Embed Size (px)
Citation preview

MANAGEMENT OF PRODUCED WATER ON OFFSHORE OIL INSTALLATIONS:
A COMPARATIVE ASSESSMENT USING FLOW ANALYSIS
FINAL REPORT
March 2005
Paul Ekins, Robin Vanner and James Firebrace
Case studies provided by the UK Offshore Operators Association and its member
companies
Part of a wider collaborative study
A Methodology for Measuring Sectoral Sustainable Development and its application to the UK oil & gas sector’
The project is funded under the DTI’s Sustainable Technologies Initiative LINK Programme, with funding from the Engineering and Physical Sciences Research Council (EPSRC), matched by industry, largely through in-kind contributions in identifying and providing
data, case studies and research papers
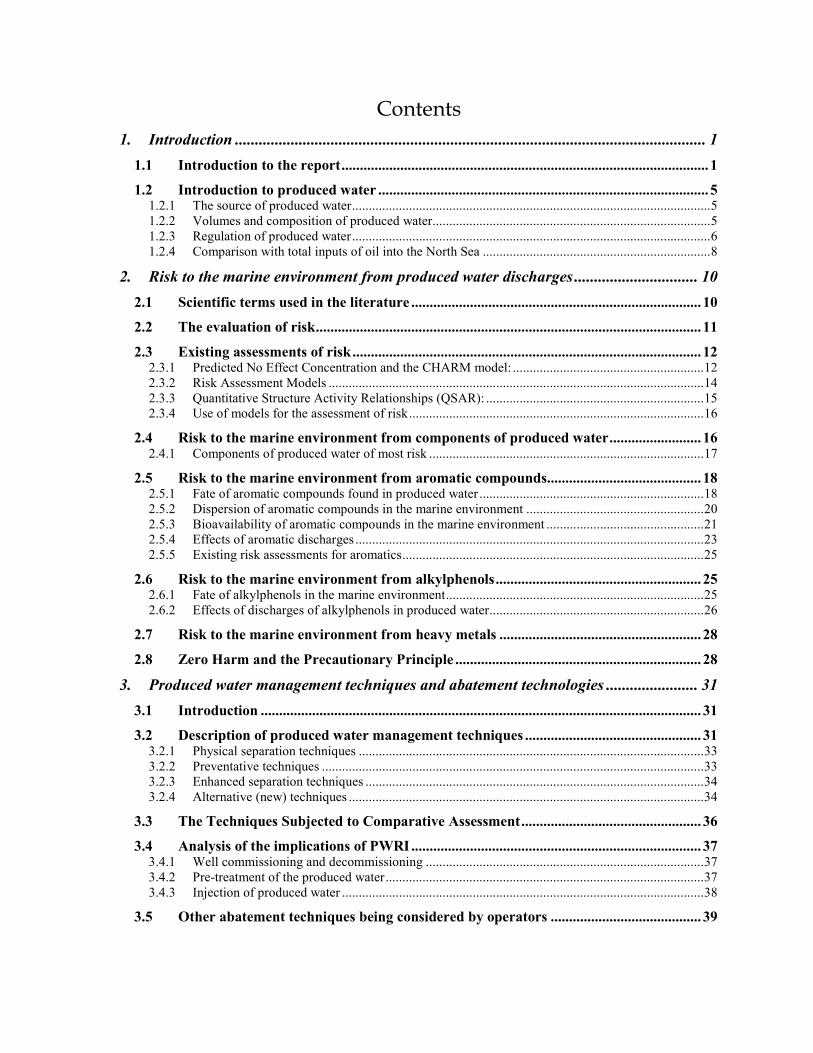
Contents
1. Introduction ...................................................................................................................... 1
1.1 Introduction to the report.................................................................................................... 1
1.2 Introduction to produced water .......................................................................................... 5 1.2.1 The source of produced water...........................................................................................................5 1.2.2 Volumes and composition of produced water...................................................................................5 1.2.3 Regulation of produced water...........................................................................................................6 1.2.4 Comparison with total inputs of oil into the North Sea ....................................................................8
2. Risk to the marine environment from produced water discharges ............................... 10
2.1 Scientific terms used in the literature ............................................................................... 10
2.2 The evaluation of risk......................................................................................................... 11
2.3 Existing assessments of risk............................................................................................... 12 2.3.1 Predicted No Effect Concentration and the CHARM model: .........................................................12 2.3.2 Risk Assessment Models ................................................................................................................14 2.3.3 Quantitative Structure Activity Relationships (QSAR): .................................................................15 2.3.4 Use of models for the assessment of risk........................................................................................16
2.4 Risk to the marine environment from components of produced water......................... 16 2.4.1 Components of produced water of most risk ..................................................................................17
2.5 Risk to the marine environment from aromatic compounds.......................................... 18 2.5.1 Fate of aromatic compounds found in produced water ...................................................................18 2.5.2 Dispersion of aromatic compounds in the marine environment .....................................................20 2.5.3 Bioavailability of aromatic compounds in the marine environment ...............................................21 2.5.4 Effects of aromatic discharges ........................................................................................................23 2.5.5 Existing risk assessments for aromatics..........................................................................................25
2.6 Risk to the marine environment from alkylphenols........................................................ 25 2.6.1 Fate of alkylphenols in the marine environment.............................................................................25 2.6.2 Effects of discharges of alkylphenols in produced water................................................................26
2.7 Risk to the marine environment from heavy metals ....................................................... 28
2.8 Zero Harm and the Precautionary Principle ................................................................... 28
3. Produced water management techniques and abatement technologies ....................... 31
3.1 Introduction ........................................................................................................................ 31
3.2 Description of produced water management techniques ................................................ 31 3.2.1 Physical separation techniques .......................................................................................................33 3.2.2 Preventative techniques ..................................................................................................................33 3.2.3 Enhanced separation techniques .....................................................................................................34 3.2.4 Alternative (new) techniques ..........................................................................................................34
3.3 The Techniques Subjected to Comparative Assessment................................................. 36
3.4 Analysis of the implications of PWRI............................................................................... 37 3.4.1 Well commissioning and decommissioning ...................................................................................37 3.4.2 Pre-treatment of the produced water...............................................................................................37 3.4.3 Injection of produced water ............................................................................................................38
3.5 Other abatement techniques being considered by operators ......................................... 39

4. Comparative assessment of produced water management techniques ......................... 40
4.1 Methodology........................................................................................................................ 40
4.2 The Case Studies and Scenarios ........................................................................................ 41 4.2.1 Risk of production cutback: Present management of produced water (Scenario 0)........................43 4.2.2 Filtration of produced water (Scenario 1) .......................................................................................44 4.2.3 PWRI (Scenarios 2a-c) ...................................................................................................................45 4.2.4 The C-Tour and Epcon treatment processes ...................................................................................47
4.3 Approach and scope of the analysis .................................................................................. 48
4.4 Results of the analysis ........................................................................................................ 49
4.5 Assessments of the generic nature of Case Study A ........................................................ 53
4.6 Comparative assessment .................................................................................................... 55
5. Conclusions..................................................................................................................... 58
5.1 The Risk of Produced Water to the Marine Environment ............................................. 58
5.2 Managing the Risks from Produced Water ..................................................................... 59
5.3 Different Precautionary Approaches to the Management of Produced Water ............ 61
5.4 Recommended additional research................................................................................... 63
6. GLOSSARY – Acronyms and definitions of terms........................................................ 65
6.1 Acronyms............................................................................................................................. 65
6.2 Definitions of terms ............................................................................................................ 66
7. References ....................................................................................................................... 69

i
SUMMARY INTRODUCTION In 2000, discharges of produced water from UK oil and gas offshore facilities amounted to over 244 million tonnes (DTI 2004c), with estimated dispersed oil content of 5,768 tonnes (DTI 2004d) and therefore a calculated mean dispersed oil concentration of about 24mg/l. It is thought that produced water’s contribution to total inputs of oil entering the North Sea is only relatively minor, research reporting this to be 6% (Cordah 2001, p31). Models comparing Predicted Environmental Concentrations (PEC’s) with Predicted No Effect Concentrations (PNECs) suggest only hypothetical and low risks from the various components of produced water. Recent recommendations from OSPAR would require reductions in the amount of dispersed oil being discharged with produced water, with the longer-term objective being the cessation of discharges of hazardous substances within one generation. This paper reviews the literature on the risks of produced water discharges and then explores through the use of flow analysis the material and financial implications of the advanced produced water abatement techniques likely to be deployed in response to regulation. It highlights the trade-off between the benefits of further abatement and the wastes and emissions implicit in such action. The paper concludes by commenting on these regulations in the light of these trade-offs. RISKS FROM PRODUCED WATER DISCHARGES
Perceptions of risk The process of establishing harm due to produced water discharges is highly complex, involving the use of a number of scientific terms, which need to be understood.
• Bioavailable means that a component of produced water is capable of being taken up by a living organism and thereby has the potential to cause harm.
• Toxic usually refers to a substance, having the capacity to cause harm once taken up by a living organism, at concentrations relevant to the situation being considered (all substances are toxic at high enough concentrations).
• An effect relates to a change in a biological process, organism, population, community or ecosystem, in this context as a result or consequence of a produced water discharge.
Clearly a component of produced water has to possess the inherent qualities of being bioavailable and toxic for it to have a harmful effect. To establish whether a component has caused an observed effect is a difficult process, typically requiring a plausible biological mechanism and a dose related relationship to be established. Beyond this, for some stakeholders an effect would need to be demonstrably adverse to be considered harm. For others, any and all risks of effects from produced water might be considered undesirable, and therefore to constitute harm. The interrelationships between the various terms are shown in Figure S1 below.

Figure S1 – Relationship of scientific terms with perceived harm
Scientific uncertainty about the effects of produced water discharges leads people to perceive risks in different ways, through what have been called ‘risk perception filters’. The construction and operation of these filters are influenced by psychology, economics, ideology, biology and by our cultural backgrounds (Adams 2002, p7). Figure S2 illustrates how such perception filters might influence the produced water policy making process and also highlights the differing levels of information available to policy makers when making decisions in this area. Sandman 1993a explores a hypothetical scenario in which genuinely unfounded public concern is managed with partial abatement action. He identifies twelve components of public outrage as set out in Table S1. He concludes that such concern should not be managed by managing the perceived hazard, as this could well confirm in the minds of the concerned stakeholders the perception that the reduced but ongoing discharges are still harmful. Table S1 – Sandman’s twelve risk characteristics that influence the extent of public outrage
Low outrage characteristics High outrage characteristics Voluntary Coerced
Natural Industrial Familiar Exotic
Unmemorable Memorable Not dreaded Dreaded
Chronic Catastrophic
Knowable Unknowable Controlled by me Controlled by others
Fair Unfair Not morally relevant Morally relevant
Communicated by those who are trusted Not communicated by those who are trusted
Managed through a responsive process
OR
Managed through an unresponsive process
Source: Sandman 1993b

iii
Figure S2 - The produced water policy-making process
Policy makers (OSPAR & DTI)
Regulatory response
Manufacturers of equipment
Abatement response
Marine discharges
Waste & emission impacts
Materials, energy & money
Oil & gas Industry
Material flow
Information flow (Thickness of arrow relative to level of information)
Public, NGOs & scientists
Public, NGOs & scientists
Risk perception filter (personal or institutional)

iv
Evidence of harm Some of the components of produced water remain largely in the dispersed oil, while others partially dissolve in the water as well. The quantity of dissolved components will depend partly on their quantity in the dispersed oil. A review of the literature suggests that polycyclic aromatic hydrocarbons (PAHs) and alkylphenols are the components of produced water considered to be of most concern (Frost et al 1998). Myhre (2004) considered that the more abundant C4-C5 alkylphenols were the alkylphenols of the most concern as the more toxic C6-C9 alkylphenols had never been detected in produced water. Both PAHs and alkylphenols are referred to in the literature as dissolved components of produced water. Recent analysis (Faksness el al 2004) confirms that more that 85% of the C4-C5 alkylphenols dissolve in water but suggests that more than 80% of PAHs (2-6 ring) reside in the dispersed oil content of produced water. This is significant because most produced water abatement techniques reduce discharges of dispersed oil (and therefore indirectly the quantity that will dissolve in the seawater), rather than its components that are already dissolved in the water. It therefore seems that such techniques would be at least effective in reducing the discharge of one of the substances of most concern. Uncertainty in effect levels is often dealt with by use of comparisons between the Predicted Environmental Concentration (PEC) at discharge, and the Predicted No Effect Concentration (PNEC), where the latter contains safety assessment factors, to take account of extrapolation from the acute effect, which is tested for, to hypothetical chronic effects, of differences between humans and the other species on which tests are carried out, and of varying vulnerability to toxins among humans. Although PEC:PNEC ratios of greater than 1 have sometimes been recorded in the 500m zone around installations, the field monitoring programmes carried out since 1994, though capable of identifying the presence of produced water constituents, have not identified any negative environmental effects, from PAHs, alkylphenols or any other components of produced water discharges (OGP 2004). Assessments based on modelling PEC:PNEC ratios suggest that no adverse or chronic effects on marine organisms would be expected from individual PAHs found in produced water, except for areas very close to the discharge points (less than 100 - 500m) (Frost et al. 1998). Much of the assessment of the risk as reported in the literature is based on the assumption that fish would not remain in a produced water plume where an effect concentration is being exceeded for long enough for there to be a chronic effect. The issue of residence time of fish in the produced water plume may be more complicated than this if the point of discharge is near the structures jacket where “the density of fish in and immediately around jackets is higher than that of the ‘open’ sea” (Cordah 2003, p.11.4). However, bioaccumulation of many organic compounds in fish is thought to be limited by fishes’ ability to rapidly transform or metabolise these compounds (IMR 2002). Beyond modelled assessments, a number of experimental studies that explore the potential for effects from produced water discharges have been carried out. Interpretation of laboratory-based experimental results has to be done with care to ensure that real conditions are being properly represented in the experimental conditions, especially when the results are applied to the field. Two of the most important of the experimental studies are as follows:

v
1. Experiments using caged fish (NFR 2003) found DNA adducts in fish associated with sample discharge sites. DNA adducts are formed through covalent bonds between a variety of pollutants and the DNA molecule. The result of DNA adducts is not clear. They may represent an adaptive response to the organism’s environment, or they may cause cancer or lead directly to cell death or adverse effects in the next generation (NFR 2003). The experiment can only be said to have established an association between DNA adducts and the sample installations. While it cannot be ruled out that these DNA adducts are in some way caused by the results of the activities of the installations in question (including, for example, the presence of hydrocarbons in older piles of drill cuttings), neither has any causal link between them and discharges of produced water been established. For example, no significant variation was found in PAH exposure between the sampling sites close to the installations (where fish exhibited DNA adducts) and those far from them (where the fish exhibited fewer DNA adducts). However, if causality were to be established between the PAHs found in produced water and the DNA adducts discovered in field observations, this could be considered as evidence of harm from discharges of produced water.
2. Fish have ‘critical windows’ for their sexual development in early life stages. During these periods they are particularly sensitive to hormonal effects, when even brief exposure or exposures to low concentrations may have important and irreversible consequences. The IMR 2002 study looked at the endocrine (hormone) disruptive impacts of alkylphenols on groups of cod kept in controlled conditions. Cod were exposed to alkylphenols at a range of concentrations. One of the concentrations (0.008 ppb) was extremely low, much lower than those that had previously been reported as having an effect, and this was proposed to be comparable to concentrations found in produced water discharges. Other concentrations used in the experiment were higher than this. Every week during the experiment the cod were exposed to doses of alkylphenols via a probe inserted directly into the stomach. The results indicated effects on sexual development, hormone levels and reproductive capacities of the cod population. However, the experiment failed to show a dose-response relationship between the different concentrations (the high levels of exposure did not have a significantly different effect to the low level) and was said to suffer from a number of methodological and reporting faults including: uncertainty over control of the source of the test sea water; the use of theoretical models to calculate the dose; and the fact that for the dose to be relevant, wild cod would need to be resident in the discharge plume itself (Matthiessen 2003). A more recent study (Myhre 2004) which involved the IMR researchers, resolved the dose issues and used the results from the IMR 2002 study to assess the actual risk of reproductive effect of alkylphenols in produced water on fish stocks in the North Sea and concluded “no significant risk of reproductive effects on the population levels of cod, saithe and haddock in the North Sea as a result of alkylphenol discharges in produced water”. It did however need to assume even distributions of fish in close vicinity of the discharges and did not therefore assess the potentially greater risk to reef populations of fish in and around the jackets of production installations.
REGULATION Following the OSPAR recommendations made in June 2001, the DTI is introducing legislation specifying that production installations in the UK sector of the North Sea comply with a monthly average dispersed oil in water discharge limit of 30mg/l by the end of 2006.

vi
In addition to this and on a national basis, also by 2006 total dispersed oil in produced water discharges needs to be reduced by 15% relative to 2000 discharges. The additional abatement effort required by existing UK installations is an estimated 1,912 tonnes of dispersed oil, or a 28% reduction on the 7,000 tonnes which are projected otherwise to be discharged in 2006 (Hope 2003). This abatement will be achieved through regulation and a produced water discharge permit trading scheme (DTI 2004d). In the longer term, the 1995 Esbjerg Declaration envisages “continuously reducing discharges, emissions and losses of hazardous substances from all sources, and endeavours to move towards the target of cessation of by the year 2020.” (OSPAR 1998a). It is by no means clear what this would actually imply in terms of produced water management. It could mean the continued targeted substitution of introduced chemicals considered as hazardous combined with advanced cleanup of naturally occurring hazardous substances. It is noted that the Declaration refers to hazard rather than risk. In other words, it is concerned with substances that could cause harm, whatever the probability through dilution and dispersion that they will actually do so. It seems likely that what is ultimately envisaged by the Declaration could only be met through the injection of all produced water throughout the North Sea. Such a requirement would have substantial implications for the lives of some of the oil and gas fields. ABATEMENT TECHNIQUES There are a large number of techniques that are already deployed to treat produced water. The focus of this study is those advanced abatement techniques most likely to be deployed to comply with the stricter regulatory requirements, most notably the 15% oil in water reduction target to be met by 2006. The case study data as used in the analysis was taken from a UKOOA member’s confidential produced water management strategy document. This considered the company’s options to comply with the 2006 15% reduction recommendation and explored three options (scenarios 0-2 as set out below). The C-Tour and Epcon produced water abatement techniques were the subject of discussion and presentation at the Society of Petroleum Engineers (SPE) event held in Canada in the spring of 2004 (Knudsen et al. 2004) and have been hypothetically applied to this case study. The various produced water management scenarios are defined below: 0. Present management of produced water. This is used as a reference scenario and assumed as a starting point for the other scenarios.
1. Filtration of produced water as presently treated through a non-regenerative filtration medium (clay). This may require the replacement and disposal of filter canisters at a suitable depository for low-level radioactive waste.
2. Produced Water Re-Injection (PWRI) of presently treated produced water under three different PWRI sub-scenarios:
a) PWRI into an existing pre-drilled well which does not provide production pressure support;
b) PWRI providing production pressure support to a production reservoir; and
c) The drilling of and PWRI into a well not associated with an operational production reservoir (i.e. a ‘dump’ well);
3. Use of the C-Tour process. The C-Tour Process System is an enhancement to the hydrocyclone technique based on the extraction of hydrocarbons from water using gas condensate.

vii
4. Use of the Epcon process on the present produced water stream. The Epcon process consists of a vertical vessel acting as a 3-phase water / oil / gas separator. Centrifugal forces and gas-flotation contribute to the separation process.
The scenarios have differing effectiveness at reducing the concentrations of the various components of produced water. Table S2 shows these reduction levels as well as highlighting the endpoint of the dispersed oil which would be diverted from the marine environment. Table S2 – Reduction levels and end point of management techniques
Baseline Filter PWRI C-Tour Epcon
Scenario 0 1 2a 3 4
% Reduction
Endpoint
% Reduction
Endpoint
% Reduction
(concentration)
Endpoint
% Reduction
Endpoint
% Reduction
Endpoint
Dispersed oil 0% 80%
0/100%1 60% 63%
BTEX 0% 8% 0/100% -40%2 0%
PAH 0% 64% 0/100% 70% 51%
Chemicals
North Sea
Landfill
Oil well
40% Oil exported3
Oil exported
OiW (mg/L) 22.6 4.6 22.6 16.3 8.5
Source: Table 2.10 of the main report Notes: 1. PWRI will still discharge during times of PWRI system shutdown and therefore the reduction in
concentrations has been shown as 0%. The estimated down-time for PWRI system running before 2000 was 5% (DTI 2004d, p5). Therefore, for 95% of the time the reduction in concentrations would be 100%.
2. The C-Tour process uses a natively produced condensate to extract actually dissolved components. This solvent in itself contains BTEX (a subgroup of aromatics smaller and less toxic then PAHs) and therefore the concentrations of BTEX will tend to increase.
3. The endpoint of the diverted oil from the C-Tour and Epcon processes would be returned to the oil for export and their ultimate fate will be decomposition via refining and or combustion.
RESULTS A comprehensive set of material flows and their corresponding financial flows are shown in Figure 4.8 of the main report, and the assumptions used in deriving these are set out in Table 4.1. Because there is as yet no trading in produced water discharge permits, there is no available financial value for a tonne of oil discharged and therefore no value has been assigned. However, the available data do permit the calculation of the average costs of abating produced water discharges (in terms of £/t OIW not discharged), and this in turn permits the calculation of the ‘imputed value’ of diverting a tonne of oil from the marine environment. This ‘imputed value’ is the minimum value which a produced water discharge permit would need to have in order for an abatement scenario to be financially viable (i.e. for abatement to be carried out at zero cost in present value terms). This differs slightly from the average abatement cost due to the discounting of cash flows to represent present values. Table S3 gives a summary comparison between various produced water management scenarios, where the Reference scenario involves basic levels of produced water treatment,

viii
usually involving hydrocyclones (which are therefore not separately examined in the scenarios). All produced water management scenarios require basic levels of treatment of produced water. Produced Water Re-injection (PWRI) requires this to prevent reduction in injectivity, as well as to ensure regulatory discharge compliance in the event of a system shutdown. PWRI systems will divert from the marine environment all produced water components of concern (provided they are operational). However, produced water will continue to be discharged into the marine environment at the same composition as at present during times of PWRI system shutdown. It can be seen from Table S3 that the endpoint of the oil diverted for discharge into the marine environment varies with management scenario.
• The Reference scenario, against which the other scenarios are compared, involves basic treatment of the produced water before discharge.
• Filtration requires the oil along with the filtration media to be landfilled as loose Low Specific Activity (LSA) waste, or potentially low grade radioactive waste onshore. Landfilled material should be isolated so long as the site is being properly managed.
• PWRI disposes of it in a geologically isolated offshore well. • All other processes return the extracted oil, together with any toxic substances it may contain, back into the oil line for export onshore. The ultimate endpoint of these toxic substances would be decomposition during the refinery process or during combustion as a fuel.
Table S3 – Summary of UKCS implications of achieving the 15% reduction recommendation in 2006
Key wastes Max PEC:PNEC
@500m
Scenario
Imputed cost/value 2004£/tOIW
UKCS cost in 2006 2004£ UKCS in 2006
tonnes of waste/tOIW diverted BTEX PAH
Reference 0 Non-compliance or cutbacks in production 0.03 0.09
Filtration 1 £50,000 £96m ~3.7 kt Loose LSA waste
1.9 LSA 0.02 0.03
PWRI 2a £65,000 £124m ~1.5 MtCO2 810 CO2
2b £8,000 £15m ~0.4 ktCO2 200 CO2
2c £73,000 £140m ~1.5 MtCO2 813 CO2
RI: 0.00 Not RI: 0.03
RI: 0.00 Not RI: 0.09
All C-Tour 3 £49,000 £94m 0.031 0.06
All Epcon 4 £19,000 £36m 0.03 0.04
Source: Figure 4.8 of the main report 1 The fact that this is higher than the reference scenario is obscured by rounding Based on a case study installation: Imputed costs per tonne OIW are scaled up by a factor of 1,912 tonnes which is the reduction required in 2006. The maximum PEC:PNEC ratio is based on a limited number of available PNEC values. The research found that the case study had a relatively high energy demand for PWRI relative to injection data more generally. For PWRI the 95% of produced water that is reinjected has 0% PEC in the marine environment; the 5% that is not reinjected (due to equipment down-time) has the same PEC:PNEC ratio as the reference scenario Note that the well drilling process is a relatively small factor in material terms (~5 ktCO2); however it is more important in terms of capital requirements.
ix
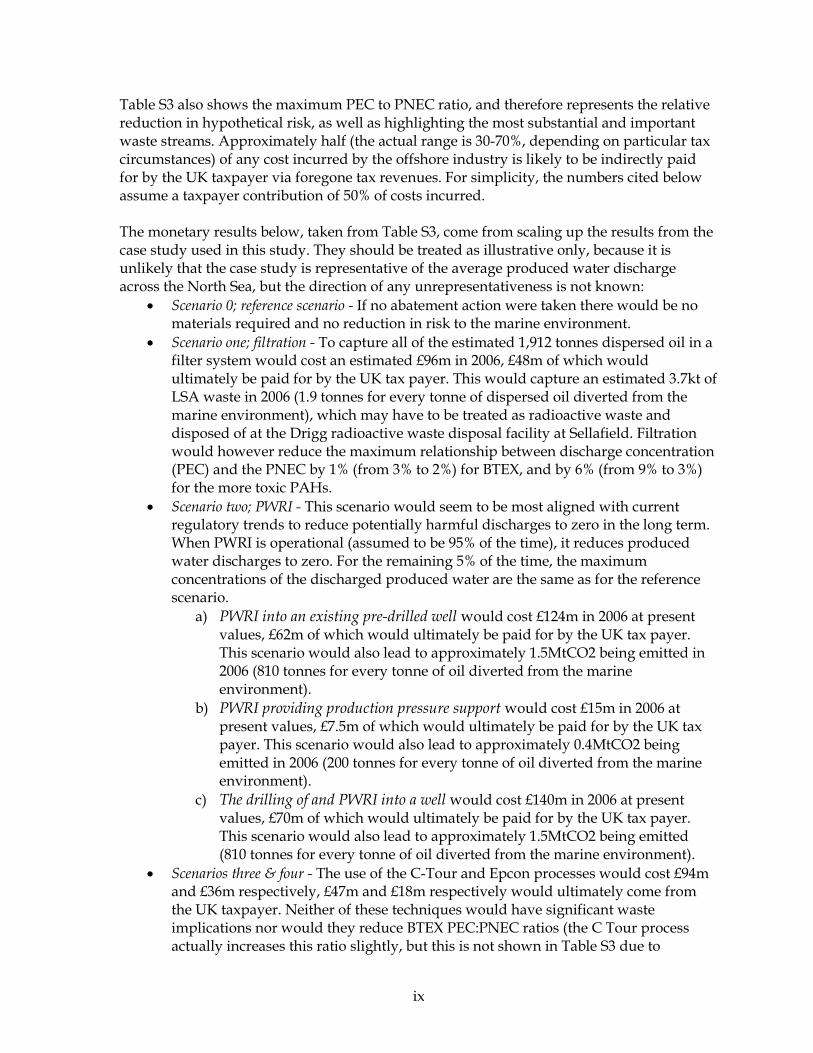
Table S3 also shows the maximum PEC to PNEC ratio, and therefore represents the relative reduction in hypothetical risk, as well as highlighting the most substantial and important waste streams. Approximately half (the actual range is 30-70%, depending on particular tax circumstances) of any cost incurred by the offshore industry is likely to be indirectly paid for by the UK taxpayer via foregone tax revenues. For simplicity, the numbers cited below assume a taxpayer contribution of 50% of costs incurred. The monetary results below, taken from Table S3, come from scaling up the results from the case study used in this study. They should be treated as illustrative only, because it is unlikely that the case study is representative of the average produced water discharge across the North Sea, but the direction of any unrepresentativeness is not known:
• Scenario 0; reference scenario - If no abatement action were taken there would be no materials required and no reduction in risk to the marine environment.
• Scenario one; filtration - To capture all of the estimated 1,912 tonnes dispersed oil in a filter system would cost an estimated £96m in 2006, £48m of which would ultimately be paid for by the UK tax payer. This would capture an estimated 3.7kt of LSA waste in 2006 (1.9 tonnes for every tonne of dispersed oil diverted from the marine environment), which may have to be treated as radioactive waste and disposed of at the Drigg radioactive waste disposal facility at Sellafield. Filtration would however reduce the maximum relationship between discharge concentration (PEC) and the PNEC by 1% (from 3% to 2%) for BTEX, and by 6% (from 9% to 3%) for the more toxic PAHs.
• Scenario two; PWRI - This scenario would seem to be most aligned with current regulatory trends to reduce potentially harmful discharges to zero in the long term. When PWRI is operational (assumed to be 95% of the time), it reduces produced water discharges to zero. For the remaining 5% of the time, the maximum concentrations of the discharged produced water are the same as for the reference scenario.
a) PWRI into an existing pre-drilled well would cost £124m in 2006 at present values, £62m of which would ultimately be paid for by the UK tax payer. This scenario would also lead to approximately 1.5MtCO2 being emitted in 2006 (810 tonnes for every tonne of oil diverted from the marine environment).
b) PWRI providing production pressure support would cost £15m in 2006 at present values, £7.5m of which would ultimately be paid for by the UK tax payer. This scenario would also lead to approximately 0.4MtCO2 being emitted in 2006 (200 tonnes for every tonne of oil diverted from the marine environment).
c) The drilling of and PWRI into a well would cost £140m in 2006 at present values, £70m of which would ultimately be paid for by the UK tax payer. This scenario would also lead to approximately 1.5MtCO2 being emitted (810 tonnes for every tonne of oil diverted from the marine environment).
• Scenarios three & four - The use of the C-Tour and Epcon processes would cost £94m and £36m respectively, £47m and £18m respectively would ultimately come from the UK taxpayer. Neither of these techniques would have significant waste implications nor would they reduce BTEX PEC:PNEC ratios (the C Tour process actually increases this ratio slightly, but this is not shown in Table S3 due to

x
rounding). The C-Tour and Epcon processes would however reduce the maximum PEC:PNEC ratios by 3% and 5% respectively for the more toxic PAHs.
On these figures Epcon is clearly preferred to C-Tour in terms of both discharge performance and cost. If a 60% reduction in dispersed oil is adequate, it is also preferable on financial grounds to both filtration and PWRI. Filtration produces almost as good a discharge performance on dispersed oil as PWRI, but is less good on BTEX and PAHs. However, it is also substantially cheaper than the two PWRI scenarios that do not involve substitution for existing seawater injection. Ultimately, which of these options is to be preferred depends both on the discharge targets for oil, and on the degree of precaution that is considered desirable in respect of BTEX and PAHs (discussed in the next section). However, this kind of finding does demonstrate how the tracing of material flows with their values through a process can highlight both the private cost of different techniques, and the public benefit which they may yield. CONCLUSIONS The study suggests that there are three different possible approaches to the management of produced water discharges, depending on the degree of precaution that is sought: Management approach one: maintain current standards of produced water management with additional targeted actions. This would involve broadly present levels of produced water management being maintained, with additional targeted action in a number of specified areas. Underlying this approach are the findings that concentrations are already very low, there are no observed effects from present levels of produced water discharges reported in the literature, and that all technical risk assessments show the risks of any such effects to be very low. The specific areas where targeted action seems necessary are as follows (see main report for detailed explanations):
i. Implementation of the 30mg/l discharge limit recommended by OSPAR in 2001 – this is necessary to ensure that all facilities are brought into line with the level of discharges for which the risk assessments were carried out.
ii. Continued substitution of introduced chemicals of most concern as set out in present UK regulation with reference to the CHARM model (see main report).
iii. Development of a UK monitoring strategy (see main report). iv. As proposed in various study reports, research investigating the occurrence
and persistence data for alkylphenols, the occurrence and implications of reef effect of fish around installations, and a study comparing the time of spawning of fish populations in the vicinity and far from points of produced water discharges (see main report).
Management approach two: maintain the current regulatory approach of further reducing permissible discharges on an ongoing basis. This approach would envisage a further cut in the absolute level of discharges beyond the 15% cut already envisaged for 2006, on the grounds that continually reducing discharges in this way would continually reduce the level of risk of harm being incurred. While there is little doubt that, as shown in Table S3, discharges (and perhaps risks) could be continually reduced in this way by the kind of technologies described, the lower PEC:PNEC ratios achieved in this way are no more justified by the risk assessment than those of the current situation. Moreover, it is possible that the investment required to achieve them in one round of reduction will be at least partially wasted, if a

xi
quite different technology is required to achieve more stringent discharge reductions in a subsequent round. It is also possible that each step will fail to satisfy key stakeholders, including those who wrongly perceive that the continued discharges are causing demonstrated harmful effects to the marine environment, rather than a reduction (from already very low levels) in the risk of such harm. The costs associated with this regulatory approach could be reduced by a well-designed permit trading scheme. Unlike with sulphur dioxide, it seems that the issue of pollution hotspots with such a scheme is unlikely to present a problem, because the majority of the facilities on the UKCS are not close enough together and the 30mg/l limit prevents excessive discharges from any one facility (see main report for detailed explanations). However, this aspect of a produced water discharge permit trading scheme should be kept under review during any operation of the scheme. Management approach three: reduce discharges of produced water to zero over the long term. If this is the ultimate objective of the wider regulatory system (as seems to be implied by the Esbjerg Declaration), then it should be acknowledged explicitly as such, rather than approached through a series of more or less arbitrary step-by-step reductions (such as the 2001 OSPAR recommendation to reduce total OIW by 15%), which generate uncertainty in the industry and, as noted above, may lead to investments that are inappropriate for future required discharge reductions and misplaced perceptions of harm to the marine environment. It is likely that achieving this interpretation of the precautionary principle would in due course require the total reinjection of produced water in the North Sea. The illustrative cost of disposing of all 7,000 tonnes of OIW (projected for 2006) in this way (assuming that new wells had to be drilled – see scenario 2c in Table S3) would be £511m, of which £255m would effectively be a contribution from the taxpayer. About 5.7mtCO2 per year (based on emissions of 813tCO2/tOIW) would also be produced would also be emitted. Production at some wells where reinjection was not a possibility would have to be shut down earlier than would otherwise be the case. It is not clear that the reduced risk achieved by this regulatory approach would justify the level of investment or foregone production, or the associated greenhouse gas emissions, although the judgement on this could be changed by any or all of the following developments: i. A study confirming any endocrine disruption in fish due to discharges of produced
water. ii. Any observed detrimental effect in fish populations in any field observational study
in which there is serious suspicion that produced water is a causal factor. iii. Any well designed study finding effects at concentrations relevant to produced
water discharges. There is no objective way of deciding between these different management approaches to produced water, all precautionary in some sense, that will satisfy all stakeholders. Approach 1 will seem adequate to some, but not sufficiently precautionary to others, who may prefer Approach 3, which will in turn seem excessively precautionary to those favouring Approach 1. Public debate from various points of view may seek to improve the information base underlying the different perceptions which lead to preferences for one approach over another, and it may be that better shared information would reduce differences in perception of the characteristics of risks from produced water. Regulators should certainly seek to stimulate such debate, but where the differences in perception are based on irreconcilable values, regulators can only hope to strike a balance between the different perceptions that is acceptable to society as a whole.

xii

1
1. INTRODUCTION
1.1 INTRODUCTION TO THE REPORT
This report has been written as part of a collaborative study carried out under the DTI’s Sustainable Technologies Initiative LINK programme and funded by the Engineering and Physical Sciences Research Council (EPSRC): ‘A Methodology for Measuring Sectoral Sustainable Development and its application to the UK oil & gas sector’. The overall objective of the study is to develop a generic sustainable development methodology that can be applied both to the oil and gas industry and to other regions or sectors – and thus be of wider public benefit. This methodology is based on an analysis of material and energy flows and their related financial implications down the value chain, coupled with an environmental impact and sustainability analysis. This methodology is being applied to look at four challenges faced by the offshore oil and gas sector (decommissioning of structures, management of produced water, energy use offshore, and the management of business relationships during transitions). It is hoped that the outputs from the research will be of direct use to the sector in meeting these challenges, as well as informing the sustainable development methodology to be applied to other sectors. The subject of this report is the management of produced water. The key sustainable development issues arising from produced water relate to the potential of the substances in produced water to cause harm to the marine environment, the environmental impacts caused by actions taken, usually due to regulation, to reduce this potential, and the cost of these actions, to both the industry and society more widely. To investigate these issues this report examines: 1. The material, energy, environmental and financial implications of key abatement strategies, in relation to existing assessments of risk to the marine environment. This required reviews of the literature on the assessment of the potential risk to the marine environment from produced water discharges, and reviews and use of case study data on the key produced water abatement techniques and management strategies.
2. The relevant regulatory objectives, as discussed in more detail below, including the 30mg/l limit by installation and the overall 15% reduction target. There is also an aspiration progressively to reduce discharges of hazardous substances into the North Sea to zero, although this has yet to be adopted as a concrete objective of regulation. The material, energy, environmental and financial implications of meeting the objectives, as well as their appropriateness and efficiency in reducing any perceived risk to the marine environment, are assessed.
Much of this report is about the risk that produced water is causing, or may cause, harm to the marine environment. Assessment of this risk may take a number of forms:
• Assessment of the properties of the substances in produced water, to gauge the extent to which they are likely to be intrinsically hazardous.
• Testing of the substances, on animals or otherwise, to assess the concentrations at which they cause harm.

2
• Theoretical modelling of produced water discharges, to assess the extent to which these concentrations are reached.
• Experiments with fish or other biota at the sites of produced water discharges, exposing them to higher than normal doses of produced water, to assess whether this causes harm.
• Scientific monitoring of actual produced water discharges and of their environmental impacts to assess the actual evidence of harm.
This report will give details of the results of all these methods. It may be noted that only the last of these, the scientific monitoring of actual discharges and their effects in situ, can generate definitive evidence that produced water is causing environmental harm (although it must also be remembered that, because of scientific uncertainty, no evidence of harm cannot be interpreted as evidence of no harm). All the other methods assess the risk that discharges might cause harm. Given the complexities and uncertainties associated with marine ecosystems, and with the impacts of certain substances, and the different values placed by different stakeholders on the different elements of the marine environment and the human impacts that affect it, it is inevitable that people will perceive the assessed risks to the environment in different ways, and give different weights to different perceived risks. Figure 1.1 illustrates this process of risk perception and how it impacts on policy makers, who may be influenced to take action to reduce risks. Policy makers, on the basis largely of initial advice from the oil and gas industry, set the initial regulatory framework for the discharge of produced water. These marine discharges are studied, and perceived differently, by scientists (some of whom may be employed by the industry), NGOs and the public, who provide feedback to policy makers, as do the manufacturers of pollution abatement equipment. As a result of this feedback, the regulatory response may change, and further abatement be taken, which may have impacts due to waste materials and other emissions, which are also subject to scientific and public perception, which feed back to policy makers in their turn. To date, as shown in Figure 1.1 (in the relative thickness to the dotted lines), the impacts from abatement action have had less attention than the impacts of the produced water discharges. One purpose of the methodology being employed in this study is to ensure that all the impacts are duly investigated and reported. The task of the policy makers is to reconcile in their regulatory response the very different inputs they will be receiving from the oil and gas industry, the manufacturers of pollution abatement equipment, scientists, NGOs and the public. In the event of scientific uncertainty, there can be a tendency to set regulatory limits to reflect what is technologically possible at a perceived reasonable cost.

3
Figure 1.1 - The produced water policy-making process
Policy makers (OSPAR & DTI)
Regulatory response
Manufacturers of equipment
Abatement response
Marine discharges
Waste & emission impacts
Materials, energy & money
Oil & gas Industry
Material flow
Information flow (Thickness of arrow relative to level of information)
Public, NGOs & scientists
Public, NGOs & scientists
Risk perception filter (personal or institutional)
4
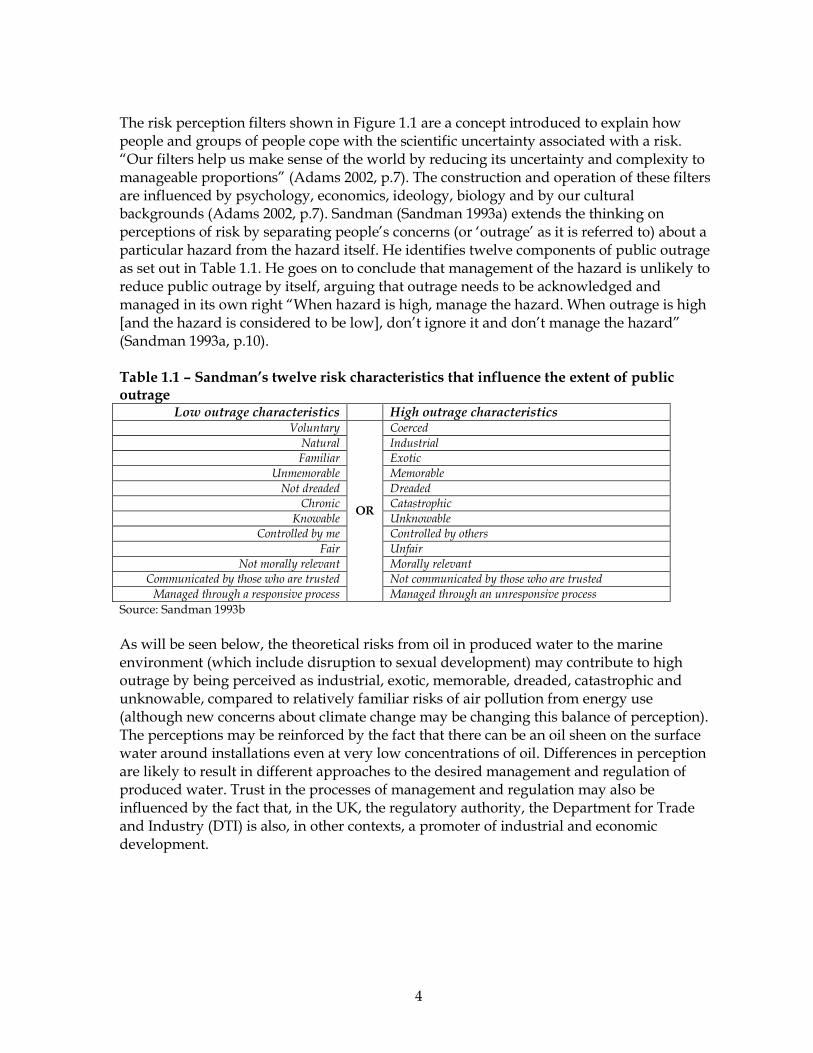
The risk perception filters shown in Figure 1.1 are a concept introduced to explain how people and groups of people cope with the scientific uncertainty associated with a risk. “Our filters help us make sense of the world by reducing its uncertainty and complexity to manageable proportions” (Adams 2002, p.7). The construction and operation of these filters are influenced by psychology, economics, ideology, biology and by our cultural backgrounds (Adams 2002, p.7). Sandman (Sandman 1993a) extends the thinking on perceptions of risk by separating people’s concerns (or ‘outrage’ as it is referred to) about a particular hazard from the hazard itself. He identifies twelve components of public outrage as set out in Table 1.1. He goes on to conclude that management of the hazard is unlikely to reduce public outrage by itself, arguing that outrage needs to be acknowledged and managed in its own right “When hazard is high, manage the hazard. When outrage is high [and the hazard is considered to be low], don’t ignore it and don’t manage the hazard” (Sandman 1993a, p.10). Table 1.1 – Sandman’s twelve risk characteristics that influence the extent of public outrage
Low outrage characteristics High outrage characteristics Voluntary Coerced
Natural Industrial Familiar Exotic
Unmemorable Memorable
Not dreaded Dreaded Chronic Catastrophic
Knowable Unknowable Controlled by me Controlled by others
Fair Unfair
Not morally relevant Morally relevant Communicated by those who are trusted Not communicated by those who are trusted
Managed through a responsive process
OR
Managed through an unresponsive process
Source: Sandman 1993b
As will be seen below, the theoretical risks from oil in produced water to the marine environment (which include disruption to sexual development) may contribute to high outrage by being perceived as industrial, exotic, memorable, dreaded, catastrophic and unknowable, compared to relatively familiar risks of air pollution from energy use (although new concerns about climate change may be changing this balance of perception). The perceptions may be reinforced by the fact that there can be an oil sheen on the surface water around installations even at very low concentrations of oil. Differences in perception are likely to result in different approaches to the desired management and regulation of produced water. Trust in the processes of management and regulation may also be influenced by the fact that, in the UK, the regulatory authority, the Department for Trade and Industry (DTI) is also, in other contexts, a promoter of industrial and economic development.

5
1.2 INTRODUCTION TO PRODUCED WATER
1.2.1 The source of produced water
Oil and gas reservoirs have a natural water layer (called formation water) that, being denser, lies under the hydrocarbons. Oil reservoirs frequently contain large volumes of water, while gas reservoirs tend to produce only small quantities. Furthermore, to achieve maximum oil recovery, additional water is often injected into the reservoirs to help force the oil to the surface. Both formation and injected water are often produced along with the hydrocarbons and, as an oil field becomes depleted, the amount of produced water increases as the reservoir fills with injected water. At the surface, the water is separated from the hydrocarbons, treated to remove oil, and then either discharged into the sea or injected back into the wells (called Produced Water Re-injection, PWRI), with or without further treatment. In addition, some installations are able to inject the water into other suitable geological formations. In what follows the term ‘produced water’ is used to describe the mixture of water (formation and injected) and oil (hydrocarbons) that is either discharged into the sea or re-injected (i.e. it is water from the well that has been subjected to basic treatment but still contains small quantities of oil).
1.2.2 Volumes and composition of produced water
Discharge of produced water into the North Sea as a whole was estimated to be 340 million cubic meters in 1998 (Frost et al. 1998, introduction section). In 2000, discharges from the UK sector amounted to over 244 million tonnes of produced water (DTI 2004c) which contained an estimated 5,768 tonnes of oil (calculated from DTI 2004d, p.4); the mean oil in water concentration at discharge is estimated to be 24 mg/l. Oil is made up a number of different hydrocarbons, including BTEX (benzene, toluene, ethylbenzene and xylene), NPD (naphthalene, phenanthrene, dibenzothiophene), PAHs (polyaromatic hydrocarbons) and phenols. The hydrocarbons are largely insoluble in water, and most of the oil is therefore said to be ‘dispersed’ in the produced water. However, the different components of the oil do dissolve partially in water to differing extents. For example, BTEX and phenols are the most soluble in water of those mentioned above. When oil is said to be ‘dissolved’ in water, it is largely these components that are being referred to. PAHs and some of the heavier alkylphenols, in contrast, are considerably less soluble in water and therefore are to a greater relative extent present in the dispersed oil, but the dissolved component may still be of some concern.

6
Table 1.2 - Typical material composition of produced water discharged from oil fields in the Norwegian sector of the North Sea
Seawater Produced water
Sources
Range Mid Unit Range Median Unit
Ratio Produced water: seawater
(mid)
Dispersed oil - - - 15-60 44 mg/l -
BTEX - - - 1-67 6 mg/l -
NPD 9-185 88 ng/l 0.06-2.3 1.2 mg/l 13,636
PAH 1-45 22 ng/l 130-575 468 µg/l 21,273
Organic Acids (<C6) - - - 55-761 368 mg/l -
Phenols(C0-C4) - - - 0.1-43 8 mg/l -
Barium (Ba) 22-80 29 µg/l 0.2-228 87 mg/l 3,000
Cadmium (Cd) 4-23 10 ng/l 0.5-5 2 µg/l 211
Copper (Cu) 20-500 240 ng/l 22-82 10 µg/l 42
Mercury (Hg) 1-3 2 ng/l <0.1-26 1.9 µg/l 950
Lead (Pd) 20-81 31 ng/l 0.4-8.3 0.7 µg/l 23
Zinc (Zn) 0.3-1.4 0.6 µg/l 0.5-13 7 mg/l 12,727
Sources: Frost 1998, Section 1.2
1.8 1.8 µg/l 0.1-15 4.3 mg/l 2,389 Iron (Fe)1
4.5-6 5.25 mg/l 2,917
Radium (226RA) 1.66 1.66 Bq/l
Radium (228RA) 3.9 3.9 Bq/l
Manganese (Mn) 0.1-0.5 0.45 mg/l
Berllium (Be) 0.02 0.02 mg/l
Nickel (Ni) 0.02-0.3 0.14 mg/l
Cobalt (Co) 0.3-1 0.35 mg/l Source: E&P 1994, p.4
Vanadium (V)
0.02-0.5 0.24 mg/l
Seawater concentrations not available
1 Second row from E&P 1994 Note: The medians for the produced water numbers were provided in the source, whereas the mid points for the seawater concentrations are calculated from the ranges.
Table 1.2 gives the concentrations of various components of produced water, and their concentrations in seawater. It shows that dispersed oil and organic acids were found to be the components with the highest concentrations in Norwegian produced water at a median of 44 and 368 mg/l [ppm] respectively. Barium and zinc were the metals with the highest discharge concentrations relative to seawater concentrations, with produced water to seawater discharge ratios of about 3,000 and 13,000 respectively. The components NPD and PAHs are discharged at concentrations about 14,000 and 21,000 times greater than found in the marine environment.
1.2.3 Regulation of produced water
International cooperation for the protection of the marine environment of the North-East Atlantic, including the North Sea, is carried out through the OSPAR Convention, which was opened for signature in 1992 and entered into force in 1998, and which combined and up-dated the 1972 Oslo Convention on dumping waste at sea and the 1974 Paris Convention on land-based sources of marine pollution. Work under the Convention is managed by the OSPAR Commission, which is made up of representatives of the Governments of 15 Contracting Parties and the European Commission, representing the European Community.

7
The first Ministerial Meeting of the OSPAR Commission took place at Sintra, Portugal, in 1998, when the Contracting Parties committed themselves “to the application of the precautionary principle and the polluter-pays-principle” and “to prevent pollution of the maritime area by continuously reducing discharges, emissions and losses of hazardous substances (that is, substances which are toxic, persistent and liable to bioaccumulate or which give rise to an equivalent level of concern), with the ultimate aim of achieving concentrations in the environment near background values for naturally occurring substances and close to zero for man-made synthetic substances” and making “every endeavour to move towards the target of cessation of discharges, emissions and losses of hazardous substances by the year 2020.” (OSPAR 1998a) At the same meeting OSPAR adopted its decision on the decommissioning of disused offshore installations (OSPAR 1998b), which is the subject of a companion report Ekins, Vanner & Firebrace 2005. At a meeting in 2001 the OSPAR Commission recommended (OSPAR 2001a) acceptance of the then provisional performance standard for discharges from offshore oil installations of 40mg/l dispersed oil in water (PARCOM 1/17/1, §101). It further recommended that all production installations in the OSPAR area comply with a monthly average dispersed oil in water discharge limit of 30mg/l by the end of 2006, and that the sector as a whole should reduce total dispersed oil in produced water discharges by 15% (relative to 2000 discharges) by the same date (note that this target is an absolute reduction of total dispersed oil in produced water, as opposed to the reduction in concentration level). The Recommendation was made explicitly in the context of the 1998 Sintra Statement objective, cited above, of completely ceasing discharges of hazardous substances by 2020. Figure 1.2 - Average Oil in produced water discharges from offshore installation on UKCS in 2002 (mg/kg) [equivalent to ppm and mg/l]
Source: DTI & UKOOA 2003
Figure 1.2 shows that of the 70 production installations on the UKCS, 14 installations were not meeting the 30mg/l target in 2002 and 3 installations were also not in compliance with
0
10
20
30
40
50
60
70
1 4 7
10
13
16
19
22
25
28
31
34
37
40
43
46
49
52
55
58
61
64
67
70
Installation (ranked by discharged concentration)
Oil in produced water discharges
[mg/kg]
2000 mean concentration
OSPAR 2006 recommendation
Present regulation

8
the present regulatory requirement of 40mg/l. If all installations had achieved a 30mg/l water quality (as recommended by OSPAR for 2006), 185 fewer tonnes of dispersed oil would have been discharged in 2002 (out of a total of 5,768 tonnes). The UK Department of Trade and Industry (DTI), the governmental body responsible for regulating the UK industry, is introducing legislation to comply with the OSPAR recommendations. The recommendation on the 15% reduction by 2006 permits governments to implement the target on a facility, company or sector wide basis. The industry is engaged in an ongoing process to explore with the DTI the setting-up of a sector wide trading scheme as a more economically efficient way of meeting the target than on an individual facility or company basis. The environmental implications of such a trading scheme are considered in Section 5.2. A 15% reduction on the 5,768 tonnes of dispersed oil discharges in 2000 corresponds to a total UK discharge target of 4,903 tonnes of dispersed oil 2006 (DTI 2004d, p.4). Figure 1.3 shows that 7,000 tonnes of dispersed oil are projected to be discharged from UK installations in 2006, assuming the expected generation of produced water volumes and business as usual treatment techniques. Compliance with the 30mg/l requirement is however non-flexible and therefore would likely contribute at least 185 tonnes towards achieving the target (based on 2002 discharges shown in Figure 1.2). Furthermore, in a possible trading scheme allocation, 2% (or 98 tonnes) of the total allowable 4,903 tonnes would be allocated to new discharging installations which have been developed since 2000 (DTI 2004d, p.4). Therefore the allocation to pre-2000 installations in 2006 would be 4,805 tonnes requiring an abatement effort after compliance with the non-flexible recommendation estimated at 1,912 tonnes of dispersed oil. This is an estimated 28% reduction on their projected business as usual discharges for 2006. Figure 1.3 - Estimate of UK dispersed oil discharges in 2006
0
1,000
2,000
3,000
4,000
5,000
6,000
7,000
8,000
Projected OIW discharges in 2006
(projected in 2002)
tonnes of dispersed OIW Allocated to post 2000
installations
Reduction due to 30ppm
requirement
Abatement effort required
(28%)
Pre-2000 installations
allocation
Source: Projection and baseline figures: Hope 2003, slide 7. 2000 discharges and 2006 allocations: DTI 2004d, p.4.
1.2.4 Comparison with total inputs of oil into the North Sea
There is some uncertainty associated with the volume of dispersed oil reaching the North Sea from sources other than the oil and gas industry. Table 1.3 shows the best available

9
estimate from 1999, and shows that approximately half of the oil entering the North Sea is from river and land run-off. Using this best estimate as a comparison, the total and UK produced water discharges contributed approximately 10% and 6% respectively to the total estimated volumes of oil entering the North Sea. Table 1.3 – Sources of oil inputs into North Sea (kt/year)
Source Low Mid High % of total (Mid)
Natural seeps 1 1% Rivers/land run-off 16 46 76 50% Costal sewage/sewage sludge 1 6 10 6% Dumped industrial waste 1 2 2 2% Dredged spoils 2 6 10 7% Oil terminals/refineries 1.0 1% Reported spills 1.0 1% Operational ship discharges 1 3 5 3% Accidental and illegal discharges 7 8% Atmospheric deposition 7 11 15 12% Produced water 9.0 10%
Total North Sea 47 92 137 100%
UK Produced water (1999) 5.6 6% UK Produced water (post 2006) 4.9 5% Source: Cordah 2001, p.31. Notes: Mid-points calculated from source data. The greater level of confidence around the amount discharged from oil and gas refining and extraction installations is expressed through an additional decimal place.
All of the sources of oil in Table 1.3 may be contaminated with other toxic substances, the removal of which should be taken into account in any evaluation of the total environmental benefit of abating oil discharges from these sources. In the case of produced water these substances will include heavy metals and production chemicals, and the dissolved hydrocarbon components in the water itself. The produced water abatement techniques which remove the dispersed oil will also remove other toxic substances that are contained within it, while those techniques such as PWRI, which remove produced water from the marine environment completely, will also remove the dissolved components. These issues are discussed further in the comparative assessment of produced water abatement techniques below, but no assessment is made in relation to the abatement of other sources of oil in the North Sea.

10
2. RISK TO THE MARINE ENVIRONMENT FROM PRODUCED WATER DISCHARGES
2.1 SCIENTIFIC TERMS USED IN THE LITERATURE
A number of scientific terms are used in scientific discussions about whether a substance, in relation to its existence in produced water, is causing harm. Some of these terms are defined and discussed below. Their relationship to one another is shown in Figure 2.1. 1. Bioavailable – This means that a component of produced water can be taken up by a living organism. The component may be found in marine sediments or in the water column. It is only through bioavailability that components of produced water are generally considered to have potential to cause harm, and it is only this possibility of harm that is assessed in this report. Bioavailability may result in bioconcentration, bioaccumulation, or biomagnification (see Glossary for definitions of these terms);
2. Toxic – This means that a component of produced water, at the concentration at which it is encountered, and once taken up by an organism, has the capacity to cause harm to a living organism found in the marine environment in which the produced water is being discharged.
3. Effect –A change in a biological process, organism, population, community or ecosystem as a result of the discharge of produced water and the bioavailability of some of its components;
4. Harm – Some effects (or the risk of an effect) could be considered to represent harm. The distinction between an effect and harm is not straightforward and may well differ for different stakeholders. For some stakeholders an effect would need to be demonstrably adverse to be considered harm. For others, all effects from produced water might be considered undesirable, and therefore to constitute harm. This difference is illustrated in the quotations below and is further considered in sections 2.5 and 2.6 in the context of actual evidence.
The USA’s Environmental Protection Agency (EPA) defines harm as “an act which actually kills or injures fish or wildlife. Such an act may include significant habitat modification or degradation where it actually kills or injures fish or wildlife by significantly impairing essential behavioural patterns, including breeding, spawning, rearing, migrating, feeding or sheltering” (FRED 1999). This is a reasonably comprehensive definition in ecological terms, based on adverse effects, although it fails to consider effects which pose an uncertain risk of future harm typical of damage to DNA structures. It should also be noted that the loss of fish or wildlife will be differentially valued by different stakeholders. In the UK, the Environmental Protection Act 1990 (HMSO 1990) defined harm as “harm to the health of living organisms or other interference with the ecological systems of which they form part”. This definition therefore considers all effects (interferences) as harm. This definition was later amended (regulation 3(2)(c) of the 2002 Regulations) to define harm as “any adverse effects on human health or the environment” which is a much narrower definition of harm which excludes all non-adverse effects. Stakeholders may disagree on whether an effect represents an adverse effect in the context of the evidence presented in section 3.

11
Figure 2.1 – Relationship of scientific terms with perceived harm
Figure 2.1 illustrates how the various terms defined above are related to each other. The terms logically lead on one from the other. Thus, for there to be harm, a bioavailable component would have to be inherently toxic and be having an effect when discharged into the marine environment. Failure to show this physical pathway leaves uncertainty as to whether the harm is being caused by environmental factors other than produced water discharges. However, there is no requirement for proof of an effect for a perception of risk to be justified. A formal risk assessment would include consideration of whether an effect, or a risk of an effect, was of concern.
2.2 THE EVALUATION OF RISK
Risk can be calculated through the multiplication of the probability and some measure of the severity of the consequence. If produced water discharges pose no risk to the environment (through either zero probability or zero severity), then the consequence of produced water discharges is ‘no harm’ to the environment, and there is no value to their further abatement. However, risk may also arise (perhaps to corporate reputations) from perceptions that discharges cause harm, or have the potential to cause harm, whether or not this is the verdict of the best available science. Under these circumstances companies may choose to abate the discharges to reduce the risk to their reputations. On the other hand, some level of harm to the marine environment might be acceptable if justified by the benefits of the activity causing it, though valuations of both the harm and the benefits might be expected to differ between stakeholders and, perhaps, according to who is affected and by how much. There is an important distinction between concerns raised by evidence demonstrating a potential for harm, and a finding which shows actual harm, and this should be kept in mind when reading the evidence on risk of produced water to the marine environment later in

12
this section. The former will lead some stakeholders to value precautionary action to reduce the risk. One of the 10 ‘guiding principles’ of the UK Sustainable Development Strategy was the precautionary principle, as defined by the Rio Declaration resulting from the Earth Summit in 1992: “Where there are threats of serious or irreversible damage, lack of full scientific certainty must not be used as a reason for postponing cost-effective measures to prevent environmental degradation” (DETR 1999, p. 23). It may be noted that the UK Offshore Operators’ Association (UKOOA) itself embraced the precautionary principle, as set out in the UK Government’s formulation, in 1999. This was subsequently reiterated in the two UKOOA sustainable development strategies (UKOOA 2001, 2003). The threat of serious or irreversible damage should be considered in relation to the evidence as set out later in this section. Whether precautionary action is cost effective should be informed by the financial and material requirements as discussed in section 5. It is not the intention of this report to make definitive social judgements on acceptable levels of produced water discharge. It does however identify precautionary management approaches of different stringency, to respond to different stakeholders’ differing perceptions of risk, and reveals the implicit values associated with the different outcomes that are achieved.
2.3 EXISTING ASSESSMENTS OF RISK
Existing regulatory systems deal with the risks from produced water in different ways. All major regulatory systems require the reduction of the dispersed oil content. Compliance with such regulations does not result in corresponding reductions in all of the components of produced water of concern as many components are not found entirely within the dispersed oil content, but are dissolved within the produced water itself. Some produced water management techniques used to comply with dispersed oil regulations will prevent discharges of such dissolved components; most particularly in the case of produced water re-injection (PWRI). The Norwegian offshore sector is required to assess the potential for an effect from their produced water discharges with a target of zero harmful1 discharges to the marine environment by 2020. Implicit in the above requirement is the assumption that all discharges which cause effects are harmful discharges, as the Predicted No Effect Concentration (PNEC) approach used is typically based on observed effects. A number of modelling techniques are used for the assessment of possible effects from produced water discharges:
2.3.1 Predicted No Effect Concentration and the CHARM model:
In June 2000, OSPAR introduced Decision 2000/2 on a Harmonised Mandatory Control System (HMCS) for the Use and Reduction of the Discharge of Offshore Chemicals. It also obliges authorities to use the CHARM "hazard assessment" model as the primary tool for ranking the use of chemicals that are added to produced water for management purposes but not the substances found in the reservoir. In the UK this is administered under the Offshore Chemical Regulations 2002 which came into force on 15th May 2002. Decision 2000/2 and its supporting Recommendations entered into force on 16 January 2001 and
3 This has NOT been interpreted in the Norwegian legislative system as zero discharges of produced water, but zero discharges causing a harmful effect on the marine environment.

13
required chemicals being introduced offshore to be ranked according to their calculated Hazard Quotient (HQ). The HQ is the ratio of Predicted Environmental Concentration (PEC) to PNEC (DTI 2000 p.4) and is generated by the CHARM model. Risk Quotients (RQs) are site-specific risk assessments for chemicals which are actually discharged into the marine environment, and are derived from the ratio of PEC:PNEC at a reference distance from the point of discharge based on predicted rates of mixing. PEC and PNEC are defined and can be interpreted as follows:
• PEC or Predicted Environmental Concentration represents the concentration of the assessed chemical substance in the environmental compartment under consideration.
• PNEC, Predicted No Effect Concentration is a theoretically determined value representing the highest concentration level which is assumed to have no chronic effect on the reference species. Deriving the PNEC usually involves adjusting the lowest known toxic effect level by an ‘assessment factor’ (typically some power or multiple of 10) to take account of uncertainties in the measurement of toxicity and in species vulnerability, and of differences between acute and chronic exposure and between humans and other species.
• When the PEC/PNEC ratio equals 1.0, the theoretical risk of an effect is defined as 5%. This means that at this concentration level of a certain chemical, 5% of the species in the influence area would theoretically be affected in a significant way.
HQs are divided into bands, as shown in Table 2.1, to determine the potential hazard of chemicals used. The HQ bands are required in submissions to the DTI called Petroleum Operations Notices (PONs) which operators are required to submit if they need to use or discharge chemicals during different types of offshore operations. Chemicals used and discharged during production operations require submission of PON 15D. Table 2.1 - Hazard categories for chemical additives within the UK regulatory system Min HQ Value
Max HQ Value Category
>0 <1 Gold
>=1 <30 Silver
>=30 <100 White
>=100 <300 Blue
>=300 <1000 Orange
>=1000 Purple
Source: CEFAS 2004a Note: The HQ is the ratio of PEC and PNEC as generated by the CHARM model
Substitution of chemicals is also a component of the HMCS, and the UK is obliged to implement a strategy to replace chemicals that have been identified as candidates for substitution, or contain components that have been identified as candidates for substitution. The criteria used to determine whether a chemical is a candidate for substitution are set out in Box 2.1:

14
Source: CEFAS 2004b LC50 - Lethal Concentration 50 is the concentration of a chemical which kills 50% of a sample population. EC50 - Effect concentrations 50 is the concentration of a chemical at which a predetermined level of effect occurs to 50% of a sample population.
As part of their risk assessment process, operators are required to consider the selection of products which are candidates for substitution, and provide a robust defence for the continued use of products that contain candidates for substitution in their PON 15D submission.
2.3.2 Risk Assessment Models
The DREAM Model The primary objective of the DREAM (Dose Related Risk and Effect Assessment Model) is to enable the identification of risks of environmental damage of produced water discharges to the marine environment by the generation of chronic effect data on marine organisms. The Environmental Impact Factor (EIF) used within DREAM is based on a combined environmental risk and hazard assessment of produced water discharges, accounting for both composition and amount of the discharge. The EIF is also linked to the environmental impact assessment studies in the area and the environmental monitoring programme for the water column and is therefore tailored to the site. Because the PEC/PNEC approach does not take into account bioaccumulation and food chain transfer, weighting of certain produced water compounds is included in the EIF. These weightings are based on persistence or biodegradability and potential for bioaccumulation. The DREAM model is then used to calculate the total water volume for which the PEC/PNEC ratio exceeds 1.0, which gives the EIF a quantitative nature (Johnsen et al, 2000).
The PROTEUS Model The Pollution Risk Offshore Technical EvalUation System (PROTEUS) model has been developed in the UK over a five-year period initially within the EU MIME programme. It predicts the physical dispersion, chemical interactions and ecotoxicological risk from a range of methods for produced water discharges (Sabeur et al. 2000). PROTEUS includes three separate risk assessment schemes; a PEC:PNEC approach for individual effluent
Box 2.1: Criteria for the Substitution of Hazardous Chemicals An offshore chemical should be substituted if it:
• is a listed chemical for priority action in Annex 2 of the OSPAR Strategy with regard to Hazardous Substances; or
• is considered by the authority [i.e. the DTI], to which the application has been made, to be of equivalent concern for the marine environment as substances covered by the previous sub-paragraph; or
• is inorganic and has a LC50 or EC50 less than 1 mg/l; or
• has a biodegradation of less than 20% during 28 days; or • meets two of the following three criteria, and a less hazardous (or preferably non-hazardous)
substitute is available: o biodegradation in 28 days less than 70% (OECD 301A, 301E) or less than 60% (OECD 301B,
301C, 301F, 306); o either, bioaccumulation log Pow 3 and molar mass of the substance is less than 600, or, BCF
> 100 o toxicity LC50 < 10mg/l or EC50 < 10mg/l;

15
components; Whole Effluent Toxicity methods to predict the harm of specific discharges and a bioaccumulation model to predict the uptake/depuration and consequent body burden arising from exposure to a dynamic contaminant (Smith et al. 1998). The outputs from the system are presented as a range of colour coded risk contours quantifying environmental concentrations and ecotoxicological risk ratios.
2.3.3 Quantitative Structure Activity Relationships (QSAR):
The potential for impacts from short and long-term exposure (acute and chronic toxicity) may also be determined theoretically through consideration of the physical properties of the components of produced water such as molecular weights and partition coefficients by applying QSAR techniques. Chronic toxicity levels determined by this method may be compared with the PNEC values (OGP 2002, p.14), as in Table 2.2. The detailed descriptions of how the two theoretical models (as presented in Table 2.2) predict the toxicity levels are beyond the scope of this report. The PNEC values are however based on concentrations which have been found to have caused an effect, while the QSAR model is a more theoretical model based on the generic physical characteristics of the compounds under consideration. It should of course be noted that the physical variables used in the QSAR model have also been derived from experimental observations, so that it has at least partly an empirical basis. An apparent observation from the tables is that the PNEC values are consistently lower than their QSAR equivalents; the chronic toxicity results. This may be due in some cases to a high assessment factor being applied to the PNEC. This cannot always be the case as the observed acute toxic effect levels used in the PNEC model are often still lower than that predicted by the QSAR model. Further explanation could be the QSAR model’s incomplete capture of possible effects due to its theoretical nature and lack of understanding of interactions of various components. In contrast to this, the PNEC model is based on data from laboratory experiments. Table 2.2 - Theoretical effect concentrations for aromatic compounds
Environmental impact factor (PNEC) QSAR ((µgl-1)
Trophic level Toxic effect levels (µgl-1)
Assessment factor PNEC (µgl-1)
Acute toxicity
Chronic toxicity
BTEX
Benzene Crustacea (Male) 170 10 17
Ethylbenzene Crustacea (Male) 490 1000 0.49
Toluene Crustacea (Male) 1000 10 100
Xylene Fish (Female) 1200 1000 1.2
Naphthalene Crustacea (Male) 21 10 2.1 4872 195
PAH
Phenanthrene Fish (Female) 1.5 10 0.15 274 11.0
Anthracene Crustacea (Female) 0.63 50 0.0126 898 35.9
Chrysene Crustacea (Female) 1.4 100 0.014 11.2 0.45
Pyrene - - - - 60.7 2.4
Benzo(a) pyrene Fish (Female) 6.3 100 0.063 7.6 0.3
Sources: Reported in OGP 2002, pages 13 & 14

16
2.3.4 Use of models for the assessment of risk
By using these various approaches, the distance from any given produced water discharge where no theoretical acute or chronic effects would occur can be estimated. It should be noted that the PNEC already has a margin of precaution (the assessment factor) built in, based on perceived levels of possible harm and uncertainty. A recent OGP draft report highlighted that the use of PNEC values will tend to overstate environmental effects: “Due to high safety factors used in deriving PNEC values and short real life or field exposure times, this risk assessment approach must be regarded as a management support tool rather than as a means of providing more accurate information about the environmental impact of the discharge” (OGP 2004, p.20). Thus PNEC should be regarded as a tool for the assessment of environmental risk, rather than as providing information about an environmental effect as such. Much of the assessment of the risk as reported in the literature is based on the assumption that fish would not remain in a produced water plume where an effect concentration is being exceeded for long enough for there to be a chronic effect due to direct exposure. The issue of residence time of fish in the produced water plume may be further complicated if the point of discharge is within the structure’s jacket. “The steel jackets of oil and gas platforms in the North Sea act as artificial reefs; the density of fish in and immediately around jackets is higher than that of the ‘open’ sea away from the jackets” (Cordah 2003, p.11.4). “The fish that would be expected to be found around the footings are saithe, cod (which tends to frequent the zone from 0 to 30m above the seabed), ling (which lives close to the seabed), red fish and wolf fish” (Cordah 2003, p.11.4). It is therefore possible that certain communities of fish may be present within the produced water discharge plume for significant amounts of time. As discussed in section 2.6.2, fish have ‘critical windows’ in their early life stages, during which they are particularly sensitive to hormonal effects from substances which act, for example, as oestrogen mimics. It is thought that some such substances are derived from some of the phenols found in produced water. The issue of produced water plumes and the reef effect of jackets is not explored in the literature, or considered within the present methods of risk assessment. However, it is thought that any bioaccumulation of organic components of produced water in nearby benthic communities would be unlikely to biomagnify or bioaccumulate up the food chain to fish as ‘fish have a much greater capacity for chemical transformation (i.e. biotransformation, leading to detoxification) of foreign matter than lower organisms’ (IMR 2002, p.5). To the extent that this is true, the risk to fish from substances in produced water is likely to be limited.
2.4 RISK TO THE MARINE ENVIRONMENT FROM COMPONENTS OF PRODUCED WATER
There is a large body of research investigating the potential fate of produced water discharges and their effects on the marine environment. A large part of this work is based on laboratory-based experiments. Interpretation of such results has to be done with care to ensure that real conditions are being properly represented in the experimental conditions. Furthermore, care has to be taken in proceeding from such results to conclusions about the absence of risk, as these experiments rarely test possible interactions between components of produced water. Field observations are essential to confirm any finding of the absence of risk.

17
2.4.1 Components of produced water of most risk
A large number of components of produced water are considered to be potentially toxic. This section of the report only focuses on those components which pose the most risk. As noted above, the calculation of risk involves consideration of both the potential harm and the probability of it occurring. Quantitatively risk is computed by multiplying some measure of the consequence by its probability of occurrence. OSPAR provides a comprehensive list of substances of possible concern. The list updated on 13 May 2003 contained 382 substances. Inclusion in the list of other substances would be dependent on data on persistence, toxicity and liability to bioaccumulate (or evidence that they give rise to an equivalent level of concern)2. This list is intended as a comprehensive list of substances, not all of which are found in produced water. Substances which do occur in produced water and are the focus of management activity include: total hydrocarbon content (THC) including aromatics (PAHs, BTEX, and naphthalene), organic acids and phenols; alkylphenols - two groups, C1-C3, and C4-C9; heavy metals - arsenic, lead, cadmium, copper, chromium, mercury, nickel, zinc; radionuclides; and production chemicals. A review of the literature on this subject undertaken by Frost et al. (1998) identified heavy metals, radioactivity and aromatic hydrocarbons as potential causes of long-term effects. Later on in the section however, Frost et al. go on to conclude that ‘it is now generally accepted within the scientific community that the water-soluble fraction of PAHs and alkylated phenols contribute most to the acute and chronic toxicity of produced water’ (Frost et al. 1998, section 5.2). PAHs and alkylated phenols are therefore the principal focus of the further consideration in this paper of risk from produced water discharges, although some consideration is also given to heavy metals. With regard to radioactivity, radioactive material which is found in produced water is not generated within the oil production process, but is natural in origin. It comes either from the oil-carrying reservoir, or from the various chemicals added into the production process, which themselves may originate from deposits of material that are naturally radioactive. Radioactive material is ubiquitous at low levels dependent on the surrounding rock type, and contributes to a background level of radioactive exposure. The concern about radioactive material in produced water centres on the moving of this material from its natural state, and the discharge of it into the marine environment in a dispersed form. A recent EU study finds that “oil production currently is the major contributor to the collective dose to the population of the European Union from industrial activities” (EC DG-ENV 2002, p.2), although in recent years “the overall civil nuclear and other anthropogenic inputs of radioactivity into the North East Atlantic have decreased by several orders of magnitude” (EC DG-ENV 2002, p.1). A review of the scientific literature on produced water undertaken during this study has failed to identify radioactive material as an area of concern in this context. Radioactive material will not therefore be the principal focus of further consideration in this report.
2 http://www.ospar.org/eng/html/welcome.html

18
2.5 RISK TO THE MARINE ENVIRONMENT FROM AROMATIC COMPOUNDS
There are three main groups of aromatic compounds which tend to have decreasing solubility in water:
• BTEX - These are monocyclic aromatic compounds: benzene, toluene, ethylbenzene, and xylene (ortho, meta and para isomers).
• NPD - These are 2-3 ring aromatic compounds: naphthalene and phenanthrene and dibenzothiophene, including their C1-C3 alkyl homologues.
• PAH - These are the 16 polycyclic (3-6 ring) aromatic hydrocarbon (PAH) compounds, listed by the US Environment Protection Agency (the 3-6 ring compounds naphthalene and phenanthrene are not defined as PAHs and are included in the NPD group).
2.5.1 Fate of aromatic compounds found in produced water
The paths for aromatic compounds from the point of discharge of produced water to a position where it could have an effect on marine biota and, ultimately, on a marine vertebrate, are diverse and may be complex. The general path is as follows: 1. Compartmentalisation: dispersion, evaporation and sedimentation in the marine environment;
2. Biodegradation and chemical oxidation; 3. Bioconcentration in plankton; 4. Bioaccumulation and biomagnification up the food chain; 5. Elimination via metabolism into products which are usually less toxic and more readily excreted. This reduces concentrations in higher trophic levels leading to lower body dose in vertebrates.
Note: Intermediates of the biodegradation and elimination processes could also be bioavailable and toxic
Table 2.3 - Concentration range (mgl-1) of aromatic compounds in produced water from oil and gas fields on the UKCS (1999-2001)
UKCS Oil Gas
Min Max Min Max
BTEX <0.5 34 0.5 2244
NPD 0.007 0.74 0.001 0.74
PAH 0.002 0.12 0.0004 0.23
Source: OGP 2002, Pages 6
Table 2.3 shows the large range of concentrations of aromatic compounds found in produced water in fields on the UKCS. Table 2.4 - Concentration range (mgl-1) of aromatic compounds in produced water from the Oseberg C oil field on the Norwegian Continental Shelf (NCS) (1998-2001)
Oseberg C
1998 1999 2000
BTEX 5.8 5.6 6.6
NPD 1.6 1.1 1.3
PAH 0.027 0.016 0.02
Source: OGP 2002, Page 8

19
Though its data are limited, Table 2.4 suggests a relative lack of variability found in individual fields over a period of a few years. Concentrations of aromatic compounds may well change, however, in the longer term. For example, the re-emergence of injected seawater mixed with formation water (which typically occurs in the later years of a field’s life) could cause a reduction in the concentration of aromatics in produced water. BTEX and NPD partially dissolve in water (in the hydrocarbon reservoir). There is therefore a relatively weak correlation between the total concentration of aromatic compounds (which is dominated by BTEX and NPD) and the [dispersed] oil in water content (OGP 2002, p. 8). Therefore many of the techniques for dispersed oil removal fail to remove them completely. It used to be thought that PAHs were also not strongly linked with dispersed oil content (Knudsen et al. 2004, p.1). However, recent analysis undertaken by Statoil suggests that in fact there may be strong correlation between the concentration of dispersed oil in produced water and the concentration of PAHs and the C6-C9 alkylated phenols (Knudsen et al. 2004, p.2). Table 2.5 presents results from the Statfjord field that show that reducing the concentration of dispersed oil in produced water by 50% and 87.5% reduced the concentration of PAHs by 41% and 71% respectively, suggesting that more than 80% of PAHs reside in the dispersed oil content of produced water, rather than being dissolved in the water itself. The same is true for the phenols which have the strongest estrogenic effects (C6-C9 phenols). On the other hand, only 13% of C4-C5 phenols, which are far more abundant in the produced water than the C6-C9 phenols, reside in the dispersed oil, the rest being dissolved in the produced water. The C4-C5 phenols are therefore largely not removed by technologies which simply remove dispersed oil from the produced water. Table 2.5 - Concentrations of PAHs and phenols at various concentrations of dispersed oil
Dispersed oil 40 mg/l 20 mg/l 5 mg/l
% reduction OIW 0% 50% 87.5%
component µg/l µg/l % red µg/l % red % in dispersed
oil
2-3 ring PAH 205 122 40% 60 71% 81%
4-6 ring PAH 3.17 1.77 44% 0.71 78% 89%
PAHs 208 124 41% 61 71% 81%
C4-C5 phenols 153 143 7% 136 11% 13%
C6-C9 phenols 2.47 1.37 45% 0.55 78% 89%
C4-C9 phenols 155 144 7% 137 12% 14%
Source: Faksness el al 2004, Slide 31
The most abundant aromatic compounds in produced water (BTEX) are volatile and evaporate rapidly from produced water discharges so that evaporation and mixing combined leads to a 50,000 – 150,000 fold reduction of benzene concentrations in seawater within 20 metres of the discharge point (OGP 2002, p.9). NPD will also evaporate but to a lesser extent. PAHs are less volatile and less water-soluble. “They degrade with half-lives ranging from less than a day to several months, with the more abundant and lower molecular weight compounds being more degradable” (OGP 2002, p. 9). Table 2.6 gives the concentration of

20
various compounds in produced water and the annual quantity discharged into the North Sea. Table 2.6 - Estimates of North Sea discharges of aromatic compounds in produced water Aromatic compound % Concentration in produced
water Annual input into
North Sea
Units % mg/l tonnes
Total aromatic compounds 100% 8.93 4,500
BTEX 96.4% 8.61 4,337
Of which: % BTEX mg/l tonnes
Benzene 53.3% 4.59 2,312
Toluene 32.2% 2.77 1395
Ethylbenzene 2.9% 0.25 126
Xylenes 11.6% 1.00 504
NPD 3.3% 0.29 148
Phenyl Benzene 0.2% 0.02 9
PAH 0.1% 0.01 6.3
Of which: % PAH µg/l
tonnes
Acenaphthylene 17.3% 2.16 1.09
Acenaphthene 13.1% 1.63 0.82
Fluorene 49.1% 6.15 3.1
Anthracene 8.6% 1.08 0.54
Fluoranthene 2.1% 0.27 0.13
Pyrene 3.4% 0.43 0.22
Benz(a)anthracene 1.8% 0.23 0.12
Chrysene 3.8% 0.48 0.24
Benzo(b)fluoranthene 0.2% 0.03 0.014
Benzo(k)fluoranthene 0.0% 0.01 0.003
Benzo(a)pyrene 0.2% 0.02 0.009
Indeno(1,2,3,cd)pyrene 0.0% 0.01 0.003
Dibenz(a,h)anthracene 0.0% 0.00 0.002
Benzo(g,h,i)perylene 0.1% 0.02 0.009
Source: Derived from Johnsen et al. 2004, p.3
2.5.2 Dispersion of aromatic compounds in the marine environment
Table 2.7 shows the concentrations of naphthalenes and PAHs at 10 metres depth at different distances from an oil production platform in the Norwegian sector.

21
Table 2.7 - Typical column concentrations (µgl-1) of PAHs at different distances from an oil production platform in the Norwegian sector
Distance from discharge: 0m (discharge) at 500m at 2,000m at 10,000m
Naphthalenes 1200 0.04 0.013 0.007
% of discharge concentration 100% 0.0033% 0.0011% 0.0006%
PAHs 33 0.0040 0.001 0.0004
% of discharge concentration 100% 0.0121% 0.0030% 0.0012%
Source: OGP 2002, p.9
Frost et al. (1998) found observable increased levels of PAHs in the seawater as far away as 10 km from the nearest discharge source, while the dilution, dispersion and biological degradation model predicted elevated levels of these compounds at even further distances from the nearest discharge point (Frost et al. 1998, introduction). Figure 2.2 - Modelled dispersion of naphthalene (µg/l) in the Tampen area of the NCS.
Source: Frost et al. 1998, section 3.1 Note: White circles are installations; black circles are sampling sites. The yellow shading in the figure shows background levels observed at the reference site. It should be noted that this is a conservative model based on sophisticated measuring and dispersion modelling techniques, and in its present form is mainly used as a management tool for ranking risk, rather than for depicting the actual field situation.
The results presented in Figure 2.2 show that increased levels of naphthalene could [theoretically] be expected to appear in the whole area between Statfjord and Troll (produced water discharging facilities) under representative meteorological conditions during the field study (Frost et al. 1998, section 3.1).
2.5.3 Bioavailability of aromatic compounds in the marine environment
These dispersed concentrations do not however relate directly to the concentrations found in marine organisms. For many compounds, transport through biological membranes (i.e. its bioavailability) requires that the compound be dissolved in the surrounding water (Frost

22
et al. 1998, section 3.2). This explains the concern about those PAHs which do dissolve partially in water. The dissolved fraction (up to 20%, see Table 2.5) is not removed by the de-oiling techniques used before discharge of produced water and may be bioavailable in the marine environment thereafter. There are two bioavailability pathways of a substance in the marine environment. Bioconcentration is defined as the net result of uptake, distribution, and elimination of a compound in an organism due to exposure via water, whereas bioaccumulation includes exposure from both food and water (Frost et al. 1998, section 4.1). Passively drifting planktonic organisms, such as algae and micro-zooplankton, coming into or along the discharge plume within the period of increased concentration levels in the discharge area, are expected to have the potential for uptake and bioconcentration of dissolved organic compounds [such as PAHs] present in the produced water (Frost et al. 1998, section 4.2). Food-chain bioaccumulation is defined as the accumulation and transfer of compounds due to exposure both from food and water, resulting in an increase of the internal concentration in organisms at succeeding trophic levels. Food-chain bioaccumulation is significant for several of the organic compounds present in produced water (Frost et al. 1998, section 4.3). Food-chain bioaccumulation has been found to be most important at the micro-zooplankton level, shown by the bioaccumulation factor in Table 2.8 below, being greater in the micro-zooplankton than in the algae on which they feed. Table 2.8 – Bioconcentration and bioaccumulation factors (BCF, BAF) for naphthalene
Naphthalene Algae Micro-zooplankton Zooplankton
Demonstrated processes
Bioconcentration
Bioconcentration Bioaccumulation
Bioconcentration Bioaccumulation Elimination
BCF (uptake from water only) 33 400 8 700 700
BAF (uptake from both water and diet)
33 400 112 200 1 600
Source: Adapted from Frost et al. 1998, section 4.3. Demonstrated process interpreted from text. Definitions: BCF (Bioconcentration factor) - The ratio of the tissue concentration of a compound at steady state to the concentration of the compound in the surrounding water (expressed as function of the whole body wet weight). BAF (Bioaccumulation factor) - The ratio of the tissue concentration of a compound at steady state due to all routes of exposure (both from food and water) to the concentration of the compound in the surrounding water (expressed as a function of the whole body wet weight).
Table 2.8 shows the relative importance of uptake from diet compared to uptake from water exposure only. Bioaccumulation from diet exposure is most important for the micro- zooplankton level, but a contribution from the diet was also found for the zooplankton (Calanus finmarchicus) present at the next level in the marine food-chain studied. The lower level of bioaccumulation found in the zooplankton species (Calanus finmarchicus) is probably due to higher capacity of metabolism in this species (Frost et al. 1998, section 4.3). Bioaccumulation is also demonstrated by the Zooplankton’s BAF being higher than its BCF.

23
Table 2.9 - Concentration of total PAH measured in mussels in the North Sea compared to levels observed in other areas Location of mussels Total PAH (ng/g wet weight)
North Sea (< 500 m from platform) 400-1150
North Sea (< 10 km from platform) 20
North Sea (background areas) 8
Norwegian coast (background) 47
Norwegian contaminated fjords 100-4300
Source: Frost et al. 1998, section 3.2.2 Table 2.9 shows the bioconcentration of PAHs in mussels (used as an indicator species). It was found that the concentration of PAHs in mussels from the near-field areas (<500 m) is generally 50 to 140 times higher than the background levels and 2.5 times higher in the mussels up to 10 km downstream of the platform in the direction of the prevailing current. The ability of fish to rapidly transform or metabolise PAHs through activation of the detoxification system (mixed function oxidase enzymes) limits the possible correlation of PAH concentrations in fish tissue with exposure concentrations in water. It is therefore difficult to predict the bioavailability of a PAH compound by the use of caged fish (Frost et al. 1998, section 3.2). OGP (2002, p.15) came to the conclusion that “The limited potential for exposure of organisms living near discharges is supported by the observation that fish and shellfish living near produced water discharges do not accumulate PAHs to an environmentally significant degree.” It is not clear whether and to what extent this conclusion in respect of shellfish was informed by Frost et al. (1998), and this would seem to be an issue that warrants further observation and research.
2.5.4 Effects of aromatic discharges
A number of toxicity mechanisms have been linked to PAHs, including:
• non-polar narcosis; • phototoxicity; • endocrine disruption • biochemical activation, that in turn may result in
o mutagenicity o carcinogenicity and o teratogenicity.
Source: OGP 2002, Page 11.
No toxic effects from produced water have yet been observed in the field. Theoretical work has suggested that produced water has a relatively low capacity to have effects on marine organisms after short exposures. For example, Frost et al. (1998) has predicted through computer-based models that, due to rapid dilution, acute toxic effects are not expected to be found beyond a distance of 50 m from the discharge point (Frost et al. 1998, section 5.1) (and, as noted above, none have in fact been observed even within this distance).
A chronic effect can be defined as a stimulus that is lingering or continues for a long time (several weeks to years, depending on the life cycle of the species). The term chronic can be used to define either the exposure or the response to an exposure. Chronic exposure typically induces a biological response of relatively slow progress and long continuance.

24
Chronic effect data from long-term exposure to PAHs are scarce. Work done in the early 1990s found adverse effects in benthic communities near produced water discharges to shallow waters, possibly caused in part by PAHs from produced water. However, the effects may have been caused in large part by the development of hypoxia3 [low oxygen] in the sediments and bottom water by microbial biodegradation of hydrocarbons and other organic compounds (Reported in Neff 2002, p.313). More recent reports have found that: “Comprehensive field monitoring programmes carried out over the last 10 years in areas with the highest density of offshore installations and with the largest volumes of produced water, though capable of identifying the presence of produced water constituents have not identified negative environmental effects” (OGP 2004, Executive Summary). An alternative way of assessing the possible chronic effects of PAHs is by the use of biomarkers. DNA adduct formation has been applied as a biomarker for PAH exposure and genotoxic effects. DNA adducts are formed through covalent bonds between a variety of pollutants and the DNA molecule. The outcome of DNA adducts is not clear, they may represent an adaptive response to the organisms environment, cause cancer or lead directly to cell death or adverse effects in the next generation. PAHs in general are known to exhibit genotoxicity through the formation of DNA adducts. (Klungsøyr et al. 2003, p.22). DNA adducts observed in a Norwegian study (Klungsøyr et al. 2003) at the Norwegian installations Sleipner and Statfjord, strongly suggest a situation of increased genotoxicity since all 14 individual haddock caught and analysed showed higher levels of DNA adducts. DNA adducts were not however found in the cod and saithe caught and analysed alongside the haddock in the Klungsøyr study. It is thought this is due to haddock having a feeding habit that brings them into much closer contact with the sediment than the cod and the saithe (Klungsøyr et al. 2003, p. 13). However, the levels of DNA adducts found among haddock in the Statfjord area are the same as outside specific point sources of PAHs/DNA-binding-xenobiotics such as aluminium smelters, pulp and paper mills, and creosote contaminated bottom sediment (Klungsøyr et al. 2003, p.26). In interpreting the importance of this finding, there are a number of considerations:
• Causality - The data presented in the report (Klungsøyr et al. 2003) does not demonstrate significant differences in exposures of PAHs between background levels and levels near installations discharging produced water. Therefore the observed differences in DNA adducts may be due to other environmental factors other than discharges of produced water. At most the data may be said to show an association between DNA adducts and produced water discharging installations. The study does not show that PAHs from produced water discharges cause DNA adducts in fish.
• Harm - DNA adducts found in the research do not indicate actual cancer formation, nor is it certain that they will affect reproduction or population viability. However, the fact that they may have these effects could warrant them being considered as harm to the marine environment.
3 Hypoxia means "low oxygen." In aquatic ecosystems, low oxygen usually means a concentration of less than 2-3 mg/l of water. A complete lack of oxygen (0 mg/L) is called anoxia.

25
2.5.5 Existing risk assessments for aromatics
Surveys of organisms can provide information about the level of bioaccumulation of components of produced water, as discussed above. A theoretical approach to the assessment of risk uses extrapolations to predict the relevant concentrations which could cause an effect in the marine environment (see Section 2.3 Existing assessments of risk ). Using this approach, the risk of these components causing harm to the marine environment is thought to be low. Not only is there no evidence from surveys of environmental harm being caused by the aromatics in produced water, existing risk assessments suggest that the probability of these substances causing such harm is very low, because of the limited bioaccumulation of these substances in fish, because the models suggest that threshold concentrations for toxic effects of aromatic substances are reached within, at most, a few hundred metres of the discharge point (OGP 2002, consolidated summary), and because observed levels of PAHs in organisms are all much lower than reported PNEC concentrations (Frost et al. 1998, section 5.2). However, there is still an issue relating to the potential bioaccumulation of toxic compounds in shellfish, and Frost et al. (1998) also recommend further investigation of the combined environmental risk of the total compound mixture in produced water.
2.6 RISK TO THE MARINE ENVIRONMENT FROM ALKYLPHENOLS
Phenol is hydroxyl benzene [a ring of 6 carbon atoms which form an aromatic ring, five bonded with hydrogen atoms and the remaining aromatic carbon is bonded to a hydroxyl (OH) group]. The five aromatic carbons not bonded with the hydroxyl group readily react with methyl carbons (single carbons bonded with hydrogen atoms) or halogens to form methyl phenols (alkyl phenols) and halogenated phenols respectively. Phenol, alkyl phenols, and to a lesser extent halogenated phenols are natural components of the environment (Neff 2002, p.203). Phenol can undergo the addition of further alkyl groups; ‘octylphenol and nonylphenol [C8-C9] are strong oestrogen mimics, the less highly alkylated phenols have relatively low toxicity’ (Neff 2002, p.205). C8 and C9 phenols largely reside in the dispersed oil content (see Table 2.5) and are therefore largely removed by de-oiling techniques. C8 and C9 alkylphenols have not therefore been detected in produced water in the North Sea and it is the C4-C7 alkylphenols (which do not have such a strong estrogenic effect) which represented the highest potential risk in discharges of produced water.
2.6.1 Fate of alkylphenols in the marine environment
Concentrations of phenol found in produced water have been reported to be in the range of 0.1-43 mg/l or an average (median) of 8mg/l (see Table 1.2 in section 1.2.2). After discharge, evidence for the fate of alkylphenols is as follows (see Table 2.5 in section 2.5.1 for the concentration of phenols in produced water):
• Around the point of discharge - Phenol [the precursor to alkylphenols] is present in the upper water column of the northern North Sea near an oil production platform in the Statfjord field at concentrations of 0.224 -0.468µg/l (Neff 2002, p.206).
• Dispersion - Phenol in produced water discharges from the platform is diluted in the receiving waters by 10,000 fold within 10m and by 20,000 fold at a distance of 500m from the discharge (Neff 2002, p.206).

26
• Degradation and sedimentation - Phenol at an initial concentration of 9,000µg/l is completely degraded in less than five days in a marine model plankton ecosystem (Neff 202, p.205).
• Bioavailability (of alkylphenols): o Bioconcentration – Bioconcentration factors (BCFs) of phenols in fish range from 0.47 to 5.67 in different species of fish (Neff 2002, p.208), where BCFs above 1 show some degree of concentration (see Glossary). BCFs of nonylphenol are reported to be much higher at 280-3,400 in mussels, 246-280 for Atlantic salmon (Neff 2002, p.209). This is because freshwater and marine organisms tend to bioaccumulate alkylphenols to higher concentrations than phenols because of the greater hydrophobicity of the former (Neff 2002, p. 209)
o Bioaccumulation – This includes the take up of substances by organisms from food as well as water. Alkylphenols tend to have higher Bioaccumulation factors (BAFs) than phenols for the same reasons as given above for BCFs.
o Biomagnification – Nonylphenol and other alkylphenols apparently do not biomagnify in freshwater and marine food chains (Neff 2002, p.209).
o Elimination - Active metabolism [in fish] of phenol in tissues may contribute to limited bioaccumulation (Neff 2002, p.208).
2.6.2 Effects of discharges of alkylphenols in produced water
The main concern of discharges of alkylphenols in the marine environment is their potential to act as endocrine disrupters, particularly in fish. The general definition of an endocrine disrupter is an ‘exogenous agent that interferes with the production, release, transport, metabolism, binding, action or elimination of natural hormones’ (IMR 2002, p.6). Fish have ‘critical windows’ in their early life stages, during which they are particularly sensitive to hormonal effects, and when even brief exposure or exposures to low concentrations may have important and irreversible consequences. This phenomenon is actively exploited in aquaculture in some countries in order to produce monosex fish cultures by treating eggs with the female sex hormone oestrogen (IMR 2002, p.8). An ‘estrogenic effect’ of this kind can also be caused by some other chemicals, which are therefore known as ‘oestrogen mimics’. Section 2.6.1 showed that alkylphenols in produced water are quickly dispersed in the marine environment to very low concentrations indeed. However, these are then bioavailable to marine organisms and tend to bioconcentrate to much greater concentrations than found in the marine environment. Alkylphenols then bioaccumulate in fish although they do not appear to biomagnify up the food chain. The concentrations associated with these processes are very low and therefore often very hard to detect. Often their presence can be inferred from the metabolites of alkylphenols found in the liver of fish.
Experimental evidence A number of recent studies have assessed the risk to populations of fish from discharges of produced water based on an experimental finding from a study by the Institute of Marine Research (IMR 2002) which looked at the endocrine disruptive impacts of alkylphenols on groups of cod kept in controlled conditions. The method used exposed cod to alkylphenols at concentrations which were proposed to be transferable to concentrations found in produced water discharges. The experiment intimately exposed cod via a probe inserted directly into the stomach. This dosing method is a non-representative route of exposure and

27
therefore required a model to estimate how the experimental doses relate to concentrations in the North Sea. The body or feed burden (dose) of 20ppb (5ppb for the 4 alkylphenols being tested) was proposed to be ‘theoretically equivalent to a 0.032 ppb concentration in seawater, using a bioconcentration factor of 600 for the four selected alkylphenols’ (IMR 2002, summary page). This is the lower concentration tested and was proposed as the representative concentration found around produced water discharges. Also tested was a non-exposed control and higher concentrations (4* 500ppb, 5ppm, 10ppm and 20ppm) inclusive of a positive control using substantially higher concentrations. The experiment using the proposed representative concentration (20ppb) found significant differences in the pattern of maturation of the testis in male cod; as well as a delay in spawning by 21 days when the cod populations were exposed for five weeks in November to December (IMR 2002, p.54). The IMR report postulated that these effects “could have an influence on the reproductive capacity of the population” (IMR 2002, p. 54), and also could also cause them [the cod population] not to synchronise with the availability of plankton (IMR 2002, p. 50). A report commissioned by UKOOA (Matthiessen 2002) reviewed the IMR 2002 study. It identified a number of weaknesses in how the methodology was reported, and highlighted the lack of consistent or dose related responses in the hormonal effects in the cod. Although there is some doubt in the literature whether a dose response would always be expected in endocrine systems, some of the results “often appear to fluctuate at random” [for female fish] (Matthiessen 2002, p.5). This leaves it uncertain whether it was the test doses of alkylphenols which were causing these effects. It was however considered in both studies that a delay of 21 days in spawning would be biologically significant and could represent harm to the cod population if found in a wild population of cod. The focus of this area research then went on to consider how the IMR study relates to risk to wild populations of fish. An assessment of risk in Matthiessen 2002 (which excluded the IMR results) showed that there was no risk of harm beyond a 3.3km radius (Matthiessen 2002, p.22). A more recent study (Myhre 2004) worked with the IMR, adapting and using the IMR 2002 results to assess the risk to wild populations of cod, saithe and haddock from discharges of produced water. It identified that the calculation of the burden of alkylphenols in the fishes’ bodies in the 2002 IMR study (the body burden), failed to consider the absorption efficiency over the gut wall (Myhre 2004, p.11). It went on to generate a range for the No Observable Effect Concentration (NOEC) for alkylphenols, based on the adjusted IMR 2000 results, of between 4 and 40 ng/l. These were used in an exercise using the DREAM risk assessment model taking into account fish movement and uptake/elimination rates to estimate the potential of environmental risk in fish. The results “show that there is no significant risk of reproductive effects on the population levels of cod, saithe and haddock in the North Sea as a result of alkyl phenol discharges in produced water” (Myhre 2004 p.1). However, low resolution in the fish stock data forced an assumption of even distributions of fish in close vicinity of the discharges. It was reported that “this is not necessarily a valid assumption” (Myhre 2004 p.1).
Observational evidence A study commissioned by the Department for Environment, Food and Rural Affairs (DEFRA) investigated the significance of offshore chemicals as endocrine disrupters in fish (CEFAS 2004c). It found elevated levels of vitellogenin (a protein usually only found in

28
female fish) concentrations in larger wild male cod (CEFAS 2004c p.15). It extends the study to look at Icelandic caught cod (regarded as largely contaminant free and therefore a control population) and finds what appears to be the same effect in the larger male cod. This additional experiment therefore concluded that “these early results indicate that any point source contribution of endocrine disrupters in the Shetland basin [the test site with discharges of produced water] may be overshadowed by other [as yet unknown] factors, that may be natural or anthropogenic” (CEFAS 2004c p.16).
2.7 RISK TO THE MARINE ENVIRONMENT FROM HEAVY METALS
Metals which are likely to be present in produced water at concentrations substantially higher than those in seawater are barium, cadmium, chromium, copper, iron, lead, nickel, silver and zinc (E&P 1994, p. 29, Johnsen et al. 2004, p.5). However, metals like barium, iron and manganese “are likely to precipitate rapidly in the produced water plume … and co-precipitate other dissolved metals in the produced water plume” (Johnsen et al. 2004, p.5). These metals would be expected to exhibit limited bioaccumulation potential (E&P 1994, p. 29). Some of the toxicity of several North Sea produced waters is attributable to zinc, which is one of the metals most frequently found at substantially higher concentrations (more than 1,000-fold) in produced water than in seawater (Neff 2002, p. 34). Seawater concentrations found in the North Sea are between 0.11-2.20 µg/l [ppb] (Neff 2002, p. 176) and produced water concentrations of a mean of about 7,000µg/l [ppb] (IMR 2002, p. 3). Zinc is an essential micronutrient in all marine organisms and therefore marine animals appear to be able to regulate tissue zinc. For example, inter-tidal snails Polynices sordidus maintain a relatively constant internal zinc concentration in sediments with zinc concentrations up to 10,000 µg/g [ppm] (Neff 2002, p. 179) and crabs and barnacles maintain relatively constant body residues in concentrations of dissolved zinc of up to about 400 µg/l. Johnsen et al. 2004 make the point that “some metal-organic compounds do appear to biomagnify to a limited extent”. For example, “Concentration of … arsenobetaine, metyl mercury, cobalamin and selenomethionine tend to increase with increasing trophic levels in marine foodwebs.” (Johnsen et al. 2004, p.5) Determining whether or not there are negative effects from this biomagnification is difficult, because some organometallic compounds (including cobalamin and selenomethionine) “are essential micronutrients and are actively bioaccumulated from food.” (ibid., p.5) This study has therefore found that there is no evidence that metals in produced water have had toxic effects, or that there is a significant risk of them doing so.
2.8 ZERO HARM AND THE PRECAUTIONARY PRINCIPLE
At the Fourth Ministerial International Conference on the Protection of the North Sea in Esbjerg, Denmark, in 1995 the participating Ministers agreed “that the objective is to ensure a sustainable, sound and healthy North Sea ecosystem. The guiding principle for achieving this objective is the precautionary principle. This implies the prevention of the pollution of the North Sea by continuously reducing discharges, emissions and losses of hazardous substances from all sources [to water] thereby moving towards the target of their cessation within one generation (25 years) with the ultimate aim of concentrations in the environment near background values for naturally

29
occurring substances and close to zero concentrations for man-made synthetic substances.” (Esbjerg 1995, paragraph 17). This text found its way more or less verbatim into the 1998 OSPAR Sintra Statement and the OSPAR 2001 Recommendation on the management of produced water (see Section 1.2.3). This is one of the clearest policy interpretations that has yet been made of what implementation of the precautionary principle might mean in practice. It clearly states that the policy objective is to continuously reduce emissions of hazardous substances to zero within 25 years, such that background concentrations of all substances will ultimately return to their natural levels (which for man-made synthetic substances is close to zero). It may also be noted that the Declaration does not state an intention to reduce all discharges to zero, but only discharges of hazardous substances. It may also be noted that the Declaration refers to hazard rather than risk. In other words, it is concerned with substances that could cause harm, whatever the probability (through dilution or dispersion, for example) that they will actually do so. If risk is probability multiplied by consequence, as stated above, then the Declaration is aimed at reducing all discharges which could have a negative consequence, even if the probability of them doing so is thought to be close to zero. The reason is the current uncertainty of the probability estimate, which is why it was thought necessary to invoke the precautionary principle in the first place. The Esbjerg Declaration is not uncontroversial. Even at the time the UK entered a reservation that it “shares the ideal of these aims, but does not accept that they are currently practicable”. (Esbjerg 1995, Index Note 3). However, by the time of the next International Conference the Ministers felt confident enough about the soundness of the Esbjerg Declaration to “note with satisfaction the major progress made since the Fourth North Sea Conference in protecting the marine environment against hazardous substances. The 'one generation' target of the Esbjerg Declaration has been recognized within OSPAR and in the European Union giving it increased importance.” (Bergen 2002, paragraph 51) On this occasion there was no UK reservation. Earlier sections of this report have distinguished between ‘harm’ and the ‘risk of harm’. In the context of the Esbjerg Declaration harm is pollution, which by definition has a negative impact on the environment which is subject to it. The risk of harm is related to the emission of hazardous substances. By ceasing this emission the Esbjerg Declaration seeks to reduce this risk to zero. A major purpose of the comparative assessment which follows in Section 4 of this report is to explore the economic and environmental implications of this risk reduction. In their report on the Norwegian oil and gas industry’s progress in meeting the goals of the Esbjerg Declaration, Lystad & Nilsson (2004) of the Norwegian Pollution Control Authority confirm that “hazardous chemicals are only to be evaluated based on their intrinsic properties” and “shall not be evaluated through the risk modelling as arguments for use and discharge or not” (p.4). On the achievement of the Norwegian Government’s goal that discharges to sea should be reduced by 80% from a year 2000 base by 2005, Lystad & Nilsson (2004, p.5) report: “All the ministerial goals will not be achieved for all the oil and gas fields by the end of 2005. … There is still work left to do on PAHs and alkylated phenols in produced water, while the concentrations of heavy metals in produced water seem to be a matter of less concern, except for some installations.” They also note that “today there is no cleansing technology that completely will eliminate the discharges of hazardous substances in produced water” and that “a level of physical

30
zero discharges [i.e. no discharges of anything to sea] might not be the optimal solution. This might be the case if increased amounts of chemicals are needed, if more energy resulting in significant increase in emissions to air is needed or if the costs are too high.” It is precisely the objective of this research to investigate such possibilities.

31
3. PRODUCED WATER MANAGEMENT TECHNIQUES AND ABATEMENT TECHNOLOGIES
3.1 INTRODUCTION
There is a distinction between a produced water management technique and a produced water abatement technology. Some responses to the produced water regulatory requirements will involve techniques which optimise present produced water treatment equipment. Best Available Technique (BAT)) is defined under the Council Directive 96/61/EC (the IPPC Directive) as “both the technology used and the way in which the installation is designed, built, maintained, operated and decommissioned”, and therefore henceforth in this report technique will represent all technology and techniques which change the concentration or total mass of any component of produced water being discharged into the marine environment. There are a large number of established techniques which are already deployed to treat produced water. Many of these are briefly described in the next section. The main focus of the section following is those abatement techniques most likely to be deployed to comply with the stricter regulatory requirements, most notably the 15% oil in water reduction target to be met by 2006. PWRI is an important but complex technique which is very specific to the characteristics of the well in question and therefore is discussed at some length in Section 3.4.
3.2 DESCRIPTION OF PRODUCED WATER MANAGEMENT TECHNIQUES
Table 3.1 lists the main produced water abatement technologies covered in OSPAR 2002, which will be discussed in this and the next section. Some of the technologies are then subjected to a more detailed comparative assessment. The majority of the techniques in Table 3.1 focus on the removal of dispersed oil (and its various hydrocarbon components), and fail to tackle compounds which are actually dissolved in the water. It is important to note that components referred to as ‘dissolved’ within the literature are in fact (and rather confusingly) both dispersed in the oil and dissolved in the water. Techniques which reduce the dispersed oil component will therefore also reduce that proportion of the so called ‘dissolved content’ which is to be found in the dispersed oil. Techniques which reduce components which are dissolved in the water are the disposal and preventative techniques (PWRI and down-hole separation), as well as C-Tour which extracts hydrocarbons which are dissolved in the water using a condensate solvent. From the data set out in Table 3.1, the cheapest technique in terms of the cost of removing a tonne of dispersed oil is hydrocyclones at €88/kg or approximately £60/kg (though such cost data will vary from site to site). However, hydrocyclones are already widely deployed on UK facilities but are only effective at reducing the oil content of produced water to a certain level. For the more thorough removal of oil required by OSPAR in 2006, Table 3.1 suggests that PWRI would appear to offer the most economic solution at €69/kg or approximately £46/kg, although a large amount of the cost data for other processes is not available from this source and therefore this is not a definitive result. An assessment of the cost effectiveness of different techniques, including PWRI, is made in section 5 of this report using new data.

32
Table 3.1 - Summary of produced water abatement technologies
Cost/kg removed BAT Removes (from the marine environment):
Technology
Oil/Gas
Dissolved oil
Dispersed oil
Zinc
equivalents
Y/N
Dispersed oil
BTEX
NPD
PAH
Scale
inhibitors
Demulsifies
Heavy metals
NORM &
LSA
Physical separation
Hydrocyclones Oil € 38 Y up to 98%1
No No Some
DGF/IGF (flotation) Y 60-90%
Skimmer tank Y 20-90%
Preventative techniques
Down hole water separation Oil € 1,460 € 88 € 41,261 50% 50% 50% 50% 50% 35% 50%
Enhanced separation (additional to physical separation)
Pect-F, Mare's Tail: Coalescence + Hydrocyclones ~65% No No Some
Centrifuges Gas € 465 Y 95% No No Some
Alternative (new) technology
Absorption - Clays (non regenerative) Yes <10% <10% <10%
Absorption - MPPE (regenerative) Y 95% Yes ? ?
C-Tour: Solvent extraction + Hydrocyclones Emerging 50-70%2 - 40% 70% Yes
Epcon CFU 50-75% 0% 17% 32-47%
Membranes Yes Yes Yes Yes
Steam Stripping Gas € 327 € 277 € 1,212 Y >85 90% 90% 90% Some Some
Biological (aerobic degradation) Yes Yes ? ?
PWRI € 1,146 € 69 € 32,378 Y 100%3
Sources: OSPAR 2002 & OGP 2002, (C-Tour, Epcon and Mare’s Tail: Knudsen et al. 2004) 1 Depends on the size of the oil droplets. 2 In addition to the hydrocyclone process. The hydrocyclone process is typically already present and is required downstream of the C-Tour process. 3 Proportional to the availability of PWRI equipment.

33
3.2.1 Physical separation techniques
Hydrocyclones This is an existing and proven technique for the removal of dispersed oil, which is deployed on a large number of facilities in the UK sector of the North Sea. Oil-water separation in hydrocyclones is based on centrifugal forces and the difference between specific gravity of oil and water. Produced water is injected under pressure tangentially. The shape of the cyclone causes an increase of speed, resulting in large centrifugal forces and separation of oil and water. The heavier water will move in a vortex towards the exit of the cyclone, whereas the lighter oil will move in a secondary vortex in the centre of the cyclone towards the inlet. Dissolved components, such as benzene, and heavy metals will not be removed. Recently, rotating cyclones were developed, which are a ‘compromise’ between a hydrocyclone and a centrifuge. Rotating cyclones have higher removal efficiencies than a static hydrocyclone.
Dissolved gas/induced gas flotation (DGF/IGF) In the process of gas flotation, a gas is finely distributed in the produced water. Raising gas strips oil droplets from produced water. Gas bubbles and oil form a foam on the water, which is skimmed, often by means of a paddle wheel. The foam and part of the water is skimmed into an overflow. Gas may be injected under pressure (Dissolved Gas Flotation, DGF) or by means of an impeller or pump (Induced Gas Flotation, IGF). Dissolved particles such as benzene and heavy metals are not removed, although gas injection may “strip” some volatile components. Sometimes, air is used instead of gas, in which case a major part of BTEX is also removed from the produced water. These techniques are usually the “polishing” step in a multiple-step procedure to remove dispersed oil from produced water.
Skimmer tank Separation is based on the difference between the specific gravity of oil and water and the coalescence of oil droplets. When the retention time is sufficient, oil floats to the surface and can be separated by an overflow. This technique is suitable only for non-dissolved components such as dispersed oil with a sufficiently large particle size. Dissolved materials such as benzene and heavy metals cannot be separated using this technique. The skimmer tank or its modified version, parallel plate interceptor or corrugated plate interceptor, is mostly used as part of a set of a number of techniques for the removal of dispersed oil.
3.2.2 Preventative techniques
Down hole separation Down hole separation for oil is a technique in which the production of an oil-water mix at the bottom of a production well is separated by a hydrocyclone. Separated water is injected into a suitable underground zone and the remaining oil water mix is pumped to the surface. In this way, the amount of produced water can be reduced by more than 50%. This will result in a higher oil production, a relatively low water production and the use of fewer chemicals. The discharge and treatment of produced water is considerably reduced or the water injection installation could be considerably decreased. However, it was not possible from the literature to establish the energy implications of down hole separation.
Produced Water Re-Injection (PWRI) The injection of produced water into an existing or specifically drilled well. The details of PWRI are discussed in Section 3.4 and later are the subject of comparative assessment.

34
3.2.3 Enhanced separation techniques
Mare's Tail: Coalescence + Hydrocyclones The Mare’s Tail® consists of a ‘tail’ of a fibrous medium such as polypropylene. The principle of operation of the Mare’s Tail® involves oil droplets dispersed in the water phase attaching to the fibrous medium. The oil droplets coalesce and move along the length of the Mare’s Tail® until the force of the water stream overcomes the attracting force of the media and the coalesced larger droplets detach from the medium. Performance tests have been conducted on the Mare’s Tail® independently. The downstream hydrocyclone performance was improved by 40% and overall reduced the dispersed oil content by 65% down to a concentration of approximately 25mg/l independent of inlet concentration. The lifetime of the polypropylene medium is not clear from field trials on Sleipner A (Knudsen et al. 2004).
Centrifuge A centrifuge may be used in order to reduce the dispersed oil content in produced water. Oil-water separation in a centrifuge is based on centrifugal forces and the difference in specific gravity of oil and water. Produced water has the gases removed from it and is injected into the centrifuge, where it is rotated at speed. Water will collect at the outside of the centrifuge; oil will collect in an inner layer. Oil and water are removed separately, under controlled conditions. An oil-water interface needs to be maintained. Oil is pumped back into the process and water is discharged. A centrifuge allows for separation of smaller oil droplets than a hydrocyclone although the energy consumption is higher. Centrifuges are usually applied as a polishing step when a performance standard (e.g. a discharge limit) cannot be achieved. On oil producing installations the use of centrifuges may be useful to clean skimmings from degassers and induced gas flotation units, thereby avoiding build up of sludges.
Epcon Compact Flotation Units (CFU) The Epcon Compact Flotation Unit has been developed to remove hydrocarbons, hydrophobic substances and particles. It consists of a vertical vessel acting as a 3-phase water / oil / gas separator. Centrifugal forces and gas-flotation contribute to the separation process. A pipe suspended from the top of the vessel extracts gas, oil and some water. The oil content of this stream will be from 10-80%. Treated water exits the vessels at the bottom outlet for discharge to sea. Dispersed oil, naphthalenes, 2-3 ring PAHs, 4+ ring PAHs phenols of more than C6 alkylation were reported to be reduced by 50-75%, 17%, 32%, 47% and 33% respectively (Knudsen et al. 2004). The Epcon technology is the subject of comparative assessment below.
3.2.4 Alternative (new) techniques
There are two types of absorbent material available to filter the produced water: those that cannot be regenerated (modified clays, wood and fibres), and those that can (activated carbon, MPPE, etc). Both systems can be designed for either a high removal efficiency of specific hydrocarbons (i.e. aromatics) or dissolved substances in general.
Non-regenerative absorption (carbon, natural fibres and clay) Once all the non-regenerative material is used, the medium needs to be removed and replaced, and the used material shipped to land for disposal. The amount of hydrocarbons in the produced water will dictate the replacement frequency of a particular medium. The waste filtration medium will be likely to contain Low Specific Activity (LSA) radioactive

35
material and therefore may require special disposal onshore. This is one of the techniques considered in case study A (see section 4.2.2). This filtration technology is the subject of comparative assessment below.
Regenerative absorption MPPE In principle, regenerative techniques (such as MPPE [Macro Porous Polymer Extraction]) can remove all organic substances with a different polarity from water. In the technique, hydrocarbon contaminated water is passed through a column packed with MPPE particles. The polymer matrix contains an extraction liquid trapped within it, which removes the hydrocarbons from the water. The purified water passes out of the column directly for reuse or discharge. In situ regeneration of the extraction liquid and MPPE particles is accomplished using low-pressure steam: the steam volatises the hydrocarbons. The volatised hydrocarbons are condensed and then separated by gravity. The hydrocarbon phase is recovered, and the water phase is recycled to the system. The energy requirement is estimated to be 6kWh per cubic metre of produced water treated and the MPPE particles would have limited regeneration potential, needing replacement every 1.5 to 3 years. This system is likely to be used for additional water treatment and can remove the majority of all aromatics in produced water. This technology is not thought to be appropriate for the high produced water handling volumes required on larger oil producing facilities, although it is appropriate for gas facilities.
Membranes The majority of aliphatic and aromatic hydrocarbons may be removed by means of membrane filtration. Low pressure water (approximately 3.5 bar) is guided along a number of ceramic or synthetic filter elements which contain pores of 0.1 – 0.2 µm. Build up of filter cake is avoided by a cross flow and a turbulent flow along the membrane surface. Part of the produced water passing through the membrane is directed to the pressure-pulse system for cleaning of the membranes, the remaining part is discharged. The components that remain in the membrane after the pressure pulses need to be removed with chemicals periodically. The main part of aliphatic hydrocarbons and solids remain in the concentrate, which is directed to a settling tank, where the oil can be separated easily in view of the high concentrations.
Steam Stripping (not suitable for produced water from oil production) Hydrocarbons can be removed from condensed water from glycol regeneration on gas platforms by means of steam stripping. The water is fed into a packed column and brought into intense contact with steam (known as stripping). This technique is suitable for the removal of dissolved oil (BTEX), but will also remove aliphatic hydrocarbons. Steam and hydrocarbon vapours are condensed and separated easily because of the high hydrocarbon content. Hydrocarbons that have been separated by steam can be directed to the condensate treatment system; and the water can then be discharged.
Biodegradation Uses microbiological organisms to break down and remove oil and aromatics from produced water. The system requires medium and long residence time for the organisms to grow and stabilise for effective operation. Due to size and weight constraints, this system is only usually applicable to onshore use.

36
C-Tour Process System with hydrocyclones The C-Tour Process System is an enhancement to the hydrocyclone technique based on the extraction of hydrocarbons from water using gas condensate. The injected gas condensate acts as an extraction-solvent. The principle of the extraction processes is to add to a solution an immiscible solvent that will absorb the solute (such as aromatics) because of its higher affinity towards the extraction solvent. The solvent extracts the dissolved hydrocarbons from the water phase and these are then removed in the hydrocyclone. Only specific types of condensate are usable, therefore limiting the potential application of this technique. The process required a ratio of approximately 2% condensate to produced water, the use of which may increase the concentration of BTEX components in the produced water stream by about 40% (Knudsen et al. 2004). This technique also reduces the concentration of dispersed oil by 50-70% (assumed to be 60% in the analysis in this report), as well as making the dissolved organic content disperse, so that it also can be removed in the hydrocyclone. The C Tour process is the subject of comparative assessment below.
3.3 THE TECHNIQUES SUBJECTED TO COMPARATIVE ASSESSMENT
For comparative assessment of produced water management techniques, detailed data of a number of kinds (on materials, energy and costs) is required. Very often this information is commercially confidential. The data used in this and the following section has come from a facility which is here called Facility A. Information on additional techniques was also applied to Facility A, although it is not currently envisaged that they will be installed there. Information was also taken from a PWRI case study (BP Forties 1995) because it provided detailed data on the implications of a switch from seawater to produced water injection. With data from these sources, the comparative assessment is carried out in relation to the following techniques:
1. Filtration of produced water as presently treated through a non-regenerative filtration media (clay).
2. Injection produced water as presently treated under three different PWRI scenarios:
a. PWRI into an existing pre-drilled ‘dump’ well which does not provide pressure support;
b. PWRI providing pressure support to a production reservoir; and c. The drilling of and PWRI into a well not associated with an operational production reservoir (a ‘dump’ well);
3. Use of the C-Tour process upstream of a produced water treatment train which uses hydrocyclones.
4. Use of the Epcon process on the present produced water stream. Not all techniques reduce the various components of produced water in equal proportions. Many of the abatement techniques presently deployed on facilities on the UKCS are only intended to remove dispersed oil (droplets of oil). Some components of produced water have more affinity for the water rather than the oil component of produced water, and are therefore largely not removed by these techniques. Such techniques allow the proportion of a component of produced water which is actually dissolved in the water to be discharged. As noted above, most components do not reside entirely in either the dispersed oil or water part of produced water, but in some kind of partition between the two. Frost et al. found that

37
there was no correlation between the oil-in-water content and the content of aromatic compounds in produced water (Frost et al. 1998, summary). However, recent analysis (Knudsen et al. 2004) has shown that more than 80% of PAHs and C6-C9 phenols are to be found in the dispersed oil rather than dissolved in the produced water (see section 2.5.1). However, it is the C4-C7 phenols which are thought to represent the highest potential risk in discharges of produced water, and Knudsen et al. found that only 13% of C4-C5 phenols reside in the dispersed (see Table 2.5). If robust, this finding demonstrates the effectiveness of abatement technologies in removing many of the components of produced water which are thought to be of the highest potential risk (PAHs and C6-C7phenols), both directly (by removing them with the dispersed oil), and indirectly (by reducing the quantity of the components that is available to dissolve in the seawater). However, the C4-C5 phenols, which have weaker estrogenic mimicking properties but tend to be found at greater concentrations in produced water, are largely allowed to be discharged.
3.4 ANALYSIS OF THE IMPLICATIONS OF PWRI
The three PWRI scenarios as described in the previous section will have different material and energy requirements as discussed below: 1. Well commissioning and decommissioning including drilling - This will only be required for PWRI strategy 2c, as PWRI strategies 2a and 2b assume that there are existing wells which have been commissioned and will be decommissioned independent of whether PWRI occurs.
2. Pre-treatment of the produced water – The produced water will need to undergo a similar level of treatment to discharged water before it can be injected into the well. The exact nature of the treatment required will depend on the well characteristics and is largely independent of the PWRI strategies.
3. The energy required for the injection of the produced water – The entire energy used for PWRI can be attributed to PWRI strategies 2a and 2c. Only the additional energy required due to the substitution from seawater to produced water re-injection should be attributed to PWRI strategy 2b.
3.4.1 Well commissioning and decommissioning
The drilling of an injection well offshore is an energy intensive and expensive process. Estimates for the capital cost have been made at €4.5 million [£3 million] (OSPAR 2002, p.44). The drilling of an oil well will typically require 301toe (Novatech 2003, Appendix C), which is assumed to come entirely from diesel. These are likely to represent conservative estimates as regulations relating to drilling activities now require drill cuttings generated using non-water-based drilling muds to be captured and managed onshore, which increases energy use.
3.4.2 Pre-treatment of the produced water
Pre-treatment of injected produced water to current standards is usually required to prevent reduction in injectivity (see below). This also allows the contingency of discharging the produced water into the marine environment in the event of a failure in the injection system. The latter would require the dispersed oil in water content to be 30mg/l or less to comply with the 2006 OSPAR concentration recommendation. Therefore it is assumed in the analysis in Section 5 that existing levels of pre-treatment would be required in addition to

38
any treatment required to protect the receiving formation from detrimental effects such as bacterial growth. Loss of injectivity occurs through a degradation of the permeability of the formation around the injection zone due to interactions of produced water with the receiving containment conditions in the reservoir. Factors and qualities within the produced water which have the potential for a loss of injectivity are: suspended oil and solids; fatty acids; dissolved gases and salts; and the PH and temperature of produced water (OGP 2000, p. 5). “A determination of the degree and type of treatment required to maintain injectivity is typically based on an analysis of all available produced water characterisation and injection formation data, including water quality data, core data, and well testing results” (OGP 2000, p. 6). PWRI can occur at constant pressure and temperature (matrix injection); or in a way that causes fracturing of the containment rock through periodic changes in pressure or temperature (fracture injection). Fracture injection exposes new surface areas whenever new fracturing occurs and therefore any loss of injectivity due to permeability degradation in the injection zone will be largely negated. This means that fracture PWRI may well require less pre-treatment than matrix injection, as any loss in injectivity will be temporary and therefore tolerated. The saving in operating costs due to reduced pre-treatment requirements of fracture injection has to be weighed against the higher capital costs for fracture injection (OGP 2000, p. 6). High dissolved salt content in injected produced water has the potential for scale formation, most notably calcium carbonate and barium sulphate (Case study A, feasibility study p.49). Scale formation can be treated or prevented by the addition of additives to the produced water.
3.4.3 Injection of produced water
The pressure at which produced water is injected varies greatly depending on the injectivity of the well and the volume of water required to be injected.
Pressure support PWRI (PS-PWRI) Produced water can be injected into oil-bearing layers or pressure supporting aquifers of the reservoir for the purpose of water flooding, to provide pressure support and sweep oil out of the pore space into the production wells. The material, energy and financial requirements for PS-PWRI are not the same as PWRI into a disused well as pressure support seawater injection (PS-SWI) would have occurred in the absence of PS-PWRI. For many facilities on the UKCS, PS-SWI is already occurring and therefore a large part of the energy required for this substitution can be discounted from the analysis. There are a number of often conflicting factors determining the pressure (and therefore the energy requirement) of such a substitution (BP Forties 1995, section 4.1): 1. Higher temperatures of produced water leading to:
a. lower viscosity leading to reduced pressure requirement. b. reduced fracture size within the formation and therefore loss of injectivity requiring higher injection pressure.

39
2. The loss of injectivity caused by damage from components found in produced water. This would lead to a higher injection pressure being required to maintain PWRI volumes.
A reduction of a half in the rate of injection (or an increase in pressure of 500psi) has been reported on substitution from seawater to produced water injection (BP Forties 1995, section 4.2). It should however be noted that the substitution in BP Forties 1995 was driven by the need to dispose of poorly treated produced water during a time of produced water treatment equipment failure. This finding should therefore be considered as a worst-case for this type of substitution.
3.5 OTHER ABATEMENT TECHNIQUES BEING CONSIDERED BY OPERATORS
The operators of Facility A were actively considering CETCO’s non-regenerative filtration through a clay medium in addition to PWRI. A technique being considered by other operators is the optimisation of existing equipment to reduce the dispersed oil content, although this would be unlikely to provide the reductions required by company A and was not part of their strategy to meet the reduction target. The C-Tour and Epcon produced water abatement techniques were the subject of discussion and presentation at the Society of Petroleum Engineers’ (SPE) event held in Canada in the spring of 2004 (Knudsen et al. 2004). Interest in these latter two techniques was led by Norwegian operators who have the additional requirement to focus on potentially harmful dissolved discharges from all their facilities, rather than just the dispersed oil reduction target recommended by OSPAR. These two technologies are however considered to be candidates for meeting the 15% reduction target in the UK, depending on the circumstances of particular facilities and operators. Of these techniques:
1. All of them were found to reduce the dispersed content; 2. The optimisation of existing equipment would entail costs but few material requirements. It was also considered unlikely to provide the kind of reductions in OIW required;
3. C-Tour was found to reduce components actually dissolved in the water, as well as about 40% of the corrosion inhibitor added to the process; and
4. The filtration technique would require replacement and landfilling of its clay medium.

40
4. COMPARATIVE ASSESSMENT OF PRODUCED WATER MANAGEMENT TECHNIQUES
4.1 METHODOLOGY
The concept of sustainable development requires the simultaneous consideration of environmental, economic and social performance. The mapping of material, energy and financial flows is intended to cast light on the environmental and economic dimensions, because many environmental impacts arise from the flow of materials and energy. Material and energy flow analysis is based on the fact that energy and matter can neither be created nor destroyed, but only change from one form into another. The analysis involves defining a boundary for a system and undertaking an accounting process for energy and/or material flows through the system and across its boundary, balancing inputs and outputs of a given material, or a flow of energy, over a given timeframe. The idea is simply illustrated in Figure 4.1, which shows that the materials cross the boundary of the system under consideration, in this case an offshore installation, and are transformed by the process operating on it. Energy flows relating to the materials before they enter or after they leave the system are not considered, but the costs associated with their final disposal are included in the assessment. Figure 4.1 – Conceptual material flow diagram
As shown in Figure 4.2 below for PWRI, fuel gas and sophisticated injection equipment are required to reduce the negative value of the produced water, by disposing of it into a well. At the end of the process, all input materials are reduced to waste products of some kind (some of which may be recycled). The injected produced water retains some (probably low) negative value because of the possibility that it may re-emerge from the well at a later date, either through pumping, if it is being used as pressure support in a functional well, or leakage. It is the combination of these material flows and end points, and their associated environmental implications, which provide a relative assessment of the best produced water management technique.
Process
Wastes (produced water) Cleaner produced water
Material system boundary
Valuable inputs (Fuel) Waste from inputs (Emissions)
OFFSHORE INSTALLATION

41
Figure 4.2 - Graphical representation of material flows required for PWRI
Note: Much of the energy and capital requirements could be excluded from this analysis if injection provides reserve pressure support.
4.2 THE CASE STUDIES AND SCENARIOS
It is intended that this report will inform the management of produced water through the use of case studies. Of particular interest are responses to the OSPAR 2006 reduction requirement. Case study A is based on a review process undertaken by the operators of a production field in the UK sector of the North Sea. Early on in their review process, it was decided to focus on reducing discharged oil from one facility in the field (Facility A), as the most efficient way of meeting the 2006 requirement. As shown in Figure 4.3, Facility A (like many others) is facing a trend of increasing volumes of produced water and declining volumes of oil production. Between 2001 and 2002, produced water production exceeded oil production and by 2006 is projected to represent 79% of total produced fluids. Volumes of produced water are projected to peak in 2007 at about 13,500 cubic metres per day. The processing capacity of any produced water management equipment fitted is therefore required to meet this peak.

42
Figure 4.3 - Projected fluid production from Facility A
-
2,000
4,000
6,000
8,000
10,000
12,000
14,000
16,000
20
00
20
01
20
02
20
03
20
04
20
05
20
06
20
07
20
08
20
09
20
10
20
11
20
12
Year
Cubic metres per day
Oil
Produced water
Sources: Case study A, PON15D submission to the DTI, Annex A, Table 1 & Feasibility study, p.36
This increasing trend in produced water production and the projected increase in oil discharged into the marine environment in the absence of additional measures means that the operator has to reduce their oil discharges by more than the 15% as a percentage of current volumes. Figure 4.4 - Projected discharges of dispersed oil in produced water (Facility A)
Source: Projections based on produced water volume projection (Case study A, feasibility study, p.36) and business as usual oil in water concentration of 22mg/l.
Figure 4.4 shows that in the peak year of 2007, a reduction of about 42 tonnes (Feasibility study p.2) or 40% of oil in water is needed to meet the 2006 OSPAR requirement for the field as a whole. The management scenarios proposed in the review process for Facility A to achieve this target were:
0.0
25.0
50.0
75.0
100.0
125.0
2006 2007 2008 2009 2010 2011 2012
Year
Dispersed oil in water (t/y)
Required to meet 15% field target

43
1. Risk production cutback – Continuation of present management techniques for produced water, taking into account the potential loss in revenue due to cutback in production to comply with the company-wide regulatory target in the absence of a UK sector trading mechanism being available.
2. Filtration of produced water through an inert clay medium – requiring the installation of the filtration unit, replacement of the filtration material four times a year and the onshore landfilling of used filtration material as a radioactive waste due to LSA in the produced water.
3. Re-injection of the produced water into a disused non-production well using fracture injection techniques to maintain injectivity – requiring fuel gas to run the injection pumps.
The further two abatement techniques included in the comparative assessment (the C-Tour and Epcon processes) were not considered by the operator of Case study A. However, high level data received from Statoil (who are in the process of installing trial units on one of their facilities) was used to show the likely material flows which would occur if these techniques were installed at Facility A. The data on the composition of produced water presently being discharged at Facility A was not provided with enough certainty to be used in the comparative assessment. Therefore a generic composition of produced water from North Sea facilities was used as shown in Table 1.2. The assessment of risk at the reference distance of 500m is expressed through the ratio of PEC:PNEC, where the PEC is generated by diluting the concentration of a substance in the discharged produced water by a factor of 1,000 (to take account of the mixing over the 500m distance). This is the default value assumed in the CHARM assessment in Case study A’s PON15D submission (Case study A, PON15D, p.15 Table 1. Note: The CHARM model was designed and is only used for the theoretical modelling of the fate of production chemicals as this kind of assessment is not required for hydrocarbons in the UK). The PEC is likely to be less than this for the volatile BTEX, which is subject to evaporation as well as mixing. The produced water management scenarios examined in this report, on the basis of data from Case study A, are:
• Scenario 0 – Management as at present, with the risk of production cutbacks in order to meet the targets
• Scenario 1 – Filtration of produced water using non-regenerative clay • Scenarios 2a,b,c – Management through Produced Water Re-injection (PWRI) • Scenario 3 – Use of the C-Tour process • Scenario 4 – Use of the Epcon process
4.2.1 Risk of production cutback: Present management of produced water (Scenario 0)
This scenario is used as the baseline for the other produced water management scenarios as it is both the starting point for further cleanup, as well as providing a point of comparison against which other scenarios can be assessed.

44
There is a material requirement for this scenario in terms of chemicals used to help the separation processes and prevent scaling of topside piping. Projected volumes of chemical use are shown in Figure 4.5. Figure 4.5 - Mass of chemicals in the management of Produced water by HQ classification
0
500
1,000
1,500
2,000
2,500
2003 2004 2005 2006
Year
Tonnes
Silver chemicals
used & discharged
Gold chemicals
used and
discharged
Gold chemicals
used but not
discharged
Note: see Table 2.1 for a definition of the silver and gold hazard categories
Figure 4.5 shows a moderate rising trend in chemical requirement leading up to 2006. It also shows that all of the potentially toxic silver classified chemicals, and the bulk of the less toxic gold chemicals remain in the produced water stream. For a discussion on the chemical classification of production chemicals see section 2.3.1. Although it was thought possible that the chemical requirements may need to change for the other scenarios, a review process will be required to determine what these changes would be after commissioning any new equipment (Case study A, feasibility study p.51). However, “it appears unlikely that process chemical use/cost will be reduced significantly due to a switch to produced water re-injection” (Case study A, feasibility study p.51) or any of the other scenarios. It is therefore assumed that the chemical usage is the same for all the scenarios and it is not necessary to include the energy or financial requirement for the use of these chemicals in the comparative assessment. Such an assumption would need to be tested on a case by case basis to confirm whether it would hold for other installations. The review process did not include the possible costs of buying permits as a means of meeting the field’s 2006 OSPAR requirement. It did however look at the potential loss of public-sector revenue (due to lost production), if a sector-wide trading scheme, which would enable an operator with excessive oil-in-water abatement costs to buy permits from other operators, was not established. These estimates were for forgone production of about 1 million tonnes of oil, with a value of nearly £78 million (at an assumed long term value of £13 per barrel, which at current oil prices of nearly twice that this is very conservative), of which approximately £20m would be payable to the UK Treasury (based on the fact that a total production of 224 mtoe of oil and gas yielded tax revenues of £4.5 billion in 2003 (UKOOA 2004, online summary).
4.2.2 Filtration of produced water (Scenario 1)
CETCO’s filtration of produced water through an inert clay medium requires an initial investment of nearly £8 million pounds (£7.6 million at present value) and an addition of an

45
estimated 80 tonnes to the topside of Facility A. Four times a year the 129 tonnes of filtration canisters (50% inert clay, 50% oil) would need to be replaced with 65 tonnes of new filtration canisters at a cost of about £190,000 per replacement. The filtration canisters would most likely contain Low Specific Activity (LSA) radioactive material which would have otherwise been discharged into the marine environment. “The classification of the canisters as a waste stream is open to interpretation by the Scottish Environmental Protection Agency” (Feasibility study p.57). It may be possible to separate the clay filtration material and the casings from the oil and treat them as separate waste streams (Feasibility study p.54). However, it was assumed in the review documents and in this report that this would not be the case and that the entire canister would need to be treated as an LSA waste stream. This waste stream may be considered as loose LSA waste, or could even be classified as radioactive waste (if its activity is greater than 14.8Bq/g), when it could only be disposed of at the Drigg facility at Sellafield, and then only if BNFL would permit this (Feasibility study p.57). The cost of landfill of loose LSA waste was estimated to be £120,000 per replacement. The non-waste management costs were estimated to be £115,000 per replacement. The total cost is therefore estimated to be £0.42 million per replacement process or £1.7 million per year.
4.2.3 PWRI (Scenarios 2a-c)
The capital costs and material requirements of the re-injection of the produced water into a disused non-production well using fracture injection techniques are show in Figures 4.6 and 4.7. Figure 4.6 - Estimated capital investment (£m) for installation of PWRI at Facility A
1.1 - Concept & feasibility studies £0.37
Description Tonnes
Engineering
Vendor
Procurement
Fabrication
Transport
Installation
Commissioning
Mechanical 78 £0.33 £0.03 £2.65 £0.01 £0.06 £0.08
Piping 10 £0.09 £0.01 £0.68 £0.13 £0.00 £0.25
Structural 46 £0.08 £0.02 £0.03 £0.20 £0.01 £0.06
Instrument £0.17 £0.13 £0.65 £0.33 £0.13
Electrical £0.13 £0.01 £0.34 £0.26 £0.04
Topside subtotals 134 £0.8 £0.2 £4.3 £0.3 £0.0 £1.0 £0.2
1.2.1 – Topside £6.9
1.2.2 - Prepare wells £1.8
1.2.3 - Management £3.6
1.2 – Implementation
Total PWRI 134 £12.3
1.0 - Total produced water management (including management studies) £12.7
Source: Feasibility study, Note: Includes 20% contingency costs

46
Figure 4.7 - Value chain of PWRI equipment during commissioning process
£0
£2
£4
£6
£8
£10
£12
£14
En
gin
ee
rin
g
Ve
nd
or
Pro
cu
rem
en
t
Fa
bri
ca
tion
Tra
ns
po
rt
Ins
talla
tion
Co
mm
iss
ion
ing
We
ll
pre
pa
ratio
n
Ma
na
ge
me
nt
Tasks
Financial expenditure (£ m
illion)
Source: Feasibility study Note: Includes 20% contingency costs
Figures 4.6 and 4.7 show that £12.7 million (£12.2 million at present value) will need to be invested to commission PWRI on Facility A. This is invested in just 134 tonnes of material on the topside, 87 tonnes of which are pumps which are procured at a cost of £2.6 million. If it is assumed that the 134 tonnes is entirely steel, the energy required to generate that steel would be an estimated 3,350GJ or 80 toe, as the energy requirement for the generation of new steel is 25GJ/tonnes of steel (IP 2000). The total energy inputted into the engineering and fabrication process would be likely to be significantly greater than this, although it is not possible to make a reasonable estimate of this. The main operational requirement is for the additional fuel gas requirements to run the injection pumps. Estimates for this were made for Case study A, although these projections did not take into account the produced water production profile. Therefore, the fuel gas use projection was fitted to the produced water production profile as shown in Figure 4.3 and the value provided (37,224 tonnes of fuel gas per year) was assumed to represent the peak value in 2007. Furthermore, there was not any value within the company’s review process associated with the use of the fuel gas, which could otherwise have been sold onshore. It has been assumed that the value of the fuel gas is £6/MWh (£84/toe) of thermal energy (DTI 2004). This represents the price paid for natural gas by onshore power generators. The emission factor of 2.0984 tCO2 per tonne of fuel gas (Case study A, CO2 forecast) was used to calculate that CO2 emissions were projected to be 471,884 tonnes, generated by 224,859 tonnes of fuel gas combusted between 2006 and 2012. This generated 157,582 toe of heat energy of estimated present value of £8.5 million if it was piped to shore and sold to power producers at a price of £6/MWh (DTI 2004a). The corresponding opportunity cost to the operator of emitting the CO2 would be £1.5 million at present value (assumes that the CO2 trading value within the EU emission trading scheme to be £10/tCO2 (€15/tCO2,

47
Rowland 2003). This value for emitting a tonne of CO2 is the private financial cost and does not represent a social valuation of the emission of a tonne of CO2. However, if it was to be accepted that the emission caps set by EU member states will be met, any transfer of CO2 abatement effort would not represent any environmental risk. The cost of running and maintaining the PWRI system would be an additional £100,000 per year escalated up at 3% per year for inflation (Case study A, Feasibility study p. 89). this represents £478,936 at present values for operating PWRI between 2006 and 2012. The PWRI systems are not operational all of the time. There would likely be planned times for maintenance as well as unplanned failures of the equipment. Installations injecting produced water before 2000 experienced total down-time of about 5% (DTI 2004d, p.5). Scenarios 2b and 2c explore hypothetical PWRI scenarios as discussed in section 3, based on the data found in Case study A. Scenario 2b assumes a simple substitution from seawater to produced water injection. It has been assumed in the summary matrix (Figure 4.8) that this substitution requires an additional 25% of energy after this substitution. This is a high level assumption which represents half of the worst case increased pressure requirement as discussed in section 4.4.3. A further justification for reducing this value by a factor of two is that Case study A is proposing fracture rather than matrix injection, therefore losses in injectivity will be temporary. Scenario 2c assumes a new injection well needs to be drilled. This adds a further £3 million (OSPAR 2002, p. 44) to the capital costs of PWRI relative to scenario 2a. The energy requirement for the drilling process is assumed to be 301toe (Novatech 2003, Appendix C).
4.2.4 The C-Tour and Epcon treatment processes
Detailed data on the material and cost requirements of these techniques were not readily available, although high-level estimates were provided. These costs are thought to represent a relatively straightforward installation of the equipment involved. Some facilities may require substantial modifications to the top side, at additional cost in advance to installation. Estimates for maintenance requirements were not available for either of these techniques, therefore the estimates used for the filtration and PWRI scenarios were assumed. These were both £100,000 per year escalating by 3% to allow for inflation.
The C-Tour process (scenario 3) The installed costs for the C-Tour process are estimated to be in the range of 50 - 70 million Norwegian kroner per unit (platform). The mid point of this range and a kroner exchange price of £0.082 were assumed to generate a capital requirement of £4.9 million in 2005 or £4.5 million at present values. This would only be effective for an estimated 43% of 2006-2012 projected produced water volumes as some of the produced water is not presently passed through hydrocyclones. This still represents a substantial volume of produced water. The operating material requirements are just the fuel gas consumption from running the condensate pump. The condensate requirement is estimated to be 1% of produced water volumes (Knudsen et al. 2004. p.2), which is almost entirely recycled through the process. Scaled down energy requirements of the PWRI pumps were used to estimate that the condensate pump’s power rating would be approximately 0.8 kW, and the fuel gas requirements would be approximately a total of 1,000 tonnes between 2006-2012.

48
The Epcon process (scenario 4) The installed costs for the Epcon process are estimated to be in the range of 10 - 100 million kroner per platform. The mid point of this range (55 million kroner) and a kroner exchange price of £0.082 were used to generate a capital requirement of £4.5 million in 2005 or £4.1 million at present values. The operating material requirements are 5 - 10 ppm [mg/l] of flocculant (see Glossary), the mid point of which corresponds to a flocculant requirement of 210 tonnes during the period 2006-2012. It is assumed that the flocculant would be captured along with the removed oil in the induced floc, and would not therefore be discharged into the marine environment.
4.3 APPROACH AND SCOPE OF THE ANALYSIS
The period under consideration is 2006 to 2012. This is the period during which data is available in the review documents, and is therefore assumed to be the remaining economic life of the facility. All of the material flows shown in Figure 4.8 represent the sum of all direct material flows required to manage the produced water over this 7 year period and are shown in red. The energy flows associated with offshore energy use in the management of produced water are converted into tonnes of oil equivalent (toe), and are shown in blue. This unit is used to present energy usage as it demonstrates in material terms the number of tonnes of oil which would be required to be burnt to generate this amount of energy. The financial flows associated with these material flows have all been discounted at a rate of 10% per year to represent the present (2004) value to the operator of the material flow and are shown in green. This discount rate is the rate assumed by the operator of Case study A in their review process. The assessment of risk to the marine environment is shown by the maximum ratio of the estimated PEC at a distance of 500m and the PNEC4 (for example, for scenario 0 for BTEX, this value is 0.03). Also provided is the minimum level of mixing required to reduce the discharge concentration to the PNEC value (again, for BTEX in scenario 0, this mixing factor is 27). For introduced and discharged chemicals, the HQ value is provided (see Table 2.1). Material inputs to produced water typically have a positive financial value (and are therefore a cost to the operator), while produced water outputs are typically wastes and therefore are likely also to represent a cost to the operator. The private cost of each scenario is the cost of the value of the inputs plus the cost of disposing of any wastes (including an imputed CO2 value, which is likely soon to be generated by the EU Emissions Trading Scheme), less the value of any marketable output materials. This enables the cost per tonne of oil not discharged into the environment (i.e. the net abatement cost per tonne) to be calculated for each scenario. For example, for scenario 2a (see Figure 4.8) the abatement cost would be £24.2 million (in present value terms) divided by 590 tonnes (the tonnage of oil not discharged), or about £42,000/tonne. A monetary value was imputed to carbon emissions, on the basis of a value thought likely to emerge from the EU Emissions Trading Scheme that is currently being established
4 PNEC values could only be found for a limited range of chemicals, as shown in Table 4.

49
(£10/tonne CO2). The Government has also legislated for an emissions trading scheme for produced water, but so far no trading of produced water discharges has taken place. No monetary cost has therefore been assigned to the oil that continues to be discharged into the marine environment. It is interesting to consider how high, under such a scheme, the value of emissions of oil in produced water would have to be for the different abatement scenarios to be financially viable (i.e. for abatement to be carried out at effectively zero cost). This can be calculated from the information underlying Figure 4.8, though not directly displayed in it. The calculation needs to take account of the fact that emission trading values in the future need to be discounted to make them comparable with the scenarios’ present value costs (which is why these values differ from the average abatement costs). For scenario 2a the value of oil emission permits in an emissions trading scheme would need to be £65,000 per tonne of oil discharged for the effective abatement cost to be zero. The valuation discussed above is only a private one (i.e. that faced by the oil and gas operator). The composition (and therefore the risk of harm in the marine environment) of oil discharged from different treatment techniques will vary depending on the mechanisms used within the technique. The more complex comparative assessment of abatement scenarios involves the joint consideration of:
• the waste materials, including the gaseous emissions as well as the endpoint of the oil diverted from being discharged into the marine environment;
• any perceived reduction in risk of harm informed by the PEC:PNEC ratios and the mixing factor and more general information in sections 2.5 & 2.6;
• both assessed in the context of the costs to the industry and the corresponding loss of tax revenue from the offsetting of these costs against tax liability and the potential for early shutdown.
4.4 RESULTS OF THE ANALYSIS
The Reference scenario 0 shows that the produced water which would be discharged from Facility A would contain 610t of dispersed oil, 23t of dissolved BTEX, about 0.34 tonnes of PAHs, nearly 11,000t of the 12,000t of gold chemicals added to the process, and all of the 850t of silver chemicals. These discharges feature as the inputs into the other management scenarios. To comply with the OSPAR 2006 emission limits through reduced production, it is estimated that about 1mt of oil production, with a value of £78m, would be lost. Filtration (management scenario 1) can further reduce the quantity of dispersed oil in water by 80% to 124t, at an average abatement cost of £32,000/t, although this generates 940t of loose LSA waste which may become increasingly difficult (and expensive) to dispose of. An emission trading scheme would need to value not-discharged oil at £50,000/t (shown as the imputed value) to make this a zero cost management scenario. Filtration can also reduce the PAH concentration by 64% (to 4.3ppb). The discharge reduction for the three PWRI management scenarios (2a,b,c) is computed on the basis of average operation/down times for the equipment (see section 5.2.3). This means that they reduce the dispersed oil in water by 95%, and also greatly reduce the discharges of both BTEX (from 23t to 1.2t) and PAHs (from 0.34t to 0.02t), as well as the ‘gold’ and ‘silver’ input chemicals. However, as shown in the ppb column, the concentrations of components that they do discharge are unchanged from the input concentrations. The cheapest PWRI scenario (because the produced water replaces seawater in injection that is already being

50
carried out) is 2b, with an average abatement cost of £5,000/t and imputed value of £8,000/t. 2a is substantially more expensive and energy intensive, using 160,000 toe of fuel gas and producing 470,000t CO2, and some SO2 and NOX. The average abatement cost of this scenario is £42,000/t and the imputed value is £65,000/t. Scenario 2c is even more expensive, because it involves drilling a special well. Figure 4.8 also shows that for every tonne of dispersed oil diverted from the marine environment, 810 tonnes of CO2 will be emitted for scenarios 2a and 2c (note that drilling an oil well does not contribute significantly to this) and 200 tonnes of CO2 for scenario 2b. C-Tour (scenario 3, as applied to the 43% of produced water flows on Facility A) reduces the dispersed oil in water content by 60% and the concentration of PAHs by 70% for the 43% of water actually treated, reducing the overall concentration of PAHs from 12ppb to 8.5ppb, at a cost of £5m. This gives an average abatement cost of £31,000/t of dispersed oil, and an imputed value of £49,000/t. The C-Tour process actually increases the concentration of BTEX discharged by 17%, (or an increase of 40% for the produced water stream actually treated by the C-Tour process). Epcon (scenario 4) achieves an even greater (51%) reduction in PAHs, and also reduces oil in dispersed water by 63%, at a cost of £4.6m, giving an average abatement cost of £12,000/t and an imputed value of £19,000/t. On these figures which are applicable to Facility A, Epcon is clearly preferred to C-Tour in terms of cost of reducing dispersed oil. C-Tour however is better at reducing the dissolved BTEX and PAHs than Epcon or any other clean up process considered. If a 60% reduction in dispersed oil is adequate, Epcon is also preferable on financial grounds to both filtration and PWRI scenarios 2a and 2c. Filtration produces almost as good a discharge performance on total dispersed oil discharged as PWRI, but is less good on BTEX and PAHs. However, it is also substantially cheaper than the two PWRI scenarios that do not involve substitution for existing seawater injection. Which of these options is to be preferred depends both on the discharge targets for oil, the particular characteristics of the facility and the discharge site, and on the degree of precaution that is considered desirable in respect of BTEX and PAHs.

51
Figure 4.8 - Material flows for produced water management 2006-2012
Produced water (mt) 27.5 Produced water (mt) 27.5
Reference scenario 0: Present management of produced water (Hydrocyclones & IGF)
Max Mixing
Components in PW t ppb 2004£m Component discharged t ppb 2004£m PEC:PNEC factor
Dispersed OIW Dispersed OIW 610 22,000 £0.0 (@500m)
BTEX BTEX 23 840 0.03 27
PAH PAH 0.34 12 0.09 86
Total in PW Discharged chemicals HQ
Material inputs t toe 2004£m Gold 10,900 <1
Gold chemicals 12,000 Silver 850 1-30
Silver chemicals 850 Total in PW 12,400 £0.0
Total added 12,850 Recovered chemicals 1,100
12,850 Outputs excluding water 13,500 £0.0
Crude oil (million) -1.0 -£78
Management scenario +1: Filtration of presently managed produced water through clay granules
Max Mixing
Components in PW t ppb 2004£m Component discharged t ppb 2004£m PEC:PNEC factor
Dispersed OIW 610 22,000 £0.0 Dispersed OIW 124 4,500 £0.0 (@500m)
BTEX 23 840 BTEX 21 777 0.02 25
PAH 0.34 12 PAH 0.12 4.3 0.03 30
Gold chemicals 10,900 Gold chemicals 10,900 <1
Silver chemicals 850 Silver chemicals 850 1-30
Total in PW 12,400 £0.0 Total in PW 11,900 £0.0
Material inputs t toe 2004£m Output waste t toe 2004£m
New canisters 450 £3.4 Special landfill 940 -£4.2
Non material OPEX £0.5 (Of canisters)
12,900 £11.5 Outputs excluding water 12,800 -£4.2
Private costs of scenario 2004£m £15.7 Average abatement cost (2004£/t) £32,000 Imputed ETS value (2004£/t) £50,000
Management scenario +2a: Re-injection of presently managed produced water into unused well
Max Mixing
Components in PW t ppb 2004£m Component discharged t ppb 2004£m PEC:PNEC factor
Dispersed OIW 610 22,000 £0.0 Dispersed OIW 30 22,000 £0.0 (@500m)
BTEX 23 840 BTEX 1.2 840 0.03 27
PAH 0.34 12 PAH 0.02 12 0.09 86
Gold chemicals 10,900 Gold chemicals 500 <1
Silver chemicals 850 Silver chemicals 40 1-30
Total in PW 12,400 £0.0 Total in PW 600 £0.0
Material inputs t toe 2004£m Output waste t toe 2004£m
Fuel gas 225,000 160,000 £8.5 CO2 470,000 -£3.0
SO2 110
Non material OPEX £0.5 NOX 650
240,000 160,000 £21.2 Outputs excluding water 470,000 -£3.0
Private costs of scenario 2004£m £24.2 Average abatement cost (2004£/t) £42,000 Imputed ETS value (2004£/t) £65,000
CO2 emitted per tonne of oil diverted (tCO2/t OIW)
Unknown
Offshore well
Inputs excluding water
Inputs excluding water
2004£m
£12.2
CAPEX
t
134
Inputs
Operational flows (assumes present pw discharge as an input)
CAPEX
CAPEX
t
Inputs excluding water
Operational flows
Operational flows (assumes present pw discharge as an input)
Baseline input materials
Unknown
returned to export oil
Discharged (Assumes 80% PWRI availability) Risk assessment
80
2004£m
£7.6
Endpoint of
diverted oil
Discharged
Landfill
Endpoint of
diverted oil
Inputs
Risk Assessment
Outputs
Potential loss of production (without trading):
Risk assessmentDischarged into the marine environment
Discharged
810
Endpoint of
diverted oil
Continues on next page

52
Notes: Figures are rounded. The Imputed value is the value that would need to be put (through an Emissions Trading Scheme for produced water or otherwise) on 1 tonne of produced water not discharged for the abatement technology to be effectively zero cost.

53
Table 4.1 - Assumptions used to generate material flows
Assumption Value Unit Source
Financial assumptions
Private discount rate 10% % Case study A, Feasibility p. 14
Year of present value (NPV) 2004
Value of a € £0.67 2004£ Financial Times, April 2nd 2004
Cost of drilling a well € 4,500,000 2002€/well OSPAR 2002, p.44
Price of traded abated CO2 £10 £/tCO2 Rowland 2003
£6 £/MWh DTI 2004a, for power producers in 2002 Value of offshore fuel gas
£84 £/toe
Value of Norwegian Kroner £0.082 £'s
(12/5/04) x-rates.com
Price of oil £13 2003£/brl Case study A, Feasibility 84
Physical assumptions
1 barrel ( of oil) = 0.159 m3 BP 2003, p.23.1
Density of produced water: 1.025 t/m3 Brandsma Engineering 2001, p.5
Density of crude oil: 0.136 t/brl EPPO website
% of PAHs in dispersed oil 81% % in OIW Faksness et al. 2004, Slide 31
Volume of ideal gas (1 atmos, 25oC) 24.465 m3/kmole PSIGate 1995
Energy assumptions
Gross CV Natural gas 0.042 GJ/sm3 Novatech 2003, p.24
Gross CV Methane 37 GJ/t Waste Research Station website (28th April 2004)
Average GCV FG - 2006-20012 29 GJ/t Source: calculated from PON15D, Table 2
1 GJ = 0.0239 toe
Energy factor to drill offshore well 12,600 GJ Novatech 2003, Annex C
SO2 retention rate 95% %
Fuel gas emission factor - CO2 2.0984 tCO2/t fuel
in Case study A, CO2 Forecast 2005 - 2012
Fuel gas emission factor - NOx 0.002907 tNOx/t fuel
in BP 2003, p.23.1
Diesel emission factor 3.2 tCO2/t fuel
in Case study A, CO2 Forecast 2005 - 2012
Facility A characteristics
Load factor of Facility A 92% % Case study A, Feasibility p.5
Availability of PWRI 95% % DTI 2004d
Dilution factor at 500m 1,000 Factor Case study A, PON15, p.15
Additional energy (SWRI - PWRI) 25% % Assumption based on experience in case study B
Pre-filtration disperse oil in water 22 mg/l Case study A, Feasibility study
Post filtered dispersed oil in water 4.5 mg/l Case study A, Feasibility study
% reduction in BTEX post filtration 7.5% % reduction OSPAR 2002, p.57
4.5 ASSESSMENTS OF THE GENERIC NATURE OF CASE STUDY A
This report has explored a case study’s response to a prospective policy measure. However, it is hoped that the conclusions from this report will provide relevant insights into proposed legislation for the oil and gas sector more generally. This section explores the extent to which this may be the case for PWRI; the management scenario most dependent on location and therefore the one considered most likely to generate variation in costs and material

54
requirements. CO2 emissions and capital requirements of PWRI are explored in detail on the basis of alternative industry information. While it would have been desirable in principle to carry out more sensitivity analysis of the costs in relation to such issues as the oil concentrations in produced water, possible economies of scale in the technologies considered, or the assumptions in Table 4.1, in general the available data did not permit this. This should be taken into account in the interpretation of the results of the study. The CO2 emissions associated with the diversion of a tonne of dispersed oil from the marine environment have been investigated in Table 4.2. This approach provides a basis for comparison for the likely energy requirements for PWRI. Table 4.2 also highlights the trade-off in terms of mass for the two main waste streams; dispersed oil and CO2, although these materials cannot be directly compared in terms of their environmental hazard. Table 4.2 – CO2 emitted per tonne of dispersed oil diverted from the marine environment
Scenario (Number)
Source of energy data
Produced water injected m3/tOIW
Oil diverted
t Fuel gas sm3/tOIW
Energy GJ/tOIW
Energy toe/tOIW
tCO2/tOIW
Case study A data 278,308 11,550 276 810 Existing well (2a) Novatech 2003
assumption 47,974 1,991 48 112
Seawater to PW (2b)
Case study A data 69,577 2,887 69 203
Case study A data 278,832 11,572 276 812 Drill new well (2c) Novatech 2003
assumption
45,066 580
48,497 2,013 48 113
Sources: Case study A data: Figure 4.8. Novatech 2003, Appendix C assumption for the injection of water (0.007-0.015 kWh/m3 of water ~ 1 sm3 FG/m3 water)
Table 4.2 shows that from the data provided by Case study A, 810 tonnes of CO2 are emitted for every tonne of dispersed oil diverted from the marine environment. This is only the case when there is an existing injection well available (scenario 2a). If drilling is required (as in scenario 2c) the CO2 emitted is only two tonnes greater at 812 tonnes. In the event that produced water injection substitutes for existing seawater injection (scenario 2b), 203 tonnes of CO2 would be emitted for every tonne of dispersed oil diverted from the marine environment. This is assuming that seawater injection requires 75% of the energy that PWRI requires. The results shown in Table 4.2 also show that PWRI at facility A has a high energy requirement, roughly a factor of six greater than that generated by the Novatech Norwegian study. As previously discussed in section 3.4.3, the energy requirement differs depending on the type of water being injected and the injection techniques used. In respect of the figures in Table 4.2: 1. The Novatech data is based on the power requirements for seawater injection, which requires less energy.
2. The type of PWRI as described in Case Study A (fracturing) would have a higher energy demand.

55
3. Relative to the fuel gas assumed in the Novatech study, the fuel gas produced at the Case Study A installation has a low calorific value and high carbon content per toe of energy content.
Thus Table 4.2 highlights Case Study A as a relatively high emitter of CO2 for every tonne of oil diverted from the marine environment. Table 4.3 – Comparison of capital requirements for PWRI systems
Case study 2004£m’s Abated t OIW/y
Average cost
£/tOIW Years of operation
Imputed cost 2004£/tOIW
Case study Bi £7.2 148 £3,700 13.1 £6,200
Case study Bii £6.4 143 £4,000 11.2 £6,200
Case study Biii £5.2 70 £7,500 9.9 £11,100
Case study Biv £5.7 51 £11,700 9.6 £17,000
Case study Bv £4.6 39 £14,500 8.2 £20,000
Case study Bvi £6.5 24 £20,900 12.7 £34,400
Facility A (CAPEX only, 13 years) £12.2 80 £11,700 13.0 £19,500
Facility A (CAPEX only, 7 years) £12.2 80 £21,800 7.0 £28,500
Facility A (As shown in Figure 4.8, inc OPEX) £24.2 80 £42,000 7.0 £65,000
Source: Case study B (A UKOOA companies initial cost assessment for PWRI systems) Note: Abatement costs rounded to two significant places
Table 4.3 compares the capital cost of PWRI (scenario 2a) of Facility A with a range of estimates from a different company, B. It shows that, when spread over 13 rather than 7 years, the capital costs per tonne of OIW not discharged into the environment for the PWRI system on facility A are broadly in the middle of the range of capital costs found by company B, but that the range is considerable. If the period of operation is reduced to seven years (as in case study A), the average cost of abatement increases to a value greater than any of the company B costs, although the imputed value (the case study’s present valuation of one tonne of oil not discharged) remains cheaper than the most expensive of company B’s case studies, case study Bvi. Table 4.3 also shows that larger capacity systems (case studies Bi and Bii), clearly have the cheapest costs of abatement suggesting significant economies of scale for PWRI systems. The final two rows in Table 4.3 explore the impact of inclusion of operating costs (including fuel and the corresponding opportunity costs for the CO2 emitted) on the cost of abatement. The imputed value increases when operating costs are included from £28,500 to £65,000, showing that an estimated 56% of case study A’s costs are incurred after commissioning.
4.6 COMPARATIVE ASSESSMENT
The private costs associated with all material flows (including CO2 emissions) are fully accounted for in Figure 4.8. It is necessary to consider the public benefit of the abatement provided by the use of all the material resources and financial expenditures as set out in Figure 4.8.

56
Table 4.4 – Summary of UKCS implications of achieving the 15% reduction recommendation in 2006
Key wastes Max PEC:PNEC
@500m
Scenario
Imputed cost/value 2004£/tOIW
UKCS cost in 2006 2004£ UKCS in 2006
tonnes of waste/tOIW diverted BTEX PAH
Reference 0 Non-compliance or cutbacks in production 0.03 0.09
Filtration 1 £50,000 £96m ~3.7 kt Loose LSA waste
1.9 LSA 0.02 0.03
PWRI 2a £65,000 £124m ~1.5 MtCO2 810 CO2
2b £8,000 £15m ~0.4 ktCO2 200 CO2
2c £73,000 £140m ~1.5 MtCO2 813 CO2
RI: 0.00 Not RI: 0.03
RI: 0.00 Not RI: 0.09
All C-Tour 3 £49,000 £94m 0.031 0.06
All Epcon 4 £19,000 £36m 0.03 0.04
Source: Figure 4.8 1 The fact that this is higher than the reference scenario is obscured by rounding Based on a case study installation: Imputed costs per tonne OIW are scaled up by a factor of 1,912 tonnes which is the reduction required in 2006. The maximum PEC:PNEC ratio is based on a limited number of available PNEC values. The research found that the case study had a relatively high energy demand for PWRI relative to injection data more generally. For PWRI the 95% of produced water that is reinjected has 0% PEC in the marine environment; the 5% that is not reinjected (due to equipment down-time) has the same PEC:PNEC ratio as the reference scenario Note that the well drilling process is a relatively small factor in material terms (~5 ktCO2); however it is more important in terms of capital requirements.
Table 4.4 summarises the main results of Figure 4.8. It shows the maximum PEC to PNEC ratio, and therefore represents the relative reduction in hypothetical risk, as well as highlighting the most substantial and important waste streams. Approximately half (the actual range is 30-70%, depending on particular tax circumstances) of any cost incurred by the offshore industry is likely to be indirectly paid for by the UK taxpayer via foregone tax revenues. For simplicity, the numbers cited below assume a taxpayer contribution of 50% of costs incurred. The monetary results below, also taken from Table 4.4, come from scaling up the results from the case study used in this study. They should be treated as illustrative only, because it is unlikely that the case study is representative of the average produced water discharge across the North Sea, but the direction of any unrepresentativeness is not known:
• Scenario 0; reference scenario - If no abatement action were taken there would be no materials required and no reduction in risk to the marine environment. Compliance with the OSPAR requirement for a 15% reduction in produced water discharges by 2006 could only be achieved by a cut in oil production.
• Scenario one; filtration - To capture all of the estimated 1,912 tonnes dispersed oil in a filter system would cost an estimated £96m in 2006, £48m of which would ultimately be paid for by the UK tax payer. This would generate an estimated 3.7kt of loose LSA waste in 2006 (1.9 tonnes for every tonne of dispersed oil diverted from the marine environment), which may have to be treated as radioactive waste and disposed of accordingly. Filtration would however reduce the maximum relationship between discharge concentration (PEC) and the PNEC by 1% (from 3% to 2%) for BTEX, and by 6% (from 9% to 3%) for the more toxic PAHs.

57
• Scenario two; PWRI - This scenario would seem to be most aligned with current regulatory trends to reduce potentially harmful discharges to zero in the long term. When PWRI is operational (assumed to be 95% of the time), it reduces produced water discharges to zero. For the remaining 5% of the time, the maximum concentrations of the discharged produced water are the same as for the reference scenario.
a) PWRI into an existing pre-drilled well would cost £124m in 2006 at present values, £62m of which would ultimately be paid for by the UK tax payer. This scenario would also lead to approximately 1.5MtCO2 being emitted in 2006 (810 tonnes for every tonne of oil diverted from the marine environment).
b) PWRI providing production pressure support would cost £15m in 2006 at present values, £7.5m of which would ultimately be paid for by the UK tax payer. This scenario would also lead to approximately 0.4MtCO2 being emitted in 2006 (200 tonnes for every tonne of oil diverted from the marine environment).
c) The drilling of and PWRI into a well would cost £140m in 2006 at present values, £70m of which would ultimately be paid for by the UK tax payer. This scenario would also lead to approximately 1.5MtCO2 being emitted (810 tonnes for every tonne of oil diverted from the marine environment).
• Scenarios three & four - The use of the C-Tour and Epcon processes would cost £94m and £36m respectively, £47m and £18m respectively would ultimately come from the UK taxpayer. Neither of these techniques would have significant waste implications nor would they reduce BTEX PEC:PNEC ratios (the C Tour process actually increases this ratio slightly, but this is not shown in Table 4.4 due to rounding). The C-Tour and Epcon processes would however reduce the maximum PEC:PNEC ratios by 3% and 5% respectively for the more toxic PAHs.
On these figures Epcon is clearly preferred to C-Tour in terms of both discharge performance and cost. If a 60% reduction in dispersed oil is adequate, it is also preferable on financial grounds to both filtration and PWRI. Filtration produces almost as good a discharge performance on dispersed oil as PWRI, but is less good on BTEX and PAHs. However, it is also substantially cheaper than the two PWRI scenarios that do not involve substitution for existing seawater injection. Ultimately, which of these options is to be preferred depends both on the discharge targets for oil, and on the degree of precaution that is considered advisable in respect of BTEX and PAHs (discussed in the next section). However, this kind of finding does demonstrate how the tracing of material flows with their values through a process can highlight both the private cost of different techniques, and the public benefit which they may yield.

58
5. CONCLUSIONS
5.1 THE RISK OF PRODUCED WATER TO THE MARINE ENVIRONMENT
Section 3 of this report identifies two main areas of pollution concern from produced water, relating to aromatic compounds and alkylphenols, which are the subject of the first conclusions of this report.
Aromatic compounds The results from risk assessment models comparing PEC with extrapolated PNEC to assess the risk posed by produced water discharges should be interpreted with care, as they will tend to conceal the underlying uncertainty and quality of available toxic effect data. A check on these results can be provided by experiments using caged fish to look for actual effects around sample discharge sites. As noted above (Section 2.5.4), using such experiments Klungsøyr et al. 2003 found DNA adducts in fish associated with sample discharge sites. However, the experiment can only be said to have established an association between DNA adducts and the sample installations. While it can not be ruled out that these DNA adducts are in some way caused by the results of the activities of the installations in question (including, for example, the presence of hydrocarbons in older piles of drill cuttings), neither has any causal link between them and discharges of produced water been established. For example, no significant variation was found in PAH exposure between the sampling sites close to the installations (where fish exhibited DNA adducts) and those far from them (where the fish exhibited fewer DNA adducts). The evidence considered here (in combination with the risk assessment models) suggests that the risk of harm from the level of PAHs in produced water is low. However, this judgement is made in the light of field studies at a small number of discharge sites which suggest no effect. However, if causality were to be established between the PAHs found in produced water and the DNA adducts discovered in field observations, this could be considered as evidence of harm from discharges of produced water. To improve the evidence base for such decisions further studies such as Klungsøyr et al. 2003 at different discharge sites should be carried out; and to reduce the risk of harm from aromatics discharge regulations intended to reduce to the average level the highest discharge concentrations of aromatic compounds in produced water should be considered.
Alkylphenols As noted in Section 3, the experiment reported in IMR 2002 attracted significant attention, as well as a certain amount of criticism over its design and the relevance. It would appear that the various concerns over the study’s methodology and dose-response results have been resolved, or put to one side, during a more recent study (Myhre 2004) that involved the same IMR researchers. Myhre (2004) used the results from the IMR 2002 and similar studies in a modelling exercise to assess the actual risk of reproductive impacts of alkylphenols in produced water on fish stocks in the North Sea. Myhre 2004 concluded “no significant risk of reproductive effects on the population levels of cod, saithe and haddock in the North Sea as a result of alkyl phenol discharges in produced water”. It did however assume even distributions of fish in close vicinity of the discharges. This means that Myhre 2004 did not

59
assess the potentially greater risk to reef populations of fish in and around the jackets of production installations, who may quite possibly spend extended time in the vicinity of discharge plume as discussed in the section on aromatic compounds above. The CEFAS 2004c study found elevated levels of vitellogenin (a protein usually only found in female fish) concentrations in larger wild ferial male cod. This was also found in the Icelandic control population of wild cod, the results would therefore fail to demonstrate that this effect is caused by discharges of produced water, or that this effect is caused by alkylphenols. The report concluded that any point source of endocrine disrupters in the area may be overshadowed by other as yet unknown factors which are the subject of ongoing investigation. Overall, the scientific literature does not demonstrate that any harm is being caused by discharges of produced water in the North Sea. Furthermore, the best available assessments of risk are able to exclude significant risks of reproductive effects at the population level with the exception of fish in the close vicinity of the discharges. This suggests that the risk of harm from the level of alkylphenols in produced water is also low. However, there is general scientific uncertainty associated with the risks from alkylphenols, and their consequences are potentially serious enough to seem to warrant further precautionary investigation as set out in Section 5.4
The reef effect An issue of outstanding concern associated with both aromatic and phenols in produced water is the interaction between the biological reef effect around jackets and produced water discharge plumes, potentially leading to higher toxic bioaccumulation in fish. This has not yet been adequately investigated, suggesting that further work needs to be undertaken in this area.
5.2 MANAGING THE RISKS FROM PRODUCED WATER
Section 2 noted the conclusion of Lystad & Nilsson (2004) of the Norwegian Pollution Control Authority that it was not currently technologically feasible to remove completely hazardous substances from produced water, and that the environmental and economic implications of reducing discharges to zero (for example through complete PWRI) might outweigh the benefits. Table 4.4 shows that the environmental implications of complying with the OSPAR 15% reduction in OIW by 2006 may be either the capturing and onshore disposal of around 4 kt of low-level radioactive waste (scenario 1, filtration) or the generation from PWRI (scenario 2) of up to 1.5 MtCO2, which are not inconsiderable increases in emissions that, in other contexts, public policy is seeking to reduce. Table 4.4 also shows that the costs of complying with the OSPAR 2006 15% reduction by 2006 could range from £36m to £140m in present terms, of which approximately 50% would be paid by the taxpayer through foregone tax revenue. In the absence of regulation, the total volume of produced water and dispersed oil being discharged into the UKCS is projected to increase in the coming years (see Section 2). However, the literature and the approaches to risk assessment suggest strongly that the main risk factor from produced water discharges is the concentration rather than the total discharge volume of the various potentially hazardous components of produced water. In

60
terms of the environmental benefit of reducing discharges of dispersed oil, Table 2.5 suggests that about 90% of the stronger endocrine disrupting alkylphenols, the C6-C9 phenols, reside in the dispersed oil content of produced water. However, only 13% of the C4-C5 phenols (which due to their higher concentrations are thought to represent the highest potential risk in discharges of produced water) reside in the dispersed oil content of produced water. This would suggest that discharge regulations which have the effect of reducing the dispersed oil content of produced water will be only partially effective at reducing the potential for endocrine disruption in the vicinity of produced water discharges. However, there has been no harm demonstrated by the various field studies, carried out at current discharge concentrations, which have been reviewed. It is in this context that the 30mg/l limit for dispersed oil in produced water as recommended by OSPAR would seem to represent a sensible precautionary way of keeping concentrations of C4-C5 phenols at levels in the middle of the range reviewed by these field studies, which have shown no harmful effects. As noted in Section 2, the 30 mg/l limit was already being achieved in 2002 by 56 out of the 70 facilities discharging produced water into the UKCS. This was four years before the target date for its achievement, which seems to imply both that the technologies to achieve compliance with this limit are widely available, and that the costs of their introduction are not prohibitive. This in turn suggests (although this issue has not been explored in this study) that the other 14 facilities could be brought into compliance with the 30mg/l limit at a social cost that is acceptable in terms of the reduction in environmental risk that it would achieve. Whether it is worth tightening this discharge limit further will depend on the evidence of harm or risk of harm that may come from future studies. The overall 15% reduction in dispersed oil by 2006 as recommended by OSPAR is a rather different matter. While this would of course reduce the quantity of hazardous substances discharged into the marine environment, the percentage reduction is arbitrary and there is no evidence that it would achieve a meaningful reduction in environmental risk from these substances. In addition, as noted above, quite apart from the economic costs of achieving the reduction, it will impose a significant environmental burden of its own. A regulatory approach that emphasises the need for continual reductions in discharges also runs the risk of reinforcing in the public mind a perception that these discharges are harmful, whereas, as noted in Section 3, there is in fact no evidence that any harmful effect is being caused by current discharges. For all these reasons, there seems to be little environmental or public policy justification for the 15% reduction target. In the absence of new evidence to the contrary, this conclusion would apply even more strongly to any further overall percentage reduction. The trading of discharge permits is permissible in the implementation of the 15% reduction as recommended by OSPAR, and there is active consideration of the possibilities of setting up a scheme (DTI 2004d). With pollution permit trading schemes that involve pollutants that have a local impact, it is necessary to consider whether the scheme might lead to pollution ‘hotspots’, where discharges become concentrated, and have an undesirable environmental impact, in certain areas. It was seen in Section 3 that increased levels of an aromatic component of produced water could be observed as far away as 10km from the point of discharge. Results from dispersion models suggest this distance could be somewhat further. There has so far been very limited work on the likelihood of pollution hotspots

61
arising from the trading of permits to discharge produced water. However, so far only the Shetland area has been identified by initial assessments by the industry as perhaps containing a cluster of produced water discharges of any plausible concern in this regard. Table 2.7 shows that by far the most reduction in concentrations occurs within 500 metres of the point of discharge (by greater than a factor of 8,000 for PAHs) Table 4.4 shows that at this distance, even with no further reduction in OIW, predicted environmental concentrations of BTEX and PAHs are well below PNEC values. Concentrations of PAHs reduce by only a further factor of 10 from 500 to 10,000 metres. This would suggest that, assuming produced water discharges are being made into open and freely mixing waters and are being degraded over time, there is little basis for concern about the reinforcement of pollution from adjacent facilities unless the facilities are within 1 km of one another. Where waters are not open and freely mixing, then perhaps the distance of potential concern should be increased to a conservative 20 km. Before a produced water discharge permit trading scheme is established, it would seem desirable to investigate the extent to which two facilities are discharging into open and freely mixing waters within 1km from one another, or two discharging facilities are within 20 km of one another and the receiving waters are not open and freely mixing. Section 3 noted that the 1995 Esbjerg Declaration envisages the continuous reduction of discharges, emissions and losses of hazardous substances to water, thereby moving towards the target of their cessation within one generation (25 years). It was also noted that the Declaration refers to hazard rather than risk. In other words, it is concerned with substances that have the potential to cause harm, whatever the probability through dilution and dispersion that they will actually do so. It is by no means clear exactly what implementation of the Esbjerg Declaration would imply in terms of produced water management, but it seems to point to the continued targeted substitution of introduced chemicals considered hazardous, combined with advanced cleanup of naturally occurring hazardous substances. Given the lack of technology to remove all hazardous substances from produced water, a strict interpretation of the Esbjerg Declaration would seem likely to lead ultimately to the application of PWRI throughout the North Sea, with PWRI system down-time negated through development and backup leading to effectively zero discharges. The material and CO2 implications, as well as the cost, would be considerable but there will always be some attraction to this approach due to its absolute and full precautionary nature. At present the scientific evidence of risk from components of produced water would hardly seem to justify the economic and environmental cost of reducing discharges to zero, but such an approach could become justified in the event of any new information emerging, such as that relating to the endocrine disruptive impacts of alkylphenols. It would seem important that continuing scientific investigation seeks to reduce the uncertainties in this area.
5.3 DIFFERENT PRECAUTIONARY APPROACHES TO THE MANAGEMENT OF PRODUCED WATER
From the discussion above three different possible approaches to the management of produced water seem to emerge. Each is precautionary in its own way, but they differ on the degree of precaution that is sought: Management approach one: maintain current standards of produced water management with additional targeted actions. This would involve broadly present levels of produced water

62
management being maintained, with additional targeted action in a number of specified areas. Underlying this approach are the findings that concentrations are already very low, there are no observed effects from present levels of produced water discharges reported in the literature, and that all technical risk assessments show the risks of any such effects to be very low. The specific areas where targeted action seems necessary are as follows (see main report for detailed explanations, see Section 5.4 for details of further recommended research): i. Implementation of the 30mg/l discharge limit recommended by OSPAR in 2001 –
this is necessary to ensure that all facilities are brought into line with the level of discharges for which the risk assessments were carried out.
ii. Continued substitution of introduced chemicals of most concern as set out in present UK regulation with reference to the CHARM model (see main report).
iii. As reported in Myhre 2004, ‘alkylphenols discharges will be followed up with monitoring as soon as the methods for this are sufficiently developed’.
iv. Research investigating the occurrence and persistence data for alkylphenols, the occurrence and implications of reef effect of fish around installations, and a study comparing the time of spawning of fish populations in the vicinity and far from points of produced water discharges (see Section 5.1 on alkylphenols).
Management approach two: maintain the current regulatory approach of further reducing permissible discharges on an ongoing basis. This approach would envisage a further cut in the absolute level of discharges beyond the 15% cut already envisaged for 2006, on the grounds that continually reducing discharges in this way would continually reduce the level of risk of harm being incurred. While there is little doubt that, as shown in Figure 4.8, discharges (and perhaps risks) could be continually reduced in this way by the kind of technologies described, the lower PEC:PNEC ratios achieved in this way are no more justified by the risk assessment than those of the current situation. Moreover, if there is perceived uncertainty over the likelihood or timing of future rounds of reductions, it is possible that the investment required to achieve one round of reduction will be at least partially wasted, if a quite different technology is required to achieve more stringent discharge reductions in a subsequent round. It is also possible that each step will fail to satisfy key stakeholders, including those who wrongly perceive that the continuing required reduction in discharges reflects actual harm being caused to the marine environment, rather than a reduction (from already very low levels) in the risk of such harm (this approach would amount to a violation of Sandman’s injunction to manage the outrage, not the hazard, in such circumstances, see Section 1.1). The costs associated with this regulatory approach could be reduced by a well-designed permit trading scheme. Unlike with sulphur dioxide, it seems that the issue of pollution hotspots with such a scheme is unlikely to present a problem, because the majority of the facilities on the UKCS are not close enough together and the 30mg/l limit, combined with the limited produced water processing capacity of any one installation, would prevent excessive discharges from any one facility. However, this aspect of a produced water discharge permit trading scheme should be kept under review during any operation of the scheme. Management approach three: reduce discharges of produced water to zero over the long term. If this is the ultimate objective of the wider regulatory system (as seems to be implied by the Esbjerg Declaration), then it should be acknowledged explicitly as such, rather than approached through a series of more or less arbitrary step-by-step reductions (such as the 2001 OSPAR recommendation to reduce total OIW by 15%), which generate uncertainty in

63
the industry and, as noted above, may lead to investments that are inappropriate for future required discharge reductions and misplaced perceptions of harm to the marine environment. It is likely that achieving this interpretation of the precautionary principle would in due course require the total reinjection of produced water in the North Sea. The illustrative cost of disposing of all 7,000 tonnes of OIW (projected for 2006) in this way (assuming that new wells had to be drilled – see scenario 2c in Table 4.4) would be £511m, of which £255m would effectively be a contribution from the taxpayer. About 5.7mtCO2 per year (at constant levels of produced water) would also be emitted (based on emissions of 813tCO2/tOIW – see Table 4.4). Production at some wells where reinjection was not a possibility would have to be shut down earlier than would otherwise be the case. Those installations with insufficient additional fuel gas to power the PWRI pumps would need to establish a gas import pipeline, or bring in diesel fuel at additional cost. It is not clear that the reduced risk achieved by this regulatory approach would justify the level of investment or foregone production, or the associated greenhouse gas emissions, although the judgement on this could be changed by any or all of the following developments: i. A study confirming any endocrine disruption in fish due to discharges of produced
water. ii. Any observed detrimental effect in fish populations in any field observational study
in which there is serious suspicion that produced water is a causal factor iii. Any well designed study finding effects at concentrations relevant to produced
water discharges. There is no objective way of deciding between these different management approaches to produced water, all precautionary in some sense, that will satisfy all stakeholders. Public debate from various points of view may seek to change the different perceptions of the characteristics of risks (as described in Section 1.1) that will be held by different stakeholders. Ultimately, however, all the regulators can hope to do is to strike a balance between the different perceptions that is acceptable to society as a whole.
5.4 RECOMMENDED ADDITIONAL RESEARCH
There are some desirable areas for further research, in addition to those identified in the previous section. First, there is probably scope for further toxicity and toxicity identification work on produced water at higher concentrations, particularly in respect of the potential effects of produced water on sexual development. Second, concern has been highlighted in this report over the interaction between the biological reef effect around jackets and produced water discharge plumes, and that this could potentially lead to higher toxic bioaccumulation in fish. This has not yet been adequately investigated, suggesting that further work needs to be undertaken in this area. Third, of the 13 projects proposed in IMR 2002, the following two remain relevant and would improve the understanding of the risks to populations of fish:
• Study primary production in areas with a high level of petroleum activities and compare this with control areas. Can the growth of fish larvae and fry be affected by changes in the availability of food or in its composition? Are fish attracted to oil fields by greater availability of food? Is the sex ratio of the larval populations that grow up near petroleum installations affected?

64
• Compare the time of spawning of populations in the vicinity of platforms with populations inhabiting a similar physical environment (temperature, light, availability of food, and any other variables that might be supposed to affect spawning time).
Fourth, as proposed in CEFAS 2004 (p. 15), further work is required to provide occurrence and persistence data for alkylphenols in produced water discharges in order to assess the risk they pose to the marine environment and whether they should be considered ‘priority pollutants’. In addition, further work seems desirable related to the bioaccumulation of both aromatics and alkylphenols in shellfish. This work should be part of an ongoing UK monitoring strategy, which would provide data to influence the regulatory strategy being developed within OSPAR. This was also proposed in Myhre 2004. A further input into the strategy could be the results of field monitoring of contamination patterns in sediments (including drill cuttings piles) and of selected biota apart from fish. Finally there is the issue of who should carry out this research. Section 1.1 noted that one of Sandman’s important risk characteristics was whether the communicator of the risk was trusted. In the past much of the research in this area, as is apparent for the references in this report, has been carried out by the oil and gas industry. This is hardly surprising, and there is no evidence that in general this research is not robust, but its lack of independence may reduce the trust that is accorded to it. It is certainly desirable that some at least of the research that has been recommended, especially that in the most sensitive areas, should be carried out by fully independent researchers, not funded by industry.

65
6. GLOSSARY – ACRONYMS AND DEFINITIONS OF TERMS
6.1 ACRONYMS
• BAF - Bioconcentration Factor
• BAT – Best Available Technique
• BCF - Bioconcentration Factor
• CFU – Compact Flotation Unit
• DEFRA – Department for Environmental and Rural Affairs (UK)
• DGF – Dissolves Gas Floatation
• DREAM – Dose Related Risk and Effect Assessment Model
• DTI – Department of Trade and Industry
• EPA – Environmental Protection Agency (In the USA)
• EPSRC - Engineering and Physical Sciences Research Council
• HMCS – Harmonised Mandatory Control System
• IGF - Induced Gas Flotation
• LSA – Low Specific Activity (radioactive material)
• MPPE – Macro Porous Polymer Extraction
• NPV – Net Present Value
• NOEC - No Observable Effect Concentration
• OGP – Oil & Gas Producers
• OIW – Oil In [produced] Water
• OSPAR – Oslo–Paris (Commission)
• PEC – Predicted Environmental Concentration
• PNEC – Predicted No Effect Concentration
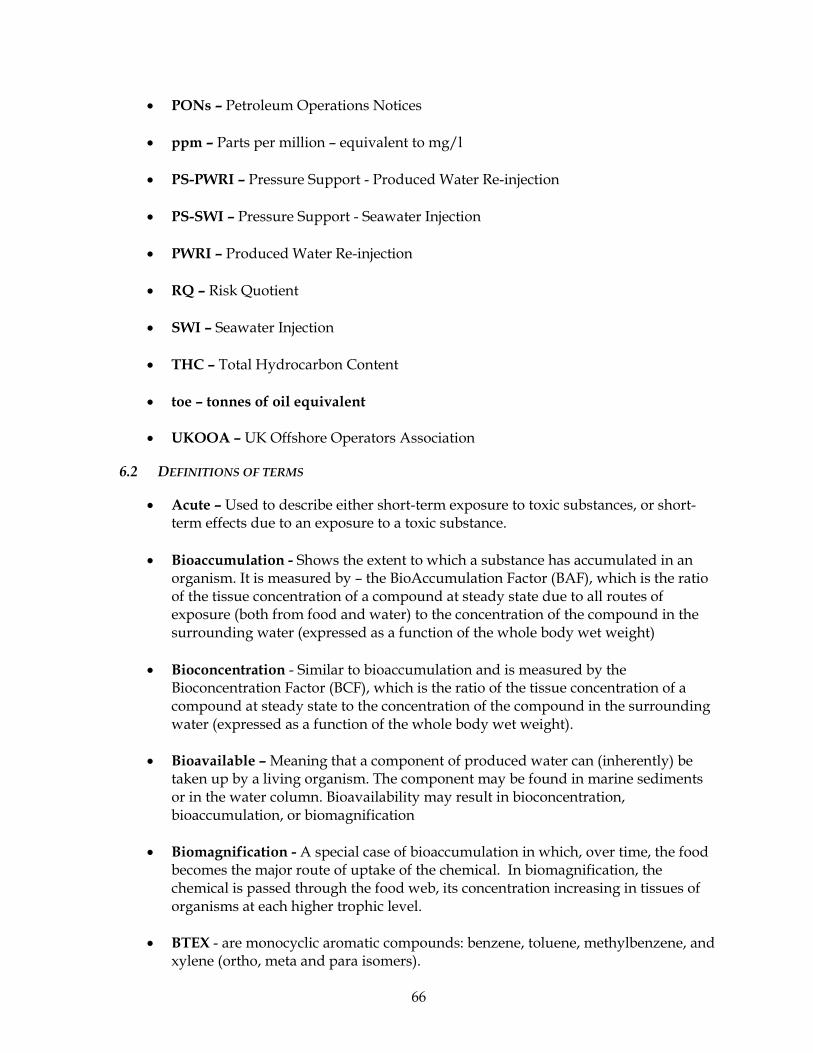
66
• PONs – Petroleum Operations Notices
• ppm – Parts per million – equivalent to mg/l
• PS-PWRI – Pressure Support - Produced Water Re-injection
• PS-SWI – Pressure Support - Seawater Injection
• PWRI – Produced Water Re-injection
• RQ – Risk Quotient
• SWI – Seawater Injection
• THC – Total Hydrocarbon Content
• toe – tonnes of oil equivalent
• UKOOA – UK Offshore Operators Association
6.2 DEFINITIONS OF TERMS
• Acute – Used to describe either short-term exposure to toxic substances, or short- term effects due to an exposure to a toxic substance.
• Bioaccumulation - Shows the extent to which a substance has accumulated in an organism. It is measured by – the BioAccumulation Factor (BAF), which is the ratio of the tissue concentration of a compound at steady state due to all routes of exposure (both from food and water) to the concentration of the compound in the surrounding water (expressed as a function of the whole body wet weight)
• Bioconcentration - Similar to bioaccumulation and is measured by the Bioconcentration Factor (BCF), which is the ratio of the tissue concentration of a compound at steady state to the concentration of the compound in the surrounding water (expressed as a function of the whole body wet weight).
• Bioavailable – Meaning that a component of produced water can (inherently) be taken up by a living organism. The component may be found in marine sediments or in the water column. Bioavailability may result in bioconcentration, bioaccumulation, or biomagnification
• Biomagnification - A special case of bioaccumulation in which, over time, the food becomes the major route of uptake of the chemical. In biomagnification, the chemical is passed through the food web, its concentration increasing in tissues of organisms at each higher trophic level.
• BTEX - are monocyclic aromatic compounds: benzene, toluene, methylbenzene, and xylene (ortho, meta and para isomers).

67
• Chronic – Used to describe either the long-term exposure to a toxic substance, or the long-term effects of exposure to a toxic substance.
• DNA adducts - are formed through covalent bonds between a variety of pollutants and the DNA molecule.
• EC50 – Effect Concentrations 50 is the concentration of a chemical at which a predetermined level of effect occurs to 50% of a sample population
• Effect - A real change in a biological process, organism, population, community or ecosystem as a result or consequence of a produced water discharge or one of its components
• EIF – Environmental Impact Factor is based on a combined environmental risk and hazard assessment of produced water discharges for a particular location, accounting for both composition and amount of the discharge.
• Endocrine disruptor - An exogenous agent that interferes with the synthesis, secretion, transport, binding, action, or elimination of natural hormones in the body that are responsible for the maintenance of homeostasis, reproduction, development, and/or behaviour
• Flocculant - A long-chain polymer molecule that is able to attach to fine solid particles causing them to join together to form larger particles. These large particles, called flocs, settle more rapidly than the smaller particles.
• Hazard - the potential to cause harm
• HQ - Hazard Quotients is the ratio of Predicted Environmental Concentration (PEC) to Predicted No Effect Concentration (PNEC) and used for introduced production chemicals
• Imputed value - the value of trading permits required for an abatement scenarios to be financially viable (i.e. for abatement to be carried out at effectively zero cost in present terms)
• LC50 – Lethal Concentration 50 is the concentration of a chemical which kills 50% of a sample population
• NPD - are 2-3 ring aromatic compounds: naphthalene and phenanthrene and dibenzothiophene, including their C1-C3 alkyl homologues.
• PAH – Poly Aromatic Hydrocarbons are 3-6 ring aromatic compounds: Polycyclic aromatic compounds, represented by the 16 EPA PAH (except naphthalene and phenanthrene, which are included in the NPD group).
• PEC - Predicted Effect Concentration
68
• PNEC – Predicted No Effect Concentration
• Produced water - Formation water, floodwater and/or condensed water produced from the reservoir during the production of oil and gas
• PWRI – Produced Water Re-injection
• Toxic - A component of produced water inherently has the capacity to cause harm to a living organism found in the marine environment in which the produced water is being discharged
• Trophic - Relating to the processes of nutrition
• QSAR - Quantitative Structure Activity Relationships – The theoretical predictive modelling of acute and chronic toxicity by use of the physical properties of the components of produced water such as molecular weights and partition coefficients.

69
7. REFERENCES
1. Adams, J., Thompson, M., 2002 Taking account of societal concerns about risk: Framing the problem, Professor John Adams of University College London and Professor Michael Thompson of the University of Bergen for the Health and Safety Executive 2002, Research Report 035 http://www.hse.gov.uk/research/rrpdf/rr035.pdf
2. Bergen 2002 ‘The Bergen Declaration’, Ministerial Declaration at the Fifth International Conference on the Protection of the North Sea, Bergen, Norway, http://odin.dep.no/filarkiv/156076/Engelsk.pdf
3. BP Forties 1995 Forties field: Experiences from injecting produced water, BP June 1995, as provided by Apache North Sea Limited
4. BP 2001 Clair Phase I Development: Environmental for Offshore Activity, PBP Exploration Operating Company Limited, Project No – D/1228/2001, August 2001
5. Brandsma Engineering 2001 Near-Field Produced Water Plume, Platform Irene, Annex F, A. D. Little Purchase Order: 21944700S, 18th July 2001 http://www.countyofsb.org/energy/documents/projects/tranquillonEIR/App_F.pdf
6. CEFAS (Centre for Environment Fisheries and Aquaculture Science) 2004a Ranked list
of HQ values for production products, Released 9th March 2004 http://www.cefas.co.uk/ocns/index.htm
7. CEFAS (Centre for Environment Fisheries and Aquaculture Science) 2004b Frequently asked questions, My product has a substitution warning on it. What does this mean and what action should I take? http://www.cefas.co.uk/ocns/faq.htm
8. CEFAS (Centre for Environment Fisheries and Aquaculture Science) 2004c The
significance of offshore chemicals as endocrine disrupters in fish, Final project report to the Department for Environment, Food and Rural Affairs (DEFRA) Research and Development CSG 15, DEFRA project code A0816
9. Cordah 2001 Assessment of the Actual Present Environmental Impact of Representative
OBM and WBM cuttings piles, R & D Programme 2B; A report for the UKOOA Drill Cuttings Joint Industry Project, Report No: Cordah/UKO016/2001 Status: Draft Final Version: 3, Date of Release: 26 October 2001
10. Cordah 2003 Environmental Statement in support of the decommissioning of the North
West Hutton facilities: A report for BP Exploration, Report ENV 01 - BPX067/ES/2003, Status: Final Draft Version: 2 Date of Release: 25 July 2003
11. Council Directive 96/61/EC of 24 September 1996 concerning integrated pollution
prevention and control, Official Journal L 257, 10/10/1996 P. 0026 – 0040,
70
http://europa.eu.int/smartapi/cgi/sga_doc?smartapi!celexapi!prod!CELEXnumdoc&lg=en&numdoc=31996L0061&model=guichett
12. DETR (Department of Environment, Transport and the Regions) 1999 A Better
Quality of Life: A Strategy for Sustainable Development in the UK, Cm4345, May, DETR, London
13. DTI (Department of Trade and Industry) 2003, Chemical Data Uploads (PON15D)
Functional Specification, DRAFT, 26 February, 2003 Version 0.8 http://www.og.dti.gov.uk/environment/PON15DChemDataUploads.doc
14. DTI (Department of Trade and Industry) 2004a Quarterly Energy Prices: Table 3.2.1
Average prices of fuels purchased by the major UK power producers and of gas at UK delivery points, DTI, Last updated 8th of January 2004 http://www.dti.gov.uk/energy/inform/energy_prices/tables/table_321.xls
15. DTI (Department of Trade and Industry) 2004b Quarterly Energy Prices, Annex B -
Calorific Values and Conversion Factors B1: Estimated average gross calorific values of fuels 2001- http://www.dti.gov.uk/energy/inform/energy_prices/#_Toc517666607
16. DTI (Department of Trade and Industry) 2004c Oil Discharged with Produced Water
1991 – 2003, Printed from DTI website: 2/08/04 http://www.og.dti.gov.uk/information/bb_updates/chapters/Table3_2.htm
17. DTI (Department of Trade and Industry) 2004d Hydrocarbons in Produced Water
Trading Scheme Rules, DTI, LCU-OED Atholl House Aberdeen, 23 August 2004, Version 1 – Early draft
18. DTI (Department of Trade and Industry) & UKOOA (UK Offshore Operators Association) 2003 Environmental Emissions Monitoring System; Detailed industry Report 2002, Rev: 0, 2nd May 2003
19. EC DG-ENV (European Commission Directorate-General Environment) 2002
MARINA II: Update of the MARINA Project on the radiological exposure of the European Community from radioactivity in North European marine waters, Radiation Protection 132, Pre-Publication copy
20. Ekins, P., Vanner, R. & Firebrace, J. 2005 Management of Produced Water on Offshore Oil
Installations: a Comparative Assessment Using Flow Analysis, Policy Studies Institute (PSI) Working Paper, PSI, London
21. EPPO (Energy Policy and Planning Office) 2004 Oil industry conversions; conversion
factors for oil, Energy Policy and Planning Office Ministry of Energy Royal Thai Government, looked at 28th of April 2004 http://www.eppo.go.th/ref/UNIT-OIL.html
22. E&P (Exploration & Production) 1994 North Sea produced water: Fate and Effects in the
Marine Environment, The E&P Forum May 1994, Report No. 2.62/204

71
23. Esbjerg 1995 ‘The Esbjerg Declaration’, Ministerial Declaration at the Fourth International Conference on the Protection of the North Sea, Esbjerg, Denmark http://odin.dep.no/md/nsc/declaration/022001-990243/dok-bn.html#1.MINISTERIAL
24. Faksness, L.G., Andersens, S.P., Grini, P.G., 2004 ‘Partitioning of semi-soluble organic
compounds between the water phase and oil droplets in produced water from platforms in the North Sea’, Presentation given at: International conference of Produced Water, Stavanger, 14-15 January 2004
25. FRED (Federal Register Environmental Documents)1999 Endangered and Threatened
Wildlife and Plants; Definition of ”Harm”, Federal Register: November 8, 1999 (Volume 64, Number 215) [Rules and Regulations], Page 60727-60731 http://www.epa.gov/fedrgstr/EPA-SPECIES/1999/November/Day-08/e29216.htm
26. Frost, T.K., Johnsen, S., Utvik, T.I.R., 1998 Produced water discharges to the North Sea,
Fate and Effects in the water column; OLF (Oljeindustriens Landsforening) December 1998, http://www.olf.no/static/en/rapporter/producedwater/
27. HMSO (Her Majesty’s Stationery Office) 1990 Environmental Protection Act 1990 (c. 43), HMSO, London http://www.hmso.gov.uk/acts/acts1990/Ukpga_19900043_en_2.htm#mdiv1
28. Hope, M. 2003 ‘The potential for oil-in-water trading’, UKOOA JIP (Joint Industry Project) presentation, 2003
29. Johnsen, S., Frost, T.K., Troudheim, Hjelsvold, M., Utvik, T.R., 'The Environmental
Impact Factor – ‘A proposed tool for produced water impact reduction, management and regulation’, SPE paper 61178 Presented in Stavanger Norway 26-28 June 2000
30. Johnsen, S., Utvik, T.R., Garland, E., de Vals, B. & Campbell, J. 2004 Environmental
Fate and Effect of contaminants in produced water, SPE 86708, presented at the Seventh SPE International Conference on Health, Safety and Environment in Oil and Gas Exploration and Production, Calgary, Society of Petroleum Engineers, Richardson, Texas
31. IP (Institute of Petroleum) 2000 Guidelines for the Calculation of Estimates of Energy use
and Gaseous Emissions in the Decommissioning of offshore structures, The Institute of Petroleum, February 2000 ISBN 0 8593 255 3
32. IMR (Institute of Marine Research) 2002 Hormonal effects of C4-C7 alkylphenols on cod
(Gadus morhua), Institute of Marine Research, P.O. Box 1870, N-5817, Bergen, Norway, http://www.imr.no/english/news/2002/hormonal_effects_of_c4c7_alkylphenols_on_cod

72
33. Klungsøyr, J., Balk, L., Berntssen, M.H.G., Beyer, J., Melbye, A.G., Hylland, K., 2003 Contamination of fish in the North Sea by the offshore oil and gas industry. Summary report to NFR (Research Council of Norway), project No. 152231/720, 2003
34. Knudsen, B.L., Hjelsvold, M., Frost, T.K., Eiken, M.B.E., Grini, P.G., Trondheim, C.F., Willumsen, C.F., Torvik , 2003 ‘Toward Zero Environmental Impact of the Produced Water’, Prepared for presentation at Offshore Europe 2003 held in Aberdeen, UK, 2-5 September 2003, SPE 83994, Society of Petroleum Engineers, Richardson, Texas
35. Knudsen, B.L., Hjelsvold, M., Frost, T.K., Svarstad, M.B E., Grini, P.G., Willumsen’, C.F., Torvik, H., 2004 ‘Meeting the Zero Discharge Challenge of Produced Water, SPE paper 86671 Presented in Calgary Canada 29-31 March 2004
36. Lystad, E. & Nilssen, I. 2004 ‘Monitoring and Zero Discharge’, SPE 86799, presented at the Seventh SPE International Conference on Health, Safety and Environment in Oil and Gas Exploration and Production, Calgary, Society of Petroleum Engineers, Richardson, Texas
37. Matthiessen, P. 2003 Environmental implications of alkylphenols and estrogenic activity
found in produced water at United Kingdom offshore production platforms, Report to the UK offshore Operators Association (UKOOA) by CEH Windermere, The Ferry House, Ambleside, Cumbria LA22 0LP, Report project/report ref: C00152/WI/C00152/2, 21st of March 2003
38. Myhre, L.P., Bausant, T., Sundt, R., Sanni, S., Vabø, R., Skjoldal, H.R., Klungsøyr, J., 2004 Risk Assessment of reproductive effects of alkyl phenols in produced water on fish stocks in the North Sea, RF-Akvamiljø Report AM-2004/018
39. Neff, J.M., 2002 Bioaccumulation in Marine Organisms: Effects if Contaminants in Oil
Well produced water, J. M. Neff, Elsevier 2002, ISBN: 0-080-43716-8 40. Novatech 2003 FORECASTING GUIDELINES, Part I: Energy Consumption and
Emissions to Air in the Upstream Petroleum Industry, Project Number 01043.00, Novatech Norway, July 18, 2003
41. OGP (International Association of Oil & Gas Producers) 2000 Guidelines for produced
water injection, OGP January 2000, Report number. 2.80/302 http://www.ogp.org.uk/pubs/302.pdf
42. OGP (International Association of Oil & Gas Producers) 2002 Aromatics in produced
water: occurrence, fate & effects, and treatment, OGP January 2002, Report No. 1.20/324 http://www.ogp.org.uk/pubs/324.pdf
43. OGP (International Association of Oil & Gas Producers) 2004 Fate and effects of
naturally occurring substances in produced water on the marine environment - a new review, Draft sent to OSPAR’s meeting of the offshore industry committee (15-19 March 2004, Agenda item 3, OIC 04/3/Info.1-E) by The International Association of Oil and Gas Producers (OGP)
73
44. OSPAR 1998a Sintra Statement, Ministerial Meeting of the OSPAR Commission, Sintra, July 22-23 1998, OSPAR Commission, http://www.ospar.org/eng/html/welcome.html
45. OSPAR 1998b OSPAR Decision 98/3 on the Disposal of Disused Offshore Installations, Ministerial Meeting of the OSPAR Commission, Sintra, July 22-23 1998, OSPAR Commission, http://www.ospar.org/eng/html/welcome.html
46. OSPAR 2001a OSPAR Recommendation 2001/1 for the Management of Produced Water
from Offshore Installations, Meeting of the OSPAR Commission, Valencia, June 25-29 2001, OSPAR Commission, http://www.ospar.org/eng/html/welcome.html
47. OSPAR 2001b Environmental Aspects of On and Off Site Injection of Drill Cuttings and
Produced Water, OSPAR Commission, 2001, http://www.ospar.org/eng/html/welcome.html
48. OSPAR 2002 Background Document concerning Techniques for the Management of
Produced Water from Offshore Installations, OSPAR Commission 2002. http://www.ospar.org/v_publications/download.asp?v1=p00162
49. PSIGate (Physical Science Information Gateway) 1995 The Ideal Gas Law: Molar
Volume of an Ideal Gas, Introduction to University chemistry II, Molar volumes of gases, Copyright 1995 James A. Plambeck (Jim.Plambeck @ualberta.ca), Updated January 09, 2000 http://www.psigate.ac.uk/newsite/reference/plambeck/chem2/p01053.htm
50. Rowland, C., 2003 Generating in a CO2 constrained world, Pan-European Utility Research, Dresdner Kleinwort Wasserstein, November 2003 www.panda.org/downloads/climate_change/chrisrowland.ppt
51. Sabeur Z.A., Tyler A.O., 2000 Development of a New Generation Modelling System for
the Prediction of the Behaviour and Impact of Offshore Discharges to the Marine Environment, Society of Petroleum Engineers, SPE 61263, Presented at SPE International Conference of Health Safety and the Environment in oil and gas Production and Exploration, Stavanger, Norway 2000
52. Sandman, P., 1993a Because People Are Concerned: How Should Public Outrage Affect
Application of the Precautionary Principle?, Commissioned by Vodafone Group Services Limited in 1993 http://www.psandman.com/articles/vodafone.pdf
53. Sandman, P., 1993b Responding to Community Outrage: Strategies for Effective Risk
Communication, A publication of the American Industrial Hygiene Association. Copyright: 1993, ISBN 093262751X
54. Smith, J.P., Tyler, A.O., Sabeur, Z.A., 1998 Ecotoxicological Assessment of Produced Waters in Indonesia, Environmental Toxicology and Water Quality, Volume 13, Issue 4 pages 323-336

74
55. Statoil 2003 Field trials with extraction based produced water purification Technologies, Produced Water Workshop Organised by National Engineering Laboratory (NEL) 26-27 March 2003, Marriott Hotel, Dyce, Aberdeen http://www.statoil.com/STATOILCOM/SVG00990.nsf/Attachments/CTour-presentasjon/$FILE/Extraction%20processes%20paper%20NEL%20260303.pdf
56. UKOOA (UK Offshore Operators Association) 2001 Striking a Balance, The UK
Offshore Oil and Gas Industry Strategy for its Contribution to Sustainable Development 2001, UKOOA, London http://www.ukooa.co.uk/issues/sustainability/report.pdf
57. UKOOA (UK Offshore Operators Association) 2003 Striking a Balance 2003, The sustainability strategy update and progress report of the UK Offshore oil and gas industry UKOOA, London
58. UKOOA (UK Offshore Operators Association) 2004 The UK Oil and Gas Industry's
Contribution to the UK and its Economy, UKOOA, London, http://www.ukooa.co.uk/issues/economic/econ04/index.htm
59. Waste Research Station website 2004 Energy from waste; landfill gas power generation, http://www.wasteresearch.co.uk/ade/efw/gas.htm