Embed Size (px)
Citation preview
u t -1
DRAFT ENVIRONMENTAL IMPACT STATEMENT
Management of Spent Nuclear Fuelfrom the K Basins
at the Hanford Site,Richland, Washington
October 1995
U.S. DEPARTMENT OF ENERGYRICHLAND, WASHINGTON 99352
0042430DOE/EIS-0245D
Draft Environmental Impact Statement
Management of Spent Nuclear Fuelfrom the K Basinsat the Hanford Site,Richland, Washington
4!wV 05-
tMR@October 1995
U.S. Department of EnergyRichland, Washington 99352
COVER SHEET
Responsible Agency: U.S. Department of Energy (DOE)
Title: Draft Environmental Impact Statement on the Management of Spent
Nuclear Fuel from the K Basins at the Hanford Site, Richland, Benton County,
Washington
Contact: For further information on this EIS, to.request copies of the EIS,
or to Dresent comments on the EIS, contact:
Dr. P. G. Loscoe; (509) 376-7434
U.S. Department of Energy, Richland Operations Office
P.O. Box 550, MS S7-41
Richland, WA 99352
For general information on DOE's National Environmental Policy Act (NEPA)
process, call the DOE's NEPA Information Line at 1-800-472-2756 to leave a
message, or contact:
Carol Borgstrom, Director; (202) 586-4600
Office of NEPA Project Assistance (EH-42), U.S. Department of Energy
1000 Independence Avenue SW
Washington, D.C. 20585
Abstract: The purpose of this draft environmental impact statement (DEIS) is
to provide environmental information to assist the U.S. Department of Energy
(DOE) in the selection of an alternative for the management and storage (up to
approximately 40 years) of spent nuclear fuel (SNF) currently located in the
K Basins at the Hanford Site. Management and storage/disposal of sludge,
debris, and water in the K Basins are also included in the DEIS. Alternatives
considered include 1) no action, 2) enhanced K Basin storage, 3) new wet
storage, 4) drying/passivation (conditioning) with dry storage (the preferred
alternative), 5) calcination with dry storage, 6) onsite processing, and
7) foreign processing.
Public Comments: To provide comments to DOE on the DEIS, either send written
comments to Dr. P. G. Loscoe at the above address, or present continents orally
or in writing at the scheduled public hearing(s). Time(s) and location(s) of
the hearing(s) will be announced in local newspapers or may be obtained from
Dr. Loscoe at the above telephone number or from the DOE toll-free number
1-800-472-2756. To be assured of consideration, comments must be received
within 45 days after the notice of availability is published in the Federal
Register.
$^ f^^^ R« \ ?AO \l/ \, ^^f^ ^^ :^
SUMMARY
The purpose of this draft environmental impact statement (DEIS) is to
provide information on the potential environmental impacts of managing spent
nuclear fuel (SNF) located in the K East (KE) and K West (KW) SNF storage
basins at the Hanford Site. These basins are attached to the retired KE.and
KW Reactors. Approximately 2100 metric tons (2315 tons) of SNF are currently
located in these two storage basins. The SNF is in the form of metallic
uranium, plutonium, and fission products and is, for the most part, fuel from
the operation of N Reactor. Small amounts of SNF remain from operation of
reactors older than N Reactor. The fuel was never processed to remove uranium
and plutonium, and has been stored for periods ranging from 8 to 24 years.
Much of the SNF stored in KE Basin is visibly damaged, has deteriorated, and
continues to deteriorate. Because the SNF in KW Basin is stored in sealed
canisters, its condition is uncertain.
The KE and KW Reactors and their associated fuel storage basins were
constructed in the early 1950s and are located in the 100-K Area as close as
420 m (1,380 ft) to the Columbia River. The basins are unlined concrete,
4.9-million-L (1.3-million-gal) water pools with an asphaltic membrane beneath
each pool. The interior of the KW Basin has been coated with epoxy. The
KE Basin has leaked water in the past and may still be leaking small quanti-
ties of water contaminated with radionuclides. The K Basins are not suitable
for continued long-term storage of SNF.
Purpose of and Need for Action
The purpose of and need for DOE's action is to reduce risks to public
health and the environment, specifically 1) to prevent the release of
radioactive materials into the air or the soil surrounding the K Basins and
the potential migration of radionuclides through the soil column to the nearby
Columbia River, 2) to reduce occupational radiation exposure, and 3) to elimi-
nate risks to the public and to workers from the continued deterioration of
SNF in the K Basins.
Proposed Action and Alternatives
DOE's proposed action is to take expeditious action to reduce risks to
public health and the environment by removing SNF from the K Basins and,
subsequently, to take action to manage the SNF in a safe and environmentally
sound manner for up to 40 years until ultimate disposition decisions are made
and implemented.
iii
DOE's proposed alternatives include
• no action
• enhanced K Basin storage
• new wet storage
• drying/passivation (conditioning) with dry storage
• calcination with dry storage
• onsite processing
• foreign processing
No action means to continue present storage in the KE and KW Basins for
up to 40 years with no modifications except for maintenance, monitoring, and
ongoing safety upgrades. Enhanced K Basin storage means to perform facility
life extension upgrades for KW Basin, containerize KE Basin SNF and sludge,
and consolidate with KW Basin SNF for up to 40 years of storage. - New wet
storage means to remove SNF from the K Basins and provide for up to 40 years
of wet storage in a new facility away from the river. Drying/passivation
(conditioning) with dry storage means to remove SNF from the K Basins,
condition [i.e., dry (remove free and bound water)], oxidize exposed reactive
areas of the fuel under controlled conditions, seal in canisters filled with
an appropriate storage atmosphere, and provide for up to 40 years of dry
storage in a new vault or cask facility. Calcination with dry storage means
to remove SNF from the K Basins, calcine, and provide for up to 40 years of
dry storage of SNF oxides in a new cask or vault facility. Onsite processing
means to remove and chemically process K Basins SNF and provide for up to40 years of dry storage of the recovered uranium (as UO 3) and plutonium (as
Pu02), and manage fission product waste in Hanford's double-shell tanks.
Foreign processing means to remove K Basins SNF, ship overseas for processing,
provide for up to 40 years of dry storage of returned uranium (as UO 3) and
plutonium (as PuOd , and store vitrified fission product waste, pending
ultimate disposition.
For all alternatives except no action, management of sludge, basin
water, and debris is included as part of the alternative. Sludge management
could include management of the sludge as SNF, management by transfer to
double-shell tanks at Hanford, or disposal as low-level waste, mixed waste, or
transuranic waste. Water management could include processing through the
200 Area Efflueht Treatment Facility (ETF) and disposal of the resulting
solids as low-level waste. Debris not containing SNF would be managed as low-
level waste.
Although storage of SNF at Hanford for 500 years might be possible,
present designs are extendable to only about 75 years. Further design work
iv
would be necessary to extend storage to 500 years. The 40-year period ana-
lyzed in this EIS would not preclude such further design and later adoption of
a longer interim-storage period, if warranted. However, DOE's policy is to
provide for long-term storage of SNF in a geologic repository.
Differences in environmental impacts do not provide clear distinctions
among alternatives (see "Environmental Consequences" section of the summary).
Nevertheless, alternatives other than no action and enhanced K Basins storage
would provide more assured protection of the Columbia River. Further, DOE
believes that no action and enhanced K Basins storage are unacceptable alter-
natives because of the cost of maintaining SNF and one or both K Basins for
40 years, because of continued degradation of the SNF, and because some action
to remove the SNF from one or both K Basins, such as one of the other alterna-
tives considered in this EIS, would be required at the end of 40 years. Among
the other alternatives, wet storage is a proven technology, although continued
wet storage could result in continued SNF degradation. Calcining or proces-
sing might put the SNF in a form acceptable for disposal in a high-level waste
repository, although this is not certain because the repository acceptance
criteria have not been announced. Foreign processing would remove the SNF
temporarily from the Hanford Site. Drying/passivation (conditioning) with dry
storage leaves the SNF in a condition such that further operations could be
carried out on the SNF to meet repository criteria.
DOE's preferred alternative is drying/passivation (conditioning) with
dry vault storage, incorporating the following steps. Remove K Basin SNF from
existing canisters, clean, and desludge. Repackage the SNF into fuel baskets
designed for multicanister overpacks (MCOs) that would include provision for
water removal, SNF conditioning, and criticality control. After loading SNF
into the MCOs, welding the top, and draining an MCO through small penetrations
on the top, initially dry the SNF under vacuum at approximately 50°C (1200F),
flood the MCO with an inert gas, seal the penetrations, and place the MCO into
a transportation cask. Transport the sealed MCOs in these casks via truck to
the Canister Storage Building (CSB) site in the 200 East Area, and provide for
temporary vented staging, as necessary. Vacuum condition the SNF in the MCOs,
as soon as practicable, heating the SNF to about 300°C (570°F) to remove water
that is chemically bound to the SNF and canister corrosion products, and to
dissociate any reactive uranium hydride. Following conditioning, weld-seal
the SNF in an inert gas in the MCOs for dry interim storage in a vault for up
to 40 years. Collect the sludge removed from the basins and disposition as
waste in Hanford's double-shell tanks after removal.from the basin. Collect
the debris from the basins and dispose of the debris as low-level waste in
Hanford's existing low-level waste burial grounds. Remove and transport
contaminated basin water to the 200 Area ETF for final disposal at the
V
200 Area State-Approved Land Disposal Site (SALDS), and replace the contamina-
ted basin water with clean water, maintaining basin water levels. Eventually
all basin water would be removed as part of facility deactivation activities.
The principal factors influencing the choice of drying/passivation with
vault storage as the preferred alternative include speed of implementation,
improved stability of the SNF, life-cycle cost, and beneficial reuse of an
existing (but incomplete) structure (i.e., the CSB).
Affected Environment
The Hanford Site occupies approximately 1450 kM 2 (560 mi) in south-
central Washington State on the Columbia River in an area characterized as
having a semiarid climate (16 cm or 6 in. of rain per year). Nearby land uses
include dry and irrigated farming and commercial activities in the cities and
towns. Summers are hot, and winters are mild. Severe weather is rare. The
Columbia River is a large river that supplies ample potable and irrigation
water. The probable maximum flood would not reach the K Basins or the
200 Areas where storage facilities could be located. The Washington.State
Department of Ecology classifies the water quality of the Columbia River at
Hanford as Class A or excellent.
Population centers within 80 km (50 mi) of the Hanford Site are Yakima
to the west and the Tri-Cities of Richland, Kennewick, and Pasco on the south-
east corner of the Site. Approximately 380,000 persons live within 80 km
(50 mi) of the 200 Areas. A satisfactory infrastructure exists in these
communities for the implementation of any alternative discussed in this DEIS.
The Hanford Site is an attainment area for all criteria pollutants under
the Clean Air Act (42 USC 7401 et seq.). However, there are occasional epi-
sodes of blowing dust on the Site, the source of which is typically recently
plowed farmland adjacent to the Site.
No known cultural or historic resource is located in any area that would
be impacted by any alternative. Similarly, no known federal or state threat-
ened or endangered species is expected to be impacted by any alternative.
However, the reference site for potential new storage and stabilization facil-
ities contains sagebrush habitat that is suitable for some state and federal
candidate species. This shrub-steppe habitat has been identified by the State
of Washington as priority habitat. Should the reference site be chosen, suit-
able mitigation measures will be taken.
vi
The potential for catastrophic earthquakes is low at the Hanford Site.
A small amount of volcanic ash was deposited on the Hanford Site from the
eruption of Mount St. Helens in 1980.
In 1989 the Hanford Site was placed on the National Priorities List by
the U.S. Environmental Protection Agency (EPA). During the same year, the
DOE, EPA, and Washington Department of Ecology signed a Federal Facilities
Agreement and Consent Order (Tri-Party Agreement) to implement cleanup of the
Hanford Site under the Comprehensive Environmental Response, Compensation, and
Liability Act (CERCLA) and the Resource Conservation and Recovery Act (RCRA),
as required by the placement of Hanford on the National Priorities List. Some
actions at the K Basins will be coordinated with other cleanup activities in
the 100-K Area.
Since the Hanford Site began operation in 1943, it is estimated that the
nearby population has received a cumulative population dose of approximately
100,000 person-rem from Hanford activities, most of which was received before
1972. For perspective, the annual natural background dose is approximately
110,000 person-rem per year for today's population of 380,000.
Environmental Consequences
As noted above in the "Proposed Action and Alternatives" section,
differences in environmental impacts do not provide clear distinctions amongalternatives.
The amount of land disturbed by new facilities (shrub-steppe habitat
destroyed) would vary from no additional land for new facilities in the no
action and enhanced K Basins storage alternatives to about 8 ha (20 acres) for
onsite processing at the reference site (a previously undisturbed site
adjacent to the 200 East Area). If the CSB site were chosen, no additional
habitat would be disturbed, because this site is already within the developed
200 East Area. Even at the reference site, the high end of the range of
habitat destruction is relatively small. However, since such an activity
would further fragment shrub-steppe habitat, it is expected that this habitat
destruction would be mitigated by nurturing similar habitat in other areas,
for example those that have been burned out by range fires. Thus, habitat
destruction is not considered to be an important discriminator among the
alternatives.
vii
Total employment ranges among the alternatives from about 4,100 worker-
years for the preferred alternative (drying/passivation) to about
17,000 worker-years in the onsite processing alternative. Thus, in terms of
man-power, the preferred alternative would represent a savings.
Human health impacts among the public and workers from releases of
radionuclides during routine operations and incident-free transportation vary
among the alternatives. However, doses are estimated to be very small frac-
tions of the annual variation in natural background radiation dose at any
given location. In the case of radiological accidents, there are scenarios in
which latent cancer fatalities would be inferred if the accident were to
happen. However, multiplying the consequences of each accident by the esti-
mated annual frequency and the number of years at risk results in.a point-risk
estimate of latent cancer fatalities that in all cases does not exceed
1 latent cancer fatality. For perspective, the point-risk estimate of latent
cancer fatalities from natural background radiation for this population
(380,000) and time period (40 years) is about 2,000.
Except for the no action and enhanced K Basins storage alternatives,
commitments of resources, other than water, gasoline, gases, and nitric acid
are within a factor of 3 to 4 for all alternatives (it being assumed that
resources equivalent to domestic processing would be required for foreign
processing). The requirement for water in the onsite processing alternative
would be about 10 times that for the preferred alternative; however, large
water requirements would not be critical because of the abundance of wateravailable from the Columbia River (maximum requirement of about 0.001% of
annual flow) and would be within the capacity of existing supply lines.
Although not required in other alternatives, sizeable quantities of gases,
principally inert gases, would be required in the preferred alternative;
however, there is no indication that these are in short supply. Nitric acid
would be required in quantity for calcination and 10 times that for the
processing alternatives, but would not be required at all in the other
alternatives. Again, nitric acid is not in short supply and, also, it would
be reclaimed as practicable.
While wastes would be generated in the process of implementing any of
the alternatives, none of the wastes described would significantly impact
Hanford's present capacity to store (as in the case of high-level and
transuranic waste) or to dispose of low-level waste. Even in the case of
high-level waste from onsite processing, the amount represents less than 10%
of the volume of the now-remaining double-shell tank capacity.
viii
Costs of implementing 40-year storage would range from about $1 to
$4 billion. At the low end of $1 billion are enhanced K Basins storage, new
wet storage, and the preferred alternative. The no action and calcine alter-
natives would cost about.$2 billion and onsite processing about $3 billion.
Costs of foreign processing would range from about $2 to $4 billion, If one
assumes that processing of SNF would be required before repository acceptance,
then the life-cycle tosts,(including 40-year storage) would'be about $3
billion for enhanced K`Basins,storage,•new wet storage, onsite processing, and
the preferred alternative, and about $4 - billion for no'action and the foreignprocessing alternatives.
Regulatory Requirements = rs ^ 5
It is'DOE's policy to conduct its operations in an environmentally safe
and,sound manner in compliance with the letter and spirit of applicable envi-
ronmental statutes and regulations. Of specific interest are the permits-thatmight be required for implementation of any of the alternatives. Air quality_
permits may be required for the release of oxides of nitrogen under theprocessing or calcination alternatives ,(EPA)._ An amendment to DOE's existing
radioactive air emissions license issued by the Washingtpn State Department of
Health will be required for the emission of radionuclides to the atmosphere
under any alternativd, except possibly for no action. DOE will submit an
application for approval of construction under the National Emission Standards
for Hazardous Air Pollutants requirements for any facility under ahy'alterna-
tive with projected radioactive emissions to the atmosphere (EPA). A National
Pollutant Discharge Elimination System permit (EPA) will be required for any
liquid point discharge to the 'Columbia River (EPA), and a discharge permit, or
an amendment to an existing permit, will be required for any liquid released'to the ground (Ecology). A RCRA permit will be required for the treatment,
storage, or disposal of any hazardous waste (Ecology).
ix
i^^:^^ „p
^ °^^^ i.
GLOSSARY
Terms in this glossary are defined based on the context in which they
are used in this EIS.
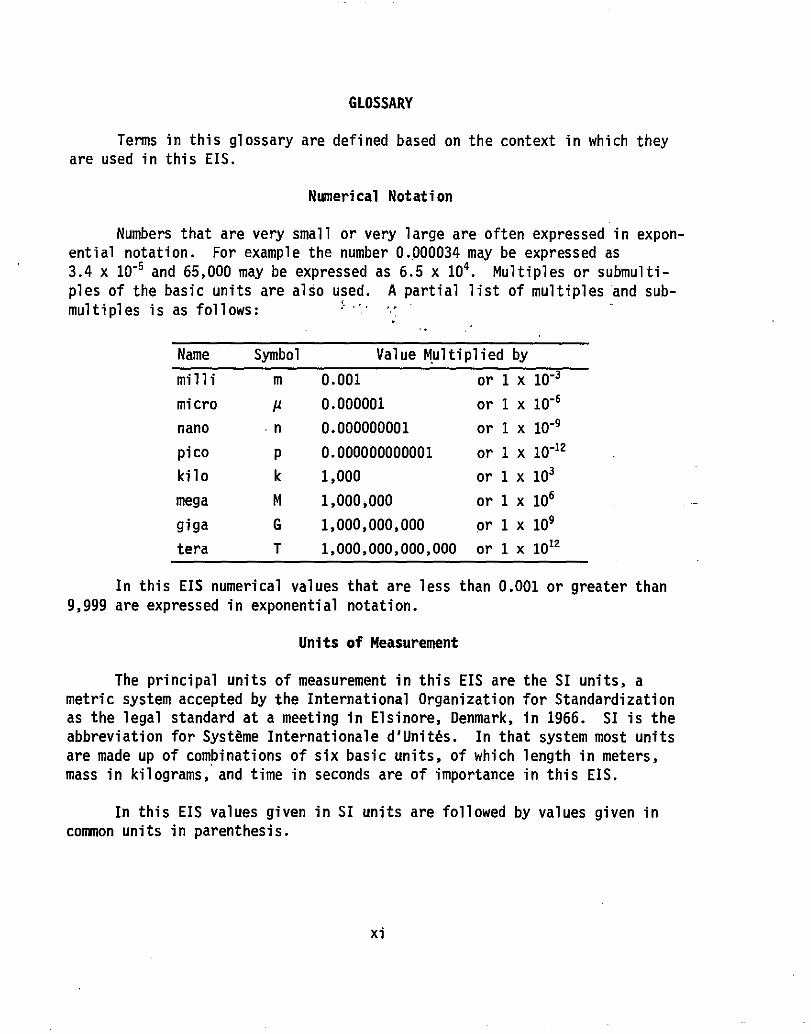
Numerical Notation
Numbers that are very small or very large are often expressed in expon-
ential notation. For example the number 0.000034 may be expressed as
3.4 x 10"5 and 65,000 may be expressed as 6.5 x 10 4 . Multiples or submulti-
ples of the basic units are also used. A partial list of multiples and sub-
multiples is as follows:
Name Symbol Value Mult ip li ed by
milli m 0.001 or 1 x 10"3
micro y 0.000001 or 1 x 10⁻⁶
nano n 0.000000001 or 1 x 10⁻⁹
Pico P 0.000000000001 or 1 x 10-12
kilo k 1,000 or 1 x 10³
mega M 11000,000 or 1 x 10⁶
giga G 1,000,000,000 or 1 x 10⁹
tera T 1,000,000,000,000 or 1 x 10¹²
In this EIS numerical values that are less than 0.001 or greater than
9,999 are expressed in exponential notation.
Units of Measurement
The principal units of measurement in this EIS are the SI units, a
metric system accepted by the International Organization for Standardization
as the legal standard at a meeting in Elsinore, Denmark, in 1966. SI is the
abbreviation for Syst8me Internationale d'Unit6s. In that system most units
are made up of combinations of six basic units, of which length in meters,
mass in kilograms, and time in seconds are of importance in this EIS.
In this EIS values given in SI units are followed by values given in
common units in parenthesis.
xi
ALARA
bd ft
BNFL
CBC
CERCLA
CFR
Ci
CSB
°C
dB (A)
d
DEIS
DOE
DOT
DST
DWS
EA
Ecology
EIS
EPA
E/Q
ERPG
ETF
FFTF
FMEF
FONSI
FR
FRR
ft
ft,
ft,
OF
9gal
ha
HCRL
HEPA
HFSUWG
0
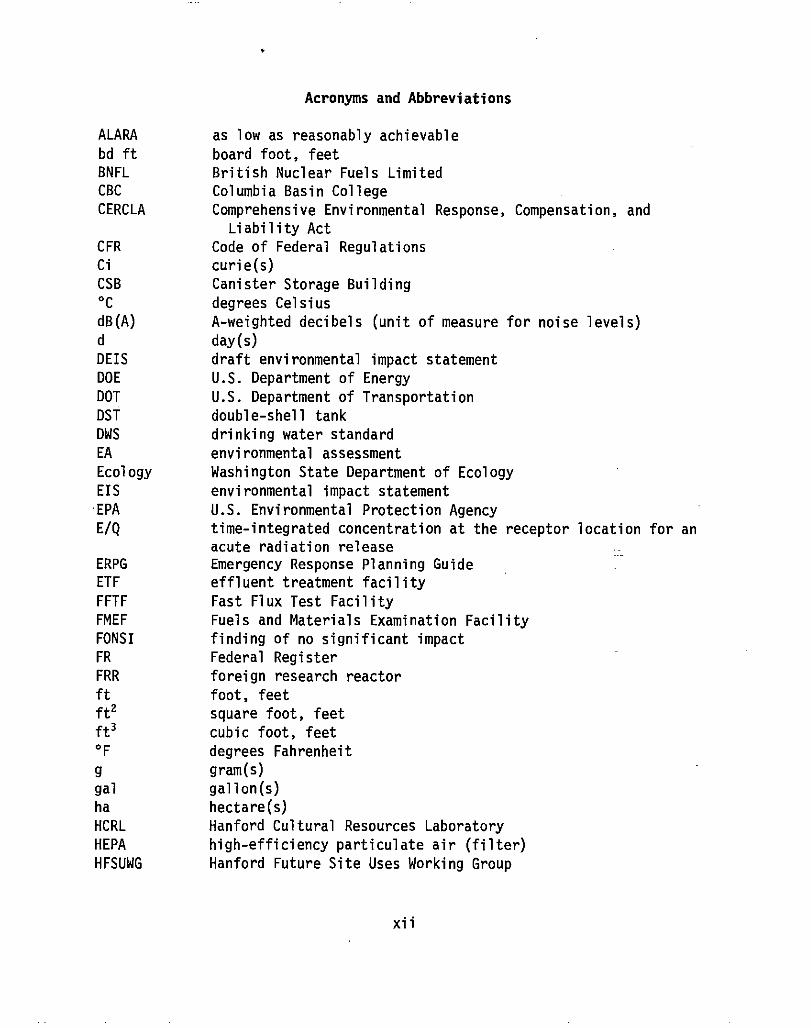
Acronyms and Abbreviations
as low as reasonably achievable
board foot, feet
British Nuclear Fuels Limited
Columbia Basin College
Comprehensive Environmental Response, Compensation, and
Liability Act
Code of Federal Regulations
curie(s)
Canister Storage Building
degrees Celsius
A-weighted decibels (unit of measure for noise levels)
day(s)
draft environmental impact statement
U.S. Department of Energy
U.S. Department of Transportation
double-shell tank
drinking water standard
environmental assessment
Washington State Department of Ecology
environmental impact statement
U.S. Environmental Protection Agency
time-integrated concentration at the receptor location for an
acute radiation releaseEmergency Response Planning Guide
effluent treatment facility
Fast Flux Test Facility
Fuels and Materials Examination Facility
finding of no significant impact
Federal Register
foreign research reactor
foot, feet
square foot, feet
cubic foot, feet
degrees Fahrenheit
gram(s)
gallon(s)
hectare(s)
Hanford Cultural Resources Laboratory
high-efficiency particulate air (filter)
Hanford Future Site Uses Working Group
xii
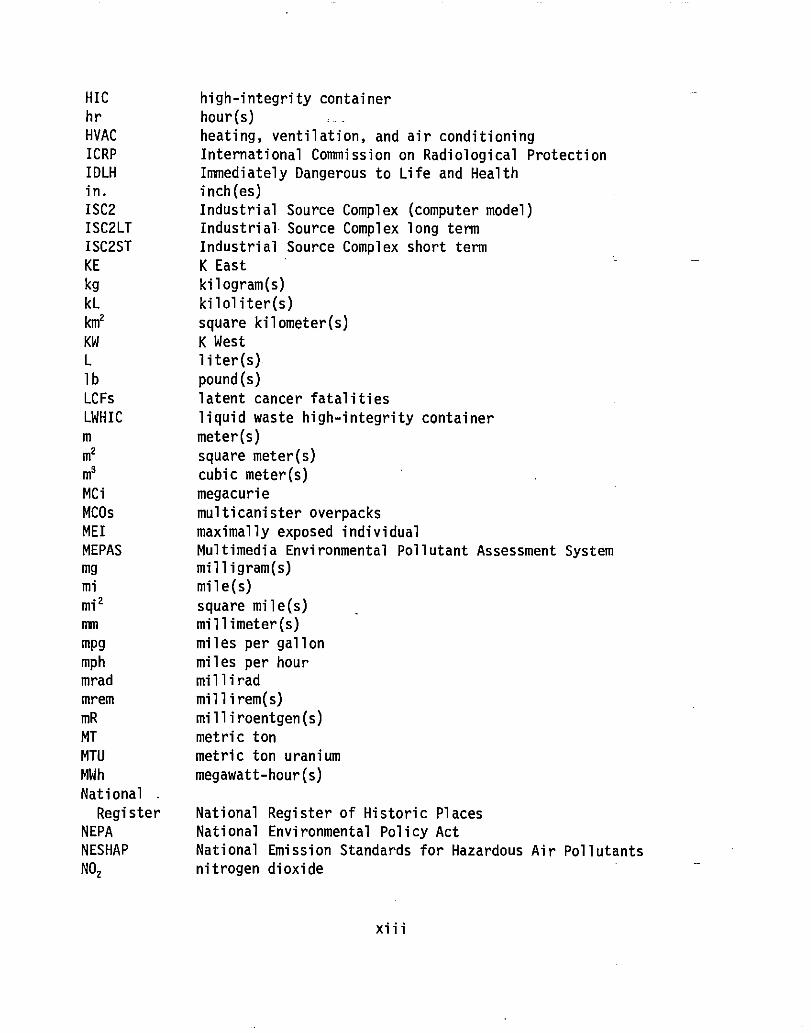
HIC high-integrity container
hr hour(s)
HVAC heating, ventilation, and air conditioning
ICRP International Commission on Radiological Protection
IDLH Immediately Dangerous to Life and Health
in. inch(es)
ISC2 Industrial Source Complex (computer model)
ISC2LT Industrial Source Complex long term
ISC2ST Industrial Source Complex short term
KE K East
kg kilogram(s)
kL kiloliter(s)
kM2 square kilometer(s)
KW K West
L liter(s)
lb pound(s)
LCFs latent cancer fatalities
LWHIC liquid waste high-integrity container
m meter(s)
e square meter(s)
m3 cubic meter(s)
MCi megacurie
MCOs multicanister overpacks
MEI maximally exposed individual
MEPAS Multimedia Environmental Pollutant Assessment Systemmg milligram(s)
mi mile(s)
mi l square mile(s)
mm millimeter(s)
Mpg miles per gallon
mph miles per hour
mrad millirad
mrem millirem(s)
mR milliroentgen(s)
MT metric ton
MTU metric ton uranium
MWh megawatt-hour(s)
National .
Register National Register of Historic Places
NEPA National Environmental Policy Act
NESHAP National Emission Standards for Hazardous Air Pollutants
NO2 nitrogen dioxide
xiii
NOI notice of intent
NPDES National Pollutant Discharge Elimination System
NRC Nuclear Regulatory Commission
OSHA Occupational Safety and Health Administration
oz ounce(s)
PCBs polychlorinated biphenyls
PEIS programmatic environmental impact statement
PFP Plutonium Finishing Plant
PM10 particulate matter less than 10 micrometers in diameter
PNL Pacific Northwest Laboratory
PSD prevention of significant deterioration
psig pounds per square inch gauge
PUREX Plutonium and Uranium Recovery through EXtraction
R roentgen, a unit of radiation exposure
RIMS Regional Input-Output Modeling System
RCRA Resource Conservation and Recovery Act
ROD record of decision
RTEC Registry of Toxic Effects for-Chemical
SALDS State-Approved Land Disposal System
SI Systeme Internationale d'Unitds (see "Units of Measure"
section)
SNF spent nuclear fuel
SNL Sandia National Laboratories
S02 sulfur dioxide
SR State RouteSWHIC solid waste high-integrity container
TEDF Treated Effluent Disposal Facility
TLV/TWA threshold limit value/time-weighted average
Tri-Party Hanford Federal Facility Agreement and Consent Order
Agreement
TRU transuranic
TRUSAF Transuranic Waste Storage and Assay Facility
TWRS Tank Waste Remediation System
µg microgram(s)
µm micrometer(s)
pmhos micromhos
USC United States Code
W watt(s)
WAC Washington Administrative Code
WHC Westinghouse Hanford Company
wk week(s)
WNP-4 Washington Nuclear Project Number 4
xiv
WSU-TC Washington State University--Tri-Cities Branch Campus
yd cubic yard (s) ._.
yr year(s)
Technical Terms
500-year flood A flood of such magnitude that it occurs, on average, every
500 years (equates to a 0.2% probability of occurring in any given year).
accident An unforeseeable and unplanned event.
activity A measure of quantity of a radioactive substance. The SI unit of
measure is the becquerel (Bq), which is equal to one disintegration (nuclear
transformation) per second. The common unit of activity is the curie (Ci),
which is equal to 37 billion disintegrations per second [that number of
disintegrations is approximately the disintegration rate of one gram (0.04 oz)
of radium from which the original definition came]. One Ci equals 3.7 x 10¹⁰
Bq and is the unit of activity used in this EIS.
While activity gives a measure of rate of radioactive decay of a substance, if
used.alone, it may be misleading. The half-life of the substance, or the time
it takes for one half of the activity to have disappeared is also important.
For example one unit of activity of cesium-137 (half-life about 30 years) will
have diminished to about 1% of the initial amount in 200 years, whereas one
unit of activity of iodine-129 (half-life about 16 million years), for allpractical purposes, will not have diminished at all.
background radiation Radiation from cosmic sources; naturally occurring
radioactive materials, including radon (except as a decay product of source or
special nuclear material); and global fallout as it exists in the environment
from the testing of nuclear explosive devices. (Natural background excludes
global fallout.)
board foot A common unit of measure for lumber equal to the volume of a board
1 ft wide by 1 ft long by 1 in. thick, or 144 cubic inches.
bounding The term bounding as used in bounding accidents, bounding resource
commitments, etc., implies that whatever is referred to as bounding would have
larger consequences than would other reasonable choices that might serve the
intended purpose. For example, the consequences of constructing a three-vault
facility would be bounding for those of a two-vault facility; hence, depending
on the context of the analysis, only the consequences of a three-vault
facility may need to be presented.
xv
calcination The process of converting material to unconsolidated granules or
powder, typically metallic oxides (also called calcining).
characterization The determination of waste composition and properties,
whether by review of process knowledge, nondestructive examination or assay,
or sampling and analysis, generally done for the purpose of determining
appropriate storage, treatment, handling, transport, and disposal
requirements.
cladding The outer jacket of reactor fuel elements usually made of aluminum,
stainless steel, or zirconium alloy. Cladding is used to prevent fuel
corrosion and retain fission products during reactor operation or to prevent
releases into the environment during storage.
Comprehensive Environmental Response, Compensation, and Liability Act of 1980
(CERCLA) A federal law (also known as "Superfund") that provides a comprehen-
sive framework to deal with abandoned hazardous materials. CERCLA provides
for liability, compensation, cleanup, and emergency response for hazardous
substances released into the environment that could endanger public health,
welfare, or the environment, as well as the cleanup of inactive hazardous
waste disposal sites. CERCLA has jurisdiction over any release or threatened
release of any "hazardous substance" . to the environment. Under CERCLA, the
definition of "hazardous substance" is much broader than the definition of
"hazardous waste" under the Resource Conservation and Recovery Act, and the
hazardous substance need not be a waste. If a site meets the CERCLArequirements for designation, it is ranked along with other "Superfund" sites
and listed on the National Priorities List. This ranking and listing is the
U.S. Environmental Protection Agency's way of determining which sites have the
highest priority for cleanup.
contamination Something that pollutes, such as radioactive material in air,
water, or on the ground or other surfaces.
crepuscular Active at twilight or just before sunrise.
curie (Ci) A unit used to describe the quantity (activity) of a radioactive
substance. The curie is a quantity of any radionuclide that decays at a rate
of 37 billion disintegrations per second (approximately the rate of decay of
1 gram of radium).
xvi
decay, radioactive A spontaneous nuclear transformation of one nuclide into a
different nuclide or into a different energy state of the same nuclide by
emission of particles or photons.
decommissioning The process of removing a facility from service. Decommis-
sioning is typically preceded by decontamination of the facility.
decontamination The actions taken to reduce or remove substances that pose a
substantial present or potential hazard to human health or the environment,
such as radioactive contamination from facilities, soil, or equipment by
washing, chemical action, mechanical cleaning, or other techniques.
DOE Orders Requirements internal to the U.S. Department of Energy (DOE) that
establish DOE policy and procedures, including those for compliance with
applicable laws.
dose, radiation In terms of public health and safety, a measure of the amount
of ionizing radiation absorbed by the body or body tissue. The unit of
absorbed dose in SI units is the gray (Gy) and is equal to the deposition of
one joule of energy per kilogram of tissue. The unit of absorbed dose in
common units is the rad, which is equal to the deposition of 100 ergs per gram
of tissue. Various forms of radiation have different impacts on tissues and
different tissues have different responses in terms of overall impact on the
body.
The source of radiation may originate outside the body or inside the body as a
result of inhalation, ingestion, absorption, or injection. Absorbed dose by
itself is generally not sufficient as a measure of detriment or impact. As a
consequence, a total effective dose equivalent (EDE) has been defined to take
into account these differences and which yields a single risk-based value.
Typically total effective dose equivalent, as used in this EIS, includes the
50-year committed dose from radionuclides internal to the body and the radia-
tion dose received from external sources from a 1-year exposure (multiple
exposures and cumulative dose are taken into account as appropriate). The
unit of total effective dose equivalent is the Sievert (Sv) in SI units and
the rem in common units. One Sv equals 100 rem. (The fundamental units of
effective dose equivalent are such that one sievert is equal to one joule of
energy per kilogram of absorbing medium).
Typically, the total effective dose equivalent (usually referred to simply as
dose in this EIS) is calculated for a "maximally exposed individual" and for
populations of interest. The maximally exposed individual is that hypo-
xvii
thetical individual who, by virtue of food consumption patterns, - place of
residence, etc., tends to receive the maximum dose for a given release of
radionuclides to air, water, or ground. In this EIS the maximally exposed
individual dose is reported in rem.
Population doses are based on doses to individuals under more typical dietary
and other assumptions. The doses for various subgroups (the product of the
number of individuals each receiving the same dose and that dose) are added
together to obtain the collective dose to the population. In this EIS
population dose is reported in person-rem.
dry storage Storage of spent nuclear fuel in environments where the fuel is
not immersed in liquid for purposes of cooling and/or shielding.
environmental monitoring The process of sampling and analysis of environ-
mental media in and around a facility being monitored for the purpose of
(a) confirming compliance with performance objectives, and (b) early detection
of any contamination entering the environment to facilitate timely remedial
action.
fission products The nuclei (fission fragments) formed by the fission of
heavy elements, plus the nuclides formed by the fission fragments' radioactive
decay.
geologic repository A system for the disposal of radioactive waste or spent
nuclear fuel in excavated geologic media.
groundwater Generally, all water contained in the ground. Water held below
the water table available to freely enter wells.
hazardous waste Under the Resource Conservation and Recovery Act, a solid
waste, or combination of solid wastes, which because of its quantity, concen-
tration, or physical, chemical, or infectious characteristics may (a) cause,
or significantly contribute to an increase in mortality or an increase in
serious irreversible, or incapacitating reversible, illness; or (b) pose asubstantial present or potential hazard to human health or the environment
when improperly treated, stored, transported, or disposed of or otherwise
managed. Source, special nuclear material, and-by-product material, as
defined by the Atomic Energy Act, are specifically excluded from the defini-
tion of solid waste.
xviii
high-level waste The highly radioactive waste material that results from the
reprocessing of spent nuclear fuel, including liquid waste produced directly
from reprocessing and any solid waste derived from the liquid that contains a
combination of transuranic and fission product nuclides in quantities that
require permanent isolation. High-level waste may include other highly radio-
active material that the U.S. Nuclear Regulatory Commission, consistent with
existing law, determines by rule requires permanent isolation.
hydrology The study of water, including groundwater, surface water, and
rainfall.
isotope One of two or more atoms with the same number of protons, but differ-
ent numbers of neutrons, in their nuclei. Thus, carbon-12, carbon-13, and
carbon-14 are isotopes of the element carbon, the numbers denoting the approx-
imate atomic weights. Isotopes have very nearly the same chemical properties,
but often different physical properties (for example, carbon-12 and -13 are
stable, carbon-14 is radioactive).
low-level waste Radioactive waste not classified as high-level waste,
transuranic waste, or spent nuclear fuel.
maximally exposed individual (MEI) A hypothetical individual whose location,
time of residency, dietary habits, etc. are defined so as to maximize esti-
mates of consequences of release of pollutants.
millirem (mrem) One thousandth of a rem (see rem).
mixed waste Waste that contains both hazardous waste under the Resource
Conservation and Recovery Act and source, special nuclear, or by-product
material subject to the Atomic Energy Act of 1954.
mitigation Those actions that avoid impacts altogether, minimize impacts,
rectify impacts, reduce or eliminate impacts, or compensate for the impact.
nitrogen oxides (NO.) Gases formed in great part from atmospheric nitrogen
and oxygen when combustion takes place under conditions of high temperature
and high pressure such as burning diesel fuel in heavy equipment; considered a
major air pollutant. Two major nitrogen oxides, nitric oxide (NO) and
nitrogen dioxide (NO 2) are important airborne contaminants. In the presence
of sunlight, nitric oxide combines with atmospheric oxygen to produce nitrogen
dioxide, which in high enough concentrations can cause lung damage.
xix
nuclear fuel Materials that can be used in nuclear reactors to produce energy
or special nuclear materials.
passivation The process of making metals inactive or less chemically reac-
tive. For example, to passivate the surface of steel by chemical treatment.
picocurie One trillionth of a curie (see curie), or about 2 disintegrations
per minute.
point-risk estimate The product of the probability of an event occurring, or
the estimated frequency of the event, over the period of interest and the
consequences of the event, if it were to occur. The point-risk estimate is
useful as a comparative quantitative measure of potential adverse impacts
arising from accidents. Thus, if accident A has a probability of 1 chance in
1,000 of 1 latent cancer fatality (LCF), it would have a point-risk estimate
of 0.001 LCF. If another accident B has a probability of 1 chance in a
million of 100 LCFs it would have a point-risk estimate of 0.0001 LCFs, or
one-tenth the mathematical expectation of accident A. On that basis it would
be more prudent to spent money to reduce the likelihood and/or consequences of
accident A than accident B.
probable maximum flood The largest flood for which there is any reasonable
expectancy in a specific area. The probable maximum flood is normally several
times larger than the largest flood of record.
processing (of spent nuclear fuel) Applying a chemical or physical process
designed to alter the characteristics (break down constituents) of the spent
nuclear fuel matrix.
radioactive waste Waste that is managed for its radioactive content.
radioactivity The property or characteristic of material to spontaneously
"disintegrate" with the emission of energy in the form of radiation.
record of decision (ROD) A public document that records the final decision(s)
concerning a proposed action. The record of decision is based in part on
information and technical analysis generated either during the Comprehensive
Environmental Response, Compensation, and Liability Act (CERCLA) process or
the National Environmental Policy Act (NEPA) process, both of which take into
consideration public comments and community concerns. An ROD based on NEPA
also takes into account cost and programmatic considerations.
xx
rem The common unit of dose equivalent, effective dose equivalent, etc. The
dosage of an ionizing radiation that will cause the same biological effect as
1 roentgen of x-ray or gamma-ray exposure.
repository A deep geologic facility for permanent disposal of high-level or
transuranic wastes and spent nuclear fuel.
reprocessing (of spent nuclear fuel) Processing of reactor irradiated nuclear
material (primarily spent nuclear fuel) to recover fissile and 'fertile
material, in order to recycle such materials primarily for defense programs.
Historically, reprocessing has involved aqueous chemical separations of
elements (typically uranium or plutonium) from undesired elements in the fuel.
Resource Conservation and Recovery Act (RCRA) A federal law addressing the
management of waste. Subtitle C of the law addresses hazardous waste under
which a waste must either be "listed" on one of the U.S. Environmental
Protection Agency's (EPA's) hazardous waste lists or meet one of the EPA's
four hazardous characteristics of ignitability, corrosivity, reactivity, or
toxicity, as measured using the toxicity characterization leaching procedure
(TCLP). Cradle-to-grave management of wastes classified as RCRA hazardous
wastes must meet stringent guidelines for environmental protection as required
by the law. These guidelines include regulation of generation, transport,
treatment, storage, and disposal of RCRA-defined hazardous waste. Subtitle D
of the law addresses the management of nonhazardous, nonradioactive, solid
waste such as municipal wastes.
risk The term risk has many interpretations; however, in this EIS risk means
the product of the probability of an event occurring, or the estimated
frequency of the event, over the period of interest and the consequences of
the event, if it were to occur. See also point-risk estimate.
seismicity The phenomenon of earth movements; seismic activity. Seismicity
is related to the location, size, and rate of occurrence of earthquakes.
SOX A generic term used to describe the oxides of sulfur. The combination of
sulfur oxides with water vapor produces acid rain (see sulfur oxides).
source term Quantity of a radioactive material or hazardous substance that
causes exposure after release during normal operations or an accident.
xxi
special nuclear material (a) Plutonium, or uranium enriched in the isotope
233 or in the isotope 235, and any other material that the U.S. Nuclear
Regulatory Commission, pursuant to the provisions of the Atomic Energy Act of
1954, Section 51, determines to be special nuclear material; or (b) any
material artificially enriched by any of the foregoing, but does not include
source material. Special nuclear material is exempt from regulation under the
Resource Conservation and Recovery Act (RCRA).
spent nuclear fuel Fuel that has been withdrawn from a nuclear reactor fol-
lowing irradiation, the constituent elements of which have not been separated.
storage The collection and containment of waste or spent nuclear fuel, in
such a manner as not to constitute disposal of the waste or spent nuclear
fuel, for the purposes of awaiting treatment or disposal capacity (that is,
not short-term accumulation).
sulfur oxides Pungent, colorless gases formed primarily by the combustion of
fossil fuels; considered major air pollutants; sulfur oxides may damage the
respiratory tract as well as vegetation (see SOX).
transuranic waste Waste containing more than 100 nanocuries of alpha-emitting
transuranic isotopes, with half-lives greater than 20 years, per gram of
waste, except for (a) high-level radioactive waste; (b) waste that the
U.S. Department of Energy has determined, with the concurrence of the
Administrator of the U.S. Environmental Protection Agency, does not need the
degree of isolation required by 40 CFR 191; or (c) waste that the U.S. Nuclear
Regulatory Commission has approved for disposal on a case-by-case basis in
accordance with 10 CFR 61.
ultimate disposition The final step in which a material is either processed
for some use or disposed of.
vadose zone The zone between the land surface and the water table. Saturated
bodies, such as perched groundwater, may exist in the vadose zone. Also
called the zone of aeration and the unsaturated zone.
vitrification The process of immobilizing waste material that results in a
glass-like solid.
xxii
waste acceptance criteria The requirements specifying the characteristics of
waste and waste packaging acceptable to a waste receiving facility; and the
documents and processes the generator needs to certify that waste meets
applicable requirements. To be distinguished from the Washington Adminis-
trative Code (WAC).
water pool A type of facility usually used for the storage of irradiated
nuclear materials and spent fuel. The water shields the material being stored
while allowing it to be accessible for handling. Sometimes referred to as a
water pit.
wet storage Storage of spent nuclear fuel in a pool of water, or in canisters
filled with water.
xxiii
THIS PAGE UNT' Di I s^? NALIX-LEFT BLANK
CONTENTS
SUMMARY. . . . . . . . . . . . . . . . . . . . . . . . . . . . . . i i i
GLOSSARY. . . . . . . . . . . . . . . . . . . . . . . . . . . . . xi
1.0 INTRODUCTION . . . . . . 1.11.1 Advice and Consultation fr Regulatory Agencies andom
Advisory Groups ... . . 1.41.2 DOE'S Programmatic Environmental Impact Statement on
the Management of Spent Nuclear Fuel . . . . . . 1.51.3 DOE'S Environmental Impact Statement on the
Management of Spent Nuclear Fuel from the K Basinsat the Hanford Site. 1.5
1.4 Other Environmental Documents Directly Related to theKBasins EIS . . . . . . . . . . . . . 1.5
1.5 Results of the Scoping Process . . . . . . . . . . . . 1.61.6 Other Issues . . . . . . . . . . . . . . . . . . . 1.81.7 Record of Decision . . . . . . . . . . . . . . . . . . 1.9
2.0 PURPOSE AND NEED . . . . ... . . . . . . . . . . . . . . 2.1
3.0 DESCRIPTION OF ALTERNATIVES AND COMPARISON OF IMPACTS AMONGTHE ALTERNATIVES . . . . . . . . . 3.13.1 Summary Description of Alternatives . . . . . . . . . 3.13.2 Details of Alternatives . . . . . . . . . . . . . 3.6
3.2.1 No Action Alternative . . . . . 3.63.2.2 Enhanced K Basins Storage Alternative . . . . 3.83.2.3 New Wet Storage Alternative . . . 3.153.2.4 Drying/Passivation (Conditioning) with Dry
Vault Storage Alternative--PreferredAlternative and Options . . . . . 3.21
3.2.5 Calcination with Dry Storage Alternative . . 3.313.2.6 Onsite Processing Alternative . . . . . . . . 3.343.2.7 Foreign Processing Alternative . . . 3.393.2.8 Alternatives Considered but Dismissed from
Detailed Evaluation . . . . . . . 3.443.3 Comparison of Impacts Among the Alternatives . . . . . 3.45
4.0 AFFECTED ENVIRONMENT . . . . . . . . . . . . . . . . . . . . 4.14.1 Overview . . . . . . . . . . . . . . . . . . . . . . 4.14.2 Land Use . . . . . . . . . . . . . . . . . . . . . 4.14.3 Socioeconomics. . . . . . . . . . . . . . 4.3
4.3.1 Employment and Income . . . . . . . . . . . . 4.34.3.2 Demography . . . . . . . . . . . 4.64.3.3 Housing and Public Services . . . . . . . . . 4.7
4.4 Cultural Resources . . . . . . . . . 4.94.4.1 Prehistoric Archaeological Resources . . . . 4.104.4.2 Native American Cultural Resources . . . 4.104.4.3 Historic Cultural Resources . . . . . . . . . 4.10
4.5 Aesthetic and Scenic Resources . . . . . . . . . . . . 4.11
xxv
4.6 Geology . . . . . . . . . . . . . . . . . 4.124.6.1 General Geology . . . . . . . . . . . . . . . 4.124.6.2 Mineral Resources . . . . . . . . . 4.144.6.3 Seismic and Volcanic Hazards . . . . . . . 4.14
4.7 Air Resources . . . . ., . . . . . . . 4.164.7.1 Climate and Meteorology . . . . . . . . . . . 4.164.7.2 Nonradiological Air Quality . . . . . . . . . 4.204.7.3 Radiological Air Quality . . . . . . . 4.22
4.8 Water Resources . . . . . .. . . . . . . . . . . 4.224.8.1 Surface Water . . . . . . . . . . . . . . . 4.224.8.2 Groundwater . . . . . . . . . . . . . . . . . 4.244.8.3 Water Rights . . . . . . . . . . . . . . . . 4.27
4.9 Ecological Resources . . . . . . . . . . . . . . . . . 4.274.9.1 Terrestrial Resources . . . . . . . . . . . . 4.274.9.2 Wetlands . . . . . . . . . . . . . . . . . . 4.284.9.3 Aquatic Resources . . . . . 4.284.9.4 Threatened, Endangered, and Sensitive
Species. . . . . . . . . . . . . . . . . 4.294.10 Noise . . . . . . . . . . . . . . . . . 4.314.11 Traffic and Transportation . . . . . . . . . . . . . . 4.33
4.11.1 Regional Infrastructure . . . . . . . . . . . 4.334.11.2 Hanford Site Infrastructure. . . . . . . 4.33
4.12 Occupational and Public Health and Safety . . . . . . 4.354.12.1 Occupational Health and Safety . . . . . . . 4.364.12.2 Public Health and Safety . . . . . . . . . . 4.37
4.13 Site Services . . . . . . . . . . . . . . . . 4.384.13.1 Water Consumption . . . . . . . . . . . . . . 4.384.13.2 Electrical Consumption . . . . . . . . . . . 4.394.13.3 Wastewater Disposal . . . . . . . . . . . . . 4.40
4.14 Waste Management . . . . . . . . . . . . . . . 4.404.14.1 Radioactive Waste . . . . . . . . . . . . . . 4.414.14.2 Mixed Waste . . . . . . . . . . . . . . . . 4.424.14.3 Hazardous Waste . . . . . . 4.444.14.4 Industrial and Sanitary Solid Waste . . . . . 4.44
4.15 Hazardous Materials . . . . . . . . . . . . . . . . . 4.44
5.0 ENVIRONMENTAL CONSEQUENCES . . . . . . . . . . . . . . . . . 5.15.1 Overview . . . . . . . . . . . . . 5.1
5.1.1 No Action Alternative . . . . . . . . 5.25.1.2 Enhanced K Basins Storage Alternative . . . . 5.25.1.3 New Wet Storage Alternative . . . 5.35.1.4 Drying/Passivation (Conditioning) with Dry
Storage Alternative . . . . . . . 5.35.1.5 Calcination with Dry Storage Alternative . . 5.35.1.6 Onsite Processing Alternative . . . . . . 5.35.1.7 Foreign Processing Alternative . . . . . . . 5.4
5.2 Land Use . . . . . . 5.45.2.1 No Action and Enhanced K Basins Storage
Alternatives. . . 5.45.2.2 Wet Storage, Passivation or Calcination with
Dry Storage, and Processing Alternatives . . 5.4
xxvi
5.65.7
5.95.115.125.125.125.125.205.315.335.345.34
5.355.355.375.375.37
5.395.395.42
5.42
5.435.44
5.445.445.45
5.455.455.465.505.535.605.625.625.63
5.645.655.655.665.66
5.3 Socioeconomics . . . . . .5.3.1 No Action Alternative, Enhanced K Basins
Storage Alternative, and ForeignProcessing Alternative . . . . . . . .
5.3.2 New Wet Storage Alternative . . . .5.3.3 Drying/Passivation, Calcination, and Onsite
Processing Alternatives . . . . . . . . . . .5.4 Cultural Resources . . . . . . . . . . . . . . . .5.5 Aesthetic and Scenic Resources . . . . . . . . . . . .5.6 Geologic Resources . . . . . . . . . . . . . . .5.7 Air Quality and Related Consequences . . . . . . . . .
5.7.1 Radiological Consequences . . . . . . . . . .5.7.2 Nonradiological Consequences . . . . . . . .
5.8 Water Quality and Related Consequences . . . . . . . .5.8.1 No Action Alternative . . . . . .5.8.2 Enhanced K Basins Storage Alternative . . . .5.8.3 Wet Storage Alternative . . . . . . . .5.8.4 Drying/Passivation with Dry Storage
Alternative5.8.5 Calcination with Dry Storage Alternative5.8.6 Processing Alternative . . . . .5.8.7 Consequences to Recreation and Fisheries . .
5.9 Ecological Resources . . . . . .5.9.1 No Action and Enhanced K Basins Storage
Alternatives. . . . . . . . . . . .5.9.2 Wet Storage Alternative .. . . .5.9.3 Calcination with Dry Storage Alternative . .5.9.4 Drying/Passivation with Dry Storage
Alternative . . . . . . . . .5.9.5 Onsite and Foreign Processing
Alternatives. . . . . . . . . . . . . . . .5.10 Noise
5.10.1 No Action and , Enhanced K Basins StorageAlternatives
5.10.2 Wet Storage Alternative . . . . . . . . . . .5.10.3 Dry Storage Alternative . . . . . . . . .5.10.4 Onsite and Foreign Processing
Alternatives. . . . . . . . . . . . . . . .5.11 Transportation . . . . . . . .
5.11.1 Enhanced K Basin Storage Alternative . . . .• 5.11.2 Wet Storage Alternative . . . . . . . . . . .5.11.3 Dry Storage Alternative . . . . . . . . .5.11.4 Foreign Processing Alternative . . . . . .
5.12 Occupational and Public Health and Safety . . . .5.12.1 Radiological Consequences.to the Public . .5.12.2 Radiological Consequences to Workers . . . .5.12.3 Nonradiological Consequences to the
Public. . . .. . . . .5.12.4 Nonradiological Consequences to Workers . . .
5.13 Site Services . . . . . . . . . . . . . . .5.13.1 No Action Alternative . . . . . .5.13.2 Enhanced K Basins Storage Alternative . . . .
xxvii
6V
5.13.3 Wet Storage Alternative .. . .5.13.4 Passivation or Calcination with Dry Storage
Alternatives. . . .5.13.5 Onsite and Foreign Processing Alternatives-
5.14 Waste Management. . . . . . . . . . . .5.14.1 No Action Alternative . . . . .5.14.2 Enhanced K Basin Storage Alternative . . .5.14.3 New Wet Storage Alternative . . . . . . . .5.14.4 Dry Storage Alternative . . . . . . . . . .5.14.5 Processing Alternatives . . .. .5.14.6 Comparison to Current Waste Generation
Rates. . . . . . . . . . . . . . . . . .5.15 Facility Accidents. . . .
5.15.1 Historical Accidents Involving SNFatHanford .. . . . . . .
5.15.2 Emergency Preparedness Planningat Hanford. . .
5.15.3 Accident Selection for the EIS Analysis . .5.15.4 Method for Accident Consequence Analysis5.15.5 Radiological Accident Analysis . . . . .5.15.6 Secondary Impacts of Radiological
Accidents. . . . .5.15.7 Nonradiological Accident Analysis . . .5.15.8 Construction and Occupational Accidents
5.16 Cumulative Impacts Including Past and ReasonablyForeseeable Actions. . . . .5.16.1 Land Use, Geological Resources, and
Ecological Resources . . . . . . . . . . .5.16.2 Air Quality . . . . . . . . . . . . . . .5.16.3 Waste Management . . . . . . . . . . . . .5.16.4 Socioeconomics . . . . . . .5.16.5 Occupational and Public Health . . . . .
5.17 Adverse Environmental Impacts that Cannot beAvoided . . . . . .5.17.1 No Action and Enhanced K Basins Storage
Alternatives . . . . . . . . . . .5.17.2 Other EIS Alternatives . .. . .
5.18 Relationship Between Short-Term Uses of theEnvironment and the Maintenance and Enhancementof Long-Term Productivity . . .
5.19 Irreversible and Irretrievable Commitment ofResources. . . . . . . . . . . . . .
5.20 Potential Mitigation Measures . .5.20.1 Pollution Prevention/Waste Minimization .5.20.2 Socioeconomics.5.20.3 Cultural (Including Archaeological and
Cultural) Resources . . . . . . . . . . .5.20.4 Air Resources . . . . . . . . . . . . . .5.20.5 Water Resources . . . . . . . . . . . . .5.20.6 Ecology . . . . .5.20.7 Noise, Traffic, and Transportation .5.20.8 Occupational and Public Health and Safety
5.67
5.695.715.745.745.755.765.785.80
5.815.83
5.83
5.835.845.855.86
5.1075.1085.113
5.113
5.1135.1155.1155.1165.117
5.118
5.1185.118
5.119
5.1195.1205.1205.123
5.1235.1235.1245.1245.1245.125
xxviii
5.20.9 Site Utilities and Support Services . . . . . 5.1255.20.10 Accidents . . . . . . . . . . . . . . . . . . 5.125
5.21 Environmental Justice . . . . . . . . . . . . . . . . 5.1275.21.1 Hanford Vicinity . . . . . . . . . . . . . . 5.1275.21.2 Port Facilities . . . . . 5.133
5.22 Estimated 40-Year Storage and Life-Cycle Costs . . . . 5.1335.22.1 No Action Alternative . . . . . . 5.1345.22.2 Enhanced K Basin Storage Alternative . . . . 5.1365.22.3 New Wet Storage Alternative . . . . . . . . . 5.1365.22.4 Dry Storage Alternative . . . . . . . . . 5.1365.22.5 Foreign Processing Alternative . . . . . : 5.1405.22.6 Description of the Treatment Options . . . . 5.1405.22.7 Final Transport and Disposal . . . . . . . . 5.142
6.0 REGULATORY REQUIREMENTS . . . . . . . . . . . . . . 6.16.1 Transportation Requirements . . . . . . . . . . . . . 6.16.2 Occupational Radiation Exposure . . . . . . 6.36.3 Radiation Exposure to Members of the Public . . . . . 6.36.4 ... . ...... .....Noise. . . . 6.46.5 Floodplain Management and Protection of Wetlands . . . 6.46.6 Hazardous Waste Management . . . . . . . . . . . . . . 6.56.7 Protection of Wetlands . . . . . . . . . . . . . . . . 6.56.8 Species Protection . . . . . . 6.56.9 Native American, Archaeological, and Historic
Preservation Statutes . . . . . . . . . . . . . . 6.66.10 Radioactive Air Emissions . . . . . . . . . . . . . . 6.76.11 Nonradioactive Air Emissions . . . . . . . . . . . . . 6.86.12 Liquid Discharges to Surface Water . . . . . . . . . . 6.86.13 Liquid Discharges to the Ground . . . . . . . . . . . 6.9
7.0 REFERENCES . . . . . . . . . . . . . . . . . . . . . . . . . 7.1
8.0 PREPARERS . . . . . . . . . . . . . . . . . . . . . . . . . . 8.1
9.0 DISTRIBUTION LIST . . . . . . . . . . . . . . . . . . . . . . 9.1
APPENDIX A -INVENTORY AND FACILITY DESCRIPTIONS . . . . . . . . . A.1
APPENDIX B - TRANSPORTATION IMPACT ANALYSIS . . . . . . . . . . . . B.1
APPENDIX C - NOISE ANALYSIS . . . . . . . . . . . . . . . . . . . . C.1
INDEX. . . . . . . . . . . . . . . . . . . . . . . . . . . . . . . Index.1
xxix
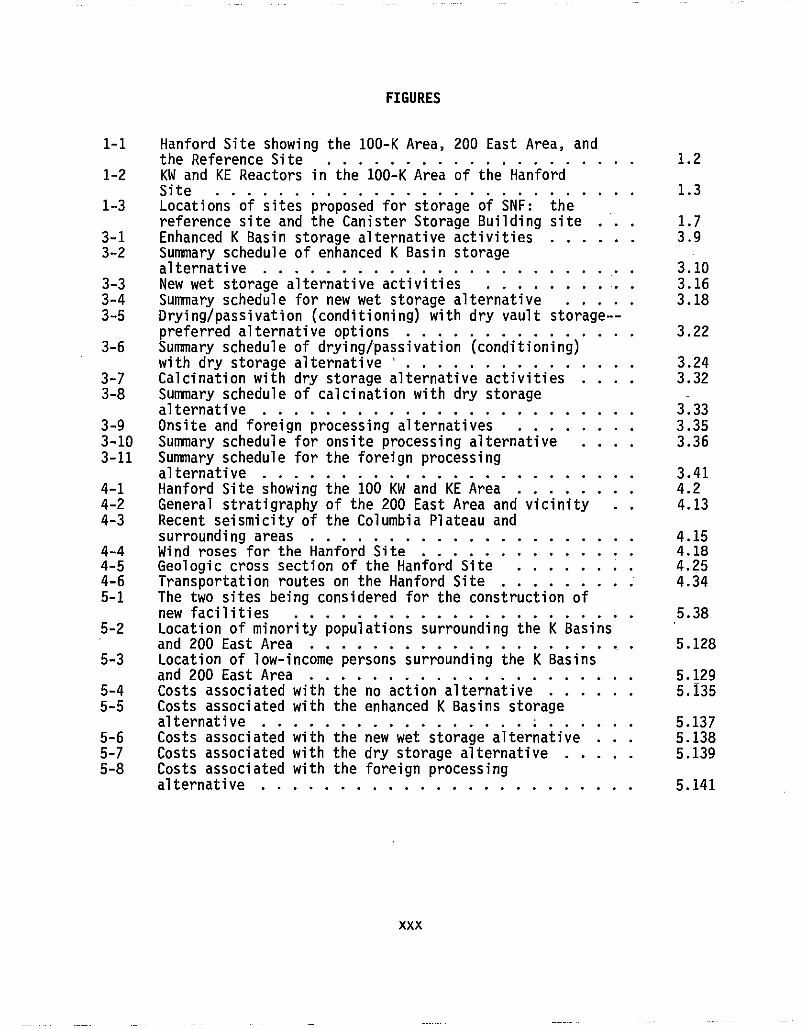
FIGURES
1-1 Hanford Site showing the 100-K Area, 200 East Area, andthe Reference Site. 1.2
1-2 KW and KE Reactors in the 100-K Area of the HanfordSite. . .. . 1.3
1-3 Locations of sites proposed for storage of SNF: thereference site and the Canister Storage Building site . . . 1.7
3-1 Enhanced K Basin storage alternative activities . . . . . . 3.93-2 Summary schedule of enhanced K Basin storage
alternative . 3.103-3 New wet storage alternative activities 3.163-4 Summary schedule for new wet storage alternative . . . . 3.183-5 Drying/passivation (conditioning) with dry vault storage--
preferred alternative options . . . . 3.223-6 Summary schedule of drying/passivation (conditioning)
with dry storage alternative. 3.243-7 Calcination with dry storage alternative activities 3.323-8 Summary schedule of calcination with dry storage -
alternative. . . .. . . . . . . . . 3.333-9 Onsite and foreign processing alternatives . . . . . . 3.353-10 Summary schedule for onsite processing alternative . . . . 3.363-11 Summary schedule for the foreign processing
alternative. . 3.414-1 Hanford Site showing the 100 KW and KE Area . . . . 4.24-2 General stratigraphy of the 200 East Area and vicinity 4.134-3 Recent seismicity of the Columbia Plateau and
surroundingareas . . . . . . . . . . . . . . . 4.154-4 Wind roses for the Hanford Site . . . . . . 4.184-5 Geologic cross section of the Hanford Site . . . . . . . . 4.254-6 Transportation routes on the Hanford Site . . . 4.345-1 The two sites being considered for the construction of
new facilities . . 5.385-2 Location of minority populations surrounding the K Basins
and 200 East Area . . . . . . . . . . . . 5.1285-3 Location of low-income persons surrounding the K Basins
and 200 East Area . . 5.1295-4 Costs associated with the no action alternative 5.1355-5 Costs associated with the enhanced K Basins storage
alternative . .. . . . . . . . . 5.1375-6 Costs associated with the new wet storage alternative . . . 5.1385-7 Costs associated with the dry storage alternative . . . . . 5.1395-8 Costs associated with the foreign processing
alternative. . . . . . . . . . . . . . . . . . . . . . . . 5.141
xxx
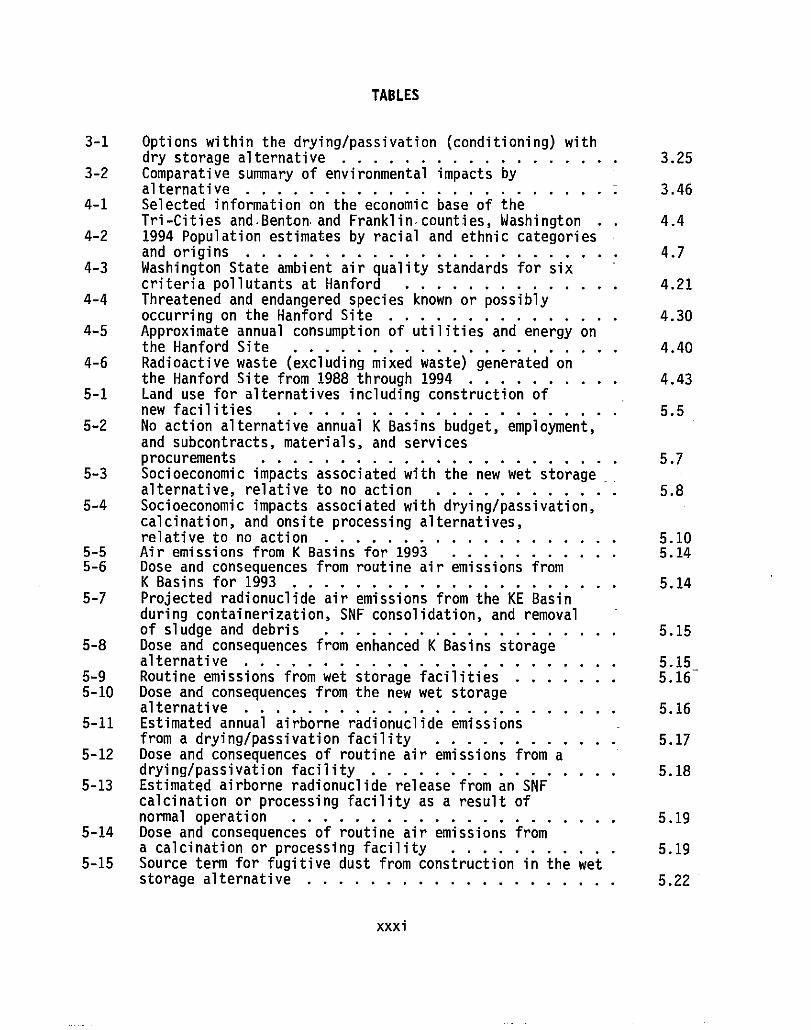
TABLES
3-1 Options within the drying/passivation (conditioning) withdry storage alternative. . . . . . . 3.25
3-2 Comparative summary of environmental impacts byalternative . . . . . . 3.46
4-1 Selected information on the economic base of theTri-Cities and.Be.nton.and Franklin.counties, Washington 4.4
4-2 1994 Population estimates by racial and ethnic categoriesandorigins. . . ... .......... .
4-3 Washington State ambient air quality standards for sixcriteria pollutants at Hanford . . . . . . . . . 4.21
4-4 Threatened and endangered species known or possiblyoccurring on the Hanford Site . .. . . . 4.30
4-5 Approximate annual consumption of utilities and energy onthe Hanford Site . . . . 4.40
4-6 Radioactive waste (excluding mixed waste) generated onthe Hanford Site from 1988 through 1994 . . . . 4.43
5-1 Land use for alternatives including construction ofnew facilities . ... . 5.5
5-2 No action alternative annual K Basins budget, employment,and subcontracts, materials, and servicesprocurements. . . .
.5.7
5-3 Socioeconomic impacts associated with the new wet storagealternative, relative to no action . . . 5.8
5-4 Socioeconomic impacts associated with drying/passivation,calcination, and onsite processing alternatives,relative to no action . . . . . . . . . . . . 5.10
5-5 Air emissions from K Basins for 1993 5.145-6 onDose and consequences from routine air emissis from
K Basins for 1993 . . . 5.145-7 Projected radionuclide air emissions from the KE Basin
during containerization, SNF consolidation, and removalof sludge and debris . . . . . . . 5.15
5-8 Dose and consequences from enhanced K Basins storagealternative. . . . . . . . 5.15_
5-9 Routine emissions from wet storage facilities . . . . . . . 5.165-10 Dose and consequences from the new wet storage
alternative 5.165-11 Estimated annual airborne radionuclide emissions
from a drying/passivation facility . . . . . 5.175-12 Dose and consequences of routine air emissions from a
drying/passivation facility . . . . . 5.185-13 Estimated airborne radionuclide release from an SNF
calcination or processing facility as a result ofnormal operation . . . . . 5.19
5-14 Dose and consequences of routine air emissions froma calcination or processing facility 5.19
5-15 Source term for fugitive dust from construction in the wetstoragealternative . . . . . . . . . . . . . . . . . . . . 5.22
xxxi
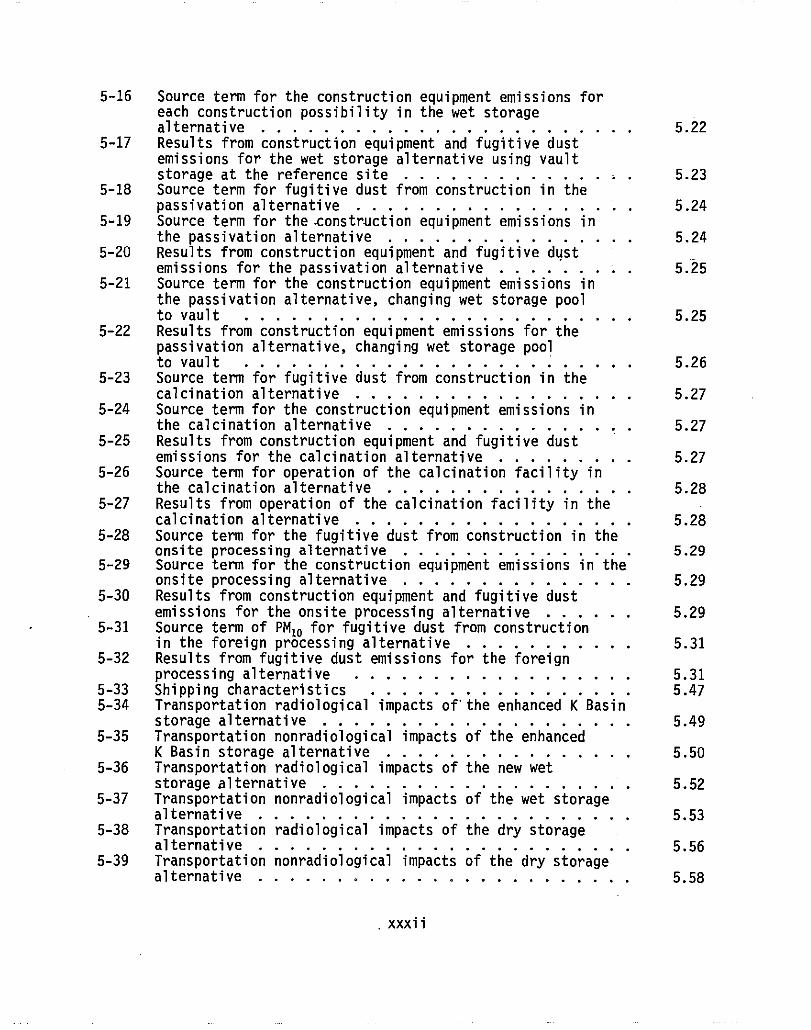
5-16 Source term for the construction equipment emissions foreach construction possibility in the wet storagealternative . . . . . . . 5.22
5-17 Results from construction equipment and fugitive dustemissions for the wet storage alternative using vaultstorage at the reference site . . . . . . . . . 5.23
5-18 Source term for fugitive dust from construction in thepassivation alternative . . . . . . . . 5.24
5-19 Source term for the-construction equipment emissions inthe passivation alternative . . . . 5.24
5-20 Results from construction equipment and fugitive dustemissions for the passivation alternative . . . 5.25
5-21 Source term for the construction equipment emissions inthe passivation alternative, changing wet storage poolto vault . . . . . . 5.25
5-22 Results from construction equipment emissions for thepassivation alternative, changing wet storage pool
...... .... . ......to vault. . . 5.265-23 Source term for fugitive dust from construction in the
calcination alternative . . . 5.275-24 Source term for the construction equipment emissions in
the calcination alternative . 5.275-25 Results from construction equipment and fugitive dust
emissions for the calcination alternative . . 5.275-26 Source term for operation of the calcination facility in
the calcination alternative. 5.285-27 Results from operation of the calcination facility in the
calcination alternative . . . . . 5.285-28 Source term for the fugitive dust from construction in the
onsite processing alternative . 5.295-29 Source term for the construction equipment emissions in the
onsite processing alternative . . . . . . . . 5.295-30 Results from construction equipment and fugitive dust
emissions for the onsite processing alternative . . . 5.295-31 Source term of PM10 for fugitive dust from construction
in the foreign processing alternative . . . . . 5.315-32 Results from fugitive dust emissions for the foreign
processing alternative . . . . . . . . . . . . . . . . . . 5.315-33 Shipping characteristics 5.475-34 Transportation radiological impacts of'the enhanced K Basin
storage alternative . . . 5.495-35 Transportation nonradiological impacts of the enhanced
K Basin storage alternative . . . . . . . . . . 5.505-36 Transportation radiological impacts of the new wet
storage alternative . . 5.525-37 Transportation nonradiological impacts of the wet storage
alternative . . . . . . . . . 5.535-38 Transportation radiological impacts of the dry storage
alternative . . 5.565-39 Transportation nonradiological impacts of the dry storage
alternative. . . . . . . . . . . . . . . . . . . . . . . . 5.58
xxxii
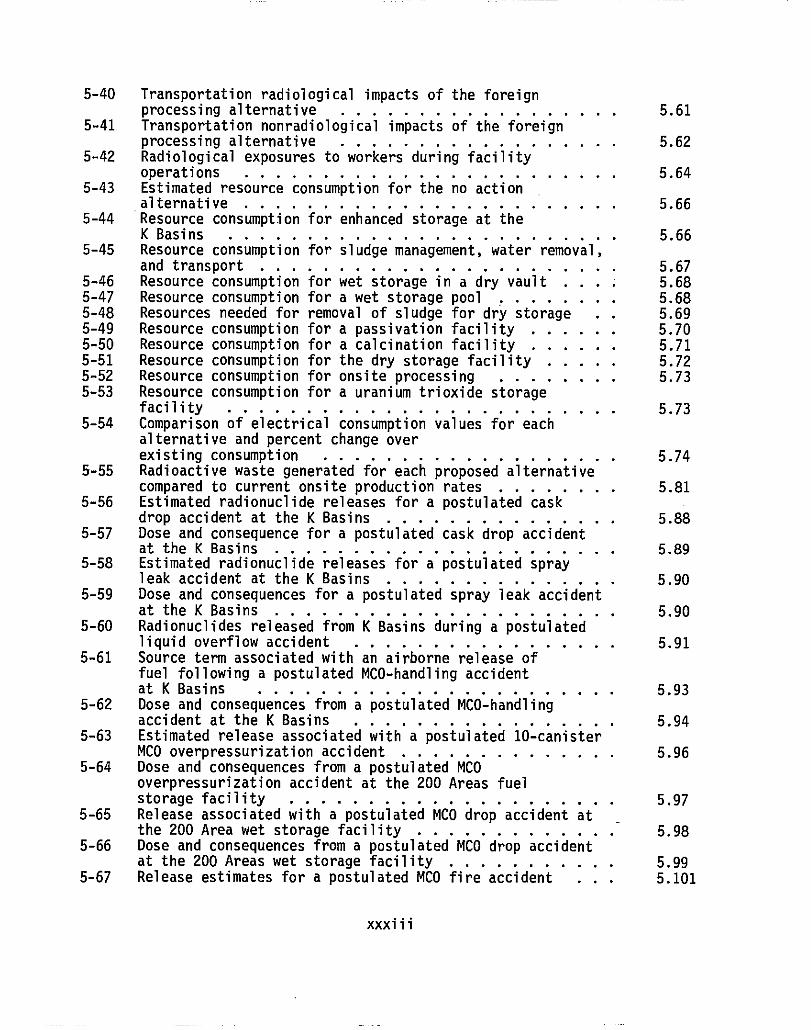
5-40 Transportation radiological impacts of the foreignprocessing alternative . . . . 5.61
5-41 Transportation nonradiological impacts of the foreignprocessing alternative . . . . . . 5.62
5-42 Radiological exposures to workers during facilityoperations 5.64
5-43 Estimated resource consumption for the no action ..alternative*.
5-44 Resource consumption fo.r enhanced storage at theK Basins 5.66
5-45 umResource consption for sludge management, water removal,and transport. . . . . 5.67
5-46 Resource consumption for wet storage in a dry vault . . . . 5.685-47 Resource consumption for a wet storage pool . . . . . 5.685-48 Resources needed for removal of sludge for dry storage . . 5.695-49 Resource consumption for a passivation facility . . . . . . 5.705-50 Resource consumption for a calcination facility . . . . . . 5.715-51 Resource consumption for the dry storage facility . . . . . 5.725-52 Resource consumption for onsite processing . . . . . . . 5.735-53 Resource consumption for a uranium trioxide storagefacility. . . . 5.73
5-54 umComparison of electrical consption values for eachalternative and percent change overexisting consumption . . . . . 5.74
5-55 Radioactive waste generated for each proposed alternativecompared to current onsite production rates . . . 5.81
5-56 Estimated radionuclide releases for a postulated caskdrop accident at the K Basins . . . . . 5.88
5-57 Dose and consequence for a postulated cask drop accidentat the K Basins . . . . . . . . 5.89
5-58 Estimated radionuclide releases for a postulated sprayleak accident at the K Basins 5.90
5-59 Dose and consequences for a postulated spray leak accidentat the K Basins . . . . . 5.90
5-60 Radionuclides released from K Basins during a postulatedliquid overflow accident . . . . 5.91
5-61 Source term associated with an airborne release offuel following a postulated MCO-handling accidentat K Basins . . . . . 5.93
5-62 Dose and consequences from a postulated MCO-handlingaccident at the K Basins. 5.94
5-63 Estimated release associated with a postulated 10-canisterMCO overpressurization accident . . . . . . . . 5.96
5-64 Dose and consequences from a postulated MCOoverpressurization accident at the 200 Areas fuelstoragefacility. .. ........ .. ..
5-65 Release associated with a postulated MCO drop accident atthe 200 Area wet storage facility. 5.98
5-66 Dose and consequences from a postulated MCO drop accidentat the 200 Areas wet storage facility. 5.99
5-67 Release estimates for a postulated MCO fire accident . . . 5.101
xxxiii
5-68 Dose and consequences from a postulated MCO fire accidentat the 200 Areas drying/passivation facility . . . 5.102
5-69 Dose and consequences for a postulated MCO fire accidentat the K Basins . . . . 5.104
5-70 Release estimate for a postulated dissolver fire at acalcination or process facility in the 200 Area . . 5.105
5-71 Dose and consequences from a postulated dissolver fire atthe 200 Area calcine or process facilities . . . . 5.106
5-72 Nonradiological exposure to public and workers duringa postulated accident . . . . . 5.110
5-73 Estimated occupational injuries, illnesses, and fatalitiesfor facility construction and operation . . . . . . . 5.114
5-74 Irreversible and irretrievable commitment of resources 5.1215-75 Location of minority and low-income populations
surrounding K Basins by distance and direction . . . 5.1305-76 Characterization of populations residing near candidatefacilities. . 5.134
5-77 Estimated transport and disposal costs for treated SNF 5.1425-78 Summary of the estimated 40-year storage costs and the
total life-cycle costs for disposition of K Basins SNF 5.143
xxxiv
1.0 INTRODUCTION
Approximately 2,100 metric tons (2,315 tons) of spent nuclear fuel (SNF)
are stored at the U.S. Department of Energy's (DOE's) Hanford Site in south-
east Washington State in SNF storage basins at the K East (KE) and K West (KW)
Reactors. This SNF is principally metallic uranium, but also includes about
5 metric tons (6 tons) of plutonium and about 1 metric ton (1.1 ton) of radio-
active fission products. For the most part, this fuel is from'the operation
of the N Reactor. Some of the SNF stored in the KE Basin is damaged, and it
has been estimated that about 1% of the original mass of the fuel has corroded
away and become radioactive sludge (Bergsman et al. 1995).
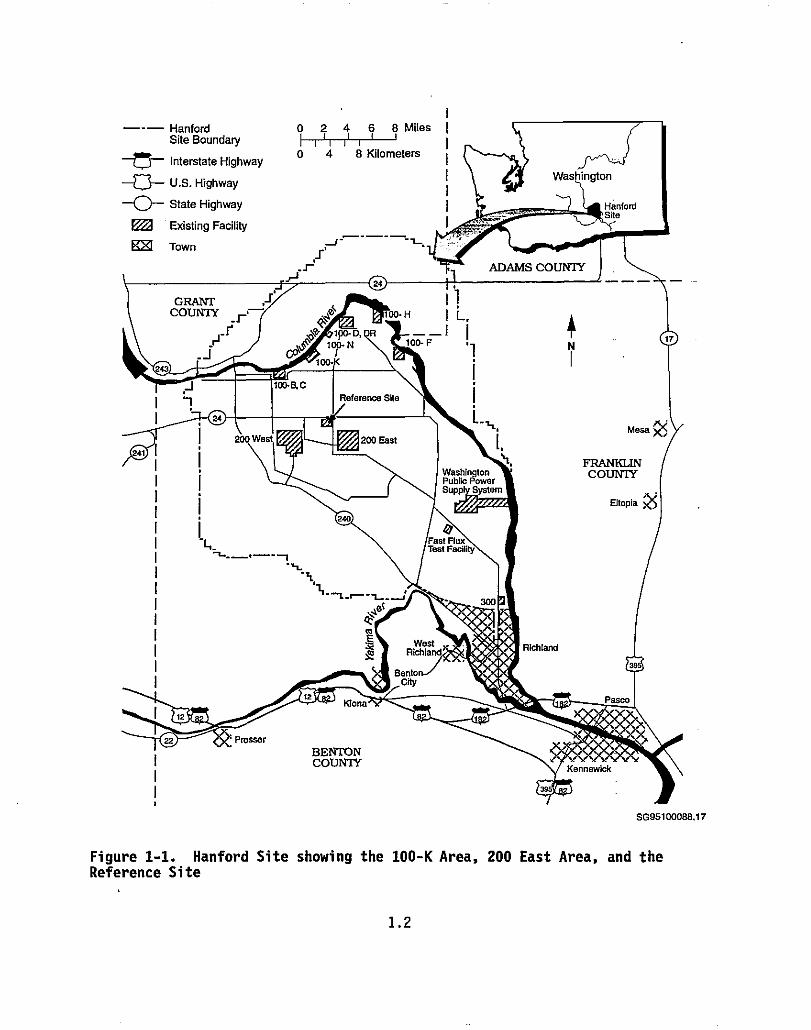
The KE and KW Reactors and their associated SNF storage basins were
constructed in the early 1950s and are located in the 100-K Area about 420 m
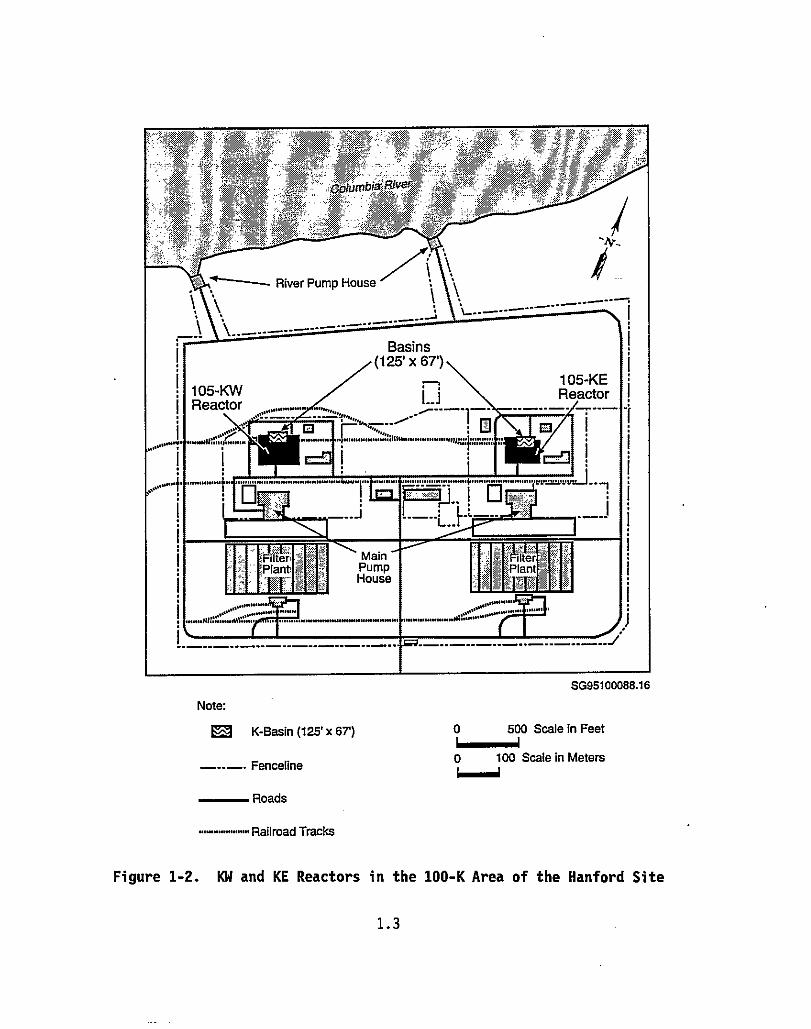
(1,400 ft) from the Columbia River (Figures 1-1 and 1-2). Spent nuclear fuel
has been stored in these basins since 1975 (KE) and 1981 (KW). The basins are
unlined concrete, 4.9 million-L (1.3 million-gal) water pools with an-
asphaltic membrane beneath each pool. The interior of the KW Basin has been
coated with epoxy. Approximately 1,200 metric tons (1,323 tons) of SNF are
stored in the KE Basin under water in 3,673 open canisters. This SNF has been
stored for varying periods of time ranging from 8 to 24 years. The fuel is
corroding and an estimated 50 m 3 (1,800 ft3) of sludge, containing radio-
nuclides and miscellaneous materials, has accumulated on the floor of the
KE Basin. The KE Basin has leaked water and radionuclides to the soil beneath
the basin, most likely at the construction joint between the foundation of the
basin and the foundation of the reactor. To mitigate the consequences of a
seismic event, the construction joint in each basin has recently been isolated
from the rest of the basin by metal isolation barriers.
Approximately 1,000 metric tons (1,102 tons) of SNF are stored in the
KW Basin under water in 3,817 closed canisters. Because the SNF was placed in
closed containers before storage, there is no appreciable sludge buildup on
the floor of the KW Basin. The KW Basin is not believed to be leaking.
Candidate areas evaluated in this environmental impact statement (EIS)
for the storage of SNF are shown in Figures 1-1 and 1-3.
1.1
--- HanfordSite Boundary
— Interstate Highway
43— U.S. Highway
^— State Highway
® Existing Facility
® Town
GRANTCOUNTY
r
0 2 4 6 8 Miles1^ 1 1
0 4 8 Kilometers
HanfordShe
ADAMS COUNTYza --- —
^^ 11C^100-H
i-D•
I I_i
N 100- F . N 17
eferone9 sne
Mesa/200 East -
FRANKLINWashington COUNTYPubtic Power
Sup Sys emEltopia
t+_
Richland
I W
<X Prosser
I COUNTYI
I
Kennewick
SG95100088.17
Figure 1-1. Hanford Site showing the 100-K Area, 200 East Area, and theReference Site
1.2
MIT
mbk'
-Ar-
River Pump House
Basins(125'x 67')
105-KW105-KEReactor
Reactor
. . ........ .
...... •..•.•.....L.. .•
... ... .......... . .. ... ........ . .
............. ... ......... .IIP 71
MainF "ie;VjpPlant Pump Plant
HousePlant
Z-4 ......................
SG95100088-16
Note:
EM K-Basin (125' x 67')
Fenceline
Roads
.... ..... ........ Railroad Tracks
0 500 Scale in Feet6=mmmmml0 100 Scale in Meters6.mmJ
Figure 1-2. KW and KE Reactors in the 100-K Area of the Hanford Site
1.3
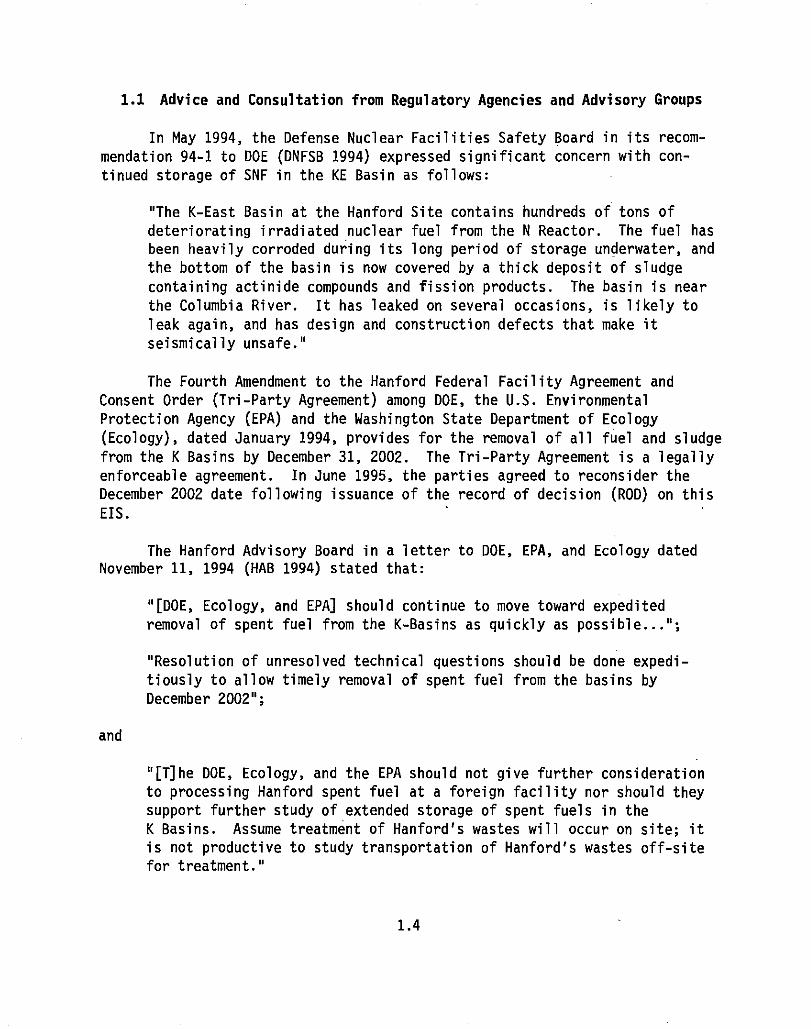
1.1 Advice and Consultation from Regulatory Agencies and Advisory Groups
In May 1994, the Defense Nuclear Facilities Safety Board in its recom-
mendation 94-1 to DOE (DNFSB 1994) expressed significant concern with con-
tinued storage of SNF in the KE Basin as follows:
"The K-East Basin at the Hanford Site contains hundreds of tons of
deteriorating irradiated nuclear fuel from the N Reactor. The fuel has
been heavily corroded during its long period of storage underwater, and
the bottom of the basin is now covered by a thick deposit of sludge
containing actinide compounds and fission products. The basin is near
the Columbia River. It has leaked on several occasions, is likely to
leak again, and has design and construction defects that make it
seismically unsafe."
The Fourth Amendment to the Hanford Federal Facility Agreement and
Consent Order (Tri-Party Agreement) among DOE, the U.S. Environmental
Protection Agency (EPA) and the Washington State Department of Ecology
(Ecology), dated January 1994, provides for the removal of all fuel and sludge
from the K Basins by December 31, 2002. The Tri-Party Agreement is a legally
enforceable agreement. In June 1995, the parties agreed to reconsider the
December 2002 date following issuance of the record of decision (ROD) on this
EIS.
The Hanford Advisory Board in a letter to DOE, EPA, and Ecology dated
November 11, 1994 (HAB 1994) stated that:
"[DOE, Ecology, and EPA] should continue to move toward expedited
removal of spent fuel from the K-Basins as quickly as possible...";
"Resolution of unresolved technical questions should be done expedi-
tiously to allow timely removal of spent fuel from the basins by
December 2002";
and
"[T]he DOE, Ecology, and the EPA should not give further consideration
to processing Hanford spent fuel at a foreign facility nor should they
support further study of extended storage of spent fuels in the
K Basins. Assume treatment of Hanford's wastes will occur on site; it
is not productive to study transportation of Hanford's wastes off-site
for treatment."
1.4
The Hanford Future Site Uses Working Group in its final report (HFSUWG1992) stated:
"To facilitate cleanup of the site, wastes from throughout the Hanford
site should be concentrated in the Central Plateau, which contains over
eighty percent of the known radionuclides on site."
1.2 DOE'S Programmatic Environmental Impact Statement on the Management of
Spent Nuclear Fuel
In June 1995, DOE published a ROD based in part on a final programmatic
environmental impact statement (PEIS), referred to as the DOE SNF Management
Programmatic Environmental Impact Statement (DOE SNF PEIS), on the management
of DOE-owned SNF located throughout the DOE complex (DOE 1995a). The DOE SNF
PEIS examined various locations in the United States for storing SNF for
approximately 40 years until decisions on ultimate disposition of the fuel are
made and implemented. Ultimate disposition of the fuel includes storage of
the fuel in a geologic repository or processing of the fuel to remove uranium,
plutonium, and other metals as resources and disposing of the fission product
waste in a geologic repository. In its ROD on SNF management, DOE elected to
implement the "regionalization by fuel type" alternative. Under that alter-
native, SNF located in the Hanford K Basins will remain at Hanford until a
decision is made on ultimate disposition of the SNF.
1.3 DOE'S Environmental Impact Statement on the Management of Spent Nuclear
Fuel from the K Basins at the Hanford Site
In March 1995, DOE announced its intent to prepare a site-specific EIS
on the management of SNF currently located in the K Basins at the Hanford Site
(DOE 1995b). This EIS, called the Environmental Impact Statement on Manage-
ment of Spent Nuclear Fuel from the K Basins at the Hanford Site, is tiered
from the DOE SNF PEIS in accordance with Council on Environmental Quality
regulations (40 CFR 1502.20 and 1508.28). Under the tiering process, infor-
mation that appears in the programmatic EIS may be summarized in the tiered
EIS and need not be repeated in detail. Therefore, some information that
might ordinarily be presented in this EIS is incorporated by reference from
the DOE SNF PEIS.
1.4 Other Environmental Documents Directly Related to the K Basins EIS
DOE prepared an environmental assessment (EA) in 1992 (DOE 1992b) to
evaluate the environmental impacts of placing all of the SNF currently stored
1.5
in open canisters in the KE Basin in sealable canisters and of placing SNF
currently stored in Mark I canisters in the KW Basin in sealable canisters.
A finding of no significant impact (FONSI) was issued, but these.actions have
not been carried out.
DOE prepared an EA in 1995 (DOE 1995f) to evaluate the environmental
impacts of characterizing SNF currently stored in the K Basins. A FONSI was
issued and the work is currently under way. The purpose of characterization
is to evaluate the physical and chemical condition of the stored SNF to assist
in the evaluation of alternative methods of treating and safely storing the
SNF for up to 40 years.
DOE prepared an EA in 1995 on the transfer of SNF from the Plutonium and
Uranium Recovery through EXtraction (PUREX) Plant and the N Reactor to the KE
and KW Basins (DOE 1995g). A FONSI was issued for this action and DOE is
presently carrying out these actions.
DOE is currently preparing an EIS on the Tank Waste Remediation System
which will examine the continued management and eventual treatment, storage,
and disposal of high-level radioactive wastes stored in tanks at Hanford.
1.5 Results of the Scoping Process
On March 28, 1995, DOE published a notice of intent (NOI) in the Federal
Register to prepare an EIS on the Management of Spent Nuclear Fuel from theK Basins at the Hanford Site (DOE 1995b).
In the NOI, the DOE stated that its proposed action is to take expedi-
tious action to reduce risks to public health and the environment by removing
SNF from the K Basins and, subsequently, to take action to manage the SNF in a
safe and environmentally sound manner for up to 40 years or until ultimate
disposition decisions are made and implemented.
The NOI initiated a scoping process that ended on May 12, 1995. The
purpose of scoping is to determine whether or not there are any actions,
alternatives, or impacts that should be considered in the EIS that were not
already listed in the NOI (40 CFR 1508.25). The results of the scoping
process are presented in DOE's implementation plan, which was published in
October 1995 (DOE 1995c). In summary except for cask storage, no new
1.6
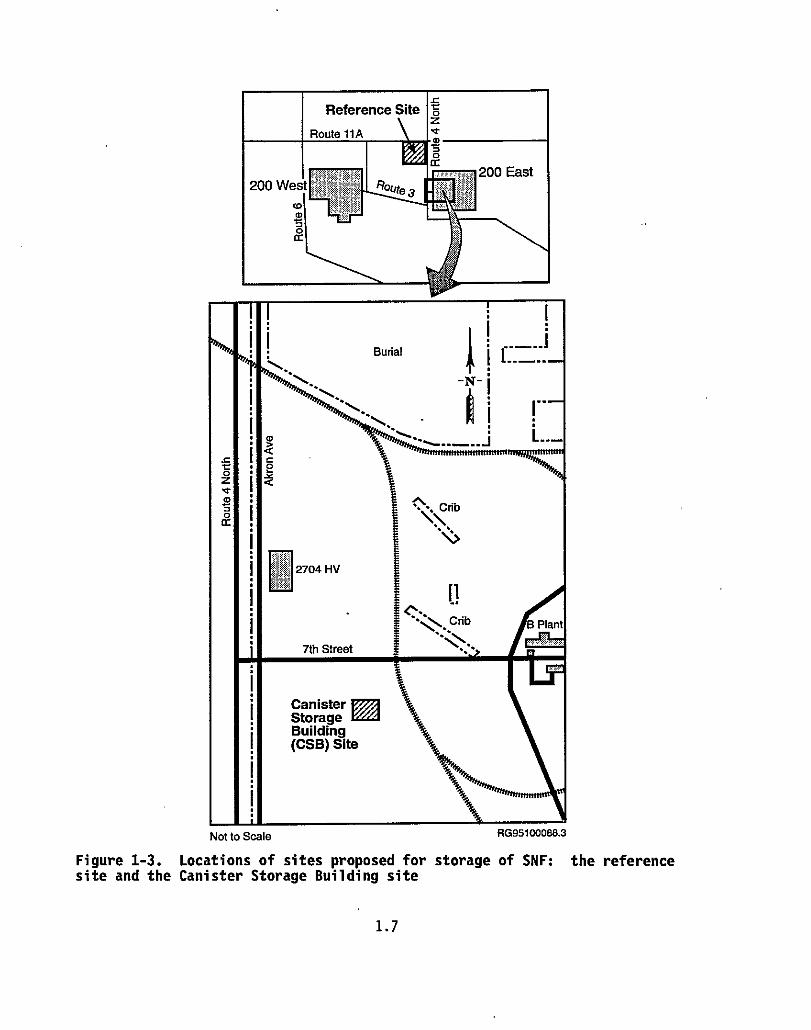
rReference Site oz
Route 11A 'pm00Cr
ix xx= x $ 200 East200 West.: €¢ t y Route
€a ^$$
m ss€^^.$d=,x.
0cc
Bu rial I
\. -N-i
tC I Q mmmmc2
mZ
IYd
a
ccC rib
.v
^t=& 2704 HVMI
^l
i '•\\, C rib <Plan't
7th Street
iLX
CanisterStorageBuilding(CSB) Site
Not to Scale RG95100088.3
Figure 1-3. Locations of sites proposed for storage of SNF: the referencesite and the Canister Storage Building site
1.7
actions, alternatives, or impacts were identified. Some alternatives sug-
gested during the scoping process were dismissed from detailed discussion, as
follows:
• Storage of SNF at the Washington Public Power Supply System abandoned
plant WNP-4, the N Reactor, or the Fast Flux Test Facility (FFTF). The
WNP-4 spray cooling pond, like the K Basins, has the disadvantage of
being near the Columbia River. The N Reactor Basin is not large enough
to accommodate K Basin fuel and is also near the river. The FFTF is
less isolated from groundwater and population centers than the 200 Area.
• Storage of SNF at Hanford for up to 500 years rather than for 40 years.
Although storage of SNF at Hanford for up to 500 years might be possi-
ble, present designs are extendable to only about 75 years. The 40-year
period analyzed in this EIS and alternative disposition of SNF would not
preclude further design and later adoption of a longer interim-storage
period, if warranted. However, DOE's policy is to provide for long-term
SNF storage in a geologic repository -(DOE 1995d).
1.6 Other Issues
Metallic uranium is thermodynamically unstable with respect to its
common oxides and with respect to uranium hydride. Similarly uranium
hydride is thermodynamically unstable with respect to the oxides of uranium
(Latimer 1952). These reactions require a supply of oxygen (air or water) tobegin and to continue. The kinetics (rapidity) of the reactions depend on a
number of other factors including the temperature of the uranium and the state
of aggregation of the uranium (the larger the ratio of surface area to volume
the more rapid the reaction). Under some conditions, metallic uranium can
catch fire. This property was noted in testimony on the DOE SNF PEIS (BNFL
1994) and is discussed in the technical information document prepared by
Westinghouse Hanford Company for the K Basins SNF EIS (Bergsman et al. 1995).
This instability is of technical concern for the future management of K Basins
SNF, as are two other well-known properties of SNF. These other properties
are the intense radioactivity of SNF and the ability in certain geometric
configurations to initiate (but not sustain) a nuclear reaction. For the
purposes of this EIS, it is only necessary to determine the impacts of these
properties during routine operations and under reasonably foreseen accident
conditions. These impacts are evaluated in the EIS.
1.8
1.7 Record of Decision
Following final publication of the EIS, the DOE will publish an ROD on
management of K Basins SNF at the Hanford Site. This ROD will be based in
part on environmental impact information presented in this EIS. The ROD will
also be based on information outside the scope of this EIS, for example,
engineering feasibility information, the factors discussed in Section 1.6, and
information on criteria for acceptance of DOE-owned SNF at a repository, which
have not yet been fully determined.
1.9
2.0 PURPOSE AND NEED
The purpose of and need for DOE's action is to reduce risks to human
health and the environment, specifically 1) to prevent the release.of radio-
active materials into the air or the soil surrounding the K Basins and the
potential migration of radionuclides through the soil column to the nearby
Columbia River, 2) to reduce occupational radiation exposure, and 3) to elim-
inate the risks to the public and to workers-from the-deterioration of SNF in
the K Basins (DOE 1995b).
2.1
Summary of Alternatives
3.0 DESCRIPTION OF ALTERNATIVES AND COMPARISON OF IMPACTS AMONG THE
ALTERNATIVES
Proposed Action:
DOE's proposed action is to reduce risks to public health and safety and
the environment by removing SNF from the K Basins and, subsequently, to manage
the SNF in a safe and environmentally sound manner for up to 40 years or until
ultimate disposition decisions are made and implemented.
A range of alternatives for removal, staging, treatment, and subsequent
management of K Basins SNF is described and compared in this chapter. A sum-
mary description of the alternatives is given in Section 3.1, details of the
alternatives are provided in Section 3.2 with additional details in Appen-
dix A, and a comparison of impacts among the alternatives is given in
Section 3.3. Further detail is provided in Bergsman et al. (1995).
3.1 Summary Description of Alternatives
The alternatives together with their principal functional advantages and
disadvantages are summarized as follows:
• no action alternative: continue present storage in the KE and KW Basins
for up to 40 years with no modifications except for maintenance, moni-
toring, and ongoing safety upgrades. (Consideration of the no actionalternative is required by Council on Environmental Quality regulations
(40 CFR 1502.14).]
The principal advantage of the no action alternative is that it would
require no movement of SNF and no construction of new facilities.
The principal disadvantages of this alternative are that the K Basins
were never designed for an 80-year life (40 years to date and up to an
additional 40 years) and would require increasing maintenance of aging
facilities with associated increased radiological impacts on workers,
would not place the SNF in a safer storage configuration, would not
preclude leakage of radionuclides to the soil beneath the basins and
near the Columbia River, would fail to alleviate concerns expressed by
authoritative bodies and the public relative to environmental impacts
induced by seismic events, and would not satisfy the Hanford FederalFacility Agreement and Consent Order (Tri-Party Agreement) commitments.
W
Summary of Alternatives
enhanced K Basins storage alternative: perform facility life extension
upgrades for KW Basin, containerize KE Basin SNF and sludge, and consol-
idate with KW Basin SNF for up to 40-year storage.
The principal advantages of the enhanced K Basins storage alternative
are that it would remove degrading SNF from the KE Basin, permit deac-
tivation of the KE Basin, and would require no construction of new
facilities.
The principal disadvantages of this alternative are that the K Basins
were never designed for an 80-year life and would require increasing
maintenance of the aging facilities despite completion of practical
upgrades, would not arrest continued fuel degradation and might result
in production of uranium hydride in the transferred KE Basin SNF, would
fail to alleviate concerns expressed by authoritative bodies and the
public relative to environmental impacts induced by seismic events, and
would not satisfy Tri-Party Agreement commitments.
• new wet storage alternative: remove SNF from the K Basins and provide
for up to 40 years of new wet storage in a new facility that meets
current design criteria.
The principal advantages of the new wet storage alternative would be
accelerated removal of SNF from aging facilities near the Columbia
River, would make use of a proven storage technology coupled with design
to modern seismic criteria, and would maintain flexibility for preparing
SNF for ultimate disposition.
The principal disadvantages -of this alternative are that it would
require construction expense and continued maintenance, would reduce but
not prevent the continuation of SNF degradation, and would not eliminate
the potential for further hydriding of the SNF.
• drying/passivation (conditioning) with dry storage: remove SNF from the
K Basins, condition [i.e., dry (remove free and bound water)], oxidize
exposed reactive areas of the fuel under controlled conditions, seal in
canisters filled with an appropriate storage atmosphere, and provide for
up to 40-year dry storage in a new vault or cask facility.
3.2
Summary of Alternatives
Drying/passivation (conditioning) with dry vault storage, incorporating
the options shown below, represents DOE's preferred alternative:
• remove K Basin SNF from existing canisters, clean, and desludge
• repackage the SNF into fuel baskets designed for multicanister
overpack (MCO) dimensions, which would include provision for water
removal, SNF conditioning requirements, and.criticality control
• after loading SNF into the MCOs, welding on the top, and draining
the MCOs through small penetrations on the top, initially dry the
SNF under vacuum at approximately 50°C (120°F), flood MCOs with
inert gas, seal penetrations, and place in transportation casks
• transport the SNF (in MCOs) in these casks via truck to the
Canister Storage Building (CSB) site in the 200 East Area, and
provide for temporary vented staging, as necessary
• vacuum condition the SNF in MCOs, as soon as practicable, heating
the SNF to about 300°C (570°F) to remove water that is chemically
bound to the SNF and canister corrosion products, .and to dissoci-
ate any reactive uranium hydride present
• following conditioning, weld-seal the SNF in an inert gas in the
MCOs for dry interim storage in a vault for up to 40 years
• collect the sludge removed from basins and disposition as waste in
Hanford's double-shell tanks (DSTs) after removal from the basin
• collect the debris from the basins and dispose of as low-level
waste in Hanford's existing low-level waste burial grounds
• remove and transport contaminated basin water to the 200 Area
Effluent Treatment Facility (ETF) for final disposal at the
200 Area State-Approved Land Disposal Site (SALDS), and replace
the contaminated basin water with clean water, maintaining basin
water levels. (Eventually all basin water would be removed as
part of facility deactivation activities.)
• prepare the K Basins for deactivation and turn over to decontam-
ination and decommissioning program.
3.3
Summary of Alternatives
The principal advantage of the drying/passivation (conditioning) with
dry storage alternative (either vault or cask) is that it would accel-
erate removal of SNF from aging facilities near the Columbia River,
would result in passive dry storage of SNF requiring only minimal
surveillance, would retard continued degradation of the SNF, and would
reduce or eliminate hydrides in the SNF.
Principal disadvantages of this alternative are that new facilities
would be required and some uncertainties exist regarding the chemical
state and pyrophoric nature of the SNF and sludge in the KE andKW Basins, and the extent to which drying and passivation processes
would be required to successfully reach the desired end state. Defense-
in-depth measures (multiple barriers to prevent or mitigate the release
of radionuclides) can be engineered to ensure the safety of the process;
characterization of K Basins SNF is currently being conducted to reduce
these uncertainties and make possible a more cost-effective conditioning
process.
• calcination with dry storage: remove SNF from the K Basins, calcine,
and provide for up to 40-year dry storage of SNF-oxides in a new cask or
vault facility.
The principal advantage of the calcination with dry storage alternative
is that it would convert the SNF into stable oxides, which are readilystorable in a dry form and may be suitable without further processingfor ultimate disposal in a geologic repository.
The principal disadvantage of this alternative is the need to construct
and operate a new calcining facility.
• onsite processing: remove and chemically process K Basins SNF and pro-vide for up to 40-year dry storage of the recovered uranium (as uranium
trioxide) and plutonium (as plutonium dioxide), and manage fission
product waste in Hanford's DSTs.
The principal advantages of the onsite processing alternative are that
it converts uranium (the major constituent of SNF) into uranium trioxide
that is rpadily storable in dry form and for which future use (consti-
tuent of power reactor fuel) might be found; converts plutonium to a
stable oxide for which a future use (constituent of power reactor fuel)
might be found or for which storage in a geologic repository may be
suitable without further processing; and converts fission products into
a form suitable for storage in a geologic repository.
3.4
summary of Alternatives
The principal disadvantages of this alternative are the need to con-
struct and operate a relatively expensive separations facility, the
plutonium dioxide product is no longer self-protecting and would require
special storage and accountability that in turn may require construction
of additional storage capacity, and no immediate need exists for either
the separated uranium or plutonium.
foreign processing: remove K Basins SNF, ship overseas for processing,
provide for up to 40-year dry storage of returned uranium (as uranium
trioxide) and plutonium (as plutonium dioxide), and store vitrified
fission product waste, pending ultimate disposition.
With the exception that foreign processing would obviate the need for
construction of additional processing facilities at Hanford, the prin-
cipal advantages of the foreign processing alternative are essentially
the same as those for onsite processing.
The principal disadvantages of the foreign processing alternative are
the need to transport Hanford's SNF to 'a U.S. shipping/receiving port,
transload the SNF to ocean vessels, ship the SNF to a foreign port,
transport the SNF to an operating reprocessing plant, and ship the
uranium and plutonium products and vitrified high-level waste back to
Hanford. Additional disadvantages include uncertainties about the
feasibility of shipping the degraded fuel overseas, costs of new ship-
ping casks, and construction of a new head-end facility at the proces-sing plant. The need for special storage for plutonium product would be
the same as in the onsite processing alternative.
In all but the no action alternative, sludge, debris, and existing
contaminated water would be removed from the basins and although there are
options for their treatment, those options are essentially invariant among the
alternatives. To facilitate expedited removal of the SNF from the K Basins,
all alternatives, except for the no action and enhanced K Basins storage
alternatives, would likely use some form of temporary storage (staging) at the
CSB site or the reference site. In the case of the new wet storage-alterna-
tive, staging would not be necessary.
The CSB site within the 200 East Area is DOE's preferred site for new
facilities for interim storage of SNF. The quarter-section reference site
located adjacent to the north-west corner of the 200 East Area (see
Figure 1-3) is an alternative site taken to be representative of a number of
3.5
Details of Alternatives
possible alternative sites [previously disturbed (inside 200 East or 200 West
Areas) or undisturbed] on the 200 Areas plateau which may have equivalent
attributes for siting new facilities for interim storage of SNF.
For reasons described in Section 3.1.8, the following alternatives were
considered but dismissed from detailed evaluation:
• WNP-4 wet storage: remove K Basins SNF and transfer to wet storage in
modified WNP-4 Spray Cooling Pond.
• N Reactor Basin storage: remove K Basins SNF and transfer to wet
storage in N Reactor Basin.
• FFTF/Fuels and Materials Examination Facility (FMEF) storage: remove
K Basins SNF and transfer to dry storage at the FFTF/FMEF.
• offsite disposition: remove K Basins SNF and transfer to another DOE
site for storage and/or processing.
3.2 Details of Alternatives
Details of the alternatives evaluated are presented in the following
subsections. In each of the alternatives there are a number of options that
could be taken to accomplish the same objective and that would have similar
impacts within that alternative. The descriptions that follow are intended to
provide a general description of what might be done and to permit encompassing
the associated environmental impacts. These should not be construed as the
exact process steps that would be performed if an option were selected (e.g.,
operating temperatures, inert gases, etc., may change during process
development).
3.2.1 No Action Alternative
In this alternative, present storage in the K Basins would continue for
up to 40 years with no modifications except for maintenance, monitoring, and
ongoing safety upgrades (analysis of the no action alternative is required by
40 CFR 1502.14). Current activities to maintain and operate the K Basins
would continue, for example:
• completing day-to-day activities required to maintain storage of
K Basins SNF in conformance with the existing safety authorization basis
3.6
No Action Alternative
• providing requisite control and accountability of special nuclear
materials in the K Basins in conformance with DOE Orders
• establishing and maintaining a program at the K Basins to improve safetyof ongoing operations
• improving water cleanup by providing redundant systems to ensure that
adequate ion exchange capability is always available
• minimizing loading of the ion exchange modules with transuranic (TRU)
radionuclides thereby reducing the amount of TRU waste requiring
disposal
• retrieving, packaging, and shipping samples of K Basins SNF and sludgeto other Hanford Site facilities for characterization
Upgrades to four essential systems at the K Basins would be completed asfollows:
• water supply and distribution system: the 100-K Area water supply anddistribution upgrade would replace the existing oversized (because the
reactors are shut down) and inefficient system and result in a reliable,
energy-efficient source of clean water for area operations. The
upgraded water supply system would be sized to accommodate operational
consumption that is anticipated to be 110 m 3 (30,000 gal) or less perday.
• fire protection system: fire protection for the 100-K Area needs to be
upgraded to bring the fire protection systems in the operational areas
of 105-KE, 105-KW, and 190-KE into compliance with fire protection pro-gram requirements. This activity would consist of installing automatic
fire suppression systems and fire protection features in the KE Reactor,KW Reactor, 165-KE, and 190-KE buildings.
• 100-K Area electrical supply system: this proposed upgrade would con-
solidate the 4,160-volt distribution system into the 151-KE sub-stationyard and the 165-KE distribution switchboards, with feeds to the KE andKW Buildings. The upgrade would also reconfigure the motor controlcenters in the KE and KW Buildings.
3.7
Enhanced Storage Alternative
• maintenance shop/support facility: this activity would result in rest-
room upgrades and other minor repairs of the existing 1717-K maintenance
building. Additional shop space would be provided by a new 500 m2
(5,000 ft') building built adjacent to the 1717-K Building.
In addition to the above listed activities, roof upgrades will be
completed for KE and KW buildings.
Also, work would be carried out to reduce the radiation levels in the
storage bays and the surrounding pits, which in turn would reduce worker dose.
Activities could include high-pressure pipe cleaning, coating basin walls,
installing of shielding, and possibly replacing facility components.
Aside from the above activities, if the no action alternative were
selected, SNF in KW and KE Basins would continue to be stored as at present.
The SNF inventory would include material currently in the Plutonium and
Uranium Recovery through EXtraction (PUREX) Plant and N Basin.
3.2.2 Enhanced K Basins Storage Alternative
Enhanced K Basins storage would involve consolidation of the SNF in the
KW Basin and would include the upgrade activities identified in Section 3.1.1
and the following reference options (a set of options likely to be selected,
if DOE were to choose this alternative). SNF would not be removed from the
100-K Area:
• containerize fuel to isolate KE Basin SNF from the basin water
• consolidate K Basins SNF at the KW Basin
• manage sludge; collect sludge from KE Basin and transfer to the tank
farms
• remove debris from basins and dispose of it in existing low-level waste
burial grounds
remove and transport contaminated KE basin water to the 200 Area ETF for
final disposal at the 200 Area SALDS, and replace the contaminated basin
water with clean water, maintaining basin water levels. (Eventually all
basin water would be removed as part of facility deactivation
activities.)
3.8
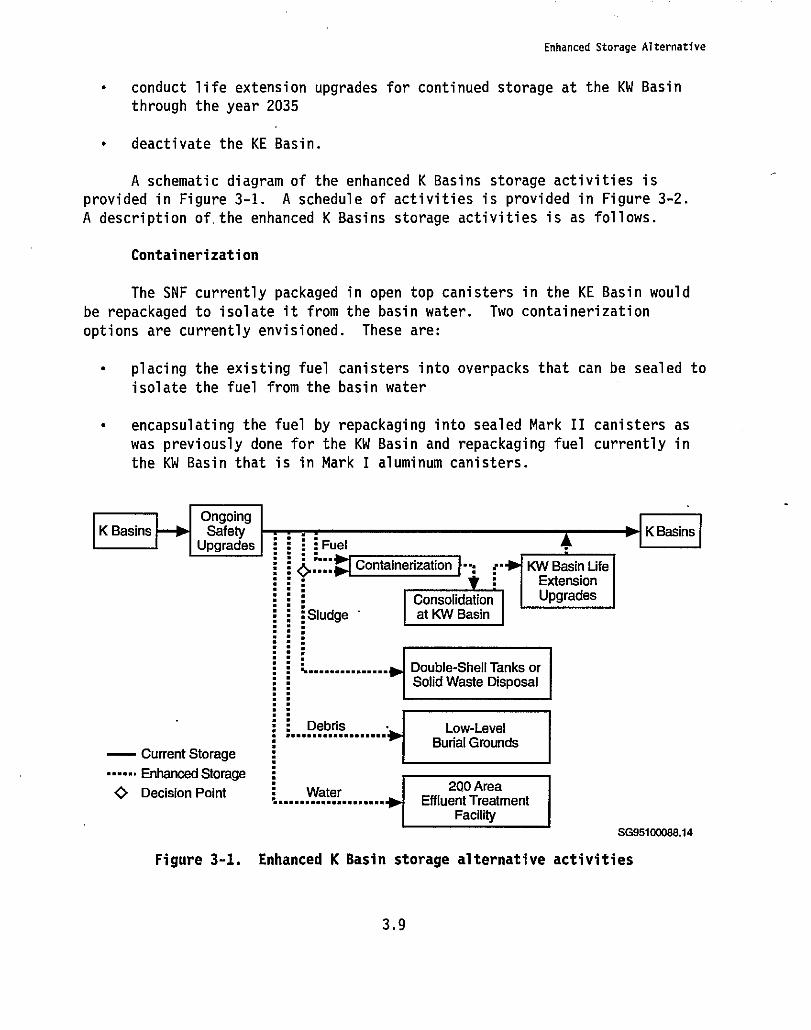
Enhanced Storage Alternative
• conduct life extension upgrades for continued storage at the KW Basin
through the year 2035
• deactivate the KE Basin.
A schematic diagram of the enhanced K Basins storage activities is
provided in Figure 3-1. A schedule of activities is provided in Figure 3-2.
A description of.the enhanced K Basins storage activities is as follows.
Containerization
The SNF currently packaged in open top canisters in the KE Basin would
be repackaged to isolate it from the basin water. Two containerization
options are currently envisioned. These are:
• placing the existing fuel canisters into overpacks that can be sealed to
isolate the fuel from the basin water
• encapsulating the fuel by repackaging into sealed Mark II canisters as
was previously done for the KW Basin and repackaging fuel currently in
the KW Basin that is in Mark I aluminum canisters.
OngoingK Basins & , mii .. K Basins
Upgrades r: _ Fuel
b;;;; Containerization r • ; : • KW Basin LifeExtension
Consolidation Upgrades
:Sludge at KW Basin
............... Double-Shelf Tanks orSolid Waste Disposal
Debris Low-LevelBurial Grounds
Current Storage
•••••. Enhanced Storage
O Decision Point : Water200 Area.................... Effluent TreatmentFacility
SG95100088.14
Figure 3-1. Enhanced K Basin storage alternative activities
W
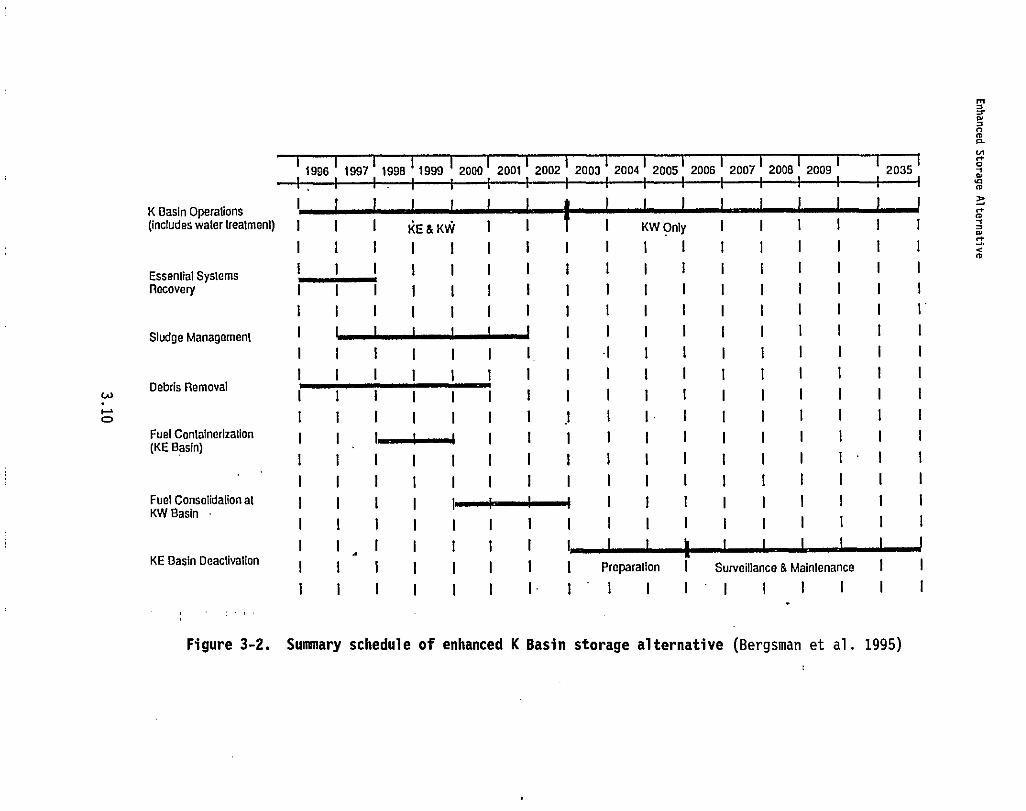
msanmnNKOa
aM
w
m
wC)C)
1996 1997 1996 1999 2000 2001 2002 2003 2004 2005 2006 2007 2000 2009 2035
h I F—I—^—t—I—I-1—+ 1 +--I
K Basin Operations(includes water treatment) I I I KE & KVi I I I KW Only I I I I I 1
I I I I 1 I I I I I I I I I I I I
Essential Systems 1^^ I I I I I I I 1 I I I I I IRecove ry I I I I I I I I I 1 I I I I I I I
i I I I I I I i I I I I I I I I I'
Sludge Management I t t t t t I I I I I I I I I I
I I 1 I I I I I I I I I I I I I I
i I I I I I I I I I I I I I I I I
Debris Removal I I I I I I i I I I I I I I I I 1
1 I I I I I I 1 I I I I I I I I I
Fuel Conlainerization I I I {. a I i I I I I I I I I I I(KE Basin)
I I I I I I I i I I I I I I I I I
I I I 1 I I i I I I I I I I I I I
Fuel Consolidation at ( I I I I^^^ I I I I I I I I IKW Basin
I I i I I I I I I I I I I I I 1 I
i I I I i I I I^^ t I Y I I I I I I
KE Basin Deactivation I I I I I I I I Preparation I Surveillance & Maintenance I I
I i I I 1 I I i l I I I I I I I I
Figure 3-2. Summary schedule of enhanced K Basin storage alternative (Bergsman et al. 1995)
Enhanced Storage Alternative
Containerization would likely involve overpacking existing canisters;
however, the EIS impact analysis is based on a previous proposal involving
encapsulation (DOE 1992b) because the earlier analysis provides a more conser-
vative estimate of overall impacts, which would likely bound the impacts for
overpacking (i.e., the impacts of encapsulation would be greater than the
impacts of overpacking existing containers).
Repackaging or overpacking equipment would be installed at the basins.
Pieces of SNF and SNF fines too small to be retrieved [<0.64 cm (1/4 in.)]
would be placed in a container and dispositioned with the sludge.
Consolidation
Containerized SNF from KE Basin would be consolidated with SNF in
KW Basin. Consolidation would include:
• installation of new multitiered storage racks in the KW Basin and making
minor facility modifications to increase SNF storage capacity
• transfer of containerized fuel from the KE Basin to the KW Basin
• disposition of excess KW Basin water [approximately 280 m3
(10,000 ft3)], which would be displaced by the addition of the new
storage racks; handled through temporary higher water levels and
evaporation losses.
Sludge Management
The KE Basin contains sludge, which is located outside fuel canisters as
well as inside. The sludge located outside of the fuel canisters contains
fuel corrosion products and small fuel pieces that have fallen out - of the
perforated bottoms of canisters or were released during fuel sorting and
repackaging activities. The sludge also contains iron and aluminum oxide from
the storage racks and canisters, concrete grit from the basin walls, fission
and activation products from the fuel, and other materials (including sand and
dust from the outside environment). The estimated volume of this sludge is
about 50 m3 (1,800 ft3). The sludge contained in the open canisters is
assumed to contain fuel corrosion products that have mixed with dust and
debris.
The KW Basin also contains sludge located outside of fuel canisters as
well as inside. Visually, the sludge that is located outside of the sealed
fuel canisters appears to consist primarily of dust that has been deposited on
3.11
Enhanced Storage Alternative
the floor since use of the facility was restarted following coating with
epoxy. The estimated volume of sludge is 4 m 3 (140 ft3). The sludge inside
of the sealed fuel canisters is assumed to consist primarily of fuel corrosion
products.
For the enhanced K Basins storage alternative, sludge within the canis-
ters would not be segregated; it would be left in the canisters and managed as
SNF. The sludge on the floor of the KW Basin is expected to be categorized as
low-level waste upon removal from the basin. It would be grouted (mixed with
cementitious material) at the K Basins and transported to the 200 Area for
disposal at the Solid Waste Operations Complex, or it may be transported
similarly to other sludge for management at the tank farms.
Two sludge management options exist for the KE Basin floor sludge under
the enhanced K Basins storage alternative. The options would be to transfer
the floor sludge to Hanford's DSTs or solid waste disposal facilities,
depending on material characteristics, or continue management of sludge as SNF
and transfer the sludge to the KW Basin. The KE Basin floor sludge transfer
to tank farms is presented as the representative approach for managing the
KE Basin floor sludge as waste.
Waste categories that the sludge may fit into are mixed and/or trans-
uranic. The actual category associated with each type of sludge would be
determined through a characterization process.
The actions required for sludge management assuming disposition to DSTs
would be as follows.
1. retrieval of the sludge: sludge may be retrieved using manually oper-
ated equipment, remotely operated equipment, or a combination of the
two. Because sludge is intermixed with basin components, sludge
retrieval in some cases would be integrated with activities associated
with fuel, debris, and water management.
2. separation/segregation of the sludge: sludge in the basins varies con-
siderably from light flocculent particles that are easily suspendable to
heavy granules and chunks of fuel or cladding. The sludge on the floor
of the K Basins also contains debris. Because no single process may be
suitable for all of these materials, some separation/segregation may be
appropriate. Separation/segregation would be performed within the
K Basins buildings.
3.12
Enhanced Storage Alternative
3. loading and transporting sludge: sludge meeting DST acceptance criteria
would be loaded into a 3- to 6-m3 (100- to 200-ft 3) shielded, high-
integrity container for transportation to the 200 East Area tank farms.
Load-out operations would be performed at the K Basins facility. The
load-out area would include installation of a spill pad and a weather
shell to permit year-round operation. Connection of the load-out system
to the transport container may be a manual operation; however, the load-
out system would be expected to be remotely operated. For purposes of
this analysis it is assumed that KE Basin floor sludge would meet DST
acceptance criteria, with separation of unacceptable particle sizes, if
necessary. The transport container would be transported using a stan-
dard, "low-boy" trailer. The transport vehicle would use existing
roads, none of which are open to the general public. If the sludge were
to be transported to tank farms, 50 to 100 shipments are assumed to be
required. If the floor sludge were to be transported to the KW Basin
for continued storage, approximately 2,000 Mark II containers are-esti-
mated to be required.
4. offloading sludge at 200 Areas tank farms: sludge transported to the
tank farms would be unloaded by directly pumping the contents of the
transport container into a DST riser. A spill pad and associated piping
and controls would be installed. The transport container is assumed to
be manually connected to the offloading system and that offloading
operations would be performed remotely. Also, some chemical adjustment
is assumed to be required to make sludge suitable for storage in a tank,
e.g., adjustment of pH. Small adjustments with chemicals, such as
hydroxide, nitrite, and nitrate, would be likely be performed during the
offloading process. Any spills or drips would be contained within a
concrete spill pad and pumped into the DST.
If a decision were made to manage the sludge (currently dispersed
throughout the K Basins) as SNF, the sludge would be containerized and moved
to the KW Basin.
Debris Removal
Debris in the K Basins includes discrete non-SNF items such as empty
canisters or other equipment and the storage racks used to hold the SNF
3.13
Enhanced Storage Alternative
canisters. Debris is defined as anything that is over 0.6 cm (1/4 in.)Ia)
in diameter that is not physically attached to the basin or any permanent
structure within the basin, is not used for current or planned operations or
maintenance activity, and is not SNF. The debris includes such things as up
to 2,000 unused fuel canisters, old equipment, hand tools, and miscellaneous
scrap. Most of the debris other than the storage racks is in the.KE Basin.
Debris would be generally be removed using existing equipment, including
cranes and tongs, although some use of new special equipment might prove
necessary. Debris may be collected on screens as sludge is removed from the
pools. A high-pressure water-jet cleaning system would be used to decontam-
inate debris under water. During removal from the basin water, the debris
would be rinsed, drip-dried, and then bagged while in a "greenhouse" contain-
ment structure to prevent release of loose contamination.
The radioactive waste volume of the debris may be reduced by mechanical
compaction and/or cleaning. Development and testing of the debris removal
equipment would occur at other existing facilities.
Water Disposition
About 4,500 m3 (1.2 million gallons) of water would remain in the
KE Basin following removal of the fuel, sludge, and debris. This water is .
contaminated with radionuclides including tritium. Most radionuclides can be
removed from water using the existing filtering and ion exchange treatmentmethods. Tritium, although present only in small amounts (<20 Ci), cannot be
effectively separated from the water. Contaminated basin water may be trans-
ported to the 200 Area ETF for final disposal into the 200 Area SALDS. This
removed water would be replaced with clean water, maintaining the KE Basin
water level. Eventually all basin water would be removed as part of facility
deactivation activities.
(a) The size is based on considerations for criticality prevention and themaximum size that can be passed through typically used sluicing pumps withminimal expectation of damage to the pumps.
3.14
New Wet Storage Alternative
Life Extension Upgrades
Life extension upgrades would be completed to enable continued storage
at the KW Basin through the year 2035. The extent of upgrades for that period
is contingent on the continued performance of KW Basin systems and applicable
regulatory criteria. The following upgrades are assumed to be completed:
heating, ventilating, and air conditioning upgrades that may be neces-
sary to provide confinement by installing a high-efficiency particulate
air filtration system
• security system upgrades.
KE Basin Deactivation
KE Basin deactivation would follow removal of fuel, sludge, and debris
from the basin. Deactivation includes KE Basin preparations for turnover to
DOE's decommissioning program and surveillance and maintenance before imple-
menting decommissioning. An analysis of environmental impacts associated with
decommissioning eight Hanford reactors, which included the K Basins, was
presented in Surplus Production Reactor Decommissioning EIS (DOE 1989) and is
not repeated in this EIS.
3.2.3 New Wet Storage Alternative
In the new wet storage alternative, the SNF in the K Basins would be
relocated to a wet storage facility away from the Columbia River and the
K Basins prepared for turnover to DOE's decommissioning program. This
alternative is depicted in Figure 3-3.
Two approaches were evaluated for new wet storage:
• a new wet pool would be constructed on the 200 Areas plateau (reference
site or CSB site) that provides an equivalent level of safety to current
storage criteria identified in 10 CFR 72 for commercial SNF
a new vault would be constructed on the 200 Areas plateau (reference
site or CSB site), where the fuel would be stored in water-filled MCOs.
3.15
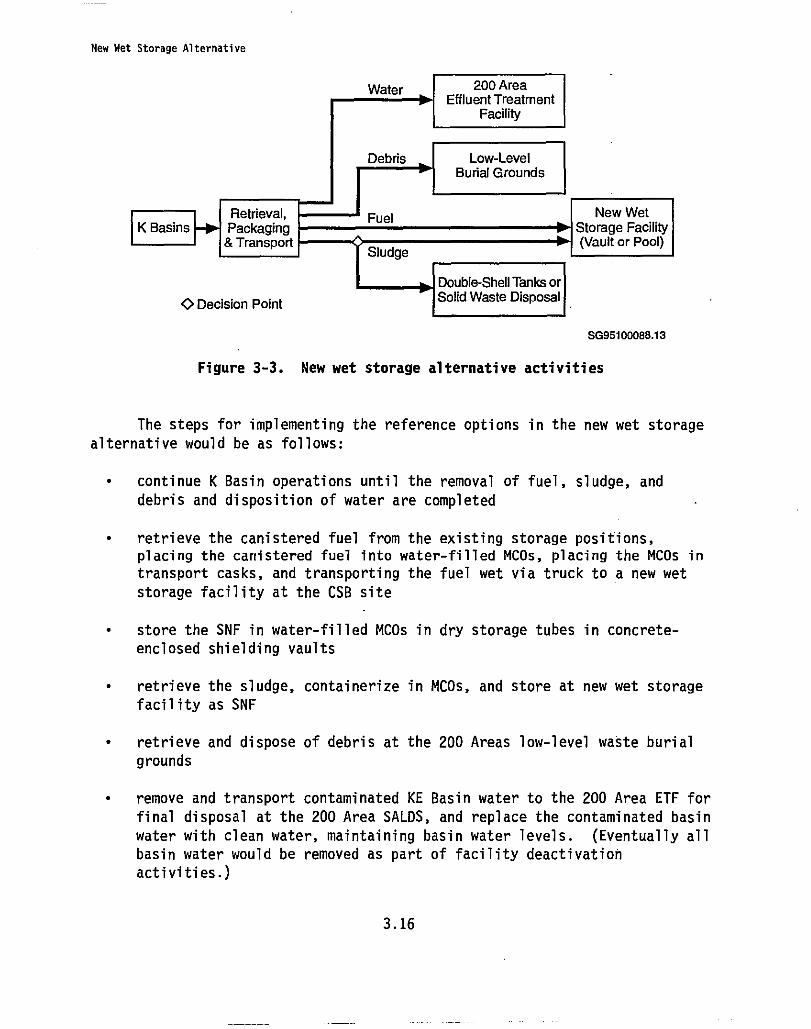
Retrieval,K Basins Packaging
& Transport
Fuel
Sludge
New WetStorage Facility(Vault or Pool)
New Wet Storage Alternative
Water 200 AreaEffluent Treatment
Facility
Debris Low-LevelBurial Grounds
Double-Shell Tanks or
0 Decision Point Solid Waste Disposal
SG95100088.13
Figure 3-3. New wet storage alternative activities
The steps for implementing the reference options in the new wet storage
alternative would be as follows:
• continue K Basin operations until the removal of fuel, sludge, and
debris and disposition of water are completed
• retrieve the canistered fuel from the existing storage positions,placing the canistered fuel into water-filled MCOs, placing the MCOs in
transport casks, and transporting the fuel wet via truck to a new wet
storage facility at the CSB site
• store the SNF in water-filled MCOs in dry storage tubes in concrete-
enclosed shielding vaults
• retrieve the sludge, containerize in MCOs, and store at new wet storage
facility as SNF
• retrieve and dispose of debris at the 200 Areas low-level waste burialgrounds
• remove and transport contaminated KE Basin water to the 200 Area ETF forfinal disposal at the 200 Area SALDS, and replace the contaminated basinwater with clean water, maintaining basin water levels. (Eventually all
basin water would be removed as part of facility deactivation
activities.)
3.16
New Wet Storage Alternative
• prepare the K Basins for deactivation and turn over to the decontamina-
tion and decommissioning program.
A summary schedule for the new wet storage alternative, which assumes
construction at the CSB site, is shown in Figure 3-4.
K Basins Operation
The K Basins would continue to operate during the SNF, sludge, and
debris removal. K Basins operation would be as described in the no action
alternative in Section 3.1.1, with no modifications except for ongoing safety
upgrades and those modifications required to support fuel retrieval.
Fuel Retrieval
MCOs would be designed to hold canisters of fuel and sludge during
transport and storage. They would be approximately 0.6 m (24 in.) outside
diameter and 4.6 m (15 ft) high and made of stainless steel, nominally 1 cm
(3/8 in.) thick. The MCOs would have a removable, but sealable, thick-walled
top closure, with features allowing monitoring of internal conditions and
venting of any excessive gas. The thick-walled top provides sufficient
shielding to allow operator access to the monitoring and venting features of
the top closure, and to seal and leak-check the MCO before shipment. The MCOs
would be capable of holding nominally 10 fuel canisters each, arranged in five
layers with two canisters in each layer.
The SNF canisters would be packaged in the MCOs at existing K Basins
facilities. The transport cask containing the MCO would be removed from its
conveyance, the cask lid and then the MCO top closure would be removed, and
the cask would be submerged underwater in the cask load-out pit using the
K Basins overhead cranes.
The existing fuel canisters would be placed into the MCOs "as is." An
existing fuel canister, which may hold fuel elements or SNF sludge, would be
lifted out of the storage rack, so it clears the rack but would still be under
at least 2.4 m (8 ft) of water, using the canister handling trolley system.
The lids of the canisters in the KW Basin would be removed. The SNF canister
would be transported to the cask load-out pit. At the load-out pit, the can-
ister would be lifted toward the surface of the water, placed over the open
MCO, and lowered into it.
Additional canisters would be loaded into the MCO one at a time until
the 10 canisters were loaded. The shielded top closure of the MCO would be.
3.17
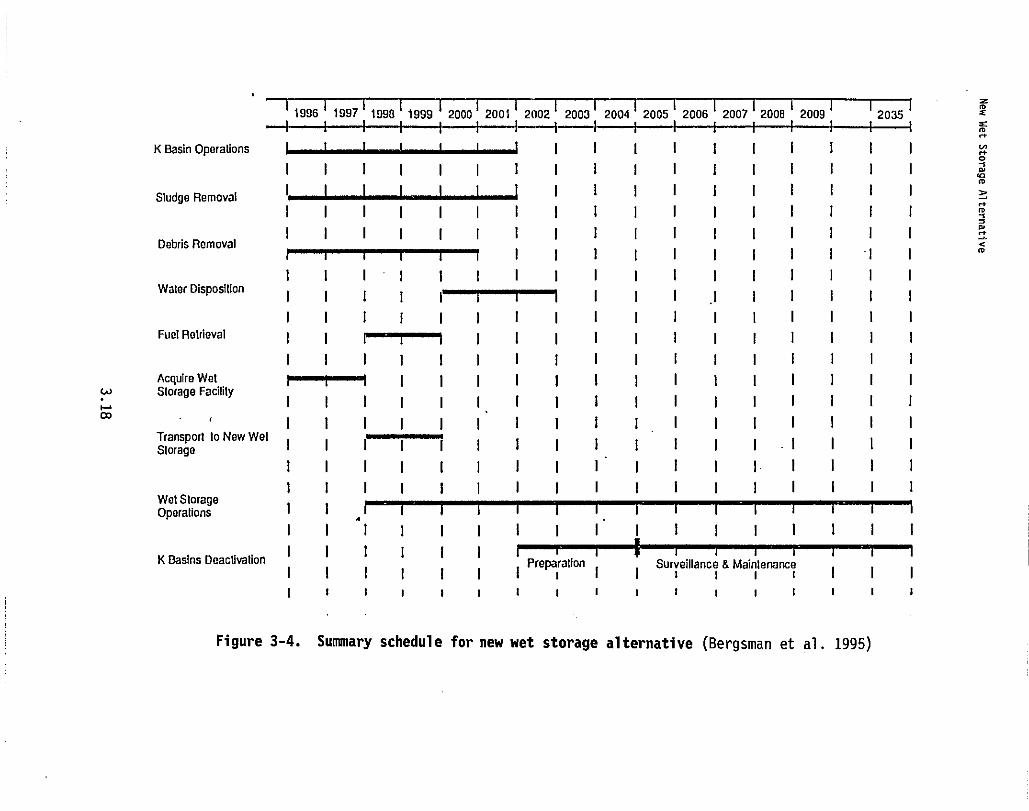
i
0Y
N
w
m
w00w
1996 1997 1990 1999 2000 2001 2002 2009 2004 2005 2006 2007 2006 2009 2035
K Basin Operations { 1 1 r r 1 I I I I I I I I I I
I I I I I I I I I I I I I I I I I
Sludge Removal I^ I I I I I I I I I I I I i I I I
I I I I I I I I 1 1 I I I I I I I
I I I I I I I I I I 1 I I I I I I
Debris RemovalI I I I I I I I I I I
I I I I I I I I I I 1 I I I I I I
Water DispositionI I I 1 ITS I I I I I I I I I
I I I 1 I I- I I I I I I I I I I I
Fuel Retrieval I I I°1^1 I I I I I I I I I I I I
I I I I I I I I I I I I I I I I I
Acquire Wet ^^-I I I I I I I I I I I I I I IStorage Facility
I I I 1 I I I I I I I I I I I I I
' I I I I I I I I I I I I I I I I I
Transport to New Wet I I I I I I I I 1 1 i I I I I I IStorage
i I I I I I I i I I I I I I I I I
I 1 I I i I I I I I I I I I I I I
Wet StorageI IOperations
I I A I I I I I I I I i I I I I I I
K Basins DeactivationI I I 1 I I
1 I I I I I1 Preparation I 1 Surveillance s Maintenance
I I I
I t 1 i r i t r r r r i i 1 i i r
Figure 3-4. Summary schedule for new wet storage alternative (Bergsman et al. 1995)
New Wet Storage Alternative
set in place and the MCO, still inside the cask, would be lifted'such that itstop would be just above the surface of the water. The top closure would be
sealed. A gas line would be connected to the MCO to force out some of thewater in the MCO, creating a space to accumulate any gases that might begenerated during transport. The MCO would be vented before transport toreduce internal pressure and then sealed. Cooling during transport might be
required.
Before sealing, the MCO seal surface would be cleaned by removing debristhat may have accumulated. The cask lid sealing surface, the top of the MCOlid, and the upper portion of the cask would be washed down with a decontami-
nation spray system as it is hoisted out of the water. The cask lid would be
put in place, the water in the annular volume of the cask would be removed,
and the cask would be sealed. The cask would be lifted from the water,
rinsed, and placed back on the railcar or truck trailer. The water would be
allowed to drain into the basin. The transport casks containing the MCOswould then be shipped to the new storage facility via truck or train.
This loading approach results in placing the SNF within water-flooded
MCOs. In the water-flooded condition, the fuel would continue to corrode and
generate gaseous corrosion products. Shipments would have to be timely and
closely supervised to prevent unacceptable gas pressure buildup inside the
MCO. The MCO design would provide for emergency pressure relief, which could
take the form of a rupture'disk.
Sludge Management, Debris Removal, and Water Disposition
Sludge management, debris removal, and water disposition for the new wet
storage alternative are the same as described in Section 3.1.2, except that
the sludge would be containerized in MCOs and stored at the new wet storagefacility for management of sludge as SNF. If the floor sludge is transported
to the new wet storage facility using MCOs, it is estimated that approximately70 MCOs would be required.
Wet Storage in a Vault Facility
The wet vault storage approach would use water-filled MCOs stacked twohigh in dry or water-filled storage tubes. The tubes would extend into below-
grade, concrete-enclosed, shielding vaults, which could be cooled by recircu-
lating refrigerated air, if necessary. The vault storage tube material would
be stainless steel, if the tubes were to be filled with water, to minimize
electrochemical corrosion between the tubes and the stainless steel MCOs. Ifthe tubes were to be dry, the tube material would be carbon steel (Corten®).
3.19
New Wet Storage Alternative
If the CSB site were selected, the vault facility would likely use the
entire foundation of the CSB (see Appendix A, Figure A-7). As such, three
below-grade vaults would likely be constructed instead of two vaults, which
would be sufficient for the estimated 750 MCOs of fuel and maximum anticipated70 MCOs of KE Basin floor sludge (assuming all basin sludge is managed with
the SNF). The CSB design provides space for up to 880 MCOs, each with 10 fuel
canisters. Any excess vault capacity could potentially be used at a later
date for storage of other.compatible Hanford Site materials (e.g., cesium/
strontium capsules, vitrified waste, and possibly staging of other HanfordSNF) .
If the reference site were selected, a somewhat smaller facility with
only two storage vaults would likely be built. It would be sized sufficiently
to meet the needs for only K Basins SNF storage. Therefore, the information
provided for the CSB site would be conservative and is used as the basis for
estimating impacts at both potential sites in Chapter 5.0.
Wet Storage in a Pool
The concept for wet storage in a pool would use the existing site prepa-
ration and concrete basemat, as well as some of the completed engineering for
the CSB site. This design also serves as the basis for the pool storage
facility at both potential storage sites, even though only one of the three.
vault structures is needed to store the SNF, because it is readily available,
conservatively estimates the technical information needed, and avoids bothhaving to backfill the large existing excavation and having to redesign the
structure to eliminate the extra vaults.
The new pool storage baseline design assumes the MCOs would be stored in
racks in a single layer in an open pool of water with a recirculating water
treatment system that would return the water to the pool at about 7°C (450F).
This portion of the new pool facility would utilize approximately one-third-of
the completed CSB foundation. The balance of the facility would be con-
structed at the same time as the pool vault for the reasons described above.
For the wet pool approach at the CSB site or reference site, a new
facility would be constructed to house up to 880 MCOs (with 10 fuel canisters
each) in a water-filled open storage pool. This pool would be large enough to
store all the K Basins fuel (750 MCOs) and potentially all the segregatedK Basins canister sludge (60 MCOs) and KE Basin floor sludge (70 MCOs). Thenew facility would have three vaults within the pool located below grade
level, even though only one vault would be used as a 40-year interim storage
pool. The MCOs stored in the pool would be placed in underwater stainless
MWIR,
Preferred Alternative--Drying/Passivation
steel racks. The exposed uranium metal in the damaged fuel elements would
continue to corrode and release uranium and small amounts of plutonium and
fission products within the MCOs. The gases would be vented continuously,
similar to the SNF storage in the KW Basin. Any excess vault capacity could
potentially be used at a later date for storage of other compatible Hanford
Site materials (e.g., cesium/strontium capsules, vitrified waste, and possibly
staging of other Hanford SNF).
3.2.4 Drying/Passivation (Conditioning) with Dry Vault Storage Alternative--
Preferred Alternative and Options
The drying/passivation (conditioning) with dry storage alternative would
provide for drying of the SNF, placing it in MCOs in an inert atmosphere, and
storing it in a vault or in casks for up to 40 years. Figure 3-5 provides a
block diagram of operations associated with the preferred alternative.
Achieving dry storage of SNF in the preferred alternative (incorporating
reference options) would involve the following primary activities:
• continue K Basin operations until the removal of fuel, sludge, and
debris and disposition of water are completed
• remove K Basin SNF from existing canisters, clean, and desludge
• construct a new dry storage facility at the CSB site
• repackage the SNF into fuel baskets designed for MCO dimensions, which
would include provision for water removal, SNF conditioning require-
ments, and criticality control
• after loading SNF into the MCOs, welding on the top, and draining the
MCOs through small penetrations on the top, initially dry the SNF under
vacuum at approximately 50°C (120°F), flood MCO with inert gas, seal
penetrations, and place in transportation cask
• transport the SNF (in MCOs) in casks via truck to the CSB site in the
200 East Area, and provide for temporary vented staging, as necessary
• vacuum condition the SNF in MCOs, as soon as practicable, heating the
SNF to about 300°C (570°F) to remove water that is chemically bound to
the SNF and canister corrosion products, and to dissociate any reactive
uranium hydride present
3.21
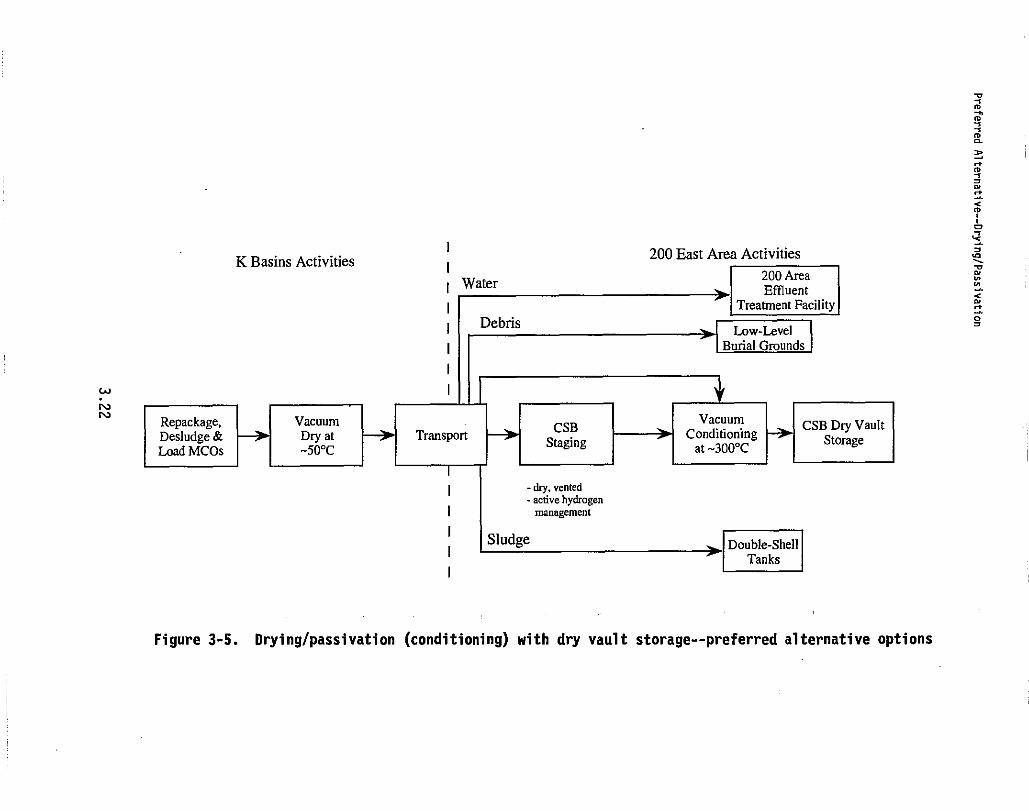
a
zaM
0z
dNr
0_
wNN
K Basins Activities 200 East Area Activities
Water AreaEI Effluent
Treatment Fa(Debris Low Level
Burial Grounds
I
I
Repackage, Vacuum CSBVacuum CSB Dry Vault
Desludge & Dry at Transport g Conditioning StorageLoad MCOs -50°C
Staging at -300°C H
- dry, vented- active hydrogen
I management
I Sludgeg Double-ShellTanks
I
Figure 3-5. Drying/passivation (conditioning) with dry vault storage--preferred alternative options
Preferred Alternative--Drying/Passivation
• following conditioning, weld-seal the SNF in an inert gas in the MCOs
for dry interim storage in a vault for up to 40 years
• collect the sludge removed from basins and disposition as waste in
Hanford's DSTs after removal from the basin
• collect the debris from the basins and dispose of as low-level waste in
Hanford's existing low-level waste burial grounds
• remove and transport contaminated basin water to the 200 Area ETF for
final disposal at the 200 Area SALDS, and replace the contaminated basin
water with clean water, maintaining basin water levels. (Eventually all
basin water would be removed as part of facility deactivation
activities.)
• prepare the K Basins for deactivation and turn over to decontamination
and decommissioning program.
A summary schedule for activities for - the drying/passivation (condi-
tioning) with dry storage alternative is provided in Figure 3-6.
For the various steps involved in this alternative, those associated
with the preferred alternative are addressed first followed by a description
of other available options. An overview of options is provided in Table 3-1;
the preferred alternative is identified with process option number 7.
Loading of Fuel in MCOs
Preferred option:
The fuel would be removed from existing canisters, cleaned, desludged,
and repackaged into fuel baskets designed specifically for the MCOs described
earlier. These baskets would include provision for water removal, SNF condi-
tioning requirements, and criticality control (e.g., a borated steel rod or
rods). Repackaging would help ensure removal of most of the sludge from the
SNF and would allow optimum MCO loading, up to 1.9 times that of other config-
urations. In this case, the inventory of SNF, excluding the separated canis-
ter sludge, could be stored in as few as 390 MCOs.
Other options:
Other methods were also considered for loading SNF into MCOs and pre-
paring the MCOs for transport. The simplest of these was described previously
3.23
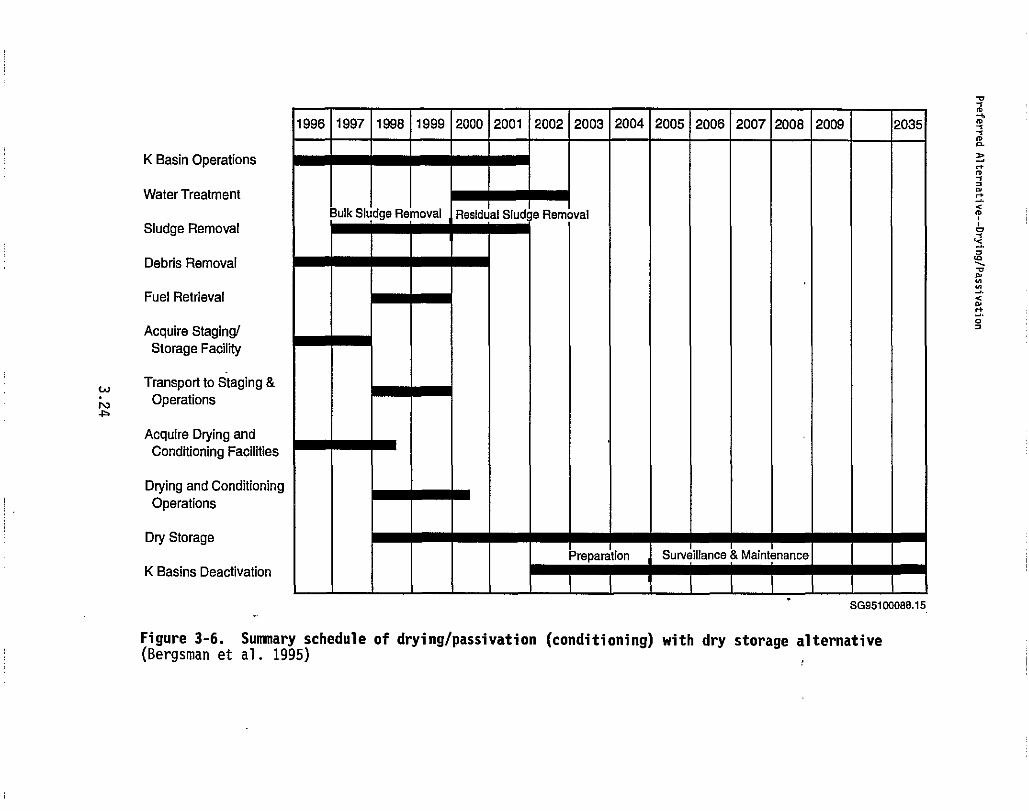
K Basin Operations
Water Treatment
Sludge Removal
Debris Removal
Fuel Retrieval
Acquire Staging/Storage Facility
w Transport to Staging &Operations
.n
Acquire Drying andConditioning Facilities
Drying and ConditioningOperations
Dry Storage
K Basins Deactivation
1996 1997 1998 1999 2000 2001 2002 2003 2004 2005 2006 1 2007 2008 2009 2035
Bulk Sludge Removal Residual SludI a Removal
Preparation Surveillance & Maintenance
SG95100088.15
Figure 3-6. Summary schedule of drying/passivation (conditioning) with dry storage alternative(Bergsman et al. 1995)
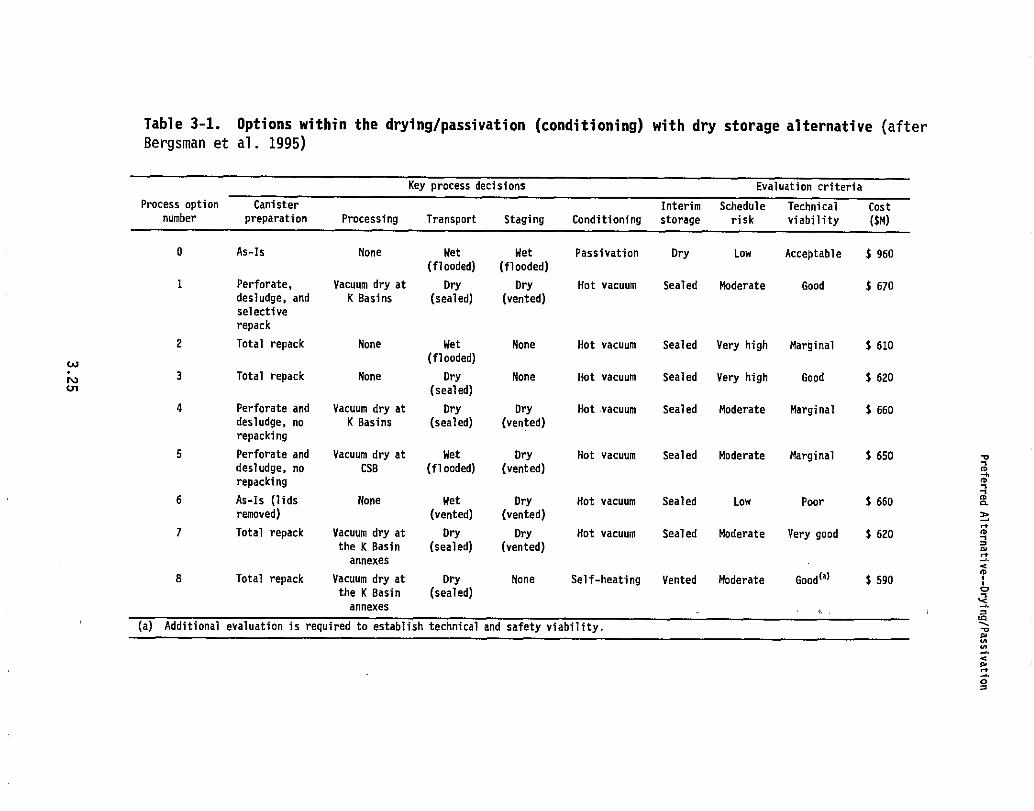
Table 3-1. Options within the drying/passivation (conditioning) with dry storage alternative (after
Bergman et al. 1995)
Key process decisions Evaluation criteria
Process option Canister Interim Schedule Technical Costnumber preparation Processing Transport Staging Conditioning storage risk viability ($M)
0 As-Is None Wet Wet Passivation Dry Low Acceptable $ 960(flooded) (flooded)
1 Perforate, Vacuum dry at Dry Dry Hot vacuum Sealed Moderate Good $ 670desludge, and K Basins (sealed) (vented)selectiverepack
2 Total repack None Wet None Hot vacuum Sealed Very high Marginal $ 610(flooded)w
jV 3 Total repack None Dry None Hot vacuum Sealed Very high Good $ 620(sealed)
4 Perforate and Vacuum dry at Dry Dry Hot vacuum Sealed Moderate Marginal $ 660desludge, no K Basins (sealed) (vented)repacking
5 Perforate and Vacuum dry at Wet Dry Hot vacuum Sealed Moderate Marginal $ 650desludge, no CSB (flooded) (vented)repacking i
6 As-Is (lids None Wet Dry Hot vacuum Sealed Low Poor $ 660 aremoved) (vented) (vented)
7 Total repack Vacuum dry at Dry Dry Hot vacuum Sealed Moderate Very good $ 620 ithe K Basin (sealed) (vented) d
annexes S8 Total repack Vacuum dry at Dry None Self-heating Vented Moderate Goodl'i $ 590
the K Basin (sealed)annexes
(a) Additional evaluation is required to establish technical and safety viability.w
an0
Preferred Alternative--Drying/Passivation
for the new wet storage alternative (i.e., the fuel canisters would be placed
into the MCOs "as is"). Other options would be to provide holes in the canis-
ter bottoms for water drainage and gas flow, or to provide holes in canister
bottoms and sides for water drainage and gas flow, and remove the canister
sludge by flushing basin water through the canisters.
All three of these other methods, as described, would result in the SNF
being placed within water-flooded MCOs or damp within dry MCOs. In the water-
flooded or damp condition, the fuel would continue to corrode and generate
gaseous corrosion products, as noted above. Shipments would have to be timely
and closely supervised to prevent excessive gas pressure buildup inside the
MCO because of corrosion.
Drying of SNF
Preferred option:
Vacuum-drying of the SNF would be initiated at the K Basins in a facil-
ity having comparable control of pollutant releases to the atmosphere as pro-
vided at the CSB conditioning facility. Initial vacuum-drying would take
place with the repackaged SNF in MCOs at a temperature of about 50°C (1200F).
This step would be expected to remove essentially all free (i.e., chemically
unbound) water, essentially arresting further corrosion and excessive hydrogengeneration.
Other options:
All vacuum drying could be performed at conditioning facilities located
at the CSB site or reference site.
Transport of SNF
Preferred option:
SNF would be transported from the K Basins in shielded casks via truck
to the CSB site in the 200 Areas.
Other options:
SNF could be shipped by rail from the K Basins to either the CSB site orreference site.
3.26
Preferred Alternative--Drying/Passivation
Staging
Staging would be considered to the extent necessary to expeditiously
remove SNF from the K Basins to the 200 Areas, either the CSB site or
reference site. It may only be needed in early stages of implementing the
alternative.
Preferred option:
Dry Vault Staging. The present concept is very similar to that
described in Section 3.2.3 for the new wet storage alternative; however, the
SNF would be staged dry. This staging would use the existing design of the
CSB site with the addition of some support facilities. As in the new wet
storage alternative, it is assumed for the purposes of this EIS that the
features and design of the new facility would be very similar to those of
the CSB.
Vault staging would use MCOs stored in two layers in inert gas-filled
tubes extending into three below-grade, concrete-enclosed, shielding vaults,
which could be cooled by recirculating 2°C (35°F) refrigerated air, if
necessary, or by natural circulation cooling. This would utilize the entire
foundation and design of the CSB. The facility has space for up to 880 MCOs,
each with 10 fuel canisters, substantially more than required for the
preferred alternative. When all the MCOs have been conditioned, the recir-
culating refrigerated air system would be shut down. Natural circulation(passive cooling) would be established and the staging portion of the facility
would then become a dry storage facility.
Differences in the facility (compared to the new wet storage alterna-
tive) if vacuum-dried SNF were stored in the MCOs would be:
MCO servicing would not include water level adjustments
• SNF temperatures would not need to be as low because of the signifi-
cantly lower potential for continued corrosion
• radioactive gas release from the staged MCOs would be much lower, sim-
plifying contamination control in operating areas and lowering routine
releases to the atmosphere.
3.27
Preferred Alternative--Drying/Passivation
Other options:
A completely new dry vault staging facility could be built at the refer-
ence SNF storage site using the existing configuration of the CSB.
Wet Staging. The wet staging concept is very similar to that described
in Section 3.2.3 for the new wet storage alternative. It would also use the
unchanged version of the existing design of the CSB site, with the addition of
some support facilities, and includes consideration of building a completely
new facility at the reference site using the existing design of the CSB.
Pool staging assumes the MCOs would be stored in racks in a single layer
in an open pool of water, with a recirculating water treatment system that
would return the water to the pool at about 7°C (45 0 F). This portion of the
new wet storage facility would utilize approximately one-third of the
completed CSB foundation. The facility has space for up to 880 MCOs each with
10 fuel canisters. Only 750 MCOs would be stored if the desired sludge
disposal options prove successful, where segregated canister and KE Basin
floor sludge would not be stored in the new wet storage facility.
The balance of the facility, which would utilize the remaining two-
thirds of the CSB foundation and the dry storage vaults, would be constructed
at the same time as the pool staging vault. Primary activities that would
remain to be completed would be installing the storage tubes in the dry
storage vaults, installing some support equipment, and installing the concreteoperating deck above the dry vaults. These activities would be completed so
that the dry storage vaults would be operational at the same time as the
conditioning facility. After conditioning, the MCOs would be returned to the
newly completed dry storage vaults. The staging portion of the facility would
then become a dry storage facility.
The pool staging facility itself would be the same as that described in
Section 3.2.3 for the new wet storage alternative, when the SNF would be
loaded into water-flooded MCOs. The facility design for repackaged SNF would
be bounded by the description of SNF in fuel canisters. The differences in
the facility resulting from vacuum dried SNF in the MCOs are:
• MCO servicing would not include water level adjustments
• SNF temperatures would not need to be as low because of the signifi-
cantly lower potential for continued corrosion
KWI3
Preferred Alternative--Drying/Passivation
• radioactive gas releases from the staged MCOs would be much lower,
simplifying control in operating areas and lowering routine releases to
the atmosphere
MCO transfer to the close-coupled conditioning facility could be done by
cart. Water-filled MCOs would likely be stored in water-filled tubes,
and vacuum dried MCOs would likely be stored in dry tubes.
Drying/Passivation (Conditioning) for Dry Storage
Preferred option:
Once at the CSB staging. facility, the MCOs would be transferred from the
staging area into a new drying/passivation (conditioning) facility. The
conditioning facility would be built adjacent to the staging/storage facility.
A transfer corridor would connect the two facilities and allow transfer of the
fuel-filled MCOs back and forth between the staging/storage facility and the
conditioning facility. The MCOs would be retrieved from the staging/storage
facility tube into a bottom-loading transfer cask and the cask moved into the
conditioning facility. The MCO would be lowered from the transfer cask into a
processing pit in the floor of the conditioning facility. The transfer cask
would be removed, and the MCO would be connected to conditioning process
piping and process control systems.
Vacuum-drying and conditioning would continue at the CSB facility wherethe following steps would be carried out on the SNF in MCOs:
• heat to about 300°C (570°F) while purging with a suitable inert gas (for
about 24 hours)
• evacuate and hold at temperature (for about 48 hours)
• cool down to about 150°C (300°F) by forced-air cooling of the exterior
of the MCO
• oxidize (passivate) by introducing a suitable inert gas-oxygen mixture
(for about 24 hours)
3.29
Preferred Alternative--Drying/Passivation
flood the MCO with a suitable inert gas and cool down to ambient
temperature (for 8 to 16 hours) and seal.
The vacuum conditioning process would remove adsorbed water and the majority
of chemically bound water and dissociate any reactive uranium hydride present.
Following this process the SNF in MCOs would be ready for storage for up to
40 years in the CSB dry storage facility.
Other options:
The drying/passivation (conditioning) process could be carried out in
new facilities at the reference site using designs similar to those intended
at the CSB site. All of the drying and conditioning processes could take
place at the CSB site or at the K Basins.
Dry Storage i'1
Preferred option:
Dry Vault Storage. To implement dry storage in a vault, the dry staging
facility would become the dry storage facility and the SNF would be stored dry
in sealed MCOs in dry tubes cooled by natural air circulation.
Other options:
Dry Storage in Casks. Dry storage could be accomplished by storing theSNF in casks. To implement dry storage in casks, the conditioned K Basin SNF
would be stored in casks designed for storage of commercial SNF, with hori-
zontal storage chosen as the basis-for details, consistent with DOE (1995a).
Each storage cask would be roughly 1.7 m (5.5 ft) in diameter, 4.9 m (16 ft)
long, and would weigh over 100 metric tons (110 tons). The concrete storage
modules that would hold the cask in the system would have dimensions of
(a) The DOE programmatically established period for interim storage is for upto 40 years. However, design engineers have indicated that dry storage for upto 75 years is currently achievable. Design for 200 years, while likelyachievable, cannot be performed under currently available funding. The abil-ity to store SNF with confidence for up to 500 years, as suggested during thescoping process, would likely be a somewhat greater challenge and has not beenexamined in detail. As a consequence, design for extended storage in newfacilities is limited to 75 years in this EIS.
3.30
Calcination Alternative
approximately 3 m (10 ft) wide, 5.5 m (18 ft) deep, and 4.6 m (15 ft) high.
On the order of 140 casks would be required and would be stored outside on a
concrete pad adjacent to the CSB site or at the reference site.
Sludge Management, Debris Removal, Water Disposition, and K Basins
Deactivation
Preferred option:
The sludge would be removed from the basins and dispositioned as waste
in Hanford's DSTs after removal from the basin. Debris would be collected
from the basins and disposed of as low-level waste in Hanford's existing low-
level waste burial grounds. Contaminated basin water would be removed and
transported to the 200 Area ETF for final disposal at the 200 Area SALDS, and
contaminated basin water would be replaced with clean water, maintaining basin
water levels. (Eventually all basin water would be removed as part of facil-
ity deactivation activities.)
Deactivation would follow removal of fuel, sludge, and debris from the
basin, and would include preparations for turnover to DOE's decommissioning
program, and would provide for the surveillance and maintenance before imple-
menting decommissioning. An analysis of environmental impacts associated with
decommissioning eight Hanford reactors, which included the K Basins, was
presented in Surplus Production Reactor Decommissioning EIS (DOE 1989) and isnot repeated in this EIS.
Other options:
Sludge management, debris removal, and disposition of basin water could
be essentially the same as described for the new wet storage alternative.
3.2.5 Calcination with Dry Storage Alternative
In this alternative, the steps (including reference options) before
calcination would be essentially the same as those in the new wet storage
alternative. However, in the calcination with dry storage alternative, a new
facility would be constructed adjacent to the staging/storage facility.
A transfer corridor would connect the two facilities and allow transfer of the
fuel-filled MCOs in transfer casks back and forth between the two facilities.
The MCOs would be unloaded remotely from the transfer casks and opened. The
fuel canisters would be removed from the MCO, and then the fuel and sludge
would be unloaded from the canisters.
3.31
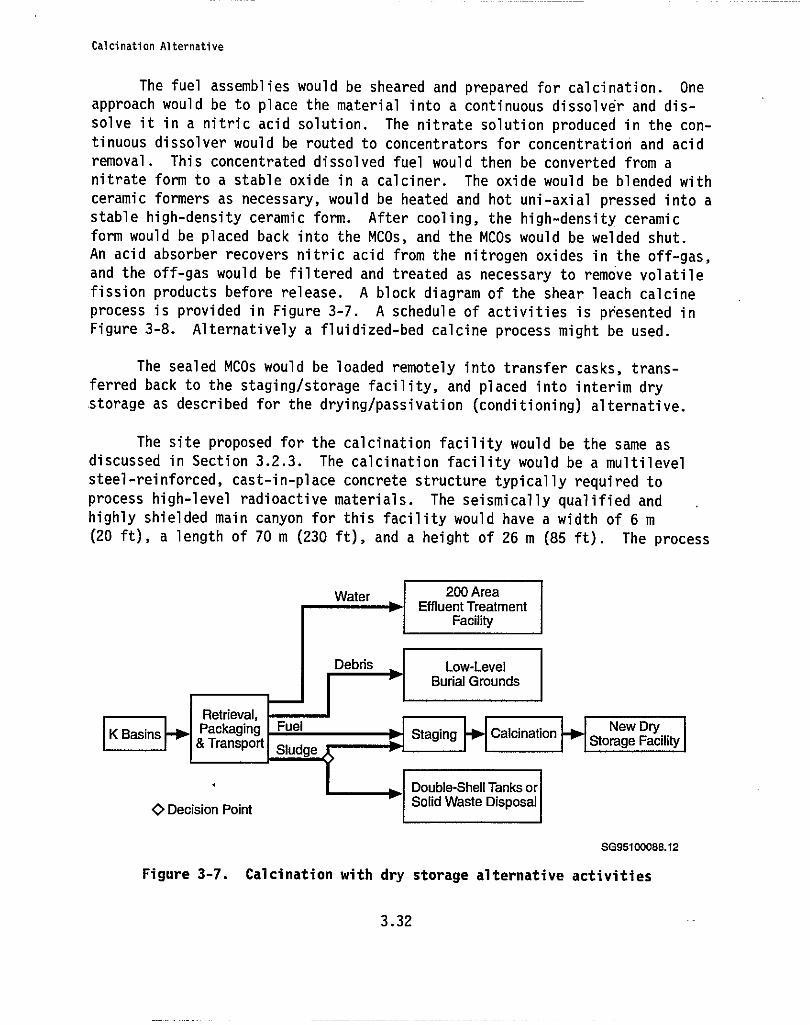
Calcination Alternative
The fuel assemblies would be sheared and prepared for calcination. Oneapproach would be to place the material into a continuous dissolver and dis-solve it in a nitric acid solution. The nitrate solution produced in the con-tinuous dissolver would be routed to concentrators for concentration and acidremoval. This concentrated dissolved fuel would then be converted from anitrate form to a stable oxide in a calciner. The oxide would be blended withceramic formers as necessary, would be heated and hot uni-axial pressed into astable high-density ceramic form. After cooling, the high-density ceramicform would be placed back into the MCOs, and the MCOs would be welded shut.An acid absorber recovers nitric acid from the nitrogen oxides in the off-gas,and the off-gas would be filtered and treated as necessary to remove volatilefission products before release. A block diagram of the shear leach calcineprocess is provided in Figure 3-7. A schedule of activities is presented inFigure 3-8. Alternatively a fluidized-bed calcine process might be used.
The sealed MCOs would be loaded remotely into transfer casks, trans-ferred back to the staging/storage facility, and placed into interim dry.storage as described for the drying/passivation (conditioning) alternative.
The site proposed for the calcination facility would be the same asdiscussed in Section 3.2.3. The calcination facility would be a multilevelsteel-reinforced, cast -in -place concrete structure typically required toprocess high-level radioactive materials. The seismically qualified andhighly shielded main canyon for this facility would have a width of 6 m(20 ft), a length of 70 m (230 ft), and a height of 26 m (85 ft). The process
Retrieval,K Basins Packaging
& Transport
Water 200 Area—► Effluent Area
Facility
Debris Low-LevelBurial Grounds
Staging Foi Calcination Storage Facility
Double-Shell Tanks orO Decision Point Solid Waste Disposal
SG95100088.12
Figure 3-7. Calcination with dry storage alternative activities
MMY4
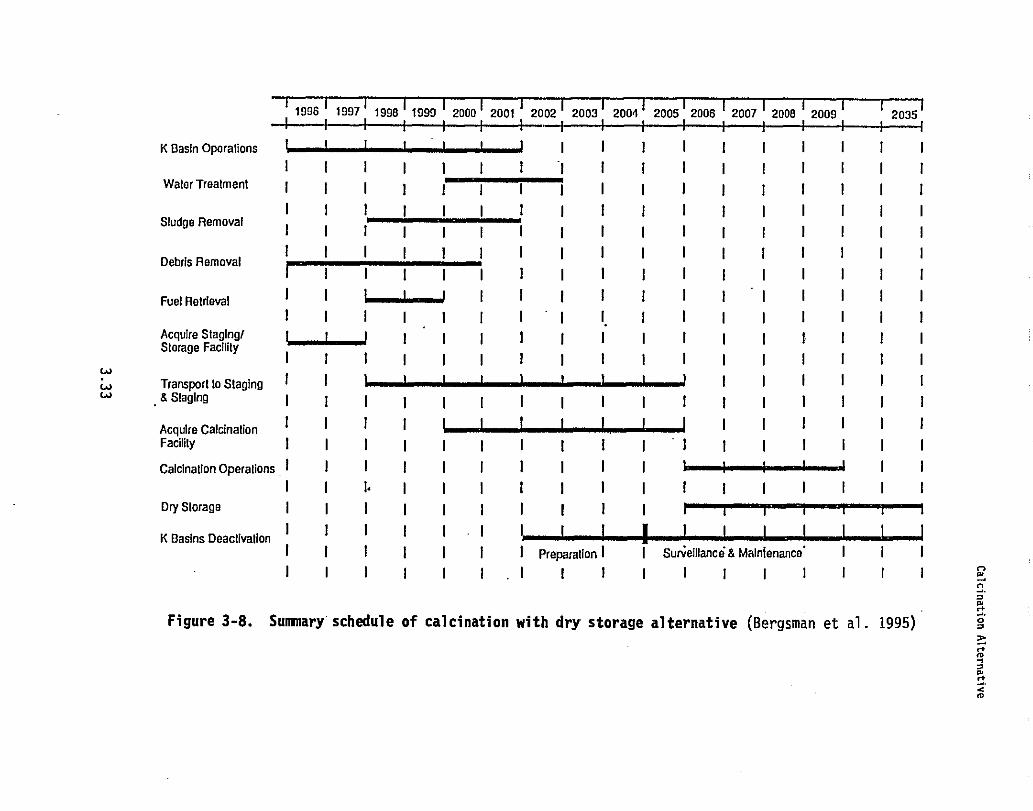
www
1996 1997 1998 1999 2000 2001 2002 2003 200A 2005 2006 2007 2008 2009 2035I i i i i —T—I—f--I i—i—I I—i—i
K Basin Operations t t ' r t I I I I I I I I I II I I I I I I I I I I I I I I I I
Water Treatment I 1 I I I^^^ I I I I I 1 I I I II I I I I I I I I I 1 1 I I I I I
Sludge Removal I I I I I I I I I I I I I I I I I
Debris Removal 1 I I I I I I I I I I I I I I I I
I I 1 1 I I I I I I I I I I I I
Fuel Retrieval I I moo; I I I I I I 1 I I I I II I I I I I I I I I I I I I I I I
Acquire Staging/ L I I I I 1 I I I I I I I L I I IStorage Facility
I I I I I I I I I I I I I I I I I
Transport to Staging 1 I ' ' t t ' 1 ' 1 I I I I I I& Staging I 1 I I I I I I I I i I I I I I I
Acquire Calcination 1 I I I I I I_ l i I I I I I I I IFacility I I I I I I I I I 1 I I I I I I I
Calcination Operations I ... ' I II I 1• I I I I I I I i I I I I I I
Dry Storage I I I I I I ( I 1 I
K Basins Deactivation I I I I I I L^^^ I I I I I I II I I 1 I I I Preparation I I Sur ielilance & Maintenance' I I II I I I I I ) I I I I I I I 1 I I
Figure 3-8. Summary schedule of calcination with dry storage alternative (Bergsman et al. 1995)
a
n
art
0
_Y
artcm
Onsite Processing Alternative
building would be approximately 110 m (360 ft) long, 50 m (160 ft) wide, and
26 m (85 ft) tall, with approximately 10 m (30 ft) of the facility height
located below grade.
The calcination facility would be sized to finish calcining of the
2,100 metric tons (2,300 tons) of fuel within 4 years. The facility is
assumed to be operated 24 hours a day, 7 days per week during scheduled opera-
ting periods. Further., the facility is assumed to be scheduled for operation
280 days per year, with 85 days per year allowed for scheduled down time.
During scheduled operating days, the facility is assumed to have a total
operating efficiency of 75% as a result of unscheduled repairs, etc.
To implement dry storage of the calcined product, the staging/storage
facility (described in Section 3.2.4) would be modified to allow dry storage
of the MCOs arriving from the adjacent calcining process. Different modifi-
cations would be required for the two different staging concepts but each
would result in calcine product being stored dry in MCOs in dry tubes cooled
by natural air circulation. The calcined product would remain in dry storage
pending ultimate disposition.
Periodic monitoring of the stored calcined product would likely be
required and might be done by checking gas buildup in the storage tube or MCO.
Defective MCOs could be overpacked, if necessary.
Optional dry storage of calcined waste in casks would be similar to thatdescribed previously for the drying/passivation with dry storage alternative.
3.2.6 Onsite Processing Alternative
The onsite processing alternative would involve removal of the SNF from
the K Basins and transport of the SNF to a facility where the uranium and
plutonium constituents would be separated from the fission products and from
each other, with subsequent storage at the Hanford Site until decisions on
ultimate disposition based on their respective material properties were made
and implemented. This approach is depicted schematically in Figure 3-9.
A summary schedule for activities in the alternative is shown in Figure 3-10.
The onsite processing alternative might be employed in the future in
conjunction with any of the interim-storage alternatives, if it were to facil-
itate ultimate disposition of SNF.
3.34
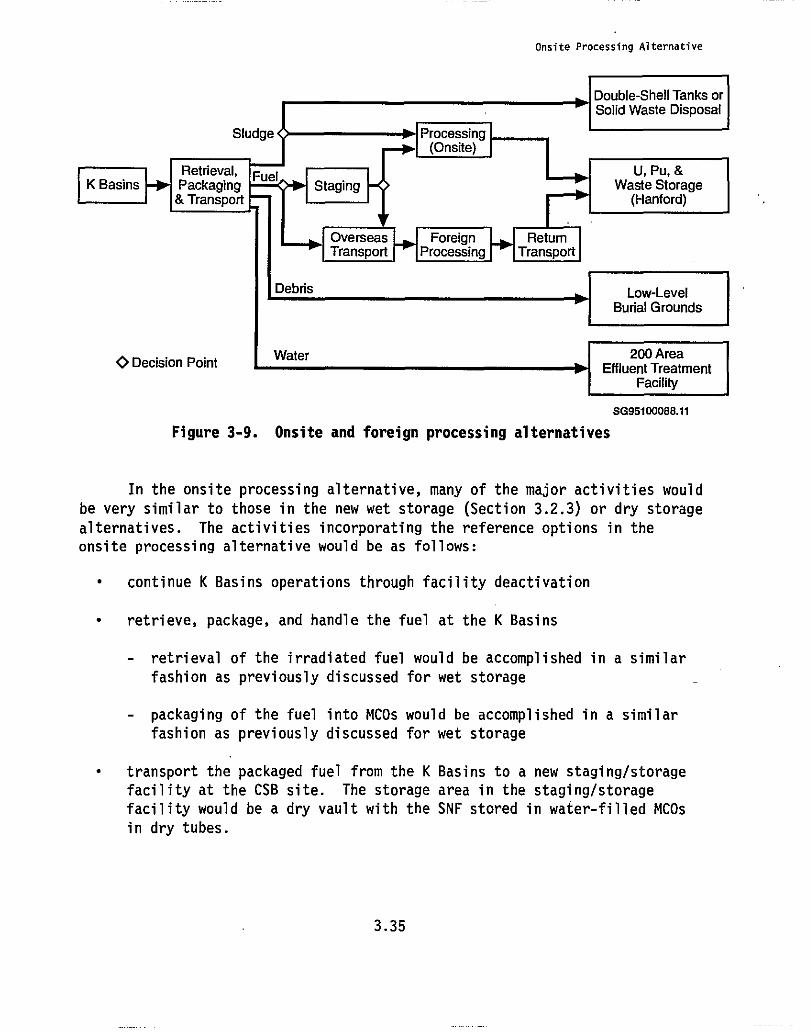
Onsite Processing Alternative
Double-Shell Tanks orSolid Waste Disposal
Sludge 0 1 Processing
Retrieval, Fuel
U, Pu, &K Basins Packaging Staging Waste Storage
& Transport (Hanford)
Overseas L.IJ Foreign LIJ ReturnTransport Processing Transpo rt
Debris Low-LevelBurial Grounds
*Decision PointWater
1200 Area
No Effluent TreatmentFacility
SG95100088.11
Figure 3-9. Onsite and foreign processing alternatives
In the onsite processing alternative, many of the major activities would
be very similar to those in the new wet storage (Section 3.2.3) or dry storage
alternatives. The activities incorporating the reference options in the
onsite processing alternative would be as follows:
• continue K Basins operations through facility deactivation
• retrieve, package, and handle the fuel at the K Basins
- retrieval of the irradiated fuel would be accomplished in a similar
fashion as previously discussed for wet storage
- packaging of the fuel into MCOs would be accomplished in a similar
fashion as previously discussed for wet storage
• transport the packaged fuel from the K Basins to a new staging/storage
facility at the CSB site. The storage area in the staging/storage
facility would be a dry vault with the SNF stored in water-filled MCOs
in dry tubes.
3.35
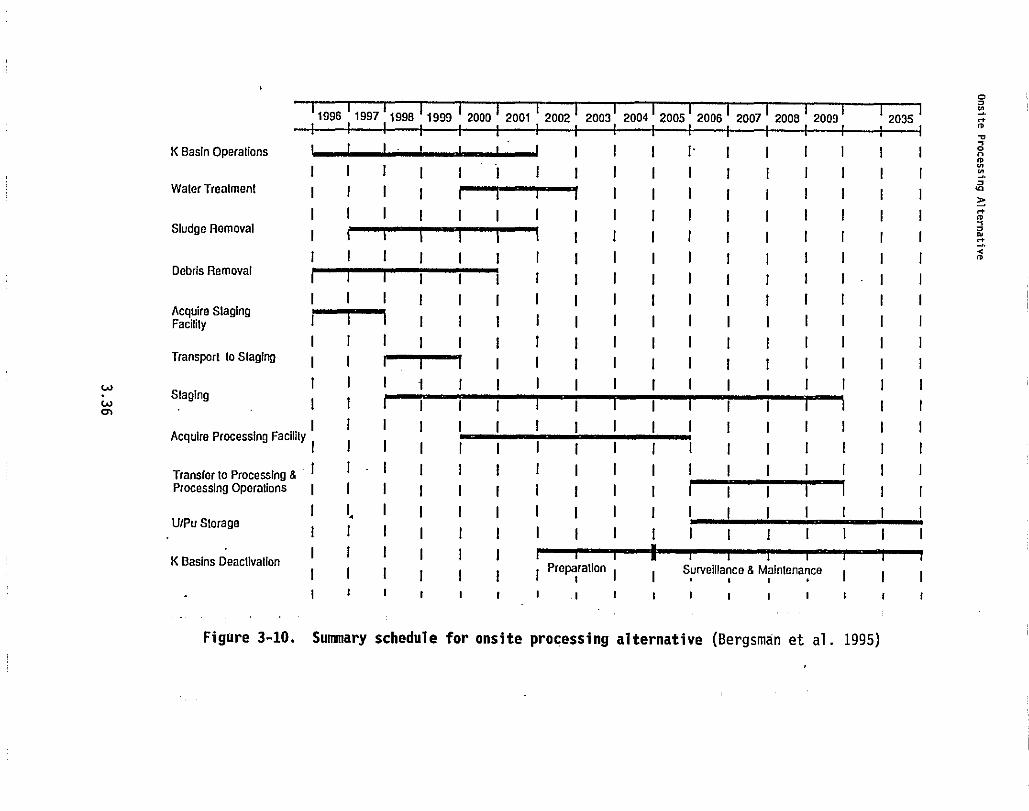
0
0
a
wwrn
1996 1997 I1996 1999 2000 1 2001 2002 2003 2004 2005 2006 2007 2006 2009 2035
K Basin Operations I II ' ' ' I I I 1' I I I I I I
I I I I I I I I i I I I 1 I I I IWater Treatment I I I I ^1°'}-'^°I I I I I I I I I I
I I I I I I I I I I I I I I I I ISludge Removal 1
I I I I I 1 I I I I
I I I I I I I i I I I I 1 I I I IDebris Removal
I I I I I I I I I I I I I I
I I I I I I I I I i I I I I I I IAcquire Staging
1'^^^ 1 I i I I I I I I I I I I IFacility
I I 1 I I I I 1 I I i I I I I I ITransport to Staging I I I^^^ I I I I I I i i I I I I
I I I 1 I I I I I I I I I I I I IStaging 1 1 I I I I I I I I I
Acquire Processing Facility I I I I I I I I I I I I I I I I
I I I I I I I I 1 1 I I 1 I
Transfer to Processing & 1 I- I I I i 1 I I I I I I I I I I
Processing Operations I I I I I I I I I I I I I I I
I I, I I I I I I I I I I I I I I IU/Pu Storage 1 I I I i I I I I I I 1 I I I I I
K Basins Deactivation I I I I I I
1 I I I I 1 1 Preparation I I Surveillance 8 Maintenance I I I
I r i r i t i i t i i i i i i r r
Figure 3-10. Summary schedule for onsite processing alternative (Bergsman et al. 1995)
onsite Processing Alternative
• process the fuel in a new facility at the Hanford Site, which would be
located near the staging/storage facility
store the recovered uranium trioxide in drums on a concrete slab in
prefabricated metal weather-tight buildings, store the plutonium'dioxide
in the Plutonium Finishing Plant (PFP) facility (2736-ZB with modifica-
tions), if possible, or in a newly constructed secure facility similar
to the existing 2736-ZB vault facility, and store the high-level waste
from processing in Hanford's DSTs
• collect the sludge removed from basins and disposition it as waste in
Hanford's DSTs after removal from the basin
collect, remove, and dispose of K Basins debris at the 200 Areas low-
level waste burial grounds
remove and transport contaminated basin water to the 200 Area ETF for
final disposal at the 200 Area SALDS, and replace the contaminated basin
water with clean water, maintaining basin water levels. (Eventually all
basin water would be removed as part of facility deactivation
activities.)
• ready the K Basins to be turned over for decommissioning.
For the onsite processing alternative, a new facility would be con-structed to process K Basins SNF. The process facility would receive metallic
fuel from storage. The fuel assemblies would be sheared into a continuous
dissolver and dissolved in a nitric acid solution. (a) The nitrate solution
produced in the continuous dissolver would then be processed through an exten-
sive solvent extraction system for removal and purification of uranium and
plutonium. The uranium nitrate product from the solvent extraction system
would be converted to uranium trioxide in a calciner and packaged for poten-
tial future beneficial use. The plutonium nitrate product from solvent
extraction would be converted to plutonium dioxide and packaged for storage in
onsite vaults, also for potential future beneficial use. (b) The high-level
(a) Although an acid dissolution process is described here, an electrometal-lurgical process in development by Argonne National Laboratory might also befeasible. The latter process is undergoing testing with unirradiatedN Reactor fuel.(b) The equivalent heat energy of the uranium-235 and plutonium-239 thatremains in the K Basins SNF, if fully fissioned, would amount to that fromabout 5,000,000,000 metric tons (6,000,000,000 tons) of coal.
3.37
Onsite Processing Alternative
waste from the solvent extraction process would be concentrated, sugar deni-
trated before neutralization, and transferred to Hanford's double-shell tanks.
The removal of uranium and plutonium from the dissolved fuel would greatly
reduce the ultimate amount of repository space required to dispose of the
fuel. An acid absorber would be used to recover nitric acid from the nitrogen
oxides in the off-gas, and the off-gas would be filtered and treated as neces-
sary to remove volatile fission products.
The processing facility would be located at either of the-sites
described in Section 3.2.3. The process facility would be a multilevel steel-
reinforced, cast-in-place concrete structure typically needed for processing
highly radioactive materials. The seismically qualified and highly shielded
main canyon for this facility would have a width of about 6 m (20 ft), a
length of about 76 m (250 ft), and a height of about 26 m (85 ft). The pro-
cess building would be approximately 130 m (420 ft) long, 78 m (260 ft) wide,
and 26 m (85 ft) tall, with approximately 10 m (33 ft) of the facility located
below grade.
Storage of Recovered Materials
Recovered materials (i.e., plutonium and uranium oxides) would be
managed with existing stockpiles at the Hanford Site until disposition of
those materials is defined. The high-level waste would transferred to DSTs.
The uranium trioxide could be considered an asset to be sold, if amarket were to exist at the time it was produced, or it could be dispositioned
as contact-handled low-level waste. Using the maximum weight limit for a
55-gal drum of 380 kg (840 lb), the approximately 2,500 metric tons
(2,800 tons) of uranium trioxide produced would require about 6,600 drums.
These drums could be palletized and housed in two prefabricated metal build-
ings situated on concrete slabs, most likely located near the processing
facility. Each would be approximately 18 m (60 ft) by 70 m (230 ft) by 4 m
(13 ft) high. Buildings could be higher if required by the fire protection
system, but a dry standpipe fire suppression system would likely be adequate
if combustible material use could be minimized. Floors would be reinforced
concrete slabs approximately 15 cm (6 in.) thick. No insulation, heating, or
cooling needs would be expected, but roof ventilators would be required. Road
construction should be minimal. Drums could be . brought into the facility by
either truck or rail.
Approximately 4.6 metric tons (5 tons) of plutonium dioxide would be
produced and require suitable storage in the PFP (modified 2736-ZB) or a newly
constructed facility. With an average processing rate of 23 kg/wk (50 lb/wk),
3.38
Foreign Processing Alternative
shipments would be expected approximately three times every 2 weeks over a
4-year campaign, and approximately 300 plutonium shipments to the PFP would be
required. U.S. Department of Transportation (DOT) Specification 6M containers
would be used for transport. Expansion of existing vault capacity or addi-
tional facilities might be required depending on national plutonium management
decisions, that might relocate the plutonium inventory to or from the PFP and
might result in concentration of existing plutonium inventories.
High-level waste would be transferred to the Hanford DSTs via under-
ground piping. The processing schedule would be developed to enable use of
existing DSTs rather than constructing new tanks.
K Basins Deactivation
K Basins deactivation would be consistent with actions and impacts
described for the new wet storage alternative in Section 3.2.3. In the onsite
processing alternative, providing for deactivation and decommissioning of the
temporary storage/staging and processing facility at the conclusion of the
campaign would also be necessary.
3.2.7 Foreign Processing Alternative
Foreign processing of K Basins SNF would include up to 40-year storage_
of returned uranium trioxide and plutonium dioxide, and vitrified high-level
waste. Foreign processing is depicted schematically with onsite processing inFigure 3-9. Except for the transportation step, the reference options areessentially the same as those for the onsite processing alternative.
As in the case of onsite processing, the foreign processing alternative
might be employed in the future in conjunction with any of the interim-storage
alternatives, if it were to facilitate ultimate disposition of SNF.
For foreign processing, the custody of the packaged SNF wouldbe trans-
ferred to a foreign enterprise that would assume responsibility for trans-
oceanic transport and for processing to forms suitable for storage. Fuel
transfer and management assumptions are based on information provided by
British Nuclear Fuels Limited, Inc. (BNFL), which has previously expressed
interest in processing the K Basins SNF at Sellafield in the United Kingdom.
The BNFL information would be representative of expected Hanford Site impacts
should the fuel be transferred for processing to the United Kingdom or another
foreign location. Use of the cited BNFL information in this EIS should not be
construed as DOE endorsement of any BNFL processing proposals.
3.39
Foreign Processing Alternative
Reference options in this approach include:
• continued operation of the K Basins until the SNF, sludge, and debris
removal and water disposition are completed
• dispositioning sludge, debris, and basin water at the Hanford Site as in
the onsite processing alternative
• modifying the K Basins cask load-out facilities or constructing a
transloading facility to accommodate overseas transport casks
• packaging N Reactor SNF from both basins
• shipping the SNF overland to a dock on the Columbia River for shipment
by barge to overseas shipping facilities at Vancouver, Washington
• transferring custody of the SNF to the foreign enterprise and shipping
the SNF overseas
• processing the SNF overseas
• returning the separated materials to the Hanford Site for interim dry
storage (recovered uranium might be stored elsewhere in the U.S.)
• prepare the K Basins for deactivation and turn over to decontamination
and decommissioning program.
A summary schedule of activities in the foreign processing alternative
is shown in Figure 3-11. The schedule in Figure 3-11 assumes maximum cask
payloads within a short time frame and that, based on SNF characteristics and
existing available licensed casks, as many as 4,000 shipments might be
required because of smaller allowed payloads and longer shipping times.
Temporary storage of the SNF in a new staging facility before shipment
overseas might be implemented if fuel receipt schedules by the foreign enter-
prise would cause prolonged storage of SNF at the K Basins.
Packaging, Transport, and Processing
The canisters of SNF are assumed to be loaded into existing K Basins
casks for transfer to a transloading facility. At the transloading facility,
3.40
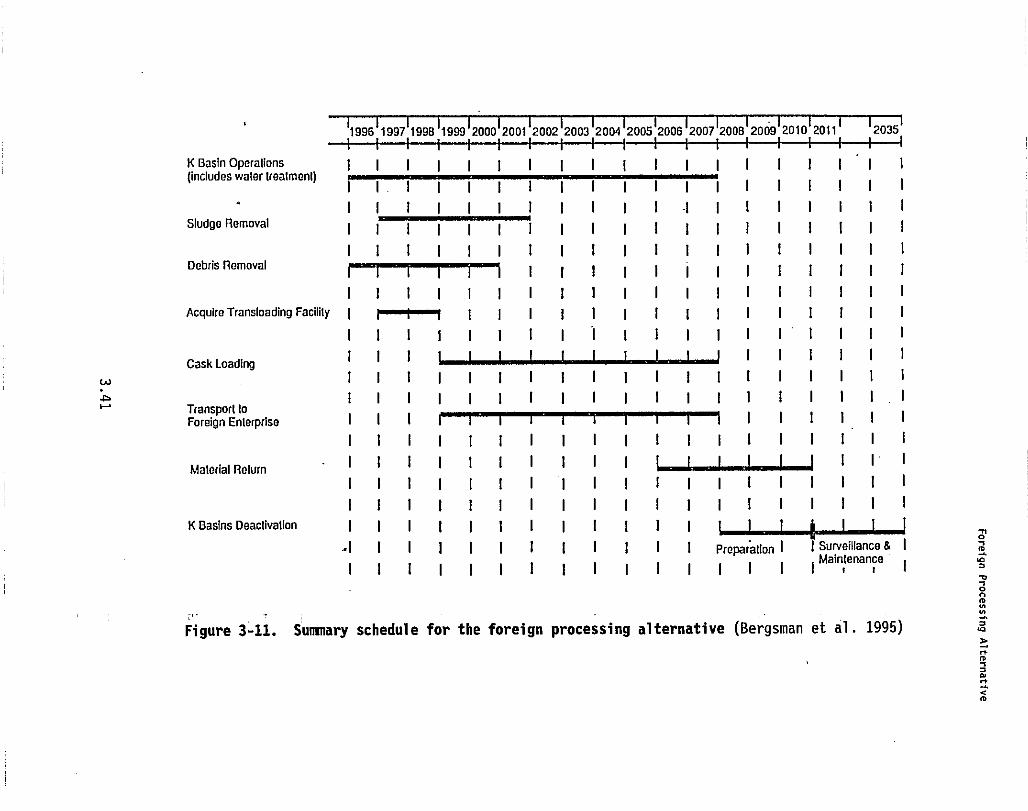
w:A
2010'2011
K Basin Operations I I I I I 1 I 1 I I I I I I I I I I I(includes water treatment)
I I I I I I I 1 1 1 1 1 1 1 1 1 1 1 1
° I I i I I I 1 I I I I -I I I I I I I ISludge Removal I 1 I i I I I I I I i I I I I I I I I
1 1 1 1 1 1 1 1 1 1 1 1 1 1 1 1 1 1 1
Debris Removal I I I I I I I I i I I I I
I I I I I I I i l l l l i l l l l l l
Acquire Transloading Facility 1 )--^^1 1 I I I I I I I I I I I I I I
I I I I I I I I I I I I I I I I I I I
Cask Loading I I I I I I i I I I I I I I I I I I
I I I I I I I I I I I I I I I I I I I
1 1 1 1 1 1 1 1 1 1 1 1 1 1 1 1 1 1 1
Transport toForeign Enterprise I I I I I I I I I
I I I I I I I I I I I I I I I I I I I
Material Re turn I I I I 1 I I I I I f I I I I I I I' I
1 1 1 1 1 1 1 I I I i l l l l l l l l
I I I I I I I I I I I I I I I I I I I
K Basins Deactivation I I I I I I I I I I I I 1 I^I
-I I I I I I i I I I I 1 Preparation I I Su rveillance a l
I I I I I I I I I I 1 I I I I I Maintenance
Figure 3-11. Summary schedule for the foreign processing alternative (Bergsman et al. 1995)
0
0
NN
aMmzaw
m
Foreign Processing Alternative
the canisters would be transferred to an internationally licensed cask, such
as the Chaplecross Magnox cask. (The K Basins cranes have insufficient capac-
ity to load the Chaplecross casks.)
The casks could be transported by truck, rail, or barge from the Hanford
Site to a northwest port for loading on a BNFL ship. (The SNF could also be
shipped on rail cars to port facilities at Bremerton, Washington, or by rail
or truck to Norfolk, Virginia.) The assumption is that the SNF would be
transported by road or rail to a location on the Columbia River suitable for
loading the casks on a barge for shipment to port facilities at Vancouver,
Washington; however, the actual shipping/receiving port is speculative. The
proposed barge capacity of 24 casks corresponds to a BNFL shipload. A more
complete range of possible shipping/receiving ports is discussed in DOE
(1995h) .
Ships employed by BNFL would comply with international agreements
governing shipment of irradiated materials and would be approved by the
U.S. Coast Guard.
If dictated by schedule constraints, the SNF would be transported to a
new staging facility for temporary storage as described in Section 3.2.3.
From the temporary storage location, the fuel would then be transloaded into
the Magnox Cask for transport overseas as described previously.
At the overseas site, the assumption is that the fuel would be dissolvedin a new chop/leach process facility. The resulting solution would contain
the dissolved uranium, plutonium, and fission products. Fuel hulls and any
shear overcans do not dissolve in the chop/leach process. The hulls and shear
overcans would be mixed with other solid waste and cemented in waste
containers.
The separations processes produce uranium, plutonium, and high-level
waste streams. The recovered uranium would be converted to uranium trioxide
and placed in 55-gal drums. The plutonium would be converted to plutonium
dioxide. The high-level waste would be vitrified in borosilicate glass and
would occupy about 500 half-ton containers.
Returned,Uranium Trioxide
Processing of all the N Reactor spent fuel would result in the return of
approximately 2,500 metric tons (2,800 tons) of purified uranium as uranium
trioxide. The returned uranium would likely become the property of the
U.S. Enrichment Corporation, a quasi-public agency of the U.S. Government that
3.42
Foreign Processing Alternative
owns the uranium processing facilities at Paducah, Kentucky, and Portsmouth,
Ohio. The uranium would be shipped in 55-gal drums as low-specific activity
material. The uranium can be considered an asset to be sold, if a market
exists at the time it is returned, or dispositioned , as contact-handled low-
level waste. Using the maximum weight limit for a 55-gal drum of 380 kg
(840 lb), the 2,500 metric tons (2,800 tons) of uranium trioxide would require
approximately 6,600 drums. If the uranium were to be returned to Hanford, it
would be returned on an ocean vessel..from the foreign.enterprise and trans-
ported to Hanford via barge to a Hanford dock and rail or truck to the storage
facility.
Storage of uranium on the Hanford Site would be the same as described in
Section 3.2.6 for onsite processing.
Returned Plutonium Dioxide
About 4.6 metric tons (5 tons) of plutonium as plutonium dioxide would
be returned to the U.S. on a military ship and unloaded at the Bremerton Naval
Shipyard or other U.S. Navy installation. Safe secure transport vehicles,
routinely used by DOE for transport of special nuclear materials, would be
used to transport the plutonium to the Hanford Site.
The safe secure transport vehicles would be unloaded at the vault
facilities and plutonium dioxide storage would be essentially the same as
described for the onsite processing alternative.
Returned Vitrified Waste
The vitrified waste would be transported to the U.S. on an ocean vessel
through a northwest port. Because of the size of the shipping casks required
to return the containers [100 metric tons (110 tons)], the assumption is that
the casks would be returned by rail to the Hanford Site and unloaded directly
at the storage facility planned for vitrified tank waste. Each cask would
hold 21 vitrified waste containers, requiring approximately 25 cask shipments.
The 500 half-ton containers of vitrified waste that would be returned
from the foreign processor may be stored at Hanford.
If contracted to process the K Basins SNF, BNFL has proposed that they
retain and store the special nuclear material for 5 years and the vitrified
high-level waste until such time as a permanent geologic repository becomes
available. Secondary low-level waste would be retained and disposed of by the
foreign enterprise. Other variations on this alternative include having the
3.43
Alternatives Dismissed
special nuclear materials and the vitrified high-level waste retained and
stored at the processing site until 2035 or having them returned to a desti-
nation in the U.S. other than the Hanford Site.
K Basins Deactivation
K Basins deactivation would be consistent with actions and impacts
described for the new wet storage alternative in Section 3.2.3. In the
foreign processing alternative, the deactivation of the transloading and
staging facilities, if employed, would need to be provided at the conclusion
of the shipping campaign.
3.2.8 Alternatives Considered but Dismissed from Detailed Evaluation
The following alternative was also evaluated by DOE (DOE 1995a). How-
ever, because it was not adopted in a record of decision (ROD) based on the
referenced EIS (DOE 1995a) and published on June 1, 1995, the alternative was
dismissed from detailed evaluation in this EIS. The ROD specified that
Hanford production reactor fuel would remain under management at the Hanford
Site for up to 40 years pending decisions on ultimate disposition. The
alternative was as follows:
• offsite disposition: remove K Basins SNF and transfer to another DOE.
site for storage and/or processing.
A description of impacts associated with this alternative may be found
in DOE (1995a).
Three other alternatives were suggested during the scoping process that
were considered but dismissed from detailed analysis. These were as follows:
• WNP-4 wet storage: remove K Basins SNF and transfer to wet storage in
modified WNP-4 Spray Cooling Pond. The WNP-4 Spray Cooling Pond, like
the K Basins, has the disadvantage of being near the Columbia River. It
has no obvious environmental advantages over the reference site or CSB
site and would require acquisition from the Washington Public Power
Supply System, which would likely require considerable time to negotiate
thereby precluding expeditious removal of the SNF from the K Basins.
• N Reactor Basin storage: remove K Basins SNF and transfer to wet
storage in N Reactor Basin. The principal reason for dismissing the
3.44
Comparison of Impacts
N Reactor Basin from detailed analysis is that the basin is not large
enough to accommodate the K Basins fuel. It also has the disadvantages
of being over 30 years old and near the Columbia River.
FFTF/FMEF storage: remove K Basins SNF and transfer to dry storage at
the FFTF/FMEF facilities in the 400 Area. The FMEF itself is not large
enough to accommodate dry storage of K Basins SNF. With modification,
the FMEF could be used as a support facility to an adjacent newly
constructed dry storage facility. Although the 400 Area-has already
been disturbed, there appear to be no environmental advantages to
storing SNF there as compared to the reference site or CSB site. In
addition, the 400 Area is off the 200 Areas plateau which, because of
its remoteness and greater distance to ground water, is being emphasized
for consolidation of waste management activities.
3.3 Comparison of Impacts Among the Alternatives
Table 3-2 provides a comparative summary of environmental impacts among
the alternatives.
As shown in Table 3-2, land committed to facilities only would vary from
no additional land use for new facilities in the no action and enhanced
K Basins storage alternatives to about 3 ha (6 acres) for dry cask storage,
which at most is small compared to the already industrialized area.
Because of the need for laydown areas, roadways, etc., construction
would require disturbance of a larger amount of land than occupied by new
facilities. The amount of land disturbed or shrub-steppe habitat destroyed
would range from zero for the no action and enhanced K Basins storage alterna-
tives to 8 ha (20 acres) for the onsite processing alternative. If the CSB
site were chosen, no additional habitat would be disturbed, because the site
is already within the developed 200 East Area. Even at the reference site,
the high end of the range of habitat destruction is relatively small. How-
ever, because such an activity would further fragment shrub-steppe habitat, it
is expected that this habitat destruction would be mitigated by nurturing
shrub-steppe species in other areas, for example those that had been burned
out by range fires.
Total employment would range among the alternatives from about
4,000 worker-years for the preferred alternative (drying/passivation) to
17,000 worker years in the onsite processing alternative. Thus, in terms of
man-power, the preferred alternative would represent a considerable savings.
3.45
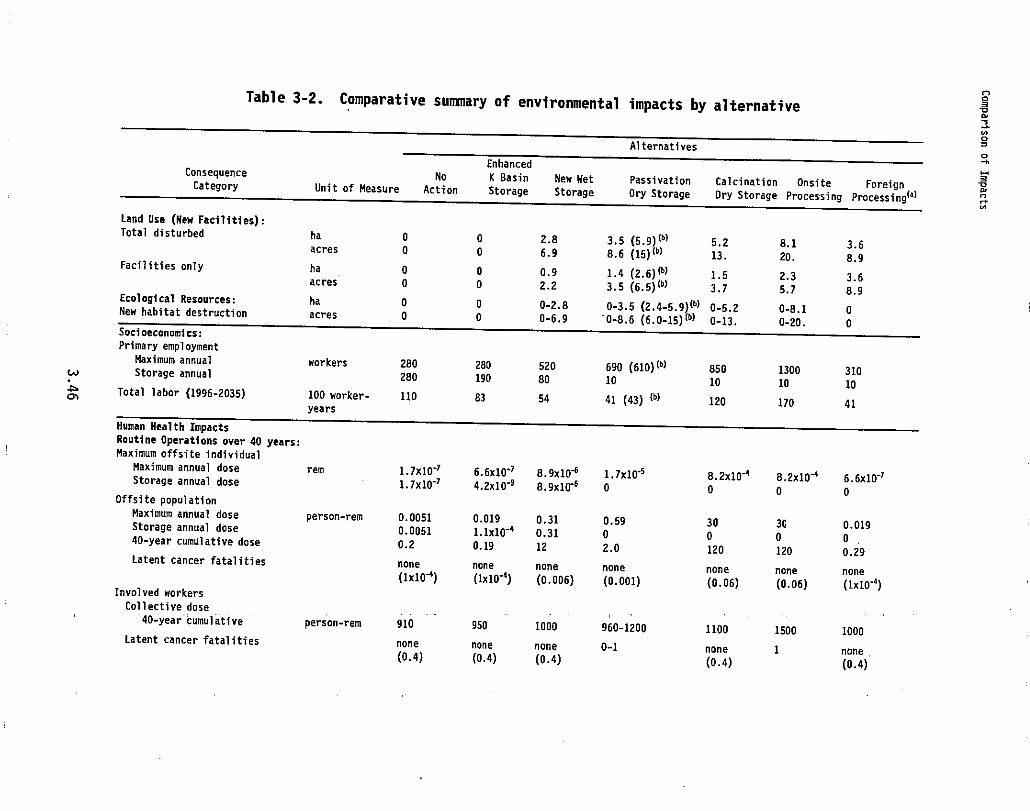
n
vzNO
0
a
KN
w
.arn
Table 3-2. Comparative summary of environmental impacts by alternative
Consequence
CategoryNo
Unit of Measure Action
Enhanced
K Basin
StorageNew Net
Storage
Alternatives
Passivation
Dry StorageCalcination OnsiteDry Storage Processing
Foreign
Processing(a)
Land Use (New Facilities):
Total disturbed ha 0 0 2.8 3.5 (5.9) (6) 5.2 8.1 3.6acres 0 0 6.9 8.6 (15) 161 13. 20. 8.9Facilities only ha 0 0 0.9 1.4 (2.6) 161 1.5
acres 0 0 2.2 3.5 (6.5) 16) 3.7
2.3
5.73.6
8.9Ecological Resources: ha 0 0 0-2.8 0-3.5 (2.4-5.9)(b) 0-5.2 0-8.1 0New habitat destruction acres 0 0 0-6.9 -0-8.6 (6.0-15) (1) 0-13. 0-20. 0Socioeconomics:
Primary employment
Maximum annual
Storage annualworkers 280 280 520 690 (610) (b) 850 1300 310
280 190 80 10 10 10 10Total labor (1996-2035) 100 worker- 110 83 54 41 (43) (b) 120
years170 41
Human Health Impacts
Routine Operations over 40 years:
Maximum offsite individual
Maximum annual dose rem 1.7x10' 6.6x10'' 8.9x10'6 1.7x10'' 8.2x10⁻⁴ 8.2x10 6.6x10'Storage annual dose 1.7x10' 4.2x10'9 8.9x10"6 0 0 0 0Offsite population
Maximum annual dose person-rem 0.0051 0.019 0.31 0.59 30 30Storage annual dose 0.0051 1. Ix10'4 0.31 0 00.019
40-year cumulative dose 0.2 0.19 12 2.0 120
0
120
0
Latent cancer fatalities none none none none none none
0.29
none(1x10'4) (1x10'4) (0.006) (0.001) (0.06) (0.06) (1x10'4)
Involved workers
Collective dose
40-year"cumulative person-rem 910 950 1000 960-1200 1100 1500 1000Latent cancer fatalities none none none 0-1 none 1
(0.4) (0.4) (0.4) (0.4)none
(0.4).
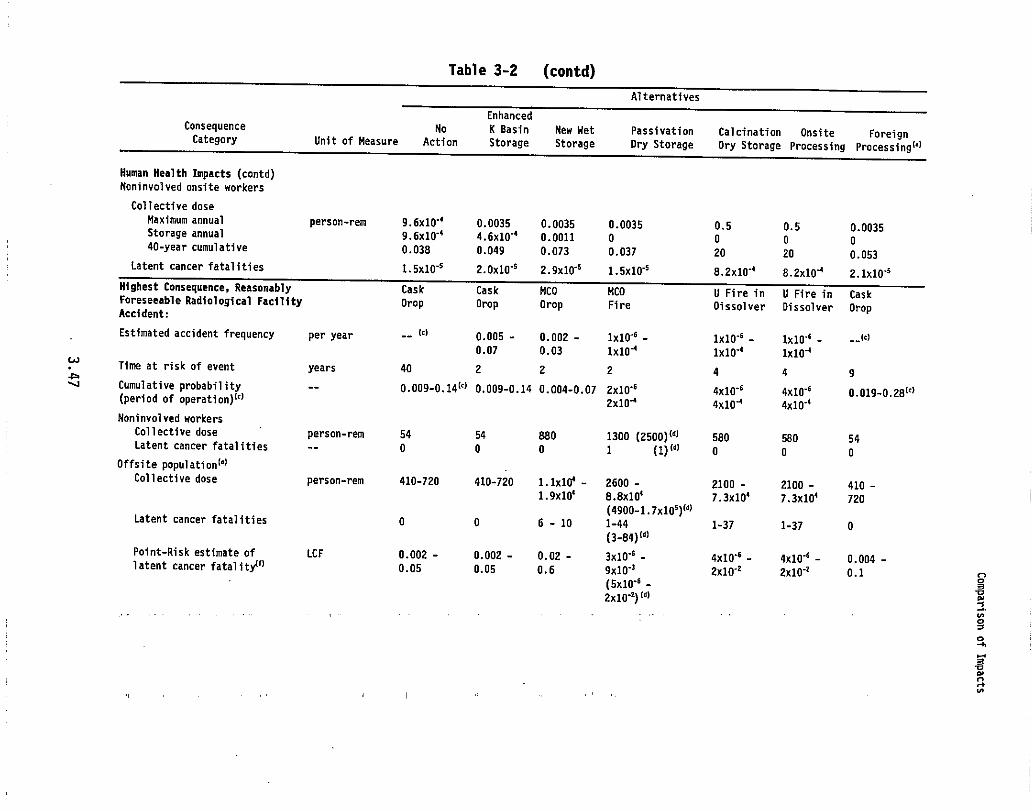
Table 3-2 (contd)
Alternatives
tnnancedConsequence No K Basin New Met Passivation Calcination Onsite ForeignCategory Unit of Measure Action Storage Storage Dry Storage Dry Storage Processing Processing(')
Human Health Impacts (contd)
Noninvolved onsite workers
Collective dose
Maximum annual person-rem 9.6x10'' 0.0035 0.0035 0.0035 0.5 0.5 0.0035Storage annual 9.6x10'' 4.6x10'' 0.0011 0 0 0 040-year cumulative 0.038 0.049 0.073 0.037 20 20 0.053
Latent cancer fatalities 1.5X10'5 2.0x10'5 2.9X10"1 1.5x10'5 8.2x10'' 8.2x10'' 2.1x10'5Highest Consequence, Reasonably Cask Cask MCO MCO U Fire in U Fire in CaskForeseeable Radiological Facility Drop Drop Drop Fire Dissolver Dissolver DropAccident:
Estimated accident frequency per year -- (0 0.005 - 0.002 - 1x10"1 - 1x10'1 - 1x10'10.07 0.03 1x10⁴ 1x10'' 1x10"'
Time at risk of event years 40 2 2 2 4 4 9A14 Cumulative probability -- 0.009-0.14(e) 0.009-0.14 0.004-0.07 2x10'1 4x10"' 4x10'1 0.019-0.28("
(period of operation)" 2x10⁴ 4x10⁴ 4x10''Noninvolved workers
Collective dose person-rem 54 54 880 1300 (2500) (d) 580 580 54Latent cancer fatalities -- 0 0 0 1 (1) (d)
0 0 0Offsite populationle)
Collective dose person-rem 410-720 410-720 1.1x10' - 2600 - 2100 - 2100 - 410 -1.9x10' 8.840' 7.3x10' 7.3x10' 720
(4900-1.7x10⁵)(")Latent cancer fatalities 0 0 6- 10 1-44 1-37 1-37 0
(3-84)'")Point-Risk estimate of LCF 0.002 - 0.002 - 0.02 - 3x10'1 - 4x10'' - 4x10"1 - 0.004 -latent cancer fatality( f) 0.05 0.05 0.6 9x10' 2x10'' 2x10 -1
0.1" (5x10" -
r,
2x10"2) (d) YO
OT
vdn
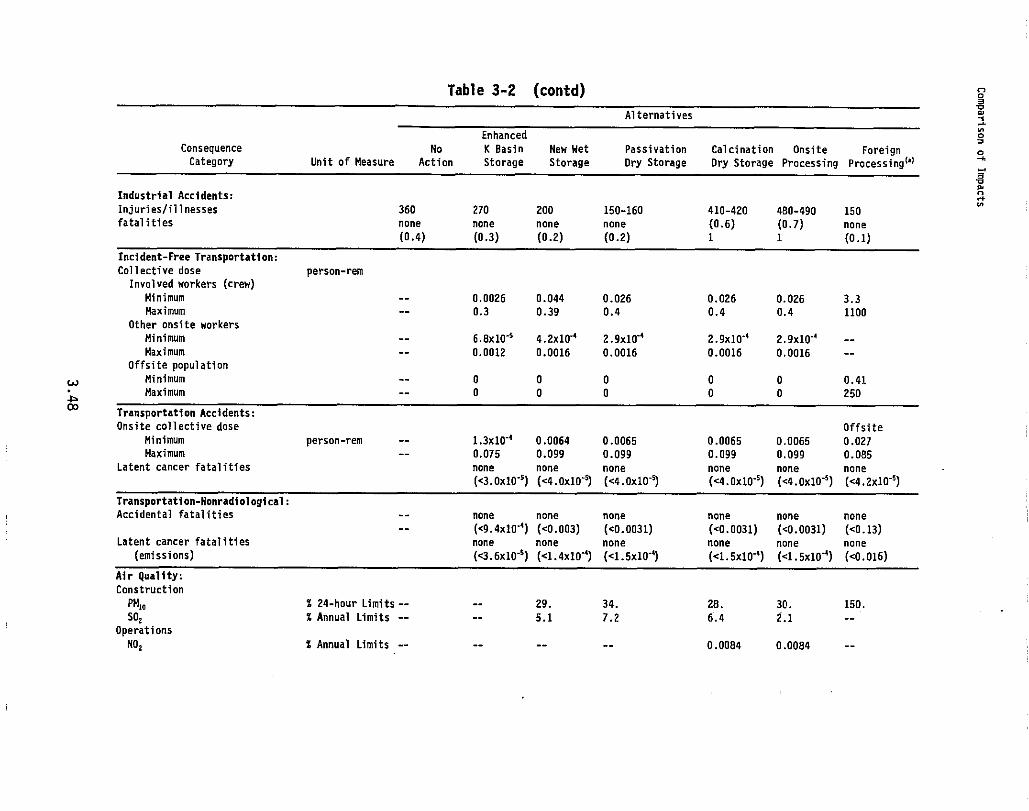
Table 3-2 (contd)a
Alternatives
i
Enhanced N
Consequence No K Basin New Net Passivation Calcination Onsite Foreign
0Category Unit of Measure Action Storage Storage Dry Storage Dry Storage Processing Processing(')
a,
3vN
Industrial Accidents:
Injuries/illnesses 360 270 200 150-160 410-420 480-490 150fatalities none none none none (0.6) (0.7) none
(0.4) (0.3) (0.2) (0.2) 1 1 (0.1)
w
coco
Incident-Free Transportation:
Collective dose person-rem
Involved workers (crew)
Minimum -- 0.0026 0.044 0.026 0.026 0.026 3.3Maximum -- 0.3 0.39 0.4 0.4 0.4 1100
Other onsite workers
Minimum -- 6.8x10"' 4.2x10' 2.9x10'" 2.9x10' 2.9x10'' --Maximum -- 0.0012 0.0016 0.0016 0.0016 0.0016 --
Offsite population
Minimum -- 0 0 0 0 0 0.41Maximum -- 0 0 0 0 0 250
Transportation Accidents:
Onsite collective dose
Minimum
Maximum
Offsite
person-rem -- I.3x10-4 0.0064 0.0065 0.0065 0.0065 0.027
-- 0.075 0.099 0.099 0.099 0.099 0.085
Latent cancer fatalities none none none none none none
(<3.Ox10"') (<4.Ox10'') (<4.OxIO") (<4.Ox10'') (<4.Ox10'') (<4.2x10-')
Transportation-Nonradiological:
Accidental fatalities -- none none none none none none
-- (<9.4x10⁻⁴) (<0.003) (<0.0031) (<0.0031) (<0.0031) (<0.13)Latent cancer fatalities none none none none none none
(emissions) (<3.6x10'') (<1.4xiO"4) (<1.5x10'') (<1.5x10'4) (<1.5x10"4) (<0.016)
Air Quality:
Construction
PM10% 24-hour Limits -- -- 29. 34. 28. 30. 150.
so, % Annual Limits -- -- 5.1 7.2 6.4 2.1 --Operations
NO, % Annual Limits -- -- -- -- 0.0084 0.0084 --
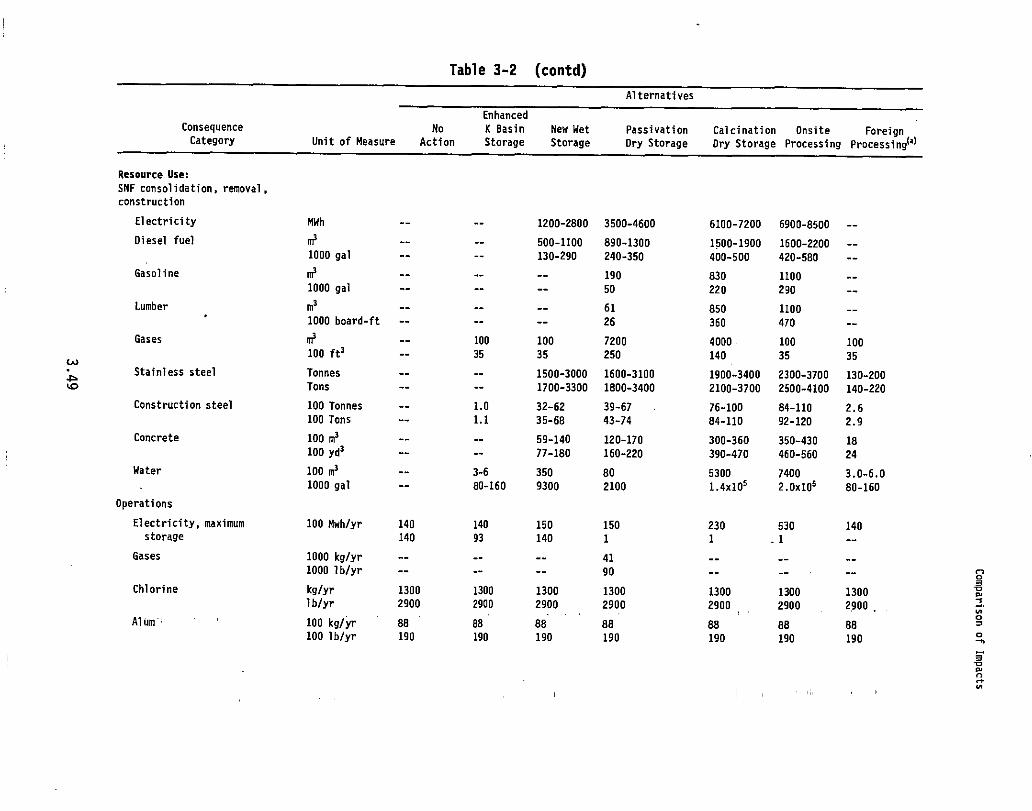
Table 3-2 (contd)
Consequence
Category Unit of Measure
No
Action
Enhanced
K Basin
Storage
New Net
Storage
Alternatives
Passivation
Dry Storage
Calcination
Dry Storage
Onsite
Processing
Foreign
Processing(a)
Resource Use:
SNF consolidation, removal,
construction
Electricity MWh -- -- 1200-2800 3500-4600 6100-7200 6900-8500 --
Diesel fuel 0 -- -- 500-1100 890-1300 1500-1900 1600-2200 --1000 gal -- -- 130-290 240-350 400-500 420-580 --
Gasoline m3 -- -- -- 190 830 1100 --1000 gal -- -- -- 50 220 290 --
Lumber m3 -- -- -- 61 850 1100 --' 1000 board-ft -- -- -- 26 360 470 --
Gases m3 -- 100 100 7200 4000- 100 100100 ft3 -- 35 35 250 140 35 35
wA Stainless steel Tonnes -- -- 1500-3000 1600-3100 1900-3400 2300-3700 130-200o Tans -- -- 1700-3300 1800-3400 2100-3700 2500-4100 140-220
Construction steel 100 Tonnes -- 1.0 32-62 39-67 - 76-100 84-110 2.6100 Tans -- 1.1 35-68 43-74 84-110 92-120 2.9
Concrete 100 m3 -- -- 59-140 120-170 300-360 350-430 18100 yd3 -- -- 77-180 160-220 390-470 460-560 24
Water 100 m3 -- 3-6 350 80 5300 7400 3.0-6.01000 gal -- 80-160 9300 2100 1.4x10⁵ 2.0x10⁵ 80-160
Operations
Electricity, maximum 100 Mwh/yr 140 140 150 150 230 530 140storage 140 93 140 1 1 . 1 --
Gases 1000 kg/yr -- -- -- 41 __
1000 lb/yr -- -- -- 90 -- -- --
Chlorine kg/yr 1300 1300 1300 1300 1300 1300 1300lb/yr 2900 2900 2900 2900 2900 2900 2900
Alum 100 kg/yr 88 88 88 88 88 88 88100 lb/yr 190 190 190 190 190 190 190
09aYN
aannN
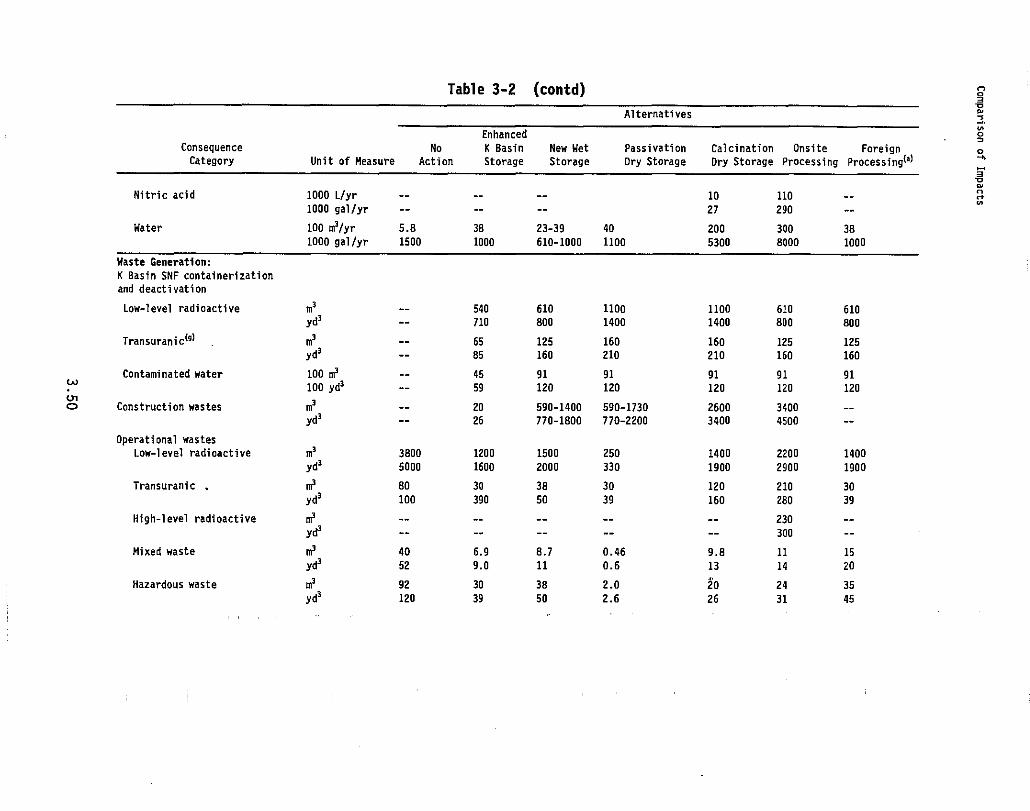
Table 3-2 (contd)wzN
0-n
vww
Wcn0
Alternatives
Enhanced
Consequence No K Basin New Wet Passivation Calcination Onsite Foreign
Category Unit of Measure Action Storage Storage Dry Storage Dry Storage Processing Processing(a)
Nitric acid 1000 L/yr -- -- -- 10 110 --
3000 gal/yr -- -- -- 27 290 --
Water 100 0/yr 5.8 38 23-39 40 200 300 38
1000 gal/yr 1500 1000 610-1000 1100 5300 8000 1000
Waste Generation:
K Basin SNF containerization
and deactivation
Low-level radioactive m3 -- 540 610 1100 1100 610 610
yd3-- 710 800 1400 1400 800 800
Transuranic (g) m3 -- 65 125 160 160 125 125
yd3-- 85 160 210 210 160 160
Contaminated water 100 m3-- 45 91 91 91 91 91
100 yd3-- 59 120 120 120 120 120
Construction wastes m3 -- 20 590-1400 590-1730 2600 3400 --
yd3-- 26 770-1800 770-2200 3400 4500 --
Operational wastes
Low-level radioactive m3 3800 1200 1500 250 1400 2200 1400
yd3 5000 1600 2000 330 1900 2900 1900
Transuranic m3 80 30 38 30 120 210 30
yd3 100 390 50 39 160 280 39
Nigh-level radioactive m3 -- -- -- -- -- 230 --
A3 '- -' -- -- -- 300 --
Mixed waste m3 40 6.9 8.7 0.46 9.8 11 15
yd3 52 9.0 11 0.6 13 14 20
Hazardous waste m3 92 30 38 2.0 20 24 35
yd3 120 39 50 2.6 26 31 45
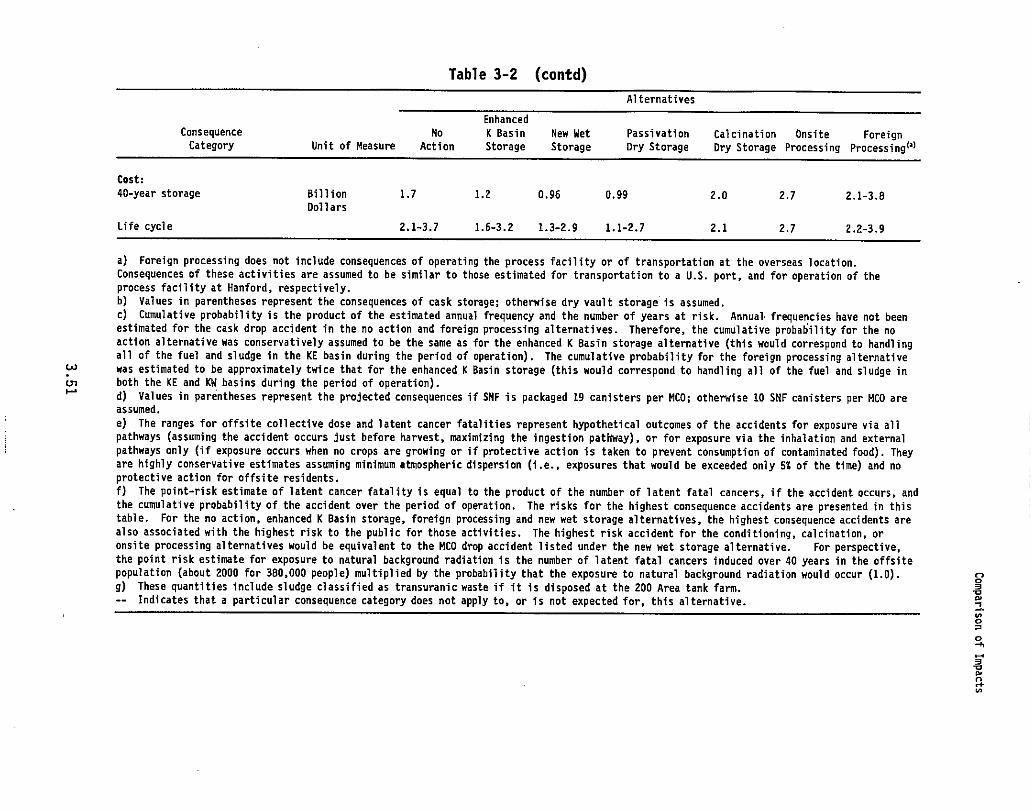
Wwr
Table 3-2 (contd)
Alternatives
Enhanced
Consequence No K Basin New Net Passivation Calcination Onsite ForeignCategory Unit of Measure Action Storage Storage Dry Storage Dry Storage Processing Processing(')
Cost:
40-year storage Billion 1.7 1.2 0.96 0.99 2.0 2.7 2.1-3.8Dollars
Life cycle 2.1-3.7 1.6-3.2 1.3-2.9 1.1-2.7 2.1 2.7 2.2-3.9
a) Foreign processing does not include consequences of operating the process facility or of transportation at the overseas location.
Consequences of these activities are assumed to be similar to those estimated for transportation to a U.S. port, and for operation of the
process facility at Hanford, respectively.
b) Values in parentheses represent the consequences of cask storage; otherwise dry vault storage is assumed.
c) Cumulative probability is the product of the estimated annual frequency and the number of years at risk. Annual . frequencies have not been
estimated for the cask drop accident in the no action and foreign processing alternatives. Therefore, the cumulative probability for the no
action alternative was conservatively assumed to be the same as for the enhanced K Basin storage alternative (this would correspond to handling
all of the fuel and sludge in the KE basin during the period of operation). The cumulative probability for the foreign processing alternative
was estimated to be approximately twice that for the enhanced K Basin storage (this would correspond to handling all of the fuel and sludge in
both the KE and KW basins during the period of operation).
d) Values in parentheses represent the projected consequences if SNF is packaged 19 canisters per MCO; otherwise 10 SNF canisters per MCO are
assumed.
e) The ranges for offsite collective dose and latent cancer fatalities represent hypothetical outcomes of the accidents for exposure via all
pathways (assuming the accident occurs just before harvest, maximizing the ingestion pathway), or for exposure via the inhalation and external
pathways only (if exposure occurs when no crops are growing or if protective action is taken to prevent consumption of contaminated food). They
are highly conservative estimates assuming minimum atmospheric dispersion (i.e., exposures that would be exceeded only 5% of the time) and no
protective action for offsite residents.
f) The point-risk estimate of latent cancer fatality is equal to the product of the number of latent fatal cancers, if the accident occurs, and
the cumulative probability of the accident over the period of operation. The risks for the highest consequence accidents are presented in this
table. For the no action, enhanced K Basin storage, foreign processing and new wet storage alternatives, the highest consequence accidents are
also associated with the highest risk to the public for those activities. The highest risk accident for the conditioning, calcination, or
onsite processing alternatives would be equivalent to the MCO drop accident listed under the new wet storage alternative. For perspective,
the point risk estimate for exposure to natural background radiation is the number of latent fatal cancers induced over 40 years in the offsite
population (about 2000 for 360,000 people) multiplied by the probability that the exposure to natural background radiation would occur (1.0).
g) These quantities include sludge classified as transuranic waste if it is disposed at the 200 Area tank farm.
-- Indicates that a particular consequence category does not apply to, or is not expected for, this alternative.
0viNO
OM
3Vwnrt
Comparison of Impacts
Human health impacts among the public and workers from routine opera-
tions and incident-free transportation would vary among the alternatives; how-
ever, values were very small fractions of the annual variation in natural
background radiation at any given location.
In the case of accidents there were scenarios where latent cancer
fatalities would be inferred if the accident were to happen. However, taking
the probability of the accidents occurring into account, the risk to public
health and safety was found to be very small. In quantitative terms, multi-
plying the consequences of the accidents with the estimated annual frequency
and the number of years at risk, the point-risk estimate of latent cancer
fatalities in all cases did not exceed 1 latent cancer fatality (for perspec-
tive, the point-risk estimate of latent cancer fatalities for natural back-
ground radiation for this population (380,000) and period would be about
2,000 latent cancer fatalities).
Impacts would occur on air quality during construction activities for
all but the no action and enhanced K Basins storage alternatives. The princi-
pal impact would be from particulates from use of earthmoving equipment. In
all cases standard dust suppression techniques would be used to mitigate
particulate emissions. For all alternatives releases of radionuclides during
routine operations would result in doses well below EPA's 0.1-mrem/year
reporting level.
Except for the no action and enhanced K Basins storage alternative, com-mitments of resources (other than water, gases, and nitric acid) were within a
factor of 3 to 4 for all alternatives (it being assumed that resources equiva-
lent to onsite processing would be required for foreign processing). The
requirement for water in the onsite processing alternative would be about
10 times that in the preferred alternative; however, large water requirements
would not be critical because of the abundance of water available from the
Columbia River (maximum requirement of about 0.001% of annual flow) and would
be within capacity of existing supply lines. Although not required in other
alternatives, sizeable quantities of gases, principally inert gases, would be
required in the preferred alternative; however, there is no indication that
these are in short supply. Nitric acid would be required in quantity for the
calcination and 10 times that in the processing alternatives, but not in the
other alternatives. Again, nitric acid is not in short supply, however it
would be reclaimed as practicable.
While wastes would be generated in the process of implementing any of
the alternatives, none of the wastes described would significantly impact
Hanford's present capacity to store (as in the case of high-level and TRU
3.52
Comparison of Impacts
waste) or to dispose of low-level waste. Even in the case of high-level waste
from onsite processing the amount represents less than 10% of the now
remaining DST capacity.
Costs of implementing 40-year storage would range from about $1 to
$4 billion. At the low end of about $1 billion were the enhanced K Basins
storage and new wet storage alternatives, and the preferred alternative. The
no action and calcine alternatives would cost about $2 billion and onsite
processing about $3 billion.. Cost, of foreign processing would range from
about $2 to $4 billion. If one presumed that p `roces'sing of SNF would be
required before repository acceptance, the life-cycle costs would be about
$3 billion for the enhanced K Basins storage, new wet storage, preferred, and
onsite processing alternatives and about $4 billion for the no action and
foreign processing alternatives.
3.53
to ^'';^^^-,^,,,`^
4.0 AFFECTED ENVIRONMENT
Information in this chapter is tiered from Chapter 4 of Appendix A to
Volume 1 of the DOE SNF Programmatic Environmental Impact Statement (DOE SNF
PEIS) (DOE 1995a) and is, therefore, presented in extended summary form here.
More complete information on the affected environment may be found in the DOE
SNF PEIS and .in Cushing (1995).
I.4.1 Overview
The Hanford Site is characterized by a shrub-steppe habitat with large
sagebrush dominating the vegetative plant community. Jack rabbits, mice,
badgers, deer, elk, hawks, owls, and many other animals inhabit the Hanford
Site. The nearby Columbia River supports one of the last remaining spawning
areas for Chinook salmon and hosts a variety of other aquatic life. The
climate is dry with hot summers and usually mild winters. Severe weather is
rare. With construction of dams along the Columbia River, flooding is nearly
nonexistent.
The Hanford Site was a major contributor to national defense during
World War II and the Cold War era. The Site was selected because it was
sparsely settled, and the Columbia River provided an abundant supply of cold,
clean water to cool the reactors. As a result of wastes generated by these
national defense activities, four areas on the Hanford Site have been placed
on the National Priorities list by the U.S. Environmental Protection Agency(EPA) under the Comprehensive Environmental Response, Compensation, and
Liability Act (CERCLA). There are currently more than 1,500 waste management
units and four major groundwater contamination plumes on the Site that have
been grouped into 76 operable units. Each of these operable units is follow-
ing a schedule for clean-up established by the Hanford Federal Facility
Agreement and Consent Order (Tri-Party Agreement), among DOE, the Washington
State Department of Ecology (Ecology), and the EPA.
4.2 Land Use
The Hanford Site is used primarily by DOE. Public access is limited to
travel on two access roads as far as the Wye Barricade, on State Highway 240,
and on the Columbia River (Figure 4-1). The Site encompasses 1,450 km2
(560 mi 2), of which most is open vacant land with widely scattered facilities,
old reactors, and processing plants.
4.1
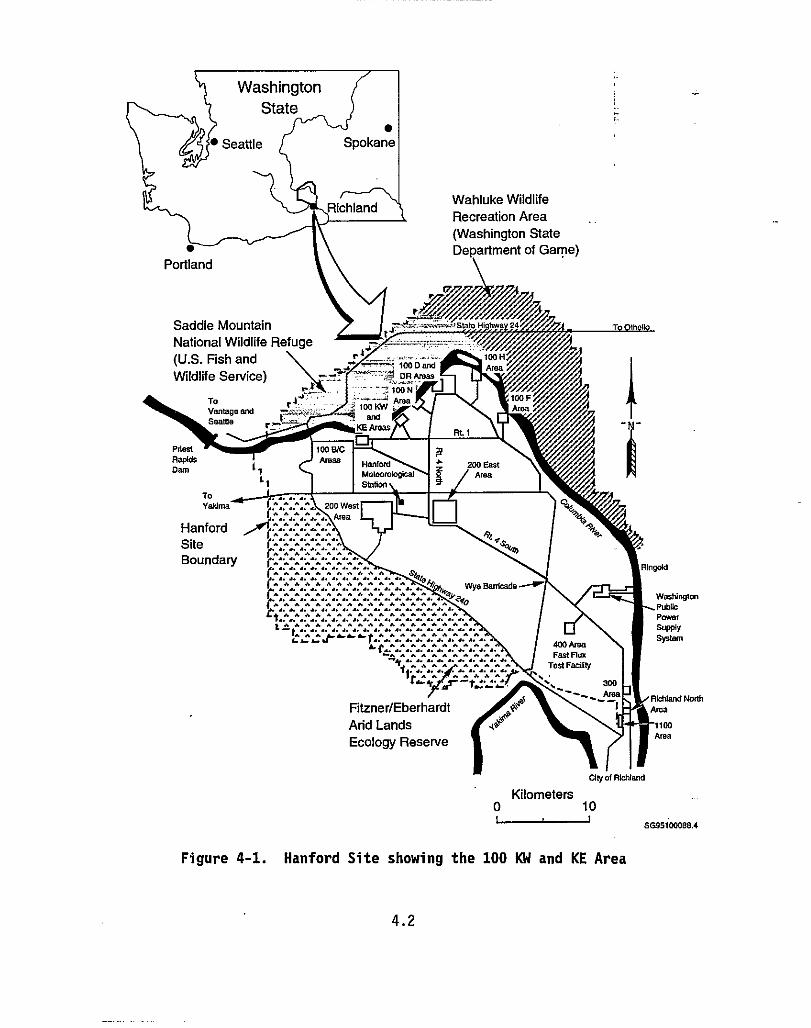
WashingtonState
Spokanepokane
Wahluke WildlifeRecreation Area(Washington StateDepartment of Game)
Portland
Saddle Mountain H' mV
National Wildlife Refuge(U.S. Fish and 100 D and Are
Wildlife Service) DR
NTO AmmVentage and
IN KWS
and r^KE Areas
settle
Rt I
Priest IGOO/CRapids Areas Hanford za
200 FaSDam Meteorological
StationTO
Yaldma200 WestArea
HanfordSiteBoundary
Wye Ban
4WAMFast Flux
Test Facility
300
Fitzner/EberhardtAdd LandsEcology Reserve
waswrowPublicPower
SupplySystem
Area
-11GOArea
City of Richland
Kilometers0 10
SW5100088.4
Figure 4-1. Hanford Site showing the 100 KW and KE Area
4.2
In the past, DOE has stated that it intends to maintain active institu-
tional control of the Hanford Site in perpetuity (DOE 1989). In the future,
DOE could release or declare excess portions of the Hanford Site not required
for DOE activities. Alternatively, Congress could act to change the manage-
ment or ownership of the Hanford Site. For a descriptive list of the DOE
operational areas, see the DOE SNF PEIS (DOE 1995a). Cushing (1995) describes
the areas within the Hanford Site that have been set aside as wildlife
refuges, wildlife management areas, or research areas.
The Columbia River adjacent to the Hanford Site is used by boaters,
water skiers, fishers, and hunters of upland game birds and migratory water-
fowl. Some land along the shore and on certain islands is accessible and
available for public use.
Land use adjacent to the Hanford Site to the southeast and generally
along the Columbia River includes residential, commercial, and industrial
development areas. The cities of Richland, Kennewick, and Pasco are located
along the Columbia River and are the closest major urban land uses adjacent to
the Hanford Site. These cities (known as the Tri-Cities) together support a
population of approximately 105,000.
Irrigated orchards and produce crops, dryland farming, and grazing are
also important land uses adjacent to the Hanford Site. Cushing (1995)
presents information on the various crops and harvests.
4.3 Socioeconomics
Activity on the Hanford Site plays a dominant role in the socioeconomics
of the Tri-Cities and other parts of Benton and Franklin counties. The agri-
cultural community also has a significant effect on the local economy. Any
major changes in Hanford activity would potentially most affect the Tri-Cities
and other areas of Benton and Franklin counties.
4.3.1 Employment and Income
Table 4-1 provides available data on the economic base of the Tri-Cities
area. Three major sectors have been the principal driving forces of the econ-
omy in the Tri-Cities since the early 1970s: 1) the DOE and its contractors
who operate the Hanford Site; 2) the Washington Public Power Supply System in
its construction and operation of nuclear power plants; and 3) an export-
oriented agricultural community, including a substantial food-processing
4.3
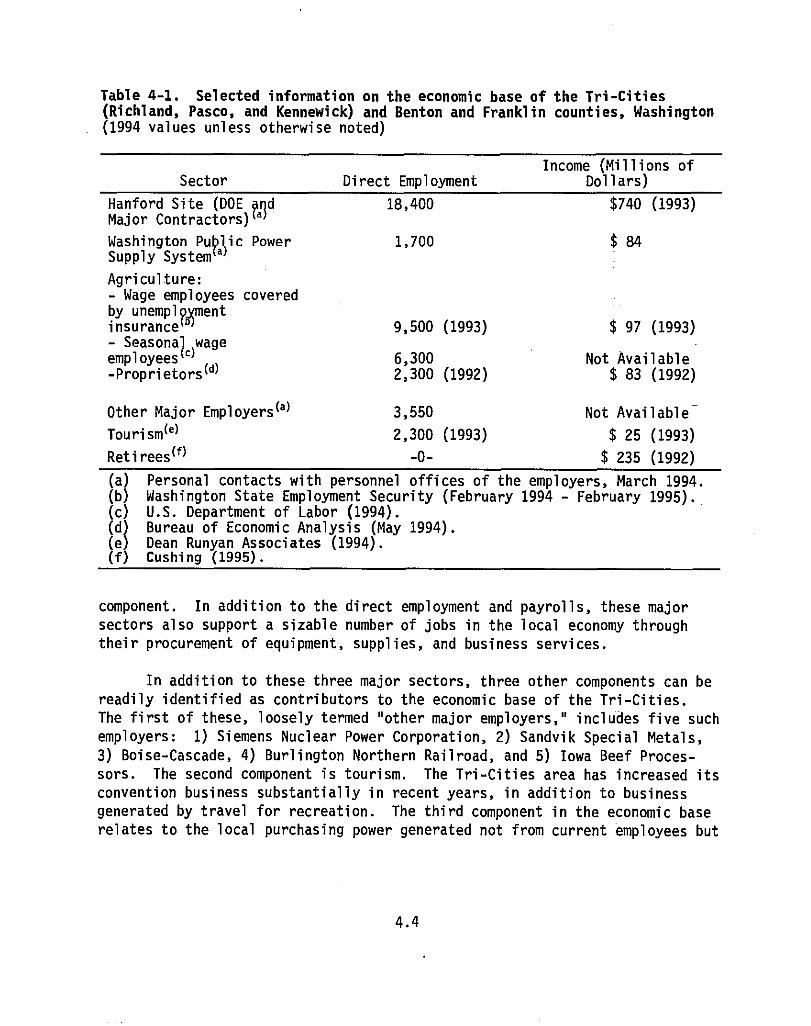
Table 4-1. Selected information on the economic base of the Tri-Cities(Richland, Pasco, and Kennewick) and Benton and Franklin counties, Washington(1994 values unless otherwise noted)
Income (Millions ofSector Direct Employment Dollars)
Hanford Site (DOE ?9d 18,400 $740 (1993)Major Contractors) a
Washington Pu^l)ic Power 1,700 $ 84Supply System a
Agriculture:- Wage employees coveredby unempl^^mentinsurance 9,500 (1993) $ 97 (1993)- Seasona^ wageemployees `-Proprietors (d)
6,300 Not Available2,300 (1992) $ 83 (1992)
Other Major Employers (a)3,550 Not Available
Tourism (e)2,300 (1993) $ 25 (1993)
Retirees (f)-0- $ 235 (1992)
(a) Personal contacts with personnel offices of the employers, March 1994.(b) Washington State Employment Security (February 1994 - February 1995).,(c) U.S. Department of Labor (1994).(d) Bureau of Economic Analysis (May 1994).(e) Dean Runyan Associates (1994).(f) Cushing (1995).
component. In addition to the direct employment and payrolls, these major
sectors also support a sizable number of jobs in the local economy through
their procurement of equipment, supplies, and business services.
In addition to these three major sectors, three other components can be
readily identified as contributors to the economic base of the Tri-Cities.
The first of these, loosely termed "other major employers," includes five such
employers: 1) Siemens Nuclear Power Corporation, 2) Sandvik Special Metals,
3) Boise-Cascade, 4) Burlington Northern Railroad, and 5) Iowa Beef Proces-
sors. The second component is tourism. The Tri-Cities area has increased its
convention business substantially in recent years, in addition to business
generated by travel for recreation. The third component in the economic base
relates to the local purchasing power generated not from current employees but
4.4
from retired former employees. Government transfer payments in the form of
pension benefits constitute a significant proportion of total spendable income
in the local economy.
In 1994 Hanford employment accounted directly for 25% of total non-
agricultural employment in Benton and Franklin counties and nearly 0.8% of all
nonagricultural statewide jobs. The total wage payroll for the Hanford Site
was estimated at over $740 million in 1993, which accounted for an estimated
45% of the payroll dollars earned in the area. Total employment at Hanford
has declined from over 18,000 in 1994 to less than 14,000 in late 1995 and is
expected to remain at about that level through 2004. Overall workforce in the
Tri-Cities is expected to remain in the range of 81,000 to 86,000, while
population in Benton and Franklin counties is expected to increase to about
173,000 by the year 2000 and 185,000 by 2005 (DOE 1995a). However, other
projects may occur at Hanford in the near term, such as the tank waste remedi-
ation program; operations of the Hazardous Materials Management Emergency
Response facility, Environmental Molecular Science Laboratory, and Laser
Interferometer Gravitational-Wave Observatory; preparation for decommissioning
of the older reactors and deactivating PUREX and other facilities; and other
cleanup operations. The schedule and funding status of several of these
operations is uncertain, making it difficult to improve on the projections in
DOE (1995a).
Previous studies have revealed that each Hanford job supports about
1.2 additional jobs in the local service sector of Benton and Franklincounties (about 2.2 total jobs) or about 1.5 additional jobs in the state's
service sector (about 2.5 total jobs) (Scott et al. 1987). Similarly, each
dollar of Hanford income supports about 2.1 dollars of total local incomes and
about 2.4 dollars of total statewide incomes. Based on these multipliers in
Benton and Franklin counties, Hanford directly or indirectly accounts for more
than 40% of all jobs. Overall employment losses in the Tri-Cities during 1995
have been less than would be predicted from the 2.2 employment multiplier for
a number of reasons: 1) about half of the Hanford position losses were early
retirees who remained in the community and continue to buy goods and services;
2) some of those laid off have started new businesses or were hired by non-
Hanford contractor businesses; 3) there was some countervailing growth in
businesses unrelated to Hanford; and 4) some of the job losses that can be
expected as a result of reduced Hanford activity had not yet taken place by
the end of fiscal year 1995.
Based on employee residence records as of December 1993, 93% of Hanford
employees resided in Benton and Franklin counties. Approximately 81% of
4.5
Hanford employees resided in the Tri-Cities. More than 42% of Hanford
employees resided in Richland, 30% in Kennewick, and 9% in Pasco. Hanford
employees residing in West Richland, Benton City, Prosser, and other areas in
Benton and Franklin counties account for 12% of the total employees.
The secondary sector consists of all other workers in Benton and
Franklin counties. Total nonagricultural employment averaged 72,300 in 1994.
Nonagricultural Jobs increased by 2,800 during 1994 (a 4.1% growth rate)
[Washington State Employment Security (February 1994-February 1995)].
In 1992 the total personal income for Benton County was $2,422 million,
Franklin County was $633 million, and the State of Washington was
$109.5 billion. Per capita income in 1992 for Benton County was $20,122,
Franklin County was $15,620, and Washington State was $21,289 (Bureau of
Economic Analysis May 1994). Median household income in 1992 for Benton
County was estimated to be $40,288, Franklin County was estimated at $28,317,
and the State of Washington was estimated at $36,648 (OFM 1994a).
4.3.2 Demography
Population estimates for 1994 for Benton and Franklin counties were
127,000 and 42,900, respectively (OFM 1994a). When compared to the 1990
census data in which Benton County's population was 112,560 and Franklin
County's population was 37,473, the current population totals reflect the
continued growth occurring in these two counties.
Within each county, the 1994 estimates distributed the Tri-Cities
population as follows: Richland 35,430, Kennewick 46,960, and Pasco 22,170.
The estimated populations of Benton City, Prosser, and West Richland totaled
11,985 in 1994. The unincorporated population of Benton County was 32,625.
In Franklin County, incorporated areas other than Pasco had a total population
of 3,155. The unincorporated population of Franklin County was 17,575 (OFM
1994b).
The 1994 estimates of racial categories by the Office of Financial
Management indicate that in Benton and Franklin counties Asians represent a
lower proportion and people of Hispanic origin represent a higher proportion
of the population than in Washington State. County-wide, Benton and Franklin
counties exhibit varying racial distributions, as shown in Table 4-2.
Benton and Franklin counties accounted for 3.2% of Washington State's
population (OFM 1994a). In 1994, the population demographics for Benton and
4.6
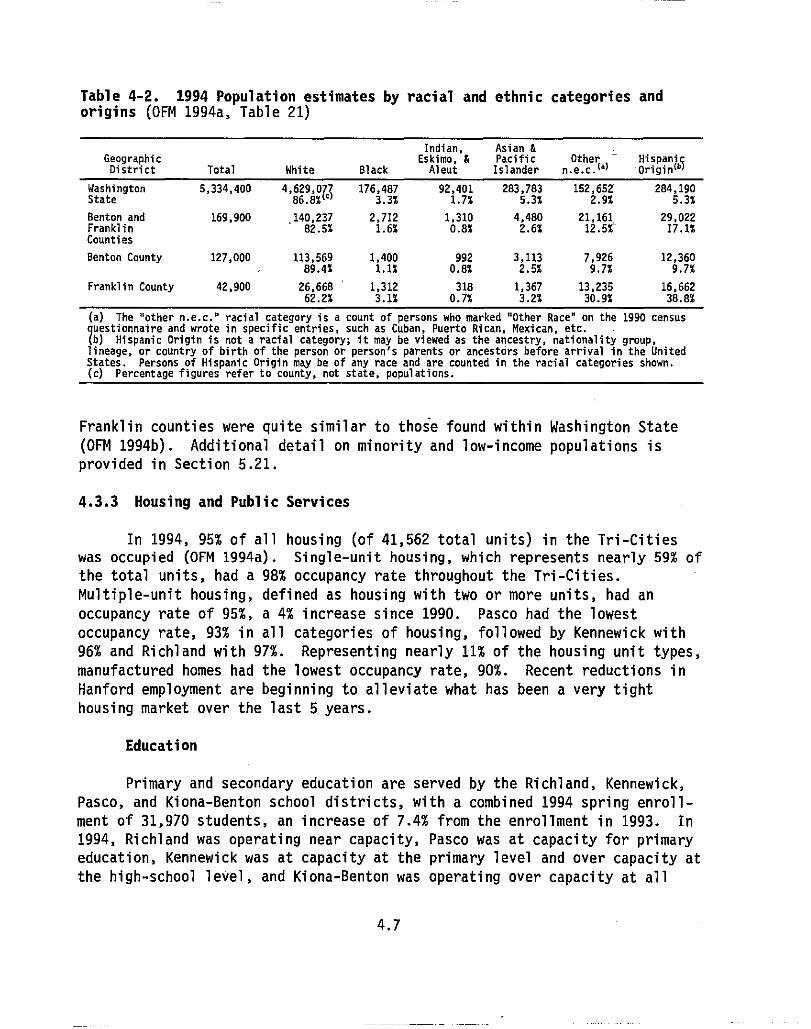
Table 4-2. 1994 Population estimates by racial and ethnic categories andorigins (OFM 1994a, Table 21)
GeographicDistrict Total White Black
Indian,Eskimo, &Aleut
Asian &PacificIslander
Othern.e.c. l' 1
Hispanii-Origin`b^
Washington 5,334,400 4,629,01,; 176,487 92,401 283,783 152,652 284,190State 86.8% ` 3.3% 1.7% 5.3% 2.9% 5.3%
Benton and 169,900 140,237 2,712 1,310 4,480 21,161. 29,022Franklin 82.5% 1.6% 0.8% 2.6% 12.5X 17.1%Counties
Benton County 127,000 113,569 1,400 992 3,113 7,926 12,36089.4% 1.1% 0.8% 2.5% 9.7% 9.7%
Franklin County 42,900 26,668 1,312 318 1,367 13,235 16,66262.2% 3.1% 0.7% 3.2% 30.9% 38.8%
(a) The 'other n.e.c." racial category is a count of persons who marked "Other Race" on the 1990 censusquestionnaire and wrote in specific entries, such as Cuban, Puerto Rican, Mexican, etc.(b) Hispanic Origin is not a racial category; it may be viewed as the ancestry, nationality group,lineage, or country of birth of the person or person's parents or ancestors before arrival in the UnitedStates. Persons of Hispanic Origin may be of any race and are counted in the racial categories shown.(c) Percentage figures refer to county, not state, populations.
Franklin counties were quite similar to those found within Washington State
(OFM 1994b). Additional detail on minority and low-income populations is
provided in Section 5.21.
4.3.3 Housing and Public Services
In 1994, 95% of all housing (of 41,562 total units) in the Tri-Citieswas occupied (OFM 1994a). Single-unit housing, which represents nearly 59% of
the total units, had a 98% occupancy rate throughout the Tri-Cities.
Multiple-unit housing, defined as housing with two or more units, had an
occupancy rate of 95%, a 4% increase since 1990. Pasco had the lowest
occupancy rate, 93% in all categories of housing, followed by Kennewick with
96% and Richland with 97%. Representing nearly 11% of the housing unit types,
manufactured homes had the lowest occupancy rate, 90%. Recent reductions in
Hanford employment are beginning to alleviate what has been a very tight
housing market over the last 5 years.
Education
Primary and secondary education are served by the Richland, Kennewick,
Pasco, and Kiona-Benton school districts, with a combined 1994 spring enroll-
ment of 31,970 students, an increase of 7.4% from the enrollment in 1993. In
1994, Richland was operating near capacity, Pasco was at capacity for primary
education, Kennewick was at capacity at the primary level and over capacity at
the high-school level, and Kiona-Benton was operating over capacity at all
4.7
levels. Kennewick is constructing a new high school, one new middle school,
and two new elementary schools. Post-secondary education in the Tri-Cities
area is provided by Columbia Basin College (CBC) (fall 1994 enrollment was
6,800) and the Tri-Cities branch campus of Washington State University
(WSU-TC) (fall 1994 enrollment was 1,300). Currently, 23 associate degree
programs are available at CBC, and WSU-TC offers 10 undergraduate and
15 graduate programs.
Health Care
The Tri-Cities have three major hospitals and five minor emergency
centers. Combined, the three hospitals have 346 beds and had about
15,000 admissions in 1994 (about 42% non-Medicare/Medicaid). All three
hospitals offer general medical services and include a 24-hour emergency room,
basic surgical services, intensive care, and neonatal care. Our Lady of
Lourdes Hospital in Pasco offers skilled nursing and rehabilitation, and
alcohol and chemical dependency services. Our Lady of Lourdes also operates
the Carondelet Psychiatric Care Center, a 32-bed psychiatric hospital located
in Richland, and provides a significant amount of outpatient and home health
services.
Human Services
The Tri-Cities offer a broad range of social services. State human
service offices in the Tri-Cities include the Job Services Office of theEmployment Security Department, food stamp offices, the Division of Develop-
mental Disabilities, financial and medical assistance, the Child Protective
Service, emergency medical service, a senior companion program, and vocational
rehabilitation. The local United Way incorporates 24 participating agencies
and 48 programs, with a cumulative 1994 budget of $21.1 million.
Police and Fire Protection
Police protection in Benton and Franklin counties is provided by county
sheriffs' departments, local municipal police departments, and the Washington
State Patrol Division headquartered in Kennewick. In February 1995, the local
departments had a combined total of 266 commissioned officers, 114 reserve
officers, and 129 patrol cars. According to the Washington Uniform Crime
Reporting Program of the Washington Association of Sheriffs and Police Chiefs,
both Benton and Franklin counties' violent crime rate per 1,000 residents
(2.8 and 2.4, respectively) were less than that of Washington State (5.1).
Pasco's rate was higher than the state rate, while the other cities' rates
4.8
were lower. Property crime rates were slightly above the state rate of 54.3
per 1,000 residents in Kennewick and Pasco, and at about half of the state
rate in Richland and the rest of the two counties.
City fire protection in the Tri-Cities area is provided by three city
fire departments and three additional rural fire districts. Together, they
have 152 paid personnel and 160 volunteers. The separate Hanford Fire
Department, composed of 155 fire-fighters, is trained to dispose of hazardous
waste and to fight chemical fires. Each station has access to a Hazardous
Material Response Vehicle, which is equipped with chemical fire extinguishing
equipment, an attack truck that carries foam and Purple-K dry chemical, a
mobile air truck that provides air for gas masks, and a transport tanker that
supplies water to six brush-fire trucks. The Hanford Fire Department owns
five ambulances and maintains contact with local hospitals.
Parks and Recreation
The Columbia, Snake, and Yakima rivers offer the residents of the
Tri-Cities a variety of recreational opportunities. The boating, camping,
and picnic facilities of the Lower Snake River Project attracted 2.5 million
visitors in 1993, while Lake Wallula on the Columbia attracted an estimated
3 million visitors in the same year (Cushing 1995). The Columbia River Basin
is also a popular area for migratory waterfowl and upland game bird hunting:
The Tri-Cities also offer numerous tennis courts and ball fields; eight golf
courses; several privately owned health clubs with indoor tennis and racquet-
ball courts, pools, and exercise programs; and bowling lanes and roller skat-
ing rinks in each of the Tri-Cities. There are minor league professional
sport franchises in hockey and baseball.
4.4 Cultural Resources
The Hanford Site contains numerous, well-preserved archaeological sites
from both prehistoric and historical periods, and is still thought of as a
homeland by many Native Americans. Historic period resources include sites,
buildings, and structures from the pre-Hanford, Manhattan Project, and Cold
War eras. Sitewide management of Hanford's cultural resources follows the
Hanford Cultural Resources Management Plan (Chatters 1989) and is conducted
for DOE Richland Operations Office by the Hanford Cultural Resources Labora-
tory (HCRL) of Pacific Northwest Laboratory (PNL). The following sections
SK
briefly discuss the cultural resource setting of the Hanford Site for the
purposes of this document. More complete discussions can be found in Chatters
(1989), Cushing (1995), and DOE (1995a). Results of cultural resource surveys
for the proposed sites can be found in the DOE SNF PEIS (DOE 1995a). No
prehistoric or historic archaeological properties were found at the reference
site.
4.4.1 Prehistoric Archaeological Resources
Archaeological sites include remains of numerous pithouse villages,
various types of open campsites, and cemeteries along the river banks (Rice
1968a, 1980); spirit quest monuments (rock cairns), hunting camps, game drive
complexes, and quarries in mountains and rocky bluffs (Rice 1968b); hunting/
kill sites in lowland stabilized dunes; and small temporary camps near peren-
nial sources of water located away from the river (Rice 1968b). As of
September 1995, 363 prehistoric archaeological sites are recorded in the files
of the HCRL. Of these, 48 sites are currently included on the National
Register of Historic Places (National Register).
4.4.2 Native American Cultural Resources
In prehistoric and early historic times, the Hanford Reach of the
Columbia River was heavily populated by Native Americans of various tribal
affiliations. The Wanapum and the Chamnapum band dwelt along the Columbia
River from south of Richland upstream to Vantage (Relander 1956; Spier 1936).
Some of their descendants still live nearby at Priest Rapids, and others have
been incorporated into the Yakama and Umatilla reservations. Palus people,
who lived on the lower Snake River, joined the Wanapum and Chamnapum to fish
the Hanford Reach of the Columbia River, and some inhabited the river's east
bank (Relander 1956; Trafzer and Scheuerman 1986). Walla Walla and Umatilla
people also made periodic visits to fish in the area. These people retain
traditional secular and religious ties to the region, and many, young and old
alike, have knowledge of the ceremonies and lifeways of their aboriginal
culture.
4.4.3 Historic Cultural Resources
Historic archaeological sites totaling 260 and 11 other historic local-
ities have been recorded by the HCRL on the Hanford Site. Localities include
the Allard Pumping Plant at Coyote Rapids, the Hanford Irrigation Ditch, the
Hanford townsite, Wahluke Ferry, the White Bluffs townsite, the Richmond
Ferry, Arrowsmith townsite, a cabin at East White Bluffs ferry landing, the
4.10
White Bluffs road, the old Hanford High School, and the Cobblestone Warehouse
at Riverland (Rice 1980). Archaeological sites including the East White
Bluffs townsite and associated ferry landings and an assortment of.trash
scatters, homesteads, corrals, and dumps have been recorded by the HCRL since
1987. In addition to the recorded sites, numerous unrecorded sites of gold
mine tailings along the river bank and the remains of homesteads, farm fields,
ranches, and abandoned Army installations are scattered over the entire
Hanford Site. Of these historic sites, one is included in the National
Register as an historic site, and 56 are listed as historic archaeological
sites.
More recent locations are the defense reactors and associated material
processing facilities that now dominate the Site. The first reactors (B, D,
and F) were constructed in 1943 as part of the Manhattan Project. Plutonium
for the first atomic explosion and the bomb that destroyed Nagasaki to end
World War II were produced in the B Reactor. Additional reactors and
processing facilities were constructed after World War II during the Cold War.
All reactor containment buildings still stand, although many ancillary struc-
tures have been removed. The B Reactor has been listed on the National
Register.
4.5 Aesthetic and Scenic Resources
The land near the Hanford Site is generally flat with little relief.
Rattlesnake Mountain, rising to 1,060 m (3,500 ft) above mean sea level, formsthe western boundary of the Site. Gable Mountain and Gable Butte are the
highest land forms within the Site. The view toward Rattlesnake Mountain is
visually pleasing, especially in the springtime when wildflowers are in bloom.
Large rolling hills are located to the west and far north. The Columbia
River, flowing across the northern part of the Site and forming the eastern
boundary, is generally considered scenic, with its contrasting blue against a
background of brown basaltic rocks and desert sagebrush. The White Bluffs,
steep whitish-brown bluffs adjacent to the Columbia River and above the
northern boundary of the river in this region, are a striking feature of the
landscape. The reach of the Columbia River flowing through the Hanford Site
is currently being considered for Wild and Scenic status.
4.11
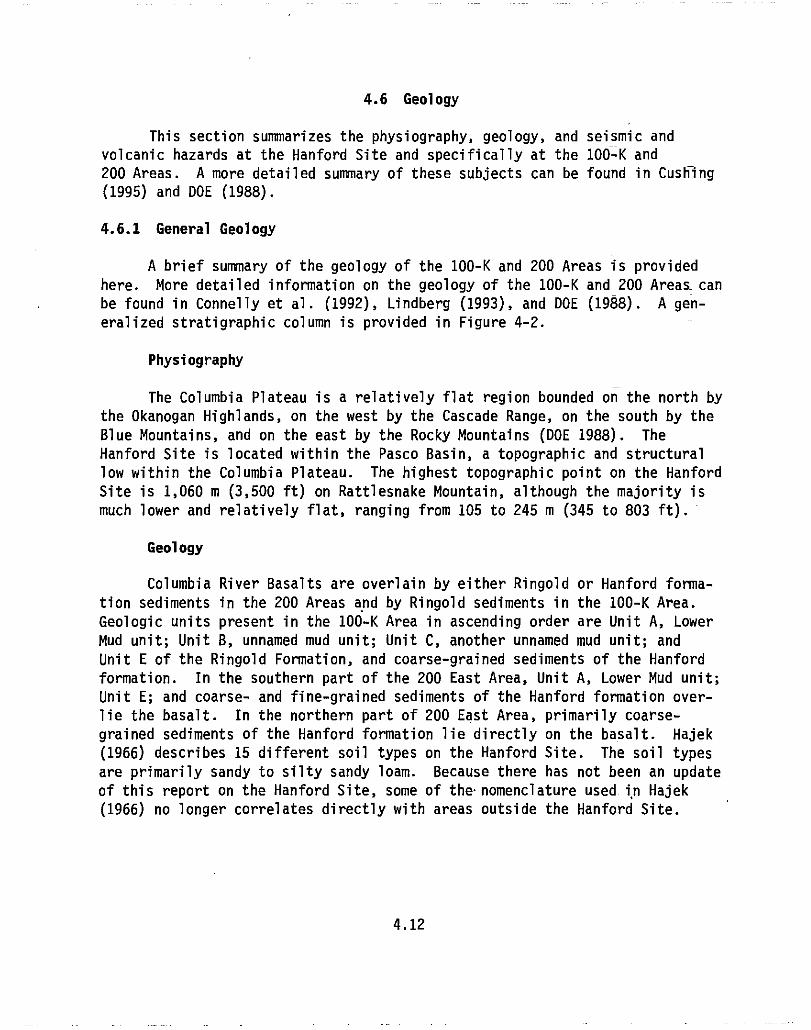
4.6 Geology
This section summarizes the physiography, geology, and seismic and
volcanic hazards at the Hanford Site and specifically at the 100-K and
200 Areas. A more detailed summary of these subjects can be found in Cushing
(1995) and DOE (1988).
4.6.1 General Geology
A brief summary of the geology of the 100-K and 200 Areas is provided
here. More detailed information on the geology of the 100-K and 200 Areas_ can
be found in Connelly et al. (1992), Lindberg (1993), and DOE (1988). A gen-
eralized stratigraphic column is provided in Figure 4-2.
Physiography
The Columbia Plateau is a relatively flat region bounded on the north by
the Okanogan Highlands, on the west by the Cascade Range, on the south by the
Blue Mountains, and on the east by the Rocky Mountains (DOE 1988). The
Hanford Site is located within the Pasco Basin, a topographic and structural
low within the Columbia Plateau. The highest topographic point on the Hanford
Site is 1,060 m (3,500 ft) on Rattlesnake Mountain, although the majority is
much lower and relatively flat, ranging from 105 to 245 m (345 to 803 ft).
Geology
Columbia River Basalts are overlain by either Ringold or Hanford forma-
tion sediments in the 200 Areas and by Ringold sediments in the 100-K Area.
Geologic units present in the 100-K Area in ascending order are Unit A, Lower
Mud unit; Unit B, unnamed mud unit; Unit C, another unnamed mud unit; and
Unit E of the Ringold Formation, and coarse-grained sediments of the Hanford
formation. In the southern part of the 200 East Area, Unit A, Lower Mud unit;
Unit E; and coarse- and fine-grained sediments of the Hanford formation over-
lie the basalt. In the northern part of 200 East Area, primarily coarse-
grained sediments of the Hanford formation lie directly on the basalt. Hajek
(1966) describes 15 different soil types on the Hanford Site. The soil types
are primarily sandy to silty sandy loam. Because there has not been an update
of this report on the Hanford Site, some of the-nomenclature used in Hajek
(1966) no longer correlates directly with areas outside the Hanford Site.
4.12
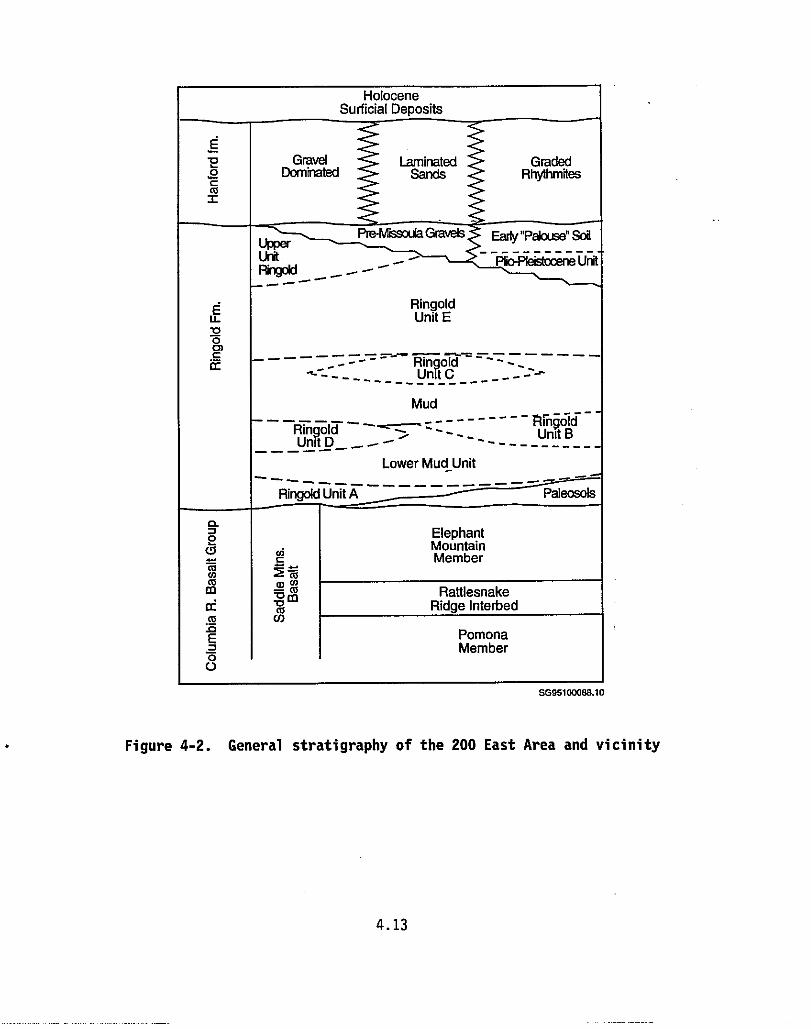
HoloceneSu rficial Deposits
EGravel Laminated Graded
o Dominated Sands Rhylhmites`cmS
UpperPre &saAaGravels Early "Palace" Sol
Pio-Pleistocene Unit
RingoldLL Unit E
0rn-----__ ==-'Ringold =_------
Mud
——'
—, - - - -------RingoldRingoldUnitD_—
—- _ Unit B
- - -^ ' - - - - - - - - - -
Lower Mud Unit-----
Ringold Unit A Paleosols
CLM ElephantP vi Mountain
Cac Member
W
mCO
v COQ m Ridge InterbedCO
SE Pomona2 Member0U
SG95100088.10
Figure 4-2. General stratigraphy of the 200 East Area and vicinity
4.13
The anticlinal ridges bounding the Pasco Basin are separated by rela-
tively gently folded synclines. These folds are oriented roughly east-west.
Thrust or high-angle faults parallel to the axis of the fold are often found
along the base of the steeper limb (DOE 1988). The 100-K Area is located
above one of the synclines, while the 200 East Area is above the northern limb
of another syncline.
The Cold Creek Fault occurs on the west end of the Cold Creek syncline
and appears to be a high-angle fault that has faulted the basalts and the
older Ringold units (Johnson et al. 1993). Another fault, informally called
the May Junction fault, is located nearly 4.8 km (3 mi) east of the 200 East
Area. Like the Cold Creek fault, this fault is thought to be a high-angle
fault that has offset the basalts and the older Ringold units. Neither of
these faults appear to have affected the younger Ringold or the Hanford forma-
tion sediments.
4.6.2 Mineral Resources
Sand, gravel, and cobble deposits are ubiquitous components of the soils
over the Columbia Basin in general and the Hanford Site in particular. Other
than proximity to areas where sand or gravel are needed, no particular quarry
site is much different from other quarries.
4.6.3 Seismic and Volcanic Hazards
The following discussion briefly summarizes seismic and volcanic hazards
on the Hanford Site. A more complete summary is provided in Cushing (1995).
Seismic Hazards
Seismic hazards are of concern because of the potential damage to .facil-
ities and disruption of services such as electricity and water. Figure 4-3
shows the historical seismicity of southeastern Washington between 1969 and
1989 for earthquakes of Modified Mercalli Intensity IV or magnitude of 3 or
greater. Large earthquakes with magnitudes greater than 7 on the Richter .
scale have occurred in the Pacific Northwest, but only one seems to have
occurred in eastern Washington. This earthquake occurred in 1872 and is
thought to have been located between Lake Chelan, Washington, and British
Columbia (DOE 1988). The Columbia Plateau is generally considered an area of
low seismicity and is classified as Uniform Building Code Zone 2.
4.14
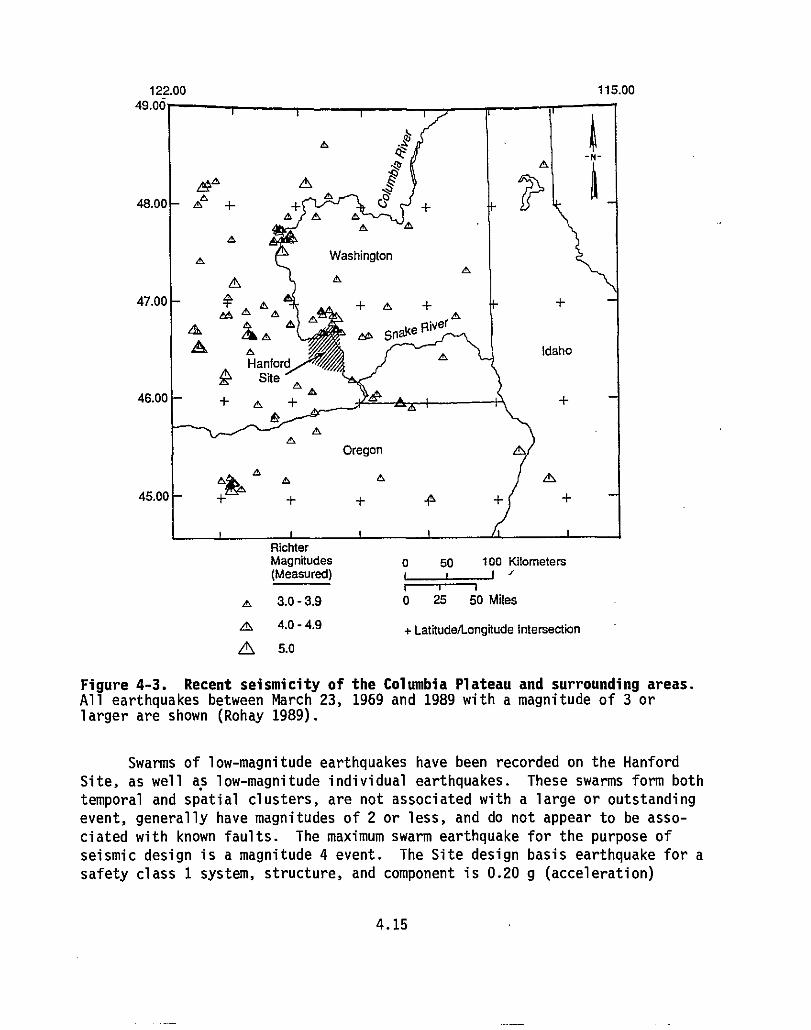
122.00
115.00
e Qm
F\^
48.00 °° + + ° Uo +e e e° e
e
° Washington
4t,e
47.00+' e + e +
& °eRiver
m
in
® eeHanford °
g Site
46.00 +
°
e + e `Q
-N-
Idaho
eOregon
e
p+ + + -P+ t
+ +
Richter
Magnit
udes 0 50 100 Kilometers(Measured) i
t—r-1e
3.0-3.9 0 25 50 Miles
p
4.0-4.9 +Latitude/Longitude Intersection5.0
Figure 4-3. Recent seismicity of the Columbia Plateau and surrounding areas.All earthquakes between March 23, 1969 and 1989 with a magnitude of 3 orlarger are shown (Rohay 1989).
Swarms of low-magnitude earthquakes have been recorded on the Hanford
Site, as well as low-magnitude individual earthquakes. These swarms form both
temporal and spatial clusters, are not associated with a large or outstanding
event, generally have magnitudes of 2 or less, and do not appear to be asso-
ciated with known faults. The maximum swarm earthquake for the purpose of
seismic design is a magnitude 4 event. The Site design basis earthquake for a
safety class 1 system, structure, and component is 0.20 g (acceleration)
4.15
(Hanford Plant Standard, Standard Design Criterion 4.1). The most recent
probabilistic seismic hazard analysis calculated an annual probability of
recurrence of 5 x 10"4 for exceeding the design basis earthquake.
Volcanic Hazards
Volcanism is of concern primarily because ash fall might affect opera-
tions of communications equipment and electronic devices, as well as vehicle
traffic. Quaternary volcanism in the region has been associated with the
Cascade Range, and airfall deposits from at least three Cascade volcanoes have
blanketed the central Columbia Plateau since the late Pleistocene. Mount
St. Helens has erupted several times since the Pleistocene, most recently in
May 1980 when an eruption resulted in about 1 mm (0.039 in.) of ashfall over a
9-hour period at the Hanford Site. Glacier Peak erupted twice about
11,200 years ago, and Mount Mazama in Oregon erupted 6,600 years ago, both
spreading ash across the Site.
4.7 Air Resources
This section addresses general air resources at the Hanford Site and
surrounding region. Included in this section are discussions of climate,
meteorology, and ambient air quality. Detailed information about the climate
at the Hanford Site are presented in Stone et al. (1983), Glantz et al.
(1990), and Hoitink and Burk (1994).
4.7.1 Climate and Meteorology
The climate of the Hanford Site can be classified as mid-latitude semi-
arid or mid-latitude desert, depending on the climatological classification
scheme used. Summers are warm and dry with abundant sunshine. Large diurnal
temperature variations result from intense solar heating during the day and
radiative cooling at night. Daytime high temperatures in June, July, and
August periodically exceed 38% (100°F). Winters are cool with occasional
precipitation. Outbreaks of cold air associated with modified arctic air
masses can reach the area and cause temperatures to drop below -18°C (O°F)
(Stone et al. 1983).
Topographic features have a significant impact on the climate of the
Hanford Site. All air masses that reach the region undergo some modification
resulting from their passage over the complex topography of the Pacific
Northwest. The climate of the region is strongly influenced by the Pacific
Ocean and the Cascade Range to the west. The relatively low annual average
4.16
rainfall of 16 cm (6.3 in.) at the Hanford Meteorological Station is caused
largely by the rain shadow created by the Cascade Range. These mountains
limit much of the maritime influence of the Pacific Ocean, resulting in a more
continental-type climate than would exist if the mountains were not present.
Maritime influences are experienced in the region during the passage of
frontal systems and as a result of movement through gaps in the Cascade Range
(such as the Columbia River Gorge).
The Rocky Mountains to the east and the north also influence the climate
of the region. These mountains play a key role in protecting the region from
the more severe winter storms and the extremely low temperatures associated
with the modified arctic air masses that move southward through Canada. Local
and regional topographical features, such as Yakima Ridge and the Rattlesnake
Hills, also impact meteorological conditions across the Hanford Site (Glantz
and Perrault 1991). In particular, these features have a significant impact
on wind directions, wind speeds, and precipitation levels.
Climatological data are collected for the Hanford Site at the Hanford
Meteorological Station. The station is located between the 200 West and
200 East Areas and is close to the reference site. Data have been collected
at this location since 1945 and are summarized in Stone et al. (1983). Begin-
ning in the early 1980s, data have also been collected at a series of auto-
mated monitoring sites located throughout the Hanford Site and the surrounding
region (Glantz et al. 1990). This Hanford Meteorological Monitoring Network
is described in detail in Glantz and Islam (1988).
Wind
Winds at the Hanford Site are strongly influenced by their proximity to
local terrain features. The prevailing wind direction in the 200 Areas is
from the west-northwest. In the southeastern portion of the Site (300 and
400 Areas), the prevailing wind direction is generally from the southwest
(Glantz et al. 1990). Wind speeds near the 200 Areas average about 3.4 m/s
(7.7 mph) at about 15 m (50 ft) above ground level. Average wind speeds are
highest in June [4 m/s (9 mph)] and lowest in November and December [3 m/s
(6 mph)] (Stone et al. 1983). Figure 4-4 displays wind direction distribu-
tions (wind roses) for meteorological monitoring stations located on the
Hanford Site and in neighboring areas.
In the 100 Area (station 13 on Figure 4-4), wind speeds of less than
1.3 m/s (3 mph) occur on average about 40% of the time, with 0.8% being
4.17
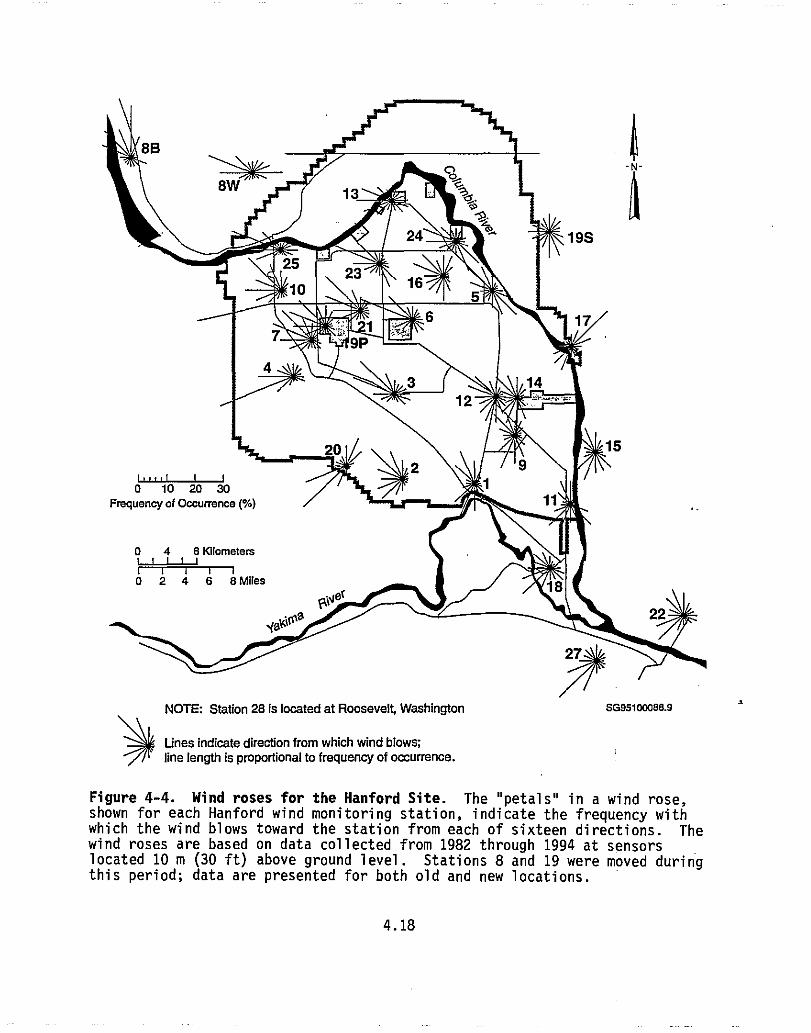
NOTE: Station 28 Is located at Roosevelt, Washington sGesi00088.9
Lines indicate direction from which wind blows;line length is proportional to frequency of occurrence.
Figure 4-4. Wind roses for the Hanford Site. The "petals" in a wind rose,shown for each Hanford wind monitoring station, indicate the frequency withwhich the wind blows toward the station from each of sixteen directions. Thewind roses are based on data collected from 1982 through 1994 at sensorslocated 10 m (30 ft) above ground level. Stations 8 and 19 were moved duringthis period; data are presented for both old and new locations.
4.18
reported as calm. In the 200 Area (station 21 on Figure 4-4), wind speeds of
less than 1.3 m/s (3 mph) occur on average about 29% of the time, with 1.6%
being reported as calm (Hoitink and Burk 1994).
Atmospheric Stability
There are a number of methods for estimating the "stability" of the
atmosphere. Using a method based on the vertical temperature gradient (NRC
1980) and measurements made at the Hanford Meteorology Station, thermally
unstable conditions are estimated to occur an average of about 25% of the
time, neutral conditions about 31% of the time, and thermally stable condi-
tions about 44% of the time. Detailed information on Hanford's atmospheric
stability and associated wind conditions are presented in Glantz et al.
(1990).
Temperature and Humidity
Ranges of daily maximum and minimum temperatures vary from normal maxima
of 2°C (36°F) in early January to 35°C (95°F) in late July. On the average,
55 days during the summer months have maximum temperatures greater than or
equal to 32°C (90°F), and 13 days have maxima greater than or equal to 38°C
(100 0 F). From mid-November through mid-March, minimum temperatures average
less than or equal to 0°C (32 0 F), with the minima in early January averaging
-6°C '(21°F).
The annual average relative humidity at the Hanford Meteorological
Station is 54%. It is highest during the winter months, averaging about 75%,
and lowest during the summer, averaging about 35%.
Precipitation
Annual precipitation is on the order of 16 cm (6.3 in.), with over
40% falling during November, December, and January (Stone et al. 1983). The
relatively low precipitation total is largely because of the rain shadow
created by the Cascade Mountain Range, which lies between the Hanford Site and
the Pacific Ocean. Measurable precipitation (defined as 0.01 in. or greater)
is recorded on an average of 68 days per year and the area experiences an
average of 10 thunderstorm days per year. Daily snowfall accumulations of
2.5 cm (1 in.) or greater occur an average of 6 days per year (Stone et al.
1983); the average annual snowfall is 34 cm (13 in.).
4.19
Severe Weather
Because tornadoes are infrequent and generally small in the Pacific
Northwest (and hurricanes do not reach this area), risks from severe winds are
generally associated with thunderstorms or the passage of strong cold fronts.
The greatest peak wind gust recorded at 15 m (50 ft) above ground level at the
Hanford Meteorology Station was 36 m/s (80 mph). Extrapolations based on
35 years of observations indicate a return period of about 200 years for a
peak gust in excess of 40 m/s (90 mph) at 15 m (50 ft) above ground level.
Stone et al. (1983) discuss blowing dust, hail, fog, glaze, ashfalls, extreme
temperatures, and blowing and drifting snow in more detail.
4.7.2 Nonradiological Air Quality
National ambient air quality standards have been set by the EPA as _
mandated in the Clean Air Act. Standards exist for sulfur oxides (measured as
sulfur dioxide), nitrogen dioxide, carbon monoxide, particles with an aero-
dynamic diameter less than or equal to 10 µm (PM,,), lead, and ozone. State
and local governments have the authority to impose standards for ambient air
quality that are stricter than the national standards and establish standards
for pollutants that are not covered by national standards. Table 4-3 summar-
izes Washington State or federal standards and background concentrations for
six criteria pollutants at Hanford.
In addition to ambient air quality standards, the EPA has established
standards for the Prevention of Significant Deterioration (PSD) of air quality
(40 CFR 52.21, "Prevention of Significant Deterioration of Air Quality"). The
PSD standards provide maximum allowable increases in concentrations of pollu-
tants for areas already in compliance with the national ambient air quality
standards. Different PSD standards exist for Class I areas (where degradation
of ambient air quality is to be severely restricted) and Class II areas (where
moderate degradation of air quality is allowed). The closest such area to the
Hanford Site is the Goat Rocks Wilderness Area (a Class I area), located about
145 km (90 mi) west of the Site.
Particulate concentrations can reach relatively high levels in eastern
Washington because of exceptional natural events (dust storms, volcanic erup-
tions, and large brushfires) that occur in the region. When estimating maxi-
mum background concentrations of particulates in rural areas east of the
Cascade Mountain crest, Washington State standards exclude the contribution
4.20
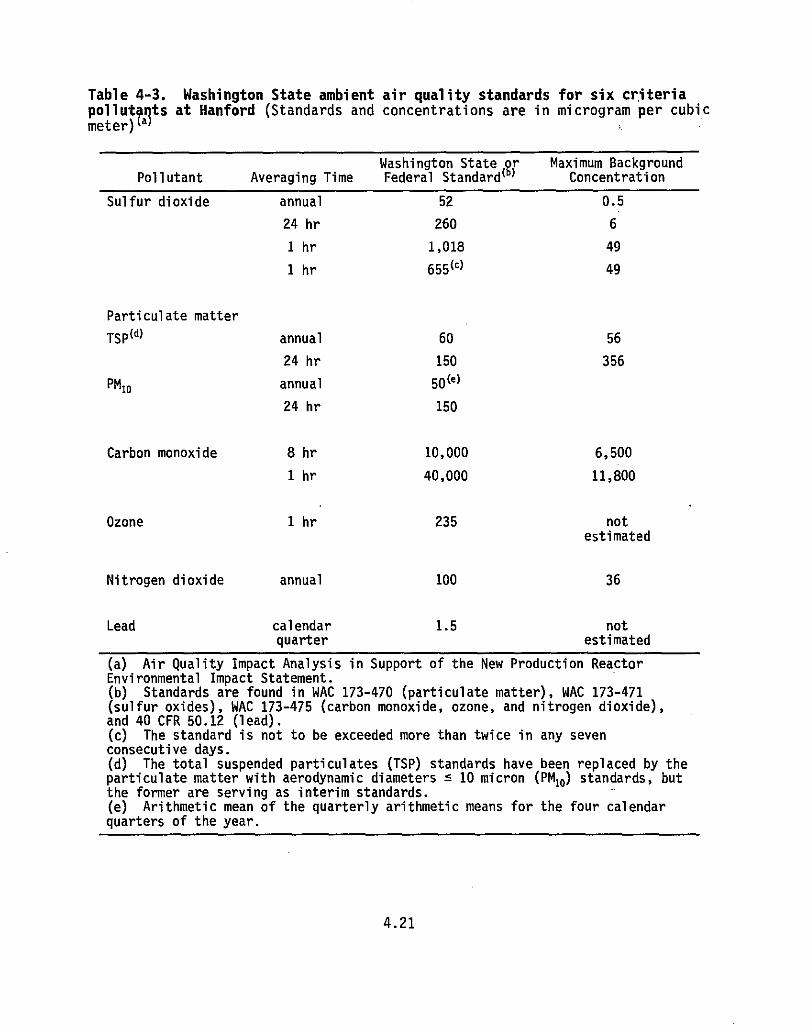
Pollutant
Sulfur dioxide
Averaging Time
annual
24 hr
1 hr
1 hr
Table 4-3. Washington State ambient air quality standards for six criteriapollutants at Hanford (Standards and concentrations are in microgram per cubicmeter) a
Washington StaterFederal Standardog)
52
260
1,018
655(°)
Maximum BackgroundConcentration
0.5
6
49
49
Particulate matter
TSP(d)
annual
60
56
24 hr
150
356
PM10 annual
50 (e)
24 hr
150
Carbon monoxide
8 hr
10,000
6,500
1 hr
40,000
11,800
Ozone
1 hr
235
notestimated
Nitrogen dioxide
annual
100
9
Lead calendar 1.5 notquarter estimated
(a) Air Quality Impact Analysis in Support of the New Production ReactorEnvironmental Impact Statement.(b) Standards are found in WAC 173-470 (particulate matter), WAC 173-471(sulfur oxides) WAC 173-475 (carbon monoxide, ozone, and nitrogen dioxide),and 40 CFR 50.12 (lead).(c) The standard is not to be exceeded more than twice in any sevenconsecutive days.(d) The total suspended particulates (TSP) standards have been replaced by theparticulate matter with aerodynamic diameters s 10 micron (PM,,) standards, butthe former are serving as interim standards.(e) Arithmetic mean of the quarterly arithmetic means for the four calendarquarters of the year.
4.21
from such natural events. Similarly, the EPA also exempts the rural fugitive
dust component of background concentrations when considering permit applica-
tions and enforcement of air quality standards (Cushing 1995).
The annual emission rates for stationary sources within the Hanford Site
boundaries are reported to Ecology by DOE.
4.7.3 Radiological Air Quality
Radionuclide emissions to the atmosphere from the Hanford Site have been
steadily decreasing over the last few years as Site operations have changed
emphasis from the historical mission of materials production and processing to
waste management, environmental restoration, and research and development.
During 1992, all operations at the Hanford Site released less than 100 Ci of
radionuclides to the atmosphere, most of which consisted of tritium and noble
gases (Woodruff et al. 1993). Of that total, fission and activation products
(excluding tritium and noble gases) accounted for less than 0.036 Ci, uranium
isotopes accounted for less than 1 x 10" 6 Ci, and transuranics contributed
less than 0.005 Ci. These releases resulted in a dose to the maximally
exposed offsite resident of less than 0.005 mrem, which is several orders of
magnitude less than the current EPA standard of 10 mrem/year (40 CFR 61) for
DOE facilities.
Ambient air monitoring for radionuclides consisted of sampling at
42 onsite and offsite locations during 1992. Total concentrations of alpha-
and beta-emitting radionuclides at the Site perimeter were indistinguishable
from those at distant locations that are unaffected by Hanford emissions.
4.8 Water Resources
This section summarizes the surface water and groundwater resources and
quality at the Hanford Site, specifically at the 100-K and 200 Areas. A more
detailed summary of these subjects can be found in Dirkes et al. (1994) andDresel et al. (1994).
Surface water in the Pasco Basin includes both natural and artificial
features. Naturally occurring surface water within the Hanford Site consists
of a few natural springs on the western side of the Site, a small pond near
Gable Mountain, and the Columbia River. There have also been a number of
artificial ponds and ditches used on the Hanford Site over the past 50 years,
primarily related to plutonium production and processing activities.
4.22
4.8.1 Surface Water
Surface water near the 100-K Area includes the Columbia River and
several basins and wastewater disposal trenches. Near the 200 East Area,
West Lake is the only natural surface water body, and surface water is found
only in a few ponds and ditches that still receive wastewater.
Only 3% of the precipitation over the Pasco Basin ends up as runoff (DOE
1988), approximately 3% recharges the groundwater, and the remainder is recy-
cled to the atmosphere as evapotranspiration (DOE 1988). Natural recharge of
the groundwater is highly variable across the Site; depending on soil and
vegetation types, long-term average rates can vary from 2.6 to 55.4 mm/year
(0.1 to 2.18 in./year) (Fayer and Walters 1995).
The amount of Columbia River water used on the Hanford Site has dropped
in the past 7 years because there are no processing activities, and discharges
to ground were severely restricted after June 1995. Discharges of wastewater
to the ground on the Hanford Site have increased the groundwater levels and
changed the direction of groundwater flow. These discharges have been decreas-
ing since the mid 1980s and were severely reduced by June 1995 in response to
federal and state regulations. Decreases in the amount discharged will gradu-
ally allow the water table to move back toward its original levels and flow
directions.
Ecology classifies the Columbia River as Class A (excellent)
between Grand Coulee Dam and the mouth of the river near Astoria, Oregon
(WAC 173-201A). Currently, eight outfalls are covered by a single National
Pollutant Discharge Elimination System (NPDES) permit at the Hanford Site:
two at the 100-K Area, five at the 100-N Area, and one at the 300 Area. These
discharge locations are monitored by PNL for various water quality,
radiological, and nonradiological constituents, and the results are provided
in the annual environmental reports (e.g., Dirkes et al. 1994). DOE was
issued an additional NPDES permit for the 300 Area Treated Effluent Disposal
Facility in 1994. This facility is now fully functional. The Columbia River
is sampled by PNL at Vernita (upstream of the Hanford Site), the 300 Area, and
the Richland Pumphouse for water quality and radiological constituents, and
the U.S. Geological Survey collects river samples for water quality
parameters. These results are also reported annually in environmental reports
(e.g., Dirkes et al. 1994).
Under the DOE regulations, a base flood is a flood that has a 1% chance
of occurrence in any given year, and a critical flood is a flood that has a
0.2% chance of occurrence in any given year (10 CFR 1022.4). The base
4.23
floodplain is the 100-year (1%) floodplain, and the critical action floodplain
is the 500-year (0.2%) floodplain. DOE has determined that the elevation of
the dam-regulated 500-year flood will not reach the elevation of the bottom of
the K Basins (DOE 1989, Appendix B). A catastrophic flood caused by a 50%
failure of Grand Coulee Dam would cause a flood evaluation exceeding the
height of the K Basins (DOE 1989, Appendix B). The reference and CSB sites
are not within the base or critical action floodplain of the Columbia River
nor would Columbia River water reach the sites in the event of a 50% cata-
strophic failure of Grand Coulee Dam.
Dirkes et al. (1994) reported tritium, strontium-90, iodine-129,
uranium-234, and uranium-238 were consistently detected, and cobalt-60,
technetium-99, cesium-137, uranium-235, and plutonium-239/240 were occasion-
ally detected in the river water during 1993. Tritium, uranium, and
iodine-129 were found in somewhat higher concentrations downstream of the
Hanford Site, but were well below federal drinking water standards (DWS).
Strontium-90 and plutonium-239/240 were detected at similar levels upstream
and downstream from the Hanford Site, and strontium-90 was below DWS (Dirkes
et al. 1994). Plutonium-239/240 was below the gross alpha DWS.
Nonradiological water quality monitoring results are fairly consistent
over time. Dirkes et al. (1994) report all water quality parameters fell
within Washington State Water Quality Standards for 1993. Volatile organic
compounds were not routinely detected, and those metals found were at similar
levels upstream and downstream.
4.8.2 Groundwater
This section discusses groundwater hydrology, and water quality of the
unconfined and confined aquifers.
Groundwater Hydrology
Groundwater occurs as confined, semiconfined, and unconfined aquifers
within the Pasco Basin. The confined aquifers occur primarily within the
Ellensburg Formation, sedimentary layers interbedded between basalt flows, and
the vesicular flow tops and bottoms of the basalt flows themselves. Recharge
to the confined aquifers occurs in areas where these layers are at or near the
surface, such as the ridges bounding the Pasco Basin, and areas farther to the
east and west of the Pasco Basin (DOE 1988). These confined aquifers are used
regionally as a source for both domestic and agricultural water. Semiconfined
aquifers occur where thick mud layers within the Ringold Formation overlie
4.24
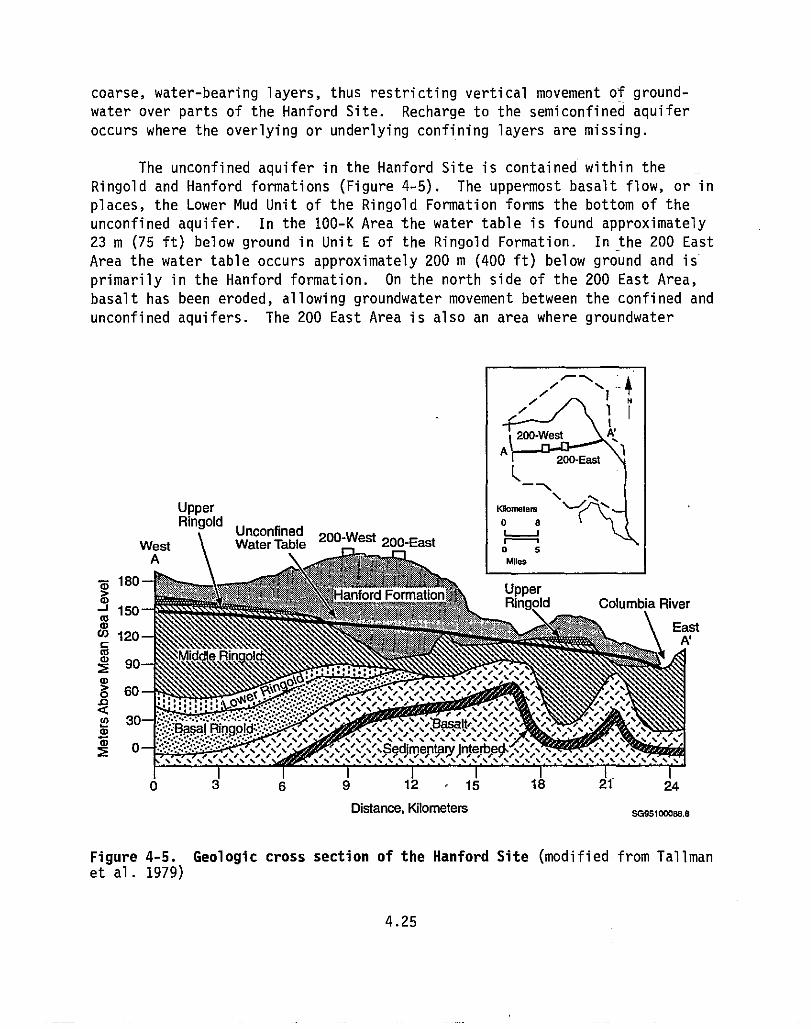
coarse, water-bearing layers, thus restricting vertical movement of ground-
water over parts of the Hanford Site. Recharge to the semiconfined aquifer
occurs where the overlying or underlying confining layers are missing.
The unconfined aquifer in the Hanford Site is contained within the
Ringold and Hanford formations (Figure 4-5). The uppermost basalt flow, or in
places, the Lower Mud Unit of the Ringold Formation forms the bottom of the
unconfined aquifer. In the 100-K Area the water table is found approximately
23 m (75 ft) below ground in Unit E of the Ringold Formation. In the 200 East
Area the water table occurs approximately 200 m (400 ft) below ground and is
primarily in the Hanford formation. On the north side of the 200 East Area,
basalt has been eroded, allowing groundwater movement between the confined and
unconfined aquifers. The 200 East Area is also an area where groundwater
Upper
Ringold UnconfinedWest Water Table 200-West 200-EastA \ \
ftaxK
o sMiles
180> Hanford Formation UpperJ
Ringold Columbia River150cam \ East
120co Mid a Rin of
90
° 60 r r// J// r r J r r r
///rrrJ /rr r/rrQ
^o
30..: .: :. :• ..:..:: :..:..: ///r
p,,r,, .r rJrr/ r rr r`
••'•'^•: • •• .:': .r ' : : :::::::: :/.rte/, , / / r
.J. :'. .'.'0 ^Sgdime^tt^r^Jnterl
6 9 12 • 15 18 21 24
Distance , Kilometers sG951OW88.9
Figure 4-5. Geologic cross section of the Hanford Site (modified from Tallmanet al. 1979)
4.25
moves between the semiconfined and unconfined aquifers. Approximately 3% of
the annual precipitation reaches the unconfined aquifer as natural recharge;
the remainder is removed through evapotranspiration. Wastewater discharges to
the ground on the Hanford Site have dominated recharge to the unconfined aqui-
fer, but began decreasing in 1984 with the closure of U Pond and are required
to decrease significantly by June 1995. As these discharges decrease, the
water table is slowly dropping (Kasza et al. 1994). Groundwater flows from
the 200 East Area north between Gable Butte and Gable Mountain toward the
Columbia River.
Water Quality of the Unconfined Aquifer
The unconfined aquifer has been sampled across the Pasco Basin as a part
of the Environmental Surveillance Program, and the results have been provided
in annual environmental reports (e.g., Dirkes et al. 1994) and in annual
groundwater monitoring reports (e.g., Dresel et al. 1994). Some water quality
and radiological constituents are monitored for, and recently nonradiological
constituents have been added. In the PascQ Basin outside of the Hanford Site,
agricultural practices affect the water quality through irrigation and chemi-
cal applications. On the Hanford Site, disposal of wastewater has caused
higher water levels and increased contamination.
The Environmental Surveillance Program sampled and/or reviewed analyses
from 770 wells in 1993. In 1993 in the 100-K Area, tritium, strontium-90,
nitrate, and chromium exceeded the DWS, while tritium and strontium-90
exceeded DWS in the 100-N Area (Dresel et al. 1994). Tritium, cobalt-60,
strontium-90, technetium-99, and uranium were detected in springs and seeps
along the Columbia River along the 100 Areas, and strontium-90 exceeded the
DWS near the 100-N Area (Dirkes et al. 1994).
The unconfined aquifer in the 200 East Area contained tritium,
iodine-129, nitrate, technetium-99, strontium-90, cesium-137, and pluto-
nium-239/240 that exceeded the DWS, and strontium-90 and plutonium-239/240
exceeded the DWS in unfiltered samples. Dirkes et al. (1994) reported that
tritium, technetium-99, and iodine-129 were found in springs along the east
side of the Hanford Site from the old Hanford townsite to the 300 Area.
Tritium exceeded the DWS in several springs.
Water Quality of the Confined Aquifer
The uppermost confined aquifer within the basalt is the Rattlesnake
Ridge Interbed. Rattlesnake Ridge is monitored by the Environmental
4.26
Surveillance Program to determine the extent, if any, of groundwater contam-
ination occurring as a result of interaction between the confined and uncon-
fined aquifers. One well in the 200 East Area and one near B Pond contained
tritium; both cases are attributable to movement of water from the unconfined
into the confined aquifer along well casing or through the basalt/sediments,
Another well just north of the 200 East Area near an erosional window through
the basalt contained nitrate.
4.8.3 Water Rights
The Hanford Site, situated along the Columbia River and near the Yakima
River, lies within a region traditionally concerned about water rights.
Typical water uses in this region include cooling a commercial nuclear power
plant, irrigation, and municipal and industrial uses. The DOE continues to
assert a federally reserved water withdrawal right with respect to its Hanford
operations.
4.9 Ecological Resources
The Hanford Site is a relatively large, undisturbed area [1,450 km'
(560 mi 2)] that contains numerous plant and animal species adapted to the
region's semiarid environment.
4.9.1 Terrestrial Resources
The Hanford Site, located in southcentral Washington, has been botani-
cally characterized as a shrub-steppe. Because of the Site's aridity, the
productivity of both plants and animals is relatively low compared with that
of other natural communities. In the early 1800s, the dominant plant in the
area was big sagebrush with an understory of perennial bunchgrasses, espe-
cially Sandberg's bluegrass and bluebunch wheatgrass. With the advent of set-
tlement that brought livestock grazing and crop raising, the natural vegeta-
tion mosaic was opened to,a persistent invasion by alien annuals, especially
cheatgrass. Today cheatgrass is the dominant plant on fields that were culti-
vated 50 years ago. Cheatgrass is also well established on rangelands at ele-
vations less than 244 m (800 ft). Wildfires in the area are common; the most
recent extensive fire in 1984 significantly altered the shrub component of the
vegetation. The dryland areas of the Hanford Site were treeless in the years
before land settlement; however, for several decades before 1943, trees were
planted and irrigated on most of the farms to provide windbreaks and shade.
When the farms were abandoned in 1943, some of the trees died but others have
4.27
persisted, presumably because their roots are deep enough to contact ground-
water. Today these trees serve as nesting platforms for several species of
birds, including hawks, owls, ravens, magpies, and great blue herons, and as
night roosts for wintering bald eagles (Rickard and Watson 1985). The vege-
tation mosaic of the Hanford Site currently consists of 10 major kinds of
plant communities; these are described and their distribution shown in Cushing
(1995).
4.9.2 Wetlands
DOE has determined that no wetlands are present on land that would be
occupied if any alternative is implemented.
Several habitats on the Hanford Site could be considered as wetlands.
The largest wetland habitat is the riparian zone bordering the Columbia River.
The extent of this zone varies, but it includes extensive stands of willows,
grasses, various aquatic macrophytes, and other plants. The zone is exten-
sively impacted by both seasonal water level fluctuations and daily variations
related to power generation at Priest Rapids Dam immediately upstream from the
Site.
Other extensive areas of wetlands can be found within the Saddle
Mountain National Wildlife Refuge and the Wahluke Wildlife Refuge Area.
These two areas encompass all the lands extending from the north bank of the
Columbia River northward to the Site boundary and east of the Columbia Riverdown to Ringold Springs. Wetland habitat in these areas consists of fairly
large ponds resulting from irrigation runoff. These ponds have extensive
stands of cattails (Typha sp.) and other emergent aquatic vegetation surround-
ing the open water regions. They are extensively used as resting sites by
waterfowl.
4.9.3 Aquatic Resources
The Columbia River is the dominant aquatic ecosystem on the Hanford Site
and supports a large, diverse community of plankton, benthic invertebrates,
fish, and other communities. The Columbia has been dammed both upstream and
downstream from the Hanford Site, and the reach flowing through the area is
the last free-flowing, but regulated, reach of the Columbia River in the
United States. Plankton populations in the Hanford Reach are influenced by
communities that develop in the reservoirs of upstream dams, particularly
Priest Rapids Reservoir, and by manipulation of water levels by dam operations
4.28
in downstream reservoirs. Phytoplankton and zooplankton populations at
Hanford are largely transient, flowing from one reservoir to another. No
tributaries enter the Columbia during its passage through the Hanford Site.
Chinook salmon, sockeye salmon, coho salmon, and steelhead trout use the river
as a migration route to and from upstream spawning areas and are of the great-
est economic importance. Details of the various aquatic components of the
Columbia River ecosystem and references to studies of those components can be
found in Cushing (1995).
The small spring streams, such as Rattlesnake and Snively springs,
contain diverse biotic communities and are extremely productive. Dense blooms
of watercress occur and are not lost until one of the major flash floods
occurs. The aquatic insect production is fairly high, compared to that in
mountain streams. The macrobenthic biota varies from site to site and is
related to the proximity of colonizing insects and other factors. Cushing
(1995) presents details on the ecological characteristics of these sites.
4.9.4 Threatened, Endangered, and Sensitive Species
Threatened and endangered plants and animals identified on the Hanford
Site, as listed by the federal government (50 CFR 17) and Washington State
(Washington Natural Heritage Program 1994), are shown in Table 4-4. No pl'ants
or mammals on the federal list of endangered and threatened wildlife and
plants (50 CFR 17.11, 17.12) are known to occur on the Hanford Site. However,
three birds and a number of other species of both plants and animals are under
consideration for formal listing by the federal and state governments.
Five species of plants are included in the Washington State listing.
Columbia milk-vetch (Astragalus columbianus Barneby), dwarf evening primrose(Oenothera pygmaea), and Hoover's desert parsley (Lomatium tuberosum) arelisted as threatened, and Columbia yellow cress (Rorippa co7umbiae Suksd.) andnorthern wormwood (Artemisia campestris ssp. borealis var. wormskio7dii) aredesignated as endangered. Columbia milk-vetch occurs on dry land benches
along the Columbia River near Priest Rapids Dam, Midway, and Vernita. It also
has been found on top of Umtanum Ridge and in Cold Creek Valley near the pres-
ent vineyards. Dwarf evening primrose has been found on mechanically dis-
turbed areas (i.e., the gravel pit near the Wye Barricade). Hoover's desert
parsley grows on steep talus slopes near Priest Rapids Dam, Midway, and
Vernita. Yellow cress occurs in the wetted zone of the water's edge along the
Columbia River. Northern wormwood is known to occur near Beverly and could
inhabit the northern shoreline of the Columbia River across from the
100 Areas.
4.29
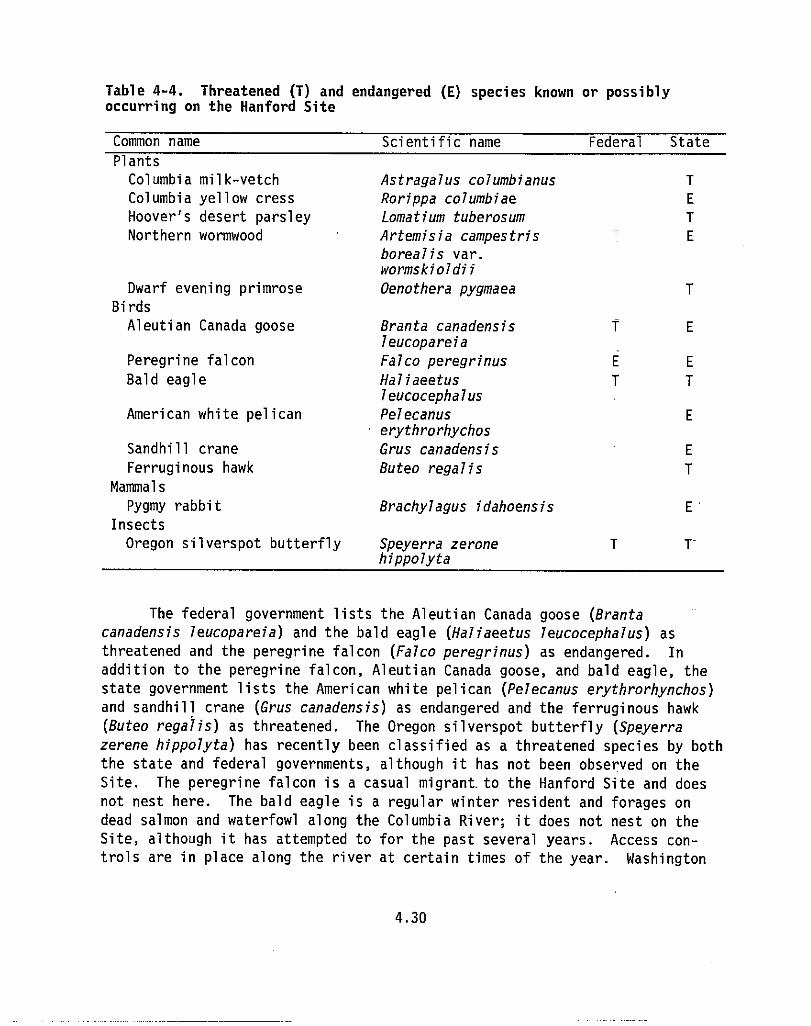
Dwarf evening primrose
Birds
Aleutian Canada goose
Peregrine falcon
Bald eagle
American white pelican
Sandhill crane
Ferruginous hawk
Mammals
Pygmy rabbit
Insects
Oregon silverspot butterfly
Table 4-4. Threatened (T) and endangered (E) species known or possiblyoccurring on the Hanford Site
Common name Scientific name Federal State
ants
Columbia milk-vetch
Columbia yellow cress
Hoover's desert parsley
Northern wormwood
Astraga7us co7umbianus TRorippa co7umbiae ELomatium tuberosum TArtemisia campestris Eborealis var.wormskio7dii
Oenothera pygmaea T
Branta canadensis T E7eucopareiaFalco peregrinus E E
Haliaeetus T T7eucocepha7usPe7ecanus EerythrorhychosGrus canadensis EButeo rega7is T
Brachy7agus idahoensis E'
Speyerra zerone T T-hippo7yta
The federal government lists the Aleutian Canada goose (Brantacanadensis 7eucopareia) and the bald eagle (Ha7iaeetus 7eucocepha7us) asthreatened and the peregrine falcon (Fa7co peregrinus) as endangered. Inaddition to the peregrine falcon, Aleutian Canada goose, and bald eagle, the
state government lists the American white pelican (Pe7ecanus erythrorhynchos)and sandhill crane (Grus canadensis) as endangered and the ferruginous hawk(Buteo rega7is) as threatened. The Oregon silverspot butterfly (Speyerrazerene hippo7yta) has recently been classified as a threatened species by boththe state and federal governments, although it has not been observed on the
Site. The peregrine falcon is a casual migrant.to the Hanford Site and does
not nest here. The bald eagle is a regular winter resident and forages on
dead salmon and waterfowl along the Columbia River; it does not nest on the
Site, although it has attempted to for the past several years. Access con-
trols are in place along the river at certain times of the year. Washington
4.30
State Bald Eagle Protection Rules were issued in 1986 (WAC-232-12-292). DOE
has prepared a Site Management Plan (Fitzner and Weiss 1994) to mitigate eagle
disturbance in response to the rules. The Endangered Species Act of 1973 also
requires that Section 7 consultation be undertaken when any action is taken
that may jeopardize the existence of, destroy, or adversely modify habitat of
the bald eagle or other threatened or endangered species. Increased use of
power poles for nesting sites by the ferruginous hawk on the Hanford Site has
been noted.
Shrub-steppe habitat is considered priority habitat by Washington State
because of its relative scarcity in the state and its requirement as nesting/
breeding habitat by loggerhead shrikes (federal and state candidate species),
sage sparrows (state candidate), burrowing owls (federal and state candidate),
pygmy rabbits (federal candidate and state endangered), sage thrashers (state
candidate), western sage grouse (federal and state candidate), northern sage-
brush lizard (federal candidate) and sagebrush voles (state monitored).
Although the last five species were not found during the present survey of the
reference site, the habitat should be considered potentially suitable for
their use. Pygmy rabbits and western sage grouse have been seen rarely on the
Hanford Site, and then primarily in upland regions.
Loggerhead shrikes have been seen frequently on the reference site and
are known to select tall big sagebrush as nest sites (Poole 1992). One shrike
was observed during the present survey of the reference site. However, no
nests were located. Ground squirrel burrows used by burrowing owls and owl
pellets were observed during the present survey of the reference site. Numer-
ous sage sparrows were also observed. Pygmy rabbits would not have been
observed during this survey because they primarily become active at twilight
and are nocturnal; they may also have been in hibernation. However, this
species is not known to inhabit lowland portions of the Hanford Site. The
closest known nest of the ferruginous hawk (federal candidate and state
threatened species) is approximately 8.9 km (5.3 mi) northwest of the refer-
ence site. The reference site should be considered as comprising a portion of
the foraging range of this species. No other species listed as endangered or
threatened, or candidates for such listing by Washington State or the federal
government, or species listed as monitor species by Washington State, were
observed on the reference site.
4.10 Noise
Sound waves are characterized by frequency and measured in hertz (Hz);
pressure is expressed as decibels (0). Noise levels are often reported as
4.31
the equivalent sound level (Leq), which normally refers to the equivalent con-
tinuous sound level for an intermittent sound, such as traffic noise. The Leq
is expressed in A-weighted decibels [dB(A)] and is averaged over a specified
period of time. The A-weighted sound level relates to human hearing
characteristics.
Most industrial facilities on the Hanford Site are located far enough
away from the Site boundary that noise levels at the boundary are not measur-
able or are barely distinguishable from background noise levels. Two studies
of environmental noise were done at Hanford: a study of the Skagit/Hanford
Nuclear Power Plant Site (NRC 1982) and a series of Site characterization
studies performed in 1987 that included five background environmental noise
level measurements.
Environmental noise measurements were taken in June 1981 at 15 sites on
the Hanford Site (NRC 1982). Noise levels ranged from 30 to 60.5 dB(A).
Values for more isolated areas ranged from 30 to 38.8 dB(A). Measurements
taken close to a Washington Public Power Supply System nuclear power plant
(WNP-2) ranged from 50.6 to 64 dB(A), resulting from construction equipment.
Measurements taken along the Columbia River near the intake structures for
WNP-2 were 47.7 and 52.1 dB(A), compared to more remote river noise levels of
45.9 dB(A). Community noise levels taken in North Richland [3000 Area at Horn
Rapids Road and Stevens Road (Route 240)] were 60.5 dB(A) and were largely
attributed to traffic.
Background noise levels (24 h Leq) were determined at five sites located
within the Hanford Site. The mean noise level for these five sites was
38.8 dB(A). Wind was the primary contributor to background noise levels.
Winds exceeding 5.4 m/s (12 mph) significantly increased noise levels. Mean
background noise levels (24 h Leq) in undeveloped areas range from 24 to
36 dB(A) (Cushing 1995).
The Hanford Environmental Health Foundation has monitored noise levels
resulting from several routine operations performed in the field at Hanford.
These included well drilling, pile driving, compressor operations, and water
wagon operation. Occupational sources of noise propagated in the field from
outdoor activities ranged from 93.4 to 96 dB(A).
4.32
4.11 Traffic and Transportation
This section discusses transportation at and around the Hanford Site._
Bulk materials or large items are shipped by barge. Rail and truck
transportation are used to move irradiated fuel, radioactive solid and liquid
wastes, equipment, and materials (primarily coal).
4.11.1 Regional Infrastructure
The regional transportation network near Hanford includes the areas in
Benton and Franklin counties from which 93% of the commuter traffic associated
with the Site originates. Interstate highways that serve the area are I-82,
I-182, and I-90. State Route (SR) 243 exits the northwestern boundary of the
Site. State Route 24 enters the Site from the west and continues eastward
across the northernmost portion of the Site. State Route 240 enters the
northern boundary and continues southeast, exiting the Site to the north of
Richland.
General weight, width, and speed limits have been established for high-
ways near Hanford. However, no unusual laws or restrictions have been identi-
fied that would significantly influence general .regional transportation.
Airline passenger and air freight service is provided at the Tri-Cities
Airport owned and operated by the Port of Pasco, at Pasco, Washington. The
air terminal is located approximately 16 km (10 mi) from the Hanford Site.
4.11.2 Hanford Site Infrastructure
Hanford's onsite road network consists of rural arterial routes (see
Figure 4-6). Only 104 of the 461 km (65 of the 288 mi) of paved roads at
Hanford are accessible to the public. Most onsite employee travel occurs
along Route 4, with controlled access at the Yakima and Wye Barricades. State
Route 240 is the main public route through the Site. Public highways SR 24
and SR 243 also traverse the Site.
A recently completed major highway improvement project involved repave-
ment and widening of the four-lane access route to the Wye Barricade. The
highway network has been used extensively for transporting large equipment
items, construction materials, and radioactive materials. Resurfacing, seal-
ing, and restoration programs are currently planned for segments of other
regional highways.
4.33
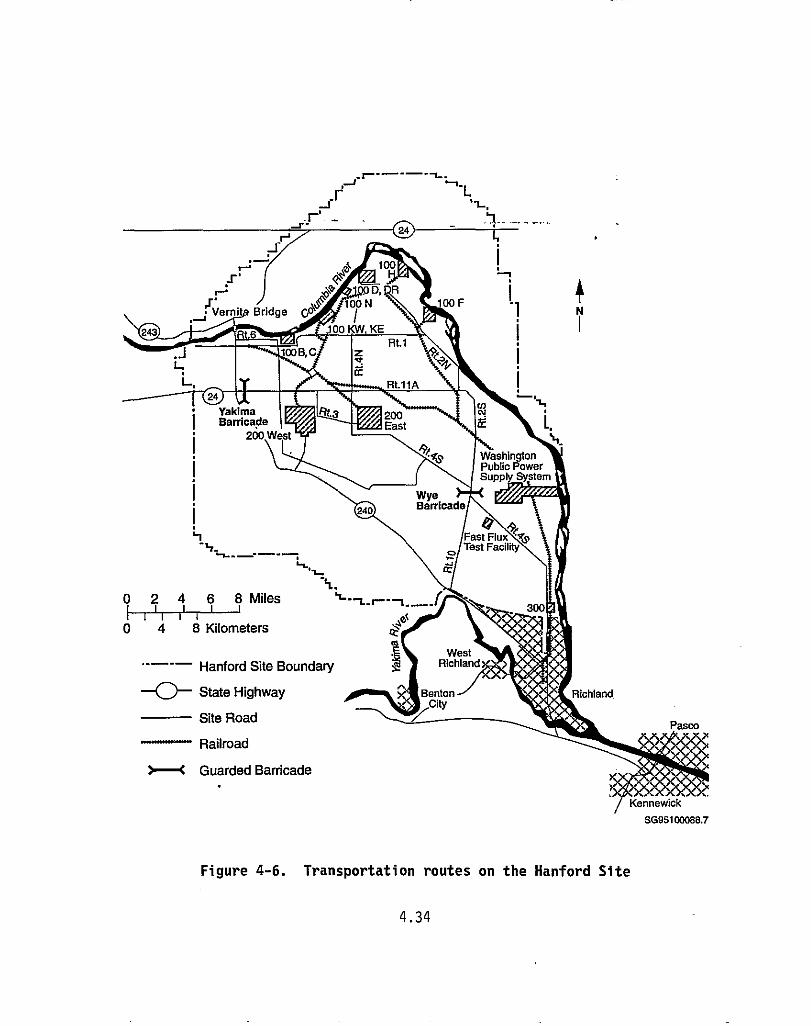
W—.. -#^
4't^4.
0 2 4 6 8 Miles_,—f l I II f
0 4 8 Kilometers
West—"— Hanford Site Boundary > Richland
State Highway Benton Richlandcity
Site Road
Railroad
>—^ Guarded Barricade
i
Figure 4-6. Transportation routes on the Hanford Site
SG95100088.7
4.34

Approximately 13 to 16 million km (8 to 10 million mi) are logged annu-
ally by DOE vehicles at Hanford (Green and Flanagan 1995). In addition, an
estimated 3,300 privately owned vehicles were driven onsite each weekday, and
560 were driven onsite each weekend day. Assuming a round-trip distance of
48 km (30 mi) onsite for each of these vehicles, a total of about 64 mil-
lion km (40 million mi) were driven annually by workers onsite.
The primary highways used by commuters are SR 24, SR 240, and I-182; 10,
90, and 10% of the work force use these routes, respectively (totals to more
than 100% because some commuters use two of the routes). With these commuting
patterns, workers annually travel about 43 millon km (27 million mi) offsite.
Trucks used for material shipment to Hanford compose about 5% of the vehicular
traffic on and around the Site.
During 1988, 169 accidents were reported onsite, with 20 involving DOE
vehicles. The other accidents involved privately owned vehicles and included
seven injury accidents and one fatal accident on SR 240. Among offsite high-
way segments of concern, most accidents occurred along I-82. According to
available data, the 15 accidents involving trucks in 1987 in the Benton/
Franklin county study area resulted in 13 injuries and 3 fatalities.
Onsite rail transport is provided by a short-line railroad owned and
operated by DOE. This line connects just south of the Yakima River with the
Union Pacific line, which in turn interchanges with the Washington Central and
Burlington Northern railroads at Kennewick. AMTRAK passenger rail service is
provided in the Tri-Cities at the Burlington Northern depot at Pasco. Approx-
imately 145,000 rail miles (232,000 km) were logged at Hanford in 1988, pri-
marily transporting coal to steam plants. Two noninjury rail accidents
occurred at Hanford in 1988.
The Hanford Site infrequently uses the Port of Benton dock facilities
on the Columbia River for off-loading large shipments. Overland wheeled
trailers are then used to transport those shipments to the Site. No barge -
accidents were reported in 1988.
4.12 Occupational and Public Health and Safety
This section summarizes the Hanford Site programs designed to protect
the health and safety of workers and the public. It also describes existing
radiological and nonradiological conditions and provides a historical perspec-
tive on worker and public exposures and potential health effects.
r=1i
4.12.1 Occupational Health and Safety
Programs are in place at the Hanford Site to protect workers from radio-
logical and nonradiological hazards. Radiological protection (health physics)
programs are based on requirements in regulations and DOE Orders, and on guid-
ance in radiological control manuals. Occupational nonradiological health and
safety programs are composed of industrial hygiene programs and occupational
safety programs.
Radiological Health and Safety
The current radiation dose limits were promulgated in 10 CFR 835, "Occu-
pational Radiation Protection." This regulation includes limits on total
effective dose equivalent to workers, dose to individual organs, and dose to
members of the public (including minors and unborn children of workers) that
may be incidentally exposed while at DOE facilities. In addition, it estab-
lishes a policy of keeping doses as low as reasonably achievable, specifies
training requirements for radiation protection personnel and other workers,
and requires monitoring and reporting of radiation exposure records for indi-
vidual workers and certain visitors.
Radiation Doses to Workers
Cumulative doses to all Hanford Site workers and visitors for all acti-
vities provide a baseline for Site operations. In 1994, about 22,000 workers
(including offsite contractors) were monitored at the Hanford Site. Of those
monitored, 13,000 were classified as radiation workers, with an average annual
dose equivalent of 0.02 rem/year per individual. This dose is well below the
10 CFR 835 dose limit of 5 rem/year and the DOE Administrative Control Level
of 2 rem/year for occupational exposure. For 1994 the estimated collective
dose-equivalent was 220 person-rem for all Hanford Site workers. Based on
standard dose-to-health effects conversion factors (ICRP 1991), no health
effects would be expected to result among this exposed population.
A relatively small fraction of the Hanford Site worker exposure was
directly related to'SNF storage activities, of which operation of the KE Basin
was the major contributor. The collective radiation dose to K Basin workers
over the 2-year period 1991 and 1992 averaged 22 person-rem/year, or approxi-
mately 0.4 rem/year for each worker. An average of 58 workers were assigned
to the K Basins during this period (Holloman and Motzco 1992, 1993).
4.36
Industrial Hygiene Program
Occupational nonradiological health and safety programs at Hanford are
composed of industrial hygiene and occupational safety programs, which are
implemented to meet the requirements of state and federal health and safety
standards. Industrial hygiene programs address such subjects as toxic chemi-
cals and physical agents, carcinogens, noise, biological hazards, lasers,
asbestos, and ergonomic factors. Occupational safety programs address such
subjects as machine safety, hoisting and rigging, electrical safety, building
codes, welding safety, and compressed gas cylinders.
Worker Safety and Accidents
No incidents of overexposure to radiation were reported to DOE during
1990 and 1991 in association with SNF storage activities at the Hanford Site.
Overexposures are defined as any exposure over regulatory limits established
by the DOE (Lansing et al. 1992; WHC 1990). In the 4-year period from 1991
through 1994, industrial-type accidents resulted in 98 lost working days at
the K Basins out of a total of approximately 70,000 days worked.
4.12.2 Public Health and Safety
The DOE has the responsibility under the Atomic Energy Act to establish
the necessary standards to protect members of the public from radiation expo-
sures resulting from DOE activities. For 1994, Dirkes and Hanf (1995) reportthat the Hanford Site is in compliance with requirements and standards estab-
lished by DOE and other federal agencies.
Environmental Programs
DOE Order 5400.1, "General Environmental Protection Program," estab-
lishes the requirement for environmental protection programs. Environmental
programs are conducted at the Hanford Site to restore environmental quality,
manage waste, develop appropriate technology for cleanup activities, and moni-
tor levels of potentially hazardous materials in the environment.
Environmental Monitoring/Surveillance Information
Environmental monitoring at the Hanford Site consists of effluent
monitoring and environmental surveillance, including groundwater monitoring.
Effluent monitoring is performed by the operators 'at the facility or at the
point of release to the environment. Environmental surveillance consists of
4.37
sampling and analyzing environmental media on and off the Hanford Site to
detect and quantify potential contaminants and to assess their environmental
and human health significance. The annual Hanford Site environmental report
(e.g., Dirkes and Hanf 1995) summarizes this information for the Hanford Site.
Potential Radiation Doses
Potential radiation doses and exposures to members-of the public from
releases of radionuclides to air and water at the Hanford Site are calculated
and reported annually. The potential radiation doses to a'maximally exposed
individual (MEI) have been published in annual Hanford Site environmental
reports since 1957. For 1994 the total potential dose (via air and water
pathways) to the MEI from Hanford operations was calculated to be 0.05 mrem.
The collective dose to the 380,000 people living within 80 km (50 mi) of the
Hanford Site was 0.6 person-rem in 1994 (Dirkes and Hanf 1995). By compari-
son, the total dose received in a year by this same population from natural
background radiation was about 110,000 person-rem.
The potential cumulative effective dose equivalent to members of the
public from both air and water sources for the 28-year period 1944 through
1972 was estimated by the Hanford Environmental Dose Reconstruction Project
(TSP 1994). The highest cumulative dose to an adult resident for the years
1944 through 1972 from pathways associated with releases to both air and water
was about 2.5 rem, essentially all of which occurred before 1964. For compar-
ison, the dose received by an average resident during this 28-year period from
natural background radiation was approximately 9 rem. The cumulative popula-
tion dose during 1944 through 1972 was 100,000 person-rem, essentially all of
which was received through air pathways in 1945. Radiation doses received by
the public from Hanford releases after 1972 were much smaller.
4.13 Site Services
This section discusses water consumption, electrical consumption and
wastewater disposal for the Hanford Site and local areas.
4.13.1 Water Consumption
The principal source of water in the Tri-Cities and the Hanford Site is
the Columbia River, from which approximately of 4.3 x 10 1 m3 (11.38 bil-
lion gal) was drawn in 1991. Each city operates its own supply and treatment
system. The Richland water supply system derives about 67% of its water from
the Columbia River, approximately 15 to 20% from a well field in North
4.38
Richland, and the remaining from groundwater wells. The city of Richland's
total usage in 1991 was 2.1 x 10' m' (5.65 billion gal). The city of Pasco
system also draws from the Columbia River for its water needs; the 1991 esti-
mate of consumption was 1.1 x 10' m' (2.81 billion gal). The Kennewick system
uses two wells and the Columbia River for its supply. These wells serve as
the sole source of water between November and March and can provide approxi-
mately 62% of the total maximum supply of 2.8 x 10' m' (7.3 billion gal).
Total usage of those wells in 1991 was 1.1 x 10' m' (2.92 billion gal).
4.13.2 Electrical Consumption
Electricity is provided to the Tri-Cities by the Benton County Public
Utility District, Benton Rural Electrical Association, Franklin County Public
Utility District, and City of Richland Energy Services Department. All the
power that these utilities provide in the local area is purchased from the
Bonneville Power Administration. The average rate for residential customers
served by the three local utilities is approximately $0.046 per kilowatt hour.
Electrical power for the Hanford Site is purchased wholesale from the
Bonneville Power Administration.
In the Pacific Northwest, hydropower, coal, and nuclear power constitute
the region's electrical generation system. Total generating capacity is about
40,270 megawatts. Approximately 74% of the region's installed generating `
capacity is hydroelectric, which supplies approximately 65% of the electricity
used by the region. Coal-fired generating capacity is 6,702 megawatts in the
region, 16% of the region's electrical generating capacity. One commercial
nuclear power plant is in service in the Pacific Northwest, with a
1170-megawatt capacity of 3% of the region's generating capacity. Oil and
natural gas account for about 3% of capacity.
Throughout the 1980s, the Northwest had more electric power than it
required and was operating with a surplus. This surplus has been exhausted,
however, and there is only approximately enough power supplied by the existing
system to meet the current electricity needs. Hydropower improvement projects
currently under construction in the Northwest include about 150 megawatts of
new capacity. The cost and availability of several other resources are cur-
rently being studied. Approximate rates for current consumption of elec-
tricity, coal, propane, natural gas, and other-utilities at the Hanford Site
are shown in Table 4-5.
4.39
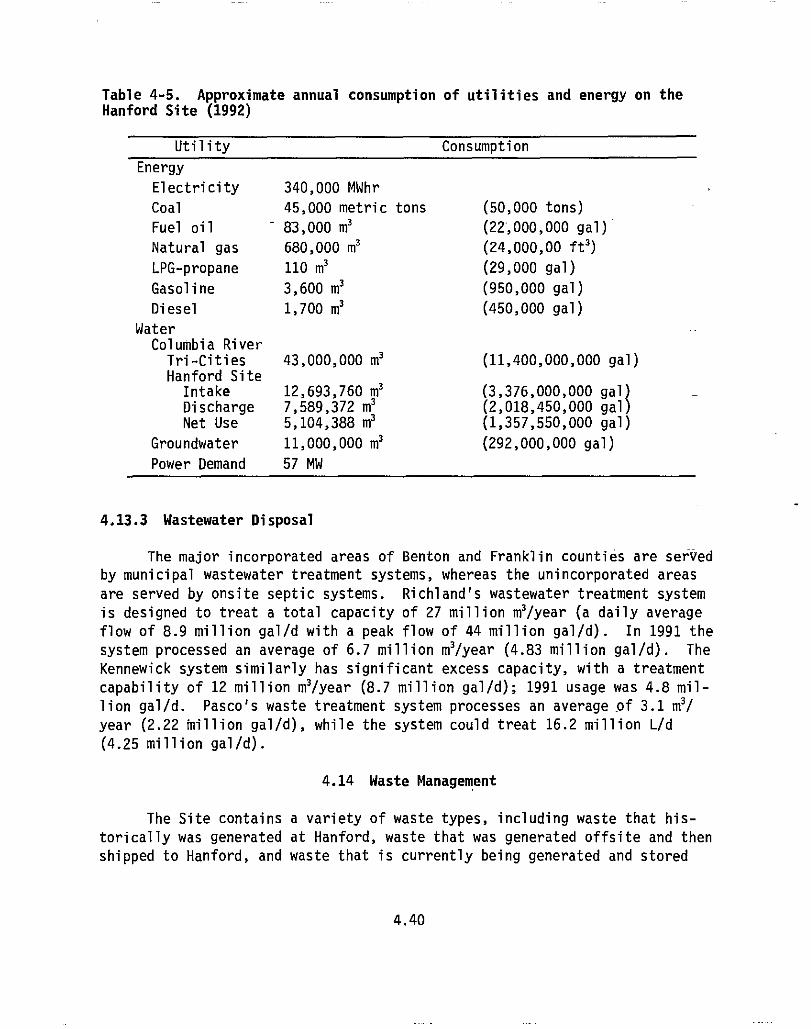
Table 4-5. Approximate annual consumption of utilities and energy on theHanford Site (1992)
Utility Consumption
tnergy
Electricity 340,000 MWhr
Coal 45,000 metric tons (50,000 tons)
Fuel oil 83,000 m3 (22,000,000 gal)
Natural gas 680,000 m3 (24,000,00 ft3)
LPG-propane 110 m3 (29,000 gal)
Gasoline 3,600 m3 (950,000 gal)
Diesel 1,700 m3 (450,000 gal)
WaterColumbia RiverTri-Cities 43,000,000 m3 (11,400,000,000 gal)Hanford Site
Intake 12,693,760 m3 (3,376,000,000 gal)Discharge 7,589,372 m3 (2,018,450,000 gal)Net Use 5,104,388 m3 (1,357,550,000 gal)
Groundwater 11,000,000 m3 (292,000,000 gal)
Power Demand 57 MW
4.13.3 Wastewater Disposal
The major incorporated areas of Benton and Franklin counties are served
by municipal wastewater treatment systems, whereas the unincorporated areas
are served by onsite septic systems. Richland's wastewater treatment system
is designed to treat a total capacity of 27 million M3 /year (a daily average
flow of 8.9 million gal/d with a peak flow of 44 million gal/d). In 1991 the
system processed an average of 6.7 million M3 /year (4.83 million gal/d). The
Kennewick system similarly has significant excess capacity, with a treatment
capability of 12 million M3 /year (8.7 million gal/d); 1991 usage was 4.8 mil-
lion gal/d. Pasco's waste treatment system processes an average of 3.1 m3/
year (2.22 million gal/d), while the system could treat 16.2 million L/d
(4.25 million gal/d).
4.14 Waste Management
The Site contains a variety of waste types, including waste that his-
torically was generated at Hanford, waste that was generated offsite and then
shipped to Hanford, and waste that is currently being generated and stored
4.40
onsite. This section discusses the management of these wastes and provides
the current status of various waste types being generated, stored, and/or dis-
posed at the Hanford Site. These wastes include radioactive waste, mixed
waste, hazardous waste, industrial and sanitary solid waste, and hazardous
materials.
The total amount of waste generated and disposed at the Hanford Site has
been reduced and-continues to be reduced through the Hanford Waste Minimiza-
tion (and Pollution Prevention) Program, which is aimed at source reduction,
product substitution, recycling, surplus chemical exchange, and waste treat-
ment. All waste classes including radioactive, mixed, hazardous, and nonhaz-
ardous regulated wastes are included in the Hanford Waste Minimization
Program.
4.14.1 Radioactive Waste
Radioactive wastes generated and/or stored at Hanford include tank
wastes, low-level wastes, transuranic wastes, and mixed wastes (i.e., mixtures
containing both radioactive and hazardous constituents). Mixed waste is dis-
cussed in Section 4.14.2. For a more detailed historical account of radio-
active high-level waste generation and accumulation at the Hanford Site, refer
to Appendix A of the DOE SNF PEIS (DOE 1995a).
Double-Shell Tank Waste
The 28 double-shell tanks currently contain about 80 million L (21 mil-
lion gal) of waste, with required space capacity of approximately 8.7 mil-
lion L (2.3 million gal) (DOE and Ecology 1995). Additional information on
the mixed waste component of these totals is given in Section 4.14.2. Alter-
natives for the treatment and disposal of the tank wastes will be evaluated in
a future EIS on the Tank Waste Remediation System (TWRS). No high-level
wastes are expected to be generated in 1995 from SNF management activities
(DOE 1995a).
Transuranic Waste
Transuranic (TRU) waste consists of material contaminated with elements
that have an atomic number greater than 92. TRU waste at the Hanford Site
exists mostly in solid form. From 1970 to 1986, TRU waste was segregated and
disposed of as retrievable waste in special trenches. Currently, all TRU and
mixed-TRU wastes are stored in above-grade storage facilities in the Hanford
Central Waste Complex located in the 200 West Area, and the Transuranic Waste
4.41
Storage and Assay Facility within the Solid Waste Operations Complex. As of
1993, there were about 124,800 m 3 (168,500 yd 3) of TRU wastes buried or in
retrievable storage (DOE 1994b). From 1996 through 2000, approximately 10 m3
(13.5 yd 3) of TRU waste is expected to be generated by SNF management
activities.
Low-Level Waste
Solid low-level waste is currently placed in unlined, near-surface
trenches at the 200 Area low-level waste burial grounds. Approximately
558,916 m3 (731,034 yd 3) of low-level waste are buried at Hanford and another
130 m3 (170 yd 3) placed into storage (DOE 1995a) before 1991. The average
annual volume of low-level wastes received at the Hanford Site from offsite
generators from 1987 through 1991 was 5,760 m 3 (7,416 yd3). From 1992 through
1994, Hanford received the following volumes of low-level waste from offsite
generators: 1992 - 1,285.3 m3 (1,735 yd3); 1993 - 2,020.2 m3 (2,727 yd3); 1994
- 2,036.5 m3 (2,749.3 yd').
These numbers exclude volumes received at a licensed commercial low-
level burial ground on the Hanford Site, which is leased to the State of
Washington and operated by U.S. Ecology for disposal of non-Hanford waste.
Through 1991, 338,500 m3 (442,741 yd 3) of low-level non-Hanford wastes had
been disposed of at the U.S. Ecology site (DOE 1992b). U.S. Ecology has
projected a volume of 4,816 m3 (6,300 yd 3) of low-level non-Hanford waste willbe disposed of in 1995.(')
An inventory of radioactive waste (excluding mixed waste) generated on
the Hanford Site from 1988 through 1994 is given in Table 4-6. In 1995
174.5 m3 (228.3 yd 3) of low-level wastes will be generated from SNF management
activities.
4.14.2 Mixed Waste
Mixed waste is defined as mixtures containing both radioactive materials
and hazardous (chemically and/or physically) wastes. Special nuclear material
production and site restoration activities have generated and may continue to
generate mixed waste.
(a) Letter from J. M. Van Nostrand to S. McLellan, November 1994.U.S. Ecology, Inc. Docket Nos. TG-920234, UR-930711, and UR-930890;Calculation of Temporary Rates for 1995.
4.42
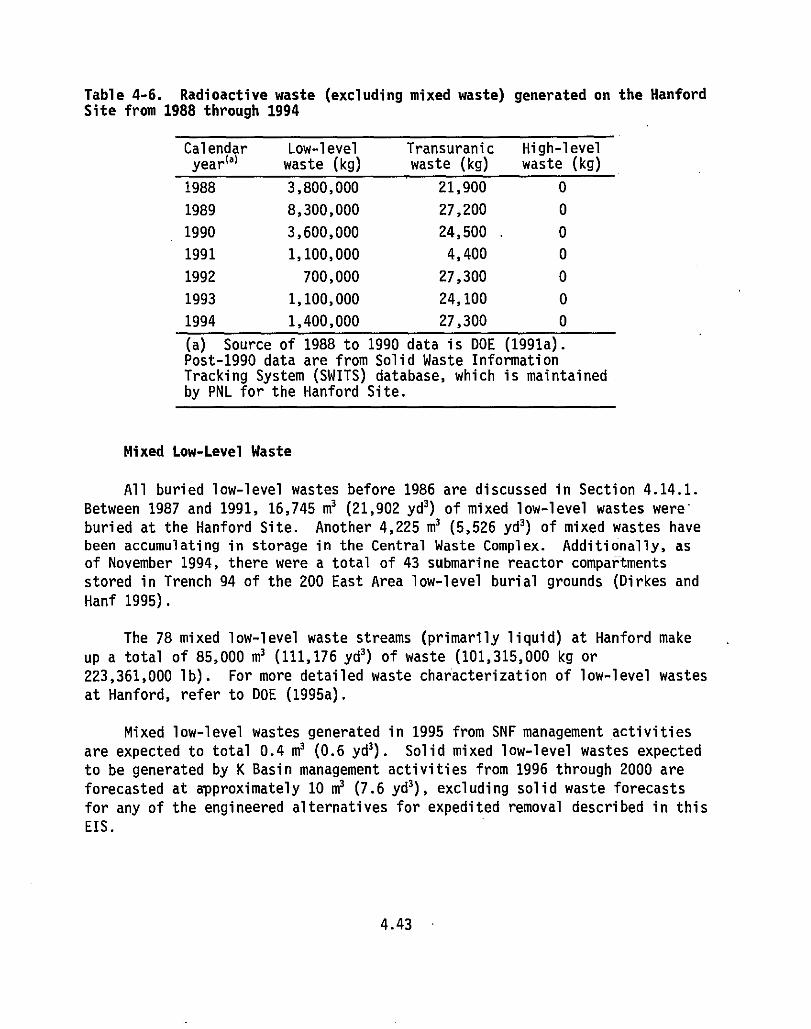
Table 4-6. Radioactive waste (excluding mixed waste) generated on the HanfordSite from 1988 through 1994
Calendaryear(a)
Low-levelwaste (kg)
Transuranicwaste (kg)
High-levelwaste (kg)
1988 3,800,000 21,900 0
1989 8,300,000 27,200 0
1990 3,600,000 24,500 0
1991 1,100,000 4,400 0
1992 700,000 27,300 0
1993 1,100,000 24,100 0
1994 1,400,000 27,300 0
(a) Source of 1988 to 1990 data is DOE (1991a).Post-1990 data are from Solid Waste InformationTracking System (SWITS) database, which is maintainedby PNL for the Hanford Site.
Mixed Low-Level Waste
All buried low-level wastes before 1986 are discussed in Section 4.14.1.
Between 1987 and 1991, 16,745 m 3 (21,902 yd 3) of mixed low-level wastes were,
buried at the Hanford Site. Another 4,225 m3 (5,526 yd 3) of mixed wastes have
been accumulating in storage in the Central Waste Complex. Additionally, asof November 1994, there were a total of 43 submarine reactor compartments
stored in Trench 94 of the 200 East Area low-level burial grounds (Dirkes and
Hanf 1995).
The 78 mixed low-level waste streams (primarily liquid) at Hanford make
up a total of 85,000 m3 (111,176 yd 3) of waste (101,315,000 kg or
223,361,000 lb). For more detailed waste characterization of low-level wastes
at Hanford, refer to DOE (1995a).
Mixed low-level wastes generated in 1995 from SNF management activities
are expected to total 0.4 m3 (0.6 yd3). Solid mixed low-level wastes expected
to be generated by K Basin management activities from 1996 through 2000 are
forecasted at approximately 10 m 3 (7.6 yd3), excluding solid waste forecasts
for any of the engineered alternatives for expedited removal described in this
EIS.
4.43
Mixed High-Level and Mixed Transuranic Waste
Tank wastes constitute 99% of the mixed wastes at the Hanford Site. In
1993, DOE reported an inventory of 233,689 m3 (305,654 yd') of mixed wastes is
stored in Hanford tanks: 145,952 m3 (190,898 yd 3) of high-level mixed waste,3,935 m3 (5,147 yd 3) of mixed TRU waste, and 84,802 m3 (110,917 yd 3) of mixedlow-level waste.
4.14.3 Hazardous Waste
Hazardous waste, as defined by RCRA, is a solid waste, or a combination
of solid wastes, which because of its quantity, concentration, or physical,
chemical or infectious characteristic, may potentially pose a hazard to human
health or the environment. Hazardous wastes are generated during normal
facility operations.
In 1992, approximately 619,000 kg (1,365,000 lb) of hazardous waste was
generated on the Hanford Site. Currently, the principal waste management
practice for newly generated hazardous waste (nonradioactive) is to ship it
offsite. Hazardous wastes generated in 1995 from SNF management activities
will total 2.2 m3 (2.9 yd3).
4.14.4 Industrial and Sanitary Solid Waste(')
Nondangerous, nonradioactive solid wastes are generated in almost allareas of and in most operations at the Hanford Site. The active Hanford Site
Solid Waste Landfill is located in the 200 Areas and has operated since 1973.
Nondangerous wastes, as defined by Washington State Dangerous Waste Regula-
tions (WAC 173-303), are buried in the solid waste section of the Solid Waste
Landfill. The landfill is currently scheduled for closure in 1997 (WHC
1993a). Some solid waste generated at Hanford has also been sent to the City
of Richland landfill.
4.15 Hazardous Materials
A hazardous chemical is one that poses a physical or health hazard, as
defined in 29 CFR 1910.1200(c). Hazardous materials are not waste, but when
the materials are no longer useful, they may become waste. Hazardous chemi-
cals are used throughout the Hanford Site in facility and environmental
(a) In this context "sanitary" denotes wastes that are nonhazardous, for themost part, such as industrial and municipal solid wastes.
4.44
restoration operations. Maintaining inventories of such materials requires
reporting under the Emergency Planning and Community Right-to-Know Act.
As of April 1995, approximately 1,490 hazardous chemicals were inventor-
ied at more than 570 locations on the Hanford Site. These 1,490 chemicals are
contained in approximately 2,700 different hazardous materials. The DOE has
prepared chemical inventory reports required under Section 313 of the Act
since 1988. At the Hanford Site, the minimum reporting threshold was exceeded
for 53 hazardous chemicals in 1992, 49 chemicals in 1993, and 53 chemicals in
1994.
4.45
* ` ^ byTHIS PAGELEFT BLANK
Overview
5.0 ENVIRONMENTAL CONSEQUENCES
The following subsections describe various potential environmental
consequences as a result of implementing alternatives for management of SNF at
the Hanford Site K Basins. The seven alternatives analyzed were 1) no action,
2) enhanced K Basins storage;3) new wet storage, 4) drying/passivation
(conditioning) with dry storage, 5) calcination with dry storage, 6) onsite
processing, and 7) foreign processing. Each of these alternatives contains
several different options that represent alternative means of managing the
K Basins fuel for the next 40 years or until a decision on its ultimate
disposition has been made.
These analyses were undertaken with an incomplete knowledge of the
condition of SNF in the K Basins. Information needed to determine the
properties of the stored fuel is currently being obtained through laboratory
characterization studies. The results of these studies are not necessary to
develop the environmental consequence analyses in this document but may be
necessary to refine the process design for the alternative ultimately selected
by DOE. Therefore, the analyses in the following sections encompass a range
of options for management of the K Basins SNF. The analyses performed for
this environmental impact statement (EIS) are relatively conservative in order
to bound the actions that may be undertaken during SNF management activities.
A safety analysis would be performed for the specific option ultimately
selected before implementing any alternative.
5.1 Overview
Section 5.1 contains a brief summary of the potential environmental
consequences of interest and an overview of activities associated with the
various alternatives that may result in environmental consequences. For this
analysis, all new facilities were assumed to be constructed adjacent to the
200 East Area (the reference site) or within the 200 East Area on, or adjacent
to, the partially completed Canister Storage Building (CSB) site for the
Hanford Waste Vitrification Plant (see Figure 1-3). Use of the partially
completed facility for storage of K Basins SNF would save part of the cost of
designing and constructing new facilities and would minimize additional land
disturbance. Commitment of the required land within the 200 East Area would
be consistent with the Site mission and would not represent a conflict on land
use. Up to 8.1 ha (20 acres) of additional land would be disturbed during
5.1
Overview
construction of process, storage, and support facilities at the reference
site. Other alternatives would disturb smaller areas, and use of the CSB site
would result in essentially no new land disturbance for any alternative. A
survey of the reference site revealed no threatened or endangered species or
cultural resources that would be directly affected by construction activities.
Routine operations under any of the alternatives would not add substan-
tially to cumulative occupational or public exposures to radiation. However,
specific short-term activities associated with removal and stabilization of
the fuel could temporarily increase worker and public exposures during these
activities. Major increases in current emission levels of criteria pollutants
or other hazardous materials would not be expected from implementing any of
the alternatives. Implementation of alternatives requiring new construction
would result in a small increase in Hanford's electrical power consumption;
the largest increase would be associated with the onsite processing alter-
native. The foreign processing alternative would result in the greatest
expenditures over the 40-year storage period and for the entire life cycle.
The temporary influx of workers under any of the alternatives would not likely
have an adverse impact on community services in the current economic climate.
5.1.1 No Action Alternative
The no action alternative identifies the minimum actions deemed neces-
sary for continued safe and secure storage of SNF at the Hanford Site. Under
this alternative, only necessary safety and security upgrades would be per-
formed at the K Basins, and the fuel would continue to be stored in its
current configuration. Ongoing operation of the K Basins is the only activity
associated with this alternative that may result in environmental conse-
quences.
5.1.2 Enhanced K Basins Storage Alternative
Activities associated with the enhanced K Basin storage alternative
include upgrade of the existing K Basins facilities to provide safe and secure
storage of the SNF. Fuel would be containerized at the K East (KE) Basin, and
the containerized fuel would be moved to the K West (KW) Basin for continued
storage. The fuel currently in the KW Basin would be rearranged to provide
the necessary additional storage space. Sludge, water, and debris would be
removed from the KE Basin, and the facility would be deactivated.
5.2
Overview
5.1.3 New Wet Storage Alternative
Activities evaluated under this alternative include repackaging and
removal of K Basins SNF, transport to a storage site on the 200 Areas plateau,
and placement in a new wet storage facility. The wet storage options
evaluated include storage of SNF in water-filled multicanister overpacks
(MCOs) in either a water-filled pool or a vault. Sludge, water, and debris
would also be removed from the K Basins and the facilities deactivated.
5.1.4 Drying/Passivation (Conditioning) with Dry Storage Alternative
Activities evaluated under the preferred alternative include repackag-
ing, removal, and drying of K Basins SNF; transport to a new staging/storage
site on the 200 Areas plateau; conditioning or passivation for storage as
needed; and placement of the SNF into dry storage. Sludge, water, and debris
would also be removed from the K Basins and the facilities deactivated.
5.1.5 Calcination with Dry Storage Alternative
Activities considered under this alternative include repackaging and
removal of K Basins SNF, transport to a new staging/storage site on the
200 Areas plateau, dissolution and calcination of the SNF, and placement in a
dry storage facility. Sludge, water, and debris would also be removed from
the K Basins and the facilities deactivated.
5.1.6 Onsite Processing Alternative
Activities included in the onsite processing alternative are removal of
SNF from the K Basins; transport to a new staging/storage facility on the
200 Areas plateau before processing; separation of plutonium, uranium, and
fission products at a new facility; and storage of the separated uranium oxide
at a new facility. For the purposes of this analysis, plutonium and high-
level waste resulting from the process were also assumed to be stored in
onsite facilities. As with the other alternatives, sludge, debris, and water
would ultimately be removed from the K Basins and the facilities would be
deactivated.
5.3
Land Use
5.1.7 Foreign Processing Alternative
Activities that would be conducted as part of the foreign processing
alternative include transloading K Basin SNF into shipping casks at the
K Basins, onsite transfer of the shipping casks to a new staging facility and
shipment of the SNF to an overseas location for separation into uranium,
plutonium, and high-level waste, after which these materials would be returned
to Hanford for storage. Deactivation of the K Basins and management of the
returned uranium and plutonium were assumed to be the same as in the onsite
processing alternative. The high-level waste was assumed to be returned in a
vitrified form and stored with treated tank wastes at the Hanford Site. The
consequences presented in this EIS do not include the impacts of
transportation or processing at the foreign location. They are assumed to be
similar to those for transportation from the Hanford Site to a U.S. port, and
for processing at the Hanford Site, respectively.
5.2 Land Use
Consequences of implementing the alternatives for management of K Basins
SNF on land use at the Hanford Site are discussed in the following
subsections.
5.2.1 No Action and Enhanced K Basins Storage Alternatives
The no action and enhanced K Basins storage alternatives would not
require construction of new facilities; therefore, no land use consequences
would be associated with either alternative.
5.2.2 Wet Storage, Passivation or Calcination with Dry Storage, and
Processing Alternatives
All new construction associated with the wet storage, dry storage, and
processing alternatives would be located on or adjacent to land already dedi-
cated to nuclear facilities. Up to 8.1 ha (20 acres) would be disturbed by
construction of facilities associated with the onsite processing alternative
at the reference site. If the facilities were constructed at the CSB site,
they would be on land that has been previously disturbed. The land use
associated with each alternative is shown in Table 5-1.
5.4
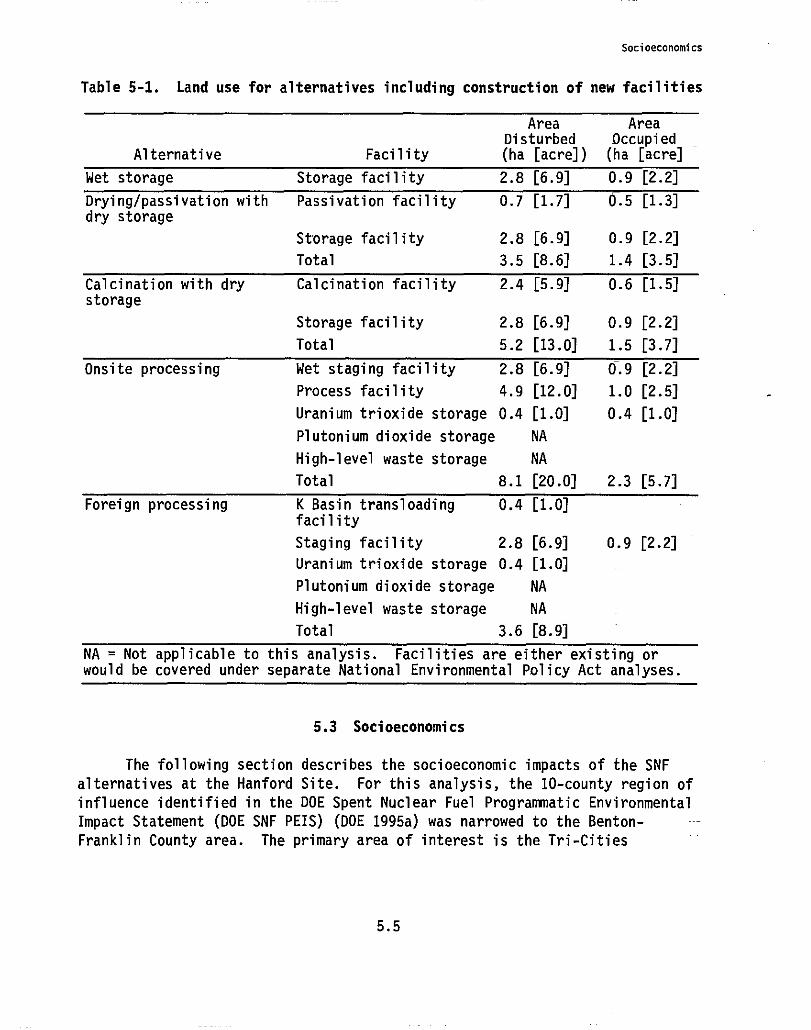
Socioeconomics
Table 5-1. Land use for alternatives including construction of new facilities
Area AreaDisturbed Occupied
Alternative Facility (ha [acre]) (ha [acre]
Wet storage Storage facility 2.8 [6.9] 0.9 [2.2]
Drying/passivation with Passivation facility 0.7 [1.7] 0.5 [1.3]dry storage
Storage facility 2.8 [6.9] 0.9 [2.2]
Total 3.5 [8.6] 1.4 [3.5]
Calcination with dry Calcination facility 2.4 [5.9] 0.6 [1.5]storage
Storage facility 2.8 [6.9] 0.9 [2.2]
Total 5.2 [13.0] 1.5 [3.7]
Onsite processing Wet staging facility 2.8 [6.9] 0.9 [2.2]
Process facility 4.9 [12.0] 1.0 [2.5]
Uranium trioxide storage 0.4 [1.0] 0.4 [1.0]
Plutonium dioxide storage NA
High-level waste storage NA
Total 8.1 [20.0] 2.3 [5.7]
Foreign processing K Basin transloading 0.4 [1.0]facility
Staging facility 2.8 [6.9] 0.9 [2.2]
Uranium trioxide storage 0.4 [1.0]
Plutonium dioxide storage NA
High-level waste storage NA
Total 3.6 [8.9]
NA = Not applicable to this analysis. Facilities are either existing orwould be covered under separate National Environmental Policy Act analyses.
5.3 Socioeconomics
The following section describes the socioeconomic impacts of the SNF
alternatives at the Hanford Site. For this analysis, the 10-county region of
influence identified in the DOE Spent Nuclear Fuel Programmatic Environmental
Impact Statement (DOE SNF PEIS) (DOE 1995a) was narrowed to the Benton-
Franklin County area. The primary area of interest is the Tri-Cities
5.5
Socioeconomics
(Richland, Kennewick, and Pasco), where the vast majority of the impacts can
be expected. The socioeconomic impacts are classified in terms of primary and
secondary effects. Changes in Hanford employment and subcontracts, materials,
and services expenditures associated with the various alternatives for dealing
with K Basins SNF are classified as primary effects, while the additional
changes that result in the general regional economy and community as a result
of these primary changes are classified as secondary effects. Examples of
secondary impacts include such things as changes in retail and service employ-
ment or changes in demand for housing. The total socioeconomic impact in the
region is the sum of the primary and secondary impacts. .
Estimates of total employment impacts were calculated using the IMPLAN
regional economic model (MIG 1993) for the Tri-Cities region. These estimates
were checked for consistency with the less-detailed estimates produced for the
DOE SNF PEIS using the Regional Input-Output Modeling System (RIMS) of the
U.S. Bureau of Economic Analysis. Allowing for differences in methods, the
more-detailed estimates produced for this EIS are in general agreement with
those produced by the earlier, less-detailed analysis. This estimate reports
the changes in employment and earnings based on historical data, which indi-
cate that 93% of Hanford employees reside in the Benton-Franklin County area
and that about 13.5% of all subcontracts, materials, and services procurements
by Hanford's management and operations contractor occur in the same region.
Impacts other than employment and income are largely based on changes in
population, in view of current capacities of the local roads, schools, waste
and water treatment, and other elements of local infrastructure. Historical
geographic patterns of settlement are assumed to persist.
5.3.1 No Action Alternative, Enhanced K Basins Storage Alternative, and
Foreign Processing Alternative
Under the no action alternative, only the minimum actions required for
continued safe and secure storage of SNF would occur. No new facilities would
be constructed, and only minimum facility upgrades or replacements would take
place. In the case of the K Basins enhancements, the investment necessary to
consolidate KE Basin fuel at KW Basin would result in an increase of $5 mil-
lion to $20 million in annual budgets between 1996 and 2002, which would
generate no extra jobs onsite and only a few extra (less than 200) total jobs.
After this K Basin operations employment and budgets would fall to about two
thirds of the baseline value shown in Table 5-2. It is assumed that existing
personnel would be used to perform the enhancements, and therefore, few incre-
mental consequences would occur. Overall, Tri-Cities socioeconomic conditions
would continue as they currently are, with employment fluctuating but
5.6
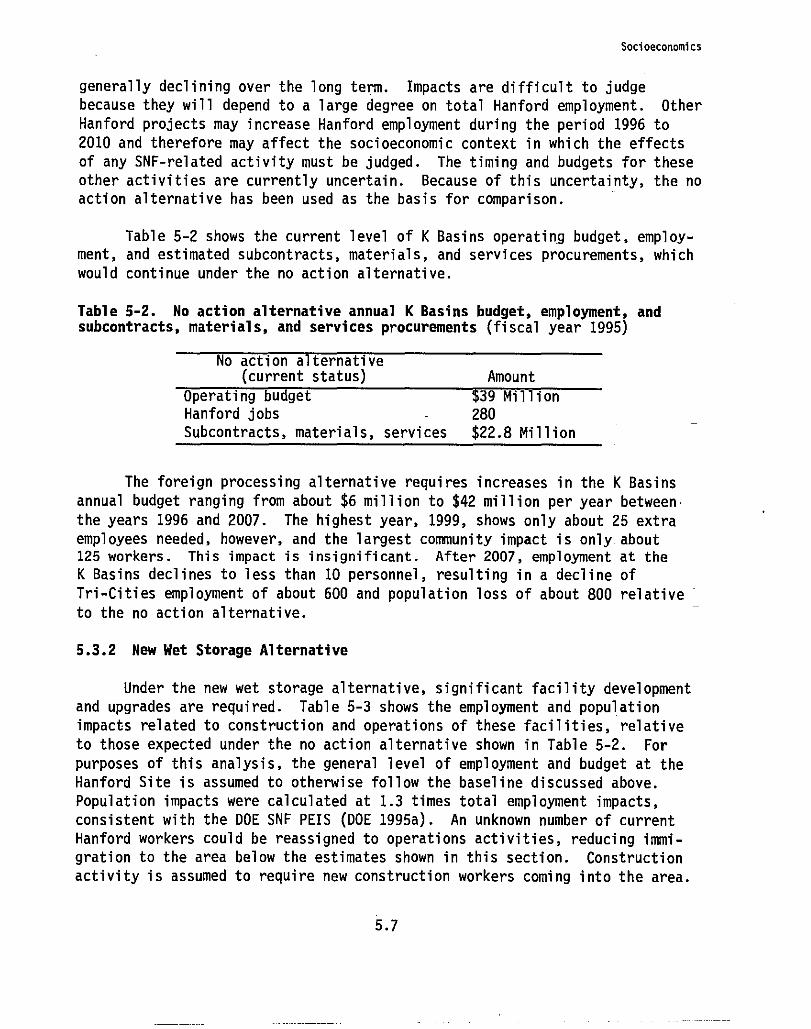
Socioeconomics
generally declining over the long term. Impacts are difficult to judge
because they will depend to a large degree on total Hanford employment. Other
Hanford projects may increase Hanford employment during the period 1996 to
2010 and therefore may affect the socioeconomic context in which the effects
of any SNF-related activity must be judged. The timing and budgets for these
other activities are currently uncertain. Because of this uncertainty, the no
action alternative has been used as the basis for comparison.
Table 5-2 shows the current level of K Basins operating budget, employ-
ment, and estimated subcontracts, materials, and services procurements, which
would continue under the no action alternative.
Table 5-2. No action alternative annual K Basins budget, employment, andsubcontracts, materials, and services procurements (fiscal year 1995)
No action alternative(current status) Amount
Operating budget 39 Million
Hanford jobs 280
Subcontracts, materials, services $22.8 Million
The foreign processing alternative requires increases in the K Basins
annual budget ranging from about $6 million to $42 million per year between,
the years 1996 and 2007. The highest year, 1999, shows only about 25 extra
employees needed, however, and the largest community impact is only about125 workers. This impact is insignificant. After 2007, employment at the
K Basins declines to less than 10 personnel, resulting in a decline of
Tri-Cities employment of about 600 and population loss of about 800 relative
to the no action alternative.
5.3.2 New Wet Storage Alternative
Under the new wet storage alternative, significant facility development
and upgrades are required. Table 5-3 shows the employment and population
impacts related to construction and operations of these facilities, relative
to those expected under the no action alternative shown in Table 5-2. For
purposes of this analysis, the general level of employment and budget at the
Hanford Site is assumed to otherwise follow the baseline discussed above.
Population impacts were calculated at 1.3 times total employment impacts,
consistent with the DOE SNF PEIS (DOE 1995a). An unknown number of current
Hanford workers could be reassigned to operations activities, reducing immi-
gration to the area below the estimates shown in this section. Construction
activity is assumed to require new construction workers coming into the area.
5.7
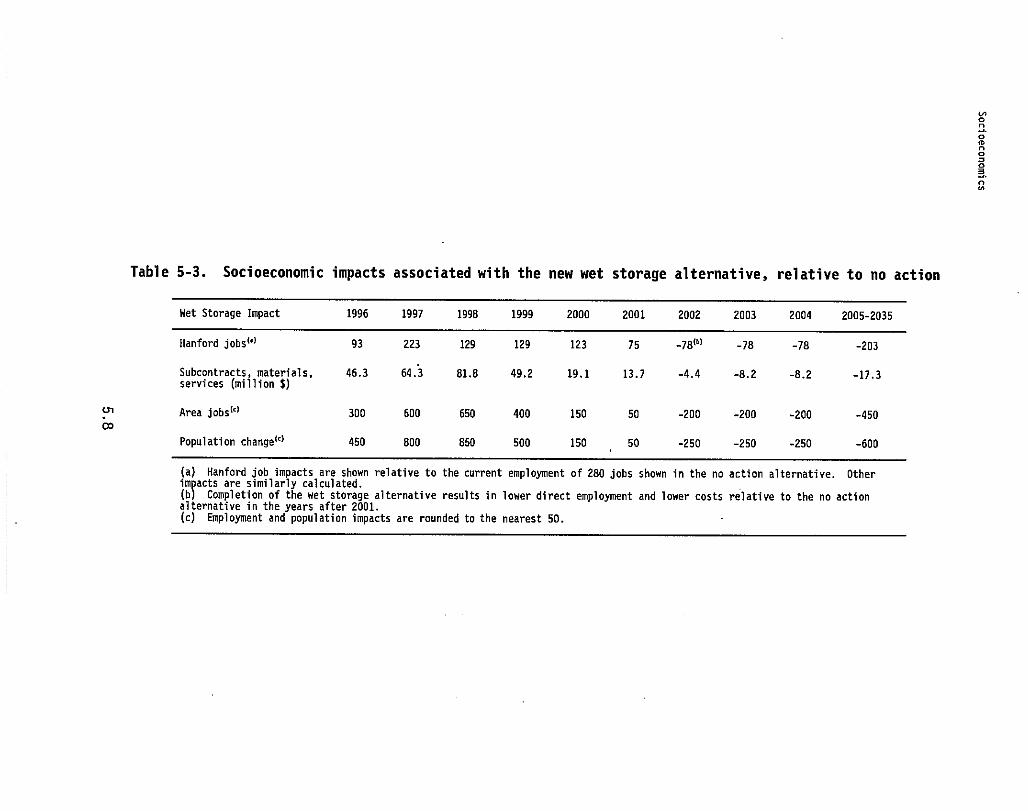
NOn0mn003nN
Table 5-3. Socioeconomic impacts associated with the new wet storage alternative, relative to no action
Wet Storage Impact 2005-20351996 1997 1998 1999 2000 2001 2002 2003 2004
Hanford jobs ( ') 93 223 129 129 123 75 -78(") -78 -78 -203
Subcontracts, materials, 46.3 64.3 81.8 49.2 19.1 13.7 -4.4 -8.2 -8.2 -17.3services (million $)
;rArea jabs(')300 600 650 400 150 50 -200 -200 -200 -45000
Population change (c)450 800 850 500 150 50 -250 -250 -250 -600
(a) Hanford job impacts are shown relative to the current employment of 280 jobs shown in the no action alternative. Otherimpacts are similarly calculated.(b) Completion of the wet storage alternative results in lower direct employment and lower costs relative to the no actionalternative in the years after 2001.(c) Employment and population impacts are rounded to the nearest 50.
Socioeconomics
Estimates of Hanford primary jobs and budget are provided in Bergsman et al.
(1995). For construction activity, Bergsman et al. (1995) report jobs in the
peak year, total person-years required, and schedule. For this section,
employment was assumed to ramp up to a peak, then ramp down for each major
facility built. This procedure results in the number of jobs by year, consis-
tent with the peak year and total person-years required. Increases in activ-
ity levels could strain the local community infrastructure housing market if
they were near capacity and a number of projects discussed for Hanford were
all built at the same time, even though the impact of the wet-storage alter-
native by itself would be insignificant. However, the current projected
baseline for Hanford shows a declining Hanford budget and employment, which
should mean that, other things equal, most community infrastructure will be
adequate to accommodate any new population associated with this alternative.
Local schools currently are crowded, but it is unclear whether this condition
will persist with declining Hanford employment.
All construction activity is assumed to peak in 1997 to 1998, with
employment of 223 and subcontracts, materials, and services procurements of
$82 million. Construction activity occurs between 1996 and 2001. The maximum
increase in area total employment is about 650, less than 1% over baseline
population projections. Population is expected to peak in 1998, with an
increase in population of about 850. This equates to an increase of less than
0.6% over the projected baseline population and implies that the effects on
demand for community infrastructure and services likely would be
insignificant.
5.3.3 Drying/Passivation, Calcination, and Onsite Processing Alternatives
Three alternatives (drying/passivation, calcination, and onsite process-
ing) result in storage of the K Basins SNF in a dry form that will require
less maintenance in the long run but significant facility development and
upgrades in the short run. The employment and population impacts related to
construction and operations of the facilities under each alternative are shown
in Table 5-4. As with wet storage, the impacts shown in the table are differ-
ences from current (no action) conditions. Employment impacts were analyzed
in the same manner as for the wet storage alternative. Increases in activity
levels likely would not have significant socioeconomic effects in themselves,
although they might be sufficient to strain community infrastructure and
housing if they were near capacity and if a number of other projects discussed
for Hanford were all built at the same time, and if Hanford budgets remained
at current levels. However, the projected baseline for the Tri-Cities area
currently shows a declining Hanford budget and employment, which should mean
that, other things equal, most community infrastructure will be adequate to
5.9
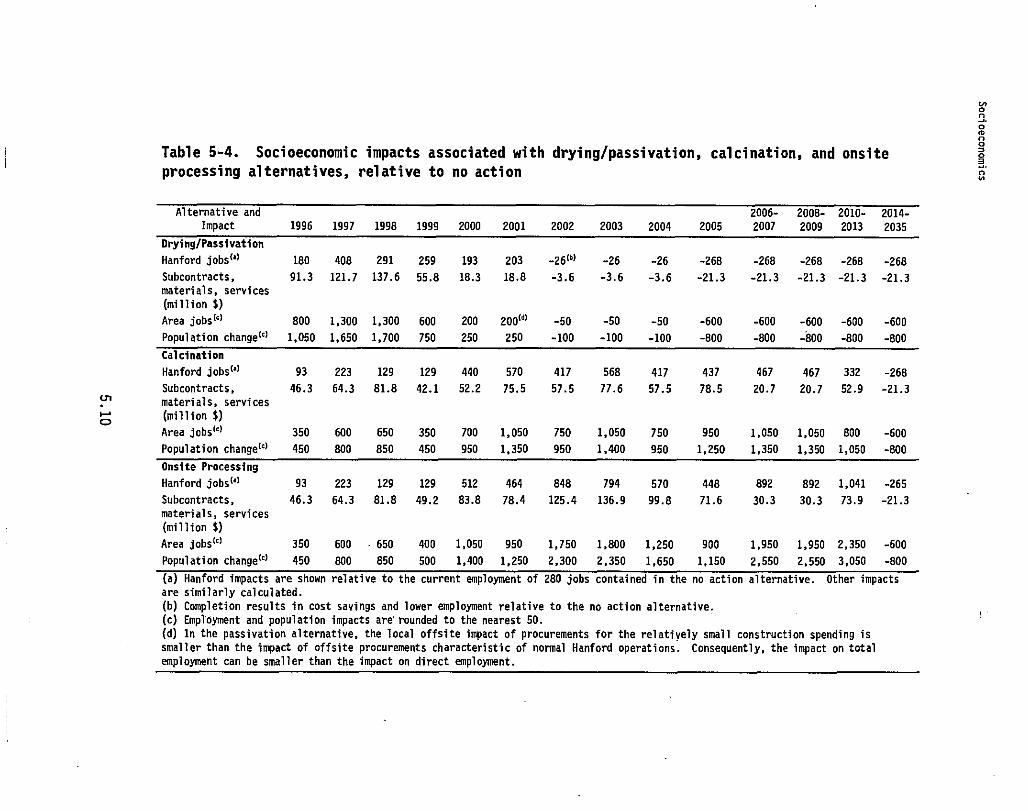
0n0mn
Table 5-4. Socioeconomic impacts associated with drying/passivation, calcination, and onsite 3processing alternatives, relative to no action N
Alternative and 2006- 2008- 2010- 2014-
Impact 1996 1997 1998 1999 2000 2001 2002 2003 2004 2005 2007 2009 2013 2035
Drying/Passivation
Hanford jobs (') 180 408 291 259 193 203 -26(") -26 -26 -268 -268 -268 -268 -268
Subcontracts, 91.3 121.7 137.6 55.8 18.3 18.8 -3.6 -3.6 -3.6 -21.3 -21.3 -21.3 -21.3 -21.3
materials, services
(million $)
Area jobs`) 800 1,300 1,300 600 200 200) -50 -50 -50 -600 -600 -600 -600 -600
Population change (' ) 1,050 1,650 1,700 750 250 250 -100 -100 -100 -800 -800 -800 -800 -800
Calcination
Hanford jobs (' ) 93 223 129 129 440 570 417 568 417 437 467 467 332 -268
Subcontracts, 46.3 64.3 81.8 42.1 52.2 75.5 57.5 77.6 57.5 78.5 20.7 20.7 52.9 -21.3
" materials, services
c(million $)
Area jobs') 350 600 650 350 700 1,050 750 1,050 750 950 1,050 1,050 800 -600
Population changeW 450 800 850 450 950 1,350 950 1,400 950 1,250 1,350 1,350 1,050 -800
Hanford jobs (')93 223 129 129 512 464 848 794 570 448 892 892 1,041 -265
Subcontracts, 46.3 64.3 81.8 49.2 83.8 78.4 125.4 136.9 99.8 71.6 30.3 30.3 73.9 -21.3
materials, services
(million $)
Area jobs' )350 600 650 400 1,050 950 1,750 1,800 1,250 900 1,950 1,950 2,350 -600
Population change (')450 800 850 500 1,400 1,250 2,300 2,350 1,650 1,150 2,550 2,550 3,050 -800
(a) Hanford impacts are shown relative to the current employment of 280 jobs contained in the no action alternative. Other impacts
are similarly calculated.
(b) Completion results in cost savings and lower employment relative to the no action alternative.
(c) Employment and population impacts are rounded to the nearest 50.
(d) In the passivation alternative, the local offsite impact of procurements for the relatively small construction spending is
smaller than the impact of offsite procurements characteristic of normal Hanford operations. Consequently, the impact on total
employment can he smaller than the impact on direct employment.
Cultural Resources
accommodate any new population associated with these alternatives. As noted
in Section 5.3.2, the exception may be schools, but this is currently unclear.
Construction activity achieves its peak impact at different times in the
three alternatives, with peak total area employment reaching about 1,300 jobs
in 1998 with drying/passivation, about 1,050 in 2003 with calcination, and
almost 1,800 in 2003 with onsite processing. However, in the case of onsite
processing, overall maximum primary employment actually occurs during the 2010
to 2013, when it assumed that $250 million is spent to deactivate the separa-
tions processing facility and $450 million is spent to decontaminate and
decommission it (Bergsman et al. 1995). The area employment impact is
2,350 jobs. Construction activity occurs between 1996 and 2000 with drying/
passivation, and between 1996 and 2005 for the other two alternatives. Peak
employment increases amount to less than a 3% increase over baseline
projections.
Corresponding population increases range from 1,750 to 3,050, an
increase of just over 1% to 1.6% above baseline projected population, which
implies that the incremental effects on demand for community infrastructure
and services likely would be insignificant.
5.4 Cultural Resources
The potential impacts on cultural resources of removing SNF from the
K Basins and storing and processing it were assessed by reviewing threefactors. These factors are 1) identifying project activities that could
directly or indirectly impact significant resources, 2) identifying the known
or expected significant resources in areas of potential impact, and 3) deter-
mining whether a project activity would have no effect, no adverse effect, or
an adverse effect on significant resources.
Two sites near the 200 East Area are candidates for storage and process-
ing facilities. The reference site, discussed in Section 5.4.4 of the DOE SNF
PEIS (DOE 1995a), is located just northwest of the 200 East Area. As part of
the DOE SNF'PEIS analysis, this site was intensively inventoried to locate
possible cultural resources (HCRC 94-600-017). No cultural resource sites
were recorded by this inventory. The CSB site, located in the west-central
portion of the 200 East Area, has also been previously inventoried for
cultural resources (Chatters and Cadoret 1990). Similar to the reference
site, no known archaeological or historical sites are located within the CSB
site.
5.11
Air Quality
Direct or indirect impacts are not anticipated to any known traditional
cultural properties that are significant to members of the Yakama Indian
Nation, the Confederated Tribes of the Umatilla Indian Reservation, or the
Wanapum people. This conclusion is based on comparing the proposed location
of facilities to known sacred or culturally important areas previously identi-
fied through ethnographic research and past interviews with elders of groups
that-formerly used the Hanford Site (Chatters 1989).
5.5 Aesthetic and Scenic Resources
Implementation of any of the alternatives would be highly unlikely to
adversely impact the present aesthetics of the area. All postulated construc-
tion of new facilities would be within or adjacent to already disturbed areas
dedicated to nuclear facilities and would not be located where they can be
seen by the general public. Up to 8.1 ha (20 acres) would be disturbed jn
construction of facilities associated with the onsite processing alternative.
5.6 Geologic Resources
No potential impacts to the geologic resources of the Hanford Site have
been identified under any of the alternatives.
5.7 Air Quality and Related Consequences
The consequences of the alternatives on ambient air quality at theHanford Site are presented in the following subsections. For radiological
emissions, the consequences are compared to current Hanford Site operations
and to regulatory standards. For nonradiological emissions, projected ambient
concentrations at key receptor locations are compared with current concentra-
tions at the Hanford Site and with state and federal air quality standards.
5.7.1 Radiological Consequences
The radiological consequences of airborne emissions during normal opera-
tion have been estimated for the K Basins SNF alternatives considered in this
document. The radiological doses were evaluated using the GENII computer code
package (Napier et al. 1988). Three separate analyses were performed for each
facility included in an alternative. The receptors evaluated in these cases
were 1) the collective offsite population within 80 km (50 mi), about
380,000 people; 2) the collective population of onsite workers, about
14,000 people; 3) the maximally exposed offsite resident; and 4) the location
of maximum exposure representing a potential onsite worker outside of the SNF
5.12
Air Quality
facility. Standard parameters for radiological dose calculations at the
Hanford Site were used for these estimates (Schreckhise et al. 1993).
The health consequences in terms of latent cancer fatalities were
calculated based on collective population dose using recommendations from the
International Commission on Radiological Protection (ICRP) in its Publica-
tion 60 (ICRP 1991). The estimated rate of latent cancer fatalities for the
general population was taken to be 5 x 10"4 per person-rem; and the corre-
sponding rate for workers was 4 x 10 -4 per person-rem. The higher rate for
the general public accounts for the presence of more sensitive members of the
population (for example, children) compared to the relatively homogeneous
population of healthy adult workers. Other long-term effects, including
nonfatal cancers and severe hereditary effects, generally occur at lower rates
(1 x 10"4 and 1.3 x 10
"4 per person-rem, respectively, for the general popu-
lation; 8 x 10⁻⁵ and 8 x 10⁻⁵ per person-rem respectively for adult workers).
None of the alternatives would result in a dose to the maximally exposed
offsite resident that exceeds 1% of the current U.S. Environmental Protection
Agency (EPA) standard of 10 mrem/year. The consequences of the no action
alternative result from emissions at existing facilities in the 100-K Area.
The facilities contribute a relatively small fraction of the total dose from
airborne emissions at current Hanford Site operations. The consequences of
the alternatives vary depending on which storage and fuel stabilization
options are considered. Alternatives including stabilization of K Basin SNF
result in the highest annual doses during the periods when the conditioning orprocessing facilities are operating; however, dry storage of the stabilized
fuel over the remainder of the period has the lowest consequences to workers
and the public.
No Action Alternative
Projected radionuclide emissions to the air for the K Basins in the no
action alternative are based on operation of the facilities during 1993
(Bergsman et al. 1995). The 1993 emissions were assumed to represent opera-
tions at existing SNF storage facilities over the EIS evaluation period and
are listed in Table 5-5. -
The dose consequences of air emissions from these facilities are summa-
rized in Table 5-6. The peak collective dose to the population within 80 km
(50 mi) is 0.0051 person-rem/year, which is predicted to result in less than
one (1 x 10 "4) fatal cancer over 40 years of storage.
5.13
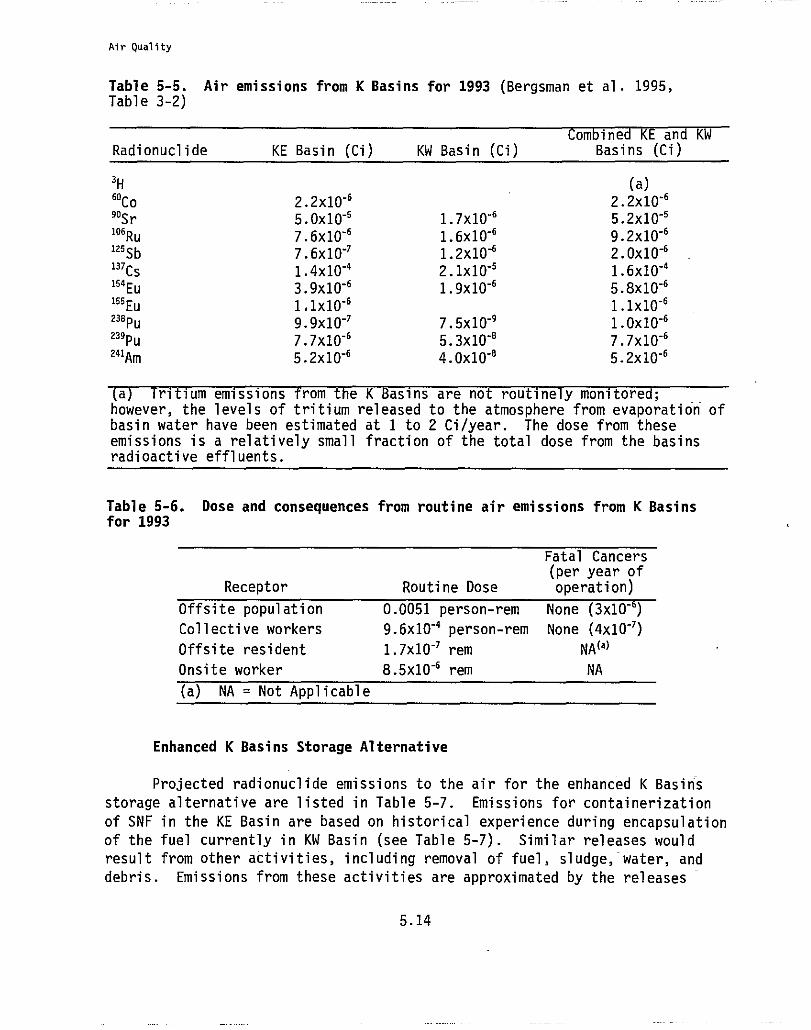
Air Quality
Table 5-5. Air emissions from K Basins for 1993 (Bergsman et al. 1995,Table 3-2)
Radionuclide KE Basin (Ci) KW Basin (Ci) Basins (Ci
3 H (a)6000 2.2x10 6 2.2x10 690S 5.Ox10-5 1.7x10'6 5.2x10.5106
Ru 7.6x10'6 1.6x10⁻⁶ 9.2x10-6125
Sb 7.6x10'' 1.2x10⁻⁶ 2.Ox10-6137 Cs 1.4x10⁻⁴ 2.1x10'5 1.6x10'"154 E 3.9x10'6 1.9x10⁻⁶ 5.8x10-6155Eu 1.1X10⁶ 1.1x10 6238p u 9.9x10⁻⁷ 7.5x10⁻⁹ 1.0x10-6239 Pu 7.7X10 6 5.3x10'6 7.7x10-6241Am 5.2x10⁻⁶ 4.0x10'0 5.2x10⁻⁶
(a) Tritium emissions Trom the K Basins are not routinely monitored;however, the levels of tritium released to the atmosphere from evaporation ofbasin water have been estimated at 1 to 2 Ci/year. The dose from theseemissions is a relatively small fraction of the total dose from the basinsradioactive effluents.
Table 5-6. Dose and consequences from routine air emissions from K Basinsfor 1993
Fatal Cancers(per year of
Receptor Routine Dose operation)
Offsite population 0.0051 person-rem None (3x10')Collective workers 9.6x10'4 person-rem None (4x10⁻⁷)
Offsite resident 1.7x10⁻⁷ rem NO)
Onsite worker 8.5x10'6 rem NA
(a) NA = Not Applicable
Enhanced K Basins Storage Alternative
Projected radionuclide emissions to the air for the enhanced K Basins
storage alternative are listed in Table 5-7. Emissions for containerizationof SNF in the KE Basin are based on historical experience during encapsulation
of the fuel currently in KW Basin (see Table 5-7). Similar releases would
result from other activities, including removal of fuel, sludge, water, and
debris. Emissions from these activities are approximated by the releases
5.14
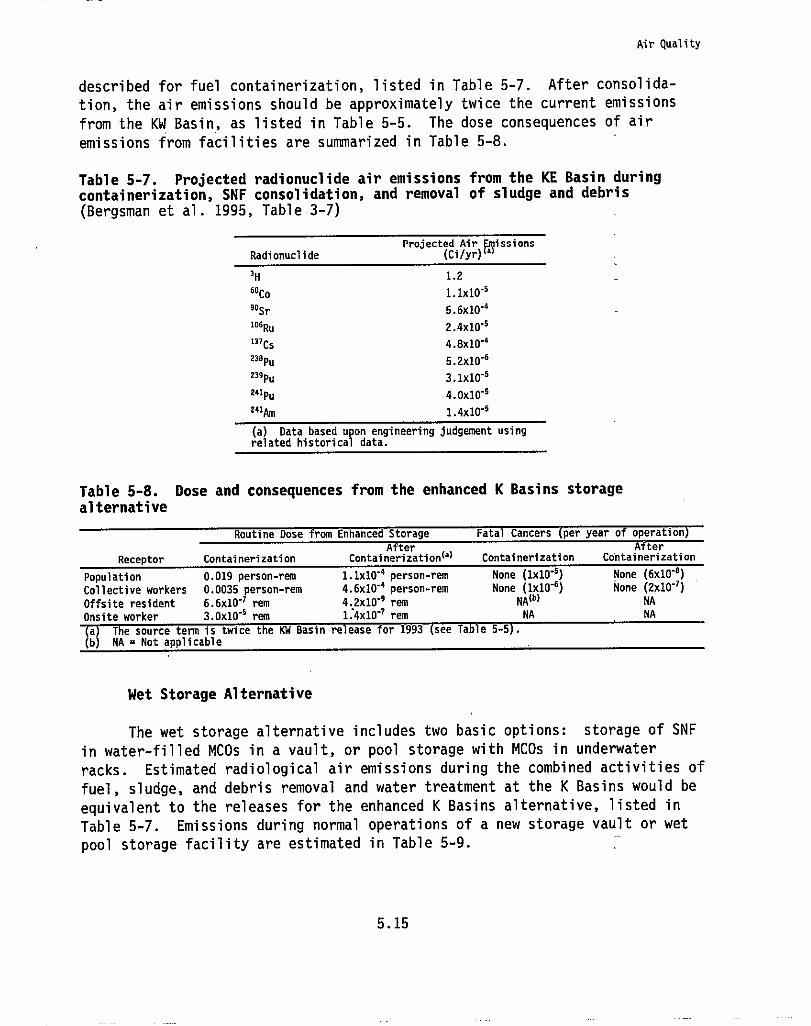
Air Quality
described for fuel containerization, listed in Table 5-7. After consolida-
tion, the air emissions should be approximately twice the current emissions
from the KW Basin, as listed in Table 5-5. The dose consequences of air
emissions from facilities are summarized in Table 5-8.
Table 5-7. Projected radionuclide air emissions from the KE Basin duringcontainerization, SNF consolidation, and removal of sludge and debris(Bergsman et al. 1995, Table 3-7)
Projected Air Fissions
Radionuclide (Ci/yr) '
3 H 1.2
60co 1.1x10"6
90Sr 5.6x10'4
106 R 2.4x10''
132Cs 4.8x10'4
23epu 5.2x10'6
299 Pu 3.1x10"'
241pu 4.0x10''
241Am 1.4x10"'
(a) Data based upon engineering ,judgement usingrelated historical data.
Table 5-8. Dose and consequences from the enhanced K Basins storagealternative
Receptor Containerization Containerizationl') Containerization Containerization
Population 0.019 person-rem 1.1x10'4 person-rem None (1x10'') None (6x10'6)
Collective workers 0.0035 person-rem 4.6x10'' person-rem None (1x10'6) None (2x10"')
Offsite resident 6.6x10' rem 4.2x10'9 remNA(b) NA
Onsite worker 3.0x10'' rem 1.410' rem NA NA
a )The source term is twice the KW Basin release or 1993 see Table 5-5).
(b) NA = Not applicable
Wet Storage Alternative
The wet storage alternative includes two basic options: storage of SNF
in water-filled MCOs in a vault, or pool storage with MCOs in underwater
racks. Estimated radiological air emissions during the combined activities of
fuel, sludge, and debris removal and water treatment at the K Basins would be
equivalent to the releases for the enhanced K Basins alternative, listed in
Table 5-7. Emissions during normal operations of a new storage vault or wet
pool storage facility are estimated in Table 5-9.
5.15
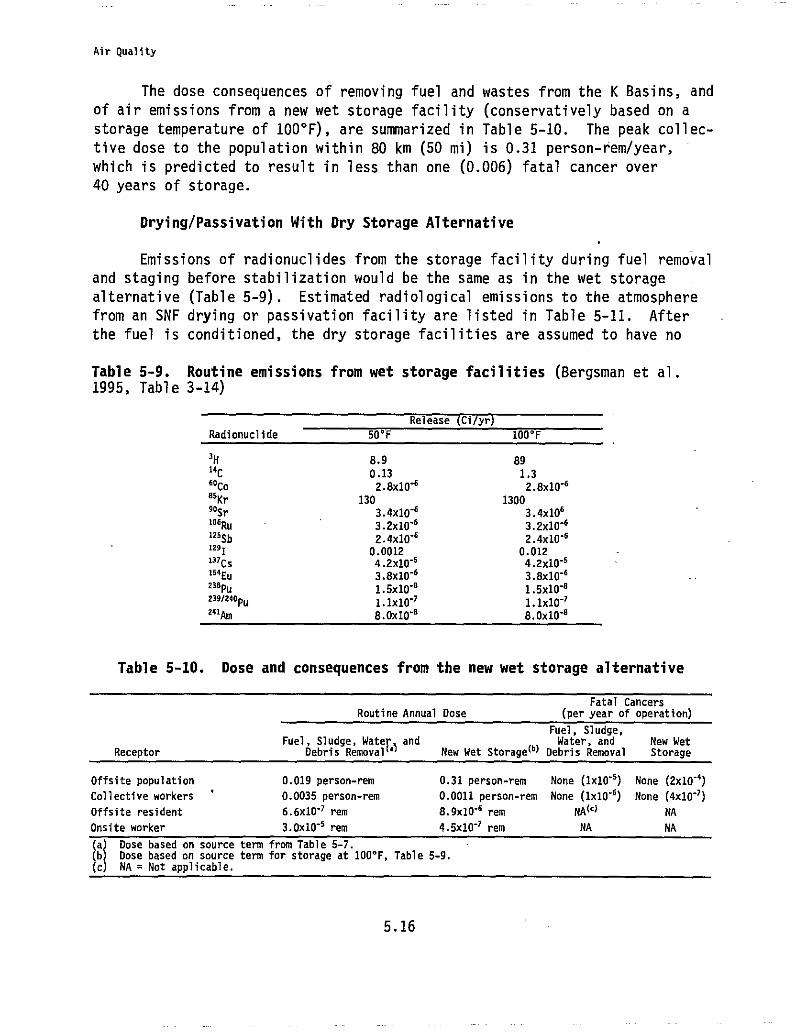
Air Quality
The dose consequences of removing fuel and
of air emissions from a new wet storage facility
storage temperature of 100 0 F), are summarized in
tive dose to the population within 80 km (50 mi)
which is predicted to result in less than one (0
40 years of storage.
wastes from the K Basins, and
(conservatively based on a
Table 5-10. The peak collec-
is 0.31 person-rem/year,
.006) fatal cancer over
Drying/Passivation With Dry Storage Alternative
Emissions of radionuclides from the storage facility during fuel removal
and staging before stabilization would be the same as in the wet storage
alternative (Table 5-9). Estimated radiological emissions to the atmosphere
from an SNF drying or passivation facility are listed in Table 5-11. After
the fuel is conditioned, the dry storage facilities are assumed to have no
Table 5-9. Routine emissions from wet storage facilities (Bergsman et al.1995, Table 3-14)
Release Ci yrRadionuclide 50 °F 100'F
3N 8.9 8914c 0.13 1.36000 2.8x10 6 2.8X10.685Kr 130 130090Sr 3.4x10'6 3.4106106 Ru 3.2x10'6 3.2x10'6125sb 2.4x10⁻⁶ 2.4X10'61291 0.0012 0.012 -132cs 4.2x10⁻⁶ 4.2x10"5154 Eu 3.8x10'6 3.840'6 - -238pu 1.5x10'0 1.5x10'0239/240pu 1.1x10⁻² 1.1x10'2241 Am 8.0x10'0 8.0X10'0
Table 5-10. Dose and consequences from the new wet storage alternative
Fatal CancersRoutine Annual Dose (per year of operation)
Fuel, Sludge,Fuel, Sludge and Water, and New Wet
Receptor Debris Removal ' New Wet Storage (' ) Debris Removal Storage
Offsite population 0.019 person-rem 0.31 person-rem None (140' 6) None (2x10"4)Collective workers 0.0035 person-rem 0.0011 person-rem None (140' 6) None (4x10⁻²)Offsite resident 6.640'2 rem 8.9x10'6 rem NO) NA
Onsite worker 3.0x10'5 rem 4.5x10'2 rem NA NA
WaDose based on source term from Table 5-7.
b Dose based on source term for storage at 100 9 F, Table 5-9.(c) NA = Not applicable.
5.16
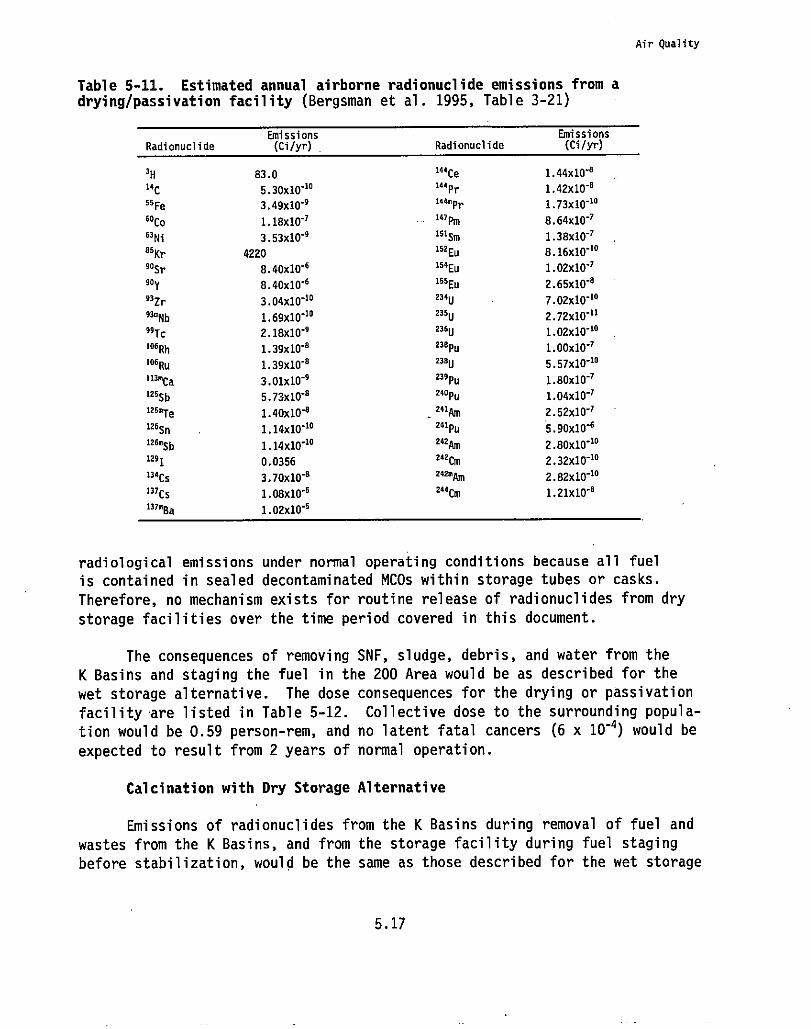
Air Quality
Table 5-11. Estimated annual airborne radionuclide emissions from adrying/passivation facility (Bergsman et al. 1995, Table 3-21)
Radionuclide
Emissions(Ci/yr) Radionuclide
Emissions(Ci/yr)
3R 83.0144Ce 1.44x10'6
14C 5.30x10'10 140 Pr 1.4240"8
55 Fe 3.49x10'9144mPr 1.73x10'16
60Co 1.18x10'2 147Pm 8.64x10⁻²
63 Ni 3.5340'9151sm 1.38x10'7
85Kr 4220 152Eu 8.16x10'10
90Sr 8.40x10"6 "Eu 1.02x10'7
90Y 8.40x10.6155 E 2.65x10"a
93 Zr 3.0440'10234u 7.0240"10
93% 1.69x10'102350 2.72x10"11
99Tc 2.18x10'9236U 1.0240 -10
106Rh 1.39x10"6238pu 1.00x10"7
106 R 1.39x10"a236U 5.5740'16
113-Ca 3.01x10-9239Pu 1.80x10'7
125Sb 5.7340'6240pu 1.04x10'2
t26mTe 1.4040'6 24IAm 2.52x10'2
126Sn 1.14x10'10241Pu 5.90x10'6
126MSb 1.14X10'10242Am 2.80x10-0
129I 0.0356 242cm 2.32x10'10
134cs 3.70x10"a242mAm 2.82x10'16
137Cs 1.08x10'6244cm 1.2140
137mBa1.02X10'9
radiological emissions under normal operating conditions because all fuel
is contained in sealed decontaminated MCOs within storage tubes or casks.
Therefore, no mechanism exists for routine release of radionuclides from dry
storage facilities over the time period covered in this document.
The consequences of removing SNF, sludge, debris, and water from the
K Basins and staging the fuel in the 200 Area would be as described for the
wet storage alternative. The dose consequences for the drying or passivation
facility are listed in Table 5-12. Collective dose to the surrounding popula-
tion would be 0.59 person-rem, and no latent fatal cancers (6 x 10 "4) would be
expected to result from 2 years of normal operation.
Calcination with Dry Storage Alternative
Emissions of radionuclides from the K Basins during removal of fuel and
wastes from the K Basins, and from the storage facility during fuel staging
before stabilization, would be the same as those described for the wet storage
5.17
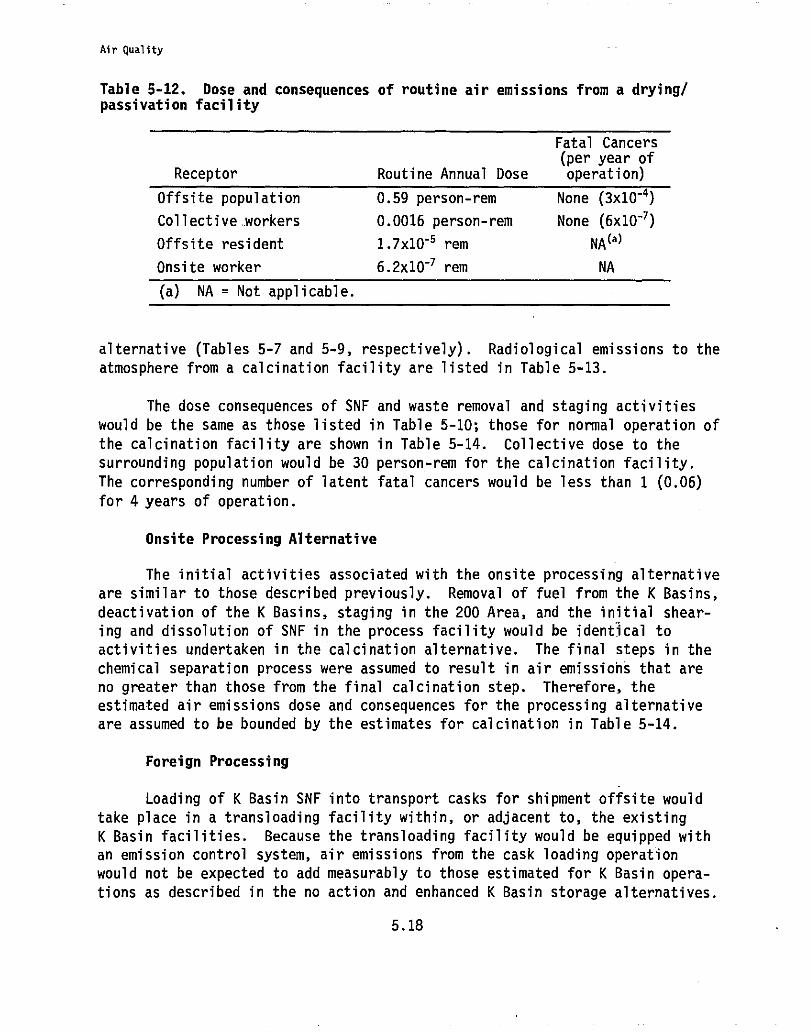
Air Quality
Table 5-12. Dose and consequences of routine air emissions from a drying/passivation facility
Fatal Cancers(per year of
Receptor Routine Annual Dose operation)
Offsite population 0.59 person-rem None (3x10 "4)
Collective..workers 0.0016 person-rem None (6x10')
Offsite resident 1.7x10 "5 rem NA (a)
Onsite worker 6.2x10'7 rem NA
(a) NA = Not applicable.
alternative (Tables 5-7 and 5-9, respectively). Radiological emissions to the
atmosphere from a calcination facility are listed in Table 5-13.
The dose consequences of SNF and waste removal and staging activities
would be the same as those listed in Table 5-10; those for normal operation of
the calcination facility are shown in Table 5-14. Collective dose to the
surrounding population would be 30 person-rem for the calcination facility.
The corresponding number of latent fatal cancers would be less than 1 (0.06)
for 4 years of operation.
Onsite Processing Alternative
The initial activities associated with the onsite processing alternative
are similar to those described previously. Removal of fuel from the K Basins,
deactivation of the K Basins, staging in the 200 Area, and the initial shear-
ing and dissolution of SNF in the process facility would be identical to
activities undertaken in the calcination alternative. The final steps in the
chemical separation process were assumed to result in air emissions that are
no greater than those from the final calcination step. Therefore, the
estimated air emissions dose and consequences for the processing alternative
are assumed to be bounded by the estimates for calcination in Table 5-14.
Foreign Processing
Loading of K Basin SNF into transport casks for shipment offsite would
take place in a transloading facility within, or adjacent to, the existing
K Basin facilities. Because the transloading facility would be equipped with
an emission control system, air emissions from the cask loading operation
would not be expected to add measurably to those estimated for K Basin opera-
tions as described in the no action and enhanced K Basin storage alternatives.
5.18
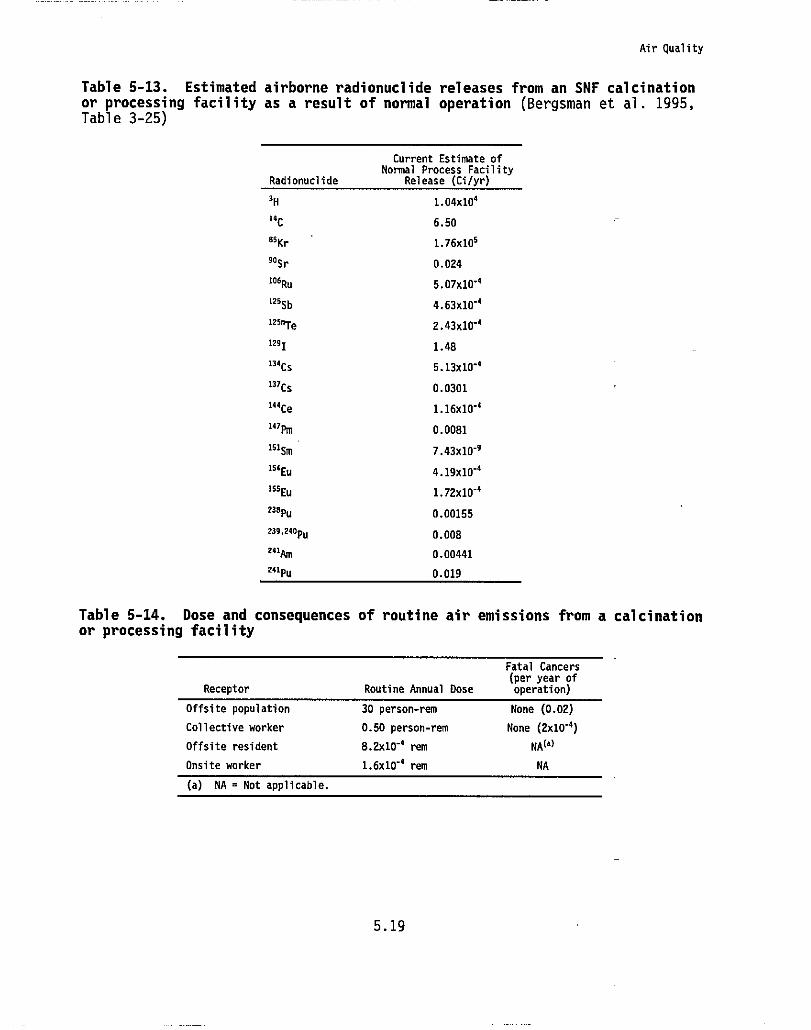
Air Quality
Table 5-13. Estimated airborne radionuclide releases from an SNF calcinationor processing facility as a result of normal operation (Bergsman et al. 1995,Table 3-25)
Current Estimate ofNormal Process Facility
Radionuclide Release (Ci/yr)
3H 1.04x10°
14c6.50
8sKr 1.76x10'
90Sr 0.024
106Ru 5.07x10.4
12556 4.63x10"'
12s0Te 2.43x10',
129I 1.48
134Cs 5.13x10'1
137Cs 0.0301
144Ce 1.16x10'4
147Pm 0.0081
151 $m 7.43x10"9
154 E4.19x10"4
1s5Eu 1.72x10"'
238pu0.00155
239.240pu 0.008
241A.0.00441
241 Pu 0.019
Table 5-14. Dose and consequences of routine air emissions from a calcinationor processing facility
Fatal Cancers(per year of
Receptor Routine Annual Dose operation)
Offsite population 30 person-rem None (0.02)
Collective worker 0.50 person-rem None (2x10'+)
Offsite resident 8.2x10'' rem NO)
Onsite worker 1.6x10"4 rem NA
(a) NA = Not applicable.
619M
Air Quality
During most of the transloading operations, emissions, dose, and consequences
would continue as described under no action (Tables 5-5 and 5-6). Short-termincreases during active removal of SNF, sludge, and debris would be expected,
similar to those estimated for the enhanced K Basin storage alternative(Tables 5-7 and 5-8). No additional radionuclide emissions would be expectedafter the SNF is packaged for transport and the K Basins are deactivated.
5.7.2 Nonradiological Consequences
The impact of emissions of nonradiological air pollutants from the
alternatives is examined in the following subsections. The focus is on
emission of nitrogen oxides (NOX) modeled as nitrogen dioxide (NO2), oxides of
sulfur modeled as sulfur dioxide (SO.), and particulate matter with a
10-micron-or-less aerodynamic diameter (PM,,). Increases above ambient levels
in the airborne concentration of these pollutants can result from construction
activities and operation of the facilities as described for each alternative
in Chapter 3.0. No significant nonradiological air quality impacts would
occur from the fuel retrieval or cleanup of the sludge, debris, and water inthe K Basins. As a result of the nature and small inventory or based on
process knowledge, there would be no significant routine releases of nonradio-
logical hazardous air pollutants (Bergsman et al. 1995); nonradiologicalhazardous air pollutants could be released during an accident (see Sec-
tion 5.15.7). For criteria pollutants, concentration levels are regulated bythe provisions of the Clean Air Act; Washington State standards for these
criteria pollutants are at least as stringent as the federal standards.
Two Industrial Source Complex (ISC2) models were selected to estimateroutine nonradiological air quality impacts for NO Z , SOP and PM,,. The ISC2models are the ISC2 short-term model (ISCST2) and the ISC2 long-term model(ISCLT2) (EPA 1992). The ISC2 models have been approved by the EPA forspecific regulatory applications and are designed for use on personal
computers.
The maximum ground-level pollutant concentrations for time periods
defined by the regulations are reported at the maximally impacted receptor
location. To determine short-term impacts (i.e., exposure periods of 1- to24-hours), the pollutant concentrations are assessed at the nearest point ofunrestricted public access (e.g., receptors located along State Route 240, theColumbia River, and the Site boundary). For long-term impacts (i.e., annual
exposures), pollutant concentrations are assessed along and outside of the
Hanford Site boundary. Onsite points of public access are not considered
because of the severely limited time any member of the public would spend at
an onsite location over the course of a year.
5.20
Air Quality
Because the details of the construction process are not available for
the alternatives, various assumptions are made. Most of these assumptions are
conservative and would tend to produce significantly greater impacts than
would be expected for an alternative were it selected for implementation.
No Action Alternative
The no action alternative involves no significant new construction, and,
during operation, the K Basins do not have any significant routine releases of
nonradiological pollutants.
Enhanced K Basins Storage Alternative
The enhanced storage alternative involves no major new construction,
and, during operation, the K Basins do not have any significant routine
releases of nonradiological pollutants.
New Wet Storage Alternative
Emissions from construction activities would contribute to the nonradio-
logical consequences in the wet storage alternative. However, during opera-
tion, neither the wet storage nor the existing K Basins would have any
significant releases of nonradiological pollutants.
Four different construction possibilities exist under the wet storagealternative: 1) construction of a vault facility at the CSB site, 2) con- -
struction of a vault facility at the reference site, 3) construction of a
storage pool at the CSB site, and 4) construction of a storage pool at the
reference site. Construction activities in each of the possibilities would
emit NO., S02 , and PM,,. As a byproduct of construction activities, PM lo would
be emitted in the form of fugitive dust from a total of 2.8 ha (6.9 acres).
Table 5-15 provides an estimate of the PM la emission rates from fugitive dust.
Emission rates from diesel- and gasoline-powered construction equipment for
all four possibilities are presented in Table 5-16. Table 5-17 presents the
resulting ai' quality impacts if the vault facility were constructed at the
reference site, which would produce the largest nonradiological air quality
impacts.
During the construction phase, the maximum offsite increases in ambient
NO21 SO,, and PMIa from both fugitive dust and construction equipment emission
would be below the state and federal regulatory limits. The offsite increases
would be temporary and would not adversely affect the regional air quality on
a continuing basis.
5.21
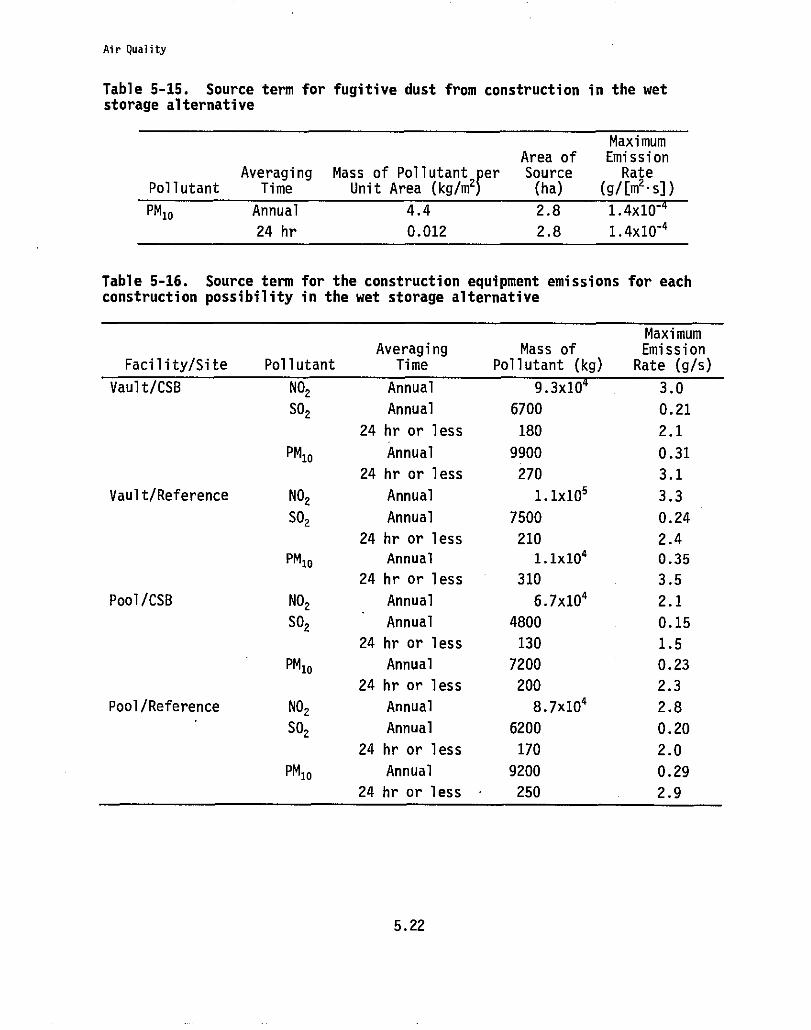
Air Quality
Table 5-15. Source term for fugitive dust from construction in the wetstorage alternative
MaximumArea of Emission
Averaging Mass of Pollutanter Source RatePollutant Time Unit Area (kg/m21 (ha) (g/ Em, - S])
PM10Annual 4.4 2.8 1.4x10-
24 hr 0.012 2.8 1.4x10"4
Table 5-16. Source term for the construction equipment emissions for eachconstruction possibility in the wet storage alternative
MaximumAveraging Mass of Emission
Facility/Site Pollutant Time Pollutant (kg) Rate (g/s)
Vault/CSB NO2 Annual 1043.0
S02 Annual 6700 0.21
24 hr or less 180 2.1
PM10 Annual 9900 0.31
24 hr or less 270 3.1
Vault/Reference NO2 Annual 1.1x10, 3.3
S02 Annual 7500 0.24
24 hr or less 210 2.4
PM10 Annual 1.1x10⁴ 0.35
24 hr or less 310 3.5
Pool/CSB NO2 Annual 6.7x10⁴ 2.1
S02 Annual 4800 0.15
24 hr or less 130 1.5
PM10 Annual 7200 0.23
24 hr or less 200 2.3
Pool/Reference NO2 Annual 8.7x10⁴ 2.8
S02 Annual 6200 0.20
24 hr or less 170 2.0
PM10 Annual 9200 0.29
24 hr or less - 250 2.9
5.22
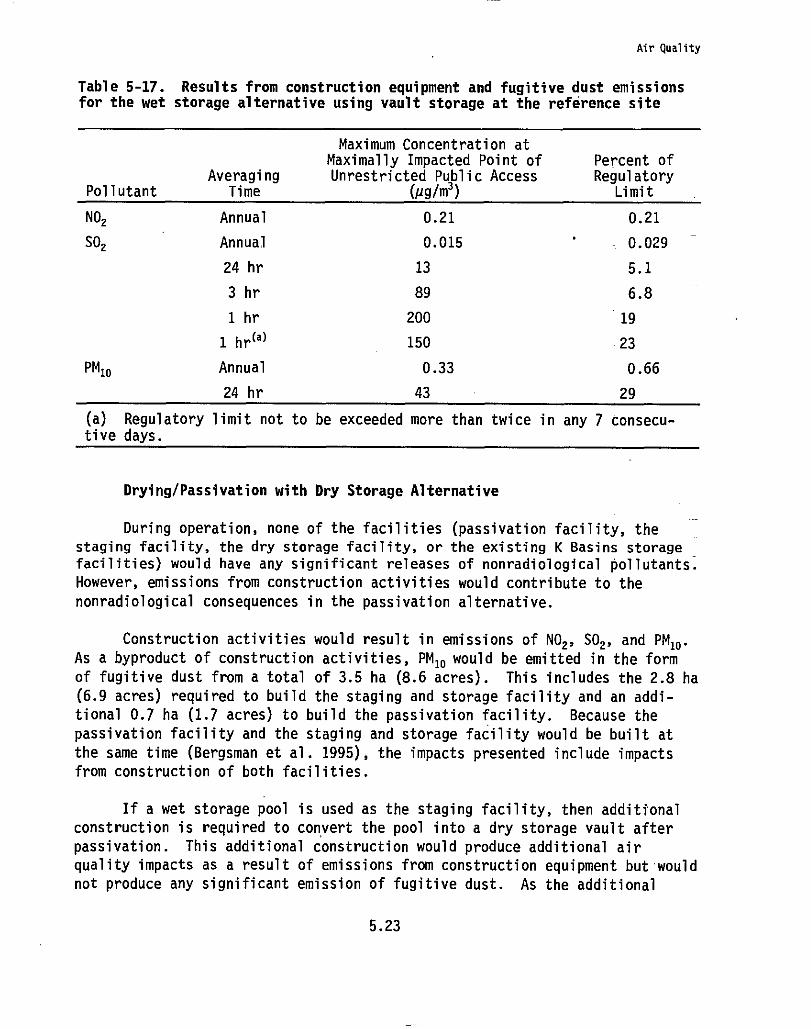
Air Quality
Table 5-17. Results from construction equipment and fugitive dust emissionsfor the wet storage alternative using vault storage at the reference site
PollutantAveraging
Time
Maximum Concentration atMaximally Impacted Point ofUnrestricted Public Access
(µg/m3)
Percent ofRegulatory
Limit
NO2 Annual 0.21 0.21
S02 Annual 0.015 0.029
24 hr 13 5.1
3 hr 89 6.8
1 hr 200 19
1 hr (a) 150 23
PMIO Annual 0.33 0.66
24 hr 43 29
(a) Regulatory limit not to be exceeded more than twice in any 7 consecu-tive days.
Drying/Passivation with Dry Storage Alternative
During operation, none of the facilities (passivation facility, the
staging facility, the dry storage facility, or the existing K Basins storagefacilities) would have any significant releases of nonradiological pollutants.
However, emissions from construction activities would contribute to the
nonradiological consequences in the passivation alternative.
Construction activities would result in emissions of NO 2 , SO2 , and PM10.
As a byproduct of construction activities, PM10 would be emitted in the form
of fugitive dust from a total of 3.5 ha (8.6 acres). This includes the 2.8 ha
(6.9 acres) required to build the staging and storage facility and an addi-
tional 0.7 ha (1.7 acres) to build the passivation facility. Because the
passivation facility and the staging and storage facility would be built at
the same time (Bergsman et al. 1995), the impacts presented include impacts
from construction of both facilities.
If a wet storage pool is used as the staging facility, then additional
construction is required to convert the pool into a dry storage vault after
passivation. This additional construction would produce additional air
quality impacts as a result of emissions from construction equipment but would
not produce any significant emission of fugitive dust. As the additional
5.23
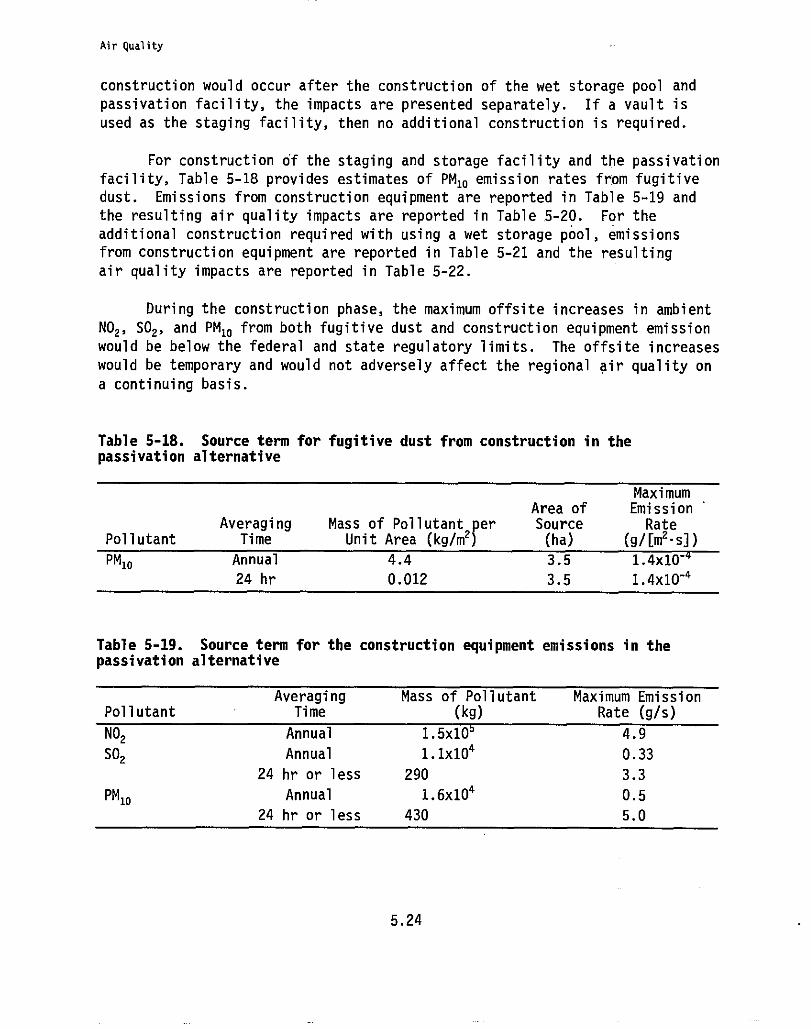
Air quality
construction would occur after the construction of the wet storage pool and
passivation facility, the impacts are presented separately. If a vault is
used as the staging facility, then no additional construction is required.
For construction of the staging and storage facility and the passivation
facility, Table 5-18 provides estimates of PM1O emission rates from fugitive
dust. Emissions from construction equipment are reported in Table 5-19 and
the resulting air quality impacts are reported in Table 5-20. For the
additional construction required with using a wet storage pool, emissions
from construction equipment are reported in Table 5-21 and the resulting
air quality impacts are reported in Table 5-22.
During the construction phase, the maximum offsite increases in ambient
NOZ , SO2 , and PM IO from both fugitive dust and construction equipment emission
would be below the federal and state regulatory limits. The offsite increases
would be temporary and would not adversely affect the regional air quality on
a continuing basis.
Table 5-18. Source term for fugitive dust from construction in thepassivation alternative
MaximumArea of Emission
Averaging Mass of Pollutant per Source RatePollutant Time Unit Area (kg/m (ha) (g/[m'-s])
PM10Annual 4.4 3.5 1.4x10"
24 hr 0.012 3.5 1.4x10⁻⁴
Table 5-19. Source term for the construction equipment emissions in thepassivation alternative
Averaging Mass of Pollutant Maximum EmissionPollutant Time (kg) Rate (g/s)
NO2 Annual 1.5x10 4.9
S02 Annual 1.1x10⁴ 0.33
24 hr or less 290 3.3
PMIO Annual 1.6x10⁴ 0.5
24 hr or less 430 5.0
FWD
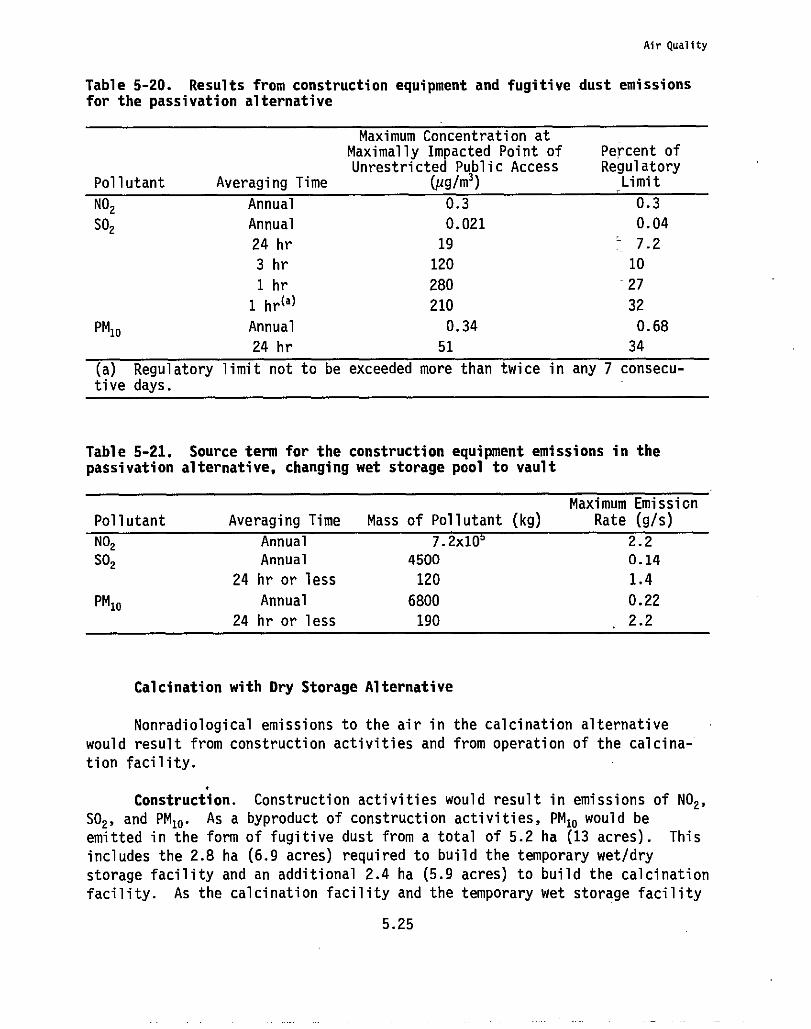
Air Quality
Table 5-20. Results from construction equipment and fugitive dust emissionsfor the passivation alternative
Maximum Concentration atMaximally Impacted Point of Percent ofUnrestricted Public Access Regulatory
Pollutant Averaging Time (µg/m3) Limit
NO2 Annual 0.3 0.3
S02 Annual 0.021 0.04
24 hr 19 7.2
3 hr 120 10
1 hr 280 -27
1 hr(a) 210 32
PM10 Annual 0.34 0.68
24 hr 51 34
(a) Regulatory limit not to be exceeded more than twice in any 7 consecu-tive days.
Table 5-21. Source term for the construction equipment emissions in thepassivation alternative, changing wet storage pool to vault
Maximum EmissionPollutant Averaging Time Mass of Pollutant (kg) Rate (g/s)
NO2 Annual 7.2x10 2.2
S02 Annual 4500 0.14
24 hr or less 120 1.4
PM10 Annual 6800 0.22
24 hr or less 190 2.2
Calcination with Dry Storage Alternative
Nonradiological emissions to the air in the calcination alternative
would result from construction activities and from operation of the calcina-
tion facility.
Construction. Construction activities would result in emissions of NO2,
S02 , and PM10 . As a byproduct of construction activities, PM 10 would be
emitted in the form of fugitive dust from a total of 5.2 ha (13 acres). This
includes the 2.8 ha (6.9 acres) required to build the temporary wet/dry
storage facility and an additional 2.4 ha (5.9 acres) to build the calcination
facility. As the calcination facility and the temporary wet storage facility
5.25
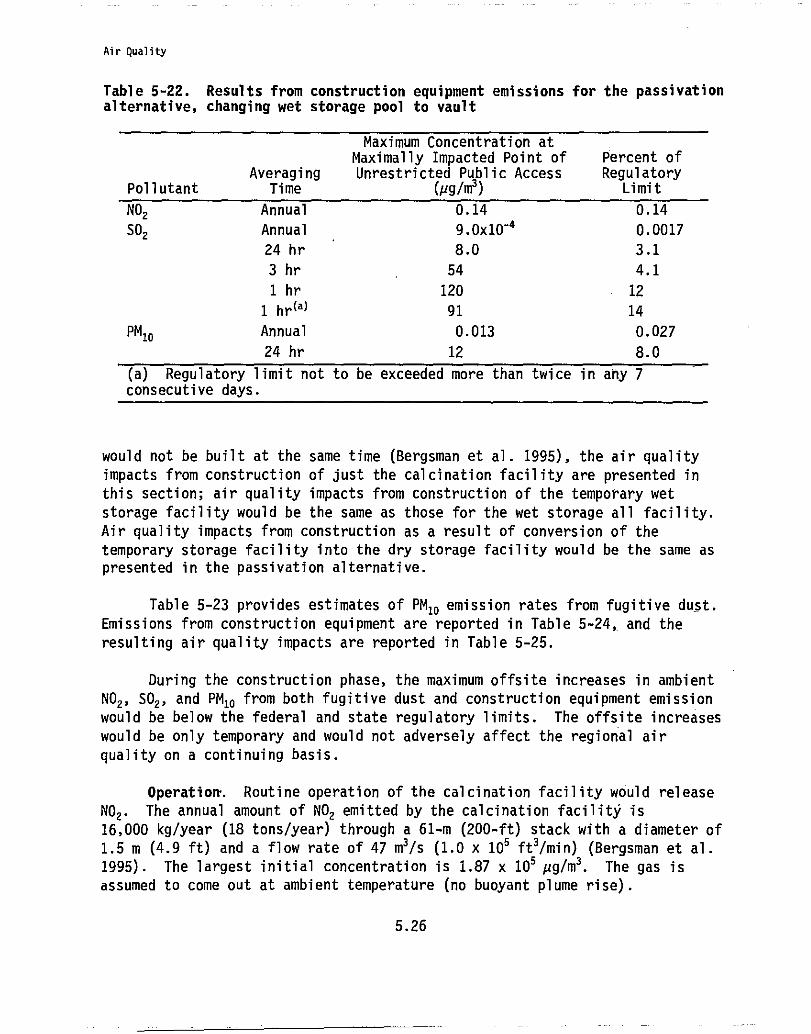
Air Quality
Table 5-22. Results from construction equipment emissions for the passivationalternative, changing wet storage pool to vault
Maximum Concentration atMaximally Impacted Point of Percent of
Averaging Unrestricted Public Access RegulatoryPollutant Time ({tg/m3) Limit
NO2 Annual 0.14 0.14
S02 Annual 9.0x10"4
0.0017
24 hr 8.0 3.1
3 hr 54 4.1
1 hr 120 12
1 hr (a) 91 14
PM10 Annual 0.013 0.027
24 hr 12 8.0
(a) Regulatory limit not to be exceeded more than twice in any 7consecutive days.
would not be built at the same time (Bergsman et al. 1995), the air quality
impacts from construction of just the calcination facility are presented in
this section; air quality impacts from construction of the temporary wet
storage facility would be the same as those for the wet storage all facility.
Air quality impacts from construction as a result of conversion of the
temporary storage facility into the dry storage facility would be the same aspresented in the passivation alternative.
Table 5-23 provides estimates of PM IO emission rates from fugitive dust.
Emissions from construction equipment are reported in Table 5-24, and the
resulting air quality impacts are reported in Table 5-25.
During the construction phase, the maximum offsite increases in ambient
NO2 , SO2 , and PM10 from both fugitive dust and construction equipment emission
would be below the federal and state regulatory limits. The offsite increases
would be only temporary and would not adversely affect the regional air
quality on a continuing basis.
Operation. Routine operation of the calcination facility would release
NO2 . The annual amount of NO 2 emitted by the calcination facility is
16,000 kg/year (18 tons/year) through a 61-m (200-ft) stack with a diameter of
1.5 m (4.9 ft) and a flow rate of 47 m3/s (1.0 x 10 5 ft'/min) (Bergsman et al.
1995). The largest initial concentration is 1.87 x 10 5 µg/m3 . The gas is
assumed to come out at ambient temperature (no buoyant plume rise).
5.26
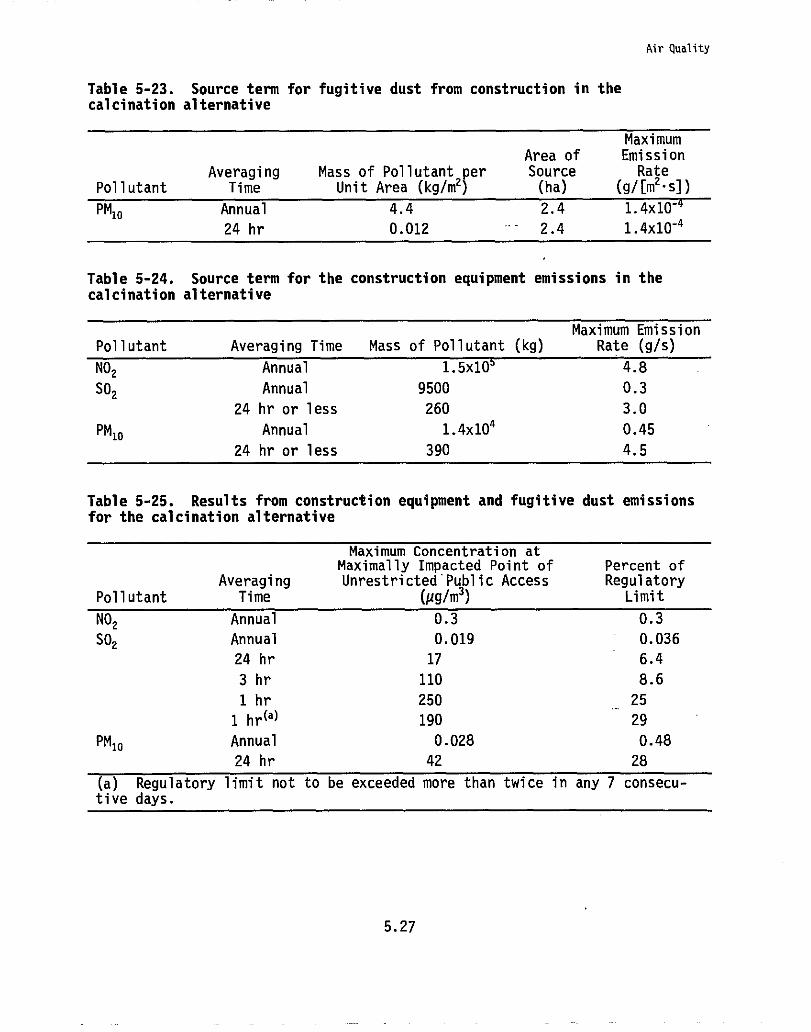
Air Quality
Table 5-23. Source term for fugitive dust from construction in thecalcination alternative
maximumArea of Emission
Averaging Mass of Pollutant er Source RatePollutant Time Unit Area (kg/m2^ (ha) (g/[m2•sD
PMIOAnnual 4.4 2.4 1.4x10"
24 hr 0.012 2.4 1.4x10⁻⁴
Table 5-24. Source term for the construction equipment emissions in thecalcination alternative
Maximum EmissionPollutant Averaging Time Mass of Pollutant (kg) Rate (g/s)
NO2 Annual 1.5x10 4.8
S02 Annual 9500 0.3
24 hr or less 260 3.0
PMI0 Annual 1.4x10⁴ 0.45
24 hr or less 390 4.5
Table 5-25. Results from construction equipment and fugitive dust emissionsfor the calcination alternative
Maximum Concentration atMaximally Impacted Point of Percent of
Averaging Unrestricted'Public Access RegulatoryPollutant Time (µg/m3) Limit
NO2 Annual 0.3 0.3
S02 Annual 0.019 0.036
24 hr 17 6.4
3 hr 110 8.6
1 hr 250 25
1 hr (a) 190 29
PMIO Annual 0.028 0.48
24 hr 42 28
(a) Regulatory limit not to be exceeded more than twice in any 7 consecu-tive days.
5.27
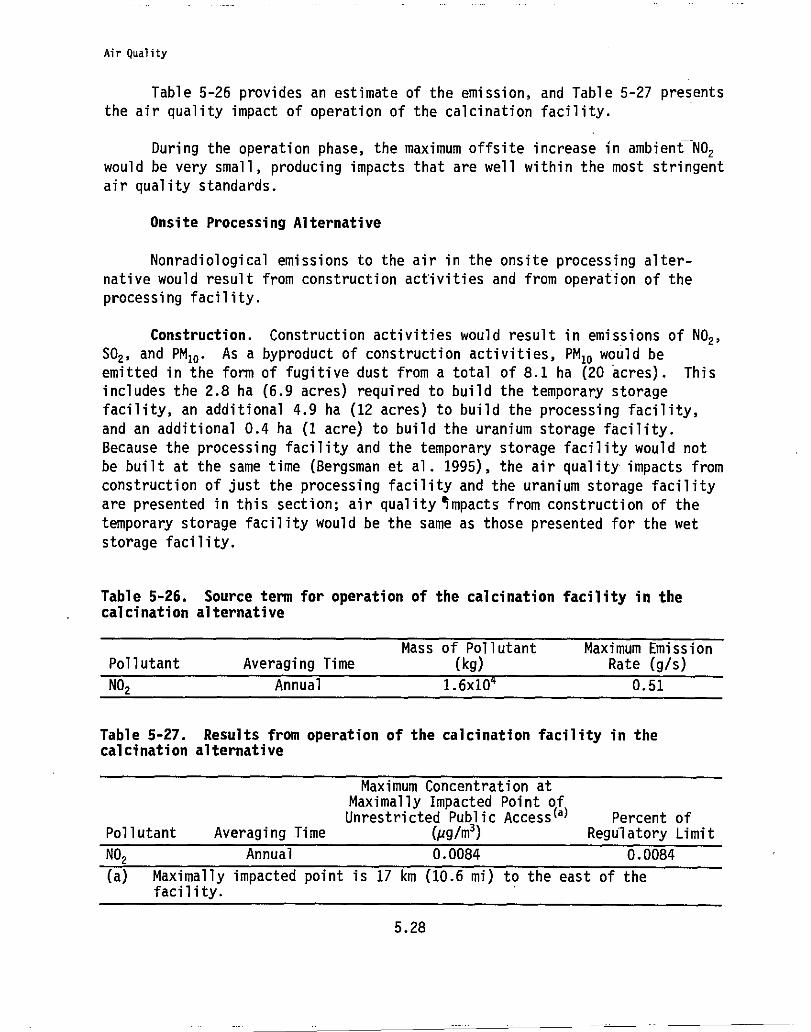
Air Quality
Table 5-26 provides an estimate of the emission, and Table 5-27 presents
the air quality impact of operation of the calcination facility.
During the operation phase, the maximum offsite increase in ambient NO2
would be very small, producing impacts that are well within the most stringent
air quality standards.
Onsite Processing Alternative
Nonradiological emissions to the air in the onsite processing alter-
native would result from construction activities and from operation of the
processing facility.
Construction. Construction activities would result in emissions of NO2,
SO,, and PM lo. As a byproduct of construction activities, PMIO would be
emitted in the form of fugitive dust from a total of 8.1 ha (20 acres). This
includes the 2.8 ha (6.9 acres) required to build the temporary storage
facility, an additional 4.9 ha (12 acres) to build the processing facility,
and an additional 0.4 ha (1 acre) to build the uranium storage facility.
Because the processing facility and the temporary storage facility would not
be built at the same time (Bergsman et al. 1995), the air quality impacts from
construction of just the processing facility and the uranium storage facility
are presented in this section; air quality Smpacts from construction of the
temporary storage facility would be the same as those presented for the wet
storage facility.
Table 5-26. Source term for operation of the calcination facility in thecalcination alternative
Mass of Pollutant Maximum EmissionPollutant Averaging Time (kg) Rate (g/s)
NO2Annual 1.6x10 0.51
Table 5-27. Results from operation of the calcination facility in thecalcination alternative
Maximum Concentration atMaximally Impacted Point ofUnrestricted Public Access (')Percent of
Pollutant Averaging Time (pg/m3) Regulatory Limit
NO2Annual 0.0084 0.0084
(a) Maximally impacted point is 17 km (10.6 mi) to the east of thefacility.
5.28
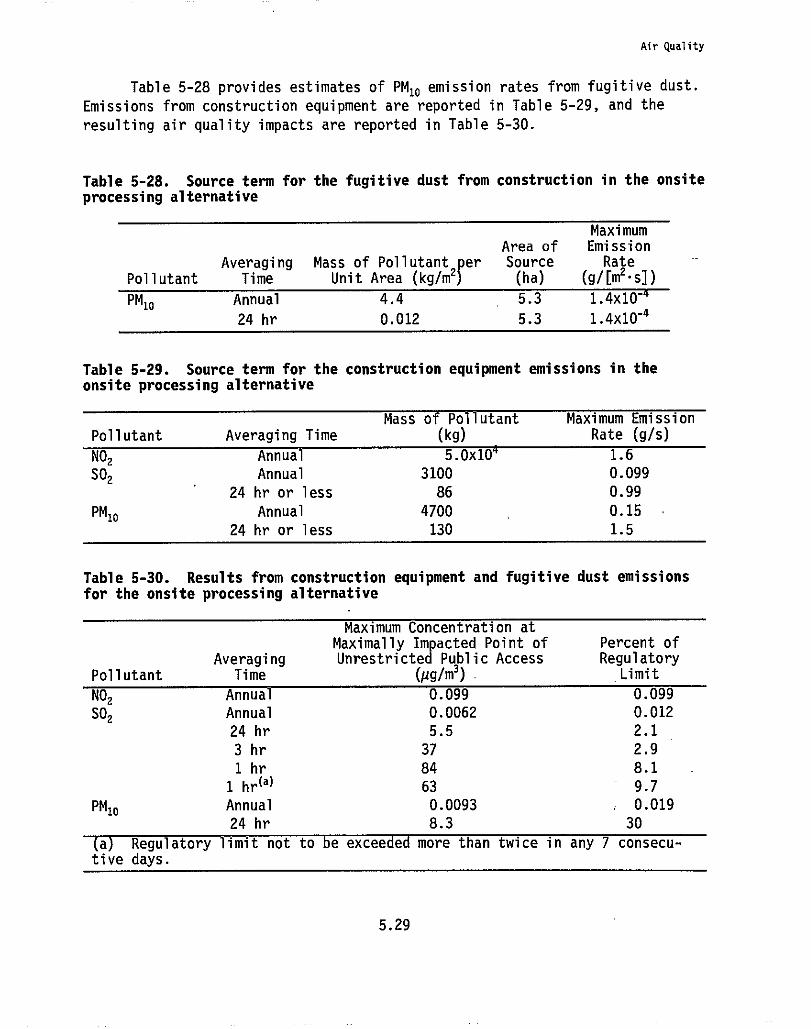
Air Quality
Table 5-28 provides estimates of PM IO emission rates from fugitive dust.
Emissions from construction equipment are reported in Table 5-29, and the
resulting air quality impacts are reported in Table 5-30.
Table 5-28. Source term for the fugitive dust from construction in the onsiteprocessing alternative
MaximumArea of Emission
Averaging Mass of Pollutant _per Source RatePollutant Time Unit Area (kg/m2) (ha) (g/[m2•s])
PMI0Annual 4.4 5.3 1.4x10-
24 hr 0.012 5.3 1.4x10"4
Table 5-29. Source term for the construction equipment emissions in theonsite processing alternative
Mass of Pollutant Maximum EmissionPollutant Averaging Time (kg) Rate (g/s)
NO2 Annual 5.0x10 1.6
S02 Annual 3100 0.099
24 hr or less 86 0.99
PMI0 Annual 4700 0.15
24 hr or less 130 1.5
Table 5-30. Results from construction equipment and fugitive dust emissionsfor the onsite processing alternative
Maximum Concentration atMaximally Impacted Point of Percent of
Averaging Unrestricted Public Access RegulatoryPollutant Time (µg/m3) Limit
NO2 Annual 0.099 0.099
S02 Annual 0.0062 0.012
24 hr 5.5 2.1
3 hr 37 2.9
1 hr 84 8.1
1 hr (a) 63 9.7
PM10 Annual 0.0093 0.019
24 hr 8.3 30
a Regulatory limit not to be exceeded more than twice in any 7 consecu-tive days.
5.29
Air Quality
During the construction phase, the maximum offsite increases in ambient
NO2 , SO,, and PM10 from both fugitive dust and construction equipment emissions
would be below the federal and state regulatory limits. The offsite increases
would be temporary and would not adversely affect the regional air quality on
a continuing basis.
Operation. The operation of the processing facility is assumed to
result in the same NO 2 emission levels as the calcination facility (see
Tables 5-26 and 5-27), and the ambient air concentrations would not exceed
regulatory standards.
Foreign Processing Alternative
The foreign processing alternative could require three new facilities:
a transloading facility at the K Basins, a staging facility, and a UO 3 storage
facility. During operation, none of these facilities would produce any
significant releases of nonradiological pollutants. However, emission from
construction activities would contribute to nonradiological consequences in
the foreign processing alternative.
Except for those at the staging facility, there would be no significant
emission of NOZ , SO2 , or PM10 from construction vehicles because the amount of
diesel fuel and gasoline required in building the new facilities would be
relatively small (Bergsman et al. 1995). However, PM 10 would be emitted in
the form of fugitive dust from a total of 3.6 ha (8.9 acres). This includes0.4 ha (1 acre) for building the transloading facility, 2.8 ha (6.9 acres) for
building the staging facility, and 0.4 ha (1 acre) for building the UO 3 stor-
age facility. Because the various facilities would be located in different
areas on the Hanford Site, the air quality impacts for each of the facilities
are presented separately. Impacts for the staging facility are given under
the wet storage alternative discussion.
Table 5-31 provides estimates of PM 10 emission rates from fugitive dust
for the transloading and UO3 storage facilities. The resulting air quality
impacts are reported in Table 5-32. Emission rates and impacts for the
staging facility would be as described for the wet storage alternative.
6IM11.'
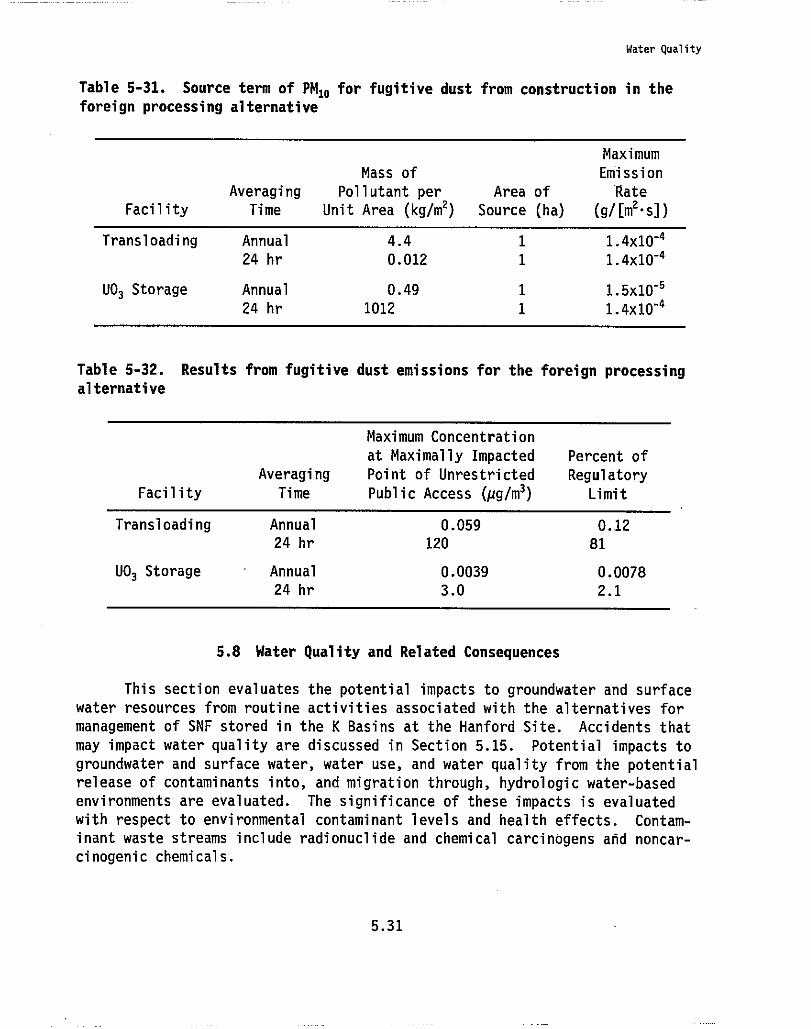
Water Quality
Table 5-31. Source term of PMlo for fugitive dust from construction in the
foreign processing alternative
Maximum
Mass of Emission
Averaging Pollutant per Area of Rate
Facility Time Unit Area (kg/m2 ) Source (ha) (g/[m2•S])
Transloading Annual 4.4 1 1.4x10"4
24 hr 0.012 1 1.4x10 -4
UO3 Storage Annual 0.49 1 1.5x10'5
24 hr 1012 1 1.4x10"4
Table 5-32. Results from fugitive dust emissions for the foreign processing
alternative
Maximum Concentration
at Maximally Impacted Percent of
Averaging Point of Unrestricted Regulatory
Facility Time Public Access (µg/m3 ) Limit
Transloading Annual 0.059 0.1224 hr 120 81
UO3 Storage Annual 0.0039 0.0078
24 hr 3.0 2.1
5.8 Water Quality and Related Consequences
This section evaluates the potential impacts to groundwater and surface
water resources from routine activities associated with the alternatives for
management of SNF stored in the K Basins at the Hanford Site. Accidents that
may impact water quality are discussed in Section 5.15. Potential impacts to
groundwater and surface water, water use, and water quality from the potential
release of contaminants into, and migration through, hydrologic water-based
environments are evaluated. The significance of these impacts is evaluated
with respect to environmental contaminant levels and health effects. Contam-
inant waste streams include radionuclide and chemical carcinogens and noncar-
cinogenic chemicals.
5.31
Water Quality
The Multimedia Environmental Pollutant Assessment System (MEPAS), a
computer model, was used to simulate the release, migration, fate, exposure,
and risk to surrounding receptors of wastes that are discharged into the
environment from the operation of SNF facilities. The uses of this model
include assessing health impacts from releases of both hazardous and radio-
active materials. The MEPAS model is designed for site-specific assessments
using readily available information. It follows EPA risk-assessment guidance
in evaluating the following:
1. the release of contaminants into the environment
2. their movement through and transfer between various environmental media
[i.e., subsurface (vadose and saturated zones), surface water, overland
(surface soil), and atmospheric]
3. exposure to surrounding receptors via inhalation, ingestion, dermal
contact, and external dose
4. risk from carcinogens and hazard from noncarcinogens.
Liquid effluent releases from alternatives for managing SNF in the
K Basins result in water either being released directly into the Columbia
River or into the soil column with subsequent potential migration into the .
Columbia River. The scenarios assume that discharge in the Columbia River is
under low-flow conditions of 1,000 m3/s (36,000 ft'/s) (Whelan et al. 1987),which represents the most conservative case for maximizing surface water
concentrations. Also as a conservative assumption, the removal of water from
the Columbia River is assumed to be 100 m (328 ft) downstream from the point
of entry of the contaminant into the river. In reality, the first withdrawal
point is at North Richland, where the water would be relatively well mixed
over a significantly larger volume of the river, resulting in substantially
lower concentrations. All assessments addressed recreational activities
(e.g., boating, swimming, and fishing) in the Columbia.River and use of the
water as a drinking water supply and for bathing, irrigation, and other uses.
Exposures were assumed to a maximum individual in the river and to a popula-
tion of 75,000 receiving its water from the same location in the river. The
maximum effective lifetime radiological dose to an individual represents the
effective dose equivalent, which is over a 50-year dose commitment period.
For this assessment, the dose commitment period was applied to all radionu-
clides taken in over a 70-year period, which represents a conservative esti-
mate of the effective dose equivalent. The population risks represent the
cancer incidence in the population, exposed at the maximum effective lifetime
radiological dose.
5.32
Water Quality
5.8.1 No Action Alternative
The only routine release from the K Basins is from directly discharging
effluent to the Columbia River. Water that is used by the K Basins flows from
and back to the Columbia River by way of the old reactor piping system.
A fraction of the water is directly used for the K Basins, while the remainder
is returned to the river. The piping system has some radiological contamin-
ation associated with it; therefore, the K Basins are combined as one release
and represented by a "single liquid release point to the Columbia River"
(Bergsman et al. 1995). The annual liquid discharge to the river is approxi-
mately 9.1 x 10 5 m3/year (2.4 x 10⁸ gal/year), releasing the following
(Bergsman et al. 1995): 2.7 x 10 -4 Ci cobalt-60, 0.0015 Ci ruthenium-106,
4.7 x 10"5 Ci cesium-134, and 4.0 x 10 -4 Ci cesium-137. The annual discharge
is assumed to continue at this level over the 18 years from 1997 through 2015,
which is consistent with DOE (1995a) and Whelan et al. (1994). For release
durations other than 18 years, the dose and risk would be prorated based on
the release duration. For example, if the release is half as long (e.g.,
9 years), then the dose and risk would be reduced by one-half.
Operational liquid effluents from the K Basins are discharged to the
Columbia River via the monitored and regulated National Pollutant Discharge
Elimination System (NPDES) permitted 1908-KE outfall. Although the radio-
logical releases occur from the outfall, they are not part of the outfall
permit, which specifically addresses nonradiological releases. For nonradio-
logical releases, Bergsman et al. (1995) notes that the analysis performed onthe NPDES outfall does not indicate any hazardous constituents. Contaminant
migration is from the point-source discharge point to the Columbia River and
in the Columbia River to receptors downstream. The maximum effective lifetime
radiological dose to an individual, considering all pathways and exposure
routes, is 2.2 x 10"6 rem for cesium-137 with a population risk of 7.5 x 10
"5
latent cancer fatalities.
Intermittent leakage of water from the K Basins is monitored via onsite
groundwater sampling. Although radionuclide concentrations in some of the
100-K Area monitoring wells exceed EPA drinking water standards (DWS), this
condition does not constitute a risk to the public because the groundwater is
not used directly for human consumption or food production. Analyses of water
from the 100-K Area springs, where groundwater enters the Columbia River,
indicate that radionuclide levels are below the EPA DWS. Dilution of this
seepage in the river flow would further reduce the risk to the downstream
population, as indicated by the fact that radionuclide concentrations in the
Columbia River at the Richland pump house are orders of magnitude below the
DWS (Dirkes et al. 1994).
5.33
Water Quality
5.8.2 Enhanced K Basins Storage Alternative
The routine release scenario under the enhanced K Basins storage
alternative is the same as the routine release scenario described under the
no action alternative (see Section 5.8.1). Bergsman et al. (1995) do not
discuss disposal of water in the KE Basin; however, disposal of water from
the KE and KW Basins is considered part of the wet storage alternative (see
Section 5.8.3). Disposal of water from the KE Basin, as part of the enhanced
K Basins storage alternative, would be bounded by disposal of water from the
KE and KW Basins, as described for the wet storage alternative.
5.8.3 Wet Storage Alternative
Scenarios and consequences relating to water quality would be the same
as for the no action alternative (i.e., Section 5.8.1) with the addition of
an operational release scenario to the 200 Area Effluent Treatment Facility
(ETF). Bergsman et al. (1995) note that
"(w)ater would remain in the K Basins following removal of the
fuel, sludge, and debris. This water is contaminated with radio-
nuclides including tritium.... Tritium ... cannot be effectively
separated from the water. Contaminated basin water would be
transported to the 200 Area ETF for final disposal into the
200 Area SALDS."
The State-Approved Land Disposal System (SALDS) is located in the 200 West
Area. Concentrations of radiological constituents in water released from all
sources from the ETF disposal system are presented in Bergsman et al. (1995)
as 7.3 x 10' mCi/L cobalt-60; 1.5 x 10'' mCi/L cesium-134; 3.1 x 10 -5 mCi/L
cesium-137; 0.0034 mCi/L tritium; 3.5 x 10 -8 mCi/L manganese-54;
3.1 x 10 "' mCi/L plutonium-238; 3.5 x 10⁻⁶ mCi/L plutonium-239,240;
6.0 x 10"6 mCi/L antimony-125; and 2.7 x 10 -5 mCi/L strontium-90. Concentra-
tions of nonradiological constituents in water released from all sources
from the ETF disposal system are presented in Bergsman et al. (1995) as
820 µg/L aluminum, 1720 µg/L barium, 335 µg/L calcium, 3430 pg/L iron,
11.5 jug/L magnesium, 3.32 ug/L manganese, 107 ,ug/L selenium, 11.1 µg/L silver,
176 ug/L sodium, 101 µg/L sulfur, 21.8 µg/L zinc, and 50.1 µg/L zirconium.
These chemical constituents are considered noncarcinogens. Over a 2.5-year
period from 2000 to 2002, 14,000 M3 /year (3.7 x 10 6 gal/year) would be
discharged through buried manifolds occupying an area equaling 2,044 m2
(22,000 ft'), resulting in an infiltration rate of 7 m/year (22 ft/year).
Holdren et al. (1994) note that the transmission rate of the top soil in the
5.34
Water Quality
200 West Area is approximately 3800 m/year (12,500 ft/year). Because the
infiltration rate is less than the transmission rate of the soil, no ponding
would occur.
Contaminant migration is from the ETF disposal system manifolds, through
the vadose zone, through the saturated zone to the Columbia River, and in the
Columbia River to receptors downstream. A pore-water velocity in the satu-
rated zone of 0.27 m/day (0.88 ft/day) was used in the modeling (corresponds
to the pathway having the shortest travel time to the river reported in
Luttrell 1995). The maximum effective lifetime radiological dose.to an
individual, considering all pathways and exposure routes, is found to be
1.1 x 10⁻⁷ rem for plutonium-239 with a population risk of 4.2 x 10"6 latent
cancer fatalities. The noncarcinogenic chemical individual doses were found
to be below their respective reference doses. EPA (1988b) defines the refer-
ence dose as the amount of a chemical that can be taken into the body each day
over a lifetime without causing adverse effects.
5.8.4 Drying/Passivation with Dry Storage Alternative
'Scenarios and consequences relating to water quality would be the same
as for the wet storage alternative (i.e., Section 5.8.3) except the discharge
to the ETF disposal system would be 1,000 M3 /year (2.6 x 10⁵ gal/year)
released over a 2-year period from 1998 to 2000. This discharge would be from
the operation of a new passivation facility. Disposal at the ETF would be
through buried manifolds occupying an area equaling 2,044 m 2 (22,000 ft'),
resulting in a Darcy infiltration rate of 0.50 m/year (1.6 ft/year).
The maximum effective lifetime radiological dose to an individual, con-
sidering all pathways and exposure routes, is 1.9 x 10 -9 rem for plutonium-239
with a population risk of 3.9 x 10 "8 latent cancer fatalities. The noncarcin-
ogenic chemical individual doses were found to be well below their respective
reference doses.
5.8.5 Calcination with Dry Storage Alternative
Under this alternative, a new calcination facility would be constructed
to stabilize the K Basin fuel before storage in a dry vault. Operation of
this facility would produce both radiological and nonradiological liquid
effluent streams. The radiological stream would be released to the ETF and
the nonradiological stream would be released to the 200 Area Treated Effluent
Disposal Facility (TEDF), located in the 200 East Area.
5.35
Water Quality
Scenarios and consequences relating to the ETF disposal would be the
same as for the assessment outlined in the wet storage alternative (i.e.,
Section 5.8.3), except the discharge to the effluent treatment facility
disposal system would be 500 m3/year (1.3 x 10 5 gal/year) released over a
4-year period from 2002 to 2006 through buried manifolds occupying an area
equaling 2,044 mZ (22,000 ft2), resulting in an infiltration rate of
0.24 m/year (0.8 ft/year). The maximum effective lifetime radiological dose
to an individual, considering all pathways and exposure routes, is 8.6 x 10"11
rem for plutonium-239. The noncarcinogenic chemical individual doses were
found to be well below their respective reference doses.
The nonradiological liquid effluent stream from the new calcination
facility would be added to the TEDF, which receives liquid effluent from many
other facilities. The discharge target allowable concentrations in the TEN
for nonradionuclides are presented in Bergsman et al. (1995). In addition,
the discharge target allowable concentrations for radionuclides presented in
Bergsman (1995) were used in this assessment. Only 380 L/day (100 gal/day)
would be discharged to the TEDF basin from this operation, although other
facilities unrelated to SNF storage would also discharge to the basin. To
address the impact of this additional effluent on water quality resulting from
discharges to the TEDF, a ponded situation resulting in maximum outflow from
the basin was assumed. This maximum outflow is 3.42 x 10⁴ M3 /day
(9.04 x 10⁶ gal/day), which is the product of the transmission rate (i.e.,
saturated hydraulic conductivity under a unit hydraulic gradient) of the
soil immediately below the basin and the basin area. The ponded assumption
maximizes the mass flux of contaminant leaving the basin (i.e., concentration
x outflow) and the flow velocity through the vadose zone, resulting in a very
conservative assessment. The discharge from the pond is assumed to last for
4 years.
Based on the movement of the second tritium plume from the PUREX cribs
in the 200 East Area to Well 699-24-33, a distance of 6 km (4 mi) in a 5-year
period (1983 to 1988), the average pore-water velocity (i.e., specific dis-
charge divided by the effective porosity) in the saturated zone is 3.3 m/day
(10.8 ft/day) (Schramke 1993; Thorne 1993). Davis et al. (1993) performed a
more recent analysis and determined the pore-water velocity as 0.02 m/day
(0.08 ft/day) just below the TEDF site, although this is not necessarily
indicative of the velocity as the water moves toward the river. The highest
pore-water velocity of 3.3 m/day (10.8 ft/day) was used because 1) it is
consistent with other assessments at the installation (Whelan et al. 1994),
2) the contaminants reach the river and receptors earlier than if the lower
velocity was used, and 3) the resulting exposure analysis provides the more
conservative estimate of health impact.
5.36
Ecological Resources
Bergsman et al. (1995) lists the chemical carcinogens and noncarcinogens
that could potentially be released from the TEDF. Bergsman (1995) lists the
radionuclides that could potentially be released from the TEDF. The concen-
trations in the TEDF were represented by the discharge target allowable con-
centrations (Bergsman et al. 1995). Contaminant migration is from the ponded
water, through the vadose zone, through the saturated zone to the Columbia
River, and in the Columbia River to receptors downstream. The maximum effec-
tive lifetime radiological dose to an individual, considering all pathways and
exposure routes under the fully ponded condition, is 0.0026 rem for carbon-14
with a population risk of 0.098 latent cancer fatalities. The maximum average
daily dose to an individual for chemical carcinogens, considering all pathways
and exposure routes, is found to be 1.4 x 10 -8 mg/[kg body mass-day] for
arsenic with a population risk of 0.023 latent cancer fatalities. The noncar-
cinogenic chemical individual doses were found to be below their respective
reference doses, except nitrate, which had a dose of 2.6 times its reference -
dose. This value is expected to be an overestimate because of the conserva-
tive nature of the assessment. This assessment is overly conservative because
1) the receptor location is extremely close to the contaminant discharge point
to the river, thereby minimizing the dilution and maximizing the concentration
in the river; 2) the maximum discharge from and the maximum allowable concen-
tration in the TEDF were assumed; and 3) a probability of occurrence of unity
was assumed.
5.8.6 Processing Alternative
Scenarios and consequences relating to water quality for this alter-
native would be the same as for the TEDF scenario outlined in the calcination
with dry storage alternative (i.e., Section 5.8.5).
5.8.7 Consequences to Recreation and Fisheries
The doses to offsite members of the public from releases to ground or
surface water are sufficiently low that no impacts on recreational use of the
Columbia River or on fisheries would be expected for any of the alternatives
evaluated.
5:9 Ecological Resources
Two sites are being considered for the alternatives that require the
construction of new facilities. The reference site (Figure 5-1) is located
outside of 200 East Area (see DOE 1995a for the results of an ecological
reconnaissance of this area), and the CSB site is located within the 200 East
Area. In the following subsections, potential impacts of construction are
5.37
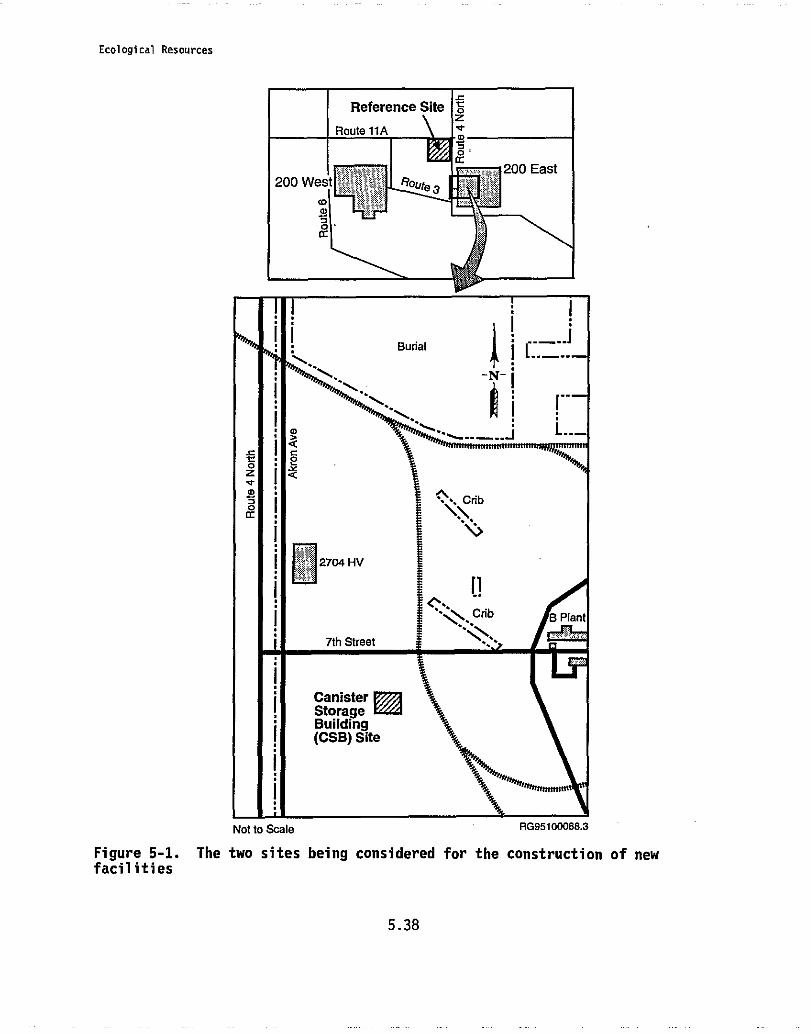
Ecological Resources
Reference Site ozRoute 11A m
0o°cc
•^ 3 5200 West Route 3
200 East
115
m a,0o¢
Burial I ^___,
^. -N-i
rz I
oxQ
V
5a°[
C rib
I
.v
f .%., 2704 HV
iN\.Crib B Plant
7th Street
i CanisterStorage
i Building(CSB) Site
Not to Scale RG95100088.3
Figure 5-1. The two sites being considered for the construction of newfacilities
5.38
Ecological Resources
only discussed for the reference site, outside of the 200 East Area. The CSB
site is a construction zone with highly disturbed vegetation cover in isolated
places. Thus, impacts to ecological resources would be inconsequential if new
facilities are built at the CSB site. Further, no plant or animal species
identified as protected under the Endangered Species Act, candidates for such
protection, or species listed by the Washington State government were observed
near the CSB site.
5.9.1 No Action and Enhanced K Basins Storage Alternatives
No impacts to terrestrial resources, wetlands, aquatic resources,
threatened and endangered species, or radioecology would result from imple-
mentation of the no action and enhanced K Basin storage alternatives. Accumu-
lation and transfer of radionuclides within the ecosystem associated with the
K Reactors would not change from those occurring now, and no measurable
impacts would be expected.
5.9.2 Wet Storage Alternative
Terrestrial Resources
Approximately 2.8 ha (6.9 acres) of land and native vegetation would be
disturbed during land-clearing activities to provide new pool or vault facil-
ities for this alternative. Plant species most likely to be affected include
big sagebrush, cheatgrass, and Sandberg's bluegrass. Although the plantcommunities to be disturbed are well represented on the Hanford Site, they are
relatively uncommon regionally because of the widespread conversion of shrub-
steppe habitats to agriculture. Disturbed areas are generally recolonized by
cheatgrass, a nonnative species, at the expense of native plants. Mitigation
of these impacts would include minimizing the area of disturbance and revege-
tating with native species, including shrubs, and replacing lost habitat in
concert with a habitat enhancement plan currently being developed for the
Hanford Site in general. Adverse impacts to vegetation on the Hanford Site
are expected to be limited to the project area and vicinity and are not
expected to affect the viability of any onsite plant populations.
Construction would have some adverse impact on animal populations. Less
mobile animals within the project area, such as invertebrates, reptiles, and
small mammals, would be destroyed during land-clearing activities. Larger
mammals and birds in construction and adjacent areas would be disturbed by
construction activities and would move to adjacent suitable habitat, and these
individual animals might not survive and reproduce. Revegetated areas (e.g.,
construction laydown areas and buried pipeline routes) would be reinvaded by
5.39
Ecological Resources
animal species from surrounding, undisturbed habitats. The adverse impacts of
construction would be limited to the project area and vicinity and should not
affect the viability of any animal populations on the Hanford Site because
similar suitable habitat would remain abundant on the Site.
The impacts to the vegetation and animal communities would be mitigated
by minimizing the amount of land disturbed during construction, employing soil
erosion control measures during construction activities, and revegetating
disturbed areas with native species. The mitigation measures would limit the
amount of direct and indirect disturbance to the construction area and
surrounding habitats and would speed the recovery process for disturbed lands.
Wetlands
No wetlands are located in the area where land disturbance would occur.
Aquatic Resources
No aquatic resources are present in the area where land disturbance
would occur.
Threatened and Endangered Species
Construction and operation of the new facilities would remove approxi-
mately 2.8 ha (6.9 acres) of relatively pristine shrub-steppe habitat. Con-struction would also disturb the gravel pit (13.88 ha, 34.29 acres) located in
the southwest portion of the proposed site.
The shrub-steppe habitat is considered priority habitat by the state of
Washington because of its relative scarcity in the state and its requirement
as nesting and breeding habitat by loggerhead shrikes, sage sparrows, sage
thrashers, burrowing owls, pygmy rabbits, and sagebrush voles.
Loggerhead shrikes, listed as a federal candidate (Category 2) and state
candidate species, forage on the proposed site but are relatively uncommon at
Hanford. This species is sagebrush-dependent, as it is known to select
primarily tall, big sagebrush as nest sites. Construction of the facility
would remove big sagebrush habitat that would preclude loggerhead shrikes from
nesting. Site development would also be expected to reduce the value of the
site as foraging habitat for shrikes known to nest in adjacent areas.
Sage sparrows and sage thrashers, both state candidate species, are
fairly common at Hanford. They were not observed on the reference site,
5.40
Ecological Resources
probably because they had begun migration before the site was surveyed.
These species are known to nest primarily in sagebrush. Construction of the
facility would likely preclude both of these species nesting at the proposed
site and reduce the site's suitability as foraging habitat for these species.
Construction is not expected to substantially impact loggerhead shrike,
sage sparrow, or sage thrasher populations because similar sagebrush habitat
is still relatively common at Hanford. However, the cumulative effects of
constructing the facility, in addition to future developments that further
reduce shrub-steppe habitat (causing further fragmentation.of nesting
habitat), would be expected to negatively affect the long-term viability of
populations of these species at Hanford.
Burrowing owls, a state candidate species, are relatively common at
Hanford and nest in abandoned ground squirrel burrows on the proposed site.
Construction would remove sagebrush and disturb soil, displacing ground
squirrels and thus reducing the suitability of the area for nesting by
burrowing owls. Construction would also displace small mammals, which
constitute a portion of the prey base for this species. Construction would,
however, not be expected to negatively impact the viability of the population
of burrowing owls on Hanford, as their use of ground squirrel burrows as nests
is not limited to burrows in shrub-steppe habitat.
Pygmy rabbits, a federal candidate (Category 2) and state threatened
species, are known to use tall clumps of big sagebrush throughout most oftheir range. This species has not been observed on the Hanford Site; however,
construction of the facility would reduce the potential for this species'
occurrence by removing suitable habitat.
Sagebrush voles, a state monitor species, are common at Hanford and
select burrow sites near sagebrush. Construction of the facility would remove
sagebrush habitat, precluding sagebrush voles from using the site. However,
construction would not affect the overall viability of sagebrush vole popula-
tions at Hanford.
The closest known nests of the ferruginous hawk, a federal candidate
(Category 2) and state threatened species, and Swainson's hawk, a state candi-
date, are 8.50 km (5.2 mi) and 6.20 km (3.9 mi), respectively, from the refer-
ence site. The site covers a portion of the foraging range of these species.
Construction of the facility is not expected to disrupt the nesting activities
of these species. However, construction would displace small, mammal popula-
tions and thus reduce the prey base of these species. The cumulative effects
of constructing the facility, in addition to future reductions in shrub-steppe
5.41
Ecological Resources
habitat (causing further fragmentation of foraging habitat), could negatively
affect the long-term viability of populations of these two species at Hanford.
Radioecology
There would be no routine releases of radioactively contaminated liquid
effluents that would reach terrestrial or aquatic resources.
5.9.3 Calcination with Dry Storage Alternative
Terrestrial Resources
Impacts of constructing the dry storage facility would be similar to
those described under the wet storage alternative (Section 5.9.2), and an
additional 2.4 ha (5.9 acres, see Table 5-1) would be affected by construction
of the calcination facility.
Wetlands
No wetlands are located on the area where land disturbance would occur.
Aquatic Resources
No aquatic resources are located on the area where land disturbance
would occur.
Threatened and Endangered Species
Impacts to threatened and endangered species would be similar to those
described under the wet storage alternative (Section 5.9.2), and an additional2.4 ha (5.9 acres) would be affected by construction of the calcination
facility.
5.9.4 Drying/Passivation with Dry Storage Alternative
Terrestrial Resources
Impacts of constructing the dry storage facility would be similar to
those described under the wet storage alternative (Section 5.9.2), except that
an additional 0.7 ha (1.7 acres) would be affected by construction of thedrying/passivation facility.
5.42
Ecological Resources
Wetlands
No wetlands are located in the area where land disturbance would occur.
Aquatic Resources
No aquatic resources are present in the area where land disturbancewould occur.
Threatened and Endangered Species
Impacts to threatened and endangered species would be similar to those
described under the wet storage alternative (Section 5.9.2), and an additional
0.7 ha (1.7 acres) would be affected by construction of the drying/passivationfacility.
Radioecology
No routine releases of radioactively contaminated liquid effluents wouldoccur that would reach terrestrial or aquatic resources.
5.9.5 Onsite and Foreign Processing Alternatives
Terrestrial Resources
Impacts would be similar to those described under the wet storage alter-native (Section 5.9.2), except that an additional 4.9 ha (12 acres) would berequired for the processing facility and 0.4 ha (1 acre) for UO 3 storage.
Wetlands
No wetlands are located on the area where land disturbance would occur.
Aquatic Resources
No aquatic resources are located on the area where land disturbance
would occur.
Threatened and Endangered Species
Impacts to threatened and endangered species would be similar to those
described under the wet storage alternative (Section 5.9.2), except that an
additional 4.9 ha (12 acres) would be required for the process facility and
0.4 ha (1 acre) for UO 3 storage.
5.43
Noise
Radioecology
No routine releases of radioactively contaminated liquid effluents would
occur that would reach terrestrial or aquatic resources.
5.10 Noise
Noise impacts resulting from implementation of the alternatives are
discussed in the following subsections. The analyses addresses-construction
and operational noise, and noise resulting from increased traffic from
employment.
5.10.1 No Action and Enhanced K Basins Storage Alternatives
The no action alternative establishes the baseline noise levels. Under
this option, minor sources of noise associated with ongoing maintenance, moni-
toring, and safety upgrades would occur. Because of the remote location of
the K Basins, impacts to communities would be very low.
Estimated employment under no action establishes the baseline for addi-
tional staff labor that was used to estimate potential impacts in communities
resulting from traffic. Under the K Basins enhancements, a decrease would
occur in traffic noise starting in 2003 and lasting through 2035.
5.10.2 Wet Storage Alternative
The wet storage alternative would require additional construction of a
facility, transfer of K Basins SNF, and decommissioning of the K Basins.
These actions would result in increased noise from construction; however,
noise levels would not exceed other routine noise levels associated with
construction, and impacts would be minimal. Operating noise levels would be
similar to the no action alternative except that impacts would occur in the
200 Area.
Community traffic noise impacts would show a slight increase in 1996 and
then a gradual decrease through 2003. Starting in 2004, a net reduction would
occur in traffic noise compared to the no action alternative. Expected
increases and dgcreases in community noise levels associated with changes in
traffic would be minor.
5.44
Transportation
5.10.3 Dry Storage Alternative
No distinction has been made between passivation or calcination with dry
storage for noise analysis. Construction and operational noise impacts, while
greater than the no action alternative, are within state regulations and would
not cause an adverse impact to the surrounding environment.
Significantly greater employment would be associated with the dry stor-
age alternative. This employment would result in increased rush-hour traffic
in the neighboring communities; however, the increase of traffic noise would
be insufficient to cause an adverse impact.
5.10.4 Onsite and Foreign Processing Alternatives
The processing alternative includes construction of the process facility
and a facility for staging unprocessed fuel and separated uranium trioxide.
Construction and operational noise impacts, while greater than the other
alternatives, would be within Washington State regulations and would not cause
an adverse impact to the surrounding environment.
Employment associated with the processing alternative would also be
greater than for the other alternatives. This would increase rush-hour
traffic in the neighboring communities; however, the increase of traffic noise
would be of insufficient magnitude to cause an adverse impact.
Noise associated with foreign processing would follow the levels modeled
for onsite processing up through the year 2010. Transportation noise associ=
ated with moving the stabilized fuel for overseas shipping would be minor
relative to baseline traffic noise levels.
5.11 Transportation
This section summarizes the evaluation of the impacts of transporting
SNF and basin sludge wastes in support of the alternatives. There are no
shipments planned in the no action alternative; therefore, this alternative
was not evaluated. Transportation impacts include external radiation
exposures received from routine (incident-free) transport and internal and
external exposures from vehicular accidents that release radioactive materials
from the shipments. Also included are nonradiological impacts from trans-
portation accidents (traumatic fatalities) and nonradiological, routine pollu-
tants emitted by the transport vehicles. Impacts to the public, workers, and
truck and rail crew members are calculated.
5.45
Transportation
Several approaches and computer codes were used to perform the trans-
portation impact calculations:
• RADTRAN 4 Computer Code (Neuhauser and Kanipe 1992): This computer code
is commonly used in EISs. It was used to calculate routine radiological
exposures to the public and workers (including truck and rail crews) as
well as the population dose (based on a probabalistic determination of
the material released) from accidental releases of radioactive materials
during transport.
• GENII Computer Code (Napier et al. 1988): GENII, also referred to as
the Hanford Environmental Dosimetry Software System, is commonly used
for analyses of consequences from accidental releases on the Hanford
Site. It was used in this analysis to develop estimates of the maximum
individual doses to the public and workers from accidental releases
during transport.
• Unit Risk Factor: The unit risk factor approaches were used to calcu-
late the nonradiological accident and routine impacts. Unit risk
factors (health effects per unit distance traveled) were taken from
Daling and Harris (1994) and Rao et al. (1982) for nonradiological
accidents and routine impacts, respectively, to develop the estimates
of these impacts.
Additional information on these approaches and computer codes is pro-vided in Appendix B. Appendix B also contains the detailed assumptions and
input data used in the analysis. A summary of the shipping scenario informa-
tion for the various alternatives is presented in Table 5-33.
5.11.1 Enhanced K Basin Storage Alternative
The enhanced K Basin storage alternative assumes that all SNF canisters
within the KE Basin would be transported a short distance and placed in the
KW Basin. The SNF in the KE Basin would be placed within MCOs and then loaded
into a shipping cask and moved approximately 0.5 km (0.3 mi) to the KW Basin.
The basin sludge will be packaged in an overpack, or other high-integrity-
container (HIC) and transported to KW Basin or the double-shell tanks or Solid
Waste Burial Ground. A DOE-approved shipping cask would be used for this fuel
transfer activity. The KE Basin sludge (i.e., sludge external to the canis-
ters) would be packaged, removed from the basin, and transported to a storage
or disposal site. Based on the results of waste characterization analyses,
the basin sludge would be managed as either SNF, solid waste, or liquid
wastes. The basin sludge would be packaged and removed from the basin
5.46
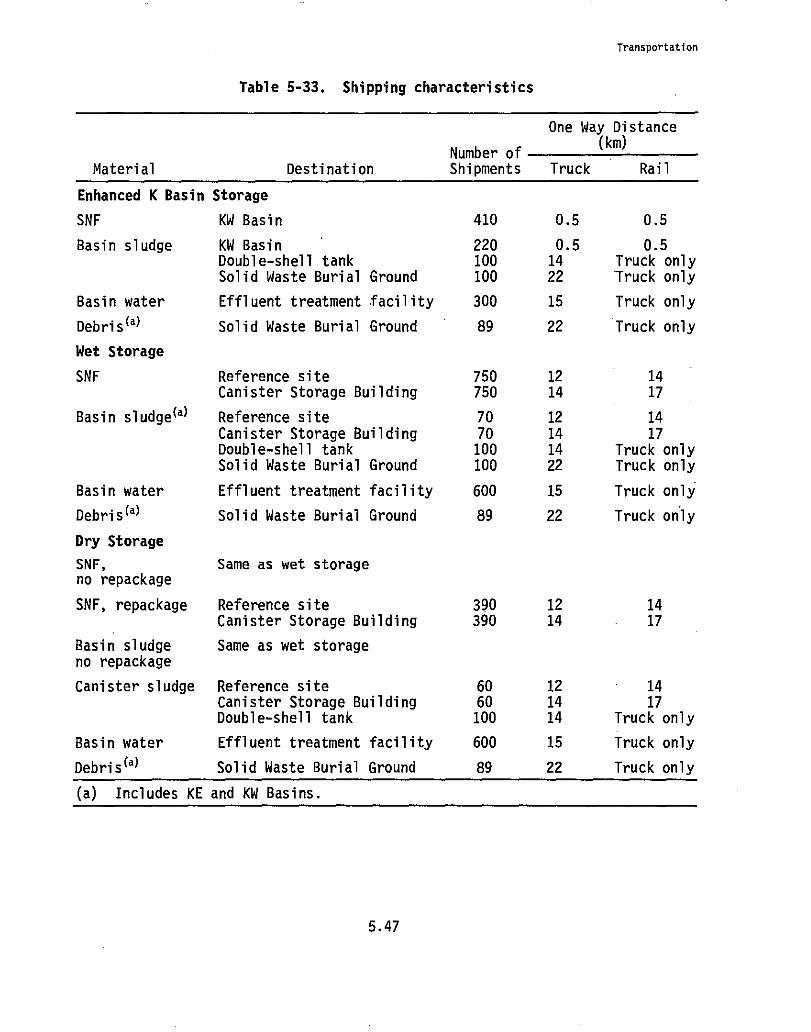
Basin sludge
Basin water
Debri s (a)
Wet Storage
SNF
Basin sludge(a)
Basin water
Debri s (a)
Dry Storage
SNF,no repackage
SNF, repackage
Basin sludgeno repackage
Canister sludge
Transportation
Table 5-33. Shipping characteristics
One Way Distance
Number of
(km)
Material
Destination Shipments
Truck Rail
Enhanced K Basin Storage
SNF KW Basin
Basin water
Debri s (a)
410
0.5
0.5
KW Basin
220
0.5
0.5Double-shell tank
100
14
Truck onlySolid Waste Burial Ground
100
22
-Truck only
Effluent treatment facility
300
15
Truck only
Solid Waste Burial Ground
89
22
Truck only
Reference site 750 12Canister Storage Building 750 14
Reference site 70 12Canister Storage Building 70 14Double-shell tank 100 14Solid Waste Burial Ground 100 22
Effluent treatment facility 600 15
Solid Waste Burial Ground 89 22
Same as wet storage
Reference site 390 12 14Canister Storage Building 390 14 17
Same as wet storage
Reference site 60 12 14Canister Storage Building 60 14 17Double-shell tank 100 14 Truck only
Effluent treatment facility 600 15 Truck only
Solid Waste Burial Ground 89 22 Truck only
1417
1417
Truck onlyTruck only
Truck only
Truck only
(a) Includes KE and KW Basins.
5.47
Transportation
remotely. The basin sludge would be placed in an MCO if the basin sludge is
characterized as SNF, a liquid waste high-integrity container (LWHIC) if the
basin sludge meets the double-shell tank waste acceptance criteria, or would
be grouted and packaged in a solid waste high-integrity container (SWHIC) if
the basin sludge meets the Solid Waste Burial Ground waste acceptance cri-
teria. The SNF containers, including the basin sludge if it is designated as
SNF, would be transported by truck or rail. The LWHIC and SWHIC containers
were assumed to be transported by truck only.
This alternative also includes management of the basin water and debris
in the KE Basin. The basin water is assumed to be transported by tanker truck
to the ETF in the 200 East Area where it would be processed. The debris would
be removed from the basin, packaged, and transported to the Solid Waste Burial
Ground for disposal as low-level radioactive waste. The debris was assumed to
be packaged in the SWHIC and transported by truck. The number of shipments
and shipping distances for these materials are shown iri Table 5-33.
Radiological Impacts
The routine radiological doses to the truck crew and the public and
public accident risks caused by transportation activities, were calculated
using RADTRAN 4 (see Appendix B). The GENII computer code was used to calcu-
late the doses to the maximally exposed individuals (MEIs) using Hanford Site-
specific weather data. Because the shipments occur within the Hanford Site
(i.e., away from public population zones and public access), impacts to only
onsite individuals and transport crew have been evaluated.
The results of the radiological impact analysis are presented in terms
of latent cancer fatalities and are shown in Table 5-34. The results are
based on a two-person truck crew, three-person rail crew, and a total onsite
population along the transportation corridor of approximately 3,200 during
accident conditions.
The results in Table 5-34 show that during routine transportation.the
calculated number of worker and onsite fatalities from radiological impacts
increases with the number of shipments or total distance travelled. For all
SNF handling options, the expected number of fatalities, for both truck and
rail, would be less than 4.8 x 10 "7 (onsite) for the entire campaign.
Also shown in Table 5-34 are the radiological impacts from transporta-
tion accidents. The onsite impacts for both truck and rail are less than
3.0 x 10 "4 latent cancer fatalities for the entire campaign. Although not
shown in Table 5-34, impacts or doses to MEIs from an SNF transportation
5.48
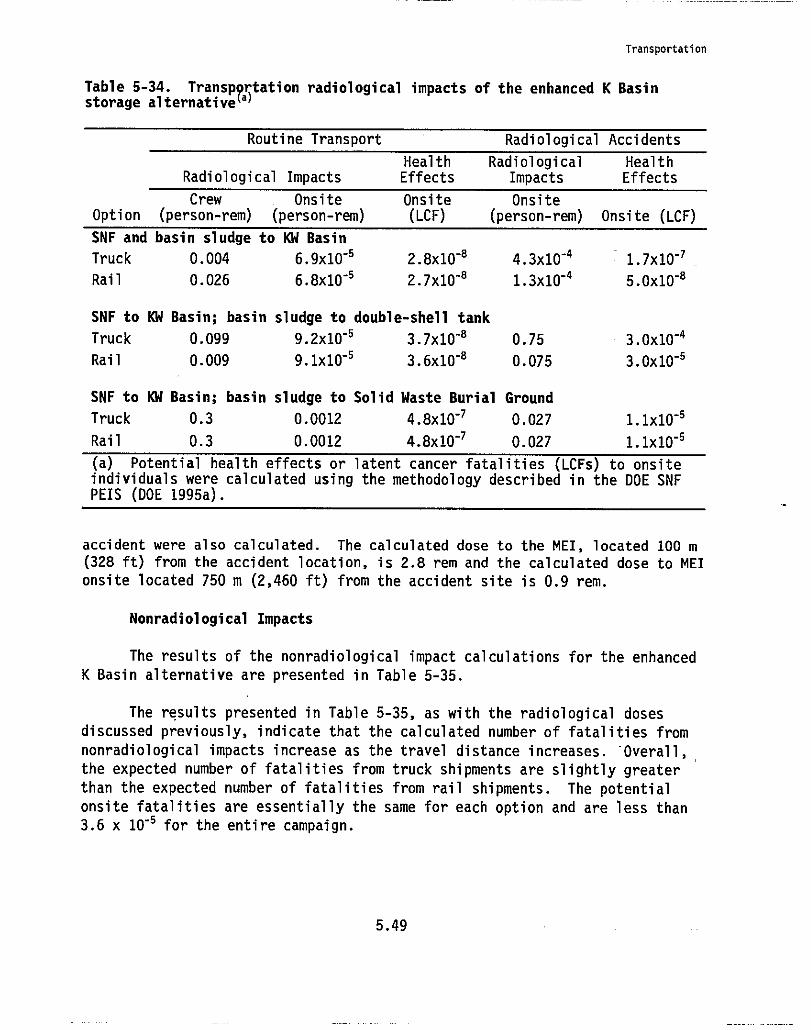
Onsite Onsite(LCF) (person-rem)
2.8x10"8
4.3x10 "4
2.7x10"81.3x10⁻⁴
Onsite (LCF)
1.7x10 "7
5.Ox10"8
Transportation
Table 5-34. Transp rtation radiological impacts of the enhanced K Basinstorage alternative ^a^
Routine Transport Radiological Accidents
Health Radiological HealthRadiological Impacts Effects Impacts Effects
Crew OnsiteOption (person-rem) (person-rem)
SNF and basin sludge to KW Basin
Truck 0.004 6.9x10"5
Rail 0.026 6.8x10 "5
SNF to KW Basin; basin sludge to double-shell tank
Truck 0.099 9.2x10"5
3.7x10"8
0.75
Rail 0.009 9.1x10-53.6x10
"80.075
SNF to KW Basin; basin sludge to Solid Waste Burial Ground
Truck 0.3 0.0012 4.8x10"7 0.027
Rail 0.3 0.0012 4.8x10"' 0.027
3.0x10"4
3.0x10"5
1.1x10⁻⁵
1.1x10⁻⁵(a) Potential health ettects or latent cancer fatalities (LCFs) to onsiteindividuals were calculated using the methodology described in the DOE SNFPEIS (DOE 1995a).
accident were also calculated. The calculated dose to the MEI, located 100 m
(328 ft) from the accident location, is 2.8 rem and the calculated dose to MEI
onsite located 750 m (2,460 ft) from the accident site is 0.9 rem.
Nonradiological Impacts
The results of the nonradiological impact calculations for the enhanced
K Basin alternative are presented in Table 5-35.
The results presented in Table 5-35, as with the radiological doses
discussed previously, indicate that the calculated number of fatalities from
nonradiological impacts increase as the travel distance increases. Overall,
the expected number of fatalities from truck shipments are slightly greater
than the expected number of fatalities from rail shipments. The potential
onsite fatalities are essentially the same for each option and are less than
3.6 x 10"5 for the entire campaign.
5.49
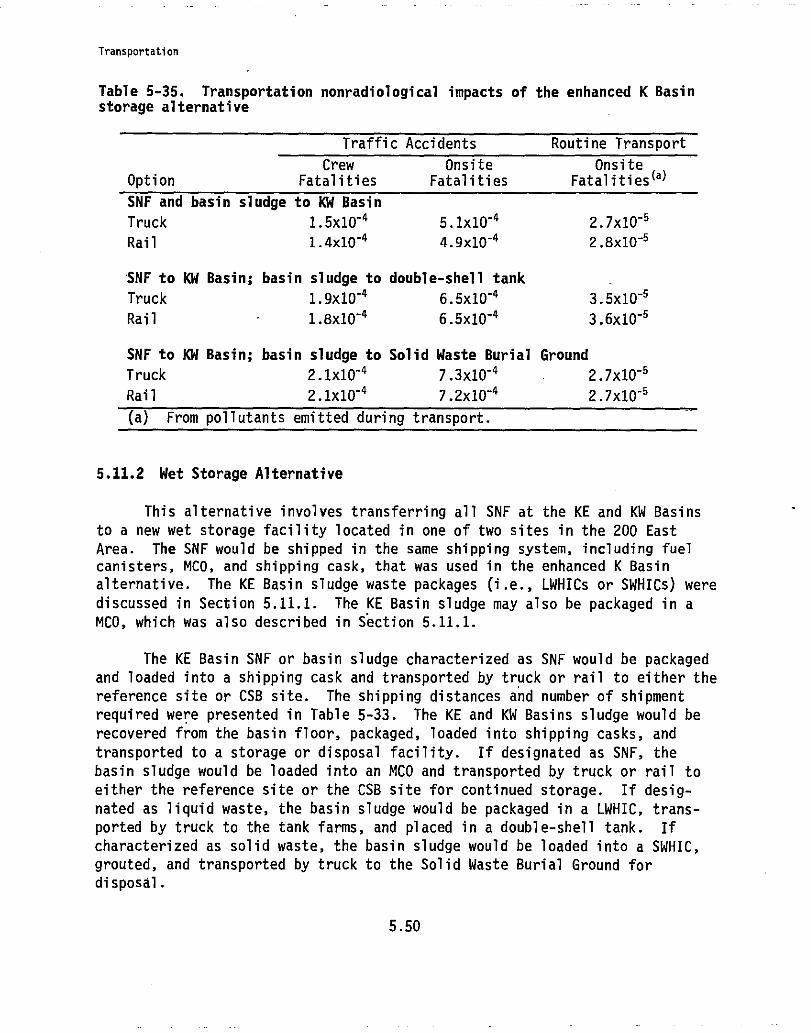
Transportation
Table 5-35. Transportation nonradiological impacts of the enhanced K Basinstorage alternative
Traffic Accidents Routine Transport
Crew Onsite OnsiteOption Fatalities Fatalities Fatalities(a)
SNF and basin sludge to KW Basin
Truck 1.5x10"4
5.1x10 "4 2.7x10'5
Rail 1.4x10"4
4.9x10 -4 2.8x10'5
SNF to KW Basin; basin sludge to double-shell tank
Truck 1.9x10"4 6.5x10"4 3.5x10"5
Rail 1.8x10"4 6.5x10⁻⁴ 3.6x10"5
SNF to KW Basin; basin sludge to Solid Waste Burial Ground
Truck 2.1x10"4 7.3x10"4
2.7x10"5
Rail 2.1x10'4 7.2x10⁻⁴ 2.7x10"5
(a) From pollutants emitted during transport.
5.11.2 Wet Storage Alternative
This alternative involves transferring all SNF at the KE and KW Basins
to a new wet storage facility located in one of two sites in the 200 East
Area. The SNF would be shipped in the same shipping system, including fuelcanisters, MCO, and shipping cask, that was used in the enhanced K Basin
alternative. The KE Basin sludge waste packages (i.e., LWHICs or SWHICs) were
discussed in Section 5.11.1. The KE Basin sludge may also be packaged in a
MCO, which was also described in Section 5.11.1.
The KE Basin SNF or basin sludge characterized as SNF would be packaged
and loaded into a shipping cask and transported by truck or rail to either the
reference site or CSB site. The shipping distances and number of shipment
required were presented in Table 5-33. The KE and KW Basins sludge would be
recovered from the basin floor, packaged, loaded into shipping casks, and
transported to a storage or disposal facility. If designated as SNF, the
basin sludge would be loaded into an MCO and transported by truck or rail to
either the reference site or the CSB site for continued storage. If desig-
nated as liquid waste, the basin sludge would be packaged in a LWHIC, trans-
ported by truck to the tank farms, and placed in a double-shell tank. If
characterized as solid waste, the basin sludge would be loaded into a SWHIC,
grouted, and transported by truck to the Solid Waste Burial Ground for
disposal.
5.50
Transportation
This alternative also includes disposition of the water and solid debris
in the basins. These materials would be handled the same as that described
for the enhanced K Basin alternative (i.e., basin water would be transported
by tanker truck to the ETF and debris would be packaged in metal boxes and
transported to the Solid Waste Burial Ground for disposal). However, this
alternative has a significant difference, because the water and debris from
both basins would be removed and dispositioned. In the enhanced K Basin stor-
age alternative, only.the.water and.debris in the KE Basin is removed because
the KW Basin would be used for continued storage of SNF (and perhaps packaged
KE Basin sludge). This difference is reflected in the shipping information
presented in Table 5-35.
Radiological Impacts
A summary of the results of the radiological impact calculations for the
new wet storage alternative, including the various suboptions, is presented in
Table 5-36.
The results presented in Table 5-36 show that, as expected, the
calculated number of worker and public LCFs increases with the distance
travelled. Because the shipments occur within the Hanford Site (i.e., away
from public population zones and public access), only impacts to onsite
individuals and the transport crew have been evaluated. The expected number,
of LCFs for all SNF handling options, for both truck and rail, is less than
6.3 x 10"7 (onsite) for an entire campaign.
Also shown in Table 5-36 are the radiological impacts from transporta-
tion accidents. The impacts to exposed onsite individuals (approximately
3,200 people along the transportation corridor) for both truck and rail are
less than 4.0 x 10⁻⁵ latent cancer fatalities for the entire campaign. The
impacts from those options that transport the basin sludge to the tank farm or
Solid Waste Burial Ground are slightly less than the impacts from the options
transporting the basin sludge to either of the sites. The impacts to MEIs are
the same as the impacts discussed for the enhanced K Basin alternative.
Nonradiological Impacts
The nonradiological impacts of the new wet storage alternative are
summarized in Table 5-37. The results presented, as with those for the
radiological doses, indicate that the expected number'of fatalities from
nonradiological impacts increase as the travel distance increases. Overall,
the expected number of fatalities from truck shipments are slightly greater
5.51
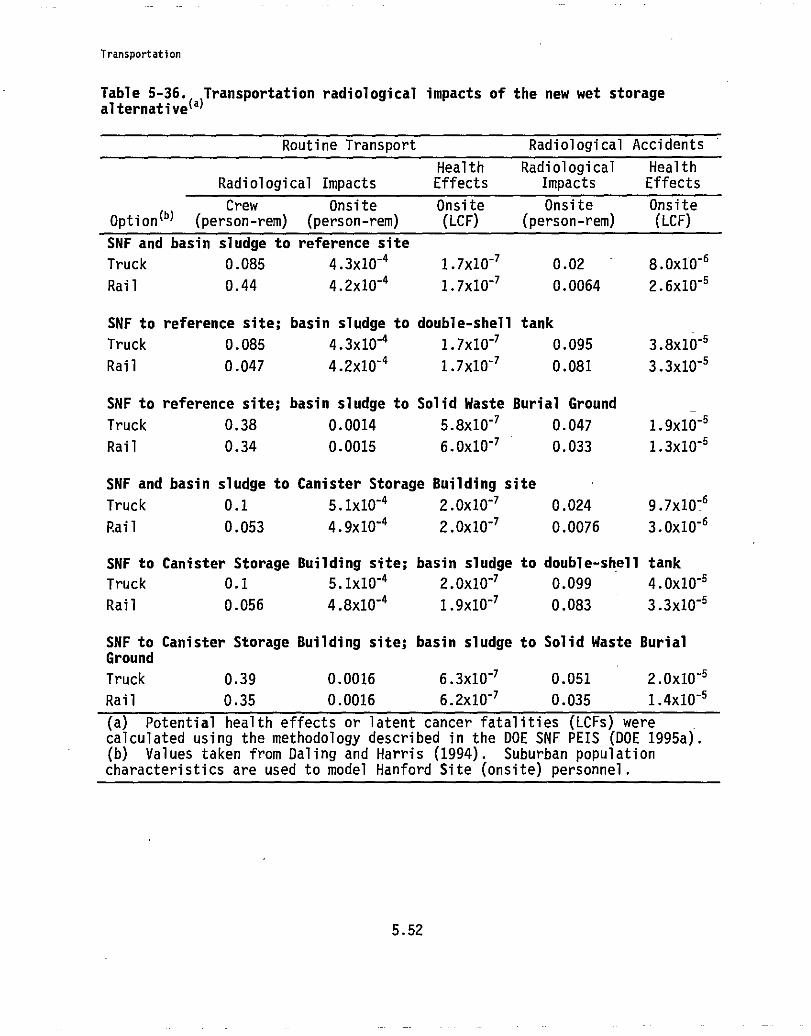
Transportation
Table 5-36. Transportation radiological impacts of the new wet storagealternative(a)
Routine Transport Radiological Accidents
Health Radiological HealthRadiological Impacts Effects Impacts Effects
Crew Onsite Onsite Onsite OnsiteOption (b) (person-rem) (person-rem) (LCF) (person-rem) (LCF)
SNF and basin sludge to reference site
Truck 0.085 4.3x10"4 1.7x10⁻⁷ 0.02 8.0x10⁻⁶
Rail 0.44 4.2x10"4 1.7x10"7 0.0064 2.6x10"5
SNF to reference site; basin sludge to double-shell tank
Truck 0.085 4.3x10"4 1.7x10⁻⁷ 0.095 3.8x10"5
Rail 0.047 4.2x10"4 1.7x10"7 0.081 3.3x10⁻⁵
SNF to reference site; basin sludge to Solid Waste Burial Ground
Truck 0.38 0.0014 5.8x10"' 0.047 1.9x10"5
Rail 0.34 0.0015 6.0x10"7 0.033 1.3x10"5
SNF and basin sludge to Canister Storage Building site
Truck 0.1 5.1x10⁻⁴ 2.0x10"7 0.024 9.7x10'6
Rail 0.053 4.9x10⁻⁴ 2.0x10"7 0.0076 3.Ox10"6
SNF to Canister Storage Building site; basin sludge to double-shell tank
Truck 0.1 5.1x10"4 2.Ox10-7 0.099 4.0x10 "5
Rail 0.056 4.8x10"4 1.9x10' 0.083 3.3x10"5
SNF to Canister Storage Building site; basin sludge to Solid Waste BurialGround
Truck 0.39 0.0016 6.3x10"7
0.051 2.0x10"5
Rail 0.35 0.0016 6.2x10"70.035 1.4x10
"5
(a) Potential health effects or latent cancer fatalities (LCFs) werecalculated using the methodology described in the DOE SNF PEIS (DOE 1995a).(b) Values taken from Daling and Harris (1994). Suburban populationcharacteristics are used to model Hanford Site (onsite) personnel.
5.52
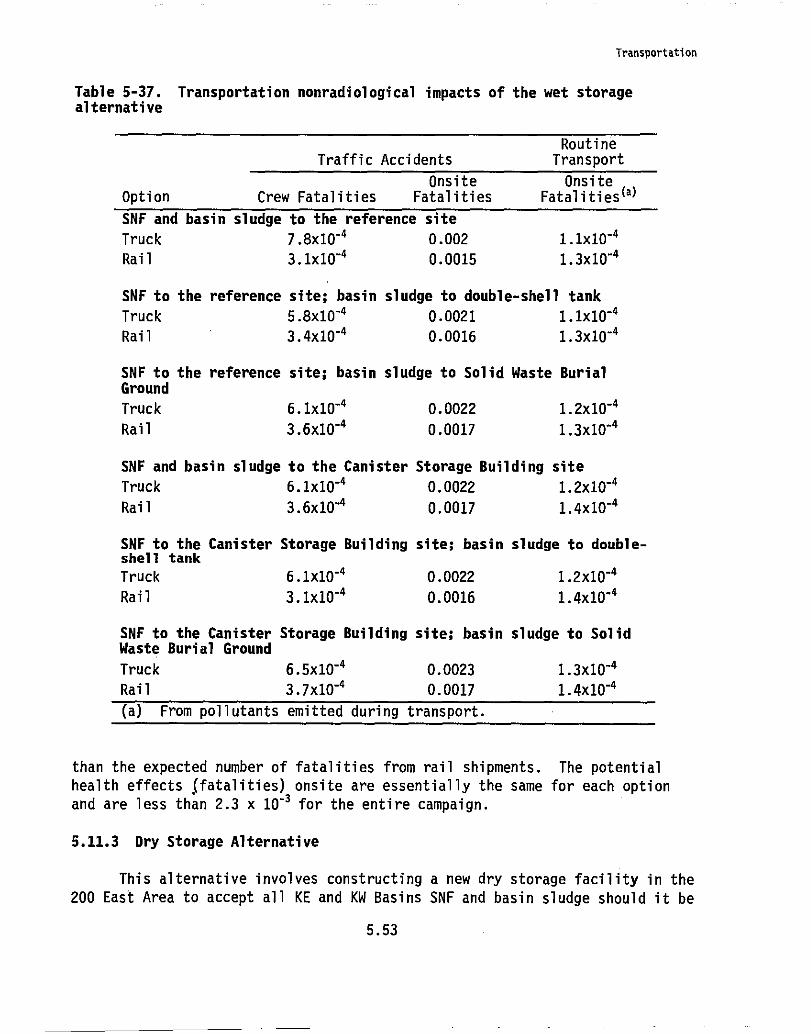
Transportation
Table 5-37. Transportation nonradiological impacts of the wet storagealternative
RoutineTraffic Accidents Transport
Onsite OnsiteOption Crew Fatalities Fatalities Fatalities(a)
SNF and basin sludge to the reference site
Truck 7.8x10"4 0.002 1.1x10'4Rail 3.1x10⁻⁴ 0.0015 1.3x10⁻⁴
SNF to the reference site; basin sludge to double-shell tank
Truck 5.8x10 -4 0.0021 1.1x10⁻⁴
Rail 3.4x10"4 0.0016 1.3x10"4
SNF to the reference site; basin sludge to Solid Waste BurialGround
Truck 6.1x10'4 0.0022 1.2x10⁻⁴Rail 3.6x10⁻⁴ 0.0017 1.3x10'4
SNF and basin sludge to the Canister Storage Building site
Truck 6.1x10'4 0.0022 1.2x10⁻⁴Rail 3.6x10'4 0.0017 1.4x10⁻⁴
SNF to the Canister Storage Building site; basin sludge to double-shell tankTruck 6.1x10'4 0.0022 1.2x10"4Rail 3.1x10"4 0.0016 1.4x10"4
SNF to the Canister Storage Building site; basin sludge to SolidWaste Burial Ground
Truck 6.5x10"4 0.0023 1.3x10"4Rail 3.7x10⁻⁴ 0.0017 1.4x10"4(a) From pollutants emitted during transport.
than the expected number of fatalities from rail shipments. The potential
health effects (fatalities) onsite are essentially the same for each option
and are less than 2.3 x 10"3 for the entire campaign.
5.11.3 Dry Storage Alternative
This alternative involves constructing a new dry storage facility in the
200 East Area to accept all KE and KW Basins SNF and basin sludge should it be
MIN
Transportation
characterized as SNF. As discussed previously, depending on the results of
characterization activities, the basin sludge could be packaged and trans-
ported to the new dry storage facility, a double-shell tank, or the Solid
Waste Burial Ground. There are four SNF and sludge handling options assoc-
iated with this alternative, as described below.
The first option, with respect to transportation, is the same as the
wet storage alternative (Section B.1.2). That is, the shipping containers,
shipping distances, and modes are the same. The differences between this
alternative and the wet storage alternative are from SNF conditioning at
the dry storage facility and are not related to transportation. The basin
sludge, water, and debris would be packaged and shipped as discussed in
Section 5.11.1.
The second option is similar to the wet storage option, except that the
canisters are perforated to allow for water drainage and gas flow; therefore,
the SNF is shipped in a damp or "dry" condition. The basin sludge, water, and
debris would be packaged and shipped as discussed previously.
The third option involves mechanically removing the sludge from the
existing fuel storage canisters, collecting the canister sludge, and packaging
the canister sludge as SNF. That is, the canister sludge would be transferred
remotely from an existing canister to an MCO. The SNF and canister sludge
would then be transported separately to the dry storage facility for further
processing or to a double-shell tank (canister sludge only). The capacity of
the MCO is 3.4 metric ton uranium (MTU) of spent fuel or 3.4 metric ton
(-7,500 lb) of canister sludge. The canister sludge would be handled as if it
were SNF. The basin sludge, water, and debris would be packaged and shippedas discussed previously.
The fourth option involves removing the SNF from the existing canisters
and repackaging the SNF into new baskets before loading the MCO. By repack-
aging the SNF into new baskets, the capacity of the MCO can be increased from
10 canisters or 3.4 MTU/MCO to 19 canisters or 6.5 MTU/MCO. This reduces the
number of MCOs required and the number of shipments from 750 to 390. The
canister sludge would be transported separately from SNF in MCOs that have acapacity of 3.4 metric tons of canister sludge. Canister sludge shipped to a
double-shell tank will be in a LWHIC (2.0 metric tons per LWHIC). The basin
sludge, water, and debris would be packaged and shipped as discussed
previously.
5.54
Transportation
Radiological Impacts
A summary of the results of the radiological impact calculations for the
new dry storage alternative, including the various suboptions, is presented in
Table 5-38.
The results presented in Table 5-38 are similar to the results presented
in Table 5-36. That is, the expected number of transport crew and onsite
fatalities caused by radiological impacts during routine transportation
increase with the distance travelled. Because the shipments occur within the
Hanford Site (i.e., away from public population zones and public access), only
impacts to onsite individuals and the transport crew have been evaluated. For
all SNF handling options, the calculated number of LCFs, for both truck and
rail, is less than 6.4 x 10⁻⁷ (onsite) for an entire campaign.
Also shown in Table 5-38 are the radiological impacts from transporta-
tion accidents. The impacts to onsite individuals (approximately 3,200 people
along the transportation corridor) for both truck and rail are less than
4.0 x 10"5 latent cancer fatalities for the entire campaign. The impacts
associated with the options that transport the basin sludge to the tank farm
or Solid Waste Burial Ground are less than the options involving transporting
the basin sludge to either of the sites. In addition, the calculated number
of worker fatalities increases slightly with the SNF repackaging options. , .
Although not shown in Tabletransportation accident were also
(for "as-is" and repackaged SNF),
location, is 2.8 rem and 5.8 rem,
MEI onsite located 750 m (2,460 f
1.9 rem, respectively.
Nonradiological Impacts
5-38, impacts or doses to MEIs from an SNFcalculated. The calculated dose to the MEI,
located 100 m (328 ft) from the accident
respectively, and the calculated dose to the
t) from the accident site is 0.9 rem and
The nonradiological impacts of dry storage are summarized in Table 5-39.
As expected, the results presented in Table 5-39, as with the radio-
logical doses, indicate that the expected number of fatalities associated with
the SNF repackaging options are less than the "as-is" SNF options. This is
because of the fewer number of shipments required to transfer the SNF, and the
basin and canister sludge. Overall, the expected number of fatalities from
truck shipments is slightly greater than the expected number of fatalities
5.55
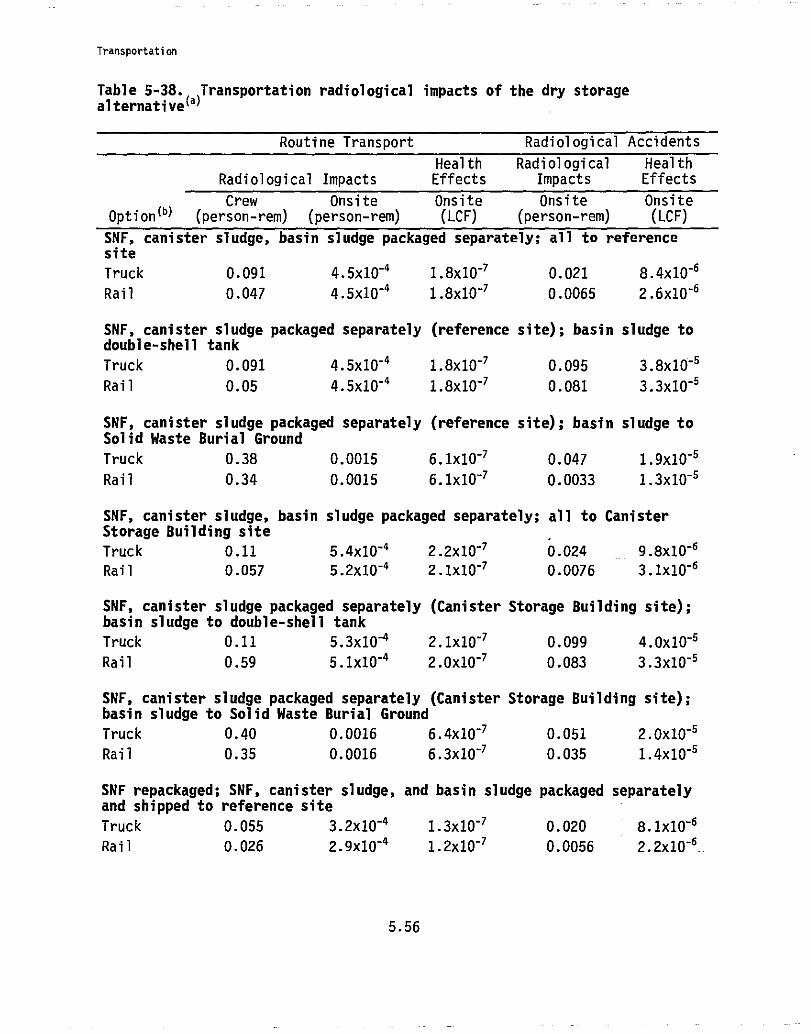
Transportation
Table 5-38. Transportation radiological impacts of the dry storagealternative(a)
Routine Transport Radiological Accidents
Health Radiological HealthRadiological Impacts Effects Impacts Effects
Crew Onsite Onsite Onsite OnsiteOption (person-rem) (person-rem) (LCF) (person-rem) (LCF)
SNF, canister sludge, basin sludge packaged separately; all to referencesite
Truck 0.091 4.5x10 "4 1.8x10-' 0.021 8.4x10'6Rail 0.047 4.5x10 "4 1.8x10-' 0.0065 2.6x10"6
SNF, canister sludge packaged separately (reference site); basin sludge todouble-shell tank
Truck 0.091 4.5x10 "4 1.8x10"I 0.095 3.8x10⁻⁵Rail 0.05 4.5x10 "4 1.8x10-' 0.081 3.3x10"5
SNF, canister sludge packaged separately (reference site); basin sludge toSolid Waste Burial Ground
Truck 0.38 0.0015 6.1x10"7 0.047 1.9x10'5Rail 0.34 0.0015 6.1x10'7 0.0033 1.3x10⁻⁵
SNF, canister sludge, basin sludge packaged separately; all to CanisterStorage Building site
Truck 0.11 5.4x10 -4 2.2x10⁻⁷ 0.024 9.8x10'6Rail 0.057 5.2x10 -4 2.1x10"7 0.0076 3.1x10"6
SNF, canister sludge packaged separately (Canister Storage Building site);basin sludge to double-shell tank
Truck 0.11 5.3x10 -4 2.1x10"' 0.099 4.0x10"5Rail 0.59 5.1x10 "4 2.Ox10
"70.083 3.3x10"5
SNF, canister sludge packaged separately (Canister Storage Building site);basin sludge to Solid Waste Burial Ground
Truck 0.40 0.0016 6.4x10"7 0.051 2.0x10⁻⁵Rail 0.35 0.0016 6.3x10"7
0.035 1.4x10"5
SNF repackaged; SNF, canister sludge, and basin sludge packaged separatelyand shipped to reference site
Truck 0.055 3.2x10"41.3x10"7
0.020 8.1x10⁻⁶Rail 0.026 2.9x10 "4 1.2x10"7
0.0056 2.2x10"6
5.56
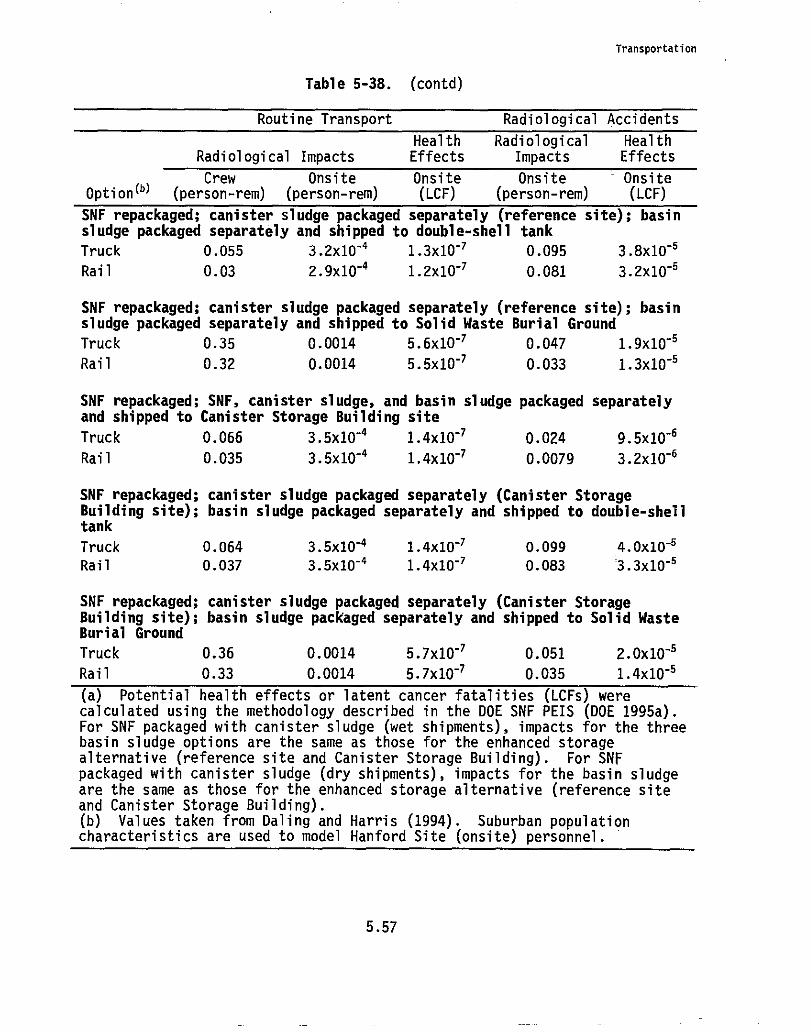
Transportation
Table 5-38. (contd)
Routine Transport Radiological Accidents
Health Radiological HealthRadiological Impacts Effects Impacts Effects
CrewOption (b)(person-rem)
SNF repackaged; canistersludge packaged separately
Truck 0.055
Rail 0.03
Onsite Onsite Onsite Onsite(person-rem) (LCF) (person-rem) (LCF)
sludge packaged separately (reference site); basin and shipped to double-shell tank
3.2x10-41.3x10"' 0.095 3.8x10"6
2.9x10"41.2x10-' 0.081 3.2x10"5
SNF repackaged; canister sludge packaged separately (reference site); basinsludge packaged separately and shipped to Solid Waste Burial Ground
Truck 0.35 0.0014 5.6x10"70.047 1.9x10⁻⁵
Rail 0.32 0.0014 5.5x10"70.033 1.3x10⁻⁵
SNF repackaged; SNF, canister sludge, and basin sludge packaged separatelyand shipped to Canister Storage Building site
Truck 0.066 3.5x10"41.4x10"' 0.024 9.5x10
"6
Rail 0.035 3.5x10"4 1.4x10"7 0.0079 3.2x10"6
SNF repackaged; canister sludge packaged separately (Canister StorageBuilding site); basin sludge packaged separately and shipped to double-shelltank
Truck 0.064 3.5x10 "4 1.4x10⁻⁷ 0.099 4.0x10⁻⁵
Rail 0.037 3.5x10 "4 1.4x10'' 0.083 3.3x10"6
SNF repackaged; canister sludge packaged separately (Canister StorageBuilding site); basin sludge packaged separately and shipped to Solid WasteBurial Ground
Truck 0.36 0.0014 5.7x10"7 0.051 2.0x10'5
Rail 0.33 0.0014 5.7x10"7 0.035 1.4x10"5
(a) Potential health effects or latent cancer fatalities (LCFs) werecalculated using the methodology described in the DOE SNF PEIS (DOE 1995a).For SNF packaged with canister sludge (wet shipments), impacts for the threebasin sludge options are the same as those for the enhanced storagealternative (reference site and Canister Storage Building). For SNFpackaged with canister sludge (dry shipments), impacts for the basin sludgeare the same as those for the enhanced storage alternative (reference siteand Canister Storage Building).(b) Values taken from Daling and Harris (1994). Suburban populationcharacteristics are used to model Hanford Site (onsite) personnel.
5.57
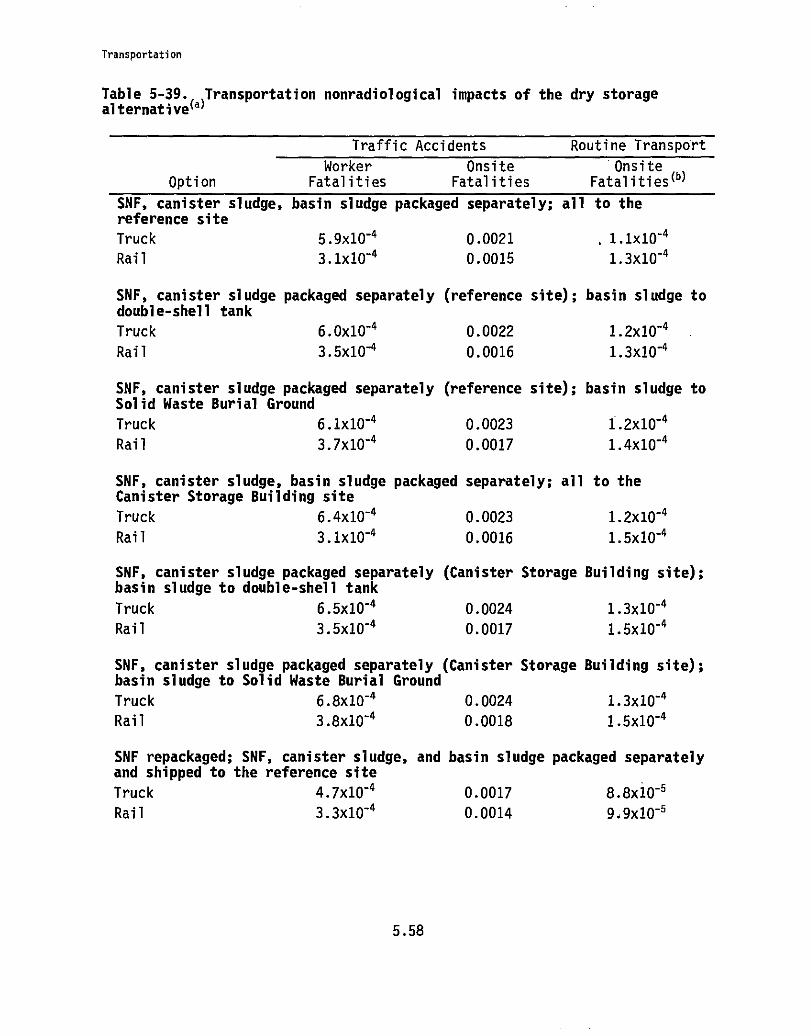
Transportation
Table 5-39. Transportation nonradiological impacts of the dry storagealternative(a)
Traffic Accidents Routine Transport
Worker Onsite IOnsiteOption Fatalities Fatalities Fatalities(b)
SNF, canister sludge, basin sludge packaged separately; all to thereference site
Truck 5.9x10"4 0.0021 1.1x10"4Rail 3.1x10"4 0.0015 1.3x10⁻⁴
SNF, canister sludge packaged separately (reference site); basin sludge todouble-shell tank
Truck 6.Ox10-4 0.0022 1.2x10⁻⁴Rail 3.5x10⁻⁴ 0.0016 1.3x10⁻⁴
SNF, canister sludge packaged separately (reference site); basin sludge toSolid Waste Burial Ground
Truck 6.1x10⁻⁴ 0.0023 1.2x10⁻⁴Rail 3.7x10⁻⁴ 0.0017 1.4x10⁻⁴
SNF, canister sludge, basin sludge packaged separately; all to theCanister Storage Building site
Truck 6.4x10"4 0.0023 1.2x10"4Rail 3.1x10'4 0.0016 1.5x10"4
SNF, canister sludge packaged separately (Canister Storage Building site);basin sludge to double-shell tank
Truck 6.5x10"4 0.0024 1.3x10⁻⁴Rail 3.5x10"4
0.0017 1.5x10⁻⁴
SNF, canister sludge packaged separately (Canister Storage Building site);basin sludge to Solid Waste Burial Ground
Truck 6.8x10⁻⁴ 0.0024 1.3x10⁻⁴Rail 3.8x10"4 0.0018 1.5x10"4
SNF repackaged; SNF, canister sludge, and basin sludge packaged separatelyand shipped to the reference site
Truck 4.7x10⁻⁴ 0.0017 8.8x10.5Rail 3.3x10⁻⁴ 0.0014 9.9x10"5
5.58
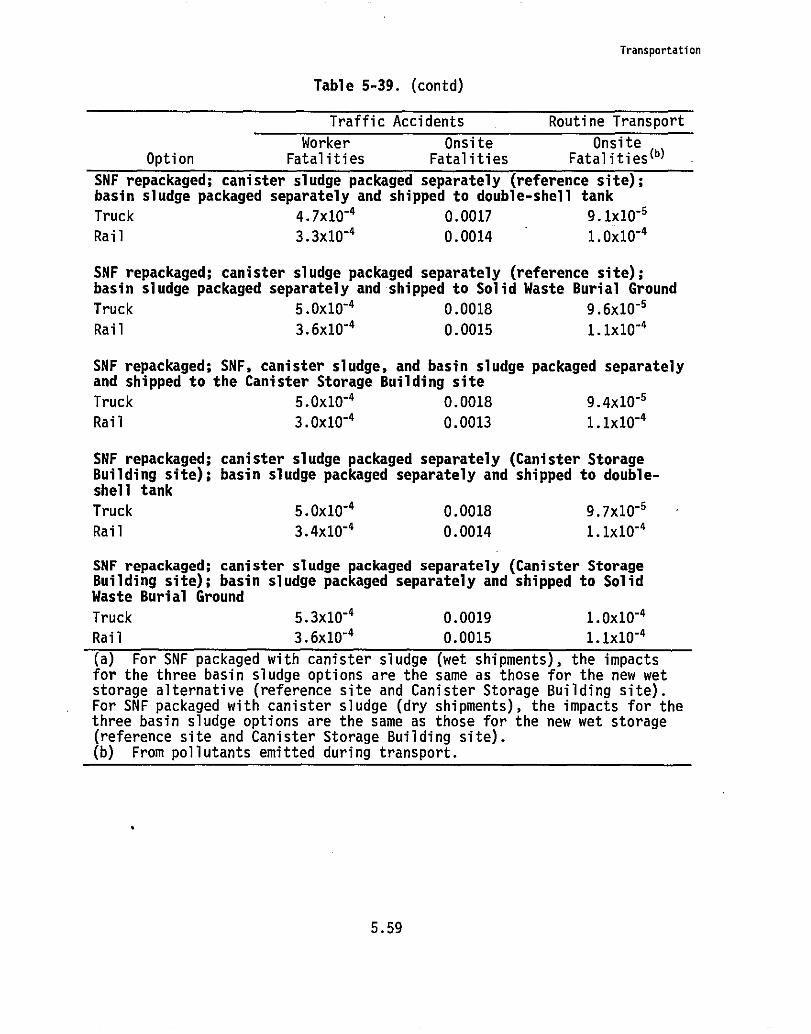
Transportation
Table 5-39. (contd)
Traffic Accidents Routine Transport
Worker Onsite OnsiteOption Fatalities Fatalities Fatalities (b)
SNF repackaged; canister sludge packaged separately (reference site);basin sludge packaged separately and shipped to double-shell tank
Truck 4.7x10"4 0.0017 9.1x10"5
Rail 3.3x10⁻⁴ 0.0014 1.0x10⁻⁴
SNF repackaged; canister sludge packaged separately (reference site);basin sludge packaged separately and shipped to Solid Waste Burial Ground
Truck 5.0x10'4 0.0018 9.6x10-'Rail 3.6x10"4 0.0015 1.1x10⁻⁴
SNF repackaged; SNF, canister sludge, and basin sludge packaged separatelyand shipped to the Canister Storage Building site
Truck 5.0x10"4 0.0018 9.4x10''Rail 3.Ox10"4 0.0013 1.1x10"4
SNF repackaged; canister sludge packaged separately (Canister StorageBuilding site); basin sludge packaged separately and shipped to double-shell tank
Truck 5.Ox10"4 0.0018 9.7x10"'Rail 3.4x10'4 0.0014 1.1x10"4
SNF repackaged; canister sludge packaged separately (Canister StorageBuilding site); basin sludge packaged separately and shipped to SolidWaste Burial Ground
Truck 5.3x10'4 0.0019 1.0x10"4Rail 3.6x10⁻⁴ 0.0015 1.1x10"4
(a) For SNF packaged with canister sludge (wet shipments), the impactsfor the three basin sludge options are the same as those for the new wetstorage alternative (reference site and Canister Storage Building site).For SNF packaged with canister sludge (dry shipments), the impacts for thethree basin sludge options are the same as those for the new wet storage(reference site and Canister Storage Building site).(b) From pollutants emitted during transport.
5.59
Transportation
from rail shipments. The potential onsite fatalities are essentially the same
for each option and transportation mode and are less than 1.5 x 10 "4 for an
entire campaign.
5.11.4 Foreign Processing Alternative
Under this alternative, the SNF currently stored in the K Basins would
be packaged for shipment to an overseas facility where it would be processed.
The analysis assumes that high-level waste arising from the process would be
returned to Hanford for interim storage, although it could potentially be
stored overseas until a domestic repository was available in which to perman-
ently dispose of it. Similarly, uranium trioxide and plutonium dioxide
resulting from the processing are assumed to be returned to Hanford for
interim storage; however, these materials could also be stored overseas
until a decision is made on their disposition by DOE.
The analyses performed (see Appendix B) evaluated various shipping
scenarios, transportation and packaging systems, radiological characteristics
of the shipments, transportation routes, and port facilities. The ports
evaluated included two potential West Coast U.S. ports (Seattle/Tacoma,
Washington, and Portland, Oregon) and one potential East Coast port (Norfolk,
Virginia) for the overland transportation analysis. The overland transpor-
tation to Seattle, Washington, would be performed using truck or rail [227 km
(172 mi) and 716 km (445 mi), respectively] and to Norfolk, Virginia, also by
truck or rail [4,585 km (2,849 mi) and 4,984 km (3,097 mi), respectively].Transport to Portland, Oregon, would be performed using a barge. At the
ports, the shipping casks would be loaded on a transoceanic ship and trans-
ported to an oversees port (e.g., U.K.).
Radiological Impacts
The radiological impact calculations for the foreign processing alter-
native are summarized in Table 5-40. The results shown in this table do not
include onsite transportation activities, including the various sludge, and
basin water and debris, handling options. However, the results shown in
Table 5-40 when compared to those of the Hanford Site alternatives are signif-
icantly higher.
As shown in Table 5-40, the radiological impacts associated with routine
truck shipments to Norfolk are higher than those for the other alternatives.
This is similar to the results of the onsite analyses (i.e., the greater the
distance travelled, the greater the impacts). The routine transportation
5.60
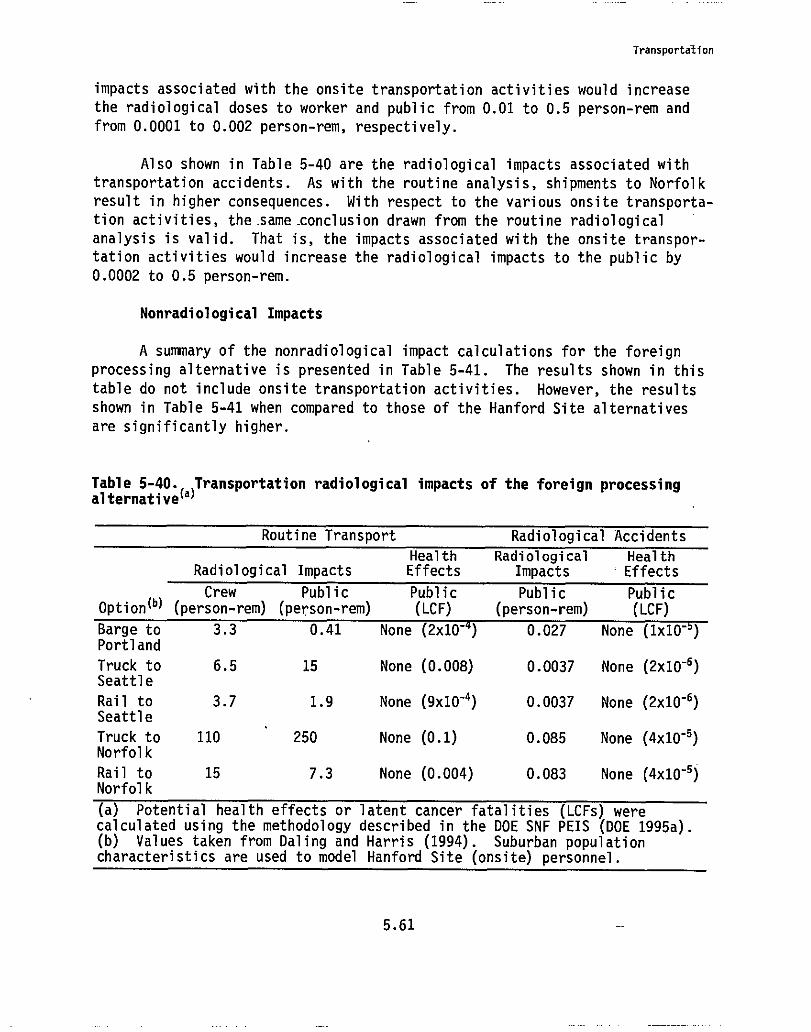
Transportation
impacts associated with the onsite transportation activities would increase
the radiological doses to worker and public from 0.01 to 0.5 person-rem and
from 0.0001 to 0.002 person-rem, respectively.
Also shown in Table 5-40 are the radiological impacts associated with
transportation accidents. As with the routine analysis, shipments to Norfolk
result in higher consequences. With respect to the various onsite transporta-
tion activities, the.same_conclusion drawn from the routine radiological
analysis is valid. That is, the impacts associated with the onsite transpor-
tation activities would increase the radiological impacts to the public by
0.0002 to 0.5 person-rem.
Nonradiological Impacts
A summary of the nonradiological impact calculations for the foreign
processing alternative is presented in Table 5-41. The results shown in this
table do not include onsite transportation activities. However, the results
shown in Table 5-41 when compared to those of the Hanford Site alternatives
are significantly higher.
Table 5-40. Transportation radiological impacts of the foreign processingalternative(a)
Routine Transport Radiological Accidents
Health Radiological HealthRadiological Impacts Effects Impacts Effects
Crew Public Public Public PublicOption (b)(person-rem) (person-rem) (LCF) (person-rem) (LCF)
Barge to 3.3 0.41 None (2x10-') 0.027 None (1x10"')Portland
Truck to 6.5 15 None (0.008) 0.0037 None (2x10"6)Seattle
Rail to 3.7 1.9 None (9x10'4) 0.0037 None (2x10"6)Seattle
Truck to 110 250 None (0.1) 0.085 None (4x10"5)Norfolk
Rail to 15 7.3 None (0.004) 0.083 None (4x10"5)Norfolk
(a) Potential health effects or latent cancer fatalities (LCFs) werecalculated using the methodology described in the DOE SNF PEIS (DOE 1995a).(b) Values taken from Daling and Harris (1994). Suburban populationcharacteristics are used to model Hanford Site (onsite) personnel.
5.61
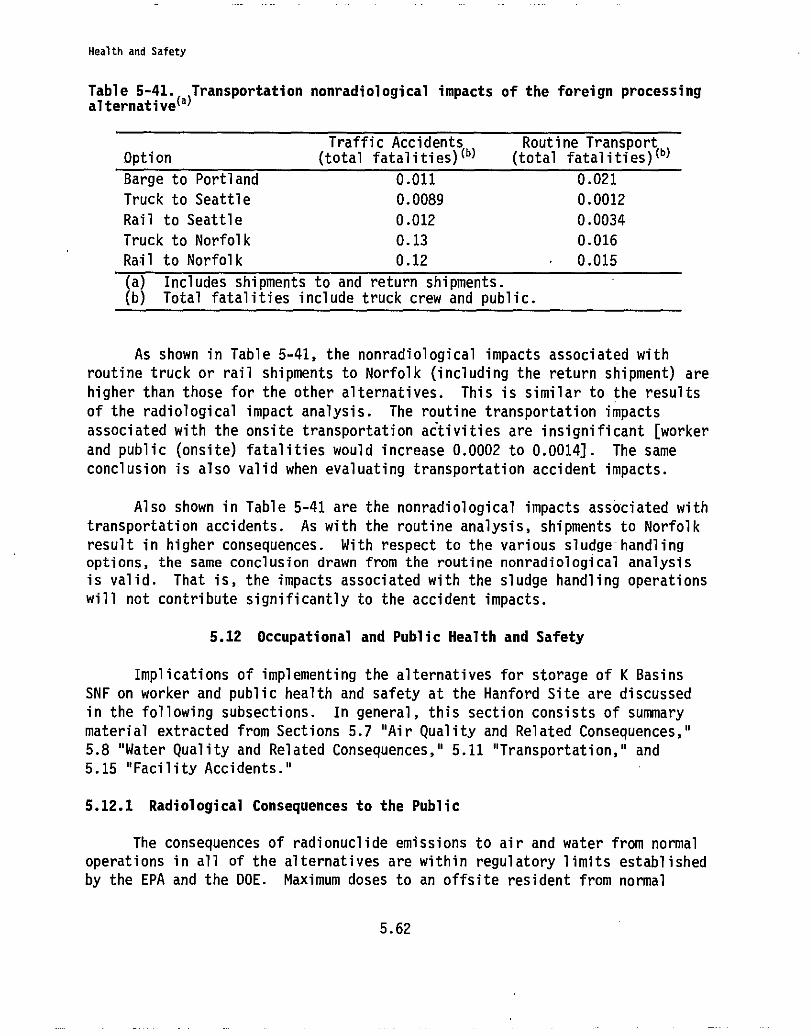
Health and Safety
Table 5-41. Transportation nonradiological impacts of the foreign processingalternative(a)
Traffic Accidents Routine TransportOption (total fatalities) (b) (total fatalities) (b)
Barge to Portland 0.011 0.021
Truck to Seattle 0.0089 0.0012
Rail to Seattle 0.012 0.0034
Truck to Norfolk 0.13 0.016
Rail to Norfolk 0.12 0.015
(a) Includes shipments to and return shipments.(b) Total fatalities include truck crew and public.
As shown in Table 5-41, the nonradiological impacts associated with
routine truck or rail shipments to Norfolk (including the return shipment) are
higher than those for the other alternatives. This is similar to the results
of the radiological impact analysis. The routine transportation impacts
associated with the onsite transportation activities are insignificant [worker
and public (onsite) fatalities would increase 0.0002 to 0.0014]. The same
conclusion is also valid when evaluating transportation accident impacts.
Also shown in Table 5-41 are the nonradiological impacts associated with
transportation accidents. As with the routine analysis, shipments to Norfolk
result in higher consequences. With respect to the various sludge-handlingoptions, the same conclusion drawn from the routine nonradiological analysis
is valid. That is, the impacts associated with the sludge handling operations
will not contribute significantly to the accident impacts.
5.12 Occupational and Public Health and Safety
Implications of implementing the alternatives for storage of K Basins
SNF on worker and public health and safety at the Hanford Site are discussed
in the following subsections. In general, this section consists of summary
material extracted from Sections 5.7 "Air Quality and Related Consequences,"
5.8 "Water Quality and Related Consequences," 5.11 "Transportation," and
5.15 "Facility Accidents."
5.12.1 Radiological Consequences to the Public
The consequences of radionuclide emissions to air and water from normal
operations in all of the alternatives are within regulatory limits established
by the EPA and the DOE. Maximum doses to an offsite resident from normal
5.62
Health and Safety
facility operation ranged from 2 x 10"7 to 8 x 10 "4 rem/year, and collective
doses to the population within 80 km (50 mi) were estimated to be 0.005 to
30 person-rem/year for the no action and calcination (or onsite processing)
alternatives, respectively.
Exposures to the public during transportation would not occur except
under the foreign processing alternative, where the collective doses were
estimated to be 0.4 to 260 person-rem for shipments to representative ports on
the west and east coast, respectively. The dose to transportation and port
workers directly involved in handling the offsite SNF shipments would be
expected to amount to an additional 2 to 37 person-rem over the course of the
entire shipping campaign. No health consequences to the public would be
expected as a result of activities associated with any alternative (see
Sections 5.7, 5.8, and 5.11).
Accidental releases of radionuclides during transportation or facility
operation have the potential to result in human health effects if they occur
(see Sections 5.11 and 5.15). However, the operations and processes that are
ultimately selected for management of K Basins SNF would be evaluated in a
detailed safety analysis before they were implemented to ensure that the risks
were acceptable, based on the potential consequences and expected frequencies
of reasonably foreseeable accidents (see Section 5.20).
5.12.2 Radiological Consequences to Workers
Workers may be subject to routine radiation exposure from many of the
operations within the SNF management facilities evaluated in this EIS. The
radiation exposure of each operations worker is administratively controlled to
no more than 2 rem/year with a worker monitoring program that provides hold
points starting at a cumulative exposure to any worker of 0.5 rem. Such con-
trols assure that under normal operating conditions individual workers will
not be exposed to levels approaching the DOE limit of 5 rem/year as prescribed
in 10 CFR 835. Radiological exposures to workers during facility operations
are summarized in Table 5-42 for all of the alternatives considered in this
EIS. Operation of a new process facility results in the highest exposures;
however, cumulative exposures for all of the alternatives are similar and
range from about 900 to 1,500 person-rem over the entire storage period. Expo-
sure at this level might result in at most one latent cancer fatality within
the exposed worker population. Dose reduction measures (see Section 5.20)
could decrease these exposures to workers under all of the alternatives if
they are implemented.
5.63
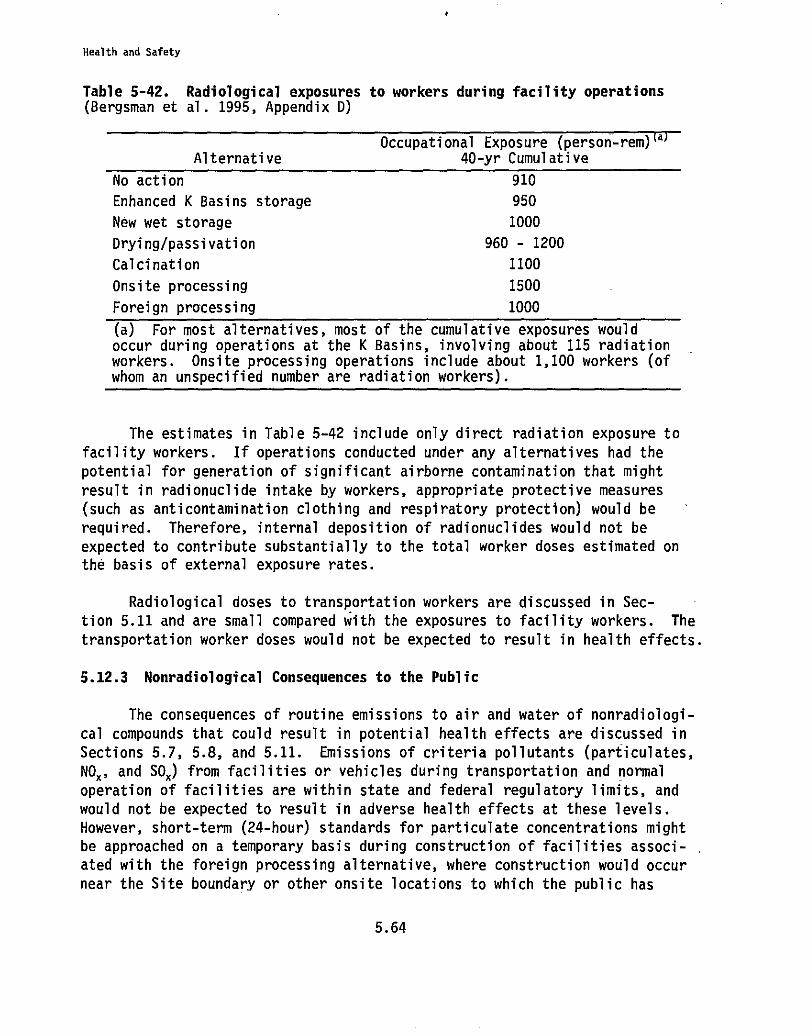
Health and Safety
Table 5-42. Radiological exposures to workers during facility operations(Bergsman et al. 1995, Appendix D)
Occupational Exposure (person-rem)'"Alternative 40-yr Cumulative
No action 910
Enhanced K Basins storage 950
New wet storage 1000
Drying/passivation 960 - 1200
Calcination 1100
Onsite processing 1500
Foreign processing 1000
(a) For most alternatives, most of the cumulative exposures wouldoccur during operations at the K Basins, involving about 115 radiationworkers. Onsite processing operations include about 1,100 workers (ofwhom an unspecified number are radiation workers).
The estimates in Table 5-42 include only direct radiation exposure to
facility workers. If operations conducted under any alternatives had the
potential for generation of significant airborne contamination that might
result in radionuclide intake by workers, appropriate protective measures
(such as anticontamination clothing and respiratory protection) would be
required. Therefore, internal deposition of radionuclides would not be
expected to contribute substantially to the total worker doses estimated on
the basis of external exposure rates.
Radiological doses to transportation workers are discussed in Sec-
tion 5.11 and are small compared with the exposures to facility workers. The
transportation worker doses would not be expected to result in health effects.
5.12.3 Nonradiological Consequences to the Public
The consequences of routine emissions to air and water of nonradiologi-
cal compounds that could result in potential health effects are discussed in
Sections 5.7, 5.8, and 5.11. Emissions of criteria pollutants (particulates,
NOX , and SOX) from facilities or vehicles during transportation and normal
operation of facilities are within state and federal regulatory limits, and
would not be expected to result in adverse health effects at these levels.
However, short-term (24-hour) standards for particulate concentrations might
be approached on a temporary basis during construction of facilities associ-
ated with the foreign processing alternative, where construction would occur
near the Site boundary or other onsite locations to which the public has
5.64
Site Services
access. Fugitive dust emissions during construction could be controlled by
standard dust suppression methods and would not be expected to affect the
regional air quality on a continuing basis. Emissions of other potentially
hazardous materials to air are not expected as a result of any alternatives in
this EIS, and routine discharges of regulated compounds in liquid wastes to
land disposal facilities would be limited to permitted concentrations.
Accidents involving releases of hazardous or toxic material from facili-
ties are evaluated in Section 5.15 and could result in adverse health effects
if such accidents were to occur. Because the accident assessment uses hypo-
thetical, nonspecific release scenarios based on facility inventory, the esti-
mated frequency and the resulting risk from these accidents cannot be assessed
directly. However, the frequencies of the types of accidents that could
result in substantial releases to the environment are typically low enough
that they would not be expected to occur during the operations considered in
this EIS.
5.12.4 Nonradiological Consequences to Workers
Health effects and fatalities from traffic or industrial accidents are
discussed in Sections 5.11 and 5.15, respectively. Facility operation and
construction would be expected to contribute up to several hundred injuries
and illnesses over the 40-year period evaluated for this EIS. Traffic acci-
dents, and accidents during facility construction and operation, might result
in at most one fatality over the same period of time.
5.13 Site Services
This section discusses the utilities and energy usage resulting from
implementation of the various alternatives. The existing consumption rates
for electricity, coal, natural gas, propane, and other utilities are shown in
Table 4-5.
Implementation of the alternatives would have incremental impacts on
existing utilities and energy resources. Most of the alternatives would
require an extension or upgrade of utilities to the project site. However,
adequate power exists on the Hanford Site. Energy consumption rates are taken
from Bergsman et al. (1995) and are discussed in the following subsections for
each alternative.
5.65
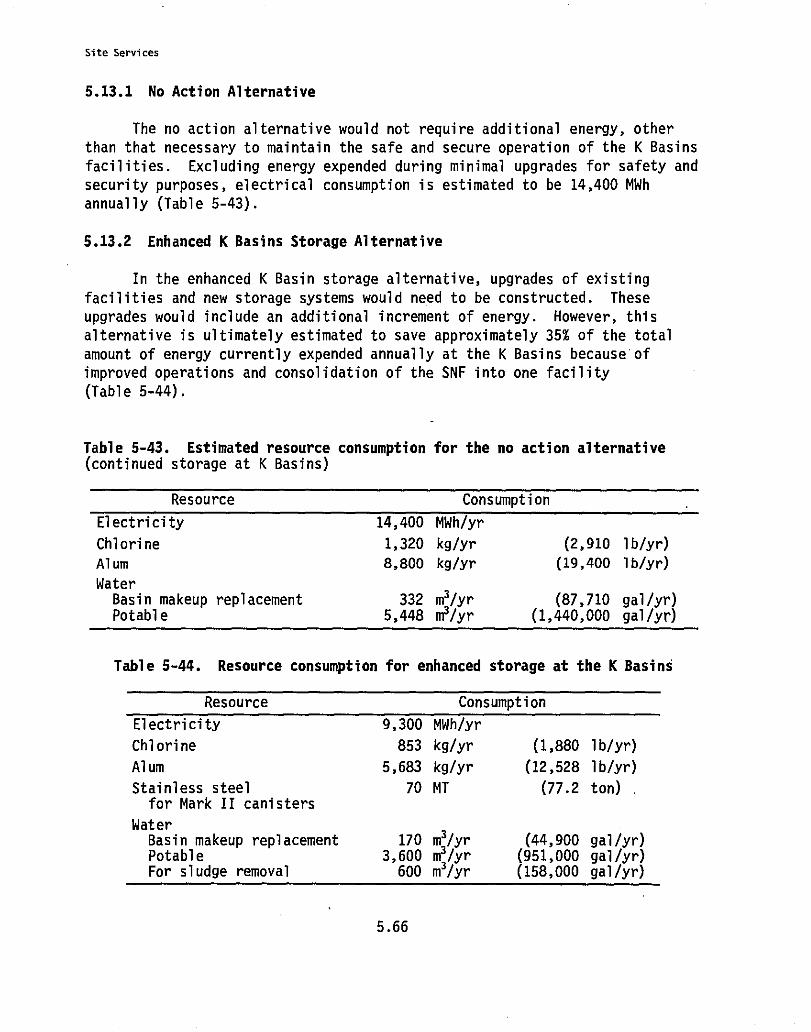
Site Services
5.13.1 No Action Alternative
The no action alternative would not require additional energy, other
than that necessary to maintain the safe and secure operation of the K Basins
facilities. Excluding energy expended during minimal upgrades for safety and
security purposes, electrical consumption is estimated to be 14,400 MWh
annually (Table 5-43).
5.13.2 Enhanced K Basins Storage Alternative
In the enhanced K Basin storage alternative, upgrades of existing
facilities and new storage systems would need to be constructed. These
upgrades would include an additional increment of energy. However, this
alternative is ultimately estimated to save approximately 35% of the total
amount of energy currently expended annually at the K Basins because of
improved operations and consolidation of the SNF into one facility
(Table 5-44).
Table 5-43. Estimated resource consumption for the no action alternative(continued storage at K Basins)
Resource Consumption
Electricity 14,400 MWh/yr
Chlorine 1,320 kg/yr (2,910 lb/yr)
Alum 8,800 kg/yr (19,400 lb/yr)
WaterBasin makeup replacement 332 m3/yr (87,710 gal/yr)Potable 5,448 m3/yr (1,440,000 gal/yr)
Table 5-44. Resource consumption for enhanced storage at the K Basins
Resource Consumption
Electricity 9,300 MWh/yr
Chlorine 853 kg/yr (1,880 lb/yr)
Alum 5,683 kg/yr (12,528 lb/yr)
Stainless steel 70 MT (77.2 ton)for Mark II canisters
WaterBasin makeup replacement 170 m3/yr (44,900 gal/yr)Potable 3,600 m3/yr (951,000 gal/yr)For sludge removal 600 m3/yr (158,000 gal/yr)
5.66
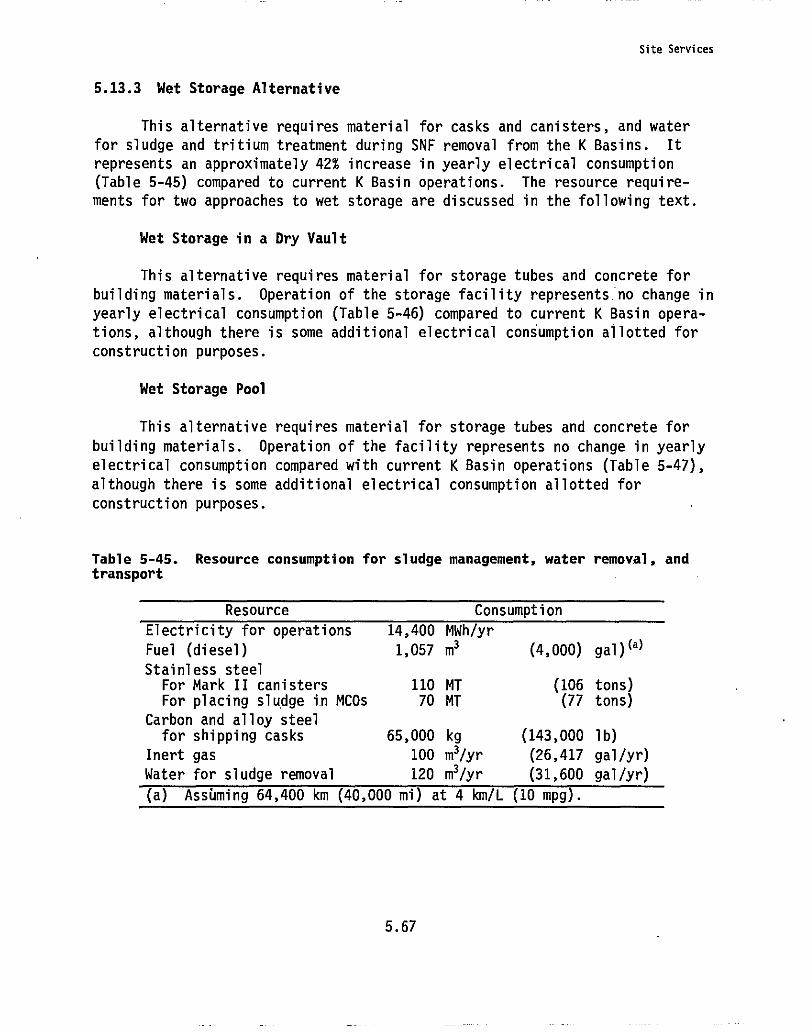
Site Services
5.13.3 Wet Storage Alternative
This alternative requires material for casks and canisters, and water
for sludge and tritium treatment during SNF removal from the K Basins. It
represents an approximately 42% increase in yearly electrical consumption
(Table 5-45) compared to current K Basin operations. The resource require-
ments for two approaches to wet storage are discussed in the following text.
Wet Storage in a Dry Vault
This alternative requires material for storage tubes and concrete for
building materials. Operation of the storage facility represents.no change in
yearly electrical consumption (Table 5-46) compared to current K Basin opera-
tions, although there is some additional electrical consumption allotted for
construction purposes.
Wet Storage Pool
This alternative requires material for storage tubes and concrete for
building materials. Operation of the facility represents no change in yearly
electrical consumption compared with current K Basin operations (Table 5-47),
although there is some additional electrical consumption allotted for
construction purposes.
Table 5-45. Resource consumption for sludge management, water removal, andtransport
Resource Consumption
Electricity for operations 14,400 MWh/yr
Fuel (diesel) 1,057 m3 (4,000) gal )(a)
Stainless steelFor Mark II canisters 110 MT (106 tons)For placing sludge in MCOs 70 MT (77 tons)
Carbon and alloy steelfor shipping casks 65,000 kg (143,000 lb)
Inert gas 100 m3/yr (26,417 gal/yr)
Water for sludge removal 120 m3/yr (31,600 gal/yr)
(a) Assbming 64,400 km (40,000 mi) at 4 km/L (10 mpg).
5.67
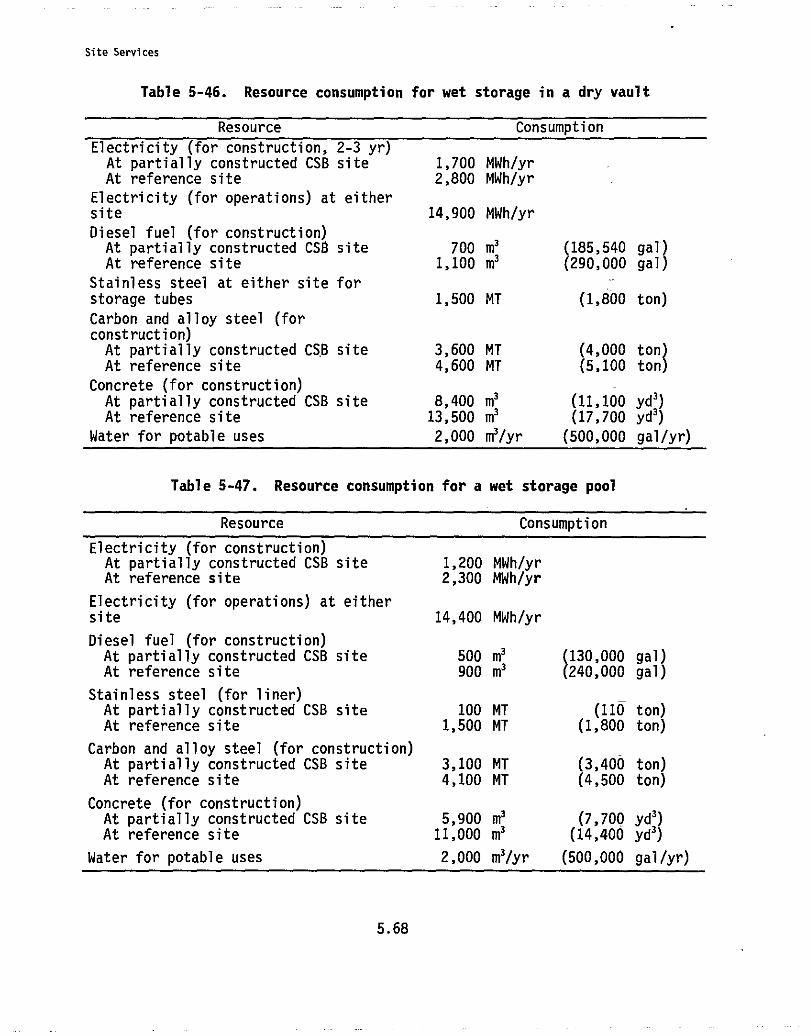
Site Services
Table 5-46. Resource consumption for wet storage in a dry vault
Resource Consumption
Electricity (for construction, 2-3 yr)At partially constructed CSB site 1,700 MWh/yrAt reference site 2,800 MWh/yr
Electricity (for operations) at eithersite 14,900 MWh/yr
Diesel fuel (for construction)At partially constructed CSB site 700 m3 (185,540 gal)At reference site 1,100 m3 (290,000 gal)
Stainless steel at either site forstorage tubes 1,500 MT (1,800 ton)
Carbon and alloy steel (forconstruction)At partially constructed CSB site 3,600 MT (4,000 ton)At reference site 4,600 MT (5,100 ton)
Concrete (for construction) -At partially constructed CSB site 8,400 m' (11,100 yd3)At reference site 13,500 m' (17,700 yd')
Water for potable uses 2,000 m3/yr (500,000 gal/yr)
Table 5-47. Resource consumption for a wet storage pool
Resource Consumption
Electricity (for construction)At partially constructed CSB site 1,200 MWh/yrAt reference site 2,300 MWh/yr
Electricity (for operations) at eithersite 14,400 MWh/yr
Diesel fuel (for construction)At partially constructed CSB site 500 m3 (130,000 gal)At reference site 900 m3 (240,000 gal)
Stainless steel (for liner)At partially constructed CSB site 100 MT (110 ton)At reference site 1,500 MT (1,800 ton)
Carbon and alloy steel (for construction)At partially constructed CSB site 3,100 MT (3,400 ton)At reference site 4,100 MT (4,500 ton)
Concrete (for construction)At partially constructed CSB site 5,900 m' (7,700 yd')At reference site 11,000 m3 (14,400 yd 3)
Water for potable uses 2,000 m3/yr (500,000 gal/yr)
5.68
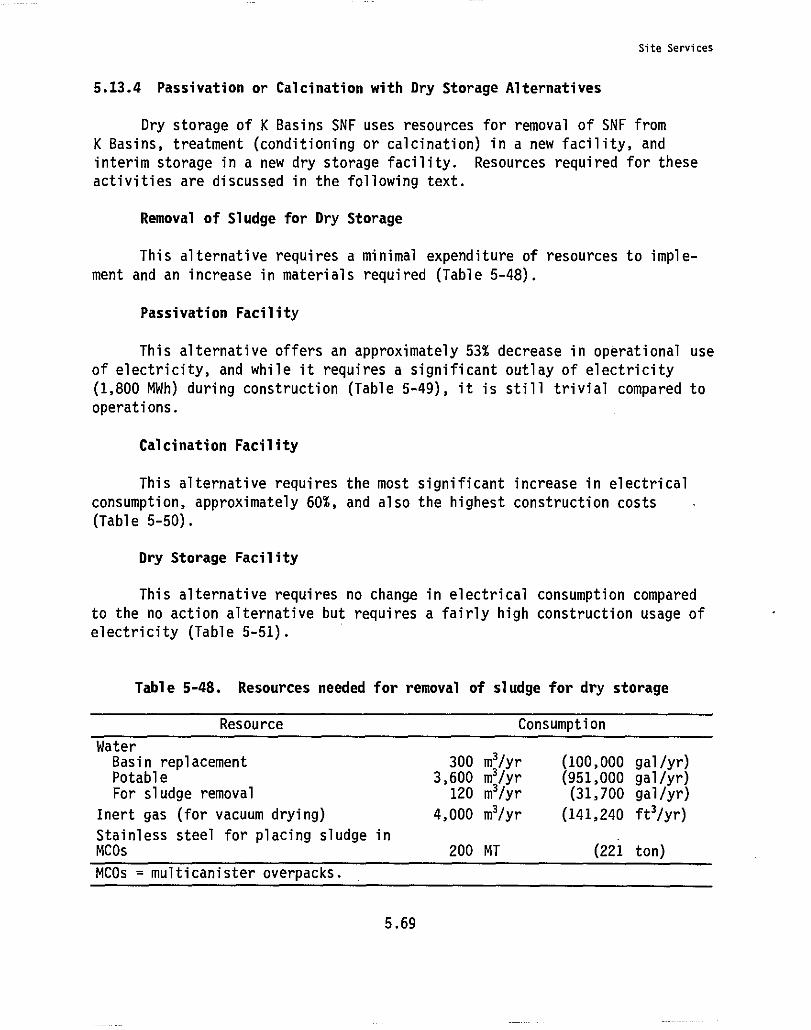
Site Services
5.13.4 Passivation or Calcination with Dry Storage Alternatives
Dry storage of K Basins SNF uses resources for removal of SNF from
K Basins, treatment (conditioning or calcination) in a new facility, and
interim storage in a new dry storage facility. Resources required for these
activities are discussed in the following text.
Removal of Sludge for Dry Storage
This alternative requires a minimal expenditure of resources to imple-
ment and an increase in materials required (Table 5-48).
Passivation Facility
This alternative offers an approximately 53% decrease in operational use
of electricity, and while it requires a significant outlay of electricity
(1,800 MWh) during construction (Table 5-49), it is still trivial compared to
operations.
Calcination Facility
This alternative requires the most significant increase in electrical
consumption, approximately 60%, and also the highest construction costs
(Table 5-50).
Dry Storage Facility
This alternative requires no change in electrical consumption compared
to the no action alternative but requires a fairly high construction usage of
electricity (Table 5-51).
Table 5-48. Resources needed for removal of sludge for dry storage
Resource Consumption
WaterBasin replacement 300 m3/yr (100,000 gal/yr)Potable 3,600 m3/yr (951,000 gal/yr)For sludge removal 120 m3/yr (31,700 gal/yr)
Inert gas (for vacuum drying) 4,000 m3/yr (141,240 ft3/yr)
Stainless steel for placing sludge inMCOs 200 MT (221 ton)
MCOs = multicanister overpacks.
5.69
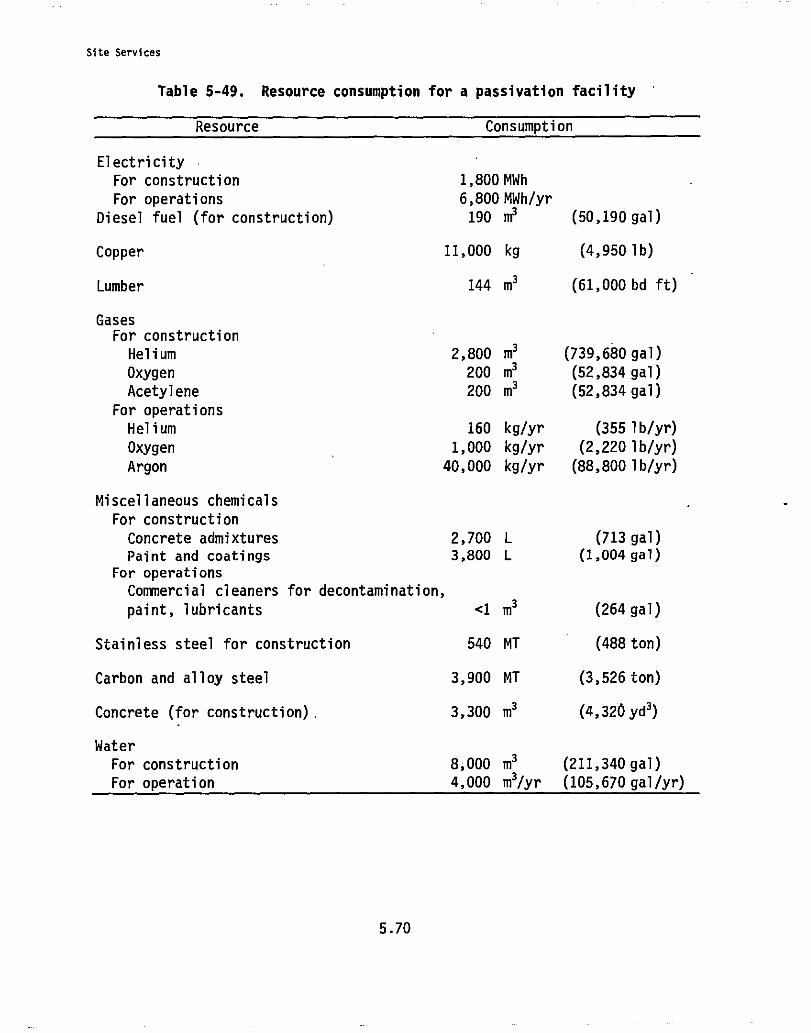
Site Services
Table 5-49. Resource consumption for a passivation facility
Resource Consumption
Electricity
For construction 1,800 MWh
For operations 6,800 MWh/yr
Diesel fuel (for construction) 190 m3(50,190 gal)
Copper 11,000 kg (4,950 lb)
Lumber 144 m3 (61,000 bd ft)
GasesFor construction
Helium 2,800 m3 (739,680 gal)
Oxygen 200 m3 (52,834 gal)
Acetylene 200 m3 (52,834 gal)
For operations
Helium 160 kg/yr (355 lb/yr)
Oxygen 1,000 kg/yr (2,220 lb/yr)
Argon 40,000 kg/yr (88,800 lb/yr)
Miscellaneous chemicals
For construction
Concrete admixtures 2,700 L (713 gal)
Paint and coatings 3,800 L (1,004 gal)
For operations
Commercial cleaners for decontamination,
paint, lubricants <1 m3 (264 gal)
Stainless steel for construction 540 MT (488 ton)
Carbon and alloy steel 3,900 MT (3,526 ton)
Concrete (for construction), 3,300 m3 (4,320 yd 3)
Water
For construction 8,000 m3(211,340 gal)For operation 4,000 m3/yr (105,670 gal/yr)
5.70
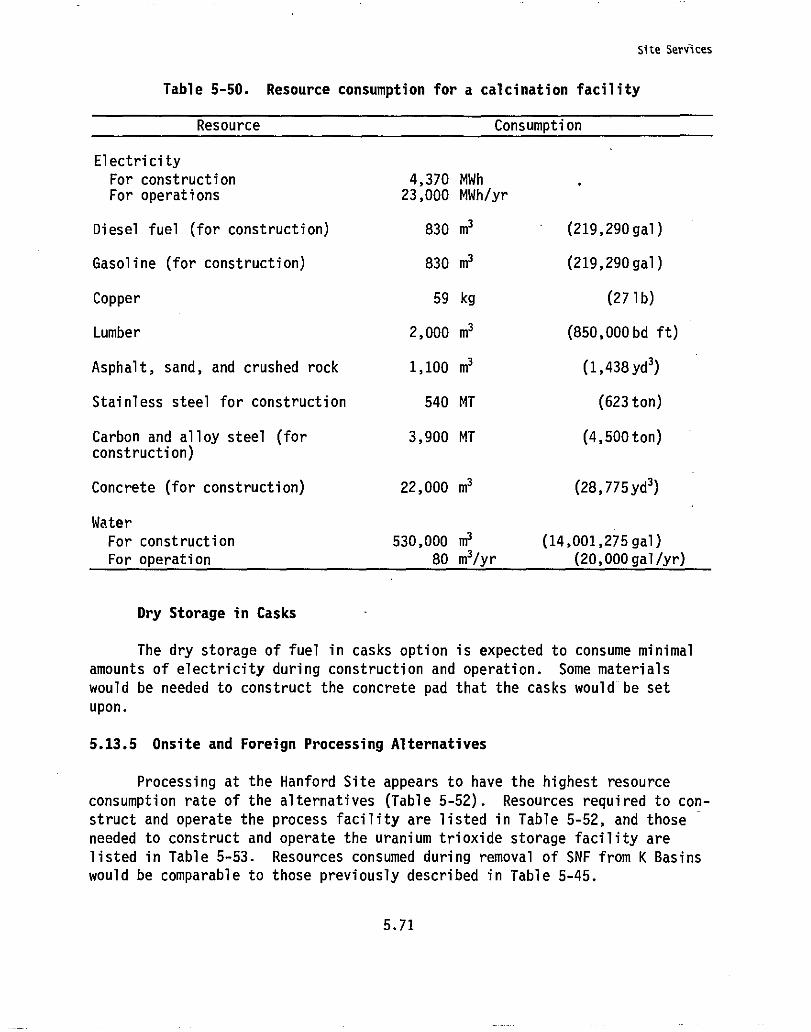
Site Services
Table 5-50. Resource consumption for a calcination facility
Resource Consumption
Electricity
For construction 4,370 MWhFor operations 23,000 MWh/yr
Diesel fuel (for construction) 830 m3 (219,290 gal)
Gasoline (for construction) 830 m3 (219,290 gal)
Copper 59 kg (271 b)
Lumber 2,000 m3 (850,000bd ft)
Asphalt, sand, and crushed rock 1,100 m3 (1,438 yd')
Stainless steel for construction 540 MT (623 ton)
Carbon and alloy steel (for 3,900 MT (4,500 ton)construction)
Concrete (for construction) 22,000 m3 (28,775yd3)
Water
For construction 530,000 m3(14,001,275 gal)
For operation 80 m3/yr (20,000 gal/yr)
Dry Storage in Casks
The dry storage of fuel in casks option is expected to consume minimal
amounts of electricity during construction and operation. Some materials
would be needed to construct the concrete pad that the casks would be set
upon.
5.13.5 Onsite and Foreign Processing Alternatives
Processing at the Hanford Site appears to have the highest resource
consumption rate of the alternatives (Table 5-52). Resources required to con-
struct and operate the process facility are listed in Table 5-52, and those
needed to construct and operate the uranium trioxide storage facility are
listed in Table 5-53. Resources consumed during removal of SNF from K Basins
would be comparable to those previously described in Table 5-45.
5.71
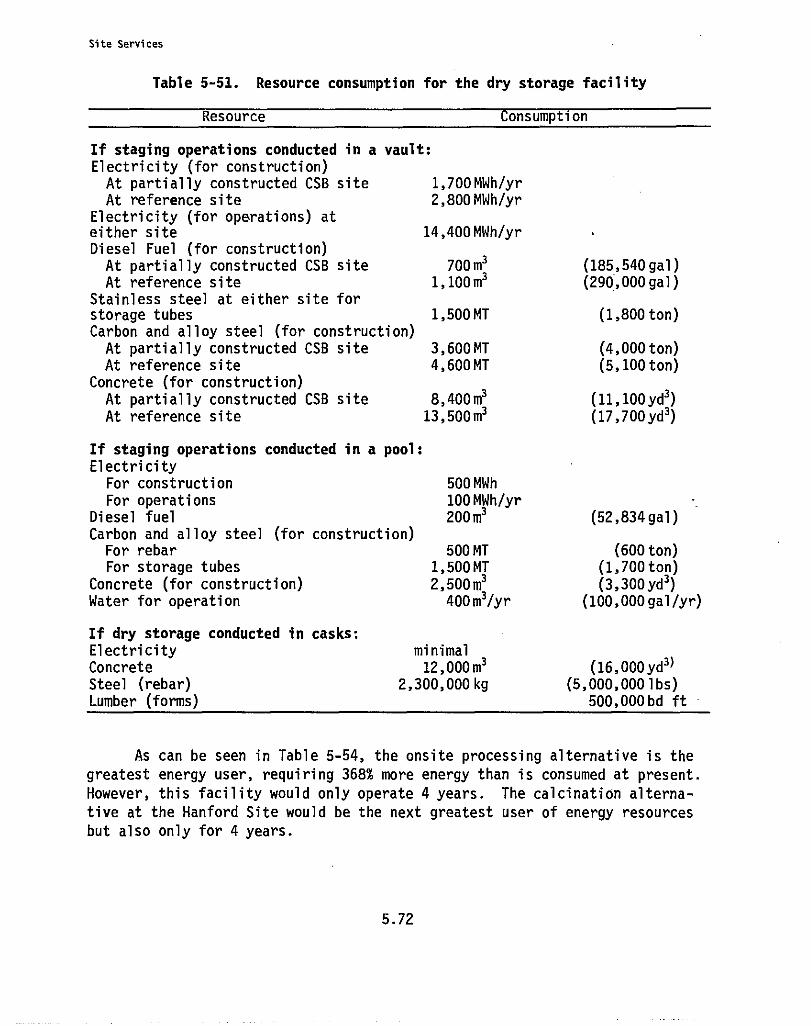
Site Services
Table 5-51. Resource consumption for the dry storage facility
Resource Consumption
If staging operations conducted in a vault:Electricity (for construction)At partially constructed CSB site 1,700 MWh/yrAt reference site 2,800 MWh/yr
Electricity (for operations) ateither site 14,400 MWh/yrDiesel Fuel (for construction)At partially constructed CSB site 700 in (185,540 gal)At reference site 1, 100 m3 (290,000 gal)
Stainless steel at either site forstorage tubes 1,500 MT (1,800 ton)Carbon and alloy steel (for construction)At partially constructed CSB site 3,600 MT (4,000 ton)At reference site 4,600MT (5,100 ton)
Concrete (for construction)At partially constructed CSB site 8,400m3 (11,100yd3)At reference site 13,500m3 (17,700yd3)
If staging operations conducted in a pool:Electricity
For construction 500 MWhFor operations 100 MWh/yr
Diesel fuel 200 m3 (52,834 gal)Carbon and alloy steel (for construction)
For rebar 500 MT (600 ton)For storage tubes 1,500 MT (1, 700 ton)
Concrete (for construction) 2,500m3 (3,300yd3)Water for operation 400 m3/yr (100,000 gal/yr)
If dry storage conducted in casks:Electricity minimalConcrete 12,000 m3(16,000 yd')Steel (rebar) 2,300,000 kg (5, 000,0001bs)Lumber (forms) 500,000 bd ft
As can be seen in Table 5-54, the onsite processing alternative is the
greatest energy user, requiring 368% more energy than is consumed at present.
However, this facility would only operate 4 years. The calcination alterna-
tive at the Hanford Site would be the next greatest user of energy resources
but also only for 4 years.
5.72
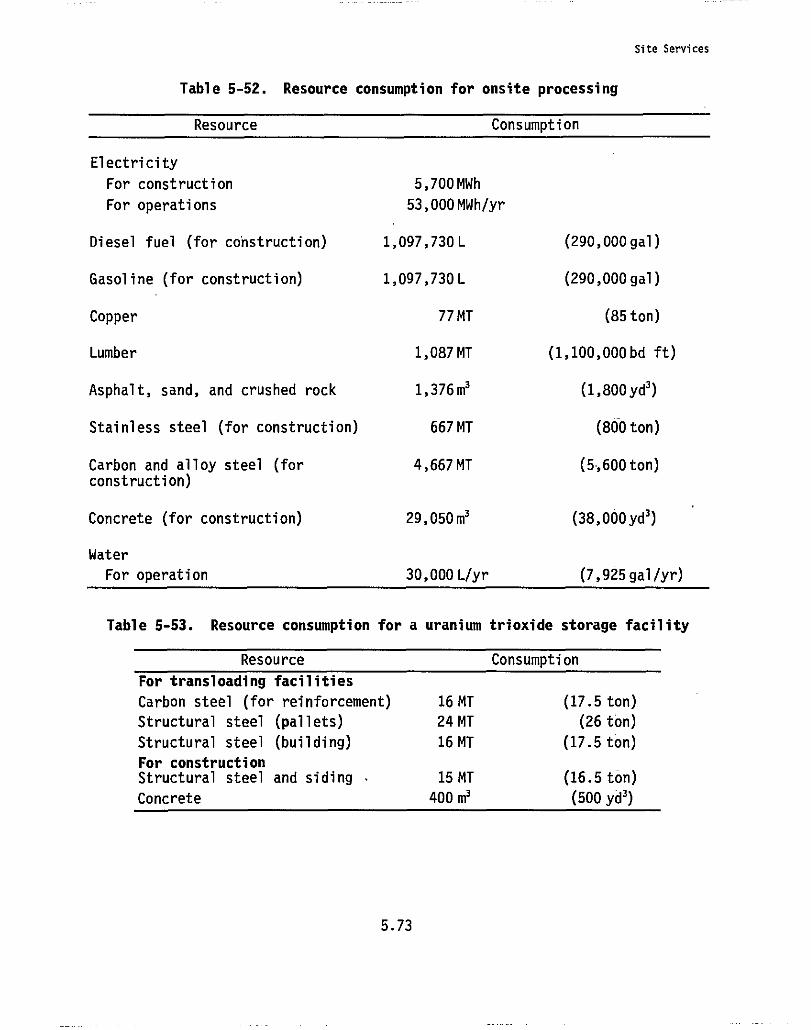
Site Services
Table 5-52. Resource consumption for onsite processing
Resource Consumption
Electricity
For construction 5,700MWh
For operations 53,000 MWh/yr
Diesel fuel (for construction) 1,097,730 L (290,000 gal)
Gasoline (for construction) 1,097,730 L (290,000 gal)
Copper 77 MT (85 ton)
Lumber 1,087 MT (1,100,000bd ft)
Asphalt, sand, and crushed rock 1,376 m' (1, 800yd3)
Stainless steel (for construction) 667 MT (800 ton)
Carbon and alloy steel (for 4,667 MT (5,600 ton)construction)
Concrete (for construction) 29,050m' (38,000 yd 3)
Water
For operation 30,000 L/yr (7,925 gal/yr)
Table 5-53. Resource consumption for a uranium trioxide storage facility
Resource Consumption
For transloading facilities
Carbon steel (for reinforcement) 16 MT (17.5 ton)
Structural steel (pallets) 24 MT (26 ton)
Structural steel (building) 16 MT (17.5 ton)
For constructionStructural steel and siding 15 MT (16.5 ton)
Concrete 400 m' (500 yd')
5.73
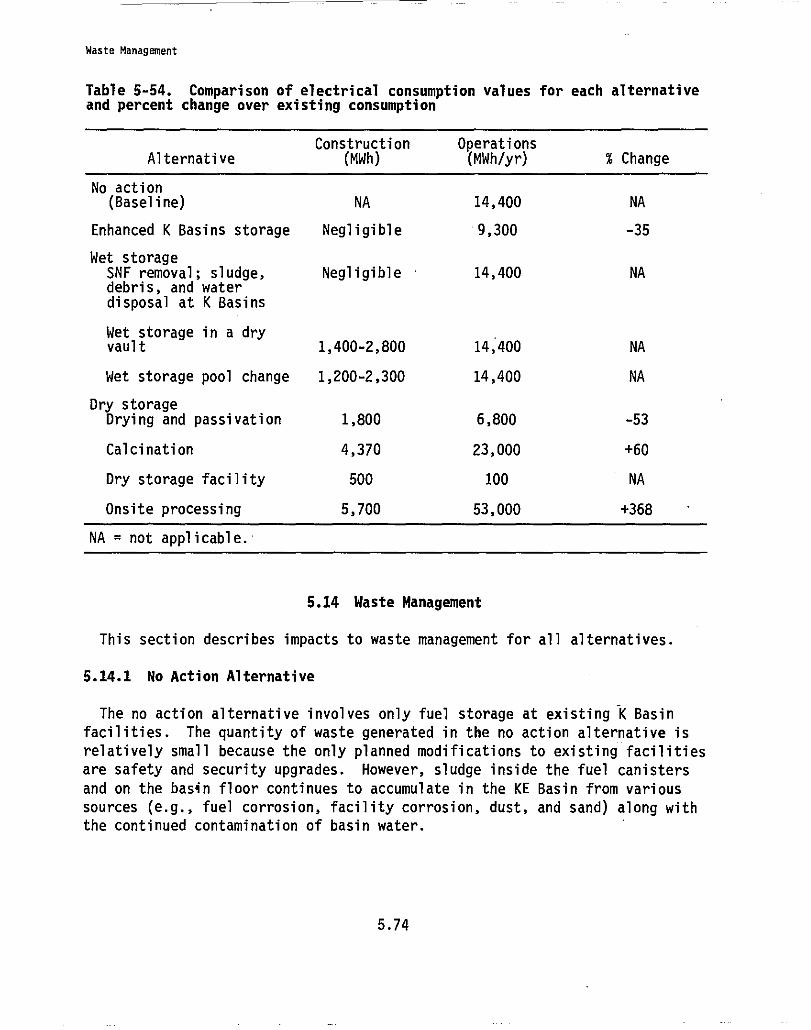
Waste Management
Table 5-54. Comparison of electrical consumption values for each alternativeand percent change over existing consumption
AlternativeConstruction
(MWh)Operations(MWh/yr) % Change
No action(Baseline) NA 14,400 NA
Enhanced K Basins storage Negligible 9,300 -35
Wet storageSNF removal; sludge, Negligible 14,400 NAdebris, and waterdisposal at K Basins
Wet storage in a dryvault 1,400-2,800 14,400 NA
Wet storage pool change 1,200-2,300 14,400 NA
Dry storageDrying and passivation 1,800 6,800 -53
Calcination 4,370 23,000 +60
Dry storage facility 500 100 NA
Onsite processing 5,700 53,000 +368
NA = not applicable.
5.14 Waste Management
This section describes impacts to waste management for all alternatives.
5.14.1 No Action Alternative
The no action alternative involves only fuel storage at existing K Basin
facilities. The quantity of waste generated in the no action alternative is
relatively small because the only planned modifications to existing facilities
are safety and security upgrades. However, sludge inside the fuel canisters
and on the basin floor continues to accumulate in the KE Basin from various
sources (e.g., fuel corrosion, facility corrosion, dust, and sand) along with
the continued contamination of basin water.
5.74
Waste Management
Impacts associated with the no action alternative are based on current
conditions. The following is a summary of routine K Basin operation waste
volume production rates. ( ' ) These include liquid and solid waste. Liquid
wastes are generated from the heating, ventilation, and air conditioning
systems. Liquid wastes are released at permitted discharge points. Solid
waste is generated from failed equipment, normal radiation zone entry, and
water treatment processes. Spent filters and ion exchange resins are the only
potential sources of transuranic (TRU) waste. In addition there is currently
20 m3 (26 yd 3) of TRU waste associated with existing spent ion exchange
columns and resins from prior operations that must be disposed of. Because
the volume is preexisting it has not been incorporated into the summary total:
• Low-level waste 95 m3/yr (124 yd3/yr)
• TRU waste 2 m3/yr (2.6 yd3/yr)
• High-level waste 0 m3/yr (0 yd3/yr)
• Mixed waste 1 m3/yr (1.3 yd3/yr)
• Hazardous waste 2.3 m3/yr (3.0 yd3/yr)
5.14.2 Enhanced K Basin Storage Alternative
The enhanced K Basin storage alternative also leaves the fuel at the
existing facilities. However, the fuel at the KE Basin would be container-
ized, some facility upgrades would be performed, and the fuel would be
consolidated at the KW Basin. Fragments and oxides that may be generated
during containerization would be placed in new containers. Pieces too smallto be retrieved would be allowed to fall and mix in with a limited sludge
accumulation on the floor (Bergsman et al. 1995). Preparation activities are
anticipated to generate approximately 3 m 3 (4 yd 3) of nonradioactive,
nonhazardous waste, which will be shipped to the existing Hanford Site Solid
Waste Operations Complex for disposal. About 516 m 3 (670 yd 3) of low-level
waste would result from containerization of SNF in the KE Basin. In addition,
15 m3 (20 yd 3) of TRU waste would be generated from spent filters.
Excess KW Basin water, displaced by the addition of the new storage
racks, will be handled by evaporative loss. After the removal of the fuel,
sludge, debris, and water would still remain in the KE Basin. This water
would be contaminated with radionuclides, including tritium. In addition to
filtering the water for the removal of isotopes, the water would be trucked
from the KE Basin to the 200 Area ETF for final treatment and disposal into
(a) For a more detailed analysis and explanation of the waste volumespresented for each alternative, refer to the K Basins Environmental ImpactStatement Technical Input (Bergsman et al. 1995).
5.75
Waste Management
the 200 Area SALDS. The water removed from the KE Basin would then be
replaced with clean water, maintaining the KE Basin water level. Eventually,
all of the basin water would be removed. If this is done, an estimated
7,000 m3 (9,450 yd 3) of water per year for 2.5 years may be used at the basinfor makeup. The KE Basin contains approximately 33,600 m3 (1.2 million gal)of water.
Both K Basins contain sludge that has accumulated within storage canis-
ters or on the floor of the basins. For this alternative, sludge within the
canisters would be left in the canisters and managed as SNF. Sludge on the
floor of KW Basin has an estimated volume of 4 m 3 (5.4 yd 3) (or 8 m3 or10.8 yd 3 after grouting) and is expected to be low-level waste. It may be
grouted at the K Basins and moved to the 200 Area solid waste disposal facil-
ity at the Solid Waste Operations Complex or transported for disposal at the
tank farms. The estimated volume of floor sludge in the KE Basin is 50 m3
(67.5 yd3) of TRU and/or mixed TRU waste. Options for managing KE Basin floor
sludge include transferring the sludge to Hanford double-shell tanks, disposal
as solid waste, or continued management of t-he sludge as SNF and transferring
the sludge to the KW Basin.
There is an estimated noncompacted volume of 20 m 3 (26 yd3) of low-level
waste associated with the replaced racks in the KW Basin.
After fuel consolidation activities into KW Basin are complete, opera-
tional wastes are estimated to be the same as those from the current operationof the KW Basin, which are as follows:
• TRU waste 1.0 m3/yr (1.30 yd3/yr)
• Low-level waste 40 m3/yr (50 yd3/yr)
• High-level waste 0 m3/yr (0 yr3/yr)
• Mixed waste 0.23 m3/yr (0.30 yd3/yr)
• Hazardous waste 1.0 m3/yr (1.30 yd3/yr)
5.14.3 New Wet Storage Alternative
For the wet storage alternative, all fuel canisters in both basins will
be moved and loaded into MCOs. However, waste generation for fuel removal and
encapsulation activities is based on containerization activities for all of
the fuel and sludge in the KE Basin and repackaging the fuel from approxi-
mately one-half of the KW Basin canisters (aluminum canisters from which SNF
will be repacked into sealed Mark II stainless steel fuel canisters). Prep-
aration activities for the fuel removal action are anticipated to generate
approximately 3 0 (4 yd 3) of nonradioactive, nonhazardous waste to be
5.76
Waste Management
disposed of in the Hanford Central Landfill; and 7 m 3 (9 yd 3) of low-levelsolid radioactive waste consisting of installation scrap and radiation zone
personnel waste to be disposed of in the Hanford 200 Area low-level burial
grounds. No hazardous or mixed waste would be generated from preparation
activities.
Approximately 210 m3 (270 yd 3) of low-level solid radioactive waste and15 m3 (120 yd
3) of TRU waste would be generated by the fuel removal work. The
waste would be packaged and shipped to the Hanford 200 Area low-level burialgrounds.
Both K Basins contain sludge that has accumulated within storage canis-
ters or on the floor of the basins (for more detailed information, refer to
Bergsman et al. 1995). For the wet storage alternative, as with enhanced
K Basin storage, sludge within the canisters would be left in the canisters
and managed as SNF at the new wet storage facility. KW Basin floor sludge is
expected to be low-level waste, and, thus, it may be grouted and trucked to
solid waste disposal [4 m3 (5.4 yd 3) or 8 m3 (10.8 yd 3) after grouting] or
transported to the tank farms for disposal. Management options for KE Basin
floor sludge being considered include transferring sludges to Hanford double-
shell tanks or solid waste disposal; and/or transferring the sludges to the
new wet storage facility. Approximately 50 m 3 (67.5 yd 3)
of TRU or mixed TRUwaste combined with 550 m 3 (742.5 yd') of water are expected to be generated
if all the sludge from the KE Basin floor is disposed of at the tank farms.
Debris removal would also generate low-level radioactive waste
(clothing, tools, scrap materials) that would be managed in existing Hanford
waste management units. Estimated noncompacted volumes include the following:
• Storage racks
40 m 3 (52 yd')
• Empty canisters
220 m3(290 yd 3)
• Miscellaneous debris
34 m3(44 yd 3)
Treatment activities for water remaining in the K Basins following
removal of the fuel, sludge, and debris would result in an average 30 m3/yr
(40.5 yd 3/yr) for 3 years for a total of 90 m 3 (121.5 yd 3) of low-level wasteand 40 m3 (54 yd
3) of TRU waste in the year 2000 and 10 m 3/yr or 13.5 yd3/yr
(of TRU waste) in 2001 and 2002 for a total of 60 m3 (81 yd 3) for spent
filters. Small volumes of low-level waste generated from human entry (tape,
clothing) would also be produced. These numbers will also apply to the dry
storage alternative.
5.77
• Low-level waste• TRU waste• High-level waste• Mixed waste• Hazardous waste• Construction waste
40 m3/yr1 m3/yr0 m3/yr0.23 m3/yr1 m3/.3r800 m
1,400 m3
Waste Management
Operating waste estimates for wet storage in a vault facility are esti-
mated to be the same as those at the current KW Basin, and are as follows:
(50 yd3)
(1 yd3/yr)(0 yd3/yr)(0.30 yd3/yr)(1 A3/yr^(1,100 yd )(total for the CSB site)(1,800 yd3)(total for the reference site)
Operating waste estimates for wet storage in a new pool are the same as
those for a vault facility. Anticipated construction waste volumes are as
follows:
• Construction waste 590 m3 (770 yd3)
(total for the CSB site)
1,100 m3(1,400 yd3)
(total for the reference site)
When calculating total annual waste generation for any alternative,
which facilities will be in operation during the specific time period must be
considered. For the wet storage alternative, the minimum annual waste genera-
tion is during operation of both K Basins (before any new facilities are
operating), and the maximum annual waste generation is during the period of
fuel transfer when both the basins and the storage facility are operating.
5.14.4 Dry Storage Alternative
As with the wet storage alternative, waste generation is based on encap-
sulation activities for the fuel and sludge in the KE Basin and repackaging
the fuel from approximately one-half of the KW Basin canisters. Preparation
activities for the fuel removal action are anticipated to generate approxi-
mately 4 m3 (5 yd3) of nonradioactive, nonhazardous waste; and 9 m 3 (12 yd3) of
low-level solid radioactive waste. No hazardous or mixed waste will be gener-
ated from preparation activities.
Approximately 650 m3 (850 yd 3) of low-level solid radioactive waste and
20 m3 (26 yd3) of TRU waste from cartridge filters would be generated by fuel
removal work. Additionally, 30 m3 (40.5 yd3) of TRU or mixed-TRU waste
combined with 570 m3 (770 yd 3) of water are expected to be generated from
canister sludge if all of the canister sludge is disposed of at the tank
5.78
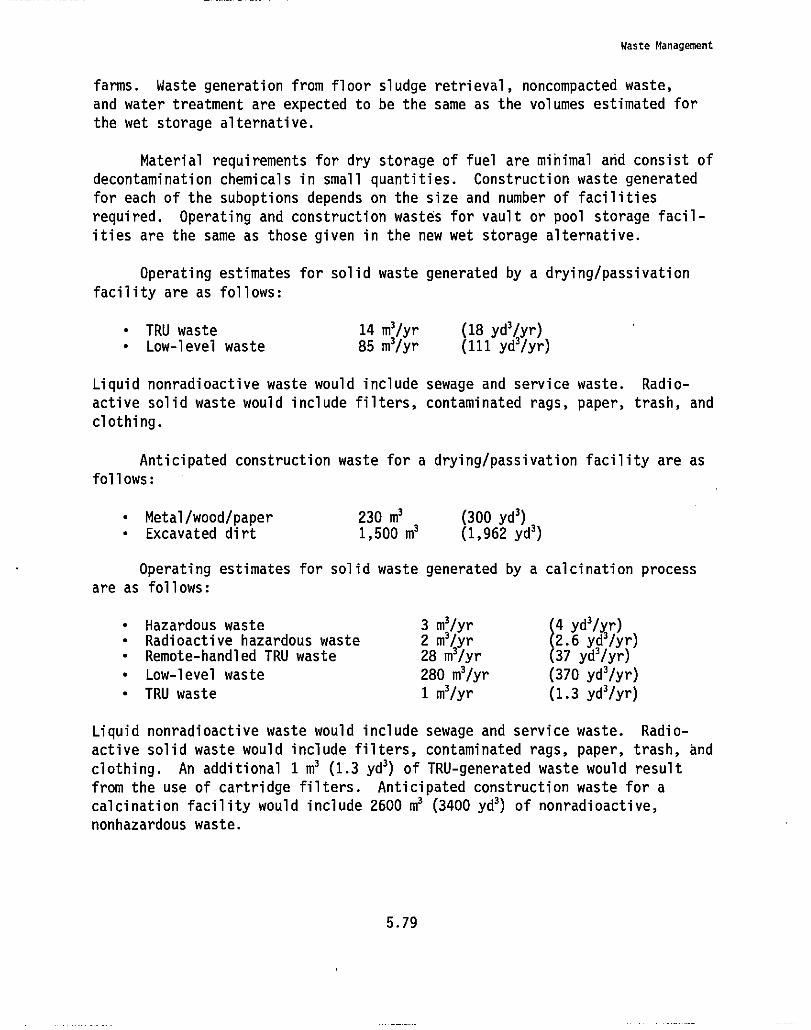
Waste Management
farms. Waste generation from floor sludge retrieval, noncompacted waste,
and water treatment are expected to be the same as the volumes estimated for
the wet storage alternative.
Material requirements for dry storage of fuel are minimal and consist of
decontamination chemicals in small quantities. Construction waste generated
for each of the suboptions depends on the size and number of facilities
required. Operating and construction wastes for vault or pool storage facil-
ities are the same as those given in the new wet storage alternative.
Operating estimates for solid waste generated by a drying/passivation
facility are as follows:
• TRU waste 14 m3/yr (18 yd3/yr)• Low-level waste 85 m3/yr (111 yd3/yr)
Liquid nonradioactive waste would include sewage and service waste. Radio-
active solid waste would include filters, contaminated rags, paper, trash, and
clothing.
Anticipated construction waste for a drying/passivation facility are as
follows:
• Metal/wood/paper 230 m3(300 yd 3)• Excavated dirt 1,500 m3(1,962 yd')
Operating estimates for solid waste generated by a calcination process
are as follows:
• Hazardous waste• Radioactive hazardous waste• Remote-handled TRU waste
• Low-level waste
• TRU waste
3 m3/yr (4 yd3/yr)2 m'/yr (2.6 yd3/yr)28 m3/yr (37 yd3/yr)
280 m3/yr (370 yd3/yr)
1 m3/yr (1.3 yd3/yr)
Liquid nonradioactive waste would include sewage and service waste. Radio-
active solid waste would include filters, contaminated rags, paper, trash, and
clothing. An additional 1 m3 (1.3 yd 3)
of TRU-generated waste would result
from the use of cartridge filters. Anticipated construction waste for a
calcination facility would include 2600 m 3 (3400 yd 3) of nonradioactive,
nonhazardous waste.
Aftj
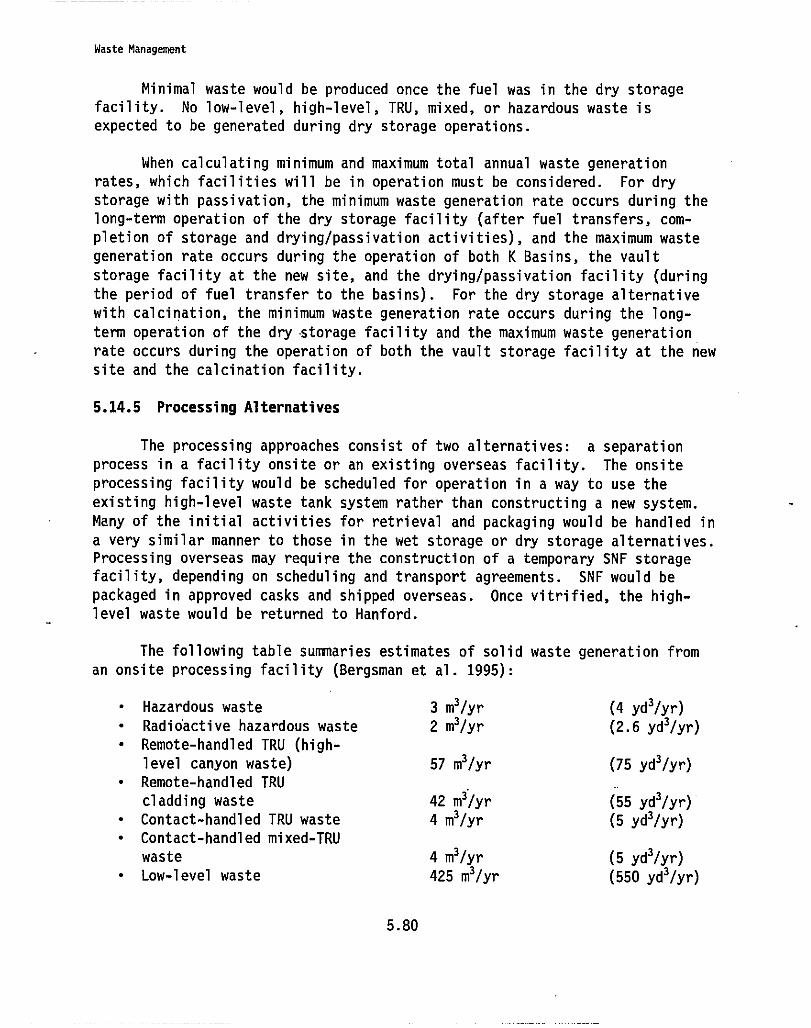
Waste Management
Minimal waste would be produced once the fuel was in the dry storage
facility. No low-level, high-level, TRU, mixed, or hazardous waste is
expected to be generated during dry storage operations.
When calculating minimum and maximum total annual waste generation
rates, which facilities will be in operation must be considered. For dry
storage with passivation, the minimum waste generation rate occurs during the
long-term operation of the dry storage facility (after fuel transfers, com-
pletion of storage and drying/passivation activities), and the maximum waste
generation rate occurs during the operation of both K Basins, the vault
storage facility at the new site, and the drying/passivation facility (during
the period of fuel transfer to the basins). For the dry storage alternative
with calcination, the minimum waste generation rate occurs during the long-
term operation of the dry storage facility and the maximum waste generation
rate occurs during the operation of both the vault storage facility at the new
site and the calcination facility.
5.14.5 Processing Alternatives
The processing approaches consist of two alternatives: a separation
process in a facility onsite or an existing overseas facility. The onsite
processing facility would be scheduled for operation in a way to use the
existing high-level waste tank system rather than constructing a new system.
Many of the initial activities for retrieval and packaging would be handled in
a very similar manner to those in the wet storage or dry storage alternatives.Processing overseas may require the construction of a temporary SNF storage
facility, depending on scheduling and transport agreements. SNF would be
packaged in approved casks and shipped overseas. Once vitrified, the high-
level waste would be returned to Hanford.
The following table summaries estimates of solid waste generation from
an onsite processing facility (Bergsman et al. 1995):
• Hazardous waste 3 m3/yr (4 yd3/yr)
• Radioactive hazardous waste 2 m3/yr (2.6 yd3/yr)
• Remote-handled TRU (high-
level canyon waste) 57 m3/yr (75 yd3/yr)• Remote-handled TRU
cladding waste 42 m3/yr (55 yd3/yr)• Contact-handled TRU waste 4 m3/yr (5 yd3/yr)
• Contact-handled mixed-TRU
waste 4 m3/yr (5 yd3/yr)• Low-level waste 425 m3/yr (550 yd3/yr)
5.80
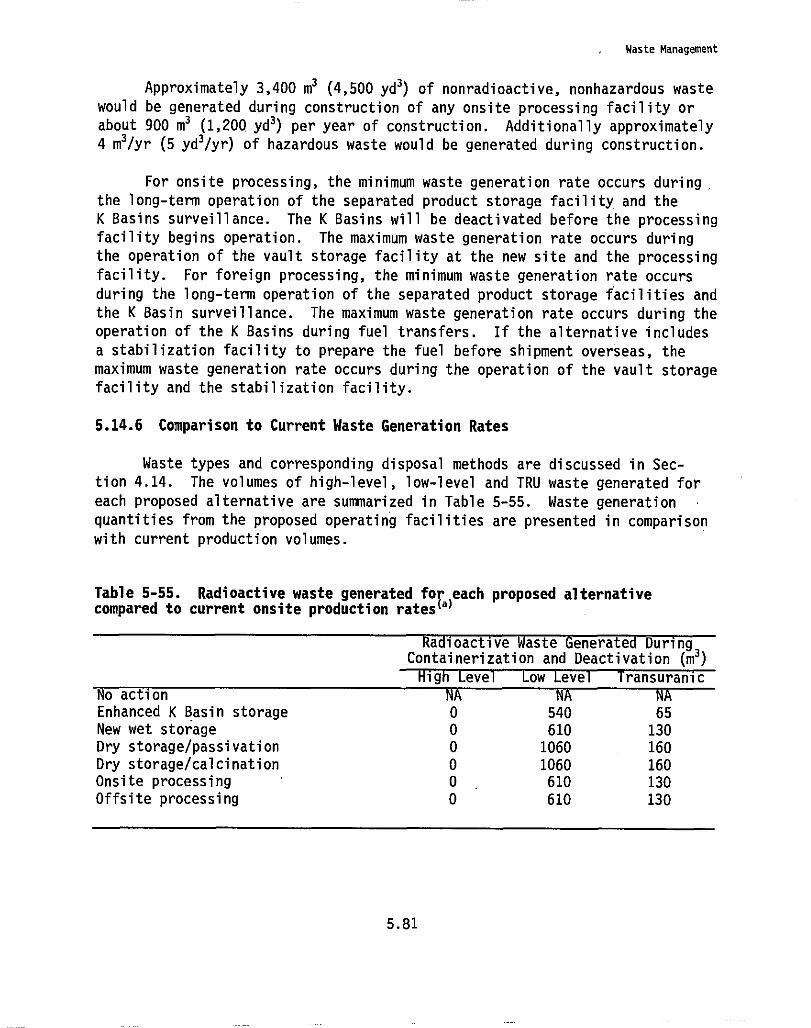
Waste Management
Approximately 3,400 m3 (4,500 yd 3)
of nonradioactive, nonhazardous waste
would be generated during construction of any onsite processing facility or
about g00 m3 (1,200 yd 3) per year of construction. Additionally approximately
4 m3/yr (5 yd3/yr) of hazardous waste would be generated during construction.
For onsite processing, the minimum waste generation rate occurs during,
the long-term operation of the separated product storage facility and the
K Basins surveillance. The K Basins will be deactivated before the processing
facility begins operation. The maximum waste generation rate occurs during
the operation of the vault storage facility at the new site and the processing
facility. For foreign processing, the minimum waste generation rate occurs
during the long-term operation of the separated product storage facilities and
the K Basin surveillance. The maximum waste generation rate occurs during the
operation of the K Basins during fuel transfers. If the alternative includes
a stabilization facility to prepare the fuel before shipment overseas, the
maximum waste generation rate occurs during the operation of the vault storage
facility and the stabilization facility.
5.14.6 Comparison to Current Waste Generation Rates
Waste types and corresponding disposal methods are discussed in Sec-
tion 4.14. The volumes of high-level, low-level and TRU waste generated for
each proposed alternative are summarized in Table 5-55. Waste generation
quantities from the proposed operating facilities are presented in comparison
with current production volumes.
Table 5-55. Radioactive waste generated fo each proposed alternativecompared to current onsite production ratesral
Radioactive aste Generated DuringContainerization and Deactivation (m3)
High Level Low LevelransuranicNo action NA NA NAEnhanced K Basin storage 0 540 65New wet storage 0 610 130Dry storage/passivation 0 1060 160Dry storage/calcination 0 1060 160Onsite processing 0 610 130Offsite processing 0 610 130
5.81
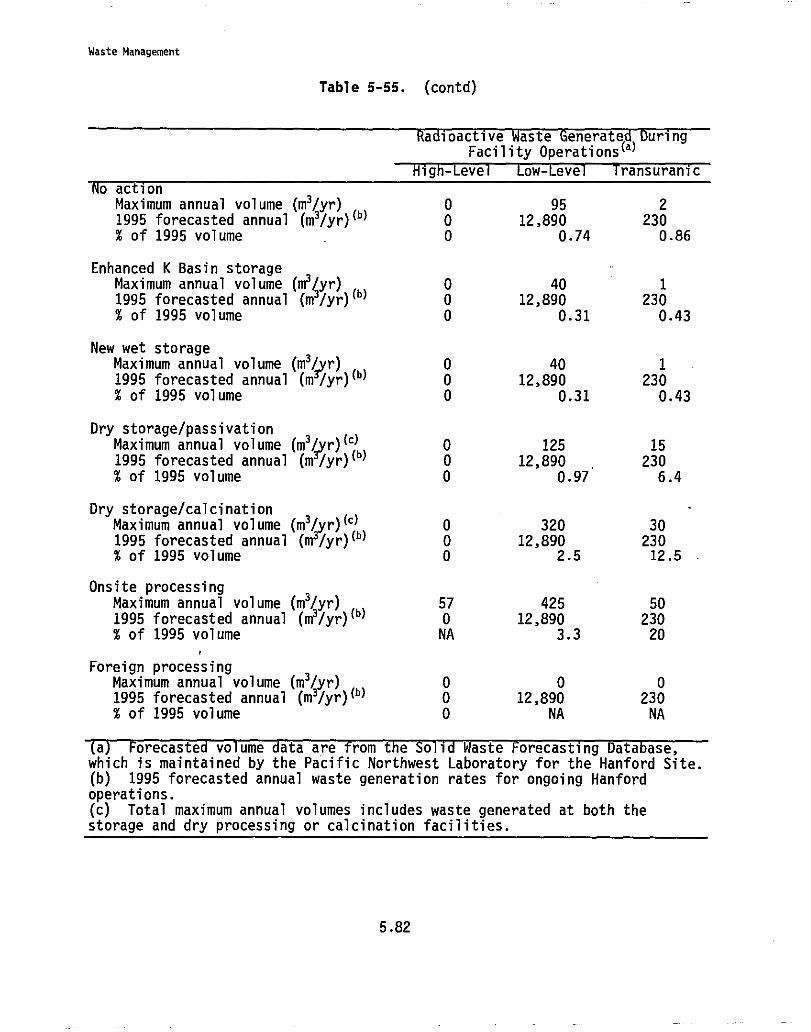
Waste Management
Table 5-55. (contd)
Radioactive aste GeneratedDuringFacility Operations(a)
c
actionMaximum annual volume (m3/yr) 0 951995 forecasted annual (m 3/yr) (b)0 12,890% of 1995 volume 0 0.74
Enhanced K Basin storageMaximum annual volume (m3/yr) 0 401995 forecasted annual (m3/yr) (b) 0 12,890% of 1995 volume 0 0.31
New wet storageMaximum annual volume (m3/ r) 0 401995 forecasted annual (m3/yr) (b) 0 12,890% of 1995 volume 0 0.31
Dry storage/passivationMaximum annual volume (m3/ r) (`) 0 1251995 forecasted annual (m3/yr)
(b)0 12,890
% of 1995 volume 0 0.97
Dry storage/calcinationMaximum annual volume (m3/yr) (` ) 0 3201995 forecasted annual (m3/yr) (b) 0 12,890% of 1995 volume 0 2.5
Onsite processingMaximum annual volume (m3/yr) 57 4251995 forecasted annual (m3/yr) (b) 0 12,890% of 1995 volume NA 3.3
t
Foreign processingMaximum annual volume (m3/yr) 0 01995 forecasted annual (m3/yr) (b) 0 12,890% of 1995 volume 0 NA
2230
0.86
1230
0.43
1230
0.43
15230
6.4
3023012.5
5023020
0230NA
aForecasted volume data are from the SolidWaste Forecasting Database,which is maintained by the Pacific Northwest Laboratory for the Hanford Site.(b) 1995 forecasted annual waste generation rates for ongoing Hanfordoperations.(c) Total maximum annual volumes includes waste generated at both thestorage and dry processing or calcination facilities.
5.82
Facility Accidents
No alternative is expected to generate high-level waste except for the
onsite processing alternative. High-level waste treatment at Hanford is
included within the Tank Waste Remediation System program. As of May 1995
there was approximately 17.8 million L (4.7 million gal; 17,800 m 3) of avail-
able space in the double-shell tanks. This space will be used for waste
storage from a variety of sources including a contingency volume for emergency
management of wastes from other tank storage facilities (DOE and Ecology
1995). Low-level waste would be forwarded to the low-level waste burial
grounds in the 200 Area with the highest production volumes resulting from
onsite processing, creating an estimated yearly increase of about 3% over 1995
forecasted volumes. Transuranic wastes would be handled by facilities in the
Hanford Central Waste Complex, and the Transuranic Waste Storage and Assay
Facility. Onsite processing would result in a volume increase of about 21%.
Other waste types discussed in this section include mixed waste (which would
also be handled by the Tank Waste Remediation System program), hazardous waste
(which would continue to be shipped offsite), and nonhazardous waste (which
would be forwarded to the Hanford Site Solid'Waste Operations Complex in the
200 Area).
5.15 Facility Accidents
Consequences of facility accidents associated with implementing the
alternatives for SNF storage at Hanford are discussed in the following subsec-
tions. The method used to select accidents for analysis is described, as are
the procedures for evaluating the consequences of selected accidents, and theresults of the analysis.
5.15.1 Historical Accidents Involving SNF at Hanford
At Hanford, no known instances of routine storage, handling, or pro-
cessing of SNF have resulted in an accident that involved a significant
release of radioactive or other hazardous materials to the environment or that
resulted in detrimental exposure of workers or members of the public to
hazardous materials.
5.15.2 Emergency Preparedness Planning at Hanford
Although the safety record for operations at Hanford and other DOE
facilities is generally good, the Richland Operations Office and all Hanford
Site contractors have established emergency response plans to prepare for and
5.83
Facility Accidents
mitigate the consequences of potential emergencies on the Hanford Site (DOE
1992a). These plans were prepared in accordance with DOE Orders and other
federal, state, and local regulations.
5.15.3 Accident Selection for the EIS Analysis
The alternatives for SNF storage considered in this EIS necessitate
evaluation of accidents at a variety of different types of facilities. In the
no action and enhanced K Basins storage alternatives, the facilities consist
of the K Basins where most SNF is currently stored on the Hanford Site. For
the other alternatives (wet storage, dry storage following either passivation
or calcination, and processing), construction of new SNF management facilities
is assumed.
Accidents evaluated for SNF management facilities at Hanford consist of
maximum reasonably foreseeable accidents described in such previously pub-
lished analysis as safety or National Environmental Policy Act documentation,
or are adaptations of accident scenarios developed for similar types of facil-
ities. The source documents for specific accidents evaluated in this section
are referenced in the detailed accident descriptions, where applicable. In
the case of new facilities, hypothetical accidents were based on analysis
developed for similar facilities at Hanford or other sites. Transportation
accidents are considered in Section 5.11 of this document.
Accident frequencies as reported in safety analysis reports and related
analysis typically represents the overall probability of the accident,
including the probability of the initiating event combined with the frequency
of any contributing events required for an environmental release to occur.
The contributing events may include equipment or barrier'failures, or failures
of other mitigating systems designed to prevent accidental releases. In
general, the safety documents do not evaluate the consequences of events with
expected frequencies of <10"6 per year (one chance in a million) because such
accidents are not considered reasonably foreseeable. Evaluation of aircraft
traffic at the Richland and Pasco, Washington, airports determined that
frequency of accidents involving commercial or military aircraft were less
than 1 x 10⁻⁷ /year for a facility in the Hanford 300 Area, which is at highest
risk because of its location (PNL 1992). Therefore, aircraft accidents are
not considered further in this analysis as initiators for accidents at Hanford
SNF management facilities.
5.84
Facility Accidents
5.15.4 Method for Accident Consequence Analysis
Accident consequence analysis used release estimates as presented in the
source document for a given existing facility or as adapted for this analysis
(Bergsman et al. 1995). For new facilities, release estimates were based on
existing safety analysis for similar DOE facilities, or on assessments devel-
oped specifically for the facilities considered in the alternatives.
Because most source documents (other than the more recent safety
analysis reports) do not evaluate hazardous materials other than radionu-
clides, a different approach was used for accidents involving nonradioactive
materials. The hazardous material inventories for each facility were used to
estimate releases based on the physical state of each compound. Specific
initiators and accident scenarios were generally not postulated for nonradio-
active materials; therefore, frequencies were not estimated for accidents
involving hazardous chemicals.
The downwind concentrations for materials released in accidents were
then calculated at receptor locations as defined for the EIS. The receptors
included a nearby worker who is onsite but outside the facility where the
accident takes place, a member of the public who is temporarily at the nearest
access location (such as a road that crosses the Site, the Columbia River, or
at the Site boundary), and the maximally exposed offsite resident. Collective
dose to the offsite population within 80 km (50 mi) was calculated for radio-
nuclide releases. Collective dose to workers within the Hanford Site boundarywas also estimated. Consequences in terms of the involved workers for repre-
sentative accident scenarios in each type of facility are discussed in Attach-
ment A to Appendix A, Volume 1 of the DOE SNF PEIS (DOE 1995a), and are not
re-evaluated for this analysis.
The accident evaluation is a conservative scoping analysis intended to
identify events that would potentially impact onsite or offsite receptors at
levels that could result in health effects, and the exposure pathways that
would contribute to those consequences. The scenarios for release of radio-
nuclides or hazardous materials to air assume mitigation by facility effluent
controls, at least a reduction by 99% for particulate materials released
through normal building exhaust systems. No credit is taken for systems
designed to preyent or mitigate the emissions from specific types of acci-
dents, such as fire suppression systems or secondary containment for leaks or
spills. Atmospheric dispersion following the accident also was estimated
using a range of conditions from "typical" conditions (those that might be
exceeded 50% of the time) to "bounding" conditions resulting in downwind
concentrations that would not be exceeded more than 5% of the time.
41.11
Facility Accidents
Individual doses were based on exposure of the receptor during the
entire release, except where the release time was sufficiently long that such
an assumption is unrealistic. For releases that were expected to last more
than a few hours, the exposure duration for onsite workers and members of the
public at accessible onsite locations was limited to 2 hour, corresponding to
the assumed time required to evacuate the Hanford Site in the event of an
accident. Offsite residents were assumed to be exposed during the entire
release, regardless of the accident duration. Exposure via inhalation and
external pathways (groundshine and submersion in the plume) were considered
for workers and the nearest public access receptors; in addition to those
pathways, ingestion of contaminated food was evaluated for offsite residents.
Because EPA protective action guidelines specify mitigative actions to prevent
consumption of contaminated food, the dose to offsite individuals and popula-
tions from inhalation and external pathways is reported separately from the
dose including all pathways. Reduced exposure to the plume or to contaminated
ground surface as a result of early evacuation of offsite populations was not
assumed for the purposes of this analysis, although such actions would also be
mandated if the projected dose from an accident exceeded the protective action
guidelines.
5.15.5 Radiological Accident Analysis
Radiological accidents resulting in the release of radionuclides into.
the environment were evaluated for the various types of facilities needed for
management of SNF currently stored at the K Basins, under each of the alter-natives. In general, the accidents evaluated represent the maximum reasonably
foreseeable accidents for a given type of facility and are intended to bound
the potential consequences of SNF management activities.
No Action and Enhanced K Basins Storage Alternatives
The no action and enhanced K Basins storage alternatives consist of
continued fuel storage at the 100-K Area SNF storage basins, either with or
without facility upgrades. Both airborne and liquid release scenarios were
evaluated for these facilities.
Cask Drop Scenario. The following describes the bounding ,K Basin acci-
dent that would result in airborne releases. In this scenario, a loaded
transfer cask from the N Reactor Basin is dropped accidentally to the floor of
the transfer area from a height of 4.6 m (15 ft) because of a postulated crane
failure. The scenario assumes that the cask overturns, the cask lid comes
off, and the irradiated fuel spills out. The cask is assumed to be loaded
5.86
Facility Accidents
with three canisters containing the maximum 14 fuel assemblies in each canis-
ter (total of 42 fuel assemblies, 84 elements), all of which are exposed to
the ambient air.
The K Basins are enclosed in buildings that do not serve as containment
but would at least partially confine or mitigate any releases occurring inside
the structure. The buildings have no forced ventilation. Although the sce-
nario assumes that the cask would open if it falls, the probability of such an
event is small because the cask has an internal locking mechanism. The
locking mechanism is operated by a detachable power tool and is not subject to
activation by contact with items or protrusions on the floor or walls. The
frequency of this accident is estimated to be 5 x 10 -3 to 7 x 10 "2 per year
over a period of 2 years. The cumulative probability of the accident during
removal of KE Basin SNF and sludge is therefore 9 x 10"3 to 0.14. The cumu-
lative probability for no action is assumed to be the same as for enhanced
storage because of the potential need to move fuel within the basins during
safety upgrades.
The estimated airborne radionuclide release to the environment is based
on assumptions and information described in Bergsman et al. (1995). The total
amount of fuel released from the building was estimated to be 5.9 g
(Table 5-56), consisting of 1.1 g of fuel and 4.8 g of sludge, including 1.5 g
during the first 2 hours. (The release rate is taken to be 0.2 g sludge per
hour over 24 hours).
The impacts of this accident in terms of dose and latent cancer fatal-
ities in the exposed population are presented in Table 5-57. The maximum dose
to an individual member of the public (at an onsite public access point) for
this scenario is 0.19 mrem. The collective dose to the offsite population
would result no latent cancer fatalities (0.01 to 0.4), if the accident
occurred.
Spray Leak Scenario. An airborne release with lower consequences than
the cask drop would result from a spray leak in the basin water recirculation
system. This accident was evaluated to account for increased water concentra-
tions in the K Basins during dose reduction activities or SNF removal and
deactivation. The leak was assumed to develop as a result of blockage and
pressure buildup in a line supplying basin water to the filtration and purifi-
cation systems. The leak of unfiltered water was evaluated for a 24-hour
release period for offsite receptors; exposures to onsite workers were assumed
to be limited to a single shift (8 hours) of the total release (Table 5-58).
The frequency of this accident was estimated as greater than 0.01/year. The
cumulative probability over the 40-year period for the no action alternative
5.87
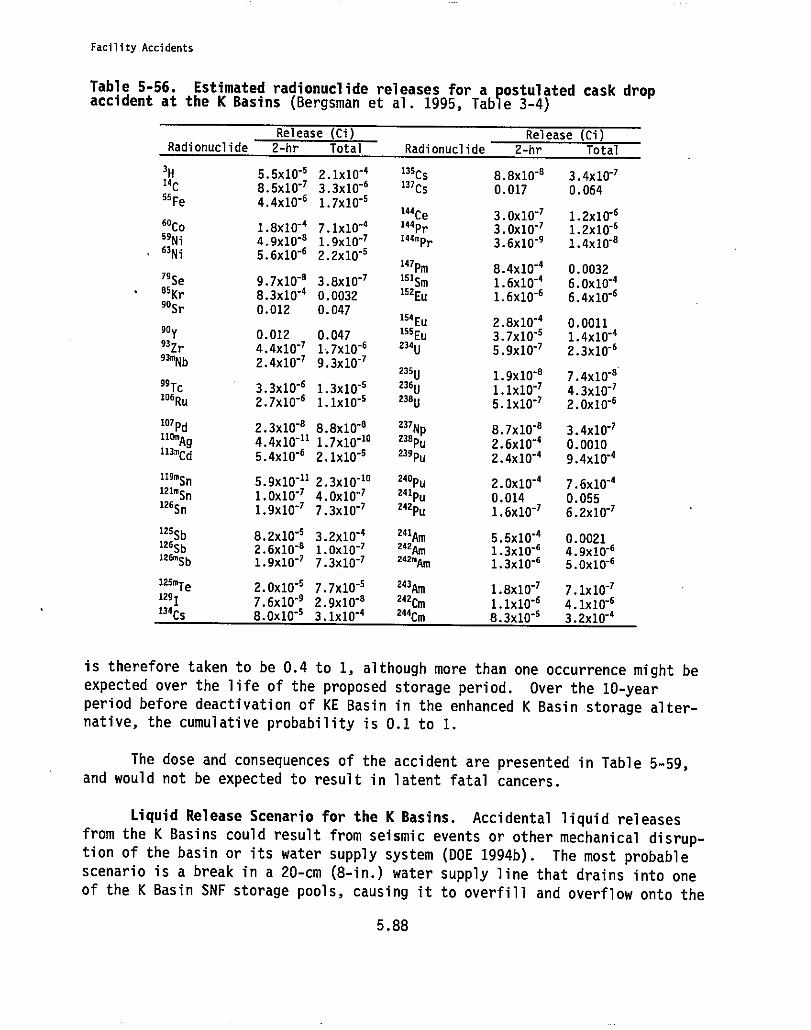
Facility Accidents
Table 5-56. Estimated radionuclide releases for a postulated cask dropaccident at the K Basins (Bergsman et al. 1995, Table 3-4)
Radionuclide
Release (Ci)
2-hr Total Radionuclide
Release (Ci)
2-hr Total
3H 5.5x10'5 2.1x10"4 135cs
8.8x10'8 3.4x10-71t 8.5x10"7 3.3x10⁻⁶ 137cs
0.017 0.0645sFe 4.4x10'6 1.7x10'5
144Ce3.0x10'7 1.2x10'660Co 1.8X10'4 7.1x10'
4 144Pr3.0x10-7 1.2x10⁻⁶
59Ni 4.9x10'8 1.9X10-73.6X10'9 1.4X10'863
Ni 5.6x10'6 2.2x10'5147Pm
8.4x10⁻⁴ 0.003279Se 9.7x10⁻⁸ 3.8x10- 1s1Sm
1.6x10'4 6.0x10'485Kr 8.340'4 0.0032 152Eu
1.6x10⁻⁶ 6.4x10-690Sr 0.012 0.047
154Eu2.8X10'4 0.0011
90Y 0.012 0.047 155Eu3.7x10'5 1.4x10'4
93Zr 4.4x10'7 1.740'6 234u5.9x10'7 2.340'693m
Nb 2.440-7 9.3x10-7235U
1.9X10'8 7.440-899Tc 3.3x10'6 1.3x10'5 236u
1.1x10'7 4.3x10'7106Ru 2.740-6 1.1X10⁻⁵ 2380
5.IX10-7 2.0x10'6
107Pd 2.3x10'8 8.8x10'8 237Np
8.7x10'8 3.4x10'7110mAg4.4x10
"111.740
"10 238pu2,640-4 0.0010113mCd
5.4x10'6 2.1x10'5 239Pu2.4x10'4 9.4x10'4
119mSn5.940-112.3x10'10 240p
u 2.0X10⁻⁴ 7.6x10'4121m5n1.0x10'7 4.0x10'7 241Pu
0.014 0.0551265n 1.9x10'7 7.340-7 242Pu
1.640-7 6.2x10'7
125Sb 8.2x10'5 3.2404 241Am
5.5x10'4 0.0021126Sb 2.6x10⁻⁸ 1.0x10⁻⁷ 242Am1.3x10-6 4.9x10'6126mSb
1.9x10'7 7.3x10⁻⁷ 242MAm1.30'6x1 5.0x10'6
125mTe2.0X10'5 7.7X10
-s 243Am1.8X10'7 7.1X10-
12917.6x10'9 2.9x10"8 242cm
1.1x10'6 4.1x10'6134Cs 8.0x10'5 3.1x10'4 244cm
8.3x10'5 3.2x10'4
is therefore taken to be 0.4 to 1, although more than one occurrence might be
expected over the life of the proposed storage period. Over the 10-yearperiod before deactivation of KE Basin in the enhanced K Basin storage alter-native, the cumulative probability is 0.1 to 1.
The dose and consequences of the accident are presented in Table 5-59,
and would not be expected to result in latent fatal cancers.
Liquid Release Scenario for the K Basins. Accidental liquid releasesfrom the K Basins could result from seismic events or other mechanical disrup-tion of the basin or its water supply system (DOE 1994b). The most probablescenario is a break in a 20-cm (8-in.) water supply line that drains into oneof the K Basin SNF storage pools, causing it to overfill and overflow onto the
5.88
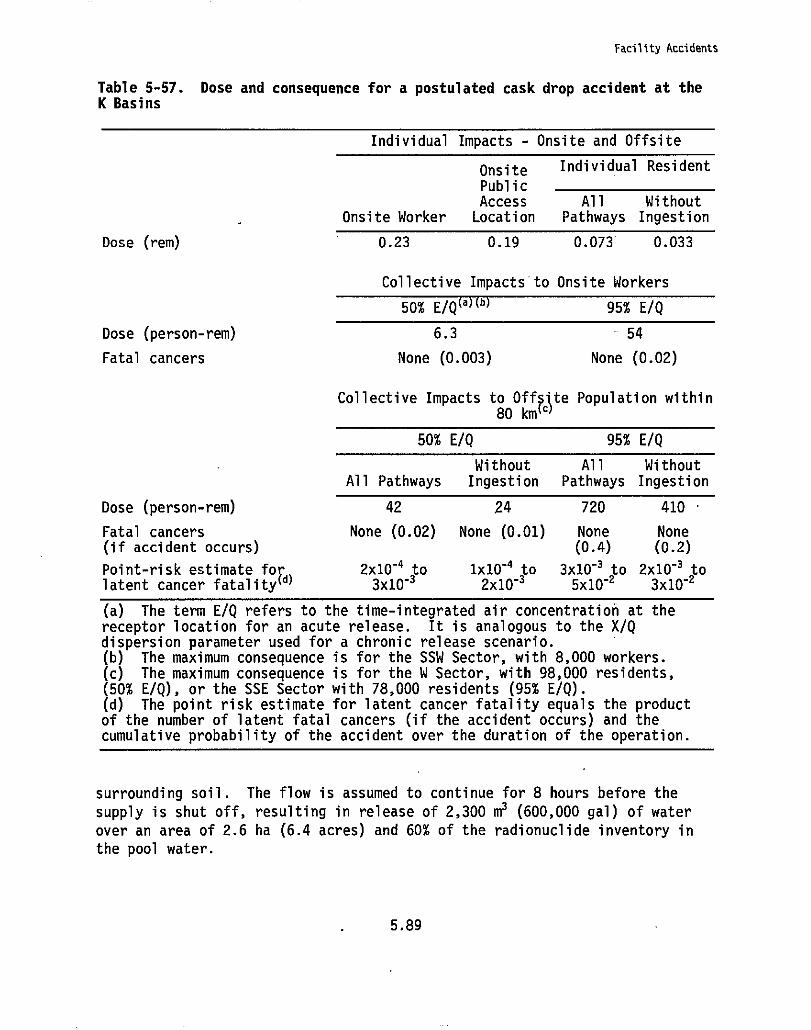
Facility Accidents
Table 5-57. Dose and consequence for a postulated cask drop accident at theK Basins
Individual Impacts - Onsite and Offsite
Onsite Individual Resident
PublicAccess All Without
Onsite Worker Location Pathways Ingestion
Dose (rem) 0.23 0.19 0.073 0.033
Collective Impacts to Onsite Workers
50% E/Q a n
95% E/Q
Dose (person-rem) 6.3 54
Fatal cancers None (0.003) None (0.02)
Collective Impacts to Off?)te Population within80 km
50% E/Q 95% E/Q
Without All WithoutAll Pathways Ingestion Pathways Ingestion
Dose (person-rem) 42 24 720 410
Fatal cancers None (0.02) None (0.01) None None(if accident occurs) (0.4) (0.2)
Point-risk estimate fofd)
2x10⁻⁴ to 1x10 "4 to 3x10"3 to 2x10"3 tolatent cancer fatality 3x10
"32x10-3 5x10
-Z 3x 10⁻²
(a) The term E/Q refers to the time-integrated air concentration at thereceptor location for an acute release. It is analogous to the X/Qdispersion parameter used for a chronic release scenario.(b) The maximum consequence is for the SSW Sector, with 8,000 workers.(c) The maximum consequence is for the W Sector, with 98,000 residents,(50% E/Q), or the SSE Sector with 78,000 residents (95% E/Q).(d) The point risk estimate for latent cancer fatality equals the productof the number of latent fatal cancers (if the accident occurs) and thecumulative probability of the accident over the duration of the operation.
surrounding soil. The flow is assumed to continue for 8 hours before the
supply is shut off, resulting in release of 2,300 m 3 (600,000 gal) of water
over an area of 2.6 ha (6.4 acres) and 60% of the radionuclide inventory in
the pool water.
5.89
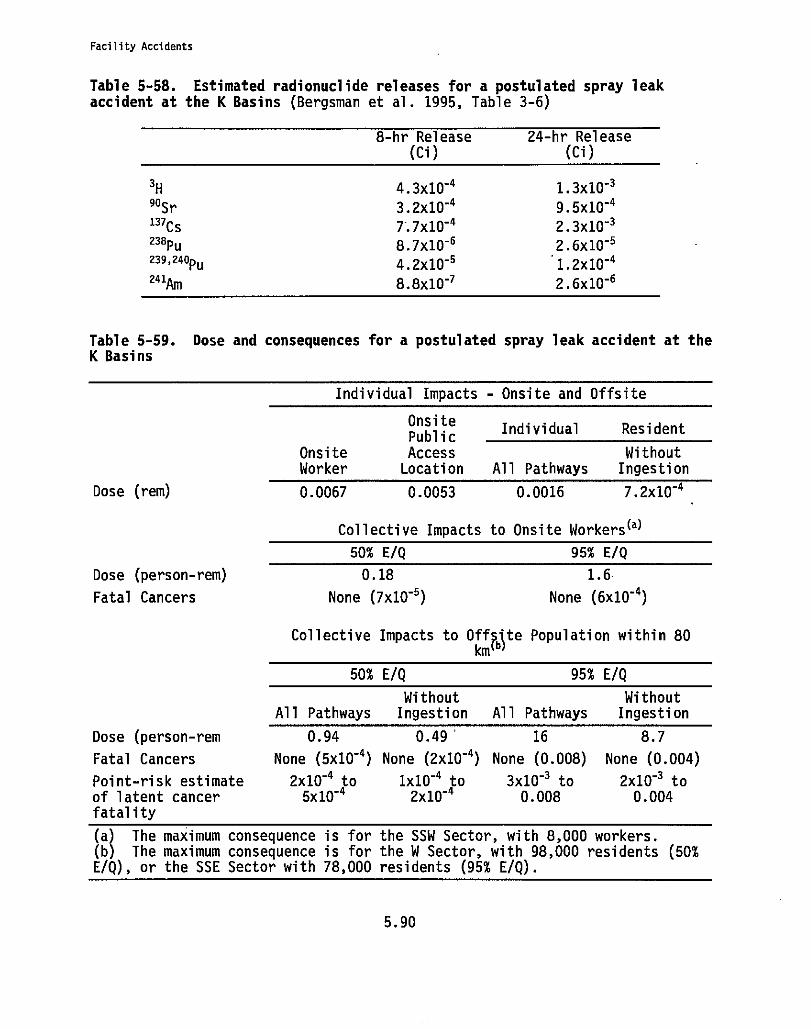
Facility Accidents
Table 5-58. Estimated radionuclide releases for a postulated spray leakaccident at the K Basins (Bergsman et al. 1995, Table 3-6)
8-hr Release(Ci)
24-hr Release(Ci)
3H 4.3x10'4 1.3x10"39OSr 3.2x10"4 9.5x10"4137Cs 7- * 7x 10⁻⁴ 2.3x10"3238Pu 8.7x10⁻⁶ 2.6x10 "5239,240pu 4.2x10 -5 1.2x10"4241Am 8.8x10"7 2.6x10"6
Table 5-59. Dose and consequences for a postulated spray leak accident at theK Basins
Dose (rem)
Individual Impacts - Onsite and Offsite
OnsitePublic
Individual Resident
Onsite Access WithoutWorker Location All Pathways Ingestion
0.0067 0.0053 0.0016 7.2x10"4
Collective Impacts to Onsite Workers(a)
50% E/Q 95% E/Q
Dose (person-rem)
0.18
1.6
Fatal Cancers
None (7x10⁻⁵)
None (6x10"4)
Collective Impacts to Off?jte Population within 80km
50% E/Q 95% E/Q
Without WithoutAll Pathways Ingestion All Pathways Ingestion
Dose (person-rem 0.94 0.49' 16 8.7
Fatal Cancers None (5x10⁻⁴) None (2x10"4) None (0.008) None (0.004)
Point-risk estimate 2x10"4 to 1x10 "4 to 3x10"3 to 2x10"3 to
of latent cancer 5x10"4
2x10⁻⁴ 0.008 0.004fatality
(a) The maximum consequence is for the SSW Sector, with 8,000 workers.(b) The maximum consequence is for the W Sector, with 98,000 residents (50%E/Q), or the SSE Sector with 78,000 residents (95% E/Q).
5.90
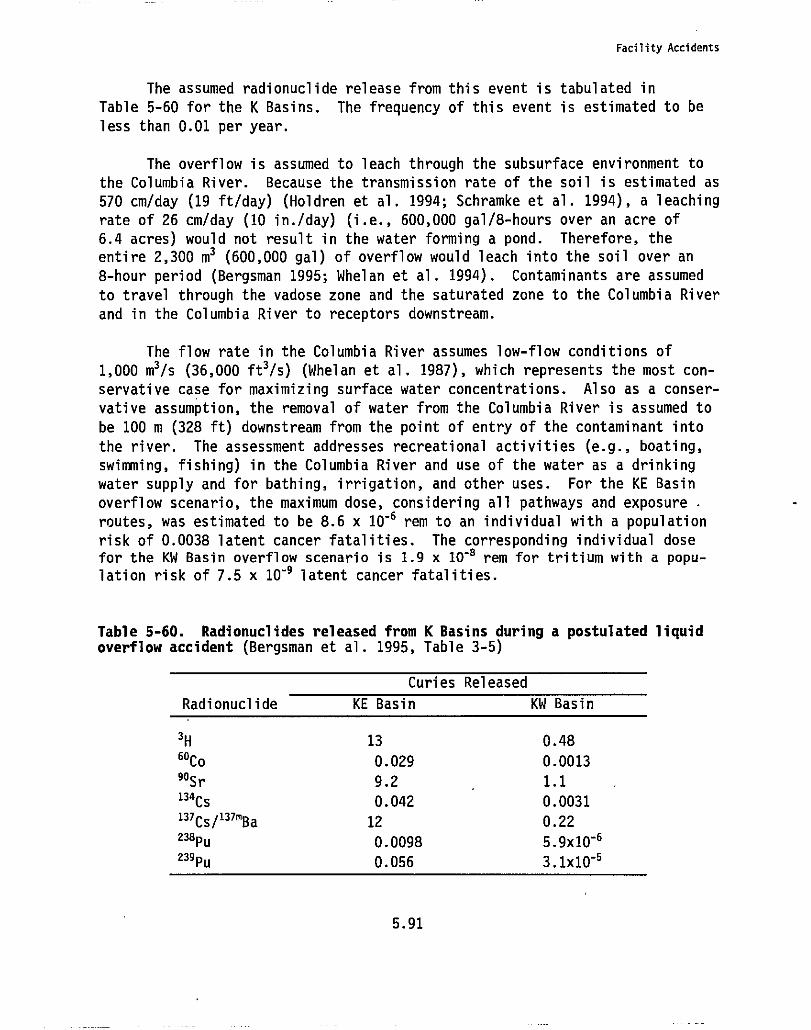
Facility Accidents
The assumed radionuclide release from this event is tabulated in
Table 5-60 for the K Basins. The frequency of this event is estimated to be
less than 0.01 per year.
The overflow is assumed to leach through the subsurface environment to
the Columbia River. Because the transmission rate of the soil is estimated as
570 cm/day (19 ft/day) (Holdren et al. 1994; Schramke et al. 1994), a leaching
rate of 26 cm/day (10 in./day) (i.e., 600,000 gal/8-hours over an acre of
6.4 acres) would not result in the water forming a pond. Therefore, the
entire 2,300 m3 (600,000 gal) of overflow would leach into the soil over an
8-hour period (Bergsman 1995; Whelan et al. 1994). Contaminants are assumed
to travel through the vadose zone and the saturated zone to the Columbia River
and in the Columbia River to receptors downstream.
The flow rate in the Columbia River assumes low-flow conditions of
1,000 m3/s (36,000 ft'/s) (Whelan et al. 1987), which represents the most con-
servative case for maximizing surface water concentrations. Also as a conser-
vative assumption, the removal of water from the Columbia River is assumed to
be 100 m (328 ft) downstream from the point of entry of the contaminant into
the river. The assessment addresses recreational activities (e.g., boating,
swimming, fishing) in the Columbia River and use of the water as a drinking
water supply and for bathing, irrigation, and other uses. For the KE Basin
overflow scenario, the maximum dose, considering all pathways and exposure .
routes, was estimated to be 8.6 x 10"6 rem to an individual with a population
risk of 0.0038 latent cancer fatalities. The corresponding individual dosefor the KW Basin overflow scenario is 1.9 x 10 "8 rem for tritium with a popu-
lation risk of 7.5 x 10 "9 latent cancer fatalities.
Table 5-60. Radionuclides released from K Basins during a postulated liquidoverflow accident (Bergsman et al. 1995, Table 3-5)
Radionuclide
Curies
KE Basin
Released
KW Basin
3H 13 0.4860co 0.029 0.0013
90S 9.2 1.1134Cs 0.042 0.0031131c5/131mBa 12 0.22238pu 0.0098 5.9x10'6239pu 0.056 3.1x10 "6
5.91
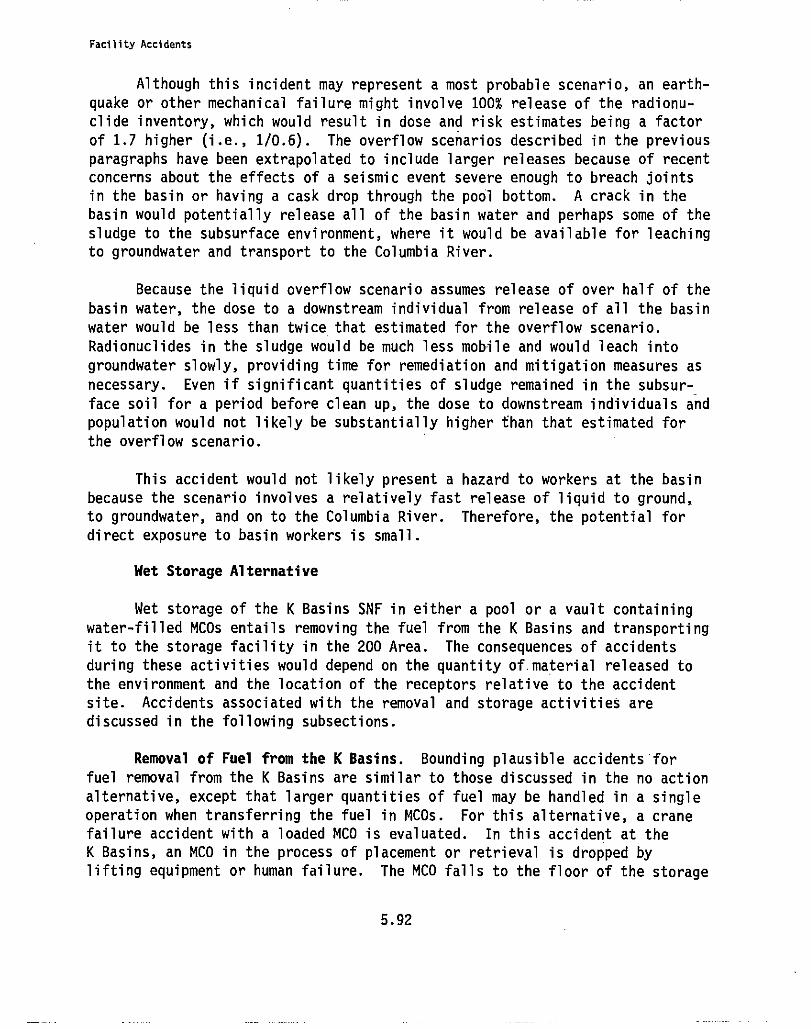
Facility Accidents
Although this incident may represent a most probable scenario, an earth-
quake or other mechanical failure might involve 100% release of the radionu-
clide inventory, which would result in dose and risk estimates being a factor
of 1.7 higher (i.e., 1/0.6). The overflow scenarios described in the previous
paragraphs have been extrapolated to include larger releases because of recent
concerns about the effects of a seismic event severe enough to breach joints
in the basin or having a cask drop through the pool bottom. A crack in the
basin would potentially release all of the basin water and perhaps some of the
sludge to the subsurface environment, where it would be available for leaching
to groundwater and transport to the Columbia River.
Because the liquid overflow scenario assumes release of over half of the
basin water, the dose to a downstream individual from release of all the basin
water would be less than twice that estimated for the overflow scenario.
Radionuclides in the sludge would be much less mobile and would leach into
groundwater slowly, providing time for remediation and mitigation measures as
necessary. Even if significant quantities of sludge remained in the subsur-
face soil for a period before clean up, the dose to downstream individuals and
population would not likely be substantially higher than that estimated for
the overflow scenario.
This accident would not likely present a hazard to workers at the basin
because the scenario involves a relatively fast release of liquid to ground,
to groundwater, and on to the Columbia River. Therefore, the potential for
direct exposure to basin workers is small.
Wet Storage Alternative
Wet storage of the K Basins SNF in either a pool or a vault containing
water-filled MCOs entails removing the fuel from the K Basins and transporting
it to the storage facility in the 200 Area. The consequences of accidents
during these activities would depend on the quantity of.material released to
the environment and the location of the receptors relative to the accident
site. Accidents associated with the removal and storage activities are
discussed in the following subsections.
Removal of Fuel from the K Basins. Bounding plausible accidents for
fuel removal from the K Basins are similar to those discussed in the no action
alternative, except that larger quantities of fuel may be handled in a single
operation when transferring the fuel in MCOs. For this alternative, a crane
failure accident with a loaded MCO is evaluated. In this accident at the
K Basins, an MCO in the process of placement or retrieval is dropped by
lifting equipment or human failure. The MCO falls to the floor of the storage
5.92
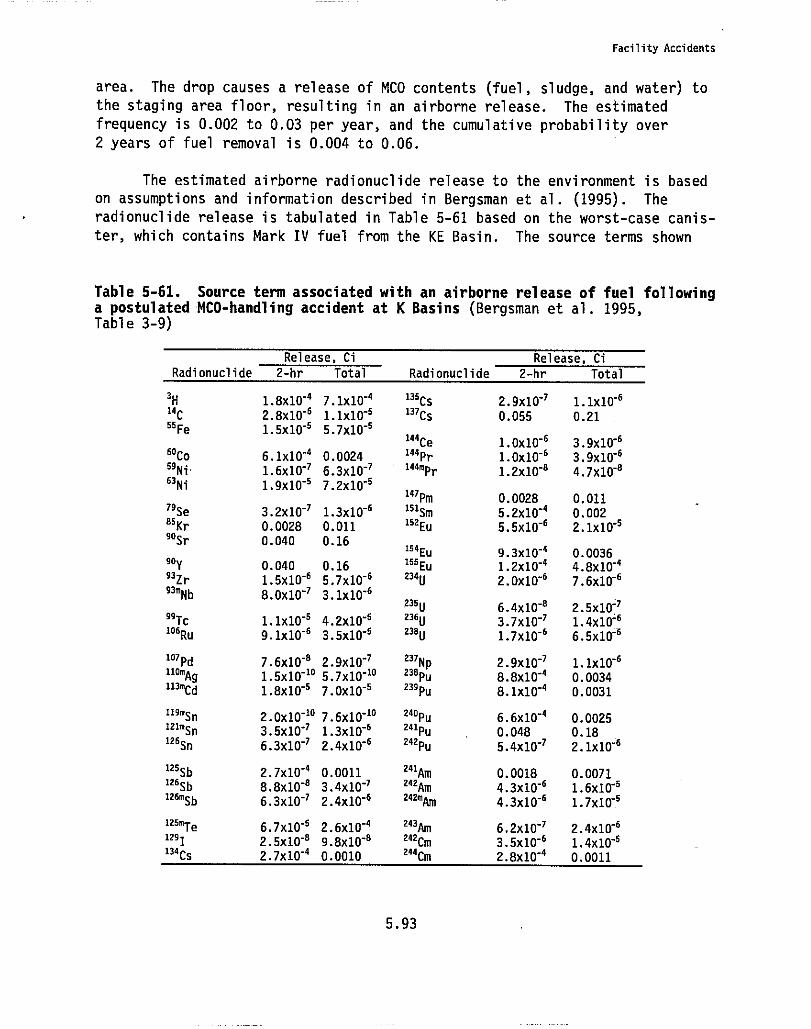
Facility Accidents
area. The drop causes a release of MCO contents (fuel, sludge, and water) to
the staging area floor, resulting in an airborne release. The estimated
frequency is 0.002 to 0.03 per year, and the cumulative probability over
2 years of fuel removal is 0.004 to 0.06.
The estimated airborne radionuclide release to the environment is based
on assumptions and information described in Bergsman et al. (1995). The
radionuclide release is tabulated in Table 5-61 based on the worst-case canis-
ter, which contains Mark IV fuel from the KE Basin. The source terms shown
Table 5-61. Source term associated with an airborne release of fuel followinga postulated MCO-handling accident at K Basins (Bergsman et al. 1995,Table 3-9)
Radionuclide
Release, Ci
2-hr Total Radionuclide
Release, Ci
2-hr Total
3H 1.8X10⁻⁴ 7.IXIO-4135Cs
2.9x10'7 I. 1x10'614C
2.8x10-' 1.1x10'' 137Cs0.055 0.21
55 Fe1.5x10-' 5.7x10⁻⁵
144 C 1.0x10-' 3.9x10'660co 6.1x10'4 0.0024 144 Pr
1.Ox10-6 3.9x10'659Ni 1.6x10'7 6.3x10⁻⁷ 344mPr 1.2x10'8 4.7x10'8
63 Ni1.9x10'' 7.2x10''
147Pm0.0028 0.011
79Se 3.2x10⁻⁷ 1.3x10⁻⁶ 151sm
5.2x10'4 0.00285Kr 0.0028 0.011
152 E5.5x10-6 2.1x10''
90Sr 0.040 0.16154 E 9.3x10⁻⁴ 0.0036
90Y 0.040 0.16 155Eu1.2x10-4 4.8x10⁻⁴
93 Zr1.5X10-6 5.7x10-'
234U2.0x10-' 7.6X10⁻⁶
93mNb 8.0X10'7 3.1x10'6
935 6.410-8 2.5x10-799Tc 1.1x10-s 4.2x10'' 236U
3.7X10⁻⁷ 1.4X10'6106Ru 9.1x10⁻⁶ 3.5x10"' 236U
1.7x10-' 6.5x10'6
107 Pd 7.640-8 2.9x10'7 237 N 2.9x10⁻⁷ 1.1x10'6110MAg
1.5X10⁻¹⁰ 5.7X10'10 238pu8.8X10'4 0.0034
113mCd1.8X10'' 7.Ox1O-5
239Pu8.1XIO-4 0.0031
119mSn2.0X10'10 7.6X10'10 240pu
6.6X10'4 0.0025121mSn
3.5x10'7 1.340-6241Pu
0.048 0.18126 S
6.3x10⁻⁷ 2.410'6 242Pu5.4x10-7 2.1x10'6
125Sb 2.7x10⁻⁴ 0.0011 241Am
0.0018 0.0071126 S
8.8x10⁻⁸ 3.4x10'7 242Am
4.3x10⁻⁶ 1.6x10''126msb
6.3x10'7 2.4x10'6 242%4.3x10'6 1.7x10-'
125mTe6.7x10'' 2.6x10 -4 243Am
6.2x10⁻⁷ 2.4x10'6129I
2.5x10'8 9.8x10'8 242cm
3.5x10'6 1.4x10''134
Cs 2.7x10'4 0.0010 244cm 2.8x10'4 0.0011
5.93
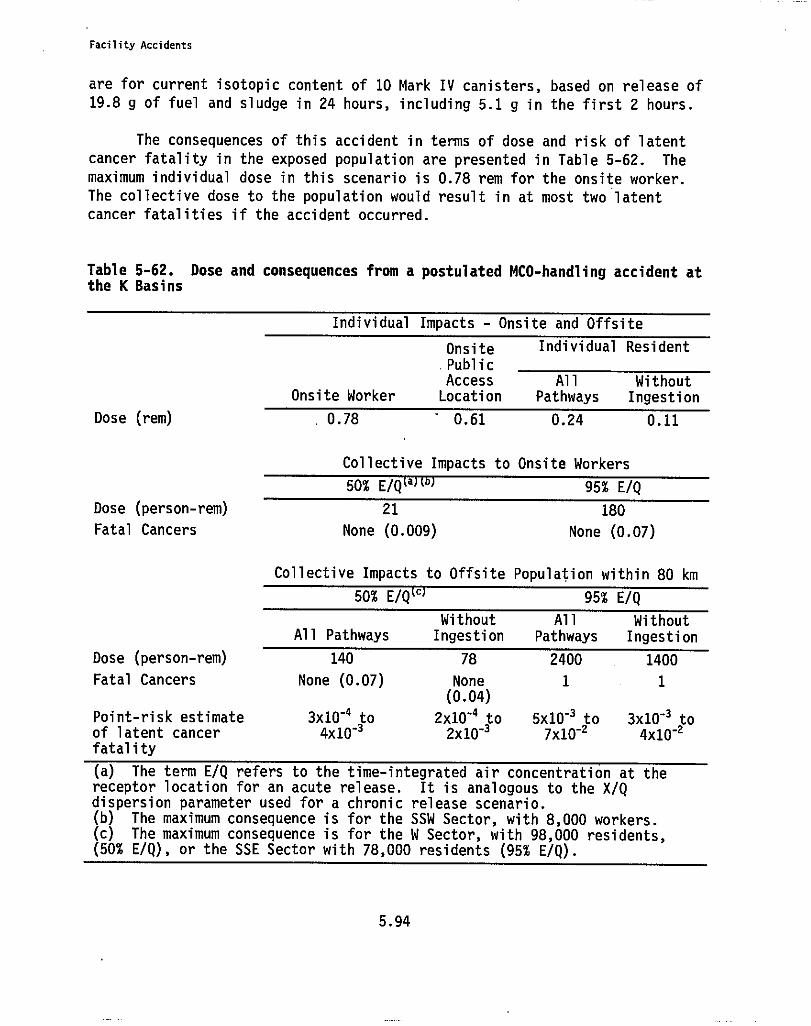
Facility Accidents
are for current isotopic content of 10 Mark IV canisters, based on release of
19.8 g of fuel and sludge in 24 hours, including 5.1 g in the first 2 hours.
The consequences of this accident in terms of dose and risk of latent
cancer fatality in the exposed population are presented in Table 5-62. The
maximum individual dose in this scenario is 0.78 rem for the onsite worker.
The collective dose to the population would result in at most two latent
cancer fatalities if the accident occurred.
Table 5-62. Dose and consequences from a postulated MCO-handling accident atthe K Basins
Individual Impacts - Onsite and Offsite
Onsite Individual Resident
.PublicAccess All Without
Onsite Worker Location Pathways Ingestion
Dose (rem) 1 0.78 0.61 0.24 0.11
Collective Impacts to Onsite Workers
50% E/Q a95% E/Q
Dose (person-rem)
21
180
Fatal Cancers
None (0.009)
None (0.07)
Collective Impacts to Offsite Population within 80 km
50% E/Q 1) 95% E/Q
Without All WithoutAll Pathways Ingestion Pathways Ingestion
140 78 2400 1400
None (0.07) None 1 1(0.04)
Point-risk estimate 3x10 "4 to 2x10"4 to 5x10"3 to 3x10"3 to
of latent cancer 4x10⁻³ 2x10³ 7x10_'
4x10 "Zfatality
(a) The term E/Q refers to the time-integrated air concentration at thereceptor location for an acute release. It is analogous to the X/Qdispersion parameter used for a chronic release scenario.(b) The maximum consequence is for the SSW Sector, with 8,000 workers.(c) The maximum consequence is for the W Sector, with 98,000 residents,(50% E/Q), or the SSE Sector with 78,000 residents (95% E/Q).
Dose (person-rem)
Fatal Cancers
5.94
Facility Accidents
Fuel Storage at 200 Areas Facility. The following information describes
bounding plausible accidents for the either a pool or vault wet storage facil-
ity. The accident at a vault storage facility results from overpressurization
of an MCO. A second accident that could apply to either type of wet storage
is a crane failure that causes an MCO to drop. Both accidents are described
in the following sections.
MCO Overpressurization. During transport from the K Basins to the wet
storage vault, enhanced corrosion of fuel may cause excessive pressure in a
sealed MCO. The MCO would be in the receiving area of the vault; the pressure
ruptures the rupture disk with potential releases of aerosols outside of the
building or a release of hydrogen with a potential hydrogen deflagration and
release of the MCO contents. The air exhaust stack is assumed to be 50 m
(165 ft) high. The estimated frequency of this accident is 1 x 10 -4 to
1 x 10 "2 per year over 2 years of SNF shipment from the K Basins to the newstorage facility. The cumulative probability of the accident is therefore
2x10" 4 to 2x 10"2.
Information and assumptions used to estimate the amount of material
released are described in Bergsman et al. (1995), and the releases by radionu-
clide are shown in Table 5-63. The release quantity is assumed to be 333.6 g
of material.
The consequences of this accident are listed in Table 5-64, with a
maximum individual dose of 2.7 rem to the onsite worker. The collective doseto the population would result in at most 8 latent fatal cancers if the
accident occurred.
Crane Failure and MCO Drop. In the crane failure accident with an MCO
at a wet storage facility, an MCO in the process of placement or retrieval is
dropped as a result of lifting equipment or human failure. It falls into a
storage tube containing one MCO that had previously been placed there, rup-
turing both MCOs. The drop causes a release of MCO contents (fuel, sludge,
and water), resulting in an airborne release. The estimated frequency is
0.002 to 0.03 per year over 2 years of transferring SNF to the storage facil-ity. The cumulative probability is 0.004 to 0.07 over the course of thetransport. Assumptions used to model the accident scenario and releases are
described in Bergsman et al. (1995).
The source term is tabulated in Table 5-65 based on the worst-case fuel,
which is Mark IV fuel from the KE Basin. The source terms shown are for
5.95
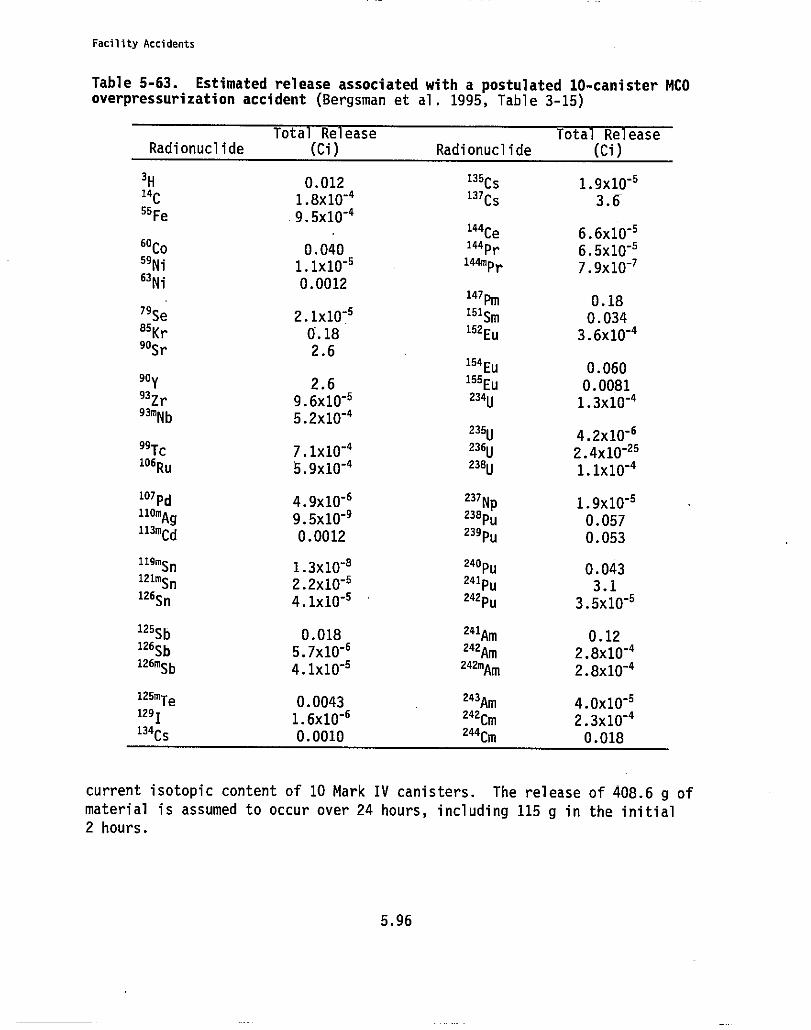
Facility Accidents
Table 5-63. Estimated release associated with a postulated 10-canister MCOoverpressurization accident (Bergsman et al. 1995, Table 3-15)
Total Release Tota Re easeRadionuclide (Ci) Radionuclide (Ci)
3H 0.012 135Cs1.9x10"5
14C1.8x10"4 137cs
3.655 Fe .9.5x 10-4
. 144 C6.6x10"5
60Co 0.040 144 Pr6.5x10"5
59Ni 1.1X10⁻⁵ 144m Pr7.9X10-7
63 Ni0.0012
147Pm0.18
79Se 2.1x10"5 151Sm0.034
85 Kr 0.18 152Eu3.6x10"4
90Sr 2.6154 E
0.06090Y 2.6 155Eu
0.008193 Zr
9.6x10⁻⁵ 234u1.3X10-4
93mNb 5.2x10-4235u
4.2X10-699Tc 7.IX10-4 236u
2.4X10"25106 R
5.9x10"4 238u1.1x10"4
107 Pd4.9x10"6 237 N 1.9x10⁻⁵
11amAg9.5x10"' 238Pu
0.057113MCd
0.0012 239Pu 0.053
119mSn1.3X10"8 240pu
0.043121mSn
2.2x10"5 241Pu3.1
126 S4.1x10"5 242Pu
3.5x10⁻⁵
125Sb 0.018 241Am0.12
126 S5.7x10"6 242Am
2.8x10"4126mSb
4.1xIO-5 242MAm 2.8X10⁻⁴
125mTe0.0043 243Am
4.0x10"5129I
1.6x10"6 242Cm2.3x10-4
134cs 0.0010 244Cm0.018
current isotopic content of 10 Mark IV canisters. The release of 408.6 g of
material is assumed to occur over 24 hours, including 115 g in the initial2 hours.
5.96
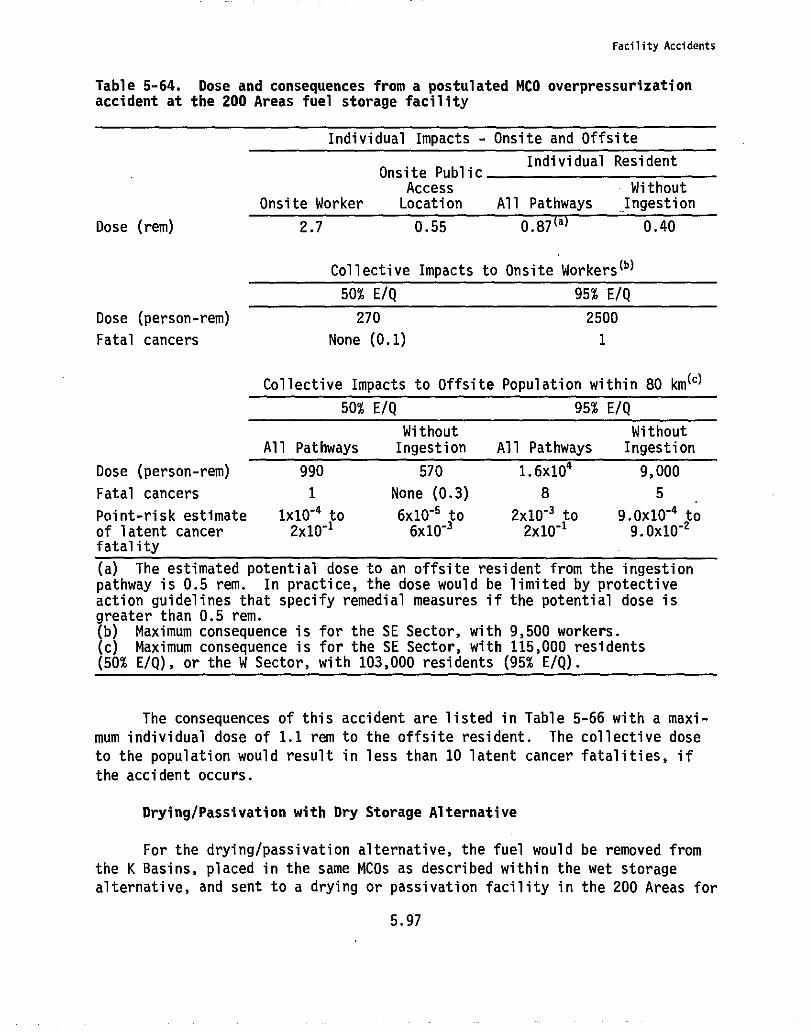
Dose (person-rem)
Fatal cancers
Point-risk estimateof latent cancerfatality
Facility Accidents
Table 5-64. Dose and consequences from a postulated MCO overpressurizationaccident at the 200 Areas fuel storage facility
Individual Impacts - Onsite and Offsite
Onsite PublicIndividual Resident
Access WithoutOnsite Worker Location All Pathways Ingestion
Dose (rem) 2.7 0.55 0.87(a) 0.40
Collective Impacts to Onsite Workers (b)
50% E/Q 95% E/Q
Dose (person-rem) 270 2500
Fatal cancers None (0.1) 1
Collective Impacts to Offsite Population within 80 km(`)
50% E/Q 95% E/Q
Without WithoutAll Pathways Ingestion All Pathways Ingestion
990 570 1.6x10⁴ 9,000
1 None (0.3) 8 5
1X10'4 to 6X10'5 to 2X10'3 t0 9.0x10'4 t02x10'1 6x10"3 2x10
"19.0x10 -1
(a) The estimated potential dose to an offsite resident from the ingestionpathway is 0.5 rem. In practice, the dose would be limited by protectiveaction guidelines that specify remedial measures if the potential dose isgreater than 0.5 rem.(b) Maximum consequence is for the SE Sector, with 9,500 workers.(c) Maximum consequence is for the SE Sector, with 115,000 residents(50% E/Q), or the W Sector, with 103,000 residents (95% E/Q).
The consequences of this accident are listed in Table 5-66 with a maxi-
mum individual dose of 1.1 rem to the offsite resident. The collective dose
to the population would result in less than 10 latent cancer fatalities, if
the accident occurs.
Drying/Passivation with Dry Storage Alternative
For the drying/passivation alternative, the fuel would be removed from
the K Basins, placed in the same MCOs as described within the wet storage
alternative, and sent to a drying or passivation facility in the 200 Areas for
5.97
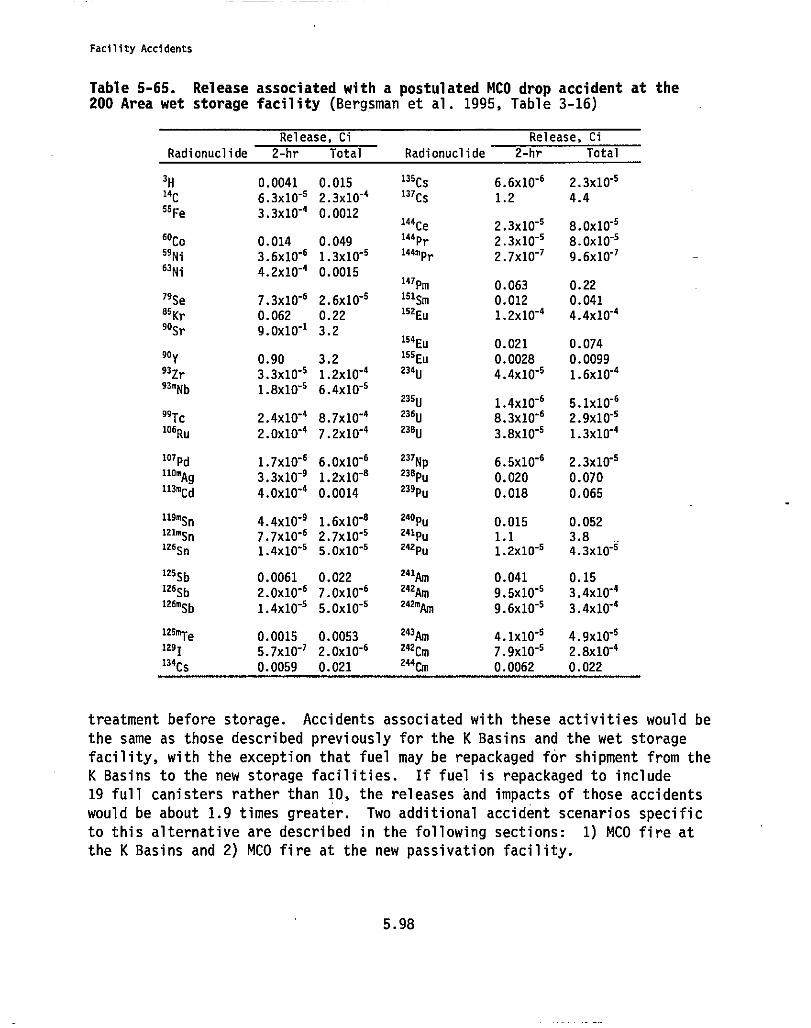
Facility Accidents
Table 5-65. Release associated with a postulated MCO drop accident at the200 Area wet storage facility (Bergsman et al. 1995, Table 3-16)
Radionuclide
Release, Ci
2-hr Total Radionuclide
Release, Ci
2-hr Total
3H 0.0041 0.015135cs
6.6x10 -6 2.3x10''14c 6.3x10-s 2.3x10'4 137Cs 1.2 4.455 Fe 3.3x10⁻⁴ 0.0012
144 C2.3x10-' 8.0x10-'
60Co 0.014 0.049144 Pr
2.3x10-' 8.0x10''
59Ni 3.6x10'6 1.3x10''144m Pr
2.7x10⁻⁷ 9.6x10-763 Ni
4.2x10'4 0.0015147Pm
0.063 0.22
79Se 7.3x10⁻⁶ 2.6x10'' 1s1Sm 0.012 0.0416sKr 0.062 0.22
152 E1.2x10-4 4.4x10⁻⁴
90Sr 9.0x10⁻¹ 3.2154 E 0.021 0.074
90Y 0.90 3.2155 E
0.0028 0.009993 Zr 3.3x10"' 1.2x10"4 234u 4.4x10"' 1.6x10'493mNb 1.8x10-' 6.4x10''
235u1.4x10 -6 5.1x10⁻⁶
9917c 2.4x10"4 8.7x10"4236u
8.3x10⁻⁶ 2.9x10''106Ru 2.0x10⁻⁴ 7.2x10"4 236u
3.8x10"' 1.3x10⁻⁴
107 Pd1.7x10-' 6.0x10-' 237 N 6.5x10"6 2.3x10"5
IlNg3.340-9 1.240-8
238pu0.020 0.070
113MCd 4.0x10⁻⁴ 0.0014 239Pu 0.018 0.065
119mSn4.440"9 1.6X10"
a 240Pu0.015 0.052
121mSn 7.7X10 "6 2.7X10 "6 241Pu 1.1 3.8126Sn 1.4x10' 5.0X10"s 242Pu 1.2X10-' 4.3x10''
125 S 0.0061 0.022241Am
0.041 0.15126 S
2.0x10"' 7.0x10-6242Am
9.5x10"1 3.4x10-4126mSb 1.4x10-' 5.0x10-' 242%
9.6X10-' 3.4X10⁻⁴
125mTe0.0015 0.0053
243Am4.1X10"' 4.9X10''
1291 5.7x10⁻⁷ 2.0X10 "6 242cm 7.9x10-' 2.8x10-4134
Cs 0.0059 0.021244Cm
0.0062 0.022
treatment before storage. Accidents associated with these activities would be
the same as those described previously for the K Basins and the wet storage
facility, with the exception that fuel may be repackaged for shipment from the
K Basins to the new storage facilities. If fuel is repackaged to include
19 full canisters rather than 10, the releases and impacts of those accidents
would be about 1.9 times greater. Two additional accident scenarios specific
to this alternative are described in the following sections: 1) MCO fire at
the K Basins and 2) MCO fire at the new passivation facility.
5.98
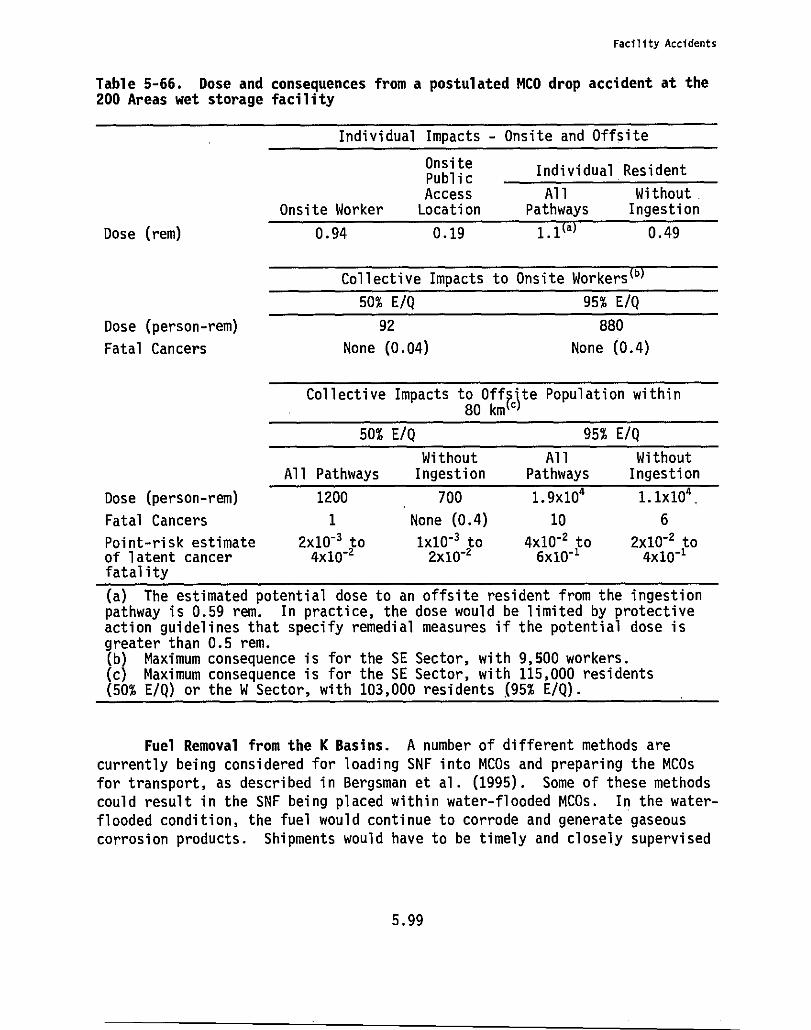
Facility Accidents
Table 5-66. Dose and consequences from a postulated MCO drop accident at the200 Areas wet storage facility
Individual Impacts - Onsite and Offsite
OnsitePublic
Individual Resident
Access All WithoutOnsite Worker Location Pathways Ingestion
Dose (rem) 0.94 0.19 1.1 a
0.49
Collective Impacts to Onsite Workers n
50% E/Q 95% E/Q
Dose (person-rem) 92 880
Fatal Cancers None (0.04) None (0.4)
Collective Impacts to Off^^te Population within80 km
50% E/Q 95% E/Q
Without All WithoutAll Pathways Ingestion Pathways Ingestion
Dose (person-rem) 1200 700 1.9x10⁴ 1.1x10⁴,
Fatal Cancers 1 None (0.4) 10 6
Point-risk estimate 2x10⁻³ to 1x10"3 to 4x10"2 to 2x10⁻² toof latent cancer 4x10⁻² 2x10⁻² 6x10
"14x10"1
fatality
(a) The estimated potential dose to an offsite resident from the ingestionpathway is 0.59 rem. In practice, the dose would be limited by protectiveaction guidelines that specify remedial measures if the potential dose isgreater than 0.5 rem.(b) Maximum consequence is for the SE Sector, with 9,500 workers.(c) Maximum consequence is for the SE Sector, with 115,000 residents(50% E/Q) or the W Sector, with 103,000 residents (95% E/Q).
Fuel Removal from the K Basins. A number of different methods are
currently being considered for loading SNF into MCOs and preparing the MCOs
for transport, as described in Bergsman et al. (1995). Some of these methods
could result in the SNF being placed within water-flooded MCOs. In the water-
flooded condition, the fuel would continue to corrode and generate gaseous
corrosion products. Shipments would have to be timely and closely supervised
5.99
Facility Accidents
to prevent excess gas pressure inside the MCO from corrosion. The MCO design
would provide for emergency pressure relief, which could take the form of a
rupture disk.
Each of the fuel loading methods could also be modified to drain the
water and vacuum dry the SNF at the K Basins to greatly reduce the uranium
corrosion and gas generation during transport and staging before stabili-
zation.
Conservative plausible accidents for fuel removal are the same as those
discussed in the no action and wet storage alternatives for handling and
removal of SNF from the K Basins, with the addition a fuel fire in an MCO,
which is discussed in the following section.
Stabilization and Storage of K Basins SNF. After removal of SNF from
the K Basins, accidents associated with drying or passivation include a fuel
fire in an MCO. Accidents at the dry storage facility could result in failure
of an MCO; however, this accident was not evaluated in detail. The estimated
release (less than 1 µg/day), and the projected frequency of the event
(1 x 10"6 to 1 x 10
"4 per year) are so low that the consequences would be very
small.
Fuel Stabilization at a Drying/Passivation Facility. An MCO containing10 canisters of irradiated fuel and sludge is in the process of being dried
and passivated at a temperature of 300°C (572 0 F). As a result of a loss ofsystem pressure boundary integrity or other failure, control of the process is
lost and the fuel rapidly oxidizes. The heat of oxidation combines with the
heat being externally supplied by the passivation process. The fuel in the
MCO oxidizes with the potential for release of radioactive materials through
pressure boundary failure and complete oxidation. The frequency of such an
event was estimated to be 1 x 10 -6 to 1 x 10"4 per year, during 2 years
required to passivate the fuel, resulting in a cumulative probability of 2 x
10"6 to 2x 10"4.
Table 5-67 contains the estimated airborne release from this accident
based on 10 canisters of the "worst case" fuel (Mark IV fuel irradiated to
16.72% 240Pu/total Pu and cooled 16 years) (Bergsman et al. 1995). Repackaging
fuel to load the MCOs more efficiently would increase the estimated release by
a factor of 1.9.
The consequences of this accident are listed in Table 5-68 with a
maximum individual dose of 2 rem to the offsite resident. The collective dose
to the population would result in less than one (0.03) to 17 latent fatal
5.100
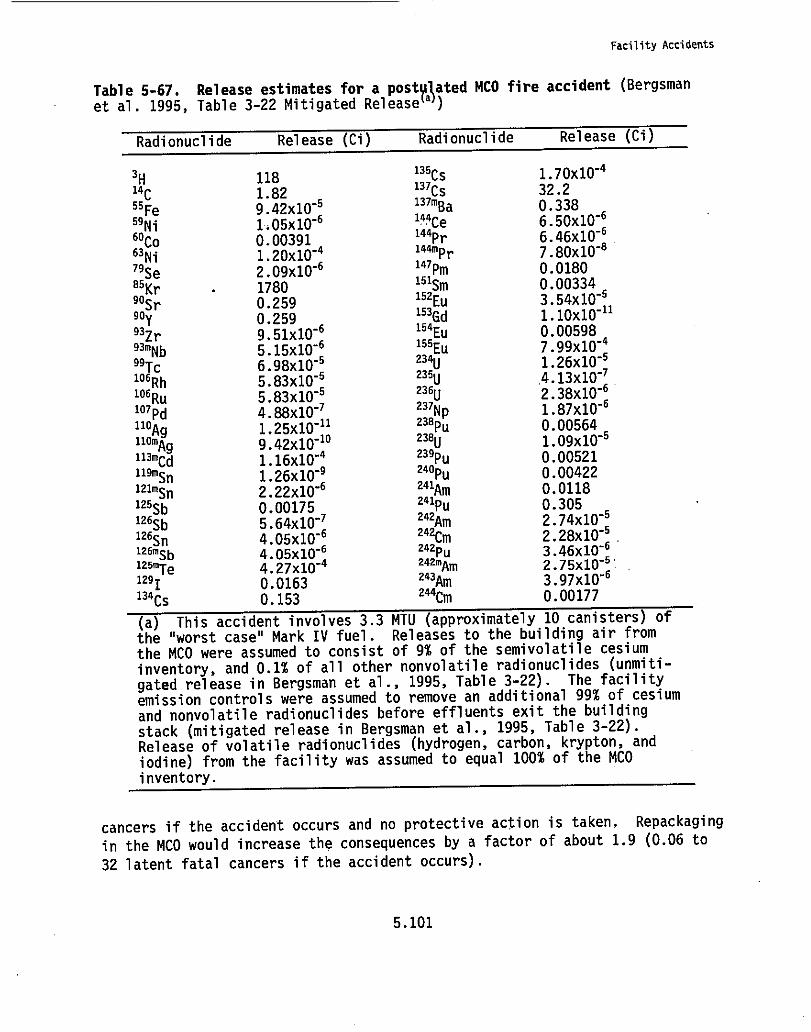
Facility Accidents
Table 5-67. Release estimates for a postMated MCO fire accident (Bergsmanet al. 1995, Table 3-22 Mitigated Release
a )
Radionuclide Release (Ci) Radionuclide Release (Ci)
3H 118135Cs 1.7OX10"4
14c 1.82 131ms32.2
55 Fe 9.42x10"6
Ba 0.338
59Ni 1:05x10"6144Ce 6.50x10"6
60co 0.00391144Pr 6.46x10⁻⁶
63 Ni 1.20x10"4144mPr 7.80X10
"8
79Se 2.09x10"6141Pm 0.0180
85Kr90Sr
17800.259
151Sm152Eu
0.003343.54x10 "6
90y 0.259153Gd 1.10x10
"11
93Zr 9.51x10"6154 E 0.00598
93mNb 5.15x10"6155Eu 7.99x10"4
99Tc 6.98x10"5234U 1.26x10"5
106 Rh 5.83x10"5235U 4.13x10"7
106 R 5.83x10"5236u 2.38x10"6
107 Pd 4.88x10"7237Np 1.87x10"6
11OAg 1.25x10"11 238pu 0.00564
110mAg 9.42X10 "102380 1.09x10"6
113mCd 1.16x10'4239Pu 0.00521
119MSn 1.26X10"9240pu 0.00422
121mSn 2.22x10"6241Am 0.0118
125Sb126Sb
0.001755.64x10'1
241Pu242Am
0.3052.74x10"6
126Sn 4.05x106242cm 2.28x10 "6.
126mSb 4.05x10'6242pu 3.46X10⁶
125mTe1291
4.27x10'40.0163
242mAm243Am
2.75x10'5'3.97x10'6
134Cs 0.153244Cm 0.00177
(a) This accident involves 3.3 MTU (approximately 10 canisters) of
the "worst case" Mark IV fuel. Releases to the building air from
the MCO were assumed to consist of 9% of the semivolatile cesium
inventory, and 0.1% of all other nonvolatile radionuclides (unmiti-
gated release in Bergsman et al., 1995, Table 3-22). The facility
emission controls were assumed to remove an additional 99% of cesium
and nonvolatile radionuclides before effluents exit the building
stack (mitigated release in Bergsman et al., 1995, Table 3-22).
Release of volatile radionuclides (hydrogen, carbon, krypton, and
iodine) from the facility was assumed to equal 100% of the MCO
inventory.
cancers if the accident occurs and no protective action is taken. Repackaging
in the MCO would increase the consequences by a factor of about 1.9 (0.06 to
32 latent fatal cancers if the accident occurs).
5.101
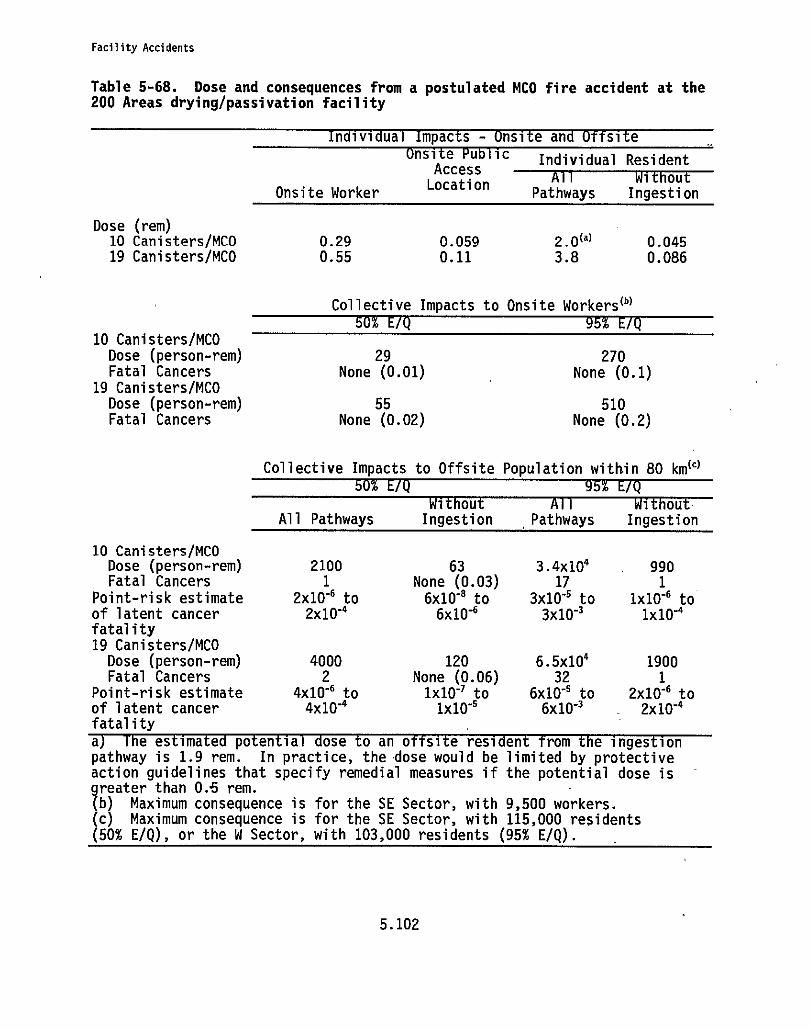
Facility Accidents
Table 5-68. Dose and consequences from a postulated MCO fire accident at the200 Areas drying/passivation facility
unsize ruDlic Individual ResidentAccess Without
Onsite WorkerLocation
Pathways Ingestion
Dose (rem)10 Canisters/MCO19 Canisters/MCO
0.29 0.059 2.0i'i 0.045
0.55 0.11 3.8 0.086
Collective Impacts to Onsite Workers (b)
10 Canisters/MCODose (person-rem)Fatal Cancers
19 Canisters/MCODose (person-rem)Fatal Cancers
29
270None (0.01)
None (0.1)
55
510None (0.02)
None (0.2)
Collective Impacts to Offsite
lation within 80 km(')
All Pathways Ingestion Pathways Ingestion
10 Canisters/MCODose (person-rem) 2100 63 3.4x10" 990Fatal Cancers 1 None (0.03) 17 1
Point-risk estimate 2x10"6 to 6x10'8 to 3x10'5 to 1x10"6 to
of latent cancer 2x10'4 6x10'6 3x10"' 1x10"4fatality19 Canisters/MCODose (person-rem) 4000 120 6.5x10⁴ 1900Fatal Cancers 2 None (0.06) 32 1
Point-risk estimate 4x10⁻⁶ to 1x10-' to 6x10'5 to 2x10"6 toof latent cancer 4x10⁻⁴ 1x10"5 6x10"' 2x10'4fatality
a The estimated potential dose to an offsite resident rom the ingestionpathway is 1.9 rem. In practice, the dose would be limited by protectiveaction guidelines that specify remedial measures if the potential dose isgreater than 0.3 rem.(b) Maximum consequence is for the SE Sector, with 9,500 workers.(c) Maximum consequence is for the SE Sector, with 115,000 residents(50% E/Q), or the W Sector, with 103,000 residents (95% E/Q).
5.102
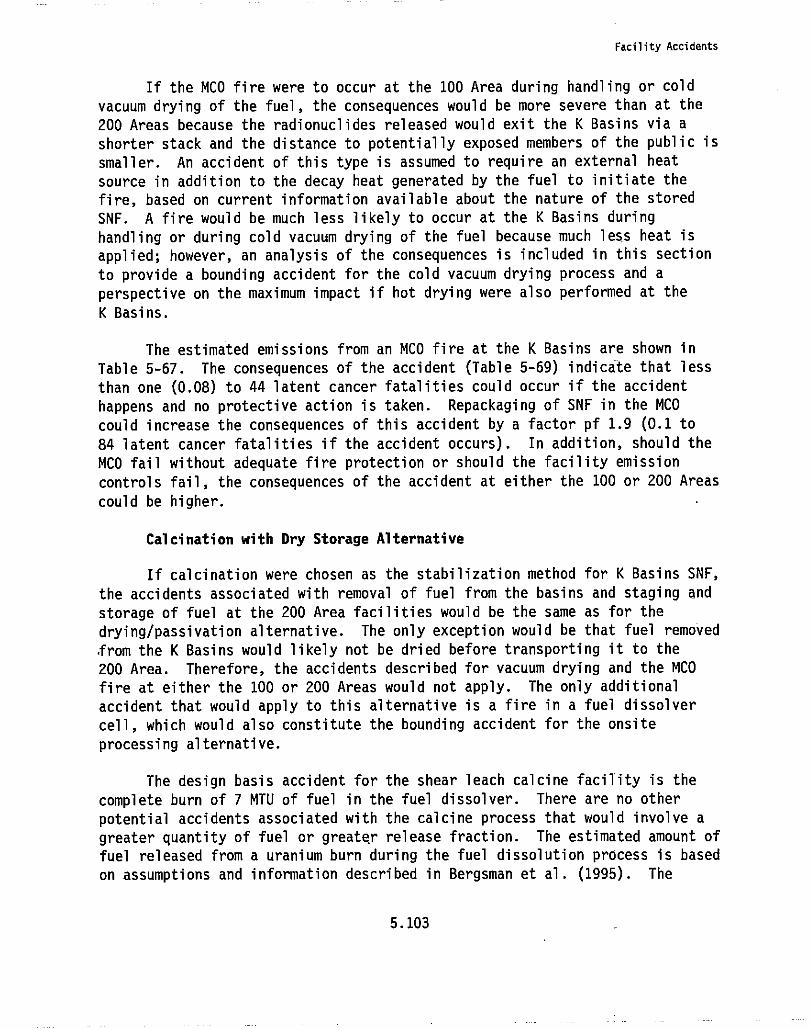
Facility Accidents
If the MCO fire were to occur at the 100 Area during handling or cold
vacuum drying of the fuel, the consequences would be more severe than at the
200 Areas because the radionuclides released would exit the K Basins via a
shorter stack and the distance to potentially exposed members of the public is
smaller. An accident of this type is assumed to require an external heat
source in addition to the decay heat generated by the fuel to initiate the
fire, based on current information available about the nature of the stored
SNF. A fire would be much less likely to occur at the K Basins during
handling or during cold vacuum drying of the fuel because much less heat is
applied; however, an analysis of the consequences is included in this section
to provide a bounding accident for the cold vacuum drying process and a
perspective on the maximum impact if hot drying were also performed at the
K Basins.
The estimated emissions from an MCO fire at the K Basins are shown in
Table 5-67. The consequences of the accident (Table 5-69) indicate that less
than one (0.08) to 44 latent cancer fatalities could occur if the accident
happens and no protective action is taken. Repackaging of SNF in the MCO
could increase the consequences of this accident by a factor pf 1.9 (0.1 to
84 latent cancer fatalities if the accident occurs). In addition, should the
MCO fail without adequate fire protection or should the facility emission
controls fail, the consequences of the accident at either the 100 or 200 Areas
could be higher.
Calcination with Dry Storage Alternative
If calcination were chosen as the stabilization method for K Basins SNF,
the accidents associated with removal of fuel from the basins and staging and
storage of fuel at the 200 Area facilities would be the same as for the
drying/passivation alternative. The only exception would be that fuel removed
.from the K Basins would likely not be dried before transporting it to the
200 Area. Therefore, the accidents described for vacuum drying and the MCO
fire at either the 100 or 200 Areas would not apply. The only additional
accident that would apply to this alternative is a fire in a fuel dissolver
cell, which would also constitute the bounding accident for the onsite
processing alternative.
The design basis accident for the shear leach calcine facility is the
complete burn of 7 MTU of fuel in the fuel dissolver. There are no other
potential accidents associated with the calcine process that would involve a
greater quantity of fuel or greater release fraction. The estimated amount of
fuel released from a uranium burn during the fuel dissolution process is based
on assumptions and information described in Bergsman et al. (1995). The
5.103
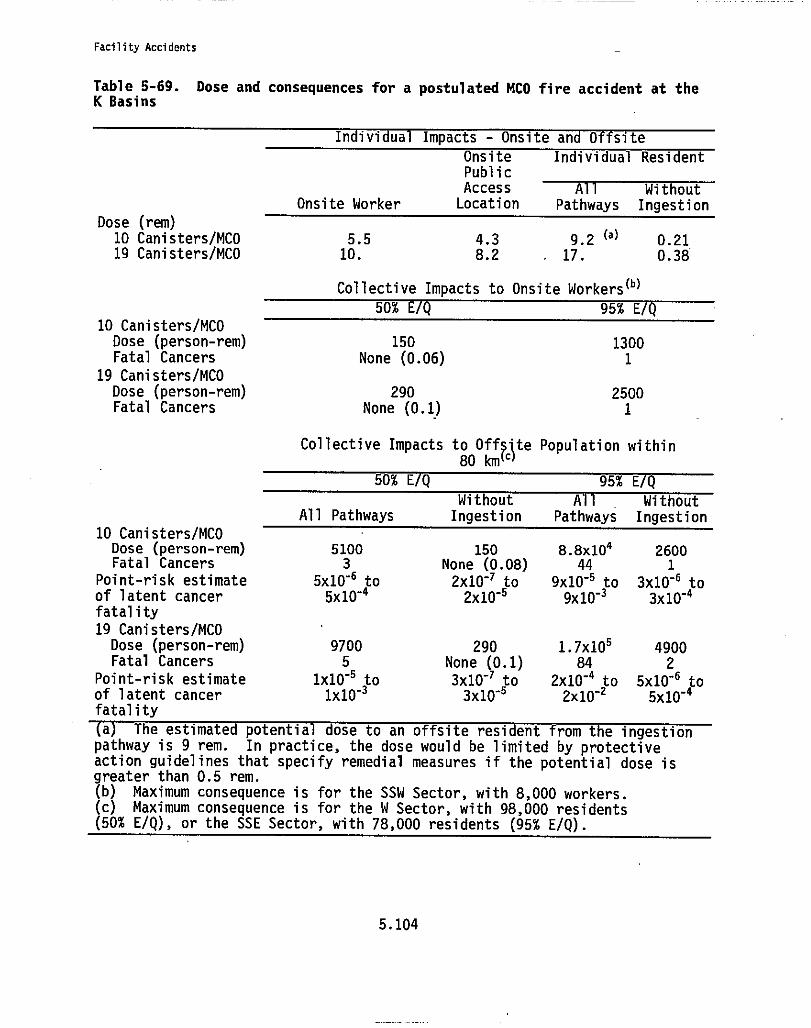
Facility Accidents
Table 5-69. Dose and consequences for a postulated MCO fire accident at theK Basins
Individual Impacts - Onsite and Offsite
Onsite Individual ResidentPublicAccess All Wit out
Onsite Worker Location Pathways IngestionDose (rem)
10 Canisters/MCO 5.5 4.3 9.2 (a) 0.2119 Canisters/MCO 10. 8.2 17. 0.38
Collective Impacts to Onsite Workers(b)
50% E Q 95% E10 Canisters/MCODose (person-rem) 150 1300Fatal Cancers None (0.06) 1
19 Canisters/MCODose (person-rem) 290 2500Fatal Cancers None (0.1) 1
Collective Impacts to Off? ite Population within80 km `
50% E Q 95% —E
Wit out All WithoutAll Pathways Ingestion Pathways Ingestion
10 Canisters/MCODose (person-rem) 5100 150 8.8x10⁴ 2600Fatal Cancers 3 None (0.08) 44 1
Point-risk estimate 5x10"6 to 2x10⁻⁷ to 9x10⁻⁵ to 3x10
"6 to
of latent cancer 5x10⁻⁴ 2x10⁻⁵ 9x10-33x10
"4
fatality
19 Canisters/MCODose (person-rem) 9700 290 1.7x10⁵ 4900Fatal Cancers 5 None (0.1) 84 2
Point-risk estimate 1x10⁻⁵ to 3x10' to 2x10"4 to 5x10'6 to
of latent cancer 1x10"3
3x10'5 2x10⁻² 5x10"4
fatalitv
tai ine eszimazea pozentiai aose to an orrsite resiaent Trom the ingestionpathway is 9 rem. In practice, the dose would be limited by protectiveaction guidelines that specify remedial measures if the potential dose isgreater than 0.5 rem.(b) Maximum consequence is for the SSW Sector, with 8,000 workers.(c) Maximum consequence is for the W Sector, with 98,000 residents(50% E/Q), or the SSE Sector, with 78,000 residents (95% E/Q).
5.104
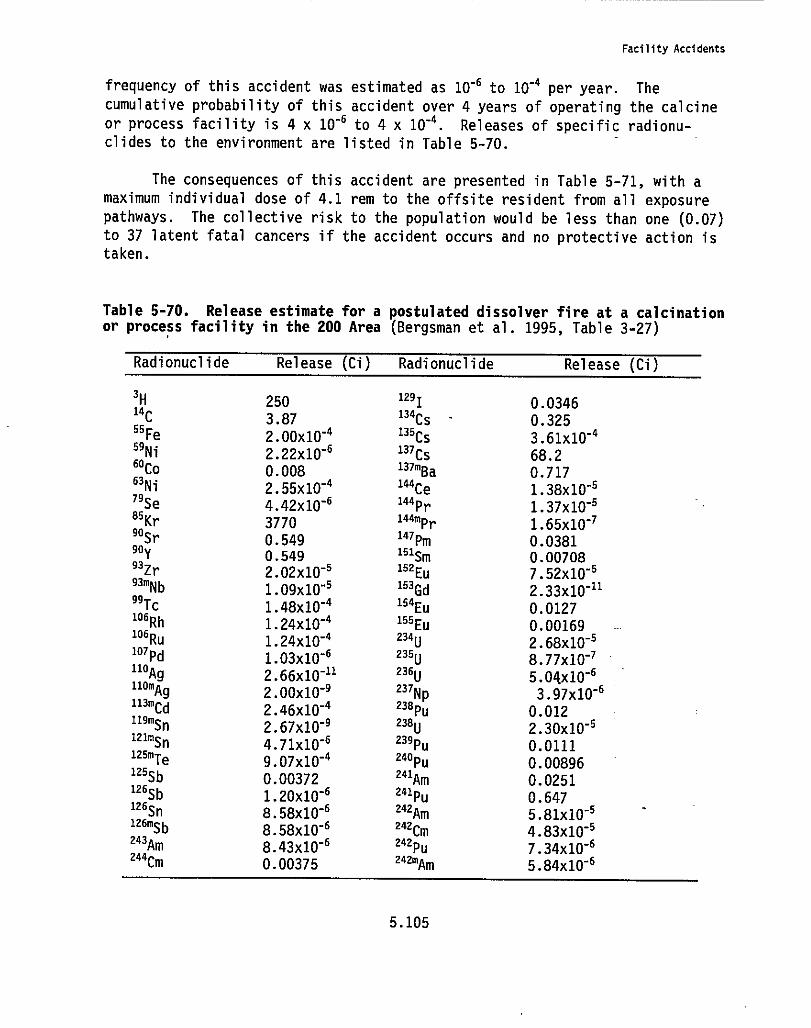
Facility Accidents
frequency of this accident was estimated as 10"6 to 10
"4 per year. The
cumulative probability of this accident over 4 years of operating the calcine
or process facility is 4 x 10"6 to 4 x 10"4 . Releases of specific radionu-clides to the environment are listed in Table 5-70.
The consequences of this accident are presented in Table 5-71, with a
maximum individual dose of 4.1 rem to the offsite resident from all exposure
pathways. The collective risk to the population would be less than one (0.07)
to 37 latent fatal cancers if the accident occurs and no protective action istaken.
Table 5-70. Release estimate for a postulated dissolver fire at a calcinationor process facility in the 200 Area (Bergsman et al. 1995, Table 3-27)
Radionuclide Release (Ci) Radionuclide Release (Ci)
3H 250 12910.034614C
3.87 134cs0.325
55Fe2.00XIO"4 135cs
3.61x10-459Ni
2.22x10'6 137Cs68.260co
0.008 137mBa0.71763 Ni
2.55x10"4 144ce1.38x10-5
79$e4.42x10"6 144 Pr
1.37x10"585Kr
3770 144m Pr1.65x10"7
90Sr 0.549 147Pm 0.038190Y
93Zr0.5492.02x10'5
151Sm152Eu
0.007087.52x10"5
93mNb1.09x10'5 153 G
2.33x10'1199Tc 1.48x10"4 154 E 0.0127106 Rh
1.24x10"4 155Eu0.00169106 R
1.24x10"4 234U2.68x10-5107 Pd
1.03x10"6 235U8.77x10-7
11oA9 2.66x10 -11 236U5.04x10"6
113mAg2.00x10-9 237Np
3.97x10"6113mCd
2.46x10⁻⁴ 238pu0.012
119mSn2.67x10"9 238U
2.30x10"5121mSn
4.71x10"6 239Pu0.0111
125mTe9.07x10"4 240Pu 0.00896
125Sb0.00372 241Am
0.0251126Sb
1.20x10"6 241Pu0.647
126Sn8.58x10"6 242 Am
5.81x10"5126mSb
8.58x10"6 242cm4.83x10'5
243Am8.43x10"6 242Pu
7.34x10-6244Cm0.00375 242mAm
5.84x10"6
5.105
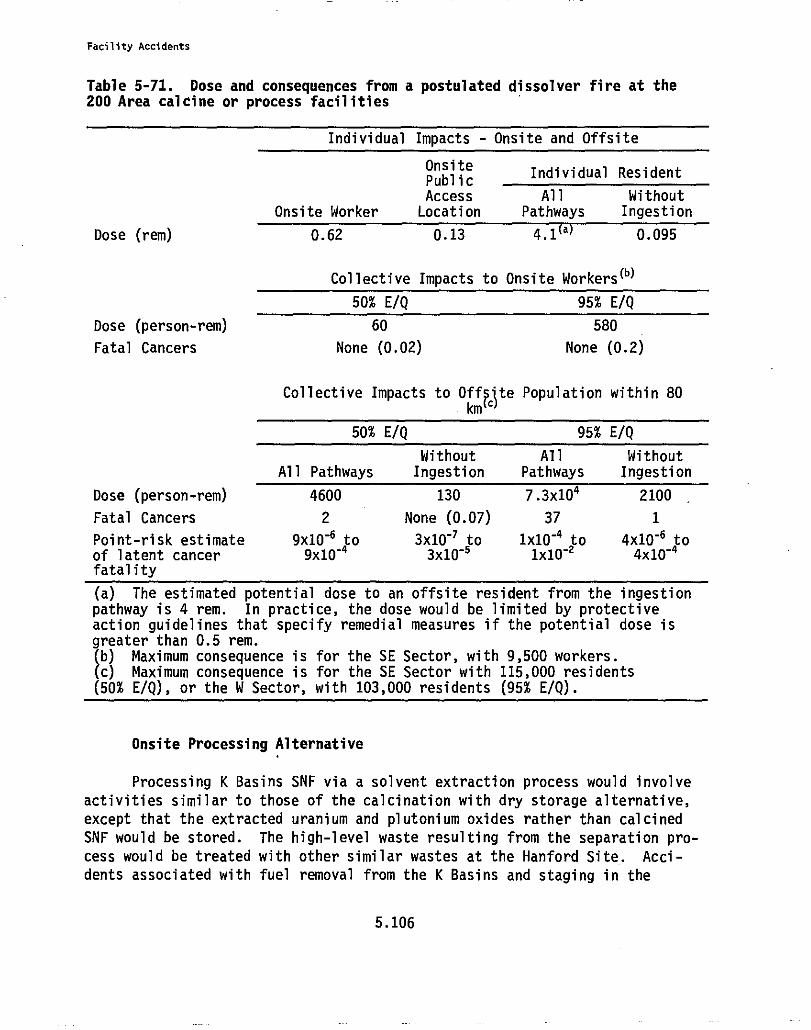
Facility Accidents
Table 5-71. Dose and consequences from a postulated dissolver fire at the200 Area calcine or process facilities
Individual Impacts - Onsite and Offsite
Dose (rem)
OnsiteIndividual Resident
PublicAccess All Without
Onsite Worker Location Pathways Ingestion
0.62 0.13 4.1 a
0.095
Collective Impacts to Onsite Workers(b)
50% E/Q 95% E/Q
Dose (person-rem)
60
580
Fatal Cancers
None (0.02)
None (0.2)
Collective Impacts to Okm^Ite Population within 80
50% E/Q 95% E/Q
Without All WithoutAll Pathways Ingestion Pathways Ingestion
Dose (person-rem) 4600 130 7.3x10" 2100
Fatal Cancers 2 None (0.07) 37 1
Point-risk estimate 9x10"6 to 3x10"
7 to 1x10"4 to 4x10 "6 to
of latent cancer 9x10"4 3x10"6
1x10"2 4x10⁻⁴
fatality
(a) The estimated potential dose to an offsite resident from the ingestionpathway is 4 rem. In practice, the dose would be limited by protectiveaction guidelines that specify remedial measures if the potential dose isgreater than 0.5 rem.(b) Maximum consequence is for the SE Sector, with 9,500 workers.(c) Maximum consequence is for the SE Sector with 115,000 residents(50% E/Q), or the W Sector, with 103,000 residents (95% E/Q).
Onsite Processing Alternative
Processing K Basins SNF via a solvent extraction process would involve
activities similar to those of the calcination with dry storage alternative,
except that the extracted uranium and plutonium oxides rather than calcined
SNF would be stored. The high-level waste resulting from the separation pro-
cess would be treated with other similar wastes at the Hanford Site. Acci-
dents associated with fuel removal from the K Basins and staging in the
5.106
Facility Accidents
200 Areas would be similar to those described in the wet storage alternative.
Accidents at the process facility would be bounded by the uranium fire des-
cribed in the previous section for the calcine facility (see Tables 5-70 and
5-71). Accidents during storage of uranium and plutonium are described in
safety documentation for existing facilities and have not been reevaluated for
this analysis. The bounding accident associated with uranium storage is
addressed in the UO3 Plant Safety Analysis Report (WHC 1993b). Actual impacts
are likely to be lower than those estimated in the safety analysis because the
uranium will be stored inside a building rather than outside as they are inthe UO3 Plant. The bounding accident associated with plutonium storage is
addressed in the PFP Safety Analysis Report (WHC 1995).
Foreign Processing Alternative
Accidents associated with preparation of K Basins SNF for overseas
shipment would generally be the same as those described previously for the no
action alternative. A dropped transfer cask represents the maximum reasonably
foreseeable accident associated with loading the fuel for shipment
(Tables 5-56 and 5-57). The cumulative frequency and point risk estimates of
latent fatal cancer are assumed to be twice those for the enhanced K Basin
storage alternative, however, because the fuel in both the KE and KW Basins
would be removed for shipment. Other accidents related to continued operation
of the K Basins--the liquid release and spray leak scenarios (Tables 5-58,
5-59, and 5-60)--would result in lower consequences than the cask drop, and
they would be less likely because of the limited time during which theK Basins would operate under this alternative.
5.15.6 Secondary Impacts of Radiological Accidents
Secondary impacts of radiological accidents have been evaluated quali-
tatively for this analysis. Although the levels of environmental contamina-
tion were not assessed directly, the dose to the offsite MEI provides a
measure of the air concentration and radionuclide deposition at the Site
boundary. Therefore, the dose can be used as a semi-quantitative estimate of
the level of environmental contamination from a given accident.
Accidents that result in estimated doses of less than 0.5 rem to the MEI
would likely have little or no secondary impacts because the levels of offsite
environmental contamination in these cases would be relatively small.
Accidents that exceed estimated doses of 0.5 rem to the MEI would have
some secondary impacts, with their extent and severity depending on the
expected levels of environmental contamination. Protective action guidelines
5.107
Facility Accidents
would require mitigating actions such as evacuation of residents surrounding
the Site or interdiction of food crops depending on the nature and location of
the accident as described in Section 5.20. Other secondary impacts might
include:
• local (onsite) effects on ecosystems or individual members of somesensitive species
• temporary closure of the Columbia River, shorelines, and affectedislands (including restrictions on traditional fishing rights andrecreational use of the river for boating or fishing)
• temporary local restrictions on use of river water for agricultural ordomestic purposes
• possible loss of agricultural crops
• temporary restrictions on land use for agricultural purposes
• costs associated with cleanup of environmental contamination.
Accidents evaluated for this EIS that could result in secondary impacts
of this magnitude include MCO handling or overpressure accidents at the wet
storage facility, an MCO fire at K Basins or the passivation facility, and a
uranium fire at the calcination or processing facility. Others would result
in only local, onsite impacts.
5.15.7 Nonradiological Accident Analysis
For purposes of this EIS, a bounding accident scenario was developed for
each existing and planned facility. The methods for assessment of the nonrad-
iological . accident scenario are summarized in this section. The accident
assumes that a chemical spill occurs within a building and is followed by an
environmental release from the normal exhaust system. It is assumed that the
building remains intact but containment measures fail, allowing releases to
occur through the ventilation system. The assumption is made that all, or a
portion of, the entire inventory of toxic chemicals stored in each building is
spilled. The environmental releases are modeled, and the hypothetical concen-
trations at three key receptor locations are compared to toxicological limits.
Several chemical inventory and chemical emissions lists are provided by
alternative and facility in Bergsman et al. (1995) and the DOE SNF PEIS (DOE
1995a, Table A-18). Effects to collocated workers, the public at nearest
point of public access, and the public at the nearest offsite residence were
estimated using the computer model EPIcode (Homann Associates Incorporated
1988). Results from the EPIcode model were compared to available Emergency
5.108
Facility Accidents
Response Planning Guideline values, Immediately Dangerous to Life and Health
values, and Threshold Limit Values/Time Weighted Averages. In the absence of
these values, acute toxicity data from the Registry of Toxic Effects for
Chemical Substances were utilized to generate exposure limits to approximate
Emergency Response Planning Guideline endpoints--irritation/odor, irreversible
health effects, and death.
Table 5-72 presents for.all alternatives the bounding nonradiological
impacts to collocated workers, the public at the nearest point of public
access, and the public at the nearest offsite residence for the postulated
accident scenarios. The potential consequences of these accidents are
discussed in the following subsections
No Action Alternative
A baseline of chemicals kept in the K Basins was developed from chemical
inventories for these facilities compiled in 1992 to comply with the Emergency
Planning and Community Right-To-Know Act.
Under the no action alternative, there would be a potential for fatali-
ties to collocated workers and the public at the nearest point of public
access from an accident in which sulfuric acid is released from the KE or KW
Basin or PCBs are released from the KE Basin facility. The public at the
nearest offsite residence could suffer health effects from the accident
involving the release of PCBs in the KE Basin facility. Health effects to
collocated workers and the public at the nearest point of public access could
also occur from an accident in which sodium hydroxide is released from either
the KE or KW Basins. Irritation and odor would be problem for nearby workers
and public at nearest point of public access from accidents involving the
release of chlorine stored in either basin or by polyacrylamide released from
the KW Basin.
Enhanced K Basins Storage Alternative
The enhanced K Basins storage alternative would have the same accident
scenarios and impacts as the no action alternative.
Wet Storage Alternative
Because the K Basins would be in operation during the removal and trans-
port of the SNF to the wet storage facility, accident scenarios under the wet
storage alternative would include accident scenarios described in the no
action alternative. The new wet storage facility can be either a storage pool
5.109
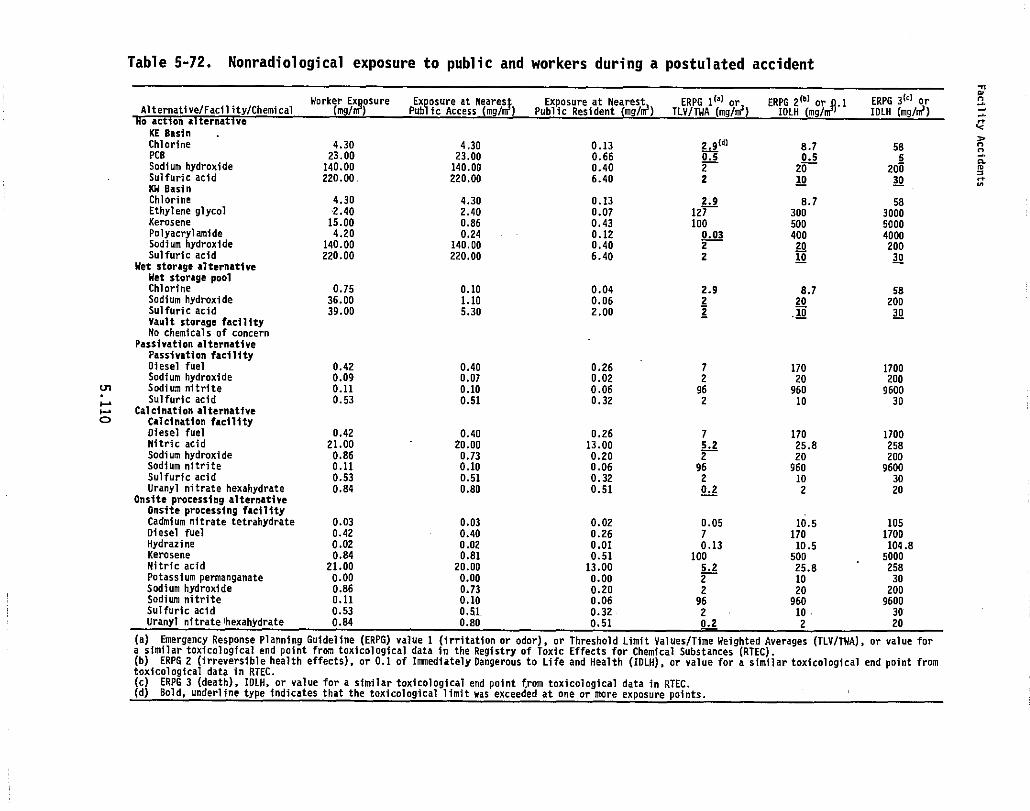
at
ff
I ERPG 3101
KE BasinChlorine 4.30 4.30 0.13 2.901 8.7 58PCB 23.00 23.00 0.66 0.5 0.5 5Sodium hydroxide 140.00 140.OD 0.40 2 20 200Sulfuric acid 220.00. 220.00 6.40 2 10 30KW Basin - - -Chlorine 4.30 4.30 0.13 2.9 8.7 58Ethylene glycol 2.40 2.40 0.07 121 300 3000Kerosene 15.00 0.86 0.43 100 500 5000Polyacrylamide 4.20 0.24 - 0.12 0.03 400 4000Sodium hydroxide 140.00 140.00 0.40 2 20 200Sulfuric acid 220.00 220.00 6.40 2 10 30
Wet storage alternativeWet storage poolChlorine 0.75 0.10 0.04 2.9 8.7 58Sodium hydroxide 36.00 1.10 0.06 2 20 20DSulfuric acid 39.00 5.30 2.00 2 .10 30Vault storage facilityNo chemicals of concern
Passivation alternativePassivation facilityDiesel fuel 0.42 0.40 0.26 7 170 1700Sodium hydroxide 0.09 0.07 0.02 2 20 200Sodium nitrite 0.11 0.10 0.06 96 960 9600Sulfuric acid 0.53 0.51 0.32 2 10 30
Calcination alternativeCalcination facilityDiesel fuel 0.42 0.40 0.26 7 110 1700Nitric acid 21.00 20.00 13.00 5.2 25.8 258Sodium hydroxide 0.86 0.73 0.20 2 20 200Sodium nitrite 0.11 0.10 0.06 96 960 9600Sulfuric acid 0.53 0.51 0.32 2 30 30Uranyl nitrate hexahydrate 0.84 0.80 0.51 0.2 2 20
Onsite processing alternativeOnsite processing facilityCadmium nitrate tetrahydrate 0.03 0.03 0.02 0.05 10.5 105Diesel fuel 0.42 0.40 0.26 7 170 170DHydrazine 0.02 0.02 0.01 0.13 10.5 104.8Kerosene 0.84 0.81 0.51 100 500 5000Nitric acid 21.00 20.00 13.00 5.2 25.8 258Potassium permanganate 0.00 0.00 0.00 2 10 30Sodium hydroxide 0.86 0.73 0.20 2 20 200Sodium nitrite 0.11 0.10 0.06 96 960 9600Sulfuric acid 0.53 0.51, 0.32 2 10 30Uranyl nitrate i hexahydrate 0.84 0.80 0.51 0.2 2 20
(a) Emergency Response Planning Guideline (ERPG) value 1 (irritation or odor), or Threshold Limit Values/Time Weighted Averages (TLV/TWA), or value fora similar toxicological end point from toxicological data in the Registry of Toxic Effects for Chemical Substances (RTEC).(b) ERPG 2 (irreversible health effects), or 0.1 of Immediately Dangerous to Life and Health (IDLH), or value for a similar toxicological end point fromtoxicological data in RTEC.(c) ERPG 3 (death), IDLH, or value for a similar toxicological end point from toxicological data in RTEC.(d) Bold, underline type indicates that the toxicological limit was exceeded at one or more exp osure points.
a
K
n6
N
csr
r
0
Table 5-72. Nonradiological exposure to public and workers during a postulated accident
Facility Accidents
or a storage vault. The wet storage pool uses the KE Basin as a surrogate for
a baseline chemical inventory. The vault storage facility does not have any
significant amounts of chemicals (Bergsman et al. 1995).
Under the wet storage alternative, impacts from the accident scenarios
involving the K Basins would present the major health impacts to workers and
the public. After the K Basins are shut down, the impacts from accident
scenarios involving the new storage pool (Table 5-72) would be possible fatal-
ities to collocated workers from a release of sulfuric acid. No significant
impacts would occur from accident scenarios involving the.new storage vault.
Drying/Passivation With Dry Storage Alternative
Accidents under conditions of this alternative would include scenarios
for the drying/passivation facility as well as those described in the no
action alternative because the K Basins would still be in operation during the
removal and transport of the SNF, and those described in the wet storage
alternative in this section because the fuel would need to be temporarily
stored before passivation.
Consequences of accidents at the drying/passivation facilities are based
on previously evaluated accidents for similar installations, adapted for the
conditions and location of these facility as assumed in this EIS. Baseline.
chemical inventories for the proposed facility are primarily derived from the
facility engineering design data (DOE 1995a).
Under the passivation alternative, the major health impacts to workers
and the public would be from accidents involving the chemicals stored in the
K Basins. Impact on workers and the public from accidents involving the
chemicals stored in the passivation plant would be small and would pose no
major health risks (Table 5-72).
Calcination Followed by Dry Storage Alternative
Accidents under conditions of the calcination alternative would include
accident scenarios for the calcination facility and those described in the no
action alternative in this section because the K Basins would still be in
operation during the removal of the fuel from the basins, and those described
in the wet storage alternative in this section because the fuel would need to
be temporarily stored before being processed by the calcination facility.
Consequences of accidents at the calcination facility are based on
previously evaluated accidents for similar installations, adapted for the
5.111
Facility Accidents
conditions and location of this facility as assumed in this EIS. Baseline
chemical inventories for the proposed facility are primarily derived from the
facility engineering design data (DOE 1995a).
Under the calcination alternative, the major health impacts to workers
and the public would be from accidents involving the chemicals stored in the
K Basins. The major health impacts from the calcination facility would be
potential irritation and odor problem for collocated workers and the public
from accidental releases of nitric acid or uranyl nitrate hexahydrate stored
in the calcination facility (Table 5-72).
Onsite Processing Followed by Storage Alternative
Accidents in the onsite processing alternative would include accident
scenarios for the processing facility as well as those described in the no
action alternative in this section because the K Basins would still be in
operation during the removal of the fuel, and those described in the wet
storage alternative in this section because the fuel would need to be tempor-
arily stored before processing.
Consequences of the processing facility accidents are based on previ-
ously evaluated accidents for similar installations, adapted for the condi-
tions and location of these facilities as assumed in this EIS. Baseline
chemical inventory for the proposed facilities is primarily derived from the
facility engineering design data (DOE 1995a).
Under the onsite processing alternative, the major health impacts to the
workers and the public would be from accidents involving chemicals stored in
the K Basins. The major health impacts from the processing facility (see
Table 5-72) would be potential irritation or odor problems from the releases
of nitric acid or uranyl nitrate hexahydrate stored in the processing
facility.
Foreign Processing Alternative
Because the K Basins would be in operation during the removal and
transport of the SNF, accident scenarios under the foreign processing alter-
native would include accident scenarios described in the no action alterna-
tive. Of the three new facilities (the transloading facility, the staging
facility, and the UO3 storage facility) associated with the foreign processing
alternative the transloading and UO 3 facilities would not have any significant
amounts of chemicals (Bergsman et al. 1995). The staging facility would be
the same as the facility in the wet storage alternative.
5.112
Cumulative Impacts
Under the foreign processing alternative, impacts from accident sce-
narios involving the K Basins would present the major health impacts to
workers and the public. After the K Basins are shut down, significant impacts
would be from accident scenarios involving the staging facility as described
in the wet storage alternative.
5.15.8 Construction and Occupational Accidents
Table 5-73 shows the estimated number of injuries, illnesses, and
fatalities among workers from construction activities and facility operations
for each alternative. Injury, illness, and fatality rates for construction
workers are presented separately from those for facility operation because of
the relatively more hazardous nature of construction work.
The alternatives that require processing or calcination of the K Basin
SNF before storage represent the highest predicted construction and occupa-
tional accident rates of the alternatives. The higher number of injuries is
attributable to the increased scope of construction and labor requirements for
fuel stabilization in these alternatives. The lowest accident rates for the
onsite alternatives are associated with the passivation/dry storage alterna-
tive because of the relatively simpler nature of the construction and the
longer-term labor savings from dry storage of the stabilized SNF. The foreign
processing alternative results in the lowest onsite consequences because a
substantial amount of activity (construction and operation of the process
facility) would occur at an overseas location.
5.16 Cumulative Impacts Including Past and Reasonably Foreseeable Actions
Cumulative impacts associated with implementing the alternatives for
storage of K Basins SNF at the Hanford Site together with impacts from past
and reasonably foreseeable future actions are described in the following
subsections.
5.16.1 Land Use, Geological Resources, and Ecological Resources
The Hanford Site covers about 1450 km 2 (570 mi 2), of which about 87 kmZ
(34 mi l) have been disturbed. Implementation of the no action and enhanced
K Basins alternatives would not affect land use at Hanford because all facili-
ties utilized in these alternatives currently exist. Construction of new
facilities in the other alternatives for storage of K Basins SNF would disturb
varying areas of previously undisturbed land if construction occurred at the
reference site, up to a maximum of 20 acres for the onsite processing alterna-
tive. Construction at the CSB site would occur on land that has previously
5.113
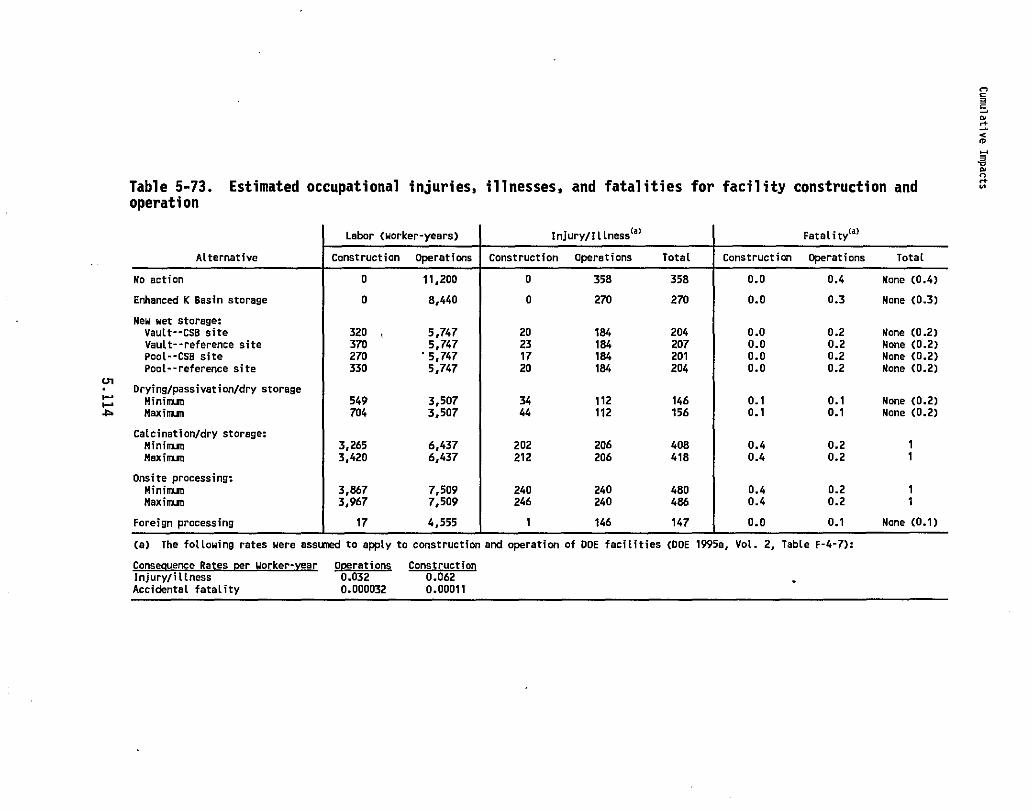
c3car'm
3vNn
Table 5-73. Estimated occupational injuries, illnesses, and fatalities for facility construction and K
operation
Labor (worker-years) Injury/I LLness (a) Fate Lity(a)
Construction Operations Construction Operations Total Construction OperationsAlternative
No action 0 11,200 0 358 358 0.0 0.4
Enhanced K Basin storage 0 8,440 0 270 270 0.0 0.3
New wet storage:Vault--CBB site 320 ,,. 5,747 20 184 204 0.0 0.2Vault--reference site 370 5,747 23 184 207 0.0 0.2PooL--CBB site 270 -5,747 17 184 201 0.0 0.2Pool--reference site 330 5,747 20 184 204 0.0 0.2
toDrying/passivation/dry storage
Minimum 549 3,507 34 112 146 0.1 0.14pMaximum 704 3,507 44 112 156 0.1 0.1
Calcination/dry storage:Minimum 3,265 6,437 202 206 408 0.4 0.2Maximum 3,420 6,437 212 206 418 0.4 0.2
Onsite processing:Minimum 3,867 7,509 240 240 480 0.4 0.2Maximum 3,967 7,509 246 240 486 0.4 0.2
Foreign processing 17 4,555 1 146 147 0.0 0.1
(a) The following rates were assumed to apply to construction and operation of DOE facilities (DOE 1995x, Vol. 2, Table F-4-7):
Consequence Rates Per Worker-year Operations ConstructionInjury/illness 0.032 0.062 -AccidentaL fatality 0.000032 0.00011
Total
None (0.4)
None (0.3)
None (0.2)None (0.2)None (0.2)None (0.2)
None (0.2)None (0.2)
11
11
None (0.1)
Cumulative Impacts
been excavated and would require little if any new land disturbance. The
represents less than 0.1% of the existing disturbed area on the Site, and less
than 0.01% of the total Site. The impact of any of the alternatives would
therefore be negligible in terms of land use or geological resources.
The cumulative effects of constructing new SNF management facilities in
relatively undisturbed areas such as the reference site, in addition to other
ongoing or future developments, may reduce the availability of shrub-steppe
habitat at Hanford. For example, construction of the Environmental Restora-
tion Disposal Facility would disturb approximately 4.1 km 2 (1,000 acres) of
land. Shrub-steppe habitat is used by several listed or candidate bird and
mammal species for forage or nesting, although nesting of these species was
not directly observed at the sites surveyed for the facilities evaluated in
this EIS. Fragmentation or removal of potential nesting and foraging habitat
could negatively affect the long-term viability of populations of these
species at Hanford.
5.16.2 Air Quality
Air quality limits (WAC 173-470-030,-100) at the Hanford Site boundary
are not expected to be approached as a result of reasonably foreseeable
additions to the Hanford Site, e.g., construction and operation of a Laser
Interferometer Gravitational-Wave Observatory or from decommissioning of
unused facilities or site restoration activities. Air quality analysis for
the EIS alternatives indicates that implementation of any of the alternatives(other than foreign processing) would result in little likelihood of these
limits being exceeded, even in conjunction with other site activities and
other nuclear facilities in the region (e.g., the WNP-2 power reactor or the
nearby Siemens commercial reactor fuel fabrication facility).
Under the foreign processing alternative, construction of a transloading
facility at the 100-K Area could result in fugitive dust concentrations that
approach 24-hour air quality standards at locations accessible by the public.
Although dust suppression measures could be employed, the proximity of these
facilities to the Columbia River would make it difficult to ensure that the
air quality standards could be met if construction of SNF management facili-
ties were to coincide with some other construction or Site restoration
activities.
5.16.3 Waste Management
Low-level radioactive wastes generated as a result of facility opera-
tions would amount to less than 5% of the total quantity that is expected to
5.115
Cumulative Impacts
be produced at Hanford during 1995 for all alternatives, and deactivation of
the K Basins would contribute an additional quantity equivalent to 5 to 10% of
the annual production rate (see Section 5.14).
Annual production of transuranic waste from routine operations would
contribute from less than 1 to about 20% of the current Site annual production
for the wet storage and onsite processing alternatives, respectively. Deacti-
vation of one or both of the.K Basins could produce transuranic waste equiva-
lent to 30 to 70% of the annual production at Hanford if KE Basin floor sludge
and sludge from the SNF canisters were disposed as radioactive waste at the
200 Area tank farms.
High-level wastes would only be produced during operation of a
processing facility in the onsite processing alternative, and the total
quantity generated over the 4-year period during which the facility would
operate is relatively small compared to the current Site inventory. Vitrified
high-level waste generated during foreign,processing would ultimately be
stored at Hanford with other treated tank wastes and also would not substan-
tially increase the quantity of such wastes that would be generated by
remediation of existing tank waste.
5.16.4 Socioeconomics
The Hanford Site work force has dropped from above 18,000 in 1994 to
less than 14,000 in late 1995 and is expected to remain approximately at that
level through 2004. The regional work force is expected to range from 81,000
to 86,000 in that same period.
Under the no action and enhanced K Basins storage alternatives, the SNF
work force would remain substantially the same, about 190 to 280 workers.
Construction and operation of new facilities in the other alternatives would
add up to about 1,100 workers on a temporary basis and would result in a net
decrease of 200 to 300 workers compared to the no action alternative on a
longer-term basis. The temporary increases in the onsite work force would not
likely necessitate a substantial increase in the need for community services,
and may help to offset projected work force reductions over the short term.
However, if peak construction activities coincide with the schedule for other
major projects planned for the Hanford Site (for example, construction of
facilities for the tank waste remediation project), there may be short-term
impacts on community services and infrastructure.
5.116
Cumulative Impacts
5.16.5 Occupational and Public Health
The cumulative population dose since plant startup was estimated
to be about 100,000 person-rem (estimated to one significant figure; Sec-
tion 4.12.2). The number of inferred fatal cancers since plant startup would
amount to about 50 (essentially all of which would be attributed to dose
received in the 1945-to-1952 timeframe). In the 50 years since plant startup,
the population of interest (assuming a constant population of 380,000 and
an individual dose of about 0.3 rem/year) would have received about
5,000,000 person-rem from naturally occurring radiation sources (natural
background), which might result in about 2,500 latent cancer fatalities. In
the same 50 years, about 27,000 cancer fatalities from all causes would have
been expected in that population.
Over the next 40 years, if the Hanford Sitewide contribution to public
dose from all exposure pathways is considered (about 0.5 person-rem/year from
DOE facilities and 0.7 person-rem/year from Washington Public Power Supply
System reactor operation), it is estimated that the cumulative collective dose
would be approximately 50 person-rem. No latent cancer fatalities would be
expected from such a dose. Over 40 years of.interim storage of SNF, the
population (380,000 people) would have received 4.,000,000 person-rem from
natural background radiation. That dose might result in 2,000 latent cancer
fatalities. In the same 40 years, about 21,000 cancer fatalities from all
causes would be expected among the population in the region of interest
(within 80 km or 50 miles).
Air and water quality limits for radionuclides and other potentially
hazardous pollutants are not expected to be approached as a result of imple-
menting any of the EIS alternatives or from reasonably foreseeable activities
at the Hanford Site. Therefore, health consequences to workers or the public
would not be expected as a result of discharges from SNF management
operations.
The cumulative dose from all SNF storage activities since facility
startup was estimated at about 2,000 person-rem (DOE 1995a, Section 4.12.1.2),
from which one fatal cancer might be inferred. In the near term, the annual
increments to cumulative worker dose would be expected to be about 21 person-
rem from operation of the K Basins. No latent fatal cancers would be expected
from 40 years of SNF storage in the no action alternative (about 910 person-
rem). Cumulative worker dose from storage and stabilization as needed for
K Basins SNF in the other alternatives would be somewhat higher than in the no
action alternative, and might result in at most one latent cancer fatality.
5.117
Cumulative Impacts
The worker dose from future site restoration activities is difficult to
quantify; however, if Hanford Site workers continue to accumulate dose at the
1994 rate of 210 person-rem/year, the cumulative dose over the next 40 years
would be about 8400 person-rem. The cumulative dose from the start up of
plant operations through the end of the 40-year SNF management period would
therefore amount to about 110,000 person-rem, from which 50 latent cancer
fatalities would be inferred (3 of which are attributable to the SNF manage-
ment period from 1996 to 2035). Over 90 years, about 110 latent cancer fatal-
ities would be inferred from natural background radiation, and 1300 cancer
fatalities from all causes would be expected, in a population of
10,000 workers.
5.17 Adverse Environmental Impacts that Cannot be Avoided
Unavoidable adverse impacts that might arise as a result of implementing
the alternatives for interim storage of SNF at the Hanford Site are discussed
in the following subsections.
5.17.1 No Action and Enhanced K Basins Storage Alternatives
Adverse impacts associated with the no action and enhanced K Basins
storage alternatives would derive from the expense and radiation exposure
associated with maintaining facilities that are near or at the end of their.
design life and the possible future degradation of fuel and facilities, thus
increasing the potential for release of pollutants to the environment.
5.17.2 Other EIS Alternatives
Adverse impacts associated with the EIS alternatives where fuel is
relocated to the 200 Areas would derive principally from construction acti-
vities needed for new facilities. There would be loss or fragmentation of
wildlife habitat, displacement of some animals from the construction site, and
the destruction of plant life within the site up to 8 ha (20 acres) if an
undisturbed site is chosen for construction of new facilities. Criteria
pollutants, radionuclides, and hazardous chemicals would also be released
during some types of SNF management activities. Traffic congestion and noise
are expected to increase by a few percent during the construction of major
facilities.
5.118
Short-Term/Lang-Terns
5.18 Relationship Between Short-Term Uses of the Environment and the
Maintenance and Enhancement of Long-Term Productivity
Storage of K Basins SNF is considered for up to 40 years pending
decisions on ultimate disposition. SNF is essentially uranium-238 with
varying amounts of uranium-235 and small amounts of plutonium contaminated by
small masses of high-activity fission products. Because of this composition,
a decision could be made at the end of the planned storage period to either
continue storage until the energy resource value of the SNF warrants
processing or to determine that the fuel will never have any resource value
and will be disposed of. If the decision is to continue to store the SNF,
that option could be seen as the best use of land at the Hanford Site in terms
of long-term productivity.
If the decision is made to dispose of the SNF, land occupied by SNF
management facilities at the Hanford Site could become available for other
uses. Because of the potential for, or perception of, contamination by
radionuclides or hazardous chemicals, use of the land for agriculture might
not be appropriate. Moreover, the land that is currently occupied, or which
would be occupied, by SNF facilities was of marginal utility for farming
before it was obtained for the Hanford Site. However, other uses, such as for
wildlife refuges, might be appropriate long-term uses of land vacated by SNF
facilities after decommissioning is completed.
5.19 Irreversible and Irretrievable Commitment of Resources
This section addresses the irretrievable commitment of resources that
would likely be used to implement the proposed EIS alternatives. An irre-
trievable resource is a resource that is irreplaceably consumed and cannot
be replenished.
If DOE decides to locate SNF management facilities at the reference
site, or at another previously undisturbed site, construction of the facili-
ties could destroy shrub-steppe habitat, which has been designated as priority
habitat by the State of Washington. This loss would continue until the SNF
facilities were decommissioned, and the site returned to its natural state.
If the CSB site were utilized for SNF management, additional loss of habitat
would not occur because the site was previously . developed for another project.
In either case, land utilized by the facilities would not be available for
other use until after final decommissioning.
5.119

Potential Mitigation Measures
With respect to the discharge of water to the soil column through the
ETF and SALDS, no hazardous substances other than tritium would be released.
Tritium will decay in time, making the soil column available for other uses.
Implementation of EIS alternatives requiring construction of new
facilities would result in the irretrievable use of labor, fossil fuels and
other raw materials in construction activities and in the transport of raw
materials to the project site. In addition, there would be an irretrievable
use of electricity and fossil fuel in the SNF removal and transport opera-
tions. The relative degree of irretrievable and irreversible use of resources
in SNF management alternatives is summarized in Table 5-74.
5.20 Potential Mitigation Measures
This section contains a description of possible mitigation measures that
might be considered to avoid or reduce impacts to the environment as a result
of Hanford Site operations in support of K Basins SNF management. These
measures would be reviewed and revised as appropriate, depending on the
specific actions to be taken at a facility, the level of impact, and other
pertinent factors. Following publication of the record of decision, a mitiga-
tion plan would be prepared to address actions specific to the selected alter-
native. That plan would be implemented, as necessary, to mitigate significant
adverse impacts of SNF management activities. Possible mitigation measures_
are generally the same for all alternatives and are summarized by resource
category below. No impacts on land use, geologic resources, or aesthetic and
scenic resources were identified; therefore, mitigation measures would not be
necessary.
5.20.1 Pollution Prevention/Waste Minimization
The DOE is responding to Executive Order 12856 (58 FR 41981) and
associated DOE Orders and guidelines by reducing the use of toxic chemicals;
improving emergency planning, response, and accident notification; and
encouraging the development and use of clean technologies and the testing of
innovative pollution prevention technologies. Program components include
waste minimization, source reduction and recycling, and procurement practices
that preferentially procure products made from recycled materials. The
pollution prevention program at the Hanford Site is formalized in a Hanford
Site Waste Minimization and Pollution Prevention Awareness Program Plan (DOE
1994a).
5.120
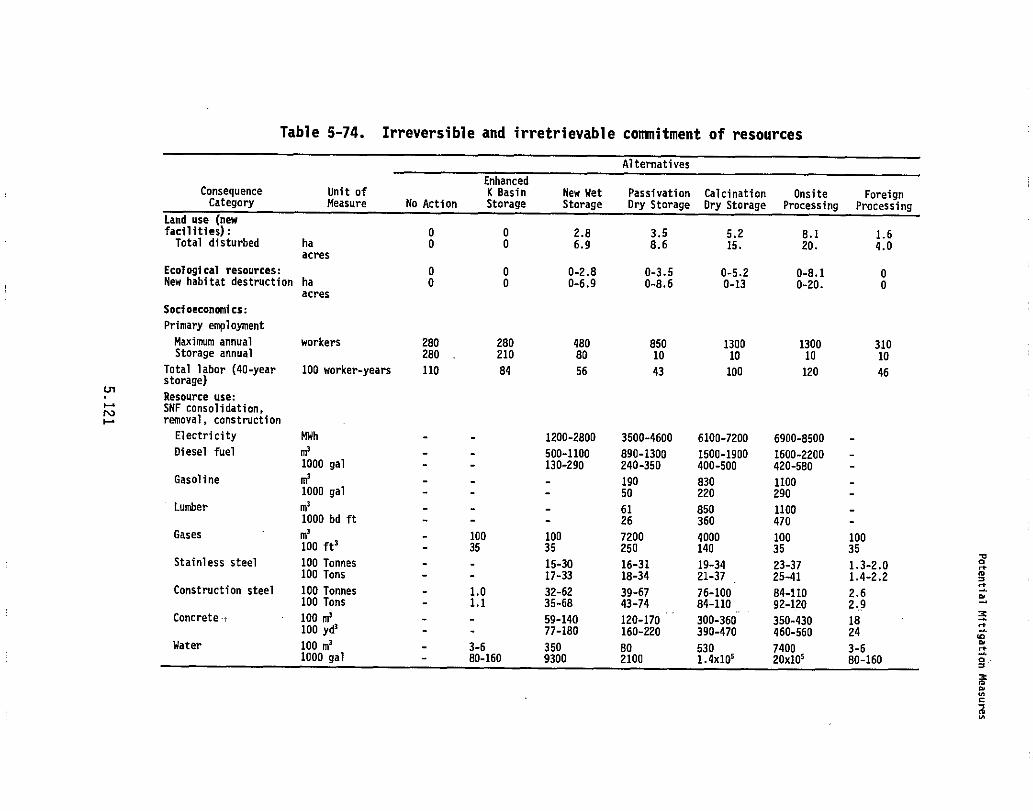
Table 5-74. Irreversible and irretrievable commitment of resources
Alternatives
EnhancedConsequence Unit of K Basin New Wet Passivation Calcination Onsite ForeignCategory Measure No Action Storage Storage Dry Storage Dry Storage Processing Processing
N
Land use (newfacilities):Total disturbed ha
acres
Ecological resources:New habitat destruction ha
acres
Socioeconamics:
Primary employment
Maximum annual workersStorage annual
Total labor (40-year 100 worker-yearsstorage)
Resource use:SNF consolidation,removal, construction
Electricity MWh
Diesel fuel m'1000 gal
Gasoline m'1000 gal
Lumber m'1000 bd ft
Gases m'100 ft'
Stainless steel 100 Tonnes100 Tons
Construction steel 100 Tonnes100 Tons
Concretes 100 m'100 yd'
Water 100 m'1000 gal
0 0 2.8 3.5 5.2 8.1 1.60 0 6.9 8.6 15. 20. 4.0
0 0 0-2.8 0-3.5 0-5.2 0-8.1 00 0 0-6.9 0-8.6 0-13 0-20. 0
280 280 480 850 1300 1300 310280 210 80 10 10 10 10
110 84 56 43 100 120 46
- - 1200-2800 3500-4600 6100-7200 6900-8500 -
- - 500-1100 890-1300 1500-1900 1600-2200 -- - 130-290 240-350 400-500 420-580 -
- - - 190 830 1100 -- - - 50 220 290 -
- - - 61 850 1100 -- - - 26 360 470 -
- 100 100 7200 4000 100 100- 35 35 250 140 35 35
- - 15-30 16-31 19-34 23-37 1.3-2.0- - 17-33 18-34 21-37 _ 25-41 1.4-2.2
- 1.0 32-62 39-67 76-100 84-110 2.6- 1.1 35-68 43-74 84-110 92-120 2.9
- - 59-140 120-170 300-360 350-430 18- - 77-180 160-220 390-470 460-560 24
- 3-6 350 80 530 7400 3-6- 80-160 9300 2100 1.4x10' 20x105 80-160
v
w_
3nen
32NGZAN
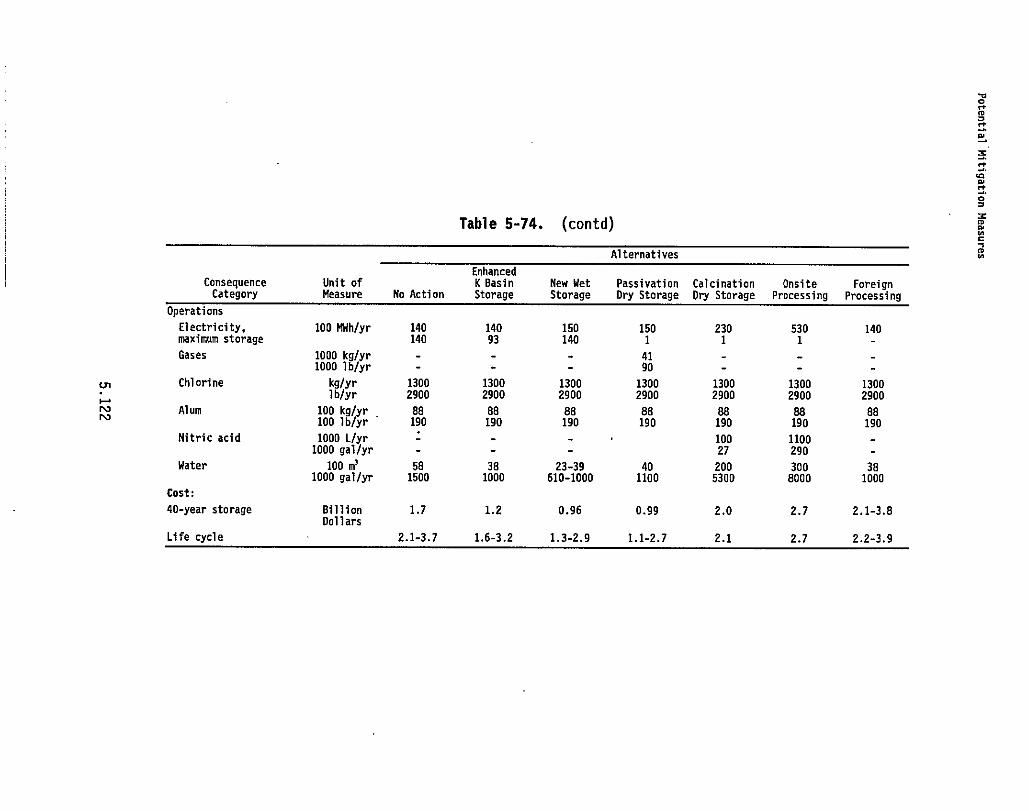
0
a
3
ba
0_
Table 5-74. (contd) 3
Alternatives
r1aNN
ConsequenceCategory
Unit ofMeasure No Action
K BasinStorage
New WetStorage
PassivationDry Storage
CalcinationDry Storage
OnsiteProcessing
ForeignProcessing
Operations
Electricity, 100 MWh/yr 140 140 150 150 230 530 140maximum storage 140 93 140 1 1 1 -
Gases 1000 kg/yr - - - 41 - - -1000 lb/yr - - - 90 - - -
Chlorine kg/yr 1300 1300 1300 1300 1300 1300 1300lb/yr 2900 2900 2900 2900 2900 2900 2900
Alum 100 kg/yr 88 88 88 88 88 88 88_100 lb/yr 190 190 190 190 190 190 190
Nitric acid 1000 L/yr - - - 100 1100 -1000 gal/yr - - - 27 290 -
Water 100 me 58 38 23-39 40 200 300 381000 gal/yr 1500 1000 610-1000 1100 5300 8000 1000
Cost:
40-year storage Billion 1.7 1.2 0.96 0.99 2.0 2.7 2.1-3.8Dollars
Life cycle 2.1-3.7 1.6-3.2 1.3-2.9 1.1-2.7 2.1 2.7 2.2-3.9
Potential Mitigation Measures
The SNF program activities would be conducted in accordance with this
plan, and implementation of the pollution prevention and waste minimization
plans would minimize the generation of waste during SNF management activities.
5.20.2 Socioeconomics
The level of predicted employment for any of the proposed SNF management
activities at the Hanford Site is not large enough in comparison with present
Hanford, local, or regional employment to produce a boom-bust impact on the
economy. Therefore mitigation measures would not likely be necessary.
5.20.3 Cultural (Including Archaeological and Cultural) Resources
To avoid loss of cultural resources during construction of SNF
facilities on the Hanford Site, a cultural resources survey of the area of
interest has been conducted. The survey did not identify cultural resources
that might preclude construction at the either of the proposed new facility
sites. If, however, during construction (earth moving) any cultural resource
is discovered, construction activities would be halted and the find would be
evaluated to determine its appropriate disposition.
5.20.4 Air Resources
To avoid impacts associated with emissions of fugitive dust during
construction activities, exposed soils would be treated using standard dustsuppression techniques, or by stockpiling soil under a cover where necessary.
Following construction, soil loss would be controlled by revegetation and
relandscaping of disturbed areas. Any soil that might become contaminated as
a result of SNF management activities could be remediated using methods
appropriate to the type and extent of contamination.
Construction activities would not be expected to generate fugitive dust
at levels that exceed air quality standards, except possibly construction of
facilities near the Site boundary in conjunction with the foreign processing
alternative. In that case, standard dust suppression techniques could be used
to reduce the particulate loading levels to an acceptable level (EPA 1993).
New facility sources of pollutant emissions to the atmosphere would be
designed using best available technology to reduce emissions to as low as
reasonably achievable.
5.123
Potential Mitigation Measures
5.20.5 Water Resources
The impacts to surface and groundwater sources could be minimized
through recycling of water, where feasible, and with clean-up of excess
process water before release to ground or surface water. Levels of contam-
inants that might affect surface or groundwater quality are controlled by
permit where process effluents are released to the environment.
5.20.6 Ecology
To avoid impacts to threatened, endangered, candidate, or state-identi-
fied sensitive species, preconstruction surveys have been completed to deter-
mine the presence of these species or their habitat. During these surveys,
the proposed construction sites at Hanford were not found to contain currently
listed species. The shrub-steppe habitat identified at the reference site
provides potential nesting or foraging habitat for listed species. Shrub-
steppe habitat has been identified as priority habitat by the state of
Washington because of its relative scarcity in the region outside of Hanford.
If the reference site, or another undisturbed site, were selected for
construction of new SNF management facilities, a habitat replacement program
could be implemented to mitigate the loss. This could be accomplished by
restoration of natural habitat in other disturbed areas of the Site as old .
facilities are decommissioned, or by purchase and protection of lands
containing such habitat in another location. The preferred mechanism by which
the loss would be mitigated is to avoid loss of the habitat by selecting a
previously developed site, such as the CSB site, for SNF management
activities.
5.20.7 Noise, Traffic, and Transportation
Generation of construction and operations noise would be reduced, as
practicable, by using equipment that complies with EPA noise guidelines
(40 CFR 201-211). Construction workers and other personnel working in envi-
ronments exceeding EPA-recommended guidelines during SNF storage construction
or operation would be provided with hearing protection devices approved by the
Occupational Safety and Health Administration (29 CFR 1910). Because of the
remote location of the Hanford SNF activities, there would be no construction
noise impacts with respect to the public for which mitigation would be
necessary.
4 IPX''J
Potential Mitigation Measures
At sites with increasing traffic concerns, DOE could encourage use of
high-occupancy vehicles (such as vans or buses), implementing carpooling and
ride-sharing programs, and staggering work hours to reduce peak traffic and
associated traffic noise.
5.20.8 Occupational and Public Health and Safety
Members of the general public would not be expected to experience any
adverse consequences as a result of routine SNF management activities con-
sidered in this document. Design and construction of facilities - would incor-
porate the best available technology to control discharge of potentially
hazardous materials to the environment.
Exposure of workers to radioactive or other potentially hazardous mate-
rials would be controlled using the ALARA ("as low as reasonably achievable")
principle. As part of the SNF management program, operations would be
reviewed before implementing them to identify measures that could be used to
minimize worker exposures. Examples of such activities that might be imple-
mented at the K Basins include cleaning or removing contaminated equipment
from the work areas, providing extra shielding at work locations, using remote
handling techniques for high-exposure operations where possible, and providing
training to minimize the time required to perform tasks in high-exposure
areas. Worker safety programs and operating procedures could also be develr
oped to reduce the potential for industrial accidents.
5.20.9 Site Utilities and Support Services
No mitigation measures.beyond those identified in Section 5.20.4 for
ground disturbance activities associated with bringing power and water to the
SNF site would appear necessary. In those cases use of standard dust suppres-
sion techniques and revegetation of disturbed areas would mitigate ground
disturbance impacts.
5.20.10 Accidents
Although the safety record for operations at Hanford and other DOE
facilities is good, DOE Richland Operations Office and all Hanford Site
contractors have established emergency response plans to prepare for and
mitigate the consequences of potential emergencies on the Hanford Site (DOE
1992a). These plans were prepared in accordance with DOE Orders and other
federal, state, and local regulations. The plans describe actions that will
be taken to evaluate the severity of a potential emergency and the steps
necessary to notify and coordinate the activities of other agencies having
5.125
Potential Mitigation Measures
emergency response functions in the surrounding communities. They also
specify levels at which the hazard to workers and the public are of sufficient
concern that protective action should be taken. The Site holds regularly
scheduled exercises to ensure that individuals with responsibilities in
emergency planning are properly trained in the procedures that have been
implemented to mitigate the consequences of potential accidents and other
events. The Hanford Site emergency response plans would be updated to include
consideration of new SNF facilities and activities as necessary.
The consequences of potential accidents at facilities can be mitigated
in several ways, including facility design to prevent or reduce emissions and
provision for protective action for workers and members of the public. Facil-
ity design may incorporate features to maintain the building's integrity and
prevent release of hazardous materials when subjected to mechanical or thermal
stress (such as earthquakes, external impacts, or internal fires or
explosions). Emission controls in the form of secondary containment barriers,
filtration of exhaust air and other features to be installed to minimize
release of hazardous substances under normal operation as well as accident
conditions. Other safety systems may be incorporated into facilities if
needed to mitigate the potential consequences of accidents involving specific
processes unique to that facility. Examples include fire detection and
suppression equipment, auxiliary exhaust filters such as high-efficiency
particulate air (HEPA) filters that are activated if a hazardous material is
released within the building, and detectors and alarms that provide workers
and emergency response personnel with early warning of an abnormal event sothat preventive or protective action could be taken.
Safety evaluations would be performed in conjunction with the design of
SNF management facilities to ensure that the risks associated with their
operation fall within acceptable guidelines. Specifications for seismic
protection and emission controls would be in accordance with DOE and EPA
standards to reduce the potential consequences of accidents. Facility
emission controls (containment, pre-filters, HEPA filters and other special-
ized systems) would be designed to maintain facility emissions at acceptable
levels both'during normal operation, and in the event of an accident. In the
event of an accident, protective action guidelines have been established to
specify the types of measures that might be necessary to protect the public.
Examples of such actions include sheltering or evacuating nearby members of
the public, restricting public access to onsite public roads or to the
Columbia River adjacent to the Site, or restrictions on the use of potentially
contaminated food or water.
5.126
Environmental Justice
5.21 Environmental Justice
As a result of Executive Order 12898, Federal Actions to AddressEnvironmental Justice in Minority Populations and Low-Income Populations(59 FR 7629), federal agencies are responsible for identifying and addressing
the possibility of disproportionately high and adverse environmental impacts
of their programs and activities on minority and low-income populations. This
section considers the location of minority and low-income populations sur-
rounding the Hanford Site and considers their susceptibility to dispropor-
tionately adverse environmental consequences of operations to retrieve,
prepare, and store SNF currently stored in the KE and KW Basins for all alter-
natives considered in this EIS. In addition, for the foreign processing
alternative, the analysis also considers these population groups at example
ports where the fuel might be loaded and unloaded for shipment to/from a
foreign processor. Impacts along transportation routes for either routine
operations or accidents to even the MEI located at 100 m (30 ft) from the
release site are estimated to be insignificant (Section 5.11 and Appendix B).
Because the consequences for any individual of any group from transportation
are insignificant, minority and low-income individuals are not considered to
be adversely and disproportionately affected along those routes.
For purposes of this analysis, minority populations are defined as all
non-white individuals, plus Hispanic whites, as reported in the 1990 census..
Low-income persons are defined as living in households in the 1990 Census that
reported an annual income less than the United States official poverty level.
The poverty level varies by size and relationship of the members - of the house-
hold. It was.$12,674 for a family of 4 at the 1990 Census. Nationally, in
1990, 24.2% of all persons were minorities and 13.1% of all households had
incomes less than the poverty level.
5.21.1 Hanford Vicinity (All Alternatives)
Figures 5-2 and 5-3 and Table 5-75 show the geographic distribution of
minority and low-income population within census block groups (areas defined
for monitoring census data of approximately 250 to 550 housing units) that are
within 80 km (50 mi) of the KE and KW Basins. The two figures also show the
location of these populations within 80 km (50 mi) of the CSB site, indicated
as 200 East on the maps.
There is not yet an agreed-upon standard within the emerging federal
guidance on environmental justice for what constitutes an area that has a
minority or low-income population large enough to act as a test for dispro-
portionate impact. For example, it has not been decided in the case of
5.127
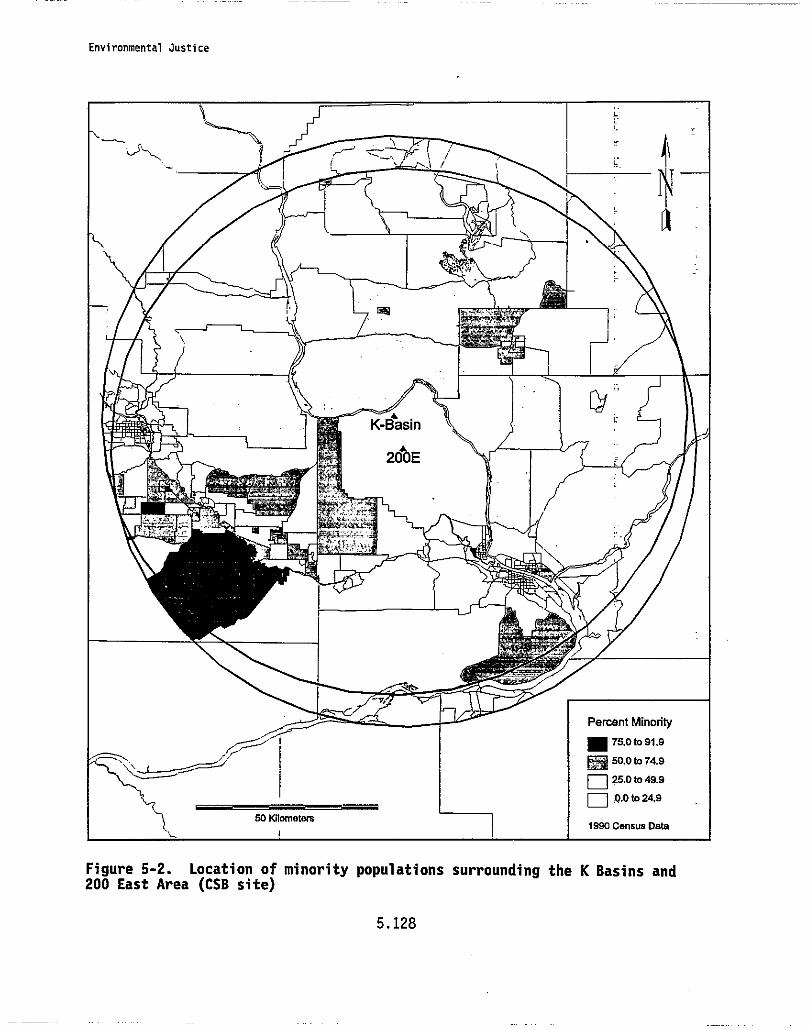
Environmental Justice
I C
L c
200E
i Percent Mino rity
.75.0 to 91.9
^^•' 50.0 to 74.9
O 25.0 to 49.9
a Do to 24.9
5o Wfometers I 1990 Census Data
Figure 5-2. Location of minority populations surrounding the K Basins and200 East Area (CSB site)
5.128
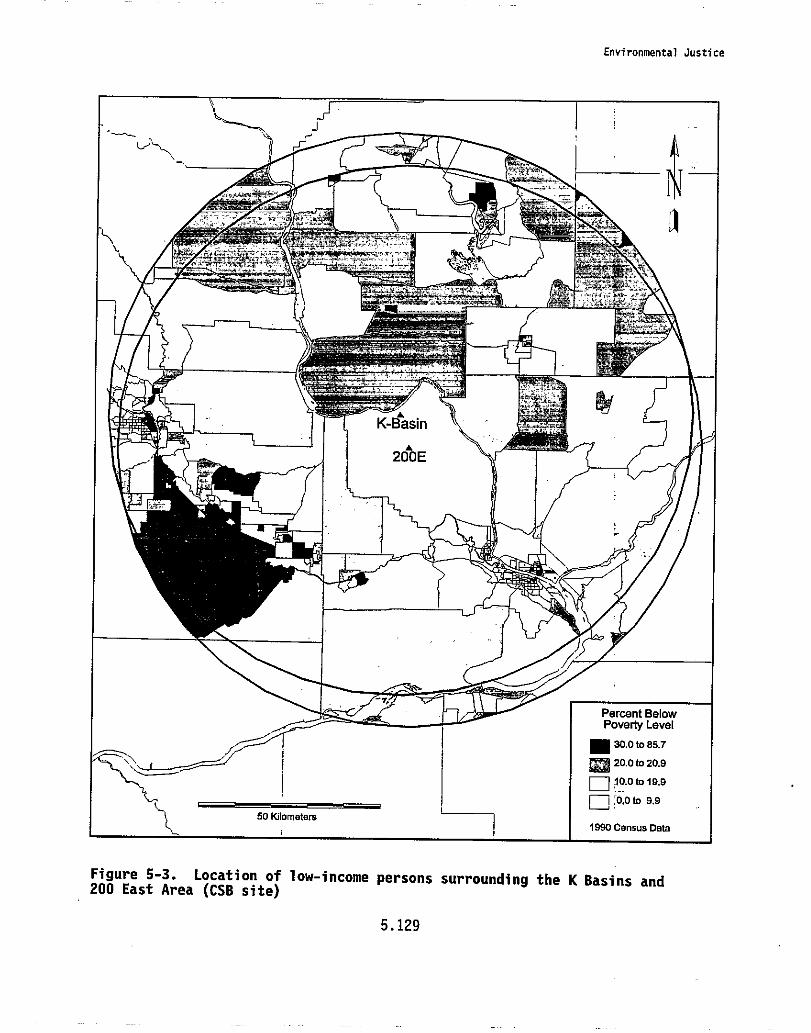
Environmental Justice
Figure 5-3. Location of low-income persons surrounding the K Basins and200 East Area (CSB site)
5.129
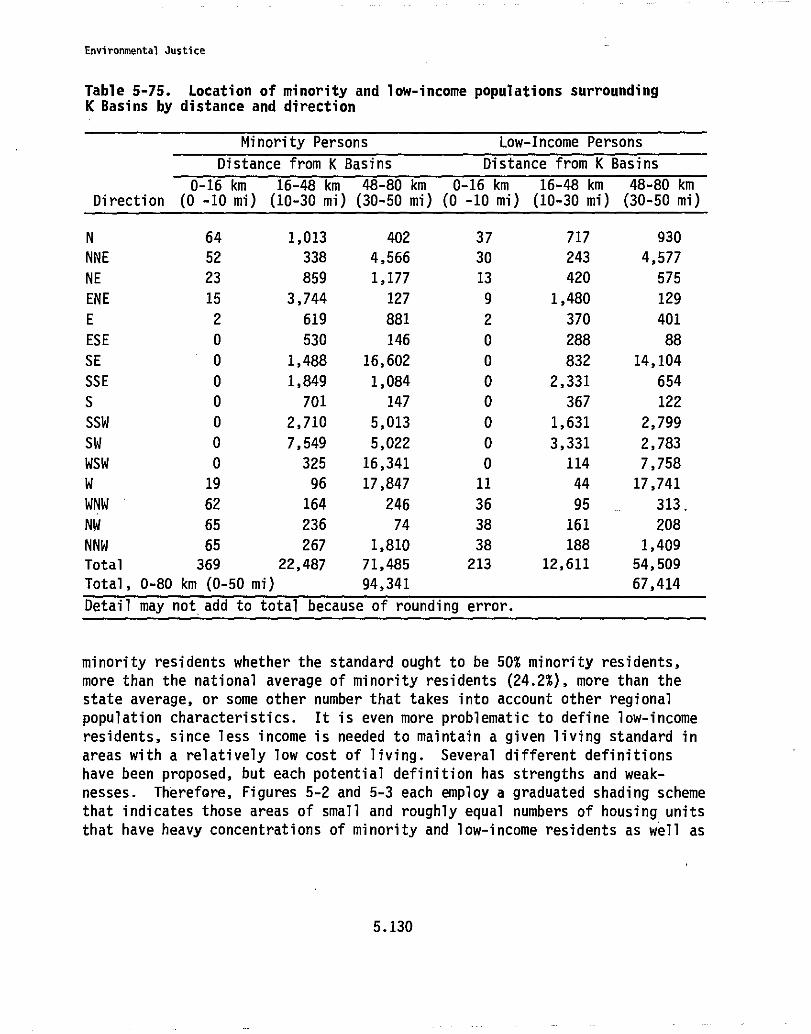
Environmental Justice
Table 5-75. Location of minority and low-income populations surroundingK Basins by distance and direction
Minority Persons Low-Income Persons
Distance from K Basins Distance from K Basins
0-16 km 16-48 km 48-80 km 0-16 km 16-48 km 48-80 kmDirection (0 -10 mi) (10-30 mi) (30-50 mi) (0 -10 mi) (10-30 mi) (30-50 mi)
N 64 1,013 402 37 717 930
NNE 52 338 4,566 30 243 4,577
NE 23 859 1,177 13 420 575
ENE 15 3,744 127 9 1,480 129
E 2 619 881 2 370 401
ESE 0 530 146 0 288 88
SE 0 1,488 16,602 0 832 14,104
SSE 0 1,849 1,084 0 2,331 654
S 0 701 147 0 367 122
SSW 0 2,710 5,013 0 1,631 2,799
SW 0 7,549 5,022 0 3,331 2,783
WSW 0 325 16,341 0 114 7,758
W 19 96 17,847 11 44 17,741
WNW 62 164 246 36 95 313,
NW 65 236 74 38 161 208
NNW 65 267 1,810 38 188 1,409
Total 369 22,487 71,485 213 12,611 54,509
Total, 0-80 km (0-50 mi) 94,341 67,414
Detail may not add to total because of rounding error.
minority residents whether the standard ought to be 50% minority residents,
more than the national average of minority residents (24.2%), more than the
state average, or some other number that takes into account other regional
population characteristics. It is even more problematic to define low-income
residents, since less income is needed to maintain a given living standard in
areas with a relatively low cost of living. Several different definitions
have been proposed, but each potential definition has strengths and weak-
nesses. Therefore, Figures 5-2 and 5-3 each employ a graduated shading scheme
that indicates those areas of small and roughly equal numbers of housing units
that have heavy concentrations of minority and low-income residents as well as
5.130
Environmental Justice
those areas that have lighter concentrations of such residents. Shaded areas
generally indicate those census block groups that have more than the national
average percentages of minority and low-income populations, with heavier
shading showing heavier concentrations. There are no residents within the
irregularly shaped census block shown in Figures 5-2 and 5-3 that contains the
K Basins and 200 East locations. This block is the Hanford Site.
Figure 5-2 and Table 5-75 together indicate that the largest numbers and
heaviest concentrations of minority populations generally are located south-
west and west-southwest of the K Basins in the Yakima Valley and Yakama Indian
Reservation [most between 48 and 80 km (30 and 50 mi) distant], with two large
pockets to the southeast (Pasco area) and west (Yakima area) beyond 48 km
(30 mi) from the K Basins. Lighter scatterings of minority populations are
located to the north, east, and west of the K Basins. Virtually all of the
residents (including minority residents) of the darker-shaded census block to
the west of the Hanford Site in Figure 5-2 actually reside near the extreme
southern boundary of that area. Figure 5-3 and Table 5-75 together indicate
that some low-income residents are scattered in all directions from the facil-
ities, again with the largest numbers at the edges of the 80-km (50-mi) rings,
and again with highest concentrations to the southwest and west-southwest in
the Yakima Valley and Yakama Indian Reservation. The census block shown in
Figure 5-3 just to the north of the K Basins that contains over 20% low-income
residents is somewhat misleading, in that most residents in this area actually
are located along the Columbia River at the extreme western edge of the block.
Although some minority and low-income populations live relatively near
the K Basins and 200 East facilities, Sections 5.7 and 5.8 indicate that it is
very unlikely that routine operations would affect them with radiological and
nonradiological health impacts and other risks. These risks would be insig-
nificant for any offsite population for any alternative discussed in this EIS.
Therefore, it is unlikely that any minority or low-income population would be
disproportionately affected by routine operations of any of the alternatives
at Hanford.
5.131
Environmental Justice
Some accident scenarios whose effects are described in Section 5.15
could result in significant air releases of radionuclides that, in turn, could
significantly affect some offsite populations. Whether the effect on minority
and low-income residents would be disproportionate would depend very much on
atmospheric conditions (especially wind directions) at the time of such a
release. Most of the concentrations of minority and low-income areas are
located to the west of the Hanford Site, while winds from the east are highly
unlikely (Section 4.7.1). Prevailing winds from the west, northwest, or
southwest would ordinarily carry any airborne release'to the east, southeast,
or northeast. A small, but still potentially disproportionate, number of
minority and low-income persons could be affected in the event of south-
westerly and westerly winds, depending on the exact wind direction and speed.
The maximum reasonably foreseen impact scenario for an accident discussed in
Section 5.15 is one in which the wind is from the northwest or north and
carries an airborne release over the Richland-Pasco-Kennewick area to the
immediate south and southeast of Hanford. In that case, majority and upper-
income populations are at least as likely to be affected as minority and low-
income populations.
The maximum reasonably foreseen water-related radiological accident in
Section 5.15 is an overflow accident at the K Basins. This has insignificant
consequences for any downstream population, including recreationists on the
Columbia River in the immediate vicinity of the facility, so it is unlikely.
that minority or low-income populations would be adversely and disproportion-
ately affected through this pathway.
Radiological accidents that exceed 0.5 rem to the MEI could have some
secondary impacts from environmental contamination and mitigative actions
under protective action guidelines (Section 5.15.7). These could include
temporary loss of access to traditional fishing rights by Native American
groups and possible loss of some agricultural crops and loss of income by
minority and low-income farm workers. It is not clear whether this impact
would be disproportionate.
Nonradiological accidental releases would cause odor and irritation
problems and some irreversible health impacts under some alternatives at the
nearest point of public access, while release of all of the PCBs at the
K Basins could cause harm at the nearest residence under all of the alterna-
tives (Section 5.15.8). In general, however, there is no reason for minori-
ties and low-income persons to be disproportionately affected.
5.132
Environmental Costs
5.21.2 Port Facilities (Foreign Processing)
The DOE Draft Environmental Impact Statement on the Proposed NuclearWeapons Nonproliferation Policy Concerning Foreign Research Reactor (FRR)Spent Nuclear Fuel (DOE 1995h) provides information on the numbers and spatiallocations of minority and low-income populations surrounding the ports of
Tacoma, Washington; Portland, Oregon; and Norfolk, Virginia (Hampton Roads).
Because the FRR EIS utilized somewhat different analytical methodologies for
environmental justice purposes than those utilized in this document, some data
may vary. For example, the definition used for low income in FRR EIS is the
U.S. Department of Housing and Urban Development standard, defined as 80% or
less of the median household income for the Metropolitan Statistical Area.
Utilizing demographic data entirely from the FRR EIS allows for comparison of
the ports of interest under consistent definitions and assumptions using
readily available data. The reader is referred to the draft FRR EIS for maps
locating the spatial distribution of minority and low-income populations.
Table 5-76 lists information on selected populations of interest for
regions surrounding the ports. Regions surrounding each port are areas that
lie at least partially within a 16-km (10-mi) radius of the port. Population
characteristics shown in the table were extracted from detailed, block-group
statistical population data of the 1990 census.
Because the impacts as a result of transportation and facility opera-
tions are small and reasonably foreseeable accidents present no significant
risk to the public (Section 5.15), no reasonably foreseeable adverse impacts
have been identified to the surrounding population. Therefore, no dispropor-
tionately high and adverse effects would be expected for any particular seg-
ment of the population, including minority and low-income populations.
5.22 Estimated 40-Year Storage and Life-Cycle Costs
The estimated costs of achieving proper disposition of the SNF currently
stored in the K Basins via the postulated alternatives are presented in this
section. The costs for all of the activities except final transport and
disposal in a geologic repository are derived from the K Basin EnvironmentalImpact Statement Technical Input (Bergsman et al. 1995). The costs for thefinal transport and disposal of the SNF are derived from information contained
in Revised Analyses of Decommissioning for the Reference Pressurized WaterReactor Power Station (Konzek et al. 1993). Costs are presented for the40-year storage period considered by the basic alternatives in this EIS. In
addition, the total life-cycle cost of each alternative is presented, which
5.133
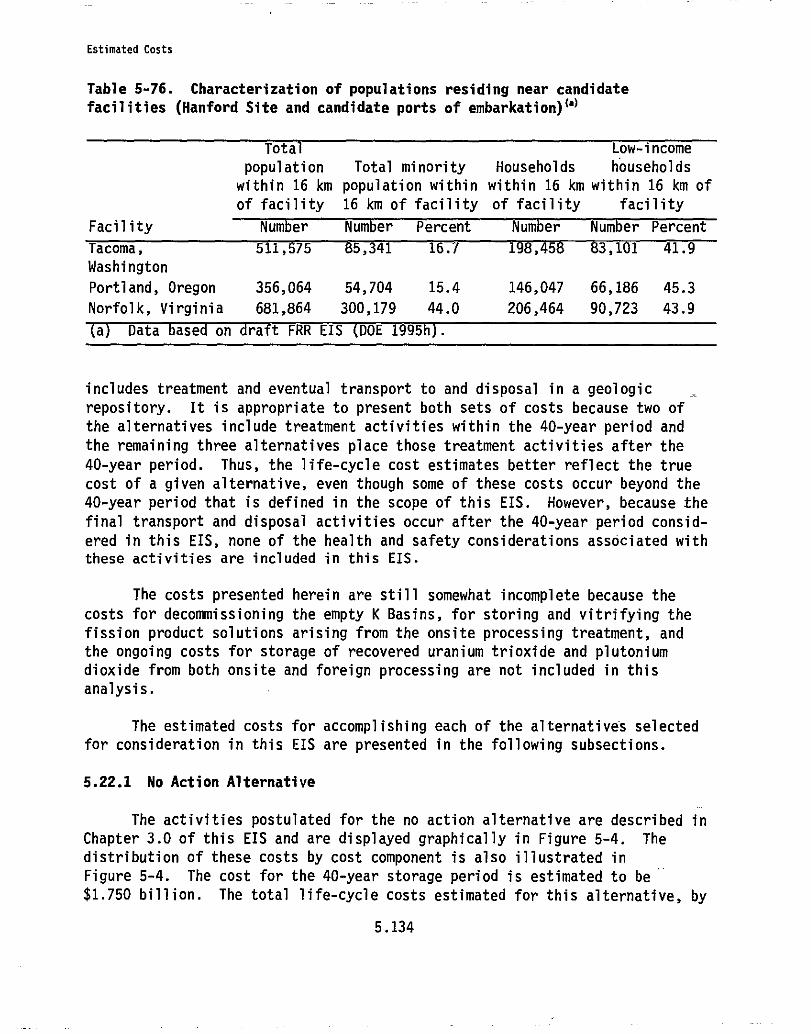
Estimated Costs
Table 5-76. Characterization of populations residing near candidate
facilities (Hanford Site and candidate ports of embarkation)(')
Total Low-income
population Total minority Households households
within 16 km population within within 16 km within 16 km of
of facility 16 km of facility of facility facility
Facility Number Number Percent Number Number Percent
Tacoma, 511,575 5,341 16.7 198,458 3,_fT1 41.9
Washington
Portland, Oregon 356,064 54,704 15.4 146,047 66,186 45.3
Norfolk, Virginia 681,864 300,179 44.0 206,464 90,723 43.9
a Data basedon draft FRR EIS DOE 1995h).
includes treatment and eventual transport to and disposal in a geologic
repository. It is appropriate to present both sets of costs because two of
the alternatives include treatment activities within the 40-year period and
the remaining three alternatives place those treatment activities after the
40-year period. Thus, the life-cycle cost estimates better reflect the true
cost of a given alternative, even though some of these costs occur beyond the
40-year period that is defined in the scope of this EIS. However, because the
final transport and disposal activities occur after the 40-year period consid-
ered in this EIS, none of the health and safety considerations associated with
these activities are included in this EIS.
The costs presented herein are still somewhat incomplete because the
costs for decommissioning the empty K Basins, for storing and vitrifying the
fission product solutions arising from the onsite processing treatment, and
the ongoing costs for storage of recovered uranium trioxide and plutonium
dioxide from both onsite and foreign processing are not included in this
analysis.
The estimated costs for accomplishing each of the alternatives selected
for consideration in this EIS are presented in the following subsections.
5.22.1 No Action Alternative
The activities postulated for the no action alternative are described in
Chapter 3.0 of this EIS and are displayed graphically in Figure 5-4. The
distribution of these costs by cost component is also illustrated in
Figure 5-4. The cost for the 40-year storage period is estimated to be
$1.750 billion. The total life-cycle costs estimated for this alternative, by
5.134
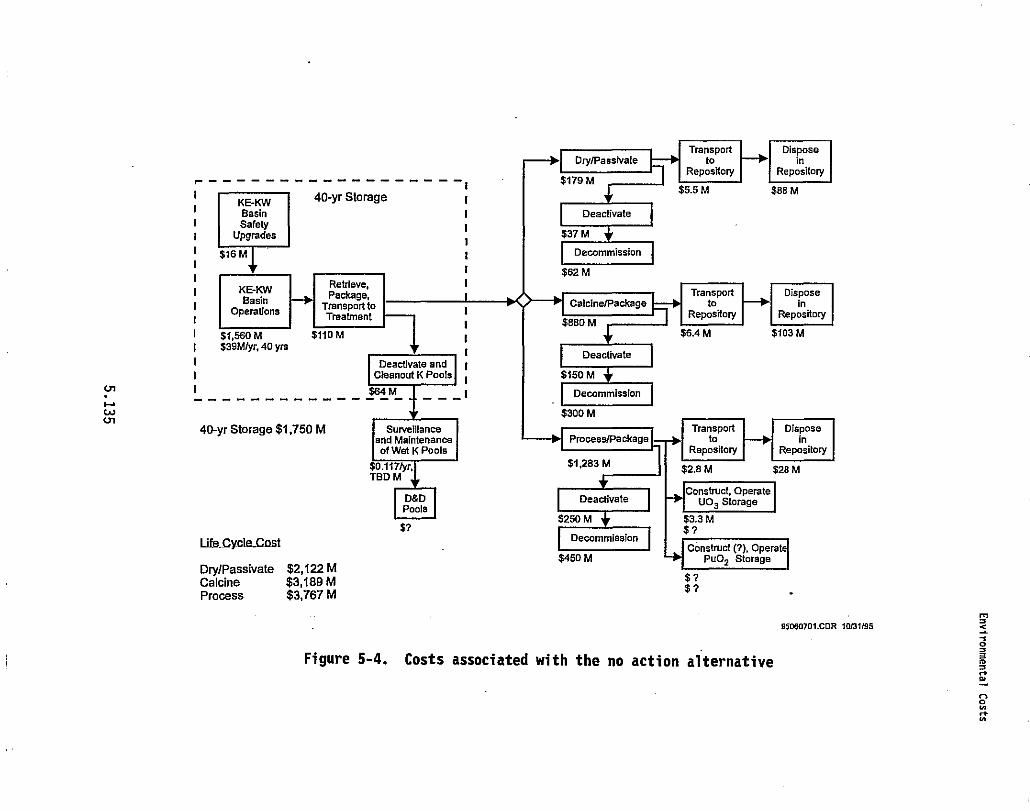
Transport
toReposttory
$5.5 M
Transpo rt
toRepository
$6.4 M
Disposein
Reposito ry
$88 M
Disposefn
Reposttory
$103 M
Deactivate
150 M
Decommission
300 M
Process/Package
$1,283 M
Transpo rt Disposeto in
Repository Repository
$2.8 M $28 M
Dry/Passivate
$179 M
Deactivate
$37 M
Decommission
$62 M
Calolne/Package
Deactivate
$250 M
Decommission
$450 M
Construct, Operate
117
Construct (9), OperateiPuOq Storage I
$7
Figure 5-4. Costs associated with the no action alternative
m
ZO
a
eN
N
95060101.CDR 10/31/95
r^w
- - - - - - - _ _ - _ _ - _ - _ - _
KE-KW 40-yr Storage
I Basfn Ii SafetyI Upgrades
I $16 MI
II
1Retrieve, IPackage, I
W$39MIyrr,,
Transpo rt toTreatment
I $110 M II
I Deactivate and1 Clesnout K Pools
1
40-yr Storage $1,750 MI Su rveillanceand Maintenanceof Wet K Pools
D&DPools
$7
Life-Cycle-Cost
Dry/Passivate $2,122 MCalcine $3,189 MProcess $3,767 M
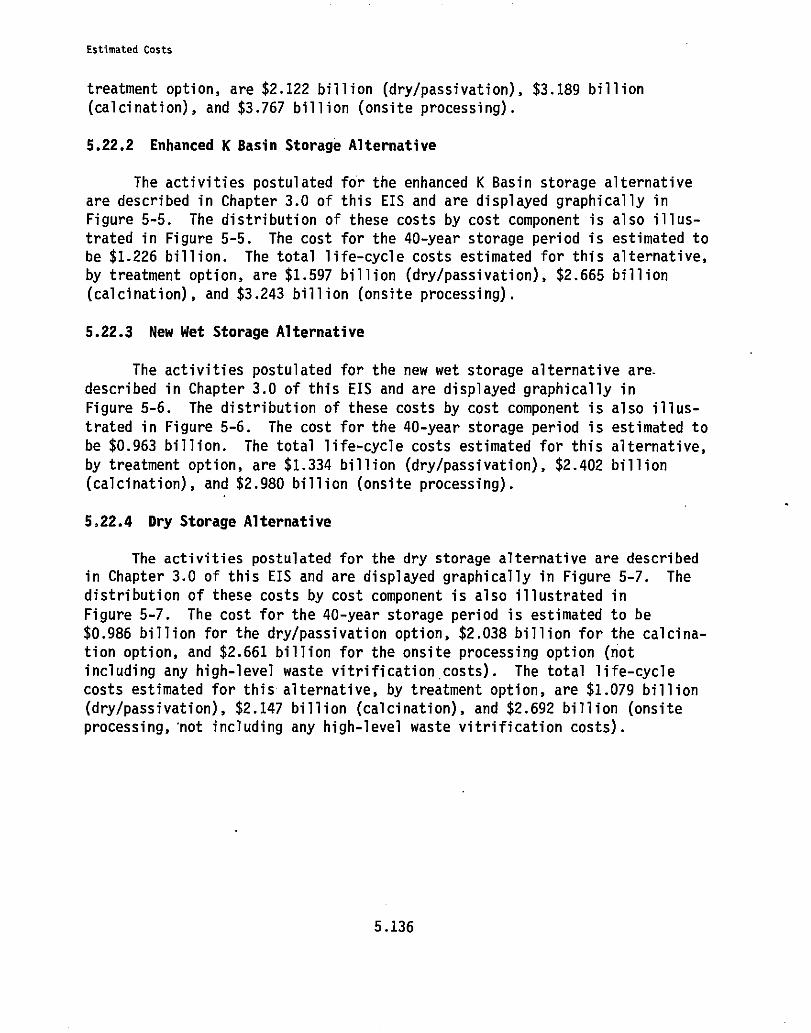
Estimated Costs
treatment option, are $2.122 billion (dry/passivation), $3.189 billion
(calcination), and $3.767 billion (onsite processing).
5.22.2 Enhanced K Basin Storage Alternative
The activities postulated for the enhanced K Basin storage alternative
are described in Chapter 3.0 of this EIS and are displayed graphically in
Figure 5-5. The distribution of these costs by cost component is also illus-
trated in Figure 5-5. The cost for the 40-year storage period is estimated to
be $1.226 billion. The total life-cycle costs estimated for this alternative,
by treatment option, are $1.597 billion (dry/passivation), $2.665 billion
(calcination), and $3.243 billion (onsite processing).
5.22.3 New Wet Storage Alternative
The activities postulated for the new wet storage alternative are-
described in Chapter 3.0 of this EIS and are displayed graphically in
Figure 5-6. The distribution of these costs by cost component is also illus-
trated in Figure 5-6. The cost for the 40-year storage period is estimated to
be $0.963 billion. The total life-cycle costs estimated for this alternative,
by treatment option, are $1.334 billion (dry/passivation), $2.402 billion
(calcination), and $2.980 billion (onsite processing).
5.22.4 Dry Storage Alternative
The activities postulated for the dry storage alternative are described
in Chapter 3.0 of this EIS and are displayed graphically in Figure 5-7. The
distribution of these costs by cost component is also illustrated in
Figure 5-7. The cost for the 40-year storage period is estimated to be
$0.986 billion for the dry/passivation option, $2.038 billion for the calcina-
tion option, and $2.661 billion for the onsite processing option (not
including any high-level waste vitrification costs). The total life-cycle
costs estimated for this alternative, by treatment option, are $1.079 billion
(dry/passivation), $2.147 billion (calcination), and $2.692 billion (onsite
processing,'not including any high-level waste vitrification costs).
5.136
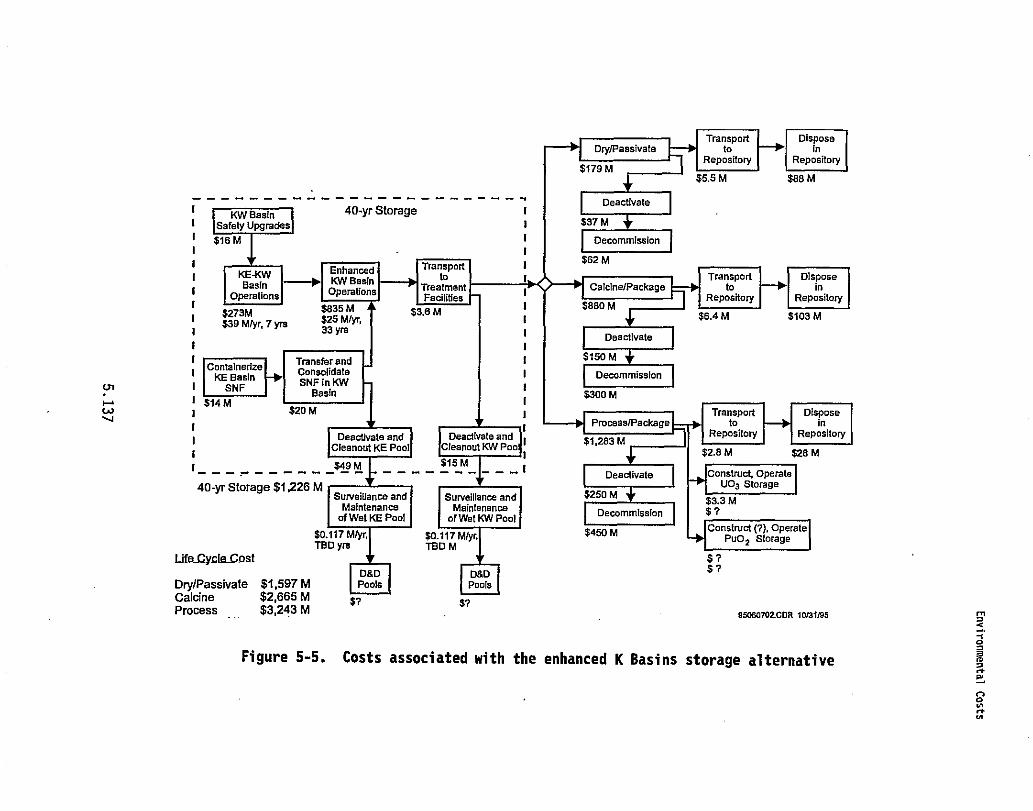
Transportto
Repository
$6.4 M
Disposein
Repository
$103 M
Deactivate
$37 M
Dewmmission
$62 M
Calcine/Package
$880 M
Transport Disposeto in
Reposito ryRepository
$2.8 M $28 M
Construct, OperateUO3 Storage
IConstmct (?), Operate)
PUO 2 Storage
Deactivate
$150 M
Decommission
$300 M
Process/Package
Deadlvate
$250 M
Decommission
$450 M
Transport
DisposeDry/Passivate
to
in
$179 M R epository
Reposiory
$5.5 M
$88 M
t71
f+wv
_ _ _ _ _ _ _
1 Kw Basin
_ _ _ _ _ _ _ _
40-yr Storage 11 Safety Upgrades i
111
1 $1
RU11 Enhanced Transportto
I
KW BasinOperations
—► TreatmentFacilities
1 $273M $835 M $3.8 M$3939 Mtyr, 7 yro
M/$25 A I
11
ro33 Yrs I
1 Contalnedze TronsferandI1
KE Basin Consolidate
1 SNFSWF in KWsin
Basin$14 M
$20 M
IDen ate and
1Deadlvate and 1
i Cleanout KE Pool Cleanout KW Poo
515M____1
40-yr Storage $1,226 MSurveillance and Surveillance and
Maintenance Maintenanceof Wet KE Pool of Wet KW Pool
$0.117 Mtyr, $0.117 Mtyr,TBD yro TBD M
LifeSey.CkLGoSt
Dry/Passivate $1,597 MCalcine $2,665 MProcess $3,243 M
D&D D&DPools Pools
s? a?9506070241311 10131M
N
Figure 5-5. Costs associated with the enhanced K Basins storage alternative
0
a
n0Nrt
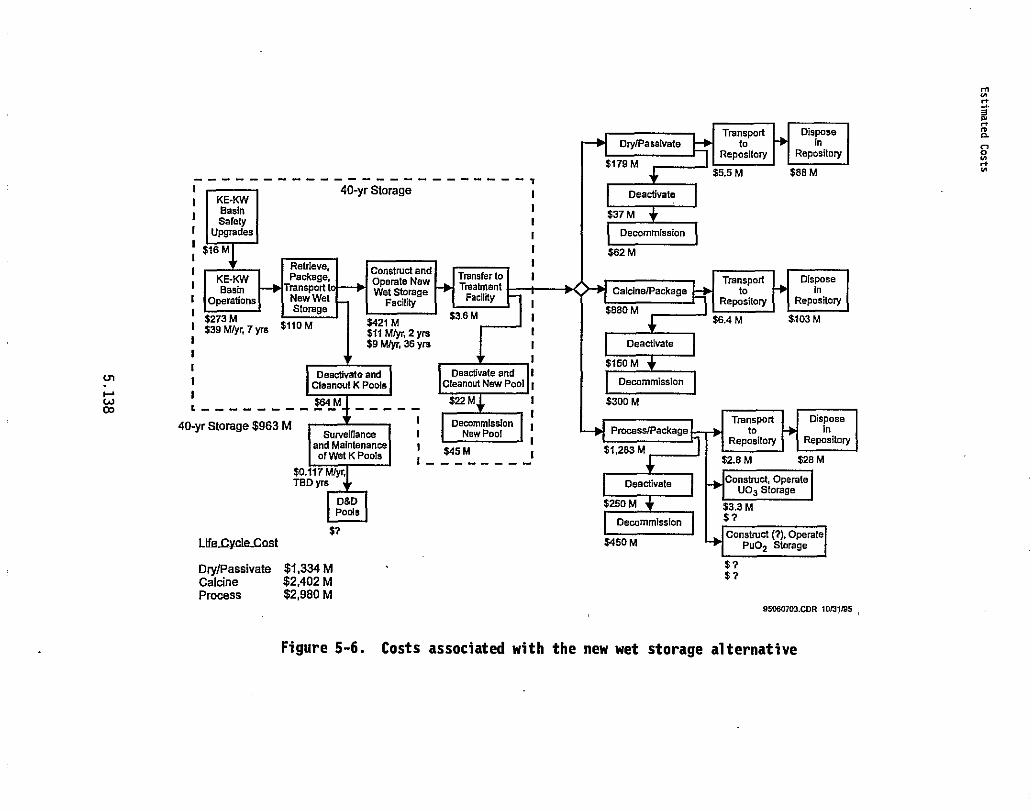
mN
arma
0w
Wco
1 40-yr Storage 1I KE•KW1 Basin 1
Safety II Upgrades I
$16 M I
I Retdeve,Packs ge, Construct and
Operate NewPTransfer to 1
1BasinBasin Transp
lort Treatment1 Operations New at WFacilityge Facility I
Storage$273 M
1 $110M$3,6 M I
$39 M/yr, 7 yrs $11 Mlyr, 2 yrs 11I
$9 Mlyr, 36 yrs II
Deactivate and Deactivate and I1 Cleanout K Pools Cteanout Naw Pool I
$64 M S22 M 1 L - - _
140-yr Storage $;6;M 1 Decommission
Surveillance 1 New Pooland Maintenance $45 Mof Wet K Pools I
_
Transport DisposeDry/Passivate to In
Reposito ry Repos itory$179 M
$5.5 M $86 M
Deactivate
$37 M
Decommission
$62 M
Transport Disposeto In
Repository Repositry
MD,Iltl,ltl
$64 M $103 M
Decommission
$300 M
Transport DisposeProcesslPackage to in
Repository Repository$1,263 M
$2.6 M $26 M
Yrs
Paola
Life-Cycle-Cost
Dry/Passivate $1,334 MCalcine $2,402 MProcess $2,980 M
Deactivate
$250 M
Decommission
$450 M
$3.3 MS?
Construct (?), OpePUO 2 Storage
95060701CM 10/31195
Figure 5-6. Costs associated with the new wet storage alternative
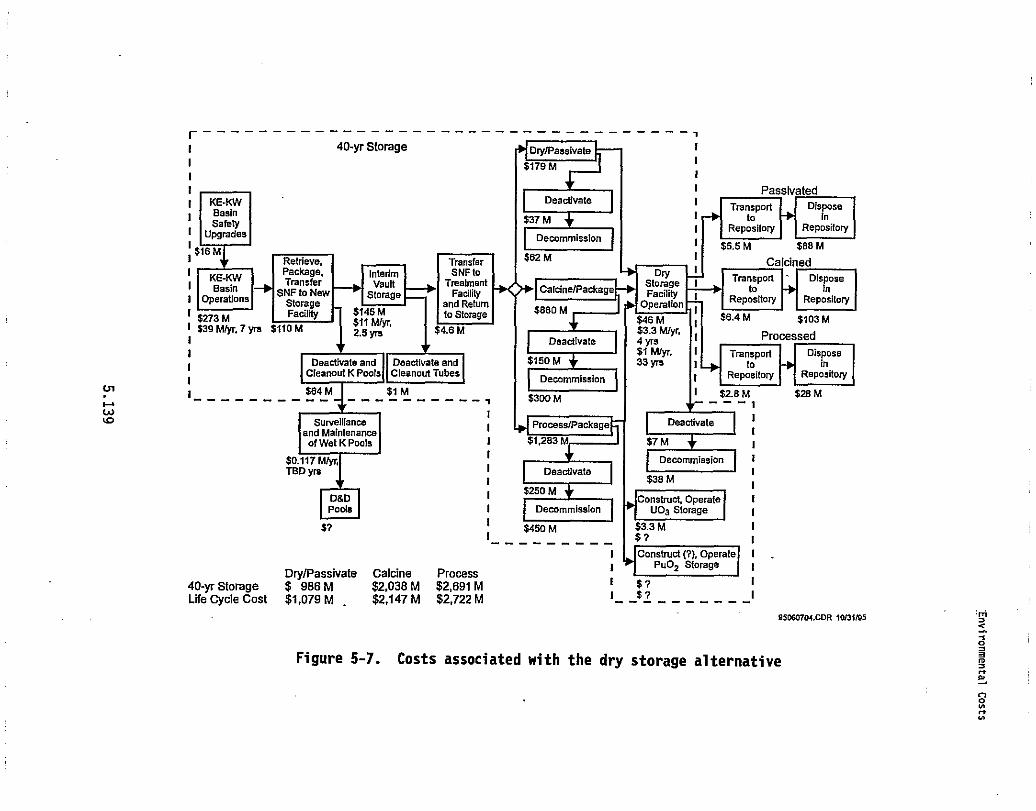
WuJ
r -- - - - - - - - - - - - - - - - - - - - - - - - - - - - - - - - - - ,1 40-yr Storage Dry/Passivate I
II
$179 MI
t I PassivatedKE-KW Deactivate 1 Transport
1 BasinSafety b37 M
i Disppose
Upgrades Repository Repository
I$IBMDecommission I $5.5M $88M
Retrieve, Transfer $62M i CalcinedI KE-KWI
Package,Transfer
InterimVauk
SNF toTreatment
DryStorage I Transport Dispose
Basin SNF to New Storage Facility Calcne/Package y 1Operations Storage and Return Opera ository
I $273 M Facility $145511
MM/yr,
to Storage $880 M$q6 M
I1 b8.4 M $103M
I $39 M/yr, 7 yro $110 M 2,gyra b4.6M1r I Processed1
Deactivate 4yrs
I I Transport Dispose
IaDeactivate nd as aDctivate nd $150 M 33 yrs
11 CleanoutKPools Cleanout Tubes Decommission I IReRepository ositoRepository
I — _ — _ _ — _ $64 M— _ _ — $1 M — _ — — $300 MI $2.8 M $28 M— , — 1
Surveillance 1 Deactivate 1and Maintenance 1of Wet K Pools 1 S7 M 1
$0.117 M/y6 I Decommission iTBD ym i
T$250MI$38 M1
O8D I Construct,OperatePools I UO3 Storage
$7 $450 M M$?3
I— — _ — — _
1 I1
ConsWdZ (?),orag
OperaleP uO St e 1
Dry/Passlvate Calcine Process40-yr Storage $ 986 M $2,038 M $2,691 M 1 $? ILife Cycle Cost $1,079 M $2,147 M $2,722 M I_ $? — _ _ _ — — _I
95090701.CDR 10/31/95
Figure 5-7. Costs associated with the dry storage alternative
m
z0
3
KN_
n0NMN
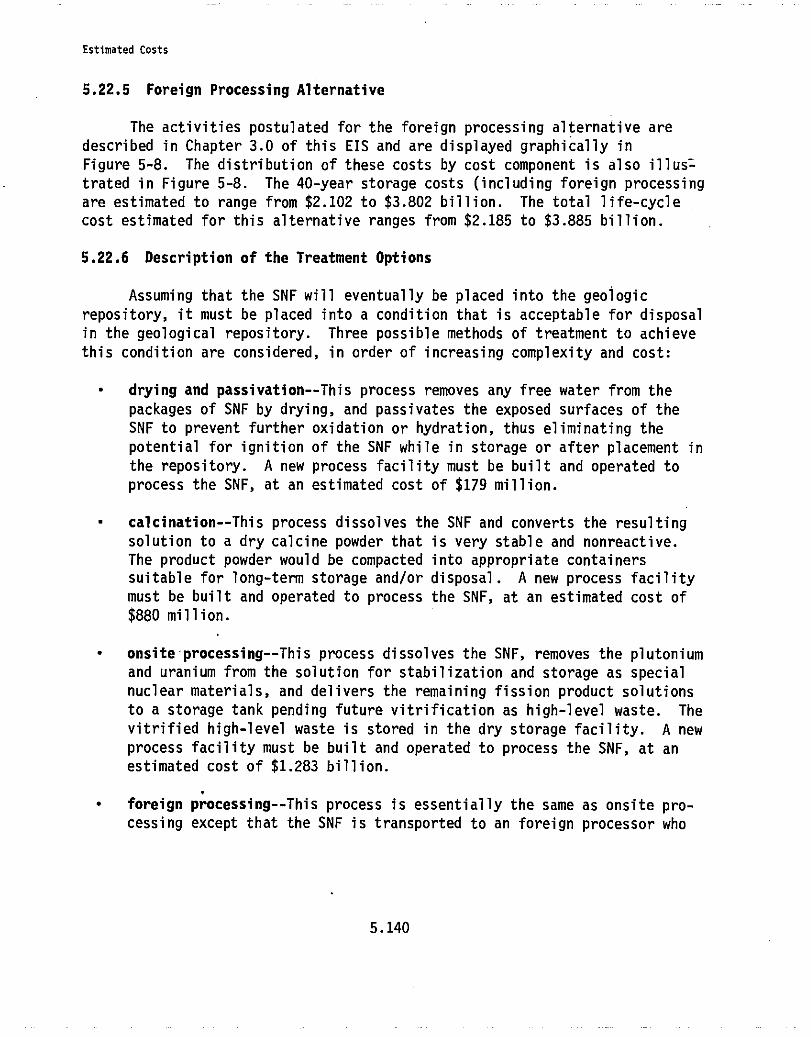
Estimated Costs
5.22.5 Foreign Processing Alternative
The activities postulated for the foreign processing alternative are
described in Chapter 3.0 of this EIS and are displayed graphically in
Figure 5-8. The distribution of these costs by cost component is also illus=
trated in Figure 5-8. The 40-year storage costs (including foreign processing
are estimated to range from $2.102 to $3.802 billion. The total life-cycle
cost estimated for this alternative ranges from $2.185 to $3.885 billion.
5.22.6 Description of the Treatment Options
Assuming that the SNF will eventually be placed into the geologic
repository, it must be placed into a condition that is acceptable for disposal
in the geological repository. Three possible methods of treatment to achieve
this condition are considered, in order of increasing complexity and cost:
• drying and passivation--This process removes any free water from the
packages of SNF by drying, and passivates the exposed surfaces of the
SNF to prevent further oxidation or hydration, thus eliminating the
potential for ignition of the SNF while in storage or after placement in
the repository. A new process facility must be built and operated to
process the SNF, at an estimated cost of $179 million.
• calcination--This process dissolves the SNF and converts the resulting
solution to a dry calcine powder that is very stable and nonreactive.
The product powder would be compacted into appropriate containers
suitable for long-term storage and/or disposal. A new process facility
must be built and operated to process the SNF, at an estimated cost of
$880 million.
• onsite processing--This process dissolves the SNF, removes the plutonium
and uranium from the solution for stabilization and storage as special
nuclear materials, and delivers the remaining fission product solutions
to a storage tank pending future vitrification as high-level waste. The
vitrified high-level waste is stored in the dry storage facility. A new
process facility must be built and operated to process the SNF, at an
estimated cost of $1.283 billion.
• foreign processing--This process is essentially the same as onsite pro-
cessing except that the SNF is transported to an foreign processor who
5.140
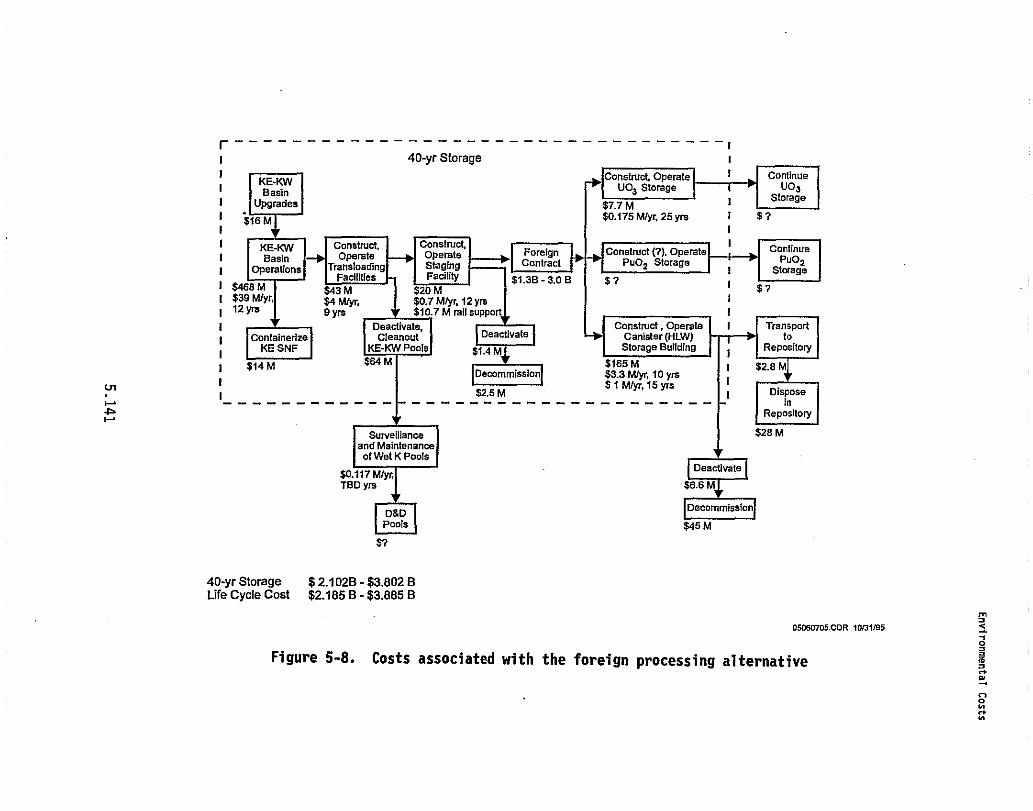
rn
4+Ar^
F — — — — — — — — — — — — — — — — — — — — — — — — — — — — — — — — — — I
I 40-yr Storage l
1 KE•KW ConsWct, Operate i Continue1 Basin UO3 Storage UO3
1 Upgrades $77M 1 Storage
1 $16 M1
$0.175 Mlyr, 25 yrs tI
$ 7
1 KE-F(WBasin
Construct, Construct,Operate Operate Foreign
IConstruct (7), Operate Continue
I Operations Transloadin Staging Contrail9
NO Storagei
PuOyStorage
Facilities Facility $1.36 - 3.O B $ 71 $458 M $43 M $20 M 1 $ 71 $39 Mfyr, b4
MlyG $0,7 Mtyr, 12 yrst 12 Yrs 9 yrs $10.7 M rail support 11 Deactivate, Construct, Operate I
Containerize Cleanout Deactivate Canister (HLW)KE SNF KE-KW Pools $1_q M Storage Building I
$14 M $64 MIDecommission $3.3 Mlyr, 10 ym
ERepository
$2.5 M$1 M/yr, 15 yrs j
— — — — — — — — — — — — — — — — — — — — — — — — — — — — — — — — —
Sury
etllence $28 Mand Maintenanceof Wet K Pools
Deactivate$0.117 MlynTBD yrs $6.6 M
D&DPools
a7
40-yr Storage $ 2.102B - $3.802 BLife Cycle Cost $2.185 B - $3.885 B
95050705.CDR 10/31/95
Figure 5-8. Costs associated with the foreign processing alternative
m
00
dna
0N1YN
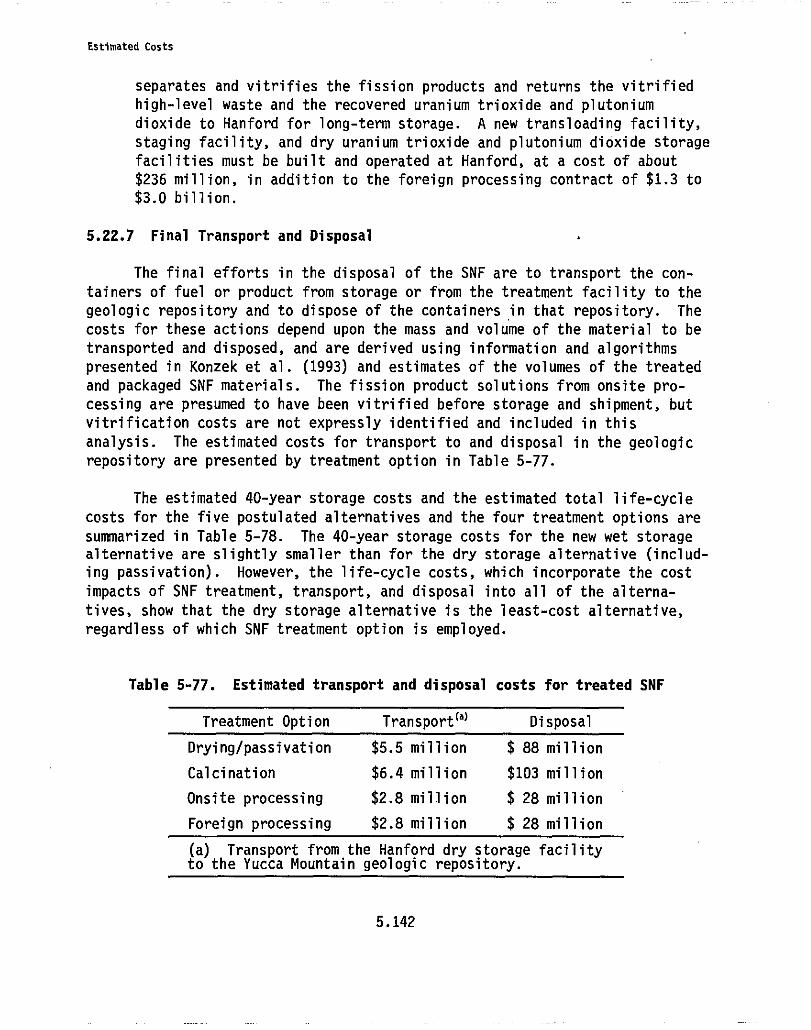
Estimated Costs
separates and vitrifies the fission products and returns the vitrified
high-level waste and the recovered uranium trioxide and plutonium
dioxide to Hanford for long-term storage. A new transloading facility,
staging facility, and dry uranium trioxide and plutonium dioxide storage
facilities must be built and operated at Hanford, at a cost of about
$236 million, in addition to the foreign processing contract of $1.3 to
$3.0 billion.
5.22.7 Final Transport and Disposal
The final efforts in the disposal of the SNF are to transport the con-
tainers of fuel or product from storage or from the treatment facility to the
geologic repository and to dispose of the containers in that repository. The
costs for these actions depend upon the mass and volume of the material to be
transported and disposed, and are derived using information and algorithms
presented in Konzek et al. (1993) and estimates of the volumes of the treated
and packaged SNF materials. The fission product solutions from onsite pro-
cessing are presumed to have been vitrified before storage and shipment, but
vitrification costs are not expressly identified and included in this
analysis. The estimated costs for transport to and disposal in the geologic
repository are presented by treatment option in Table 5-77.
The estimated 40-year storage costs and the estimated total life-cycle
costs for the five postulated alternatives and the four treatment options are
summarized in Table 5-78. The 40-year storage costs for the new wet storagealternative are slightly smaller than for the dry storage alternative (includ-
ing passivation). However, the life-cycle costs, which incorporate the cost
impacts of SNF treatment, transport, and disposal into all of the alterna-
tives, show that the dry storage alternative is the least-cost alternative,
regardless of which SNF treatment option is employed.
Table 5-77. Estimated transport and disposal costs for treated SNF
Treatment Option Transport(a) Disposal
Drying/passivation
$5.5 million
$ 88 million
Calcination
$6.4 million
$103 million
Onsite processing $2.8 million $ 28 million
Foreign processing $2.8 million $ 28 million
(a) Transport from the Hanford dry storage facilityto the Yucca Mountain geologic repository.
WREN
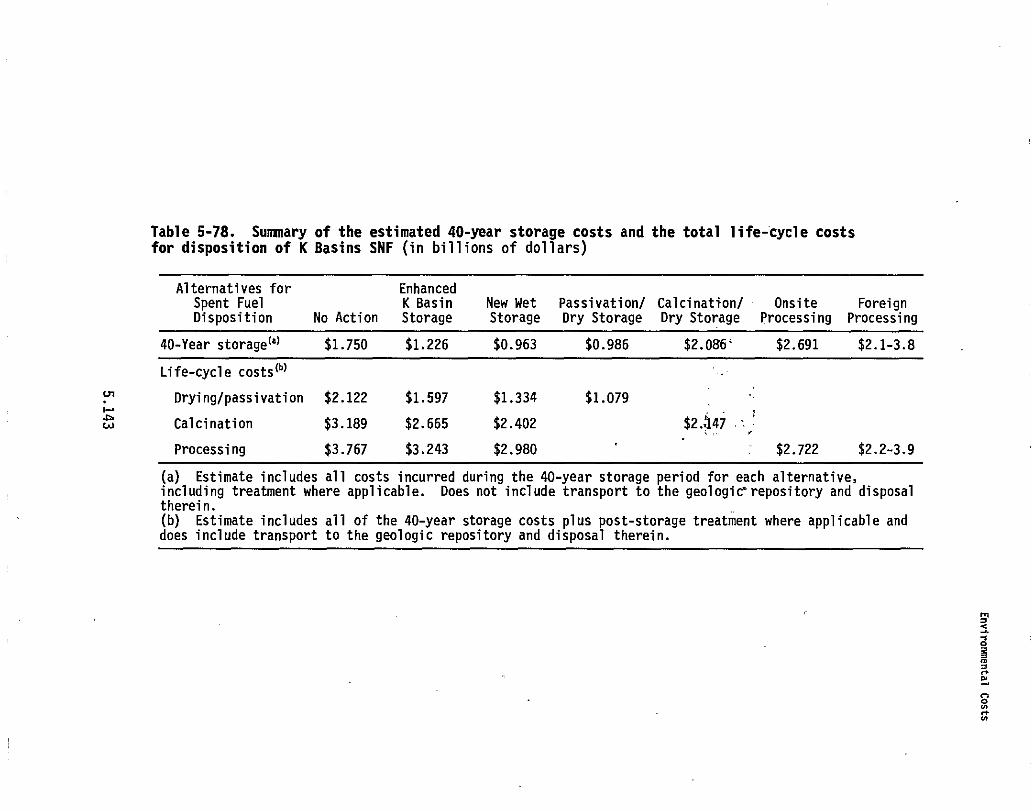
Table 5-78. Summary of the estimated 40-year storage costs and the total life-cycle costsfor disposition of K Basins SNF (in billions of dollars)
Alternatives for EnhancedSpent Fuel K Basin New Wet Passivation/ Calcination/ Onsite ForeignDisposition No Action Storage Storage Dry Storage Dry Storage Processing Processing
40-Year storage (') $1.750 $1.226 $0.963 $0.986 $2.0864 $2.691 $2.1-3.8
Life-cycle costs (b)
Drying/passivation $2.122 $1.597 $1.334 $1.079
w Calcination $3.189 $2.665 $2.402 $2.:147
Processing $3.767 $3.243 $2.980 $2.722 $2.2-3.9
(a) Estimate includes all costs incurred during the 40-year storage period for each alternative,including treatment where applicable. Does not include transport to the geologic°repository and disposaltherein.(b) Estimate includes all of the 40-year storage costs plus post-storage treatment where applicable anddoes include transport to the geologic repository and disposal therein.
m
03NnN_
ON1?N
THIS PAGE INTEN; MNA1,1Y
LEFT BLANK
6.0 REGULATORY REQUIREMENTS
It is DOE's policy to conduct its operations in an environmentally safe
and sound manner in compliance with the letter and spirit of applicable
environmental statutes, regulations, and standards. Statutory, regulatory,
and potential permit requirements relative to the management of K Basins SNF
are discussed in this chapter.
6.1 Transportation Requirements
All alternatives other than the no action alternative involve transpor-
tation of SNF and waste products from the K Basins. Shipment of.the SNF and
waste products stored at the K Basins is not directly subject to the Nuclear
Regulatory Commission's (NRC's) requirements for packaging and transportation
of radioactive material at 10 CFR 71 because the SNF and waste products are
not material that is licensed by the NRC or an Agreement State. Shipment of
SNF and waste products from the K Basins for all but the foreign processing
alternative is also not directly subject to the Department of Transportation's
(DOT's) requirements for the transportation of hazardous materials at
49 CFR 171-180 because the shipments would occur exclusively on federal
government property (i.e., the Hanford Site) over portions of the property
where access is controlled at all times through the use of gates and guards.
All shipments of SNF and waste products on the Hanford Site will comply
with the requirements of DOE Order 1540.2 ("Hazardous Material Packaging for
Transport - Administrative Procedures") and DOE Order 5480.3 ("Safety Require-
ments for the Packaging and Transportation of Hazardous Materials, Hazardous
Substances, and Hazardous Wastes"). DOE policy is to ensure that all packag-
ings used in transporting radioactive and other hazardous materials meet all
applicable safety requirements (DOE Order 1540.2, Section 8). The Hanford
administrative process specifies packaging design that provides equivalent
safety to that required in 10 CFR 71.
Significant international and federal laws, regulations, and require-
ments that apply to the transportation of hazardous and radioactive materials
include the following:
• International Convention on the Safety of Life at Sea of 1960 (as
amended)
Atomic Energy Act (42 USC 2011 et seq.)
• Hazardous Materials Transportation Act (49 USC 1801 et seq.)
6.1
• Resource Conservation and Recovery Act, as amended by the Hazardous and
Solid Waste Amendments (42 USC 26901 et seq.)
Executive Order 12114 (Environmental Effects Abroad of Major Federal
Actions).
Offsite transportation of hazardous and radioactive materials, sub-
stances, and wastes are subject to the regulations of the DOT (49 CFR 171-178,
383-397), the NRC (10 CFR 71), and the EPA (40 CFR 262, 265).
DOT regulations contain requirements for identifying a material as haz-
ardous or radioactive. These regulations interface with NRC and EPA regula-
tions for identifying material, but the DOT regulations govern hazard communi-
cation via placarding, labeling, reporting, and shipping requirements (see
especially 10 CFR 71.5, in which DOT regulations are applied by NRC regula-
tions to shipping of radioactive materials).
NRC regulations address packaging design and certification requirements.
Certification is based on safety analysis report data on the packaging design
for various hypothetical accident conditions.
EPA hazardous waste transportation regulations address labeling and rec-
ord keeping, including shipping documentation (waste manifest).
General overland carriage is subject to specific regulations dealing
with packaging notification, escorts, and communication. There are specific
provisions for truck and for rail. For carriage by truck, the carrier must
use interstate highways or state-designated preferred routes. DOT regulations
found in 49 CFR 397.101 establish routing and driver training requirements for
highway carriers of packages containing "highway-route-controlled quantities"
of radioactive materials. SNF shipments constitute such controlled shipments.
For carriage by rail car, each shipment by the railroad must comply with
49 CFR 174 Subpart K "Detailed Requirements for Radioactive Materials."
For overseas transportation, the NRC and DOT conform their regulations
to the model regulations of the International Atomic Energy Agency to the
extent feasible. These model international regulations are also incorporated
into the International Maritime Dangerous Goods Code, which was developed to
supplement the International Convention on the Safety of Life at Sea, to which
the U.S. is a signatory. Transportation risk in the global commons must be
evaluated in accordance with Executive Order 12114, Environmental Effects
Abroad of Major Federal Actions (44 FR 1957).
6.2
Transportation of dangerous cargoes through the Panama Canal is governed
by the International Maritime Dangerous Goods Code and is addressed in
35 USC 113. General provisions for passage through the Panama Canal are found
at 35 USC 101-135. 3eneral regulations governing navigation, including the
applicability of the International Regulations for the-Prevention of Colli-
sions at Sea (1972), are found throughout 33 CFR.
Relevant regulations applying to transport of SNF by vessel are found in
10 CFR 71 and 73 (NRC) and 49 CFR 176 (DOT). These regulations address pre-
notification to the U.S. Coast Guard for inspection and provide specifications
for packaging, labeling, and other preparation for shipment. A Certification
of Competent Authority must be obtained in compliance with International
Atomic Energy Agency requirements. Specific provisions are made for stowage,
including package surface temperature limitations, spacing, and total aggre-
gate volume and number of freight containers.
6.2 Occupational Radiation Exposure
DOE's radiation protection standards, limits, and program requirements
for protecting occupational workers from ionizing radiation resulting from the
conduct of DOE activities are at 10 CFR 835. All activities associated with
any alternative will be conducted consistent with these requirements. The
annual total effective dose equivalent limit for general employees is 0.05 Sv
(5 rem) [10 CFR 835.202(a)(1)]. The DOE is committed to measures that will
"maintain radiation exposure in controlled areas as low as reasonably achiev-
able (ALARA) through facility and equipment design and administrative control"
(10 CFR 835.1001).
6.3 Radiation Exposure to Members of the Public
Chapter II of DOE Order 5400.5 provides that DOE activities shall be
conducted so that the exposure of members of the public to radiation sources
as a consequence of all routine DOE activities shall not cause an effective
dose equivalent exceeding 1 mSv/year (100 mrem/year).
Activities associated with any of the alternatives will be managed so
that radiation exposure to any member of the public authorized to enter the
controlled area where activities associated with implementation of any altern-
ative are conducted will not exceed 1 mSv (100 mrem) total effective dose
equivalent in a year (10 CFR 835.208). Air emissions resulting from the
implementation of any alternative will comply with the 0.1-mSv/year (10-mrem/
year) standard at 40 CFR 61.92.
6.3
6.4 Noise
Federal efforts to regulate noise largely derive from the Noise Control
Act of 1972 (42 USC 4901-4918). Under the Act, federal agencies such as DOE
are to carry out their programs to further the Act's purpose of promoting an
environment for all Americans that is free from noise that jeopardizes health
or welfare [42 USC 4903(a)]. Beyond the general obligation in the Noise Con-
trol Act, no specific requirements in the Noise Control Act or in any regula-
tions implemented under the Act prohibit or regulate the activities conducted
under any of the alternatives.
The Noise Control Act requires federal agencies to meet state and local
requirements relating to the abatement of noise [42 USC 4903(b)]. The state
of Washington has adopted maximum environmental noise levels. No activities
associated with any alternative will violate Washington's maximum permissible
environmental noise levels (WAC 173-60-040). In addition, no requirements of
Benton County, Washington, will prohibit or regulate the noise associated with
operation of any alternative.
The Occupational Safety and Health Administration (OSHA) has established
regulations to regulate the noise exposure of occupational workers
(29 CFR 1910.95). DOE Order 5480.4 specifies that DOE contractor operations,
such as those to be conducted under any alternative, are to meet all OSHA
standards in 29 CFR 1910.
6.5 Floodplain Management and Protection of Wetlands
Executive Order 11988, issued by President Carter in 1977 (42 FR 26951),
requires an executive branch agency such as DOE to evaluate the potential
effects of any actions it may take in a floodplain and ensure that its plan-
ning and programs reflect consideration of flood hazards and floodplain
management. DOE policy is to avoid to the extent possible the long- and
short-term adverse impacts associated with the occupancy and modification of
floodplains and avoid direct and indirect support of floodplain development
wherever there is a practicable alternative [10 CFR 1022.3(a)]. Information
on the flood plain status of the K Basins and the reference and CSB storage
sites is in Section 4.8.1. DOE has determined that the elevation of a
500-year flood will reach neither the elevation of the bottom of the K Basins
nor the elevation of the bottom of any SNF facility at the CSB or reference
site.
6.4
6.6 Hazardous Waste Management
Nonradioactive hazardous (dangerous) wastes are temporarily stored at
the nonradioactive dangerous waste storage facility in the 200 West Area. The
wastes are subsequently transported from the Hanford Site pursuant to an
existing contract with Burlington Environmental Inc. and disposed of offsite
at a hazardous waste disposal site(s) with appropriate Resource Conservation
and Recovery Act (RCRA) or state permits.
Most of the authority to administer the RCRA program, including treat-
ment, storage and disposal standards, and permit requirements, has been
delegated by EPA to the State of Washington, except for corrective action
(cleanup). Washington State RCRA (WSHWMA) Dangerous Waste Regulations are
found in WAC 173-303 (Washington Administrative Code). Generally, RCRA does
not apply to source material, special nuclear material, by-product material,
SNF, or radioactive-only wastes. Should SNF be processed into or commingled
with a hazardous waste as defined by Subtitle C of RCRA, then the generation,
treatment, storage, and disposal of the hazardous waste portion of such mixed
waste would be subject to EPA regulations in 40 CFR 260-268 and 270-272 or to
the applicable state regulations in WAC 173-303 and potentially to the terms
of a RCRA treatment, storage, or disposal permit.
6.7 Protection of Wetlands
Executive Order 11990, issued by President Carter in 1977 (42 FR 26961),
requires executive branch agencies such as DOE to minimize destruction, loss,
or degradation of wetlands in carrying out the agency's responsibilities.
Agencies are to avoid new construction on wetlands unless there is no practi-
cable alternative. DOE has determined that no wetlands are present on land
that would be occupied if any alternative is implemented.
6.8 Species Protection
The Endangered Species Act of 1973 requires that federal agencies not
take any action that is likely to jeopardize the continued existence of any
endangered species or threatened species or result in destruction or adverse
modification of critical habitat for such species [16 USC 1536(a)(2)]. DOE
has conducted biological surveys of the two sites where construction might
occur (the reference and CSB sites). Based on these surveys, DOE has con-
cluded that implementation of any alternative will not jeopardize 1) the
M-1
continued existence of any species listed as threatened or endangered under
the Endangered Species Act of 1973 at 50 CFR 17 Subpart B, or 2) any critical
habitat of such species. No critical habitat exists for any species on theHanford Site.
Unless otherwise permitted by regulation, the Migratory Bird Treaty Act
(16 USC 703) makes it unlawful to pursue, hunt, take, capture, kill (or to
attempt any of the preceding) any migratory bird or nest or eggs of such bird.
The Bald and Golden Eagle Protection Act (16 USC 668) protects bald and golden
eagles. DOE has determined that implementation of any of the alternatives
under consideration in this EIS would not violate either of these statutes.
6.9 Native American, Archaeological, and Historic Preservation Statutes
DOE's American Indian Tribal Government Policy is in DOE Order 1230.2,
issued April 8, 1992. DOE commits in the Order to consult with tribal govern-
ments to ensure that tribal rights and concerns are considered before DOE
takes actions that may affect tribes. DOE also commits to avoid unnecessary
interference with traditional tribal religious practices.
The American Indian Religious Freedom Act (42 USC 1996) establishes that
it is the United States' policy to protect and preserve for American Indians
their inherent right of freedom to believe, express, and exercise their tradi-
tional religions including access to sites, use and possession of sacred
objects, and the freedom to worship through ceremonies and traditional rites.
The Native American Graves Protection and Repatriation Act provides that
tribal descendants shall own Native American human remains and cultural items
discovered on federal lands after November 16, 1990 (25 USC 3002). When items
are discovered during an activity on federal lands, the activity is to cease
and appropriate tribal governments are to be notified. Work on the activity,
can resume 30 days after receipt of certification that notice has been
received by the tribal governments.
The Archaeological Resources Preservation Act of 1979 prohibits the
excavation of material remains of past human life that.have archaeological
interest and are at least 100 years old without a permit from the appropriate
federal land manager or an exemption (16 USC 470bb, 470ee). The federal land
manager for the Hanford Site is DOE.
The National Historic Preservation Act authorizes the Secretary of
the Interior to maintain a National Register of Historic Places [16 USC
470a(a) (1)]. Federal agencies are to take into account the effect of their
actions on properties included in or eligible for inclusion in the Register
M- 1-
and afford the Advisory Council on Historic Preservation a reasonable opportu-
nity to comment on such actions (16 USC 470f). DOE will review facilities in
the 100 K Area to determine eligibility for inclusion in the National Register
of Historic Places.
DOE has reviewed the preceding statutes and has determined that imple-
mentation of any alternative would be consistent with the statutes through
implementation of appropriate mitigating measures.
6.10 Radioactive Air Emissions
Radioactive emissions from facilities at Hanford are subject to EPA's
National Emission Standards for Hazardous Air Pollutants (NESHAP) requirements
at 40 CFR 61. In particular, Subpart A, "General Provisions," and Subpart H,
"National Emission Standards for Emissions of Radionuclides Other Than Radon
From Department of Energy Facilities," are applicable to all alternatives.
Emissions of radionuclides to the ambient air from a DOE facility are not to
exceed those amounts that would cause any member of the public to receive in
any year an effective dose equivalent of 0.1 mSv/year (10 mrem/year)
(40 CFR 61.92). For any alternative selected for implementation, DOE Richland
Operations Office will submit an application for approval of construction or
modification to EPA Region 10 under the NESHAP requirements at 40 CFR 61.07
for any new or modified facility associated with the alternative with pro-'
jected radioactive emissions that are estimated to exceed 1% of the 0.1 mSv/
year (10 mrem/year) standard [40 CFR 61.96(b)]. The only alternatives with
radioactive emissions projected to exceed this level are the calcination and
processing alternatives (see Table 5-14).
New sources of radioactive emissions at Hanford are also subject to the
licensing requirements of the Washington State Department of Health at
WAC 246-247. DOE Richland Operations Office holds a license (No. FF-01)
issued by the Department of Health covering airborne radioactive effluents
from Hanford operations. This license will be incorporated into DOE's operat-
ing permit for the Hanford Site when the permit is issued (WAC 246-247-060).
DOE Richland Operations Office will submit a notice of construction to the
Department of Health as required by WAC 246-247-060 before constructing or
modifying any facility associated with any alternative under consideration in
this EIS with projected radioactive emissions. All new construction and sig-
nificant modifications of emission units will utilize best available radio-
nuclide control technology [WAC 246-247-040(3)].
6.7
6.11 Nonradioactive Air Emissions
All of the Hanford Site has attainment status for the National Ambient
Air Quality Standards listed at 40 CFR 50. Consequently, a written determina-
tion consistent with 40 CFR 93 Subpart B indicating any alternative conforms
to Washington's Implementation Plan for-achieving the standards does not need
to be prepared.
Major new sources of pollutants in attainment areas are subject to pre-
vention of significant deterioration (PSD) permit requirements. The only
facilities under consideration in this EIS that could potentially require a
PSD permit are a processing or a calcination facility. Nitrogen oxide emis-
sions from each of these facilities are projected to be approximately
16,000 kg/year (18 tons/year). These levels of emissions would not by them-
selves trigger the PSD permit requirements at 40 CFR 52.21 or WAC 173-400-141.
When combined with other nitrogen oxide emissions at Hanford, however, these
level of emissions could potentially cause the Hanford Site baseline nitrogen
dioxide emissions to exceed 36,000 kg/year (40 tons/year) [40 CFR 52.21(b)
(23)], thus triggering the need for a modification to Hanford's existing PSD
permit (permit No. PSD-X80-14) issued to DOE Richland Operations Office by EPA
Region 10 in 1980. If a decision is made to construct a processing or
calcination facility at Hanford, total Hanford Site emissions of nitrogen
oxides will be analyzed to determine the need for a PSD permit modification.
The alternatives under consideration is this EIS are not included withinthe source categories subject to the standards of performance for new station-
ary sources at 40 CFR 60 or WAC 173-400-115.
Nonradioactive emissions from any of the alternatives will not be
emitted in sufficiently high quantities to subject the facilities to the new
source review requirements at WAC 173-400-110(1) or WAC 173-460-040(1).
Both radioactive and nonradioactive emissions from any alternative
selected for implementation will eventually be covered in an operating permit
issued by Ecology for the entire Hanford Site under the procedures in
WAC 173-401. DOE Richland Operations Office submitted an operating permit
application for the Hanford Site to Ecology in May 1995 (DOE 19951).
6.12 Liquid Discharges to Surface Water
Small quantities of radionuclides would continue to be discharged to the
Columbia River under the no action and enhanced storage alternatives and under
the other alternatives until SNF is completely removed from the K Basins.
6.8
Water is withdrawn from the Columbia River to supply makeup water for the
K Basins; excess water is returned to the Columbia River through the
1908-KE outfall. The source of the radionuclides is residual contamination in
the water piping, which was formerly used to support reactor operations in the
100-K Area. Discharges at the 1908-KE outfall are in compliance with
1) the NPDES Permit (Permit No. WA-000374-3) incorporating the 1908-KE outfall
(the permit was issued to DOE by EPA Region 10) and 2) DOE Order 5480.4
("Environmental Protection, Safety, and Health Protection Standards").
6.13 Liquid Discharges to the Ground
Water remaining in the K Basins after removal of the SNF would be
treated with filters and ion exchange processes to remove radionuclides.
After treatment, the water would still contain tritium. This water would be
transported to the 200 Area Effluent Treatment Facility (ETF) where it would
be further treated before final disposal in the 200 Area State-Approved Land
Disposal Site (SALDS). Under the dry storage alternative, contaminated water
would result from pumping water from the storage tubes and as a result of
decontamination of the tubes. This water may also be treated to remove con-
tamination and then transported to the 200 Area ETF before final treatment and
disposal in the 200 Area SALDS. DOE received a waste discharge permit
(No. ST 4500) for the ETF from Ecology in June 1995. Nonradioactive liquid
effluents from the calcination facility would be routed to the 200 Area
Treated Effluent Disposal Facility (TEDF). A waste discharge permit
(No. ST 4502) for the TEDF was issued by Ecology to DOE in April 1995.
Permits ST 4500 and ST 4502 both contain provisions to be followed to obtain
approval of new influent streams not addressed in the original permitapplications.
Any alternative that involves construction of a new facility could also
involve construction of a septic system to dispose of sanitary wastes. For
any such system, the DOE Richland Operations Office policy is to seek approval
from the Washington State Department of Health and follow the requirements at
WAC 246-272 ("On-Site Sewage Systems").
6.9
I.tQNp)'tA,NjVjjS PAGE t .
LEFT BLtktj-V"
7.0 REFERENCES
42 FR 26961. May 25, 1977. "Protection of Wetlands." Executive Order 11990(May 24, 1977). Federal Register.
42 FR 26951. May 25, 1977. "Floodplain Management." Executive Order 11988(May 24, 1977). Federal Register.
44 FR 1957. January 4, 1979. "Environmental Effects Abroad of Major FederalActions." Executive Order 12114. Federal Register.
58 FR 41981. August 3, 1993. "Federal Compliance With Right-to-Know Laws andPollution Prevention Requirements." Executive Order 12856. Federal Register.
59 FR 7629. February 16, 1994. "Federal Actions to Address EnvironmentalJustice in Minority Populations and Low-Income Populations." ExecutiveOrder 12898 (February 11, 1994). Federal Register.
Bergsman, K. H. 1995. Preliminary Hanford Technical Input for the Departmentof Energy Programmatic Spent Nuclear Fuel Management and Idaho NationalEngineering Laboratory Environmental Restoration and Waste Management ProgramsEnvironmental Impact Statement. WHC -EP-0848, Rev. 0, Westinghouse HanfordCompany, Richland, Washington.
Bergsman, K. H., T. B. Bergman, D. W. Bergmann, G. E. Costley, M. T. Jansky,D. S. Leach, R. L. McCormack, M. J. Monthey, A. N. Praga, I. K. Ullah,W. L. Willis, and A. G. Hosler. 1995. K Basin Environmental Impact StatementTechnical Input. WHC-SD-SNF-TI-013, Rev. 0, Westinghouse Hanford Company,Richland, Washington.
Bureau of Economic Analysis. 1994. Regional Economic Information System.U.S. Department of Commerce, Bureau of Economic Analysis, Washington, D.C.
BNFL (British Nuclear Fuels Limited). 1994. Testimony by Marilyn Meigsrepresenting BNFL Ltd. at the Pasco, Washington hearing on the U.S. Departmentof Energy's Draft Programmatic Environmental Impact Statement on Spent NuclearFuel Management and Idaho National Engineering Laboratory.EnvironmentalRestoration and Waste Management Programs.
Chatters, J. C. (ed.). 1989. Hanford Cultural Resources Management Plan.PNL-6942, Pacific Northwest Laboratory, Richland, Washington.
Chatters, J. C., and N. A. Cadoret. 1990. Archeological Survey of the200-East and 200-West Areas, Hanford Site, Washington. PNL-7264, PacificNorthwest Laboratory, Richland, Washington.
Connelly, M. P., J. V. Borghese, C. D. Delaney, B. H. Ford, J. W. Lindberg,and S. J. Trent. 1992. Hydrogeo7ogic Model for the 200 East GroundwaterAggregate Area. WHC-SD-EN-TI-019, Rev. 0, Westinghouse Hanford Company,Richland, Washington.
7.1
Cushing, C. E., (ed.). 1995. Hanford Site National Environmental Policy Act(NEPA) Characterization. PNL-6415, Rev. 7, Pacific Northwest Laboratory,Richland, Washington.
Dating, P. M., and M. S. Harris. 1994. Transportation Impact Analysis forShipment of Irradiated N-Reactor Fuel and Associated Materials. PNL-10249,Pacific Northwest Laboratory, Richland, Washington.
Davis, J. D., D.-B. Barnett., L. C. Swanson, W. J. McMahon, andC. D. Palomares. 1993. Site Characterization Report: Results of DetailedEvaluation of the Suitability of the Site Proposed for Disposal of 200 AreasTreated Effluent. WHC-SD-EN-SE-004, Westinghouse Hanford Company, Richland,Washington.
Dean Runyan Associates. 1994. Washington 1991-1993: Economic Impacts ofTravel and Visitor Volume. Prepared for Washington State Tourism, Departmentof Community, Trade, and Economic Development, by Dean Runyan Associates,Portland, Oregon.
Dirkes, R.L., and R. W. Hanf. 1995. Hanford Site Environmental Report forCalendar Year 1994. PNL-10574, Pacific Northwest Laboratory, Richland,Washington.
Dirkes, R. L., R. W. Hanf, R. K. Woodruff, and R. E. Lundgren (eds). 1994.Hanford Site Environmental Report for Calendar Year 1993. PNL-9823, PacificNorthwest Laboratory, Richland, Washington.
DNFSB (Defense Nuclear Facilities Safety Board). 1994. Recommendation 94-1in a letter from the Defense Nuclear Facilities Safety Board to the Secretaryof Energy dated May 26, 1994.
DOE (U.S. Department of Energy). 1988. Consultation Draft: Site Characteri-zation Plan, Reference Repository Location, Hanford Site, Washington. Vol. 1of 9, DOE/RW-0164, U.S. Department of Energy, Washington, D.C.
DOE (U.S. Department of Energy). 1989. Decommissioning of Eight SurplusProduction Reactors at the Hanford Site, Richland, Washington. DOE/EIS-0119D,U.S. Department of Energy, Washington, D.C.
DOE (U.S. Department of Energy). 1991a. Environmental Restoration and WasteManagement Site-Specific Plan for the Richland Operations Office.DOE/RL-91-25, U.S. Department of Energy, Richland, Washington.
DOE (U.S. Department of Energy). 1991b. Overview of the Hanford CleanupFive-Year Plan. U.S. Department of Energy, Richland, Washington.
DOE (U.S. Department of Energy). 1992a. Emergency Response Plan forU.S. Department of Energy, Richland Field Office. Prepared for theU.S. Department of Energy by Pacific Northwest Laboratory, Richland,Washington.
7.2
DOE (U.S. Department of Energy). 1992b. Environmental Assessment of 105-KEand 105-KW Basins Fuel Encapsulation and Repackaging, 100-K Area, HanfordSite, Richland, Washington. DOE/EA-0535, U.S. Department of Energy, Richland,Washington.
DOE (U.S. Department of Energy). 1993a. Hanford Site Development Plan.DOE/RL-93-19, U.S. Department of Energy, Richland, Washington.
DOE (U.S. Department of Energy).. 1993b. U.S. Department of Energy InterimMixed Waste Inventory Report: Waste Streams, Treatment Capacities andTechnologies. DOE/NBM-1100, U.S. Department of Energy, Washington, D.C.
DOE (U.S. Department of Energy). 1994a. Hanford Site Waste Minimization andPollution Prevention Awareness Program Plan. DOE/RL-91-31, Rev. 1,U.S. Department of Energy, Richland, Washington.
DOE (U.S. Department of Energy). 1994b. Integrated Data Base for 1993:U.S. Spent Nuclear Fuel and Radioactive Waste Inventories, Projections, andCharacteristics. DOE/RW-0006, Rev. 10, U.S. Department of Energy, Oak RidgeNational Laboratory, Oak Ridge, Tennessee.
DOE (U.S. Department of Energy). 1995a. Department of Energy ProgrammaticSpent Nuclear Fuel Management and Idaho National Engineering LaboratoryEnvironmental Restoration and Waste Management Programs Final EnvironmentalImpact Statement. The Programmatic EIS includes Vol. 1, Appendix A, HanfordSite Spent Nuclear Fuel Management Program. DOE/EIS-0203-F, U.S. Departmentof Energy, Washington, D.C.
DOE (U.S. Department of Energy). 1995b. Notice of Intent to Prepare anEnvironmental Impact Statement for the Management of Spent Nuclear Fuel fromthe K Basins at the Hanford Site. U.S. Department of Energy, Richland,Washington. 60 FR 15905, March 28, 1995.
DOE (U.S. Department of Energy). 1995c. Implementation Plan for thePreparation of an Environmental Impact Statement on the Management of SpentNuclear Fuel from the K Basins at the Hanford Site. U.S. Department ofEnergy, Richland, Washington.
DOE (U.S. Department of Energy). 1995d. Memorandum for the Secretary fromThomas D. Grumbly and Tara O'Toole to Secretary of Energy, Hazel O'Leary.Approved by Secretary O'Leary. March 31, 1995.
DOE (U.S. Department of Energy). 1995e. Tank Waste Remediation SystemIntegrated Technology Plan. Prepared by the Technology Development ProgramOffice of the TWRS Program, DOE/RL-92-61, Rev. 2, U.S. Department of Energy,Richland, Washington.
DOE (U.S. Department of Energy). 1995f. Environmental Assessment forCharacterization of Stored Defense Production Spent Nuclear Fuel andAssociated Materials at the Hanford Site. DOE/EA-1030, U.S. Department ofEnergy, Richland, Washington.
7.3
DOE (U.S. Department of Energy). 1995g. Environmental Assessment: Transferof Plutonium Uranium Extraction Plant and 105 N Reactor Irradiated Fuel forEncapsulation and Storage at the 105 KE and 105 KW Reactor Fuel StorageBasins, 100 and 200 Areas, Hanford Site. DOE/EA-0988, U.S. Department ofEnergy, Richland, Washington.
DOE (U.S. Department of Energy). 1995h. Draft Environmental Impact Statementon a Proposed Nuclear Weapons Nonproliferation Policy Concerning ForeignResearch Reactor Spent Nuclear Fuel. .DOE/EIS-0218D, U.S..Department ofEnergy, Washington, D.C.
DOE (U.S. Department of Energy). 1995i. Hanford Site Air Operating PermitApplication. DOE/RL-95-07, U.S. Department of Energy, Richland, Washington.
DOE (U.S. Department of Energy) and Ecology (Washington State Department ofEcology). 1995. Final Environmental Impact Statement, Safe Interim Storageof Hanford Tank Wastes. DOE/EIS-0212, U.S. Department of Energy, Richland;Washington.
Dresel, P. E., S. P. Luttrell, J. C. Evans, W. D. Webber, P. D. Thorne,M. A. Chamness, B. M. Gillespie, B. E. Opitz, J. T. Rieger, and J. K. Merz.1994. Hanford Site Ground-Water Monitoring for 1993. PNL-10082, PacificNorthwest Laboratory, Richland, Washington.
EPA (U.S. Environmental Protection Agency). 1988a. Gap Filling P& EmissionFactors for Selected Open Area Dust Sources. EPA-450/4-88-003, U.S. Environ-mental Protection Agency, Research Triangle Park, North Carolina.
EPA (U.S. Environmental Protection Agency). 1988b. Guidance for ConductingRemedial Investigations and Feasibility Studies Under CERCLA, Direc-tive 9355.3-01. U.S. Environmental Protection Agency, Office of Solid Wasteand Emergency Response, Washington, D.C. (draft).
EPA (U.S. Environmental Protection Agency). 1991. Compilation of AirPollutant Emission Factors Volume II: Mobile Sources. AP-42, Suppl. A,Office of Air and Radiation, Office of Mobile Sources, Test and EvaluationBranch, Ann Arbor, Michigan.
EPA (U.S. Environmental Protection Agency). 1992. User's Guide for theIndustrial Source Complex (ISC2) Dispersion Models Volume I--User Instruc-tions. EPA-450/4-92-008a, Office of Air Quality Planning and Standards,Technical Support Division, Research Triangle Park, North Carolina.
EPA (U.S. Environmental Protection Agency). 1993. Compilation of AirPollutant Emission Factors Volume I: Stationary Point and Area Sources.AP-42, Suppl. F, Office of Air Quality Planning and Standards, Office of Airand Radiation, Research Triangle Park, North Carolina.
Ertec Northwest, Inc. 1981. A Cu7tura7 Resources Overview and Scenic andNatural Resources Assessment for the Skagit-Hanford Nuclear Power Project.Ertec Northwest, Inc., Seattle, Washington.
7.4
Fayer, M. J., and T. B. Walters. 1995. Estimated Recharge Rates at theHanford Site. PNL-10285, Pacific Northwest Laboratory, Richland, Washington.
Fitzner, R. E., and S. G. Weiss. 1994. Bald Eagle Site Management Plan forthe Hanford Site, South-Central Washington. DOE/RL-94-150, U.S. Department ofEnergy, Richland Operations Office, Richland, Washington.
Fulton, J. C. 1994. Hanford Spent Nuclear Fuel Project, Recommended PathForward. WHC-EP-0830, Rev. 0, Westinghouse Hanford Company, Richland,Washington.
Glantz, C. S., and M. M. Islam. 1988. The Data Collection Component of theHanford Meteorology Monitoring Program. PNL-6684, Pacific NorthwestLaboratory, Richland, Washington.
Glantz, C. S., and P. J. Perrault. 1991. Climatological Summary of the300 Area for the 300 -FF-1 Operable Unit Remedial Investigation.WHC-SD-EN-TI-005, Westinghouse Hanford Company, Richland, Washington.
Glantz, C. S., M. N. Schwartz, K. W. Burk, R. B. Kasper, M. W. Ligotke, andP. J. Perrault. 1990. Climatological Summary of Wind and Temperature Datafor the Hanford Meteorology Monitoring Network. PNL-7471, Pacific NorthwestLaboratory, Richland, Washington.
Green, J. R., and B. D. Flanagan. 1995. Hanford Site Truck Accident Rate,1990-1994. Westinghouse Hanford Company, Richland, Washington.
HAB (Hanford Advisory Board). 1994. Letter from Sue Gould to John Wagoner(DOE/RL), Chuck Clarke (EPA), and Mary Riveland (Department of Ecology), datedNovember 1994.
Hajek, B. F. 1966. Soil Survey: Hanford Project in Benton County,Washington. BNWL-243, Pacific Northwest Laboratory, Richland, Washington.
Hanlon, B. M. 1995. Waste Tank Summary for Month Ending December 31, 1994.WHC-EP-0182-81, Westinghouse Hanford Company, Richland, Washington.
HFSUWG (Hanford Future Site Uses Working Group). 1992. The Future forHanford: Uses and Cleanup. Final Report of the Hanford Future Site UsesWorking Group. U.S. Department of Energy, Richland, Washington.
Hoitink, D. J., and K. W. Burk. 1994. Climatological Data Summary 1993 withHistorical Data. PNL-9809, Pacific Northwest Laboratory, Richland,Washington.
Holdren, G. R., C. S. Glantz, L. K. Berg, K. Delinger, S. M. Goodwin,J. R. Rustad, R. Schalla, and J. A. Schramke. 1994. Environmental Settingsfor Selected U.S. Department of Energy Installations-Support Information forthe Programmatic Environmental Impact Statement. PNL-10180, Pacific NorthwestLaboratory, Richland, Washington.
7.5
Holloman, W. D., and C. M. Motzko. 1992. Westinghouse Hanford CompanyPerformance Indicators December 1991. WHC-SP-0440-39, Westinghouse HanfordCompany, Richland, Washington.
Holloman, W. D., and C. M. Motzko. 1993. Westinghouse Hanford CompanyPerformance Indicators December 1992. WHC-SP-0440-51, Westinghouse HanfordCompany, Richland, Washington.
Holt, R. G., L. E. Gadbois, and D. P. Holland. .1995. "Hanford FederalFacility Agreement and Consent Order (Tri-Party Agreement) Unit Managers'Recommendation to Resume Discussions on M-34 Basin Changes." Letter toK. M. Thompson (U.S. Department of Energy), D. R. Sherwood (U.S. EnvironmentalProtection Agency), and R. F. Stanley (Washington State Department ofEcology), June 26, 1995.
Homann Associates Incorporated. 1988. EPI Code. Homann AssociatesIncorporated, Fremont, California.
ICRP (International Commission on Radiological Protection). 1991. 1990Recommendations of the International Commission on Radiological Protection.ICRP Publication 60, Pergamon Press, Elmford, New York.
ITAT (Independent TechnicalAssessment Team). 1994. Dry Storage of N ReactorFuel, Independent Technical Assessment. Vol. 1, Independent Technical Assess-ment Team. MAC Technical Services Co., Richland, Washington.
Johnson, V. G., D. L. Graham, and S. P. Reidel. 1993. "Methane in ColumbiaRiver Basalt Aquifers: Isotopic and Geohydrologic Evidence for a Deep Coal-Bed Gas Source in the Columbia Basin, Washington." American Association.ofPetroleum Geologist Bulletin, Vol. 77, pp. 1192-1207.
Kasza, G. L., M. J. Hartman, W. A. Jordan, and J. V. Borghese. 1994.Groundwater Maps of the Hanford Site, December 1993. WHC-EP-0394-8,Westinghouse Hanford Company, Richland, Washington.
Konzek, G. J., R. I. Smith, M. C. Bierschbach, and P. N. McDuffie. 1993.Revised Analyses of Decommissioning for the Reference Pressurized WaterReactor Power Station. NUREG/CR-5884, Draft for Comment. U.S. NuclearRegulatory Commission report by Pacific Northwest Laboratory, Richland,Washington.
Lansing, K. A., T. L. Aldridge, D. S. Cunningham, D. A. Hammond,J. E. Lindsey, J. L. Newcomb, I. L. Scrimsher, and J. J. Severud. 1992.Westinghouse Hanford Company Health and Safety Report, 1991. WHC-SP-0564-24,Westinghouse Hanford Company, Richland, Washington.
Latimer, W. M. 1952. Oxidation Potentials. Prentice-Hall, Inc., New York,New York.
Lindberg, J. W. 1993. Geology of the 100-K Area, Hanford Site, South-CentralWashington. WHC-SD-EN-TI-155, Rev. 0, Westinghouse Hanford Company, Richland,Washington.
UP
Luttrell, S. P. 1995. "Ground-Water Modeling for the C-018H Facility."Letter report to R. D. Hildebrand (U.S. Department of Energy), April 5, 1995,Pacific Northwest Laboratory, Richland, Washington.
MIG (Minnesota IMPLAN Group). 1993. Micro IMPAN User's Guide. Micro IMPLANGroup, St. Paul, Minnesota.
Napier, B. A., R. A. Peloquin, D. L. Strenge, and J. V. Ramsdell. 1988.GENII - The Hanford.Environmenta7 Radiation Dosimetry Software System.PNL-6584, Vols. 1-3, Pacific Northwest Laboratory, Richland, Washington.
National Park Service. 1994. Hanford Reach of the Columbia River:Comprehensive River Conservation Study and Environmental Impact Statement.U.S. Department of the Interior, Washington, D.C.
Neuhauser, K. S., and F. L. Kanipe. 1992. RADTRAN 4: Volume 3 User's Guide.SAND89-2370, Sandia National Laboratories, Albuquerque, New Mexico.
NRC (U.S. Nuclear Regulatory Commission). 1980. Proposed Revision 1 toRegulatory 1,23, Meteorology Programs in Support of Nuclear Power Plants.U.S. Nuclear Regulatory Commission, Washington D.C.
NRC (U.S. Nuclear Regulatory Commission). 1982. Draft Environmental State-ment Related to the Construction of Skagit/Hanford Nuclear Project, Units 1and 2, Prepared by Puget Sound Power & Light Company, Pacific Power and LightCompany, the Washington Water Power Company, and Portland General ElectricCompany. NUREG-0894, U.S. Nuclear Regulatory Commission, Washington, D.C.
OFM (Office of Financial Management). 1994a. 1994 Population Trends forWashington State. Office of Financial Management, Forecasting Division.Olympia, Washington.
OFM (Office of Financial Management). 1994b. Inter-Censa7 and Post-Censa7Estimates of County Populations by Age and Sex: State of Washington1980-1994. Office of Financial Management, Forecasting Division. Olympia,Washington.
PNL (Pacific Northwest Laboratory). 1992. Safety Analysis Report for324 Building Waste Technology, Engineering Laboratory. PNL-7989, PacificNorthwest Laboratory, Richland, Washington.
Poole, L. D. 1992. Reproductive Success and Nesting Habitat of LoggerheadShrikes in Shrubsteppe Communities. M.S. Thesis, Oregon State University,Corvallis, Oregon.
Rao, R. K., E. L. Wilmot, and R. E. Luna. 1982. Non-Radiological Impacts ofTransporting Radioactive Material. SAND81-1703, Sandia National Laboratories,Albuquerque, New Mexico.
Relander, C. 1956. Drummers and Dreamers. Caxton Printers, Caldwell, Idaho.
7.7
Rice, D. G. 1968a. Archaeological Reconnaissance: Ben Franklin ReservoirArea, 1968. Washington State University, Laboratory of Anthropology, Pullman,Washington.
Rice, D. G. 1968b. Archaeological Reconnaissance: Hanford Atomic Works.U.S. Atomic Energy Commission, National Park Service and Washington StateUniversity, Pullman, Washington.
Rice, D. G. 1980. Overview of Cu7tura7 Resources on the Hanford Reservationin South Central Washington State.Report submitted to U.S. Department ofEnergy, Richland Operations Office, Richland, Washington.
Rickard, W. H., and D. G. Watson. 1985. "Four Decades of EnvironmentalChange and Their Influences Upon Native Wildlife and Fish on the Mid-ColumbiaRiver, Washington, U.S.A." Environ. Conserv. 12:241-238.
Rohay, A. C. 1989. Earthquake Recurrence Rate Estimates for EasternWashington and the Hanford Site. PNL-6956, Pacific Northwest Laboratory,Richland, Washington.
Schramke, J. A. 1993. Hanford Hydrologic Data for the PSIS. PacificNorthwest Laboratory, Richland, Washington.
Schramke, J. A., C. S. Glantz, and G. R. Holdren. 1994. Hanford SiteEnvironmental Setting Data Developed for the Unit Risk Factor Methodology inSupport of the Programmatic Environmental Impact Statement (PSIS). PNL-9801,Pacific Northwest Laboratory, Richland, Washington.
Schreckhise, R. G., K. Rhoads, J. S. Davis, B. A. Napier, and J. V. Ramsdell.1993. Recommended Environmental Dose Calculation Methods and Hanford-SpecificParameters. PNL-3777, Rev. 2, Pacific Northwest Laboratory, Richland,Washington.
Scott, M. J., D. B. Belzer, R. J: Nesse, R. W. Schultz, P. A. Stokowski, andD. C. Clark. 1987. The Economic and Community Impacts of Closing Hanford'sN Reactor and Nuclear Materials Production Facilities. PNL-6295, PacificNorthwest Laboratory, Richland, Washington.
Seinfeld, J. H. 1986. Atmospheric Chemistry and Physics of Air Pollution.John Wiley and Sons, Inc., New York.
Spier, L. 1936. Tribal Distribution in Washington. General Series inAnthropology No. 3, George Banta Publishing Co., Menasha, Wisconsin.
Stone, W. A., J. M. Thorp, 0. P. Gifford, and D. J. Hoitink. 1983.Climatological Summary for the Hanford Area. PNL-4622, Pacific NorthwestLaboratory, Richland, Washington.
Tallman, A. M., K. R. Fecht, M. C. Marratt, and G. V. Last. 1979. Geology ofthe Separation Areas Hanford Site, South-Central Washington. RHO-ST-23,Rockwell Hanford Operations, Richland, Washington.
7.8
Thorne, P. D. 1993. Pacific Northwest Laboratory, Richland, Washington,memorandum to J. A. Schramke, Pacific Northwest Laboratory, Richland,Washington, "Information to Support Hanford PEIS," April 15.
Trafter, C. E., and R. D. Scheuerman. 1986. Renegade Tribe: The PalouseIndians and the Invasion of the Inland Pacific Northwest. Washington StateUniversity Press, Pullman, Washington.
TSP (Technical Steering Panel of the Hanford Environmental Dose ReconstructionProject). 1994. Summary: Radiation Dose Estimates from Hanford RadioactiveMaterial Releases to the Air and to the Columbia River. Centers for DiseaseControl and Prevention, Atlanta, Georgia.
U.S. Department of Labor. 1994. "Domestic Agricultural In-Season Farm LaborReport, Washington State - Farm Labor Abstract." Issued monthly by theU.S. Department of Labor, Employment and Training Administration.
Valero, 0. J., T. J. DeFrost, and K. J. Templeton. 1995. 1995 Solid Waste30-Year Volume Summary. WHC-EP-0865, Westinghouse Hanford Company, Richland,Washington.
Washington Natural Heritage Program. 1994. Endangered, Threatened andSensitive Vascular Plants of Washington. Washington State Department ofNatural Resources, Olympia, Washington.
Washington State Employment Security. February 1994 - February 1995. LaborArea Summaries. Washington State Employment Security, Olympia, Washington.
WHC (Westinghouse Hanford Company). 1990. Draft Revision B, Interim SafetyBasis for the 308 Building. WHC-SD-FL-ISB-001, Westinghouse Hanford Company,Richland, Washington.
WHC (Westinghouse Hanford Company). 1993a. Letter report: Annual Report forSolid Waste Landfill Operations. 8701982B R6, January 14, WestinghouseHanford Company, Richland, Washington.
WHC (Westinghouse Hanford Company). 1993b. UO3 Plant Safety Ana7ysis Report.WHC-SD-CP-SAR-002, Rev. 6G, Westinghouse Hanford Company, Richland,Washington.
WHC (Westinghouse Hanford Company). 1995. PFP Safety Analysis Report.WHC-SD-CP-SAR-021, Rev. 0, Westinghouse Hanford Company, Richland, Washington.
Whelan, G., D. W. Damschen, and R. D. Brockhaus. 1987. Columbia RiverStatistical Update Model - Version 4.0 (COLSTAT4): Background Documentationand User's Guide. PNL-6041, Pacific Northwest Laboratory, Richland,Washington.
7.9
Whelan, G., J. P. McDonald, and C. Sato. 1994. Environmental Consequences toWater Resources from Alternatives of Managing Spent Nuclear Fuel at Hanford.PNL-10053, Pacific Northwest Laboratory, Richland, Washington.
Woodruff, R. K., R. W. Hanf, and R. E. Lundgren (eds). 1993. Hanford SiteEnvironmental Report for Calendar Year 1992. PNL-8682, Pacific NorthwestLaboratory, Richland, Washington.
7.10
8.0 PREPARERS
The following staff of the Pacific Northwest Laboratory were key
contributors to the preparation of this EIS:
Roseanne L. Aaberg, dose calculations. B.S. (Chemical Engineering) University
of Washington. Seventeen years of experience in dose calculations and EIS
preparation.
John C. Abbott, affected environment and environmental impacts. B.A.
(Geography) Southwest Texas State University, M.S. (Conservation of Natural
Resources) University of Texas at San Antonio. Over 18 years of experience in
the preparation of NEPA documents, NEPA audits, ecological risk assessments,
regulatory compliance activities, program oversight, and assistance to
President's Council on Environmental Quality (CEQ).
Cynthia W. Abrams, waste management on the Hanford Site and environmental
consequences. B.A. (Environmental Studies and Biology) University of
California at Santa Cruz. Nine years experience at Hanford specializing in
the development and analysis of environmental policy, and the preparation of
guidance for the implementation of that policy. Primary areas include
ecological systems management, ecological risk assessment, public involvement,
CERCLA policy analysis, and other project oversight activities.
Susan L. Blanton, references, preparers, and index. B.S. (Zoology) MiamiUniversity. Five years of experience in technical writing, and two years of
experience in EIS preparation.
Michele A. Chamness, geology and hydrology. B.S. (Geology) Washington State
University. Sixteen years of experience studying in geology and hydrology of
the Hanford Site.
Jean M. Cheyney, communication support specialist. Four years of experience
in document production and word processing.
Colbert E. Cushing, deputy project manager, ecological resources. B.S.
(Fisheries Management) and M.S. (Limnology) Colorado State University, Ph.D.
(Limnology) University of Saskatchewan. Thirty-four years of experience in
freshwater ecological research in streams and radioecology, and over twenty
years of experience in EIS preparation. Teaches university classes in stream
ecology and writing journal articles.
8.1
Phil M. Daling, transportation consequence analysis. B.S. (Physical
Metallurgy) Washington State University. Fifteen years experience in risk,
safety, reliability, and statistical analysis techniques and in the
preparation of safety analysis documents for a wide variety of nonnuclear and
nuclear operations, facilities, and transportation.
Sharon M. Daly, lead communication support specialist. Twelve years of
experience in word processing and graphic design.
Michelle Davis, waste management. B.S. (Industrial Engineering) University of
Washington, M.S. (Environmental Science) Washington State University. Over
four years of experience in hazardous, mixed and nuclear waste management,
hazardous and radioactive inventory control, waste minimization and pollution
prevention, and programmatic performance assessment for waste and materials
management programs.
Christian J. Fosmire, nonradiological air quality impacts. B.S. (Meteorology)
and M.S. (Meteorology) Pennsylvania State University. One year of experience
in computer programming and data collection and analysis in the area of
atmospheric diffusion modeling and risk assessment.
Clifford S. Glantz, nonradiological air quality impacts. B.S. (Physics and
Atmospheric Sciences) State University of New York at Albany, M.S.
(Atmospheric Sciences) University of Washington. Twelve years of experience
in the analysis of nonradiological air quality impacts.
Paul L. Hendrickson, regulatory requirements. B.S. (Chemical Engineering)
University of Washington, M.S. (Industrial Management) Purdue University,
J.D. University of Washington School of Law. Twenty-two years of experience
in energy and environmental studies. Special emphasis on regulatory issues
including regulatory requirements analyses for EISs.
Jay C. Lavender, transportation consequence analysis. B.A. (Industrial
Technology) Washington State University. Ten years of experience in risk,
safety, reliability, and statistical analysis techniques and in the prepara-
tion of safety analysis documents for a wide variety of nonnuclear and nuclear
operations, facilities, and transportation systems.
Regina E. Lundgren, lead communications specialist. B.A. (Scientific and
Technical Communication/Environmental Studies) University of Washington. Over
10 years experience in the preparation of NEPA documents, risk communication,
and documentation project management.
8.2
Kristin L. Manke, communication specialist. B.S. (Biochemistry) Washington
State University. Over 6 years experience in environmental, scientific, and
technical communications projects.
Emmett B. Moore, project manager. B.S. (Chemistry) Washington State
University, Ph.D. (Physical Chemistry) University of Minnesota. Twenty years
of experience in environmental regulation, participation in and management of
the preparation of environmental permits and documentation (NEPA). University
professor of physics, chemistry, and environmental sciences.
Kathy R. Neiderhiser, communication support specialist. A.A. (Business
Management), Clark County Community College. Ten years of experience in
document production and word processing.
Iral C. Nelson, deputy project manager, environmental consequences. B.S.
(Mathematics) University of Oregon, M.A. (Physics) University of-Oregon,
diplomat&, American Board of Health Physics. Forty years of experience in
various aspects of health physics (radiation protection) and 24 years of
experience in conducting NEPA reviews and preparing NEPA documentation.
Paul R. Nickens, cultural resources. B.A., M.A., and Ph.D. (Anthropology/
archaeology), University of Colorado. Twenty-four years experience in various
aspects of cultural resource management, including several years experience'in
preparing cultural resources and Native American sections for EISs.
Ted M. Poston, noise impact assessment. B.A. (Biology) Central Washington
University, M.S. (Fisheries) University of Washington. Twenty years of
experience in research, environmental assessment, and noise analysis.
Kathleen Rhoads, consequences analysis coordinator. B.S. (Microbiology) and
M.S. (Radiological Sciences), University of Washington. Nineteen years of
experience in the analysis of risk assessment variables, estimation of
radiation dose following routine or accidental release of radionuclides to the
environment, and evaluation of health effects from energy production.
Teresa A. Riley, publication assistant. A.A.S. (Executive Secretary Program),
Columbia Basin College. Over 4 years experience coordinating the production
of large documents.
Michael J. Scott, affected socioeconomic environment and impacts. B.A.
(Economics), Washington State University, M.A. and Ph.D. (Economics),
8.3
University of Washington. More than 20 years experience in regional socio-
economic impact analysis, regional economic impact modeling, and regional
economic forecasting.
Richard I. Smith, life-cycle costs for proposed alternatives. B.S. (Physics)
Washington State University, M.S. (Applied Physics) University of California
at Los Angeles. P.E. (Nuclear Engineering) State of Washington and State of
California. Over 38 years of experience in research and development
activities in the nuclear area, including neutronics studies for experimental
reactors, analyses of decommissioning licensed nuclear facilities, analyses of
the waste management system in support of the Nuclear Waste Policy Act, and in
the planning of Hanford cleanup.
Betty J. Tegner, editor. B.A. (English) University of Washington, M.A.
(English) California Polytechnical State University. Previous experience in
journalism and university teaching. Five years of experience in technical
editing.
Rose M. Watt, communication support specialist. Seventeen years of experience
in page layout, document production, document design, and word processing.
Gene Whelan, water quality and related consequences. B.S. (Civil Engineering)
Pennsylvania State University, M.S. (Mechanics and Hydraulics) University of
Iowa, Ph.D. (Civil and Environmental Engineering) Utah State University.
Seventeen years of experience in multimedia contaminant environmental exposure
assessments.
8.4
9.0 DISTRIBUTION LIST
CONGRESS
United States Senate
Hon. Slade Gorton--Washington
Hon. Patty Murray--Washington
Hon. Mark Hatfield--Oregon
United States House of
Representatives
Hon. Norman D. Dicks--Washington
Hon. Jennifer Dunn--Washington
Hon. Richard (Doc) Hastings--
Washington
Hon. Jim McDermott--Washington
Hon. Jack Metcalf--Washington
Hon. George R. Nethercutt, Jr.--
Washington
Hon. Linda Smith--Washington
Hon. Randy Tate--Washington
Hon. Rick White--Washington
Hon. Jim Bunn--Oregon
Hon. Elizabeth Furse--Oregon
FEDERAL AGENCIES
Mr. Chuck Clarke
Regional Administrator
U.S. Environmental Protection Agency
Region 10
Defense Nuclear Facilities Safety
Board
John T. Conway, Chair
National Park Service
U.S. Fish and Wildlife Service
U.S. Fish and Wildlife Service
Region 1
U.S. Nuclear Regulatory Commission
Office of Nuclear Materials Safety
and Safeguards
Spent Fuel Program Office
STATE GOVERNMENT
Washington State - Executive,
Elected
Hon. Mike Lowry, Governor
Hon. Christine Gregoire,
Attorney General
Washington State - Senate
Sen. Pat Hale
Sen. Valoria Loveland
9.1

STATE GOVERNMENT (contd)
Washington State - House of
Representatives
Rep. Jerome Delvin
Rep. Bill Grant
Rep. Shirley Hankins
Rep. Dave Mastin
Washington State - Agencies
Department of Ecology
Ms. Mary Riveland, Director
Mr. Dan Silver, Asst.,Director
Mr. Ron Effland
Ms. Barbara Ritchie
Mr. Tom Tebb
Department of Health
Mr. Al Conklin
Washington State - Local Government
Mr. Joe King
City of Richland
Mr. Gary Crutchfield
City of Pasco
Mr. Robert Kelly
City of Kennewick
STATE GOVERNMENT (contd)
Mr. Ray Isaacson, Chairman
Benton County Commissioner
Ms. Sue Miller
Franklin County Commissioner
Oregon State - Executive, Elected
Hon. John Kitzhaber, Governor
Oregon State - Agencies
Oregon Water Resources Department
Mr. Ralph Patt
Oregon Department of Energy
Mr. David Stewart-Smith,
Administrator
Mr. Dirk Dunning
NATIVE AMERICAN TRIBES
Confederated Tribes of the
Umatilla Indian Reservation
Nez Perce Tribe
Wanapum People
Yakama Indian Nation
HANFORD ADVISORY BOARD
VIPA
LIBRARIES
INTERESTED INDIVIDUALS (contd)
Gonzaga University
Foley Library
Portland State University
Branford Price Miller Library
University of Washington Library
DOE Public Reading Room, Richland
DOE Public Reading Room,
Washington D.C.
INTERESTED INDIVIDUALS
Dr. Dick Betsey
Physicians for Social Responsibility
Walt Blair
Kennewick, WA
Bob CookRichland, WA
Dames and Moore
Denver, CO
Ken Ferguson
Greenpeace
Harold Heacock
TRIDEC
Maxine Hines
La Grande, OR
Les Jardine
LLNL
Russell Jim
Toppenish, WA
Paige Knight
Hanford Watch
Ken Kramer
Sheridan, OR
Richard Longmire
Spokane, WA
Jesus Mancilla
Richland, WA
Todd Martin
Hanford Education Action League
Clyde Nash, Jr.
Seattle, WA
Gerald Pollett
Heart of America NW
Ms. Donna L. Powaukee
ERWM Manager
Nez Perce Tribe
Merilyn Reeves, Chair
Hanford Advisory Board
Ray Robinson
Richland, WA
Gordon Rogers
Pasco, WA
Elizabeth Shedd
Seattle, WA
9.3
INTERESTED INDIVIDUALS (contd) INTERESTED INDIVIDUALS (contd)
Lynn Sims
Miles Uchida
Portland, OR
Portland, OR
Lance S. Soto
James E. WeberPortland, OR
Portland, OR
Charles Sullivan
Edward Wenk
Portland, OR
Kirkland, WA
David Talbert Huber
Bob Williams
Seattle, WA
Portland, OR
Ross Tewksbury
Portland, OR
9.4
APPENDIX A
INVENTORY AND FACILITY DESCRIPTIONS
^k^ 9PAG
d 1'^ 0. @
r
APPENDIX A
INVENTORY AND FACILITY DESCRIPTIONS
This appendix provides information on facilities included in this
Environmental Impact Statement (EIS). The data are intended to supplement the
discussion presented in,Chapter 3.0 of the EIS.
Existing' Facilities are discussed with regard to their function, condi-
tion, and service life.' Proposed facilities are derived from the alternatives
described in the EIS. Where relevant and applicable, information on facili-
ties from the DOE Spent Nuclear Fuel Programmatic EIS (DOE 1995), from which
this EIS is tiered, is integrated with this discussion. Information on the
new facilities, or proposed modifications to existing facilities, is based
primarily from on the K Basins Environmental Impact Statement Technical Input
(Bergsman et al. 1995). Information from the Hanford Spent Nuclear Fuel Proj-
ect Recommended Path Forward (Fulton 1994), the Staging and Storage Facility
Feasibility Study Final Report (Fluor Daniel 1995), and the Dry Storage of
N Reactor Fuel Independent Technical Assessment (ITAT 1994) have been
considered where applicable.
The K East (KE) and K West (KW) Reactors and respective basins are about
430 m (1,400 ft) from the Columbia River (see Figures A-1 and A-2). They were
constructed in the 1950s as part of the ongoing "Cold War" strategy to produce
weapons-grade plutonium.
A.1 Inventory
The total inventory of irradiated N Reactor fuel at Hanford is approxi-
mately 2,100 MTU (Tables A-1 and A-2). The inventory contains 1,764.3 MTU offuel-grade fuel and 331.2 MTU of weapon-grade fuel. An additional 0.3 MTU ofweapon-grade fuel remains in the canyon of the Plutonium and Uranium Recovery
through Extraction (PUREX) Plant, but will be going to the K Basins.
The KW Basin contains approximately 952 MTU of N Reactor fuel in 3,817
closed canisters; the basin water has a low degree of radionuclide contamina-
tion. The KE Basin contains approximately 1,144 MTU in 3,673 canisters; its
water is contaminated with radionuclides. Each-basin also contains a small
amount of single-purpose reactor fuel: 0.1 MTU in KW and 0.4 MTU in KE
(Bergsman 1993).
A.1
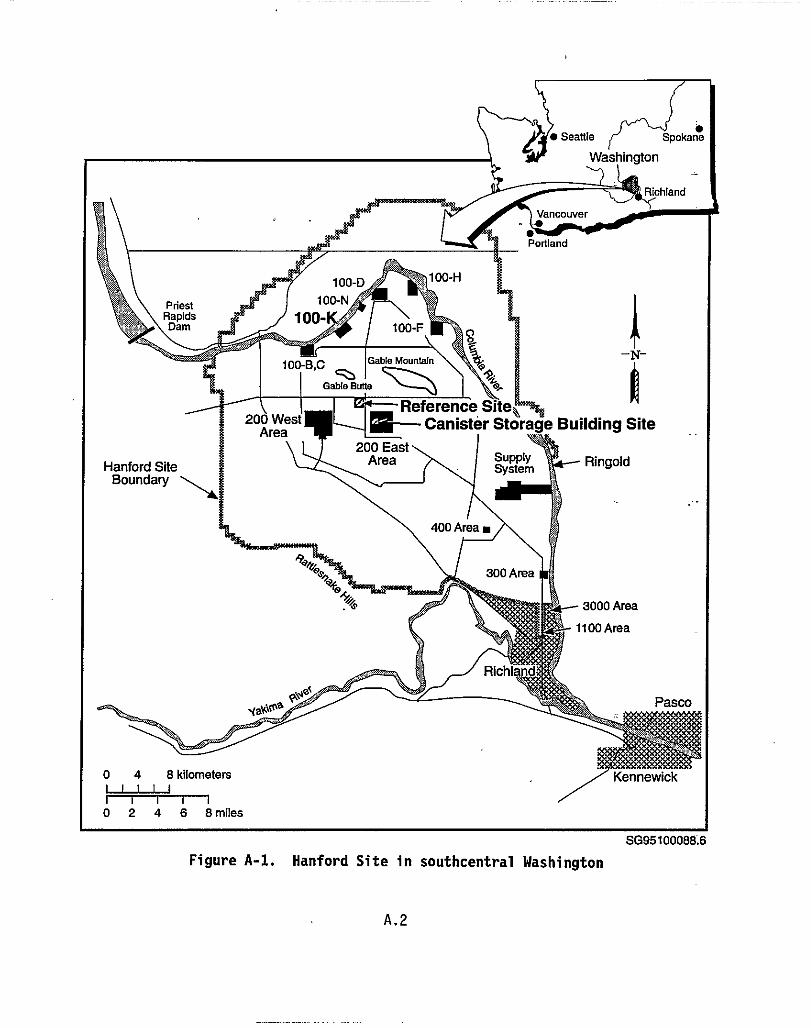
Priest
RapidsDam
Hanford SiteBoundary
Seattle
V1
ancower
Po rtland
100-D 100-H
100-1
100- ,r100-F
0—
100-B,C Gable Mountain f^ —N-
Gable BBuna 92e^.
Reference Site10 west Canister Storage Building SiteArea
200 EastArea
System Ringold
400 Area n
9d es^'F300 Area
eyes 3000 Area
1100 Area
yaKma r^ Pasco
0 4 8 kilometers / KennewickI I I l
I^i
---10 2 4 6 8 miles
SG95100088.6
Figure A-1. Hanford Site in southcentral Washington
A.2
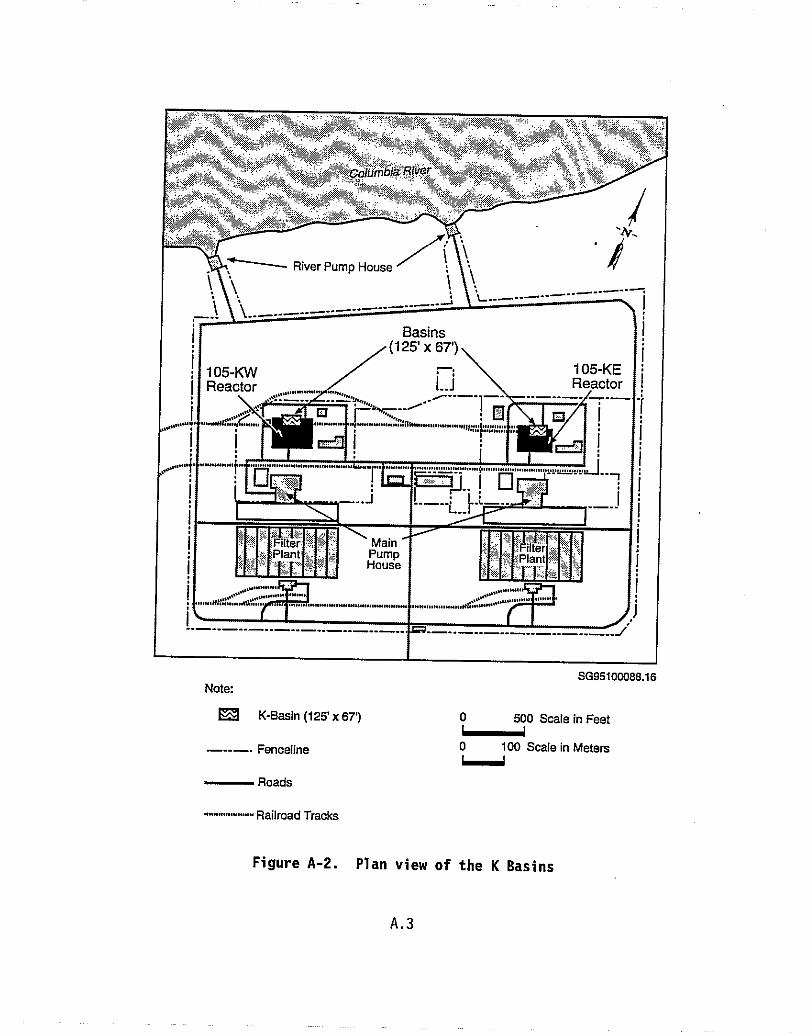
MW ''Am
River Pump House
Basins(125' x 67')
105-KWReactor Reactor
................
I.
. . ................... . . . . ...... ......
Fili r— MainPlant
House
.... ....... .I .. ...... .. I . . I . . .................. I. . .......... .....
SG95100088.16Note:
K-Basin (125'x 67') 0 500 Scale in Feet6.===..j
Fenceline 0 100 Scale in Meters6mmumi
Roads
••^^••......•••••.. Railroad Tracks
Figure A-2. Plan view of the K Basins
A.3
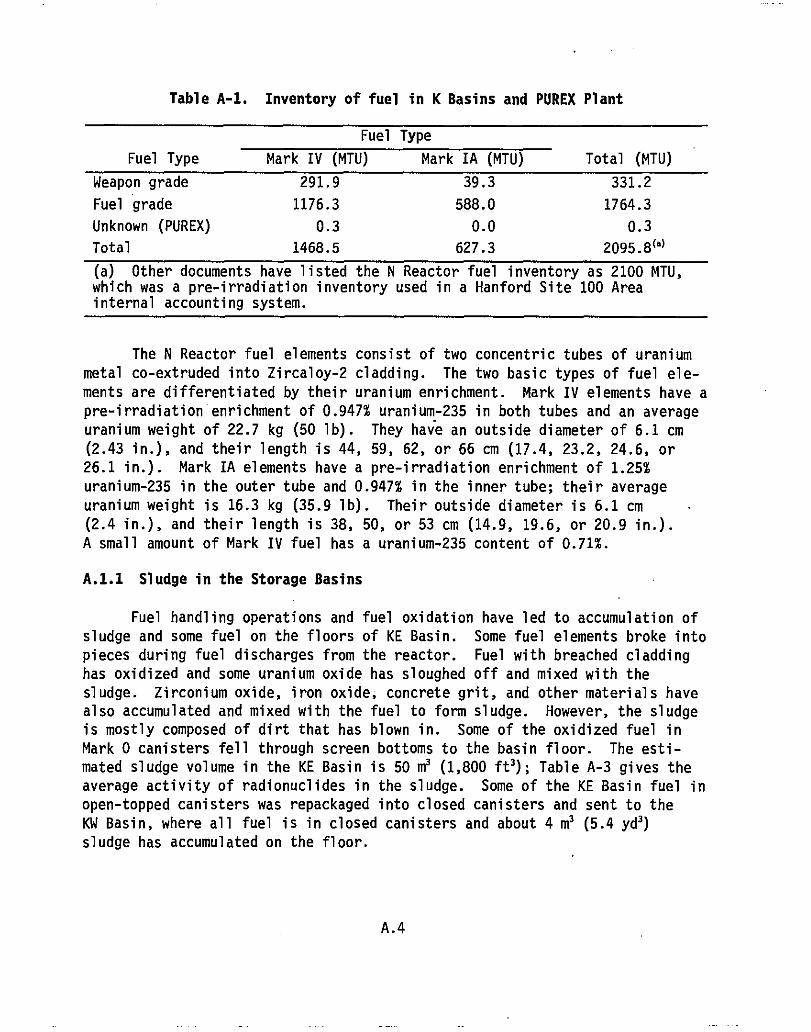
Table A-1. Inventory of fuel in K Basins and PUREX Plant
Fuel Type
Fuel Type Mark IV (MTU) Mark IA (MTU) Total (MTU)
Weapon grade 291.9 39.3 331.2
Fuel grade 1176.3 588.0 1764.3
Unknown (PUREX) 0.3 0.0 0.3
Total 1468.5 627.3 2095.8(x)
(a) Other documents have listed the N Reactor fuel inventory as 2100 MTU,which was a pre-irradiation inventory used in a Hanford Site 100 Areainternal accounting system.
The N Reactor fuel elements consist of two concentric tubes of uranium
metal co-extruded into Zircaloy-2 cladding. The two basic types of fuel ele-
ments are differentiated by their uranium enrichment. Mark IV elements have a
pre-irradiation enrichment of 0.947% uranium-235 in both tubes and an average
uranium weight of 22.7 kg (50 lb). They have an outside diameter of 6.1 cm
(2.43 in.), and their length is 44, 59, 62, or 66 cm (17.4, 23.2, 24.6, or
26.1 in.). Mark IA elements have a pre-irradiation enrichment of 1.25%
uranium-235 in the outer tube and 0.947% in the inner tube; their average
uranium weight is 16.3 kg (35.9 lb). Their outside diameter is 6.1 cm
(2.4 in.), and their length is 38, 50, or 53 cm (14.9, 19.6, or 20.9 in.).
A small amount of Mark IV fuel has a uranium-235 content of 0.71%.
A.1.1 Sludge in the Storage Basins
Fuel handling operations and fuel oxidation have led to accumulation of
sludge and some fuel on the floors of KE Basin. Some fuel elements broke into
pieces during fuel discharges from the reactor. Fuel with breached cladding
has oxidized and some uranium oxide has sloughed off and mixed with the
sludge. Zirconium oxide, iron oxide; concrete grit, and other materials have
also accumulated and mixed with the fuel to form sludge. However, the sludge
is mostly composed of dirt that has blown in. Some of the oxidized fuel in
Mark 0 canisters fell through screen bottoms to the basin floor. The esti-
mated sludge volume in the KE Basin is 50 m' (1,800 ft'); Table A-3 gives the
average activity of radionuclides in the sludge. Some of the KE Basin fuel in
open-topped canisters was repackaged into closed canisters and sent to the
KW Basin, where all fuel is in closed canisters and about 4 m' (5.4 yd')
sludge has accumulated on the floor.
A.4
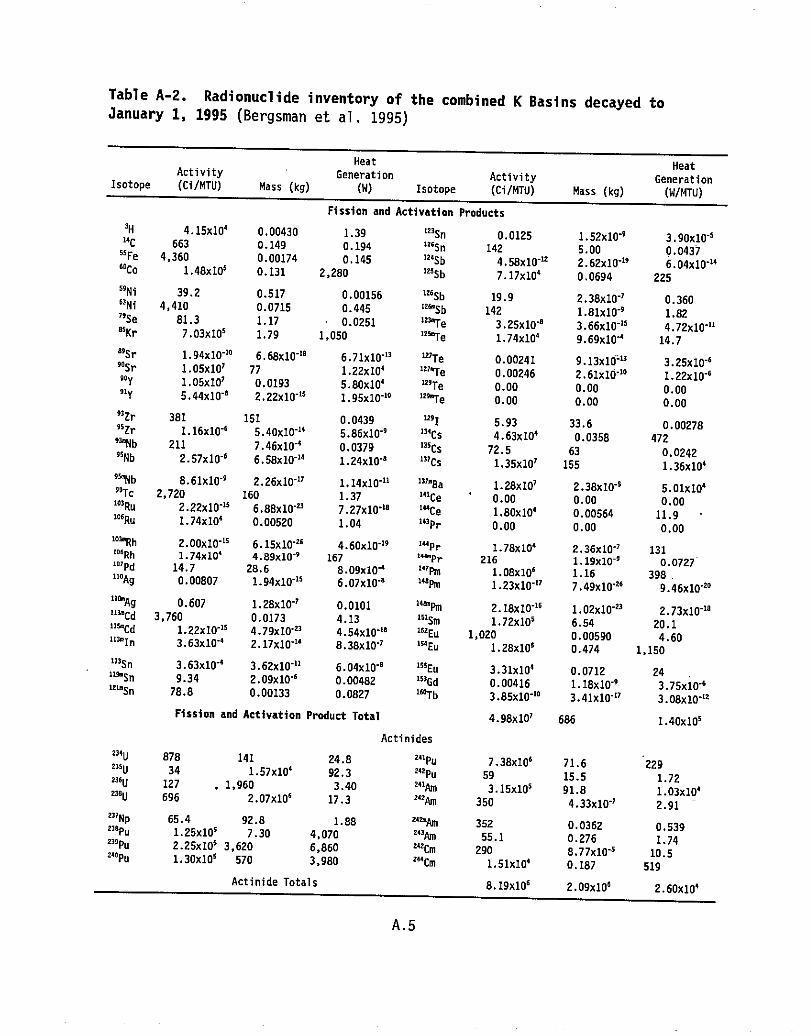
Table A-2. Radionuclide inventory of the combined K Basins decayed toJanuary 1, 1995 (Bergsman et al. 1995)
IsotopeActivity
(Ci/MTU) Mass (kg)
Heat
Generation
(W) IsotopeActivity
(Ci/MTU) Mass (kg)
Heat
Generation
(W/MTU)
Fission and Activation Products
3H 4.15x1040.00430 1.39 123 S 0.0125 1.52x10'9 3.90x10'514 C
55 Fe663 0.149 0.194 126Sn
142 5.00 0.04374,360 0.00174 0.145 1245b4.58x10 "12 2.62x10 "19 6.04x10'14
60Co 1.48x10⁵ 0.131 2,280 125Sb 7.17x10⁴ 0.0694 225
"Ni
63Ni39.2 0.517 0.00156 lz6Sb
19.9 2.38x10'' 0.3604,410 0.0715 0.445 126"Sb 142 1.81x10 "9 1.8219Se 81.3 1.17 0.0251 121"Te 3.25x10'0 3.66x10'`5 4.72x10'`385Kr 7.03x10⁵ 1.79 1,050 1t5"Te 1.74x10⁴ 9.69404 14.7
89Sr 1.9440'10 6.68x10' 18 6.71x10'11 1E1Te 0.00241 9.13x10'13 3.25x10'690Sr 1.0540' 77 1.2240' 11-Te 0.00246 2.6140'10 1.22x10'690Y 1.05x10³ 0.0193 5.80x10' 1^9Te 0.00 0.00 0.0091Y 5.44x10'0 2.22x10'15 1.95x10'10 129"Te 0.00 0.00 0.0093Zr'Zr9
381 151 0.0439 12915.93 33.6 0.002781.16x10'6 5.4040'11 5.86x10'9 134Cs 4.63x10⁴ 0.0358 472
93"Nb 211 7.46x10'4 0.0379 15CS 72.5 63 0.024295Nb 2.57x10'6 6.58x10"14 1.24x10"0 13?cs 1.35x10⁷ 155 1.36x10494b 8.61x10'9 2.26x10'11 1.14x10'" 137-8a 1.28x10⁷ 2.3840'5 5.01x10'99Tc
103Ru2,720 160 1.37 141 C 0.00 0.00 0.00
2.224 0'15 6.88x10'23 7.2740'10 '"Ce 1.80x10⁴ 0.00564 11.9106Ru 1.74x10⁴ 0.00520 1.04 143Pr 0.00 0.00 0.00
`0uRh 2.0040"11 6.1540 -21 4.6040 '19 '"Pr1.78x104 2.36x10"' 131106Rh 1.7440' 4.89x10'9 167 "Pr 216 1.19x10'4 0.0727-192Pd
'"Ag14.7 28.6 8.09x10'' 147Pm 1.08x10⁶ 1.16 398 .0.00807 1.94x10'`1 6.07x10'0 148pm 1.23x10'" 7.4940'26 9.4640"1
11'"Ag0.607 1.2840'' 0.0101 140npm 2.18x10'11 1.02x10-t3 2.73x10'18"3mCd 3,160 0.0173 4.13 151Sm
1.72x10⁵ 6.54 20.1115mCd 1.22x10'15 4.79x10'21 4.54x10'10 1$zEu 1 1 020 0.00590 4.6013"In 3.6340" 2.1740'" 8.3840'1 154Eu1.28405 0.474 1,150
13sn 3.63x10'4 3.6240'11 6.0410'0 155Eu3.31x10' 0.0712 2411%Sn
1YwSn9.34 2.09x10'1 0.00482 153Gd 0.00416 1.18x10'9 3.7540'678.8 0.00133 0.0827 11017 b 3.85x10"10 3.41x10'11 3.08x10'1'Fission and Activation Product Total 4.98x10⁷ 686 1.40401
Actinides
331U 878 141 24.8 241Pu 7.38x10⁶ 71.6 2292150 34 1.57x10' 92.3 21
2Pu 59 15.5 1.72 236
U230
127 1,960 3.40 241Am3.15x105 91.8 1.03x10⁴U 696 2.07x10' 17.3 242Am
350 4.33x10"' 2.91217Npz39Pu
65.4 92.8 1.88 2•Am 352 0.0362 0.539
239Pu
1.25x10⁵
2.25x1057.30
3,6204,070
6,860213Am
312
Cm
55.1 0.276 1.74
znopu 1.30x10⁵ 570 3,980 344Cm290
1.51x1048.77x10'50.187
10.5519
Actinide Totals 8.19401 2.09x10' 2.60404
A.5
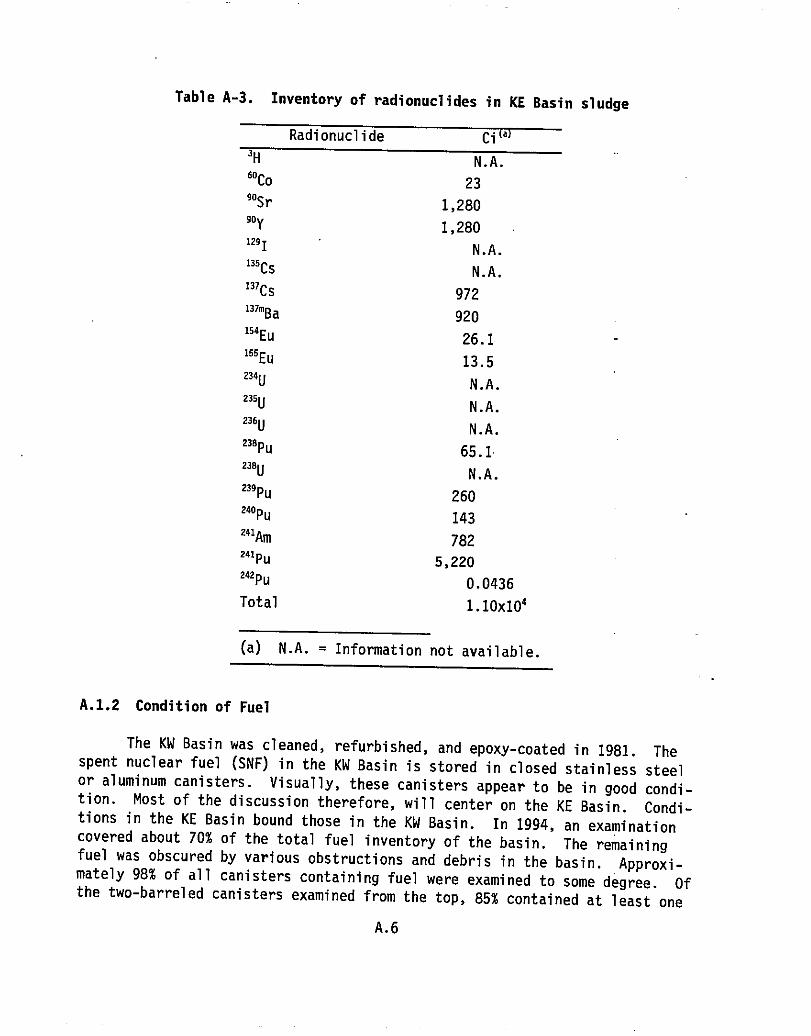
Table A-3. Inventory of radionuclides in KE Basin sludge
Radionuclide Ci a'H
N.A.60co
23
90Sr 1,280
90Y 1,280
1291 N.A.
135C5N.A.137Cs
972137mBa
920154 E
26.1155Eu
13.5234u
N.A.2350
N.A.
236U N.A.238pu
65.12380
N. A.239pu
260240pu
143241Am 782241pu
5,220242pu
0.0436
Total 1.10x10⁴
(a) N.A. = Information not available.
A.1.2 Condition of Fuel
The KW Basin was cleaned, refurbished, and epoxy-coated in 1981. The
spent nuclear fuel (SNF) in the KW Basin is stored in closed stainless steel
or aluminum canisters. Visually, these canisters appear to be in good condi-
tion. Most of the discussion therefore, will center on the KE Basin. Condi-
tions in the KE Basin bound those in the KW Basin. In 1994, an examination
covered about 70% of the total fuel inventory of the basin. The remaining
fuel was obscured by various obstructions and debris in the basin. Approxi-
mately 98% of all canisters containing fuel were examined to some degree. Of
the two-barreled canisters examined from the top, 85% contained at least one
A.6
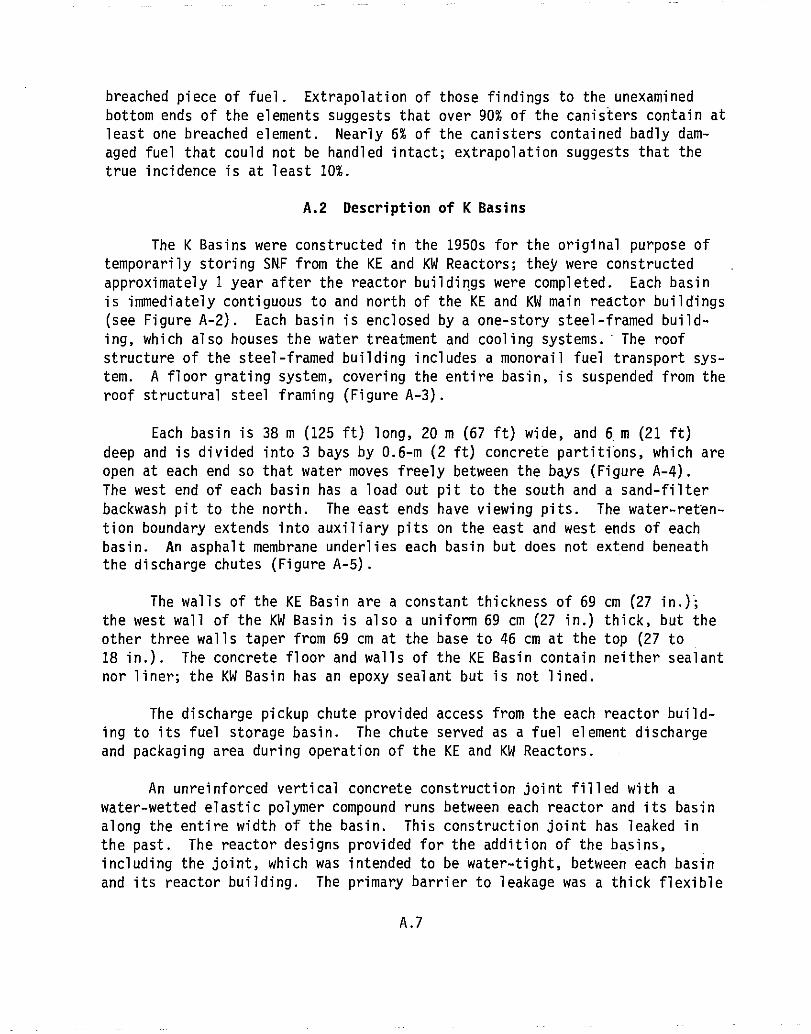
breached piece of fuel. Extrapolation of those findings to the unexamined
bottom ends of the elements suggests that over 90% of the canisters contain at
least one breached element. Nearly 6% of the canisters contained badly dam-
aged fuel that could not be handled intact; extrapolation suggests that the
true incidence is at least 10%.
A.2 Description of K Basins
The K Basins were constructed in the 1950s for the original purpose of
temporarily storing SWF from the KE and KW Reactors; they were constructed
approximately 1 year after the reactor buildings were completed. Each basin
is immediately contiguous to and north of the KE and KW main reactor buildings
(see Figure A-2). Each basin is enclosed by a one-story steel-framed build-
ing, which also houses the water treatment and cooling systems.- The roof
structure of the steel-framed building includes a monorail fuel transport sys-
tem. A floor grating system, covering the entire basin, is suspended from the
roof structural steel framing (Figure A-3).
Each basin is 38 m (125 ft) long, 20 m (67 ft) wide, and 6 . m (21 ft)
deep and is divided into 3 bays by 0.6-m (2 ft) concrete partitions, which are
open at each end so that water moves freely between the bays (Figure A-4).
The west end of each basin has a load out pit to the south and a sand-filter
backwash pit to the north. The east ends have viewing pits. The water-reten-
tion boundary extends into auxiliary pits on the east and west ends of each
basin. An asphalt membrane underlies each basin but does not extend beneath
the discharge chutes (Figure A-5).
The walls of the KE Basin are a constant thickness of 69 cm (27 in.);
the west wall of the KW Basin is also a uniform 69 cm (27 in.) thick, but the
other three walls taper from 69 cm at the base to 46 cm at the top (27 to
18 in.). The concrete floor and walls of the KE Basin contain neither sealant
nor liner; the KW Basin has an epoxy sealant but is not lined.
The discharge pickup chute provided access from the each reactor build-
ing to its fuel storage basin. The chute served as a fuel element discharge
and packaging area during operation of the KE and KW Reactors.
An unreinforced vertical concrete construction joint filled with a
water-wetted elastic polymer compound runs between each reactor and its basin
along the entire width of the basin. This construction joint has leaked in
the past. The reactor designs provided for the addition of the basins,
including the joint, which was intended to be water-tight, between each basin
and its reactor building. The primary barrier to leakage was a thick flexible
A.7
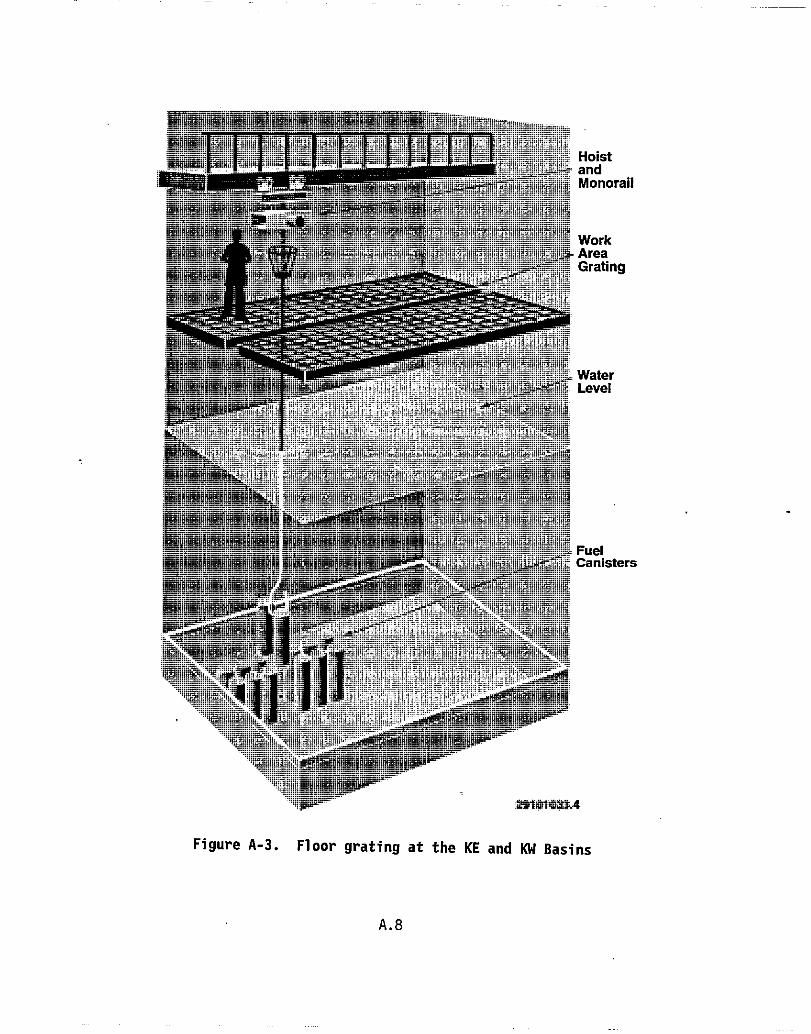
Figure A-3. Floor grating at the KE and KW Basins
4
HoistandMonorail
WorkAreaGrating
WaterLevel
FuelCanisters
A.8
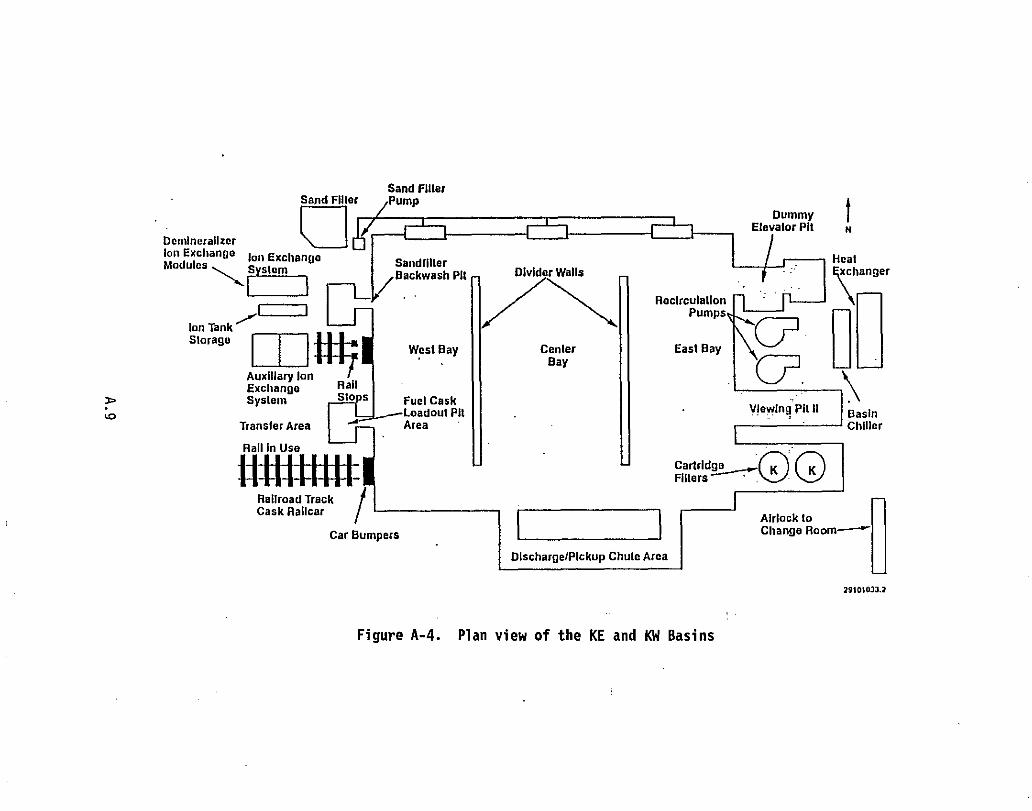
DummyElevator Pit n
Heatxchanger
RecirculationPumps
East BayaCP.
Viewing Pit II pasinChiller
Cartridge
OPillars
1 7-1Discharge/Pickup Chute Area
Airlock toChange Room"
29101007.2
nzo
Sand FilterSandFilter Pump
Dendncrallzer ^JIon Exchange Ion ExchangeModules System
SackwaerBackwash Pit
Ion TankStorage
m
West Bay
Auzlllary Ion-
Exchange Rail
System Sto s Fuel CaskLoadoulPlt
Transfer Area Area
Rail in Use
Railroad TrackCask Railcar
Car Bumpers
Figure A-4. Plan view of the KE and KW Basins
KREACTOR
D5CHARGEIPlrC upWiTE
STORAGE
DRAIN HEADERBASIN
WATERTO COLLECTION STOPSUMP I \
ASPHALTIC MEMBRANE
Figure A-5. Vertical section of the KE and KW Basins
membrane cast into the reactor building concrete below the outfall to the di.s-
charge chute. When the basins were constructed, the concrete floors were cast
around the flexible membranes.
Two isolation barriers (Figure A-6) were recently installed between the
basin proper and the reactor building. The barriers isolate the main part of
the basin, where SNF is stored, from the reactor discharge chute, where the
construction joint is located.
The walls and floor of the basin are the primary containment barrier.
The bottom of each pool is approximately 6.1 m (20 ft) below grade; each bot-
tom slab is 0.6 m (2 ft) thick. Unused or unnecessary drains have been
plugged and sealed with concrete. Drains that might carry contaminated or
potentially contaminated water have been intercepted and routed to a liquid
effluent sump. As mentioned, an epoxy sealant lines the floor and walls of
the KW Basin to further limit leakage. The discharge chute of the KE Basin
was lined with epoxy after repair to a construction joint in 1980. The
original underbasin leakage system (the asphalt membrane and a pipeline to a
dispersion tile field) has been intercepted outside the facility. Contami-
nated effluents are now collected, routed to a sump, and pumped back to the
A.10
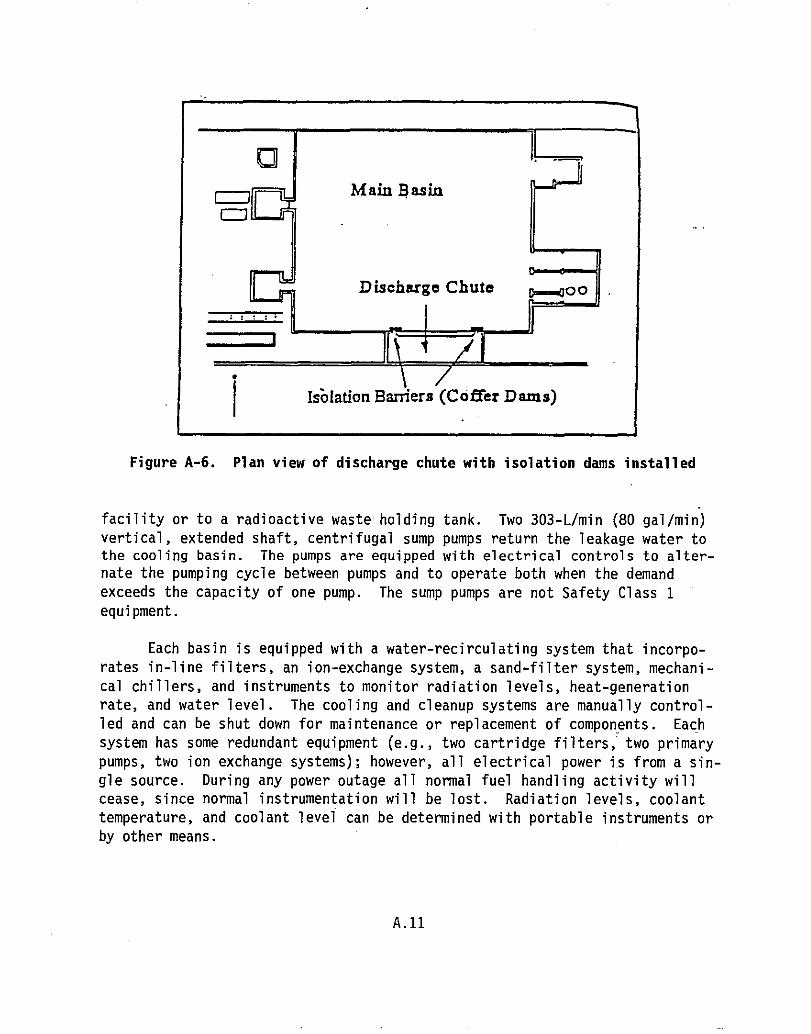
Main Basin
O
Discharge Chute a—^oo
• Isolation Barriers (Coffer Dams)1
Figure A-6. Plan view of discharge chute with isolation dams installed
facility or to a radioactive waste holding tank. Two 303-L/min (80 gal/min)
vertical, extended shaft, centrifugal sump pumps return the leakage water tothe cooling basin. The pumps are equipped with electrical controls to alter-
nate the pumping cycle between pumps and to operate both when the demand
exceeds the capacity of one pump. The sump pumps are not Safety Class 1
equipment.
Each basin is equipped with a water-recirculating system that incorpo-
rates in-line filters, an ion-exchange system, a sand-filter system, mechani-
cal chillers, and instruments to monitor radiation levels, heat-generation
rate, and water level. The cooling and cleanup systems are manually control-
led and can be shut down for maintenance or replacement of components. Each
system has some redundant equipment (e.g., two cartridge filters, two primary
pumps, two ion exchange systems); however, all electrical power is from a sin-
gle source. During any power outage all normal fuel handling activity will
cease, since normal instrumentation will be lost. Radiation levels, coolant
temperature, and coolant level can be determined with portable instruments or
by other means.
A.11
The fuel is stored in canisters in single-stacked storage racks at the
bottom of each basin. The racks are steel frames that sit on the concrete
floor. Although the racks are not anchored to the floors, they overlap along
their long sides. The rack units extend to or nearly to the pool walls. The
openings in the racks are so sized that they can hold only one fuel storage
canister each. The canisters are approximately 74 cm (29 in.) high, have two
cylindrical barrels approximately 23 cm (9 in.) in diameter, and normally con-
tain 14 fuel elements. The racks and canisters together maintain geometric
control of the stored fuel under normal handling operations and credible acci-
dents to preclude criticality.
Hoists and separately attached lifting rods move canisters along an
underwater path, which corresponds to the route of the interconnecting network
of slots built into the floor grating. The canisters can be shifted to and
from the storage basins into the abutting pits or pickup station for unload-
ing, loading, reviewing, or inspection.
Water levels in the basins are maintained at a minimum of 4.72 m
(15.5 ft) above the basin floor to cool the stored fuel and provide radio-
logical shielding for personnel working in the facility. The filters and ion
exchange systems maintain water clarity and remove radionuclides. Water tem-
perature, pH, conductivity, and water level are continuously monitored;
temperature is maintained around 10°C (50°F), pH is normally between 6 and
7 (range, 5.5 to 8), and average conductivity is 10 µmhos (range, 5 to
60 µmhos).
Four vents exhaust unfiltered air from the fuel storage area in the
KE and KW buildings. Emission monitoring consists of an emission sampler for
each vent. Each K Basin is a registered exhaust emission point that has been
designated as a minor stack at the Hanford Site with the potential to contrib-
ute a dose of less than 0.1 mrem/year to the maximally exposed offsite
individual.
In the KE building, two low-bay roof ventilators exhaust the fuel stor-
age area, and two high-bay roof ventilators exhaust the water treatment area.
The fuel-storage and water-treatment areas share the same air space inside the
facility. All roof ventilators discharge their effluent horizontally, and
each has four associated samplers.
Access to the K Basins is by rail. Only the transfer pit at the south
side of each basin is functional. Cask handling capability is similar at both
basins but is fairly restricted. Crane capacity is 27 MT. The cask-transfer
A.12
pit is 2.1 m (6.8 ft) by 2.8 m (9.2 ft), but the loading pit internal frame-
work restricts the free clearance to 1.5 m (4.9 ft) by 2.8 m (9.2 ft). Casks
must be loaded under water and must be less than 2.6 m (8.5 ft) tall.
A.3 New Facilities Proposed on the Hanford Site
Several facilities are proposed for the Hanford Site in support of the
defense fuel management decisions that will be made regarding the KE and
KW Basins. All of the designs remain conceptual pending selection of an
alternative in the record of decision. The final designs may be substantially
improved.
A.3.1 Facilities Associated with the New Wet Storage
Two wet-storage modes have been suggested for the SNF:
• water-filled multicanister overpacks (MCOs) in a vault
• pool storage (MCOs in pool racks or vault tubes).
A.3.1.1 Water-Filled MCOs in a New Vault Storage Facility
The vault storage approach would use water-filled MCOs stacked two high
in dry or water-filled storage tubes. The tubes would extend into below
grade, concrete enclosed, shielding vaults, which would be cooled by recircu-
lating refrigerated air. The vault storage tube material would be stainless
steel, if the tubes were filled with water to minimize electrochemical corro-
sion mechanisms between the tubes and the stainless steel MCOs. If the tubes
were dry, they would be made of carbon steel (Corten®).
If the'partially constructed Canister Storage Building (CSB) site (see
Section A.4) were selected, the vault facility would use the entire founda-
tion. Three below-grade vaults would likely be constructed. The CSB design
provides space for up to 880 MCOs, each containing 10 fuel canisters. Any
excess vault capacity could be used for storage of other, compatible Hanford
Site materials (i.e., cesium/strontium capsules, other Hanford SNF, vitrified
waste), but their receipt and storage would require supplemental National
Environmental Policy Act review.
If the reference site (see Section A.4) were selected, only two storage
vaults would likely be built to meet the needs for only K Basins SNF storage.
The information provided for the CSB site is, therefore, conservative and is
used to develop generic impacts at both potential sites.
A.13
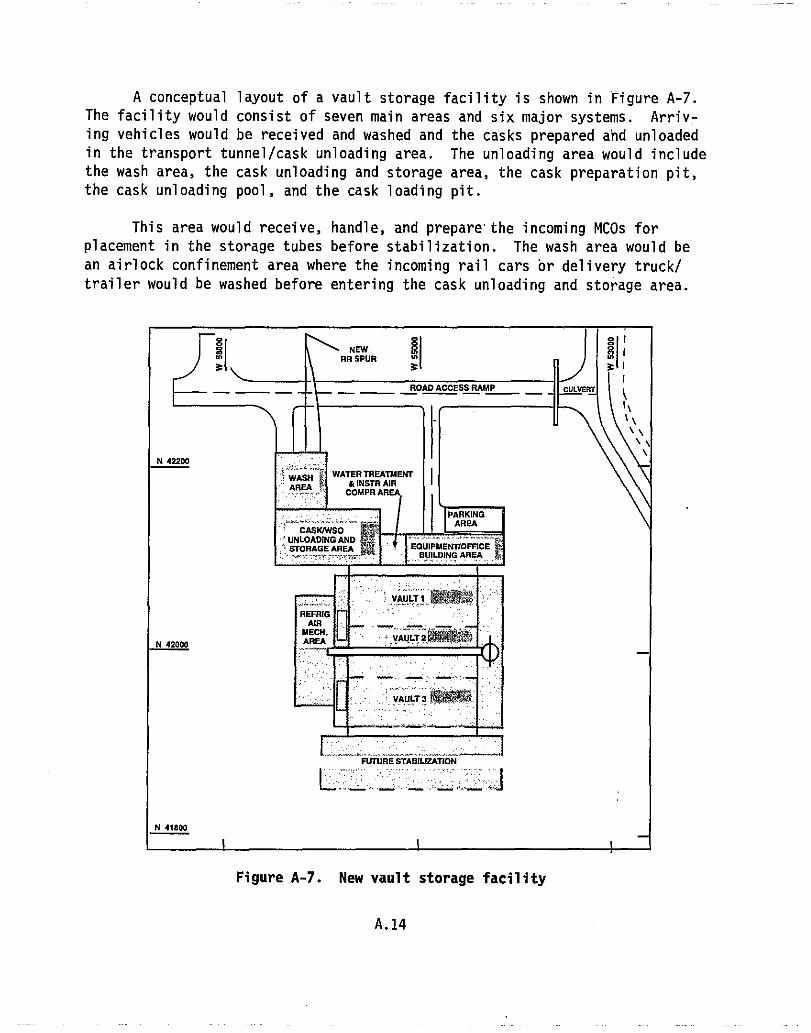
A conceptual layout of a vault storage facility is shown in Figure A-7.
The facility would consist of seven main areas and six major systems. Arriv-ing vehicles would be received and washed and the casks prepared and unloadedin the transport tunnel/cask unloading area. The unloading area would include
the wash area, the cask unloading and storage area, the cask preparation pit,
the cask unloading pool, and the cask loading pit.
This area would receive, handle, and prepare the incoming MCOs for
placement in the storage tubes before stabilization. The wash area would be
an airlock confinement area where the incoming rail cars br delivery truck/
trailer would be washed before entering the cask unloading and storage area.
g
3I
g
RRR
;Ilc I
3I1
I_ ROAD ACCESS RAMP CULVERT 1
I\
N 42208
..%IWASN" WATER TREATMENT
-. AREA &INSTR AIRCOMPR AR
PARKING....AREA
CASKIWSO,^.'; UNLOADINGAND-' STORAGE AREA EOUIPMEN (OFFICE.
-"-rf -, . ,' BUILDING AREA
VAULT 1
REFRIG .
AIRMECH.
N 42000 AREA VAULT2
VAULT 3
FUTURE STABILIZATION
N 41800
Figure A-7. New vault storage facility
A.14
The cask unloading and storage area would be designed for unloading and load-
ing shipping casks and for handling and storage of empty MCOs. A 5-m (15-ft)-
tall wall would partially isolate this area from the cask preparation pit, the
unloading pool, and the loading pit but would allow passage of the overhead
crane above it. The cask preparation pit, between the isolation wall and the
end of the storage pool, would be dedicated to preparing shipping casks for
unloading. A 54.4 -MT (60-ton) overhead crane would be used to handle the -
cask. The cask unloading pool, adjacent to the cask preparation pit, would be
dedicated to unloading MCOs from their casks, to MCO servicing, and to placing
defective MCOs in overpacks. The pool would be lined with stainless steel to
ensure water purity, to prevent water migration through the concrete pool
structure, and to allow decontamination at the end of the facility life. The
cask unloading area would have an underwater transfer canal to transfer MCOs
to a receiving station in the operating area. The cask loading pit would be
similar in construction to the preparation pit. The then ready-to-use cask
would be transferred to a storage position or to an empty vehicle in the
loading and storage area. Servicing four MCOs per day would require two
servicing stations, each equipped with the necessary gas collection pit,
filter, piping, and instruments.
The water in the cask unloading pool would provide shielding and cooling
for the MCOs. The pool water treatment system would maintain pool tempera-
ture, clarity, and radioactive contamination at acceptable levels. Although
no leakage would be expected from MCOs or system components, the pool and its
water treatment system would be designed to minimize radiation exposure if an
accident caused leakage.
The water-treatment system would have sufficient redundancy (or contin-
gency backup capability in the available response time) so that a single
failure of any active component (such as a pump, filter, or control) would not
cause loss of system function.
The cask unloading pool water treatment system would consist of pool
skimmers and flow distribution piping, recirculation pumps, high-efficiency
filters, filter backwash equipment, deionization units, waste slurry holding,
waste water holding, chemical unloading, water chillers, and water sterili-
zers. System drainage would go to the waste water holding tank to be neutral-
ized and monitored before being picked up by a truck with a pump. Pool water
filtrate slurry would go to the contaminated waste slurry holding tank to be
monitored before being transferred into a shielded container on a truck.
Separate curbed areas would be provided for truck loading and unloading and
the tanks for waste water and contaminated waste slurry.
A.15
Structural Information
The operating floor superstructure over vaults 1, 2, and 3 would be a
prefabricated steel frame building with crane rails and a girder for the
overhead cask/crane system. This building would be approximately 14 m (46 ft)
high.
On the west side of the storage vault would be the refrigerated air
mechanical building, a 36.6-m (120-ft)-long, 12.2-m (40-ft)-wide, and 6.1-m
(20-ft)-high prefabricated steel-frame building. West of that would be five
air-cooled condensers, each supported on a 2.7-m (8-ft) by 5-m (15-ft) con-
crete pad. North of the storage vault would be four other support buildings:
• cask/MCO unloading and storage building
[51.8 m (170 ft) long, 36.6 m (61 ft) wide, 10.1 m (33 ft) high]
• wash area building
[19.5 m (64 ft) long, 15.2 m (50 ft) wide, 8.2 m (27 ft) high]
• water treatment and instrument air compressor building
[10.7 m (35 ft) long, 9.1 m (30 ft) wide, 5.2 m (17 ft) high]
• equipment/office building
[30.6 m (100 ft) long, 10.2 m (33 ft) wide, 5.2 m (17 ft) high].
All support buildings would be prefabricated steel frame type with metal
siding and roof deck.
A heating, ventilating, and air conditioning duct would connect the
exhaust stack and the refrigerated air mechanical area. This duct would be
supported by the operating superstructure. Removable blinds in the air inlet
ducts and exhaust stack would isolate the refrigerated air system from the
environment.
Contamination Control in Closed Tube Storage
Gas vented from the MCOs would rise through 1.5 m (5 ft) or more of
water in the storage tube to reach the operating area, which would normally be
ventilated with enough fresh air [over 16,990 m 3/hr (10,000 ft'/min)] to
dilute the hydrogen and krypton-85 levels. Because the storage tubes would be
enclosed spaces in which hydrogen could accumulate, provisions would be made
to prevent the accumulation of explosive concentrations. In one concept for
achieving this objective, each storage tube would have a sealed plug with an
A.16
embedded vent line and two test lines. The test lines would have normally-
closed valves, and the vent line would contain a high-efficiency particulate
air filter. The tubes designed for the CSB could contain a pressure of almost
5 psig before the plug lifted from its sealed seat; the tube wall and bellows
would be designed for higher pressures. A simple modification would be to add
a relief device to each vent line so that the vent would be used only if the
pressure in the tube rose to about 4 psig.
A local pressure indicator would be added to each tube plug, and a por-
table cart used to sample and purge each tube with nitrogen. If each tube was
vented and purged with nitrogen before the pressure exceeded 0.8 psig, the
hydrogen concentration would not exceed 6% by volume. A 6% mixture of hydro-
gen in nitrogen would be nonflammable when mixed with any proportion of air.
A.3.1.2 Pool Storage
In this option, a new storage pool would constructed. This water-filled
open pool would hold 880 MCOs in underwater stainless steel racks. Each MCO
would hold up to 10 fuel canisters. MCOs would be designed with grapples so
that they could be transported underwater without the cask. Stainless steel
storage racks in the pool would be modular and movable with the pool storage
crane. MCOs would be stored vertically, under about 7.3 m (24 ft) of water.
Approximately 18 spaces in the rack would be provided for storage of MCOs that
had been overpacked because of detected or suspected leaks.
The pool water treatment system would maintain pool temperature, clar-
ity, and radioactive contamination within acceptable levels. The stainless
steel-lined pool would be equipped with a leak-detection system and a collec-
tion sump in the concrete structure. Water treatment would include filtration
and ion exchange.
The pool would have three or four vaults, located below grade level.
One vault would be used as a wet-staging pool. The others would be con-
structed as potential dry storage for MCOs returning from a future stabiliza-
tion process, if such a process were selected for interim storage.
In the three-vault alternative, the dry storage vaults would be equipped
with a total of 440 storage tubes, in which stabilized MCOs would be stacked
two-deep. If the four-vault alternative is implemented, the dry storage
vaults would contain a total of 660 storage tubes. Vaults would be con-
structed of concrete and enclosed by a steel-frame building.
A.17
A.3.2 Removal of SNF from the K Basins, Treatment, and up to 40 Years Dry
Storage
Four different treatment options are under consideration, each with its
own facilities: drying by vacuum and/or heating, passivation, calcination
(oxide forms), and onsite processing.
A.3.2.1 Drying and Passivation (or Conditioning) Facility
Drying and passivation (or conditioning) as described in the ITAT (1994)
report is a gradual process of drying the SNF from the K Basins in a safe and
measured manner. The goal is to get the previously wet SNF to a dry, stable
state, "conditioned" for dry storage.
Water-filled MCOs would be transferred from the storage facility to a
new drying/passivation facility, which would be built adjacent to the storage
facility and connected to it by a transfer corridor. The approximate overall
building dimensions would be 25 m (82 ft) wide by 64 m (210 ft) long by 20 m
(66 ft) high. The building would extend approximately 13 m (43 ft) above the
ground. The building's construction is primarily "cast in place" concrete,
but has some areas enclosed in metal sided structures. Roughly "L" shaped,
the building would contain areas for MCO processing; wastewater collection and
treatment; sludge collection and packaging; auxiliary power generation;
heating, ventilating, and air conditioning and process off-gas handling; and
other necessary functions. The proposed layout of the facility is shown inFigure A-8.
The SNF would be protected at all times in a shielded transfer cask or
conditioning station. Additional equipment, such as the conditioning system
isolation valves, would provide localized protection if warranted by an evalu-
ation of probability versus mitigative actions provided in the system design.
A.3.2.2 New Facility for Onsite Calcination (Oxide Forms)
This option would require construction of a new facility adjacent to the
storage facility and connected to it by a transfer corridor. The calcination
facility would be a multilevel steel-reinforced, cast-in-place concrete struc-
ture like those typically used to process high-level radioactive materials.
The process building would be appropriately hardened for ground motion. The
hardened and highly shielded main canyon for this facility would have a width
of 6 m (19.7 ft), a length of 70 m (230 ft), and a height of 26 m (85.3 ft).
A.18
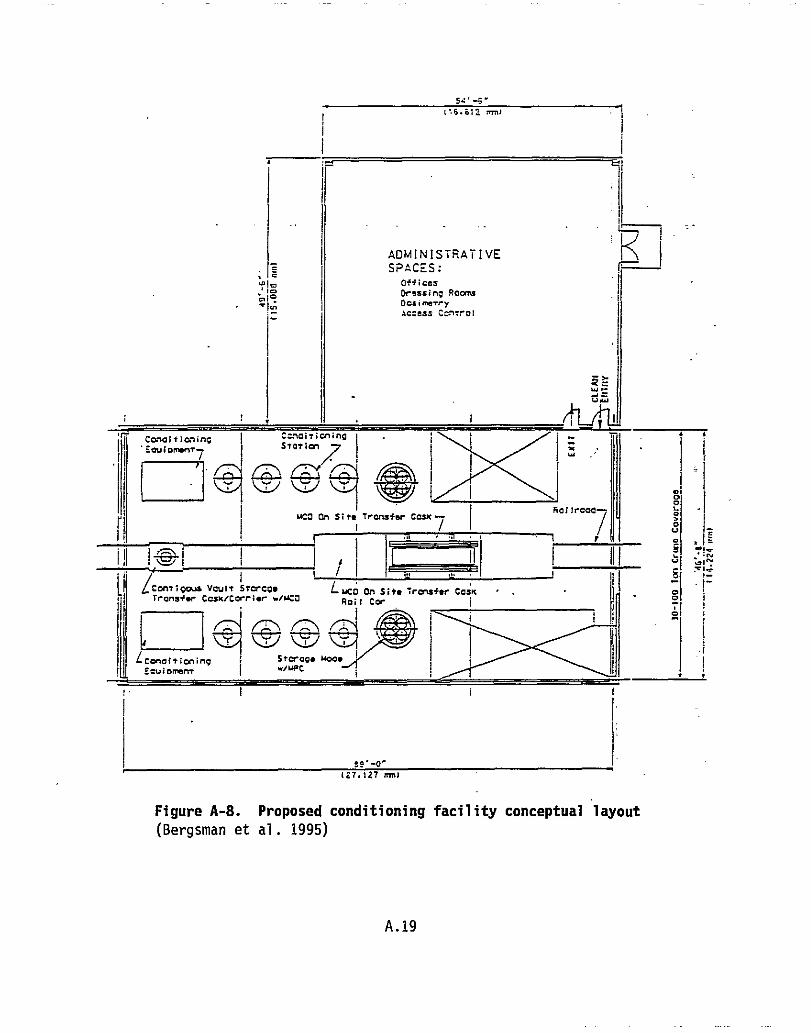
I 11 i
DmDi ti0.ninC
^QUi D111tl1T^i
StOT idT ^` Q\\\
I I
mca on 5itta Trena,er ccS --
I
/ 1
z/ i IcmTiopVcuIT STWCOO Lmcp On Sit* Tra ftr CCSKTrcns,^ CC^SSkk//CCC{ Fii*r r'/M:^O Re; I CW j
/
I LCmat,iminqi CCU^DIneM
I STC Oq m uoo.,_/f/' r'/WC
I
x1 W
J
Di IftbC•
I
«•-9-
t 15.512 +inl 1
Cc
j
i —II
ADMINISTRATIVE f
SPACES:
Of +i CBSDressi n0 RcansODsi merry
j Access lLntrDl
Figure A-8. Proposed conditioning facility conceptual layout
(Bergsman et al. 1995)
A.19
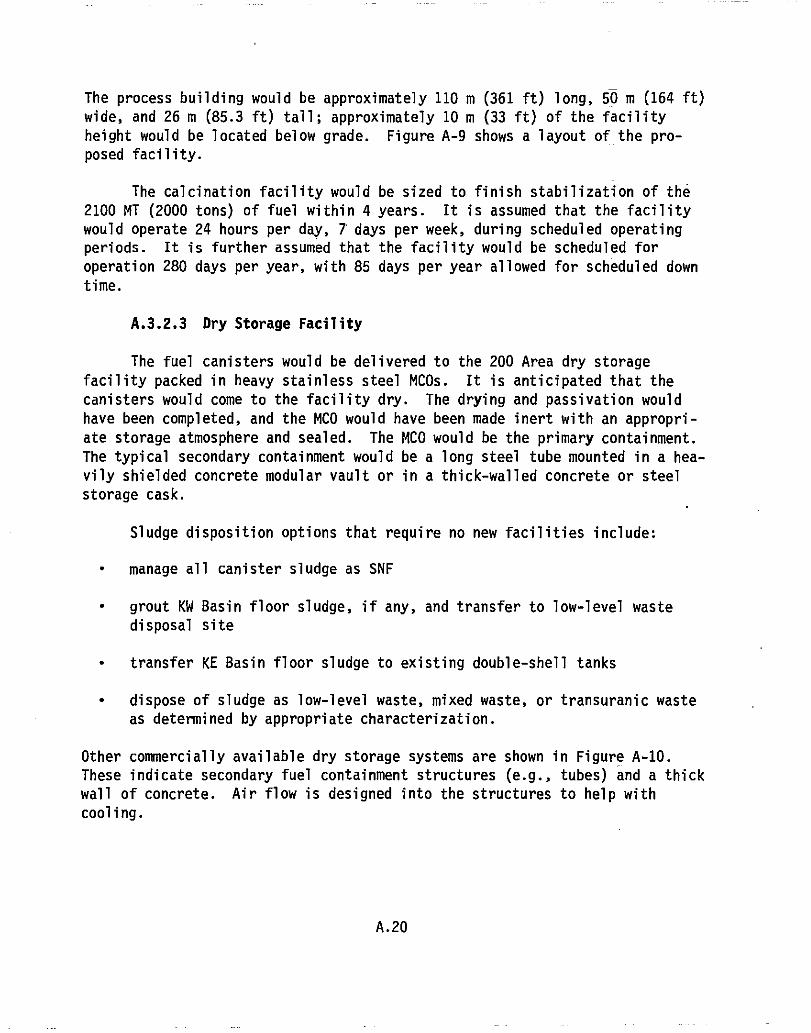
The process building would be approximately 110 m (361 ft) long, 50 m (164 ft)
wide, and 26 m (85.3 ft) tall; approximately 10 m (33 ft) of the facility
height would be located below grade. Figure A-9 shows a layout of the pro-
posed facility.
The calcination facility would be sized to finish stabilization of the
2100 MT (2000 tons) of fuel within 4 years. It is assumed that the facility
would operate 24 hours per day, 7 days per week, during scheduled operating
periods. It is further assumed that the facility would be scheduled for
operation 280 days per year, with 85 days per year allowed for scheduled down
time.
A.3.2.3 Dry Storage Facility
The fuel canisters would be delivered to the 200 Area dry storage
facility packed in heavy stainless steel MCOs. It is anticipated that the
canisters would come to the facility dry. The drying and passivation would
have been completed, and the MCO would have been made inert with an appropri-
ate storage atmosphere and sealed. The MCO would be the primary containment.
The typical secondary containment would be a long steel tube mounted in a hea-
vily shielded concrete modular vault or in a thick-walled concrete or steel
storage cask.
Sludge disposition options that require no new facilities include:
• manage all canister sludge as SNF
• grout KW Basin floor sludge, if any, and transfer to low-level waste
disposal site
• transfer KE Basin floor sludge to existing double-shell tanks
• dispose of sludge as low-level waste, mixed waste, or transuranic waste
as determined by appropriate characterization.
Other commercially available dry storage systems are shown in Figure A-10.
These indicate secondary fuel containment structures (e.g., tubes) and a thick
wall of concrete. Air flow is designed into the structures to help with
cooling.
A.20
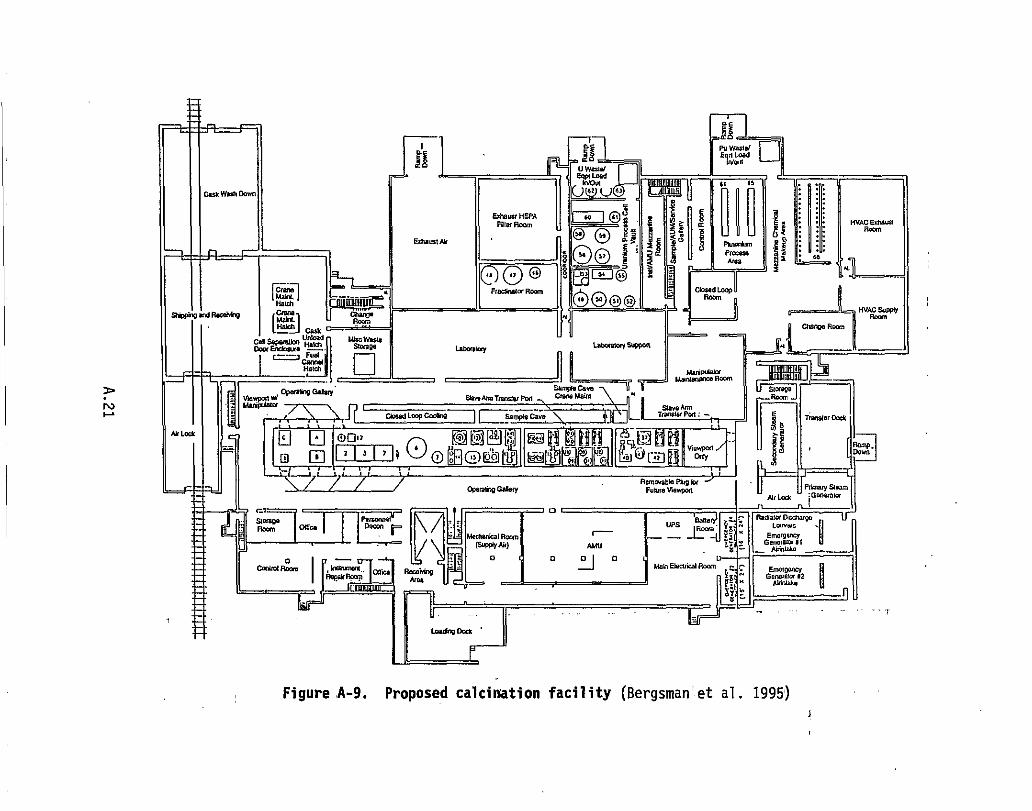
I
E#auar HEPARear Paam
EWuaf A4 '
IFraafrWa(loom
LaEOrnlay
LpuULaop GmNq Smgaf
Pa Wa wE4^TWaLnd U
H n
.s
^: ^ ^ ^ ^^g
^Hvac eawm+
Haam
^^aE
P a Jun
^
^ Praass Iaea .
a
i ^w
Cba.0 Loop
^ Glanpe Hnom^
fkoin
MuvcdomrMwnixwra Hoomn
N
MLak
a
r„ IrA HeawWq Groh
^Hafeil u^ n r
cv^ FlwCarvWcairn
via ^IIII^ Sx Aw Truug
0 O oo^> Y^^
^^ Ll ^ ^ hQ _ o //k ^
U ^' lJ > # O Q o^' ^/ tp ^^'
7Lfr
i^ll l^ Va%
^ ^ ^ ^ ^ Gperauq Galary FuMe Vanpaf
SIaWC Percw^e 9apary{bom ^ rw... ._ _ f^_ UPS IHOwe
C""h'L 1' .."—("" or McRarical Heom — ...L J
(kWPMA4) AMu
c o G GI o(:aMrol Haan I oTra Heoeilbq —1 Man EMOriralHmn
J_ (
^tlef
Neva
'j
+^^I
II LaawM L`aa I^
_ _ _ ... _ -
J
Il
Fd Trmsleroog
111 a3 k
r E ^Ho^wan 1
P^LTMiY9wn J
Alr LOrk ^ iGmwaar
Ha6ala u&iuiVOLwrvwc
EmamwiqGwaiaar ni
= Airinleko ^_
Gem eI „ AM'vnaFa
Figure A-9. Proposed calcination facility (Bergsman'et al. 1995)
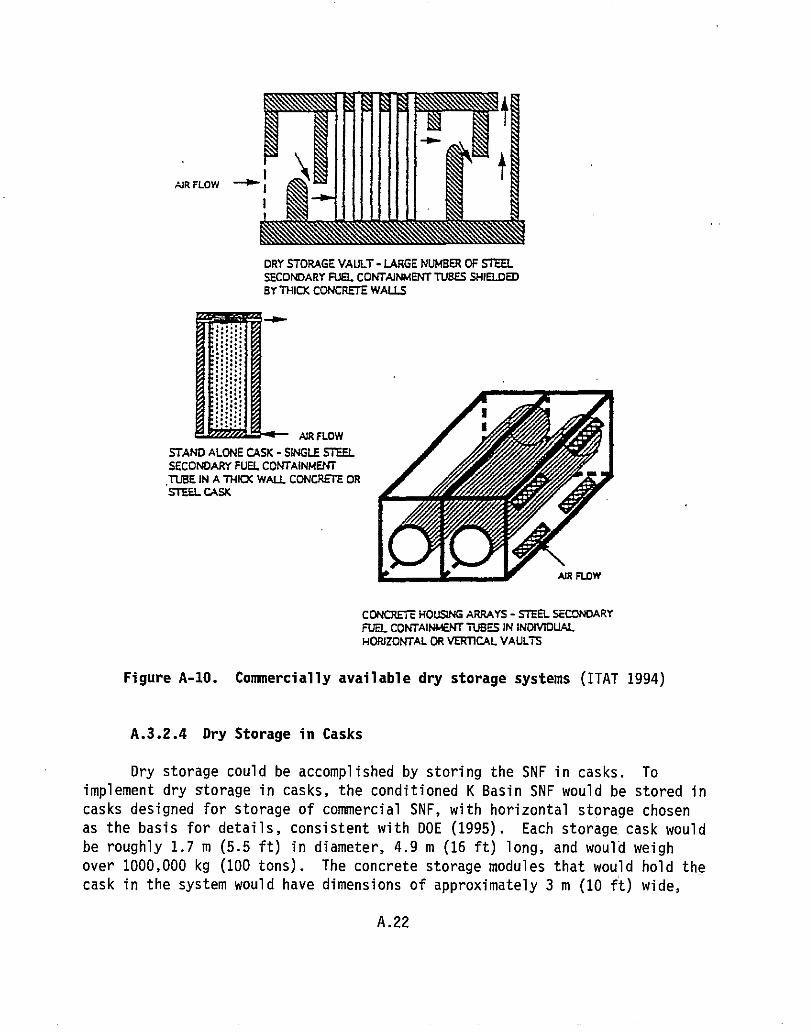
AIR FLOW -'P"
AIR FLOW
STAND ALONE CASK - SINGLE STEELSECONDARY FUEL CONTAINMENTTUBE IN A THICK WALL CONCRETE ORSTEEL CASK
DRY STORAGE VAULT - LARGE NUMBER OF STEELSECONDARY FUEL CONTAINMENT TUBES SHIELDEDBY THICK CONCRETE WALLS
CONCRETEE HOUSING ARRAYS - STEEL SECONDARYFUEL CONTAINMENT TUBES IN INDIVIDUALHORIZONTAL OR VERTICAL VAULTS
Figure A-10. Commercially available dry storage systems (ITAT 1994)
A.3.2.4 Dry Storage in Casks
Dry storage could be accomplished by storing the SNF in casks. To
implement dry storage in casks, the conditioned K Basin SNF would be stored in
casks designed for storage of commercial SNF, with horizontal storage chosen
as the basis for details, consistent with DOE (1995). Each storage.cask would
be roughly 1.7 m (5.5 ft) in diameter, 4.9 m (16 ft) long, and would weigh
over 1000,000 kg (100 tons). The concrete storage modules that would hold the
cask in the system would have dimensions of approximately 3 m (10 ft) wide,
A.22
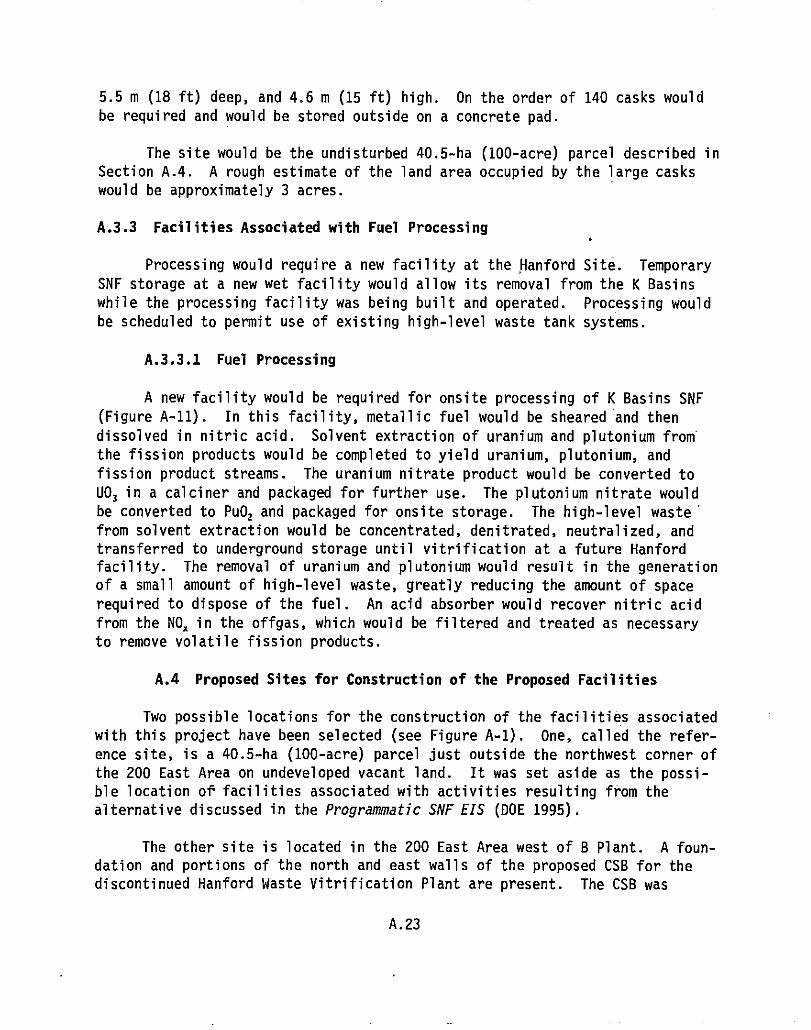
5.5 m (18 ft) deep, and 4.6 m (15 ft) high. On the order of 140 casks would
be required and would be stored outside on a concrete pad.
The site would be the undisturbed 40.5-ha (100-acre) parcel described in
Section A.4. A rough estimate of the land area occupied by the large casks
would be approximately 3 acres.
A.3.3 Facilities Associated with Fuel Processing
Processing would require a new facility at the Hanford Site. Temporary
SNF storage at a new wet facility would allow its removal from the K Basins
while the processing facility was being built and operated. Processing would
be scheduled to permit use of existing high-level waste tank systems.
A.3.3.1 Fuel Processing
A new facility would be required for onsite processing of K Basins SNF
(Figure A-11). In this facility, metallic fuel would be sheared and then
dissolved in nitric acid. Solvent extraction of uranium and plutonium from
the fission products would be completed to yield uranium, plutonium, and
fission product streams. The uranium nitrate product would be converted to
UO3 in a calciner and packaged for further use. The plutonium nitrate would
be converted to PUO2 and packaged for onsite storage. The high-level waste'
from solvent extraction would be concentrated, denitrated, neutralized, and
transferred to underground storage until vitrification at a future Hanford
facility. The removal of uranium and plutonium would result in the generation
of a small amount of high-level waste, greatly reducing the amount of space
required to dispose of the fuel. An acid absorber would recover nitric acid
from the N0, in the offgas, which would be filtered and treated as necessary
to remove volatile fission products.
A.4 Proposed Sites for Construction of the Proposed Facilities
Two possible locations for the construction of the facilities associated
with this project have been selected (see Figure A-1). One, called the refer-
ence site, is a 40.5-ha (100-acre) parcel just outside the northwest corner of
the 200 East Area on undeveloped vacant land. It was set aside as the possi-
ble location of facilities associated with activities resulting from the
alternative discussed in the Programmatic SNF EIS (DOE 1995).
The other site is located in the 200 East Area west of B Plant. A foun-
dation and portions of the north and east walls of the proposed CSB for the
discontinued Hanford Waste Vitrification Plant are present. The CSB was
A.23
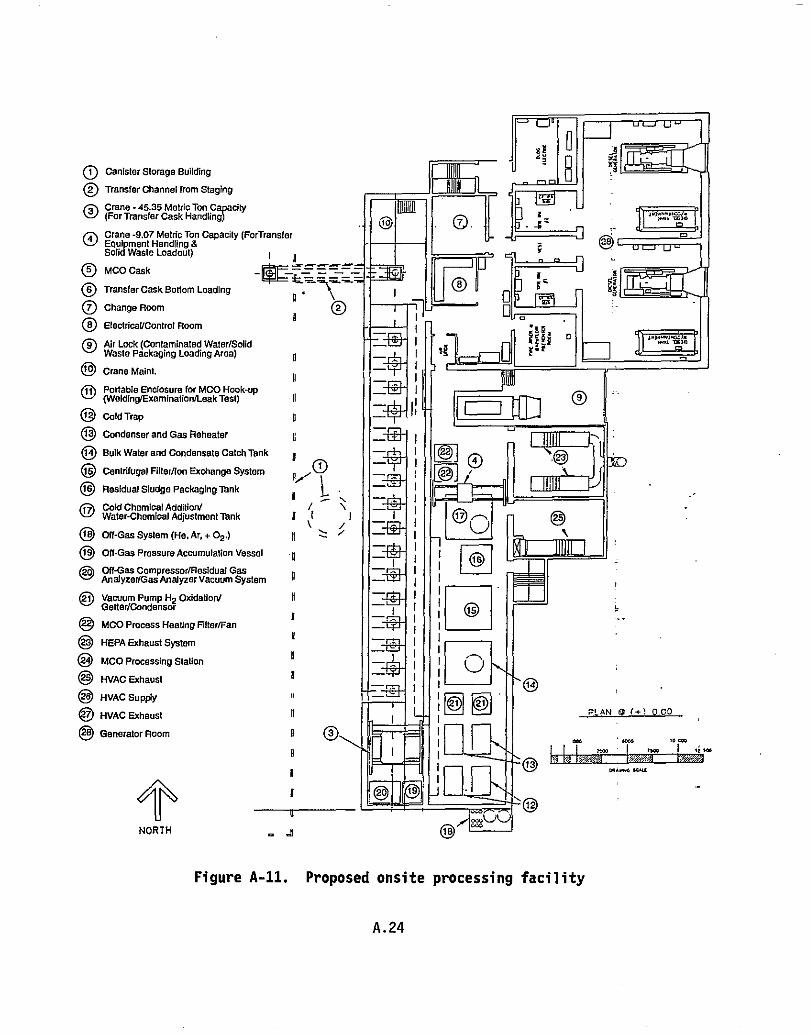
^^ $O Canister Storage Building x
O Transfer Channel from Staging
Crane -45.35 Metric Ton Caciry m
(For Transfer Cask HandtinU __ -p)ht/a.d
Crane-9.07
d
Met ric Ton Capacity(ForTransfer rd O ^+
O Solitl Waste Loaioul) I r
IIQ MCO Cask
© Transfer Cask Bo ttom Loading9 ,3
I O If tisx
7O Change Room O2 O
o,r
u I
QElectrical/Control Room I •!A
O9 Air Water/Solid — I Std a'"Waste PackagingPackaging LoadingLoading Area) 0 — I f^ ^^
tU Crane Maim.u I
11 Po rtable En closure for MCO Hook-up —(WeldingtExaminatlo n/LeakTest) II — " I I ^I-('ll Q
Q Cald Trap tl— i I I ICI I IVI
13 Condenser and Gas Reheater g — I (^ffifl--h
74 Bulk Water and Condensate Catch Tank
15
II — i rj3r^ 4
f1 L^`1ll23L_^t 3b
Centrifugal Rllerflon Exchange System ^^^ — I ^^J O III
16 Residual Sludge Packaging TankY
17 Cold Chemical Addition/Water-Chemical Adjustment lank tl \ / I — ( 1©f^' 25
16 O((-Gas System (He, Ar.+02 .) h — I ^JI19 Off-Gas Pressure Accumulation Vessel
Off-Gas Compressor/Residuai Gas — IAnalyzer/Gas Analyzer Vacuum System — I I
21 Vacuum Pump H2 Oxidation/ H _ Ir
Ge tter/CondenserII — I I I 15
-
® MOO Process Healing Filter/Fan — I II23 HEPA Exhaust System
R— I
24 MOO Processing Station — I IU
Q HVAC Exhaust I I
— I I 14
26 HVAC Supply " I 21 21HVAC Exhaust n
II I F! AN 6(-1 QO0
28 Generator Room A 3O,
II .o w
a I I I I I >m I II
13i ,Y s^
G^
19' l a- \
NORTH – A 18 --
Figure A-11. Proposed onsite processing facility
A.24
designed to provide dry storage of the vitrified glass product from the
Hanford Waste Vitrification Process. The CSB can be easily modified to store
defense fuel from the K Basins.
A.5 Proposed Casks and Cask-Handling Equipment Associated
With the Proposed Facilities
The proposed casks to be used in the transfer, processing, and storage
of SNF and sludge from the K Basins would contain one MCO, but could hold more
depending upon the final design chosen. One possible cask design is shown in
Figure A-10. Each cask would accommodate one MCO.
Minor structural modifications and new equipment would be required in
each of the K Basins to accommodate the equipment needed to prepare, load, and
handle the MCOs in their casks. The modifications and new equipment recom-
mended by the ITAT (1994) are the following:
Remove the structural steel used to guide the existing N Reactor SNF
transfer cask from the cask pit.
• Install the transfer cask support structure in the cask pit and attach
MCO-decontamination spray nozzles. The MCO loading support frame would
be placed on the floor of the cask pit and an auxiliary hoist would be
attached to the existing overhead crane.
• Install the canister preparation station and canister water cleanup
system.
A.5.1 Transport Tunnel/Cask Unloading Area
The rail tunnel/cask unloading area proposed for transporting the SNF to
the storage area would occupy 930 mZ (10,000 ft'). The main functions of this
area are to safely receive, handle, and prepare incoming MCOs for placement in
the temporary storage pool storage racks (see Section A.3.2.1). The transport
tunnel/cask unloading area would have capacity to handle transporters inside
and outside the facility, and to store clean and contaminated shipping casks
and new, empty MCOs and overpacks, which would be used if an MCO leaked.
Included in this facility would be a wash area, a cask unloading and storage
area, a cask preparation pit, and a cask loading pit. The wash area would be
used to wash incoming rail cars and other vehicles. The cask unloading and
storage area would be equipped with a crane and would be used to load and
unload casks. The cask preparation pit would be used to prepare casks for
unloading, including unbolting the cask cover. '
I1'd.1
The cask unloading pool would be used to unload the MCOs from their
casks, service MCOs, and placing defective MCOs in an overpack. This work
would all be done underwater. The unloading pool would be connected to the
temporary storage pool so that the MCOs could be moved to storage racks.
A.6 References
Bergsman, K. H. 1993. Hanford Irradiated Fuel Inventory Baseline.
WHD-SD-CP-TI-175, Westinghouse Hanford Company, Richland, Washington.
Bergsman, K. H., T. B. Bergman, D. W. Bergmann, G. E. Costley, M. T. Janskey,
D. S. Leach, R. L. McCormack, M. J. Monthey, A. N. Praga, I. K. Ullah,
W. L. Willis, and A. G. Hosler. 1995. K Basin Environmental Impact Statement
Technical Input. WHC-SD-SNF-TI-013, Rev. 0, Westinghouse Hanford Company,
Richland, Washington.
DOE (U.S. Department of Energy). 1995. Department of Energy Programmatic
Spent Nuclear Fuel Management and Idaho National Engineering Laboratory
Environmental Restoration and Waste Management Programs Final Environmental
Impact Statement. Vol. 1, Appendix A, Hanford Site Spent Nuclear. Fuel
Management Program. DOE/EIS-0203-F, U.S. Department of Energy,
Washington, D.C.
Fluor Daniel, Inc. 1995. Staging and Storage Facility Feasibility Study
Final Report. Fluor Daniel, Inc., Seattle, Washington.
Fulton, J. C. 1994. Hanford Spent Nuclear Fuel Project, Recommended Path
Forward. WHC-EP-0830, Rev 0, Westinghouse Hanford Company, Richland,
Washington.
ITAT (Independent Technical Assessment Team). 1994. Dry Storage of N Reactor
Fuel Independent Technical Assessment. MAC Technical Services Co., Richland,
Washington.
Pitner, A. L. 1995. KE Basin Underwater Visual Fuel Survey.
WHC-SD-SNF-TI-012, Rev 0, Westinghouse Hanford Company, Richland, Washington.
A.26
APPENDIX B
TRANSPORTATION IMPACT ANALYSIS
a t
APPENDIX B
TRANSPORTATION IMPACT ANALYSIS
This appendix evaluates the impacts associated with transporting spent
nuclear fuel (SNF) and sludge wastes for the alternatives discussed in
Chapter 3.0 of the environmental impact statement (EIS).
This appendix evaluates the impacts of both incident-free (routine)
transport of radioactive materials in which the shipments reach their destina-
tions without incident and the impacts of accidents involving the shipments.
The consequences of the maximum credible transportation accident are also cal-
culated. The approaches and data that were used to calculate these impacts
are presented, as are the shipping scenarios and characteristics of the radio-
active shipments that are important to determining the radiological impacts.
Nonradiological impacts are also calculated.
The no action alternative was not evaluated in this analysis because
there are no proposed shipments of SNF, sludge, or basin water associated with
this alternative. The transportation impacts associated with new wet storage
and'dry storage are basically the same. The key differences result primarily
from the assumed location of the storage and conditioning facilities and the
options to transport the SNF and sludge wet or dry.
Further information on the transportation scenarios in support of thealternatives are provided in the next section. Descriptions of the approach
and computer codes used in this analysis are presented in Section B.2.
Section B.3 presents the results of the transportation impact calculations.
B.1 Shipping Scenarios and Shipment Characteristics
This section presents the shipping scenarios and shipment characteris-
tics for each of the SNF management alternatives addressed in this EIS. The
information presented includes container and shipment capacities, shipment
inventories, numbers of shipments, and route information.
The radiological inventories used in the analyses are presented in
Table B-1. The data in the table represent the bounding inventories of each
radionuclide and were derived from Table A-2 and Bergsman et al. (1995).
The bounding inventories were used in the analysis of both incident-free andaccident impacts.
B.1
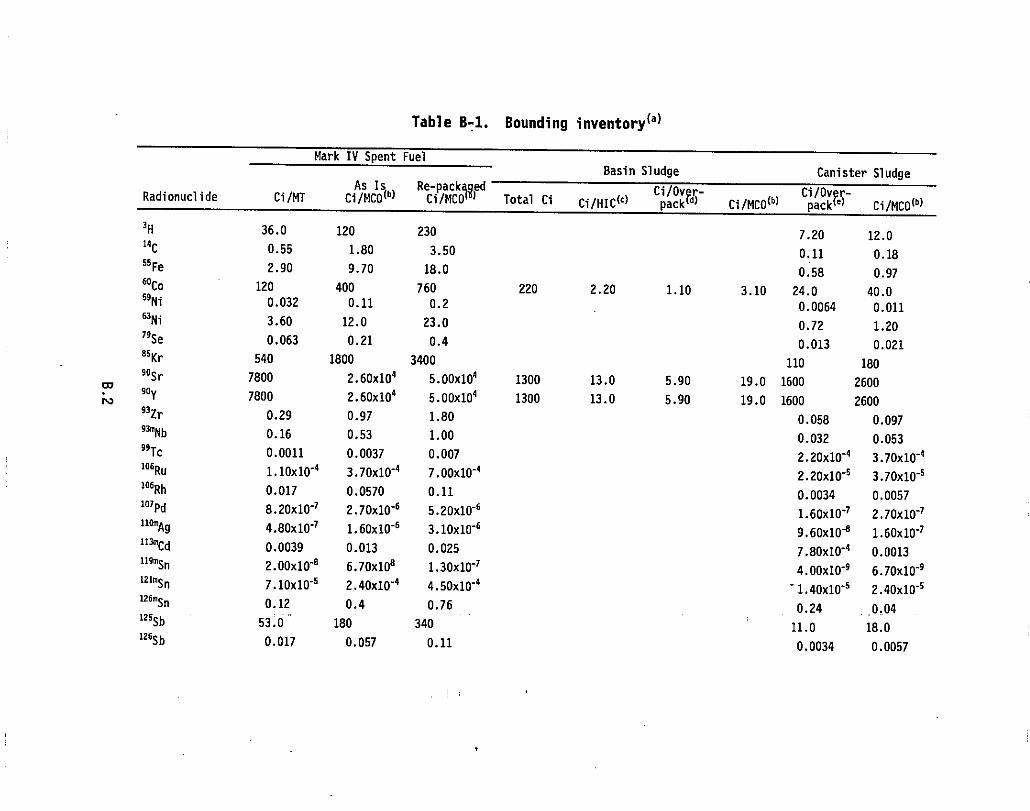
Table B-1. Bounding inventory(a)
Radionuclide
Mark IV Spent
As IsCi/MT Ci/MCO(b)
Fuel
Re-pack,NedCi/MCI Total Ci
Basin
Ci/HIC i`>
Sludge
Ci/Ov r-pack g°^ Ci/MC0^6^
Canister Sludge
Ci/Ov -packg°^ Ci/MCO^"^
3 H 36.0 120 230 7.20 12.014C
0.55 1.80 3.50 0.11 0.1855 Fe 2.90 9.70 18.0 0.58 0.9760Co 120 400 760 220 2.20 1.10 3.10 24.0 40.059Ni 0.032 0.11 0.2 0.0064 0.011
63 Ni 3.60 12.0 23.0 0.72 1.20
79Se 0.063 0.21 0.4 0.013 0.02165Kr 540 1800 3400 110 18090Sr
w7800 2.60x10⁴ 5.00x10⁴ 1300 13.0 5.90 19.0 1600 2600
ro 90Y 7800 2.60x10⁴ 5.00x10⁴ 1300 13.0 5.90 19.0 1600 260093
Zr 0.29 0.97 1.80 0.058 0.09793mNb 0.16 0.53 1.00 0.032 0.05399Tc 0.0011 0.0037 0.007 2.20x10'4 3.70x10'4106
R 1.1Ox10.4
3.7Ox10-4 7.00x10'4 2.20x10'5 3.70x10'5106
Rh 0.017 0.0570 0.11 0.0034 0.0057107 Pd 8.20x10⁻⁷ 2.70x10'6 5.20x10'6 1.60x10"7 2.7Ox10-7110mAg
4.80x10"71.60x10⁻⁶ 3.1Ox10-6 9.60x10'6 1.6Ox10-7
113mCd0.0039 0.013 0.025 7.80x10⁻⁴ 0.0013
119mSn2.00x10'6 6.70406 1.3Ox10-7 4.00x10⁻⁹ 6.704 0'9
121msn7.10x10'5 2.40x10'4 4.50X10⁻⁴ 1.40xIO-5 2.40x10'6
126mSn0.12 0.4 0.76 0.24 0.04
125Sb 53.0 180 340 11.0 18.0
126 S 0.017 0.057 0.11 0.0034 0.0057
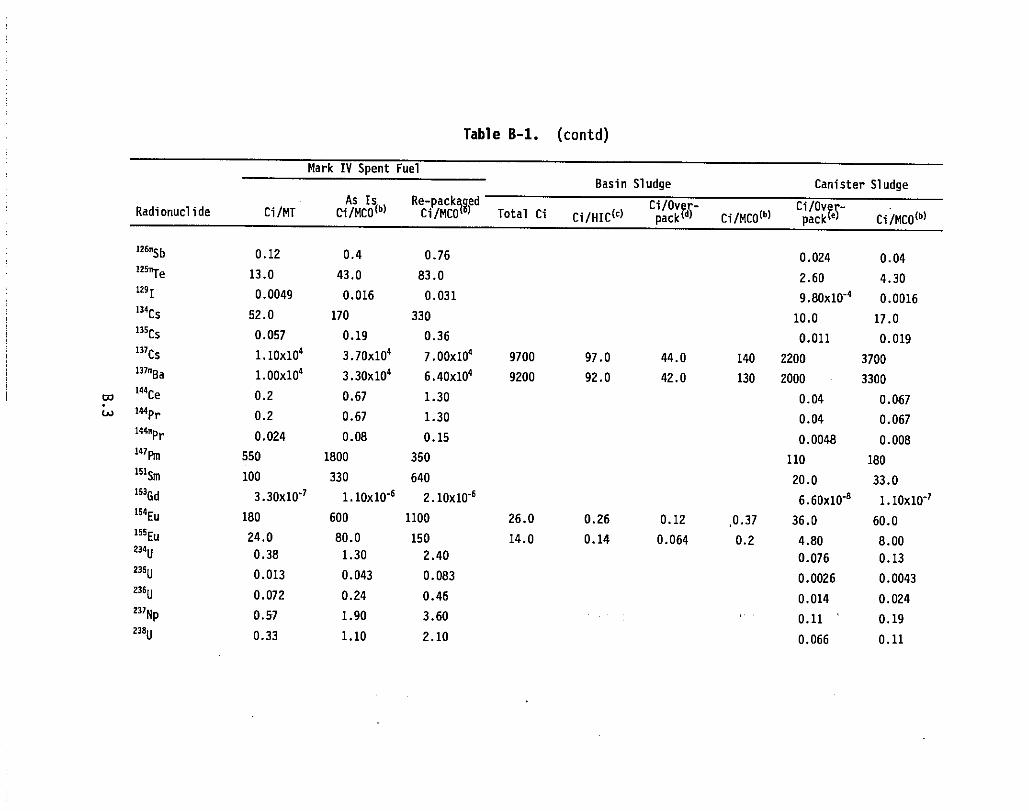
Table B-1. (contd)
Mark IV Spent fuel
Basin Sludge Canister Sludge
As Is Re-pack ed Ci/Ov - Cf/OvRadionuclide Ci/MT Ci/MCOI61 Ci/MCO ) Total Ci Ci/HIC I`1 packg^^
r-Ci/MC0 (61 pack Ci/MCO(W
126msb 0.12 0.4 0.76125mTe 13.0 43.0 83.01291
0.0049 0.016 0.031134
Cs 52.0 170 330135
Cs 0.057 0.19 0.36133
Cs 1.1Ox104 3.7Ox104 7.00x10° 9700 97.0 44.0137mBa
1.00x10^ 3.30x10⁴ 6.40x10⁴ 9200 92.0 42.0
w144 C 0.2 0.67 1.30
144 Pr 0.2 0.67 1.30144m
Pr 0.024 0.08 0.15142 Pm 550 1800 350151
Sm 100 330 640153Gd 3.3Ox10'3 1.IOX10-6 2.10x10-6154 E
180 600 1100 26.0 0.26 0.12155
Eu 24.0 80.0 150 14.0 0.14 0.064234u 0.38 1.30 2.40235u
0.013 0.043 0.083236u 0.072 0.24 0.46237 N 0.57 1.90 3.60236u
0.33 1.10 2.10
0.024 0.04
2.60 4.30
9.80x10'40.0016
10.0 17.0
0.011 0.019
140 2200 3700
130 2000 3300
0.04 0.067
0.04 0.067
0.0048 0.008
110 180
20.0 33.0
6.60x10'6 1.1Ox10"3
1 0.37 36.0 60.0
0.2 4.80 8.00
0.076 0.13
0.0026 0.0043
0.014 0.024
0.11 0.19
0.066 0.11
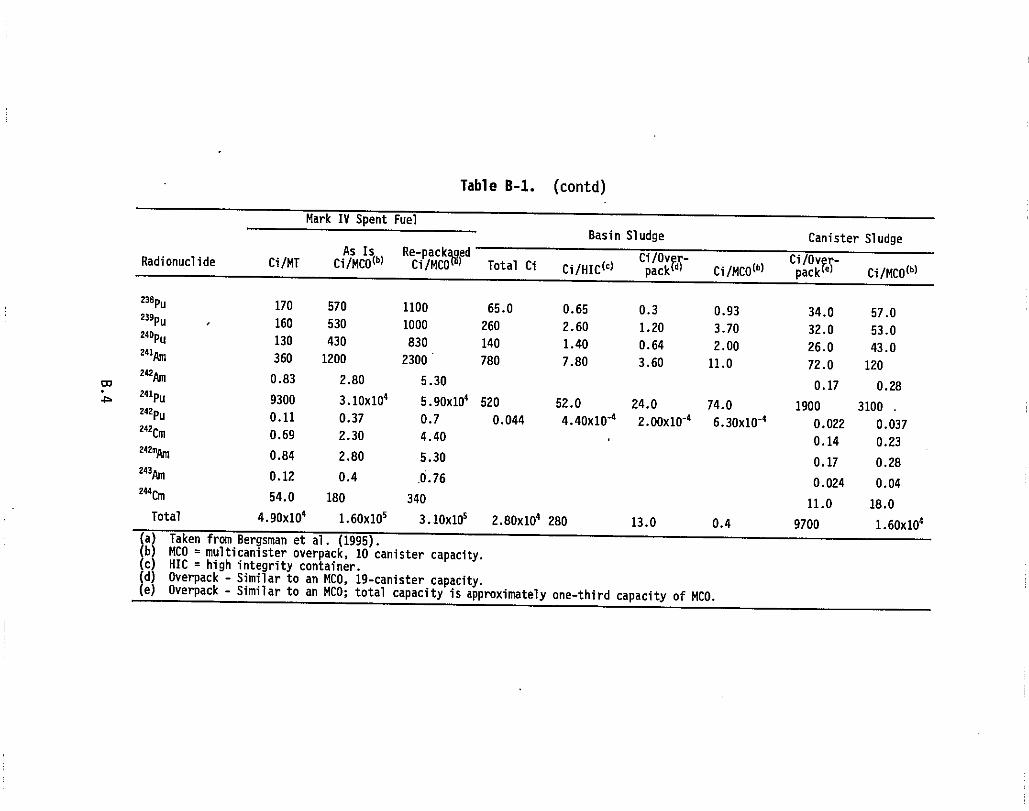
Table B-1. (contd)
Mark IV Spent Fuel
Basin Sludge
Canister Sludge
Radionuclide Ci/MT Ci/MCOW R Ci^MCON)ed
Total Ci Ci/HIC (`)
Ci/MCO(W
Ci/MCO(W
w
A
238Pu170 570 1100 65.0 0.65 0.3 0.93 34.0 57.0239pu 160 530 1000 260 2.60 1.20 3.70 32.0 53.0
24DPu 130 430 830 140 1.40 0.64 2.00 26.0 43.0241am360 1200 2300 780 7.80 3.60 11.0 72.0 120
242am 0.83 2.80 5.30 0.17 0.28
241pu9300 3.10x10⁴ 5.90x10° 520 52.0 24.0 74.0 1900 3100242
Pu 0.11 0.37 0.7 0.044 4.40x10'4 2.00x10⁻⁴ 6.30x10⁻⁴ 0.022
.
0.037242Cm 0.69 2.30 4.40 0.14 0.23
242mam0.84 2.80 5.30 0.17 0.28
243am 0.12 0.4 0.76 0.024 0.04
244Cm 54.0 180 340 11.0 18.0Total 4.9Ox104 1.60x10⁵ 3.10x10⁵ 2.80x10⁴ 280 13.0 0.4 9700 1.60x10⁴
(a) Taken from Bergsman et al. (1995).(b) MCO = multicanister overpack, 10 canister capacity.(c) HIC = high integrity container.(d) Overpack - Similar to an MCO, 19-canister capacity.(e) Overpack - Similar to an MCO; total capacity is approximately one-third capacity of MCO.
The transportation routing information, by mode and waste form, is pre-
sented in Table B-2. These data were derived from Bergsman et al. (1995) and
from detailed maps of the Hanford Site road and rail system. Additional
alternative-specific information is presented in the rest of this section.
B.1.1 Enhanced K Basin Storage
This alternative involves upgrades to the KW Basin to extend basin
operations for an additional 40 years and the waste management and SNF trans-
fer activities necessary to consolidate and continue SNF storage in the
KW Basin. Following upgrades to the KW Basin, SNF currently stored in the KE
Basin would be transferred to KW Basin for wet storage. Sludge waste external
to the SNF canisters (basin sludge) would be characterized. Based on the
results of the waste characterization, the one of the following three options
would be used for disposition of the basin sludge:
1. transfer to a Hanford double-shell tank (DST) farm,
2. package as SNF and transfer to the KW Basin, or
3. mix with grout, pour into container, and transfer to the solid waste
burial ground (SWBG).
The SNF and the basin sludge, if characterized as SNF, will be trans-
ferred from the KE Basin to the KW Basin using the existing railroad line.
The KE Basin sludge will be transferred to the Hanford DST tank farm or the
SWBG by truck using existing roadways within the Hanford Site.
The transportation options assume that all SNF canisters within the
KE Basin would be transferred to the KW Basin and the basin sludge would be
removed from the basin, i.e., packaged and transported to a disposal site.
The SNF would be loaded underwater into a canister, then placed into an
overpack, which would then be placed inside a shipping cask and shipped by
truck or rail approximately 500 m (1,700 ft) to the KW Basin for storage in
the basin. A DOE-approved shipping cask would be used for this option.
The shipping cask would be capable of containing one multicanister
overpack (MCO) or approximately 3.3 MTU per cask. A total of 750 MCOs would
be required for all SNF in the K Basins. The fraction of the SNF inventory
located at the KE Basin is about 50% of the total SNF inventory (or roughly
3,700 canisters), so it was estimated that 370 overpacks would be required to
transfer the SNF from the KE to the KW Basin. The radiological inventory on a
per-overpack basis (equivalent to the per-cask inventory) was shown in
Table B-1.
B.5
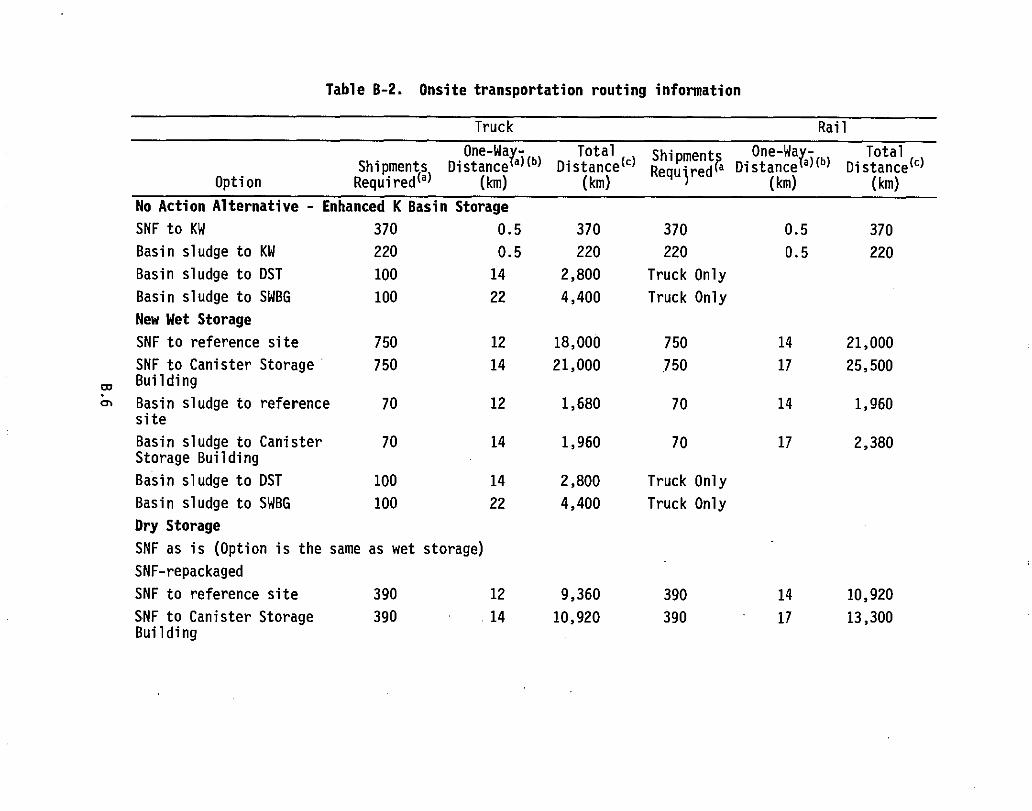
Table B-2. Onsite transportation routing information
Truck Rail
One-Wa -0(b)
Total^`1
Shipment
u're^i
One-WayV-a)(')
TotalDistance(`)Shipments Distance Distance Re q
3Distance
Option Required(a) ( km) NO ( km) ( km)
No Action Alternative - Enhanced K Basin Storage
SNF to KW 370 0.5 370 370 0.5 370
Basin sludge to KW 220 0.5 220 220 0.5 220
Basin sludge to DST 100 14 2,800 Truck Only
Basin sludge to SWBG 100 22 4,400 Truck Only
New Wet Storage
SNF to reference site 750 12 18,000 750 14 21,000
SNF to Canister Storage 750 14 21,000 750 17 25,500o, Building
Basin sludge to reference 70 12 1,680 70 14 1,960site
Basin sludge to Canister 70 14 1,960 70 17 2,380Storage Building
Basin sludge to DST 100 14 2,800 Truck Only
Basin sludge to SWBG 100 22 4,400 Truck Only
Dry Storage
SNF as is (Option is the same as wet storage)
SNF-repackaged
SNF to reference site 390 12 9,360 390 14 10,920
SNF to Canister Storage 390 14 10,920 390 17 13,300Building
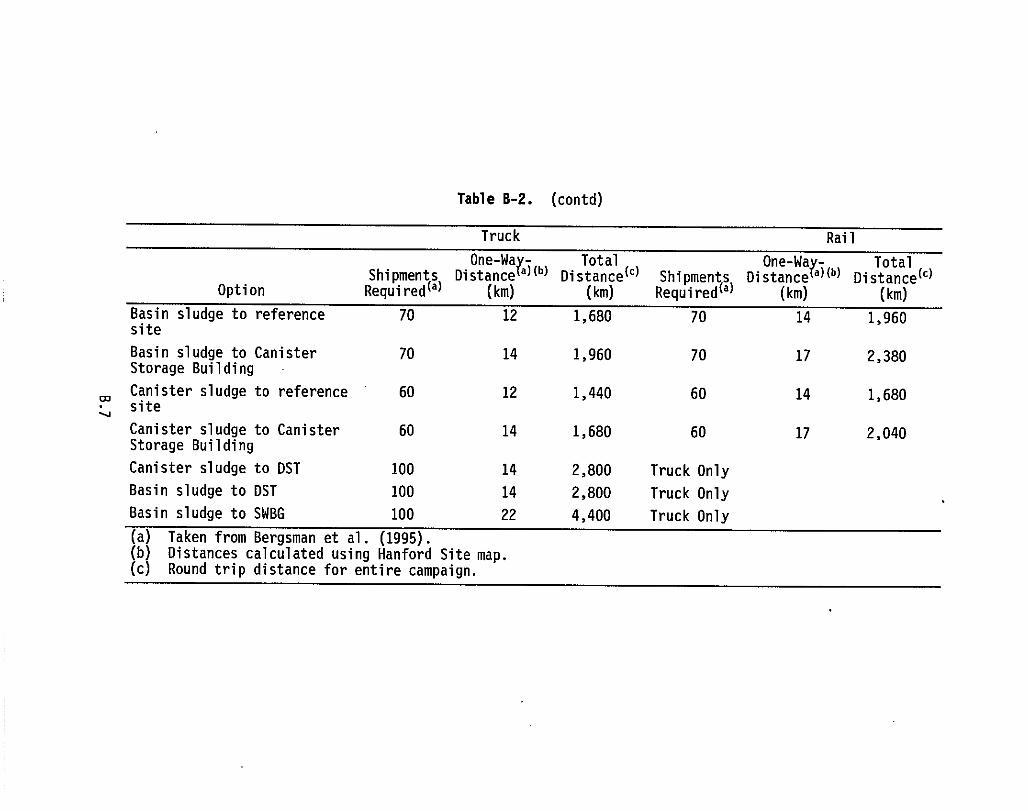
Table B-2. (contd)
Truck Rail
One-Wary Total One-War- TotalShipments Distance a)(b) Distance (` ) Shipments Distance
)(b)Distance(`)
Option Required(a) (km) (km) Required(a) (km) (km)
Basin sludge to reference 70 12 1,680 70 14 1,960site
Basin sludge to Canister 70 14 1,960 70 17 2,380Storage Building
W Canister sludge to reference 60 12 1,440 60 14 1,680siteV
Canister sludge to Canister 60 14 1,680 60 17 2,040Storage Building
Canister sludge to DST 100 14 2,800 Truck Only
Basin sludge to DST 100 14 2,800 Truck Only
Basin sludge to SWBG 100 22 4,400 Truck Only
(a) Taken from Bergsman et al. (1995).(b) Distances calculated using Hanford Site map.(c) Round trip distance for entire campaign.
Based on the results of the basin sludge waste characterization, the
basin sludge would be managed as SNF or solid or liquid waste; however, the
preferred option is to transfer the basin sludge to a DST. For this assess-
ment, it was assumed that the characteristics of the assumed solid and liquid
waste packages (i.e., MTU per package and curies per package) and the required
number of shipments would be the same. The basin sludge would be removed from
the basin remotely and transferred to either a liquid waste high-integrity
container (LWHIC), if the basin sludge meets the DST waste acceptance cri-
teria, or grouted and containerized in a solid waste high-integrity container
(SWHIC), if the basin sludge meets the SWBG waste acceptance criteria. The
capacity of the LWHIC is approximately 6 m 3 (1,580 gal). It was assumed that
up to 600,000 L (158,000 gal) of makeup water or an equivalent grout volume
would be required to treat and remove the basin sludge.
The LWHIC would be shipped by truck approximately 14 km (8.7 mi) to the
AW DST tank farm located in the 200 East Area. The SWHIC would also be
shipped by truck approximately 22 km (13.7 mi) to the SWBG. The radiological
inventory calculated for a LWHIC or SWHIC, shown in Table B-1, assumes that
the basin sludge would be uniformly distributed throughout the 600,000 L
(158;000 gal) of makeup water or grouted waste.
Should the basin sludge be designated SNF, the basin sludge would be
loaded into a canister and placed into an overpack (10 canisters per over-
pack). The loaded MCO would then be placed into a rail shipping cask (one
overpack per shipping cask). Approximately 220 overpacks would be required to
transport the basin sludge from the KE to the KW Basin. The estimated inven-
tory per overpack or shipping cask was shown in Table B-1.
6.1.2 New Wet Storage
This alternative assumes that a new wet storage facility is constructed
away from the Columbia River. Two sites would be considered: the reference
site is located to the northwest of the 200 East Area and the Canister Storage
Building is .located within the 200 East Area. All SNF currently stored in the
K Basins would be transferred to the new facility. The basin sludge would be
packaged and disposed of as discussed in the no action alternative. The SNF,
as well as the basin sludge, would be transferred from the K Basins via rail
or truck.
This alternative involves transferring all SNF at the basins to a new
wet storage facility. The SNF shipping package, i.e., canisters, MCO, and
shipping cask, with the exception of the MCO, are the same as those discussed
B.8
in Section B.1.1. The KE Basin sludge waste packages, i.e., LWHICs and
SWHICs, were also discussed previously in Section B.1.1.
The KE Basin SNF or basin sludge would be loaded underwater into an MCO
and then placed into a shipping cask (one MCO per cask), as discussed previ-
ously, and transported via truck or rail. The rail shipping distances are
approximately 13.5 km (8.4 mi) and 16.3 km (10 mi) from the KE Basin to the
reference site and the Canister Storage Building, respectively. - The truck
shipping distances are approximately 12.0 km (7.4 mi) and 14.1 km (8.8 mi) to
the reference site and the Canister Storage Building, respectively. The
KW Basin SNF would be loaded underwater and shipped via rail approximately
14.0 km (8.7 mi) and 16.8 km (10.3 mi) from the KE Basin to the reference site
and the Canister Storage Building, respectively, or via truck approximately
12.0 km (7.4 mi) and 14.0 km (8.8 mi) to the reference site and the Canister
Storage Building, respectively. The estimated radiological inventory per MCO
or shipping cask was shown in Table B-1.
The K Basins sludge would be recovered from the basin floor, packaged,
and transported to the wet storage facility (if classified as SNF based on
characterization data), AW tank farm (if classified as liquid waste), or SWBG
(if classified as solid waste). The basin sludge would be transported via
truck approximately 14.0 km (8.7 mi) to the AW tank farm in the 200 East Area
or approximately 22.0 km (13.7 mi) to the SWBG. The estimated radiological
inventory per LWHIC or SWHIC was shown in Table B-1.
B.1.3 Dry Storage
This alternative involves constructing a new dry storage facility at the .
reference site and the Canister Storage Building to accept and store all
K Basins SNF or basin sludge characterized as SNF. As discussed previously,
basin sludge meeting the DST waste acceptance criteria or the SWBG acceptance
criteria would be shipped to the AW DST tank farm or the SWBG. However, there
are four SNF and sludge handling options associated with this alternative.
The first dry storage option, with respect to transportation, is the
same as the new wet storage alternative (Section B.1.2). That is, the ship-
ping containers, shipping distances, and modes are the same. The differences
between this alternative and the wet storage alternative result from SNF han-
dling operations at the facility and are not related to transportation.
The second dry storage option is similar to the new wet storage option,
except that the canisters would be perforated to-allow for water drainage and
B.9
gas flow; therefore, the SNF would be shipped in a damp or "dry" condition.
The basin sludge would be packaged and shipped as discussed in Section B.1.2.
The third and fourth dry storage options involve mechanically removing
the sludge from the canister, collecting the canister sludge, and packaging
the canister sludge for disposition as SNF or liquid waste. That is, the can-
ister sludge would be transferred remotely from the canister to a MCO. The_
fourth option involves removing the SNF from the canister and repackaging the
SNF in baskets before loading the MCO. By repackaging the SNF in baskets, the
capacity of the MCO would be increased from 10 canisters or 3.4 MTU to
19 canisters or 6.5 MTU. This would reduce the number of MCOs required and
the number of shipments from 750 to 390. Repackaged SNF will only be shipped
onsite and is not considered in the foreign processing alternative.
B.1.4 Foreign Processing
Potential shipping scenarios are described in this section for trans-
porting irradiated N Reactor fuel from the Hanford Site to the U.K., and the
return of separated plutonium, uranium, and HLW to Hanford. All scenarios
assume stabilization and packaging, as necessary, of the SNF currently stored
in the K Basins on the Hanford Site. From the K Basins, the SNF would be
loaded for onsite or offsite transport as required for each scenario. Offsite
transport would take place via either barge, truck, or rail to a port desig-
nated as a "facility of particular hazard" in accordance with 33 CFR 126,
where the shipment would be loaded onto a ship for overseas transport. The
overseas segment of the shipment was assumed to utilize purpose-built ships
typical of those employed by the representative processing facility in the
U.K. for shipping SNF (BNFL 1994). Such a system would likely be necessary if
Hanford SNF were to be shipped without prior stabilization because alternative
carriers would presumably not have either the equipment or expertise required
for long-distance transport of metallic SNF in a wet overpack. If the SNF
were stabilized before shipment, a variety of commercial or military shipping
options might be available.
After processing of the SNF, the products and wastes are assumed to be
returned to Hanford for interim storage via the same U.S. seaport at which the
initial shipments exited the country. The three materials addressed in the
analysis for the return shipments are plutonium, uranium, and HLW. It is
assumed that the separated plutonium and uranium would be converted to oxide
forms and shipped to the U.S. aboard a purpose-built ship similar to that used
for transporting the irradiated fuel. Other transport options might also be
available for these materials, including use of military or commercial ships
or aircraft. HLW is assumed to be processed to a stable form (borosilicate
B.10
glass encased in stainless steel canisters) before shipment. This section
provides descriptions of the shipping sce_narpos, transportation and packaging
systems, radiological characteristics of -=t =he shipments, transportation routes,
and port facilities that were examined in this analysis.
B.1.4.1 Port Selection
Ports evaluated for the foreign processing option were chosen to mini-
mize either the overland or ocean segments of_the shipments and to provide a
reasonable range of alternative transportation modes between the Hanford Site
and the port (i.e., barge, truck, or rail). For this evaluation, two poten-
tial West Coast U.S. ports (Seattle/Tacoma, Washington, and Portland, Oregon)
and one potential East Coast port (Norfolk, Virginia) were evaluated for the
overland transportation analysis. Population densities along the routes to
these ports are representative of those near many major U.S. seaports. In
addition, the port of Newark, New Jersey, was included in the port accident
analysis to estimate the consequences of an accident in a location with a very
high surrounding population.
B.1.4.2 Overseas Transport
The routing for overseas transport from West Coast U.S. ports would
include transit via the Columbia River or Puget Sound to the Pacific Ocean, 'a
southerly route through the Panama Canal or around Cape Horn in South America,
and then north to the U.K. The route around the cape is considered because it
maximizes the distance that a shipment might be required to travel, and there-
fore provides an upper bound for risks associated with the ocean transport
segment. However, a route via the Panama Canal would be preferable for West
Coast shipments because it avoids potential risk associated with the added
distance and adverse weather conditions that might be encountered during
transport around the cape. Transport via -an East Coast U.S. port would be
directly across the Atlantic Ocean to the-U,K. The total distance for ocean
transport via the West Coast is approximEM-ely 7,000 nautical miles via the
Panama Canal or 17,000 nautical miles viaMpe Horn; that for the East Coast
is approximately 3,000 nautical miles.
B.1.4.3 Transport Scenarios
Overland transport between the Hanford Site and overseas shipping ports
was evaluated for three different scenarios, as described in the followingsections.
B.11
Barge to the Port of Portland, Transoceanic Shipment to the U.K. Thisscenario begins with cask loading operations at the Hanford Site K Basins.
The shipping casks would be loaded with SNF and prepared for truck transport
to the Port of Benton barge slip near the 300 Area of the Hanford Site. After
arrival at the barge slip, the shipping casks would be transloaded onto the
barge via crane and then secured to the deck of the barge. After a full load
of casks was secured, the barge would depart for the Port of Portland, Oregon,
traveling down the Columbia River through routinely navigated shipping chan-
nels. At the Port of Portland, the shipping casks would be lifted off the
barge and placed aboard a ship for the overseas segment of the journey. The
shipping casks would then be secured, and the ship would depart for the U.K.
After processing of the SNF, the HLW shipments are assumed to return via
Portland, where the material would be transloaded onto a rail car and trans-
ported to Hanford for interim storage. Shipments of uranium trioxide and
plutonium dioxide would be returned to Hanford by truck.
Truck/Rail to the Port of Seattle, Transoceanic Shipment to the U.K.The first leg of this scenario is different from the barge-to-Portland sce-
nario in that the shipping casks would be loaded at the K Basins and shipped
directly to the Port of Seattle, Washington, for transloading onto the ocean-
going vessel. The overland leg would consist of either truck or rail ship-
ments. The assumption was made that one shipping cask would be transported
per truck shipment or two casks per rail shipment. After arrival at the Port
of Seattle, the shipping casks would be transloaded onto the ocean-going
vessel, and when a shipload of casks had been loaded, the ship would sail
through Puget Sound and the Strait of Juan de Fuca to the Pacific Ocean,
travel south via either the Panama Canal or Cape Horn, and then north to the
U.K. After processing, the uranium trioxide, plutonium dioxide, and vitrified
HLW would be returned to the U.S. by ship via Seattle and finally to Hanford
by truck or rail.
Truck/Rail to the Port of Norfolk, Virginia, Transoceanic Shipment tothe U.K. This scenario would be similar to the truck/rail to Seattle scenarioexcept the intermediate port would be Norfolk, Virginia. Similar to the Port
of Seattle scenario, the shipping casks would be loaded aboard the ocean-going
vessel and shipped to the U.K. This shipping scenario maximizes the overland
transport leg and minimizes the ocean travel distance. As with the other two
shipping scenarios, the vitrified HLW, plutonium dioxide, and uranium trioxide
materials were assumed to be returned to Hanford via Norfolk.
B.12
B.1.4.4 Shipping System Descriptions
This section presents descriptions of the shipping cask and truck, rail,
and barge shipping systems that are used in the three potential shipping sce-
narios. The information presented focuses on the parameters important to the
impact calculations, namely the cargo capacities and radionuclide inventories.
The shipping cask assumed to be used for the SNF shipments from Hanford
to the U.K. is a standard design routinely used for commercial SNF transport
(BNFL 1994). The cask could transport approximately 5.5 MT (5 tons) of intact
fuel (with a smaller capacity for damaged fuel). The loaded cask weight is
about 51 MT (46 tons), so it was assumed that one cask could be transported
per highway shipment and two per rail shipment. The capacities of the barge
and ship are assumed to be 24 casks each. A total of 17 transoceanic
shipments would be required to accommodate the 408 caskloads that would be
necessary to ship all Hanford SNF. The actual number of shipments required
would depend on the number of casks available, or on procurement of a suffi-
cient number of new casks to provide for efficient shipment of Hanford SNF on
a reasonable schedule.
The radionuclide inventories for the SNF shipments were determined using
the information on N Reactor fuel inventories presented in Bergsman (1994).
The resulting radionuclide inventories for the three types of shipments
(truck, rail, and barge/ship) are presented in.Table B-3.
The return shipments of HLW and plutonium and uranium oxides were
assumed to be shipped via the same routes used for overseas shipment of
Hanford SNF. For the barge-to-Portland option, these materials were assumed
to be returned to the U.S. by ship to the Port of Portland, where HLW shipping
casks would be transloaded onto a barge and uranium and plutonium onto trucks
for transport to Hanford. Similarly for the other options, the materials
would be transported by ships to the ports of Norfolk or Seattle, transloaded
onto truck or rail shipping systems, and transported to Hanford.
The number of shipments of solidified HLW was estimated using assumed
shipping cask capacities for HLW. It is estimated that a total of 500 con-
tainers of vitrified HLW, each weighing about 500 kg (1100 lb), would result
from processing the N Reactor SNF (BNFL 1994). The U.K. processing facility
has designed a new 121 MT (110-ton) shipping cask for vitrified HLW that would
be capable of carrying 21 HLW containers per shipment. Therefore, about 24
caskloads would be required to return the HLW to the U.S. This material was
assumed to be transported to a U.S. port facility in one shipment and then
transloaded onto a rail car for the overland shipment segment (the HLW cask is
B.13
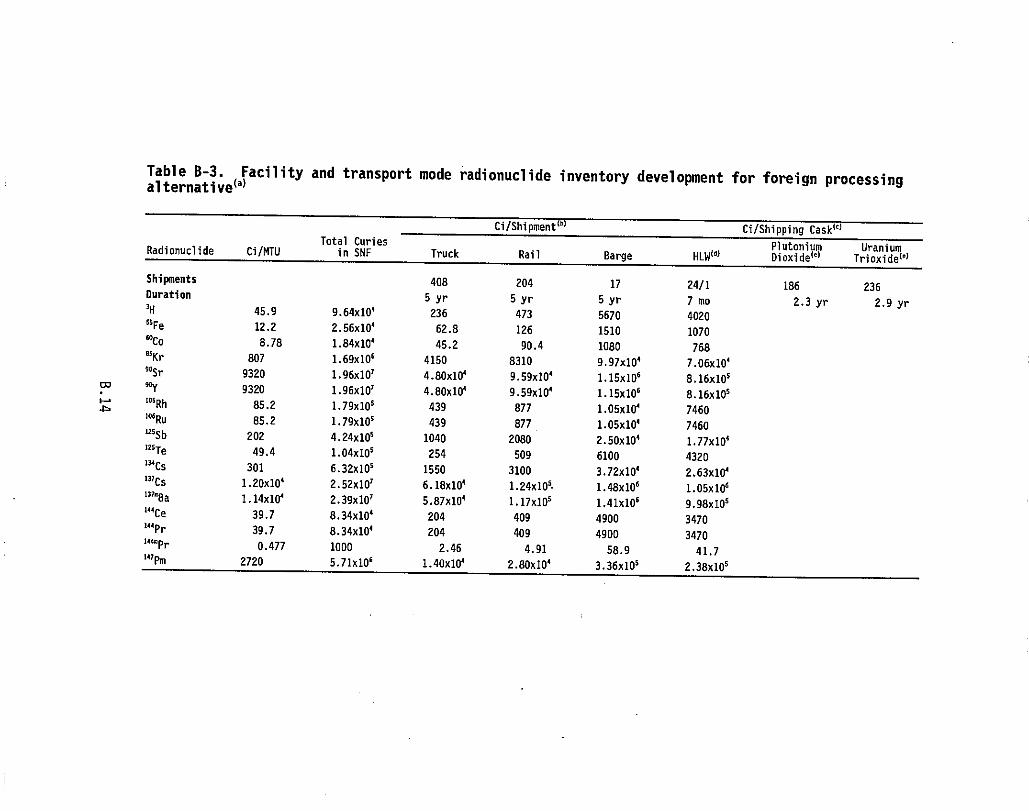
Table B-3. Facility and transport mode radionuclide inventory development for foreign processingalternative(a)
Ci/Shipments "3 - Ci/Shipping CaskOTotal Curies Plutonium UraniumRadionuclide Ci/MTU in SNF Truck Rail Barge HLW(4) Dioxi de(') Tri oxidpl6/
Shipments 408 204 17 24/1 186 236Duration 5 yr 5 yr 5 yr 7 mo 2.3 yr 2.9 yr3H 45.9 9.6410' 236 473 5670 402055Fe 12.2 2.56x10' 62.8 126 1510 1070'CO 8.78 1.84x10' 45.2 90.4 1080 768e5Kr 807 1.69x10⁶ 4150 8310 9.97x10' 7.06x10'90Sr 9320 1.96x10³ 4.80x10' 9.59x10' 1.15x10⁶ 8.16x10⁶
CO 90Y 9320 1.96x10⁷ 4.80x10' 9.59x10' 1.15x10⁶ 8.16x101Os Rh 85.2 1.79x10⁵ 439 877 1.05x10' 74601wRu 85.2 1.79x10⁵ 439 877 1.05x10' 7460us5b 202 4.24x10⁵ 1040 2080 2.50x10⁴ 1.77x10415Te 49.4 1.04x10⁵ 254 509 6100 432013 Cs 301 6.32x10⁵ 1550 3100 3.72x10' 2.63x10'137 Cs 1.20x10' 2.52x10⁷ 6.1840' 1.24x10⁵- 1.48x10⁶ 1.05x106133 Ba 1.14x10' 2.39x10⁷ 5.87x10' 1.17x10⁵ 1.41x10⁶ 9.98405144 C 39.7 8.34x10' 204 409 4900 3470144 Pr 39.7 8.34x10' 204 409 4900 347011ftPr 0.477 1000 2.46 4.91 58.9 41.7147 Pm 2720 5.71x10⁶ 1.4040' 2.80x10' 3.36405 2.38x10⁵
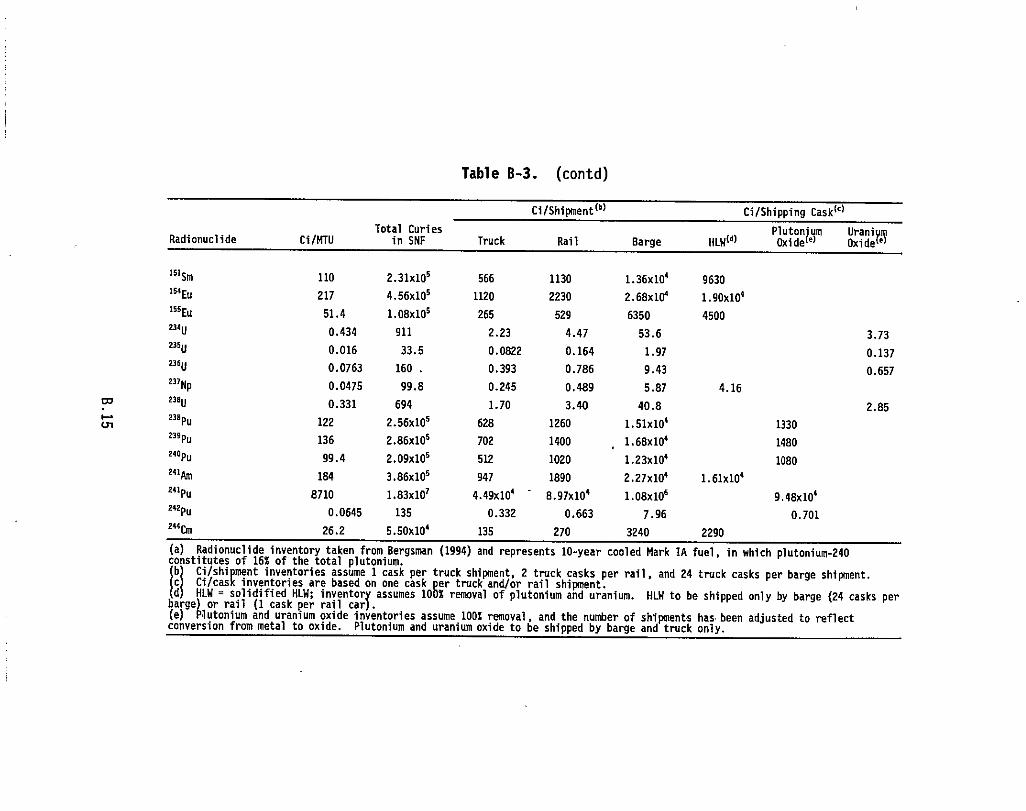
3.73
0.137
0.657
2.85
Table B-3. (contd)
Ci/Shipment(°) Ci/Shipping Cask(`)
Total Curies Pluton"um UraniRadionuclide Ci/MTU in SNF Truck Rail Barge HLW(') OxideM OxideY`T
W
43l
ISI Sm 110 2.31x10⁵ 566 1130 1.36x10⁴ 9630154 E 217 4.56x10⁵ 1120 2230 2.68x10⁴ 1.90x10°15SEu 51.4 1.08x10⁵ 265 529 6350 4500234W 0.434 911 2.23 4.47 53.62358 0.016 33.5 0.0822 0.164 1.97239U 0.0763 160 . 0.393 0.786 9.43237 N 0.0475 99.8 0.245 0.489 5.87 4.16238H 0.331 694 1.70 3.40 40.8238pu 122 2.56x10⁵ 628 1260 1.51x10⁴ 1330239pu 136 2.86x10⁵ 702 1400 1.68x10⁴ 1480240 Pu 99.4 2.09x10⁵ 512 1020 1.23x10⁴ 1080241 Am 184 3.86x10⁵ 947 1890 2.27x10⁴ 1.61x104241 Pu 8710 1.83x10³ 4.49x10⁴ - 8.97x10⁴ 1.08x10⁵ 9.48x104242 Pu 0.0645 135 0.332 0.663 7.96 0.701244Cm 26.2 5.5Ox104 135 270 3240 2290
(a) Radionuclide inventory taken from Bergsman (1994) and represents 10-year cooled Mark IA fuel, in which plutonium-240constitutes of 16% of the total plutonium.
large
)b) Ci/shipment inventories assume 1 cask per truck shipment, 2 truck casks per rail, and 24 truck casks per barge shipment.c Ci/cask inventories are based on one cask per truck and/or rail shipment.d HLW = solidified HLW; inventory assumes 100% removal of plutonium and uranium. HLW to be shipped only by barge (24 casks per
or rail (1 cask per rail car).(e) Plutonium and uranium oxide inventories assume 100% removal, and the number of shipments has been adjusted to reflectconversion from metal to oxide. Plutonium and uranium oxide to be shipped by barge and truck only.
too large to be transported by regular truck service). The actual number of
shipments required would depend on the number of HLW casks available or on
procurement of a sufficient number of new casks to provide for efficient
return shipment of HLW on a reasonable schedule.
The radionuclide inventories for the vitrified HLW shipments are pre-
sented in Table B-3. These inventories were calculated by dividing the total
quantity of each radionuclide shipped to the U.K. (exclusive of uranium and
plutonium) by the number of HLW casks (24) to be returned to the U.S.
The number of shipments of uranium trioxide and plutonium dioxide were
estimated using standard U.S. shipping equipment for uranium trioxide and
plutonium dioxide. The estimated quantities to be shipped include 2,600 MT
(2,360 tons) of purified uranium trioxide and 7 MT (6.5 tons) of plutonium
dioxide generated from processing the K Basins SNF. For this analysis, it was
assumed that the plutonium dioxide would be transported by truck in a Type B
package with a capacity of 35 kg/shipment (71 lb/shipment). This results in a
total of 186 caskloads of plutonium dioxide. The vehicle for transport of
plutonium dioxide was assumed to be a Safe-Secure Trailer/Armored Tractor
specifically designed for shipment of special nuclear materials within the
U.S. The uranium trioxide was assumed to be transported by truck in shipping
systems with a capacity of 10,000 kg/shipment (22,000 lb/shipment). This
would require a total of 236 caskloads of uranium trioxide. One caskload per
truck shipment for overland segments was assumed. One sea shipment of uranium
trioxide and one of plutonium dioxide were assumed to be required.
The radionuclide inventories for the plutonium dioxide and uranium tri-
oxide shipments are presented in Table B-3. The inventories were determined
by dividing the total quantities of uranium trioxide and plutonium dioxide to
be shipped to the U.K. by the respective numbers of caskloads presented above.
B.2 Routine and Accident Impact Analysis Methods and Models,
This section describes the methods used to estimate consequences of
normal and accidental exposure of individuals or populations to radioactive
materials. The RADTRAN 4 (Neuhauser and Kanipe 1992) computer codes were used
to calculate the transportation impacts, and the GENII software package
(Napier et al. 1988) was used to estimate the consequences to the maximally
exposed individuals. Nonradiological impacts from both incident-free trans-
port and accidents were also evaluated.
The output from computer codes, as total effective dose equivalent (TEDE
or dose) to the affected receptors, was then used to express the consequences
B.16
in terms of potential latent cancer fatalities (LCFs). Radiological exposures
were used to convert dose as TEDE to LCF using recommendations of the Inter-
national Commission on Radiological Protection (ICRP 1991). The conversion
factor applied to adult workers was 4 x 10 "4 LCF/rem TEDE; for the general
population, the conversion factor was 5 x 10 -4 LCF/rem TEDE. The general
population was assumed to have a higher rate of cancer induction for a given
radiation dose than healthy adult workers because of the presence of more
sensitive individuals (e.g., children) in the general population.
The estimated LCF for potential accidents was multiplied by the expected
accident frequency per year, per shipment, or for the entire duration of the
operation, to provide a point estimate of risk consistent with risks reported
in the remainder of this EIS. Incident-free transportation or normal facility
operations were assumed to occur; therefore, the cumulative risks associated
with normal operations would be identical to the predicted number of LCFs for
the duration of the operation.
Nonradiological incident-free and accident impacts were also evaluated.
Nonradiological incident-free impacts consist of fatalities from pollutants
emitted from the vehicles. Nonradiological accident impacts are the fatali-
ties resulting from potential vehicular accidents involving the shipments.
Neither of these two categories of impacts are related to the radiological
characteristics of the cargo. Hand calculations were performed using unit=
risk factors (fatalities per kilometers of travel) to derive estimates of the
nonradiological impacts. The nonradiological impacts were calculated by mul-
tiplying the unit risk factors by the total shipping distances for all of the
shipments in each shipping option. Nonradiological unit risk factors for
incident-free transport were taken from Rao et al. (1982), and for vehicular
accidents were taken from Bergsman et al. (1995) and Cashwell et al. (1986).
B.2.1 RADTRAN 4 Computer Code
The RADTRAN 4 computer code (Neuhauser and Kanipe 1992) was used to
perform the analyses of the radiological impacts of routine transport and the
population dose of accidents during transport of the waste. RADTRAN was
developed by Sandia National Laboratories (SNL) to calculate the risks assoc-
iated with the transportation of radioactive materials. The original code was
written by SNL in 1977 in association with the preparation of NUREG-0170,
Final Environmental Statement on the Transportation of Radioactive Material by
Air and Other Modes (NRC 1977). The code has since been refined and expanded
and is currently maintained by SNL under contract with DOE.
B.17
The RADTRAN 4 computer code is organized into the following seven models(Neuhauser and Kanipe 1992):
• material model
• transportation model
population distribution model
• health effects model
• accident severity and package release model
• meteorological dispersion model
• economic model.
The code uses the first three models to calculate the potential population
dose from normal, incident-free transportation and the first six models to
calculate the risk to the population from user-defined accident scenarios.
The economic model was not used in this study.
The material model defines the source as either a point source or as a
line source. For exposure distances of less than twice the package dimension,
the source is conservatively assumed to be a line source. For all other
cases, the source is modeled as a point source that emits radiation equally in
all directions.
The material model also contains a library of 59 isotopes, each of which
has 11 defining parameters that are used in the calculation of dose. The user
can add isotopes not in the RADTRAN library by creating a data table in theinput file, consisting of 11 parameters.
The transportation model allows the user to input descriptions of the
transportation route. A transportation route may be divided into links or
segments of the journey with information for each link on population density,
mode of travel (e.g., trailer truck or ship), accident rate, vehicle speed,
road type, vehicle density, and link length. Alternatively, the transporta-
tion route also can be described by aggregate route data for rural, urban, and
suburban areas. For this analysis, the aggregate route method was used for
each potential origin-destination combination.
The health effects model in RADTRAN 4 is outdated and was replaced by
hand calculations for this EIS. The health effects were determined by multi-
plying the population dose (person-rem) supplied by RADTRAN 4 by a conversion
factor.
Accident analysis in RADTRAN 4 is performed using the accident severity
and package release model. The user can define up to 20 severity categories
B.18
for three population densities (urban, suburban, and rural), each increasing
in magnitude. Eight severity categories for SNF containers that are related
to fire, puncture, crush, and immersion environments are defined in NUREG-0170
(NRC 1977). Various other studies also have been performed for small packages
(Clarke et al. 1976) and large packages (Dennis et al. 1978) that also can be
used to generate severity categories. The accident scenarios are further
defined by allowing the user to input release fractions and aerosol and
respirable fractions for each severity category. These fractions are also a
function of the physical-chemical properties of the materials being
transported.
RADTRAN 4 allows the user to choose two different methods for modeling
the atmospheric transport of radionuclides after a potential accident. The
user can either input Pasquill atmospheric-stability category data or averaged
time-integrated concentrations. In this analysis, the dispersion of radionu-
clides after a potential accident was modeled by the use of time-integrated
concentration values in downwind areas compiled from national averages by SNL.
B.2.1.1 Incident-Free Transport
The models described above are used by RADTRAN 4 to determine dose from
incident-free transportation or risk from potential accidents. The public and
worker doses calculated by RADTRAN 4 for incident-free transportation are
dependent on the type of material being transported and the transportation
index of the package or packages. The transportation index is defined in
49 CFR 173.403(bb) as the highest package dose rate in mrem/hr at a distance
of 1 m (3.3 ft) from the external surface of the package. Dose consequences
are also dependent on the size of the package that, as indicated in the mate-
rial model description, will determine whether the package is modeled as a
point source or line source for close-proximity exposures.
8.2.1.2 Analysis of Potential Accidents
The accident analysis performed in RADTRAN 4 calculates population doses
for each accident severity category using six exposure pathway models. They
include inhalation, resuspension, groundshine, cloudshine, ingestion, and
direct exposure. This RADTRAN 4 analysis assumes that any contaminated area
is either mitigated or public-access-controlled-so the dose via the ingestion
pathway equals zero. The consequences calculated for each severity category
are multiplied by the appropriate frequencies for accidents in each category
and summed to give a total point estimate of risk for a radiological accident.
B.19
B.2.2 GENII Description
GENII (Napier et al. 1988), which is also referred to as the Hanford
Environmental Dosimetry Software System, was developed and written by the
Pacific Northwest Laboratory to analyze radiological releases to the environ-
ment. GENII is composed of seven linked computer programs and their associ-
ated data libraries. This includes user interface programs, internal and
external dose factor generators, and the environmental dosimetry programs.
GENII is capable of calculating
doses resulting from acute or chronic releases, including options
for annual dose, committed dose, and accumulated dose
doses from various exposure pathways evaluated including direct
exposure via water, soil, and air as well as inhalation and
ingestion pathways
acute and chronic elevated and ground level releases to air
acute and chronic releases to water
• initial contamination of soil or surfaces
• radionuclide decay.
The pathways considered in this analysis include inhalation, submersion, and
external exposures caused by ground contamination.
B.3 Results of Incident-Free Transportation Impact Analysis
This section discusses the radiological and nonradiological impacts to
the transportation crew and the public during incident-free or routine trans-
portation activities for each of the SNF management alternatives and shipping
options. The key input parameters for the RADTRAN 4 computer code that were
used to perform the incident-free transportation impact calculations for the
onsite alternatives are provided in Table B-4. The key input parameters for
the foreign processing alternatives are discussed later in this section.
Following that discussion, separate subsections are provided below for the
results of the radiological and nonradiological impact calculations.
B.20
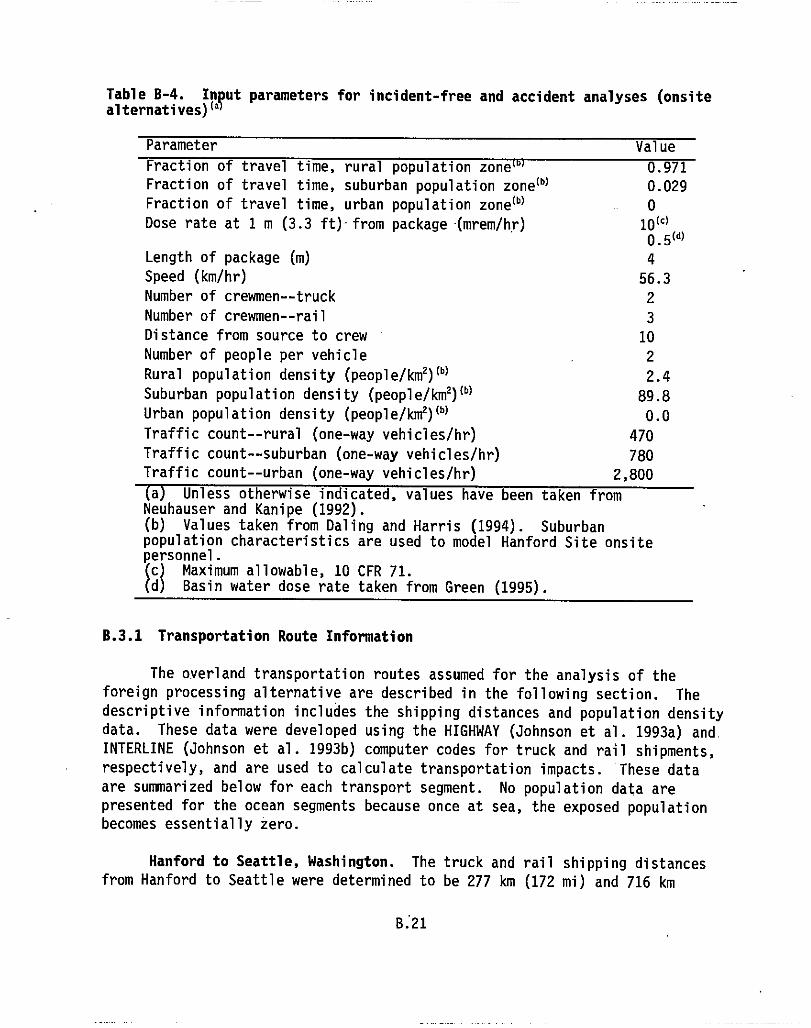
Table B-4. Input parameters for incident-free and accident analyses (onsiteal ternati ves) (a)
Parameter Value
Fraction of travel time, rural population zone 0.971Fraction of travel time, suburban population zone (b)
0.029
Fraction of travel time, urban population zone (b)0
Dose rate at 1 m (3.3 ft)-from package (mrem/hr)1O(`5(a)
Length of package (m) 4Speed (km/hr) 56.3Number of crewmen--truck 2
Number of crewmen--rail 3
Distance from source to crew 10Number of people per vehicle 2Rural population density (people/km') (b) 2.4
Suburban population density (people/km') (') 89.8Urban population density (people/kmz) (b) 0.0
Traffic count--rural (one-way vehicles/hr) 470
Traffic count--suburban (one-way vehicles/hr) 780Traffic count--urban (one-way vehicles/hr) 2,800
a Unless otherwise indicated, values have been taken fromNeuhauser and Kanipe (1992).(b) Values taken from Daling and Harris (1994). Suburbanpopulation characteristics are used to model Hanford Site onsitepersonnel.(c) Maximum allowable, 10 CFR 71.(d) Basin water dose rate ta ken from Green (1995).
B.3.1 Transportation Route Information
The overland transportation routes assumed for the analysis of the
foreign processing alternative are described in the following section. The
descriptive information includes the shipping distances and population density
data. These data were developed using the HIGHWAY (Johnson et al. 1993a) and.
INTERLINE (Johnson et al. 1993b) computer codes for truck and rail shipments,
respectively, and are used to calculate transportation impacts. These data
are summarized below for each transport segment. No population data are
presented for the ocean segments because once at sea, the exposed population
becomes essentially zero.
Hanford to Seattle, Washington. The truck and rail shipping distances
from Hanford to Seattle were determined to be 277 km (172 mi) and 716 km
B.21
(445 mi), respectively. The large difference in shipping distance arises from
the fact that the rail route is not a direct link to Seattle, but travels
fromHanford to Vancouver, Washington, and then to Seattle. For the highway
route, the shipment travels through 88.1% rural areas (weighted population
density 4.5 persons/km'), 10% in suburban areas (359 persons/km') and 1.9% in
urban population zones (1,870 persons/km'). The rail route travels through
74.1% rural areas (9.8 persons/kmZ), 19% in suburban zones (415.5 per-
sons/km2), and 6.9% in urban areas (2,226 persons/km?).
Hanford to Norfolk, Virginia. The truck and rail shipping distances
from Hanford to Norfolk were determined to be 4,585 km (2,849 mi) and 4,984 km
(3,097 mi), respectively. For the highway route, the shipment travels through
84.5% rural areas (7.3 persons/IoW), 13.4% in suburban areas (365 per-
sons/kmZ), and 2.1% in urban population zones (2,299 persons/km Z). The rail
route travels through 83% rural areas (7.8 persons/km), 14.5% in suburban
zones (360.4 persons/kmZ), and 2.4% in urban areas (2,149 persons/kmZ).
Hanford to Portland, Oregon. The only option evaluated for using the
Port of Portland was to barge the SNF to Portland, where it would be trans-
loaded onto the ship. The distance and population density information for
this shipment was approximated using INTERLINE (Johnson et al. 1993b), which
evaluates potential rail routes, because the rail lines closely follow the
Columbia River in which the barge would be operating. Consequently, the route
data for a barge shipment would be similar to that for a rail shipment. Therail data are thought to be more conservative than actual barge data because
the rail lines pass closer to the city centers along the river than would a
barge does.
Dose rates emitted by the shipping casks are important input parameters.
RADTRAN 4 uses the dose rate at 1 m or 3.3 ft (referred to as the transporta-
tion index) in calculating dose to the public and worker. All of the SNF and
HLW shipments in this analysis were assumed to be at the regulatory maximum
dose rate, which is 10 mrem/hr at a distance of 2 m (6.6 ft) from the cask
surface. This would be equivalent to a transportation index of 13 (or a dose
rate of 13 mrem/hr at 1 m or 3.3 ft from the surface). Although it is likely
that many of these shipments will have significantly smaller transportation
index values, the use of the regulatory maximum value is bounding because it
cannot be exceeded.
Because shipments of plutonium dioxide and uranium trioxide would have
much smaller dose rates than SNF or HLW, preliminary shielding calculations
were performed to derive more realistic values. The computer code MICROSHIELD
(Grove Engineering 1988) was used to perform these calculations. Both types
B.22
of shipments were modeled as cylindrical sources with cylindrical shields.
The parameters used in these calculations are shown as follows:
• Plutonium dioxide: The plutonium source was assumed to be 12.7 cm(5 in.) in diameter and 127 cm (50 in.) in length. Shielding wasassumed to beprovided by a 1-cm-thick (0.4-in.-thick) steel shield andan 8-cm (3-in. thickness of solid hydrogenous material. The sourceinventory was the same as that shown in Table B-3.
• Uranium trioxide: The uranium source was modeled as a single large con-tainer although the shipment will most likely be composed of severalsmaller containers. The source dimensions were assumed to be 114 cm(45 in.) in diameter and 370 cm (146 in.) in length. The source wasassumed to be surrounded by a 1-cm-thick (0.4-in.-thick) steel cylinderand a 3-cm-thick (1.2-in.-thick) shield of solid hydrogenous material.The source inventory was shown in Table B-3.
The dose rate at 1 m (3.3 ft) from the surface of the plutonium dioxide
shipment was calculated to be 0.019 mrem/hr. Because this was increased by a
factor of five to provide a bounding estimate, the transportation index value
for these shipments was set to 0.1 mrem/hr. The dose rate for the uranium
trioxide shipments was calculated to be 0.0049 mrem/hr. This was also
increased by a factor of five to 0.025 mrem/hr for conservatism.
Table B-5 is a list of input parameters that are used by RADTRAN 4 in'
the calculation of population dose for incident-free transportation. Many of
the parameters are default values in the RADTRAN 4 code. Those that are notdefault values are identified and their sources are provided in footnotes to
the table.
The potential receptors include workers and the general public. Worker
doses include those received by the truck, rail, or barge crew and package
handlers aboard the barge. Although RADTRAN models package handlers as per-
sons who handle packages during intermediate stops, the routine doses to this
group were assumed to apply to personnel who inspect the shipping containers
aboard the barge. The equations used to calculate these doses assume that a
five-person team spends approximately 0.5 hr per handling operation (or per
inspection tour of the shipping casks). Although not exact, this is believed
to be a reasonable approximation.
Public doses include doses to persons on the highway or railway (this
category is not applicable to barge shipments as indicated in the RADTRAN
documentation); doses to persons who reside near the highway, railway, or
river; and doses at stops (for barge transport, this was assumed to include
B.23
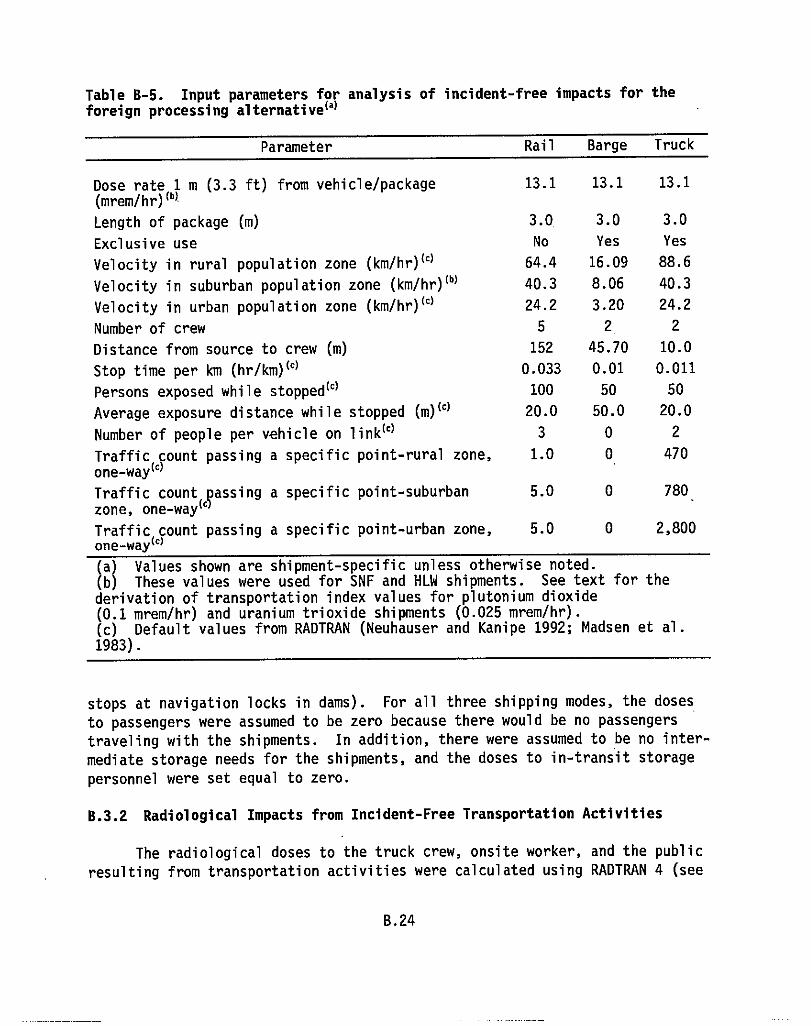
Table B-5. Input parameters for analysis of incident-free impacts for theforeign processing alternative(a)
Parameter Rail Barge Truck
Dose rate 1 m (3.3 ft) from vehicle/package 13.1 13.1 13.1
(mrem/hr) ('^
Length of package (m) 3.0 3.0 3.0
Exclusive use No Yes Yes
Velocity in rural population zone (km/hr) (`) 64.4 16.09 88.6
Velocity in suburban population zone (km/hr) ( ') 40.3 8.06 40.3
Velocity in urban population zone (km/hr) l`) 24.2 3.20 24.2
Number of crew 5 2 2
Distance from source to crew (m) 152 45.70 10.0
Stop time per km (hr/km) (`) 0.033 0.01 0.011
Persons exposed while stopped (`) 100 50 50
Average exposure distance while stopped (m) (`) 20.0 50.0 20.0
Number of people per vehicle on link (`) 3 0 2
Traffic count passing a specific point-rural zone, 1.0 0 470
one-way(`)
Traffic count 4assing a specific point-suburban 5.0 0 780_
zone, one-way s°
Traffic count passing a specific point-urban zone, 5.0 0 2,800one-way(`)
(a) Values shown are shipment-specific unless otherwise noted.(b) These values were used for SNF and HLW shipments. See text for thederivation of transportation index values for plutonium dioxide(0.1 mrem/hr) and uranium trioxide shipments (0.025 mrem/hr).(c) Default values from RADTRAN (Neuhauser and Kanipe 1992; Madsen et al.1983).
stops at navigation locks in dams). For all three shipping modes, the doses
to passengers were assumed to be zero because there would be no passengers
traveling with the shipments. In addition, there were assumed to be no inter-
mediate storage needs for the shipments, and the doses to in-transit storage
personnel were set equal to zero.
B.3.2 Radiological Impacts from Incident-Free Transportation Activities
The radiological doses to the truck crew, onsite worker, and the public
resulting from transportation activities were calculated using RADTRAN 4 (see
B.24
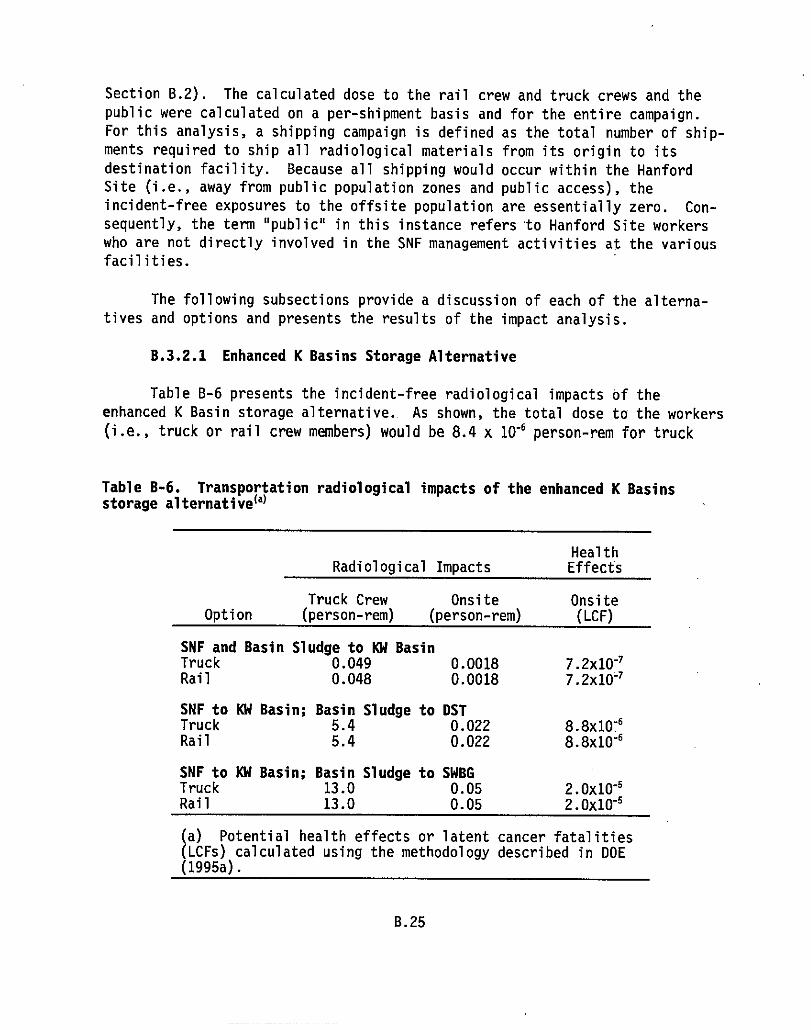
Section B.2). The calculated dose to the rail crew and truck crews and the
public were calculated on a per-shipment basis and for the entire campaign.
For this analysis, a shipping campaign is defined as the total number of ship-
ments required to ship all radiological materials from its origin to its
destination facility. Because all shipping would occur within the Hanford
Site (i.e., away from public population zones and public access), the
incident-free exposures to the offsite population are essentially zero. Con-
sequently, the term "public" in this instance refers to Hanford Site workers
who are not directly involved in the SNF management activities at the various
facilities.
The following subsections provide a discussion of each of the alterna-
tives and options and presents the results of the impact analysis.
8.3.2.1 Enhanced K Basins Storage Alternative
Table B-6 presents the incident-free radiological impacts of the
enhanced K Basin storage alternative. As shown, the total dose to the workers
(i.e., truck or rail crew members) would be 8.4 x 10"6 person-rem for truck
Table B-6. Transportation radiological impacts of the enhanced K Basinsstorage alternative(a)
Option
Radiological Impacts
Truck Crew Onsite(person-rem) (person-rem)
HealthEffects
Onsite(LCF)
SNF and Basin Sludge to KW BasinTruck 0.049 0.0018 7.2x10-'Rail 0.048 0.0018 7.2x10"'
SNF to KW Basin; Basin Sludge to DSTTruck 5.4 0.022 8.8x10'6Rail 5.4 0.022 8.8x10"6
SNF to KW Basin; Basin Sludge to SWBGTruck 13.0 0.05 2.0x10"6Rail 13.0 0.05 2.0x10⁻⁶
(a) Potential health effects or latent cancer fatalities(LCFs) calculated using the methodology described in DOE(1995a).
B.25
shipments and 3.6 x 10⁻⁶ person-rem for rail shipments, assuming the basin
sludge were designated SNF. The total dose to the workers, assuming the basin
sludge were shipped to the AW DST farm would be 0.0019 person-rem and
0.0019 person-rem, for truck and rail shipments, respectively. The total dose
to the workers, assuming the basin sludge were shipped to the SWBG, would be
0.0030 person-rem for truck shipments and rail shipments. The total dose,
truck crew plus onsite individuals, would be 8.4 x 10 "6 person-rem if the
basin sludge were designated SNF;'0.0019 person-rem if the basin sludge were
shipped to the AW DST farm; and 0.0030 person-rem if the sludge were shipped
to the SWBG. The total dose, rail crew plus onsite individuals, would be -
3.6 x 10⁻⁶ person-rem, 0.0019 person-rem, and 0.0030 person-rem, for these
options, respectively.
The potential health effects or LCFs were calculated using the method-
ology described in ICRP (1991), i.e., 4.0 x 10 -4 LCFs/person-rem each to the
onsite workers and truck crew. The health effects for truck crews were esti-
mated to be 3.4 x 10"' (sludge as SNF), 7.6 x 10' (sludge to DST), and
1.2 x 10⁻⁶ (sludge to SWBG). The annual health effects for onsite workers
were estimated to be less than 6.0 x 10 -', or essentially zero.
8.3.2.2 New Wet Storage
As shown in Table B-7, the total dose (reference site dose estimates are
shown first followed by the Canister Storage Building dose estimates inparentheses) to the workers in the new wet storage alternative (i.e., truck orrail crew members) would be 1.7 x 10' (2.0 x 10 -') person-rem for truck ship-
ments and 9.7 x 10⁻⁶ (7.0 x 10' 5) person-rem for rail shipments, assuming the
basin sludge were designated SNF. The total dose to the workers, assuming
the basin sludge were shipped to the AW DST farm, would be 0.0020 (0.0020)
person-rem and 0.0019 (0.0020) person-rem for truck and rail shipments,
respectively. The total dose to the workers, assuming the basin sludge were
shipped to the SWBG, would be 0.0031 (0.0031) person-rem for truck shipments
and 0.0030 (0.0031) person-rem for rail shipments. The total dose, truck crew
plus onsite individuals, would be 1.7 x 10 -' (2.0 x 10"4) person-rem if the
sludge were SNF, 0.0020 (0.0020) person-rem if the sludge went to a DST, and
0.0031 (0.0031) person-rem if the sludge went to the SWBG. The total dose,
rail crew plus onsite individuals, would be 1.0 x 10 -5 (7.1 x 10"5) person-rem,
0.0019 (0.0020) person-rem, and 0.0030 (0.0031) person-rem, for these options,
respectively.
The potential health effects or LCFs were calculated for truck crews to
be 6.7 x 10"8 (8.0 x 10"8) LCFs (sludge as SNF), 8.0 x 10"' (8.1 x 10 -') LCFs
B.26
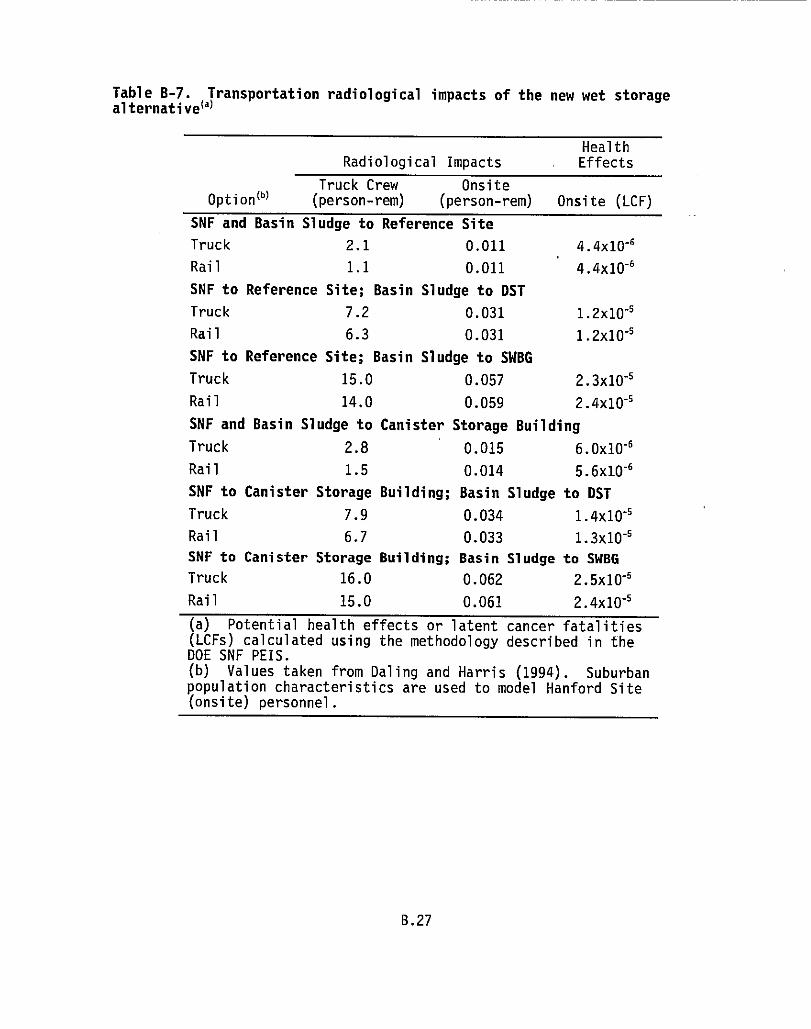
Table B-7. Transportation radiological impacts of the new wet storagealternative (a)
HealthRadiological Impacts Effects
Truck Crew OnsiteOption (b)
(person-rem) (person-rem) Onsite (LCF)
SNF and Basin Sludge to Reference Site
Truck 2.1 0.011 4.4x10⁻⁶
Rail 1.1 0.011 4.4x10⁻⁶
SNF to Reference Site; Basin Sludge to DST
Truck 7.2 0.031 1.2x10"5
Rail 6.3 0.031 1.2x10⁻⁵
SNF to Reference Site; Basin Sludge to SWBG
Truck 15.0 0.057 2.3x10'5
Rail 14.0 0.059 2.4x10⁻⁵
SNF and Basin Sludge to Canister Storage Building
Truck 2.8 0.015 6.0x10⁻⁶
Rail 1.5 0.014 5.6x10⁻⁶
SNF to Canister Storage Building; Basin Sludge to DST
Truck 7.9 0.034 1.4x10'5
Rail 6.7 0.033 1.3x10⁻⁵
SNF to Canister Storage Building; Basin Sludge to SWBG
Truck 16.0 0.062 2.5x10⁻⁵
Rail 15.0 0.061 2.4x10"5
(a) Potential health effects or latent cancer fatalities(LCFs) calculated using the methodology described in theDOE SNF PEIS.(b) Values taken from Daling and Harris (1994). Suburbanpopulation characteristics are used to model Hanford Site(onsite) personnel.
B.27
(sludge to DST) and 1.2 x 10'6 (1.2 x 10⁻⁶) LCFs (sludge to SWBG. The health
effects for the onsite worker were estimated to be less than 6.0 x 10'' LCFs,
or essentially zero.
8.3.2.3 New Dry Storage
The results and input parameters associated with this alternative have
been separated into two categories. The first category, "spent nuclear fuel -
as is," is similar to wet storage; thus, the radiological impacts are the same
as discussed in Section B.3, under "New Wet Storage." The second category,
"spent nuclear fuel - repackaged," as discussed in Sections B.1.3, is signifi-
cantly different. The results for the second category of impacts are
discussed in this section.
As can be seen in Table B-8, the total dose (reference site dose esti-
mates are shown first followed by the Canister Storage Building dose estimates
in parenthesis) to the workers (i.e., truck or rail crew members) for the
repackaged SNF would be 2.4 x 10' 4 (2.8 x 10'4) person-rem for truck shipments
and 5.9 x 10⁻⁵ (7.9 x 10'5) person-rem for rail, assuming the repackaged SNF,canister sludge, and basin sludge are transported to the reference site (or
Canister Storage Building). The dose to crew members would be 0.0021 and
0.0020 person-rem for truck and rail shipments, respectively, assuming the
basin sludge were shipped to the AW DST farm for each of the repackaged SNF
destinations (reference site or Canister Storage Building). The total dose to
the workers for each of the SNF destinations, assuming the basin sludge were
shipped to the SWBG, would be 0.0032 person-rem for truck shipments and 0.0031
person-rem for rail shipments.
The worst case potential health effects or LCFs calculated for truck and
rail crews were estimated to be 1.3 x 10 -6 LCFs (sludge to DST), and 1.2 x 10 -6
(sludge to SWBG), respectively. The annual health effects for the onsite
worker were estimated to be less than 6.0 x 10⁻⁹ LCFs and thus are considered
zero.
8.3.2.4 Foreign Processing
The following sections describe expected radiological consequences to
workers and the public during transportation in the support of the foreign
processing alternative.
B.28
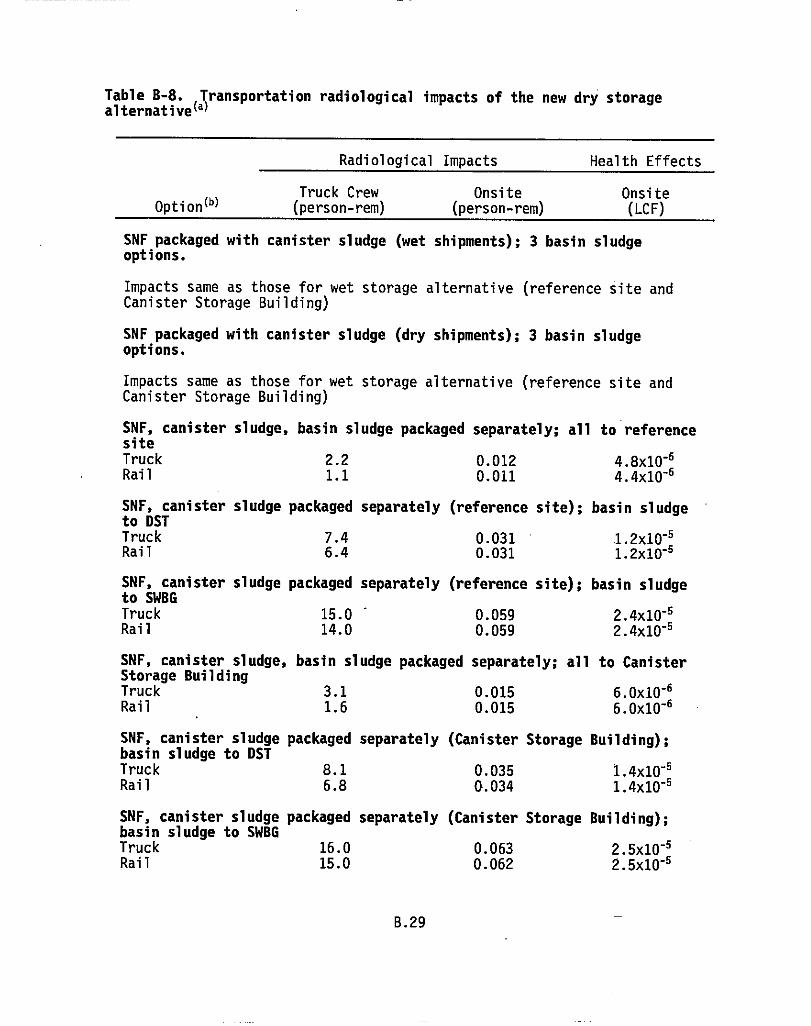
Table B-8. Transportation radiological impacts of the new dry storagealternative(a)
Radiological Impacts Health Effects
Truck Crew Onsite OnsiteOption (b)(person-rem) (person-rem) (LCF)
SNF packaged with canister sludge (wet shipments); 3 basin sludgeoptions.
Impacts same as those for wet storage alternative (reference site andCanister Storage Building)
SNF packaged with canister sludge (dry shipments); 3 basin sludgeoptions.
Impacts same as those for wet storage alternative (reference site andCanister Storage Building)
SNF, canister sludge, basin sludge packaged separately; all to referencesiteTruck 2.2 0.012 4.8x10⁻⁶Rail 1.1 0.011 4.4x10'6
SNF, canister sludge packaged separately (reference site); basin sludgeto DSTTruck 7.4 0.031 1.2x10
-6
Rail 6.4 0.031 1.2x10"5
SNF, canister sludge packaged separately (reference site); basin sludgeto SWBGTruck 15.0 0.059 2.4x10 "6
Rail 14.0 0.059 2.410 "5
SNF, canister sludge, basin sludge packaged separately; all to CanisterStorage BuildingTruck 3.1 0.015 6.0x10"6Rail 1.6 0.015 6.0x10⁻⁶
SNF, canister sludge packaged separately (Canister Storage Building);basin sludge to DSTTruck 8.1 0.035 1.4x10 "5
Rail 6.8 4.034 1.4x10 "5
SNF, canister sludge packaged separately (Canister Storage Building);basin sludge to SWBGTruck 16.0 0.063 2.5x10 "5
Rail 15.0 0.062 2.5x10⁻⁵
B.29
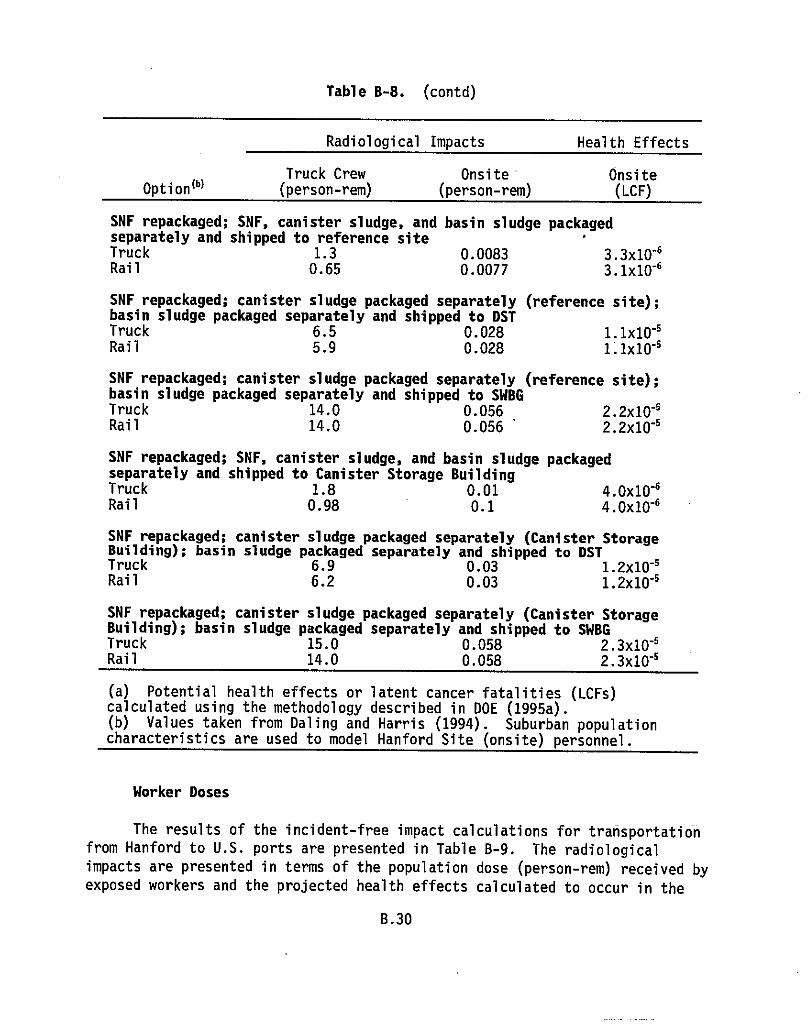
Table B-8. (contd)
Radiological Impacts Health Effects
Truck Crew Onsite OnsiteOption
(b) (person-rem) (person-rem) (LCF)
SNF repackaged; SNF, canister sludge, and basin sludge packagedseparately and shipped to reference siteTruck 1.3 0.0083 3.3x10 "6
Rail 0.65 0.0077 3.1x10 -6
SNF repackaged; canister sludge packaged separately (reference site);basin sludge packaged separately and shipped to DSTTruck 6.5 0.028 1.1x10"5Rail 5.9 0.028 1.1x10"5
SNF repackaged; canister sludge packaged separately (reference site);basin sludge packaged separately and shipped to SWBGTruck 14.0 0.056 2.2x10"5Rail 14.0 0.056 2.2x10"5
SNF repackaged; SNF, canister sludge, and basin sludge packagedseparately and shipped to Canister Storage BuildingTruck 1.8 0.01 4.0x10
"6
Rail 0.98 0.1 4.Ox10-6
SNF repackaged; canister sludge packaged separately (Canister StorageBuilding); basin sludge packaged separately and shipped to DSTTruck 6.9 0.03 1.2x10⁻⁵Rail 6.2 0.03 1.2x10"5
SNF repackaged; canister sludge packaged separately (Canister StorageBuilding); basin sludge packaged separately and shipped to SWBGTruck 15.0 0.058 2.3x10"5Rail 14.0 0.058 2.3x10'5
(a) Potential health effects or latent cancer fatalities (LCFs)calculated using the methodology described in DOE (1995a).(b) Values taken from Daling and Harris (1994). Suburban populationcharacteristics are used to model Hanford Site (onsite) personnel.
Worker Doses
The results of the incident-free impact calculations for transportation
from Hanford to U.S. ports are presented in Table B-9. The radiological
impacts are presented in terms of the population dose (person-rem) received by
exposed workers and the projected health effects calculated to occur in the
B.30
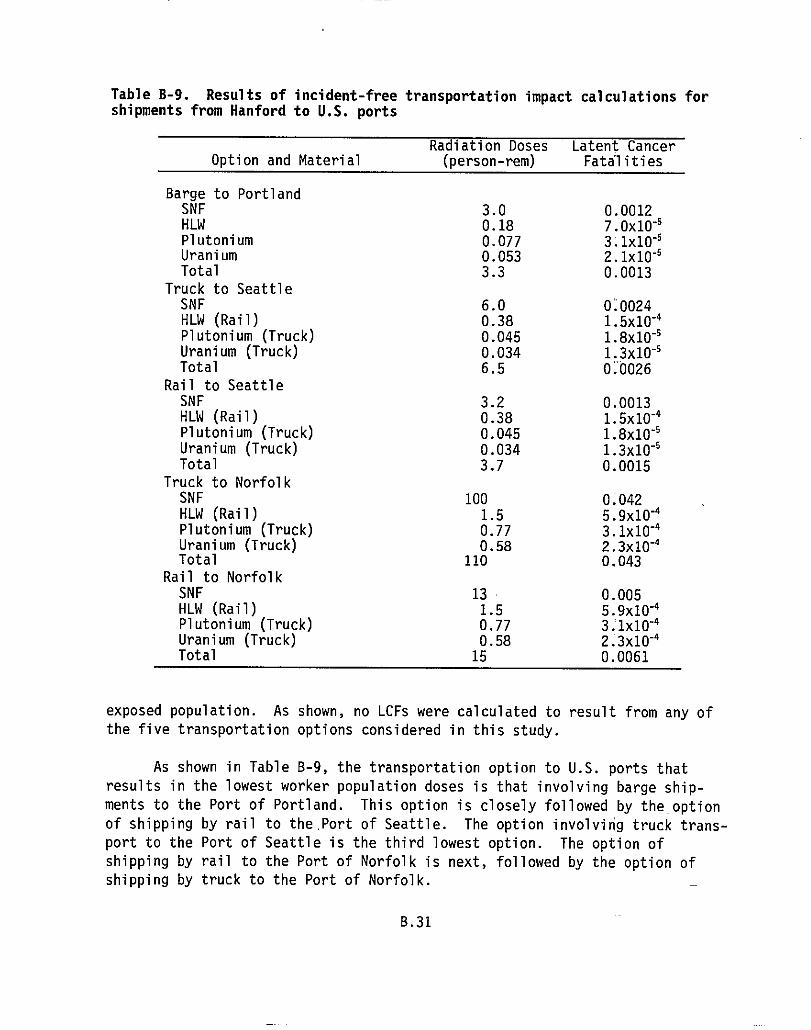
Table B-9. Results of incident-free transportation impact calculations forshipments from Hanford to U.S. ports
Option and MaterialRadiation Doses(person-rem)
Latent CancerFatalities
Barge to PortlandSNF 3.0 0.0012HLW 0.18 7.0x10"5Plutonium 0.077 3:1x10'5Uranium 0.053 2.1x10⁻⁵Total 3.3 0.0013
Truck to SeattleSNF 6.0 0.0024HLW (Rail) 0.38 1.5x10 "4
Plutonium (Truck) 0.045 1.8x10⁻⁵Uranium (Truck) 0.034 1.3x10⁻⁵Total 6.5 0.0026
Rail to SeattleSNF 3.2 0.0013HLW (Rail) 0.38 1.5x10 -4
Plutonium (Truck) 0.045 1.8x10"5Uranium (Truck) 0.034 1.3x10⁻⁵Total 3.7 0.0015
Truck to NorfolkSNF 100 0.042HLW (Rail) 1.5 5.9x10
"4
Plutonium (Truck) 0.77 3.1x10⁻⁴Uranium (Truck) 0.58 2.3x10⁻⁴Total 110 0.043
Rail to NorfolkSNF 13 0.005HLW (Rail) 1.5 5.9x10 -4
Plutonium (Truck) 0.77 3:1x10 "4
Uranium (Truck) 0.58 2.3x10 -4
Total 15 0.0061
exposed population. As shown, no LCFs were calculated to result from any of
the five transportation options considered in this study.
As shown in Table B-9, the transportation option to U.S. ports that
results in the lowest worker population doses is that involving barge ship-
ments to the Port of Portland. This option is closely followed by the option
of shipping by rail to the.Port of Seattle. The option involving truck trans-
port to the Port of Seattle is the third lowest option. The option of
shipping by rail to the Port of Norfolk is next, followed by the option of
shipping by truck to the Port of Norfolk.
B.31
In general, the shipments of N Reactor SNF to the U.K. would produce the
highest doses of all the materials. This is attributed primarily to the
higher number of N Reactor SNF shipments than the other materials. Also, it
can be seen that rail shipments generally result in lower worker doses than
truck shipments. This is because the exposure distances between the source
and crew are much longer for rail shipments than for truck shipments.
Similarly, the crew doses for rail and barge shipments are approximately
comparable.
Maximum individual doses to workers from incident-free transport were
calculated using the RISKIND computer code. The maximally exposed workers for
truck shipments were found to be the truck drivers (two-person crew), who were
assumed to drive shipments for up to 2,000 hr/year. The maximally exposed
worker for rail shipments was a transportation worker in a rail yard who spent
a time- and distance-weighted average of 0.16 hr inspecting, classifying, and
repairing railcars and was assumed to be present for all of the radioactive
shipments.
The maximum incident-free exposure calculations for workers were per-
formed for each shipping option. The results are 1.46 person-rem for the
barge-to-Portland option, 2.0 person-rem for the option of shipping to Seattle
by truck, 1.03 person-rem for the option of shipping to Seattle by rail,
35.3 person-rem for the option of shipping to Norfolk by truck, and 17.9 per-
son-rem for the option of shipping to Norfolk by rail.
Consequences to workers during handling and loading activities in ports
are based on commercial experience during the last three quarters of 1994.
Over this period, workers handled two shipments consisting of 16 loaded casks,
and 1 shipment consisting of 5 empty casks. The collective dose to the
30 workers involved was 0.024 person-rem, with the maximum individual receiv-
ing 0.016 rem. Assuming that handling of the empty casks did not contribute
measurably to that total, the expected collective dose from handling a single
loaded cask is estimated to be on the order of 0.001 rem to the maximally
exposed worker and 0.0015 person-rem total to all workers. The consequences
for loading and unloading of 408 casks during shipment from the U.S. to the
U.K. would therefore be approximately 1.2 person-rem to all workers over the
expected 5-year campaign. Accounting for an additional two handling activi-
ties per cask at the Hanford Site and at the U.K. process facility would
roughly double that estimate, resulting in a collective dose of 2.4 person-rem
and a potential for 9.8 x 10 -4 LCF for all shipments. The maximum dose to an
individual worker, assuming that worker were involved in handling all
408 casks at one point in the shipping sequence, would be on the order of
0.4 rem over 5 years.
B.32
The primary impact of routine marine transport of SNF is potential
radiological exposure to crew members of the ships used to carry the casks.
Members of the general public and marine life would not receive any measurable
dose from the SNF during incident-free marine transport of the casks. While
at sea, the crew dose would be limited to those individuals who might enter
the ship's hold during transit and receive external radiation near the
packaged SNF. At all other times, the crew would be shielded from the casks
by the decking and other structures of the vessel. The number of entries and
inspections would be a function of the transit time from the port of loading
to the port of off-loading.
External radiation from an intact shipping package must be less than
specified limits that control the exposure of the handling personnel and
general public. These limits are established in 49 CFR 173. The limit ofinterest is a 10-mrem/hr dose rate at any point 2 m (6.6 ft) from the outer
surfaces of the transport cask. This limit applies to exclusive-use
shipments, i.e., a shipment in which no other cargo is loaded on the platform
used for the transportation casks, not that the ship is an exclusive-use
vessel, although this would not be a limitation for the commercial special-
purpose ships assumed for this analysis.
The external dose rates at the outside of the transport casks are
anticipated to be much less than the regulatory limits. It was estimated that
the N Reactor SNF considered in this analysis would fall within the design
envelope of the internationally licensed casks routinely used by the U.K.
facility for SNF transport"(BNFL 1994). However, estimates of dose during
normal transportation have been made assuming dose rates at the regulatory
limits, using analyses performed for transport of foreign research reactor SNF
as a basis (DOE 1995b). These analyses may be used to develop an upper bound
of the doses anticipated to be received by ships crews during transport of the
N Reactor SNF. Actual doses would be expected to be lower than these
estimates.
Bounding Dose Calculations. Calculations performed to estimate boundingradiation doses during routine cask inspections aboard ship (DOE 1995b) pro-
vided information from which an inspection dose factor (IDF) could be deter-
mined of 6 x 10⁻⁵ rem/min/cask/day/person, based on an average distance of
5.5 m (18 ft).- Because the ship crews are highly trained and the ships are
designed for SNF transport, it was assumed that inspection of each of the
eight holds on the ship (each containing three casks) would take no longer
than 15 min, or an average of 5 min per cask for the total 24 casks. The
B.33
total inspection time per day would be 2 hr. If an inspection crew were
assumed to consist of two members of the ship's crew, the bounding dose per
daily inspection would be
6 x 10"5 (IDF) x 5 min x 24 casks = 0.007 rem/person/day (1)
Assuming a travel time from an eastern U.S. port of 10 days, the esti-
mated maximum dose received by each member of a two-person inspection crew
would be 0.07 rem. This value would not exceed the 0.1-rem dose limit for a
member of the general public. The transit time for a shipment originating on
the West Coast of the U.S. could be up to five times longer, resulting in a
dose per shipment of 0.35 rem. This value would exceed the 0.1-rem dose limit
for a member of the general public. However, because the ship's crews are
trained and issued dosimeters, it is presumed that they would be considered
radiation workers. Although it is not clear at this time if radiation expos-
ure of the ship's crew would fall under the jurisdiction of the U.K. or U.S.
radiation protection standards, these standards are identical for both coun-
tries (5 rem/year, with an administrative control level of 2 rem/year).
Therefore, the maximum possible dose received by individual workers during
ocean transit would be well within the limits of the U.S.. and U.K. radiation
protection standards for workers.
Complete transport of the SNF to the U.K. for processing would require
17 shipments of 24 casks. The collective dose to crew members responsible for
conducting inspections on the transport ships during fuel transport from theU.S. East Coast would be
(0.007 rem/person/day) x 2 persons x
(10 days/trip) x 17 trips = 2.4 person-rem (2)
Based on this bounding estimate of the collective dose to the ship's
crew for transportation of the SNF, an upper limit of approximately 0.001 LCF
would be expected among the ship's crew from exposure to external radiation
from the SNF transport casks. If all shipments originated at a western U.S.
port, the collective dose could be up to 12 person-rem with a corresponding
consequence of 0.005 LCF.
As a bounding estimate, the same number of return shipments and similar
external dose rates, at the regulatory limit, were assumed for high level
waste, plutonium dioxide and uranium trioxide. Under those circumstances, an
upper limit of 0.01 LCF would be expected among the ships' crews from exposure
to the external radiation during all shipments.
B.34
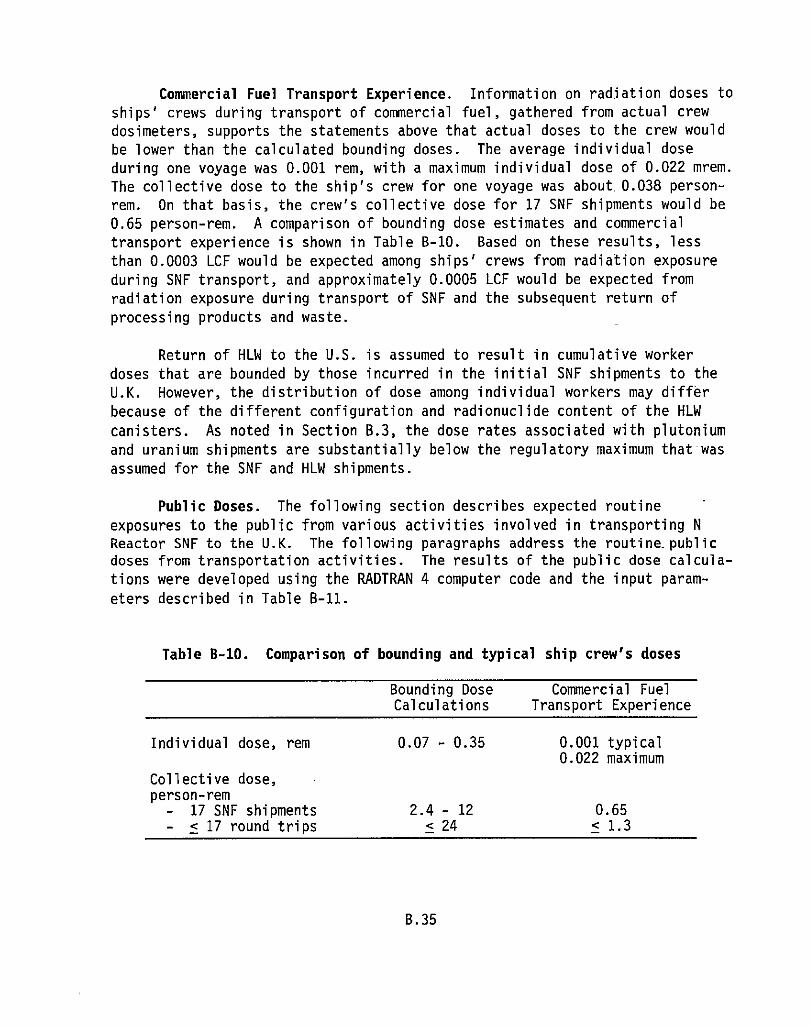
Commercial Fuel Transport Experience. Information on radiation doses tc
ships' crews during transport of commercial fuel, gathered from actual crew
dosimeters, supports the statements above that actual doses to the crew would
be lower than the calculated bounding doses. The average individual dose
during one voyage was 0.001 rem, with a maximum individual dose of 0.022 mrem.
The collective dose to the ship's crew for one voyage was about.0.038 person-
rem. On that basis, the crew's collective dose for 17 SNF shipments would be
0.65 person-rem. A comparison of bounding dose estimates and commercial
transport experience is shown in Table B-10. Based on these results, less
than 0.0003 LCF would be expected among ships' crews from radiation exposure
during SNF transport, and approximately 0.0005 LCF would be expected from
radiation exposure during transport of SNF and the subsequent return of
processing products and waste.
Return of HLW to the U.S. is assumed to result in cumulative worker
doses that are bounded by those incurred in the initial SNF shipments to the
U.K. However, the distribution of dose among individual workers may differ
because of the different configuration and radionuclide content of the HLW
canisters. As noted in Section B.3, the dose rates associated with plutonium
and uranium shipments are substantially below the regulatory maximum that was
assumed for the SNF and HLW shipments.
Public Doses. The following section describes expected routine
exposures to the public from various activities involved in transporting NReactor SNF to the U.K. The following paragraphs address the routine publicdoses from transportation activities. The results of the public dose calcula-
tions were developed using the RADTRAN 4 computer code and the input param-
eters described in Table B-11.
Table B-10. Comparison of bounding and typical ship crew's doses
Bounding Dose Commercial FuelCalculations Transport Experience
Individual dose, rem
Collective dose,person-rem- 17 SNF shipments- < 17 round trips
0.07 - 0.35
2.4 - 12< 24
0.001 typical0.022 maximum
0.65< 1.3
B.35
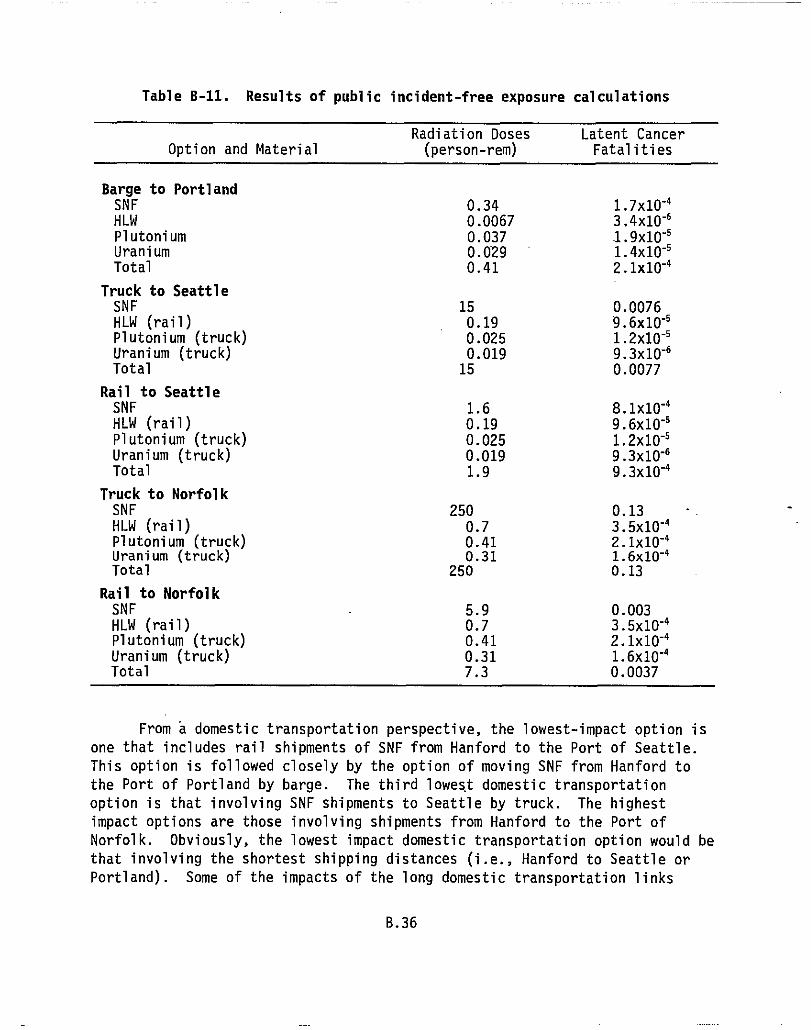
Table B-11. Results of public incident-free exposure calculations
Radiation Doses Latent CancerOption and Material (person-rem) Fatalities
Barge to PortlandSNF 0.34 .1.7x10"'HLW 0.0067 3.4x10⁻⁶Plutonium 0.037 1.9x10"6Uranium 0.029 1.4x10.5Total 0.41 2.1x10-'
Truck to SeattleSNF 15 0.0076HLW (rail) 0.19 9.6x10"5Plutonium (truck) 0.025 1.2x10⁻⁵Uranium (truck) 0.019 9.3x10⁻⁶Total 15 0.0077
Rail to SeattleSNF 1.6 8.1x10"'HLW (rail) 0.19 9.6x10"6Plutonium (truck) 0.025 1.2x10.5Uranium (truck) 0.019 9.3x10"6Total 1.9 9.3x10-'
Truck to NorfolkSNF 250 0.13HLW (rail) 0.7 3.5x10-'Plutonium (truck) 0.41 2.1x10-'Uranium (truck) 0.31 1.6x10''Total 250 0.13
Rail to NorfolkSNF 5.9 0.003HLW (rail) 0.7 3.5x10"'Plutonium (truck) 0.41 2.1x10-'Uranium (truck) 0.31 1.6x10''Total 7.3 0.0037
From a domestic transportation perspective, the lowest-impact option is
one that includes rail shipments of SNF from Hanford to the Port of Seattle.
This option is followed closely by the option of moving SNF from Hanford to
the Port of Portland by barge. The third lowest domestic transportation
option is that involving SNF shipments to Seattle by truck. The highest
impact options are those involving shipments from Hanford to the Port of
Norfolk. Obviously, the lowest impact domestic transportation option would be
that involving the shortest shipping distances (i.e., Hanford to Seattle or
Portland). Some of the impacts of the long domestic transportation links
B.36
would be offset by subsequent reductions in the lengths of the ocean shipment
segments. Consequently, the rankings of the options presented in Table B-11
do not necessarily represent the rankings that would result if the ocean seg-
ments of the shipments were included. However, public routine doses are not
significant for ocean voyages because the separation distance between the ship
and the nearest exposed population is greater, resulting in extremely low
radiation dose rates.
The results in Table B-11 demonstrate that barge shipments of SNF (and
HLW) would produce lower public routine doses than truck or rail shipments.
This is attributed primarily to the lower traffic volumes on waterways
relative to railroads and highways, generally greater separation distances
between barges and the public relative to the separation distances between
highways/railroads and the public, as well as the increased per-shipment
capacities of barges relative to truck and rail shipments (resulting in fewer
shipments).
Table B-11 also demonstrates that rail shipments would produce lower
public routine doses than equivalent truck shipments. This can be seen by
comparing the SNF shipment impacts for truck shipments to Seattle
(15 person-rem) and rail shipments to Seattle (1.6 person-rem). Even though
the rail shipping route from Hanford to Seattle is much longer than the truck
route (277 km and 716 km), the total public routine doses are smaller. As
with barge shipments, this is attributed to lower traffic volumes, larger
separation distances, and increased shipment capacity for rail shipments.
This analysis expects no dose to members of the public resulting from
incident-free ocean transport of N Reactor SNF to the U.K. The ships carrying
the fuel are owned and operated by the commercial vendor, and its shipboard
crews are assumed to be classified as radiation workers for the purposes of
this analysis.
B.3.3 Nonradiological Impacts from Incident-Free Transportation Activities
Impacts to the public from nonradiological causes were also evaluated.
This included potential fatalities resulting from pollutants emitted from the
vehicles during normal transportation. Based on the information contained in
Rao et al. (1982), the types of pollutants that are present and can impact the
public are sulfur oxides (SO.), particulates, nitrogen oxides (NO.), carbon
monoxide (CO), hydrocarbons (HC), and photochemical oxidants (O z). Of thesepollutants, Rao et al. (1982) determined that the majority of the.health
effects are from S0, and the particulates. Unit risk factors (fatalities per
kilometer) for truck shipments were developed by Rao et al. (1982) for travel
B.37
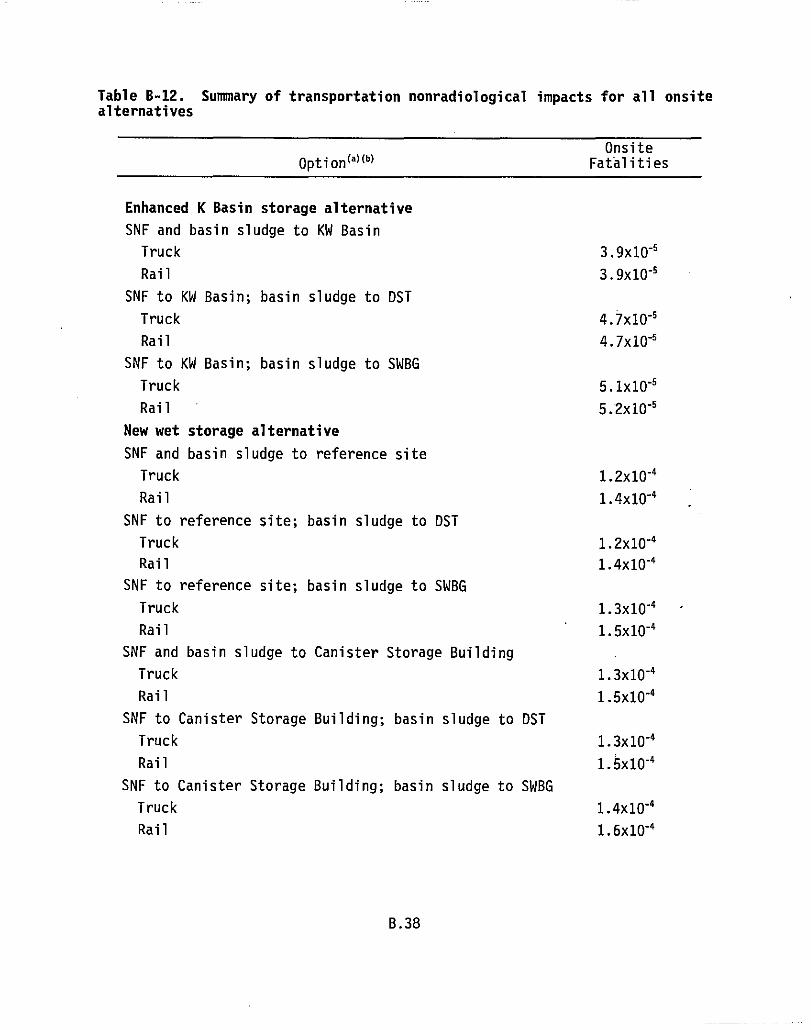
Table B-12. Summary of transportation nonradiological impacts for all onsitealternatives
OnsiteOption (a) (b) Fatal i ti es
Enhanced K Basin storage alternative
SNF and basin sludge to KW Basin
Truck 3.9x10⁻⁵
Rail 3.9x10⁻⁵
SNF to KW Basin; basin sludge to DST
Truck 4.7x10'5
Rail 4.7x10⁻⁵
SNF to KW Basin; basin sludge to SWBG
Truck 5.1x10'5
Rail 5.2x10'5
New wet storage alternative
SNF and basin sludge to reference site
Truck 1.2x10-"
Rail 1.4x10"4
SNF to reference site; basin sludge to DST
Truck 1.2x10"4
Rail 1.4x10⁻⁴
SNF to reference site; basin sludge to SWBG
Truck 1.3x10⁻⁴
Rail 1.5x10"4
SNF and basin sludge to Canister Storage Building
Truck 1.3x10⁻⁴
Rail 1.5x10⁻⁴
SNF to Canister Storage Building; basin sludge to DST
Truck 1.3x10⁻⁴
Rail 1.5x10⁻⁴
SNF to Canister Storage Building; basin sludge to SWBG
Truck 1.4x10⁻⁴
Rail 1.6x10⁻⁴
B.38
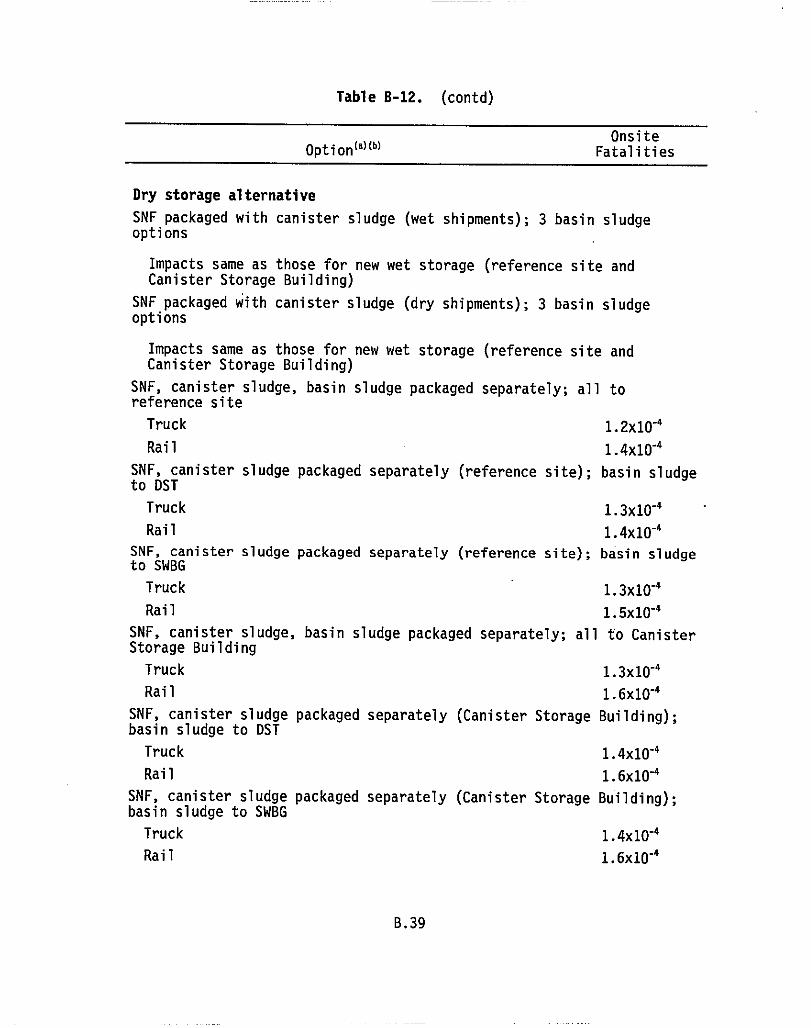
Table B-12. (contd)
p
(a)(b) OnsiteOption Fatalities
Dry storage alternative
SNF packaged with canister sludge (wet shipments); 3 basin sludgeoptions
Impacts same as those for new wet storage (reference site andCanister Storage Building)
SNF packaged with canister sludge (dry shipments); 3 basin sludgeoptions
Impacts same as those for new wet storage (reference site andCanister Storage Building)
SNF, canister sludge, basin sludge packaged separately; all toreference site
Truck 1.2x10"4
Rail 1.4x10"4
SNF, canister sludge packaged separately (reference site); basin sludgeto DST
Truck 1.3x10"4
Rail 1.4x10⁻⁴
SNF, canister sludge packaged separately (reference site); basin sludgeto SWBG
Truck 1.3x10⁻⁴
Rail 1.5x10"4
SNF, canister sludge, basin sludge packaged separately; all to CanisterStorage Building
Truck 1.3x10'4
Rail 1.6x10"4
SNF, canister sludge packaged separately (Canister Storage Building);basin sludge to DST
Truck 1.4x10⁻⁴
Rail 1.6x10"4
SNF, canister sludge packaged separately (Canister Storage Building);basin sludge to SWBG
Truck 1.4x10 -4
Rail 1.6x10"4
B.39
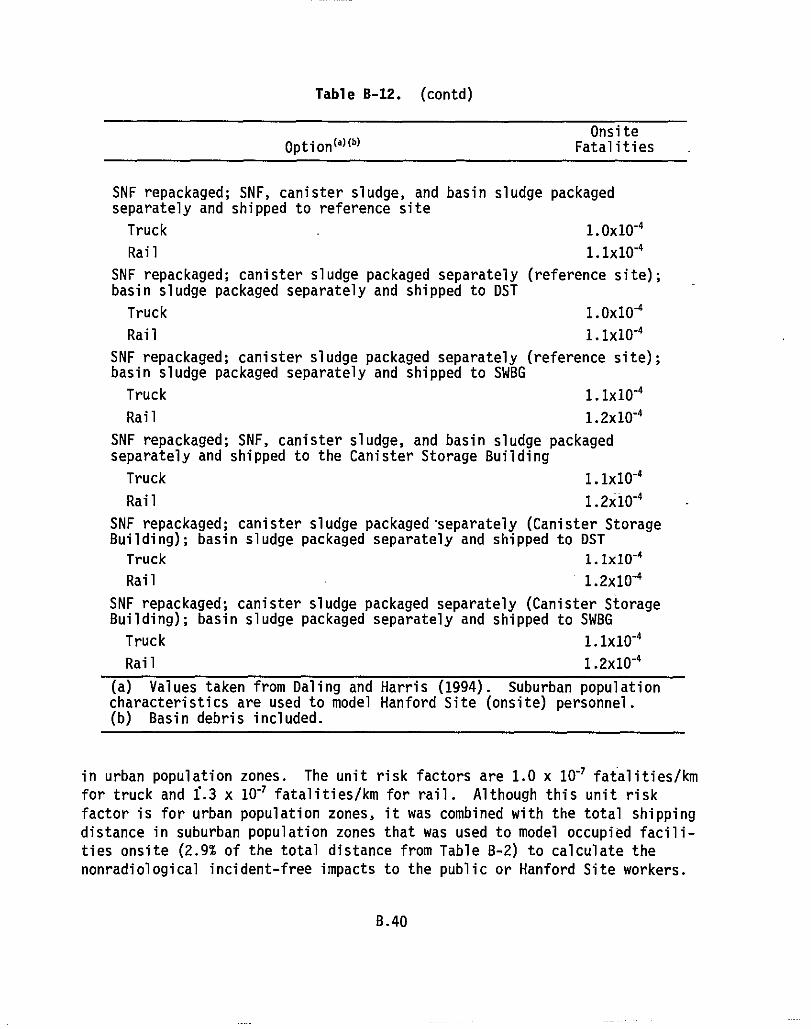
Table B-12. (contd)
OnsiteOption (a) (') Fatal it i es
SNF repackaged; SNF, canister sludge, and basin sludge packagedseparately and shipped to reference site
Truck 1.Ox10-4
Rail 1.1x10"4
SNF repackaged; canister sludge packaged separately (reference site);basin sludge packaged separately and shipped to DST
Truck 1.0x10⁴
Rail 1.1x10"4
SNF repackaged; canister sludge packaged separately (reference site);basin sludge packaged separately and shipped to SWBG
Truck 1.1x10'4
Rail 1.2x10 -4
SNF repackaged; SNF, canister sludge, and basin sludge packagedseparately and shipped to the Canister Storage Building
Truck 1.1x10"4
Rail 1.2x10"4
SNF repackaged; canister sludge packaged separately (Canister StorageBuilding); basin sludge packaged separately and shipped to DST
Truck 1.1X10 -4
Rail 1.2x10"4
SNF repackaged; canister sludge packaged separately (Canister StorageBuilding); basin sludge packaged separately and shipped to SWBG
Truck 1.1x10"4
Rail 1.2x10 -4
(a) Values taken from Daling and Harris (1994). Suburban populationcharacteristics are used to model Hanford Site (onsite) personnel.(b) Basin debris included.
in urban population zones. The unit risk factors are 1.0 x 10 "' fatalities/km
for truck and f.3 x 10 "' fatalities/km for rail. Although this unit risk
factor is for urban population zones, it was combined with the total shipping
distance in suburban population zones that was used to model occupied facili-
ties onsite (2.9% of the total distance from Table B-2) to calculate the
nonradiological incident-free impacts to the public or Hanford Site workers.
B.40
The nonradiological incident-free impacts were calculated based on the
travel distances given in Tables B-3 and B-4. The results for all alternative
options are shown in Table B-12. The estimated number of fatalities would be
less than 2.0 x 10 "4 for all truck and rail shipping options for the onsite
alternatives. Results are not presented in Table B-12 for the foreign
processing alternative. The foreign processing alternative involves offsite
transport so the public impacts will outweigh the onsite impacts. The results
for the foreign processing alternative are presented later.
B.4 Analysis of Transportation Accidents
This section discusses the potential radiological and nonradiological
impacts from transportation accidents for each alternative discussed in
Section B.I. Radiological accident impacts to the collective population
(public) were calculated using the RADTRAN 4 computer code (Neuhauser and
Kanipe 1992). The radiological impacts to a maximally exposed individual, and
the maximally exposed onsite and offsite individual, were calculated using the
GENII code (Napier et al. 1988).
B.4.1 Radiological Impacts to the Public from Transportation Accidents
The transportation impacts are expressed as maximum individual doses and
as population doses. The population doses were determined by multiplying the
expected consequences of an accident by the accident frequency, summed over
all possible accidents, and then integrated over the entire shipping campaign.
The potential impacts or consequences to the population from transportation
accidents were expressed in terms of radiological dose and LCFs.
Accident impacts can result from breaches in the shipping cask or damage
to the cask shielding; however, the frequencies of occurrence of transporta-
tion accidents that would release significant quantities of radioactive mate-
rial are relatively small. The shipping casks are designed to withstand
specified transportation accident conditions (i.e., the shipping casks for all
the materials shipped in this analysis were assumed to meet the type B packag-
ing requirements specified in 49 CFR 173 and 10 CFR 71); therefore, only a
relatively small fraction of accidents involve conditions that would be severe
enough to result in a release of radioactive materials.
Once the material is released to the environment in an accident, it
would be dispersed and diluted by atmospheric conditions and a small amount
would be deposited on the ground from plume depletion at the receptor loca-
tion. Access to the area adjacent to the transportation accident would be
B.41
controlled by emergency response personnel until the area could be remediated
and the radiation monitoring personnel have declared the area safe.
The RADTRAN 4 computer code was used to calculate the radiological risk
of transportation accidents involving radioactive material shipments. The
RADTRAN 4 methodology was summarized previously. For further details, refer
to the discussions in RADTRAN III (Madsen et al. 1986) and RADTRAN 4:
Volume 3--User's Guide (Neuhauser and Kanipe 1992).
There are five major categories of input data needed to calculate poten-
tial accident transportation risk impacts using the RADTRAN 4 computer code.
These are 1) accident frequency, 2) release quantities, 3) atmospheric disper-
sion parameters, 4) population distribution parameters, and 5) human uptake
and dosimetry models. Accident frequency and release quantities are discussed
below. The remaining parameters were discussed in Section B.2.1.
The frequency of a severe accident is calculated by multiplying an
overall accident rate (accidents per truck-km or per rail-km) by the condi-
tional probability that an accident would involve mechanical and/or thermal
conditions that are severe enough to result in container failure and subse-
quent release of radioactive material.
For this analysis, the six shipment-specific severity categories and'
conditional probabilities identified in DOE (1995a) were used to model caskfailure. The conditional probability for a given severity category is definedas the fraction of accidents that would fall into that severity category if an
accident were to occur. Severity category 1 was defined as encompassing all
accidents that are within the type B package envelope that would not be severe
enough to result in failure of the shipping cask (i.e., accidents with zero
release). The higher categories (2 through 6) were defined to include more
severe accidents, and thus may lead to a release of radioactive material. The
conditional probabilities of the various severity categories that were used in
the onsite analysis are shown in Table B-13.
Release fractions are used to determine the quantity of radioactive
material released to the environment as a result of an accident. The quantity
of material released is a function of the severity of the accident (i.e.,
thermal and mechanical conditions produced in the accident), the response of
the shipping container to these conditions, and the physical and chemical
properties of the material being shipped. The release fractions used in this
analysis were taken from DOE (1995a) and are shown in Table B-14.
B.42
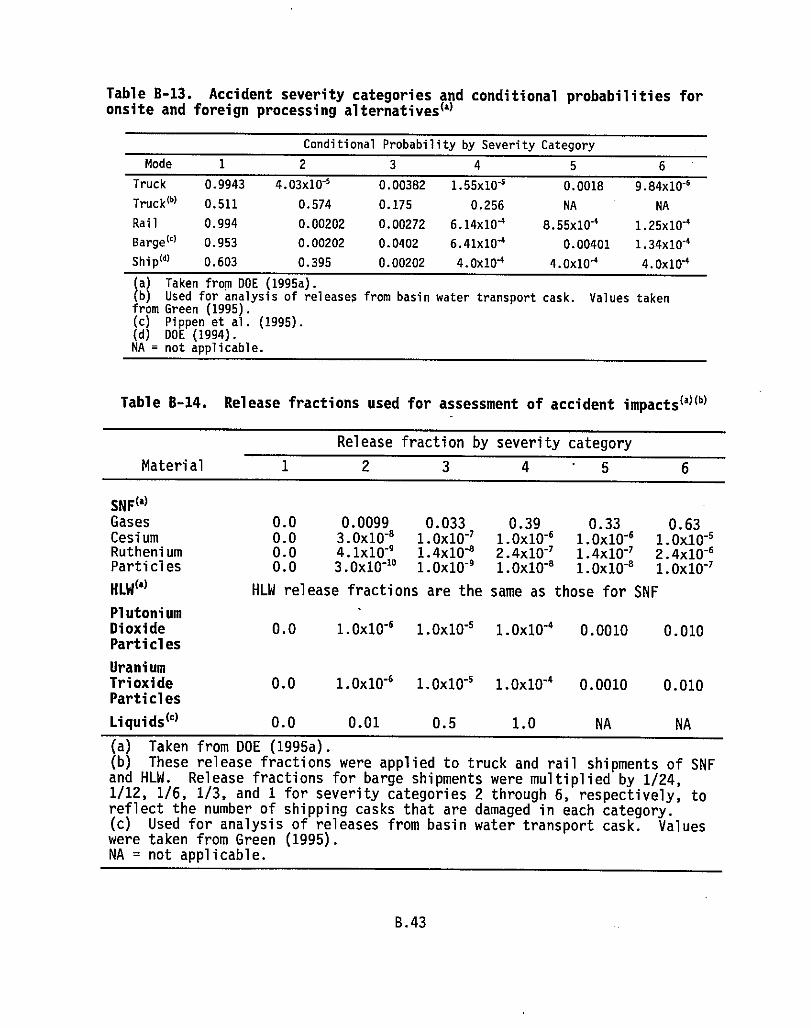
Table B-13. Accident severity categories and conditional probabilities foronsite and foreign processing alternative0l
Conditional Probability by Severity Category
Mode 1 2 3 4 5 6
Truck 0.9943 4.03x10'5 0.00382 1.55x10'5 0.0018 9.84x10'6
Truck (')0.511 0.574 0.175 0.256 NA NA
Rail 0.994 0.00202 0.00272 6.14x10 -4 8.55x10"4 1.25x10'0
Barge (.) 0.953 0.00202 0.0402 6.41x10'° 0.00401 1.34x10"4
Ship (d) 0.603 0.395 0.00202 4.0x10"4
4.0x10"4 4.Ox10'4
(a) Taken from DOE (1995a).(b) Used for analysis of releases from basin water transport cask. Values takenfrom Green (1995).(c) Pippen et al. (1995).(d) DOE (1994).NA = not applicable.
Table B-14. Release fractions used for assessment of accident impactsldl(")
Release fraction by severity category
Material 1 2 3 4 5 6
SNF(4)Gases 0.0 0.0099 0.033 0.39 0.33 0.63Cesium 0.0 3.0x10⁻⁸ 1.0x10"' 1.0x10-61.0x10"6 1.0x10 -5
Ruthenium 0.0 4.1x10"' 1.4x10'82.4x10-' 1.4x10-' 2.4x10⁻⁶Particles 0.0 3.0x10 "3e 1.0x10-' 1.0x10-81.0x10
.81.0x10-'
HLW(a) HLW release fractions are the same as those for SNF
PlutoniumDioxide 0.0 1.0x10"6
1.0x10'51.0x10'40.0010 0.010Particles
UraniumTrioxide 0.0 1.0x10 "6
1.0x10"51.0x10
"40.0010 0.010
Particles
Liquids (`)0.0 0.01 0.5 1.0 NA NA
(a) Taken from DOE (1995a).(b) These release fractions were applied to truck and rail shipments of SNFand HLW. Release fractions for barge shipments were multiplied by 1/24,1/12, 1/6, 1/3, and 1 for severity categories 2 through 6, respectively, toreflect the number of shipping casks that are damaged in each category.(c) Used for analysis of releases from basin water transport cask. Valueswere taken from Green (1995).NA = not applicable.
B.43
The input data used to calculate the radiological dose to the public
(i.e., population densities, travel times, and distances) were the same as the
inputs used to calculate the incident-free dose to the population and are
shown in Tables B-3 and B-4. The radiological inventories used in the acci-
dent analysis were shown in Tables B-1 and B-2. The initial accident data (or
rates expressed as accidents/km) used in this analysis were taken from
Bergsman et al. (1995) and are recommended for the Hanford Site. The accident
rate used for truck shipments is 8.86 x 10 -8 accident/km (5.50 x 10⁻⁸ acci-
dent/mi ) ; and for rail, it is 2.40 x 10 -8 accident/km (1.49 x '10-8 acci-
dent/mi).
8.4.1.1 Enhanced K Basin Storage
For this analysis, the release fractions identified in Table B-14 for
SNF were also used to model releases of radiological materials from shipping
casks containing basin or canister sludge and SWHIC containing basin sludge.
The dispersibility and respirability parameters in RADTRAN 4 were used to
reflect the differences in waste forms. The assumed dispersibility factor for
SNF is 1.0 and sludge is 0.050. These values were taken from Neuhauser and
Kanipe (1992) for SNF and large powders, respectively. The category of large
powders was considered appropriate for sludge based on its chemical and physi-
cal form (i.e., sludge will not be dried) and thus will not contain small, dry
particles before packaging. It was also assumed that 1001 of the liquid
contained in LWHIC would be released from a transportation accident. Assuming
a resuspension rate of 1 x 10' 10/s (Sutter 1982), for a 6,000-L (1,580-gal)
release, 0.0043 L (0.0011 gal) would be aerosolized in a 2-hr period.
Using the accident modelling data contained in DOE (1995a) and the
default values contained in Neuhauser and Kanipe (1992), it was assumed that
5% of the SNF (including basin sludge designated SNF and the grouted basin
sludge released) and 100% of the liquid aerosolized would be respirable. The
results of the analysis are shown in Table B-15.
8.4.1.2 New Wet Storage
For this analysis, the release fractions, accident rates, and dispersi-
bility/respirability parameters presented above for the no action alternative
were also used for this alternative. The results of the analysis are shown in
Table B-16.
B.44
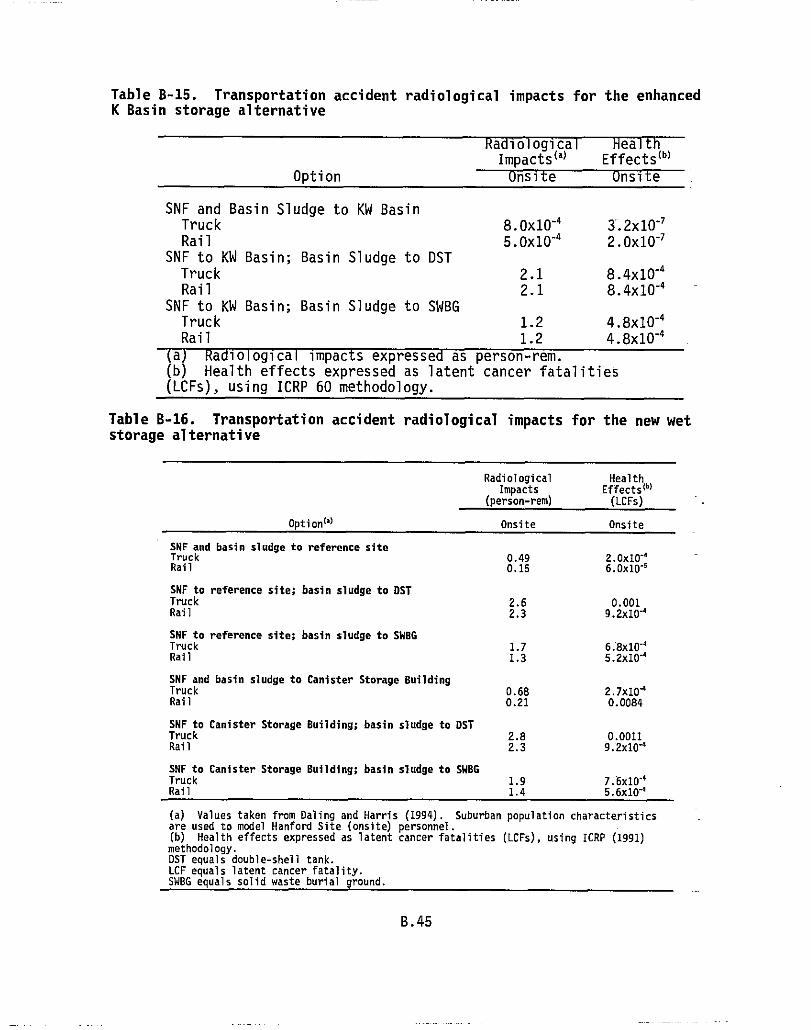
2.12.1
1.21.2
Table B-15. Transportation accident radiological impacts for the enhancedK Basin storage alternative
Kaaloioglcai neajTnImpacts iaiEffects (b)
Option Onsite Unsite
SNF and Basin Sludge to KW BasinTruckRail
SNF to KW Basin; Basin Sludge to DSTTruckRail
SNF to KW Basin; Basin Sludge to SWBGTruckRail
8.Ox10 -4
5.Ox10 -4
3.2x10-'2.Ox10-'
8.4x 10⁻⁴
8.4x10 -4
4.8x10 -4
4.8x10 -4
(a) Kaaloioglcai impacts expressed as person-rem.(b) Health effects expressed as latent cancer fatalities(LCFs), using ICRP 60 methodology.
Table B-16. Transportation accident radiological impacts for the new wetstorage alternative
Option (a)
RadiologicalImpacts
(person-rem)
Onsite
HealthEffects(")(LCFs)
Onsite
SNF and basin sludge to reference siteTruck 0.49 2.0x10'4Rail 0.15 6.Ox10"5
SNF to reference site; basin sludge to DSTTruck 2.6 0.001Rail 2.3 9:2x10"
SNF to reference site; basin sludge to SWBGTruck 1.7 6:8x10'°Rail 1.3 5.2x10⁴
SNF and basin sludge to Canister Storage BuildingTruck 0.68 2.7x10''Rail 0.21 0.0084
SNF to Canister Storage Building; basin sludge to DSTTruck 2.8 0.0011Rail 2.3 9.2x10""
SNF to Canister Storage Building; basin sludge to SWBGTruck 1.9 7.6x10'4Rai1 1.4 5.6x10"4
(a) Values taken from Daling and Harris (1994). Suburban population characteristicsare used to model Hanford Site (onsite) personnel. -(b) Health effects expressed as latent cancer fatalities (LCFs), using ICRP (1991)methodology.DST equals double-shell tank.LCF equals latent cancer fatality.SWBG equals solid waste burial ground.
B.45

B.4.1.3 Dry Storage
As discussed in Section B.1.3, two options were analyzed to assess
potential radiological accident impacts to the public. The first option,
remove the SNF as is, involves the same transportation assumptions as the new
wet storage alternative. Therefore, the results of the analysis are the same
shown for new wet storage in Table B-16.
The second option assumes that the canister sludge is removed from the
canister and packaged for disposition as SNF or liquid waste, and the SNF is
repackaged, increasing the fuel loading per SNF cask. The basin sludge may be
shipped as SNF, solid waste, or liquid waste; therefore, the impacts to the
public, with respect to the basin sludge would be the same as the new wet
storage alternative. The analysis assumptions discussed above for the
enhanced K Basin alternative were also used in this analysis. The results of
the analysis are shown in Table B-17.
B.4.1.4 Foreign Processing
The results of the integrated population risk assessment for the foreign
processing alternative are presented in Table B-18. The lowest impact option
is that in which SNF is shipped from Hanford to the Port of Seattle by rail.
The Port of Seattle by truck option is the next highest followed in order by
the rail option to Norfolk, truck to Norfolk, and then barge to Portland. Theimpacts for all of the options are dominated by the SNF shipments to the U.K.and plutonium dioxide return shipments to Hanford, primarily because the quan-
tities and forms of these materials are more vulnerable to accidental releases
and represent higher radiotoxicities than do vitrified HLW and uranium triox-
ide. Shipments of vitrified HLW were determined to present the lowest impacts
of all the materials because of the reasons given plus the immobilized form of
the material relative to the other materials.
Shipments by barge are shown in Table B-18 to result in relatively
higher accident impacts than shipments by rail or truck. Thi's is because the
inventories of radioactive materials transported by barge, and the resulting
potential accident releases, are at least an order of magnitude greater than
for truck and rail shipments. Because the accident rates for the three modes
are comparable, this results in a higher per shipment (or per-km) accident
risk for barge than the other modes. This higher per-shipment risk more than
offsets the risk reduction attributable to fewer barge shipments so, overall,
barge accident risks appear to be higher than truck or rail transport risks.
However, in comparing the magnitudes of the accident risks to the public
routine exposures, it can be seen that the accident risks are lower than the
B.46
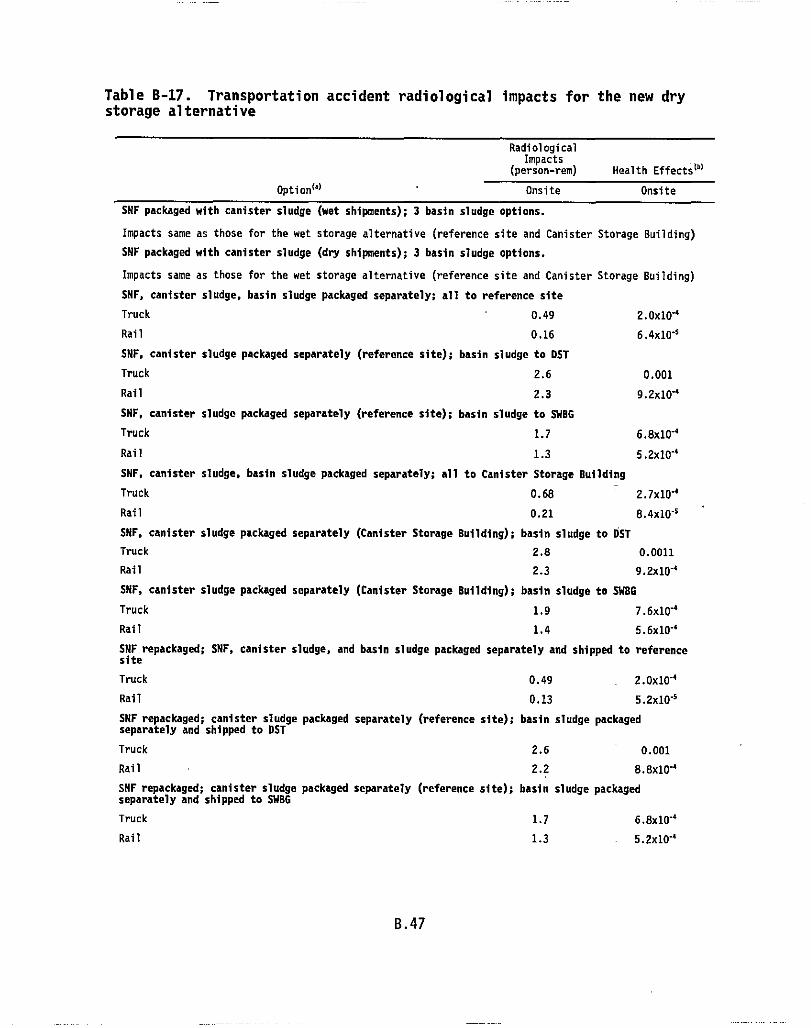
Table B-17. Transportation accident radiological impacts for the new drystorage alternative
RadiologicalImpacts
(person-rem) Health Effects(")
Option (.)Onsite Onsite
SNF packaged with canister sludge (wet shipments); 3 basin sludge options.
Impacts same as those for the wet storage alternative (reference site and Canister Storage Building)
SNF packaged with canister sludge (dry shipments); 3 basin sludge options.
Impacts same as those for the wet storage alternative (reference site and Canister Storage Building)
SNF, canister sludge, basin sludge packaged separately; all to reference site
Truck 0.49 2.0x10"4
Rail 0.16 6.4x10'5
SNF, canister sludge packaged separately (reference site); basin sludge to DST
Truck 2.6 0.001
Rail 2.3 9.2x10'4
SNF, canister sludge packaged separately (reference site); basin sludge to SWBG
Truck 1.7 6.8x10'4
Rail 1.3 5.2x10'4
SNF, canister sludge, basin sludge packaged separately; all to Canister Storage Building
Truck 0.68 2.7x10'4
Rail 0.21 8.4x10'5
SNF, canister sludge packaged separately (Canister Storage Building); basin sludge to DST
Truck 2.8 0.0011
Rail 2.3 9.240'4
SNF, canister sludge packaged separately (Canister Storage Building); basin sludge to SWBG
Truck 1.9 7.6x10'4
Rail 1.4 5.6x10⁻⁴
SNF repackaged; SNF, canister sludge, and basin sludge packaged separately and shipped to referencesiteTruck 0.49 _ 2.0x10'4
Rail 0.13 5.240'5
SNF repackaged; canister sludge packaged separately (reference site); basin sludge packagedseparately and shipped to DST
Truck 2.6 0.001
Rail 2.2 8.840'4
SNF repackaged; canister sludge packaged separately (reference site); basin sludge packagedseparately and shipped to SWBG
Truck 1.7 6.8x10'4
Rail 1.3 5.2x10⁻⁴
B.47
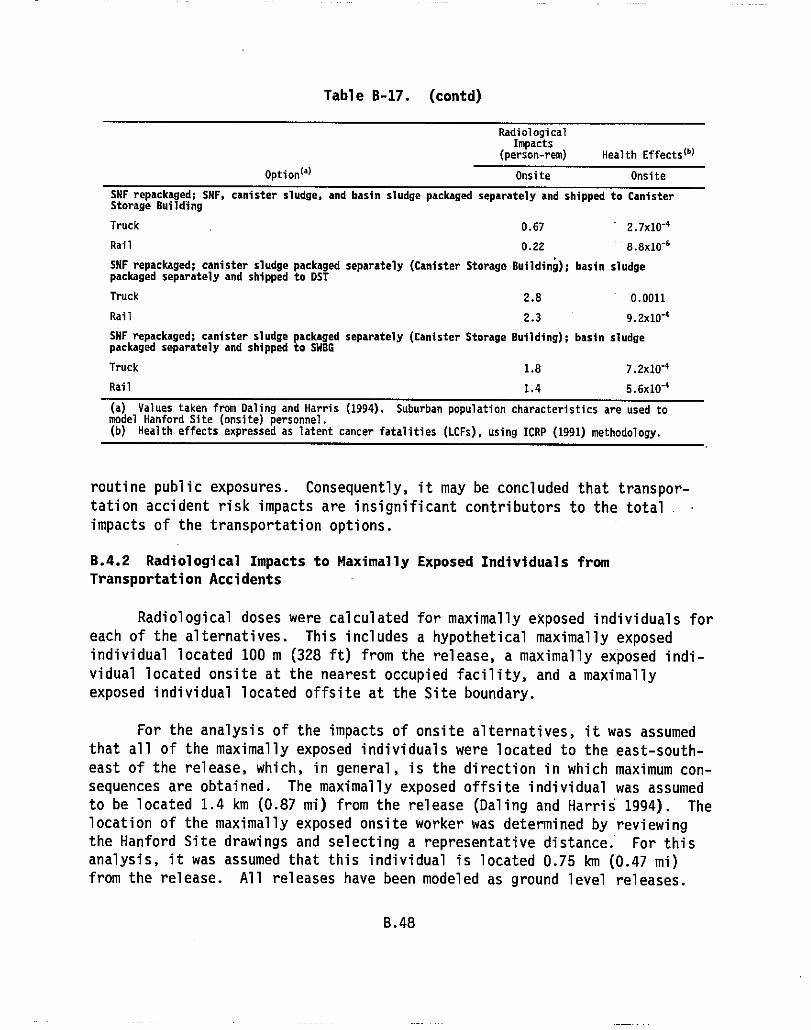
Table B-17. (contd)
RadiologicalImpacts
(person-rem) Health Effects(b)
Option (- )Onsite Onsite
SNF repackaged; SNF, canister sludge, and basin sludge packaged separately and shipped to CanisterStorage Building
Truck 0.67 - 2.7x10'4Rail 0.22 8.8x10.5
SNF repackaged; canister sludge packaged separately (Canister Storage Building); basin sludgepackaged separately and shipped to DST
Truck 2.8 0.0011Rail 2.3 9.2x10'4SNF repackaged; canister sludge packaged separately (Canister Storage Building); basin sludgepackaged separately and shipped to SWBG
Truck 1.8 7.2x10"4Rail 1.4 5.6x10'4
1a) Values taKen from gating and Harris (1994). Suburban population characteristics are used tomodel Hanford Site (onsite) personnel.(b) Health effects expressed as latent cancer fatalities (LCFs), using ICRP (1991) methodology.
routine public exposures. Consequently, it may be concluded that transpor-
tation accident risk impacts are insignificant contributors to the total .
impacts of the transportation options.
B.4.2 Radiological Impacts to Maximally Exposed Individuals from
Transportation Accidents
Radiological doses were calculated for maximally exposed individuals for
each of the alternatives. This includes a hypothetical maximally exposed
individual located 100 m (328 ft) from the release, a maximally exposed indi-
vidual located onsite at the nearest occupied facility, and a maximally
exposed individual located offsite at the Site boundary.
For the analysis of the impacts of onsite alternatives, it was assumed
that all of the maximally exposed individuals were located to the east-south-
east of the release, which, in general, is the direction in which maximum con-
sequences are obtained. The maximally exposed offsite individual was assumed
to be located 1.4 km (0.87 mi) from the release (Daling and Harris 1994). The
location of the maximally exposed onsite worker was determined by reviewing
the Hanford Site drawings and selecting a representative distance. For this
analysis, it was assumed that this individual is located 0.75 km (0.47 mi)
from the release. All releases have been modeled as ground level releases.
B.48
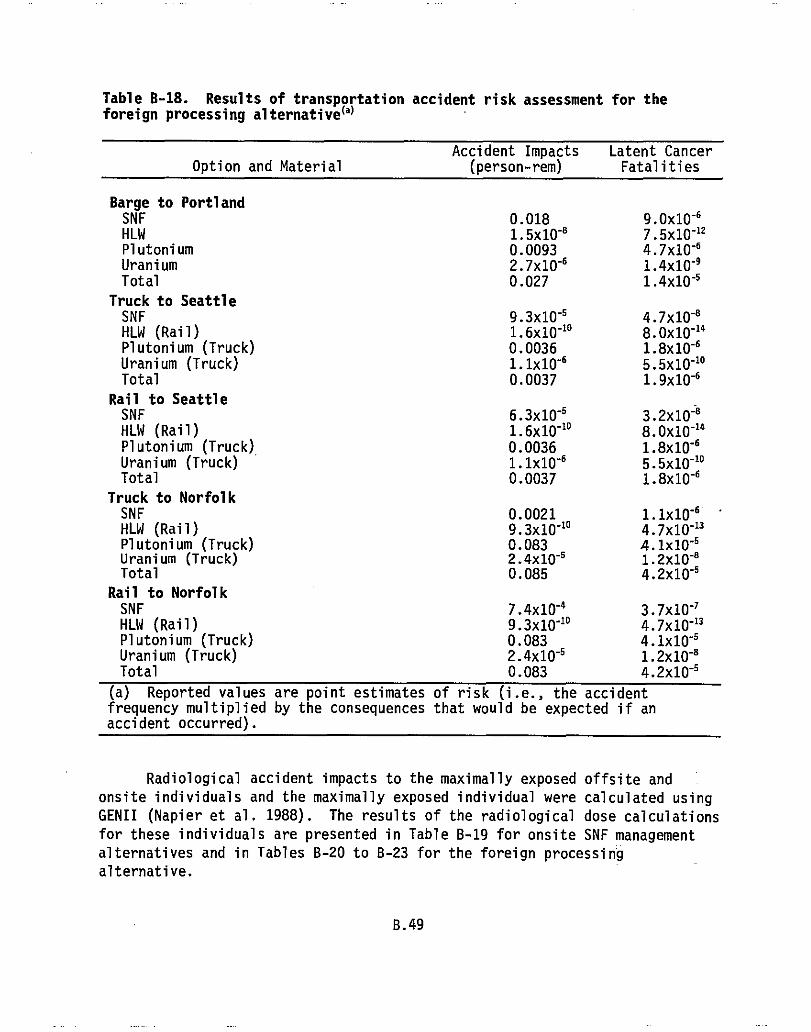
Table B-18. Results of transportation accident risk assessment for theforeign processing alternative (a)
Option and MaterialAccident Impacts
(person-rem)Latent CancerFatalities
Barge to PortlandSNF 0.018 9.0x10⁻⁶HLW 1.5x10⁻⁸ 7.5xlO-"Plutonium 0.0093 4.7x10'6Uranium 2.7x10⁻⁶ 1.4x10-'Total 0.027 1.4x10'5
Truck to SeattleSNF 9.3x10"5 4.7x10⁻⁸HLW (Rail) 1.6x10 -10 8.Ox10'"Plutonium (Truck) 0.0036 1.8x10⁻⁶Uranium (Truck) 1.1x10'6 5.5x10 "10
Total 0.0037 1.9x10⁻⁶Rail to SeattleSNF 6.3x10"5 3.2x10⁻⁸HLW (Rail) 1.6x10'10 8.0x10 -14
Plutonium (Truck) , 0.0036 1.8x10⁻⁶Uranium (Truck) 1.1x10'6 5.5x10 -10
Total 0.0037 1.8x10⁻⁶Truck to NorfolkSNF 0.0021 1.1x10"6'HLW (Rail) 9.3x10 "10 4.7x10⁻¹³Plutonium (Truck) 0.083 4.1x10"5Uranium (Truck) 2.4x10 -6 1.2x10 -8
Total 0.085 4.2x10"5Rail to NorfolkSNF 7.4x10 "4 3.7x10"'HLW (Rail) 9.3x10 "10 4.7x10'13Plutonium (Truck) 0.083 4.1x10'5Uranium (Truck) 2.4x10'5 1.2x10⁻⁸Total 0.083 4.2x10⁻⁵
(a) Reported values are point estimates of risk (i.e., the accidentfrequency multiplied by the consequences that would be expected if anaccident occurred).
Radiological accident impacts to the maximally exposed offsite and
onsite individuals and the maximally exposed individual were calculated using
GENII (Napier et al. 1988). The results of the radiological dose calculationsfor these individuals are presented in Table B -19 for onsite SNF managementalternatives and in Tables B -20 to B -23 for the foreign processingalternative.
FRID]
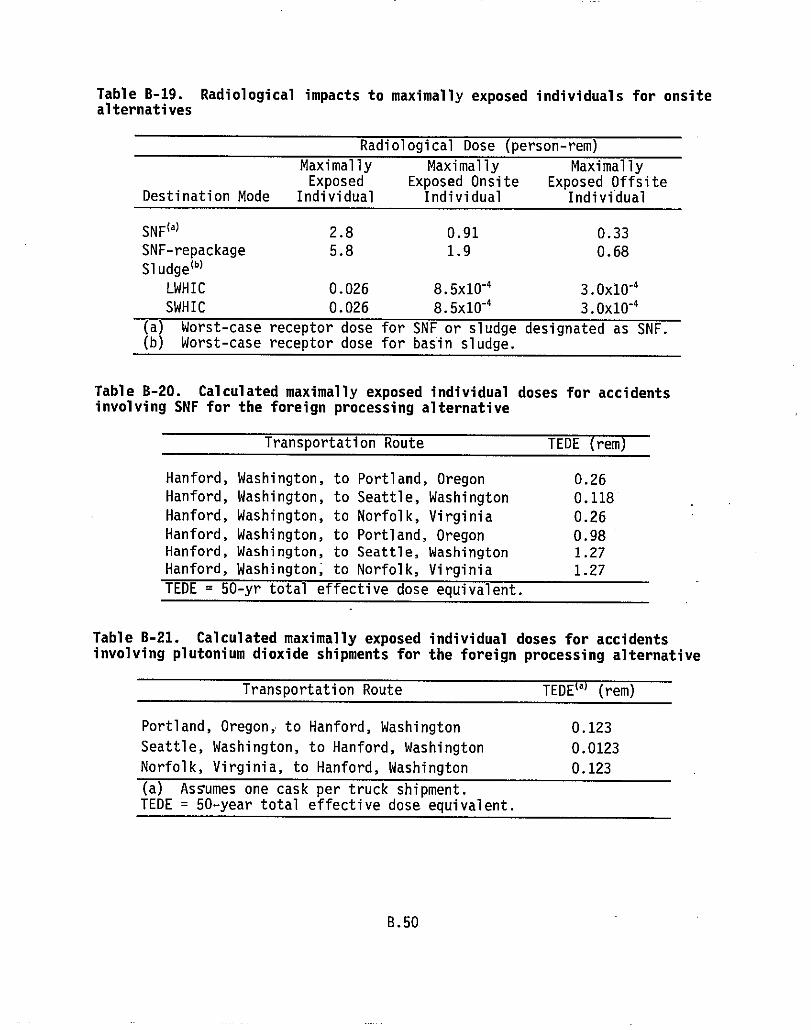
Table B-19. Radiological impacts to maximally exposed individuals for onsitealternatives
Radiological Dose (person-rem)
Maximally Maximally MaximallyExposed Exposed Onsite Exposed Offsite
Destination Mode Individual Individual Individual
SNF (d) 2.8 0.91 0.33SNF-repackage 5.8 1.9 0.68Sludge(b)
LWHIC 0.026 8.5x10⁻⁴ 3.0x10"4
SWHIC 0.026 8.5x10⁻⁴ 3.Ox10'4
(a) Worst-case receptor dose for SNF or sludge designated as SNF.(b) Worst-case receptor dose for basin sludge.
Table B-20. Calculated maximally exposed individual doses for accidentsinvolving SNF for the foreign processing alternative
Transportation Route TEDE rem
Hanford, Washington, to Portland, Oregon 0.26Hanford, Washington, to Seattle, Washington 0.118Hanford, Washington, to Norfolk, Virginia 0.26Hanford, Washington, to Portland, Oregon 0.98Hanford, Washington, to Seattle, Washington 1.27Hanford, Washington; to Norfolk, Virginia 1.27
TEDE = 50-yr total effective dose equivalent.
Table B-21. Calculated maximally exposed individual doses for accidentsinvolving plutonium dioxide shipments for the foreign processing alternative
Transportation Route TEDE(') (rem)
Portland, Oregon, to Hanford, Washington 0.123
Seattle, Washington, to Hanford, Washington 0.0123
Norfolk, Virginia, to Hanford, Washington 0.123
(a) Assumes one cask per truck shipment.TEDE = 50-year total effective dose equivalent.
B.50

Table B-22. Calculated maximally exposed individual doses for accidentsinvolving uranium trioxide shipments for the foreign processing alternative
Transportation Route TEDE (rem)
Portland, Oregon, to Hanford, Washington 2.36x10.5
Seattle, Washington, to Hanford, Washington 2.36x10"5
Norfolk, Virginia, to Hanford, Washington 2.3¢x10.5
TEDE = 50-year total effective dose equivalent.
Table B-23. Calculated maximally exposed individual doses for accidentsinvolving solidified high-level waste shipments for the foreign processingalternative
Transportation Route TEDE (rem)
Portland, Oregon, to Hanford, Washington 0.839
Seattle, Washington, to Hanford, Washington 0.839
Norfolk, Virginia, to Hanford, Washington 0.839
TEDE = 50-year total effective dose equivalent.
The consequences of accidents during port transit were estimated using
the same assumptions described for worker consequences in Section B.2.4.
Collective point estimates of risk to the population within 80 km (50 mi) of
each location were calculated for an accident at the dock and on the approach
to the port. The point estimate of risk to an individual at 1,600 m (1 mi)
was also estimated for applicable exposure pathways. Consequences for popula-
tions and individuals are reported, both with and without the risk from
ingestion of locally grown foods because protective action guidelines would
require mitigative actions if the projected dose exceeded specified levels.
Individual consequences assume 95% atmospheric dispersion, whereas conse-
quences to populations are estimated for both 50% and 95% atmospheric
dispersion.
The consequences of port accidents were estimated in a manner similar to
that used for'overland transportation impacts. The contents of one shipping
cask were assumed to be involved in an accident (see Table B-2), with radio-
nuclide releases according to the release fractions reported in Table B-14
The dose and resulting LCF were calculated for each of the six accident sever-
ity categories. The point estimates of risk included the consequences as LCF
for accidents of each severity category multiplied by the frequency with which
B.51
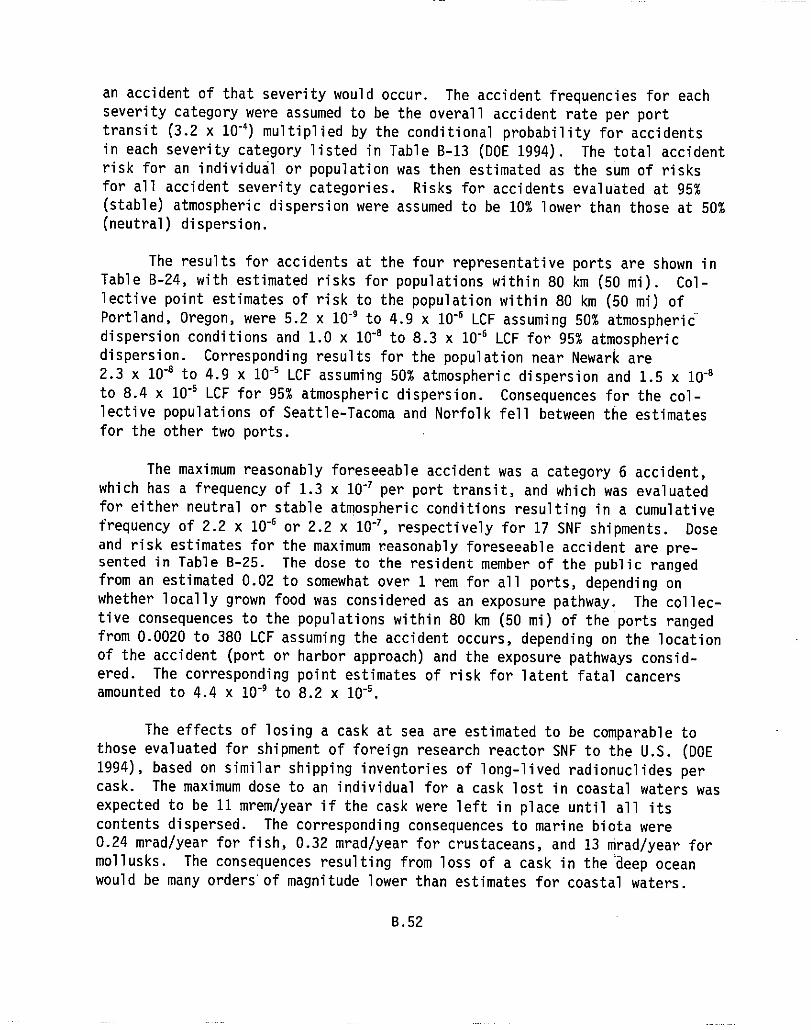
an accident of that severity would occur. The accident frequencies for each
severity category were assumed to be the overall accident rate per porttransit (3.2 x 10 -4) multiplied by the conditional probability for accidents
in each severity category listed in Table B-13 (DOE 1994). The total accident
risk for an individual or population was then estimated as the sum of risks
for all accident severity categories. Risks for accidents evaluated at 95%
(stable) atmospheric dispersion were assumed to be 10% lower than those at 50%(neutral) dispersion.
The results for accidents at the four representative ports are shown itTable B-24, with estimated risks for populations within 80 km (50 mi). Col-
lective point estimates of risk to the population within 80 km (50 mi) of
Portland, Oregon, were 5.2 x 10 -9 to 4.9 x 10 -6 LCF assuming 50% atmosphericdispersion conditions and 1.0 x 10 -8 to 8.3 x 10 -6 LCF for 95% atmosphericdispersion. Corresponding results for the population near Newark are2.3 x 10
"8 to 4.9 x 10⁻⁶
LCF assuming 50% atmospheric dispersion and 1.5 x 10⁻⁸to 8.4 x 10"5
LCF for 95% atmospheric dispersion. Consequences for the col-
lective populations of Seattle-Tacoma and Norfolk fell between the estimates
for the other two ports.
The maximum reasonably foreseeable accident was a category 6 accident,
which has a frequency of 1.3 x 10'' per port transit, and which was evaluated
for either neutral or stable atmospheric conditions resulting in a cumulative
frequency of 2.2 x 10⁻⁶ or 2.2 x 10⁻⁷ , respectively for 17 SNF shipments. Dose
and risk estimates for the maximum reasonably foreseeable accident are pre-sented in Table B-25. The dose to the resident member of the public ranged
from an estimated 0.02 to somewhat over 1 rem for all ports, depending on
whether locally grown food was considered as an exposure pathway. The collec-
tive consequences to the populations within 80 km (50 mi) of the ports ranged
from 0.0020 to 380 LCF assuming the accident occurs, depending on the location
of the accident (port or harbor approach) and the exposure pathways consid-
ered. The corresponding point estimates of risk for latent fatal cancersamounted to 4.4 x 10' 9 to 8.2 x 10⁻⁵.
The effects of losing a cask at sea are estimated to be comparable to
those evaluated for shipment of foreign research reactor SNF to the U.S. (DOE
1994), based on similar shipping inventories of long-lived radionuclides per
cask. The maximum dose to an individual for a cask lost in coastal waters was
expected to be 11 mrem/year if the cask were left in place until all its
contents dispersed. The corresponding consequences to marine biota were
0.24 mrad/year for fish, 0.32 mrad/year for crustaceans, and 13 mrad/year for
mollusks. The consequences resulting from loss of a cask in the deep ocean
would be many orders of magnitude lower than estimates for coastal waters.
B.52
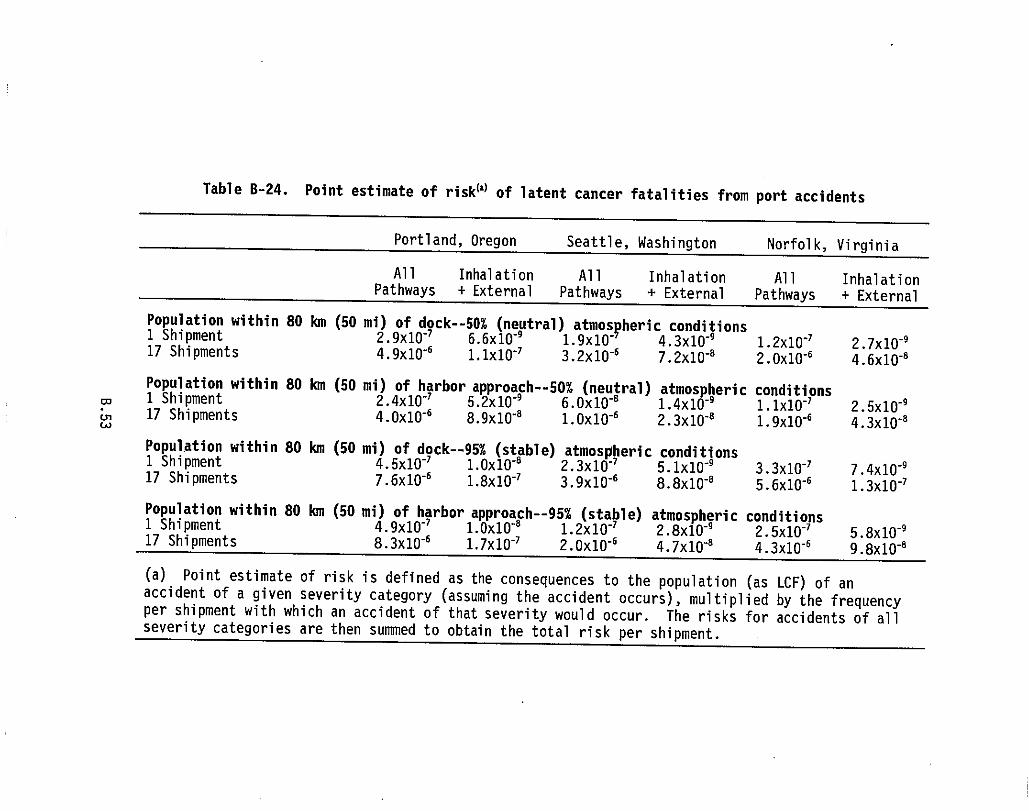
Table B-24. Point estimate of risk (') of latent cancer fatalities from port accidents
Portland, Oregon Seattle, Washington Norfolk, Virginia
All Inhalation All Inhalation All InhalationPathways + External Pathways + External Pathways + External
Population within 80 km (50 mi)of dock- -50% (neutral) atmospheric conditions1 Shipment 2.9x10-' 6.6x10-' 1.9x10" 4.3x10-' 1.2x10'' 2.7x1O-'17 Shipments 4.9x10"6 1.1x10'' 3.2x1O-6 7.2x10.8 2.0x10⁻⁶ 4.6x10.8
Population within 80 km (50 mi)of harbor approach- -50% (neutral) atmospheric conditionso, 1 Shipment 2.4x10"' 5.2x10-' 6.Ox1O-8 1.4x10-' 1.1x10-' 2.5x10-'w
17 Shipments 4.0x10.8 8.9x10'8 1.0x10.8
2.3x10'8 1.9x10.8 4.3x10"'
Population within 80 km (50 mi)of dock--95% (stable) atmospheric conditions1 Shipment 4.5x10"' 1.0x10"e
2.3x10-' 5.1x10"' 3.3x10-' 7.4x10-'17 Shipments 7.6x10.8 1.8x10"' 3.9x10⁻⁶ 8.8x10.8 5.6x10.8 1.3x10-'
Population within 80 km (50 mi)of harbor approach --95% (stable) atmospheric conditions1 Shipment 4.9x10-' 1.0x10"e
1.2x10-' 2.8x10-' 2.5x10-' 5.8xiO-'17 Shipments 8.3x10⁻⁸ 1.7x10-' 2.0x10.8 4.7x10"' 4.3x10⁻⁶ 9.8x10.8
(a) Point estimate of risk is defined as the consequences to the population (as LCF) of anaccident of a given severity category (assuming the accident occurs), multiplied by the frequencyper shipment with which an accident of that severity would occur. The risks for accidents of allseverity categories are then summed to obtain the total risk per shipment.
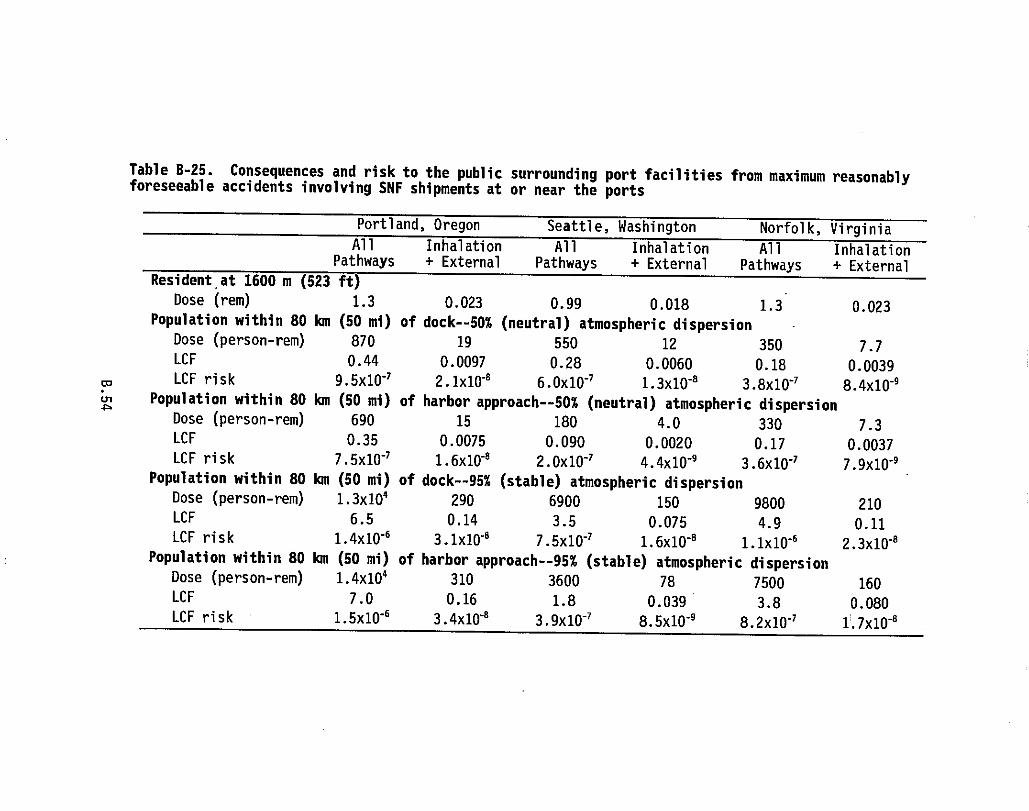
Table B-25. Consequences and risk to the public surrounding port facilities from maximum reasonablyforeseeable accidents involving SNF shipments at or near the ports
Portland, Oregon Seattle, Washington Norfolk, VirginiaAll Inhalation All Inhalation All Inhalation
Pathways + External Pathways + External Pathways + ExternalResident . at 1600 m (523 ft)
Dose (rem) 1.3 0.023 0.99 0.018 1.3 0.023Population within 80 km (50 mi) of dock-- 50% (neutral) atmospheric dispersion
Dose (person-rem) 870 19 550 12 350 7.7LCF 0.44 0.0097 0.28 0.0060 0.18 0.0039
W LCF risk 9.5x10'' 2.1x10.8 6.0x10"' 1.3x10⁻⁸ 3.8x10"' 8.4x10-'A Population within 80 km (50 mi) of harbor approach--50% (neutral) atmospheric dispersion
Dose (person-rem) 690 15 180 4.0 330 7.3LCF 0.35 0.0075 0.090 0.0020 0.17 0.0037LCF risk 7.5x10-' 1.6x10'8 2.0x10"' 4.4x10"' 3.6x10"' 7.9x10''
Population within 80 km (50 mi) of dock-- 95% (stable) atmospheric dispersionDose (person-rem) 1.3x10" 290 6900 150 9800 210LCF 6.5 0.14 3.5 0.075 4.9 0.11LCF risk 1.4x10 "6
3.1x10'8 7.5x10-' 1.6x10⁻⁸ 1.1x10'8 2.3x1O-'Population within 80 km (50 mi) of harbor approach-- 95% (stable) atmospheric dispersion
Dose (person-rem) 1.4x10° 310 3600 78 7500 160LCF 7.0 0.16 1.8 0.039 3.8 0.080LCF risk 1.5x10'8 3.4x10"' 3.9x10-' 8.5x10'' 8.2x10-' 1'.7x10-8
The probability of accident on the open ocean was estimated to be
4.6 x 10⁻⁵ per shipment for an average duration voyage of about 20 days in
transporting SNF from foreign research reactors to the U.S. (DOE 1995b). The
frequency of accidents for overseas shipment of SNF and process materials via
special-purpose ships would likely be within a factor of two or three of this
estimate. However, that frequency applies to commercial freight shipping
experience, and it is possible that the use of special-purpose ships could
result in a different accident rate. Using the commercial freight accident
rate given above, the probability of an accident on the open ocean involving
transport of SNF (17 ocean shipments), HLW (1 shipment), 'uranium trioxide
(1 shipment), and plutonium dioxide (1 shipment) was calculated to be about
9.2 x 10⁻⁴ , integrated over all the shipments.
B.4.3 Nonradiological Impacts from Transportation Accidents
This section describes the analyses performed to assess nonradiological
impacts to the public and the maximally exposed individuals.
The nonradiological impacts associated with the transportation of SNF
and basin sludge were assumed to be comparable to the impacts associated with
general transportation activities in the United States. To calculate non-
radiological impacts or fatalities, a unit risk factor (i.e., fatalities per
km or fatalities per mi) developed for specific population zones or density
was multiplied by the total shipment distance (i.e., total distance per
campaign). The fatalities would occur as the result of vehicular impacts with
solid objects, rollovers, or collisions. Therefore, unit risk factors are
required for crew members and the public (i.e., individuals on or immediately
adjacent to roadways or rail lines).
As discussed in Daling and Harris (1994), the Hanford Site can be char-
acterized as a rural population zone. The following unit risk factors
(Cashwell et al. 1986) were used in this analysis:
Truck:
1.5 x 10"8 fatalities/km for crew members
5.3 x 10⁻⁸ fatalities/km for the public
Rail:
1.8 x 10⁻⁹ fatalities/km for crew members
2.6 x 10⁻⁸ fatalities/km for the public
Results were obtained for each alternative by multiplying the unit risk
factors by the appropriate total shipping distances for each alternative.
B.55
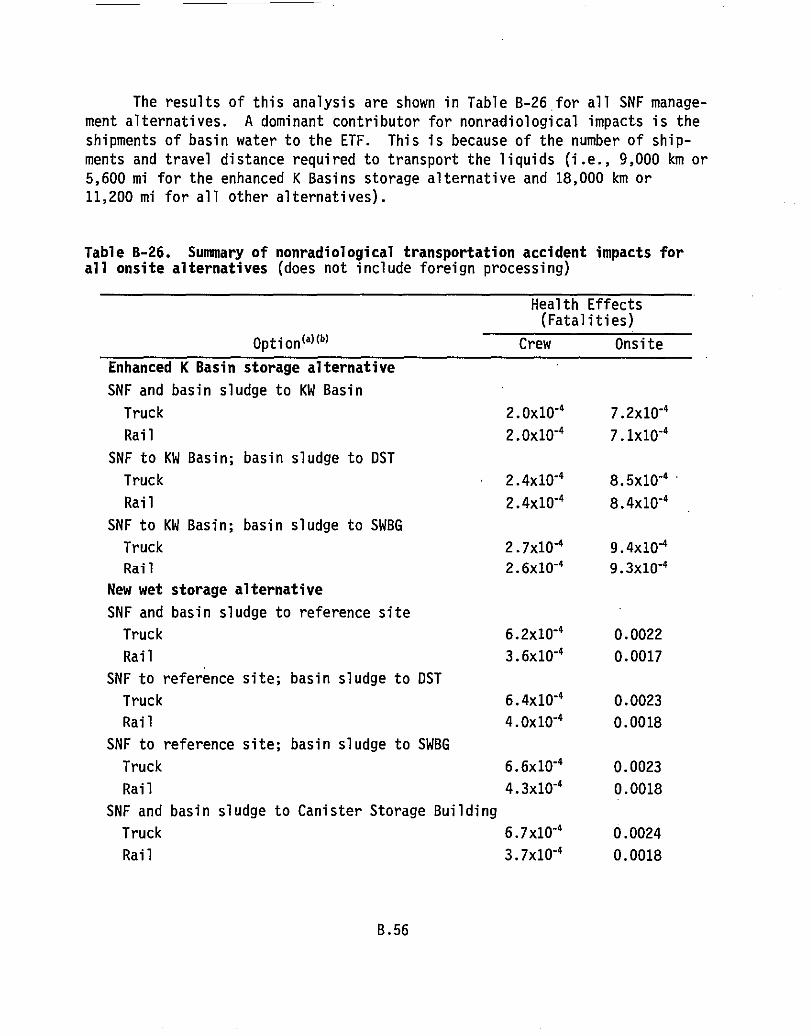
The results of this analysis are shown in Table B-26 for all SNF manage-
ment alternatives. A dominant contributor for nonradiological impacts is the
shipments of basin water to the ETF. This is because of the number of ship-
ments and travel distance required to transport the liquids (i.e., 9,000 km or
5,600 mi for the enhanced K Basins storage alternative and 18,000 km or
11,200 mi for all other alternatives).
Table B-26. Summary of nonradiological transportation accident impacts forall onsite alternatives (does not include foreign processing)
Health Effects(Fatalities)
Option (a)M Crew Onsite
Enhanced K Basin storage alternative
SNF and basin sludge to KW Basin
Truck 2.0x10"4 7.2x10'4
Rail 2.Ox10-4 7.1x10⁻⁴
SNF to KW Basin; basin sludge to DST
Truck 2.4x10 -4 8.5x10"4
Rail 2.4x10 -4 8.4x10⁻⁴
SNF to KW Basin; basin sludge to SWBG
Truck 2.7x10"4 9.410'4
Rail 2.6x10⁻⁴ 9.3x10⁻⁴
New wet storage alternative
SNF and basin sludge to reference site
Truck 6.2x10"4 0.0022
Rail 3.6x10⁻⁴ 0.0017
SNF to reference site; basin sludge to DST
Truck 6.4x10⁻⁴ 0.0023
Rail 4.Ox10-4 0.0018
SNF to reference site; basin sludge to SWBG
Truck 6.6x10"4 0.0023
Rail 4.3x10⁻⁴ 0.0018
SNF and basin sludge to Canister Storage Building
Truck 6.7x10'4 0.0024
Rail 3.7x10⁻⁴ 0.0018
B.56
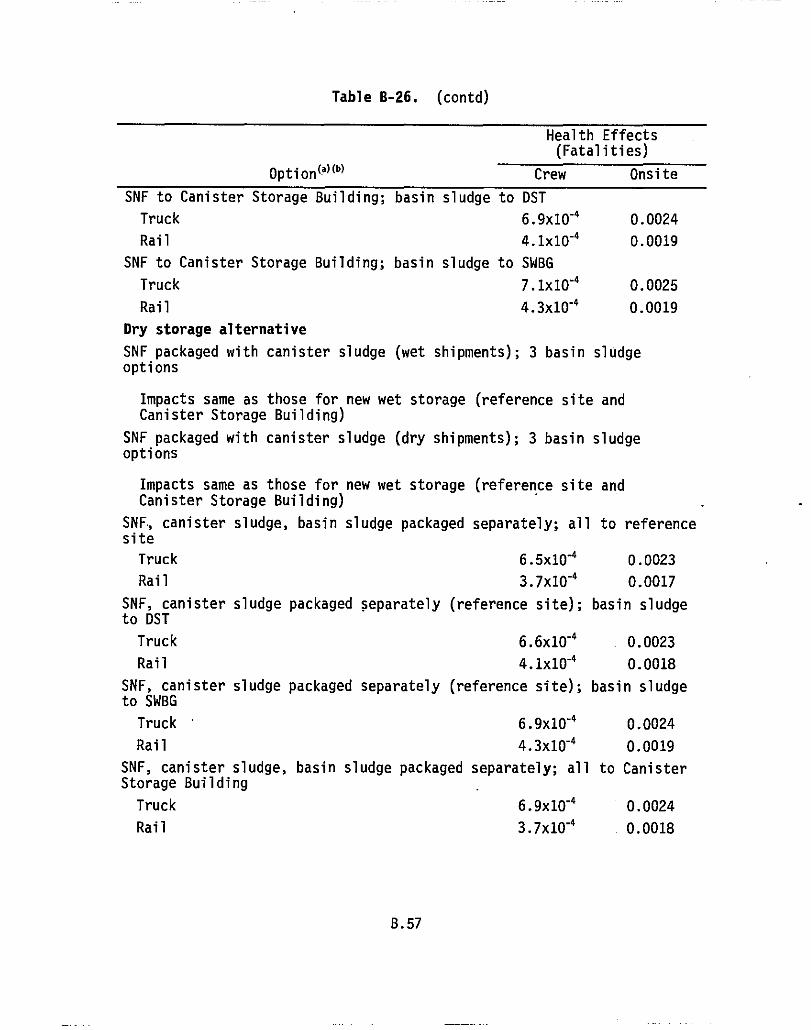
Table B-26. (contd)
Health Effects(Fatalities)
Option (a)(")Crew Onsite
SNF to Canister Storage Building; basin sludge to DST
Truck 6.9x10"40.0024
Rail 4.1x10⁻⁴ 0.0019
SNF to Canister Storage Building; basin sludge to SWBG
Truck 7.1x10"40.0025
Rail 4.3x10"40.0019
Dry storage alternative
SNF packaged with canister sludge (wet shipments); 3 basin sludgeoptions
Impacts same as those for new wet storage (reference site andCanister Storage Building)
SNF packaged with canister sludge (dry shipments); 3 basin sludgeoptions
Impacts same as those for new wet storage (reference site andCanister Storage Building)
SNF., canister sludge, basin sludge packaged separately; all to referencesite
Truck 6.5x10"40.0023
Rail 3.7x10⁻⁴ 0.0017
SNF, canister sludge packaged separately (reference site); basin sludgeto DST
Truck 6.6x10"4
0.0023
Rail 4.1x10⁻⁴ 0.0018
SNF, canister sludge packaged separately (reference site); basin sludgeto SWBG
Truck 6.9x10"4
0.0024
Rail 4.3x10 -4 0.0019
SNF, canister sludge, basin sludge packaged separately; all to CanisterStorage Building
Truck 6.9x10 "40.0024
Rail 3.7x10"40.0018
B.57
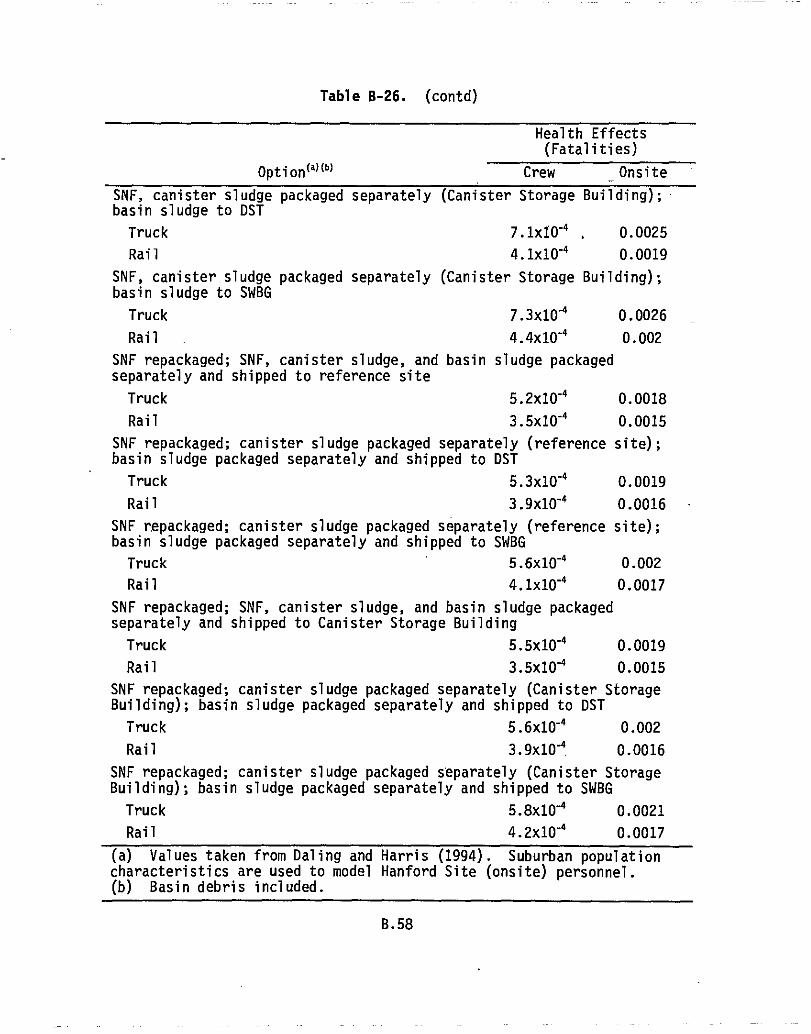
Table B-26. (contd)
Health Effects(Fatalities)
Option (a)(b) Crew Onsite
SNF, canister sludge packaged separately (Canister Storage Building);basin sludge to DST
Truck 7.1x10"40.0025
Rail 4.1x10"40.0019
SNF, canister sludge packaged separately (Canister Storage Building);basin sludge to SWBG
Truck 7.3x10 0.0026
Rail 4.4x10"40.002
SNF repackaged; SNF, canister sludge, and basin sludge packagedseparately and shipped to reference site
Truck 5.2x10"40.0018
Rail 3.5x10"40.0015
SNF repackaged; canister sludge packaged separately (reference site);basin sludge packaged separately and shipped to DST
Truck 5.3x10"40.0019
Rail 3.9x10"40.0016
SNF repackaged; canister sludge packaged separately (reference site);basin sludge packaged separately and shipped to SWBG
Truck 5.6x10⁻⁴ 0.002
Rail 4.1x10"40.0017
SNF repackaged; SNF, canister sludge, and basin sludge packagedseparately and shipped to Canister Storage Building
Truck 5.5x10"40.0019
Rail 3.5x10"' 0.0015
SNF repackaged; canister sludge packaged separately (Canister StorageBuilding); basin sludge packaged separately and shipped to DST
Truck 5.6x10-40.002
Rail 3.9x10 "4. 0.0016
SNF repackaged; canister sludge packaged separately (Canister StorageBuilding); basin sludge packaged separately and shipped to SWBG
Truck 5.8x10"40.0021
Rail 4.2x10 "40.0017
(a) Values taken from Daling and Harris (1994). Suburban populationcharacteristics are used to model Hanford Site (onsite) personnel.(b) Basin debris included.
B.58
B.5 References
Bergsman, K. H. 1994. Hanford Irradiated Fuel Inventory Baseline,
WHC-SD-SNF-TI-001, Rev. 0, Westinghouse Hanford Company, Richland, Washington.
Bergsman, K. E, T. B Bergman, D. W. Bergmann, G. E. Costley, M. T. Jansky,
D. S. Leach, R. L. McCormack, M. J. Monthey, A. N. Praga, I. K. Ullah,
W. L. Willis, and A. G. Hosler. 1995. K Basin Environmental Impact Statement
Technical Input. WHC-SD-SNF-TI-013, Rev. 0, Westinghouse Hanford Company,
Richland, Washington.
BNFL (British Nuclear Fuels Limited). 1994. "UK-Based Processing as a Spent
Fuel Management Option for US DOE." British Nuclear Fuels, Inc., Washington,
D.C.
Cashwell, J. W., K. S. Neuhauser, P. C. Reardon, and G. W. McNair. 1986.
Transportation Impacts of the Commercial Radioactive Waste Management Program.
SAND85-2715, Sandia National Laboratory, Albuquerque, New Mexico.
Clarke, R. K., J. T. Foley, W. F. Hartman, and D. W. Larson. 1976.
Severities of Transportation Accidents, Volume 1 - Summary. SLA-74-001,
Sandia National Laboratories, Albuquerque, New Mexico.
Daling, P. M., and M. S. Harris. 1994. Transportation Impact Analysis for
Shipment of Irradiated N-Reactor Fuel and Associated Materials. PNL-10249,Pacific Northwest Laboratory, Richland, Washington.
Dennis, A. W., J. T. Foley, W. F. Hartman, and D. W. Larson. 1978.
Severities of Transportation Accidents Involving Large Packages. SAND77-0001,
Sandia National Laboratories, Albuquerque, New Mexico.
DOE (U.S. Department of Energy). 1994. Environmental Assessment of Urgent-
Re7ief Acceptance of Foreign Research Reactor Spent Nuclear Fuel, DOE/EA-0912,
U.S. Department of Energy, Washington, D.C.
DOE (U.S. Department of Energy). 1995a. Department of Energy Programmatic
Spent Nuclear Fuel Management and Idaho National Engineering Laboratory
Environmental Restoration and Waste Management Programs Final Environmental
Impact Statement. The Programmatic EIS includes Vol. 1, Appendix A, Hanford
Site Spent Nuclear Fuel Management Program. DOE/EIS-0203-F, U.S. Department
of Energy, Washington, D.C.
B.59
DOE (U.S. Department of Energy). 1995b. Draft Environment Impact Statementon a Proposed Policy for the Acceptance of Foreign Research Reactor SpentNuclear Fuel, DOE/EIS-0218-D, U.S. Department of Energy, Washington, D.C.
Green, J. R. 1995. Transportation Impact Analysis for Shipment of LowSpecific Activity Nitric Acid. WHC-SD-TP-RPT-015, Rev. 1, Westinghouse
Hanford Company, Richland, Washington.
Grove Engineering, Inc. 1988. MICROSHIELD, Version 3. Rockville, Maryland.
ICRP (International Commission on Radiological Protection). 1991. 1990
Recommendations of the International Commission on Radiological Protection.ICRP Publication 60, Pergamon Press, Oxford.
Johnson, D. E., D. S. Joy, D. B. Clarke, and J. M. Jacobi. 1993a.
HIGHWAY 3.1 - An Enhanced Highway Routing Model: Program Description,Methodology, and Revised User's Manual. ORNL/TM-12124, Oak Ridge NationalLaboratory, Oak Ridge, Tennessee.
Johnson, P. E., D. S. Joy, D. B. Clarke, and J. M. Jacobi. 1993b. INTERLINE5.0 - An Expanded Railroad Routing Model: Program Description, Methodology,and Revised User's Manual. ORNL/TM-12090, Oak Ridge National Laboratory,
Oak Ridge, Tennessee.
Madsen, M. M., E. L. Wilmot, and J. M. Taylor. 1983. RADTRAN II User'sGuide. SAND82-2681, Sandia National Laboratories, Albuquerque, New Mexico.
Madsen, M. M., J. M. Taylor, R. M. Ostmeyer, and P. C. Reardon. 1986.
RADTRAN III. SAND84-0036, Sandia National Laboratories, Albuquerque,New Mexico.
Napier, B. A., D. L. Strenge, R. A. Peloquin, and J. V. Ramsdell. 1988.
GENII -The Hanford Environmental Radiation Dosimetry Software System.PNL-6584, Vols. 1 and 3, Pacific Northwest Laboratory, Richland, Washington.
Neuhauser, K. S., and F. L. Kanipe. 1992. RADTRAN 4: Volume 3--User'sGuide. SAND89-2370, Sandia National Laboratories, Albuquerque, New Mexico.
NRC (U.S. Nuclear Regulatory Commission). 1977. Final Environmental
Statement on the Transportation of Radioactive Material by Air and OtherModes. NUREG-0170, U.S. Nuclear Regulatory Commission, Washington, D.C.
B.60
Pippin, H. K., M. Hall, and T. Wierman. 1995. Scoping Evaluation for theOption of Transporting Spent Nuclear Fuel by Barge. SAIC Engineering DesignFile No. EIS-TRANS-39, Science Applications International Corp., Idaho Falls,
Idaho.
Rao, R. K., E. L. Wilmot, and R. E. Luna. 1982. Non-Radiological Impacts ofTransporting Radioactive Material. SAND81-1703, Sandia National Laboratories,Albuquerque, New Mexico.
Sutter, S. L. 1982. Accident Generated Particulate Materials and TheirCharacteristics--A Review of Background Information. PNL-4514, PacificNorthwest Laboratory, Richland, Washington.
B.61
APPENDIX C
NOISE ANALYSIS
APPENDIX C
NOISE ANALYSIS
The purpose of this appendix is to provide documentation of noise analy-
sis for this environmental impact statement (EIS). Construction and opera-
tional noise impacts have been assessed for several major projects at Hanford,
including the new production reactor (DOE 1991), and were not considered
significant. Construction of facilities associated with the alternatives in
this EIS is smaller in scope and duration than that for these other major
projects. Additionally, there is no blasting associated with the alterna-
tives. Consequently, the construction noise impacts of alternatives have a
low potential for adverse impact and are not evaluated further.
The remainder of this appendix addresses the estimation of traffic noise
associated with the alternatives in this EIS.
C.1 Estimation of Traffic Noise
A regression equation was developed from modeled data of traffic volume
(vehicles/hr) and estimated noise levels (1-hr equivalent sound level; Leq in
dB[A]). The Leq is the equivalent steady sound that, if continuous during a
specified time period, would contain the same total energy as the actual time-
varying sound over the monitored or modeled time period. The modeled data
were developed to assess traffic noise associated with the New Production
Reactor Environmental Impact Statement (DOE 1991). The regression equation
was:
Y = 48.35549 + 7.25929X
where Y is the predicted noise level in 1-hr Leq (dB[A]) and X is the log of
the hourly traffic volume.
For the analysis, four baseline levels of traffic volume were used: 10,
100, 1000, and 4000 vehicles/hr. The 10-vehicle/hr limit might approximate
early morning traffic. The 4000-vehicle/hr value is a conservative estimate
of maximum rush hour traffic volume. The larger the baseline traffic volume,
the lower the potential impact resulting from K Basin associated traffic noise
C.1
in the community. Incremental increases of traffic for each of these baseline
traffic volumes were adjusted by the estimated change in staff associated with
each alternative by year. Each increase in staff corresponds with an addi-
tional vehicle on the road. Carpooling or commuter buses would reduce the
noise estimates as fewer vehicles would be involved; consequently, this
approach provides a worst-case assessment. All traffic was modeled as passing
one location. Noise estimates were estimated at 5 in (15 ft) from the side of
the road. Noise impacts associated with construction and operation were
estimated by year for the period of 1995 through 2009, and 2010 through 2035
as a single period of time (Table C-1). The impact was then related to the no
action alternative to define incremental impacts as increases or decreases in
the 1-hr Leq (Table C-2).
Incremental increases in traffic noise for wet storage, passivation with
dry storage, calcination with dry storage, and onsite processing show minor
increases in traffic noise from 1995 through 2002. Depending on the alter-
native, decreases in noise levels would start in 2002 through 2005 and
continue through 2035 because of reduced staff requirements (see Table C-1).
The greatest incremental increases were associated with onsite processing.
This was an increase of 4.2 dB(A) at the baseline of 10 vehicles/hr for the
period of 2006 through 2009. Baseline rush hour traffic volumes would exceed
1000 vehicles/hr; therefore, the potential for adverse impacts is lower under
more realistic traffic flow conditions. These incremental increases would not
be expected to cause public complaint as they would occur during times of
normally high traffic flow (6:30 to 8:00 a.m. and 3:30 to 5:30 p.m.) and
existing baseline traffic noise levels would be relatively high.
C.2 Reference
DOE (U.S. Department of Energy). 1991. Draft Environmental Impact Statementfor the Siting, Construction and Operation of New Production Reactor Capacity.
Vol. 4, Appendices D-R, DOE/EIS-0144D, U.S. Department of Energy, Washington,
D.C.
C.2
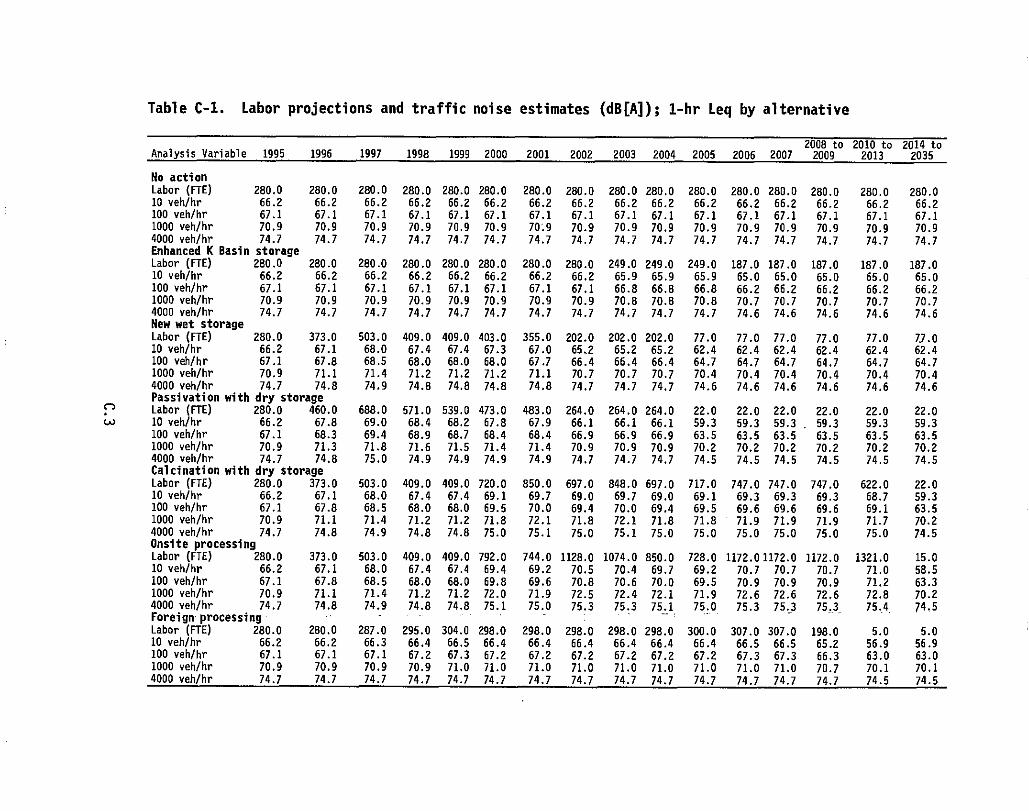
Table C-1. Labor projections and traffic noise estimates (dB[A]); 1-hr Leq by alternative
2008 to 2010 to 2014 toAnalysis Variable 1995 1996 1997 1998 1999 2000 2001 2002 2003 2004 2005 2006 2007 2009 2013 2035
No actionLabor (FTE) 280.0 280.0 280.0 280.0 280.0 280.0 280.0 280.0 280.0 280.0 280.0 280.0 280.0 280.0 280.0 280.010 veh/hr 66.2 66.2 66.2 66.2 66.2 66.2 66.2 66.2 66.2 66.2 66.2 66.2 66.2 66.2 66.2 66.2100 veh/hr 67.1 67.1 67.1 67.1 67.1 67.1 67.1 67.1 67.1 67.1 67.1 67.1 67.1 67.1 67.1 67.11000 veh/hr 70.9 70.9 70.9 70.9 70.9 70.9 70'.9 70.9 70.9 70.9 70.9 70.9 70.9 70.9 70.9 70.94000 veh/hr 74.7 74.7 74.7 74.7 74.7 74.7 74.7 74.7 74.7 74.7 74.7 74.7 74.7 74.7 74.7 74.7Enhanced K Basin storageLabor (FTE) 280.0 280.0 280.0 280.0 280.0 280.0 280.0 280.0 249.0 249.0 249.0 187.0 187.0 187.0 187.0 187.010 veh/hr 66.2 66.2 66.2 66.2 66.2 66.2 66.2 66.2 65.9 65.9 65.9 65.0 65.0 65.0 65.0 65.0100 veh/hr 67.1 67.1 67.1 67.1 67.1 67.1 67.1 67.1 66.8 66.8 66.8 66.2 66.2 66.2 66.2 66.21000 veh/hr 70.9 70.9 70.9 70.9 70.9 70.9 70.9 70.9 70.8 70.8 70.8 70.7 70.7 70.7 70.7 70.74000 veh/hr 74.7 74.7 74.7 74.7 74.7 74.7 74.7 74.7 74.7 74.7 74.7 74.6 74.6 74.6 74.6 74.6New wet storageLabor (FTE) 280.0 373.0 503.0 409.0 409.0 403.0 355.0 202.0 202.0 202.0 77.0 77.0 77.0 77.0 77.0 77.010 veh/hr 66.2 67.1 68.0 67.4 67.4 67.3 67.0 65.2 65.2 65.2 62.4 62.4 62.4 62.4 62.4 62.4100 veh/hr 67.1 67.8 68.5 68.0 68.0 68.0 67.7 66.4 66.4 66.4 64.7 64.7 64.7 64.7 64.7 64.71000 veh/hr 70.9 71.1 71.4 71.2 71.2 71.2 71.1 70.7 70.7 70.7 70.4 70.4 70.4 70.4 70.4 70.44000 veh/hr 74.7 74.8 74.9 74.8 74.8 74.8 74.8 74.7 74.7 74.7 74.6 74.6 74.6 74.6 74.6 74.6Passivation with dry storageLabor (FTE) 280.0 460.0 688.0 571.0 539.0 473.0 483.0 264.0 264.0 264.0 22.0 22.0 22.0 22.0 22.0 22.0
W 10 veh/hr 66.2 67.8 69.0 68.4 68.2 67.8 67.9 66.1 66.1 66.1 59.3 59.3 59.3. 59.3 59.3 59.3100 veh/hr 67.1 68.3 69.4 68.9 68.7 68.4 68.4 66.9 66.9 66.9 63.5 63.5 63.5 63.5 63.5 63.51000 veh/hr 70.9 71.3 71.8 71.6 71.5 71.4 71.4 70.9 70.9 70.9 70.2 70.2 70.2 70.2 70.2 70.24000 veh/hr 74.7 74.8 75.0 74.9 74.9 74.9 74.9 74.7 74.7 74.7 74.5 74.5 74.5 74.5 74.5 74.5Calcination with dry storageLabor (FTE) 280.0 373.0 503.0 409.0 409.0 720.0 850.0 697.0 848.0 697.0 717.0 747.0 747.0 747.0 622.0 22.010 veh/hr 66.2 67.1 68.0 67.4 67.4 69.1 69.7 69.0 69.7 69.0 69.1 69.3 69.3 69.3 68.7 59.3100 veh/hr 67.1 67.8 68.5 68.0 68.0 69.5 70.0 69.4 70.0 69.4 69.5 69.6 69.6 69.6 69.1 63.51000 veh/hr 70.9 71.1 71.4 71.2 71.2 71.8 72.1 71.8 72.1 71.8 71.8 71.9 71.9 71.9 71.7 70.24000 veh/hr 74.7 74.8 74.9 74.8 74.8 75.0 75.1 75.0 75.1 75.0 75.0 75.0 75.0 75.0 75.0 74.5Onsite processingLabor (FTE) 280.0 373.0 503.0 409.0 409.0 792.0 744.0 1128.0 1074.0 850.0 728.0 1172.0 1172.0 1172.0 1321.0 15.010 veh/hr 66.2 67.1 68.0 67.4 67.4 69.4 69.2 70.5 70.4 69.7 69.2 70.7 70.7 70.7 71.0 58.5100 veh/hr 67.1 67.8 68.5 68.0 68.0 69.8 69.6 70.8 70.6 70.0 69.5 70.9 70.9 70.9 71.2 63.31000 veh/hr 70.9 71.1 71.4 71.2 71.2 72.0 71.9 72.5 72.4 72.1 71.9 72.6 72.6 72.6 72.8 70.24000 veh/hr 74.7 74.8 74.9 74.8 74.8 75.1 75.0 75.3 75.3 75.1 75.0 75.3 75.3 75.3, 75.4. 74.5Foreign processing - -'Labor (FTE) 280.0 280.0 287.0 295.0 304.0 298.0 298.0 298.0 298.0 298.0 300.0 307.0 307.0 198.0 5.0 5.010 veh/hr 66.2 66.2 66.3 66.4 66.5 66.4 66.4 66.4 66.4 66.4 66.4 66.5 66.5 65.2 56.9 56.9100 veh/hr 67.1 67.1 67.1 67.2 67.3 67.2 67.2 67.2 67.2 67.2 67.2 67.3 67.3 66.3 63.0 63.01000 veh/hr 70.9 70.9 70.9 70.9 71.0 71.0 71.0 71.0 71.0 71.0 71.0 71.0 71.0 70.7 70.1 70.14000 veh/hr 74.7 74.7 74.7 74.7 74.7 74.7 74.7 74.7 74.7 74.7 74.7 74.7 74.7 74.7 74.5 74.5
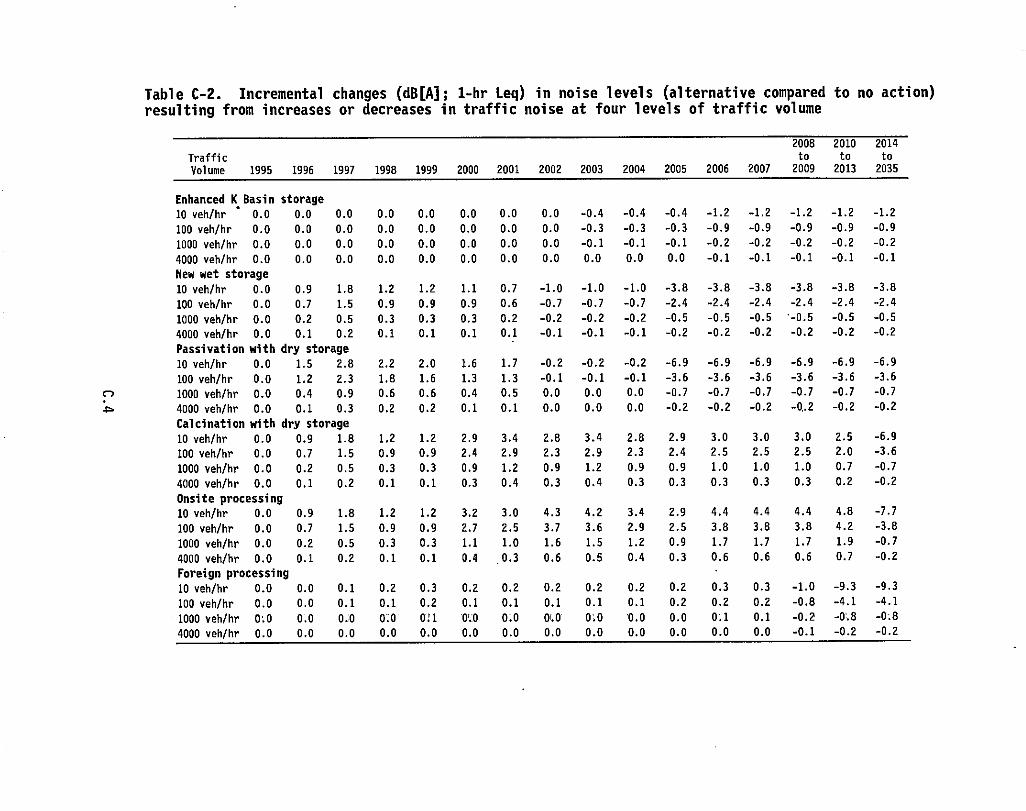
Table C-2. Incremental changes (dB[A]; 1-hr Leq) in noise levels (alternative compared to no action)resulting from increases or decreases in traffic noise at four levels of traffic volume
2008 2010 2014
Traffic to to to
Volume 1995 1996 1997 1998 1999 2000 2001 2002 2003 2004 2005 2006 2007 2009 2013 2035
a
Enhanced K Basin storage
30 veh/hr ' 0.0 0.0 0.0 0.0 0.0 0.0 0.0 0.0 -0.4 -0.4 -0.4 -1.2 -1.2 -1.2 -1.2 -1.2
100 veh/hr 0.0 0.0 0.0 0.0 0.0 0.0 0.0 0.0 -0.3 -0.3 -0.3 -0.9 -0.9 -0.9 -0.9 -0.9
1000 veh/hr 0.0 0.0 0.0 0.0 0.0 0.0 0.0 0.0 -0.1 -0.1 -0.1 -0.2 -0.2 -0.2 -0.2 -0.2
4000 veh/hr 0.0 0.0 0.0 0.0 0.0 0.0 0.0 0.0 0.0 0.0 0.0 -0.1 -0.1 -0.1 -0.1 -0.1
New wet storage
10 veh/hr 0.0 0.9 1.8 1.2 1.2 1.1 0.7 -1.0 -1.0 -1.0 -3.8 -3.8 -3.8 -3.8 -3.8 -3.8
100 veh/hr 0.0 0.7 1.5 0.9 0.9 0.9 0.6 -0.7 -0.7 -0.7 -2.4 -2.4 -2.4 -2.4 -2.4 -2.4
1000 veh/hr 0.0 0.2 0.5 0.3 0.3 0.3 0.2 -0.2 -0.2 -0.2 -0.5 -0.5 -0.5 '-0.5 -0.5 -0.5
4000 veh/hr 0.0 0.1 0.2 0.1 0.1 0.1 0.1 -0.1 -0.1 -0.1 -0.2 -0.2 -0.2 -0.2 -0.2 -0.2
Passivation with dry storage
10 veh/hr 0.0 1.5 2.8 2.2 2.0 1.6 1.7 -0.2 -0.2 -0.2 -6.9 -6.9 -6.9 -6.9 -6.9 -6.9
100 veh/hr 0.0 1.2 2.3 1.8 1.6 1.3 1.3 -0.1 -0.1 -0.1 -3.6 -3.6 -3.6 -3.6 -3.6 -3.6
1000 veh/hr 0.0 0.4 0.9 0.6 0.6 0.4 0.5 0.0 0.0 0.0 -0.7 -0.7 -0.7 -0.7 -0.7 -0.7
4000 veh/hr 0.0 0.1 0.3 0.2 0.2 0.1 0.1 0.0 0.0 0.0 -0.2 -0.2 -0.2 -0..2 -0.2 -0.2
Calcination with dry storage
10 veh/hr 0.0 0.9 1.8 1.2 1.2 2.9 3.4 2.8 3.4 2.8 2.9 3.0 3.0 3.0 2.5 -6.9
100 veh/hr 0.0 0.7 1.5 0.9 0.9 2.4 2.9 2.3 2.9 2.3 2.4 2.5 2.5 2.5 2.0 -3.6
1000 veh/hr 0.0 0.2 0.5 0.3 0.3 0.9 1.2 0.9 1.2 0.9 0.9 1.0 1.0 1.0 0.7 -0.7
4000 veh/hr 0.0 0.1 0.2 0.1 0.1 0.3 0.4 0.3 0.4 0.3 0.3 0.3 0.3 0.3 0.2 -0.2
Onsite processing
10 veh/hr 0.0 0.9 1.8 1.2 1.2 3.2 3.0 4.3 4.2 3.4 2.9 4.4 4.4 4.4 4.8 -7.7
100 veh/hr 0.0 0.7 1.5 0.9 0.9 2.7 2.5 3.7 3.6 2.9 2.5 3.8 3.8 3.8 4.2 -3.8
1000 veh/hr 0.0 0.2 0.5 0.3 0.3 1.1 1.0 1.6 1.5 1.2 0.9 1.7 1.7 1.7 1.9 -0.7
4000 veh/hr 0.0 0.1 0.2 0.1 0.1 0.4 . 0.3 0.6 0.5 0.4 0.3 0.6 0.6 0.6 0.7 -0.2
Foreign processing
10 veh/hr 0.0 0.0 0.1 0.2 0.3 0.2 0.2 0.2 0.2 0.2 0.2 0.3 0.3 -1.0 -9.3 -9.3
100 veh/hr 0.0 0.0 0.1 0.1 0.2 0.1 0.1 0.1 0.1 0.1 0.2 012 0.2 -0.8 -4.1 -4.1
1000 veh/hr 0'.0 0.0 OX 0:0 0':1 0'♦0 0:0 OCO 0i0 '0.0 0.0 0:1 0.1 -Oi2 -0.8 -0:8
4000 veh/hr 0.0 0.0 0.0 0.0 0.0 0.0 0.0 0.0 0.0 0.0 0.0 0.0 0.0 -0.1 -0.2 -0.2
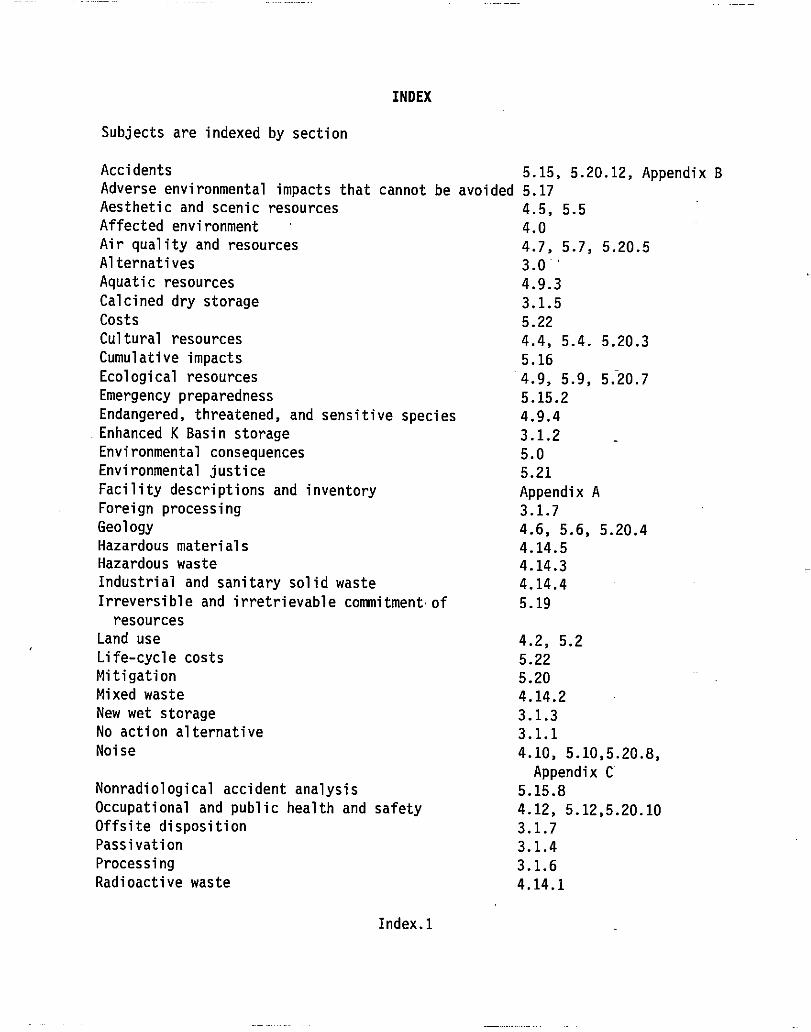
Aesthetic and scenic resources 4.5, 5.5Affected environment 4.0Air quality and resources 4.7, 5.7,Alternatives 3.0 'Aquatic resources 4.9.3Calcined dry storage 3.1.5Costs 5.22
Cultural resources 4.4, 5.4.Cumulative impacts 5.16Ecological resources 4.9, 5.9,Emergency preparedness 5.15.2Endangered, threatened, and sensitive species 4.9.4Enhanced K Basin storage 3.1.2Environmental consequences 5.0Environmental justice 5.21Facility descriptions and inventory Appendix AForeign processing 3.1.7Geology 4.6, 5.6,Hazardous materials 4.14.5Hazardous waste 4.14.3Industrial and sanitary solid waste 4.14.4Irreversible and irretrievable commitment-of 5.19
5.20.5
5.20.4
5.20.3
5.20.7
INDEX
Subjects are indexed by section
Accidents 5.15, 5.20.12, Appendix BAdverse environmental impacts that cannot be avoided 5.17
resources
Land use
Life-cycle costs
Mitigation
Mixed waste
New wet storage
No action alternative
Noise
Nonradiological accident analysis
Occupational and public health and safety
Offsite disposition
Passivation
Processing
Radioactive waste
4.2, 5.2
5.22
5.20
4.14.2
3.1.3
3.1.1
4.10, 5.10,5.20.8,
Appendix C
5.15.8
4.12, 5.12,5.20.10
3.1.7
3.1.4
3.1.6
4.14.1
Index.I
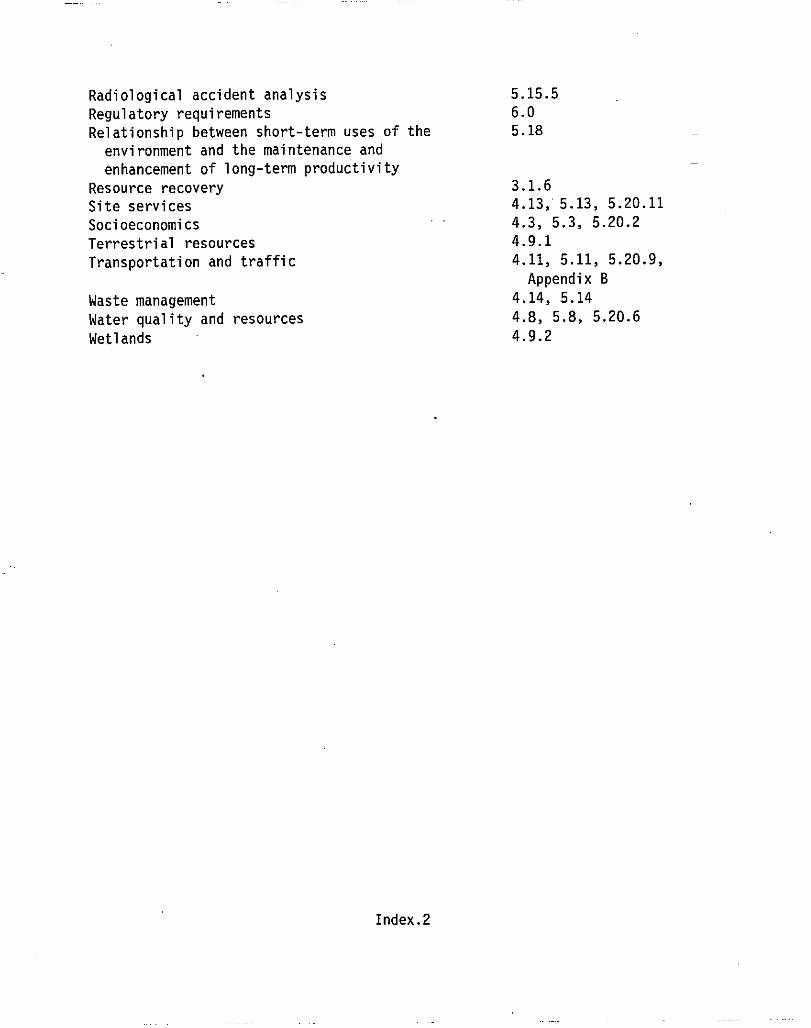
Radiological accident analysis 5.15.5
Regulatory requirements 6.0
Relationship between short-term uses of the 5.18
environment and the maintenance and
enhancement of long-term productivity
Resource recovery 3.1.6
Site services 4.13, 5.13, 5.20.11
Socioeconomics 4.3, 5.3, 5.20.2
Terrestrial resources 4.9.1
Transportation and traffic 4.11, 5.11, 5.20.9,
Appendix B
Waste management 4.14, 5.14
Water quality and resources 4.8, 5.8, 5.20.6
Wetlands 4.9.2
Index.2