Embed Size (px)
Citation preview

US Army Corps of Engineers BUILDING STRONG®
Management of the
Cumberland River System
Benjamin L. Rohrbach, P.E. Hydrology & Hydraulics Branch Chief
Nashville District
Tennessee Silver Jackets Meeting Old Hickory Lock and Dam 09 April 2014

BUILDING STRONG®
Agenda
Background History and Authorizing Legislation Authorized Purposes The Water Management Challenge Water Management Program Flood Operations Protecting the Lower Ohio and Mississippi Summary

BUILDING STRONG®
Background

BUILDING STRONG®
US Army Corps of Engineers Division Boundaries

BUILDING STRONG®
Great Lakes & Ohio River Division District Boundaries
BUILDING STRONG®
Nashville District River Basins & Boundaries
Lieutenant Colonel John L. Hudson
Commander and District Engineer
Nashville District
BUILDING STRONG®
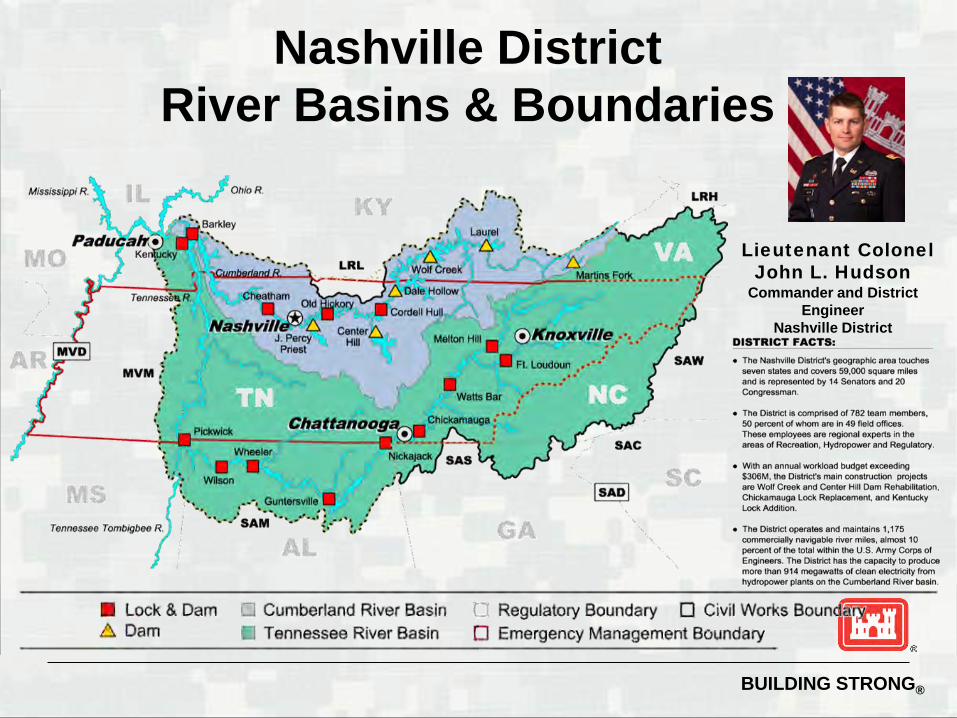
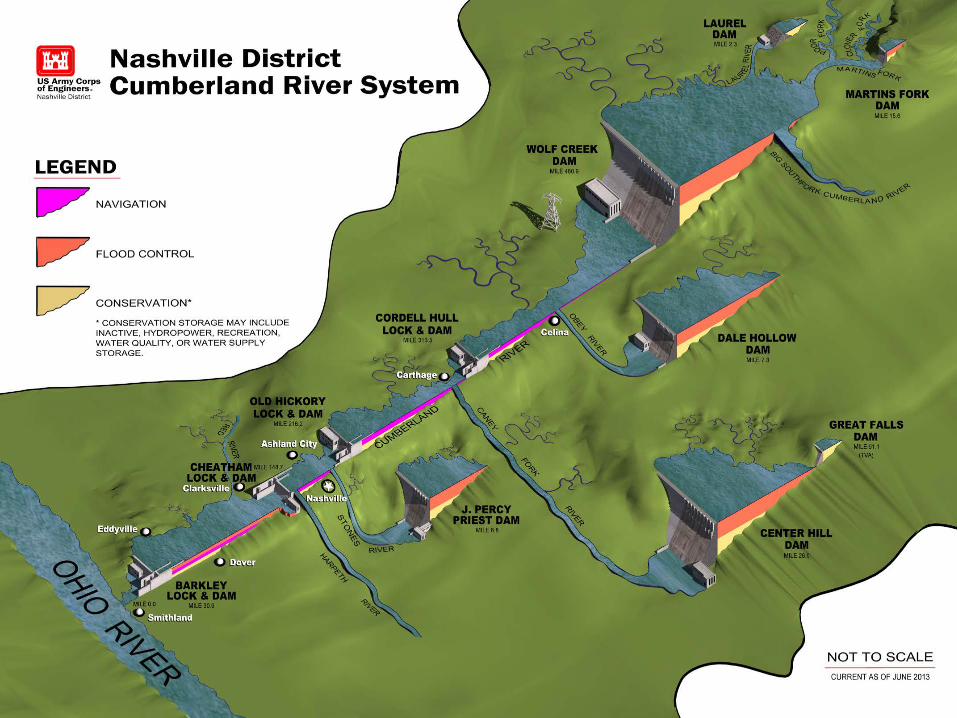
Cumberland River Basin ► Drainage area – 17,913 mi2
► Total length – 694 miles System of 10 multi-purpose projects
► Flood Damage Reduction • 5.3 M acre-feet of flood storage • > $2 B in flood damages prevented ($115 M/yr) • 77 % of drainage area above Nashville is controlled
► Hydropower • 9/10 projects have hydropower • 914 MW capacity from 28 hydropower turbines
► Navigation • 380 miles of navigable waterway (4 locks) • 795 miles on TN River (10 locks)
► Recreation • 5 Nashville District projects in top 25 nationally • 31.3 M visitors last year (> $700 M economic impact)
► Environmental Stewardship • Environmental restoration projects • Tremendous mussel and fish diversity • Home to two world record fish
Cumberland River Basin Reservoir System
Project Flood Control
Storage (acre-feet)
Wolf Creek 2,094,000
Dale Hollow 353,000
Center Hill 762,000
J. Percy Priest 350,000
Barkley 1,472,000
Total 5,031,000

BUILDING STRONG®
History and Authorizing Legislation

BUILDING STRONG®
Historic Flood 1926-1927

BUILDING STRONG®
Historic Flood 1937
BUILDING STRONG®
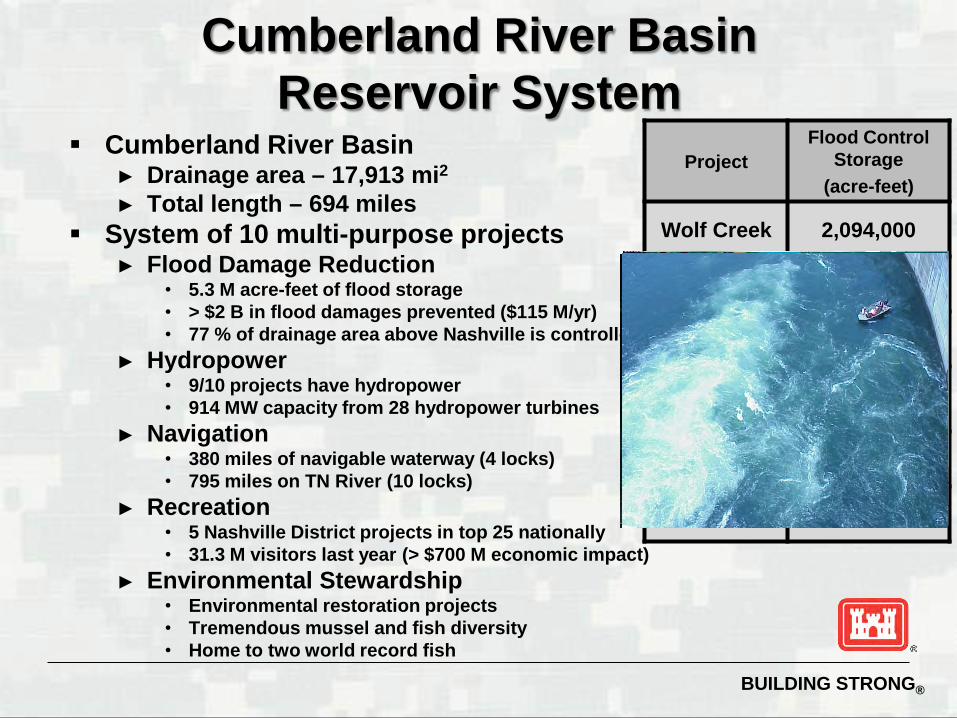
Low Water on the Cumberland River

BUILDING STRONG®
Flood Control Act of 1938: PL 75-761 ► Wolf Creek (construction finished in 1952) ► Dale Hollow (1953) ► Center Hill (1951) ► J. Percy Priest (1970) ► Three Islands ► Rossview ► Devil’s Jump
River and Harbor Act of 1946: PL 79-525 ► Celina ► Cordell Hull (1974) ► Old Hickory (1957) ► Cheatham (1959) ► Barkley (1966)
Flood Control Act of 1960: PL 86-645 ► Laurel (1977)
Flood Control Act of 1965: PL 89-298 ► Martins Fork (1978)
Authorizing Legislation

BUILDING STRONG®
Authorized Purposes
BUILDING STRONG®
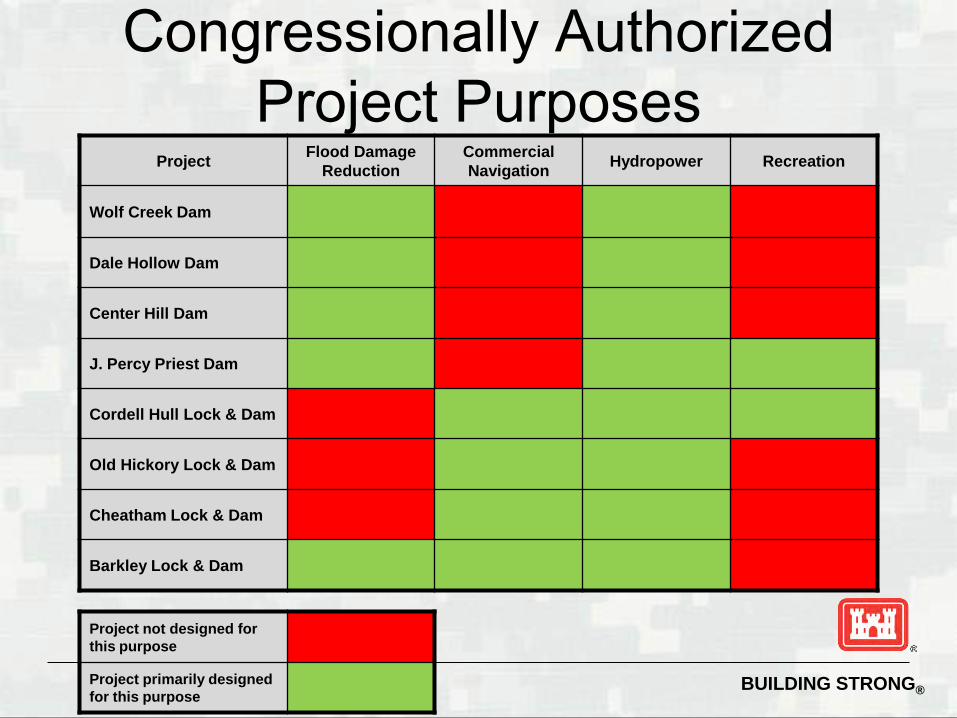
Congressionally Authorized Project Purposes
Project Flood Damage Reduction
Commercial Navigation Hydropower Recreation
Wolf Creek Dam
Dale Hollow Dam
Center Hill Dam
J. Percy Priest Dam
Cordell Hull Lock & Dam
Old Hickory Lock & Dam
Cheatham Lock & Dam
Barkley Lock & Dam
Project not designed for this purpose
Project primarily designed for this purpose
BUILDING STRONG®

BUILDING STRONG®
Congressionally Authorized Project Purposes
Wolf Creek Dam Old Hickory Lock & Dam
Project Design ► Flood Damage Reduction
► 37 ft zone ► Volume - 2,094,000 acre-feet
► Hydropower ► 50 ft zone ► Volume – 2,142,000 acre-feet
Project Design ► Flood Surcharge Storage
► 5 ft zone ► Volume - 125,000 acre-feet
► Hydropower ► 3 ft zone ► Volume – 63,000 acre-feet
► Commercial Navigation

BUILDING STRONG®
540’
580’
620’
660’
700’
740’
760’
460 480 500 520 540 560 Cumberland River Mile
Elev
atio
n
Flood Control Pool
Pittsburgh District (17)
Scale and Impact to the System
Huntington District (35)
726’ Louisville District (20) May 2011
Level
Lake Cumberland Available Storage
(Reduced flooding by
1.2’ at Cairo, IL)

BUILDING STRONG®
The Water Management Challenge
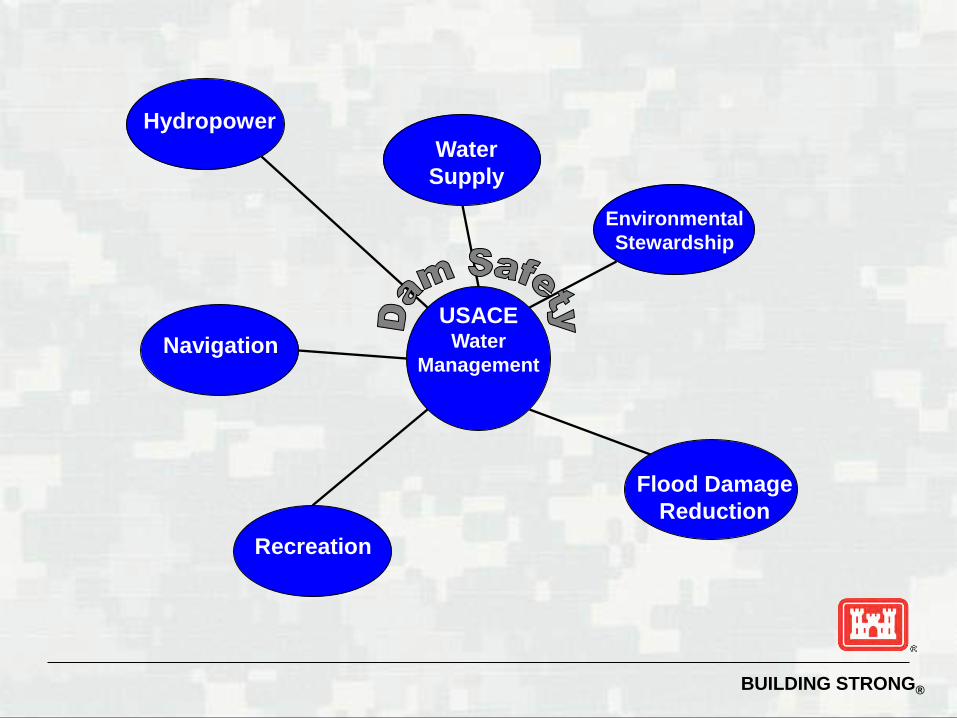
Water Control Water Quality Balancing Act Project Authorized Purposes Environmental Statutes Changing Societal Values/Expectations
BUILDING STRONG®
Flood Damage Reduction
USACE Water
Management
Hydropower
Recreation
Environmental Stewardship
Navigation
Water Supply
BUILDING STRONG®
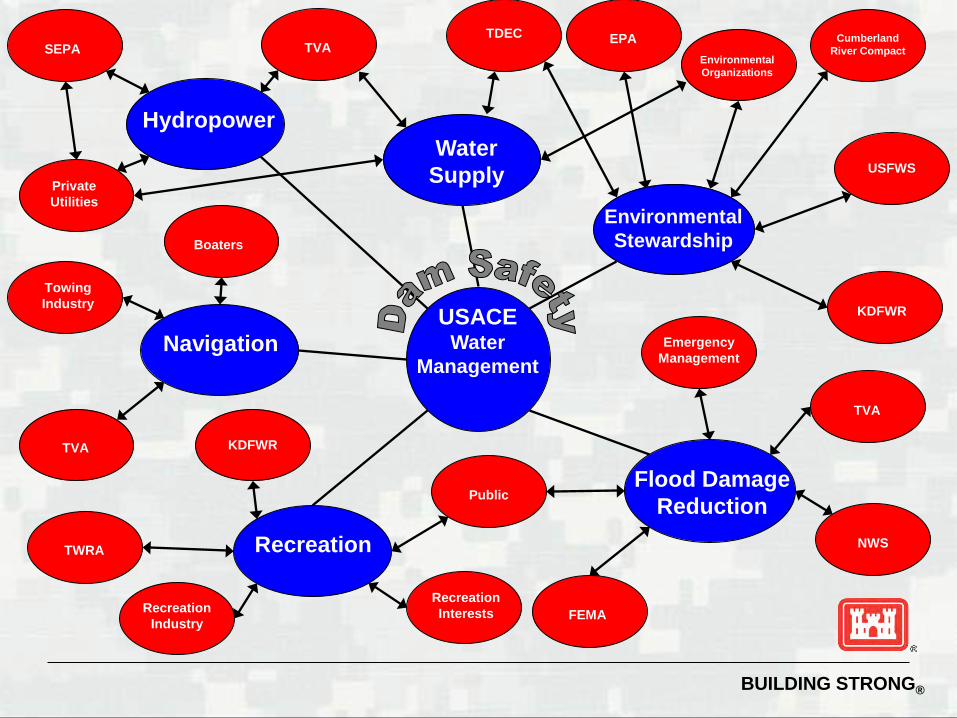
NWS
TVA
FEMA
USACE Water
Management
Hydropower
Recreation
Environmental Stewardship
Navigation Emergency Management
Towing Industry
TVA
Boaters
USFWS
EPA Environmental Organizations
KDFWR
Cumberland River Compact
TDEC
Private Utilities
TVA SEPA
KDFWR
TWRA
Recreation Interests
Public
Recreation Industry
Flood Damage Reduction
Water Supply

BUILDING STRONG®
Water Management Program
BUILDING STRONG®
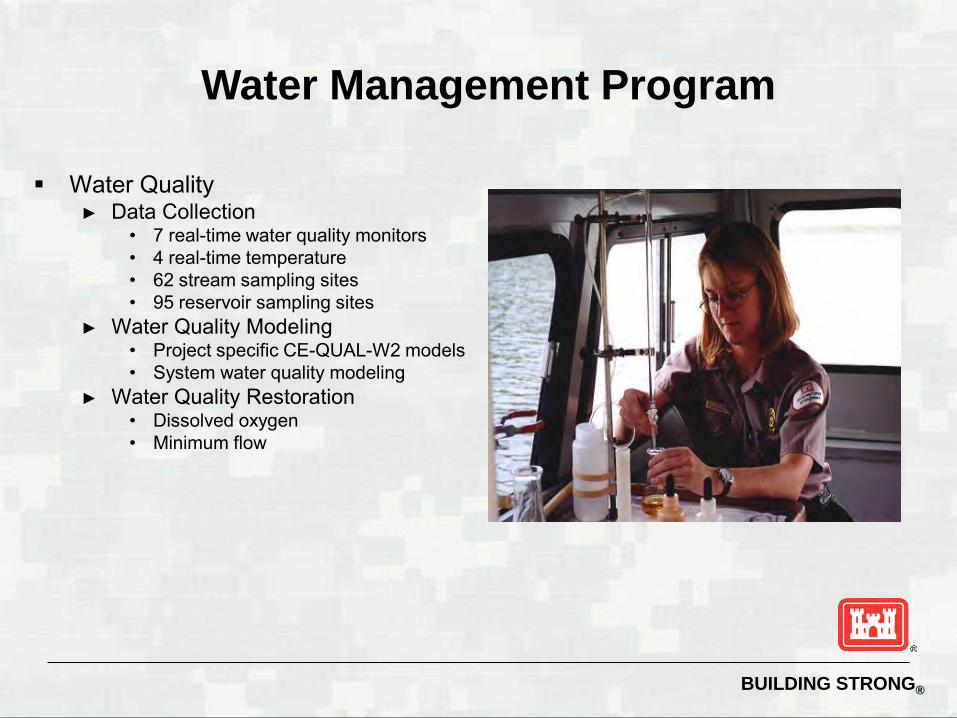
Water Quality ► Data Collection
• 7 real-time water quality monitors • 4 real-time temperature • 62 stream sampling sites • 95 reservoir sampling sites
► Water Quality Modeling • Project specific CE-QUAL-W2 models • System water quality modeling
► Water Quality Restoration • Dissolved oxygen • Minimum flow
Water Management Program

BUILDING STRONG®
Water Management Program
Water Control Program Data Collection Program
• Project data from 10 multi-purpose projects
• 75 rainfall sites • 45 river stage sites
Hydrology, Hydraulic, and Reservoir Simulation Modeling
Reservoir System Operations
• Daily analysis of reservoir conditions
• Balance operating objectives
• Prepare 8-day forecast

BUILDING STRONG®
Nashville District Water Management ► Multidisciplinary staff – engineers & scientists ► Perform complete system analysis every day
Nashville District Hydropower Operators ► 24/7 operational support
Great Lakes & Ohio River Water Management ► Ohio/Mississippi flood control operations ► Program oversight
Federal Partners ► Tennessee Valley Authority (TVA) ► National Weather Service ► U. S. Geological Survey
Water Management Team

BUILDING STRONG®
Water Management Center
BUILDING STRONG®
Flood Operations

BUILDING STRONG®
National Weather Service NWS generates observed radar rainfall 1
Flood Operations
Nashville WM runs hydrology models to forecast reservoir releases 2
Nashville USACE Water
Management
NWS uses forecast reservoir releases and rainfall to predict flood stages 3
Public
National Weather Service
BUILDING STRONG®
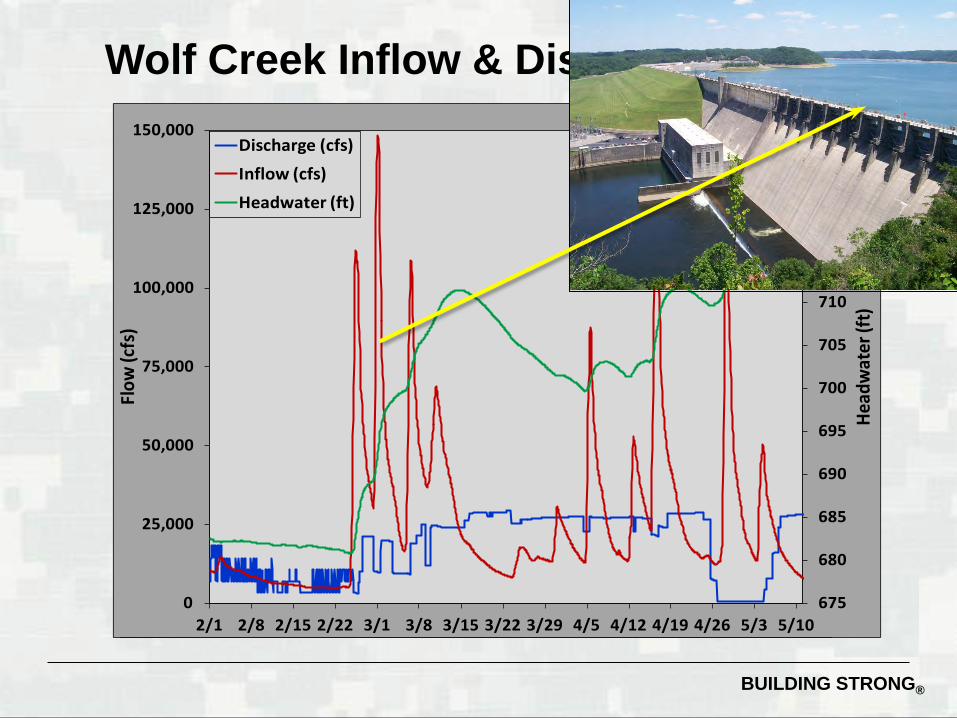
0
25,000
50,000
75,000
100,000
125,000
150,000
2/1 2/8 2/15 2/22 3/1 3/8 3/15 3/22 3/29 4/5 4/12 4/19 4/26 5/3 5/10
Flow
(cfs
)Discharge (cfs)
Inflow (cfs)
675
680
685
690
695
700
705
710
715
720
725
730
0
25,000
50,000
75,000
100,000
125,000
150,000
2/1 2/8 2/15 2/22 3/1 3/8 3/15 3/22 3/29 4/5 4/12 4/19 4/26 5/3 5/10
Head
wat
er (f
t)
Flow
(cfs
)Discharge (cfs)Inflow (cfs)Headwater (ft)
Wolf Creek Inflow & Discharge (2011)
BUILDING STRONG®
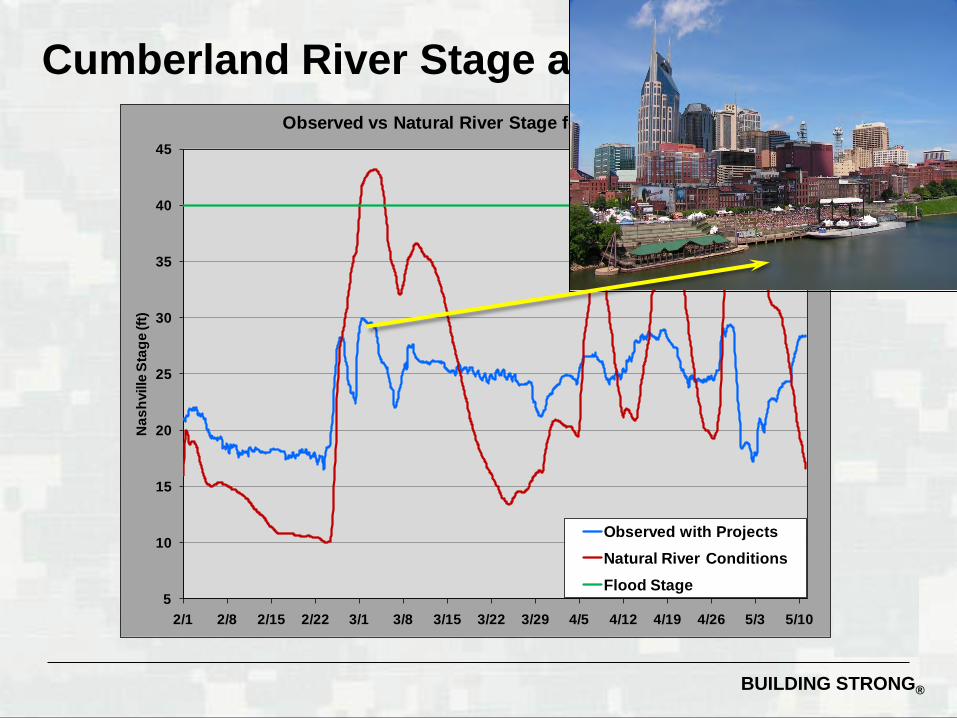
5
10
15
20
25
30
35
40
45
2/1 2/8 2/15 2/22 3/1 3/8 3/15 3/22 3/29 4/5 4/12 4/19 4/26 5/3 5/10
Nas
hvill
e St
age
(ft)
Observed vs Natural River Stage for Nashville
Observed with ProjectsNatural River ConditionsFlood Stage
Cumberland River Stage at Nashville (2011)
BUILDING STRONG®
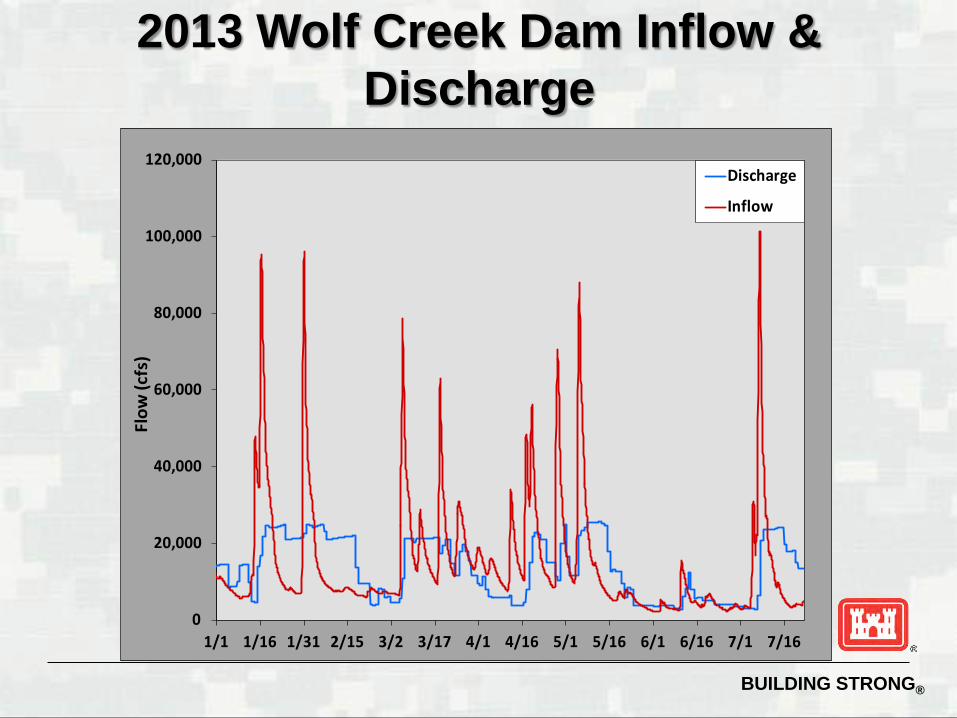
2013 Wolf Creek Dam Inflow & Discharge
0
20,000
40,000
60,000
80,000
100,000
120,000
1/1 1/16 1/31 2/15 3/2 3/17 4/1 4/16 5/1 5/16 6/1 6/16 7/1 7/16
Flow
(cfs
)
Discharge
Inflow
BUILDING STRONG®
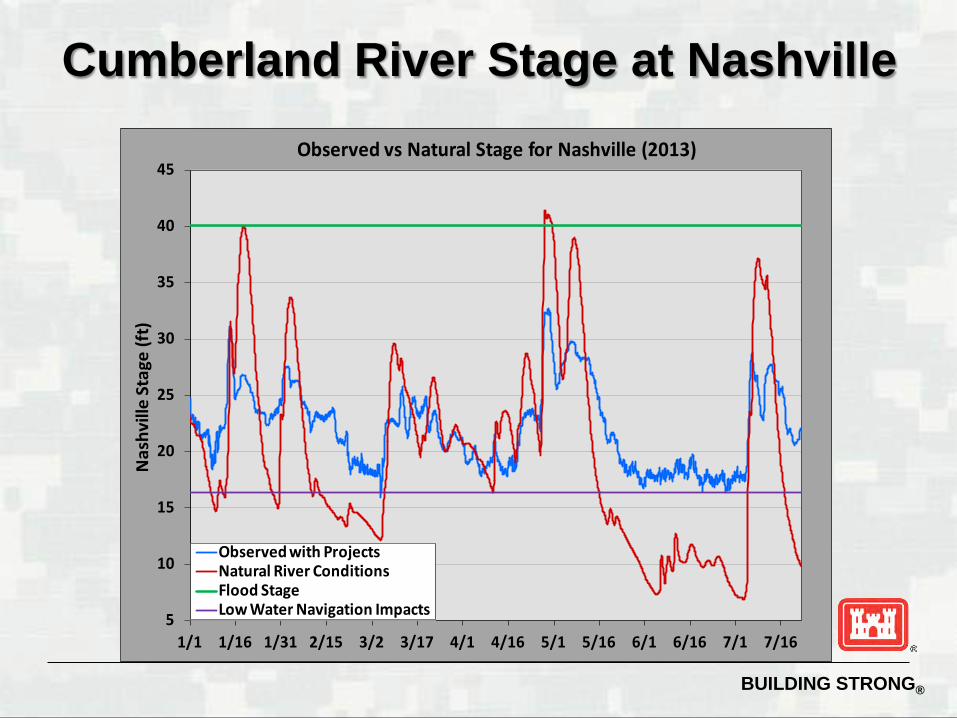
Cumberland River Stage at Nashville
5
10
15
20
25
30
35
40
45
1/1 1/16 1/31 2/15 3/2 3/17 4/1 4/16 5/1 5/16 6/1 6/16 7/1 7/16
Nas
hvill
e St
age
(ft)
Observed vs Natural Stage for Nashville (2013)
Observed with ProjectsNatural River ConditionsFlood StageLow Water Navigation Impacts

BUILDING STRONG®
Protecting the Lower Ohio and Mississippi Rivers

BUILDING STRONG®
Protecting the Lower Ohio and Mississippi Rivers
Canal
Paducah
Cairo
Smithland Lock
Lock 52
Lock 53
Birds Point- New Madrid Floodway
BUILDING STRONG®
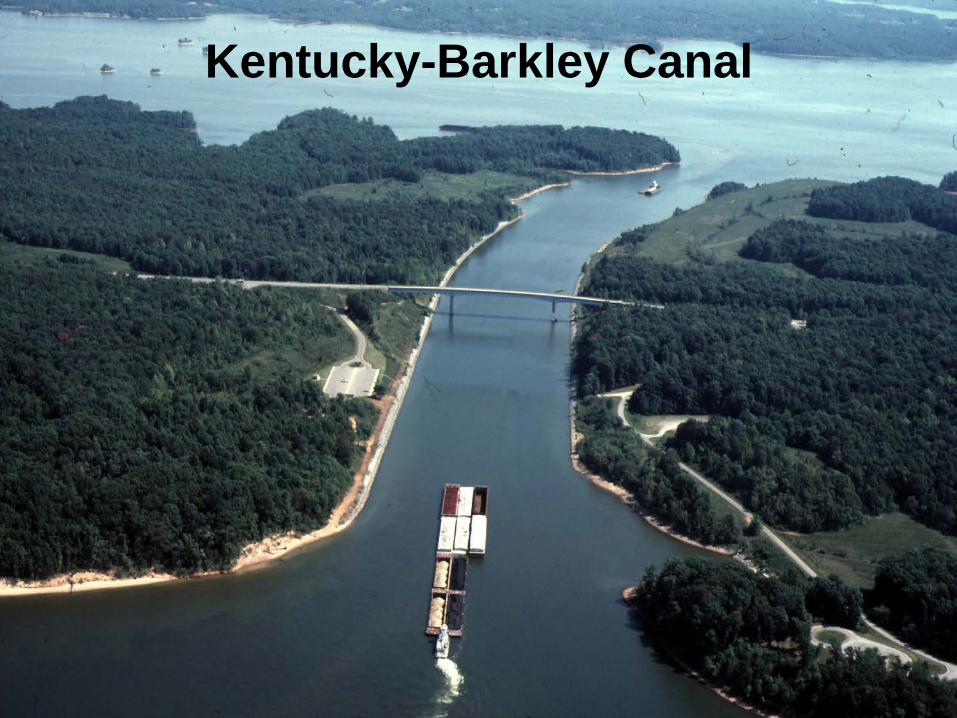
Kentucky-Barkley Canal
BUILDING STRONG®
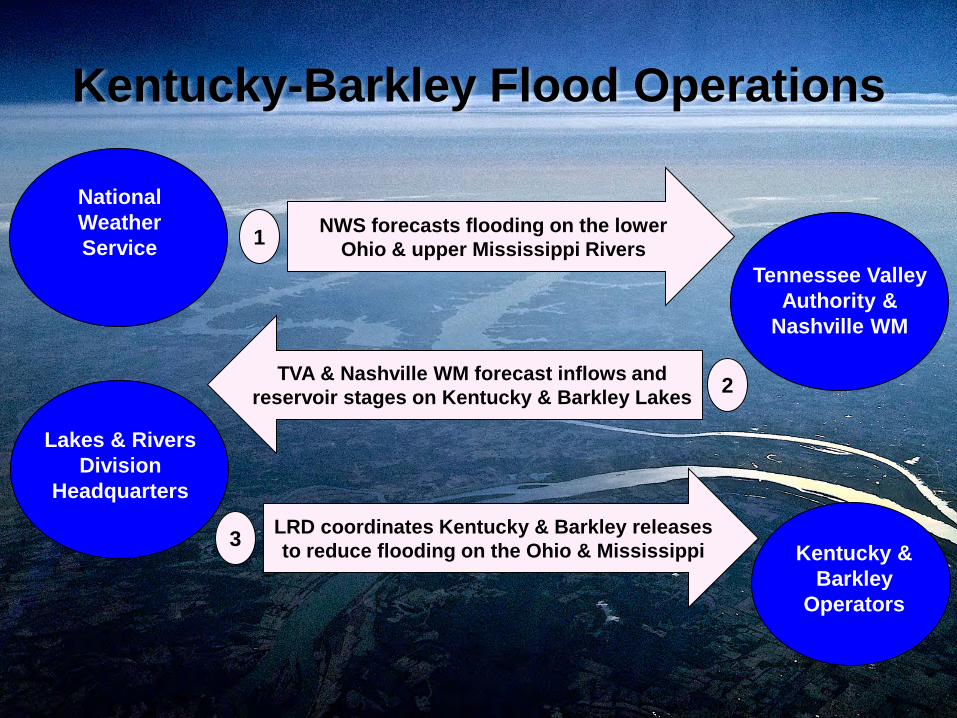
National Weather Service
NWS forecasts flooding on the lower Ohio & upper Mississippi Rivers 1
Kentucky-Barkley Flood Operations
TVA & Nashville WM forecast inflows and reservoir stages on Kentucky & Barkley Lakes 2
Tennessee Valley Authority &
Nashville WM
LRD coordinates Kentucky & Barkley releases to reduce flooding on the Ohio & Mississippi 3 Kentucky &
Barkley Operators
Lakes & Rivers Division
Headquarters

BUILDING STRONG®
Operation Watershed 4/26/2011 – 5/4/2011
Rainfall & Project Operations Cumberland River Basin
Dale Hollow Dam
Cordell Hull Lock & Dam
Old Hickory Lock & Dam
Cheatham Lock & Dam
Barkley Lock & Dam
Wolf Creek Dam
J. Percy Priest Dam
Center Hill Dam
Storage conserved in Barkley and Kentucky
4.65 feet
Dale Hollow – 0.51’
Center Hill – 0.95’
Wolf Creek – 2.54’
J. Percy Priest – 0.65’
Top of Hydropower Pool
Top of Hydropower Pool
Top of Flood Control Pool
Top of Flood Control Pool
Top of Hydropower Pool
Storage at Peak Elevation
Available
Pie area scaled to storage capacity
Peak
695
700
705
710
715
720
725
730
4/12 4/22 5/2 5/12 5/22 6/1
Elev
atio
n (ft
)
Operation Watershed - Wolf Creek DamObservedWithout Reductions
650
652
654
656
658
660
662
664
4/12 4/22 5/2 5/12 5/22 6/1
Elev
atio
n (ft
)
Operation Watershed - Dale Hollow Dam
ObservedWithout Reductions
625
630
635
640
645
650
655
660
4/12 4/22 5/2 5/12 5/22 6/1
Elev
atio
n (ft
)
Operation Watershed - Center Hill DamObservedWithout Reductions
488
490
492
494
496
498
500
502
504
506
4/12 4/22 5/2 5/12 5/22 6/1
Elev
atio
n (ft
)
Operation Watershed - J. Percy Priest Dam
ObservedWithout Reductions

BUILDING STRONG®
Project Headwater
(02/24/2011) Headwater
Crest Water Stored
(acre-feet)
Wolf Creek1 681.12 725.96 1,992,000
Dale Hollow 643.75 660.16 459,000
Center Hill1 625.70 658.15 576,000
J. Percy Priest 483.75 501.65 280,000
Total 3,307,0002
Water Stored After February 24, 2011
1 Wolf Creek and Center Hill Dams have been classified as DSAC 1 dams and are under pool restrictions to assure the stability of the dams. 2 This volume of water is roughly equivalent to 1.08 quadrillion gallons of water or if stacked on a football field it would be 3.2 million feet (606 miles) high.

BUILDING STRONG®
Protecting the Lower Ohio and Mississippi Rivers
Canal
Paducah
Cairo
Smithland Lock
Lock 52
Lock 53
Birds Point- New Madrid Floodway
May 2011 Flood Stage Reduction at Cairo
2-ft (0.62-m) due to Cumberland River Projects 0.8-ft (0.24-m) due to Tennessee River Projects 3.8-ft (1.2-m) for all LRD Storage Projects

BUILDING STRONG®
Summary
BUILDING STRONG®
Cumberland River System Water Management
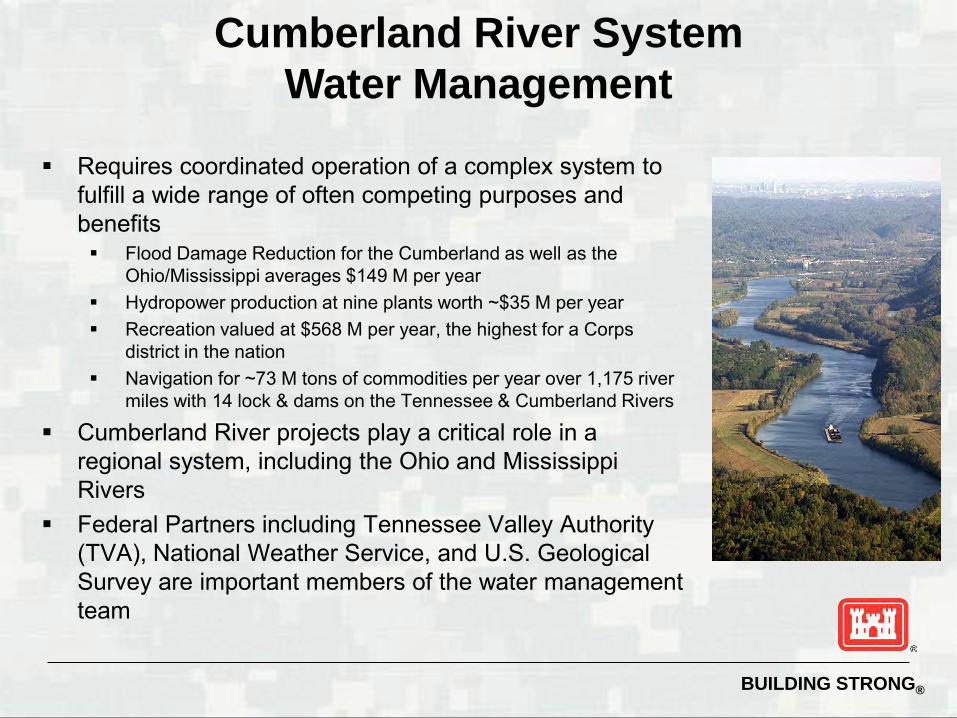
Requires coordinated operation of a complex system to fulfill a wide range of often competing purposes and benefits Flood Damage Reduction for the Cumberland as well as the
Ohio/Mississippi averages $149 M per year Hydropower production at nine plants worth ~$35 M per year Recreation valued at $568 M per year, the highest for a Corps
district in the nation Navigation for ~73 M tons of commodities per year over 1,175 river
miles with 14 lock & dams on the Tennessee & Cumberland Rivers
Cumberland River projects play a critical role in a regional system, including the Ohio and Mississippi Rivers
Federal Partners including Tennessee Valley Authority (TVA), National Weather Service, and U.S. Geological Survey are important members of the water management team

BUILDING STRONG®
Questions?