Embed Size (px)
Citation preview

Management of Wisconsin SoilsFifth Edition
A3588
TOC-FM 10/20/05 10:07 AM Page 1

TOC-FM 10/20/05 10:07 AM Page 2

Management of Wisconsin Soils
A3588
Fifth Edition
TOC-FM 10/20/05 10:07 AM Page 3

TOC-FM 10/20/05 10:07 AM Page 4
Soil formation and classification
What is soil? . . . . . . . . . . . . . . 1Soil formation . . . . . . . . . . . . . 1
Factors of soil formation . . . . . . 1Soil-forming processes . . . . . . . 3Weathering. . . . . . . . . . . . . 3
Soil classification . . . . . . . . . . . . 4Soil horizons . . . . . . . . . . . . 4Soil name . . . . . . . . . . . . . 5
Soil maps and mapping reports . . . . . 5Soil factors affecting management . . . 7
Soil slope . . . . . . . . . . . . . . 7Soil depth . . . . . . . . . . . . . 7Soil drainage . . . . . . . . . . . . 7
Land capability classes . . . . . . . . . 8
Physical properties of soil Texture . . . . . . . . . . . . . . . . 11
Importance of soil texture. . . . . 12Determining soil texture
by feel . . . . . . . . . . . . . 13Structure . . . . . . . . . . . . . . . 14Organic matter . . . . . . . . . . . . 15Mineral matter . . . . . . . . . . . . 16Bulk density . . . . . . . . . . . . . . 18Tilth. . . . . . . . . . . . . . . . . . 18Color . . . . . . . . . . . . . . . . . 19Temperature . . . . . . . . . . . . . . 19
Soil waterHydrologic cycle . . . . . . . . . 21Evapotranspiration (ET) . . . . . 22Water-use efficiency. . . . . . . . 24How water is held in soil . . . . . 24Forms of soil water . . . . . . . . 25Water movement in soil. . . . . . 26Irrigation scheduling . . . . . . . 27
TillagePurpose of tillage . . . . . . . . . . . 29Kinds of tillage . . . . . . . . . . . . 29
Conventional tillage . . . . . . . 29Conservation tillage. . . . . . . . 31
Comparison of tillage systems . . . . . 34Estimating residue cover. . . . . . . . 37Soil crusting . . . . . . . . . . . . . . 38Soil compaction . . . . . . . . . . . . 38Effect of tillage on nutrient
availability . . . . . . . . . . . . . 39
Soil and water conservationRunoff and erosion . . . . . . . . . . 42Factors influencing erosion . . . . . . 43Soil and water conservation
practices . . . . . . . . . . . . . . 43Crop rotation . . . . . . . . . . . 43Conservation tillage. . . . . . . . 44Contour tillage . . . . . . . . . . 44Strip cropping . . . . . . . . . . 45Cover crops . . . . . . . . . . . . 45Terraces and diversions . . . . . . 45Grass waterways . . . . . . . . . 45Buffer/filter strips . . . . . . . . . 45
Wind erosion . . . . . . . . . . . . . 46Tillage translocation . . . . . . . . . . 47Conservation incentives . . . . . . . . 47
Soil acidity and limingSoil pH . . . . . . . . . . . . . . . . 49
Importance of soil pH . . . . . . 50How soils become acidic . . . . . . . 51
Acid parent material . . . . . . . 51Leaching of basic cations . . . . . 51Crop removal of basic cations . . . 51Acid-forming fertilizers . . . . . . 52Carbonic acid . . . . . . . . . . . 52Acid rain . . . . . . . . . . . . . 53Oxidation of sulfides . . . . . . . 53
Nature of soil acidity . . . . . . . . . 53Optimum pH for crops . . . . . . . . 53Liming acid soils . . . . . . . . . . . 55
Benefits of liming . . . . . . . . . 55Liming materials . . . . . . . . . 58How much lime to apply . . . . . 59When to apply aglime . . . . . . 62Other factors to consider . . . . . 62Correcting soil alkalinity . . . . . 63
1
2
3
6
5
4
C O N T E N T S
TOC-FM 10/20/05 10:07 AM Page 5
Biological properties of soilSoil fauna . . . . . . . . . . . . . . . 66
Arthropods . . . . . . . . . . . . 66Mollusks . . . . . . . . . . . . . 66Earthworms. . . . . . . . . . . . 66Protozoa . . . . . . . . . . . . . 66Nematodes . . . . . . . . . . . . 66Mammals . . . . . . . . . . . . . 66
Soil flora. . . . . . . . . . . . . . . . 66Algae . . . . . . . . . . . . . . . 66Bacteria . . . . . . . . . . . . . . 66Actinomycetes . . . . . . . . . . 67Fungi . . . . . . . . . . . . . . . 67
Carbon cycle . . . . . . . . . . . . . 67Oxygen requirements . . . . . . . . . 68Symbiotic relationships . . . . . . . . 68Role of microorganisms in nutrient
transformations . . . . . . . . . . . 69Plant roots. . . . . . . . . . . . . . . 69
Soil chemistry and plant nutritionEssential plant nutrients . . . . . . . . 71Non-essential elements . . . . . . . . 73Properties of chemical elements,
atoms, ions, and salts . . . . . . . . 73Sources of plant nutrients in the soil. . 74
Soil solution . . . . . . . . . . . 74Exchange sites on clay and
organic matter . . . . . . . . . 74Complexed or chelated nutrients . 75Decomposition of organic matter . 75Low-solubility compounds . . . . 75Soil rocks and minerals . . . . . . 76
What constitutes a fertile soil . . . . . 76
Soil and fertilizer sources of plant nutrients
Nitrogen . . . . . . . . . . . . . . . . 78Function in plants . . . . . . . . . 78Reactions in soils . . . . . . . . . . 79Sources of nitrogen. . . . . . . . . 82Timing of nitrogen fertilizer
applications . . . . . . . . . . . 85Nitrogen fertilizer timing summary 85
Phosphorus . . . . . . . . . . . . . . . 86Function in plants . . . . . . . . . 86Reactions in soils . . . . . . . . . . 86
Sources of phosphate . . . . . . . . 87Methods of phosphorus fertilizer
application . . . . . . . . . . . 89Potassium. . . . . . . . . . . . . . . . 89
Function in plants . . . . . . . . . 89Reactions in soils . . . . . . . . . . 90Sources of potassium . . . . . . . . 91
Secondary nutrients. . . . . . . . . . . 92Calcium . . . . . . . . . . . . . . 92Magnesium . . . . . . . . . . . . 93Sulfur . . . . . . . . . . . . . . . 94
Micronutrients . . . . . . . . . . . . . 97Boron . . . . . . . . . . . . . . . 97Manganese . . . . . . . . . . . . . 98Zinc . . . . . . . . . . . . . . . . 98Copper. . . . . . . . . . . . . . . 99Iron . . . . . . . . . . . . . . . . 99Molybdenum . . . . . . . . . . . 99Chlorine . . . . . . . . . . . . . . 99Nickel . . . . . . . . . . . . . . . 99
Summary of the fate of applied nutrients . . . . . . . . . . . . . . 100
Fertilizer analysis . . . . . . . . . . . 101Forms of commercial fertilizer. . . . . 101
Fertilizer grades . . . . . . . . . . 102Methods of fertilizer application. . . . 103
Starter or row application . . . . . 103Broadcast and topdress
applications . . . . . . . . . . 106Sidedress applications . . . . . . . 106Injection . . . . . . . . . . . . . 106Foliar application . . . . . . . . . 106Dribble application . . . . . . . . 107Fertigation . . . . . . . . . . . . 107
Soil amendmentsOrganic amendments . . . . . . . . 109
Manure . . . . . . . . . . . . . 109Biosolids. . . . . . . . . . . . . 113Whey . . . . . . . . . . . . . . 114Miscellaneous organic
amendments . . . . . . . . . 115Inorganic amendments. . . . . . . . 116
Gypsum . . . . . . . . . . . . . 116Non-traditional soil amendments . . 117
Soil conditioners. . . . . . . . . 117
7
8
9 10
TOC-FM 10/20/05 10:07 AM Page 6
Mineral nutrient sources. . . . . 117Wetting agents and surfactants . 118Biological inoculants and
activators . . . . . . . . . . . 118Plant stimulants and growth
regulators . . . . . . . . . . . 119
Environmental concerns andpreventive soil managementpractices
Nitrates in groundwater . . . . . . . 121Rate of application . . . . . . . 122Methods to improve nitrogen
rate recommendations . . . . 123Nitrogen credits . . . . . . . . . 125Timing of nitrogen applications . 125Manure management . . . . . . 126Irrigation scheduling . . . . . . 126Urease inhibitors . . . . . . . . 127Best management practices . . . 127
Phosphorus in surface water . . . . . 127Rate of application . . . . . . . 127Phosphorus credits . . . . . . . 127Manure management . . . . . . 128Erosion control . . . . . . . . . 129Identification of landscape areas
prone to phosphorus loss . . . 129Best management practices
for phosphorus . . . . . . . . 130Nutrient management planning . . . 130
Soil testing. . . . . . . . . . . . 130Assessment of on-farm
nutrient resources . . . . . . . 130Nutrient crediting . . . . . . . . 130Consistency with the farm’s
conservation plan . . . . . . . 131Manure inventory . . . . . . . . 131Manure spreading plan . . . . . 131The 590 nutrient management
standard . . . . . . . . . . . 131Non-essential elements . . . . . . . . 131
Soil testing, soil testrecommendations, and plant analysis
Soil testing . . . . . . . . . . . . . . 135Soil sampling . . . . . . . . . . 136Tillage considerations . . . . . . 139Timing and frequency . . . . . . 139Analyzing the soil . . . . . . . . 139Interpreting the analytical results 140
Soil test recommendations . . . . . . 141Nitrogen recommendations . . . 141Phosphate and potash
recommendations. . . . . . . 142Aglime recommendations . . . . 145Secondary nutrient
recommendations. . . . . . . 147Micronutrient recommendations 150Soil test report . . . . . . . . . . 152
Plant analysis. . . . . . . . . . . . . 153Uses of plant analysis . . . . . . 153Limitations of plant analysis . . . 154Collecting plant samples. . . . . 154Interpretation of plant analyses . 155Tissue testing . . . . . . . . . . 157
Economics of lime and fertilizer use
Returns from aglime . . . . . . . . . 160Returns from the use of fertilizer . . . 161
Availability of capital . . . . . . 162Price changes . . . . . . . . . . 162Residual carryover . . . . . . . . 163Substituting fertilizer for land . . 164
Calculating the cost of plant nutrients . . . . . . . . . . 164
Single nutrient fertilizer . . . . . 165Mixed fertilizer . . . . . . . . . 165
Calculating profits from improved soil management . . . . . . . . . 166
Annual costs for long-term capital investments . . . . . . . . . . 166
Sources of increased returns . . . 166Comparison of net returns . . . . . . 166Feeding higher crop yields
through livestock . . . . . . . . . 167
Index. . . . . . . . . . . . . . . . . 169
11
13
12
TOC-FM 10/20/05 10:07 AM Page 7

TOC-FM 10/20/05 10:07 AM Page 8
IntroductionPeople look at soils differently.
People may view soil in the home as asource of “dirt” or as a good mediumfor growing house plants.Construction engineers look at soil interms of its ability to support abuilding or highway. Butagriculturalists look at soil in terms ofits ability to support the growth ofplants. Obviously, this is its mostimportant function because the soilultimately supports nearly all plant andanimal life.
Soil appears to be simply an inertmixture of different-sized particles. Butthis certainly is not the case. Livingorganisms by the billions, decayingand residual organic matter, a widevariety of minerals, and air and waterinteract to form a dynamic andexceedingly complex biological,physical and chemical system. Forexample, a teaspoon of soil maycontain as many microorganisms asthere are people on the earth. Thissame teaspoon of soil contains morechemical atoms than there are drops ofwater in Lake Superior and LakeMichigan combined!
The various chemical, physical,and biological processes taking place inthe soil are complex and sometimesnot easily understood. But for farmersand land managers to make wisedecisions in the future, they mustunderstand these processes. In this ageof rapid technological change, we needto know why things happen—knowingonly what to do is often inadequate.
Both grain and livestock farmers needto produce crops efficiently in order tosucceed economically. And to producecrops efficiently, they must understandand use good soil managementpractices.
Growth of a colony of organisms,whether microbes, higher plants,animals, or people, is limitedultimately by exhaustion of the foodsupply or toxic accumulation ofwastes. As the world populationcontinues to grow, agriculturalists willbe challenged as never before toincrease production while managingwastes so as to recycle nutrientswithout polluting water supplies.
Good soil management is a keyfactor in maintaining the quality ofour water resources. Protecting oursurface water supplies requires that wefollow a good soil and waterconservation program. Runoff waterand soil erosion losses account formuch of the nitrogen and phosphorusentering our lakes and streams fromrural areas. To protect groundwater wemust develop nutrient managementprograms that support productivecropping systems and simultaneouslyreduce leaching of nutrients. If we areinterested in agricultural sustainabilityand environmental protection, wemust develop a conservation ethic andtruly become “stewards of the soil.”
Emmett E. SchulteLeo M. Walsh
“If you are thinking a year ahead, sow seed. If you arethinking 10 years ahead, plant a tree. If you are thinking100 years ahead, educate the people.”
Old Chinese saying
TOC-FM 10/20/05 10:07 AM Page 9

TOC-FM 10/20/05 10:07 AM Page 10
“Soil is a living entity: thecrucible of life, a seethingfoundry in which matter andenergy are in constant fluxand life is continually createdand destroyed.”
D. Hillel, Out of the Earth, 1991
What is soil?Soil is the upper layer of earth
which may be tilled and cultivated.More specifically, soils are theunconsolidated (loose) inorganic andorganic materials on the surface of theearth which support the growth ofplants. Weathered rocks and mineralsmake up the inorganic fraction of thesoil and can supply all essential plantnutrients except nitrogen. Virtually allof the nitrogen, as well as a portion ofseveral other essential plant nutrients, isstored in the organic matter.
Soil formationSoils are formed from many kinds
of materials exposed on the land surfaceknown as parent materials. Physical andchemical weathering processes graduallychange rocks, glacial deposits, and windor water deposits into soil over longperiods of time. These processes areinfluenced by variations in climate,plants and animals, and topography.
Factors of soil formationParent material, climate, living
organisms, topography, and time arethe five factors of soil formation. Somewould include humans as a sixth factor,for our activities can markedly changethe formation of many soils. The typeof soil developed depends on theamount of time a parent material in aspecific topography is exposed to theeffects of climate and vegetation.
Parent materials that make up Wisconsin’s soils are (1) bedrockweathered in place, (2) deposits left byglaciers, (3) materials deposited bywind or water, and (4) decaying plantmaterial.
The bedrock geology of an areaoften directly or indirectly influencessoil formation. Soils in the west centraland central parts of the state are theresult of direct influence of bedrock. Inthese areas the weathering of thesandstone bedrock left predominatelysandy soils. The bedrock has indirectlyinfluenced those soils formed in glacialtill. In northern and north centralWisconsin the glacial till is acid becausethe till was derived from the weatheringof acidic granitic rock in northernWisconsin; whereas, calcareous glacialtill was developed in the southern andeastern parts of the state where thepredominant bedrock is limestone. Themap, Bedrock Geology of Wisconsin,shows the location of the different kindsof bedrock throughout the state. Seethe back side of the map for additionalinformation on Wisconsin bedrock.
Glacial deposits and the action ofglaciers in altering the landscape haveprofoundly influenced the formation ofmost soils in Wisconsin. Many soils areformed partially or entirely out ofglacial “drift” or till. In these areas thesoils have taken on many of thephysical and chemical characteristics ofthe till. Acid soils are formed from acidtill; stony soils are formed from stony
Soil formation and classification
1
C H A P T E R
1
C-1 10/18/05 11:06 AM Page 1
till; red-colored soils are formed fromred-colored till, etc. The Ice Age Depositsof Wisconsin map shows the glacialdeposits in Wisconsin. The back sidecontains additional information on theice age in Wisconsin.
Materials deposited by wind andwater have been important in the for-mation of many soils in the state. Thewind-blown or aeolian silts (loess) arequite deep in the unglaciated area inwestern and southwestern Wisconsin. Asilt cap of more than 4 feet is commonnear the Mississippi River. The silt capor loess becomes progressively thinneras one moves in a northeasterlydirection. Little, if any, silt cap exists onthe soils in the eastern and northeasternparts of the state. Soils with a deep siltcap are very productive because they areusually well-drained and store relativelylarge quantities of available water. Also,they are generally easy to work and freefrom stones.
Alluvial soils have been formed as aresult of materials being deposited bywater. These soils are commonly foundon stream terraces and range from siltyto very sandy, and from well-drained tovery poorly drained.
Decaying plant material in bogsand low-lying areas is the parentmaterial of organic soils. The lack ofoxygen in these saturated soils preventsdecomposition, allowing organicmaterial to accumulate. Generally,organic soils contain at least 20% oforganic matter (by weight), and thisorganic layer is more than 1 foot thick.Organic soils occupy approximately7.5% of Wisconsin’s surface and areoften referred to as mucks or peats.Mucks are more highly decomposedthan peats to the extent that the kind ofplants from which they formed is noteasily identified. Mineral soils containless than 20% organic matter.
Climate is defined as weather as itexists over a long period of time.Climate changes with time, and soilsoften reflect the effects of past climates.
Precipitation and temperaturechanges both help form soil. Waterfrom rain and melting snow dissolvessome soil minerals. Freezing andthawing break rocks and large soilparticles into smaller pieces.
High temperatures and high levelsof precipitation often speed weathering.The effect of climate can be seen bestby comparing soils over large areas. Forinstance, the more intensive weatheringin southeastern United States hasresulted in the development ofextensive areas of brick-red colored soilcontaining relatively low amounts oforganic matter and high levels ofoxidized iron. In contrast, most soils inthe Midwest contain much moreorganic matter and lower amounts ofoxidized iron. Soils in the northernGreat Plains differ from soils in thenorth central region mainly becausethey developed in a drier climate. Soilsformed in drier climates typically havea relatively high pH and more plantnutrients due to less leaching.
Even within Wisconsin there isenough climatic difference from thenorth to the south to producenoticeable variation in the soils.Northern Wisconsin’s cooler climateslows decomposition of organic matteron the surface of the soil. This slowlydecomposing organic matter producesorganic substances that promoteleaching of minerals and nutrients fromthe soil. Northern Wisconsin soils are,therefore, more leached and tend to beless fertile than those further south.
Climate also influences the kindsof plants and animals that will grow inand on the soil. For instance, undernatural conditions grasses and shrubs
grow on soils where the climate isrelatively dry while trees tend to growin the more humid climates.
Living organisms, plants andanimals, play an important role in soilformation. Plants extract nutrientsfrom the subsoil as they grow. Thesenutrients are subsequently deposited onthe soil surface when the plants die.Soil differences frequently can berelated to the type of plants grown onthem over long periods of time. In partsof southern Wisconsin, tall prairiegrasses growing on soil produced athick black layer of surface soil high inhumus. Much of this humus camefrom the decay of grass roots. Trees, onthe other hand, deposit their leaves,needles and twigs on the top of the soil,and tree roots do not die each year asmost grass roots do. Therefore, mostforest soils do not have thick blacksurface layers.
Fire has also played an importantrole in determining the nativevegetation growing on our soils. Forexample, in southern Wisconsin theprairies burned frequently. Fireprevented the development of forests;thus, in these areas only a few large oaktrees growing in fields of grass survived.
Bacteria and fungi, which aremicroscopic plants, are a vital part ofthe soil. They decompose organicmatter and produce materials that bindsoil particles together in aggregates, andthey help make certain nutrientsavailable for plants.
Animals have a lot to do with soilformation. Earthworms burrow throughthe soil making large holes that improveboth water and air movement in thesoil. They also consume large amountsof dead organic matter and often carryplant material from the surface downseveral inches into the soil. This hastensdecomposition of organic matter and
M A N A G E M E N T O F W I S C O N S I N S O I L S2
C-1 10/18/05 11:06 AM Page 2
tends to thicken the dark surface soil.Other small animals living in the soilalso eat and partially decompose organicmatter from leaves, grass blades, andother plant materials.
Humans have had an extremelyimportant effect on soil formation—both beneficial and destructive. Theycan cause erosion, compaction anddepletion of essential nutrients, or theycan improve the physical and chemicalconditions in soil by using sound tillagepractices and by adding lime, fertilizer,manure, and crop residues.
Topography refers to the lay ofthe land—the patterns of hills, valleys,and plains. It strongly influences waterflow across and through soils, and thishas a major influence on soil formation.For instance, soils may be very shallowor “thin” where slopes are steep andserious erosion has occurred. In theeastern part of the state the topographyhas been strongly influenced by theglaciers. Many low-lying soils—peatsand mucks, for example—occur in bogsand poorly drained depressions.Topography becomes especiallyimportant when soils are farmed. Steepslopes require excellent soil conservationpractices, while low-lands anddepressional areas need surface or tiledrainage for optimum crop production.
Time, measured in thousands ofyears, is the final element in soildevelopment. Most Wisconsin soilshave formed since the glaciers retreated.With the exception of southwesternWisconsin, most of the state has beencovered by glaciers within the last30,000 years, and much of the eastern,central and northern parts of the statewere covered by ice or water within thelast 8,000 to 15,000 years. Because ofleaching and the weathering process,older soils tend to be less fertile thansoils of relatively recent origin.
Soil-forming processesMany complex physical, biological,
and chemical transformations occur insoils. Any set of events that intimatelyaffects the soil in which it operates is asoil-forming process. There are manysoil-forming processes active in soil.Only the more important processes willbe discussed here. Not all processes areactive in every soil. Some processespredominate in one soil, others inanother soil. The terms defined belowidentify several of the more importantsoil-forming processes.
decomposition—breakdown of a mineralor organic matter into itscomponents.
eluviation—downward movement ofsolid material, usually clay particles,within a soil profile.
erosion—loss of material from thesurface layer of soil by the action ofwater or wind.
gleization—reduction of iron underwaterlogged soil conditions, givingsubsoils a blue-grey color.
humification—transformation of raworganic matter into humus.
illuviation—the accumulation of finesoil particles which move from upperlayers of soil to the subsoil.
laterization—chemical migration ofsilica out of the soil profile andconcentration of oxides andhydroxides of iron and aluminum.Occurs in tropical regions.
leaching—movement of solublematerial through the soil inpercolating water.
mineralization—conversion of organiccompounds into inorganic elements.
salinization—accumulation of solublesalts (usually sulfates or chlorides ofcalcium, magnesium, potassium andsodium). Usually found in semi-aridregions.
More than one soil-formingprocess can be active simultaneously orsequentially. It is the net effect of theactive processes that give a soil itsunique characteristics.
WeatheringWeathering transforms parent
materials in the process of soilformation. This weathering may bephysical, chemical, or both. Chemicalweathering is not very significant inlarge rocks because there is relativelylittle surface area exposed. Physicalweathering is more important.
Physical weathering involvesnatural forces that break rocks intosmaller pieces. These forces includetemperature, wind, water, ice, andplant roots. Rapid temperature changescan cause rocks to crack. Rocks aremade up of two or more minerals, eachmineral expanding and contractingdifferently in response to temperaturechanges. Some early pioneers built fireson large rocks, then doused them withcold water to break them into smallerrocks that could be hauled away.
Wind strong enough to carry sandparticles can sandblast rock surfaces.Moving water, especially that carryingsediment, is also abrasive. Pebbles on thebottom of a stream tend to be roundedor smooth as a result of the tumblingaction of the water. Water freezing incracks and crevices also causesdisintegration by expansion. InWisconsin, glacial activity broke rocksinto smaller fragments and ground somerocks to silt-sized particles. Plant rootsgrowing into cracks in rocks can alsocause cracking and breaking.
C h a p t e r 1 . S o i l f o r m a t i o n a n d c l a s s i f i c a t i o n 3
C-1 10/18/05 11:06 AM Page 3
Chemical weathering becomessignificant once physical weatheringreduces parent materials to the size ofsand or smaller particles. The mostimportant chemical reactions aresolution, hydration, hydrolysis,decomposition, and complexation.
Solution refers to the dissolving of asolid in a liquid. Water is the liquid insoils and is considered a universalsolvent. Every solid is soluble in waterto some extent. Most rocks andminerals are negligibly soluble. Mostchloride and nitrate salts are highlysoluble; whereas many phosphatecompounds are only slightly soluble.When the solubility of a dissolvedsubstance is exceeded, it precipitates orsolidifies and drops out of solution. Forexample, when hard water is heated,calcium carbonate precipitates to formlime on the walls of a teakettle. Also,some dissolved materials may beadsorbed or attached onto the surfacesof existing soil particles.
Hydration is the addition of waterto a substance. For example, theaddition of water to dry calcium sulfate
(CaSO4) results in gypsum(CaSO4•2H2O), with two watermolecules bound to each calciumsulfate molecule.
Hydrolysis is a form ofdecomposition in which the hydrogen-hydroxyl (H-OH) bond in water issplit, and the resulting ions combinewith a reactant. For example, feldspar(KAlSi3O8) and water (H2O) react toform silicic acid (HAlSi3O8) andpotassium hydroxide (KOH).
Decomposition involves thebreakdown of a substance into itscomponent parts. Organic matter, forexample, is broken down into carbondioxide and nutrients which can berecycled for new plant growth.
Oxidation, a form of decomposition,is the combination of oxygen with asubstance, as in burning. Organicmatter decomposes (oxidizes) in soils.Also, some elements such as nitrogen,sulfur, iron, and manganese undergooxidation in well-aerated soils. Underwaterlogged conditions, reduction—the reverse of oxidation—can occur.Under these conditions, the removal of
part of the oxygen from iron andmanganese oxides makes them moresoluble, allowing them to be leached.
Complexation refers to thesurrounding of metallic ions by groupsof anions or neutral molecules.Ammonia, for example, forms acomplex with copper by surrounding acopper ion with four ammoniamolecules. Organic molecules can formcomplexes with metallic ions. Somelarge organic molecules form two ormore bonds with the same metallicions. These are known as chelates(Greek: chele = claw). Some chelates,such as ZnEDTA, make good fertilizersbecause they prevent precipitation ofthe metallic ion, keeping it moreavailable to plants. In chemicalweathering, chelates help make themetals in rocks and minerals slightlymore soluble.
Soil classificationThe factors and processes of soil
formation discussed above haveproduced many kinds of soil inWisconsin. Soils vary considerablyfrom place to place, sometimes evenwithin a small field. Soils are classifiedin a manner similarly to how plantsand animals are classified. Instead ofgenus and species, however, the lowestor most specific unit of soilclassification is the soil series. Higherlevels of classification include thefamily, subgroup, great group,suborder, and order. The classificationsystem implies that one soil differsfrom another sufficiently to makeclassification meaningful.
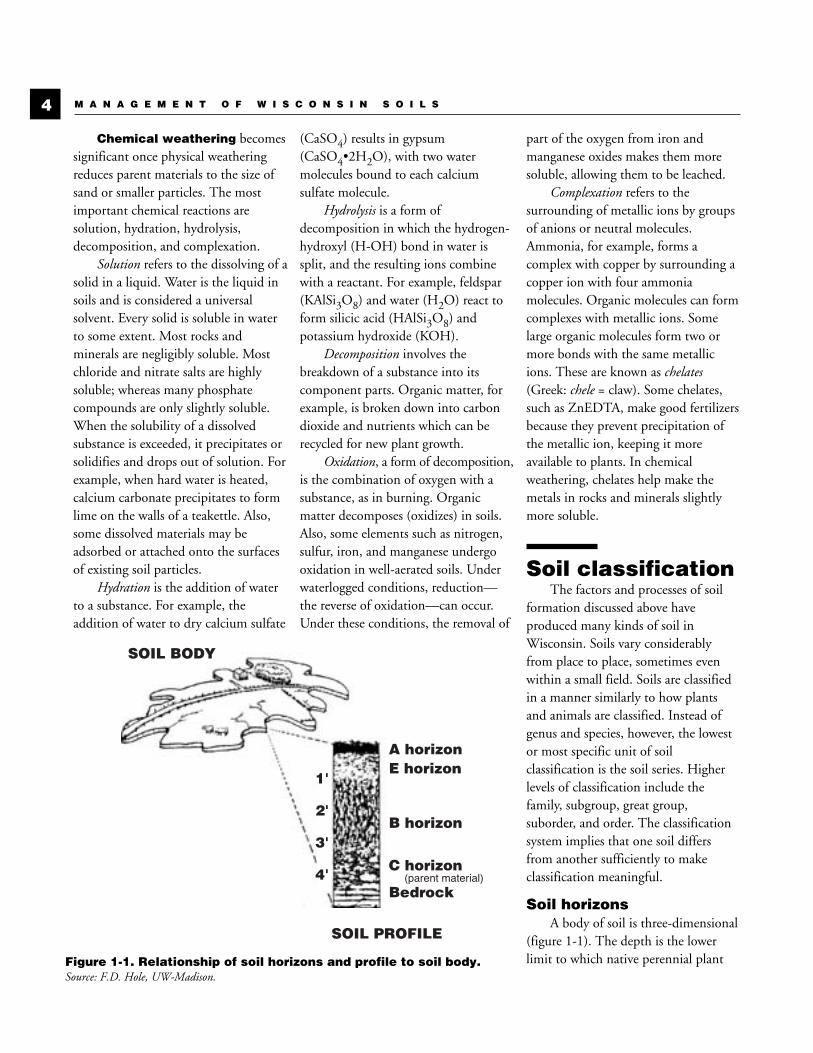
Soil horizonsA body of soil is three-dimensional
(figure 1-1). The depth is the lowerlimit to which native perennial plant
M A N A G E M E N T O F W I S C O N S I N S O I L S4
A horizonE horizon
B horizon
C horizon
Bedrock
SOIL PROFILE
SOIL BODY
1'
2'
3'
4' (parent material)
Figure 1-1. Relationship of soil horizons and profile to soil body.Source: F.D. Hole, UW-Madison.
C-1 10/18/05 11:06 AM Page 4
roots extend. In Wisconsin, soil depthusually ranges from 1 foot in shallowsoils over bedrock to about 7 feet. Thesurface area may be less than an acre tomore than 100 acres. Usually we viewonly the soil surface or the depth towhich the soil is tilled. In ditches andalong road cuts one can see the verticaldimension. A vertical section of soil iscalled a soil profile. This profiletypically has distinct layers calledhorizons. Horizons are the result ofvarious soil-forming processesoccurring in a particular soil.
Accumulation of organic matter underprairie, for example, results in dark-colored surface soil. In contrast, soilsformed under forests are much lighterin color. Regardless of originalvegetation, the downward movement ofclay and iron oxides results in theformation of subsoil horizons that aremore dense than the surface soil. Thedepths at which the different horizonsoccur depends on the intensity of thepredominant soil-forming factorsacting on a particular soil.
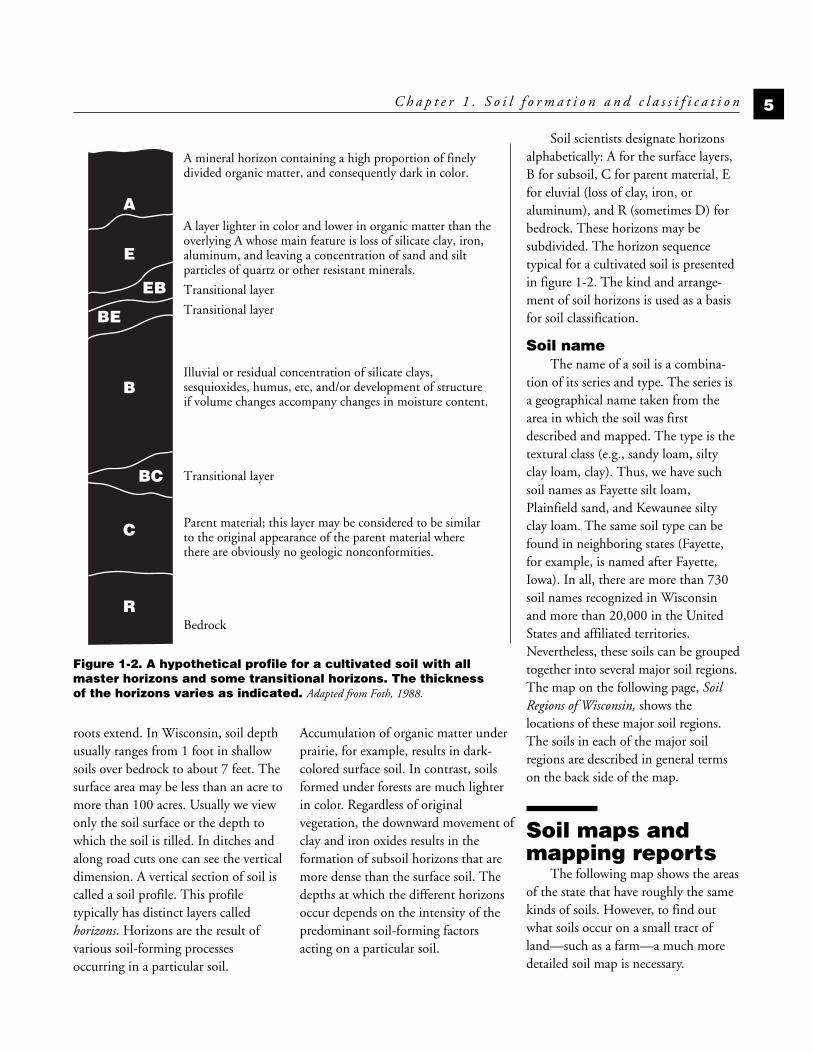
Soil scientists designate horizonsalphabetically: A for the surface layers,B for subsoil, C for parent material, Efor eluvial (loss of clay, iron, oraluminum), and R (sometimes D) forbedrock. These horizons may besubdivided. The horizon sequencetypical for a cultivated soil is presentedin figure 1-2. The kind and arrange-ment of soil horizons is used as a basisfor soil classification.
Soil nameThe name of a soil is a combina-
tion of its series and type. The series isa geographical name taken from thearea in which the soil was firstdescribed and mapped. The type is thetextural class (e.g., sandy loam, siltyclay loam, clay). Thus, we have suchsoil names as Fayette silt loam,Plainfield sand, and Kewaunee siltyclay loam. The same soil type can befound in neighboring states (Fayette,for example, is named after Fayette,Iowa). In all, there are more than 730soil names recognized in Wisconsinand more than 20,000 in the UnitedStates and affiliated territories.Nevertheless, these soils can be groupedtogether into several major soil regions.The map on the following page, SoilRegions of Wisconsin, shows thelocations of these major soil regions.The soils in each of the major soilregions are described in general termson the back side of the map.
Soil maps andmapping reports
The following map shows the areasof the state that have roughly the samekinds of soils. However, to find outwhat soils occur on a small tract ofland—such as a farm—a much moredetailed soil map is necessary.
C h a p t e r 1 . S o i l f o r m a t i o n a n d c l a s s i f i c a t i o n 5
EB
E
A
BE
B
BC
C
R
Figure 1-2. A hypothetical profile for a cultivated soil with allmaster horizons and some transitional horizons. The thickness of the horizons varies as indicated. Adapted from Foth, 1988.
Parent material; this layer may be considered to be similarto the original appearance of the parent material wherethere are obviously no geologic nonconformities.
A mineral horizon containing a high proportion of finelydivided organic matter, and consequently dark in color.
A layer lighter in color and lower in organic matter than theoverlying A whose main feature is loss of silicate clay, iron,aluminum, and leaving a concentration of sand and siltparticles of quartz or other resistant minerals.
Transitional layer
Transitional layer
Transitional layer
Illuvial or residual concentration of silicate clays,sesquioxides, humus, etc, and/or development of structureif volume changes accompany changes in moisture content.
Bedrock
C-1 10/18/05 11:06 AM Page 5
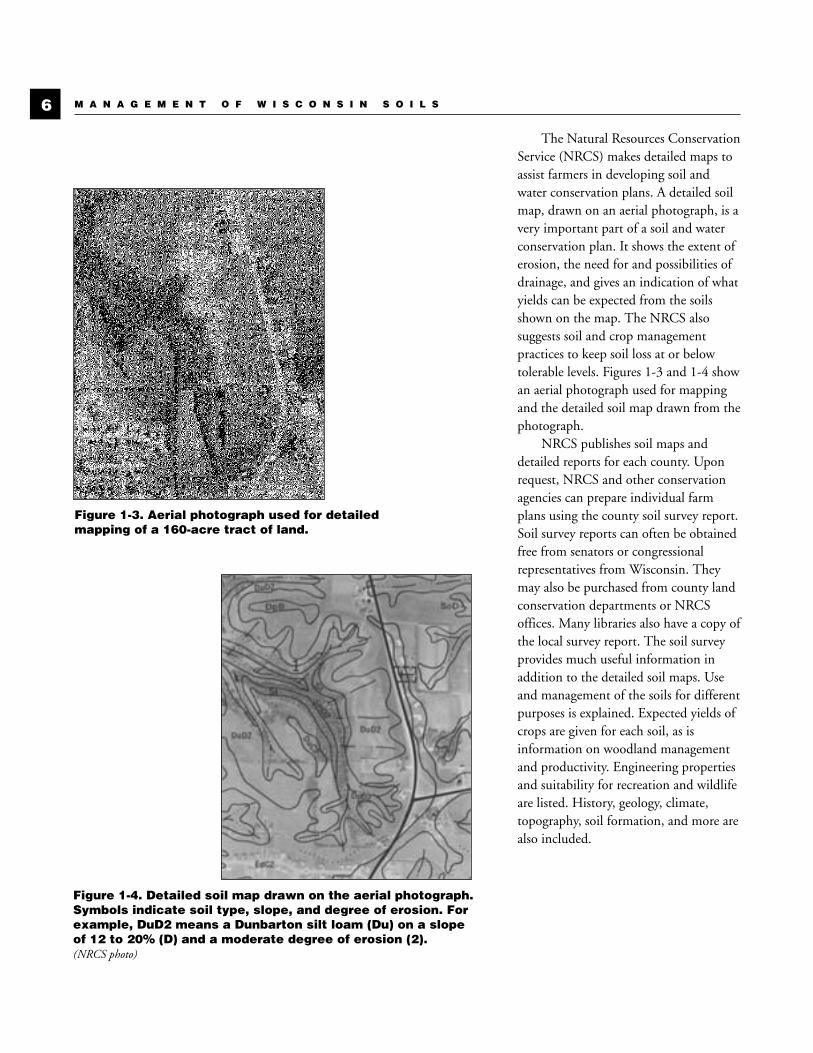
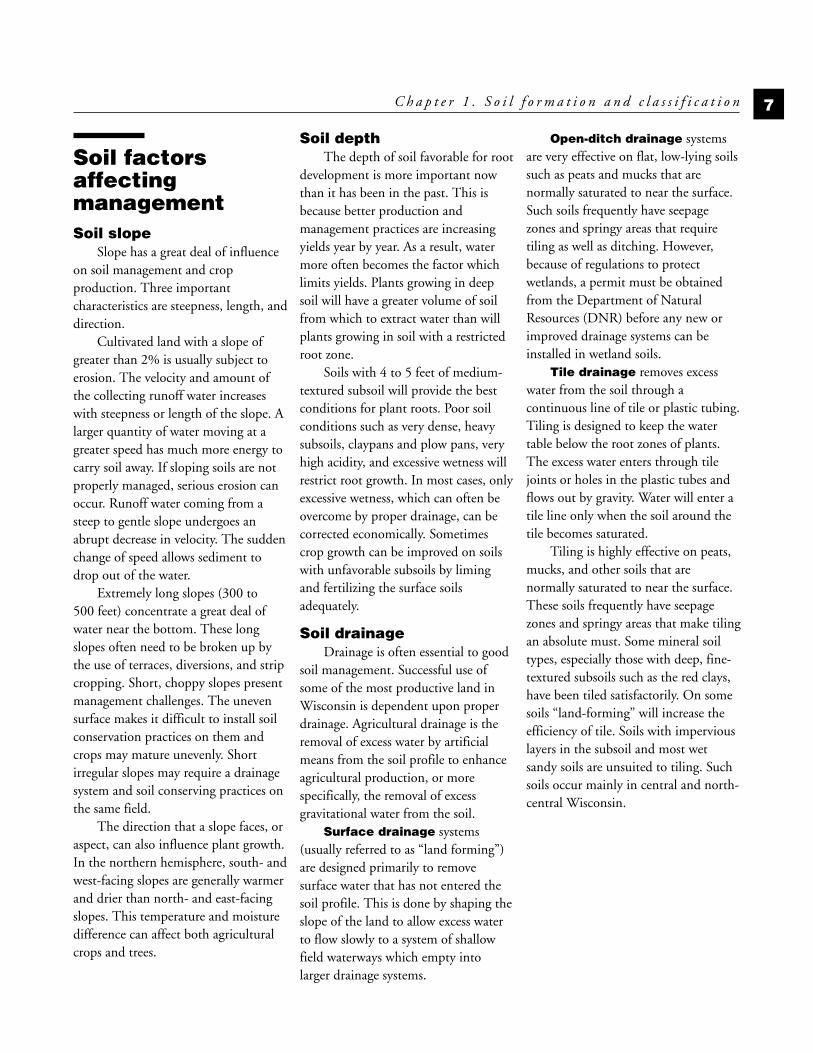
The Natural Resources ConservationService (NRCS) makes detailed maps toassist farmers in developing soil andwater conservation plans. A detailed soilmap, drawn on an aerial photograph, is avery important part of a soil and waterconservation plan. It shows the extent oferosion, the need for and possibilities ofdrainage, and gives an indication of whatyields can be expected from the soilsshown on the map. The NRCS alsosuggests soil and crop managementpractices to keep soil loss at or belowtolerable levels. Figures 1-3 and 1-4 showan aerial photograph used for mappingand the detailed soil map drawn from thephotograph.
NRCS publishes soil maps anddetailed reports for each county. Uponrequest, NRCS and other conservationagencies can prepare individual farmplans using the county soil survey report.Soil survey reports can often be obtainedfree from senators or congressionalrepresentatives from Wisconsin. Theymay also be purchased from county landconservation departments or NRCSoffices. Many libraries also have a copy ofthe local survey report. The soil surveyprovides much useful information inaddition to the detailed soil maps. Useand management of the soils for differentpurposes is explained. Expected yields ofcrops are given for each soil, as isinformation on woodland managementand productivity. Engineering propertiesand suitability for recreation and wildlifeare listed. History, geology, climate,topography, soil formation, and more arealso included.
M A N A G E M E N T O F W I S C O N S I N S O I L S6
Figure 1-3. Aerial photograph used for detailedmapping of a 160-acre tract of land.
Figure 1-4. Detailed soil map drawn on the aerial photograph.Symbols indicate soil type, slope, and degree of erosion. Forexample, DuD2 means a Dunbarton silt loam (Du) on a slopeof 12 to 20% (D) and a moderate degree of erosion (2). (NRCS photo)
C-1 10/18/05 11:06 AM Page 6
Soil factorsaffectingmanagementSoil slope
Slope has a great deal of influenceon soil management and cropproduction. Three importantcharacteristics are steepness, length, anddirection.
Cultivated land with a slope ofgreater than 2% is usually subject toerosion. The velocity and amount ofthe collecting runoff water increaseswith steepness or length of the slope. Alarger quantity of water moving at agreater speed has much more energy tocarry soil away. If sloping soils are notproperly managed, serious erosion canoccur. Runoff water coming from asteep to gentle slope undergoes anabrupt decrease in velocity. The suddenchange of speed allows sediment todrop out of the water.
Extremely long slopes (300 to500 feet) concentrate a great deal ofwater near the bottom. These longslopes often need to be broken up bythe use of terraces, diversions, and stripcropping. Short, choppy slopes presentmanagement challenges. The unevensurface makes it difficult to install soilconservation practices on them andcrops may mature unevenly. Shortirregular slopes may require a drainagesystem and soil conserving practices onthe same field.
The direction that a slope faces, oraspect, can also influence plant growth.In the northern hemisphere, south- andwest-facing slopes are generally warmerand drier than north- and east-facingslopes. This temperature and moisturedifference can affect both agriculturalcrops and trees.
Soil depthThe depth of soil favorable for root
development is more important nowthan it has been in the past. This isbecause better production andmanagement practices are increasingyields year by year. As a result, watermore often becomes the factor whichlimits yields. Plants growing in deepsoil will have a greater volume of soilfrom which to extract water than willplants growing in soil with a restrictedroot zone.
Soils with 4 to 5 feet of medium-textured subsoil will provide the bestconditions for plant roots. Poor soilconditions such as very dense, heavysubsoils, claypans and plow pans, veryhigh acidity, and excessive wetness willrestrict root growth. In most cases, onlyexcessive wetness, which can often beovercome by proper drainage, can becorrected economically. Sometimescrop growth can be improved on soilswith unfavorable subsoils by limingand fertilizing the surface soilsadequately.
Soil drainageDrainage is often essential to good
soil management. Successful use ofsome of the most productive land inWisconsin is dependent upon properdrainage. Agricultural drainage is theremoval of excess water by artificialmeans from the soil profile to enhanceagricultural production, or morespecifically, the removal of excessgravitational water from the soil.
Surface drainage systems(usually referred to as “land forming”)are designed primarily to removesurface water that has not entered thesoil profile. This is done by shaping theslope of the land to allow excess waterto flow slowly to a system of shallowfield waterways which empty intolarger drainage systems.
Open-ditch drainage systemsare very effective on flat, low-lying soilssuch as peats and mucks that arenormally saturated to near the surface.Such soils frequently have seepagezones and springy areas that requiretiling as well as ditching. However,because of regulations to protectwetlands, a permit must be obtainedfrom the Department of NaturalResources (DNR) before any new orimproved drainage systems can beinstalled in wetland soils.
Tile drainage removes excesswater from the soil through acontinuous line of tile or plastic tubing.Tiling is designed to keep the watertable below the root zones of plants.The excess water enters through tilejoints or holes in the plastic tubes andflows out by gravity. Water will enter atile line only when the soil around thetile becomes saturated.
Tiling is highly effective on peats,mucks, and other soils that arenormally saturated to near the surface.These soils frequently have seepagezones and springy areas that make tilingan absolute must. Some mineral soiltypes, especially those with deep, fine-textured subsoils such as the red clays,have been tiled satisfactorily. On somesoils “land-forming” will increase theefficiency of tile. Soils with imperviouslayers in the subsoil and most wetsandy soils are unsuited to tiling. Suchsoils occur mainly in central and north-central Wisconsin.
C h a p t e r 1 . S o i l f o r m a t i o n a n d c l a s s i f i c a t i o n 7
C-1 10/18/05 11:06 AM Page 7
Land capabilityclasses
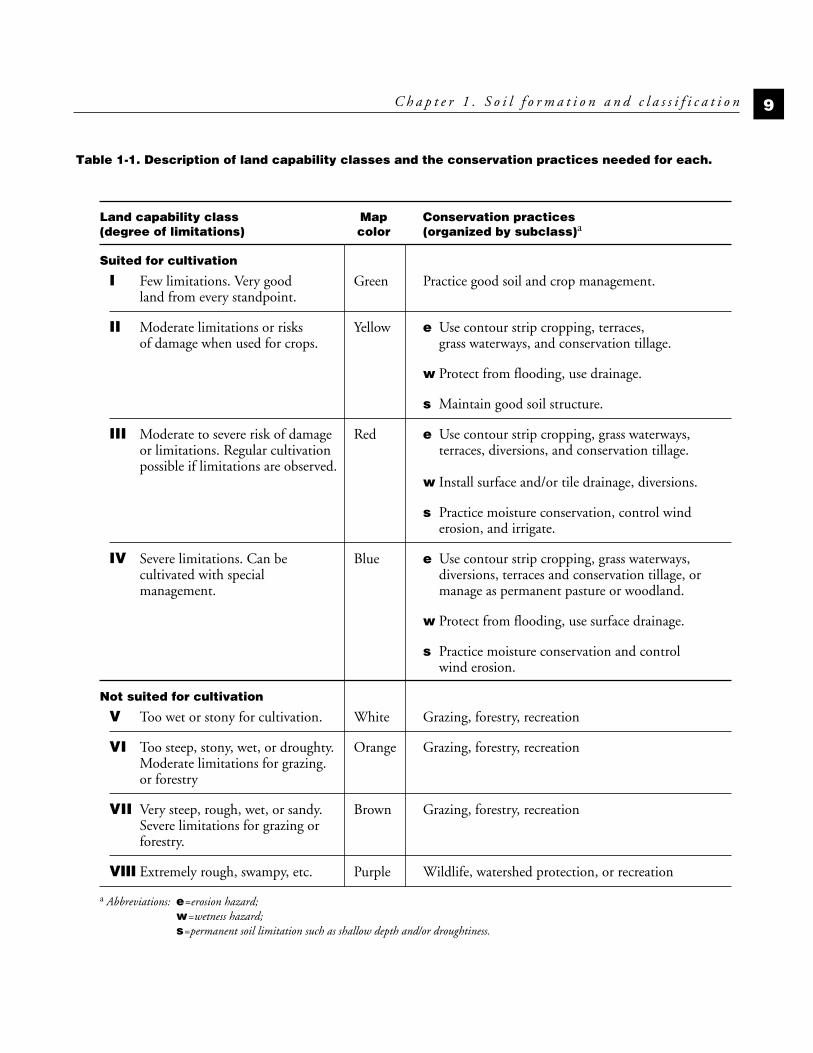
Land capability classes are practicalgroupings of soil limitations based onsuch characteristics as erosion hazard,droughtiness, wetness, stoniness, andresponse to management. Soil mapsprepared by NRCS farm planners arecolored to show different landcapability classes. Each color on the soilmap indicates one of eight landcapability classes. These classes reflectthe land’s relative suitability for crops,grazing, forestry, and wildlife. For asummary of the limitations and therecommended management practices,see table 1-1.
Land classes are designated usingroman numerals I through VIII. Theclasses are divided into subclasses andunits. Subclasses are designated byletters and numbers. The letter “e”stands for an erosion hazard, “w” for awetness hazard, and “s” for apermanent soil limitation such asshallow depth and/or droughtiness.
Class I land has the widest range ofuse with the least risk of being damaged.It is level or nearly level, well-drained,and productive. Land in this class canbe cultivated with almost no risk oferosion and will remain productive ifmanaged with normal care. This class iscolored green on soil maps.
Class II land can be cultivatedregularly, but certain physicalconditions give it more limitations thanClass I land. Some Class II land may begently sloping so it will need moderateerosion control. Other soils in this classmay be slightly droughty, slightly wet,or somewhat limited in depth. Thisclass is colored yellow on soil maps.
Class III land can be croppedregularly but has a narrower range ofsafe alternative uses than Class I or IIland. This land usually requiresextensive use of conservation practicesto control erosion or provide drainage.This class is colored red on soil maps.
Class IV soils should be cultivatedonly occasionally or under very carefulmanagement. Generally, it is bestadapted for pastures or forests. Thisclass is colored blue on soil maps.
Class V land is not suited toordinary cultivation because it is toowet or too stony, or because thegrowing season is too short. It canproduce good pasture and trees. Thisclass is white.
Class VI or VII land use is severelylimited because of erosion hazards.Some kind of permanent cover shouldbe kept on these soils. With very specialmanagement, including elaborate soiland water conservation practices,improved pastures can in someinstances be established by renovation.Class VI is colored orange, and ClassVII is colored brown.
Class VIII land is not suited toeconomic crops. Usually it is veryseverely eroded or is extremely sandy,wet, arid, rough, steep, or stony. Muchof it is valuable for wildlife food andcover, for watershed protection, or forrecreation. Class VIII land is coloredpurple.
These capability classes, assummarized in table 1-1, indicate thelimitations of land and the hazardsassociated with its use for agricultureand forestry. Land use recommendationsin soil and water conservation planstake these hazards into account and arebased primarily upon the needs forerosion control and good water manage-ment rather than upon practices such asfertilizer application and weed control.
M A N A G E M E N T O F W I S C O N S I N S O I L S8
C-1 10/18/05 11:06 AM Page 8
C h a p t e r 1 . S o i l f o r m a t i o n a n d c l a s s i f i c a t i o n 9
Table 1-1. Description of land capability classes and the conservation practices needed for each.
Land capability class Map Conservation practices (degree of limitations) color (organized by subclass)a
Suited for cultivation
I Few limitations. Very good Green Practice good soil and crop management.land from every standpoint.
II Moderate limitations or risks Yellow e Use contour strip cropping, terraces, of damage when used for crops. grass waterways, and conservation tillage.
w Protect from flooding, use drainage.
s Maintain good soil structure.
III Moderate to severe risk of damage Red e Use contour strip cropping, grass waterways,or limitations. Regular cultivation terraces, diversions, and conservation tillage.possible if limitations are observed.
w Install surface and/or tile drainage, diversions.
s Practice moisture conservation, control wind erosion, and irrigate.
IV Severe limitations. Can be Blue e Use contour strip cropping, grass waterways, cultivated with special diversions, terraces and conservation tillage, or management. manage as permanent pasture or woodland.
w Protect from flooding, use surface drainage.
s Practice moisture conservation and control wind erosion.
Not suited for cultivation
V Too wet or stony for cultivation. White Grazing, forestry, recreation
VI Too steep, stony, wet, or droughty. Orange Grazing, forestry, recreationModerate limitations for grazing.or forestry
VII Very steep, rough, wet, or sandy. Brown Grazing, forestry, recreationSevere limitations for grazing orforestry.
VIII Extremely rough, swampy, etc. Purple Wildlife, watershed protection, or recreation
a Abbreviations: e=erosion hazard; w=wetness hazard; s=permanent soil limitation such as shallow depth and/or droughtiness.
C-1 10/18/05 11:06 AM Page 9
Questions1. The soils of southwestern
Wisconsin are considerably olderthan those of northeasternWisconsin. Explain why.
2. Why are the soils of north-centralWisconsin consistently more acidthan the red clay soils in easternWisconsin?
3. What are aeolian deposits, andwhat is their importance in termsof the soils in Wisconsin?
4. The parent materials having themost effect on the soils ofWisconsin are the bedrock, glacialdeposits, and aeolian deposits.Explain what effect, if any, each ofthese parent materials have had onthe soils in your local area.
5. What are alluvial soils? Name someimportant areas of alluvial soils inWisconsin, elsewhere in theUnited States, and in othercountries.
6. Why are soils developed fromsandstone inherently less fertilethan soils developed fromlimestone?
7. In southwestern Wisconsin, prairiesoils developed on the broad, flathilltops while forested soilspredominate on the hillsides andin the valleys. Explain why.
8. What is the difference betweenphysical weathering and chemicalweathering?
9. Explain how “horizons” form insoil.What is the difference betweenthe A and B horizons in a soil?
10.How are soils named? Give anexample of a soil name and explainthe meaning of each part of thename. How can you find out thenames of soils on a particular farmand the yields of crops that thesesoils are capable of producing?
11.A soil map in a soil and waterconservation plan shows a fieldwith some land in Land CapabilitySubclass IIIe and some in SubclassIIIw. What land use practiceswould apply to these landsubclasses?
M A N A G E M E N T O F W I S C O N S I N S O I L S10
C-1 10/18/05 11:06 AM Page 10
There is a widespreadpopular acceptance of theimportance of the physicalproperties of soil to plantgrowth, but a largeproportion of the statementscommonly made on thissubject are vague, qualitativeand frequently unsupportedby factual evidence.”
B.T. Shaw, Soil Physical Conditions and Plant Growth, 1952
Spectacular advances in the use offertilizers, pesticides, and otheragricultural chemicals since the 1950shave placed a great deal of emphasis onagricultural chemistry. In the process,the importance of the physicalproperties of soils and their effects onplant growth have often beenoverlooked. For example, heavierequipment makes soil compaction anincreasing problem. Also, few peopleunderstand the physical forces thatcontrol water retention and movementin soils. As a result, water is frequentlythe most mismanaged of all growthfactors.
TextureIn its broadest sense, soil texture
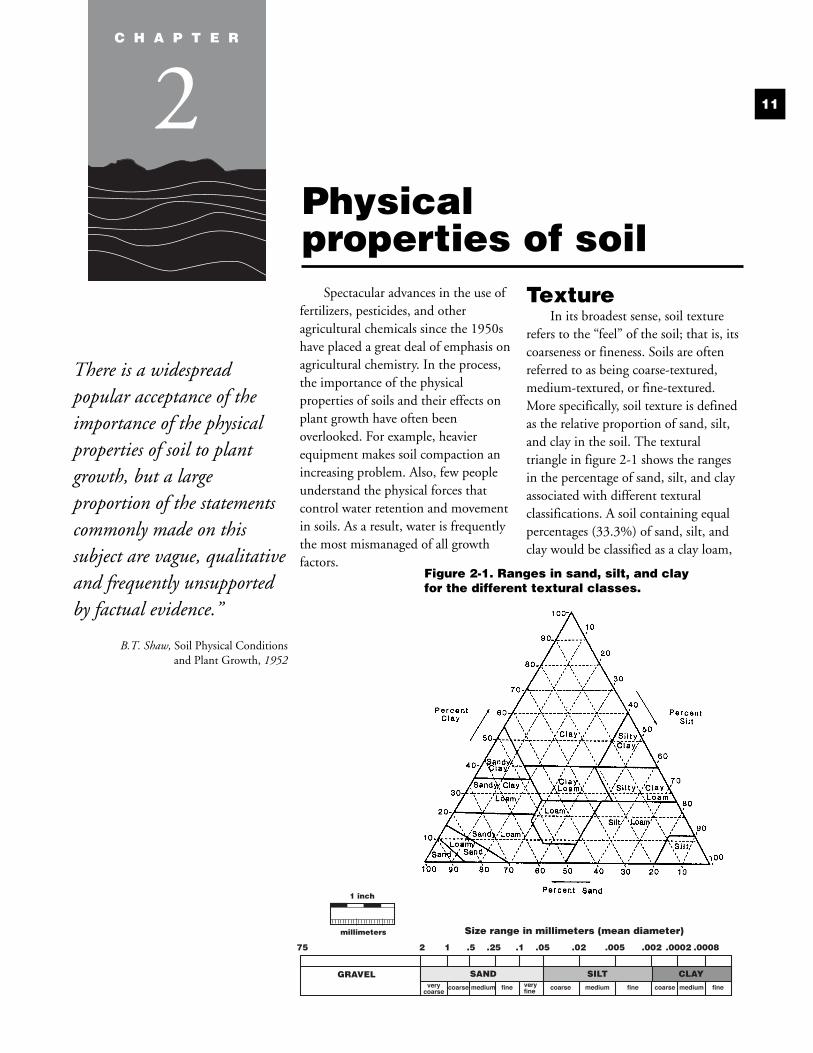
refers to the “feel” of the soil; that is, itscoarseness or fineness. Soils are oftenreferred to as being coarse-textured,medium-textured, or fine-textured.More specifically, soil texture is definedas the relative proportion of sand, silt,and clay in the soil. The texturaltriangle in figure 2-1 shows the rangesin the percentage of sand, silt, and clayassociated with different texturalclassifications. A soil containing equalpercentages (33.3%) of sand, silt, andclay would be classified as a clay loam,
11
Physical properties of soil
Size range in millimeters (mean diameter)
coarse
2 1 .5 .25 .1 .05 .02 .005 .002 .0002 .000875
coarseverycoarse
coarsefine finefinemedium medium mediumveryfine
SAND SILT CLAYGRAVEL
1 inch
millimeters
C H A P T E R
2
Figure 2-1. Ranges in sand, silt, and clay for the different textural classes.
C-2 10/18/05 11:07 AM Page 11
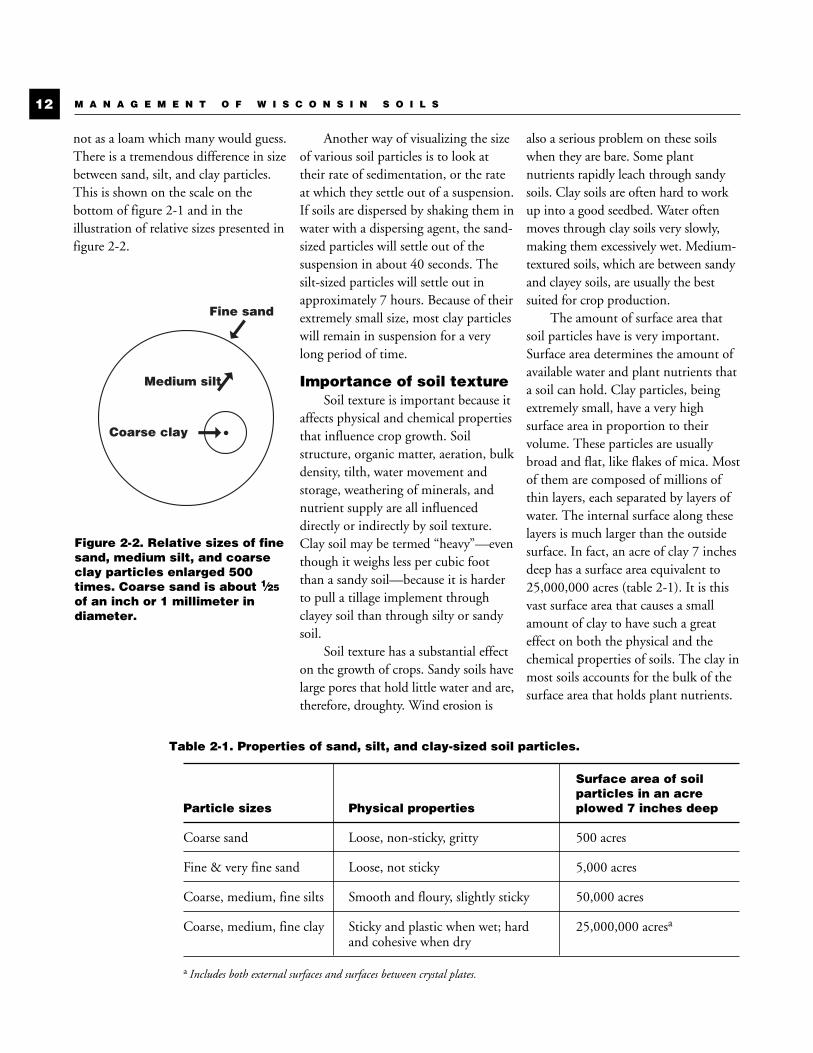
not as a loam which many would guess.There is a tremendous difference in sizebetween sand, silt, and clay particles.This is shown on the scale on thebottom of figure 2-1 and in theillustration of relative sizes presented infigure 2-2.
Another way of visualizing the sizeof various soil particles is to look attheir rate of sedimentation, or the rateat which they settle out of a suspension.If soils are dispersed by shaking them inwater with a dispersing agent, the sand-sized particles will settle out of thesuspension in about 40 seconds. Thesilt-sized particles will settle out inapproximately 7 hours. Because of theirextremely small size, most clay particleswill remain in suspension for a verylong period of time.
Importance of soil textureSoil texture is important because it
affects physical and chemical propertiesthat influence crop growth. Soilstructure, organic matter, aeration, bulkdensity, tilth, water movement andstorage, weathering of minerals, andnutrient supply are all influenceddirectly or indirectly by soil texture.Clay soil may be termed “heavy”—eventhough it weighs less per cubic footthan a sandy soil—because it is harderto pull a tillage implement throughclayey soil than through silty or sandysoil.
Soil texture has a substantial effecton the growth of crops. Sandy soils havelarge pores that hold little water and are,therefore, droughty. Wind erosion is
also a serious problem on these soilswhen they are bare. Some plantnutrients rapidly leach through sandysoils. Clay soils are often hard to workup into a good seedbed. Water oftenmoves through clay soils very slowly,making them excessively wet. Medium-textured soils, which are between sandyand clayey soils, are usually the bestsuited for crop production.
The amount of surface area thatsoil particles have is very important.Surface area determines the amount ofavailable water and plant nutrients thata soil can hold. Clay particles, beingextremely small, have a very highsurface area in proportion to theirvolume. These particles are usuallybroad and flat, like flakes of mica. Mostof them are composed of millions ofthin layers, each separated by layers ofwater. The internal surface along theselayers is much larger than the outsidesurface. In fact, an acre of clay 7 inchesdeep has a surface area equivalent to25,000,000 acres (table 2-1). It is thisvast surface area that causes a smallamount of clay to have such a greateffect on both the physical and thechemical properties of soils. The clay inmost soils accounts for the bulk of thesurface area that holds plant nutrients.
M A N A G E M E N T O F W I S C O N S I N S O I L S12
Fine sand
Medium silt
Coarse clay
➞
➞•
➞Figure 2-2. Relative sizes of finesand, medium silt, and coarseclay particles enlarged 500times. Coarse sand is about 1⁄25
of an inch or 1 millimeter indiameter.
Table 2-1. Properties of sand, silt, and clay-sized soil particles.
Surface area of soilparticles in an acre
Particle sizes Physical properties plowed 7 inches deep
Coarse sand Loose, non-sticky, gritty 500 acres
Fine & very fine sand Loose, not sticky 5,000 acres
Coarse, medium, fine silts Smooth and floury, slightly sticky 50,000 acres
Coarse, medium, fine clay Sticky and plastic when wet; hard 25,000,000 acresa
and cohesive when dry
a Includes both external surfaces and surfaces between crystal plates.
C-2 10/18/05 11:07 AM Page 12

Determining soil texture by feel
A precise determination of soiltexture requires laboratory analysis. Formost practical purposes, the texture canbe estimated accurately enough byhand texturing. In a mineral soil, thefeel of the soil when rubbed betweenthe thumb and forefinger is dependentprimarily on the relative amount of
sand, silt, and clay. While soils rarelyconsist entirely of one particle sizerange, learning the characteristic feel ofeach particle size helps in identifyingthe different size fractions (table 2-2).Mastering this method requiresknowing how each soil texture feels.However, moisture and organic mattercan change the feel of the different sizefractions and thus the soil itself. For
example, clay moistened to theconsistency of workable putty feels likesmooth satin, while dry clay feels roughand gritty. Organic matter makes clayfeel less sticky and sand feel less gritty.Organic matter is also an importantcoloring agent in soil; however, soilcolor is not an indicator of texture.
C h a p t e r 2 . P h y s i c a l p r o p e r t i e s o f s o i l 13
Table 2-2. Textural properties of mineral soils.
—————————————Feel and appearance of soila ——————————————Soil class Dry soil Moist soil
Sand Loose single grains that feel gritty. Squeezed in the hand it forms a cast Squeezed in the hand the soil mass falls or mold that crumbles when touched.apart when the pressure is released. Does not form a ribbon.
Sandy loam Aggregates are easily crushed; very faint Forms a cast requiring careful handlingvelvety feeling initially but as rubbing is to keep it from breaking. Does not form a ribbon.continued the gritty feeling of sand soon dominates.
Loam Moderate pressure crushes aggregates; Cast can be handled quite freely without clods can be quite firm. Pulverized loam breaking. Very slight tendency to ribbon. has a velvety feel that becomes gritty Rubbed surface is rough.with continued rubbing.
Silt loam Aggregates are firm but may be crushed Cast can be freely handled without breaking.under moderate pressure. Clods are firm to Slight tendency to ribbon with rubbed surfacehard. Smooth, flour-like feel dominates having a broken or rippled appearance.when soil is pulverized.
Clay loam Very firm aggregates and hard clods are Cast can bear much handling without breaking.difficult to crush by hand. Pulverized clay Pinched between the thumb and forefinger it loam feels somewhat gritty due to the forms a ribbon. The ribbon’s surface tends to feelharshness of the tiny remaining aggregates. slightly gritty when dampened and rubbed. Soil
is plastic, sticky, and puddles easily.
Clay Aggregates are hard and clods are extremely Casts can bear considerable handling without hard to crush by hand. Pulverized clay has a breaking. Forms a flexible ribbon and retainsgritty texture due to the harshness of its plasticity when elongated. Rubbed very smooth,numerous very small aggregates. surface has a satin feeling. Sticky when wet and
easily puddled.
a The properties described for the clayey soils refer to those found in the temperate regions.
C-2 10/18/05 11:07 AM Page 13
StructureThe arrangement of primary soil
particles (sand, silt, clay) intoaggregates of definite shape is known assoil structure. Soil structure affectswater movement into and through soil,root penetration, porosity or aeration,and bulk density. In all soils other thansands, soil particles tend to sticktogether. The pieces that are formed arecalled structural aggregates or peds(figure 2-3). The major materialscementing soil particles together intopeds are clay, organic matter, variousbacterial gums, iron and aluminumoxides, silica, and lime. Root hairs andfungal mycelia also help stabilize soilaggregates.
Some soils, such as sands, have nostructure and are described as single-grained. Another kind of structurelesssoil is one in which the structure hasbeen physically destroyed or puddledwhen wet. The soil in the rut of atractor that has been stuck in the mudis an example of such a structureless ormassive soil.
Granular soils work up easily into agood seedbed. This is particularly truewhen the granules are well-cementedtogether and are fine. Many surfacesoils in Wisconsin were originallygranular. Intensive row cropping, poormanagement, and erosion havedestroyed much of this granularstructure. The impact of raindrops canalso break down aggregates near the soilsurface. Moreover, the use of heavyequipment and excessive tillage whenthe soil is too wet can destroy soilstructure. With modern four-wheel-drive tractors, fields can be tilled whenthey are too wet. The resultingcompaction stunts crop growth byreducing aeration, restricting rootgrowth, and inducing nutrientdeficiencies. Plant roots will tend togrow horizontally when they encountera compacted layer of soil.
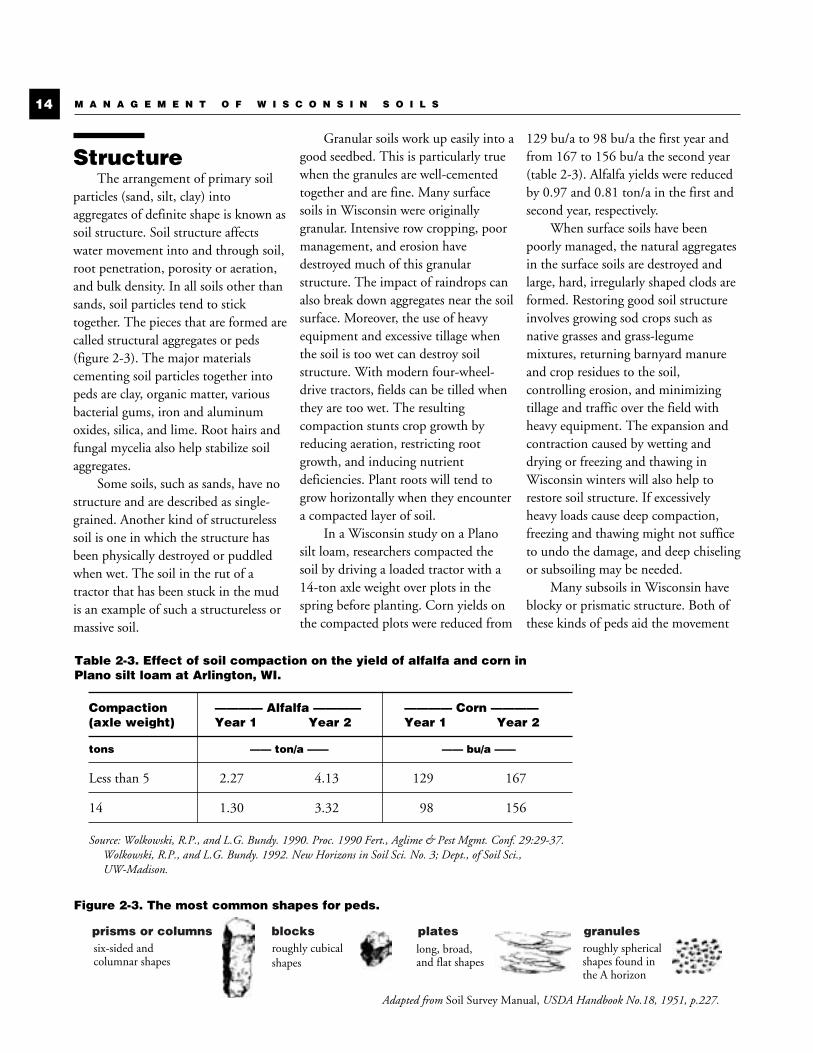
In a Wisconsin study on a Planosilt loam, researchers compacted thesoil by driving a loaded tractor with a14-ton axle weight over plots in thespring before planting. Corn yields onthe compacted plots were reduced from
129 bu/a to 98 bu/a the first year andfrom 167 to 156 bu/a the second year(table 2-3). Alfalfa yields were reducedby 0.97 and 0.81 ton/a in the first andsecond year, respectively.
When surface soils have beenpoorly managed, the natural aggregatesin the surface soils are destroyed andlarge, hard, irregularly shaped clods areformed. Restoring good soil structureinvolves growing sod crops such asnative grasses and grass-legumemixtures, returning barnyard manureand crop residues to the soil,controlling erosion, and minimizingtillage and traffic over the field withheavy equipment. The expansion andcontraction caused by wetting anddrying or freezing and thawing inWisconsin winters will also help torestore soil structure. If excessivelyheavy loads cause deep compaction,freezing and thawing might not sufficeto undo the damage, and deep chiselingor subsoiling may be needed.
Many subsoils in Wisconsin haveblocky or prismatic structure. Both ofthese kinds of peds aid the movement
M A N A G E M E N T O F W I S C O N S I N S O I L S14
Table 2-3. Effect of soil compaction on the yield of alfalfa and corn in Plano silt loam at Arlington, WI.
Compaction ———— Alfalfa ———— ———— Corn ————(axle weight) Year 1 Year 2 Year 1 Year 2
tons —— ton/a —— —— bu/a ——
Less than 5 2.27 4.13 129 167
14 1.30 3.32 98 156
Source: Wolkowski, R.P., and L.G. Bundy. 1990. Proc. 1990 Fert., Aglime & Pest Mgmt. Conf. 29:29-37.Wolkowski, R.P., and L.G. Bundy. 1992. New Horizons in Soil Sci. No. 3; Dept., of Soil Sci., UW-Madison.
granulesplatesprisms or columns blocksroughly sphericalshapes found inthe A horizon
long, broad,and flat shapes
roughly cubicalshapes
six-sided andcolumnar shapes
Figure 2-3. The most common shapes for peds.
Adapted from Soil Survey Manual, USDA Handbook No.18, 1951, p.227.
C-2 10/18/05 11:07 AM Page 14
of water, air, and plant roots throughthe subsoil.
Platy structure is the leastdesirable. Water and roots have to goback and forth to get between theplates, slowing their downwardmovement. Platy structure occursnaturally in some soils. It can also becreated by farming. Use of themoldboard plow when the soil is toowet and plowing at the same depth yearafter year tend to create a platystructure (plow pan) just below theplowed layer of surface soil. Plow panscan be eliminated by varying the depthof plowing occasionally, by using achisel plow or subsoiler, and by notworking the soil when it is too wet.
Sometimes farmers attempt toimprove poorly drained, tight subsoilsby deep tillage. Deep tillage mayprovide some temporary benefit, but itwon’t give long-term improvement onsoils that have drainage problems or incases where improper management isnot corrected.
Organic matterThe organic portion of the soil is
extremely important. It stores plantnutrients and improves the water-holding capacity of soil. On the surfaceas a mulch, organic matter shades thesoil and reduces the harmful effect ofraindrop impact on soil structure.Organic matter improves soils for thegrowth of plants by promoting soilaggregation, thus improving soilstructure and tilth.
The plants and animals living insoil feed on organic matter. Frequentadditions of fresh organic matter areneeded to maintain large and vigorouspopulations of bacteria, earthwormsand other soil organisms. Organicmatter also helps soil retain plantnutrients. This is most noticeable insandy soils but is important in all soils.While adding fresh organic matter isvery beneficial, it does not significantlyincrease the residual organic matter orhumus content. For example, the
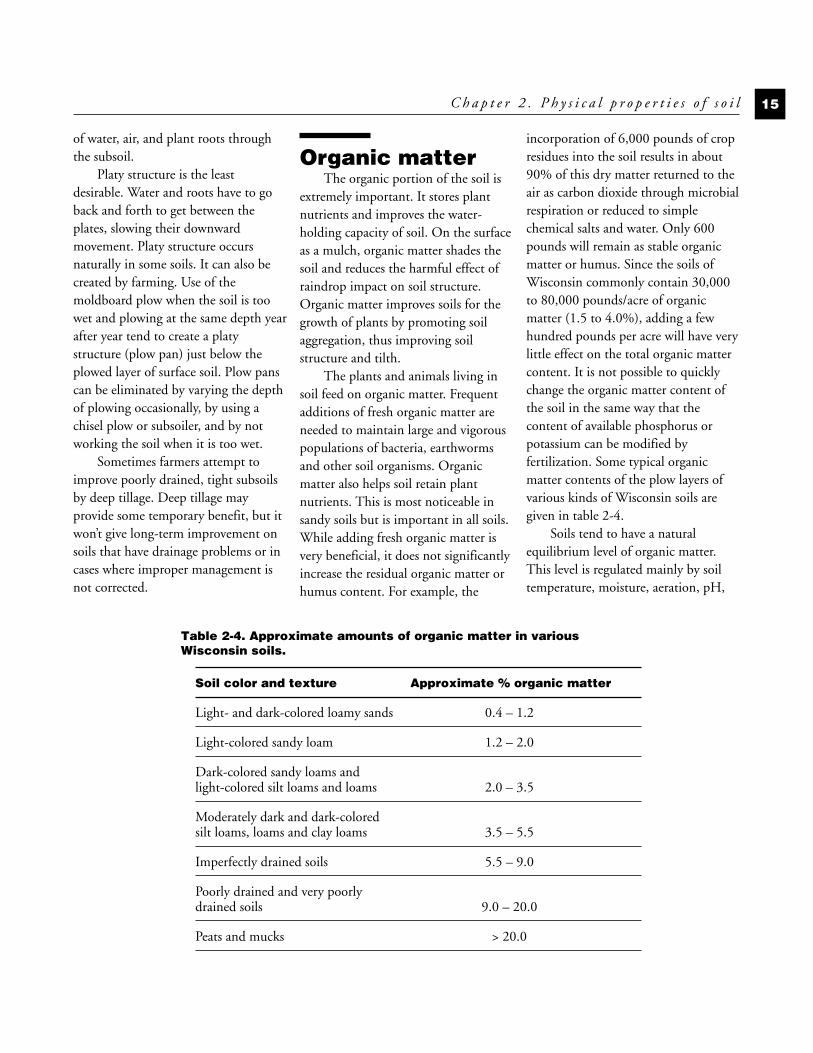
incorporation of 6,000 pounds of cropresidues into the soil results in about90% of this dry matter returned to theair as carbon dioxide through microbialrespiration or reduced to simplechemical salts and water. Only 600pounds will remain as stable organicmatter or humus. Since the soils ofWisconsin commonly contain 30,000to 80,000 pounds/acre of organicmatter (1.5 to 4.0%), adding a fewhundred pounds per acre will have verylittle effect on the total organic mattercontent. It is not possible to quicklychange the organic matter content ofthe soil in the same way that thecontent of available phosphorus orpotassium can be modified byfertilization. Some typical organicmatter contents of the plow layers ofvarious kinds of Wisconsin soils aregiven in table 2-4.
Soils tend to have a naturalequilibrium level of organic matter.This level is regulated mainly by soiltemperature, moisture, aeration, pH,
C h a p t e r 2 . P h y s i c a l p r o p e r t i e s o f s o i l 15
Table 2-4. Approximate amounts of organic matter in variousWisconsin soils.
Soil color and texture Approximate % organic matter
Light- and dark-colored loamy sands 0.4 – 1.2
Light-colored sandy loam 1.2 – 2.0
Dark-colored sandy loams and light-colored silt loams and loams 2.0 – 3.5
Moderately dark and dark-coloredsilt loams, loams and clay loams 3.5 – 5.5
Imperfectly drained soils 5.5 – 9.0
Poorly drained and very poorlydrained soils 9.0 – 20.0
Peats and mucks > 20.0
C-2 10/18/05 11:07 AM Page 15
carbon:nitrogen ratio, and nutrientsupply. These factors influence themicrobial process that decomposesorganic matter. Organic matteraccumulates in swamps and poorlydrained soils because aeration isrestricted. It also accumulates in arcticsoils, as in Alaska, becauseaccumulation during the short growingseason exceeds decomposition duringthe rest of the year.
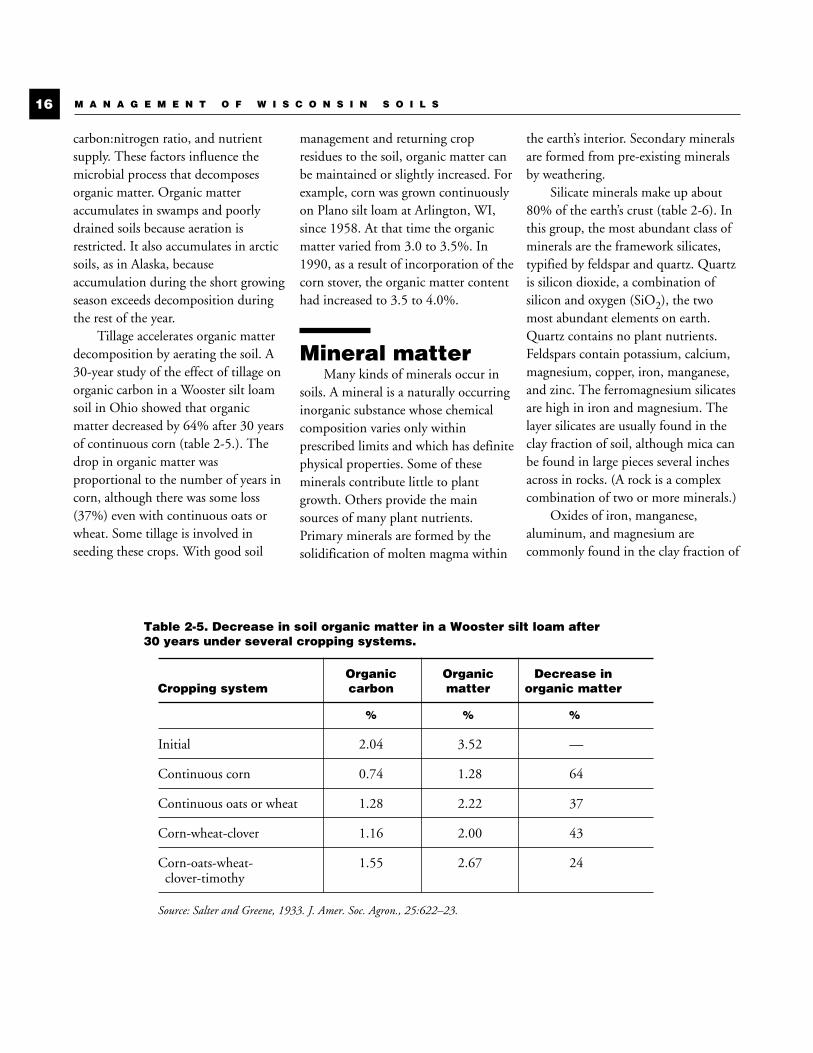
Tillage accelerates organic matterdecomposition by aerating the soil. A30-year study of the effect of tillage onorganic carbon in a Wooster silt loamsoil in Ohio showed that organicmatter decreased by 64% after 30 yearsof continuous corn (table 2-5.). Thedrop in organic matter wasproportional to the number of years incorn, although there was some loss(37%) even with continuous oats orwheat. Some tillage is involved inseeding these crops. With good soil
management and returning cropresidues to the soil, organic matter canbe maintained or slightly increased. Forexample, corn was grown continuouslyon Plano silt loam at Arlington, WI,since 1958. At that time the organicmatter varied from 3.0 to 3.5%. In1990, as a result of incorporation of thecorn stover, the organic matter contenthad increased to 3.5 to 4.0%.
Mineral matterMany kinds of minerals occur in
soils. A mineral is a naturally occurringinorganic substance whose chemicalcomposition varies only withinprescribed limits and which has definitephysical properties. Some of theseminerals contribute little to plantgrowth. Others provide the mainsources of many plant nutrients.Primary minerals are formed by thesolidification of molten magma within
the earth’s interior. Secondary mineralsare formed from pre-existing mineralsby weathering.
Silicate minerals make up about80% of the earth’s crust (table 2-6). Inthis group, the most abundant class ofminerals are the framework silicates,typified by feldspar and quartz. Quartzis silicon dioxide, a combination ofsilicon and oxygen (SiO2), the twomost abundant elements on earth.Quartz contains no plant nutrients.Feldspars contain potassium, calcium,magnesium, copper, iron, manganese,and zinc. The ferromagnesium silicatesare high in iron and magnesium. Thelayer silicates are usually found in theclay fraction of soil, although mica canbe found in large pieces several inchesacross in rocks. (A rock is a complexcombination of two or more minerals.)
Oxides of iron, manganese,aluminum, and magnesium arecommonly found in the clay fraction of
M A N A G E M E N T O F W I S C O N S I N S O I L S16
Table 2-5. Decrease in soil organic matter in a Wooster silt loam after30 years under several cropping systems.
Organic Organic Decrease in Cropping system carbon matter organic matter
% % %
Initial 2.04 3.52 —
Continuous corn 0.74 1.28 64
Continuous oats or wheat 1.28 2.22 37
Corn-wheat-clover 1.16 2.00 43
Corn-oats-wheat- 1.55 2.67 24clover-timothy
Source: Salter and Greene, 1933. J. Amer. Soc. Agron., 25:622–23.
C-2 10/18/05 11:07 AM Page 16
soils. They are important sources ofmagnesium, boron, copper, iron,manganese, molybdenum, and zinc.Some of these nutrients are adsorbed(bonded) onto the surfaces of theseoxides.
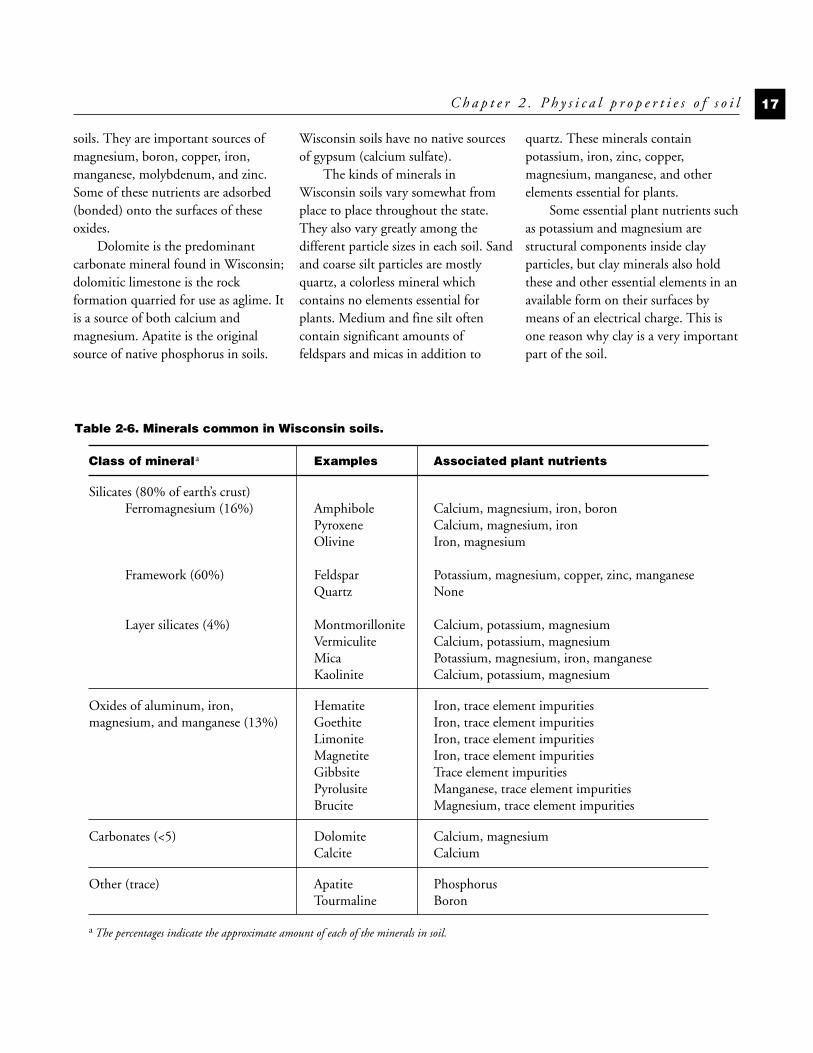
Dolomite is the predominantcarbonate mineral found in Wisconsin;dolomitic limestone is the rockformation quarried for use as aglime. Itis a source of both calcium andmagnesium. Apatite is the originalsource of native phosphorus in soils.
Wisconsin soils have no native sourcesof gypsum (calcium sulfate).
The kinds of minerals inWisconsin soils vary somewhat fromplace to place throughout the state.They also vary greatly among thedifferent particle sizes in each soil. Sandand coarse silt particles are mostlyquartz, a colorless mineral whichcontains no elements essential forplants. Medium and fine silt oftencontain significant amounts offeldspars and micas in addition to
quartz. These minerals containpotassium, iron, zinc, copper,magnesium, manganese, and otherelements essential for plants.
Some essential plant nutrients suchas potassium and magnesium arestructural components inside clayparticles, but clay minerals also holdthese and other essential elements in anavailable form on their surfaces bymeans of an electrical charge. This isone reason why clay is a very importantpart of the soil.
C h a p t e r 2 . P h y s i c a l p r o p e r t i e s o f s o i l 17
Table 2-6. Minerals common in Wisconsin soils.
Class of minerala Examples Associated plant nutrients
Silicates (80% of earth’s crust)Ferromagnesium (16%) Amphibole Calcium, magnesium, iron, boron
Pyroxene Calcium, magnesium, ironOlivine Iron, magnesium
Framework (60%) Feldspar Potassium, magnesium, copper, zinc, manganeseQuartz None
Layer silicates (4%) Montmorillonite Calcium, potassium, magnesiumVermiculite Calcium, potassium, magnesiumMica Potassium, magnesium, iron, manganeseKaolinite Calcium, potassium, magnesium
Oxides of aluminum, iron, Hematite Iron, trace element impuritiesmagnesium, and manganese (13%) Goethite Iron, trace element impurities
Limonite Iron, trace element impuritiesMagnetite Iron, trace element impuritiesGibbsite Trace element impuritiesPyrolusite Manganese, trace element impuritiesBrucite Magnesium, trace element impurities
Carbonates (<5) Dolomite Calcium, magnesiumCalcite Calcium
Other (trace) Apatite PhosphorusTourmaline Boron
a The percentages indicate the approximate amount of each of the minerals in soil.
C-2 10/18/05 11:07 AM Page 17
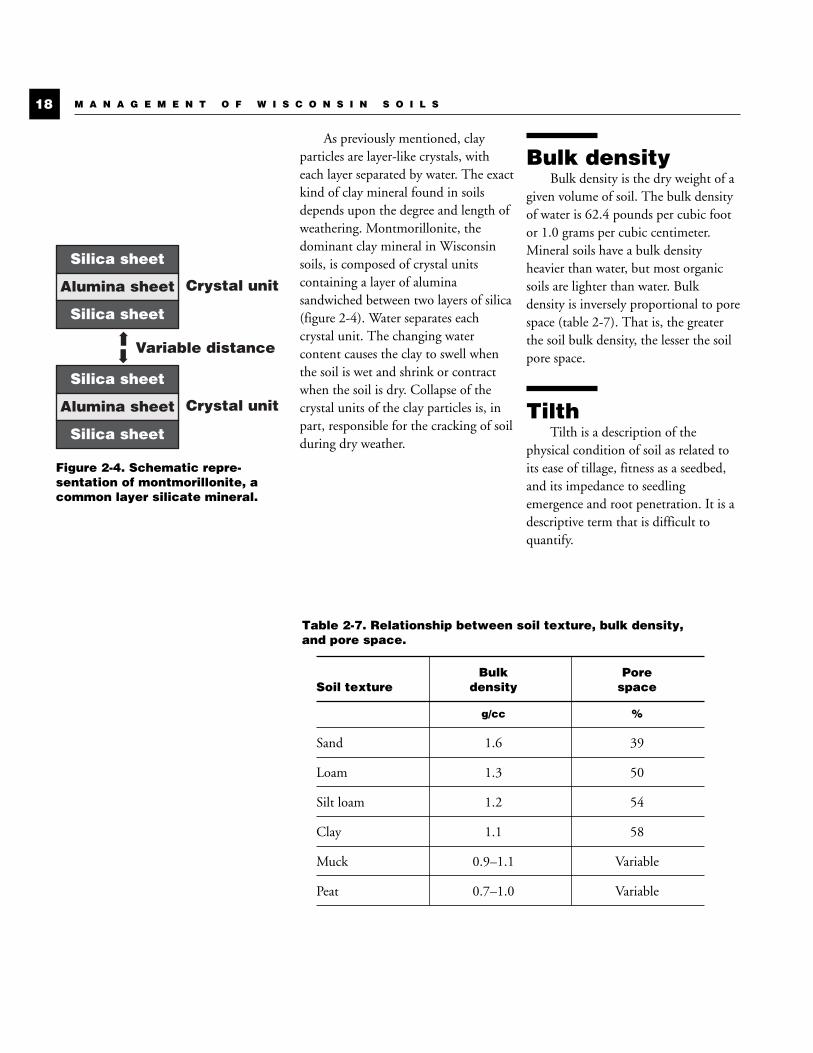
As previously mentioned, clayparticles are layer-like crystals, witheach layer separated by water. The exactkind of clay mineral found in soilsdepends upon the degree and length ofweathering. Montmorillonite, thedominant clay mineral in Wisconsinsoils, is composed of crystal unitscontaining a layer of aluminasandwiched between two layers of silica(figure 2-4). Water separates eachcrystal unit. The changing watercontent causes the clay to swell whenthe soil is wet and shrink or contractwhen the soil is dry. Collapse of thecrystal units of the clay particles is, inpart, responsible for the cracking of soilduring dry weather.
Bulk densityBulk density is the dry weight of a
given volume of soil. The bulk densityof water is 62.4 pounds per cubic footor 1.0 grams per cubic centimeter.Mineral soils have a bulk densityheavier than water, but most organicsoils are lighter than water. Bulkdensity is inversely proportional to porespace (table 2-7). That is, the greaterthe soil bulk density, the lesser the soilpore space.
TilthTilth is a description of the
physical condition of soil as related toits ease of tillage, fitness as a seedbed,and its impedance to seedlingemergence and root penetration. It is adescriptive term that is difficult toquantify.
M A N A G E M E N T O F W I S C O N S I N S O I L S18
Table 2-7. Relationship between soil texture, bulk density,and pore space.
Bulk PoreSoil texture density space
g/cc %
Sand 1.6 39
Loam 1.3 50
Silt loam 1.2 54
Clay 1.1 58
Muck 0.9–1.1 Variable
Peat 0.7–1.0 Variable
Silica sheet
Alumina sheet
Silica sheet
Crystal unit
Silica sheet
Alumina sheet
Silica sheet
Crystal unit
Variable distance➡➡
Figure 2-4. Schematic repre-sentation of montmorillonite, acommon layer silicate mineral.
C-2 10/18/05 11:07 AM Page 18
ColorSoil color is determined mainly by
the iron and organic matter in soil andthe oxidation state of the iron. Soilminerals are mostly whitish to grayishin color when the iron and organicmatter are removed. Humus and ironoxide are the principal pigments in soil,and like paint, a little goes a long way.Color bears little relationship to soilfertility, although it may give someuseful clues to the nature of soils. Ablack or dark soil usually is high inorganic matter. Yet a peat with 60%organic matter will not be as dark as amuck with only 30% organic matterbecause the peat is less decomposed.The reddish soils of eastern Wisconsinare red because of the presence of ironoxide coatings. This pigment coats thesilt, clay, and humus and masks thedark pigmentation of the latter.
Highly oxidized iron oxide is red.Iron that’s been exposed to both waterand oxygen, called hydrated iron oxide,is yellowish. Iron in an oxygen-scarceenvironment (such as waterlogged soils),called reduced iron oxide, is blue-gray.Thus, when a wet mineral soil isdrained and cultivated, the subsoil willhave a blue-gray color. In time, with
tillage and good drainage, the reducediron slowly oxidizes, and the color turnsyellowish-brown. Many tropical soilsare brick-red because intenseweathering results in accumulation ofiron oxides. The pinkish-red soils ofeastern Wisconsin are young; the ironoxide was removed from iron depositsby glacial activity and ground andmixed with the parent material thatformed these soils. Soils that aresubjected to alternate periods of wetand dry conditions often have reddish-yellow mottles in the subsoil becausethe oxidation and reduction of ironoxide is a slow process. While the colorof a soil gives some clues to its organicmatter content and state of ironoxidation, it is not a reliable indicatorof soil fertility.
TemperatureThe temperature of the soil is
important for both root growth andmicrobial activity. Little microbialactivity occurs below 45°F or above90°F. A temperature difference of onlya few degrees can be important when acrop is near the threshold temperaturerequired for growth. For example, thedifference in early season vigor between
corn planted with conventional tillageand that planted no-till has been attri-buted to slightly cooler soil (2° to 4°F)under no-till.
Although we cannot control theweather, some management practiceswill affect soil temperature. It takes fivetimes as many calories to heat a poundof water than it does to heat a pound ofdry soil. Consequently, wet soils remaincold much longer than well-drainedsoils. Proper drainage, therefore, willfacilitate soil warming in the spring.Also, surface residue shades the soilfrom direct solar radiation and tends tokeep the surface soil moist. At 4 inchesdeep, soil temperatures of fields withsubstantial surface residue typically area few degrees cooler than under baresoil. However, the advantage of awarmer soil must be weighed againstthe erosion potential of a bare soil.
North slopes are cooler than southslopes (in the northern hemisphere).Sometimes the difference is greatenough to result in differences incropping and native vegetation. Insouthern Wisconsin, for example,apples are often grown on northernslopes because the temperaturefluctuates less, lessening the risks ofpremature bloom and subsequent frostdamage.
C h a p t e r 2 . P h y s i c a l p r o p e r t i e s o f s o i l 19
C-2 10/18/05 11:07 AM Page 19

Questions1. What is meant by the texture of a
soil? How is soil texture measured?Which soil texture offers idealgrowth conditions for plants?Why?
2. The percentages of sand, silt, andclay are given below for severalsoils. What would be the texturalclassification of each of these soils?
sand silt clay———— % ————
a. 65 25 10
b. 50 20 30
c. 40 40 20
d. 30 40 30
e. 15 50 35
3. Why is soil structure important?What are some factors thatcontribute to the breakdown of soilstructure?
4. How can the structure and tilth ofa soil be maintained when the landis cropped to continuous corn?
5. Why is a sandy soil that weighs100 pounds per cubic foot easier toplow than a silty clay loam thatweighs only 72 pounds per cubicfoot?
6. Explain why tilling silty or clayeysoils when they are too wet reducescrop yields.
7. Discuss five reasons why organicmatter is an important componentof soil.
8. It is much easier to lose organicmatter from soil than to increasesoil organic matter. Why?
9. Why do cracks form in silt loamsoils during periods of drought butnot in sandy soils?
10.What can you tell about a soilfrom its color?
11.Why do dry soils warm up fasterthan wet soils?
M A N A G E M E N T O F W I S C O N S I N S O I L S20
C-2 10/18/05 11:07 AM Page 20

“In a majority of seasons,deficiency of moisture [is] amarked limiting factor ofyield.”
F.H. King, The Soil, 1895
Water is the most limiting factoraffecting plant growth throughoutmuch of the world. The amount andfrequency of rainfall received duringthe growing season is as important asthe total annual precipitation.Wisconsin receives an average of31 inches of precipitation annually,with about two-thirds coming duringthe growing season.
Water is the plant’s source ofhydrogen, which is incorporated intocarbohydrates by photosynthesis. Itserves as the medium in whichnutrients are taken up and distributedwithin the plant and through whichmaterials that have been synthesized
within the plant are translocated. Infact, all of the biochemical reactionswithin the plant and the chemicalreactions of the soil take place in anaqueous system. However, all of thesefunctions demand only a very smallpercentage of the water absorbed byplants; most of the water is lost to theatmosphere by transpiration.
Hydrologic cycleThe cycling of water from the
atmosphere to the ground and backagain is known as the hydrologic cycle(figure 3-1). Water travels along one ofmany paths before returning to the
21
Soil water
while fa
lling
tran
spira
tion
infiltration
surface runoff
evaporation
from
str
eam
s
from ocean
from
soil
cloud formationcloud formation
rain clouds
soil
ocean
ground water
Figure 3-1. The hydrologic cycle.
C H A P T E R
3
Source: Reproduced by permission of Deere & Co.
C-3 10/18/05 11:08 AM Page 21
atmosphere through evaporation. Itmay remain on the earth’s surface,infiltrate the soil, or run off intoswamps, streams, lakes, or reservoirs.Water entering the soil may be storedin the soil, used by plants, or continuemoving downward through the vadose(unsaturated) zone to the groundwater.Groundwater moves laterally to lakes,springs, streams, and rivers where iteventually returns to the surface. Waterat the surface of soil or water bodiesevaporates and returns to theatmosphere where it may form cloudsand eventually return to the surface asprecipitation.
Evapotranspiration(ET)
Evapotranspiration is acombination of water loss fromevaporation of the soil surface plustranspiration from plants. It isestimated that roughly two-thirds ofWisconsin’s 31-inch average annualprecipitation returns to the atmospherethrough evapotranspiration. Theremainder either percolates through thesoil profile to the water table or runsoff the land surface.
The amount of water lost from thesoil by evaporation depends on manyfactors, including soil moisture,temperature, vegetation, and soiltexture. On moist soil, heat determinesthe amount of evaporation. Wet soilsstay cold longer in the spring because ittakes more heat to warm the water insoil pores than it does to warm the airor soil particles. However, when the soilsurface is dry, evaporation also dependson the rate of water movement throughcapillary flow to the surface, not onheat alone. Fine-textured soils have
greater capillary movement than sandsor peats, so they lose more water byevaporation.
Transpiration is the process ofplants pulling water from the soilthrough their roots to replace the waterthat is lost by evaporation from theirleaves. The amount of water plants cantranspire depends on length of growingseason, plant density, depth of rooting,rainfall distribution, temperature, andhumidity. Early in the season, theamount of water lost by transpirationdepends on the amount of leaf surfaceexposed. When the soil is reasonablywet and the sun is shining there is asteady flow of water into roots, up theplant stem, and into the leaves.Increasing the plant population beyondthat required to form a closed canopydoes not increase transpiration. Oncethe soil is completely shaded byvegetation, most of the water loss is bytranspiration rather than evaporationfrom the soil surface. Depth of rootingis important because it determines howmuch water is available. Deep-rootedplants continue transpiring aftershallow-rooted plants wilt for lack ofmoisture. Rainfall distributiondetermines the amount of time theexposed surface soil is wet, and itinfluences the depth of rooting. Longerperiods of time between rains result indeeper rooting. Table 3-1 comparesamounts of evapotranspiration fromdifferent kinds of vegetation over a yearand over the length of their growingseason.
Figure 3-2 depicts a soil waterbudget for a crop grown on a sandyloam soil. The graph shows how theamount of stored soil water changesdaily with evapotranpiration, drainage,and rainfall. At the start of day 1 all ofthe gravitational water has drainedaway and the available water is at1.4 inches, nearly its maximum(1.6 inches in this example). Dailyevaporation removes some water fromthe storage (0.12 to 0.32 inches), as iseasily seen on days 1 through 4. Rainon day 5 refills the available water, andbecause it is cloudy only a smallamount evaporates. On day 6, however,it rains too much for the soil to hold,and after the 1.6 inches of availablewater capacity is saturated, theremainder drains. Because the soil wascompletely saturated on day 6, much ofthe day 7 rain also drains. During therain-free period of days 8 and 9evaporation again steadily depletes theavailable water. Another rain on day 10refills the soil’s reserve for availablewater.
M A N A G E M E N T O F W I S C O N S I N S O I L S22
C-3 10/18/05 11:08 AM Page 22
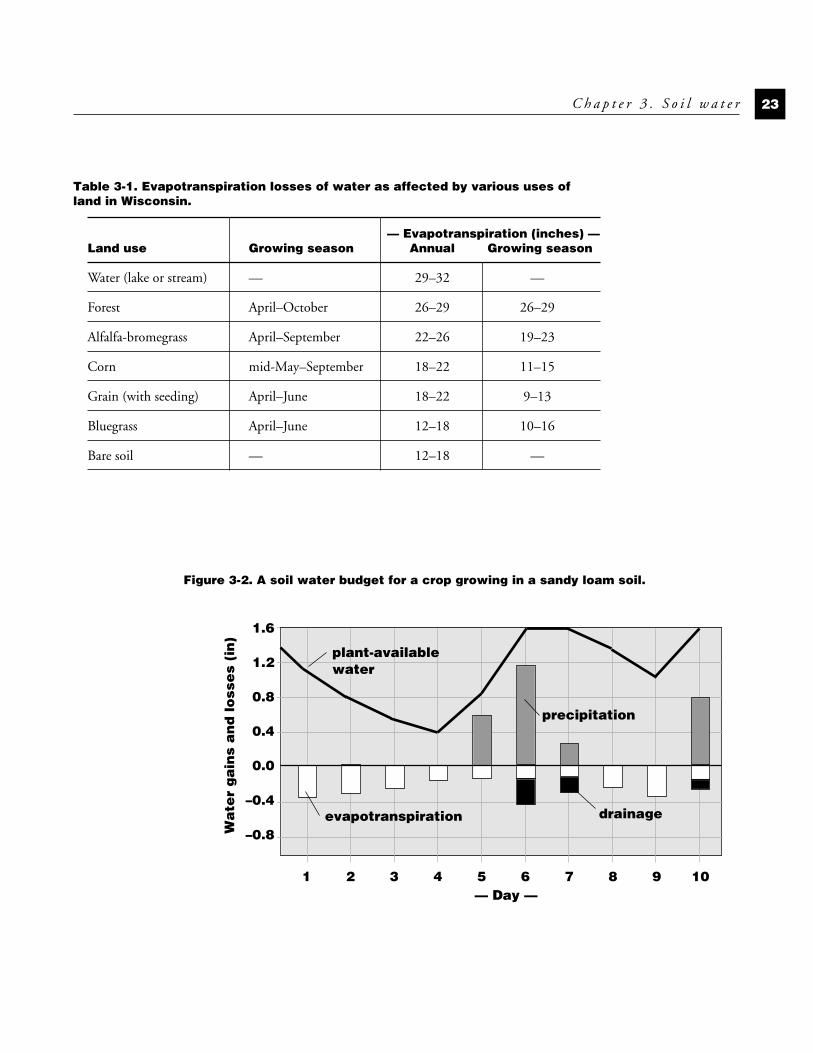
C h a p t e r 3 . S o i l w a t e r 23
Table 3-1. Evapotranspiration losses of water as affected by various uses ofland in Wisconsin.
— Evapotranspiration (inches) —Land use Growing season Annual Growing season
Water (lake or stream) — 29–32 —
Forest April–October 26–29 26–29
Alfalfa-bromegrass April–September 22–26 19–23
Corn mid-May–September 18–22 11–15
Grain (with seeding) April–June 18–22 9–13
Bluegrass April–June 12–18 10–16
Bare soil — 12–18 —
evapotranspiration
1 2 3 4 5 6 7 8 9 10
0.0
–0.4
–0.8
0.4
0.8
1.2
1.6
drainage
precipitation
plant-availablewater
Figure 3-2. A soil water budget for a crop growing in a sandy loam soil.
Wa
ter
ga
ins
an
d lo
sse
s (i
n)
— Day —
C-3 10/18/05 11:08 AM Page 23
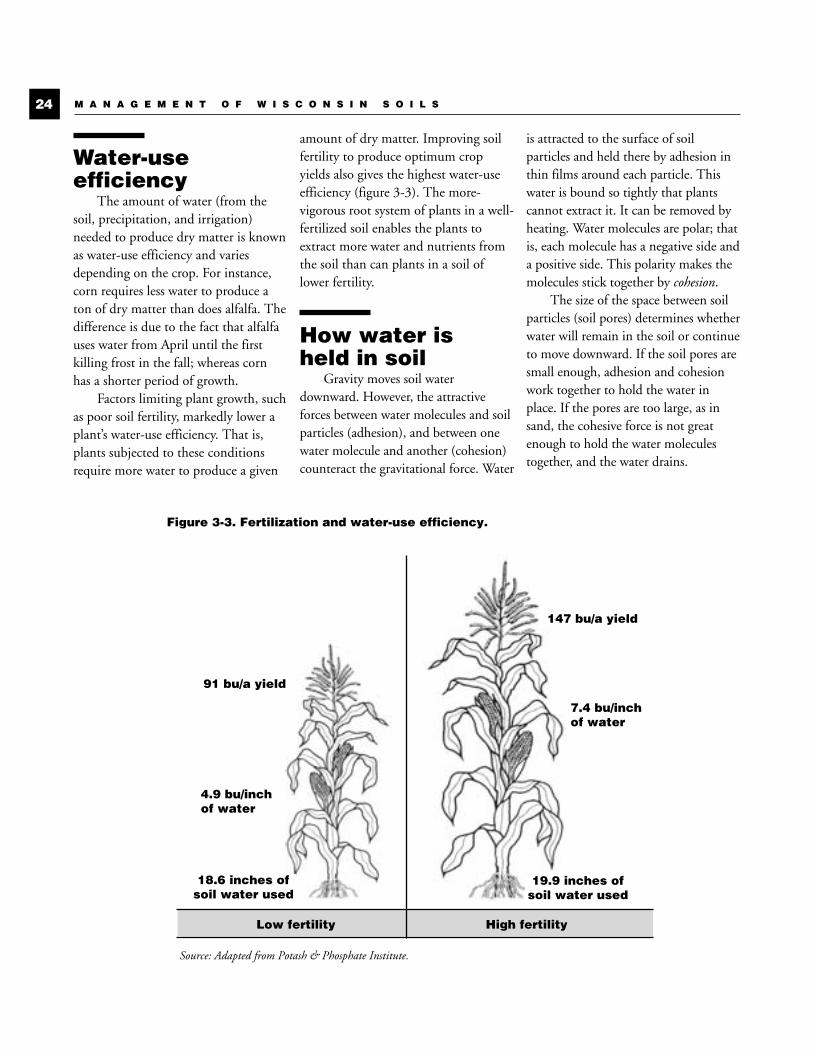
Water-useefficiency
The amount of water (from thesoil, precipitation, and irrigation)needed to produce dry matter is knownas water-use efficiency and variesdepending on the crop. For instance,corn requires less water to produce aton of dry matter than does alfalfa. Thedifference is due to the fact that alfalfauses water from April until the firstkilling frost in the fall; whereas cornhas a shorter period of growth.
Factors limiting plant growth, suchas poor soil fertility, markedly lower aplant’s water-use efficiency. That is,plants subjected to these conditionsrequire more water to produce a given
amount of dry matter. Improving soilfertility to produce optimum cropyields also gives the highest water-useefficiency (figure 3-3). The more-vigorous root system of plants in a well-fertilized soil enables the plants toextract more water and nutrients fromthe soil than can plants in a soil oflower fertility.
How water is held in soil
Gravity moves soil waterdownward. However, the attractiveforces between water molecules and soilparticles (adhesion), and between onewater molecule and another (cohesion)counteract the gravitational force. Water
is attracted to the surface of soilparticles and held there by adhesion inthin films around each particle. Thiswater is bound so tightly that plantscannot extract it. It can be removed byheating. Water molecules are polar; thatis, each molecule has a negative side anda positive side. This polarity makes themolecules stick together by cohesion.
The size of the space between soilparticles (soil pores) determines whetherwater will remain in the soil or continueto move downward. If the soil pores aresmall enough, adhesion and cohesionwork together to hold the water inplace. If the pores are too large, as insand, the cohesive force is not greatenough to hold the water moleculestogether, and the water drains.
M A N A G E M E N T O F W I S C O N S I N S O I L S24
Figure 3-3. Fertilization and water-use efficiency.
Source: Adapted from Potash & Phosphate Institute.
Low fertility High fertility
147 bu/a yield
7.4 bu/inchof water
19.9 inches ofsoil water used
91 bu/a yield
4.9 bu/inchof water
18.6 inches ofsoil water used
C-3 10/18/05 11:08 AM Page 24
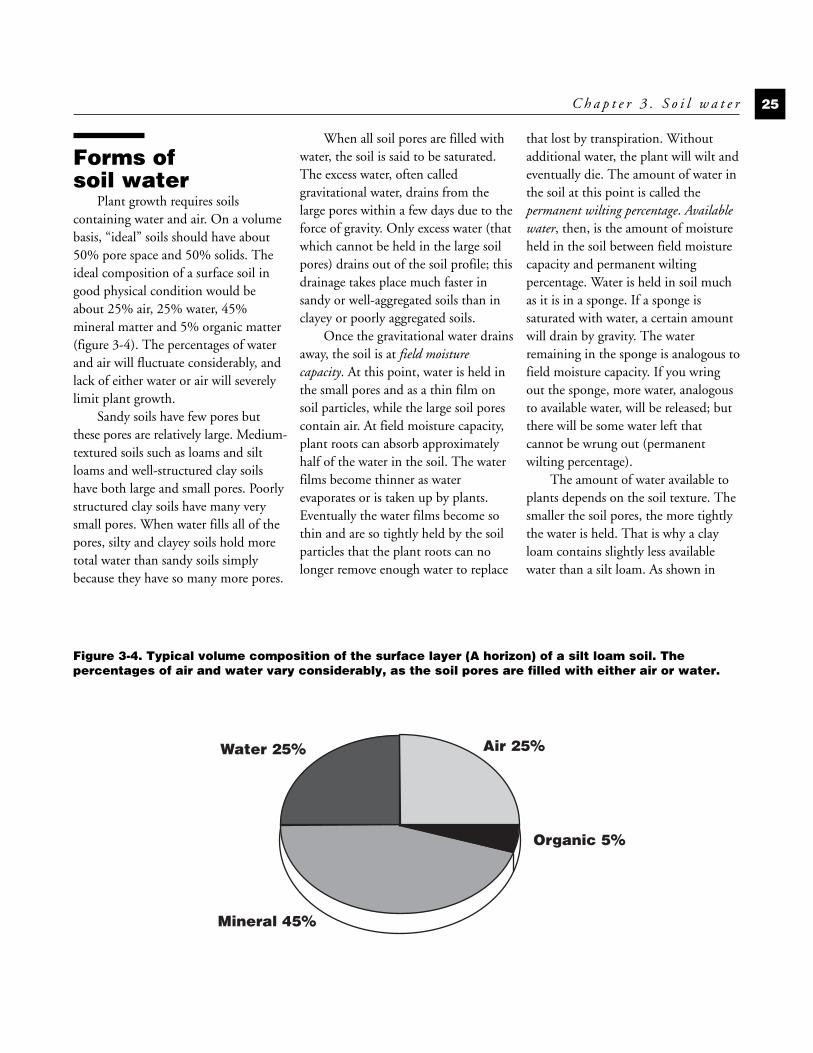
Forms of soil water
Plant growth requires soilscontaining water and air. On a volumebasis, “ideal” soils should have about50% pore space and 50% solids. Theideal composition of a surface soil ingood physical condition would beabout 25% air, 25% water, 45%mineral matter and 5% organic matter(figure 3-4). The percentages of waterand air will fluctuate considerably, andlack of either water or air will severelylimit plant growth.
Sandy soils have few pores butthese pores are relatively large. Medium-textured soils such as loams and siltloams and well-structured clay soilshave both large and small pores. Poorlystructured clay soils have many verysmall pores. When water fills all of thepores, silty and clayey soils hold moretotal water than sandy soils simplybecause they have so many more pores.
When all soil pores are filled withwater, the soil is said to be saturated.The excess water, often calledgravitational water, drains from thelarge pores within a few days due to theforce of gravity. Only excess water (thatwhich cannot be held in the large soilpores) drains out of the soil profile; thisdrainage takes place much faster insandy or well-aggregated soils than inclayey or poorly aggregated soils.
Once the gravitational water drainsaway, the soil is at field moisturecapacity. At this point, water is held inthe small pores and as a thin film onsoil particles, while the large soil porescontain air. At field moisture capacity,plant roots can absorb approximatelyhalf of the water in the soil. The waterfilms become thinner as waterevaporates or is taken up by plants.Eventually the water films become sothin and are so tightly held by the soilparticles that the plant roots can nolonger remove enough water to replace
that lost by transpiration. Withoutadditional water, the plant will wilt andeventually die. The amount of water inthe soil at this point is called thepermanent wilting percentage. Availablewater, then, is the amount of moistureheld in the soil between field moisturecapacity and permanent wiltingpercentage. Water is held in soil muchas it is in a sponge. If a sponge issaturated with water, a certain amountwill drain by gravity. The waterremaining in the sponge is analogous tofield moisture capacity. If you wringout the sponge, more water, analogousto available water, will be released; butthere will be some water left thatcannot be wrung out (permanentwilting percentage).
The amount of water available toplants depends on the soil texture. Thesmaller the soil pores, the more tightlythe water is held. That is why a clayloam contains slightly less availablewater than a silt loam. As shown in
C h a p t e r 3 . S o i l w a t e r 25
Air 25%
Organic 5%
Water 25%
Mineral 45%
Figure 3-4. Typical volume composition of the surface layer (A horizon) of a silt loam soil. Thepercentages of air and water vary considerably, as the soil pores are filled with either air or water.
C-3 10/18/05 11:08 AM Page 25
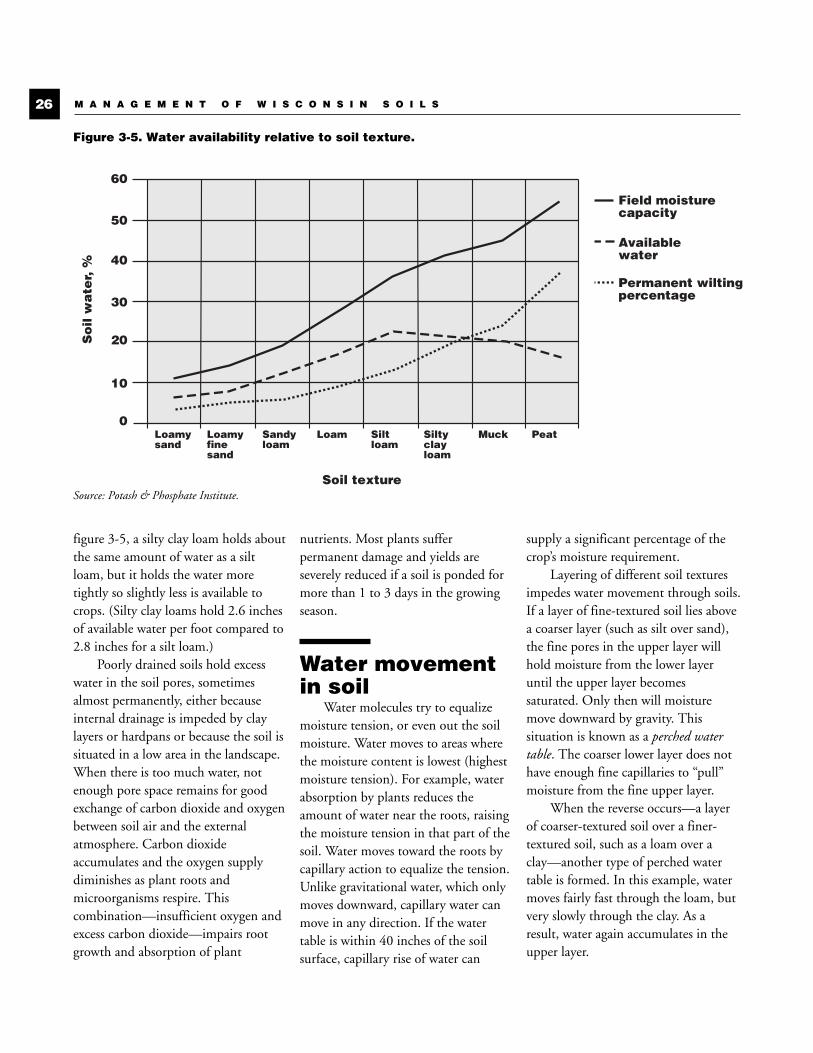
M A N A G E M E N T O F W I S C O N S I N S O I L S26
figure 3-5, a silty clay loam holds aboutthe same amount of water as a siltloam, but it holds the water moretightly so slightly less is available tocrops. (Silty clay loams hold 2.6 inchesof available water per foot compared to2.8 inches for a silt loam.)
Poorly drained soils hold excesswater in the soil pores, sometimesalmost permanently, either becauseinternal drainage is impeded by claylayers or hardpans or because the soil issituated in a low area in the landscape.When there is too much water, notenough pore space remains for goodexchange of carbon dioxide and oxygenbetween soil air and the externalatmosphere. Carbon dioxideaccumulates and the oxygen supplydiminishes as plant roots andmicroorganisms respire. Thiscombination—insufficient oxygen andexcess carbon dioxide—impairs rootgrowth and absorption of plant
nutrients. Most plants sufferpermanent damage and yields areseverely reduced if a soil is ponded formore than 1 to 3 days in the growingseason.
Water movementin soil
Water molecules try to equalizemoisture tension, or even out the soilmoisture. Water moves to areas wherethe moisture content is lowest (highestmoisture tension). For example, waterabsorption by plants reduces theamount of water near the roots, raisingthe moisture tension in that part of thesoil. Water moves toward the roots bycapillary action to equalize the tension.Unlike gravitational water, which onlymoves downward, capillary water canmove in any direction. If the watertable is within 40 inches of the soilsurface, capillary rise of water can
supply a significant percentage of thecrop’s moisture requirement.
Layering of different soil texturesimpedes water movement through soils.If a layer of fine-textured soil lies abovea coarser layer (such as silt over sand),the fine pores in the upper layer willhold moisture from the lower layeruntil the upper layer becomessaturated. Only then will moisturemove downward by gravity. Thissituation is known as a perched watertable. The coarser lower layer does nothave enough fine capillaries to “pull”moisture from the fine upper layer.
When the reverse occurs—a layerof coarser-textured soil over a finer-textured soil, such as a loam over aclay—another type of perched watertable is formed. In this example, watermoves fairly fast through the loam, butvery slowly through the clay. As aresult, water again accumulates in theupper layer.
So
il w
ate
r, %
Soil texture
40
30
20
10
0
50
60
Loamyfinesand
Sandyloam
Loam Silt loam
Siltyclay loam
Muck PeatLoamysand
Permanent wilting percentage
Field moisture capacity
Available water
Figure 3-5. Water availability relative to soil texture.
Source: Potash & Phosphate Institute.
C-3 10/18/05 11:08 AM Page 26
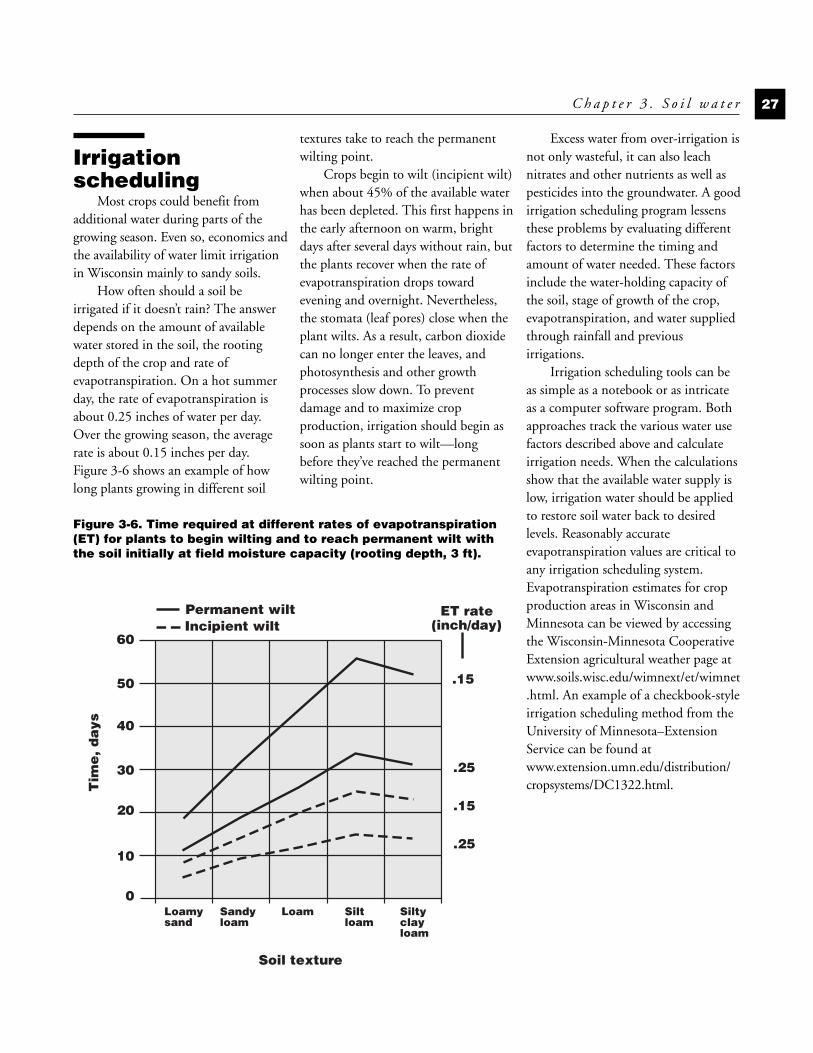
Irrigationscheduling
Most crops could benefit fromadditional water during parts of thegrowing season. Even so, economics andthe availability of water limit irrigationin Wisconsin mainly to sandy soils.
How often should a soil beirrigated if it doesn’t rain? The answerdepends on the amount of availablewater stored in the soil, the rootingdepth of the crop and rate ofevapotranspiration. On a hot summerday, the rate of evapotranspiration isabout 0.25 inches of water per day.Over the growing season, the averagerate is about 0.15 inches per day.Figure 3-6 shows an example of howlong plants growing in different soil
textures take to reach the permanentwilting point.
Crops begin to wilt (incipient wilt)when about 45% of the available waterhas been depleted. This first happens inthe early afternoon on warm, brightdays after several days without rain, butthe plants recover when the rate ofevapotranspiration drops towardevening and overnight. Nevertheless,the stomata (leaf pores) close when theplant wilts. As a result, carbon dioxidecan no longer enter the leaves, andphotosynthesis and other growthprocesses slow down. To preventdamage and to maximize cropproduction, irrigation should begin assoon as plants start to wilt—longbefore they’ve reached the permanentwilting point.
Excess water from over-irrigation isnot only wasteful, it can also leachnitrates and other nutrients as well aspesticides into the groundwater. A goodirrigation scheduling program lessensthese problems by evaluating differentfactors to determine the timing andamount of water needed. These factorsinclude the water-holding capacity ofthe soil, stage of growth of the crop,evapotranspiration, and water suppliedthrough rainfall and previousirrigations.
Irrigation scheduling tools can beas simple as a notebook or as intricateas a computer software program. Bothapproaches track the various water usefactors described above and calculateirrigation needs. When the calculationsshow that the available water supply islow, irrigation water should be appliedto restore soil water back to desiredlevels. Reasonably accurateevapotranspiration values are critical toany irrigation scheduling system.Evapotranspiration estimates for cropproduction areas in Wisconsin andMinnesota can be viewed by accessingthe Wisconsin-Minnesota CooperativeExtension agricultural weather page atwww.soils.wisc.edu/wimnext/et/wimnet.html. An example of a checkbook-styleirrigation scheduling method from theUniversity of Minnesota–ExtensionService can be found atwww.extension.umn.edu/distribution/cropsystems/DC1322.html.
C h a p t e r 3 . S o i l w a t e r 27
Soil texture
40
30
20
10
0
50
60
Sandyloam
Loam Silt loam
Siltyclay loam
Loamysand
Tim
e,
da
ys
.15
.25
.15
ET ratePermanent wilt
.25
Incipient wilt (inch/day)
Figure 3-6. Time required at different rates of evapotranspiration(ET) for plants to begin wilting and to reach permanent wilt withthe soil initially at field moisture capacity (rooting depth, 3 ft).
C-3 10/18/05 11:08 AM Page 27
Questions1.Approximately two-thirds of the
rainfall received in Wisconsin isreturned to the atmosphere by wayof evapotranspiration. What usefulpurpose(s) does evapotranspirationserve? What would happen if onlyone-third of the rainfall receivedreturned to the air byevapotranspiration?
2.Why is less water lost byevapotranspiration from landcropped to corn than from forestedland?
3.Explain why a well-fertilized cropuses less water to produce a poundof dry matter than does a crop on aninfertile soil.
4.A farmer has a field containing threekinds of soil: (a) a uniform loamysand several feet deep, (b) a silt loamseveral feet deep and (c) a clayseveral feet deep. Identify where inthe field you’d expect to see thefollowing characteristics:
a. Plants showing the first signs ofwater shortage.
b. Plants showing deficiencysymptoms of nitrogen andpotassium if no fertilizer wasused.
c. Soil that works up into a finegranular seedbed most readily.
d. Water ponding after a heavy rain.
5.Define the following:
a. field moisture capacity
b. permanent wilting percentage
c. available water
d. gravitational water
e. evapotranspiration
6.Corn sometimes curls in mid-afternoon due to moisture stress butrecovers by the next morning eventhough there was no rain or dew.Explain.
7.A farmer has difficulty establishingalfalfa on a soil containing 8.0%organic matter while the same cropgrows very well on another soilcontaining 3.0% organic matter.What is the most likely reason forthe poor alfalfa growth and survivalon the soil containing high organicmatter?
8.What is a perched water table?Under what conditions is a perchedwater table possible?
9. If corn is growing on a silt loam soil3 feet deep which contains 2 inchesof available water per foot of soil,and if 0.15 inches of water is lost perday by evapotranspiration, abouthow many days can this crop growwithout rain before showingincipient wilt? Permanent wilt?
M A N A G E M E N T O F W I S C O N S I N S O I L S28
C-3 10/18/05 11:08 AM Page 28
“But Nature neither plows,harrows, nor hoes her fields,and yet where water isabundant and the temperatureright, the grasses thrive, theflowers bloom and fruit, andtree and shrub vie with oneanother for occupancy of thewhole surface of the earth.”
F.H King, The Soil, 1895
Soil scientists have longappreciated the physical effect oftillage. F.H. King, UW Professor ofAgricultural Physics, in his book TheSoil, published in 1895, gives us aninsight that many have overlooked tothis day when he stated:
When we reflect upon Nature’smethods, we see plainly that they arequite different from those adopted bythrifty husbandry. In the first place,by Nature’s methods, not one seed inmany hundreds ever germinates andcomes to maturity, but in farming nosuch chances can be taken. In thesecond place, by Nature’s methods,almost all fields bear a mixedvegetation, …but in agriculturecertain crops must occupy the fieldfor the season to the exclusion of allothers, and in these…(fields) we findthe chief needs for, and the greatimportance of, good (soil) tilth...
Purpose of tillageThe main purposes of tillage are to
prepare a seedbed, prepare a rootbed,eliminate competing vegetation, andmanage previous crop residue. Theseedbed is that small volume of soil inthe immediate vicinity of thegerminating seed; whereas the rootbedis the much larger volume of soil inwhich roots develop. Tillage loosensand aerates the soil if done at theproper moisture stage. Over-aggressivesoil preparation can hurt crop
production and accelerate erosion bydestroying soil structure. Dependingupon the previous crop it may beadvantageous to incorporate or movesome crop residue so that the soil willwarm more quickly in the spring.Tillage to manage crop residuefollowing corn is common, whereasresidue may not be a considerationwhere a crop is planted after soybean.
Ideal conditions for a rootbed areconsiderably different than for aseedbed. A field serves as a rootbedthroughout 95% of the growing season,so the primary emphasis should be onrootbed preparation. A good seedbedrequires fine, grain-like soil aggregatesthat will be in firm contact with theseed. This ensures good moisturemovement to the seeds to speedgermination. However, a good rootbedrequires a loose and porous soil withsome residue being maintained on thesoil surface. Such a soil improves rootgrowth and absorbs water rapidly,reducing runoff and erosion. Hence,only the seedbed area should bethoroughly tilled and compacted.Preparing the entire field as a seedbedfor row crops wastes time and money.
Kinds of tillageTillage systems are sometimes
defined according to their objective(reduced, conventional, conservation)or according to the principal tillageimplement employed (moldboard plow,
29
Tillage
C H A P T E R
4
C-4 10/18/05 11:09 AM Page 29
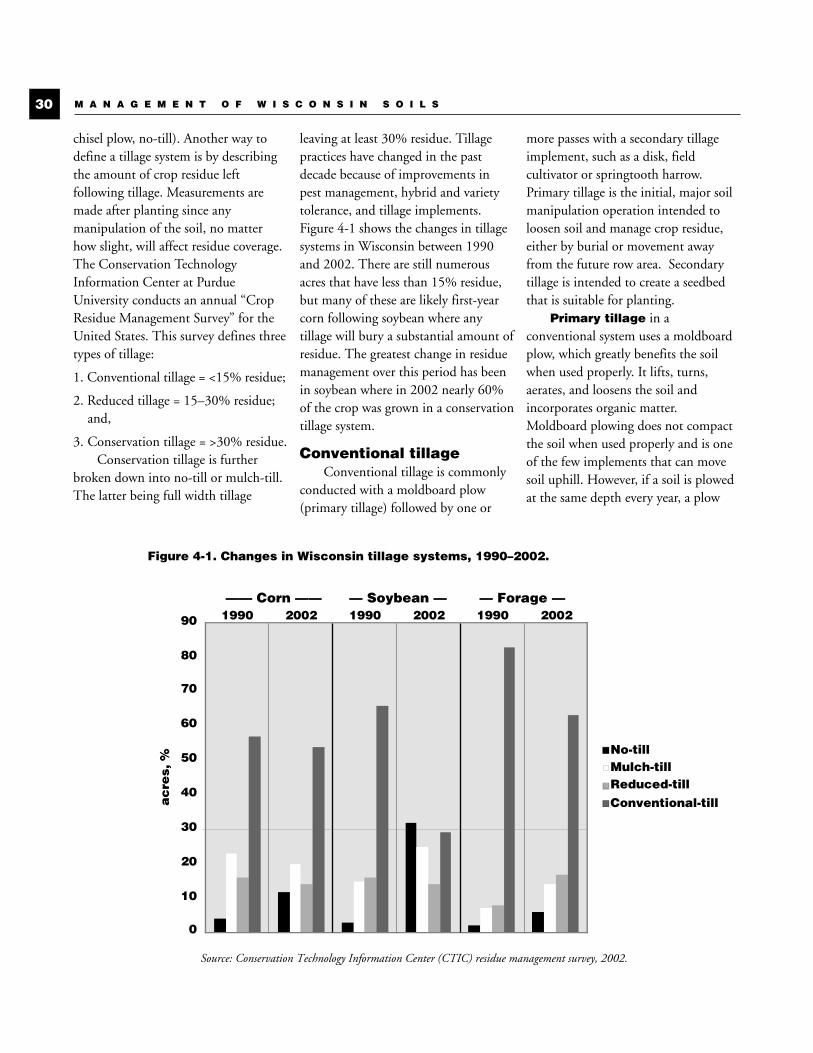
chisel plow, no-till). Another way todefine a tillage system is by describingthe amount of crop residue leftfollowing tillage. Measurements aremade after planting since anymanipulation of the soil, no matterhow slight, will affect residue coverage.The Conservation TechnologyInformation Center at PurdueUniversity conducts an annual “CropResidue Management Survey” for theUnited States. This survey defines threetypes of tillage:
1. Conventional tillage = <15% residue;
2. Reduced tillage = 15–30% residue;and,
3. Conservation tillage = >30% residue. Conservation tillage is further
broken down into no-till or mulch-till.The latter being full width tillage
leaving at least 30% residue. Tillagepractices have changed in the pastdecade because of improvements inpest management, hybrid and varietytolerance, and tillage implements.Figure 4-1 shows the changes in tillagesystems in Wisconsin between 1990and 2002. There are still numerousacres that have less than 15% residue,but many of these are likely first-yearcorn following soybean where anytillage will bury a substantial amount ofresidue. The greatest change in residuemanagement over this period has beenin soybean where in 2002 nearly 60%of the crop was grown in a conservationtillage system.
Conventional tillageConventional tillage is commonly
conducted with a moldboard plow(primary tillage) followed by one or
more passes with a secondary tillageimplement, such as a disk, fieldcultivator or springtooth harrow.Primary tillage is the initial, major soilmanipulation operation intended toloosen soil and manage crop residue,either by burial or movement awayfrom the future row area. Secondarytillage is intended to create a seedbedthat is suitable for planting.
Primary tillage in aconventional system uses a moldboardplow, which greatly benefits the soilwhen used properly. It lifts, turns,aerates, and loosens the soil andincorporates organic matter.Moldboard plowing does not compactthe soil when used properly and is oneof the few implements that can movesoil uphill. However, if a soil is plowedat the same depth every year, a plow
M A N A G E M E N T O F W I S C O N S I N S O I L S30
0
10
20
30
40
50
60
70
80
90
acre
s, %
No-tillMulch-tillReduced-tillConventional-till
Figure 4-1. Changes in Wisconsin tillage systems, 1990–2002.
Source: Conservation Technology Information Center (CTIC) residue management survey, 2002.
1990 2002 1990 2002 1990 2002— Soybean — — Forage ——— Corn ——
C-4 10/18/05 11:09 AM Page 30
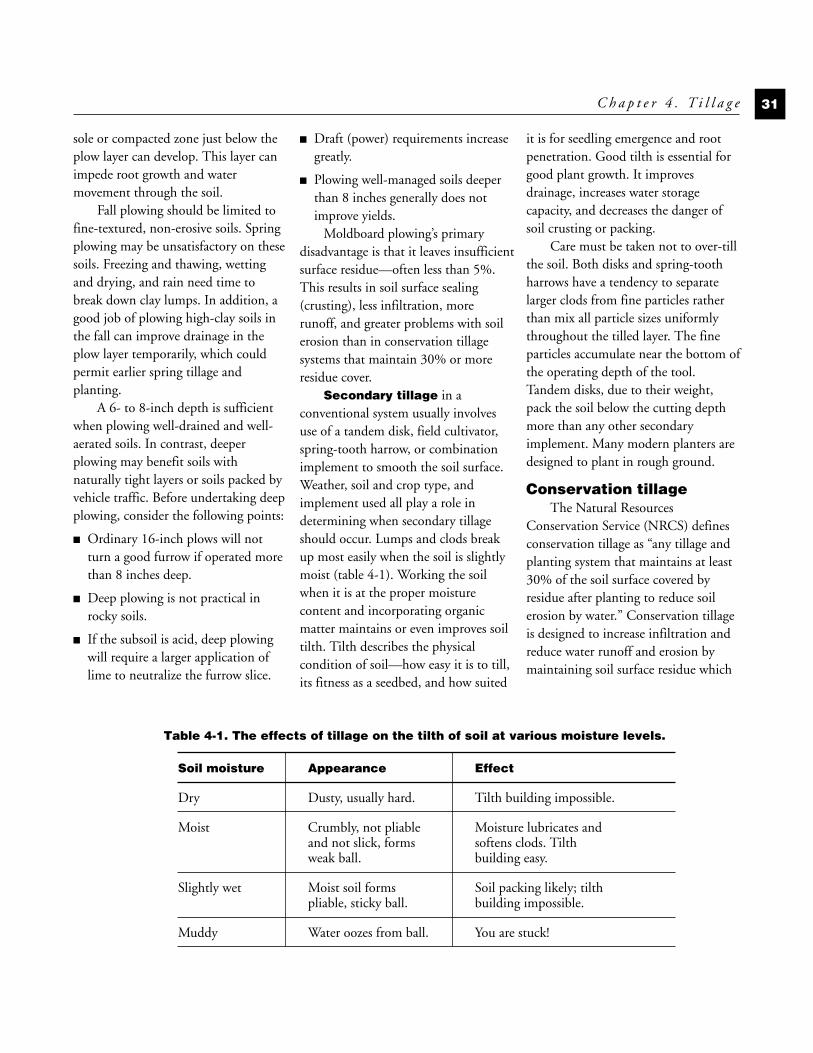
sole or compacted zone just below theplow layer can develop. This layer canimpede root growth and watermovement through the soil.
Fall plowing should be limited tofine-textured, non-erosive soils. Springplowing may be unsatisfactory on thesesoils. Freezing and thawing, wettingand drying, and rain need time tobreak down clay lumps. In addition, agood job of plowing high-clay soils inthe fall can improve drainage in theplow layer temporarily, which couldpermit earlier spring tillage andplanting.
A 6- to 8-inch depth is sufficientwhen plowing well-drained and well-aerated soils. In contrast, deeperplowing may benefit soils withnaturally tight layers or soils packed byvehicle traffic. Before undertaking deepplowing, consider the following points:
■ Ordinary 16-inch plows will notturn a good furrow if operated morethan 8 inches deep.
■ Deep plowing is not practical inrocky soils.
■ If the subsoil is acid, deep plowingwill require a larger application oflime to neutralize the furrow slice.
■ Draft (power) requirements increasegreatly.
■ Plowing well-managed soils deeperthan 8 inches generally does notimprove yields.
Moldboard plowing’s primarydisadvantage is that it leaves insufficientsurface residue—often less than 5%.This results in soil surface sealing(crusting), less infiltration, morerunoff, and greater problems with soilerosion than in conservation tillagesystems that maintain 30% or moreresidue cover.
Secondary tillage in aconventional system usually involvesuse of a tandem disk, field cultivator,spring-tooth harrow, or combinationimplement to smooth the soil surface.Weather, soil and crop type, andimplement used all play a role indetermining when secondary tillageshould occur. Lumps and clods breakup most easily when the soil is slightlymoist (table 4-1). Working the soilwhen it is at the proper moisturecontent and incorporating organicmatter maintains or even improves soiltilth. Tilth describes the physicalcondition of soil—how easy it is to till,its fitness as a seedbed, and how suited
it is for seedling emergence and rootpenetration. Good tilth is essential forgood plant growth. It improvesdrainage, increases water storagecapacity, and decreases the danger ofsoil crusting or packing.
Care must be taken not to over-tillthe soil. Both disks and spring-toothharrows have a tendency to separatelarger clods from fine particles ratherthan mix all particle sizes uniformlythroughout the tilled layer. The fineparticles accumulate near the bottom ofthe operating depth of the tool.Tandem disks, due to their weight,pack the soil below the cutting depthmore than any other secondaryimplement. Many modern planters aredesigned to plant in rough ground.
Conservation tillageThe Natural Resources
Conservation Service (NRCS) definesconservation tillage as “any tillage andplanting system that maintains at least30% of the soil surface covered byresidue after planting to reduce soilerosion by water.” Conservation tillageis designed to increase infiltration andreduce water runoff and erosion bymaintaining soil surface residue which
C h a p t e r 4 . T i l l a g e 31
Table 4-1. The effects of tillage on the tilth of soil at various moisture levels.
Soil moisture Appearance Effect
Dry Dusty, usually hard. Tilth building impossible.
Moist Crumbly, not pliable Moisture lubricates andand not slick, forms softens clods. Tilth weak ball. building easy.
Slightly wet Moist soil forms Soil packing likely; tilthpliable, sticky ball. building impossible.
Muddy Water oozes from ball. You are stuck!
C-4 10/18/05 11:09 AM Page 31
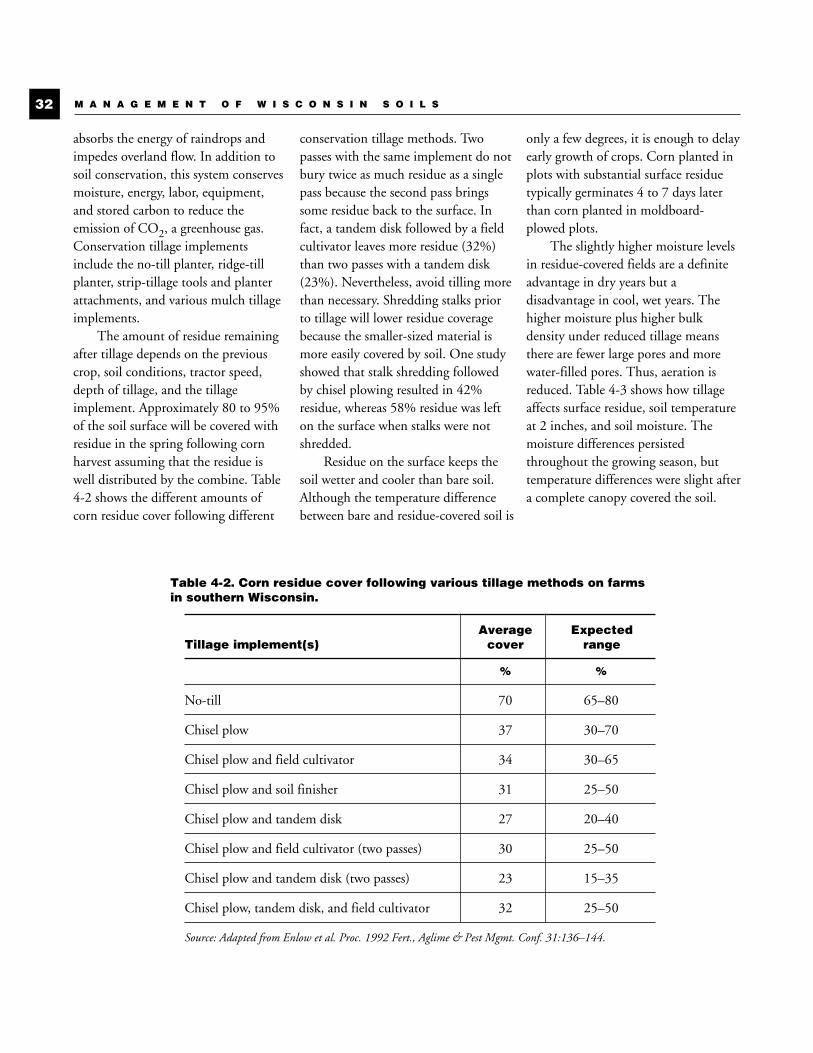
absorbs the energy of raindrops andimpedes overland flow. In addition tosoil conservation, this system conservesmoisture, energy, labor, equipment,and stored carbon to reduce theemission of CO2, a greenhouse gas.Conservation tillage implementsinclude the no-till planter, ridge-tillplanter, strip-tillage tools and planterattachments, and various mulch tillageimplements.
The amount of residue remainingafter tillage depends on the previouscrop, soil conditions, tractor speed,depth of tillage, and the tillageimplement. Approximately 80 to 95%of the soil surface will be covered withresidue in the spring following cornharvest assuming that the residue iswell distributed by the combine. Table4-2 shows the different amounts ofcorn residue cover following different
conservation tillage methods. Twopasses with the same implement do notbury twice as much residue as a singlepass because the second pass bringssome residue back to the surface. Infact, a tandem disk followed by a fieldcultivator leaves more residue (32%)than two passes with a tandem disk(23%). Nevertheless, avoid tilling morethan necessary. Shredding stalks priorto tillage will lower residue coveragebecause the smaller-sized material ismore easily covered by soil. One studyshowed that stalk shredding followedby chisel plowing resulted in 42%residue, whereas 58% residue was lefton the surface when stalks were notshredded.
Residue on the surface keeps thesoil wetter and cooler than bare soil.Although the temperature differencebetween bare and residue-covered soil is
only a few degrees, it is enough to delayearly growth of crops. Corn planted inplots with substantial surface residuetypically germinates 4 to 7 days laterthan corn planted in moldboard-plowed plots.
The slightly higher moisture levelsin residue-covered fields are a definiteadvantage in dry years but adisadvantage in cool, wet years. Thehigher moisture plus higher bulkdensity under reduced tillage meansthere are fewer large pores and morewater-filled pores. Thus, aeration isreduced. Table 4-3 shows how tillageaffects surface residue, soil temperatureat 2 inches, and soil moisture. Themoisture differences persistedthroughout the growing season, buttemperature differences were slight aftera complete canopy covered the soil.
M A N A G E M E N T O F W I S C O N S I N S O I L S32
Table 4-2. Corn residue cover following various tillage methods on farmsin southern Wisconsin.
Average ExpectedTillage implement(s) cover range
% %
No-till 70 65–80
Chisel plow 37 30–70
Chisel plow and field cultivator 34 30–65
Chisel plow and soil finisher 31 25–50
Chisel plow and tandem disk 27 20–40
Chisel plow and field cultivator (two passes) 30 25–50
Chisel plow and tandem disk (two passes) 23 15–35
Chisel plow, tandem disk, and field cultivator 32 25–50
Source: Adapted from Enlow et al. Proc. 1992 Fert., Aglime & Pest Mgmt. Conf. 31:136–144.
C-4 10/18/05 11:09 AM Page 32
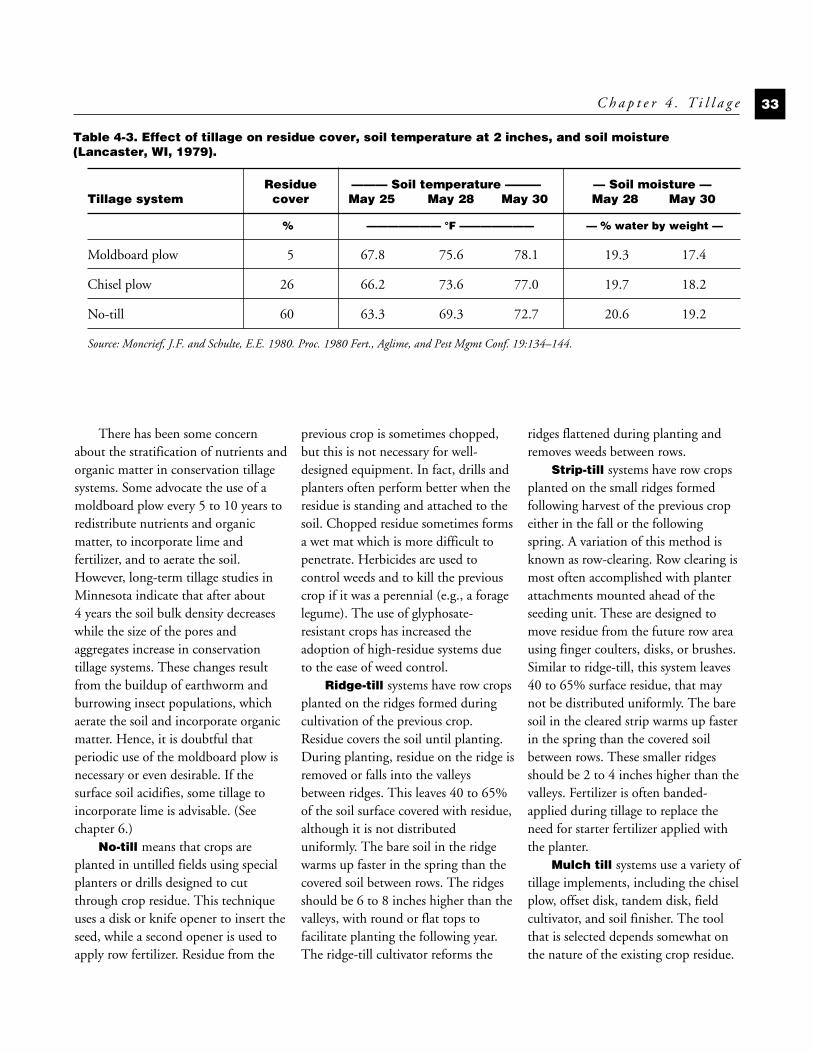
There has been some concernabout the stratification of nutrients andorganic matter in conservation tillagesystems. Some advocate the use of amoldboard plow every 5 to 10 years toredistribute nutrients and organicmatter, to incorporate lime andfertilizer, and to aerate the soil.However, long-term tillage studies inMinnesota indicate that after about4 years the soil bulk density decreaseswhile the size of the pores andaggregates increase in conservationtillage systems. These changes resultfrom the buildup of earthworm andburrowing insect populations, whichaerate the soil and incorporate organicmatter. Hence, it is doubtful thatperiodic use of the moldboard plow isnecessary or even desirable. If thesurface soil acidifies, some tillage toincorporate lime is advisable. (Seechapter 6.)
No-till means that crops areplanted in untilled fields using specialplanters or drills designed to cutthrough crop residue. This techniqueuses a disk or knife opener to insert theseed, while a second opener is used toapply row fertilizer. Residue from the
previous crop is sometimes chopped,but this is not necessary for well-designed equipment. In fact, drills andplanters often perform better when theresidue is standing and attached to thesoil. Chopped residue sometimes formsa wet mat which is more difficult topenetrate. Herbicides are used tocontrol weeds and to kill the previouscrop if it was a perennial (e.g., a foragelegume). The use of glyphosate-resistant crops has increased theadoption of high-residue systems dueto the ease of weed control.
Ridge-till systems have row cropsplanted on the ridges formed duringcultivation of the previous crop.Residue covers the soil until planting.During planting, residue on the ridge isremoved or falls into the valleysbetween ridges. This leaves 40 to 65%of the soil surface covered with residue,although it is not distributeduniformly. The bare soil in the ridgewarms up faster in the spring than thecovered soil between rows. The ridgesshould be 6 to 8 inches higher than thevalleys, with round or flat tops tofacilitate planting the following year.The ridge-till cultivator reforms the
ridges flattened during planting andremoves weeds between rows.
Strip-till systems have row cropsplanted on the small ridges formedfollowing harvest of the previous cropeither in the fall or the followingspring. A variation of this method isknown as row-clearing. Row clearing ismost often accomplished with planterattachments mounted ahead of theseeding unit. These are designed tomove residue from the future row areausing finger coulters, disks, or brushes.Similar to ridge-till, this system leaves40 to 65% surface residue, that maynot be distributed uniformly. The baresoil in the cleared strip warms up fasterin the spring than the covered soilbetween rows. These smaller ridgesshould be 2 to 4 inches higher than thevalleys. Fertilizer is often banded-applied during tillage to replace theneed for starter fertilizer applied withthe planter.
Mulch till systems use a variety oftillage implements, including the chiselplow, offset disk, tandem disk, fieldcultivator, and soil finisher. The toolthat is selected depends somewhat onthe nature of the existing crop residue.
C h a p t e r 4 . T i l l a g e 33
Table 4-3. Effect of tillage on residue cover, soil temperature at 2 inches, and soil moisture(Lancaster, WI, 1979).
Residue ——— Soil temperature ——— — Soil moisture —Tillage system cover May 25 May 28 May 30 May 28 May 30
% ——————— °F ——————— — % water by weight —
Moldboard plow 5 67.8 75.6 78.1 19.3 17.4
Chisel plow 26 66.2 73.6 77.0 19.7 18.2
No-till 60 63.3 69.3 72.7 20.6 19.2
Source: Moncrief, J.F. and Schulte, E.E. 1980. Proc. 1980 Fert., Aglime, and Pest Mgmt Conf. 19:134–144.
C-4 10/18/05 11:09 AM Page 33
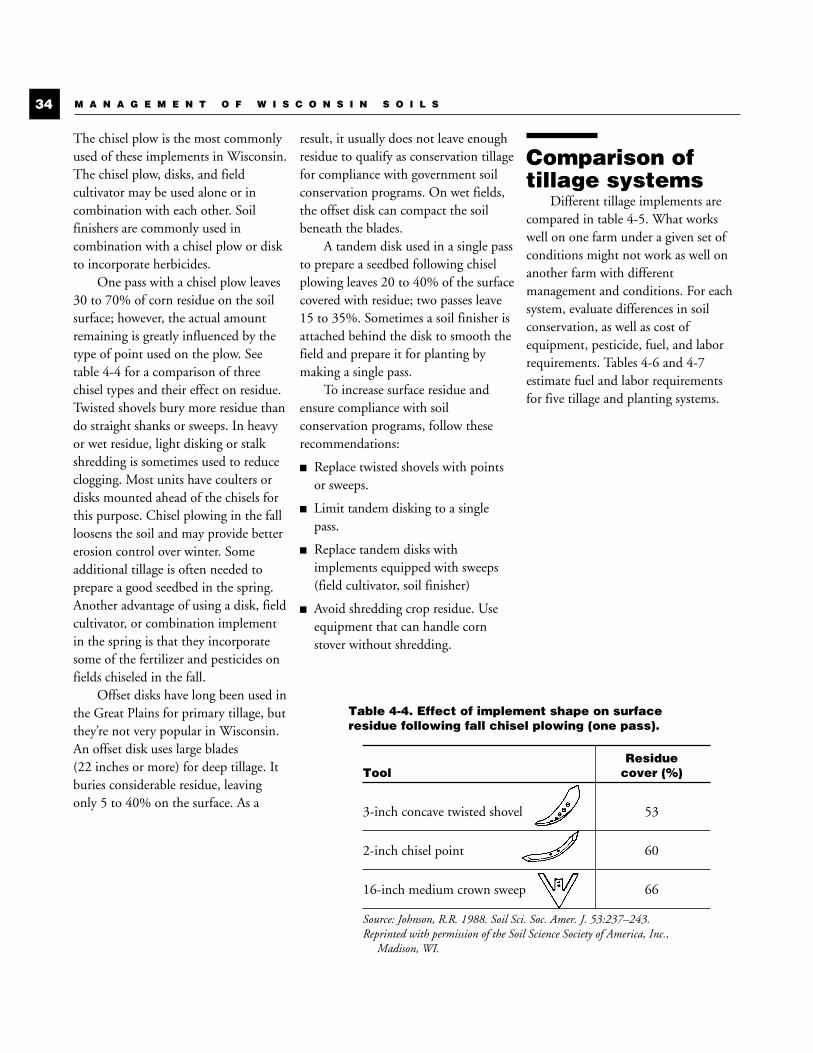
The chisel plow is the most commonlyused of these implements in Wisconsin.The chisel plow, disks, and fieldcultivator may be used alone or incombination with each other. Soilfinishers are commonly used incombination with a chisel plow or diskto incorporate herbicides.
One pass with a chisel plow leaves30 to 70% of corn residue on the soilsurface; however, the actual amountremaining is greatly influenced by thetype of point used on the plow. Seetable 4-4 for a comparison of threechisel types and their effect on residue.Twisted shovels bury more residue thando straight shanks or sweeps. In heavyor wet residue, light disking or stalkshredding is sometimes used to reduceclogging. Most units have coulters ordisks mounted ahead of the chisels forthis purpose. Chisel plowing in the fallloosens the soil and may provide bettererosion control over winter. Someadditional tillage is often needed toprepare a good seedbed in the spring.Another advantage of using a disk, fieldcultivator, or combination implementin the spring is that they incorporatesome of the fertilizer and pesticides onfields chiseled in the fall.
Offset disks have long been used inthe Great Plains for primary tillage, butthey’re not very popular in Wisconsin.An offset disk uses large blades(22 inches or more) for deep tillage. Itburies considerable residue, leavingonly 5 to 40% on the surface. As a
result, it usually does not leave enoughresidue to qualify as conservation tillagefor compliance with government soilconservation programs. On wet fields,the offset disk can compact the soilbeneath the blades.
A tandem disk used in a single passto prepare a seedbed following chiselplowing leaves 20 to 40% of the surfacecovered with residue; two passes leave15 to 35%. Sometimes a soil finisher isattached behind the disk to smooth thefield and prepare it for planting bymaking a single pass.
To increase surface residue andensure compliance with soilconservation programs, follow theserecommendations:
■ Replace twisted shovels with pointsor sweeps.
■ Limit tandem disking to a singlepass.
■ Replace tandem disks withimplements equipped with sweeps(field cultivator, soil finisher)
■ Avoid shredding crop residue. Useequipment that can handle cornstover without shredding.
Comparison oftillage systems
Different tillage implements arecompared in table 4-5. What workswell on one farm under a given set ofconditions might not work as well onanother farm with differentmanagement and conditions. For eachsystem, evaluate differences in soilconservation, as well as cost ofequipment, pesticide, fuel, and laborrequirements. Tables 4-6 and 4-7estimate fuel and labor requirementsfor five tillage and planting systems.
M A N A G E M E N T O F W I S C O N S I N S O I L S34
Table 4-4. Effect of implement shape on surfaceresidue following fall chisel plowing (one pass).
ResidueTool cover (%)
3-inch concave twisted shovel 53
2-inch chisel point 60
16-inch medium crown sweep 66
Source: Johnson, R.R. 1988. Soil Sci. Soc. Amer. J. 53:237–243.Reprinted with permission of the Soil Science Society of America, Inc.,
Madison, WI.
C-4 10/18/05 11:09 AM Page 34
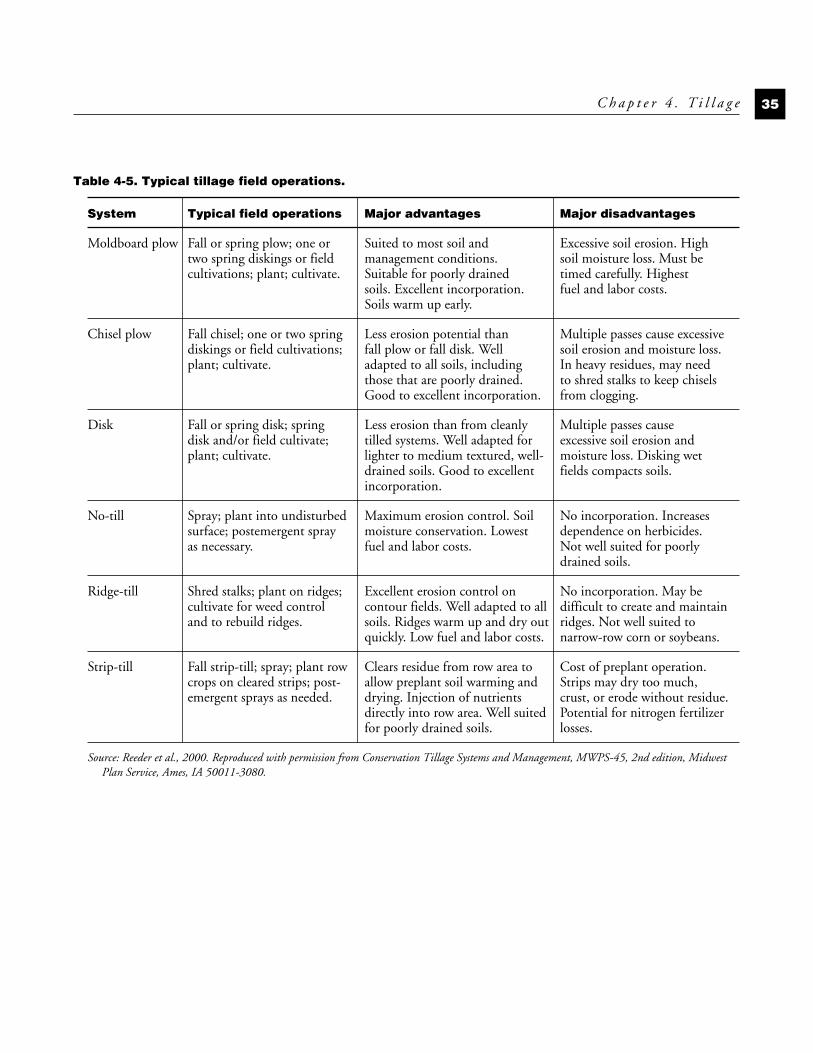
C h a p t e r 4 . T i l l a g e 35
Table 4-5. Typical tillage field operations.
System Typical field operations Major advantages Major disadvantages
Moldboard plow Fall or spring plow; one or Suited to most soil and Excessive soil erosion. High two spring diskings or field management conditions. soil moisture loss. Must be cultivations; plant; cultivate. Suitable for poorly drained timed carefully. Highest
soils. Excellent incorporation. fuel and labor costs.Soils warm up early.
Chisel plow Fall chisel; one or two spring Less erosion potential than Multiple passes cause excessivediskings or field cultivations; fall plow or fall disk. Well soil erosion and moisture loss. plant; cultivate. adapted to all soils, including In heavy residues, may need
those that are poorly drained. to shred stalks to keep chisels Good to excellent incorporation. from clogging.
Disk Fall or spring disk; spring Less erosion than from cleanly Multiple passes cause disk and/or field cultivate; tilled systems. Well adapted for excessive soil erosion and plant; cultivate. lighter to medium textured, well- moisture loss. Disking wet
drained soils. Good to excellent fields compacts soils.incorporation.
No-till Spray; plant into undisturbed Maximum erosion control. Soil No incorporation. Increases surface; postemergent spray moisture conservation. Lowest dependence on herbicides. as necessary. fuel and labor costs. Not well suited for poorly
drained soils.
Ridge-till Shred stalks; plant on ridges; Excellent erosion control on No incorporation. May be cultivate for weed control contour fields. Well adapted to all difficult to create and maintain and to rebuild ridges. soils. Ridges warm up and dry out ridges. Not well suited to
quickly. Low fuel and labor costs. narrow-row corn or soybeans.
Strip-till Fall strip-till; spray; plant row Clears residue from row area to Cost of preplant operation. crops on cleared strips; post- allow preplant soil warming and Strips may dry too much,emergent sprays as needed. drying. Injection of nutrients crust, or erode without residue.
directly into row area. Well suited Potential for nitrogen fertilizerfor poorly drained soils. losses.
Source: Reeder et al., 2000. Reproduced with permission from Conservation Tillage Systems and Management, MWPS-45, 2nd edition, MidwestPlan Service, Ames, IA 50011-3080.
C-4 10/18/05 11:09 AM Page 35

M A N A G E M E N T O F W I S C O N S I N S O I L S36
Table 4-6. Typical diesel fuel requirements for various tillage and planting systems.
————————————— Fuel use, gal/a —————————————
Operation Moldboard Chisel Disk No-till/Strip-till Ridge-till
Chop stalks 0.55
Moldboard plow 2.25
Chisel plow 1.05
Fertilize, knife 0.60 0.60 0.60 0.60 0.60
Disk 1.48a 0.74 1.48a
Plant 0.52 0.52 0.52 0.60 0.68
Cultivate 0.43 0.43 0.43 0.86a
Spray 0.23a
Total 5.28 3.34 3.03 1.43 2.69
aTwo passes. Source: Reeder et al., 2000. Reproduced with permission from Conservation Tillage Systems and Management, MWPS-45, 2nd edition, Midwest
Plan Service, Ames, IA 50011-3080.
Table 4-7. Typical labor requirements for various tillage and planting systems.
————————————— Labor, hr/aa —————————————
Operation Moldboard Chisel Disk No-till/Strip-till Ridge-till
Chop stalks 0.17
Moldboard plow 0.38
Chisel plow 0.21
Fertilize, knife 0.13 0.13 0.13 0.13 0.13
Disk 0.32b 0.16 0.32b
Plant 0.21 0.21 0.21 0.25 0.25
Cultivate 0.18 0.18 0.18 0.36b
Spray 0.11b
Total 1.22 0.89 0.84 0.49 0.91
aHours per acre assumes 100 hp tractor and matching equipment for average soil conditions.bTwo passes.Source: Reeder et al., 2000. Reproduced with permission from Conservation Tillage Systems and Management, MWPS-45, 2nd edition, Midwest
Plan Service, Ames, IA 50011-3080.
C-4 10/18/05 11:09 AM Page 36
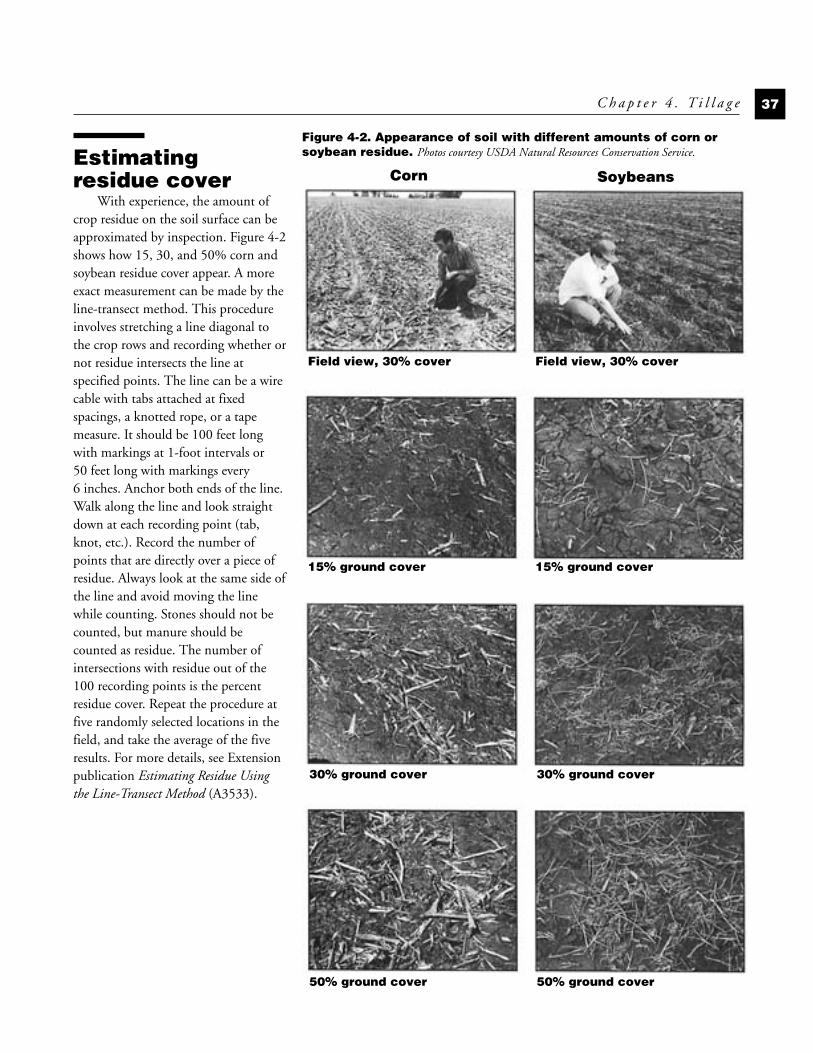
Estimatingresidue cover
With experience, the amount ofcrop residue on the soil surface can beapproximated by inspection. Figure 4-2shows how 15, 30, and 50% corn andsoybean residue cover appear. A moreexact measurement can be made by theline-transect method. This procedureinvolves stretching a line diagonal tothe crop rows and recording whether ornot residue intersects the line atspecified points. The line can be a wirecable with tabs attached at fixedspacings, a knotted rope, or a tapemeasure. It should be 100 feet longwith markings at 1-foot intervals or50 feet long with markings every6 inches. Anchor both ends of the line.Walk along the line and look straightdown at each recording point (tab,knot, etc.). Record the number ofpoints that are directly over a piece ofresidue. Always look at the same side ofthe line and avoid moving the linewhile counting. Stones should not becounted, but manure should becounted as residue. The number ofintersections with residue out of the100 recording points is the percentresidue cover. Repeat the procedure atfive randomly selected locations in thefield, and take the average of the fiveresults. For more details, see Extensionpublication Estimating Residue Usingthe Line-Transect Method (A3533).
C h a p t e r 4 . T i l l a g e 37
Figure 4-2. Appearance of soil with different amounts of corn orsoybean residue. Photos courtesy USDA Natural Resources Conservation Service.
Corn Soybeans
Field view, 30% cover
15% ground cover
30% ground cover
50% ground cover
Field view, 30% cover
15% ground cover
30% ground cover
50% ground cover
C-4 10/18/05 11:09 AM Page 37
Soil crustingRaindrop impact on bare soil
dislodges individual sand, silt, clay, andorganic matter particles from soilaggregates. When pools of waterdevelop, the sand settles to the bottom,the silt rests on top of the sand, and theclay on top of the silt—if it is notcarried away with organic matterparticles in the runoff water. When thewater dries, a surface crust about1⁄4-inch thick is formed. This crust canprevent seedling emergence, reduce airexchange, limit water infiltration, andincrease water runoff.
Crop residue on the surface retardscrust formation by absorbing theenergy of the raindrop and limiting theamount of dislodged soil particles.Coarse, sandy soils do not form crusts,nor do well-granulated clays. Mostclayey soils will shrink enough ondrying to break up crusts. Sandy loamand silt loam soils low in organicmatter seem to produce the densest andthickest crusts. Sometimes these crustscan be broken up with a rotary hoe.
Soil compactionCompacted soil reduces water
infiltration at the surface and decreasespermeability at lower levels, reducesaeration, and physically restricts plantshoot emergence and rootdevelopment. Three forces compactsoil: gravity, rain, and traffic. If the soilsurface is bare, raindrop impact tendsto dislodge silt and clay particles fromaggregates at the surface. The silt and
clay get washed into larger pores,increasing the bulk density of the soil.Residue on the surface protects soilstructure from this effect of raindropimpact.
Moisture is usually thedetermining factor in compaction.Before doing any field work, check soilmoisture, not only at the surface but tothe depth of tillage and immediatelybelow. The most serious damage occurswhen tillage, planting, cultivating, orharvesting operations are done whenthe soil is wet. For example, in onestudy on a clay loam soil, three passeswith a tractor packed the plow layer tothe same bulk density as the subsoil.
It is a good practice to return asmuch fresh organic matter (cropresidue, manure) to the soil as possible.All soil compaction problems becomemore severe as organic matter isdepleted. Humus (decomposingorganic matter) acts as a cementingmaterial to give stability to soilaggregates, thus maintaining soilstructure.
Most compaction is the result ofwheel traffic. Large rubber tires causeless surface compaction than small tiresbecause of their larger “footprint.”Radial-ply tires have a larger footprintthan bias-ply tires. Depth ofcompaction depends on the total loadon the tire. Deep compaction is notaffected by slippage of a driving tire,but it is increased by liquid in the tireand wheel weights. Wheel weightsshould be removed when they are notneeded for traction.
Another way to reduce compactionis to control traffic. All vehicle andimplement wheels are spaced to runcentered between rows. Many tillage,planting, spraying, and harvestingoperations can use the same tracks. Incontinuous row crops, this systemworks well with ridge-till, strip-till, andno-till where the same tracks are usedyear after year. Traffic, and thereforecompaction, is confined to a smallpercentage of the soil between rows.Compaction is thereby managed, noteliminated.
A common management responseto compaction is subsoiling or deeptillage. Recent research showed that thetype of subsoiler that is used caninfluence yield. A straight-shankedsubsoiler following either corn orsoybean was found to increase cropyield when compared to a moreaggressive subsoiler that lifted andshattered the entire soil volume.Researchers have noted that intensivesubsoiling destroys the bearing strengthand natural channels in the soil suchthat it can be recompacted to a worsecondition. Before subsoiling,compaction should be diagnosed. Themost common tool is a conepenetrometer that is pushed into thesoil at a constant rate. Be sure to noteboth the intensity and depth of theresistance. Subsoiling points should run1 to 2 inches below the compactedlayer. Be sure to take penetrometermeasurements in affected andunaffected areas because the resistanceto penetration is relative to themoisture content of the soil.
M A N A G E M E N T O F W I S C O N S I N S O I L S38
C-4 10/18/05 11:09 AM Page 38

Effect of tillageon nutrientavailability
Wisconsin research shows thattillage has little influence onphosphorus (P) availability, but itstrongly influences the availability ofnitrogen (N) and potassium (K).Nutrient availability is linked to tillagebecause of changes in soil moisture andair space. Reduced tillage increasesmoisture and reduces air space. Figure4-3 shows how various tillage systemsaffect moisture content and air space.
For nitrogen, reduced air spaceprovides conditions conducive to theconversion of nitrate-nitrogen toatmospheric nitrogen (denitrification)resulting in less plant-available nitrogen.Studies of seven soils across the U.S.have shown a much higher populationof denitrifying microorganisms in no-till plots compared to moldboard-plowed plots. Wisconsin research showsthat, in wet years, nitrogen is lessavailable in no-till plots compared tomoldboard or chisel-plowed plots.However, in dry years the no-till plotshad better yields than moldboard orchisel-plowed plots.
Reduced air space also plays a rolein potassium availability. Theconcentration of potassium in plantroot cells is about 2,000 times higherthan the concentration of potassium inthe soil solution. Plants must exertenergy to take in potassium against thishigh concentration gradient. Thisenergy comes from respiration of sugarstranslocated to the roots from theleaves where it was manufactured.Respiration requires oxygen, so whenaeration is reduced, the plant has lessenergy to extract potassium (and othernutrients).
C h a p t e r 4 . T i l l a g e 39
Figure 4-3. Influence of tillage on soil bulk density and pore spaceoccupied by air or water (upper 3 inches of soil).
Air10.8%
Water 35.6%
Solids53.6%
No till
Water 26.2%
Solids43.4%
Air30.4%
Moldboard
Water 25.3%
Solids43.0%
Air31.7%
Chisel
Adapted from Moncrief, J.F. 1981. Ph.D thesis, UW-Madison.
C-4 10/18/05 11:09 AM Page 39
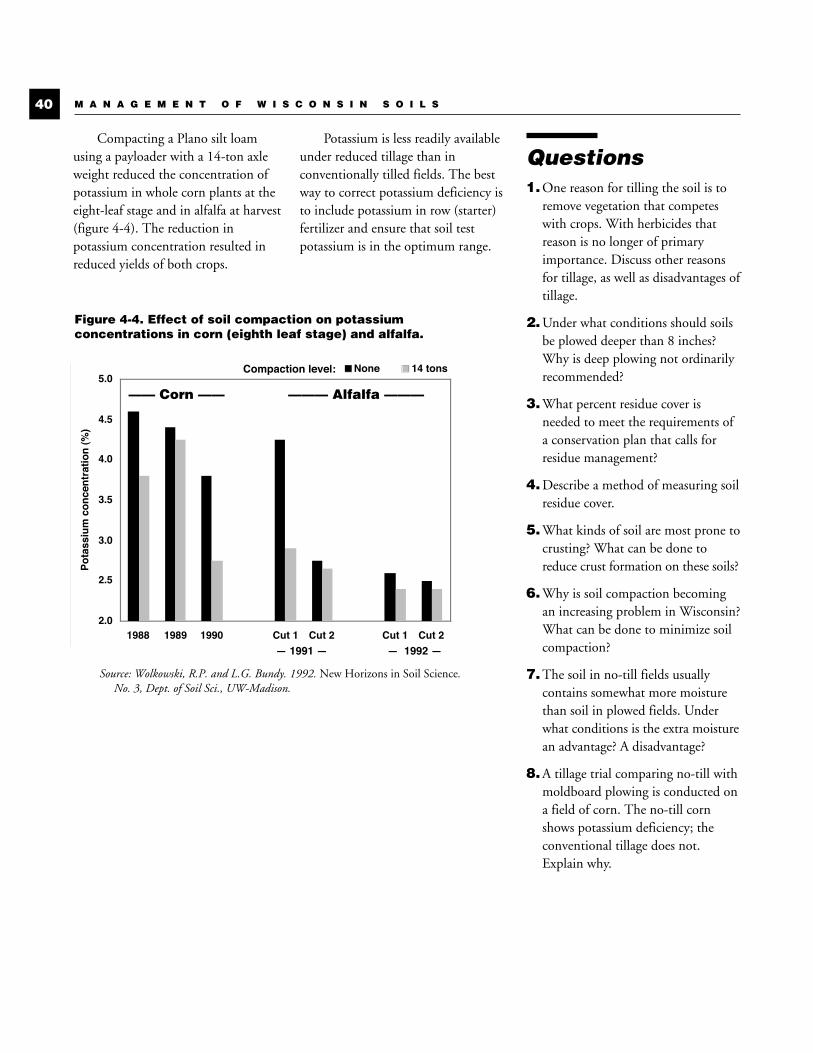
Compacting a Plano silt loamusing a payloader with a 14-ton axleweight reduced the concentration ofpotassium in whole corn plants at theeight-leaf stage and in alfalfa at harvest(figure 4-4). The reduction inpotassium concentration resulted inreduced yields of both crops.
Potassium is less readily availableunder reduced tillage than inconventionally tilled fields. The bestway to correct potassium deficiency isto include potassium in row (starter)fertilizer and ensure that soil testpotassium is in the optimum range.
Questions1.One reason for tilling the soil is to
remove vegetation that competeswith crops. With herbicides thatreason is no longer of primaryimportance. Discuss other reasonsfor tillage, as well as disadvantages oftillage.
2.Under what conditions should soilsbe plowed deeper than 8 inches?Why is deep plowing not ordinarilyrecommended?
3.What percent residue cover isneeded to meet the requirements ofa conservation plan that calls forresidue management?
4.Describe a method of measuring soilresidue cover.
5.What kinds of soil are most prone tocrusting? What can be done toreduce crust formation on these soils?
6.Why is soil compaction becomingan increasing problem in Wisconsin?What can be done to minimize soilcompaction?
7.The soil in no-till fields usuallycontains somewhat more moisturethan soil in plowed fields. Underwhat conditions is the extra moisturean advantage? A disadvantage?
8.A tillage trial comparing no-till withmoldboard plowing is conducted ona field of corn. The no-till cornshows potassium deficiency; theconventional tillage does not.Explain why.
M A N A G E M E N T O F W I S C O N S I N S O I L S40
Figure 4-4. Effect of soil compaction on potassiumconcentrations in corn (eighth leaf stage) and alfalfa.
2.0
2.5
3.0
3.5
4.0
4.5
5.0
1988 1989 1990 Cut 1 Cut 2 Cut 1 Cut 2
Po
tass
ium
co
nce
ntr
atio
n (
%)
None 14 tons
Source: Wolkowski, R.P. and L.G. Bundy. 1992. New Horizons in Soil Science.No. 3, Dept. of Soil Sci., UW-Madison.
Compaction level:
— 1991 — — 1992 —
—— Corn —— ——— Alfalfa ———
C-4 10/18/05 11:09 AM Page 40
“The nation that destroys itssoil destroys itself. The soil isindispensable. Heedlesswastage of the wealth whichnature has stored in the soilcannot long continuewithout the effects being feltby every member of society.”
Henry A. Wallace,U.S. Secretary of Agriculture, 1936
Soil erosion affects everyone, andwe all contribute to the problem.Erosion occurs at construction sites,along roadsides, in parks and forests,along stream banks, on hiking trailsand bicycle paths, and on agriculturalland. It scars the landscape, causessiltation in drainage ways, sewers,reservoirs and lakes, degrades waterquality, and reduces soil productivity.The Natural Resources ConservationService (NRCS) estimates in its 2001national resources inventory that thenation’s cropland is losing 1.8 billiontons of topsoil per year. Average erosionrates are estimated to be 2.7 tons peracre per year from water (sheet and rill)erosion and 2.1 tons per acre per yearfrom wind erosion. Soil erosion bywater is a natural process that occurswhenever rain falls on sloping land.Erosion produced the sediment thatgave rise to the fertile delta soils of thegreat rivers of the world long beforepeople began to till the soil. But humanactivities have often accelerated erosionbeyond acceptable limits.
Organic matter and clay erodemore easily than silt and sand becausethe particles are lighter or smaller andare more easily suspended in runoffwater. These particles hold moreavailable nutrients than sand or silt.Hence, the most fertile part of the soilis lost. In one study using conventionaltillage, the organic matter, totalnitrogen, and available phosphorus ineroded sediments were about 33%
higher than the soil from which theycame. Exchangeable potassium wasmore than six times higher. Withconservation tillage, phosphorus andpotassium tend to be concentrated onthe soil surface. As a result, theconcentration of these nutrients inrunoff and sediments is often higher aswell. Even so, the total loss ofphosphorus and potassium is less fromconservation tillage fields because thesesystems reduce sediment loss.
Most soil conservationists feel thaterosion cannot be stopped; it can onlybe controlled. Soil loss from sheet andrill erosion is estimated through the useof the Revised Universal Soil LossEquation 2 (RUSLE2) software model.The RUSLE2 model is the latest in aseries of predictive tools (includingUSLE and RUSLE) for estimating long-term, average annual soil loss caused byrainfall. Model inputs include slopelength and steepness, rainfall factors(intensity and duration), soilerodibility, cropping practices, andpresence of soil conservation practicesfor a given field. Results are comparedto tolerable soil loss (T) values. Valuesfor “T” are defined for a given soil asthe soil loss rate that is, in theory, equalto the rate of soil formation. Hence, atT, equilibrium between soil loss andgain is reached. T values typically rangefrom 3 to 5 tons per acre per year formost crop, pasture, and forest lands.On western rangeland, T values aretypically much lower (2 tons per acre
41
Soil and waterconservation
C H A P T E R
5
C-5 10/18/05 11:10 AM Page 41
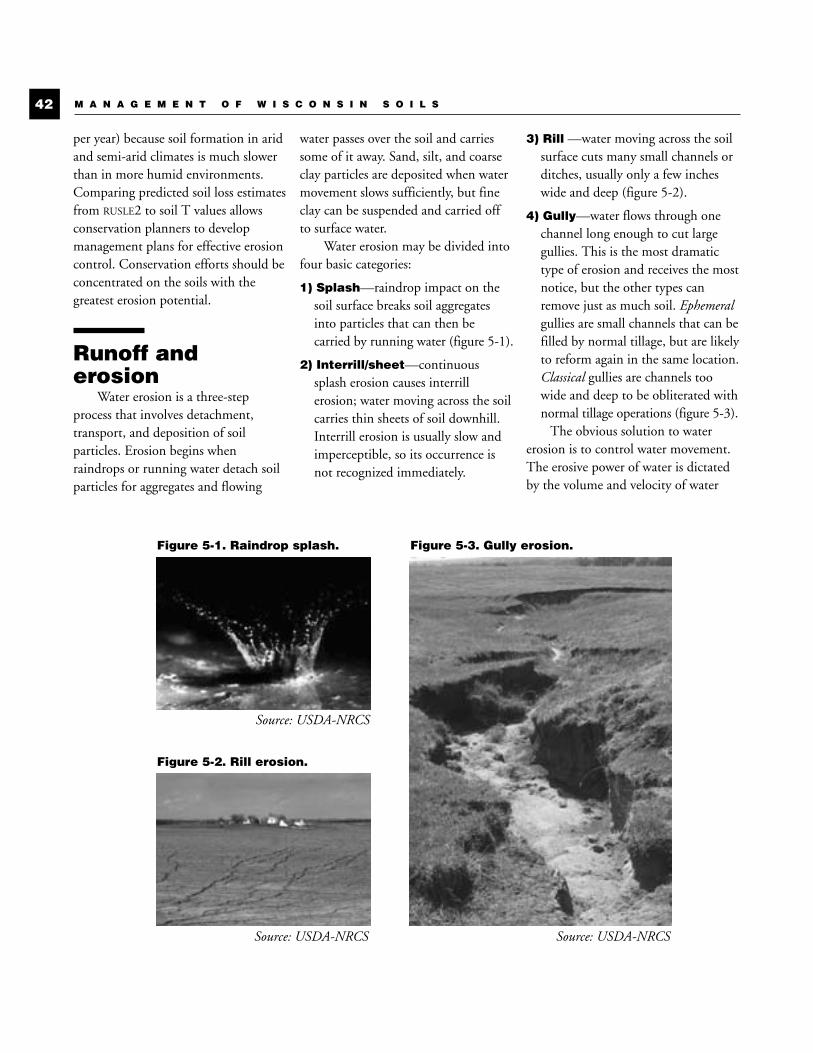
per year) because soil formation in aridand semi-arid climates is much slowerthan in more humid environments.Comparing predicted soil loss estimatesfrom RUSLE2 to soil T values allowsconservation planners to developmanagement plans for effective erosioncontrol. Conservation efforts should beconcentrated on the soils with thegreatest erosion potential.
Runoff anderosion
Water erosion is a three-stepprocess that involves detachment,transport, and deposition of soilparticles. Erosion begins whenraindrops or running water detach soilparticles for aggregates and flowing
water passes over the soil and carriessome of it away. Sand, silt, and coarseclay particles are deposited when watermovement slows sufficiently, but fineclay can be suspended and carried offto surface water.
Water erosion may be divided intofour basic categories:
1) Splash—raindrop impact on thesoil surface breaks soil aggregatesinto particles that can then becarried by running water (figure 5-1).
2) Interrill/sheet—continuoussplash erosion causes interrillerosion; water moving across the soilcarries thin sheets of soil downhill.Interrill erosion is usually slow andimperceptible, so its occurrence isnot recognized immediately.
3) Rill —water moving across the soilsurface cuts many small channels orditches, usually only a few incheswide and deep (figure 5-2).
4) Gully—water flows through onechannel long enough to cut largegullies. This is the most dramatictype of erosion and receives the mostnotice, but the other types canremove just as much soil. Ephemeralgullies are small channels that can befilled by normal tillage, but are likelyto reform again in the same location.Classical gullies are channels toowide and deep to be obliterated withnormal tillage operations (figure 5-3).
The obvious solution to watererosion is to control water movement.The erosive power of water is dictatedby the volume and velocity of water
M A N A G E M E N T O F W I S C O N S I N S O I L S42
Source: USDA-NRCS
Source: USDA-NRCS Source: USDA-NRCS
Figure 5-1. Raindrop splash.
Figure 5-2. Rill erosion.
Figure 5-3. Gully erosion.
C-5 10/18/05 11:10 AM Page 42
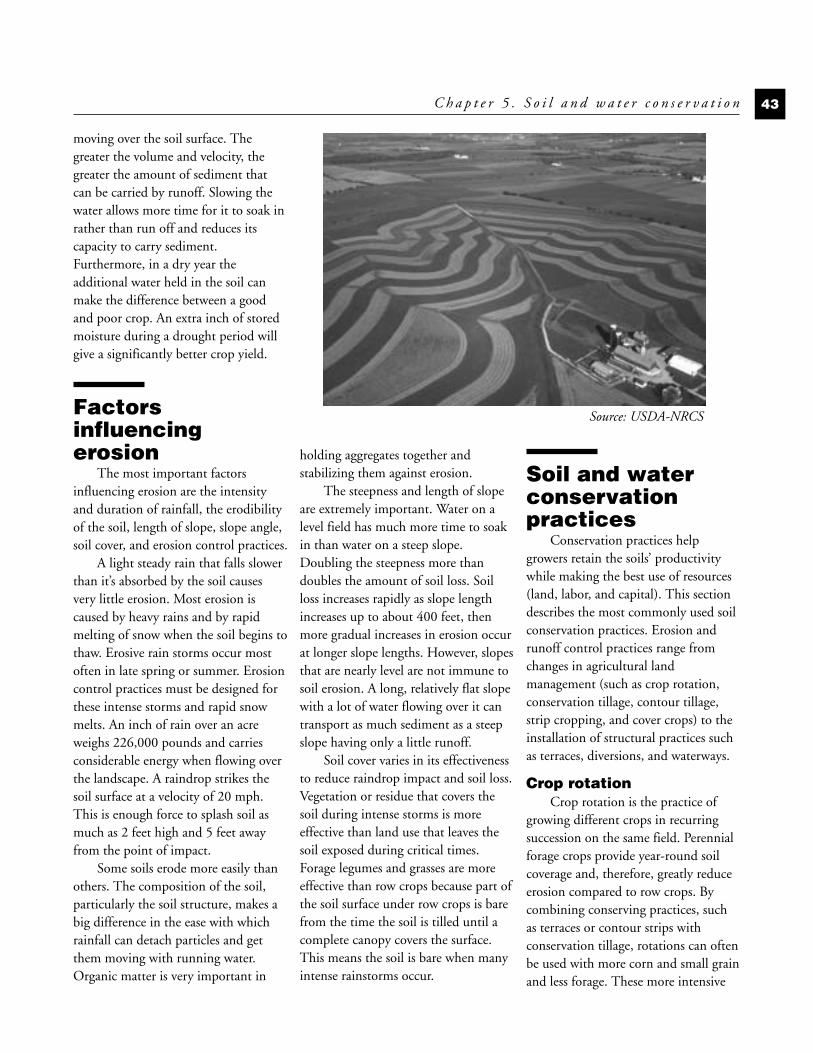
moving over the soil surface. Thegreater the volume and velocity, thegreater the amount of sediment thatcan be carried by runoff. Slowing thewater allows more time for it to soak inrather than run off and reduces itscapacity to carry sediment.Furthermore, in a dry year theadditional water held in the soil canmake the difference between a goodand poor crop. An extra inch of storedmoisture during a drought period willgive a significantly better crop yield.
Factorsinfluencingerosion
The most important factorsinfluencing erosion are the intensityand duration of rainfall, the erodibilityof the soil, length of slope, slope angle,soil cover, and erosion control practices.
A light steady rain that falls slowerthan it’s absorbed by the soil causesvery little erosion. Most erosion iscaused by heavy rains and by rapidmelting of snow when the soil begins tothaw. Erosive rain storms occur mostoften in late spring or summer. Erosioncontrol practices must be designed forthese intense storms and rapid snowmelts. An inch of rain over an acreweighs 226,000 pounds and carriesconsiderable energy when flowing overthe landscape. A raindrop strikes thesoil surface at a velocity of 20 mph.This is enough force to splash soil asmuch as 2 feet high and 5 feet awayfrom the point of impact.
Some soils erode more easily thanothers. The composition of the soil,particularly the soil structure, makes abig difference in the ease with whichrainfall can detach particles and getthem moving with running water.Organic matter is very important in
holding aggregates together andstabilizing them against erosion.
The steepness and length of slopeare extremely important. Water on alevel field has much more time to soakin than water on a steep slope.Doubling the steepness more thandoubles the amount of soil loss. Soilloss increases rapidly as slope lengthincreases up to about 400 feet, thenmore gradual increases in erosion occurat longer slope lengths. However, slopesthat are nearly level are not immune tosoil erosion. A long, relatively flat slopewith a lot of water flowing over it cantransport as much sediment as a steepslope having only a little runoff.
Soil cover varies in its effectivenessto reduce raindrop impact and soil loss.Vegetation or residue that covers thesoil during intense storms is moreeffective than land use that leaves thesoil exposed during critical times.Forage legumes and grasses are moreeffective than row crops because part ofthe soil surface under row crops is barefrom the time the soil is tilled until acomplete canopy covers the surface.This means the soil is bare when manyintense rainstorms occur.
Soil and waterconservationpractices
Conservation practices helpgrowers retain the soils’ productivitywhile making the best use of resources(land, labor, and capital). This sectiondescribes the most commonly used soilconservation practices. Erosion andrunoff control practices range fromchanges in agricultural landmanagement (such as crop rotation,conservation tillage, contour tillage,strip cropping, and cover crops) to theinstallation of structural practices suchas terraces, diversions, and waterways.
Crop rotationCrop rotation is the practice of
growing different crops in recurringsuccession on the same field. Perennialforage crops provide year-round soilcoverage and, therefore, greatly reduceerosion compared to row crops. Bycombining conserving practices, suchas terraces or contour strips withconservation tillage, rotations can oftenbe used with more corn and small grainand less forage. These more intensive
C h a p t e r 5 . S o i l a n d w a t e r c o n s e r v a t i o n 43
Source: USDA-NRCS
C-5 10/18/05 11:10 AM Page 43
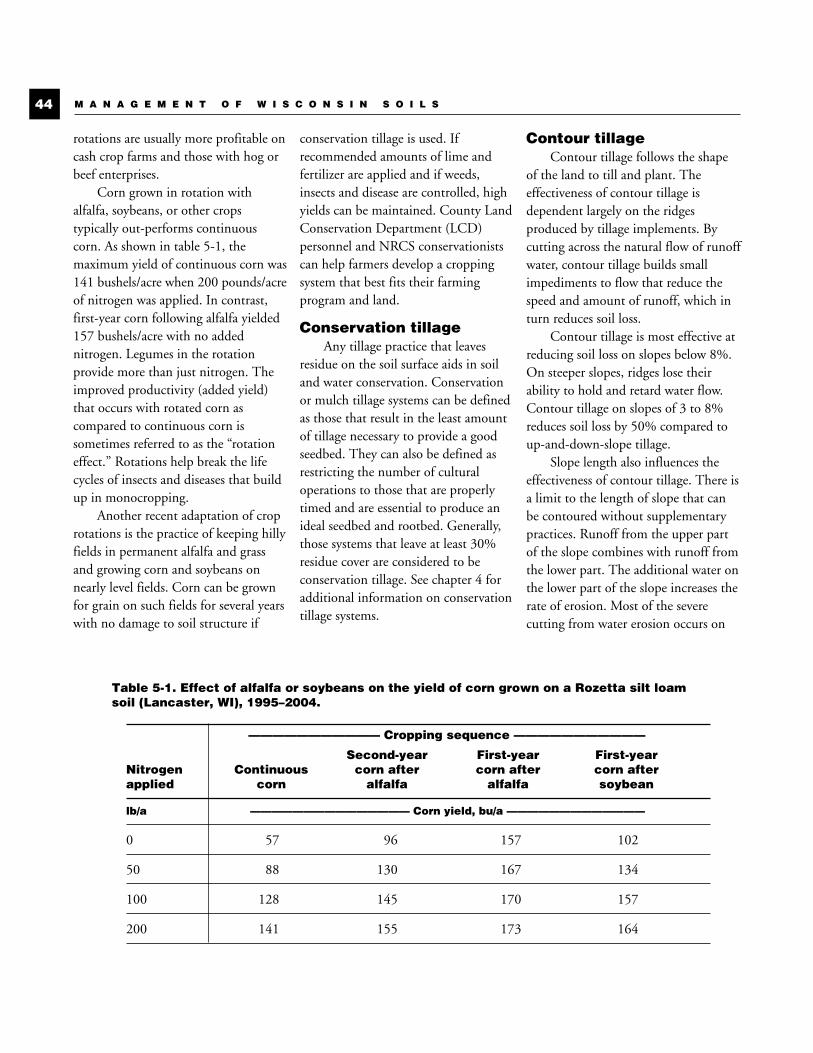
rotations are usually more profitable oncash crop farms and those with hog orbeef enterprises.
Corn grown in rotation withalfalfa, soybeans, or other cropstypically out-performs continuouscorn. As shown in table 5-1, themaximum yield of continuous corn was141 bushels/acre when 200 pounds/acreof nitrogen was applied. In contrast,first-year corn following alfalfa yielded157 bushels/acre with no addednitrogen. Legumes in the rotationprovide more than just nitrogen. Theimproved productivity (added yield)that occurs with rotated corn ascompared to continuous corn issometimes referred to as the “rotationeffect.” Rotations help break the lifecycles of insects and diseases that buildup in monocropping.
Another recent adaptation of croprotations is the practice of keeping hillyfields in permanent alfalfa and grassand growing corn and soybeans onnearly level fields. Corn can be grownfor grain on such fields for several yearswith no damage to soil structure if
conservation tillage is used. Ifrecommended amounts of lime andfertilizer are applied and if weeds,insects and disease are controlled, highyields can be maintained. County LandConservation Department (LCD)personnel and NRCS conservationistscan help farmers develop a croppingsystem that best fits their farmingprogram and land.
Conservation tillageAny tillage practice that leaves
residue on the soil surface aids in soiland water conservation. Conservationor mulch tillage systems can be definedas those that result in the least amountof tillage necessary to provide a goodseedbed. They can also be defined asrestricting the number of culturaloperations to those that are properlytimed and are essential to produce anideal seedbed and rootbed. Generally,those systems that leave at least 30%residue cover are considered to beconservation tillage. See chapter 4 foradditional information on conservationtillage systems.
Contour tillageContour tillage follows the shape
of the land to till and plant. Theeffectiveness of contour tillage isdependent largely on the ridgesproduced by tillage implements. Bycutting across the natural flow of runoffwater, contour tillage builds smallimpediments to flow that reduce thespeed and amount of runoff, which inturn reduces soil loss.
Contour tillage is most effective atreducing soil loss on slopes below 8%.On steeper slopes, ridges lose theirability to hold and retard water flow.Contour tillage on slopes of 3 to 8%reduces soil loss by 50% compared toup-and-down-slope tillage.
Slope length also influences theeffectiveness of contour tillage. There isa limit to the length of slope that canbe contoured without supplementarypractices. Runoff from the upper partof the slope combines with runoff fromthe lower part. The additional water onthe lower part of the slope increases therate of erosion. Most of the severecutting from water erosion occurs on
M A N A G E M E N T O F W I S C O N S I N S O I L S44
Table 5-1. Effect of alfalfa or soybeans on the yield of corn grown on a Rozetta silt loamsoil (Lancaster, WI), 1995–2004.
——————————— Cropping sequence ———————————
Second-year First-year First-yearNitrogen Continuous corn after corn after corn afterapplied corn alfalfa alfalfa soybean
lb/a ——————————————— Corn yield, bu/a —————————————
0 57 96 157 102
50 88 130 167 134
100 128 145 170 157
200 141 155 173 164
C-5 10/18/05 11:10 AM Page 44
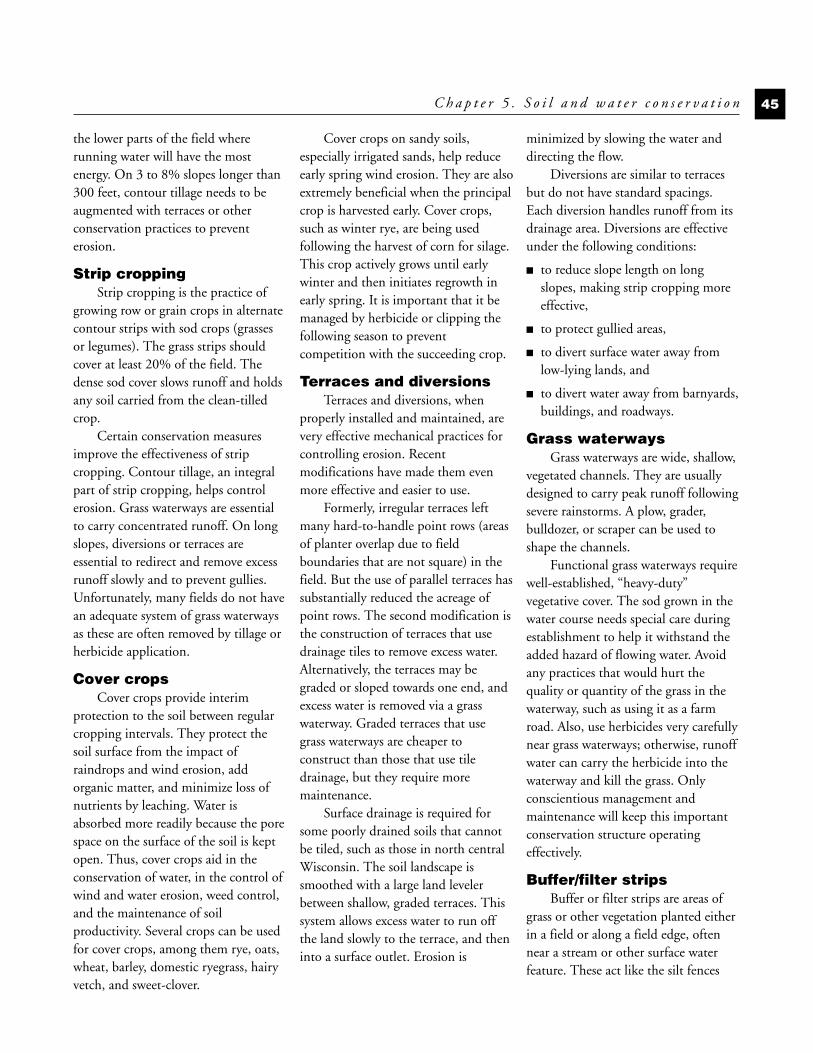
the lower parts of the field whererunning water will have the mostenergy. On 3 to 8% slopes longer than300 feet, contour tillage needs to beaugmented with terraces or otherconservation practices to preventerosion.
Strip croppingStrip cropping is the practice of
growing row or grain crops in alternatecontour strips with sod crops (grassesor legumes). The grass strips shouldcover at least 20% of the field. Thedense sod cover slows runoff and holdsany soil carried from the clean-tilledcrop.
Certain conservation measuresimprove the effectiveness of stripcropping. Contour tillage, an integralpart of strip cropping, helps controlerosion. Grass waterways are essentialto carry concentrated runoff. On longslopes, diversions or terraces areessential to redirect and remove excessrunoff slowly and to prevent gullies.Unfortunately, many fields do not havean adequate system of grass waterwaysas these are often removed by tillage orherbicide application.
Cover cropsCover crops provide interim
protection to the soil between regularcropping intervals. They protect thesoil surface from the impact ofraindrops and wind erosion, addorganic matter, and minimize loss ofnutrients by leaching. Water isabsorbed more readily because the porespace on the surface of the soil is keptopen. Thus, cover crops aid in theconservation of water, in the control ofwind and water erosion, weed control,and the maintenance of soilproductivity. Several crops can be usedfor cover crops, among them rye, oats,wheat, barley, domestic ryegrass, hairyvetch, and sweet-clover.
Cover crops on sandy soils,especially irrigated sands, help reduceearly spring wind erosion. They are alsoextremely beneficial when the principalcrop is harvested early. Cover crops,such as winter rye, are being usedfollowing the harvest of corn for silage.This crop actively grows until earlywinter and then initiates regrowth inearly spring. It is important that it bemanaged by herbicide or clipping thefollowing season to preventcompetition with the succeeding crop.
Terraces and diversionsTerraces and diversions, when
properly installed and maintained, arevery effective mechanical practices forcontrolling erosion. Recentmodifications have made them evenmore effective and easier to use.
Formerly, irregular terraces leftmany hard-to-handle point rows (areasof planter overlap due to fieldboundaries that are not square) in thefield. But the use of parallel terraces hassubstantially reduced the acreage ofpoint rows. The second modification isthe construction of terraces that usedrainage tiles to remove excess water.Alternatively, the terraces may begraded or sloped towards one end, andexcess water is removed via a grasswaterway. Graded terraces that usegrass waterways are cheaper toconstruct than those that use tiledrainage, but they require moremaintenance.
Surface drainage is required forsome poorly drained soils that cannotbe tiled, such as those in north centralWisconsin. The soil landscape issmoothed with a large land levelerbetween shallow, graded terraces. Thissystem allows excess water to run offthe land slowly to the terrace, and theninto a surface outlet. Erosion is
minimized by slowing the water anddirecting the flow.
Diversions are similar to terracesbut do not have standard spacings.Each diversion handles runoff from itsdrainage area. Diversions are effectiveunder the following conditions:
■ to reduce slope length on longslopes, making strip cropping moreeffective,
■ to protect gullied areas,
■ to divert surface water away fromlow-lying lands, and
■ to divert water away from barnyards,buildings, and roadways.
Grass waterwaysGrass waterways are wide, shallow,
vegetated channels. They are usuallydesigned to carry peak runoff followingsevere rainstorms. A plow, grader,bulldozer, or scraper can be used toshape the channels.
Functional grass waterways requirewell-established, “heavy-duty”vegetative cover. The sod grown in thewater course needs special care duringestablishment to help it withstand theadded hazard of flowing water. Avoidany practices that would hurt thequality or quantity of the grass in thewaterway, such as using it as a farmroad. Also, use herbicides very carefullynear grass waterways; otherwise, runoffwater can carry the herbicide into thewaterway and kill the grass. Onlyconscientious management andmaintenance will keep this importantconservation structure operatingeffectively.
Buffer/filter stripsBuffer or filter strips are areas of
grass or other vegetation planted eitherin a field or along a field edge, oftennear a stream or other surface waterfeature. These act like the silt fences
C h a p t e r 5 . S o i l a n d w a t e r c o n s e r v a t i o n 45
C-5 10/18/05 11:10 AM Page 45
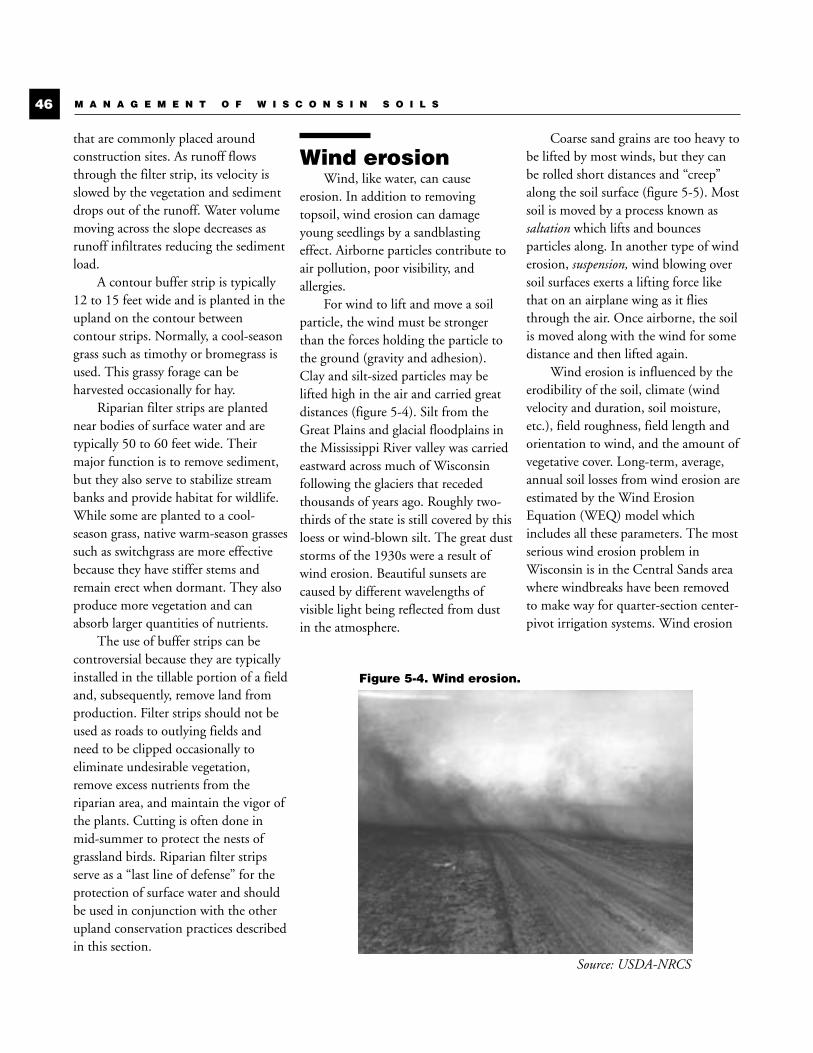
that are commonly placed aroundconstruction sites. As runoff flowsthrough the filter strip, its velocity isslowed by the vegetation and sedimentdrops out of the runoff. Water volumemoving across the slope decreases asrunoff infiltrates reducing the sedimentload.
A contour buffer strip is typically12 to 15 feet wide and is planted in theupland on the contour betweencontour strips. Normally, a cool-seasongrass such as timothy or bromegrass isused. This grassy forage can beharvested occasionally for hay.
Riparian filter strips are plantednear bodies of surface water and aretypically 50 to 60 feet wide. Theirmajor function is to remove sediment,but they also serve to stabilize streambanks and provide habitat for wildlife.While some are planted to a cool-season grass, native warm-season grassessuch as switchgrass are more effectivebecause they have stiffer stems andremain erect when dormant. They alsoproduce more vegetation and canabsorb larger quantities of nutrients.
The use of buffer strips can becontroversial because they are typicallyinstalled in the tillable portion of a fieldand, subsequently, remove land fromproduction. Filter strips should not beused as roads to outlying fields andneed to be clipped occasionally toeliminate undesirable vegetation,remove excess nutrients from theriparian area, and maintain the vigor ofthe plants. Cutting is often done inmid-summer to protect the nests ofgrassland birds. Riparian filter stripsserve as a “last line of defense” for theprotection of surface water and shouldbe used in conjunction with the otherupland conservation practices describedin this section.
Wind erosionWind, like water, can cause
erosion. In addition to removingtopsoil, wind erosion can damageyoung seedlings by a sandblastingeffect. Airborne particles contribute toair pollution, poor visibility, andallergies.
For wind to lift and move a soilparticle, the wind must be strongerthan the forces holding the particle tothe ground (gravity and adhesion).Clay and silt-sized particles may belifted high in the air and carried greatdistances (figure 5-4). Silt from theGreat Plains and glacial floodplains inthe Mississippi River valley was carriedeastward across much of Wisconsinfollowing the glaciers that recededthousands of years ago. Roughly two-thirds of the state is still covered by thisloess or wind-blown silt. The great duststorms of the 1930s were a result ofwind erosion. Beautiful sunsets arecaused by different wavelengths ofvisible light being reflected from dustin the atmosphere.
Coarse sand grains are too heavy tobe lifted by most winds, but they canbe rolled short distances and “creep”along the soil surface (figure 5-5). Mostsoil is moved by a process known assaltation which lifts and bouncesparticles along. In another type of winderosion, suspension, wind blowing oversoil surfaces exerts a lifting force likethat on an airplane wing as it fliesthrough the air. Once airborne, the soilis moved along with the wind for somedistance and then lifted again.
Wind erosion is influenced by theerodibility of the soil, climate (windvelocity and duration, soil moisture,etc.), field roughness, field length andorientation to wind, and the amount ofvegetative cover. Long-term, average,annual soil losses from wind erosion areestimated by the Wind ErosionEquation (WEQ) model whichincludes all these parameters. The mostserious wind erosion problem inWisconsin is in the Central Sands areawhere windbreaks have been removedto make way for quarter-section center-pivot irrigation systems. Wind erosion
M A N A G E M E N T O F W I S C O N S I N S O I L S46
Source: USDA-NRCS
Figure 5-4. Wind erosion.
C-5 10/18/05 11:10 AM Page 46
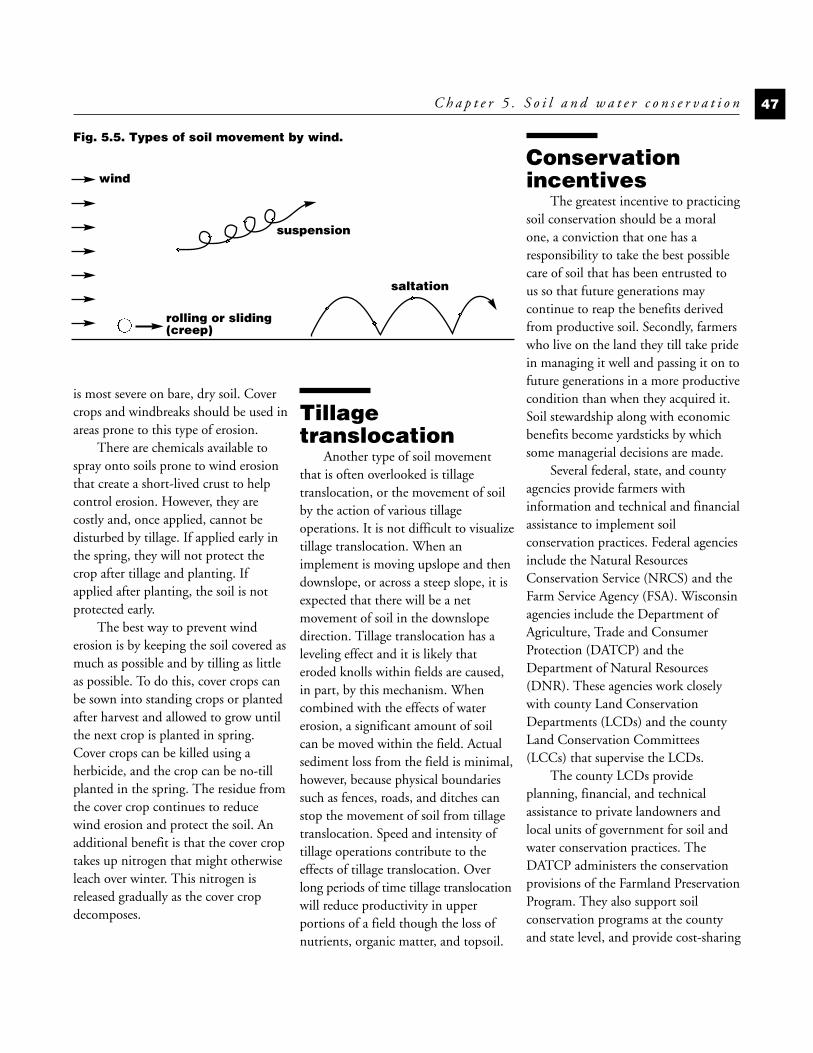
is most severe on bare, dry soil. Covercrops and windbreaks should be used inareas prone to this type of erosion.
There are chemicals available tospray onto soils prone to wind erosionthat create a short-lived crust to helpcontrol erosion. However, they arecostly and, once applied, cannot bedisturbed by tillage. If applied early inthe spring, they will not protect thecrop after tillage and planting. Ifapplied after planting, the soil is notprotected early.
The best way to prevent winderosion is by keeping the soil covered asmuch as possible and by tilling as littleas possible. To do this, cover crops canbe sown into standing crops or plantedafter harvest and allowed to grow untilthe next crop is planted in spring.Cover crops can be killed using aherbicide, and the crop can be no-tillplanted in the spring. The residue fromthe cover crop continues to reducewind erosion and protect the soil. Anadditional benefit is that the cover croptakes up nitrogen that might otherwiseleach over winter. This nitrogen isreleased gradually as the cover cropdecomposes.
Tillagetranslocation
Another type of soil movementthat is often overlooked is tillagetranslocation, or the movement of soilby the action of various tillageoperations. It is not difficult to visualizetillage translocation. When animplement is moving upslope and thendownslope, or across a steep slope, it isexpected that there will be a netmovement of soil in the downslopedirection. Tillage translocation has aleveling effect and it is likely thateroded knolls within fields are caused,in part, by this mechanism. Whencombined with the effects of watererosion, a significant amount of soilcan be moved within the field. Actualsediment loss from the field is minimal,however, because physical boundariessuch as fences, roads, and ditches canstop the movement of soil from tillagetranslocation. Speed and intensity oftillage operations contribute to theeffects of tillage translocation. Overlong periods of time tillage translocationwill reduce productivity in upperportions of a field though the loss ofnutrients, organic matter, and topsoil.
Conservationincentives
The greatest incentive to practicingsoil conservation should be a moralone, a conviction that one has aresponsibility to take the best possiblecare of soil that has been entrusted tous so that future generations maycontinue to reap the benefits derivedfrom productive soil. Secondly, farmerswho live on the land they till take pridein managing it well and passing it on tofuture generations in a more productivecondition than when they acquired it.Soil stewardship along with economicbenefits become yardsticks by whichsome managerial decisions are made.
Several federal, state, and countyagencies provide farmers withinformation and technical and financialassistance to implement soilconservation practices. Federal agenciesinclude the Natural ResourcesConservation Service (NRCS) and theFarm Service Agency (FSA). Wisconsinagencies include the Department ofAgriculture, Trade and ConsumerProtection (DATCP) and theDepartment of Natural Resources(DNR). These agencies work closelywith county Land ConservationDepartments (LCDs) and the countyLand Conservation Committees(LCCs) that supervise the LCDs.
The county LCDs provideplanning, financial, and technicalassistance to private landowners andlocal units of government for soil andwater conservation practices. TheDATCP administers the conservationprovisions of the Farmland PreservationProgram. They also support soilconservation programs at the countyand state level, and provide cost-sharing
C h a p t e r 5 . S o i l a n d w a t e r c o n s e r v a t i o n 47
Fig. 5.5. Types of soil movement by wind.
wind
suspension
saltation
rolling or sliding(creep)
C-5 10/18/05 11:10 AM Page 47
to participants. The DNR administersWisconsin non-point source waterpollution abatement programs, whichare implemented locally by LCDs inselected watersheds. University ofWisconsin-Extension and otherinstitutions within the universitysystem conduct educational programsand do research in support of soil andwater conservation programs.
The NRCS assigns full-timeprofessional technicians to Wisconsincounties to assist LCDs in developingand carrying out conservationprograms. These specialists assistlandowners in developing resourceconservation plans. They providespecifications, standards, and guidelinesfor selection, design, layout,installation, and maintenance ofmanagement practices and engineeringmeasures to control runoff, soil erosion,and sedimentation. They also help planand design animal waste managementsystems. The FSA administers federallyfunded programs which provide costsharing and incentive payments tofarmers to encourage the use ofpractices that will reduce soil erosionand water pollution.
Questions1. Apart from the loss of precious
topsoil, why is soil erosionundesirable?
2. How much soil loss is permissible?
3. Describe four different kinds ofwater erosion. Which causes thegreatest soil loss in your area?
4. Name three factors that affect soilerosion. Explain the importance ofeach factor.
5. Explain how a surface mulch ofcrop residues reduces soil erosion.
6. If all rainfall could be held on thesoil long enough to eliminaterunoff, soil erosion by water wouldbe eliminated as well. Why is thisnot practical?
7. What soil conservation measurescan be used to counteract theeffects of long, steep slopes on soilerosion?
8. “Water conservation equals soilconservation.” Explain.
9. Under what conditions mightwind erosion be a problem? Howcan it be reduced?
10.List each federal, state, and countyagency involved in conservationprograms. What role does eachplay?
M A N A G E M E N T O F W I S C O N S I N S O I L S48
C-5 10/18/05 11:10 AM Page 48
“So without question, themost important singlechemical characteristic of asoil as regards its suitabilityfor plant growth is itsreaction or pH status.”
Emil Truog,Mineral Nutrition of Plants, 1951
The late Professor Emil Truog onceremarked that if you could have butone soil test run on a field, that testshould be pH. Soil acidity, which isdetermined by measuring soil pH,reduces productivity of all crops andeliminates the possibility of growingacid-sensitive crops. Aglime added toacid soils raises the pH by neutralizingsoil acidity. On the other hand,lowering the pH of alkaline soils isseldom required and usually is notpractical on a large scale.
Soil pHSoil pH, a measure of acidity or
alkalinity, affects many chemical andbiological reactions taking place in thesoil. Before discussing these reactions, itis necessary to understand what the pHmeasurement means and the chemicalnature of acids and bases.
Stated simply, an acid is asubstance with an excess of hydrogenions (H+), and a base is a substancewith an excess of hydroxyl ions (OH–).A common example of an acid issulfuric acid (the solution in carbatteries). Sodium hydroxide (lye) is anexample of a base. When sulfuric acidis mixed with water, the followingreaction occurs (in chemical equationsthe symbol HOH is often used forwater instead of H2O):
Sulfuric acid ionizes (dissolves)completely; that is, it goes to the rightin the reaction above. It is a strong acidbecause it contains more hydrogen ions(H+) than hydroxyl ions (OH–).
When lye (sodium hydroxide) ismixed with water, it ionizes, formingexcess hydroxyl ions. This results in astrongly alkaline or basic solution:
Pure water contains an equalamount of hydrogen and hydroxyl ionsand, therefore, is neutral.
HOH <——> H+ + OH–
The concentration of hydrogenions in pure water has been found to be0.0000001 moles per liter of water(1 mole = 1.008 grams of H+). The pHscale is a convenient way to expresssuch small numbers. The pH is definedas the logarithm of the reciprocal of thehydrogen ion concentration (pH = log1/H+). For example, the concentrationof 0.0000001 moles of hydrogen perliter of water is converted into a pH of7 as follows:
pH = log 1/0.0000001= log 10,000,000
(reciprocal number)= 7
49
Soil acidity and liming
NaOH + HOH <——> Na+ + H+ + 2OH–
H2SO4 + HOH <——> 3H+ + SO4= + OH–
water
hydrogen ion
hydroxyl ion
sulfate ion
sulfuric acid
water
hydrogen ion
hydroxyl ion
sodium ion
sodium hydroxide
C H A P T E R
6
C-6 10/18/05 11:11 AM Page 49

The concentration of hydrogenand hydroxyl ions at pH levelscommonly observed in Wisconsin soilsis presented in table 6-1. Note that asacidity increases, the pH numberdecreases. Another important point isthat for each one unit change in the pHvalue, there is a 10-fold change in theconcentration of hydrogen ions. Forinstance, when the pH decreases from5.0 to 4.0, the concentration ofhydrogen ions increases 10 times from0.00001 to 0.0001 moles/liter.
Importance of soil pHSoil pH is important because it
affects both chemical and biologicalreactions, including the following:
■ availability of most of the essentialnutrients,
■ activity of microorganisms,
■ ability of soil to hold positivelycharged nutrients (cations),
■ solubility of non-essential elements,including heavy metals, and
■ performance of some herbicides.The soil pH directly affects the
availability of some nutrients, but itoften indirectly affects nutrientavailability through its influence on
microbial activity. The relationshipbetween soil pH and nutrientavailability is illustrated in figure 6-1.In this graph, the wider the bar, thegreater the relative availability of thenutrient.
The effect of pH on nitrogenavailability is due mainly to itsinfluence on microbial activity.Nitrogen in soil is stored in humus ororganic matter and becomes available
as microorganisms decompose theorganic matter. The optimum pH formost soil microorganisms is pH 6.0 to7.5. Also, Rhizobium bacteria are mostactive in converting atmosphericnitrogen into plant-usable nitrogen inthis pH range. The Rhizobium bacteriaassociated with alfalfa are most active atpH 6.8 and higher. Nitrogen fixationby Rhizobia associated with otherlegumes, such as red clover and birds-foot trefoil, is less dependent on pH.
Phosphorus is most availablebetween pH 6.5 and 7.5. Below pH6.0, phosphorus reacts with iron andaluminum oxides to form insolublephosphates. Above pH 7.0, phosphorusreacts with calcium compounds toform insoluble calcium phosphates.The influence of pH on the availabilityof potassium, calcium, and magnesiumis due principally to competitionbetween these cations (positivelycharged ions) and hydrogen ions forexchange sites. (For more details aboutchemical reactions, see chapter 8.) In
M A N A G E M E N T O F W I S C O N S I N S O I L S50
H+ OH–
concentration concentration pH Interpretation
—————— moles/liter ——————
0.00000001 0.000001 8 strongly alkaline
0.0000001 0.0000001 7 neutral
0.000001 0.00000001 6 slightly acid
0.00001 0.000000001 5 strongly acid
0.0001 0.0000000001 4 extremely acid
4.0 5.0 6.0 7.0 8.0 9.0 10.0
Nitrogen
Phosphorus
Potassium
Sulfur
Calcium
Magnesium
Iron
Manganese
Boron
Copper, Nickel, Zinc
Molybdenum
Soil pH
Figure 6-1. Relationship between soil pH and nutrient availability.The width of the bar represents relative nutrient availability.
Table 6-1. Hydrogen and hydroxyl concentrations andinterpretations at common pH levels.
C-6 10/18/05 11:11 AM Page 50
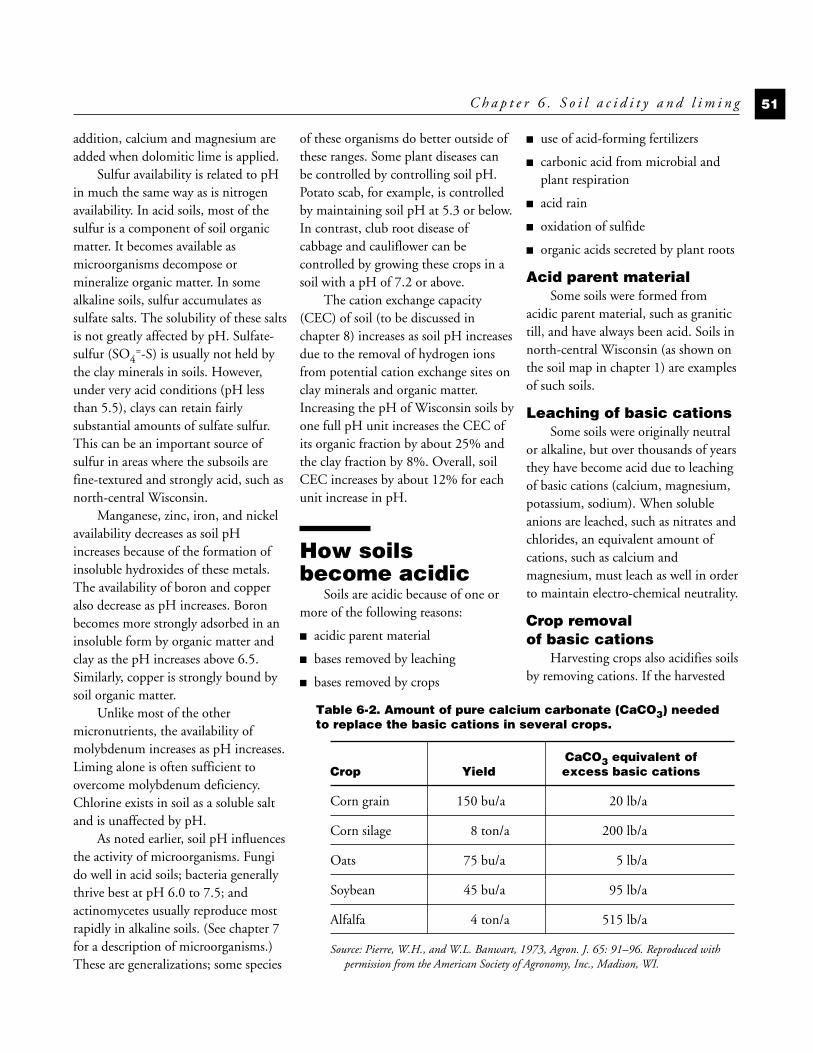
addition, calcium and magnesium areadded when dolomitic lime is applied.
Sulfur availability is related to pHin much the same way as is nitrogenavailability. In acid soils, most of thesulfur is a component of soil organicmatter. It becomes available asmicroorganisms decompose ormineralize organic matter. In somealkaline soils, sulfur accumulates assulfate salts. The solubility of these saltsis not greatly affected by pH. Sulfate-sulfur (SO4
=-S) is usually not held bythe clay minerals in soils. However,under very acid conditions (pH lessthan 5.5), clays can retain fairlysubstantial amounts of sulfate sulfur.This can be an important source ofsulfur in areas where the subsoils arefine-textured and strongly acid, such asnorth-central Wisconsin.
Manganese, zinc, iron, and nickelavailability decreases as soil pHincreases because of the formation ofinsoluble hydroxides of these metals.The availability of boron and copperalso decrease as pH increases. Boronbecomes more strongly adsorbed in aninsoluble form by organic matter andclay as the pH increases above 6.5.Similarly, copper is strongly bound bysoil organic matter.
Unlike most of the othermicronutrients, the availability ofmolybdenum increases as pH increases.Liming alone is often sufficient toovercome molybdenum deficiency.Chlorine exists in soil as a soluble saltand is unaffected by pH.
As noted earlier, soil pH influencesthe activity of microorganisms. Fungido well in acid soils; bacteria generallythrive best at pH 6.0 to 7.5; andactinomycetes usually reproduce mostrapidly in alkaline soils. (See chapter 7for a description of microorganisms.)These are generalizations; some species
of these organisms do better outside ofthese ranges. Some plant diseases canbe controlled by controlling soil pH.Potato scab, for example, is controlledby maintaining soil pH at 5.3 or below.In contrast, club root disease ofcabbage and cauliflower can becontrolled by growing these crops in asoil with a pH of 7.2 or above.
The cation exchange capacity(CEC) of soil (to be discussed inchapter 8) increases as soil pH increasesdue to the removal of hydrogen ionsfrom potential cation exchange sites onclay minerals and organic matter.Increasing the pH of Wisconsin soils byone full pH unit increases the CEC ofits organic fraction by about 25% andthe clay fraction by 8%. Overall, soilCEC increases by about 12% for eachunit increase in pH.
How soils become acidic
Soils are acidic because of one ormore of the following reasons:
■ acidic parent material
■ bases removed by leaching
■ bases removed by crops
■ use of acid-forming fertilizers
■ carbonic acid from microbial andplant respiration
■ acid rain
■ oxidation of sulfide
■ organic acids secreted by plant roots
Acid parent materialSome soils were formed from
acidic parent material, such as granitictill, and have always been acid. Soils innorth-central Wisconsin (as shown onthe soil map in chapter 1) are examplesof such soils.
Leaching of basic cationsSome soils were originally neutral
or alkaline, but over thousands of yearsthey have become acid due to leachingof basic cations (calcium, magnesium,potassium, sodium). When solubleanions are leached, such as nitrates andchlorides, an equivalent amount ofcations, such as calcium andmagnesium, must leach as well in orderto maintain electro-chemical neutrality.
Crop removal of basic cations
Harvesting crops also acidifies soilsby removing cations. If the harvested
C h a p t e r 6 . S o i l a c i d i t y a n d l i m i n g 51
Table 6-2. Amount of pure calcium carbonate (CaCO3) neededto replace the basic cations in several crops.
CaCO3 equivalent ofCrop Yield excess basic cations
Corn grain 150 bu/a 20 lb/a
Corn silage 8 ton/a 200 lb/a
Oats 75 bu/a 5 lb/a
Soybean 45 bu/a 95 lb/a
Alfalfa 4 ton/a 515 lb/a
Source: Pierre, W.H., and W.L. Banwart, 1973, Agron. J. 65: 91–96. Reproduced withpermission from the American Society of Agronomy, Inc., Madison, WI.
C-6 10/18/05 11:11 AM Page 51
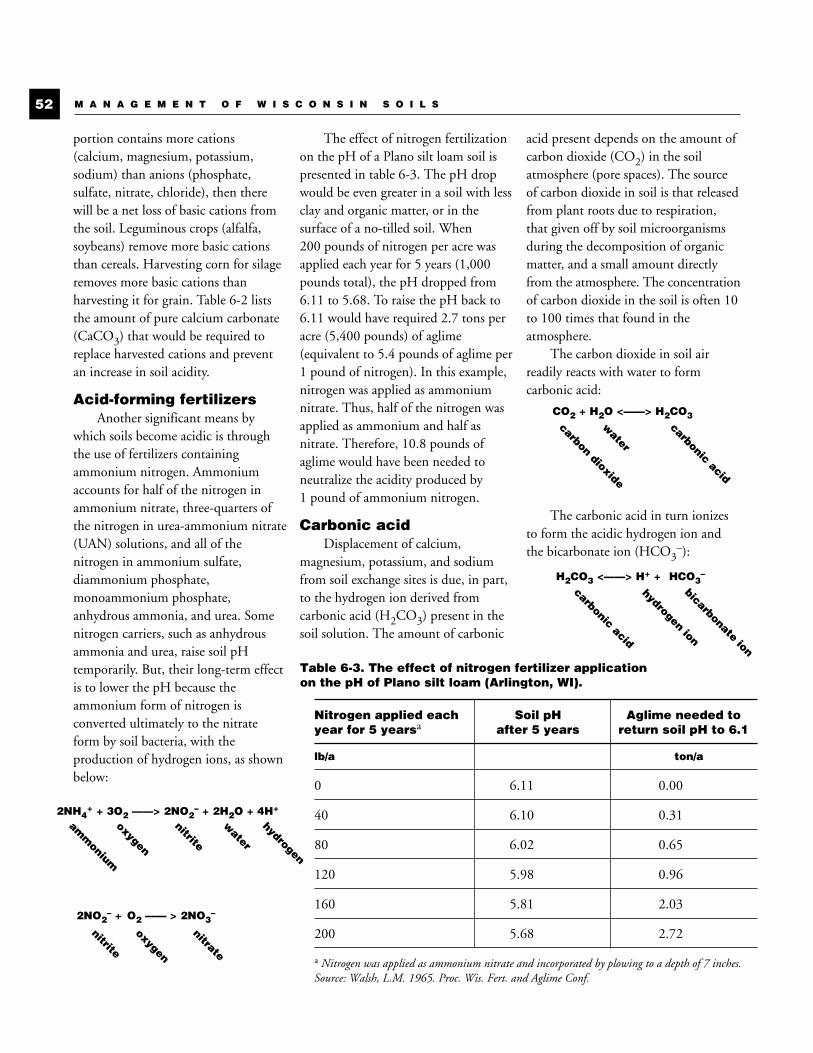
portion contains more cations(calcium, magnesium, potassium,sodium) than anions (phosphate,sulfate, nitrate, chloride), then therewill be a net loss of basic cations fromthe soil. Leguminous crops (alfalfa,soybeans) remove more basic cationsthan cereals. Harvesting corn for silageremoves more basic cations thanharvesting it for grain. Table 6-2 liststhe amount of pure calcium carbonate(CaCO3) that would be required toreplace harvested cations and preventan increase in soil acidity.
Acid-forming fertilizersAnother significant means by
which soils become acidic is throughthe use of fertilizers containingammonium nitrogen. Ammoniumaccounts for half of the nitrogen inammonium nitrate, three-quarters ofthe nitrogen in urea-ammonium nitrate(UAN) solutions, and all of thenitrogen in ammonium sulfate,diammonium phosphate,monoammonium phosphate,anhydrous ammonia, and urea. Somenitrogen carriers, such as anhydrousammonia and urea, raise soil pHtemporarily. But, their long-term effectis to lower the pH because theammonium form of nitrogen isconverted ultimately to the nitrateform by soil bacteria, with theproduction of hydrogen ions, as shownbelow:
The effect of nitrogen fertilizationon the pH of a Plano silt loam soil ispresented in table 6-3. The pH dropwould be even greater in a soil with lessclay and organic matter, or in thesurface of a no-tilled soil. When200 pounds of nitrogen per acre wasapplied each year for 5 years (1,000pounds total), the pH dropped from6.11 to 5.68. To raise the pH back to6.11 would have required 2.7 tons peracre (5,400 pounds) of aglime(equivalent to 5.4 pounds of aglime per1 pound of nitrogen). In this example,nitrogen was applied as ammoniumnitrate. Thus, half of the nitrogen wasapplied as ammonium and half asnitrate. Therefore, 10.8 pounds ofaglime would have been needed toneutralize the acidity produced by1 pound of ammonium nitrogen.
Carbonic acidDisplacement of calcium,
magnesium, potassium, and sodiumfrom soil exchange sites is due, in part,to the hydrogen ion derived fromcarbonic acid (H2CO3) present in thesoil solution. The amount of carbonic
acid present depends on the amount ofcarbon dioxide (CO2) in the soilatmosphere (pore spaces). The sourceof carbon dioxide in soil is that releasedfrom plant roots due to respiration,that given off by soil microorganismsduring the decomposition of organicmatter, and a small amount directlyfrom the atmosphere. The concentrationof carbon dioxide in the soil is often 10to 100 times that found in theatmosphere.
The carbon dioxide in soil airreadily reacts with water to formcarbonic acid:
The carbonic acid in turn ionizesto form the acidic hydrogen ion andthe bicarbonate ion (HCO3
–):
M A N A G E M E N T O F W I S C O N S I N S O I L S52
Table 6-3. The effect of nitrogen fertilizer application on the pH of Plano silt loam (Arlington, WI).
Nitrogen applied each Soil pH Aglime needed toyear for 5 yearsa after 5 years return soil pH to 6.1
lb/a ton/a
0 6.11 0.00
40 6.10 0.31
80 6.02 0.65
120 5.98 0.96
160 5.81 2.03
200 5.68 2.72
a Nitrogen was applied as ammonium nitrate and incorporated by plowing to a depth of 7 inches.Source: Walsh, L.M. 1965. Proc. Wis. Fert. and Aglime Conf.
2NH4+ + 3O2 ——> 2NO2
– + 2H2O + 4H+
oxygen
nitrite
amm
onium
hydrogen
water
2NO2– + O2 —— > 2NO3
–
nitrite
oxygen
nitrate
CO2 + H2O <——> H2CO3
H2CO3 <——> H+ + HCO3–
carbonic acid
carbon dioxide
water
carbonic acid
hydrogen ion
bicarbonate ion
C-6 10/18/05 11:11 AM Page 52
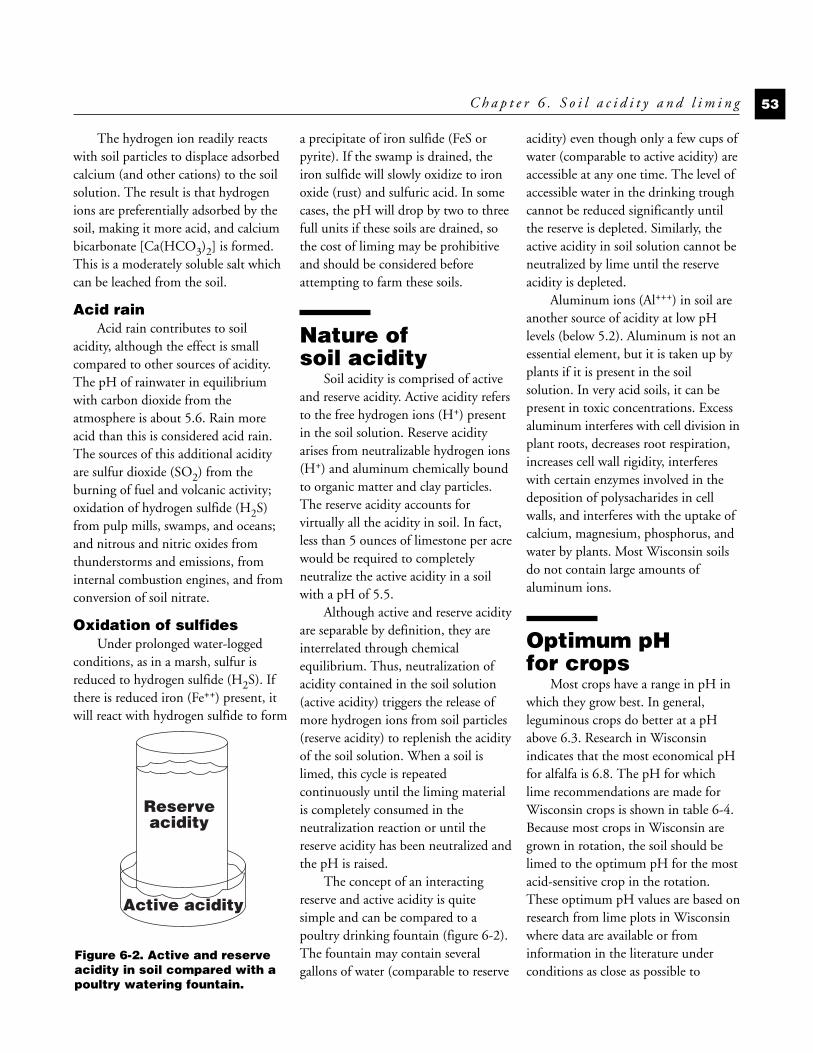
The hydrogen ion readily reactswith soil particles to displace adsorbedcalcium (and other cations) to the soilsolution. The result is that hydrogenions are preferentially adsorbed by thesoil, making it more acid, and calciumbicarbonate [Ca(HCO3)2] is formed.This is a moderately soluble salt whichcan be leached from the soil.
Acid rainAcid rain contributes to soil
acidity, although the effect is smallcompared to other sources of acidity.The pH of rainwater in equilibriumwith carbon dioxide from theatmosphere is about 5.6. Rain moreacid than this is considered acid rain.The sources of this additional acidityare sulfur dioxide (SO2) from theburning of fuel and volcanic activity;oxidation of hydrogen sulfide (H2S)from pulp mills, swamps, and oceans;and nitrous and nitric oxides fromthunderstorms and emissions, frominternal combustion engines, and fromconversion of soil nitrate.
Oxidation of sulfidesUnder prolonged water-logged
conditions, as in a marsh, sulfur isreduced to hydrogen sulfide (H2S). Ifthere is reduced iron (Fe++) present, itwill react with hydrogen sulfide to form
a precipitate of iron sulfide (FeS orpyrite). If the swamp is drained, theiron sulfide will slowly oxidize to ironoxide (rust) and sulfuric acid. In somecases, the pH will drop by two to threefull units if these soils are drained, sothe cost of liming may be prohibitiveand should be considered beforeattempting to farm these soils.
Nature of soil acidity
Soil acidity is comprised of activeand reserve acidity. Active acidity refersto the free hydrogen ions (H+) presentin the soil solution. Reserve acidityarises from neutralizable hydrogen ions(H+) and aluminum chemically boundto organic matter and clay particles.The reserve acidity accounts forvirtually all the acidity in soil. In fact,less than 5 ounces of limestone per acrewould be required to completelyneutralize the active acidity in a soilwith a pH of 5.5.
Although active and reserve acidityare separable by definition, they areinterrelated through chemicalequilibrium. Thus, neutralization ofacidity contained in the soil solution(active acidity) triggers the release ofmore hydrogen ions from soil particles(reserve acidity) to replenish the acidityof the soil solution. When a soil islimed, this cycle is repeatedcontinuously until the liming materialis completely consumed in theneutralization reaction or until thereserve acidity has been neutralized andthe pH is raised.
The concept of an interactingreserve and active acidity is quitesimple and can be compared to apoultry drinking fountain (figure 6-2).The fountain may contain severalgallons of water (comparable to reserve
acidity) even though only a few cups ofwater (comparable to active acidity) areaccessible at any one time. The level ofaccessible water in the drinking troughcannot be reduced significantly untilthe reserve is depleted. Similarly, theactive acidity in soil solution cannot beneutralized by lime until the reserveacidity is depleted.
Aluminum ions (Al+++) in soil areanother source of acidity at low pHlevels (below 5.2). Aluminum is not anessential element, but it is taken up byplants if it is present in the soilsolution. In very acid soils, it can bepresent in toxic concentrations. Excessaluminum interferes with cell division inplant roots, decreases root respiration,increases cell wall rigidity, interfereswith certain enzymes involved in thedeposition of polysacharides in cellwalls, and interferes with the uptake ofcalcium, magnesium, phosphorus, andwater by plants. Most Wisconsin soilsdo not contain large amounts ofaluminum ions.
Optimum pH for crops
Most crops have a range in pH inwhich they grow best. In general,leguminous crops do better at a pHabove 6.3. Research in Wisconsinindicates that the most economical pHfor alfalfa is 6.8. The pH for whichlime recommendations are made forWisconsin crops is shown in table 6-4.Because most crops in Wisconsin aregrown in rotation, the soil should belimed to the optimum pH for the mostacid-sensitive crop in the rotation.These optimum pH values are based onresearch from lime plots in Wisconsinwhere data are available or frominformation in the literature underconditions as close as possible to
C h a p t e r 6 . S o i l a c i d i t y a n d l i m i n g 53
Active acidity
Reserve acidity
Figure 6-2. Active and reserveacidity in soil compared with apoultry watering fountain.
C-6 10/18/05 11:11 AM Page 53
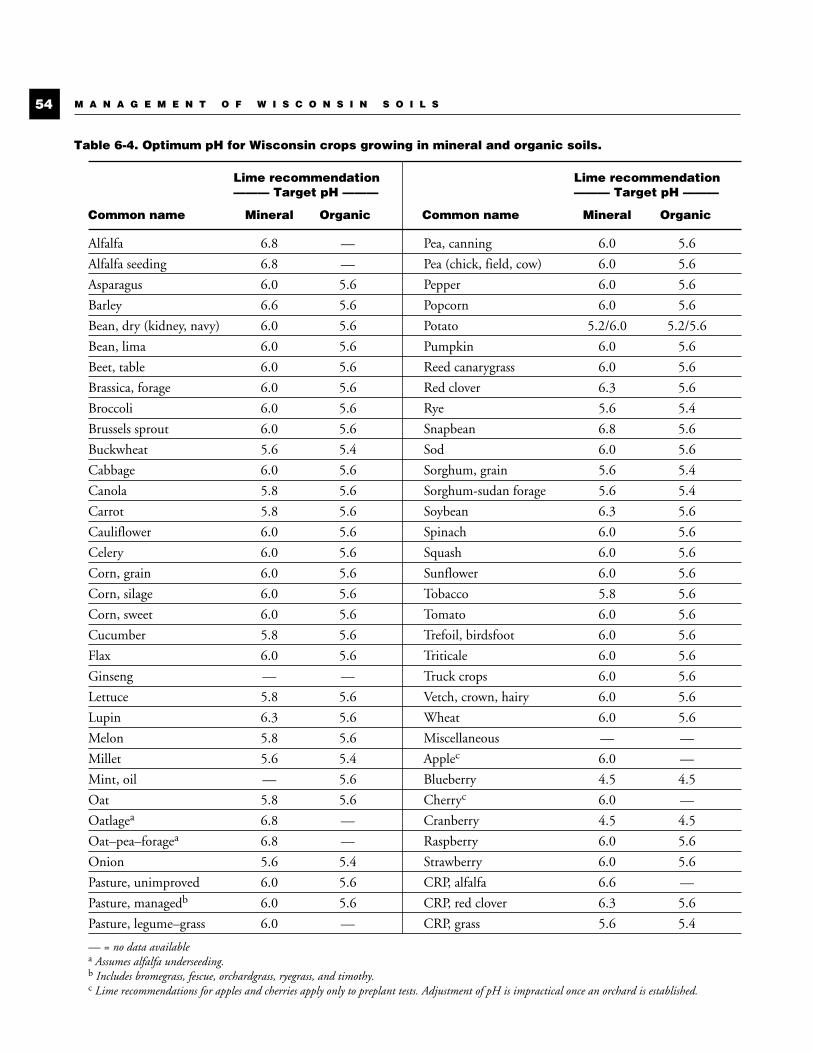
M A N A G E M E N T O F W I S C O N S I N S O I L S54
Table 6-4. Optimum pH for Wisconsin crops growing in mineral and organic soils.
Lime recommendation Lime recommendation——— Target pH ——— ——— Target pH ———
Common name Mineral Organic Common name Mineral Organic
Alfalfa 6.8 — Pea, canning 6.0 5.6
Alfalfa seeding 6.8 — Pea (chick, field, cow) 6.0 5.6
Asparagus 6.0 5.6 Pepper 6.0 5.6
Barley 6.6 5.6 Popcorn 6.0 5.6
Bean, dry (kidney, navy) 6.0 5.6 Potato 5.2/6.0 5.2/5.6
Bean, lima 6.0 5.6 Pumpkin 6.0 5.6
Beet, table 6.0 5.6 Reed canarygrass 6.0 5.6
Brassica, forage 6.0 5.6 Red clover 6.3 5.6
Broccoli 6.0 5.6 Rye 5.6 5.4
Brussels sprout 6.0 5.6 Snapbean 6.8 5.6
Buckwheat 5.6 5.4 Sod 6.0 5.6
Cabbage 6.0 5.6 Sorghum, grain 5.6 5.4
Canola 5.8 5.6 Sorghum-sudan forage 5.6 5.4
Carrot 5.8 5.6 Soybean 6.3 5.6
Cauliflower 6.0 5.6 Spinach 6.0 5.6
Celery 6.0 5.6 Squash 6.0 5.6
Corn, grain 6.0 5.6 Sunflower 6.0 5.6
Corn, silage 6.0 5.6 Tobacco 5.8 5.6
Corn, sweet 6.0 5.6 Tomato 6.0 5.6
Cucumber 5.8 5.6 Trefoil, birdsfoot 6.0 5.6
Flax 6.0 5.6 Triticale 6.0 5.6
Ginseng — — Truck crops 6.0 5.6
Lettuce 5.8 5.6 Vetch, crown, hairy 6.0 5.6
Lupin 6.3 5.6 Wheat 6.0 5.6
Melon 5.8 5.6 Miscellaneous — —
Millet 5.6 5.4 Applec 6.0 —
Mint, oil — 5.6 Blueberry 4.5 4.5
Oat 5.8 5.6 Cherryc 6.0 —
Oatlagea 6.8 — Cranberry 4.5 4.5
Oat–pea–foragea 6.8 — Raspberry 6.0 5.6
Onion 5.6 5.4 Strawberry 6.0 5.6
Pasture, unimproved 6.0 5.6 CRP, alfalfa 6.6 —
Pasture, managedb 6.0 5.6 CRP, red clover 6.3 5.6
Pasture, legume–grass 6.0 — CRP, grass 5.6 5.4
— = no data availablea Assumes alfalfa underseeding.b Includes bromegrass, fescue, orchardgrass, ryegrass, and timothy.c Lime recommendations for apples and cherries apply only to preplant tests. Adjustment of pH is impractical once an orchard is established.
C-6 10/18/05 11:11 AM Page 54
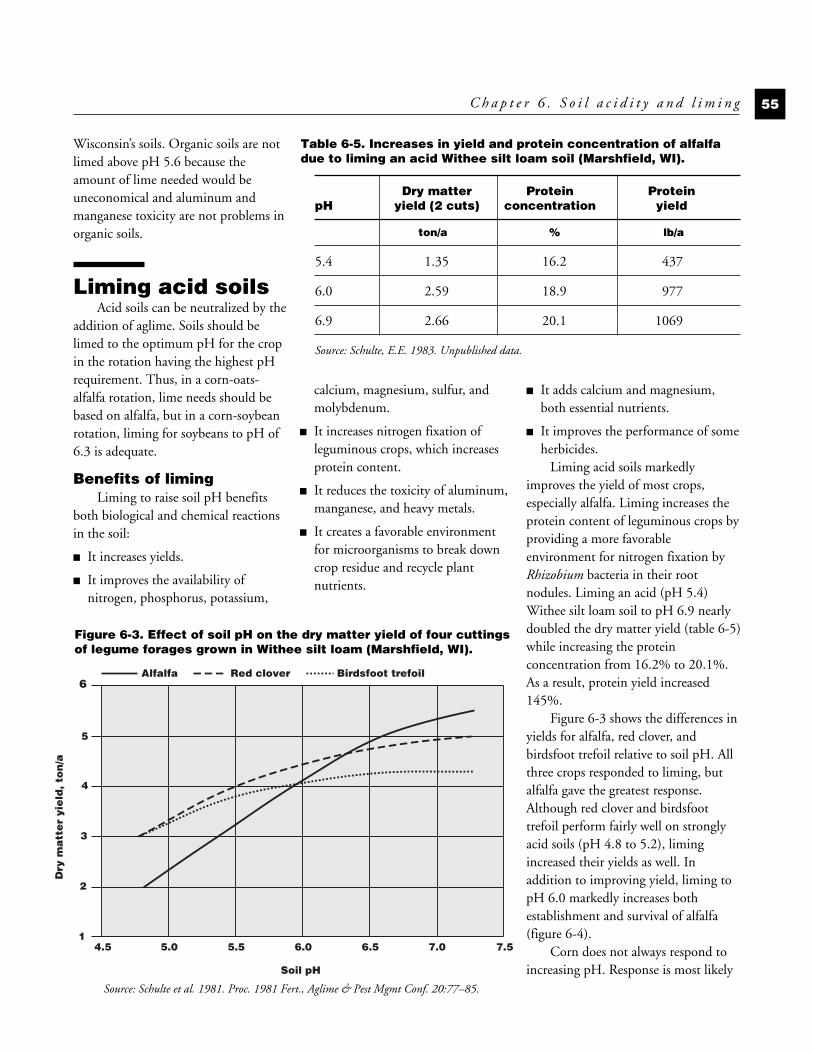
Wisconsin’s soils. Organic soils are notlimed above pH 5.6 because theamount of lime needed would beuneconomical and aluminum andmanganese toxicity are not problems inorganic soils.
Liming acid soilsAcid soils can be neutralized by the
addition of aglime. Soils should belimed to the optimum pH for the cropin the rotation having the highest pHrequirement. Thus, in a corn-oats-alfalfa rotation, lime needs should bebased on alfalfa, but in a corn-soybeanrotation, liming for soybeans to pH of6.3 is adequate.
Benefits of limingLiming to raise soil pH benefits
both biological and chemical reactionsin the soil:
■ It increases yields.
■ It improves the availability ofnitrogen, phosphorus, potassium,
calcium, magnesium, sulfur, andmolybdenum.
■ It increases nitrogen fixation ofleguminous crops, which increasesprotein content.
■ It reduces the toxicity of aluminum,manganese, and heavy metals.
■ It creates a favorable environmentfor microorganisms to break downcrop residue and recycle plantnutrients.
■ It adds calcium and magnesium,both essential nutrients.
■ It improves the performance of someherbicides.
Liming acid soils markedlyimproves the yield of most crops,especially alfalfa. Liming increases theprotein content of leguminous crops byproviding a more favorableenvironment for nitrogen fixation byRhizobium bacteria in their rootnodules. Liming an acid (pH 5.4)Withee silt loam soil to pH 6.9 nearlydoubled the dry matter yield (table 6-5)while increasing the proteinconcentration from 16.2% to 20.1%.As a result, protein yield increased145%.
Figure 6-3 shows the differences inyields for alfalfa, red clover, andbirdsfoot trefoil relative to soil pH. Allthree crops responded to liming, butalfalfa gave the greatest response.Although red clover and birdsfoottrefoil perform fairly well on stronglyacid soils (pH 4.8 to 5.2), limingincreased their yields as well. Inaddition to improving yield, liming topH 6.0 markedly increases bothestablishment and survival of alfalfa(figure 6-4).
Corn does not always respond toincreasing pH. Response is most likely
C h a p t e r 6 . S o i l a c i d i t y a n d l i m i n g 55
Table 6-5. Increases in yield and protein concentration of alfalfadue to liming an acid Withee silt loam soil (Marshfield, WI).
Dry matter Protein ProteinpH yield (2 cuts) concentration yield
ton/a % lb/a
5.4 1.35 16.2 437
6.0 2.59 18.9 977
6.9 2.66 20.1 1069
Source: Schulte, E.E. 1983. Unpublished data.
Dry
ma
tte
r yi
eld
, to
n/a
5
4
3
2
1
6
Soil pH
4.5 5.0 5.5 6.0 6.5 7.57.0
Red clover Birdsfoot trefoilAlfalfa
Figure 6-3. Effect of soil pH on the dry matter yield of four cuttingsof legume forages grown in Withee silt loam (Marshfield, WI).
Source: Schulte et al. 1981. Proc. 1981 Fert., Aglime & Pest Mgmt Conf. 20:77–85.
C-6 10/18/05 11:11 AM Page 55
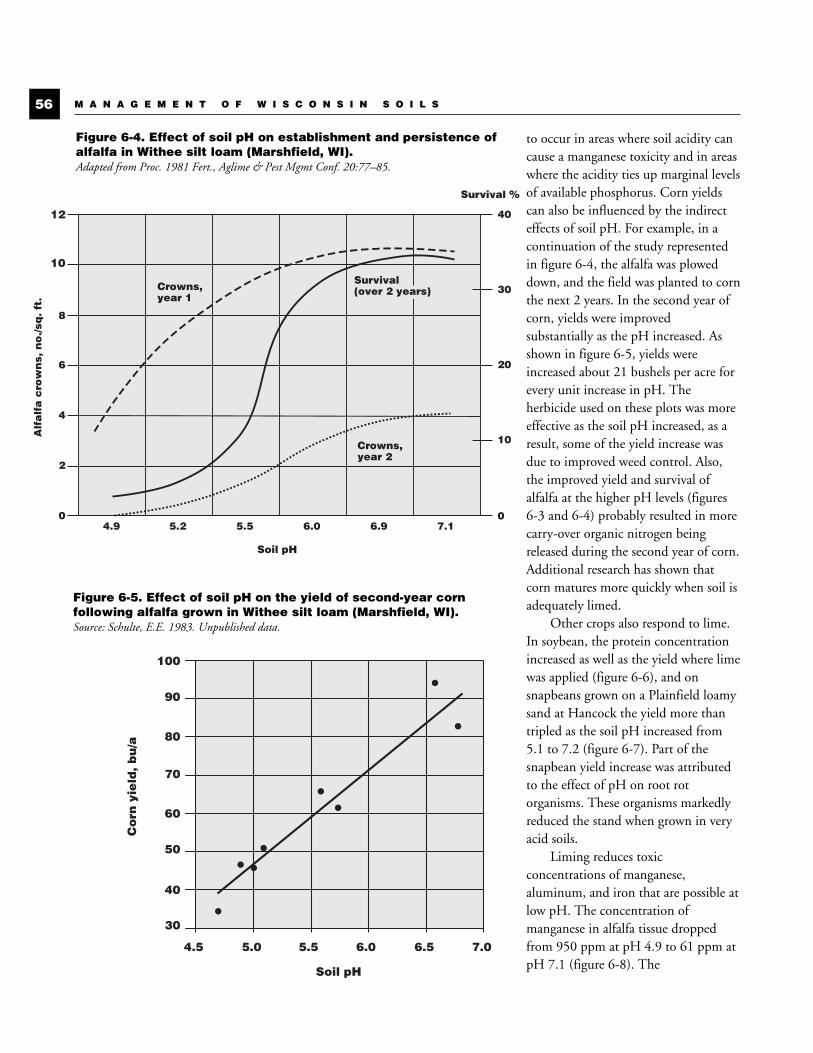
to occur in areas where soil acidity cancause a manganese toxicity and in areaswhere the acidity ties up marginal levelsof available phosphorus. Corn yieldscan also be influenced by the indirecteffects of soil pH. For example, in acontinuation of the study representedin figure 6-4, the alfalfa was ploweddown, and the field was planted to cornthe next 2 years. In the second year ofcorn, yields were improvedsubstantially as the pH increased. Asshown in figure 6-5, yields wereincreased about 21 bushels per acre forevery unit increase in pH. Theherbicide used on these plots was moreeffective as the soil pH increased, as aresult, some of the yield increase wasdue to improved weed control. Also,the improved yield and survival ofalfalfa at the higher pH levels (figures6-3 and 6-4) probably resulted in morecarry-over organic nitrogen beingreleased during the second year of corn.Additional research has shown thatcorn matures more quickly when soil isadequately limed.
Other crops also respond to lime.In soybean, the protein concentrationincreased as well as the yield where limewas applied (figure 6-6), and onsnapbeans grown on a Plainfield loamysand at Hancock the yield more thantripled as the soil pH increased from5.1 to 7.2 (figure 6-7). Part of thesnapbean yield increase was attributedto the effect of pH on root rotorganisms. These organisms markedlyreduced the stand when grown in veryacid soils.
Liming reduces toxicconcentrations of manganese,aluminum, and iron that are possible atlow pH. The concentration ofmanganese in alfalfa tissue droppedfrom 950 ppm at pH 4.9 to 61 ppm atpH 7.1 (figure 6-8). The
M A N A G E M E N T O F W I S C O N S I N S O I L S56
Alf
alf
a c
row
ns,
no
./sq
. ft
.
8
6
4
2
0
10
Soil pH
Crowns, year 2
4.9 5.2 5.5 6.0 6.9 7.1
12
Survival %
0
10
20
30
40
Crowns, year 1
Survival(over 2 years)
Co
rn y
ield
, b
u/a
Soil pH
4.5 5.0 5.5 6.0 6.5 7.0
100
70
60
50
40
30
80
90•
•
•
•
••
•
•
Figure 6-4. Effect of soil pH on establishment and persistence ofalfalfa in Withee silt loam (Marshfield, WI). Adapted from Proc. 1981 Fert., Aglime & Pest Mgmt Conf. 20:77–85.
Figure 6-5. Effect of soil pH on the yield of second-year cornfollowing alfalfa grown in Withee silt loam (Marshfield, WI).Source: Schulte, E.E. 1983. Unpublished data.
C-6 10/18/05 11:11 AM Page 56
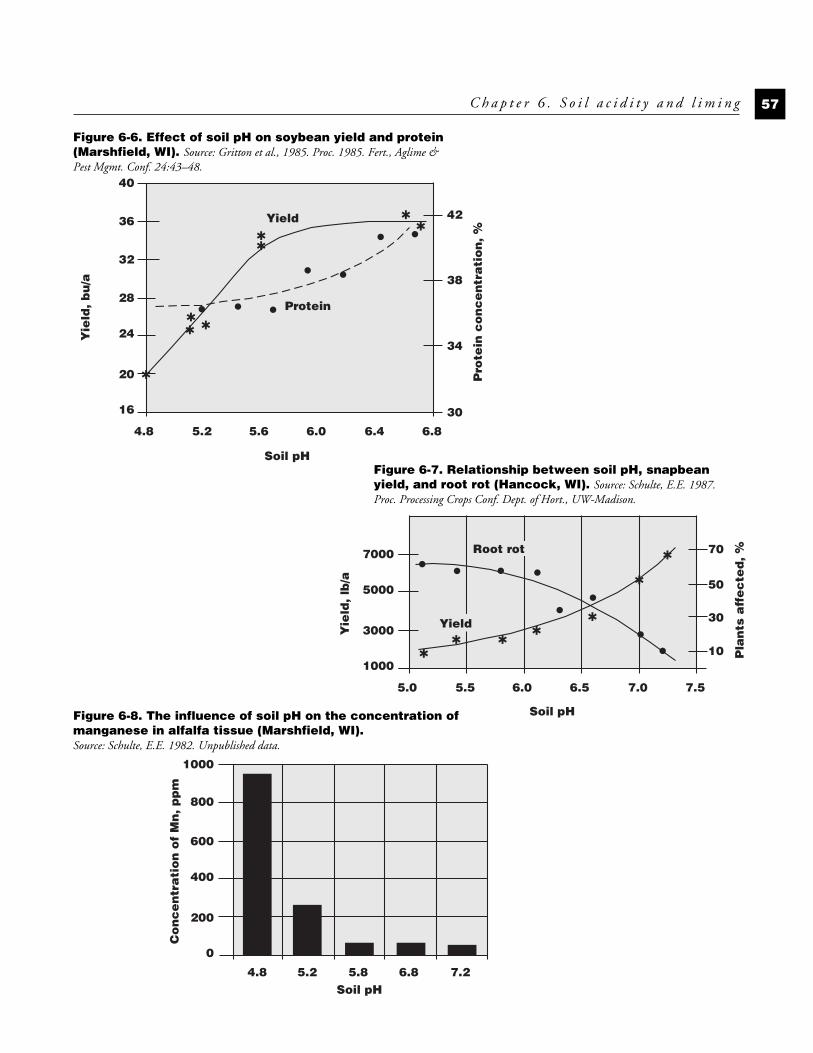
C h a p t e r 6 . S o i l a c i d i t y a n d l i m i n g 57
Figure 6-6. Effect of soil pH on soybean yield and protein(Marshfield, WI). Source: Gritton et al., 1985. Proc. 1985. Fert., Aglime &Pest Mgmt. Conf. 24:43–48.
Figure 6-7. Relationship between soil pH, snapbeanyield, and root rot (Hancock, WI). Source: Schulte, E.E. 1987.Proc. Processing Crops Conf. Dept. of Hort., UW-Madison.
Figure 6-8. The influence of soil pH on the concentration ofmanganese in alfalfa tissue (Marshfield, WI). Source: Schulte, E.E. 1982. Unpublished data.
Yie
ld, b
u/a
4.8 5.2 5.6 6.0 6.4 6.8
Soil pH
Pro
tein
co
nc
en
tra
tio
n, %
38
34
30
Protein
Yield
•
•
•
✱
✱✱
✱
✱
•✱
40
36
32
28
24
20
16
42
•
✱
•
•
✱Y
ield
, lb
/a
5.0 5.5 6.0 6.5 7.0 7.5
Soil pH
7000
5000
3000
1000
Pla
nts
aff
ec
ted
, %
•
•
•
•• ••
✱ ✱✱
✱
✱ •
70
50
30
10
✱
✱Root rot
Yield
Co
nc
en
tra
tio
n o
f M
n, p
pm
Soil pH4.8 5.2 5.8 6.8 7.2
800
600
400
200
0
1000
C-6 10/18/05 11:11 AM Page 57
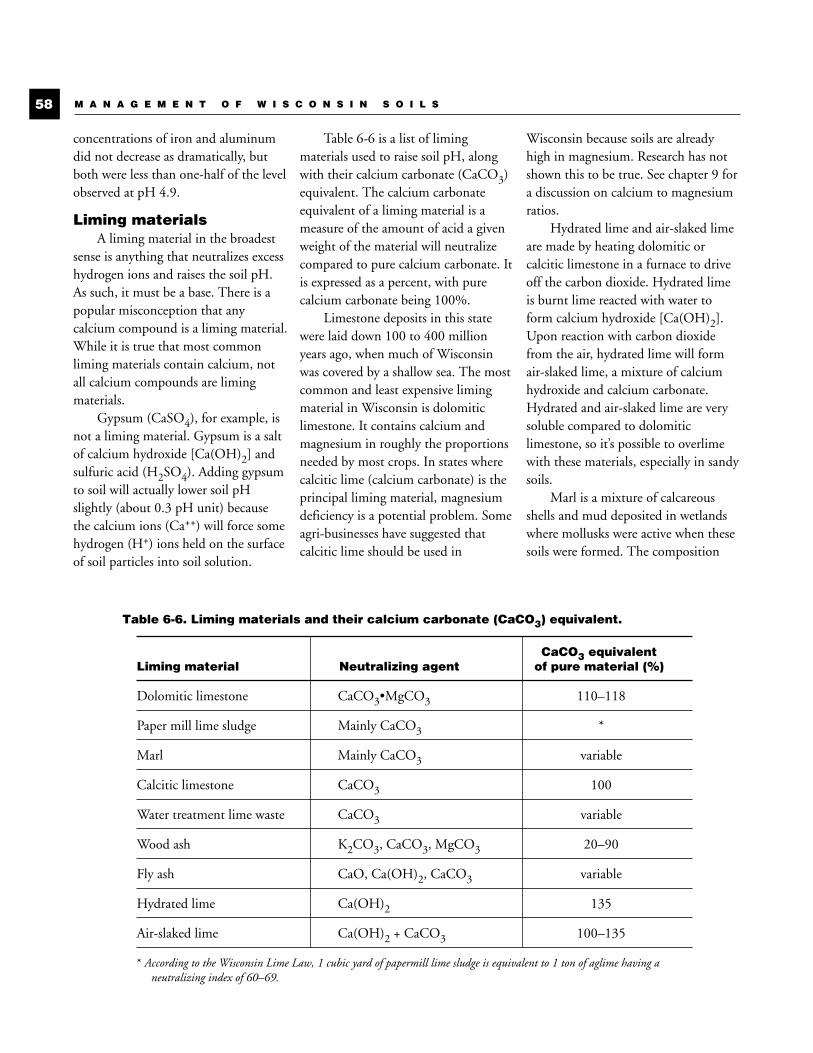
concentrations of iron and aluminumdid not decrease as dramatically, butboth were less than one-half of the levelobserved at pH 4.9.
Liming materialsA liming material in the broadest
sense is anything that neutralizes excesshydrogen ions and raises the soil pH.As such, it must be a base. There is apopular misconception that anycalcium compound is a liming material.While it is true that most commonliming materials contain calcium, notall calcium compounds are limingmaterials.
Gypsum (CaSO4), for example, isnot a liming material. Gypsum is a saltof calcium hydroxide [Ca(OH)2] andsulfuric acid (H2SO4). Adding gypsumto soil will actually lower soil pHslightly (about 0.3 pH unit) becausethe calcium ions (Ca++) will force somehydrogen (H+) ions held on the surfaceof soil particles into soil solution.
Table 6-6 is a list of limingmaterials used to raise soil pH, alongwith their calcium carbonate (CaCO3)equivalent. The calcium carbonateequivalent of a liming material is ameasure of the amount of acid a givenweight of the material will neutralizecompared to pure calcium carbonate. Itis expressed as a percent, with purecalcium carbonate being 100%.
Limestone deposits in this statewere laid down 100 to 400 millionyears ago, when much of Wisconsinwas covered by a shallow sea. The mostcommon and least expensive limingmaterial in Wisconsin is dolomiticlimestone. It contains calcium andmagnesium in roughly the proportionsneeded by most crops. In states wherecalcitic lime (calcium carbonate) is theprincipal liming material, magnesiumdeficiency is a potential problem. Someagri-businesses have suggested thatcalcitic lime should be used in
Wisconsin because soils are alreadyhigh in magnesium. Research has notshown this to be true. See chapter 9 fora discussion on calcium to magnesiumratios.
Hydrated lime and air-slaked limeare made by heating dolomitic orcalcitic limestone in a furnace to driveoff the carbon dioxide. Hydrated limeis burnt lime reacted with water toform calcium hydroxide [Ca(OH)2].Upon reaction with carbon dioxidefrom the air, hydrated lime will formair-slaked lime, a mixture of calciumhydroxide and calcium carbonate.Hydrated and air-slaked lime are verysoluble compared to dolomiticlimestone, so it’s possible to overlimewith these materials, especially in sandysoils.
Marl is a mixture of calcareousshells and mud deposited in wetlandswhere mollusks were active when thesesoils were formed. The composition
M A N A G E M E N T O F W I S C O N S I N S O I L S58
Table 6-6. Liming materials and their calcium carbonate (CaCO3) equivalent.
CaCO3 equivalentLiming material Neutralizing agent of pure material (%)
Dolomitic limestone CaCO3•MgCO3 110–118
Paper mill lime sludge Mainly CaCO3 *
Marl Mainly CaCO3 variable
Calcitic limestone CaCO3 100
Water treatment lime waste CaCO3 variable
Wood ash K2CO3, CaCO3, MgCO3 20–90
Fly ash CaO, Ca(OH)2, CaCO3 variable
Hydrated lime Ca(OH)2 135
Air-slaked lime Ca(OH)2 + CaCO3 100–135
* According to the Wisconsin Lime Law, 1 cubic yard of papermill lime sludge is equivalent to 1 ton of aglime having aneutralizing index of 60–69.
C-6 10/18/05 11:11 AM Page 58
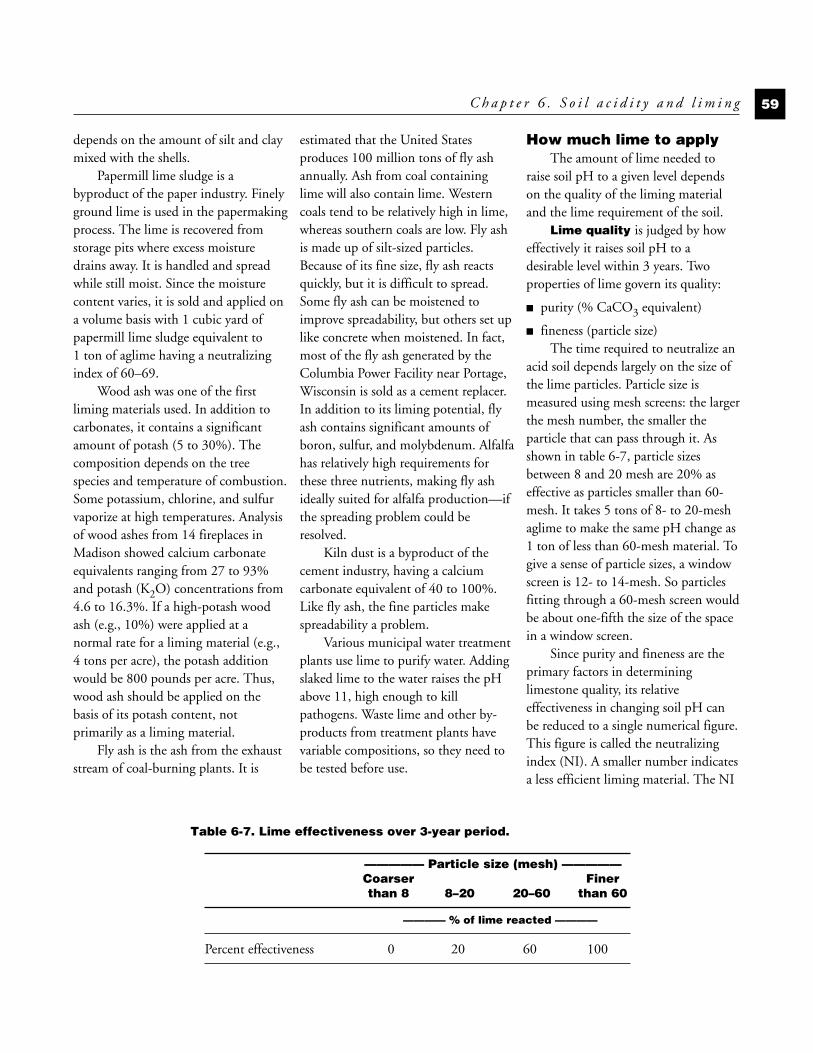
depends on the amount of silt and claymixed with the shells.
Papermill lime sludge is abyproduct of the paper industry. Finelyground lime is used in the papermakingprocess. The lime is recovered fromstorage pits where excess moisturedrains away. It is handled and spreadwhile still moist. Since the moisturecontent varies, it is sold and applied ona volume basis with 1 cubic yard ofpapermill lime sludge equivalent to1 ton of aglime having a neutralizingindex of 60–69.
Wood ash was one of the firstliming materials used. In addition tocarbonates, it contains a significantamount of potash (5 to 30%). Thecomposition depends on the treespecies and temperature of combustion.Some potassium, chlorine, and sulfurvaporize at high temperatures. Analysisof wood ashes from 14 fireplaces inMadison showed calcium carbonateequivalents ranging from 27 to 93%and potash (K2O) concentrations from4.6 to 16.3%. If a high-potash woodash (e.g., 10%) were applied at anormal rate for a liming material (e.g.,4 tons per acre), the potash additionwould be 800 pounds per acre. Thus,wood ash should be applied on thebasis of its potash content, notprimarily as a liming material.
Fly ash is the ash from the exhauststream of coal-burning plants. It is
estimated that the United Statesproduces 100 million tons of fly ashannually. Ash from coal containinglime will also contain lime. Westerncoals tend to be relatively high in lime,whereas southern coals are low. Fly ashis made up of silt-sized particles.Because of its fine size, fly ash reactsquickly, but it is difficult to spread.Some fly ash can be moistened toimprove spreadability, but others set uplike concrete when moistened. In fact,most of the fly ash generated by theColumbia Power Facility near Portage,Wisconsin is sold as a cement replacer.In addition to its liming potential, flyash contains significant amounts ofboron, sulfur, and molybdenum. Alfalfahas relatively high requirements forthese three nutrients, making fly ashideally suited for alfalfa production—ifthe spreading problem could beresolved.
Kiln dust is a byproduct of thecement industry, having a calciumcarbonate equivalent of 40 to 100%.Like fly ash, the fine particles makespreadability a problem.
Various municipal water treatmentplants use lime to purify water. Addingslaked lime to the water raises the pHabove 11, high enough to killpathogens. Waste lime and other by-products from treatment plants havevariable compositions, so they need tobe tested before use.
How much lime to applyThe amount of lime needed to
raise soil pH to a given level dependson the quality of the liming materialand the lime requirement of the soil.
Lime quality is judged by howeffectively it raises soil pH to adesirable level within 3 years. Twoproperties of lime govern its quality:
■ purity (% CaCO3 equivalent)
■ fineness (particle size)The time required to neutralize an
acid soil depends largely on the size ofthe lime particles. Particle size ismeasured using mesh screens: the largerthe mesh number, the smaller theparticle that can pass through it. Asshown in table 6-7, particle sizesbetween 8 and 20 mesh are 20% aseffective as particles smaller than 60-mesh. It takes 5 tons of 8- to 20-meshaglime to make the same pH change as1 ton of less than 60-mesh material. Togive a sense of particle sizes, a windowscreen is 12- to 14-mesh. So particlesfitting through a 60-mesh screen wouldbe about one-fifth the size of the spacein a window screen.
Since purity and fineness are theprimary factors in determininglimestone quality, its relativeeffectiveness in changing soil pH canbe reduced to a single numerical figure.This figure is called the neutralizingindex (NI). A smaller number indicatesa less efficient liming material. The NI
C h a p t e r 6 . S o i l a c i d i t y a n d l i m i n g 59
Table 6-7. Lime effectiveness over 3-year period.
————— Particle size (mesh) —————Coarser Finerthan 8 8–20 20–60 than 60
———— % of lime reacted ————
Percent effectiveness 0 20 60 100
C-6 10/18/05 11:11 AM Page 59
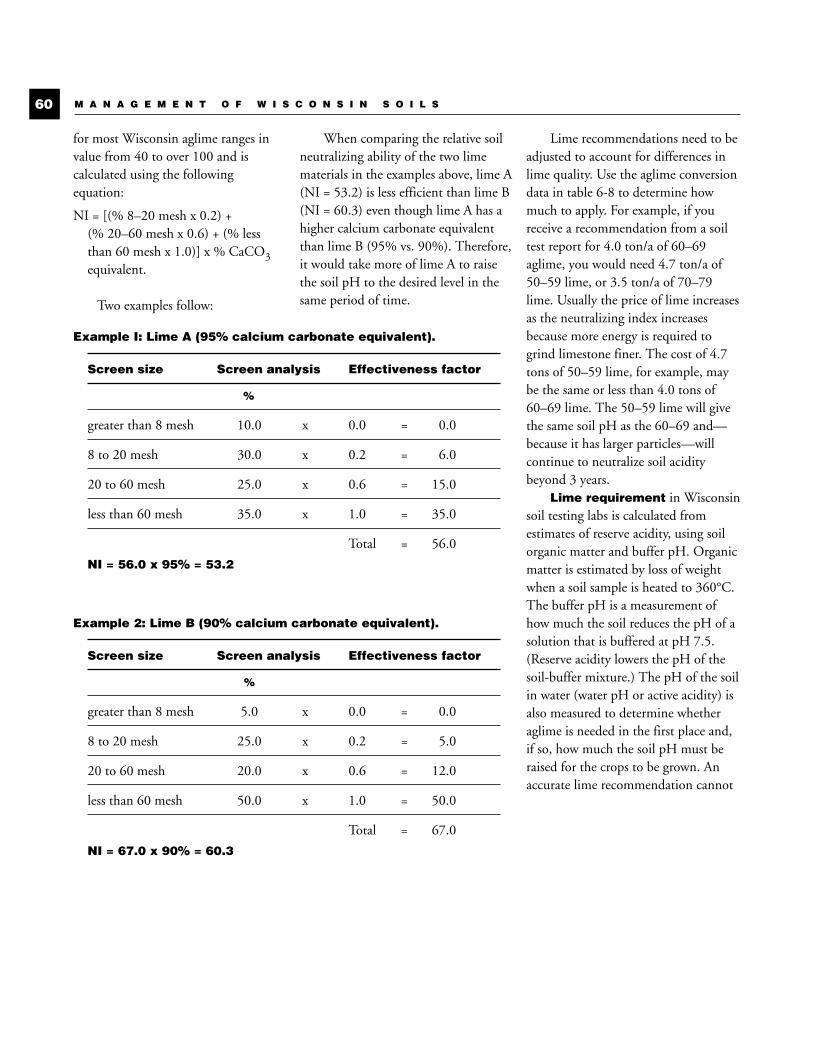
for most Wisconsin aglime ranges invalue from 40 to over 100 and iscalculated using the followingequation:
NI = [(% 8–20 mesh x 0.2) + (% 20–60 mesh x 0.6) + (% lessthan 60 mesh x 1.0)] x % CaCO3equivalent.
Two examples follow:
When comparing the relative soilneutralizing ability of the two limematerials in the examples above, lime A(NI = 53.2) is less efficient than lime B(NI = 60.3) even though lime A has ahigher calcium carbonate equivalentthan lime B (95% vs. 90%). Therefore,it would take more of lime A to raisethe soil pH to the desired level in thesame period of time.
Lime recommendations need to beadjusted to account for differences inlime quality. Use the aglime conversiondata in table 6-8 to determine howmuch to apply. For example, if youreceive a recommendation from a soiltest report for 4.0 ton/a of 60–69aglime, you would need 4.7 ton/a of50–59 lime, or 3.5 ton/a of 70–79lime. Usually the price of lime increasesas the neutralizing index increasesbecause more energy is required togrind limestone finer. The cost of 4.7tons of 50–59 lime, for example, maybe the same or less than 4.0 tons of60–69 lime. The 50–59 lime will givethe same soil pH as the 60–69 and—because it has larger particles—willcontinue to neutralize soil aciditybeyond 3 years.
Lime requirement in Wisconsinsoil testing labs is calculated fromestimates of reserve acidity, using soilorganic matter and buffer pH. Organicmatter is estimated by loss of weightwhen a soil sample is heated to 360°C.The buffer pH is a measurement ofhow much the soil reduces the pH of asolution that is buffered at pH 7.5.(Reserve acidity lowers the pH of thesoil-buffer mixture.) The pH of the soilin water (water pH or active acidity) isalso measured to determine whetheraglime is needed in the first place and,if so, how much the soil pH must beraised for the crops to be grown. Anaccurate lime recommendation cannot
M A N A G E M E N T O F W I S C O N S I N S O I L S60
Example I: Lime A (95% calcium carbonate equivalent).
Screen size Screen analysis Effectiveness factor
%
greater than 8 mesh 10.0 x 0.0 = 0.0
8 to 20 mesh 30.0 x 0.2 = 6.0
20 to 60 mesh 25.0 x 0.6 = 15.0
less than 60 mesh 35.0 x 1.0 = 35.0
Total = 56.0
NI = 56.0 x 95% = 53.2
Example 2: Lime B (90% calcium carbonate equivalent).
Screen size Screen analysis Effectiveness factor
%
greater than 8 mesh 5.0 x 0.0 = 0.0
8 to 20 mesh 25.0 x 0.2 = 5.0
20 to 60 mesh 20.0 x 0.6 = 12.0
less than 60 mesh 50.0 x 1.0 = 50.0
Total = 67.0
NI = 67.0 x 90% = 60.3
C-6 10/18/05 11:11 AM Page 60

be made with a water pH measurementalone because it only measures theactive acidity. Water pH does notmeasure reserve acidity; that is, thehydrogen bonded to clay and organicmatter.
The lime requirement is calculatedusing loss of weight on heating to360°C, buffer pH, and water pH. Asan example, the amount of aglime (NIof 60–69) needed to raise the water pHfrom 5.8 to 6.3 in a soil with a weightloss upon heating of 3.3% and a bufferpH of 6.0 would be as follows:
More explanation of how the limerequirement is calculated for severaltarget pH levels is given in Extensionpublication Soil Test Recommendationsfor Field, Vegetable and Fruit Crops(A2809).
Standard recommendations arebased on liming the soil to a depth of 7inches or less. If tillage is deeper than 7inches, more lime will be needed toneutralize the entire tilled layer. Tocalculate how much more lime to add,use the appropriate multiplier(table 6-9) to adjust the formula.
C h a p t e r 6 . S o i l a c i d i t y a n d l i m i n g 61
Table 6-8. Aglime conversion table for different neutralizing index zones.
Lime Zones of lime quality according to neutralizing index valuesrecommendationa 40–49 50–59 60–69 70–79 80–89 90–99 100–109+
(ton/a) ——————————————— ton/a lime to apply —————————————
1 1.4 1.2 1.0 0.9 0.8 0.7 0.6
2 2.9 2.4 2.0 1.7 1.5 1.4 1.2
3 4.3 3.5 3.0 2.6 2.3 2.1 1.9
4 5.8 4.7 4.0 3.5 3.1 2.7 2.5
5 7.2 5.9 5.0 4.3 3.8 3.4 3.1
6 8.7 7.1 6.0 5.2 4.6 4.1 3.7
7 10.1 8.3 7.0 6.1 5.4 4.8 4.3
8 11.6 9.5 8.0 6.9 6.1 5.5 5.0
9 13.0 10.6 9.0 7.8 6.9 6.2 5.6
10 14.4 11.8 10.0 8.7 7.6 6.8 6.2
a Soil test recommendations are made for lime having a neutralizing index zone of 60–69. To convert a recommendation to a liming material witha different grade, read across the table to the appropriate column.
Lime required = 1.75 [1.20(6.3 – soil pH)(% weight loss) + 0.030 (buffer pH)]
= 1.75 [1.20(6.3–5.8)(3.3) + 0.030(6.0)]
= 1.75 [1.98 + 0.18] = 4 ton/a
Table 6-9. Multipliers used toadjust lime recommendationsbased on tillage depth.
Tillage depth (inches) Multiplier
<7.1 1.00
7.1–8.0 1.15
8.1–9.0 1.31
>9.0 1.46
C-6 10/18/05 11:11 AM Page 61
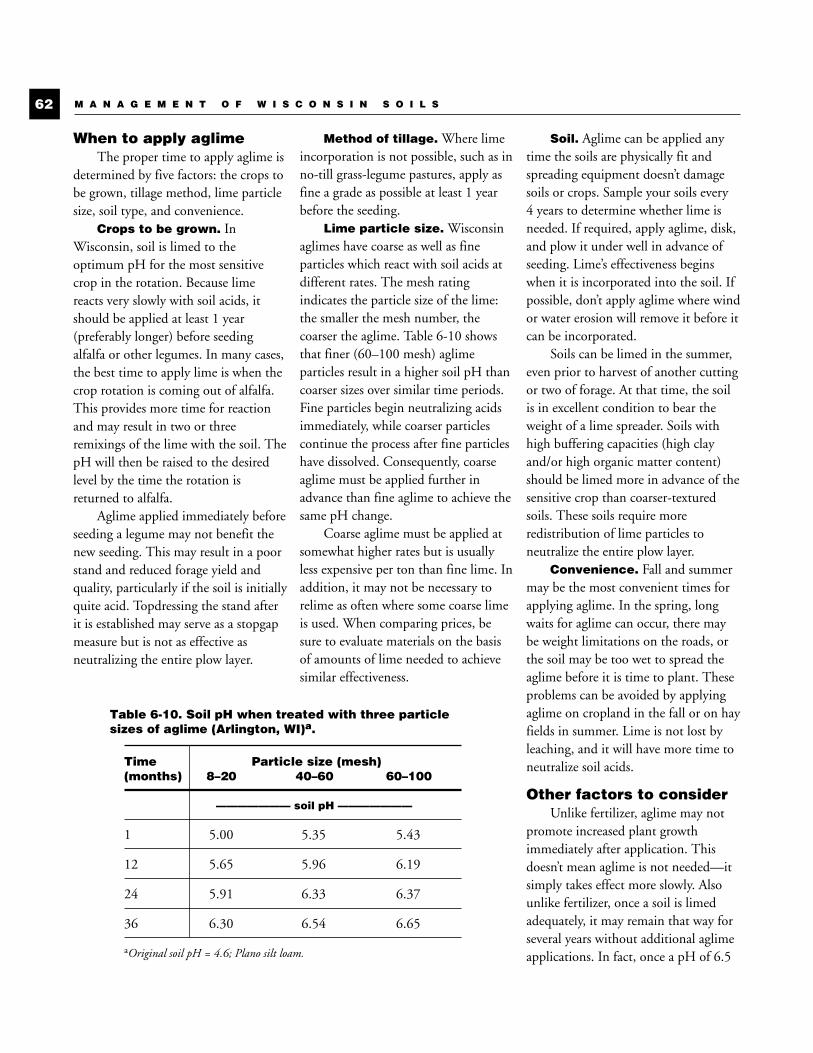
When to apply aglimeThe proper time to apply aglime is
determined by five factors: the crops tobe grown, tillage method, lime particlesize, soil type, and convenience.
Crops to be grown. InWisconsin, soil is limed to theoptimum pH for the most sensitivecrop in the rotation. Because limereacts very slowly with soil acids, itshould be applied at least 1 year(preferably longer) before seedingalfalfa or other legumes. In many cases,the best time to apply lime is when thecrop rotation is coming out of alfalfa.This provides more time for reactionand may result in two or threeremixings of the lime with the soil. ThepH will then be raised to the desiredlevel by the time the rotation isreturned to alfalfa.
Aglime applied immediately beforeseeding a legume may not benefit thenew seeding. This may result in a poorstand and reduced forage yield andquality, particularly if the soil is initiallyquite acid. Topdressing the stand afterit is established may serve as a stopgapmeasure but is not as effective asneutralizing the entire plow layer.
Method of tillage. Where limeincorporation is not possible, such as inno-till grass-legume pastures, apply asfine a grade as possible at least 1 yearbefore the seeding.
Lime particle size. Wisconsinaglimes have coarse as well as fineparticles which react with soil acids atdifferent rates. The mesh ratingindicates the particle size of the lime:the smaller the mesh number, thecoarser the aglime. Table 6-10 showsthat finer (60–100 mesh) aglimeparticles result in a higher soil pH thancoarser sizes over similar time periods.Fine particles begin neutralizing acidsimmediately, while coarser particlescontinue the process after fine particleshave dissolved. Consequently, coarseaglime must be applied further inadvance than fine aglime to achieve thesame pH change.
Coarse aglime must be applied atsomewhat higher rates but is usuallyless expensive per ton than fine lime. Inaddition, it may not be necessary torelime as often where some coarse limeis used. When comparing prices, besure to evaluate materials on the basisof amounts of lime needed to achievesimilar effectiveness.
Soil. Aglime can be applied anytime the soils are physically fit andspreading equipment doesn’t damagesoils or crops. Sample your soils every4 years to determine whether lime isneeded. If required, apply aglime, disk,and plow it under well in advance ofseeding. Lime’s effectiveness beginswhen it is incorporated into the soil. Ifpossible, don’t apply aglime where windor water erosion will remove it before itcan be incorporated.
Soils can be limed in the summer,even prior to harvest of another cuttingor two of forage. At that time, the soilis in excellent condition to bear theweight of a lime spreader. Soils withhigh buffering capacities (high clayand/or high organic matter content)should be limed more in advance of thesensitive crop than coarser-texturedsoils. These soils require moreredistribution of lime particles toneutralize the entire plow layer.
Convenience. Fall and summermay be the most convenient times forapplying aglime. In the spring, longwaits for aglime can occur, there maybe weight limitations on the roads, orthe soil may be too wet to spread theaglime before it is time to plant. Theseproblems can be avoided by applyingaglime on cropland in the fall or on hayfields in summer. Lime is not lost byleaching, and it will have more time toneutralize soil acids.
Other factors to considerUnlike fertilizer, aglime may not
promote increased plant growthimmediately after application. Thisdoesn’t mean aglime is not needed—itsimply takes effect more slowly. Alsounlike fertilizer, once a soil is limedadequately, it may remain that way forseveral years without additional aglimeapplications. In fact, once a pH of 6.5
M A N A G E M E N T O F W I S C O N S I N S O I L S62
Table 6-10. Soil pH when treated with three particlesizes of aglime (Arlington, WI)a.
Time Particle size (mesh)(months) 8–20 40–60 60–100
——————— soil pH ———————
1 5.00 5.35 5.43
12 5.65 5.96 6.19
24 5.91 6.33 6.37
36 6.30 6.54 6.65
aOriginal soil pH = 4.6; Plano silt loam.
C-6 10/18/05 11:12 AM Page 62
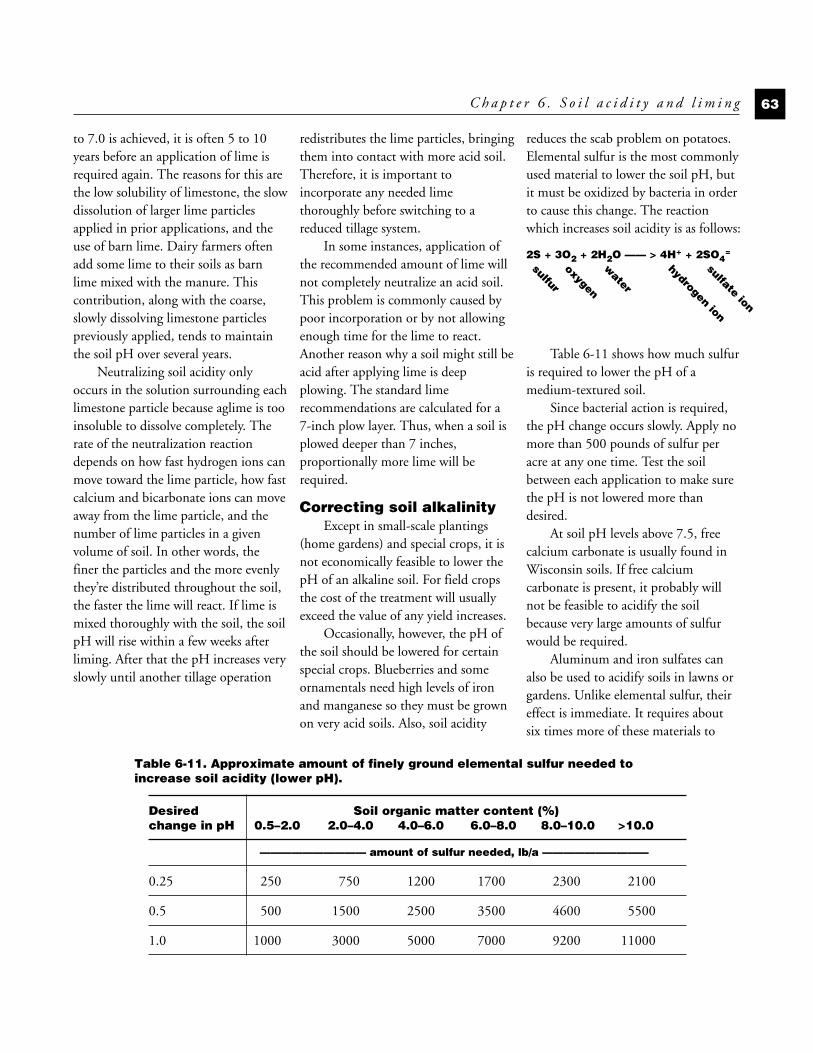
to 7.0 is achieved, it is often 5 to 10years before an application of lime isrequired again. The reasons for this arethe low solubility of limestone, the slowdissolution of larger lime particlesapplied in prior applications, and theuse of barn lime. Dairy farmers oftenadd some lime to their soils as barnlime mixed with the manure. Thiscontribution, along with the coarse,slowly dissolving limestone particlespreviously applied, tends to maintainthe soil pH over several years.
Neutralizing soil acidity onlyoccurs in the solution surrounding eachlimestone particle because aglime is tooinsoluble to dissolve completely. Therate of the neutralization reactiondepends on how fast hydrogen ions canmove toward the lime particle, how fastcalcium and bicarbonate ions can moveaway from the lime particle, and thenumber of lime particles in a givenvolume of soil. In other words, thefiner the particles and the more evenlythey’re distributed throughout the soil,the faster the lime will react. If lime ismixed thoroughly with the soil, the soilpH will rise within a few weeks afterliming. After that the pH increases veryslowly until another tillage operation
redistributes the lime particles, bringingthem into contact with more acid soil.Therefore, it is important toincorporate any needed limethoroughly before switching to areduced tillage system.
In some instances, application ofthe recommended amount of lime willnot completely neutralize an acid soil.This problem is commonly caused bypoor incorporation or by not allowingenough time for the lime to react.Another reason why a soil might still beacid after applying lime is deepplowing. The standard limerecommendations are calculated for a7-inch plow layer. Thus, when a soil isplowed deeper than 7 inches,proportionally more lime will berequired.
Correcting soil alkalinityExcept in small-scale plantings
(home gardens) and special crops, it isnot economically feasible to lower thepH of an alkaline soil. For field cropsthe cost of the treatment will usuallyexceed the value of any yield increases.
Occasionally, however, the pH ofthe soil should be lowered for certainspecial crops. Blueberries and someornamentals need high levels of ironand manganese so they must be grownon very acid soils. Also, soil acidity
reduces the scab problem on potatoes.Elemental sulfur is the most commonlyused material to lower the soil pH, butit must be oxidized by bacteria in orderto cause this change. The reactionwhich increases soil acidity is as follows:
Table 6-11 shows how much sulfuris required to lower the pH of amedium-textured soil.
Since bacterial action is required,the pH change occurs slowly. Apply nomore than 500 pounds of sulfur peracre at any one time. Test the soilbetween each application to make surethe pH is not lowered more thandesired.
At soil pH levels above 7.5, freecalcium carbonate is usually found inWisconsin soils. If free calciumcarbonate is present, it probably willnot be feasible to acidify the soilbecause very large amounts of sulfurwould be required.
Aluminum and iron sulfates canalso be used to acidify soils in lawns orgardens. Unlike elemental sulfur, theireffect is immediate. It requires aboutsix times more of these materials to
C h a p t e r 6 . S o i l a c i d i t y a n d l i m i n g 63
Table 6-11. Approximate amount of finely ground elemental sulfur needed toincrease soil acidity (lower pH).
Desired Soil organic matter content (%)change in pH 0.5–2.0 2.0–4.0 4.0–6.0 6.0–8.0 8.0–10.0 >10.0
—————————— amount of sulfur needed, lb/a ——————————
0.25 250 750 1200 1700 2300 2100
0.5 500 1500 2500 3500 4600 5500
1.0 1000 3000 5000 7000 9200 11000
2S + 3O2 + 2H2O —— > 4H+ + 2SO4=
sulfur
oxygen
water
hydrogen ion
sulfate ion
C-6 10/18/05 11:12 AM Page 63
change the pH as compared to sulfur.Because too much aluminum and ironcan be toxic to plants, do not applymore than 50 pounds per 1,000 squarefeet.
Acid peat moss usually has a pH of4.5 or less and is a good material to mixwith lawn or garden soils to make themmore acid. It also adds organic matter.It is convenient to use on small gardenareas and for potting soil. It may makeup one-fourth the volume of pottingsoil, depending on the pH of the soilwith which it is mixed and the pHrequirement of the plants to be grown,On gardens, apply 1 to 2 inches on thesurface and spade or rototill to mix it in.
As noted previously, fertilizerscontaining ammonium nitrogen areacid-forming. Ammonium sulfate is themost acidifying per pound of nitrogenapplied. Ammonium sulfate (21-0-0) isthe best nitrogen fertilizer formaintaining an acid soil, as withblueberries, cranberries, andhydrangeas.
Questions1. What influence does soil pH have
on chemical and biolgicalreactions?
2. List several ways by which soilsbecome acid.
3. What is the difference betweenactive acidity and reserve acidity?Which of these forms is measuredwhen the soil is analyzed for its pHin water?
4. Is lime requirement more closelyassociated with the active acidity orthe reserve acidity? Explain.
5. List several benefits of liming.
6. Explain why calcium carbonate(CaCO3) will neutralize soilacidity but calcium sulfate(CaSO4) will not.
7. A soil test recommendation callsfor 4 ton/a of 60–69 aglime. Howmuch 40–49 aglime would berequired? 70–79 aglime? 90–99aglime?
8. An aglime vendor had samples oftwo of products tested, with thefollowing results:
Screen Screen analysissize (mesh) A B
———%———
less than 8 5.0 2.0
8–20 20.4 4.5
20–60 57.3 25.6
greater than 60 17.3 67.9
CaCO3 equivalence 98.0 93.0
What is the neutralizing index ofeach product? If it costs $12/ton tospread product A and $15/ton to
spread product B, which is thebetter buy?
9. Assume that two different limingmaterials have a neutralizing indexof 60–69 and 90–99 and that thecost of these materials is $9.00/tonand $18.00/ton, respectively.Which material is the better buy?
10. When a field is to be limed in Apriland seeded in May, lime with aneutralizing index of 90–99 or100–109 is recommended ratherthan lime with an index of 60–69.Why?
11. How many tons of lime would berequired to raise the pH of thefollowing soils to 6.3? (Use theformula given on page 61.)
12. Assume that a field has a pH of 5.2and is being cropped in a corn-oats-alfalfa-alfalfa-alfalfa rotation.When would be the best time tolime this field? Why?
13. When an acid soil is limed in Apriland seeded in May, the new alfalfaseeding sometimes fails to survivedue to soil acidity. Explain howthis can happen.
14. Under what conditions would yourecommend that the pH of a soilshould be lowered from 7.3 to 4.5?How would you accomplish this?
M A N A G E M E N T O F W I S C O N S I N S O I L S64
Water Buffer Weight Soila pH pH loss (%)
Plano 6.0 6.6 4.0
Fayette 5.8 6.7 1.5
Tama 5.8 6.0 3.5
aAssume that all soils are plowed at a depth of 7 inches.
C-6 10/18/05 11:12 AM Page 64

“The series of biophysicaland biochemical processesthat follow [weathering]ultimately reorganize theinitially haphazard mineralconstituents into a distinct,internally ordered, livingnatural body. This finalmetamorphosis is broughtabout by the activity and theaccumulated organic productsof myriad microscopic andmacroscopic plants andanimals which coinhabit the soil as an integratedcommunity.”
Daniel J. Hillel, Out of the Earth, 1991
Fertile soils are biologically active.This means they support the growth ofa wide variety of microscopic plantsand soil animals, as well as terrestrialplants. Most soil organisms arebeneficial, but some can cause plantdisease or physical damage to the soil(e.g., excessive burrowing by rodents).Soil organisms range in size frommicroscopic, single-celled plants tolarge burrowing animals. Immensenumbers of organisms live in fertilesoils. A gram of such soil, for example,can contain more than 500 millionmicroorganisms.
Another important characteristicof a biologically active soil is the cyclingof carbon and several plant nutrients,such as nitrogen, phosphorus andsulfur, through plants and soil-dwellinganimals. These chemical elements arein constant flux: they cycle fromdecaying organic residue, to activelygrowing plants and animals, and backagain to decomposing organic matter.
The information presented in thischapter is concerned with animals ormicroscopic plants living within thesoil. Other chapters deal with thegrowth of crops and native plants.
For organisms to grow andmultiply in the soil, they must havefavorable environmental conditions. Anenvironment that favors growth in onegroup of organisms may limit growth inanother group. Some crops rely oninteractions with organisms foroptimum production. When
environmental conditions limit growthof these beneficial organisms, cropyields can suffer. Factors favoringbiological activity include the following:
■ Food supply—soil organic matterand plant residues supply food andenergy for most soil organisms.Terrestrial plants obtain energy fromthe sun but depend on the soil fornutrients.
■ Favorable temperature—eachorganism has an optimumtemperature range, above or belowwhich its activity diminishes.
■ Aeration—most organisms incropped soils require adequateaeration to supply oxygen.
■ Favorable moisture—all organismsrequire water. If soil is too dry,growth slows, and some organismsmay die. If soil is too wet, aeration isreduced.
■ Favorable pH—Each organism hasan optimum pH range in which itfunctions best. Some prefer acidsoils, but most do best in neutral orslightly alkaline soils.
■ Absence of toxic substances—soilmust be free of toxic substances fororganisms to thrive. Some organismsproduce toxins to help themcompete with other organisms.People also introduce potentiallytoxic substances such as pesticides,heavy metals, salts and gases. Someare added deliberately, othersinadvertently.
65
Biological properties of soil
C H A P T E R
7
C-7 10/18/05 11:12 AM Page 65
Soil faunaFauna refers to animals, including
insects, as opposed to flora or plant life.The main groups include arthropods,mollusks, earthworms, protozoa,nematodes, and mammals.
ArthropodsThese invertebrate organisms
include insects, spiders, andcrustaceans. Arthropods have a jointedbody and limbs and a hard (chitinous)shell. Microscopic forms important insoils include springtails and mites—both of which feed on fungi. Somemites also feed on other soil animals.
Larger arthropods include woodlice, centipedes, millipedes, beetles andother insects, and spiders. Wood licefeed on decaying plant material and areactive in soil too dry for earthworms.Centipedes are predators on other soilfauna. Millipedes feed on decayinglitter, although some feed on roots ofliving plants. A wide range of insectsinhabit soil. Most insects burrow, anactivity that often improves aerationand water infiltration. Some are moreimportant in the larval stages.Wireworms, for example, are the larvalform of certain beetles and feed on plantroots. Ants feed on green vegetation,other fauna, and some species feed onseeds. In tropical and subtropical soils,termites are prominent in consumingdead plant remains. Some species arenotorious for building huge moundsand destroying timber in buildings.
MollusksImportant soil mollusks include
slugs and snails. Slugs feed on dead ordamaged vegetation. Some feed onsucculent fruits and vegetables growingon or near the soil surface. A few speciesof snails help to decompose plant matter
by digesting cellulose, the material thatmakes up cell walls of plants.
EarthwormsEarthworms are very important in
mixing soil and incorporating dead ordecaying plant remains. They have avoracious appetite, consuming as muchas 80 times their body weight of foodper day. Their burrowing activityimproves aeration, water infiltration,and drainage. They are most numerousin undisturbed areas such as no-tillcorn fields, pastures, and deciduousforests where there is an abundantsupply of litter and burrows are notdisrupted by tillage. Some 1 to 1.5million earthworms per acre werefound in two productive Danish forestsoils. Collectively, they weighed in at1500 to 1750 pounds per acre. In anEnglish apple orchard, an average of15.5 earthworm burrows per squareyard were found. This was estimated tobe equivalent to one 1.4-inch drainagepipe per square yard.
Protozoa Protozoa are microscopic one-
celled animals abundant in soils. Mostprotozoa feed on soil fauna such asbacteria and other protozoa. Somebacteria apparently have a symbioticrelationship with predatory protozoa.Soil protozoa live in the film of watersurrounding soil particles. Protozoahave different ways of surviving dryperiods: most form cysts while othersgo into a state of suspended animation.They revive quickly when moisturereturns.
NematodesNematodes or eelworms are
microscopic worms. Many speciesparasitize plant roots. Not allnematodes are parasites: some free-living species feed on bacteria,protozoa, and other nematodes.
Mammals Mammals burrow into soil for
shelter, mixing soil and promotingaeration. They influence a relativelysmall portion of the total root zone.Some feed on plant roots or eat seeds,damaging crops. Mammals ofimportance in soil include badgers,chipmunks, gophers, ground squirrels,mice, moles, prairie dogs, rabbits,shrews, and voles.
Soil floraFour principal groups of
microscopic plants in soil are the algae,bacteria, actinomycetes, and fungi.
AlgaeAlgae are the most numerous and
widely distributed of green plants,excluding flowering plants. Thesemulticellular organisms are found infresh water, sea water, on land, in hotsprings, and on arctic snows. They arethe primary food of aquatic animals.Most species are photosynthetic,producing food from carbon dioxide(CO2) with energy from light.Therefore, they are important only nearthe soil surface where light is adequate.They are of greater significance inaquatic environments such as ricepaddies and swamps. A gram of fertilesoil contains 1,000 to 500,000 algae.
BacteriaBacteria are one-celled organisms
and occur in a wide variety of species.Fertile soils may contain over500 million bacteria per gram(400 pounds per acre). They are activein organic matter decomposition andmineral transformations. Bacterialpopulations increase rapidly when food(fresh organic residues) is available,then decline as the supply runs out.
M A N A G E M E N T O F W I S C O N S I N S O I L S66
C-7 10/18/05 11:12 AM Page 66
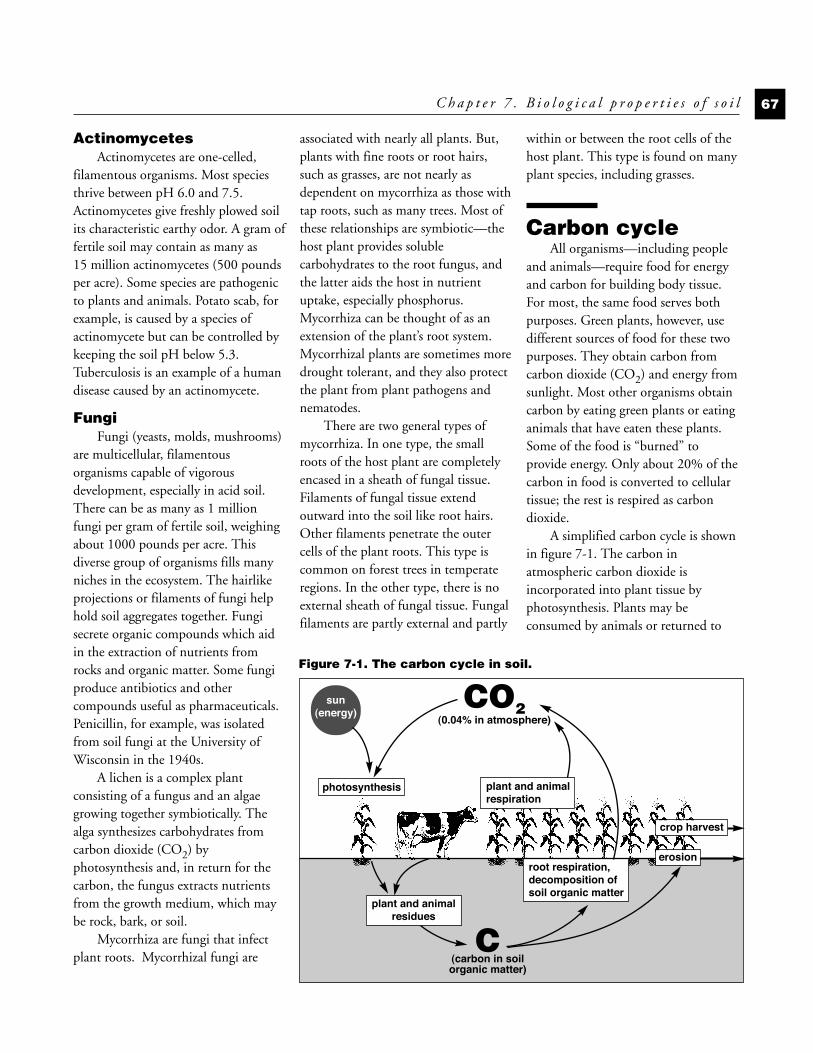
ActinomycetesActinomycetes are one-celled,
filamentous organisms. Most speciesthrive between pH 6.0 and 7.5.Actinomycetes give freshly plowed soilits characteristic earthy odor. A gram offertile soil may contain as many as15 million actinomycetes (500 poundsper acre). Some species are pathogenicto plants and animals. Potato scab, forexample, is caused by a species ofactinomycete but can be controlled bykeeping the soil pH below 5.3.Tuberculosis is an example of a humandisease caused by an actinomycete.
FungiFungi (yeasts, molds, mushrooms)
are multicellular, filamentousorganisms capable of vigorousdevelopment, especially in acid soil.There can be as many as 1 millionfungi per gram of fertile soil, weighingabout 1000 pounds per acre. Thisdiverse group of organisms fills manyniches in the ecosystem. The hairlikeprojections or filaments of fungi helphold soil aggregates together. Fungisecrete organic compounds which aidin the extraction of nutrients fromrocks and organic matter. Some fungiproduce antibiotics and othercompounds useful as pharmaceuticals.Penicillin, for example, was isolatedfrom soil fungi at the University ofWisconsin in the 1940s.
A lichen is a complex plantconsisting of a fungus and an algaegrowing together symbiotically. Thealga synthesizes carbohydrates fromcarbon dioxide (CO2) byphotosynthesis and, in return for thecarbon, the fungus extracts nutrientsfrom the growth medium, which maybe rock, bark, or soil.
Mycorrhiza are fungi that infectplant roots. Mycorrhizal fungi are
associated with nearly all plants. But,plants with fine roots or root hairs,such as grasses, are not nearly asdependent on mycorrhiza as those withtap roots, such as many trees. Most ofthese relationships are symbiotic—thehost plant provides solublecarbohydrates to the root fungus, andthe latter aids the host in nutrientuptake, especially phosphorus.Mycorrhiza can be thought of as anextension of the plant’s root system.Mycorrhizal plants are sometimes moredrought tolerant, and they also protectthe plant from plant pathogens andnematodes.
There are two general types ofmycorrhiza. In one type, the smallroots of the host plant are completelyencased in a sheath of fungal tissue.Filaments of fungal tissue extendoutward into the soil like root hairs.Other filaments penetrate the outercells of the plant roots. This type iscommon on forest trees in temperateregions. In the other type, there is noexternal sheath of fungal tissue. Fungalfilaments are partly external and partly
within or between the root cells of thehost plant. This type is found on manyplant species, including grasses.
Carbon cycleAll organisms—including people
and animals—require food for energyand carbon for building body tissue.For most, the same food serves bothpurposes. Green plants, however, usedifferent sources of food for these twopurposes. They obtain carbon fromcarbon dioxide (CO2) and energy fromsunlight. Most other organisms obtaincarbon by eating green plants or eatinganimals that have eaten these plants.Some of the food is “burned” toprovide energy. Only about 20% of thecarbon in food is converted to cellulartissue; the rest is respired as carbondioxide.
A simplified carbon cycle is shownin figure 7-1. The carbon inatmospheric carbon dioxide isincorporated into plant tissue byphotosynthesis. Plants may beconsumed by animals or returned to
C h a p t e r 7 . B i o l o g i c a l p r o p e r t i e s o f s o i l 67
Figure 7-1. The carbon cycle in soil.
sun(energy)
CO2(0.04% in atmosphere)
C(carbon in soilorganic matter)
root respiration,decomposition ofsoil organic matter
plant and animalresidues
erosion
crop harvest
photosynthesis plant and animalrespiration
C-7 10/18/05 11:12 AM Page 67
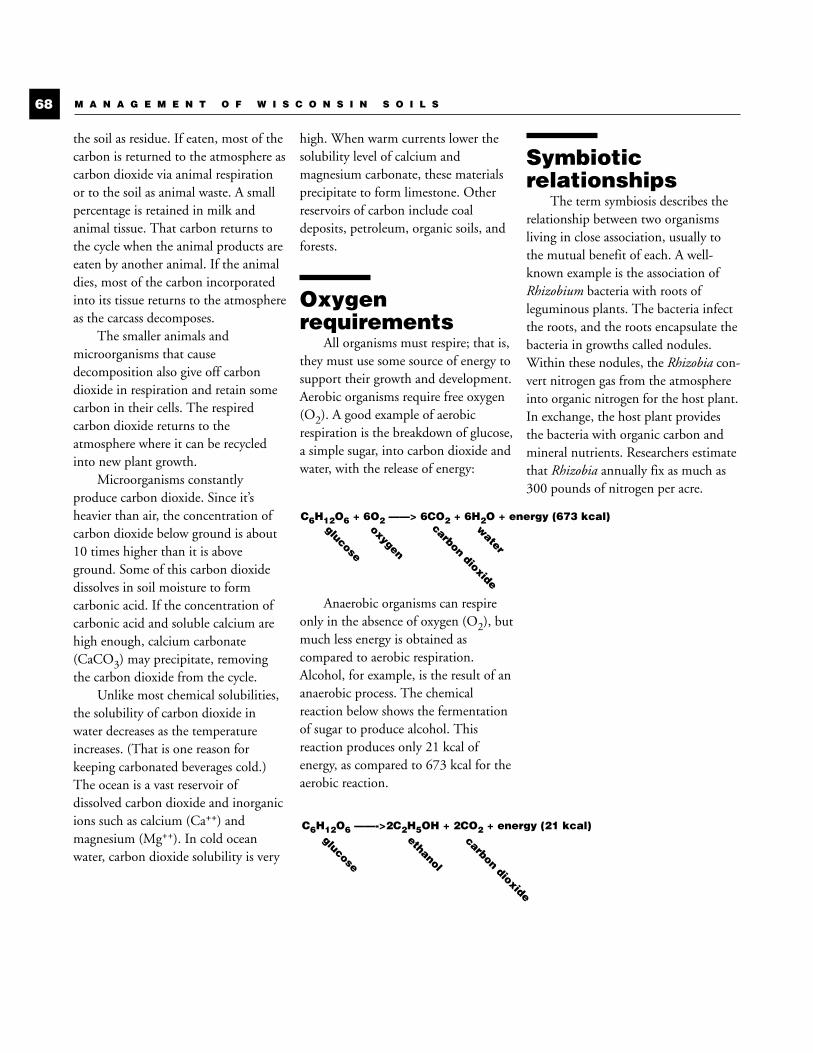
the soil as residue. If eaten, most of thecarbon is returned to the atmosphere ascarbon dioxide via animal respirationor to the soil as animal waste. A smallpercentage is retained in milk andanimal tissue. That carbon returns tothe cycle when the animal products areeaten by another animal. If the animaldies, most of the carbon incorporatedinto its tissue returns to the atmosphereas the carcass decomposes.
The smaller animals andmicroorganisms that causedecomposition also give off carbondioxide in respiration and retain somecarbon in their cells. The respiredcarbon dioxide returns to theatmosphere where it can be recycledinto new plant growth.
Microorganisms constantlyproduce carbon dioxide. Since it’sheavier than air, the concentration ofcarbon dioxide below ground is about10 times higher than it is aboveground. Some of this carbon dioxidedissolves in soil moisture to formcarbonic acid. If the concentration ofcarbonic acid and soluble calcium arehigh enough, calcium carbonate(CaCO3) may precipitate, removingthe carbon dioxide from the cycle.
Unlike most chemical solubilities,the solubility of carbon dioxide inwater decreases as the temperatureincreases. (That is one reason forkeeping carbonated beverages cold.)The ocean is a vast reservoir ofdissolved carbon dioxide and inorganicions such as calcium (Ca++) andmagnesium (Mg++). In cold oceanwater, carbon dioxide solubility is very
high. When warm currents lower thesolubility level of calcium andmagnesium carbonate, these materialsprecipitate to form limestone. Otherreservoirs of carbon include coaldeposits, petroleum, organic soils, andforests.
Oxygenrequirements
All organisms must respire; that is,they must use some source of energy tosupport their growth and development.Aerobic organisms require free oxygen(O2). A good example of aerobicrespiration is the breakdown of glucose,a simple sugar, into carbon dioxide andwater, with the release of energy:
Anaerobic organisms can respireonly in the absence of oxygen (O2), butmuch less energy is obtained ascompared to aerobic respiration.Alcohol, for example, is the result of ananaerobic process. The chemicalreaction below shows the fermentationof sugar to produce alcohol. Thisreaction produces only 21 kcal ofenergy, as compared to 673 kcal for theaerobic reaction.
Symbioticrelationships
The term symbiosis describes therelationship between two organismsliving in close association, usually tothe mutual benefit of each. A well-known example is the association ofRhizobium bacteria with roots ofleguminous plants. The bacteria infectthe roots, and the roots encapsulate thebacteria in growths called nodules.Within these nodules, the Rhizobia con-vert nitrogen gas from the atmosphereinto organic nitrogen for the host plant.In exchange, the host plant providesthe bacteria with organic carbon andmineral nutrients. Researchers estimatethat Rhizobia annually fix as much as300 pounds of nitrogen per acre.
M A N A G E M E N T O F W I S C O N S I N S O I L S68
C6H12O6 + 6O2 ——> 6CO2 + 6H2O + energy (673 kcal)
C6H12O6 ——->2C2H5OH + 2CO2 + energy (21 kcal)
glucose
oxygen
carbon dioxide
glucose
ethanol
carbon dioxide
water
C-7 10/18/05 11:12 AM Page 68
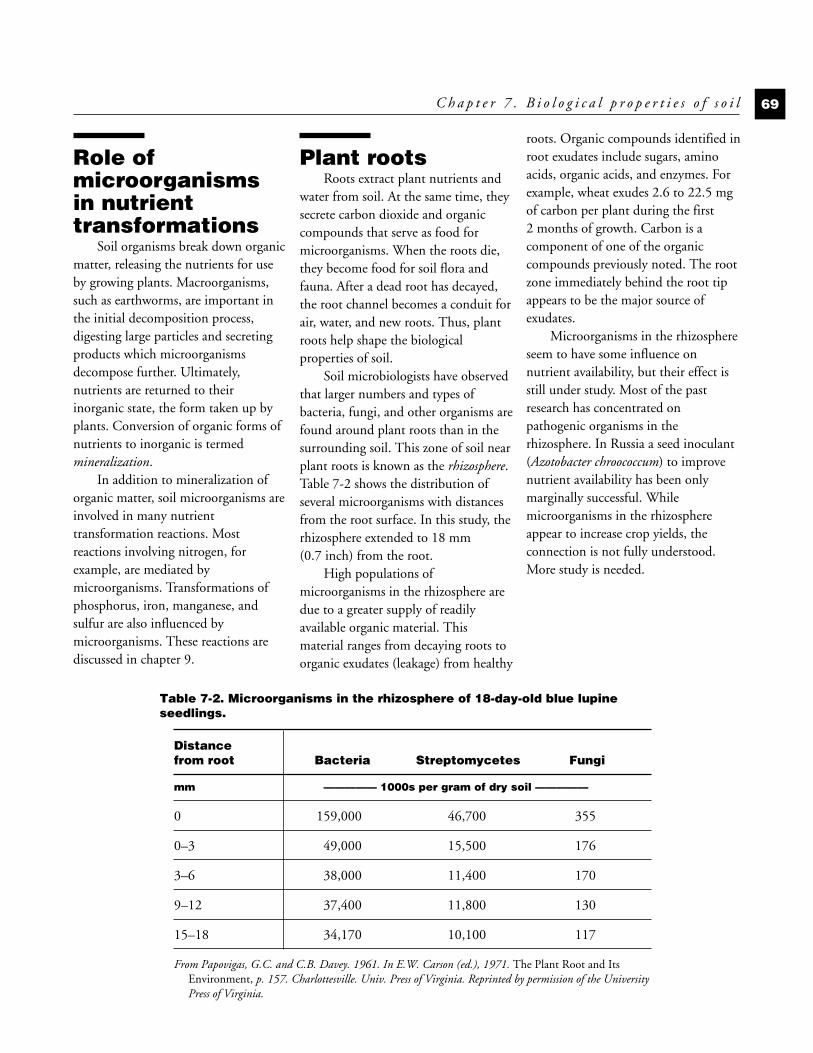
Role ofmicroorganismsin nutrienttransformations
Soil organisms break down organicmatter, releasing the nutrients for useby growing plants. Macroorganisms,such as earthworms, are important inthe initial decomposition process,digesting large particles and secretingproducts which microorganismsdecompose further. Ultimately,nutrients are returned to theirinorganic state, the form taken up byplants. Conversion of organic forms ofnutrients to inorganic is termedmineralization.
In addition to mineralization oforganic matter, soil microorganisms areinvolved in many nutrienttransformation reactions. Mostreactions involving nitrogen, forexample, are mediated bymicroorganisms. Transformations ofphosphorus, iron, manganese, andsulfur are also influenced bymicroorganisms. These reactions arediscussed in chapter 9.
Plant rootsRoots extract plant nutrients and
water from soil. At the same time, theysecrete carbon dioxide and organiccompounds that serve as food formicroorganisms. When the roots die,they become food for soil flora andfauna. After a dead root has decayed,the root channel becomes a conduit forair, water, and new roots. Thus, plantroots help shape the biologicalproperties of soil.
Soil microbiologists have observedthat larger numbers and types ofbacteria, fungi, and other organisms arefound around plant roots than in thesurrounding soil. This zone of soil nearplant roots is known as the rhizosphere.Table 7-2 shows the distribution ofseveral microorganisms with distancesfrom the root surface. In this study, therhizosphere extended to 18 mm(0.7 inch) from the root.
High populations ofmicroorganisms in the rhizosphere aredue to a greater supply of readilyavailable organic material. Thismaterial ranges from decaying roots toorganic exudates (leakage) from healthy
roots. Organic compounds identified inroot exudates include sugars, aminoacids, organic acids, and enzymes. Forexample, wheat exudes 2.6 to 22.5 mgof carbon per plant during the first2 months of growth. Carbon is acomponent of one of the organiccompounds previously noted. The rootzone immediately behind the root tipappears to be the major source ofexudates.
Microorganisms in the rhizosphereseem to have some influence onnutrient availability, but their effect isstill under study. Most of the pastresearch has concentrated onpathogenic organisms in therhizosphere. In Russia a seed inoculant(Azotobacter chroococcum) to improvenutrient availability has been onlymarginally successful. Whilemicroorganisms in the rhizosphereappear to increase crop yields, theconnection is not fully understood.More study is needed.
C h a p t e r 7 . B i o l o g i c a l p r o p e r t i e s o f s o i l 69
Table 7-2. Microorganisms in the rhizosphere of 18-day-old blue lupineseedlings.
Distancefrom root Bacteria Streptomycetes Fungi
mm ————— 1000s per gram of dry soil —————
0 159,000 46,700 355
0–3 49,000 15,500 176
3–6 38,000 11,400 170
9–12 37,400 11,800 130
15–18 34,170 10,100 117
From Papovigas, G.C. and C.B. Davey. 1961. In E.W. Carson (ed.), 1971. The Plant Root and ItsEnvironment, p. 157. Charlottesville. Univ. Press of Virginia. Reprinted by permission of the UniversityPress of Virginia.
C-7 10/18/05 11:12 AM Page 69
Questions1. What benefits result from the
decomposition of crop residue andanimal wastes?
2. List six factors favoring biologicalactivity in soil.
3. Name ten species of fauna that youhave observed in soil.
4. Name at least three useful purposesserved by earthworms.
5. In leguminous crops such asalfalfa, the crop benefits from itsassociation with Rhizobiumbacteria by receiving organicnitrogen fixed from atmosphericnitrogen by the bacteria. How dothe bacteria benefit from thismutual association?
6. Why are alfalfa, soybean, and otherleguminous plant seeds usuallyinoculated? What is in theinoculant that is beneficial to thesecrops, and how does it work?
7. A culture of photosynthetic blue-green algae is sold for applicationto soil. The seller claims thatadding these algae will reduce theneed for fertilizer. Would you buythis product? Why?
8. What are mycorrhiza? How dothey benefit plants?
9. Define mineralization. Why is itnecessary?
10.Organic soils (mucks and peats)subside when they are drained andfarmed. Mineral soils do notsubside. Explain why thisdifference occurs.
M A N A G E M E N T O F W I S C O N S I N S O I L S70
C-7 10/18/05 11:12 AM Page 70
“Each seed joined the earth,entered into some mysteriouspartnership with soil, water,air and sun and began togrow and become part of theliving land.”
Ben Logan, The Land Remembers, 1975
Essential plantnutrients
Green plants have the uniqueability to make everything they need tosustain growth from water, light, air,and an adequate supply of 17 essentialelements. Lack of any one of theseelements will hinder growth. Plants getcarbon, hydrogen, and oxygen from airand water. The remaining 14 elementscome from the soil (although they alsoreceive small amounts of nitrogen andsulfur from the atmosphere). Table 8-1lists all of the essential elements, theforms taken up by plants, their primarysource, their approximate concentrationin plants, and amounts in soil.
A plant nutrient is consideredessential when a deficiency of theelement makes it impossible for theplant to complete its life cycle, whenthe deficiency cannot be corrected bysubstituting another element, andwhen the element is needed by a widevariety of species from many differentplant families.
Of the 14 essential elementsavailable from the soil, six—nitrogen,phosphorus, potassium, calcium,magnesium, sulfur—are required inrelatively large amounts. Nitrogen,phosphorus, and potassium are themost commonly deficient nutrients andare sometimes referred to as the primarynutrients. Calcium, magnesium, andsulfur are often added incidentally in
lime, commercial fertilizers, or livestockmanure and are not often deficient insoil. They are called secondary nutrients.The remaining elements—boron,chlorine, copper, iron, manganese,molybdenum, nickel, and zinc—areneeded by plants in very smallquantities, hence they are calledmicronutrients or trace elements.
The terms primary, secondary, andmicro or trace have nothing to do withthe importance of a nutrient in cropproduction. The lack of any one willreduce crop yield. This concept isstated in the Law of the Minimum,which says that the growth of a plantwill be limited by the nutrient presentin the least amount relative to itsrequirement.
Carbon, hydrogen, and oxygentogether make up approximately 94%of the dry weight of plants, yet they arerarely deficient. Sometimes a lack ofoxygen in poorly drained soils limitsyields, but this is remedied by drainage,not by adding oxygen. Rapidly growinggreenhouse crops sometimes respond toan atmosphere enriched with carbondioxide, but adding carbon dioxide to afield has never proven to beeconomically beneficial. Most of soilfertility, therefore, deals with the14 remaining elements which make upapproximately 6% of the dry weight ofplants.
71
Soil chemistryand plant nutrition
C H A P T E R
8
C-8 10/18/05 11:13 AM Page 71
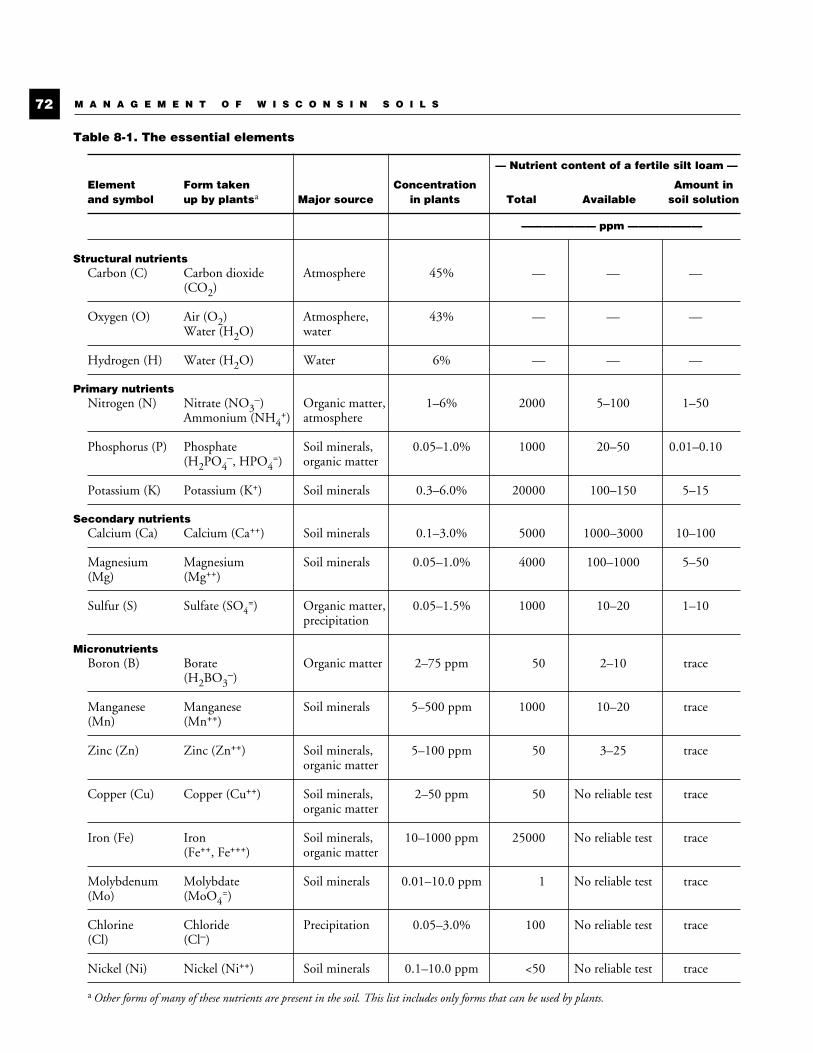
M A N A G E M E N T O F W I S C O N S I N S O I L S72
Table 8-1. The essential elements
— Nutrient content of a fertile silt loam —
Element Form taken Concentration Amount inand symbol up by plantsa Major source in plants Total Available soil solution
——————— ppm ———————
Structural nutrientsCarbon (C) Carbon dioxide Atmosphere 45% — — —
(CO2)
Oxygen (O) Air (O2) Atmosphere, 43% — — —Water (H2O) water
Hydrogen (H) Water (H2O) Water 6% — — —
Primary nutrientsNitrogen (N) Nitrate (NO3
–) Organic matter, 1–6% 2000 5–100 1–50Ammonium (NH4
+) atmosphere
Phosphorus (P) Phosphate Soil minerals, 0.05–1.0% 1000 20–50 0.01–0.10(H2PO4
–, HPO4=) organic matter
Potassium (K) Potassium (K+) Soil minerals 0.3–6.0% 20000 100–150 5–15
Secondary nutrientsCalcium (Ca) Calcium (Ca++) Soil minerals 0.1–3.0% 5000 1000–3000 10–100
Magnesium Magnesium Soil minerals 0.05–1.0% 4000 100–1000 5–50(Mg) (Mg++)
Sulfur (S) Sulfate (SO4=) Organic matter, 0.05–1.5% 1000 10–20 1–10
precipitation
MicronutrientsBoron (B) Borate Organic matter 2–75 ppm 50 2–10 trace
(H2BO3–)
Manganese Manganese Soil minerals 5–500 ppm 1000 10–20 trace(Mn) (Mn++)
Zinc (Zn) Zinc (Zn++) Soil minerals, 5–100 ppm 50 3–25 traceorganic matter
Copper (Cu) Copper (Cu++) Soil minerals, 2–50 ppm 50 No reliable test traceorganic matter
Iron (Fe) Iron Soil minerals, 10–1000 ppm 25000 No reliable test trace(Fe++, Fe+++) organic matter
Molybdenum Molybdate Soil minerals 0.01–10.0 ppm 1 No reliable test trace(Mo) (MoO4
=)
Chlorine Chloride Precipitation 0.05–3.0% 100 No reliable test trace(Cl) (Cl–)
Nickel (Ni) Nickel (Ni++) Soil minerals 0.1–10.0 ppm <50 No reliable test trace
a Other forms of many of these nutrients are present in the soil. This list includes only forms that can be used by plants.
C-8 10/18/05 11:13 AM Page 72

Non-essentialelements
An essential plant nutrient is onethat is required for life, whereas a non-essential plant nutrient can increasecrop yield, but its absence will notcause the plant to die. Enhancing, orbeneficial, non-essential elements cancompensate for toxic effects of otherelements or may replace mineralnutrients in some other function.Examples of non-essential elementsinclude aluminum, cadmium, cobalt,lead, mercury, selenium, silicon, andsodium.
Beneficial elements have not beendeemed essential for all plants but maybe essential for some. The distinctionbetween beneficial and essential is oftendifficult in the case of some traceelements. Cobalt for instance isessential for nitrogen fixation inlegumes. Silicon, deposited in cellwalls, has been found to improve heatand drought tolerance and increaseresistance to insects and fungalinfections. Silicon, acting as a beneficialelement, can help compensate for toxiclevels of manganese, iron, phosphorus,and aluminum as well as zincdeficiency. A more holistic approach toplant nutrition would not be limited tonutrients essential to survival butwould include mineral elements atlevels beneficial for optimum growth.The list of essential elements may wellincrease in the future to includenutrients that are currently considerednon-essential.
Some non-essential elements canbecome toxic to plants, animals, andhumans at high concentrations. Furtherdiscussion on the toxicity potential ofnon-essential elements can be found inchapter 11.
Properties ofchemicalelements, atoms,ions, and salts
Chemical elements are substancesthat ordinarily cannot be decomposedor changed into simpler substances.Nitrogen, phosphorus, and potassiumare all chemical elements. An atom isthe smallest particle of an elementwhich has the physical and chemicalcharacteristics of that element. Atomsare electrically neutral. However, manyatoms gain or lose electrons (negativelycharged particles) and becomeelectrically charged ions. If an atom orgroup of atoms loses one or moreelectrons, it becomes a positivelycharged ion called a cation. If an atomor group of atoms gains one or moreelectrons, it becomes a negatively
charged ion called an anion.Ions with the same charge repel
one another; ions with opposite chargesattract one another to form a chemicalbond. This is very similar to the waylike poles of magnets repel each other,while opposite poles of magnets attracteach other. This relationship is shownin figure 8-1. The compounds formedby the chemical bonds between positiveand negative ions are termed salts. Ifthese salts have a definite crystallinestructure, they are called minerals.
There is always an attractionbetween positively and negativelycharged ions. However, the intensity ofthe attraction depends on the ions. Forsome salts this attraction is overcomeby interaction with water molecules. Asa result, these salts dissolve easily andreadily go into the soil solution. Thesesalts are described as being soluble.Potassium chloride (KCl) and
C h a p t e r 8 . S o i l c h e m i s t r y a n d p l a n t n u t r i t i o n 73
+ – – +➡➡➡
➡➡➡
Like poles of magnets repel each other.
➡➡➡
➡➡➡
Ions and soil particles with like charges repel each other.
— — soil particle
Opposite poles of magnets attract each other.
➡➡➡
➡➡➡
Ions and soil particles with opposite charges attract each other.
+ —soil particle
➡➡➡
➡➡➡
+ – + –
Figure 8-1. Attractive and repulsive forces between chemicalions and soil particles are similar to the forces which repel orattract the opposite or like poles of bar magnets.
C-8 10/18/05 11:13 AM Page 73
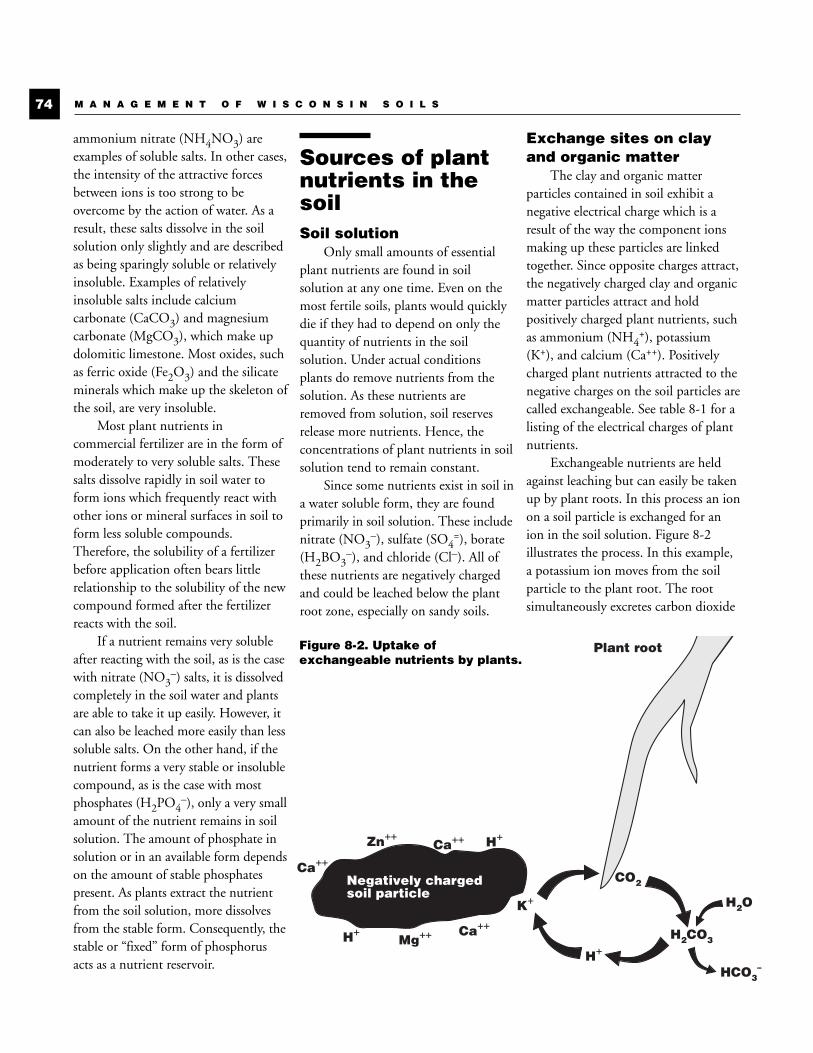
ammonium nitrate (NH4NO3) areexamples of soluble salts. In other cases,the intensity of the attractive forcesbetween ions is too strong to beovercome by the action of water. As aresult, these salts dissolve in the soilsolution only slightly and are describedas being sparingly soluble or relativelyinsoluble. Examples of relativelyinsoluble salts include calciumcarbonate (CaCO3) and magnesiumcarbonate (MgCO3), which make updolomitic limestone. Most oxides, suchas ferric oxide (Fe2O3) and the silicateminerals which make up the skeleton ofthe soil, are very insoluble.
Most plant nutrients incommercial fertilizer are in the form ofmoderately to very soluble salts. Thesesalts dissolve rapidly in soil water toform ions which frequently react withother ions or mineral surfaces in soil toform less soluble compounds.Therefore, the solubility of a fertilizerbefore application often bears littlerelationship to the solubility of the newcompound formed after the fertilizerreacts with the soil.
If a nutrient remains very solubleafter reacting with the soil, as is the casewith nitrate (NO3
–) salts, it is dissolvedcompletely in the soil water and plantsare able to take it up easily. However, itcan also be leached more easily than lesssoluble salts. On the other hand, if thenutrient forms a very stable or insolublecompound, as is the case with mostphosphates (H2PO4
–), only a very smallamount of the nutrient remains in soilsolution. The amount of phosphate insolution or in an available form dependson the amount of stable phosphatespresent. As plants extract the nutrientfrom the soil solution, more dissolvesfrom the stable form. Consequently, thestable or “fixed” form of phosphorusacts as a nutrient reservoir.
Sources of plantnutrients in thesoilSoil solution
Only small amounts of essentialplant nutrients are found in soilsolution at any one time. Even on themost fertile soils, plants would quicklydie if they had to depend on only thequantity of nutrients in the soilsolution. Under actual conditionsplants do remove nutrients from thesolution. As these nutrients areremoved from solution, soil reservesrelease more nutrients. Hence, theconcentrations of plant nutrients in soilsolution tend to remain constant.
Since some nutrients exist in soil ina water soluble form, they are foundprimarily in soil solution. These includenitrate (NO3
–), sulfate (SO4=), borate
(H2BO3–), and chloride (Cl–). All of
these nutrients are negatively chargedand could be leached below the plantroot zone, especially on sandy soils.
Exchange sites on clayand organic matter
The clay and organic matterparticles contained in soil exhibit anegative electrical charge which is aresult of the way the component ionsmaking up these particles are linkedtogether. Since opposite charges attract,the negatively charged clay and organicmatter particles attract and holdpositively charged plant nutrients, suchas ammonium (NH4
+), potassium(K+), and calcium (Ca++). Positivelycharged plant nutrients attracted to thenegative charges on the soil particles arecalled exchangeable. See table 8-1 for alisting of the electrical charges of plantnutrients.
Exchangeable nutrients are heldagainst leaching but can easily be takenup by plant roots. In this process an ionon a soil particle is exchanged for anion in the soil solution. Figure 8-2illustrates the process. In this example,a potassium ion moves from the soilparticle to the plant root. The rootsimultaneously excretes carbon dioxide
M A N A G E M E N T O F W I S C O N S I N S O I L S74
Plant root
H+
Negatively charged soil particle
H+
K+
Ca++Zn++
Ca++
H+Mg++ Ca++
CO2
H2O
H2CO3
HCO3–
Figure 8-2. Uptake ofexchangeable nutrients by plants.
C-8 10/18/05 11:13 AM Page 74

(CO2) into the soil solution as part ofrespiration. The carbon dioxide reactswith water (H2O) to form carbonicacid (H2CO3), an unstable compoundwhich splits into a hydrogen ion (H+)and a bicarbonate ion (HCO3
–). Thehydrogen ion moves to the negativelycharged surface of the soil particle toreplace the potassium ion. Thus, onepositively charged ion is exchanged foranother positively charged ion. If acalcium ion (Ca++) had been exchangedinstead of potassium, two hydrogenions would be required because thecalcium ion fills two negative chargeson the soil particle.
Exchangeable nutrients are a veryimportant reservoir of plant nutrientsin soil. Nearly all of the ammonium,potassium, calcium, and magnesiumused by plants comes from theexchangeable form. Exchangeablenutrients are readily available to plantsand, at the same time, are essentiallynon-leachable. Soils cannot hold anunlimited quantity of positivelycharged ions. The amount of cations asoil can hold can be measured and isknown as the cation exchange capacity(CEC). Silty and clayey soils, forinstance, will hold anywhere from 3 to10 times more positively charged ionsthan sandy soils. However, even thesands have sufficient “exchangecapacity” to hold all of the positivelycharged plant nutrients needed byplants in an available but relativelynon-leachable form.
Complexed or chelatednutrients
Certain types of positively chargedions are held very tightly by the organicmatter—much more tightly thanexchangeable ions are held. They aresaid to be complexed or chelated.Copper (Cu++) and zinc (Zn++) are twonutrients that are usually held aschelates. As noted in chapter 1, thename chelate comes from the Greekword chele meaning claw. This term isquite descriptive as the positivelycharged ions are literally held in thecenter of a negatively charged claw.
Decomposition of organicmatter
In addition to holding availableplant nutrients in an exchangeableform, organic matter suppliespreviously unavailable nutrients whenit is decomposed. Crop residues,manure, and other organic materialscontain considerable amounts ofnitrogen, phosphorus, and sulfur andare a good source of mostmicronutrients, particularly boron(table 8-1). Organic matter is animportant reservoir of these nutrients,but organic forms of nutrients generallycannot be used by plants. In order tochange or mineralize these nutrientsfrom an organic form (unavailable) toan inorganic form (available), theorganic matter must be decomposed bysoil microorganisms.
Soil microorganisms aremicroscopic living organisms which arevery sensitive to their environment. Ingeneral, organic matter decompositionis hastened when:
■ The soil temperature is 75° to 90°F.(Microbial activity is very slow attemperatures below 50°F anddecreases above 90°F.)
■ Moderate, but not excessive amountsof soil moisture are present.
■ The soil pH is above 6.0.
■ The soil is well-aerated. (Decompo-sition is much slower in waterloggedsoils because of a lack of oxygen.)
In Wisconsin, organic matter maydecompose slowly in the spring becausemany of our soils remain cool and wet.Therefore, the reserves of nitrogen andphosphorus often are not released fastenough to take care of the early growthof a spring-seeded crop. For this reasonstarter fertilizer is nearly alwaysrecommended for corn and other rowcrops even on fertile soils that couldotherwise supply sufficient plantnutrients.
Low-solubility compounds Some plant nutrients react with
ions in the soil to form extremely stablecompounds. These compounds havevery low solubilities in water. Plantnutrients which form this type ofcompound are phosphorus (H2PO4
–),molybdate (MoO4
=), iron (Fe+++) and,in calcareous soils, manganese (Mn++).Because of the low solubilities of thesecompounds, the concentrations ofthese nutrients in soil solution are verylow. Even though it is quite insoluble,the surface of a stable compound doesact as a nutrient reservoir. When plantsremove a nutrient like phosphate fromsoil solution, some of the phosphate onthe surface of the stable phosphatecompound will dissolve. Thus, theconcentration of phosphate in solutiontends to remain constant. Because ofthe low concentrations in the soilsolution, leaching is rarely a problemwith these nutrients.
C h a p t e r 8 . S o i l c h e m i s t r y a n d p l a n t n u t r i t i o n 75
C-8 10/18/05 11:13 AM Page 75
Soil rocks and mineralsLarge amounts of many plant
nutrients are found in soil rocks andminerals. However, these nutrients areconsidered to be unavailable becausethey are released much too slowly tosupport plant growth. Good evidencefor this is the fact that a soil low inavailable potassium (less than 100 ppm)may contain as much as 20,000 ppm oftotal potassium (table 8-1).
What constitutesa fertile soil
A fertile soil is one that hassufficient reserves to maintain a highenough concentration of nutrients insoil solution to permit optimum plantgrowth throughout the growing season.An infertile soil cannot maintain asufficient concentration of plantnutrients in the soil solution, reducingplant growth and, consequently, cropyields. For example, the nutrientreservoir in sandy soils is often quitesmall because these soils contain verylittle clay or organic matter ascompared to silty soils. This is onereason why sandy soils are often lessfertile than silty soils.
Questions1. List the 17 essential elements and
the form each is taken in by plants.Why are these elements said to beessential?
2. Soil fertility deals mainly with14 nutrients that make up only5 to 10% of the dry weight ofplants. The other three essentialnutrients are mostly ignored.Explain.
3. Define the following:
a. atom
b. element
c. anion
d. cation
e. acid
f. base
g. salt
h. mineral
4. Which primary nutrient—nitrogen, phosphorus, orpotassium—could be leachedbelow the root zone if applied inthe fall?
5. Why do potassium or ammoniumleach less easily than nitrate? Whydo nitrates leach from soil whereasphosphates don’t, even thoughboth are negatively charged ions?
6. Which essential element can betaken up by plant roots both as ananion and as a cation?
7. Describe the types of soils and theconditions under which potassiummay leach into the subsoil.
8. What is the significance of cationexchange capacity in soil? How canthe cation exchange capacity of asoil be increased?
9. The top 7 inches of soil in an acremay contain as much as 4,000 lbof nitrogen, 2,000 lb ofphosphorus, and 40,000 lb ofpotassium, yet the field requiresaddition of these nutrients toobtain good yields. Why?
10.A sandy soil in central Wisconsinand a silt loam in southernWisconsin both test high inavailable phosphorus andpotassium. If these soils arecropped and fertilizer is notapplied, which soil will becomedepleted of its fertility first? Why?
11.Farmers in Wisconsin usually getresponse to starter fertilizer oncorn even when the soil tests highin phosphorus and potassium.Farmers in central Illinois seldomget response to starter fertilizer onhigh testing soils. What is thereason for this difference?
M A N A G E M E N T O F W I S C O N S I N S O I L S76
C-8 10/18/05 11:13 AM Page 76
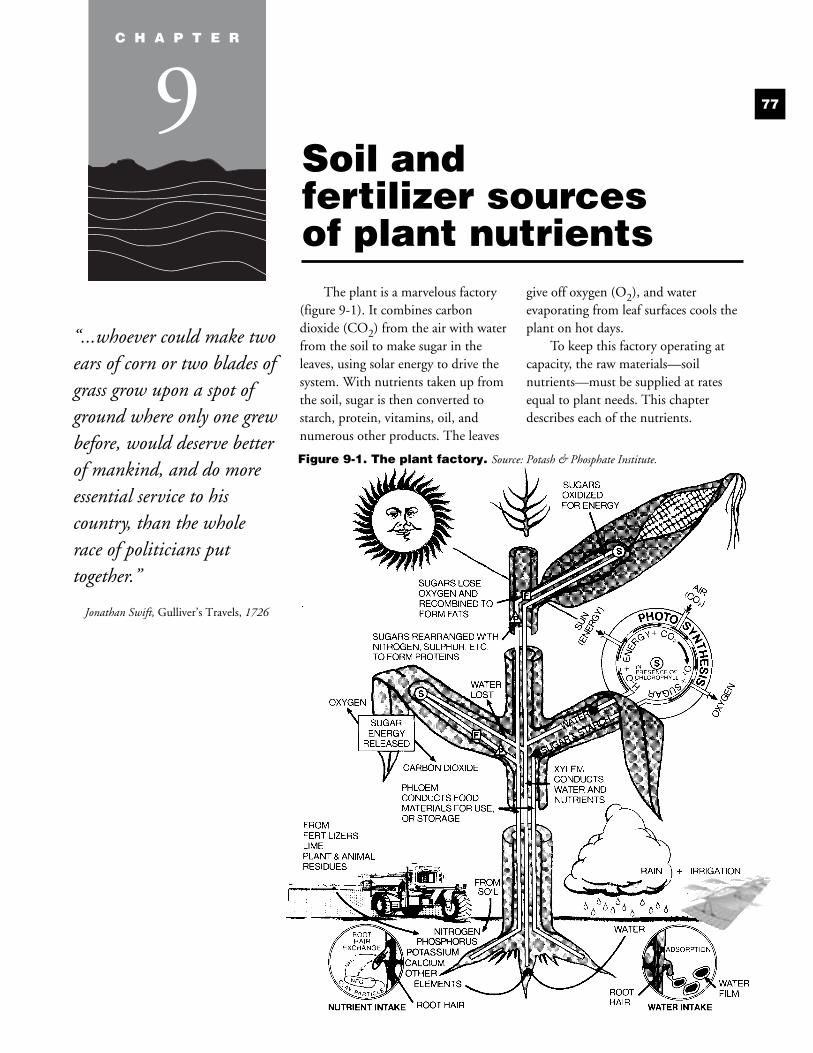
“...whoever could make twoears of corn or two blades ofgrass grow upon a spot ofground where only one grewbefore, would deserve betterof mankind, and do moreessential service to hiscountry, than the wholerace of politicians puttogether.”
Jonathan Swift, Gulliver’s Travels, 1726
The plant is a marvelous factory(figure 9-1). It combines carbondioxide (CO2) from the air with waterfrom the soil to make sugar in theleaves, using solar energy to drive thesystem. With nutrients taken up fromthe soil, sugar is then converted tostarch, protein, vitamins, oil, andnumerous other products. The leaves
give off oxygen (O2), and waterevaporating from leaf surfaces cools theplant on hot days.
To keep this factory operating atcapacity, the raw materials—soilnutrients—must be supplied at ratesequal to plant needs. This chapterdescribes each of the nutrients.
77
Soil and fertilizer sources of plant nutrients
C H A P T E R
9
Figure 9-1. The plant factory. Source: Potash & Phosphate Institute.
C-9 10/18/05 11:14 AM Page 77
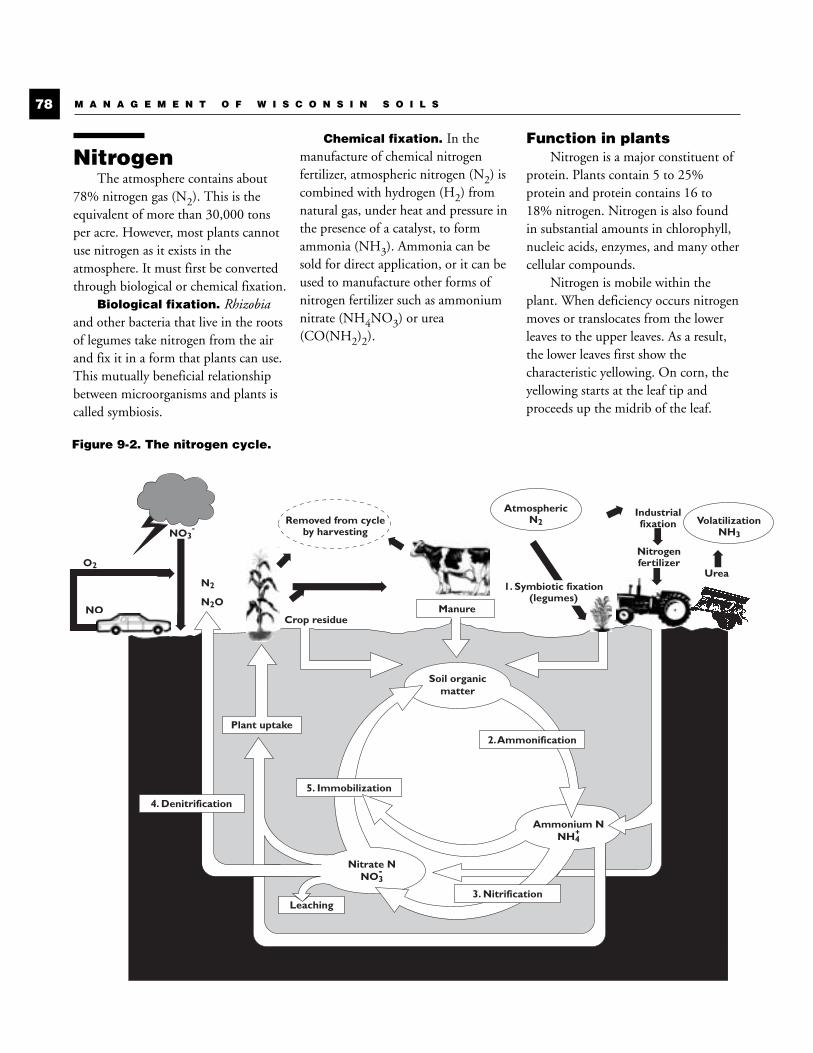
NitrogenThe atmosphere contains about
78% nitrogen gas (N2). This is theequivalent of more than 30,000 tonsper acre. However, most plants cannotuse nitrogen as it exists in theatmosphere. It must first be convertedthrough biological or chemical fixation.
Biological fixation. Rhizobiaand other bacteria that live in the rootsof legumes take nitrogen from the airand fix it in a form that plants can use.This mutually beneficial relationshipbetween microorganisms and plants iscalled symbiosis.
Chemical fixation. In themanufacture of chemical nitrogenfertilizer, atmospheric nitrogen (N2) iscombined with hydrogen (H2) fromnatural gas, under heat and pressure inthe presence of a catalyst, to formammonia (NH3). Ammonia can besold for direct application, or it can beused to manufacture other forms ofnitrogen fertilizer such as ammoniumnitrate (NH4NO3) or urea(CO(NH2)2).
Function in plantsNitrogen is a major constituent of
protein. Plants contain 5 to 25%protein and protein contains 16 to18% nitrogen. Nitrogen is also foundin substantial amounts in chlorophyll,nucleic acids, enzymes, and many othercellular compounds.
Nitrogen is mobile within theplant. When deficiency occurs nitrogenmoves or translocates from the lowerleaves to the upper leaves. As a result,the lower leaves first show thecharacteristic yellowing. On corn, theyellowing starts at the leaf tip andproceeds up the midrib of the leaf.
M A N A G E M E N T O F W I S C O N S I N S O I L S78
➡
Soil organicmatter
Ammonium NNH4
Nitrate NNO3
-
+
Crop residue
Leaching
N2O
N2
Removed from cycleby harvesting ➡
➡
➡
VolatilizationNH3
AtmosphericN2
➡
➡
➡
1. Symbiotic fixation(legumes)
Industrial fixation
Nitrogenfertilizer➡
➡
NO3-
➡
O2
NO
Urea➡
5. Immobilization
2. Ammonification
3. Nitrification
4. Denitrification
Plant uptake
Manure
Figure 9-2. The nitrogen cycle.
C-9 10/18/05 11:14 AM Page 78
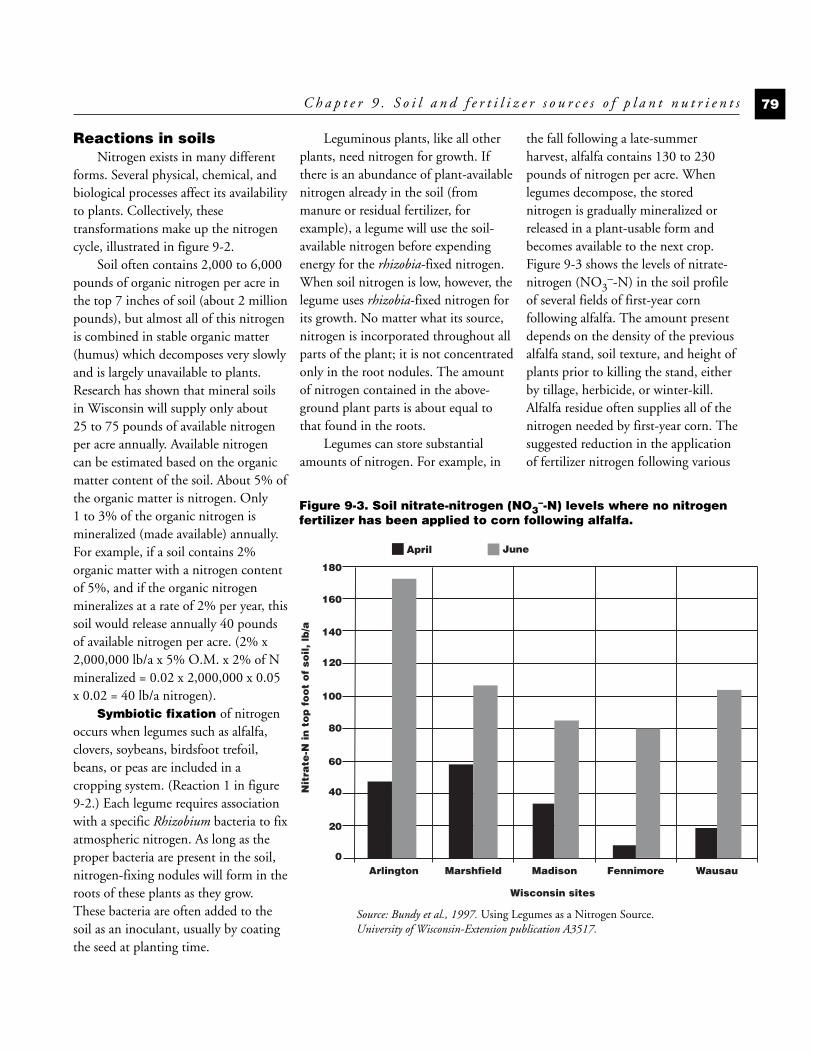
Reactions in soilsNitrogen exists in many different
forms. Several physical, chemical, andbiological processes affect its availabilityto plants. Collectively, thesetransformations make up the nitrogencycle, illustrated in figure 9-2.
Soil often contains 2,000 to 6,000pounds of organic nitrogen per acre inthe top 7 inches of soil (about 2 millionpounds), but almost all of this nitrogenis combined in stable organic matter(humus) which decomposes very slowlyand is largely unavailable to plants.Research has shown that mineral soilsin Wisconsin will supply only about25 to 75 pounds of available nitrogenper acre annually. Available nitrogencan be estimated based on the organicmatter content of the soil. About 5% ofthe organic matter is nitrogen. Only1 to 3% of the organic nitrogen ismineralized (made available) annually.For example, if a soil contains 2%organic matter with a nitrogen contentof 5%, and if the organic nitrogenmineralizes at a rate of 2% per year, thissoil would release annually 40 poundsof available nitrogen per acre. (2% x2,000,000 lb/a x 5% O.M. x 2% of Nmineralized = 0.02 x 2,000,000 x 0.05x 0.02 = 40 lb/a nitrogen).
Symbiotic fixation of nitrogenoccurs when legumes such as alfalfa,clovers, soybeans, birdsfoot trefoil,beans, or peas are included in acropping system. (Reaction 1 in figure9-2.) Each legume requires associationwith a specific Rhizobium bacteria to fixatmospheric nitrogen. As long as theproper bacteria are present in the soil,nitrogen-fixing nodules will form in theroots of these plants as they grow.These bacteria are often added to thesoil as an inoculant, usually by coatingthe seed at planting time.
Leguminous plants, like all otherplants, need nitrogen for growth. Ifthere is an abundance of plant-availablenitrogen already in the soil (frommanure or residual fertilizer, forexample), a legume will use the soil-available nitrogen before expendingenergy for the rhizobia-fixed nitrogen.When soil nitrogen is low, however, thelegume uses rhizobia-fixed nitrogen forits growth. No matter what its source,nitrogen is incorporated throughout allparts of the plant; it is not concentratedonly in the root nodules. The amountof nitrogen contained in the above-ground plant parts is about equal tothat found in the roots.
Legumes can store substantialamounts of nitrogen. For example, in
the fall following a late-summerharvest, alfalfa contains 130 to 230pounds of nitrogen per acre. Whenlegumes decompose, the storednitrogen is gradually mineralized orreleased in a plant-usable form andbecomes available to the next crop.Figure 9-3 shows the levels of nitrate-nitrogen (NO3
–-N) in the soil profileof several fields of first-year cornfollowing alfalfa. The amount presentdepends on the density of the previousalfalfa stand, soil texture, and height ofplants prior to killing the stand, eitherby tillage, herbicide, or winter-kill.Alfalfa residue often supplies all of thenitrogen needed by first-year corn. Thesuggested reduction in the applicationof fertilizer nitrogen following various
C h a p t e r 9 . S o i l a n d f e r t i l i z e r s o u r c e s o f p l a n t n u t r i e n t s 79
Nit
rate
-N in
to
p f
oo
t o
f so
il, lb
/a
Wisconsin sites
140
80
60
40
20
0
100
120
160
180
Arlington Marshfield Madison Fennimore Wausau
April June
Figure 9-3. Soil nitrate-nitrogen (NO3–-N) levels where no nitrogen
fertilizer has been applied to corn following alfalfa.
Source: Bundy et al., 1997. Using Legumes as a Nitrogen Source. University of Wisconsin-Extension publication A3517.
C-9 10/18/05 11:14 AM Page 79
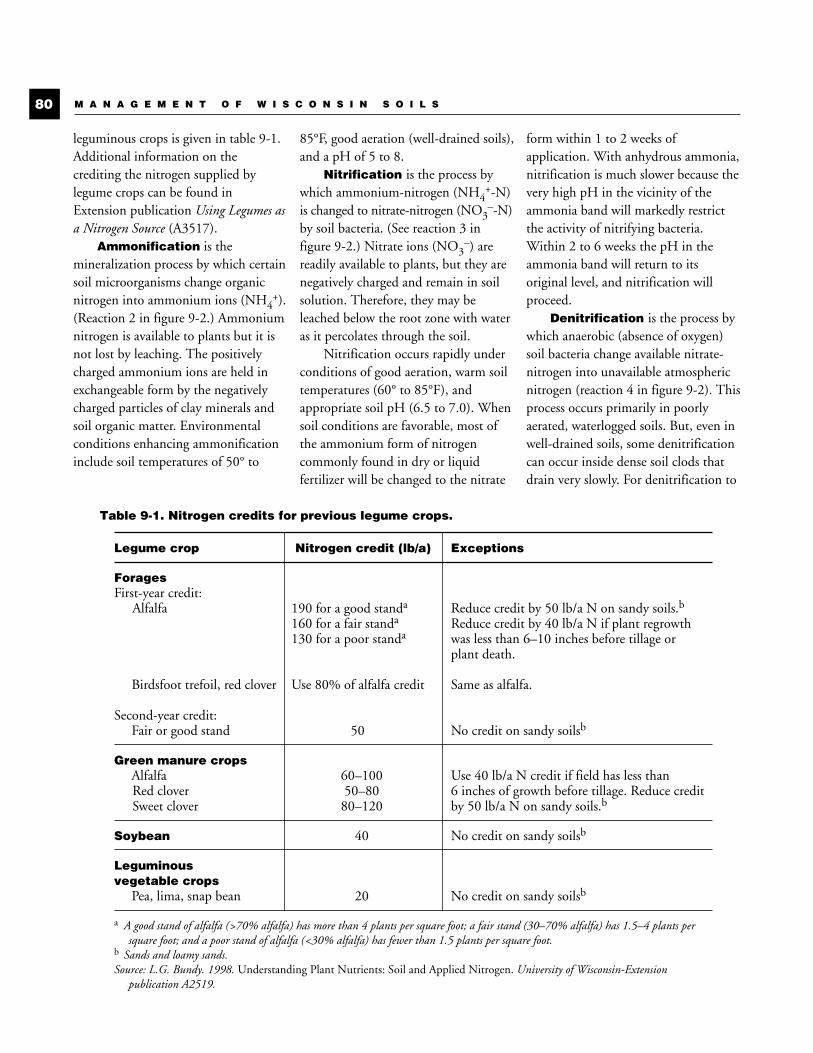
leguminous crops is given in table 9-1.Additional information on thecrediting the nitrogen supplied bylegume crops can be found inExtension publication Using Legumes asa Nitrogen Source (A3517).
Ammonification is themineralization process by which certainsoil microorganisms change organicnitrogen into ammonium ions (NH4
+).(Reaction 2 in figure 9-2.) Ammoniumnitrogen is available to plants but it isnot lost by leaching. The positivelycharged ammonium ions are held inexchangeable form by the negativelycharged particles of clay minerals andsoil organic matter. Environmentalconditions enhancing ammonificationinclude soil temperatures of 50° to
85°F, good aeration (well-drained soils),and a pH of 5 to 8.
Nitrification is the process bywhich ammonium-nitrogen (NH4
+-N)is changed to nitrate-nitrogen (NO3
–-N)by soil bacteria. (See reaction 3 infigure 9-2.) Nitrate ions (NO3
–) arereadily available to plants, but they arenegatively charged and remain in soilsolution. Therefore, they may beleached below the root zone with wateras it percolates through the soil.
Nitrification occurs rapidly underconditions of good aeration, warm soiltemperatures (60° to 85°F), andappropriate soil pH (6.5 to 7.0). Whensoil conditions are favorable, most ofthe ammonium form of nitrogencommonly found in dry or liquidfertilizer will be changed to the nitrate
form within 1 to 2 weeks ofapplication. With anhydrous ammonia,nitrification is much slower because thevery high pH in the vicinity of theammonia band will markedly restrictthe activity of nitrifying bacteria.Within 2 to 6 weeks the pH in theammonia band will return to itsoriginal level, and nitrification willproceed.
Denitrification is the process bywhich anaerobic (absence of oxygen)soil bacteria change available nitrate-nitrogen into unavailable atmosphericnitrogen (reaction 4 in figure 9-2). Thisprocess occurs primarily in poorlyaerated, waterlogged soils. But, even inwell-drained soils, some denitrificationcan occur inside dense soil clods thatdrain very slowly. For denitrification to
M A N A G E M E N T O F W I S C O N S I N S O I L S80
Table 9-1. Nitrogen credits for previous legume crops.
Legume crop Nitrogen credit (lb/a) Exceptions
ForagesFirst-year credit:
Alfalfa 190 for a good standa Reduce credit by 50 lb/a N on sandy soils.b
160 for a fair standa Reduce credit by 40 lb/a N if plant regrowth130 for a poor standa was less than 6–10 inches before tillage or
plant death.
Birdsfoot trefoil, red clover Use 80% of alfalfa credit Same as alfalfa.
Second-year credit:Fair or good stand 50 No credit on sandy soilsb
Green manure cropsAlfalfa 60–100 Use 40 lb/a N credit if field has less than Red clover 50–80 6 inches of growth before tillage. Reduce credit Sweet clover 80–120 by 50 lb/a N on sandy soils.b
Soybean 40 No credit on sandy soilsb
Leguminous vegetable crops
Pea, lima, snap bean 20 No credit on sandy soilsb
a A good stand of alfalfa (>70% alfalfa) has more than 4 plants per square foot; a fair stand (30–70% alfalfa) has 1.5–4 plants persquare foot; and a poor stand of alfalfa (<30% alfalfa) has fewer than 1.5 plants per square foot.
b Sands and loamy sands.Source: L.G. Bundy. 1998. Understanding Plant Nutrients: Soil and Applied Nitrogen. University of Wisconsin-Extension
publication A2519.
C-9 10/18/05 11:14 AM Page 80
occur, readily decomposable organicmatter must be present as a source ofenergy. Because of this energyrequirement, little denitrificationoccurs deep in the subsoil or ingroundwater.
Denitrification takes place veryrapidly. If water stands on the soil foronly 2 to 3 days during the growingseason, most of the nitrate-nitrogenwill be lost by denitrification.Applications of nitrogen should bedelayed as long as possible on soils thatoften become waterlogged in thespring. Also, use of a nitrificationinhibitor—a material that slows downthe nitrification process—can bebeneficial when preplant nitrogen isapplied to soils that tend to betemporarily waterlogged.
Immobilization is the conversionof mineral forms of nitrogen tounavailable organic forms. (See reaction5 in figure 9-2.) For example,incorporating carbon-rich cropresidues, such as straw or corn stalks,stimulates microbial activity. Availablenitrogen is then converted intomicrobial protein and will remainunavailable until the crop residuedecomposes. When the microbes die,the nitrogen is again released in anavailable form. Under ideal weatherconditions, release of immobilizednitrogen will begin about 1 month afterincorporation of the organic matter.
The addition of nitrogen fertilizermay hasten residue decomposition, butmost well-managed soils containenough nitrogen to break down cropresidues. The factor limitingdecomposition of residues is usually thesize of the residue pieces rather than theamount of nitrogen present. Smallparticles decompose much morerapidly than large particles. To speed
decomposition, crop residues can bechopped or shredded. Crop residuesneed about 20 pounds of nitrogen perton of dry matter to satisfy therequirements of the microorganismsdecomposing the residue. For example,3 tons of corn stalks would require60 pounds of nitrogen. Such a nitrogenapplication would be recommended ifthese low-nitrogen residues causetemporary nitrogen deficiencies tooccur, especially when the crop to begrown needs additional nitrogen.However, because of the expense andenvironmental concerns, nitrogenshould not be applied for the solepurpose of speeding up decomposition.Soil test recommendations take residueconditions into consideration. Thenitrogen needed to decompose theresidue is built into the calculation ofthe nitrogen rate.
In addition to nitrogen losses dueto biological transformations such asdenitrification and immobilization,nitrogen can be removed from the croproot zone by leaching andvolatilization.
Leaching is the movement ofplant nutrients in the soil solutionbelow the root zone. Leaching ofnitrate-nitrogen can be very seriouscrop production and water qualityproblems, especially on sandy soils.
Since coarse-textured soils retainonly about 1 inch of water per foot ofsoil, relatively small amounts of rain orirrigation water can readily movenitrate below the root zone. Well-drained silty and clayey soils, however,commonly hold 2.5 to 3 inches ofwater per foot of soil, so very rapidleaching on these soils occurs onlywhen rainfall is abnormally high ornitrogen is over-applied. When rainfallis normal or below normal, leaching is
not a problem on silty or clayey soilsduring the growing season becausenitrate seldom moves downward morethan 2 feet.
Ammonium-nitrogen is held in anexchangeable form on soil particles anddoes not leach below the root zone.Nitrate-nitrogen is not held by soilparticles and can be leached below theroot zone. But, this does not necessarilymean that ammonium-nitrogen will bemore effective than nitrate-nitrogen.Ammonium-nitrogen quickly changesto nitrate-nitrogen under optimum soilconditions. As a result, nitrogen lossthrough leaching can occur even wherenitrogen is initially applied asammonium.
On sandy soils where excessiveleaching often occurs, ammonium-containing nitrogen fertilizers (e.g.,urea, anhydrous ammonia, ammoniumsulfate) sometimes do better thannitrate-containing nitrogen fertilizers(e.g., ammonium nitrate). Thisdifference appears when substantialrainfall occurs shortly after application.In this case the ammonium nitrogenwould not yet be nitrified and wouldnot be leached as easily as nitrate.Organic sources of nitrogen areespecially beneficial on sandy soilsbecause they serve as a reservoir ofnitrogen that is slowly released duringthe growing season.
Volatilization is the conversionof usable nitrogen to ammonia gas.Direct loss of ammonia as a gas canoccur when anhydrous ammonia isinjected into soils that are too wet ortoo dry so that the vapor escapes beforethe soil seals behind the applicatorknives. Volatilization can also takeplace when materials containing urea(manure and other organic wastes;fertilizers such as urea, 28% nitrogen
C h a p t e r 9 . S o i l a n d f e r t i l i z e r s o u r c e s o f p l a n t n u t r i e n t s 81
C-9 10/18/05 11:14 AM Page 81
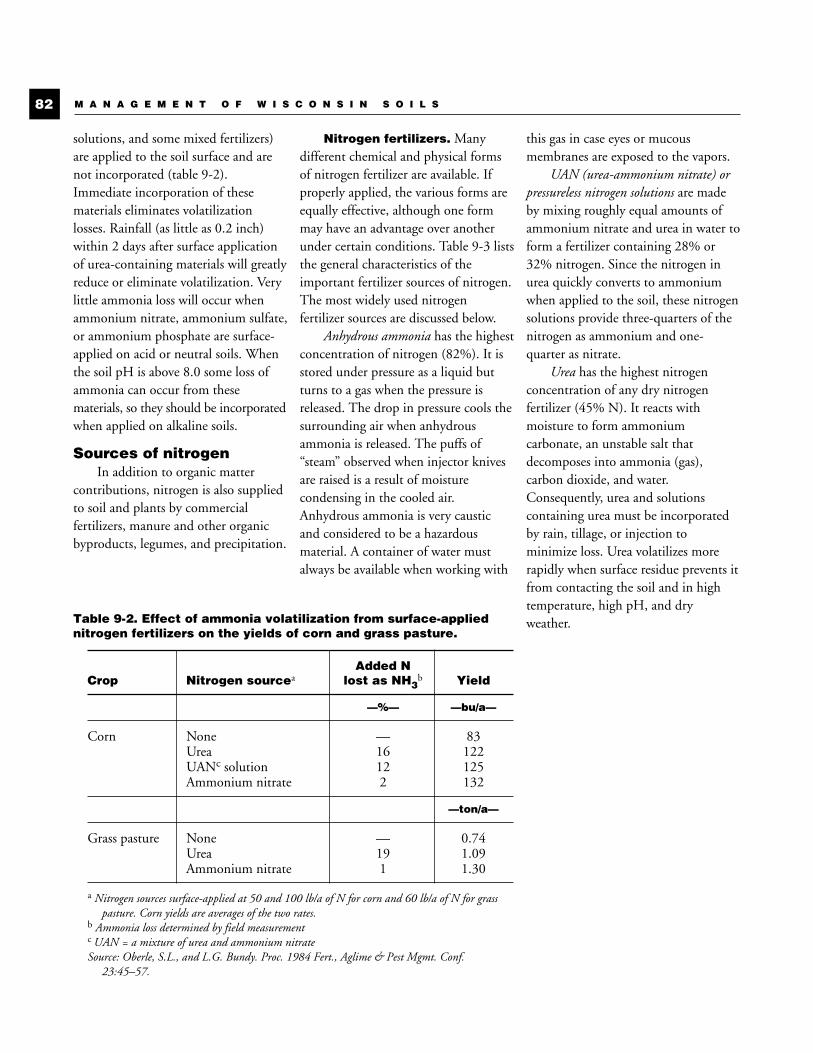
solutions, and some mixed fertilizers)are applied to the soil surface and arenot incorporated (table 9-2).Immediate incorporation of thesematerials eliminates volatilizationlosses. Rainfall (as little as 0.2 inch)within 2 days after surface applicationof urea-containing materials will greatlyreduce or eliminate volatilization. Verylittle ammonia loss will occur whenammonium nitrate, ammonium sulfate,or ammonium phosphate are surface-applied on acid or neutral soils. Whenthe soil pH is above 8.0 some loss ofammonia can occur from thesematerials, so they should be incorporatedwhen applied on alkaline soils.
Sources of nitrogenIn addition to organic matter
contributions, nitrogen is also suppliedto soil and plants by commercialfertilizers, manure and other organicbyproducts, legumes, and precipitation.
Nitrogen fertilizers. Manydifferent chemical and physical formsof nitrogen fertilizer are available. Ifproperly applied, the various forms areequally effective, although one formmay have an advantage over anotherunder certain conditions. Table 9-3 liststhe general characteristics of theimportant fertilizer sources of nitrogen.The most widely used nitrogenfertilizer sources are discussed below.
Anhydrous ammonia has the highestconcentration of nitrogen (82%). It isstored under pressure as a liquid butturns to a gas when the pressure isreleased. The drop in pressure cools thesurrounding air when anhydrousammonia is released. The puffs of“steam” observed when injector knivesare raised is a result of moisturecondensing in the cooled air.Anhydrous ammonia is very causticand considered to be a hazardousmaterial. A container of water mustalways be available when working with
this gas in case eyes or mucousmembranes are exposed to the vapors.
UAN (urea-ammonium nitrate) orpressureless nitrogen solutions are madeby mixing roughly equal amounts ofammonium nitrate and urea in water toform a fertilizer containing 28% or32% nitrogen. Since the nitrogen inurea quickly converts to ammoniumwhen applied to the soil, these nitrogensolutions provide three-quarters of thenitrogen as ammonium and one-quarter as nitrate.
Urea has the highest nitrogenconcentration of any dry nitrogenfertilizer (45% N). It reacts withmoisture to form ammoniumcarbonate, an unstable salt thatdecomposes into ammonia (gas),carbon dioxide, and water.Consequently, urea and solutionscontaining urea must be incorporatedby rain, tillage, or injection tominimize loss. Urea volatilizes morerapidly when surface residue prevents itfrom contacting the soil and in hightemperature, high pH, and dryweather.
M A N A G E M E N T O F W I S C O N S I N S O I L S82
Table 9-2. Effect of ammonia volatilization from surface-appliednitrogen fertilizers on the yields of corn and grass pasture.
Added N Crop Nitrogen sourcea lost as NH3
b Yield
—%— —bu/a—
Corn None — 83Urea 16 122UANc solution 12 125Ammonium nitrate 2 132
—ton/a—
Grass pasture None — 0.74Urea 19 1.09Ammonium nitrate 1 1.30
a Nitrogen sources surface-applied at 50 and 100 lb/a of N for corn and 60 lb/a of N for grasspasture. Corn yields are averages of the two rates.
b Ammonia loss determined by field measurementc UAN = a mixture of urea and ammonium nitrateSource: Oberle, S.L., and L.G. Bundy. Proc. 1984 Fert., Aglime & Pest Mgmt. Conf.
23:45–57.
C-9 10/18/05 11:14 AM Page 82
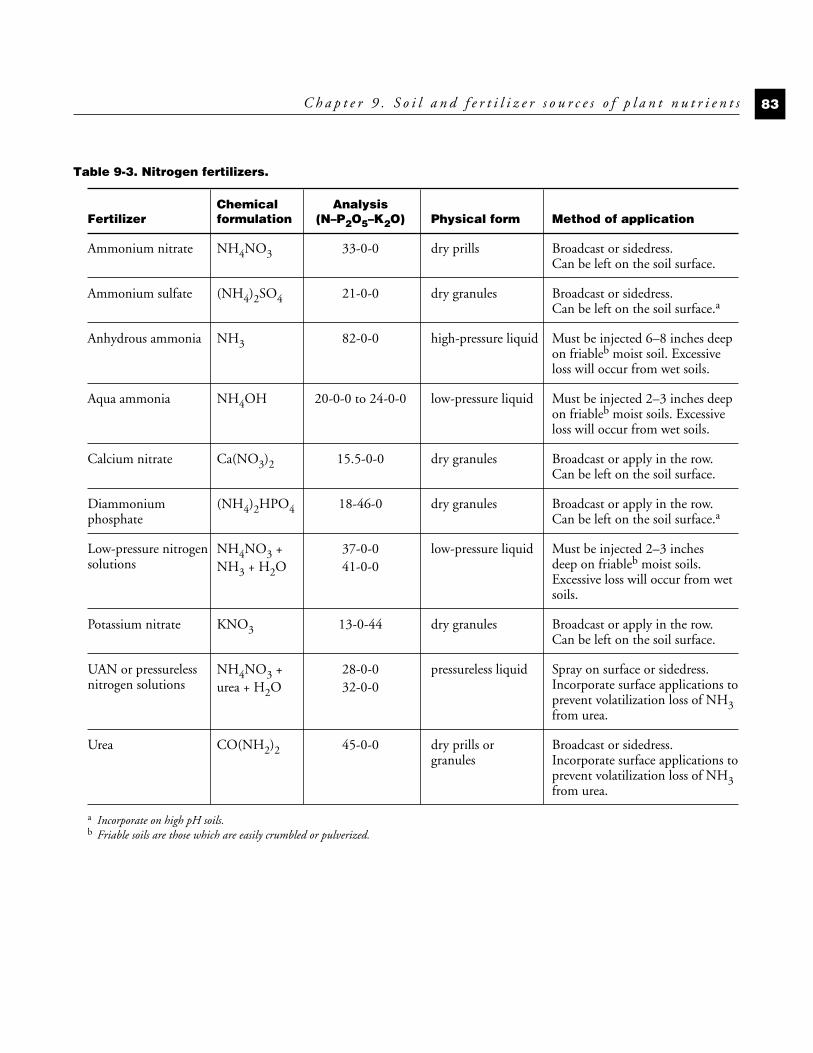
C h a p t e r 9 . S o i l a n d f e r t i l i z e r s o u r c e s o f p l a n t n u t r i e n t s 83
Table 9-3. Nitrogen fertilizers.
Chemical AnalysisFertilizer formulation (N–P2O5–K2O) Physical form Method of application
Ammonium nitrate NH4NO3 33-0-0 dry prills Broadcast or sidedress. Can be left on the soil surface.
Ammonium sulfate (NH4)2SO4 21-0-0 dry granules Broadcast or sidedress. Can be left on the soil surface.a
Anhydrous ammonia NH3 82-0-0 high-pressure liquid Must be injected 6–8 inches deep on friableb moist soil. Excessive loss will occur from wet soils.
Aqua ammonia NH4OH 20-0-0 to 24-0-0 low-pressure liquid Must be injected 2–3 inches deep on friableb moist soils. Excessive loss will occur from wet soils.
Calcium nitrate Ca(NO3)2 15.5-0-0 dry granules Broadcast or apply in the row. Can be left on the soil surface.
Diammonium (NH4)2HPO4 18-46-0 dry granules Broadcast or apply in the row. phosphate Can be left on the soil surface.a
Low-pressure nitrogen NH4NO3 + 37-0-0 low-pressure liquid Must be injected 2–3 inches solutions NH3 + H2O 41-0-0 deep on friableb moist soils.
Excessive loss will occur from wet soils.
Potassium nitrate KNO3 13-0-44 dry granules Broadcast or apply in the row.Can be left on the soil surface.
UAN or pressureless NH4NO3 + 28-0-0 pressureless liquid Spray on surface or sidedress. nitrogen solutions urea + H2O 32-0-0 Incorporate surface applications to
prevent volatilization loss of NH3from urea.
Urea CO(NH2)2 45-0-0 dry prills or Broadcast or sidedress. granules Incorporate surface applications to
prevent volatilization loss of NH3from urea.
a Incorporate on high pH soils.b Friable soils are those which are easily crumbled or pulverized.
C-9 10/18/05 11:14 AM Page 83
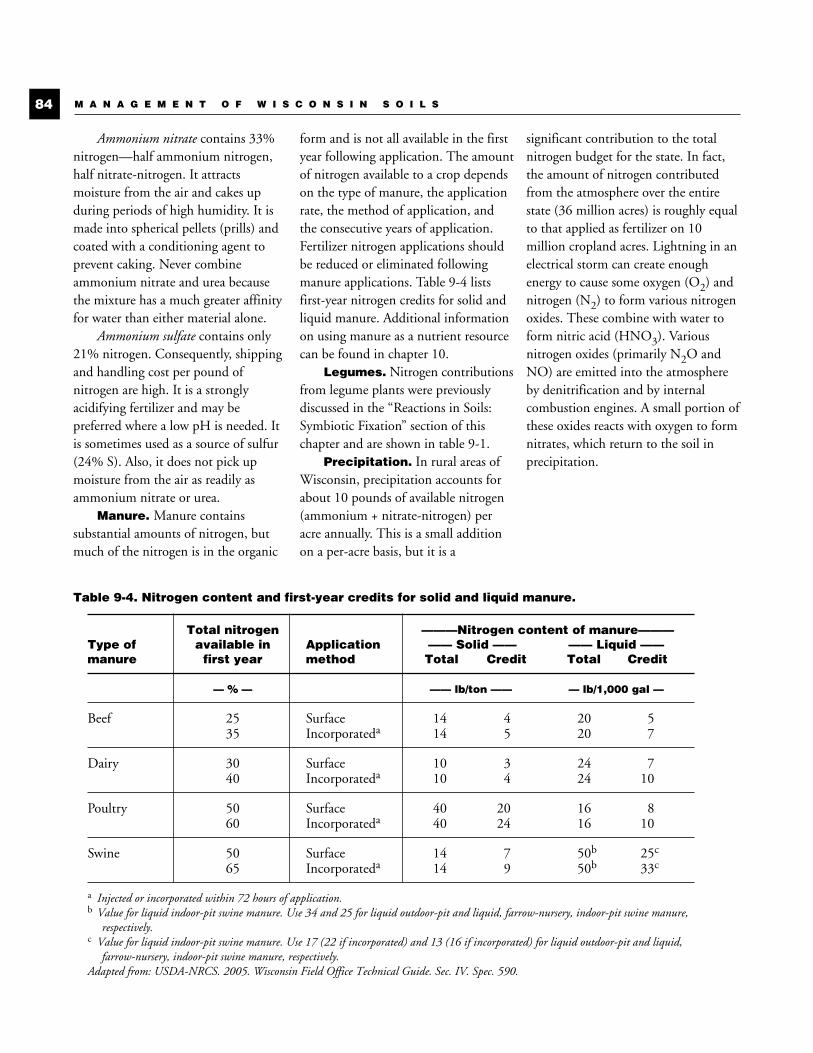
Ammonium nitrate contains 33%nitrogen—half ammonium nitrogen,half nitrate-nitrogen. It attractsmoisture from the air and cakes upduring periods of high humidity. It ismade into spherical pellets (prills) andcoated with a conditioning agent toprevent caking. Never combineammonium nitrate and urea becausethe mixture has a much greater affinityfor water than either material alone.
Ammonium sulfate contains only21% nitrogen. Consequently, shippingand handling cost per pound ofnitrogen are high. It is a stronglyacidifying fertilizer and may bepreferred where a low pH is needed. Itis sometimes used as a source of sulfur(24% S). Also, it does not pick upmoisture from the air as readily asammonium nitrate or urea.
Manure. Manure containssubstantial amounts of nitrogen, butmuch of the nitrogen is in the organic
form and is not all available in the firstyear following application. The amountof nitrogen available to a crop dependson the type of manure, the applicationrate, the method of application, andthe consecutive years of application.Fertilizer nitrogen applications shouldbe reduced or eliminated followingmanure applications. Table 9-4 listsfirst-year nitrogen credits for solid andliquid manure. Additional informationon using manure as a nutrient resourcecan be found in chapter 10.
Legumes. Nitrogen contributionsfrom legume plants were previouslydiscussed in the “Reactions in Soils:Symbiotic Fixation” section of thischapter and are shown in table 9-1.
Precipitation. In rural areas ofWisconsin, precipitation accounts forabout 10 pounds of available nitrogen(ammonium + nitrate-nitrogen) peracre annually. This is a small additionon a per-acre basis, but it is a
significant contribution to the totalnitrogen budget for the state. In fact,the amount of nitrogen contributedfrom the atmosphere over the entirestate (36 million acres) is roughly equalto that applied as fertilizer on 10million cropland acres. Lightning in anelectrical storm can create enoughenergy to cause some oxygen (O2) andnitrogen (N2) to form various nitrogenoxides. These combine with water toform nitric acid (HNO3). Variousnitrogen oxides (primarily N2O andNO) are emitted into the atmosphereby denitrification and by internalcombustion engines. A small portion ofthese oxides reacts with oxygen to formnitrates, which return to the soil inprecipitation.
M A N A G E M E N T O F W I S C O N S I N S O I L S84
Table 9-4. Nitrogen content and first-year credits for solid and liquid manure.
Total nitrogen ———Nitrogen content of manure———Type of available in Application —— Solid —— —— Liquid ——manure first year method Total Credit Total Credit
— % — —— lb/ton —— — lb/1,000 gal —
Beef 25 Surface 14 4 20 535 Incorporateda 14 5 20 7
Dairy 30 Surface 10 3 24 740 Incorporateda 10 4 24 10
Poultry 50 Surface 40 20 16 860 Incorporateda 40 24 16 10
Swine 50 Surface 14 7 50b 25c
65 Incorporateda 14 9 50b 33c
a Injected or incorporated within 72 hours of application.b Value for liquid indoor-pit swine manure. Use 34 and 25 for liquid outdoor-pit and liquid, farrow-nursery, indoor-pit swine manure,
respectively.c Value for liquid indoor-pit swine manure. Use 17 (22 if incorporated) and 13 (16 if incorporated) for liquid outdoor-pit and liquid,
farrow-nursery, indoor-pit swine manure, respectively.Adapted from: USDA-NRCS. 2005. Wisconsin Field Office Technical Guide. Sec. IV. Spec. 590.
C-9 10/18/05 11:14 AM Page 84
C h a p t e r 9 . S o i l a n d f e r t i l i z e r s o u r c e s o f p l a n t n u t r i e n t s 85
Timing of nitrogenfertilizer applications
The timing of nitrogen fertilizerapplications can markedly affect theirefficiency and the potential for nitrogenlosses. Supplying the needed nitrogenjust prior to the crop’s greatest demandmaximizes the efficiency of nitrogenapplications. For spring-planted crops,sidedress and spring preplantapplications provide greater nitrogenefficiency than fall applications, whichare usually 10 to 15% less effective inincreasing crop yields.
Sidedress applications ofnitrogen during the growing season areeffective on all soils. Proper timing isessential to provide available nitrogenwhen the crop uses the nitrogenrapidly. For corn, this is usually 6 to12 weeks after planting. To provideadequate nitrogen during this period ofrapid nitrogen use, sidedressapplications should be made no laterthan 6 weeks after planting. Benefitsfrom using sidedress nitrogen instead ofpreplant applications are greatest onsandy soils or on fine-textured, poorlydrained soils, and in years when rainfallis above normal. Research on sandyirrigated soils has shown consistentlyhigher corn yields with sidedressapplications than with preplanttreatments. Further discussion of thistopic can be found in the “Methods ofFertilizer Application” section of thischapter.
Spring preplant applicationsare usually as effective as sidedresstreatments on medium-textured, well-drained soils. The risk of leaching ordenitrification in these soils is low.
Multiple or split applicationsof nitrogen through irrigation systemsare also effective. For corn, theseapplications should be timed so thatsome nitrogen is applied by the sixth
week after planting and most of therecommended nitrogen is applied bythe tenth week after planting
Fall applications are mosteffective on medium-textured, well-drained soils, where nitrogen lossthrough leaching or denitrification isusually low. They are not effective onsandy soils, shallow soils over fracturedbedrock or fine-textured poorly drainedsoils. If fall treatments are to be madeon medium-textured, well-drainedsoils, they should be limited toapplication of ammonium forms ofnitrogen only (anhydrous ammonia,urea, ammonium sulfate), and theyshould be delayed until soiltemperatures are below 50°F to slowthe conversion of ammonium to nitrateby soil organisms. This conversion canbe delayed also by use of nitrificationinhibitors (see below). Price andconvenience advantages associated withfall-applied nitrogen must be weighedagainst the possibility of nitrate-nitrogen losses and lower effectiveness.
Nitrification inhibitors such asnitrapyrin (N-Serve) or dicyandiamide(DCD) used with ammonium forms ofnitrogen fertilizer can reduce nitrogenlosses on soils where leaching ordenitrification is likely. Nitrificationinhibitors slow the conversion ofammonium to nitrate by soil organisms(Reaction 3 in figure 9-2). Becauseleaching and denitrification occurthrough the nitrate form of nitrogen,maintaining fertilizer nitrogen in theammonium form should reducenitrogen losses through these processes.
Nitrification inhibitors are likely toincrease crop yields when used withspring preplant nitrogen applicationson sandy soils or fine-textured, poorlydrained soils. Yield increases are alsolikely from inhibitor use with fall-applied nitrogen on medium-textured,
well-drained soils. However, spring-applied nitrogen fertilizer is usuallymore effective than fall-appliednitrogen even with use of a nitrificationinhibitor. Using nitrification inhibitorswith spring preplant nitrogen onmedium-textured, well-drained soils orwith sidedress applications on any soiltype is not likely to improve yields.
Urease inhibitors such asNBPT (Agrotain) used with surface-applied urea-containing fertilizers canreduce ammonia losses and improvenitrogen efficiency. However, they donot consistently increase yields. Thedecision to use a urease inhibitorshould be based on the risk of nitrogenloss that could be controlled, the costof using the inhibitor, and the cost andconvenience of other nitrogen sourcesor placement methods that are notsubject to ammonia loss. Alternativesinclude injecting or incorporating theurea-containing fertilizers or using non-urea nitrogen sources.
Nitrogen fertilizer timing summary
To minimize leaching ordenitrification losses, follow thesegeneral recommendations.
Sandy soils. Nitrogen should beapplied as a sidedress treatment. Forirrigated crops, part of the nitrogenmay be applied through the irrigationwater. Fall or spring preplanttreatments will result in excessive losseson these soils. If spring preplantapplications must be made, applyammonium forms of nitrogen treatedwith a nitrification inhibitor. Forirrigated crops, apply part of thenitrogen through the irrigation water.
Well-drained silty or clayeysoils. Spring preplant or sidedressapplications can contain any form ofnitrogen. If fall applications must be
C-9 10/18/05 11:14 AM Page 85
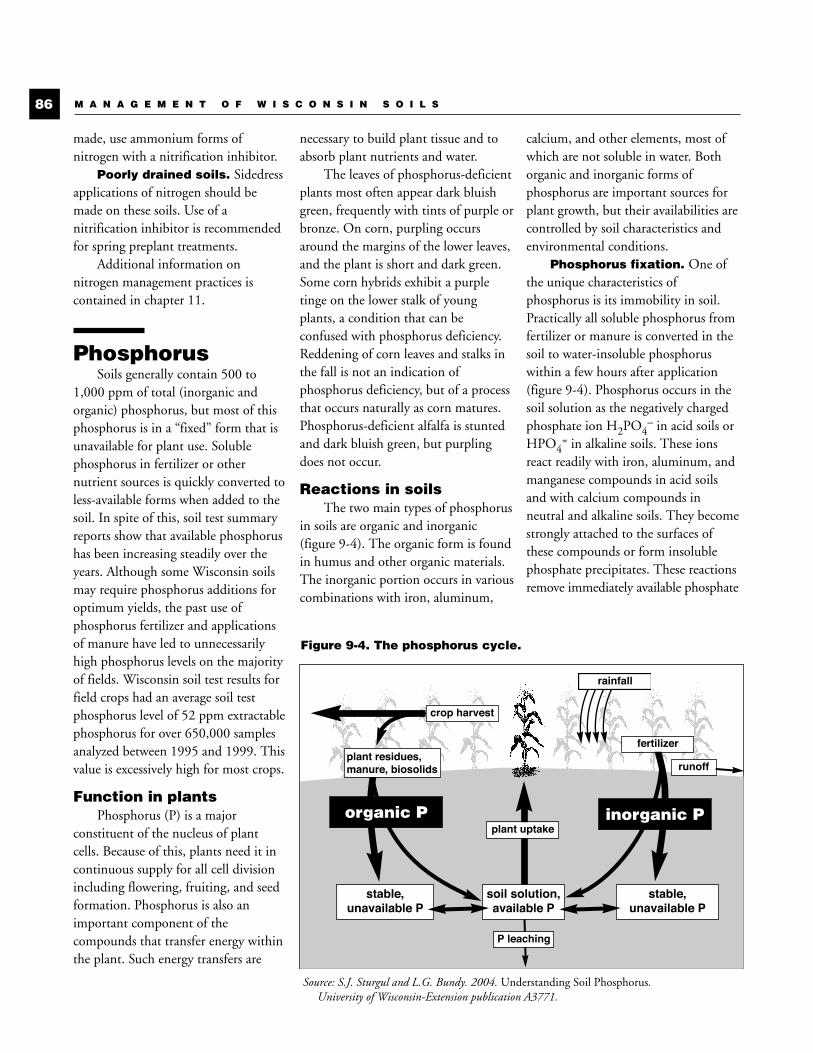
made, use ammonium forms ofnitrogen with a nitrification inhibitor.
Poorly drained soils. Sidedressapplications of nitrogen should bemade on these soils. Use of anitrification inhibitor is recommendedfor spring preplant treatments.
Additional information onnitrogen management practices iscontained in chapter 11.
PhosphorusSoils generally contain 500 to
1,000 ppm of total (inorganic andorganic) phosphorus, but most of thisphosphorus is in a “fixed” form that isunavailable for plant use. Solublephosphorus in fertilizer or othernutrient sources is quickly converted toless-available forms when added to thesoil. In spite of this, soil test summaryreports show that available phosphorushas been increasing steadily over theyears. Although some Wisconsin soilsmay require phosphorus additions foroptimum yields, the past use ofphosphorus fertilizer and applicationsof manure have led to unnecessarilyhigh phosphorus levels on the majorityof fields. Wisconsin soil test results forfield crops had an average soil testphosphorus level of 52 ppm extractablephosphorus for over 650,000 samplesanalyzed between 1995 and 1999. Thisvalue is excessively high for most crops.
Function in plantsPhosphorus (P) is a major
constituent of the nucleus of plantcells. Because of this, plants need it incontinuous supply for all cell divisionincluding flowering, fruiting, and seedformation. Phosphorus is also animportant component of thecompounds that transfer energy withinthe plant. Such energy transfers are
necessary to build plant tissue and toabsorb plant nutrients and water.
The leaves of phosphorus-deficientplants most often appear dark bluishgreen, frequently with tints of purple orbronze. On corn, purpling occursaround the margins of the lower leaves,and the plant is short and dark green.Some corn hybrids exhibit a purpletinge on the lower stalk of youngplants, a condition that can beconfused with phosphorus deficiency.Reddening of corn leaves and stalks inthe fall is not an indication ofphosphorus deficiency, but of a processthat occurs naturally as corn matures.Phosphorus-deficient alfalfa is stuntedand dark bluish green, but purplingdoes not occur.
Reactions in soilsThe two main types of phosphorus
in soils are organic and inorganic(figure 9-4). The organic form is foundin humus and other organic materials.The inorganic portion occurs in variouscombinations with iron, aluminum,
calcium, and other elements, most ofwhich are not soluble in water. Bothorganic and inorganic forms ofphosphorus are important sources forplant growth, but their availabilities arecontrolled by soil characteristics andenvironmental conditions.
Phosphorus fixation. One ofthe unique characteristics ofphosphorus is its immobility in soil.Practically all soluble phosphorus fromfertilizer or manure is converted in thesoil to water-insoluble phosphoruswithin a few hours after application(figure 9-4). Phosphorus occurs in thesoil solution as the negatively chargedphosphate ion H2PO4
– in acid soils orHPO4
= in alkaline soils. These ionsreact readily with iron, aluminum, andmanganese compounds in acid soilsand with calcium compounds inneutral and alkaline soils. They becomestrongly attached to the surfaces ofthese compounds or form insolublephosphate precipitates. These reactionsremove immediately available phosphate
M A N A G E M E N T O F W I S C O N S I N S O I L S86
Source: S.J. Sturgul and L.G. Bundy. 2004. Understanding Soil Phosphorus.University of Wisconsin-Extension publication A3771.
stable,unavailable P
stable,unavailable P
fertilizer
P leaching
plant residues,manure, biosolids
organic P inorganic P
runoff
soil solution,available P
crop harvest
Figure 9-4. The phosphorus cycle.
rainfall
plant uptake
C-9 10/18/05 11:14 AM Page 86

ions from the soil solution. Unlikenitrate ions, phosphate ions rarelyleach, even in sandy soils. Studies ofhighly fertilized, intensively farmedland indicate that the annual loss ofphosphorus in drainage water seldomexceeds 0.1 pounds per acre. The plowlayer of the soil usually retains almost all(98 to 99%) of the applied phosphorus.This means that very little phosphorusmoves into or through the subsoil. Acidsoils fix more phosphorus than neutralsoils; liming acid soils to a pH of 6.0 to6.8 increases the availability of both soiland fertilizer phosphorus.
The concentration of phosphorusin the soil solution is about 0.02 to 0.1ppm. If this were the only source ofphosphorus available to plants, thesupply would be exhausted in a fewhours when crops are growing rapidly.But this does not happen because thephosphorus removed from solution byplants is quickly replenished frommany slowly available sources includingthat “fixed” by iron, aluminum, andcalcium compounds (figure 9-4). A
fertile soil is able to maintain thephosphorus concentration in the soilsolution at a level high enough to meetthe needs of crops during periods ofpeak demand.
Phosphorus in organicmatter. The relative amounts oforganic and inorganic phosphorus varyconsiderably. In Wisconsin, organicphosphorus accounts for 30 to 50% ofthe total phosphorus in most mineralsoils. Decomposition (mineralization)of organic matter converts organicforms of phosphorus to inorganicavailable forms. As with themineralization of organic nitrogen,organic phosphorus is released morerapidly in warm, well-aerated soils.This explains why crops grown in cold,wet Wisconsin soils often show growthresponse to row-applied (starter)phosphorus even though the soil maybe well supplied with phosphorus orbroadcast phosphorus fertilizer hasbeen added.
Sources of phosphorusIn addition to organic matter and
soil mineral contributions, phosphorusis also supplied to soil and plants bycommercial fertilizers, manure, andother organic byproducts.Phosphorus fertilizers
Rock phosphate. Rock phosphate isthe original source of nearly allphosphorus fertilizer sold in the UnitedStates. Mined rock phosphate is tooinsoluble (less than 1% water soluble)to be a useful source of phosphorus forcrops, except when very finely groundand applied to soils with a pH below6.0. During the manufacture offertilizer, insoluble rock phosphate istreated with an acid to convert it tomore-available superphosphate orammonium phosphate. This processneutralizes much of the acid;application of phosphate fertilizerresults in very little residual aciditywhen it is applied to the soil. Thecommon phosphate fertilizers, listed intable 9-5, are seldom applied alone inWisconsin. Usually they are
C h a p t e r 9 . S o i l a n d f e r t i l i z e r s o u r c e s o f p l a n t n u t r i e n t s 87
Table 9-5. Sources of phosphorus fertilizer.
Fertilizer analysis WaterName of fertilizer Chemical formula N-P2O5-K2O solubility
——————— % ———————
Ammoniated superphosphate variable variable 60
Ammonium polyphosphate NH4H2PO4 + (NH4)3HP2O7Liquid 10-34-0 100Dry 15-62-0 100
Diammonium phosphate (NH4)2HPO4 18-46-0 >95
Monoammonium phosphate NH4H2PO4 11-48-0 92
Ordinary superphosphate Ca(H2PO4)2 + CaSO4 0-20-0 85
Rock phosphate 3Ca3(PO4)2CaF2 0-32-0 <1
Triple superphosphate Ca(H2PO4)2 0-46-0 87
C-9 10/18/05 11:14 AM Page 87

manufactured or blended withnitrogen, potassium, or both to form amixed fertilizer such as 6-24-24 or9-23-30. As shown in table 9-6, thevarious sources of phosphorus areequally effective in improving cropyields.
Orthophosphate versuspolyphosphate. Sources of phosphoruscontaining the H2PO4
– or HPO4= ions
are called orthophosphates.Polyphosphates contain a mixture oforthophosphate and some long-chainphosphate ions such as pyrophosphate,(HP2O7)3
–. Commercially producedpolyphosphate contains approximately50% orthophosphate and 50% long-chain phosphate compounds.
Claims that polyphosphates aresuperior to orthophosphates exaggeratetheir ability to partially chelate orcombine with certain micronutrientsand hold them in an available form.Research has not demonstrated thatthis difference improves yields orincreases nutrient uptake in most soils.Polyphosphate ions react with soilmoisture to form orthophosphatesrelatively rapidly (1 to 2 weeks). Onalmost all soils, orthophosphate andpolyphosphate fertilizers are equallyeffective.
The main advantage ofpolyphosphate is in the production ofhigher analysis grades of both liquidand dry fertilizers. Also, in liquidfertilizers polyphosphates can bindmicronutrients such as zinc andmanganese and hold them in solution;whereas with orthophosphates, thesetrace elements would precipitate.
Water solubility. The amount ofwater-soluble phosphorus in thedifferent sources of availablephosphorus varies considerably (table9-5). However, when phosphorus isbroadcast and incorporated or when it
is topdressed on forages, watersolubility makes little or no difference.University of Wisconsin researchshown in table 9-6 illustrates that thedifferences in water solubility amongammoniated superphosphate (60%soluble), concentrated superphosphate(85% soluble), and monoammoniumphosphate (92% soluble) did notinfluence yields. Increasing the amountof water-soluble phosphorus above60% did not increase yields. Allcommonly used phosphorus fertilizerspresently sold in Wisconsin (exceptrock phosphate) contain at least 85%water-soluble phosphorus.
Liquid versus dry phosphate.Compared to conventional dryfertilizers, liquid fertilizers are easier tohandle, mix, and apply. Despite claimsto the contrary, research has shown thatliquid phosphate does not improvefertilizer phosphorus availability orrecovery. Soil interactions controlphosphorus uptake, not the physicalform of the fertilizer applied.
Rock phosphate versussuperphosphate. Rock phosphate issometimes recommended instead ofsuperphosphate for building up the
“reserve” level of phosphate in soil. Thephosphorus in rock phosphate becomesavailable only when the soil is acid(below pH 5.5), and therefore its useby Wisconsin dairy farms is notrecommended. The pH should beabout 6.8 for high-quality alfalfa and atleast 6.0 to 6.2 for most otheragronomic crops. Research in the1950s clearly demonstrated that rockphosphate is not an effectivephosphorus source in most soils.Manure
Manure contains substantialamounts of phosphorus but, similar tonitrogen, much of the phosphorus is inthe organic form and is not all availablein the first year following application.The amount of manure-phosphorusavailable to a crop depends on the typeof manure, the application rate, and theconsecutive years of application.Fertilizer phosphorus applicationsshould be reduced or eliminatedfollowing manure applications. Table9-7 lists first-year nitrogen credits forsolid and liquid manure. Additionalinformation on using manure as anutrient resource can be found inchapter 10.
M A N A G E M E N T O F W I S C O N S I N S O I L S88
Table 9-6. Effect of various sources of row-applied phosphorus oncorn yield (Arlington, WI).
Fertilizer Sources of phosphorus Corn yieldgrade in commercial 6-24-24 (% of control)
—— Control—no phosphorus added —
6-24-24 Ammoniated superphosphate +13.5
6-24-24 Concentrated superphosphate +16.7
6-24-24 Monoammonium phosphate +16.7
Source: Schulte, E.E. and K.A. Kelling. 1996. Soil and Applied Phosphorus. University ofWisconsin-Extension publication A2520.
C-9 10/18/05 11:14 AM Page 88
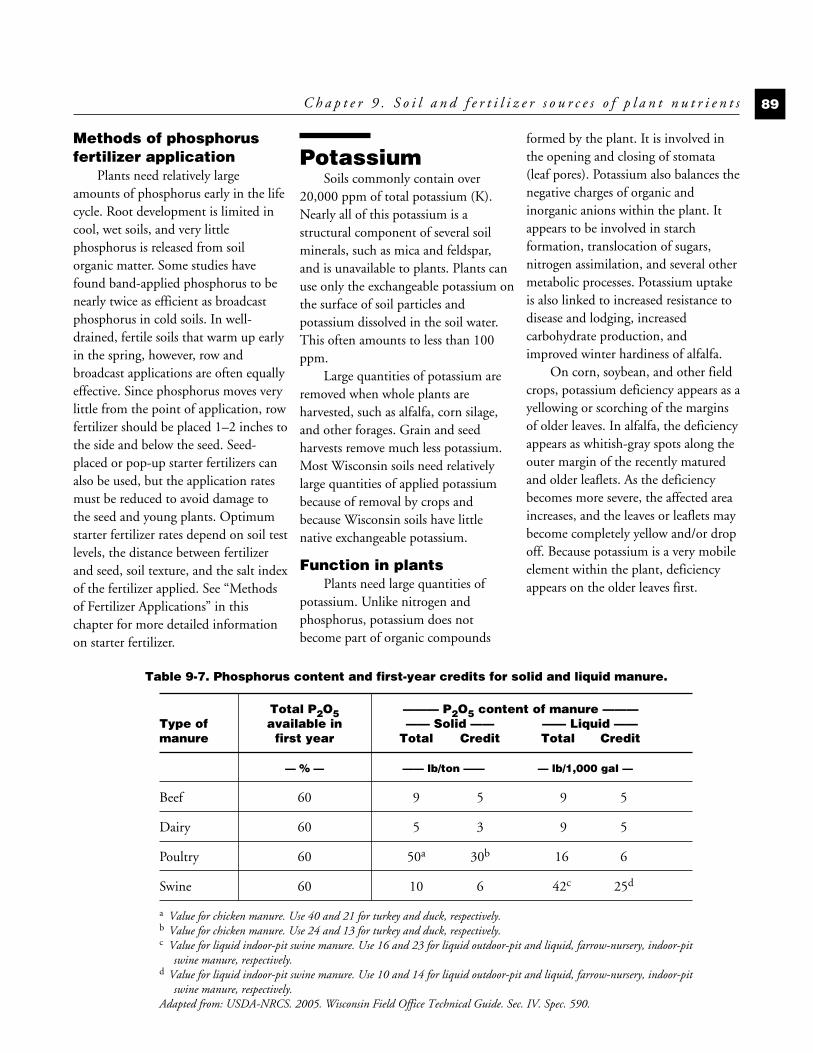
Methods of phosphorusfertilizer application
Plants need relatively largeamounts of phosphorus early in the lifecycle. Root development is limited incool, wet soils, and very littlephosphorus is released from soilorganic matter. Some studies havefound band-applied phosphorus to benearly twice as efficient as broadcastphosphorus in cold soils. In well-drained, fertile soils that warm up earlyin the spring, however, row andbroadcast applications are often equallyeffective. Since phosphorus moves verylittle from the point of application, rowfertilizer should be placed 1–2 inches tothe side and below the seed. Seed-placed or pop-up starter fertilizers canalso be used, but the application ratesmust be reduced to avoid damage tothe seed and young plants. Optimumstarter fertilizer rates depend on soil testlevels, the distance between fertilizerand seed, soil texture, and the salt indexof the fertilizer applied. See “Methodsof Fertilizer Applications” in thischapter for more detailed informationon starter fertilizer.
PotassiumSoils commonly contain over
20,000 ppm of total potassium (K).Nearly all of this potassium is astructural component of several soilminerals, such as mica and feldspar,and is unavailable to plants. Plants canuse only the exchangeable potassium onthe surface of soil particles andpotassium dissolved in the soil water.This often amounts to less than 100ppm.
Large quantities of potassium areremoved when whole plants areharvested, such as alfalfa, corn silage,and other forages. Grain and seedharvests remove much less potassium.Most Wisconsin soils need relativelylarge quantities of applied potassiumbecause of removal by crops andbecause Wisconsin soils have littlenative exchangeable potassium.
Function in plantsPlants need large quantities of
potassium. Unlike nitrogen andphosphorus, potassium does notbecome part of organic compounds
formed by the plant. It is involved inthe opening and closing of stomata(leaf pores). Potassium also balances thenegative charges of organic andinorganic anions within the plant. Itappears to be involved in starchformation, translocation of sugars,nitrogen assimilation, and several othermetabolic processes. Potassium uptakeis also linked to increased resistance todisease and lodging, increasedcarbohydrate production, andimproved winter hardiness of alfalfa.
On corn, soybean, and other fieldcrops, potassium deficiency appears as ayellowing or scorching of the marginsof older leaves. In alfalfa, the deficiencyappears as whitish-gray spots along theouter margin of the recently maturedand older leaflets. As the deficiencybecomes more severe, the affected areaincreases, and the leaves or leaflets maybecome completely yellow and/or dropoff. Because potassium is a very mobileelement within the plant, deficiencyappears on the older leaves first.
C h a p t e r 9 . S o i l a n d f e r t i l i z e r s o u r c e s o f p l a n t n u t r i e n t s 89
Table 9-7. Phosphorus content and first-year credits for solid and liquid manure.
Total P2O5 ——— P2O5 content of manure ———Type of available in —— Solid —— —— Liquid ——manure first year Total Credit Total Credit
— % — —— lb/ton —— — lb/1,000 gal —
Beef 60 9 5 9 5
Dairy 60 5 3 9 5
Poultry 60 50a 30b 16 6
Swine 60 10 6 42c 25d
a Value for chicken manure. Use 40 and 21 for turkey and duck, respectively.b Value for chicken manure. Use 24 and 13 for turkey and duck, respectively.c Value for liquid indoor-pit swine manure. Use 16 and 23 for liquid outdoor-pit and liquid, farrow-nursery, indoor-pit
swine manure, respectively.d Value for liquid indoor-pit swine manure. Use 10 and 14 for liquid outdoor-pit and liquid, farrow-nursery, indoor-pit
swine manure, respectively.Adapted from: USDA-NRCS. 2005. Wisconsin Field Office Technical Guide. Sec. IV. Spec. 590.
C-9 10/18/05 11:14 AM Page 89
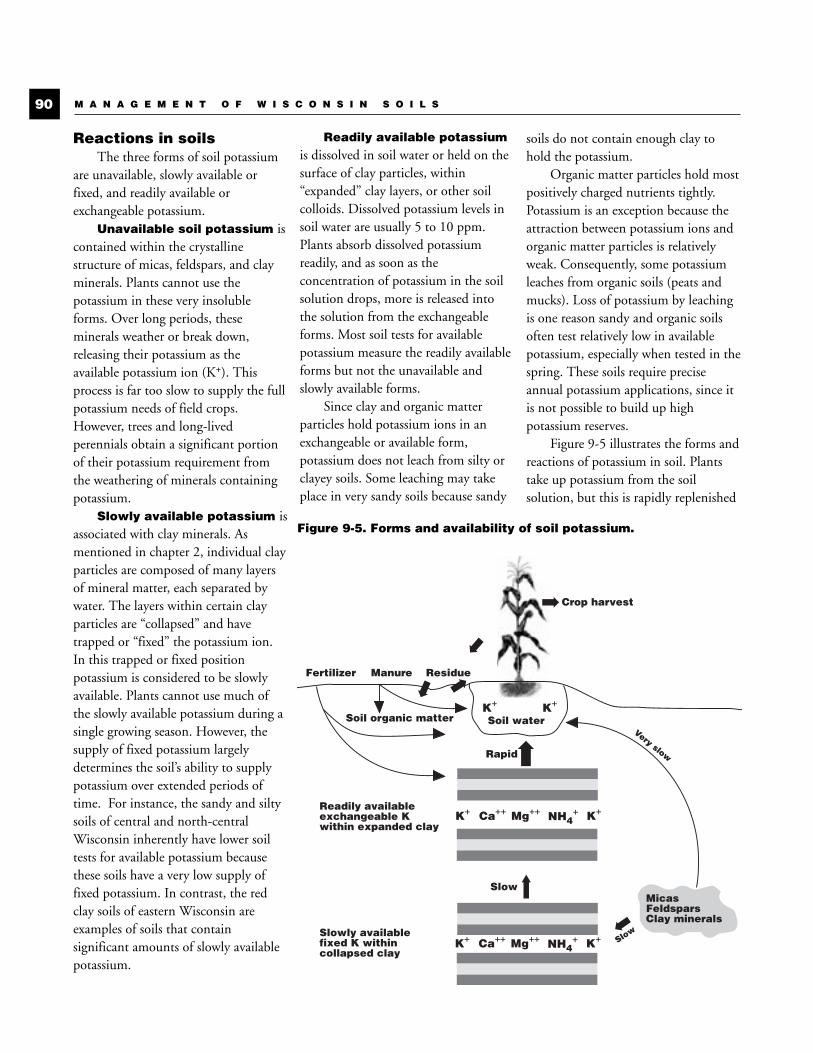
Reactions in soilsThe three forms of soil potassium
are unavailable, slowly available orfixed, and readily available orexchangeable potassium.
Unavailable soil potassium iscontained within the crystallinestructure of micas, feldspars, and clayminerals. Plants cannot use thepotassium in these very insolubleforms. Over long periods, theseminerals weather or break down,releasing their potassium as theavailable potassium ion (K+). Thisprocess is far too slow to supply the fullpotassium needs of field crops.However, trees and long-livedperennials obtain a significant portionof their potassium requirement fromthe weathering of minerals containingpotassium.
Slowly available potassium isassociated with clay minerals. Asmentioned in chapter 2, individual clayparticles are composed of many layersof mineral matter, each separated bywater. The layers within certain clayparticles are “collapsed” and havetrapped or “fixed” the potassium ion.In this trapped or fixed positionpotassium is considered to be slowlyavailable. Plants cannot use much ofthe slowly available potassium during asingle growing season. However, thesupply of fixed potassium largelydetermines the soil’s ability to supplypotassium over extended periods oftime. For instance, the sandy and siltysoils of central and north-centralWisconsin inherently have lower soiltests for available potassium becausethese soils have a very low supply offixed potassium. In contrast, the redclay soils of eastern Wisconsin areexamples of soils that containsignificant amounts of slowly availablepotassium.
Readily available potassiumis dissolved in soil water or held on thesurface of clay particles, within“expanded” clay layers, or other soilcolloids. Dissolved potassium levels insoil water are usually 5 to 10 ppm.Plants absorb dissolved potassiumreadily, and as soon as theconcentration of potassium in the soilsolution drops, more is released intothe solution from the exchangeableforms. Most soil tests for availablepotassium measure the readily availableforms but not the unavailable andslowly available forms.
Since clay and organic matterparticles hold potassium ions in anexchangeable or available form,potassium does not leach from silty orclayey soils. Some leaching may takeplace in very sandy soils because sandy
soils do not contain enough clay tohold the potassium.
Organic matter particles hold mostpositively charged nutrients tightly.Potassium is an exception because theattraction between potassium ions andorganic matter particles is relativelyweak. Consequently, some potassiumleaches from organic soils (peats andmucks). Loss of potassium by leachingis one reason sandy and organic soilsoften test relatively low in availablepotassium, especially when tested in thespring. These soils require preciseannual potassium applications, since itis not possible to build up highpotassium reserves.
Figure 9-5 illustrates the forms andreactions of potassium in soil. Plantstake up potassium from the soilsolution, but this is rapidly replenished
M A N A G E M E N T O F W I S C O N S I N S O I L S90
K+
MicasFeldsparsClay minerals
K+ NH4+ K+Mg++Ca++Readily available
exchangeable Kwithin expanded clay
K+ NH4+ K+Mg++Ca++
Slowly availablefixed K withincollapsed clay
Slow
➡Rapid
➡
➡
Slow
Soil waterSoil organic matter
ResidueManureFertilizer
Crop harvest➡
➡
➡
Very slow
K+
➡
Figure 9-5. Forms and availability of soil potassium.
C-9 10/18/05 11:14 AM Page 90
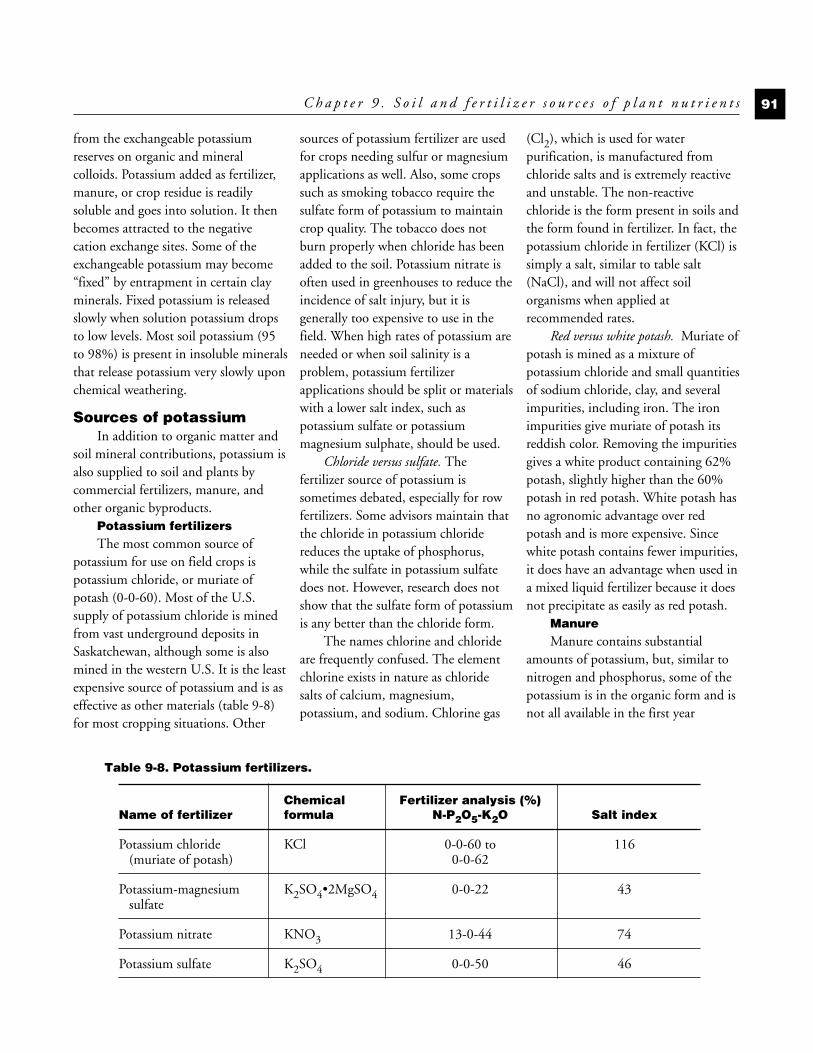
from the exchangeable potassiumreserves on organic and mineralcolloids. Potassium added as fertilizer,manure, or crop residue is readilysoluble and goes into solution. It thenbecomes attracted to the negativecation exchange sites. Some of theexchangeable potassium may become“fixed” by entrapment in certain clayminerals. Fixed potassium is releasedslowly when solution potassium dropsto low levels. Most soil potassium (95to 98%) is present in insoluble mineralsthat release potassium very slowly uponchemical weathering.
Sources of potassiumIn addition to organic matter and
soil mineral contributions, potassium isalso supplied to soil and plants bycommercial fertilizers, manure, andother organic byproducts.
Potassium fertilizersThe most common source of
potassium for use on field crops ispotassium chloride, or muriate ofpotash (0-0-60). Most of the U.S.supply of potassium chloride is minedfrom vast underground deposits inSaskatchewan, although some is alsomined in the western U.S. It is the leastexpensive source of potassium and is aseffective as other materials (table 9-8)for most cropping situations. Other
sources of potassium fertilizer are usedfor crops needing sulfur or magnesiumapplications as well. Also, some cropssuch as smoking tobacco require thesulfate form of potassium to maintaincrop quality. The tobacco does notburn properly when chloride has beenadded to the soil. Potassium nitrate isoften used in greenhouses to reduce theincidence of salt injury, but it isgenerally too expensive to use in thefield. When high rates of potassium areneeded or when soil salinity is aproblem, potassium fertilizerapplications should be split or materialswith a lower salt index, such aspotassium sulfate or potassiummagnesium sulphate, should be used.
Chloride versus sulfate. Thefertilizer source of potassium issometimes debated, especially for rowfertilizers. Some advisors maintain thatthe chloride in potassium chloridereduces the uptake of phosphorus,while the sulfate in potassium sulfatedoes not. However, research does notshow that the sulfate form of potassiumis any better than the chloride form.
The names chlorine and chlorideare frequently confused. The elementchlorine exists in nature as chloridesalts of calcium, magnesium,potassium, and sodium. Chlorine gas
(Cl2), which is used for waterpurification, is manufactured fromchloride salts and is extremely reactiveand unstable. The non-reactivechloride is the form present in soils andthe form found in fertilizer. In fact, thepotassium chloride in fertilizer (KCl) issimply a salt, similar to table salt(NaCl), and will not affect soilorganisms when applied atrecommended rates.
Red versus white potash. Muriate ofpotash is mined as a mixture ofpotassium chloride and small quantitiesof sodium chloride, clay, and severalimpurities, including iron. The ironimpurities give muriate of potash itsreddish color. Removing the impuritiesgives a white product containing 62%potash, slightly higher than the 60%potash in red potash. White potash hasno agronomic advantage over redpotash and is more expensive. Sincewhite potash contains fewer impurities,it does have an advantage when used ina mixed liquid fertilizer because it doesnot precipitate as easily as red potash.
ManureManure contains substantial
amounts of potassium, but, similar tonitrogen and phosphorus, some of thepotassium is in the organic form and isnot all available in the first year
C h a p t e r 9 . S o i l a n d f e r t i l i z e r s o u r c e s o f p l a n t n u t r i e n t s 91
Table 9-8. Potassium fertilizers.
Chemical Fertilizer analysis (%)Name of fertilizer formula N-P2O5-K2O Salt index
Potassium chloride KCl 0-0-60 to 116(muriate of potash) 0-0-62
Potassium-magnesium K2SO4•2MgSO4 0-0-22 43sulfate
Potassium nitrate KNO3 13-0-44 74
Potassium sulfate K2SO4 0-0-50 46
C-9 10/18/05 11:14 AM Page 91

following application. The amount ofmanure potassium available to a cropdepends on the type of manure, theapplication rate, and the consecutiveyears of application. Fertilizerpotassium applications should bereduced or eliminated followingmanure applications. Table 9-9 listsfirst-year potassium credits for solidand liquid manure. Additionalinformation on using manure as anutrient resource can be found inchapter 10.
Secondarynutrients
Calcium, magnesium, and sulfurare known as secondary nutrients, butthis does not mean that they play asecondary role in plant nutrition. Theysimply do not limit plant growth asfrequently as nitrogen, phosphorus, orpotassium, the primary nutrients.
CalciumCalcium (Ca) is relatively
abundant in soils and rarely limits cropproduction. It makes up about 3.6% ofthe earth’s crust. It is present in soilminerals such as amphibole, apatite,calcite, dolomite, feldspar, gypsum, andpyroxene. Calcium is a component ofcell walls and is also important for celldivision and elongation, permeabilityof cell membranes, and nitrogenmetabolism. It is different from mostplant nutrients in that it is only movedwithin the plant by the water movingfrom the roots through the leaves.
Calcium deficiency is rare forWisconsin field crops. The few knowninstances were usually associated withacid soils (pH 5.0 or less) low inorganic matter. When calcium isdeficient, a plant’s terminal buds androots fail to develop. Deficiencysymptoms show up first at the growingpoints because calcium is immobile inplants. In calcium-deficient corn, thenew leaf tips stick together and prevent
the normal emergence and unfolding ofnew leaves, a condition known asbuggy whipping. However, otherstresses such as herbicide injury morecommonly cause buggy whipping.
Reaction in soils. Calcium isthe predominant positively charged ion(Ca++) held on soil clay and organicmatter particles because it is held moretightly than magnesium (Mg++),potassium (K+), and most otherexchangeable cations. Parent materialsfrom which soils are formed alsousually contain more calcium thanmagnesium or potassium. Therefore,soils normally have large amounts ofexchangeable calcium (300 to 5000ppm). Leaching of calcium throughsoils does not normally occur to anyappreciable extent because of itsrelatively strong attraction to thesurface of clay particles.
Calcium/magnesium ratios.Claims regarding the “balance” ofcalcium and magnesium and the needto adjust the ratio of calcium to
M A N A G E M E N T O F W I S C O N S I N S O I L S92
Table 9-9. Potassium content and first-year credits for solid and liquid manure.
Total K2O ——— K2O content of manure ———Type of available in —— Solid —— —— Liquid ——manure first year Total Credit Total Credit
— % — —— lb/ton —— — lb/1,000 gal —
Beef 80 11 9 20 16
Dairy 80 9 7 20 16
Poultry 80 30 24 12 10
Swine 80 9 7 30a 24b
a Value for liquid indoor-pit swine manure. Use 20 and 22 for liquid outdoor-pit and liquid, farrow-nursery, indoor-pitswine manure, respectively.
b Value for liquid indoor-pit swine manure. Use 16 and 18 for liquid outdoor-pit and liquid, farrow-nursery, indoor-pitswine manure, respectively.
Adapted from: USDA-NRCS. 2005. Wisconsin Field Office Technical Guide. Sec. IV. Spec. 590.
C-9 10/18/05 11:14 AM Page 92
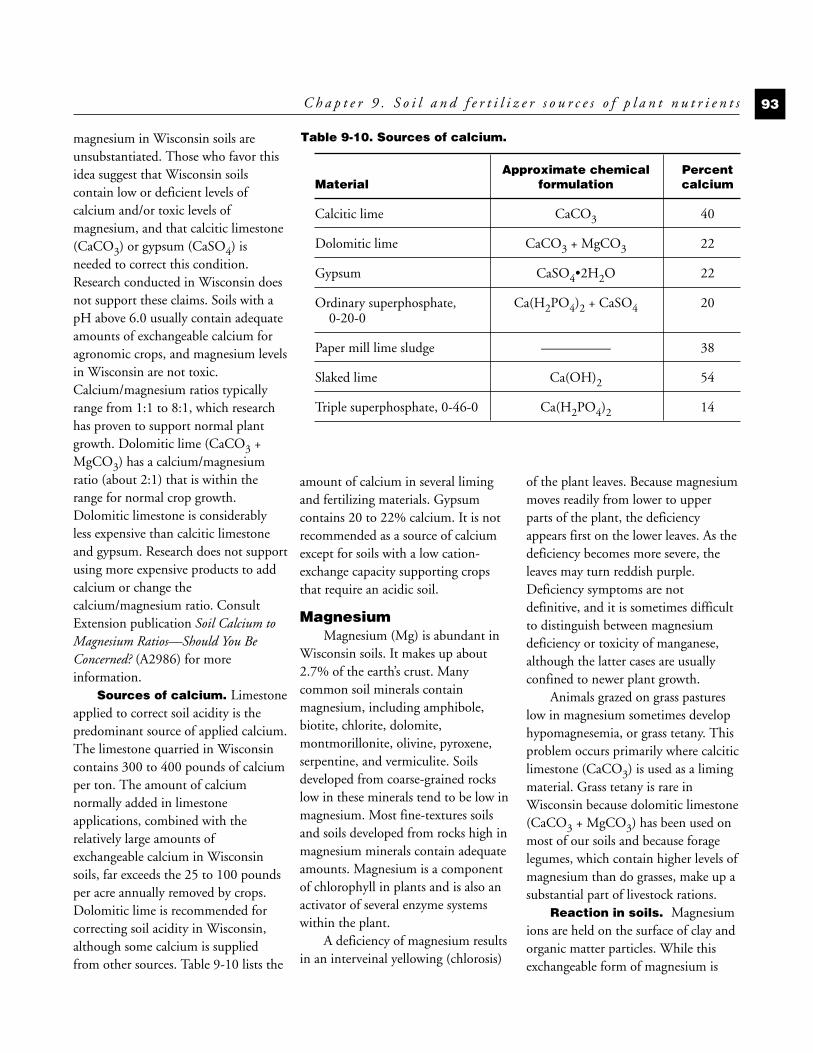
magnesium in Wisconsin soils areunsubstantiated. Those who favor thisidea suggest that Wisconsin soilscontain low or deficient levels ofcalcium and/or toxic levels ofmagnesium, and that calcitic limestone(CaCO3) or gypsum (CaSO4) isneeded to correct this condition.Research conducted in Wisconsin doesnot support these claims. Soils with apH above 6.0 usually contain adequateamounts of exchangeable calcium foragronomic crops, and magnesium levelsin Wisconsin are not toxic.Calcium/magnesium ratios typicallyrange from 1:1 to 8:1, which researchhas proven to support normal plantgrowth. Dolomitic lime (CaCO3 +MgCO3) has a calcium/magnesiumratio (about 2:1) that is within therange for normal crop growth.Dolomitic limestone is considerablyless expensive than calcitic limestoneand gypsum. Research does not supportusing more expensive products to addcalcium or change thecalcium/magnesium ratio. ConsultExtension publication Soil Calcium toMagnesium Ratios—Should You BeConcerned? (A2986) for moreinformation.
Sources of calcium. Limestoneapplied to correct soil acidity is thepredominant source of applied calcium.The limestone quarried in Wisconsincontains 300 to 400 pounds of calciumper ton. The amount of calciumnormally added in limestoneapplications, combined with therelatively large amounts ofexchangeable calcium in Wisconsinsoils, far exceeds the 25 to 100 poundsper acre annually removed by crops.Dolomitic lime is recommended forcorrecting soil acidity in Wisconsin,although some calcium is suppliedfrom other sources. Table 9-10 lists the
amount of calcium in several limingand fertilizing materials. Gypsumcontains 20 to 22% calcium. It is notrecommended as a source of calciumexcept for soils with a low cation-exchange capacity supporting cropsthat require an acidic soil.
MagnesiumMagnesium (Mg) is abundant in
Wisconsin soils. It makes up about2.7% of the earth’s crust. Manycommon soil minerals containmagnesium, including amphibole,biotite, chlorite, dolomite,montmorillonite, olivine, pyroxene,serpentine, and vermiculite. Soilsdeveloped from coarse-grained rockslow in these minerals tend to be low inmagnesium. Most fine-textures soilsand soils developed from rocks high inmagnesium minerals contain adequateamounts. Magnesium is a componentof chlorophyll in plants and is also anactivator of several enzyme systemswithin the plant.
A deficiency of magnesium resultsin an interveinal yellowing (chlorosis)
of the plant leaves. Because magnesiummoves readily from lower to upperparts of the plant, the deficiencyappears first on the lower leaves. As thedeficiency becomes more severe, theleaves may turn reddish purple.Deficiency symptoms are notdefinitive, and it is sometimes difficultto distinguish between magnesiumdeficiency or toxicity of manganese,although the latter cases are usuallyconfined to newer plant growth.
Animals grazed on grass pastureslow in magnesium sometimes develophypomagnesemia, or grass tetany. Thisproblem occurs primarily where calciticlimestone (CaCO3) is used as a limingmaterial. Grass tetany is rare inWisconsin because dolomitic limestone(CaCO3 + MgCO3) has been used onmost of our soils and because foragelegumes, which contain higher levels ofmagnesium than do grasses, make up asubstantial part of livestock rations.
Reaction in soils. Magnesiumions are held on the surface of clay andorganic matter particles. While thisexchangeable form of magnesium is
C h a p t e r 9 . S o i l a n d f e r t i l i z e r s o u r c e s o f p l a n t n u t r i e n t s 93
Table 9-10. Sources of calcium.
Approximate chemical PercentMaterial formulation calcium
Calcitic lime CaCO3 40
Dolomitic lime CaCO3 + MgCO3 22
Gypsum CaSO4•2H2O 22
Ordinary superphosphate, Ca(H2PO4)2 + CaSO4 200-20-0
Paper mill lime sludge ————— 38
Slaked lime Ca(OH)2 54
Triple superphosphate, 0-46-0 Ca(H2PO4)2 14
C-9 10/18/05 11:14 AM Page 93
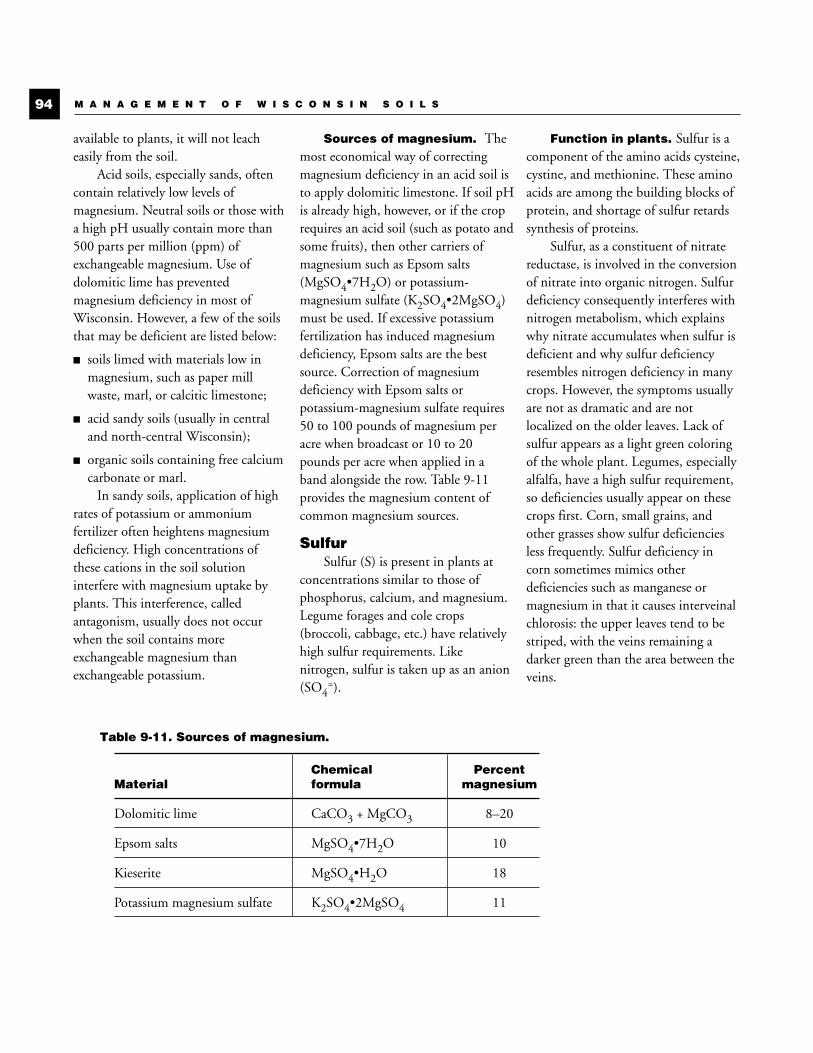
available to plants, it will not leacheasily from the soil.
Acid soils, especially sands, oftencontain relatively low levels ofmagnesium. Neutral soils or those witha high pH usually contain more than500 parts per million (ppm) ofexchangeable magnesium. Use ofdolomitic lime has preventedmagnesium deficiency in most ofWisconsin. However, a few of the soilsthat may be deficient are listed below:
■ soils limed with materials low inmagnesium, such as paper millwaste, marl, or calcitic limestone;
■ acid sandy soils (usually in centraland north-central Wisconsin);
■ organic soils containing free calciumcarbonate or marl.
In sandy soils, application of highrates of potassium or ammoniumfertilizer often heightens magnesiumdeficiency. High concentrations ofthese cations in the soil solutioninterfere with magnesium uptake byplants. This interference, calledantagonism, usually does not occurwhen the soil contains moreexchangeable magnesium thanexchangeable potassium.
Sources of magnesium. Themost economical way of correctingmagnesium deficiency in an acid soil isto apply dolomitic limestone. If soil pHis already high, however, or if the croprequires an acid soil (such as potato andsome fruits), then other carriers ofmagnesium such as Epsom salts(MgSO4•7H2O) or potassium-magnesium sulfate (K2SO4•2MgSO4)must be used. If excessive potassiumfertilization has induced magnesiumdeficiency, Epsom salts are the bestsource. Correction of magnesiumdeficiency with Epsom salts orpotassium-magnesium sulfate requires50 to 100 pounds of magnesium peracre when broadcast or 10 to 20pounds per acre when applied in aband alongside the row. Table 9-11provides the magnesium content ofcommon magnesium sources.
SulfurSulfur (S) is present in plants at
concentrations similar to those ofphosphorus, calcium, and magnesium.Legume forages and cole crops(broccoli, cabbage, etc.) have relativelyhigh sulfur requirements. Likenitrogen, sulfur is taken up as an anion(SO4
=).
Function in plants. Sulfur is acomponent of the amino acids cysteine,cystine, and methionine. These aminoacids are among the building blocks ofprotein, and shortage of sulfur retardssynthesis of proteins.
Sulfur, as a constituent of nitratereductase, is involved in the conversionof nitrate into organic nitrogen. Sulfurdeficiency consequently interferes withnitrogen metabolism, which explainswhy nitrate accumulates when sulfur isdeficient and why sulfur deficiencyresembles nitrogen deficiency in manycrops. However, the symptoms usuallyare not as dramatic and are notlocalized on the older leaves. Lack ofsulfur appears as a light green coloringof the whole plant. Legumes, especiallyalfalfa, have a high sulfur requirement,so deficiencies usually appear on thesecrops first. Corn, small grains, andother grasses show sulfur deficienciesless frequently. Sulfur deficiency incorn sometimes mimics otherdeficiencies such as manganese ormagnesium in that it causes interveinalchlorosis: the upper leaves tend to bestriped, with the veins remaining adarker green than the area between theveins.
M A N A G E M E N T O F W I S C O N S I N S O I L S94
Table 9-11. Sources of magnesium.
Chemical Percent Material formula magnesium
Dolomitic lime CaCO3 + MgCO3 8–20
Epsom salts MgSO4•7H2O 10
Kieserite MgSO4•H2O 18
Potassium magnesium sulfate K2SO4•2MgSO4 11
C-9 10/18/05 11:14 AM Page 94
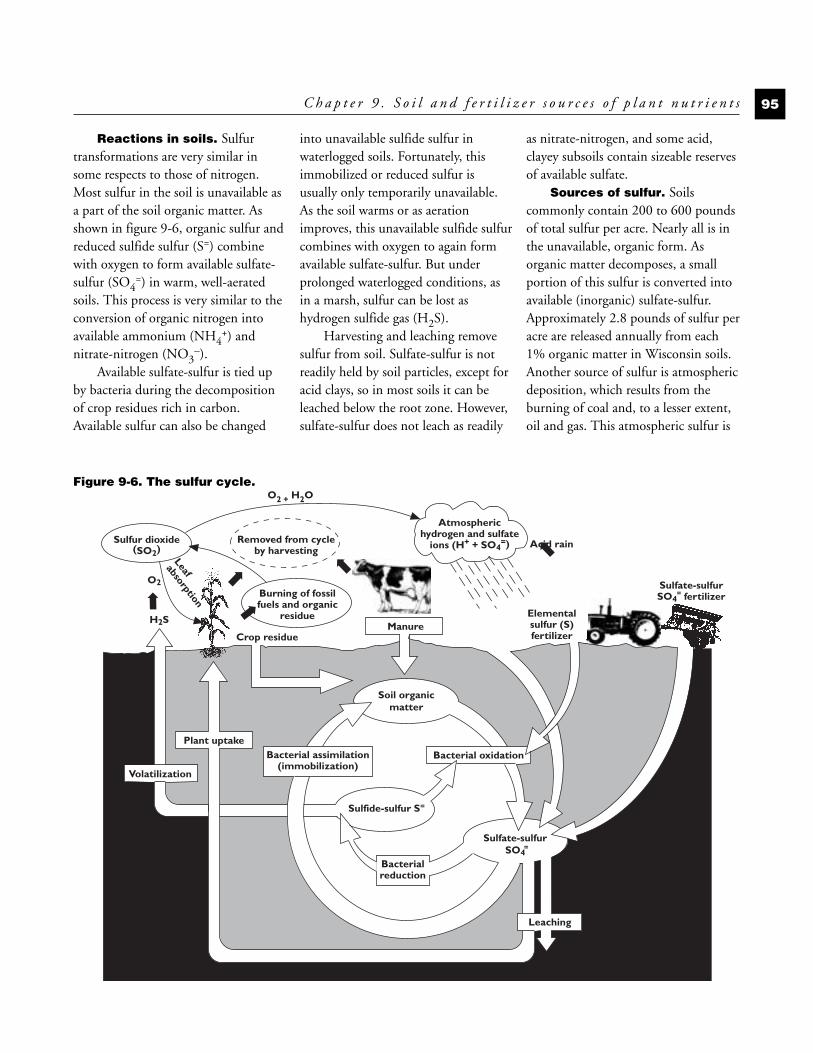
Reactions in soils. Sulfurtransformations are very similar insome respects to those of nitrogen.Most sulfur in the soil is unavailable asa part of the soil organic matter. Asshown in figure 9-6, organic sulfur andreduced sulfide sulfur (S=) combinewith oxygen to form available sulfate-sulfur (SO4
=) in warm, well-aeratedsoils. This process is very similar to theconversion of organic nitrogen intoavailable ammonium (NH4
+) andnitrate-nitrogen (NO3
–).Available sulfate-sulfur is tied up
by bacteria during the decompositionof crop residues rich in carbon.Available sulfur can also be changed
into unavailable sulfide sulfur inwaterlogged soils. Fortunately, thisimmobilized or reduced sulfur isusually only temporarily unavailable.As the soil warms or as aerationimproves, this unavailable sulfide sulfurcombines with oxygen to again formavailable sulfate-sulfur. But underprolonged waterlogged conditions, asin a marsh, sulfur can be lost ashydrogen sulfide gas (H2S).
Harvesting and leaching removesulfur from soil. Sulfate-sulfur is notreadily held by soil particles, except foracid clays, so in most soils it can beleached below the root zone. However,sulfate-sulfur does not leach as readily
as nitrate-nitrogen, and some acid,clayey subsoils contain sizeable reservesof available sulfate.
Sources of sulfur. Soilscommonly contain 200 to 600 poundsof total sulfur per acre. Nearly all is inthe unavailable, organic form. Asorganic matter decomposes, a smallportion of this sulfur is converted intoavailable (inorganic) sulfate-sulfur.Approximately 2.8 pounds of sulfur peracre are released annually from each1% organic matter in Wisconsin soils.Another source of sulfur is atmosphericdeposition, which results from theburning of coal and, to a lesser extent,oil and gas. This atmospheric sulfur is
C h a p t e r 9 . S o i l a n d f e r t i l i z e r s o u r c e s o f p l a n t n u t r i e n t s 95
Soil organicmatter
Sulfate-sulfurSO4
=
ManureCrop residue
Plant uptake
H2S
Removed from cycleby harvesting
Bacterialreduction
Sulfide-sulfur S=
Bacterial assimilation(immobilization)
Bacterial oxidation
Volatilization
Elemental sulfur (S)fertilizer
Leaching
Sulfate-sulfurSO4 fertilizer=
Acid rain➡➡
Sulfur dioxide(SO2)
O2Burning of fossil fuels and organic
residue
O2 + H2O
➡
Atmospherichydrogen and sulfate
ions (H+ + SO4=)
➡
Leaf
absorption ➡
Figure 9-6. The sulfur cycle.
C-9 10/18/05 11:14 AM Page 95
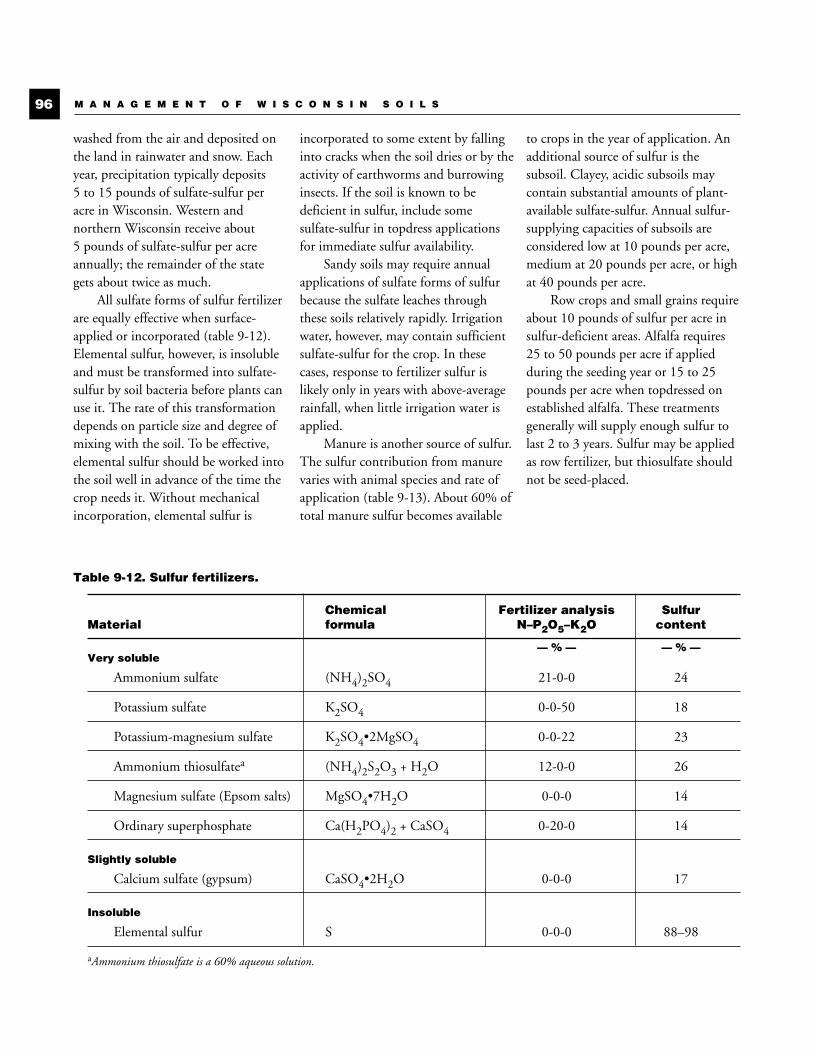
washed from the air and deposited onthe land in rainwater and snow. Eachyear, precipitation typically deposits5 to 15 pounds of sulfate-sulfur peracre in Wisconsin. Western andnorthern Wisconsin receive about5 pounds of sulfate-sulfur per acreannually; the remainder of the stategets about twice as much.
All sulfate forms of sulfur fertilizerare equally effective when surface-applied or incorporated (table 9-12).Elemental sulfur, however, is insolubleand must be transformed into sulfate-sulfur by soil bacteria before plants canuse it. The rate of this transformationdepends on particle size and degree ofmixing with the soil. To be effective,elemental sulfur should be worked intothe soil well in advance of the time thecrop needs it. Without mechanicalincorporation, elemental sulfur is
incorporated to some extent by fallinginto cracks when the soil dries or by theactivity of earthworms and burrowinginsects. If the soil is known to bedeficient in sulfur, include somesulfate-sulfur in topdress applicationsfor immediate sulfur availability.
Sandy soils may require annualapplications of sulfate forms of sulfurbecause the sulfate leaches throughthese soils relatively rapidly. Irrigationwater, however, may contain sufficientsulfate-sulfur for the crop. In thesecases, response to fertilizer sulfur islikely only in years with above-averagerainfall, when little irrigation water isapplied.
Manure is another source of sulfur.The sulfur contribution from manurevaries with animal species and rate ofapplication (table 9-13). About 60% oftotal manure sulfur becomes available
to crops in the year of application. Anadditional source of sulfur is thesubsoil. Clayey, acidic subsoils maycontain substantial amounts of plant-available sulfate-sulfur. Annual sulfur-supplying capacities of subsoils areconsidered low at 10 pounds per acre,medium at 20 pounds per acre, or highat 40 pounds per acre.
Row crops and small grains requireabout 10 pounds of sulfur per acre insulfur-deficient areas. Alfalfa requires25 to 50 pounds per acre if appliedduring the seeding year or 15 to 25pounds per acre when topdressed onestablished alfalfa. These treatmentsgenerally will supply enough sulfur tolast 2 to 3 years. Sulfur may be appliedas row fertilizer, but thiosulfate shouldnot be seed-placed.
M A N A G E M E N T O F W I S C O N S I N S O I L S96
Table 9-12. Sulfur fertilizers.
Chemical Fertilizer analysis SulfurMaterial formula N–P2O5–K2O content
Very soluble— % — — % —
Ammonium sulfate (NH4)2SO4 21-0-0 24
Potassium sulfate K2SO4 0-0-50 18
Potassium-magnesium sulfate K2SO4•2MgSO4 0-0-22 23
Ammonium thiosulfatea (NH4)2S2O3 + H2O 12-0-0 26
Magnesium sulfate (Epsom salts) MgSO4•7H2O 0-0-0 14
Ordinary superphosphate Ca(H2PO4)2 + CaSO4 0-20-0 14
Slightly soluble
Calcium sulfate (gypsum) CaSO4•2H2O 0-0-0 17
Insoluble
Elemental sulfur S 0-0-0 88–98
aAmmonium thiosulfate is a 60% aqueous solution.
C-9 10/18/05 11:14 AM Page 96
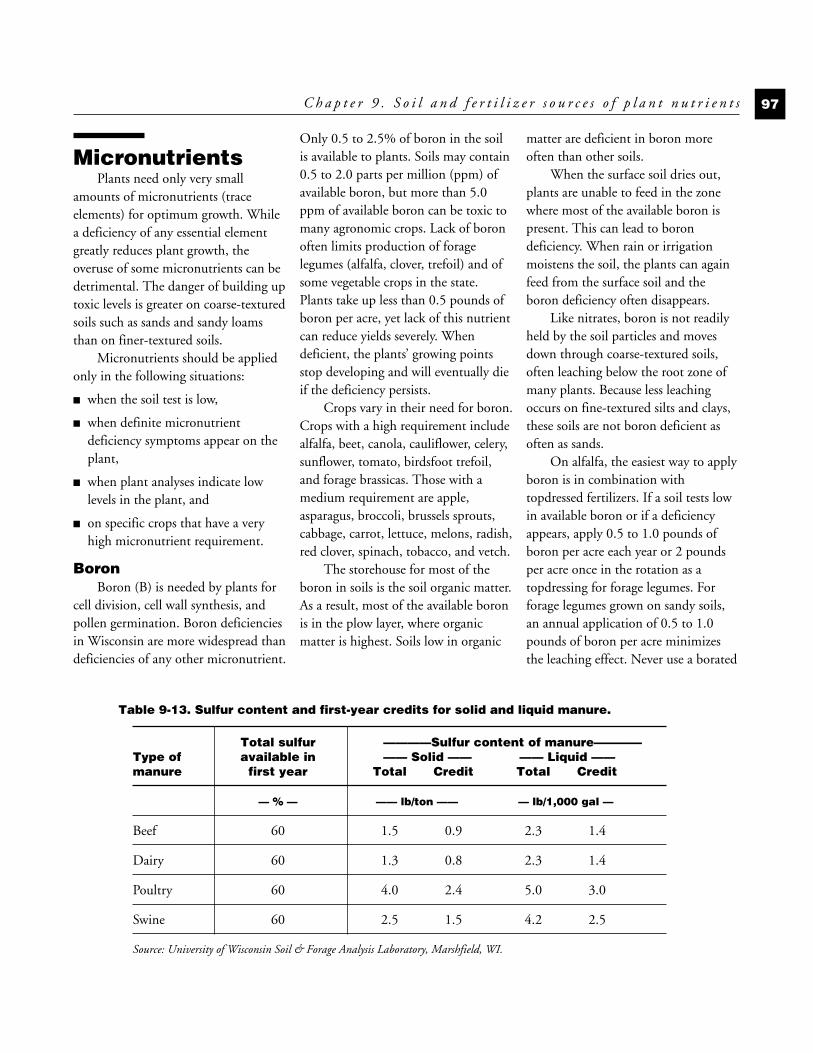
MicronutrientsPlants need only very small
amounts of micronutrients (traceelements) for optimum growth. Whilea deficiency of any essential elementgreatly reduces plant growth, theoveruse of some micronutrients can bedetrimental. The danger of building uptoxic levels is greater on coarse-texturedsoils such as sands and sandy loamsthan on finer-textured soils.
Micronutrients should be appliedonly in the following situations:
■ when the soil test is low,
■ when definite micronutrientdeficiency symptoms appear on theplant,
■ when plant analyses indicate lowlevels in the plant, and
■ on specific crops that have a veryhigh micronutrient requirement.
BoronBoron (B) is needed by plants for
cell division, cell wall synthesis, andpollen germination. Boron deficienciesin Wisconsin are more widespread thandeficiencies of any other micronutrient.
Only 0.5 to 2.5% of boron in the soilis available to plants. Soils may contain0.5 to 2.0 parts per million (ppm) ofavailable boron, but more than 5.0ppm of available boron can be toxic tomany agronomic crops. Lack of boronoften limits production of foragelegumes (alfalfa, clover, trefoil) and ofsome vegetable crops in the state.Plants take up less than 0.5 pounds ofboron per acre, yet lack of this nutrientcan reduce yields severely. Whendeficient, the plants’ growing pointsstop developing and will eventually dieif the deficiency persists.
Crops vary in their need for boron.Crops with a high requirement includealfalfa, beet, canola, cauliflower, celery,sunflower, tomato, birdsfoot trefoil,and forage brassicas. Those with amedium requirement are apple,asparagus, broccoli, brussels sprouts,cabbage, carrot, lettuce, melons, radish,red clover, spinach, tobacco, and vetch.
The storehouse for most of theboron in soils is the soil organic matter.As a result, most of the available boronis in the plow layer, where organicmatter is highest. Soils low in organic
matter are deficient in boron moreoften than other soils.
When the surface soil dries out,plants are unable to feed in the zonewhere most of the available boron ispresent. This can lead to borondeficiency. When rain or irrigationmoistens the soil, the plants can againfeed from the surface soil and theboron deficiency often disappears.
Like nitrates, boron is not readilyheld by the soil particles and movesdown through coarse-textured soils,often leaching below the root zone ofmany plants. Because less leachingoccurs on fine-textured silts and clays,these soils are not boron deficient asoften as sands.
On alfalfa, the easiest way to applyboron is in combination withtopdressed fertilizers. If a soil tests lowin available boron or if a deficiencyappears, apply 0.5 to 1.0 pounds ofboron per acre each year or 2 poundsper acre once in the rotation as atopdressing for forage legumes. Forforage legumes grown on sandy soils,an annual application of 0.5 to 1.0pounds of boron per acre minimizesthe leaching effect. Never use a borated
C h a p t e r 9 . S o i l a n d f e r t i l i z e r s o u r c e s o f p l a n t n u t r i e n t s 97
Table 9-13. Sulfur content and first-year credits for solid and liquid manure.
Total sulfur ————Sulfur content of manure————Type of available in —— Solid —— —— Liquid ——manure first year Total Credit Total Credit
— % — —— lb/ton —— — lb/1,000 gal —
Beef 60 1.5 0.9 2.3 1.4
Dairy 60 1.3 0.8 2.3 1.4
Poultry 60 4.0 2.4 5.0 3.0
Swine 60 2.5 1.5 4.2 2.5
Source: University of Wisconsin Soil & Forage Analysis Laboratory, Marshfield, WI.
C-9 10/18/05 11:14 AM Page 97
fertilizer in the row for corn orsoybean, or in the drill for oats. Theboron concentrated in a band is toxicto germination of these crops and maycause severe injury.
ManganeseManganese (Mn) functions as an
enzyme activator for steps inphotosynthesis. It is an element foundin plant tissue at concentrationsranging from 10 to 500 ppm or more.In most plants, it is deficient at lessthan 10 ppm and toxic when theconcentration exceeds about 300 ppm.Deficiency symptoms are mostcommon in oats, snapbeans, andsoybeans grown in high pH (6.5 orgreater) mineral soils and neutral toalkaline organic soils. Symptoms appearas interveinal chlorosis of the youngerleaves because manganese is animmobile element. In oats, thesymptoms show up as specks of deadtissue, giving the deficiency the name“gray speck disease.”
Crops with high manganeserequirements include beans (lima,snap), lettuce, oat, onion, radish,raspberry, soybean, spinach, sorghum-sudan, and wheat. Those with mediummanganese needs are barley, beet,broccoli, brussel sprout, cabbage,carrot, cauliflower, celery, corn,cucumber, pea, potato, tobacco, andtomato.
Manganese availability increases assoil pH decreases. Manganese toxicityis common in acid soils below pH 5.5,especially when these soils are low inorganic matter and temporarilywaterlogged. Acid, sandy soils are likelyto contain high manganese levels.Crops susceptible to manganesetoxicity include asparagus, foragelegumes, mint, and pea. Manganesetoxicity of potato has also been
identified on extremely acid soils (pHless than 5.0).
One of the main reasons for limingacid soils, especially for legumes, is toprevent manganese toxicity. Theamount of manganese in solutiondecreases 100-fold for each unit rise insoil pH (as from 5.0 to 6.0). Wheremanganese deficiency exists as a resultof high pH, it is easier to correct thedeficiency by adding a manganesefertilizer than by attempting to acidifythe soil.
Broadcast applications ofmanganese fertilizer or attempts tobuild soil test manganese levels are notrecommended, particularly on highpH, high organic matter soils becauseof their capacity to rapidly fixmanganese. Band application reduceschemical fixation by reducing contactwith soil particles. Mixing manganesewith ammonium nitrogen in a fertilizerband further improves its availability asa result of the acidity produced asammonium converts to nitrate.
Although chelated manganese iseffective as a foliar application, its useas a soil application can actuallyaggravate the deficiency. Apparently,the manganese chelate converts to themore stable iron chelate causing theplant to take in more iron, whichsuppresses the uptake of manganese.
ZincZinc (Zn) is required for the
synthesis of a growth hormone(indoleacetic acid) by plants. Also, itfunctions as an enzyme activator incarbohydrate metabolism and proteinformation. Deficiency symptomsusually appear first on relatively youngleaves early in the growing season. Oncorn, a broad band of bleached tissueappears on either side of the midrib.The deficiency begins at the base of the
leaf and usually stays in the lower halfof the leaf.
In broadleaf plants, zinc deficiencyresults in a shortening of internodes(rosetting) and a decrease in leaf size(little leaf ). Snapbean develops ayellowing between the leaf veins(interveinal chlorosis). However, it isvery difficult to distinguish betweenzinc and manganese deficiencies in thiscrop.
Crops generally take up less than0.5 pounds of zinc per acre, yet whenzinc is deficient, crop yields are reducedmarkedly. Plants vary considerably intheir requirements for zinc. Crops withhigh zinc requirements include corn,onion, and spinach. Those withmedium requirements are barley, beans,beets, canola, cucumber, lettuce,lupine, potato, radish, sorghum-sudan,soybean, tobacco, and tomato. Othercrops have low zinc requirements andseldom exhibit zinc deficiency. InWisconsin, zinc deficiencies have beenobserved on corn, snapbean, and a fewother vegetable crops.
Scalped or severely eroded soils aremore apt to be zinc deficient than well-managed soils. Also, sands, sandyloams, and organic soils are more likelyto be zinc deficient than silty or clayeysoils. This is due to the fact that sandyand organic soils originally contain lowtotal zinc levels. Severe soil compactioncan also reduce zinc availability.
Soil acidity (pH) influences theavailability of zinc more than any otherfactor, with lower zinc solubility as thepH increases. Therefore, zincdeficiency usually is limited to soilswith a pH above 6.5. Overliming ofsoils, especially sands, may induce zincdeficiency.
M A N A G E M E N T O F W I S C O N S I N S O I L S98
C-9 10/18/05 11:14 AM Page 98
CopperCopper (Cu) serves as an activator
of several enzyme systems in plants. Itis present in soils at concentrations of2 to 100 ppm with an average value ofabout 30 ppm. Beets, lettuce, onion,spinach, sunflower, and tomato haverelatively high copper requirements.Copper deficiency is rare in Wisconsin.Occurrences have been confined to acidorganic soils. Organic matter bindscopper more tightly than any othermicronutrient. Copper toxicity in somesandy soils has resulted from repeateduse of copper-containing fungicidesover many years.
IronIron (Fe) is required for synthesis
of chlorophyll by plants, but it is notpart of the chlorophyll molecule. Ironis very immobile in plants, sodeficiency symptoms appear on newgrowth. The veins of young leavesremain green, but the area between theveins becomes yellow (chlorotic). Eachnew leaf emerges paler than the onebefore. Eventually, new leaves,including the veins, are creamy white,devoid of chlorophyll.
Iron deficiency has rarely beenobserved on field or vegetable crops inWisconsin, except that iron chlorosishas occasionally been observed onsoybeans grown on alkaline soils (pHabove 7.0). However, turfgrass, pin oaktrees, and some ornamentals such asyews occasionally develop irondeficiency when grown on alkalinesoils. The deficiency can be correctedby spraying the foliage several timeswith ferrous sulfate or an iron chelate.Soil applications are not very effectivebecause of the rapid transformation ofiron contained in fertilizer tounavailable forms in the soil. An
exception is soil application of thestable chelate, FeDDHA, that has hadsome success in correcting irondeficiency.
MolybdenumPlants need extremely small
amounts of molybdenum (Mo).Normal tissue concentrations are 0.03to 1 ppm. Molybdenum is required forsymbiotic nitrogen fixation and forconverting nitrate ions into organicnitrogen in the plant. Hence, the firstsymptom of molybdenum deficiency isnitrogen deficiency. If the deficiency issevere, the leaf edges of some vegetablecrops may become brown and curlupward (cupping). Cupped leaves maylook rolled and show interveinalchlorosis. Molybdenum deficiency incauliflower leads to a classic conditionknown as whiptail, in which leavessometimes appear crinkled or withered.Broccoli, cauliflower, lettuce, onion,spinach, and table beets are responsiveto this element; corn, small grains, andpotato are not.
Soil acidity has a marked influenceon the availability of molybdenum. Assoil pH decreases, the availability ofmolybdenum decreases. Liming aloneis usually enough to correct adeficiency. Legume crops grown onvery acid soils should be seed-treatedwith molybdenum. Soil applications ofmolybdenum are not recommendedbecause only 1 ounce per acre isrequired, and this amount would bedifficult to spread evenly even if mixedwith another fertilizer. Seed treatmentor foliar sprays are the recommendedapplication techniques. Followmolybdenum recommendations closelybecause excess molybdenum in feed orforage can cause animal healthproblems (molybdenosis).
ChlorineThe earth’s crust contains about
500 parts per million of chlorine (Cl),with average soil concentrationestimated at 100 ppm. Chlorine is a“universal contaminant.” It is present aschloride in ocean water and gets intothe atmosphere as ocean spray. Plantsrequire chlorine for certain photo-chemical reactions in photosynthesis.Chlorine uptake affects the degree ofhydration of plant cells and balancesthe charge of positive ions in cationtransport. Chlorine deficiency has beeninduced in the laboratory, but it hasnever been observed under fieldconditions in Wisconsin. Response tochlorine, expressed as reducedincidence of disease and higher yield insmall grains, has been observed in a fewstudies in Oregon and the Dakotas.The soils in these states have high levelsof potassium so potassium chloridefertilizer (0-0-60) is seldom applied.However, because Wisconsin soils tendto be inherently low in potassium,application of potassium chloridefertilizer and manure has precludedchlorine deficiency.
NickelNickel has recently been identified
as an essential plant nutrient. It isneeded by plants to form the enzymeurease which breaks down urea-nitrogen for plant use. Nickel is alsoinvolved in plant uptake of iron fromsoil. Deficiencies of nickel are notknown to exist in Wisconsin.Generally, there is greater concernabout nickel toxicity, particularly onsoils where sewage sludge has beenapplied. (See chapter 11 for furtherinformation.)
C h a p t e r 9 . S o i l a n d f e r t i l i z e r s o u r c e s o f p l a n t n u t r i e n t s 99
C-9 10/18/05 11:14 AM Page 99
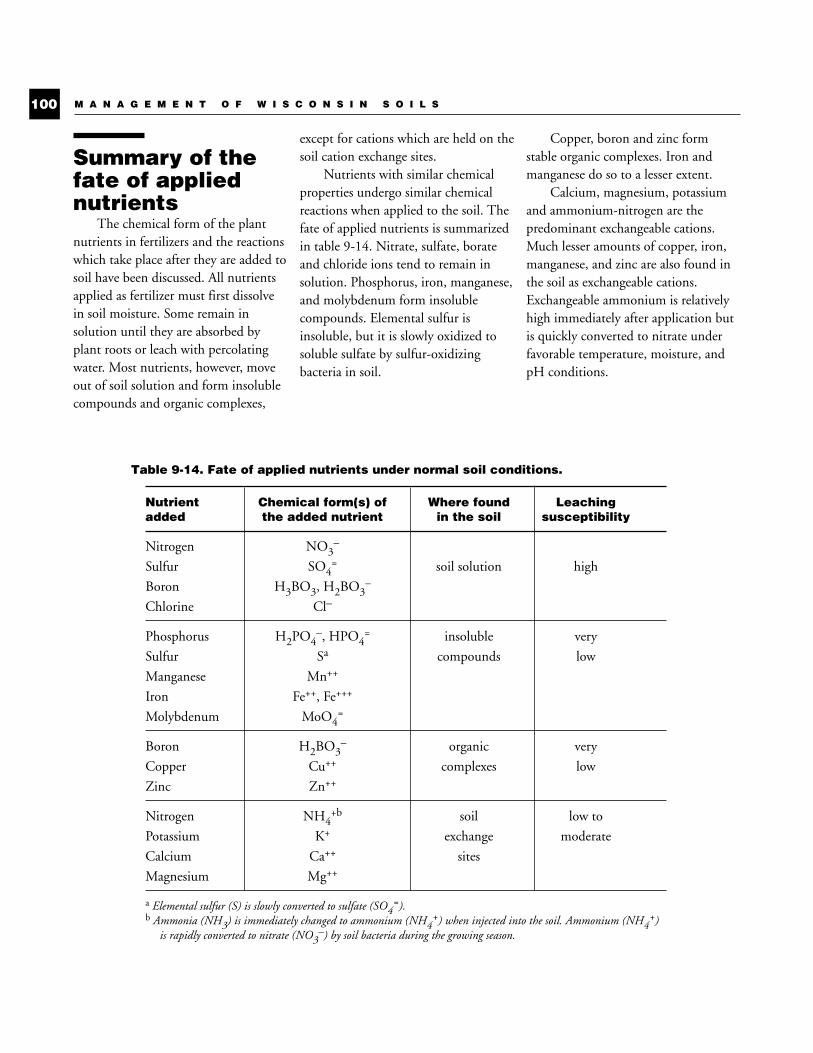
Summary of thefate of appliednutrients
The chemical form of the plantnutrients in fertilizers and the reactionswhich take place after they are added tosoil have been discussed. All nutrientsapplied as fertilizer must first dissolvein soil moisture. Some remain insolution until they are absorbed byplant roots or leach with percolatingwater. Most nutrients, however, moveout of soil solution and form insolublecompounds and organic complexes,
except for cations which are held on thesoil cation exchange sites.
Nutrients with similar chemicalproperties undergo similar chemicalreactions when applied to the soil. Thefate of applied nutrients is summarizedin table 9-14. Nitrate, sulfate, borateand chloride ions tend to remain insolution. Phosphorus, iron, manganese,and molybdenum form insolublecompounds. Elemental sulfur isinsoluble, but it is slowly oxidized tosoluble sulfate by sulfur-oxidizingbacteria in soil.
Copper, boron and zinc formstable organic complexes. Iron andmanganese do so to a lesser extent.
Calcium, magnesium, potassiumand ammonium-nitrogen are thepredominant exchangeable cations.Much lesser amounts of copper, iron,manganese, and zinc are also found inthe soil as exchangeable cations.Exchangeable ammonium is relativelyhigh immediately after application butis quickly converted to nitrate underfavorable temperature, moisture, andpH conditions.
M A N A G E M E N T O F W I S C O N S I N S O I L S100
Table 9-14. Fate of applied nutrients under normal soil conditions.
Nutrient Chemical form(s) of Where found Leachingadded the added nutrient in the soil susceptibility
Nitrogen NO3–
Sulfur SO4= soil solution high
Boron H3BO3, H2BO3–
Chlorine Cl–
Phosphorus H2PO4–, HPO4
= insoluble very
Sulfur Sa compounds low
Manganese Mn++
Iron Fe++, Fe+++
Molybdenum MoO4=
Boron H2BO3– organic very
Copper Cu++ complexes low
Zinc Zn++
Nitrogen NH4+b soil low to
Potassium K+ exchange moderate
Calcium Ca++ sites
Magnesium Mg++
a Elemental sulfur (S) is slowly converted to sulfate (SO4=).
b Ammonia (NH3) is immediately changed to ammonium (NH4+) when injected into the soil. Ammonium (NH4
+)is rapidly converted to nitrate (NO3
–) by soil bacteria during the growing season.
C-9 10/18/05 11:14 AM Page 100
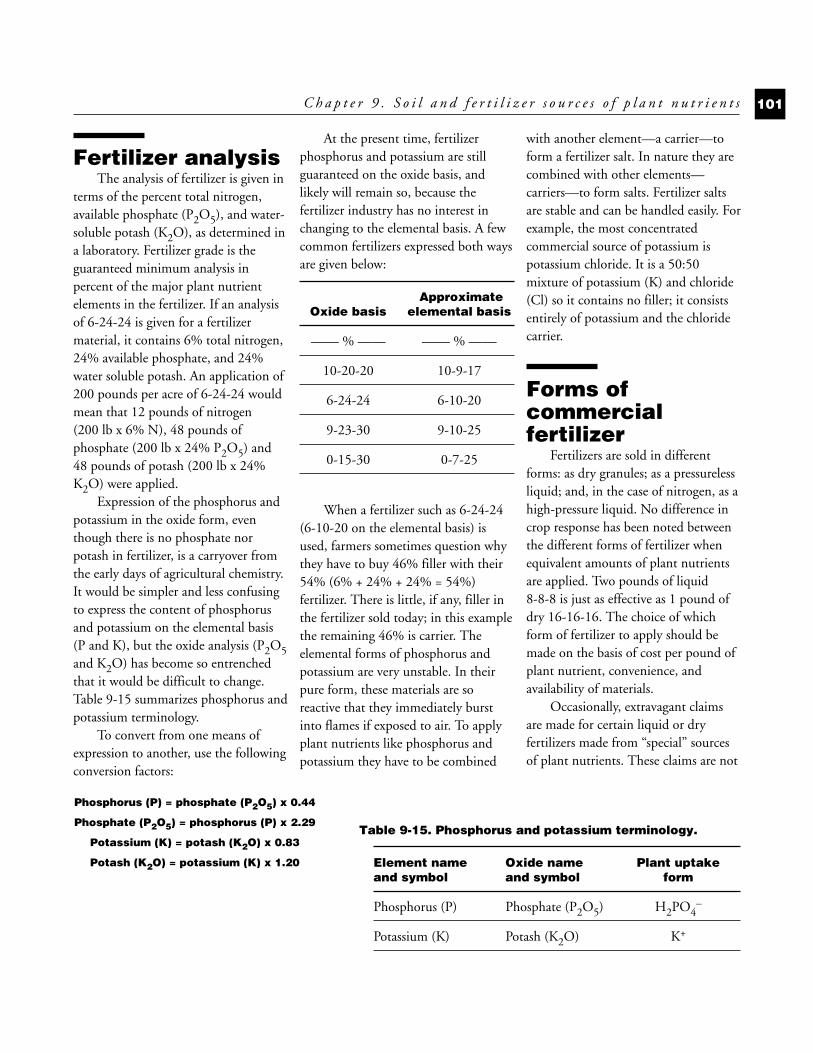
Fertilizer analysisThe analysis of fertilizer is given in
terms of the percent total nitrogen,available phosphate (P2O5), and water-soluble potash (K2O), as determined ina laboratory. Fertilizer grade is theguaranteed minimum analysis inpercent of the major plant nutrientelements in the fertilizer. If an analysisof 6-24-24 is given for a fertilizermaterial, it contains 6% total nitrogen,24% available phosphate, and 24%water soluble potash. An application of200 pounds per acre of 6-24-24 wouldmean that 12 pounds of nitrogen(200 lb x 6% N), 48 pounds ofphosphate (200 lb x 24% P2O5) and48 pounds of potash (200 lb x 24%K2O) were applied.
Expression of the phosphorus andpotassium in the oxide form, eventhough there is no phosphate norpotash in fertilizer, is a carryover fromthe early days of agricultural chemistry.It would be simpler and less confusingto express the content of phosphorusand potassium on the elemental basis(P and K), but the oxide analysis (P2O5and K2O) has become so entrenchedthat it would be difficult to change.Table 9-15 summarizes phosphorus andpotassium terminology.
To convert from one means ofexpression to another, use the followingconversion factors:
At the present time, fertilizerphosphorus and potassium are stillguaranteed on the oxide basis, andlikely will remain so, because thefertilizer industry has no interest inchanging to the elemental basis. A fewcommon fertilizers expressed both waysare given below:
ApproximateOxide basis elemental basis
—— % —— —— % ——
10-20-20 10-9-17
6-24-24 6-10-20
9-23-30 9-10-25
0-15-30 0-7-25
When a fertilizer such as 6-24-24(6-10-20 on the elemental basis) isused, farmers sometimes question whythey have to buy 46% filler with their54% (6% + 24% + 24% = 54%)fertilizer. There is little, if any, filler inthe fertilizer sold today; in this examplethe remaining 46% is carrier. Theelemental forms of phosphorus andpotassium are very unstable. In theirpure form, these materials are soreactive that they immediately burstinto flames if exposed to air. To applyplant nutrients like phosphorus andpotassium they have to be combined
with another element—a carrier—toform a fertilizer salt. In nature they arecombined with other elements—carriers—to form salts. Fertilizer saltsare stable and can be handled easily. Forexample, the most concentratedcommercial source of potassium ispotassium chloride. It is a 50:50mixture of potassium (K) and chloride(Cl) so it contains no filler; it consistsentirely of potassium and the chloridecarrier.
Forms ofcommercialfertilizer
Fertilizers are sold in differentforms: as dry granules; as a pressurelessliquid; and, in the case of nitrogen, as ahigh-pressure liquid. No difference incrop response has been noted betweenthe different forms of fertilizer whenequivalent amounts of plant nutrientsare applied. Two pounds of liquid8-8-8 is just as effective as 1 pound ofdry 16-16-16. The choice of whichform of fertilizer to apply should bemade on the basis of cost per pound ofplant nutrient, convenience, andavailability of materials.
Occasionally, extravagant claimsare made for certain liquid or dryfertilizers made from “special” sourcesof plant nutrients. These claims are not
C h a p t e r 9 . S o i l a n d f e r t i l i z e r s o u r c e s o f p l a n t n u t r i e n t s 101
Phosphorus (P) = phosphate (P2O5) x 0.44
Phosphate (P2O5) = phosphorus (P) x 2.29
Potassium (K) = potash (K2O) x 0.83
Potash (K2O) = potassium (K) x 1.20
Table 9-15. Phosphorus and potassium terminology.
Element name Oxide name Plant uptake and symbol and symbol form
Phosphorus (P) Phosphate (P2O5) H2PO4–
Potassium (K) Potash (K2O) K+
C-9 10/18/05 11:14 AM Page 101
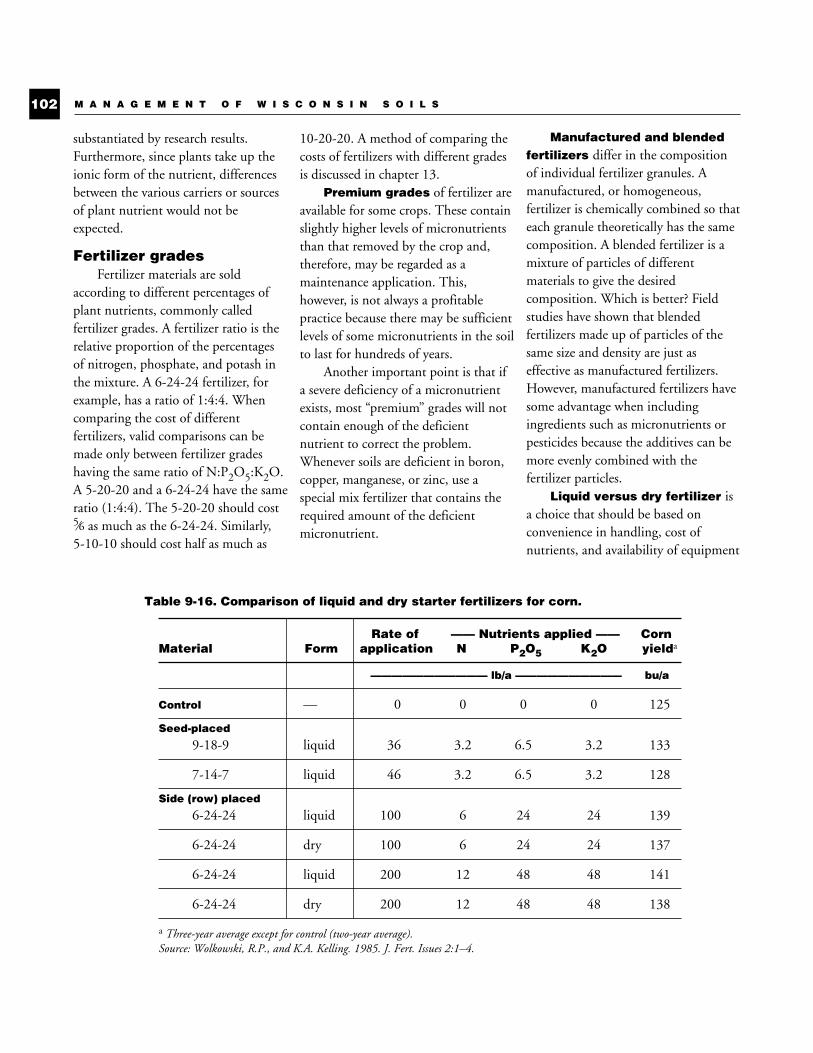
substantiated by research results.Furthermore, since plants take up theionic form of the nutrient, differencesbetween the various carriers or sourcesof plant nutrient would not beexpected.
Fertilizer gradesFertilizer materials are sold
according to different percentages ofplant nutrients, commonly calledfertilizer grades. A fertilizer ratio is therelative proportion of the percentagesof nitrogen, phosphate, and potash inthe mixture. A 6-24-24 fertilizer, forexample, has a ratio of 1:4:4. Whencomparing the cost of differentfertilizers, valid comparisons can bemade only between fertilizer gradeshaving the same ratio of N:P2O5:K2O.A 5-20-20 and a 6-24-24 have the sameratio (1:4:4). The 5-20-20 should cost5⁄6 as much as the 6-24-24. Similarly,5-10-10 should cost half as much as
10-20-20. A method of comparing thecosts of fertilizers with different gradesis discussed in chapter 13.
Premium grades of fertilizer areavailable for some crops. These containslightly higher levels of micronutrientsthan that removed by the crop and,therefore, may be regarded as amaintenance application. This,however, is not always a profitablepractice because there may be sufficientlevels of some micronutrients in the soilto last for hundreds of years.
Another important point is that ifa severe deficiency of a micronutrientexists, most “premium” grades will notcontain enough of the deficientnutrient to correct the problem.Whenever soils are deficient in boron,copper, manganese, or zinc, use aspecial mix fertilizer that contains therequired amount of the deficientmicronutrient.
Manufactured and blendedfertilizers differ in the compositionof individual fertilizer granules. Amanufactured, or homogeneous,fertilizer is chemically combined so thateach granule theoretically has the samecomposition. A blended fertilizer is amixture of particles of differentmaterials to give the desiredcomposition. Which is better? Fieldstudies have shown that blendedfertilizers made up of particles of thesame size and density are just aseffective as manufactured fertilizers.However, manufactured fertilizers havesome advantage when includingingredients such as micronutrients orpesticides because the additives can bemore evenly combined with thefertilizer particles.
Liquid versus dry fertilizer isa choice that should be based onconvenience in handling, cost ofnutrients, and availability of equipment
M A N A G E M E N T O F W I S C O N S I N S O I L S102
Table 9-16. Comparison of liquid and dry starter fertilizers for corn.
Rate of —— Nutrients applied —— CornMaterial Form application N P2O5 K2O yielda
——————————— lb/a —————————— bu/a
Control — 0 0 0 0 125
Seed-placed
9-18-9 liquid 36 3.2 6.5 3.2 133
7-14-7 liquid 46 3.2 6.5 3.2 128
Side (row) placed
6-24-24 liquid 100 6 24 24 139
6-24-24 dry 100 6 24 24 137
6-24-24 liquid 200 12 48 48 141
6-24-24 dry 200 12 48 48 138
a Three-year average except for control (two-year average).Source: Wolkowski, R.P., and K.A. Kelling. 1985. J. Fert. Issues 2:1–4.
C-9 10/18/05 11:14 AM Page 102
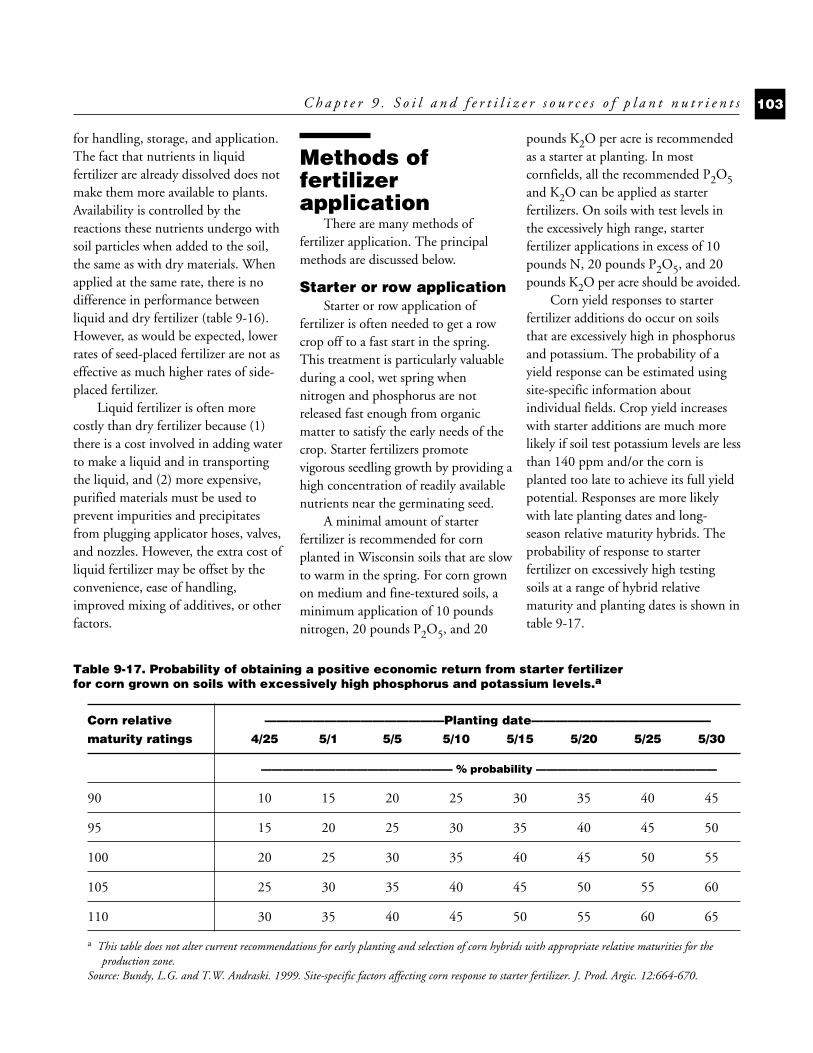
for handling, storage, and application.The fact that nutrients in liquidfertilizer are already dissolved does notmake them more available to plants.Availability is controlled by thereactions these nutrients undergo withsoil particles when added to the soil,the same as with dry materials. Whenapplied at the same rate, there is nodifference in performance betweenliquid and dry fertilizer (table 9-16).However, as would be expected, lowerrates of seed-placed fertilizer are not aseffective as much higher rates of side-placed fertilizer.
Liquid fertilizer is often morecostly than dry fertilizer because (1)there is a cost involved in adding waterto make a liquid and in transportingthe liquid, and (2) more expensive,purified materials must be used toprevent impurities and precipitatesfrom plugging applicator hoses, valves,and nozzles. However, the extra cost ofliquid fertilizer may be offset by theconvenience, ease of handling,improved mixing of additives, or otherfactors.
Methods offertilizerapplication
There are many methods offertilizer application. The principalmethods are discussed below.
Starter or row application Starter or row application of
fertilizer is often needed to get a rowcrop off to a fast start in the spring.This treatment is particularly valuableduring a cool, wet spring whennitrogen and phosphorus are notreleased fast enough from organicmatter to satisfy the early needs of thecrop. Starter fertilizers promotevigorous seedling growth by providing ahigh concentration of readily availablenutrients near the germinating seed.
A minimal amount of starterfertilizer is recommended for cornplanted in Wisconsin soils that are slowto warm in the spring. For corn grownon medium and fine-textured soils, aminimum application of 10 poundsnitrogen, 20 pounds P2O5, and 20
pounds K2O per acre is recommendedas a starter at planting. In mostcornfields, all the recommended P2O5and K2O can be applied as starterfertilizers. On soils with test levels inthe excessively high range, starterfertilizer applications in excess of 10pounds N, 20 pounds P2O5, and 20pounds K2O per acre should be avoided.
Corn yield responses to starterfertilizer additions do occur on soilsthat are excessively high in phosphorusand potassium. The probability of ayield response can be estimated usingsite-specific information aboutindividual fields. Crop yield increaseswith starter additions are much morelikely if soil test potassium levels are lessthan 140 ppm and/or the corn isplanted too late to achieve its full yieldpotential. Responses are more likelywith late planting dates and long-season relative maturity hybrids. Theprobability of response to starterfertilizer on excessively high testingsoils at a range of hybrid relativematurity and planting dates is shown intable 9-17.
C h a p t e r 9 . S o i l a n d f e r t i l i z e r s o u r c e s o f p l a n t n u t r i e n t s 103
Table 9-17. Probability of obtaining a positive economic return from starter fertilizer for corn grown on soils with excessively high phosphorus and potassium levels.a
Corn relative ———————————————Planting date———————————————maturity ratings 4/25 5/1 5/5 5/10 5/15 5/20 5/25 5/30
—————————————————— % probability —————————————————
90 10 15 20 25 30 35 40 45
95 15 20 25 30 35 40 45 50
100 20 25 30 35 40 45 50 55
105 25 30 35 40 45 50 55 60
110 30 35 40 45 50 55 60 65
a This table does not alter current recommendations for early planting and selection of corn hybrids with appropriate relative maturities for theproduction zone.
Source: Bundy, L.G. and T.W. Andraski. 1999. Site-specific factors affecting corn response to starter fertilizer. J. Prod. Argic. 12:664-670.
C-9 10/18/05 11:14 AM Page 103
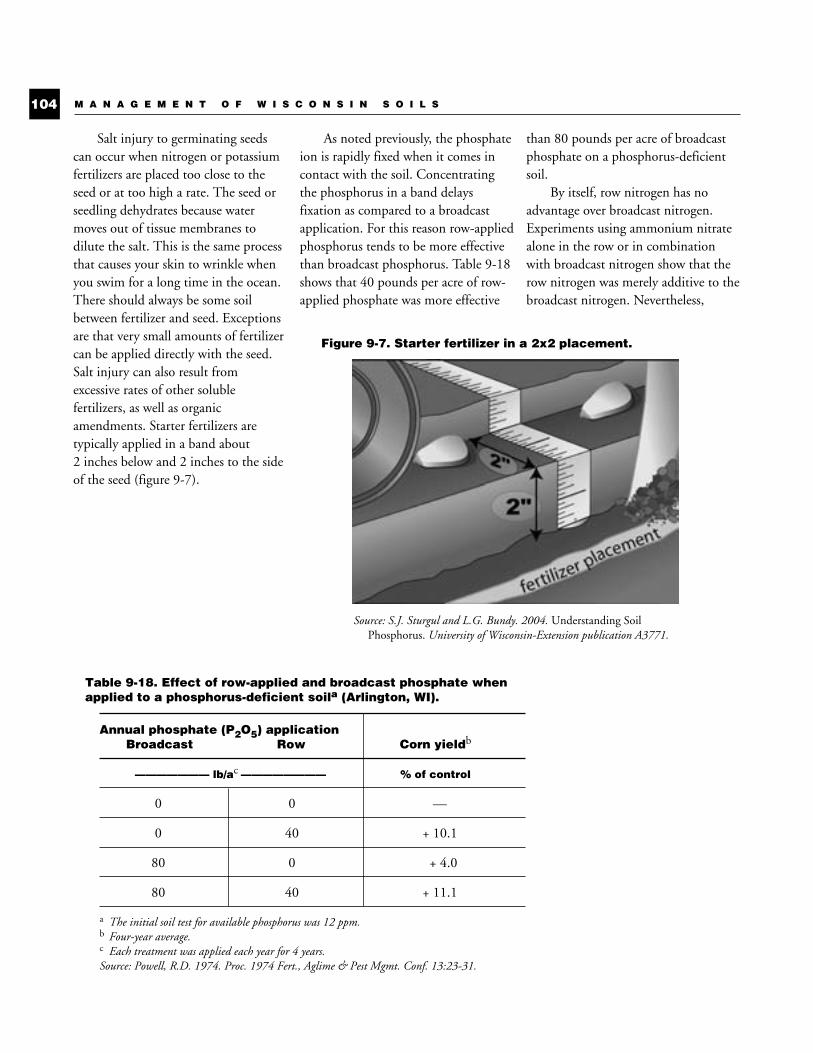
Salt injury to germinating seedscan occur when nitrogen or potassiumfertilizers are placed too close to theseed or at too high a rate. The seed orseedling dehydrates because watermoves out of tissue membranes todilute the salt. This is the same processthat causes your skin to wrinkle whenyou swim for a long time in the ocean.There should always be some soilbetween fertilizer and seed. Exceptionsare that very small amounts of fertilizercan be applied directly with the seed.Salt injury can also result fromexcessive rates of other solublefertilizers, as well as organicamendments. Starter fertilizers aretypically applied in a band about2 inches below and 2 inches to the sideof the seed (figure 9-7).
As noted previously, the phosphateion is rapidly fixed when it comes incontact with the soil. Concentratingthe phosphorus in a band delaysfixation as compared to a broadcastapplication. For this reason row-appliedphosphorus tends to be more effectivethan broadcast phosphorus. Table 9-18shows that 40 pounds per acre of row-applied phosphate was more effective
than 80 pounds per acre of broadcastphosphate on a phosphorus-deficientsoil.
By itself, row nitrogen has noadvantage over broadcast nitrogen.Experiments using ammonium nitratealone in the row or in combinationwith broadcast nitrogen show that therow nitrogen was merely additive to thebroadcast nitrogen. Nevertheless,
M A N A G E M E N T O F W I S C O N S I N S O I L S104
Figure 9-7. Starter fertilizer in a 2x2 placement.
Source: S.J. Sturgul and L.G. Bundy. 2004. Understanding SoilPhosphorus. University of Wisconsin-Extension publication A3771.
Table 9-18. Effect of row-applied and broadcast phosphate whenapplied to a phosphorus-deficient soila (Arlington, WI).
Annual phosphate (P2O5) applicationBroadcast Row Corn yieldb
——————— lb/ac ———————— % of control
0 0 —
0 40 + 10.1
80 0 + 4.0
80 40 + 11.1
a The initial soil test for available phosphorus was 12 ppm.b Four-year average.c Each treatment was applied each year for 4 years.Source: Powell, R.D. 1974. Proc. 1974 Fert., Aglime & Pest Mgmt. Conf. 13:23-31.
C-9 10/18/05 11:15 AM Page 104
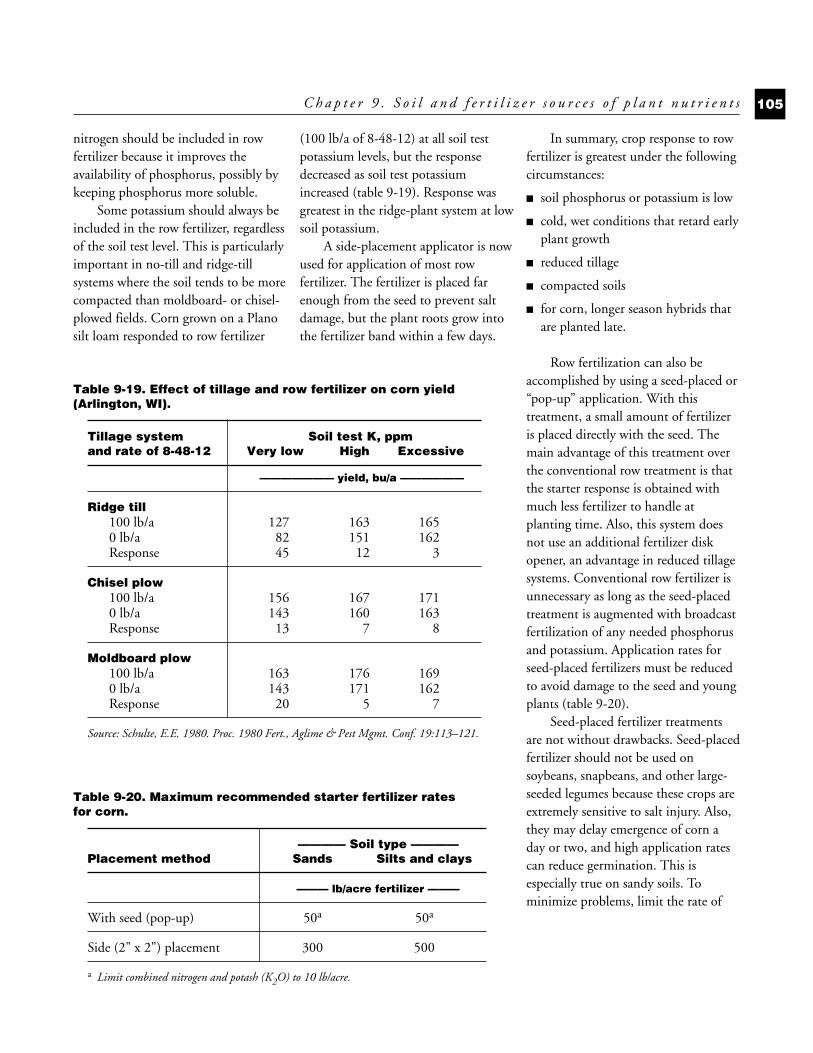
nitrogen should be included in rowfertilizer because it improves theavailability of phosphorus, possibly bykeeping phosphorus more soluble.
Some potassium should always beincluded in the row fertilizer, regardlessof the soil test level. This is particularlyimportant in no-till and ridge-tillsystems where the soil tends to be morecompacted than moldboard- or chisel-plowed fields. Corn grown on a Planosilt loam responded to row fertilizer
(100 lb/a of 8-48-12) at all soil testpotassium levels, but the responsedecreased as soil test potassiumincreased (table 9-19). Response wasgreatest in the ridge-plant system at lowsoil potassium.
A side-placement applicator is nowused for application of most rowfertilizer. The fertilizer is placed farenough from the seed to prevent saltdamage, but the plant roots grow intothe fertilizer band within a few days.
In summary, crop response to rowfertilizer is greatest under the followingcircumstances:
■ soil phosphorus or potassium is low
■ cold, wet conditions that retard earlyplant growth
■ reduced tillage
■ compacted soils
■ for corn, longer season hybrids thatare planted late.
Row fertilization can also beaccomplished by using a seed-placed or“pop-up” application. With thistreatment, a small amount of fertilizeris placed directly with the seed. Themain advantage of this treatment overthe conventional row treatment is thatthe starter response is obtained withmuch less fertilizer to handle atplanting time. Also, this system doesnot use an additional fertilizer diskopener, an advantage in reduced tillagesystems. Conventional row fertilizer isunnecessary as long as the seed-placedtreatment is augmented with broadcastfertilization of any needed phosphorusand potassium. Application rates forseed-placed fertilizers must be reducedto avoid damage to the seed and youngplants (table 9-20).
Seed-placed fertilizer treatmentsare not without drawbacks. Seed-placedfertilizer should not be used onsoybeans, snapbeans, and other large-seeded legumes because these crops areextremely sensitive to salt injury. Also,they may delay emergence of corn aday or two, and high application ratescan reduce germination. This isespecially true on sandy soils. Tominimize problems, limit the rate of
C h a p t e r 9 . S o i l a n d f e r t i l i z e r s o u r c e s o f p l a n t n u t r i e n t s 105
Table 9-19. Effect of tillage and row fertilizer on corn yield(Arlington, WI).
Tillage system Soil test K, ppmand rate of 8-48-12 Very low High Excessive
——————— yield, bu/a ——————
Ridge till100 lb/a 127 163 1650 lb/a 82 151 162Response 45 12 3
Chisel plow100 lb/a 156 167 1710 lb/a 143 160 163Response 13 7 8
Moldboard plow100 lb/a 163 176 1690 lb/a 143 171 162Response 20 5 7
Source: Schulte, E.E. 1980. Proc. 1980 Fert., Aglime & Pest Mgmt. Conf. 19:113–121.
Table 9-20. Maximum recommended starter fertilizer rates for corn.
———— Soil type ————Placement method Sands Silts and clays
——— lb/acre fertilizer ———
With seed (pop-up) 50a 50a
Side (2" x 2") placement 300 500
a Limit combined nitrogen and potash (K2O) to 10 lb/acre.
C-9 10/18/05 11:15 AM Page 105
N + K2O to 10 pounds per acre. Thismeans that a mixed fertilizer such as6-24-24 would have to be limited to33.3 pounds per acre (33.3 lb/a x .06 =2 lb of N; 33.3 lb/a x .24 = 8 lb ofK2O). Never use urea in seed-placedfertilizer. A band of concentrated ureaproduces gaseous ammonia thatinhibits germination and damagesseedlings.
Broadcast and topdressapplications
Broadcast fertilizer is spreaduniformly over the surface of the fieldand incorporated before planting bytillage or cultivation. Topdressedfertilizer is applied uniformly over thesurface after emergence of the crop,usually a small grain or legume forage.In dry seasons, phosphorus andpotassium applied before plowing maygive better yield results thanapplications after plowing. This isbecause plowing incorporates thenutrients more deeply than disking,making them more available during dryweather.
Fertilizer can be broadcast as atopdressing on established alfalfa andgrass pastures. Even though thistopdressed fertilizer remains near thesurface of the soil, these crops makevery good use of it.
Broadcast and topdressapplications can be made with farmspreaders or commercial trucks ortrailers. Bulk-spread materials can beeither manufactured fertilizer, such as6-24-24, or blended fertilizer made bymixing materials such as 18-46-0 and0-0-60.
Most fields are not uniform withrespect to fertility. A fertilizerrecommendation based on average soiltest levels for a field may be too low for
parts of the field and too high forothers. Variable rate spreadingtechnology permits the adjustment ofthe rate of a given nutrient “on-the-go.”This technology requires an accuratefertility map based on intensivesampling. The fertility map withknown geographic coordinates iscomputerized and used to adjustfertilizer rates in a variable rate spreaderfitted with global positioningequipment.
Yield variability across a field ismore often a result of variability in soilproperties such as texture, compaction,or water-holding capacity than soilfertility. Technology is now available tomeasure yields electronically whileharvesting. A map prepared from thisdata can be used for field inspection oflow-producing areas and soil samplingbased on yield level. If yield variabilityis due to soil physical characteristics orlow fertility, fertilizer rates can beadjusted accordingly for such areas.Such precision farming has thepotential for reducing fertilizer costsand environmental problems arisingfrom over-fertilization.
Sidedress applications Sidedress applications place
fertilizer, typically nitrogen, next to orbetween the rows during the growingseason. These treatments are effectiveon all soils, but offer the greatestadvantage on sandy soils and poorlydrained soils. Sidedress applicationsplace nitrogen in the soil just before theplant needs it most, reducing theamount of time nitrogen is exposed toloss by leaching or denitrification.
Potential loss of nitrogen from ureathat cannot be incorporated in no-tillor other conservation tillage programslimits the choices of nitrogen fertilizer.
Also, sidedressed nitrogen remainsexposed on the soil surface where it ismore vulnerable to loss by volatilizationwhen herbicides rather than cultivationare used to control weeds.
Split-sidedressed nitrogen appliedto corn on Plainfield sandy loamincreased yield by 5 to 21% comparedto preplant nitrogen, depending on therate applied (table 9-21). Equallyimportant from an environmentalstandpoint, recovery of appliednitrogen increased from 37 to 47%with preplant nitrogen to 57 to 84%with split-sidedressed nitrogen.
To coincide with plant uptake,sidedress applications to corn should bemade no later than 6 weeks afterplanting. Do not sidedress withanhydrous ammonia when the soil istoo wet. Wet soil does not seal wellbehind the injector knives. Somenitrogen will be lost, and the crop maybe injured by the escaping ammonia gas.
InjectionFertilizer can be injected using
knives. This technique deposits thefertilizer in rows or bands, so the knivesshould be spaced close enough to allowfor uniform distribution. Anotherinjection technique is the spoke wheelinjector. Liquid fertilizer is forcedunder high pressure through spokes ofa wheel that penetrate the soil to thedesired depth. Fertilizer is injectedwhen the spoke enters the soil.
Foliar applicationPlants can absorb small amounts of
nutrients through their leaves. Theusefulness of foliar applicationsdepends on the total quantity of anutrient needed by the crop. Forinstance, zinc and manganese can beapplied successfully as foliar sprays
M A N A G E M E N T O F W I S C O N S I N S O I L S106
C-9 10/18/05 11:15 AM Page 106
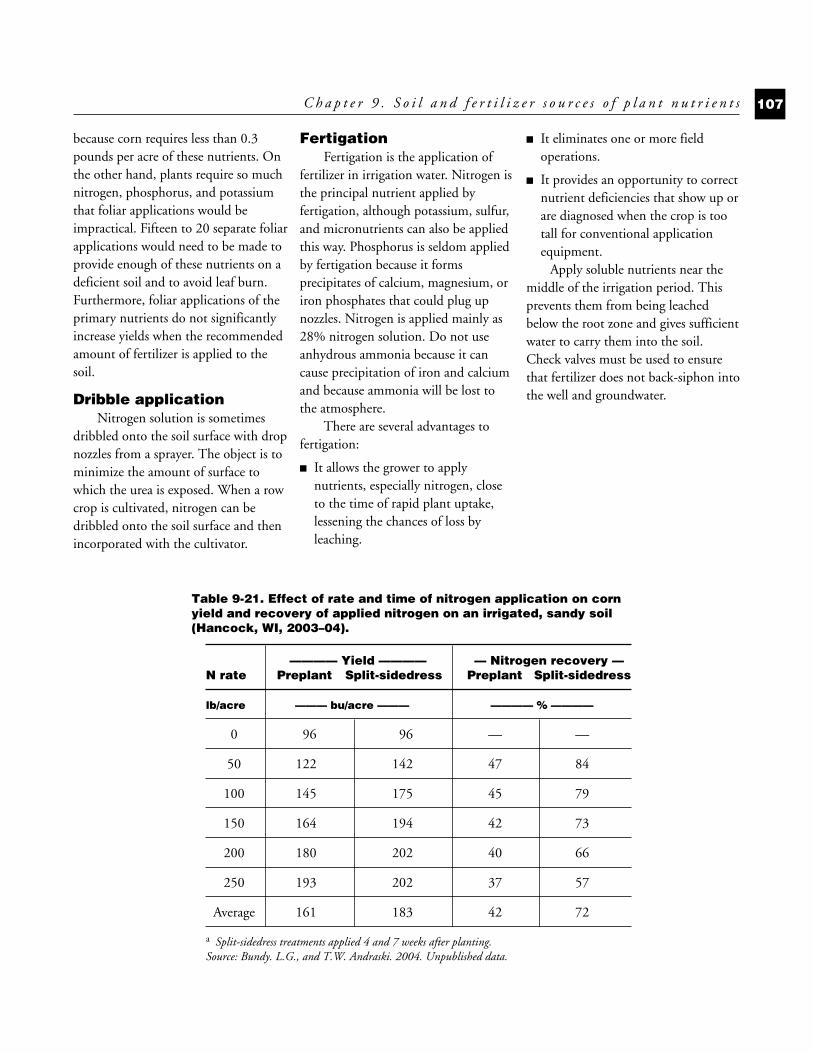
because corn requires less than 0.3pounds per acre of these nutrients. Onthe other hand, plants require so muchnitrogen, phosphorus, and potassiumthat foliar applications would beimpractical. Fifteen to 20 separate foliarapplications would need to be made toprovide enough of these nutrients on adeficient soil and to avoid leaf burn.Furthermore, foliar applications of theprimary nutrients do not significantlyincrease yields when the recommendedamount of fertilizer is applied to thesoil.
Dribble applicationNitrogen solution is sometimes
dribbled onto the soil surface with dropnozzles from a sprayer. The object is tominimize the amount of surface towhich the urea is exposed. When a rowcrop is cultivated, nitrogen can bedribbled onto the soil surface and thenincorporated with the cultivator.
Fertigation Fertigation is the application of
fertilizer in irrigation water. Nitrogen isthe principal nutrient applied byfertigation, although potassium, sulfur,and micronutrients can also be appliedthis way. Phosphorus is seldom appliedby fertigation because it formsprecipitates of calcium, magnesium, oriron phosphates that could plug upnozzles. Nitrogen is applied mainly as28% nitrogen solution. Do not useanhydrous ammonia because it cancause precipitation of iron and calciumand because ammonia will be lost tothe atmosphere.
There are several advantages tofertigation:
■ It allows the grower to applynutrients, especially nitrogen, closeto the time of rapid plant uptake,lessening the chances of loss byleaching.
■ It eliminates one or more fieldoperations.
■ It provides an opportunity to correctnutrient deficiencies that show up orare diagnosed when the crop is tootall for conventional applicationequipment.
Apply soluble nutrients near themiddle of the irrigation period. Thisprevents them from being leachedbelow the root zone and gives sufficientwater to carry them into the soil.Check valves must be used to ensurethat fertilizer does not back-siphon intothe well and groundwater.
C h a p t e r 9 . S o i l a n d f e r t i l i z e r s o u r c e s o f p l a n t n u t r i e n t s 107
Table 9-21. Effect of rate and time of nitrogen application on cornyield and recovery of applied nitrogen on an irrigated, sandy soil(Hancock, WI, 2003–04).
———— Yield ———— — Nitrogen recovery —N rate Preplant Split-sidedress Preplant Split-sidedress
lb/acre ——— bu/acre ——— ———— % ————
0 96 96 — —
50 122 142 47 84
100 145 175 45 79
150 164 194 42 73
200 180 202 40 66
250 193 202 37 57
Average 161 183 42 72
a Split-sidedress treatments applied 4 and 7 weeks after planting.Source: Bundy. L.G., and T.W. Andraski. 2004. Unpublished data.
C-9 10/18/05 11:15 AM Page 107
Questions1. A farmer in southern Wisconsin
grows continuous corn on a low-lying field that is somewhat poorlydrained. The corn often showssigns of nitrogen deficiency despitethe fact that 400 pounds per acreof ammonium nitrate (33-0-0) isbroadcast on this deep silt loamsoil each fall. What is the mostlikely reason for the appearance ofthe nitrogen deficiency?
2. Crops on irrigated sandy soils showvery little difference between non-leachable ammonium sources ofnitrogen and leachable nitratesources. Why?
3. How can nitrogen losses from fall-applications be minimized?
4. A farmer harvests one-half of awell-fertilized corn field for silagecorn and the other half for earcorn. The following year the fieldis planted to oats. Which half ofthe oats field will be more apt tolodge? Why?
5. If nitrogen fertilizer is surfaceapplied and not incorporated,ammonium sulfate or ammoniumnitrate is recommended instead ofurea. Why?
6. Identify the source of nitrogenwhich isa. difficult to apply to wet, stony,
high-residue soils.b. also a carrier of sulfur.c. apt to cause plant damage when
improperly sidedressed.d.used more rapidly by plants,
especially when applied to coolsoils.
7. The phosphate in one 5-20-20fertilizer is 100% water soluble,while the phosphate in another5-20-20 fertilizer is only 60%water soluble. In comparing thesetwo fertilizers on corn, nodifference in response is noted.Why?
8. Under what soil and croppingconditions would rock phosphatebe a satisfactory source ofphosphorus?
9. Why doesn’t phosphate (H2PO4–),
a negatively charged ion, leach outof the soil?
10.Explain why a band application ofphosphate is often more effectivethan an equivalent amount ofbroadcast phosphate.
11.What is the most commonly usedsource of potassium? Why?
12.Potassium does not leach generally.However, some leaching will takeplace on very sandy soils andorganic soils. Explain why.
13.Most Wisconsin soils containlower levels of available potassiumthan soils in neighboring states,even though our use of potash percropland acre is as high or higherthan most of these states. Explainwhy.
14.Explain why calcium deficiency isnot a problem on soils with a pHof 6.0 or above.
15.What soil conditions can causemagnesium deficiencies?
16.What soil and cropping conditionswould have the most response tosulfur fertilizer?
17. Is elemental sulfur or potassiumsulfate more effective whentopdressed on established alfalfa?Give reasons.
18.Discuss the soil conditionsfavoring deficiency and the cropsmost likely to show the deficiencyfor each of the followingmicronutrients:a. Boronb. Manganesec. Zincd. Coppere. Ironf. Molybdenum
19.Some micronutrients can beapplied successfully as a foliarspray, but foliar application ofnitrogen, phosphate, and potash isnot recommended. Explain.
20.Could 40 pounds per acre of10-10-10 be applied safely as aseed-placed or pop-up treatmenton corn? On soybeans? Givereasons.
21. Outline a nitrogen fertilizationprogram for corn grown onirrigated sands in centralWisconsin that will minimizeleaching losses.
M A N A G E M E N T O F W I S C O N S I N S O I L S108
C-9 10/18/05 11:15 AM Page 108

“And by plentiful dunging,which is owing to flocks andherds of cattle, the earthproduces her fruit in greatabundance.”
Columella, L.J.M. Circa 40 A.D.
A soil amendment is any materialapplied to the soil to improve cropyield or quality. Technically,commercial fertilizers are amendments,but the term is generally used todescribe materials other than fertilizers.
Organicamendments
The principal organic soilamendments used in Wisconsin aremanure, municipal biosolids (sewagesludge), and whey. Crop residue is notconsidered an amendment unless it isharvested and transported to anotherfield. Other organic amendmentsinclude compost, sawdust, wood chips,fibrous paper mill sludge, leaves, grassclippings, and peat moss.
ManureManure is a byproduct of
Wisconsin’s vibrant animal agricultureindustry. The manure produced by thestate’s dairy cows alone is estimated tobe 33.6 million tons annually. Manuregenerated in such quantities is asignificant source of nutrients for cropsand soils. It is also a resource that mustbe managed appropriately to fullyutilize its nutrients in a manner thatminimizes environmental risk.Unfortunately, because of its low valueper unit volume and handlingproblems, manure is too often treatedas a waste.
When manure is applied tocropland, its nutrients are recycled as
soil microorganisms process it for foodand energy. When applied atrecommended rates, manure providesthe following benefits:
■ It adds essential plant nutrients.
■ It acts as a mulch.
■ It adds organic matter to soil.
■ It improves soil structure.
■ It improves tilth.
■ It increases cation exchange capacity.
■ It improves infiltration of water.
■ It reduces runoff.Composition. Manure is a good
source of nitrogen, phosphorus,potassium, and other nutrients but itvaries greatly in composition. Table 10-1provides an estimate of the totalnutrient content of manure. Numerousfactors affect the nutrient content ofmanure, including: animal species andage, bedding type and amount, feedcomposition and digestibility, andmanure handling and storageprocedures. The composition of liquidmanure depends on how much water isused to dilute the fresh manure so thatit can be handled as a liquid.
In addition to nitrogen, phosphate,and potash, manure contains all of theother essential nutrients. Subsequently,soils to which manure is appliedregularly are rarely deficient in sulfur ormicronutrients.
There are other benefits ofapplying manure to soil. On the soilsurface, manure acts as a mulch andreduces erosion. Incorporating it into
109
Soil amendments
C H A P T E R
10
C-10 10/18/05 11:15 AM Page 109
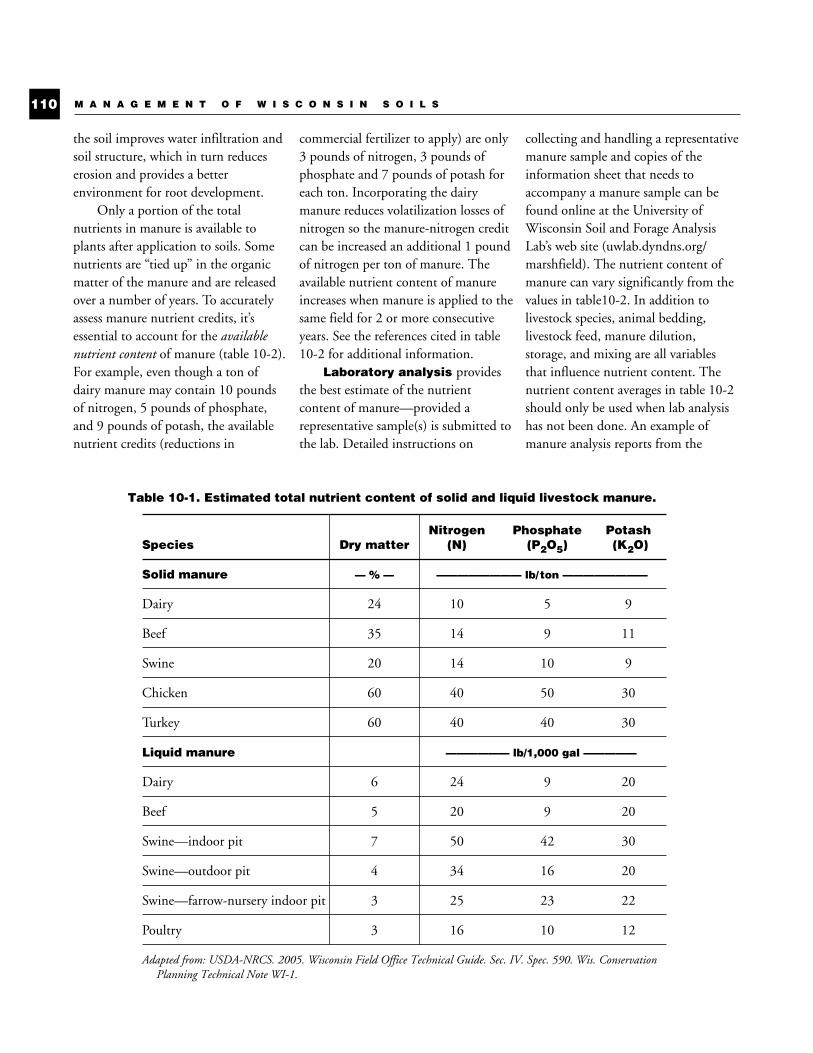
the soil improves water infiltration andsoil structure, which in turn reduceserosion and provides a betterenvironment for root development.
Only a portion of the totalnutrients in manure is available toplants after application to soils. Somenutrients are “tied up” in the organicmatter of the manure and are releasedover a number of years. To accuratelyassess manure nutrient credits, it’sessential to account for the availablenutrient content of manure (table 10-2).For example, even though a ton ofdairy manure may contain 10 poundsof nitrogen, 5 pounds of phosphate,and 9 pounds of potash, the availablenutrient credits (reductions in
commercial fertilizer to apply) are only3 pounds of nitrogen, 3 pounds ofphosphate and 7 pounds of potash foreach ton. Incorporating the dairymanure reduces volatilization losses ofnitrogen so the manure-nitrogen creditcan be increased an additional 1 poundof nitrogen per ton of manure. Theavailable nutrient content of manureincreases when manure is applied to thesame field for 2 or more consecutiveyears. See the references cited in table10-2 for additional information.
Laboratory analysis providesthe best estimate of the nutrientcontent of manure—provided arepresentative sample(s) is submitted tothe lab. Detailed instructions on
collecting and handling a representativemanure sample and copies of theinformation sheet that needs toaccompany a manure sample can befound online at the University ofWisconsin Soil and Forage AnalysisLab’s web site (uwlab.dyndns.org/marshfield). The nutrient content ofmanure can vary significantly from thevalues in table10-2. In addition tolivestock species, animal bedding,livestock feed, manure dilution,storage, and mixing are all variablesthat influence nutrient content. Thenutrient content averages in table 10-2should only be used when lab analysishas not been done. An example ofmanure analysis reports from the
M A N A G E M E N T O F W I S C O N S I N S O I L S110
Table 10-1. Estimated total nutrient content of solid and liquid livestock manure.
Nitrogen Phosphate PotashSpecies Dry matter (N) (P2O5) (K2O)
Solid manure — % — ———————— lb/ ton ————————
Dairy 24 10 5 9
Beef 35 14 9 11
Swine 20 14 10 9
Chicken 60 40 50 30
Turkey 60 40 40 30
Liquid manure —————— lb/1,000 gal —————
Dairy 6 24 9 20
Beef 5 20 9 20
Swine—indoor pit 7 50 42 30
Swine—outdoor pit 4 34 16 20
Swine—farrow-nursery indoor pit 3 25 23 22
Poultry 3 16 10 12
Adapted from: USDA-NRCS. 2005. Wisconsin Field Office Technical Guide. Sec. IV. Spec. 590. Wis. ConservationPlanning Technical Note WI-1.
C-10 10/18/05 11:15 AM Page 110
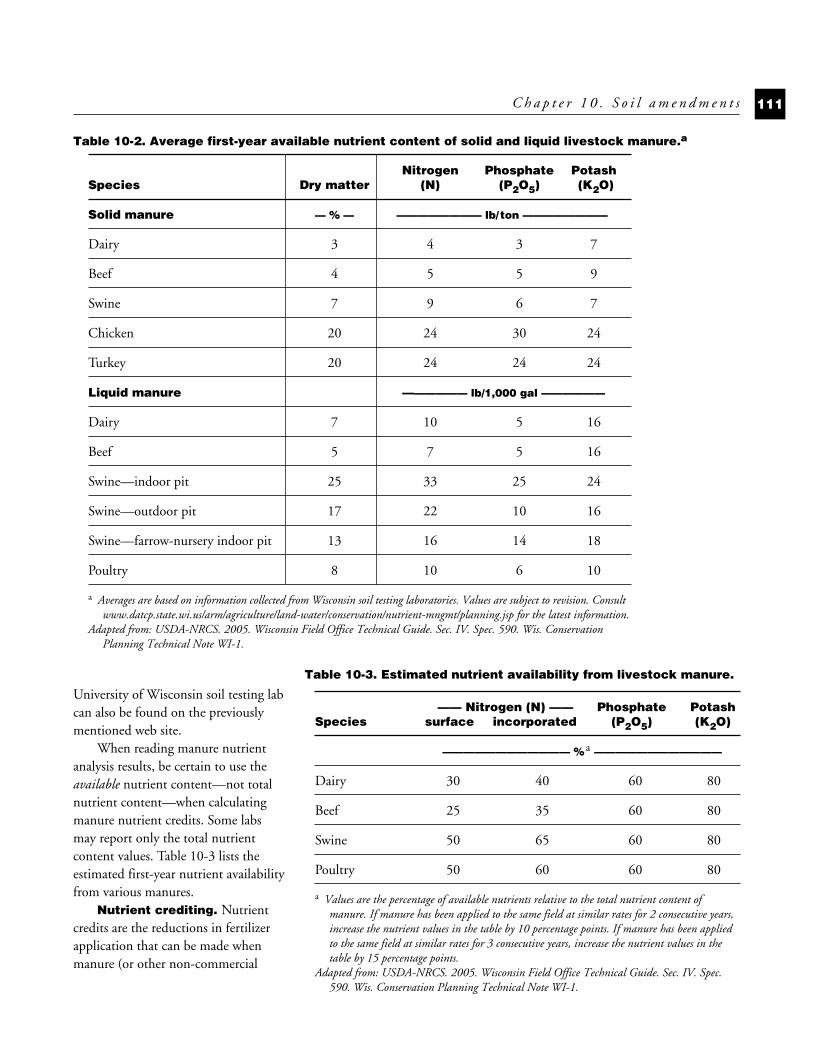
University of Wisconsin soil testing labcan also be found on the previouslymentioned web site.
When reading manure nutrientanalysis results, be certain to use theavailable nutrient content—not totalnutrient content—when calculatingmanure nutrient credits. Some labsmay report only the total nutrientcontent values. Table 10-3 lists theestimated first-year nutrient availabilityfrom various manures.
Nutrient crediting. Nutrientcredits are the reductions in fertilizerapplication that can be made whenmanure (or other non-commercial
C h a p t e r 1 0 . S o i l a m e n d m e n t s 111
Nitrogen Phosphate PotashSpecies Dry matter (N) (P2O5) (K2O)
Solid manure — % — ———————— lb/ ton ————————
Dairy 3 4 3 7
Beef 4 5 5 9
Swine 7 9 6 7
Chicken 20 24 30 24
Turkey 20 24 24 24
Liquid manure —————— lb/1,000 gal ——————
Dairy 7 10 5 16
Beef 5 7 5 16
Swine—indoor pit 25 33 25 24
Swine—outdoor pit 17 22 10 16
Swine—farrow-nursery indoor pit 13 16 14 18
Poultry 8 10 6 10
a Averages are based on information collected from Wisconsin soil testing laboratories. Values are subject to revision. Consultwww.datcp.state.wi.us/arm/agriculture/land-water/conservation/nutrient-mngmt/planning.jsp for the latest information.
Adapted from: USDA-NRCS. 2005. Wisconsin Field Office Technical Guide. Sec. IV. Spec. 590. Wis. ConservationPlanning Technical Note WI-1.
Table 10-3. Estimated nutrient availability from livestock manure.
—— Nitrogen (N) —— Phosphate PotashSpecies surface incorporated (P2O5) (K2O)
———————————— % a ————————————
Dairy 30 40 60 80
Beef 25 35 60 80
Swine 50 65 60 80
Poultry 50 60 60 80
a Values are the percentage of available nutrients relative to the total nutrient content ofmanure. If manure has been applied to the same field at similar rates for 2 consecutive years,increase the nutrient values in the table by 10 percentage points. If manure has been appliedto the same field at similar rates for 3 consecutive years, increase the nutrient values in thetable by 15 percentage points.
Adapted from: USDA-NRCS. 2005. Wisconsin Field Office Technical Guide. Sec. IV. Spec.590. Wis. Conservation Planning Technical Note WI-1.
Table 10-2. Average first-year available nutrient content of solid and liquid livestock manure.a
C-10 10/18/05 11:15 AM Page 111

fertilizer sources of plant nutrients) isapplied to soil. In order to use manureas a nutrient resource, both theavailable nutrient content and themanure application rate must beknown. For example, if dairy manurecontaining 3 pounds of plant-availablenitrogen per ton is applied at 20 tonsper acre, a nitrogen credit of 60 poundsper acre can be subtracted from the soiltest recommendation for nitrogen.
Estimating application rates.Manure must be applied uniformlyacross fields and the application ratemust be known if manure is to be usedas a fertilizer resource. Manureapplication rates cannot be estimatedvisually! To get a reasonably accurateestimate of application rates, themanure spreader must be calibrated.For solid manure, this is done bydetermining the weight of the spreaderand the area covered. The insert KnowHow Much You Haul! provides detailson how to do this.
Incorporation. Incorporating orinjecting manure by tillage soon afterapplication—generally, within 3 days—can conserve nitrogen by limitingammonia losses. It can also controlodors. However, tillage to incorporatemanure, especially in spring, canincrease sediment and phosphoruslosses by increasing soil erosion.Unincorporated, spring-appliedmanure can lower runoff volume anderosion by increasing residue cover andwater infiltration into the soil.
Incorporated manure can alsolower phosphorus losses in runoff insome cases. Incorporating manure inthe fall often lowers runoff volume andtotal phosphorus losses. Unincorporatedmanure applied in the fall to relativelysmooth (sealed) soil surfaces such asthose found following no-till corn orsoybean or established alfalfa often
increases phosphorus losses. Winterapplications of unincorporated manureare particularly susceptible tophosphorus losses.
Manure managementguidelines. Additional guidelines andrecommendations for manuremanagement include the following:
■ Do not exceed tolerable soil loss (T)on fields receiving manure.
■ Limit manure application to theannual crop removal rate forphosphorus unless it is incorporated.If incorporated, higher rates can beapplied to meet the nitrogen needsof the crop to be grown.
■ Realize that when applying manureto meet the nitrogen needs of asubsequent crop, an over-applicationof phosphorus and potassium islikely to result.
■ Monitor soil test phosphorus levelson fields receiving manure. If levelsreach 100 ppm or more, reducemanure application rates and plant acrop that removes substantialamounts of phosphorus, such asalfalfa or silage corn.
■ Do not apply manure to frozen soilswithin 1,000 feet of lakes and 300feet of rivers and streams.
■ Never apply manure in grasswaterways, terrace channels, nearopen surface drains, or other areaswhere water flow may concentrate.
■ If manure is to be applied tounfrozen soils within 1,000 feet oflakes and 300 feet of rivers andstreams, use one or more of thefollowing precautions: (1) install ormaintain buffers along the waterbody, (2) maintain at least 30% cropresidue cover, (3) incorporatemanure within 72 hours leavingadequate crop residue cover.
■ If manure is applied to frozen soilson slopes of 9% or less and protectthese areas from upslope runoff.
■ Do not apply manure to frozen soilson slopes between 9 and 12% unlesscontour strips, terraces or otherconservation measures are in place.
■ Do not apply manure to frozen orsnow-covered soils on slopes greaterthan 12%.
■ Do not apply manure where there isless than 20 inches of soil overbedrock unless it can be applied inthe fall when soil temperatures arebelow 50°F and limited to 120pounds of available nitrogen peracre.
■ On sandy soils where crops are notgrowing, delay fall application untilsoil temperatures are below 50°F. If aperennial or cover crop is growing,fall application can be made at anytime.
Other considerations. Forgreatest efficiency of manure nutrientutilization, have the manure analyzedand the soil tested. Apply more manureto fields testing low in phosphorus andpotassium and less manure to fieldswith a high soil test.
As long as the manure is handledproperly, daily spreading or seasonalspreading from a manure storagesystem is equally effective at improvingcrop yield.
A number of universitypublications, available from countyExtension offices or the web sites citedin this chapter, discuss manuremanagement in greater detail. Be awarethat various federal, state, and localregulations may impact manuremanagement strategies. The USDA-Natural Resources ConservationService’s nutrient management standard(Wisconsin Field Office Technical
M A N A G E M E N T O F W I S C O N S I N S O I L S112
C-10 10/18/05 11:15 AM Page 112

To use manure as a quality, dependable fertilizer, you must accurately figure your spreading rate and calculate your manurenutrient credits. This whole process can take less than a hour! All you need to get started is this sheet, a calculator andportable axle scales. Contact your land conservation department, county extension agent or the Nutrient and PestManagement Program (877) 426-0176 for assistance with scales.
STEP 1. DETERMINE LOAD WEIGHTTOOLS NEEDED: CALCULATOR, PORTABLE AXLE SCALES
Using a typical load size, the tractor with spreader is weighed empty and full,axle by axle.
What is typical? If you normally haul one load every day at about the same time, weigh a load with 24 hoursworth of manure. Or if you normally wait until the spreader is filled to capacity, weigh the spreader filled.
Know How Much You Haul !
STEP 2. DETERMINE SPREADING RATETOOLS NEEDED: CALCULATOR AND FIELD RECORDS OR MEASURING WHEEL*
You can now calculate your tons per acre spreading rate using field records onhow many loads you put on a particular field of known acreage (see equations on otherside). This rate can be considered the “standard” for the farm. Make sure you usetypical ground speed, PTO speed and spreader settings.
To develop variable rates (such as high, medium and low) experiment with differentspeeds and spreader settings. These rates could be useful when dealing withfields that have special fertilizer, tillage or environmental considerations.
*You can get an estimateestimateestimateestimateestimate of a per acre rate right away by using a measuring wheel on the area just spread.Use caution with this method since it does not take into account overlap or load tapering.
STEP 3. DETERMINE MANURE NUTRIENT CREDITSTOOLS NEEDED: CALCULATOR
Using University of WI guidelines (table on other side) you can estimate theavailable nutrient content per ton of the manure you are spreading. You can alsohave your manure analyzed for its specific nutrient content. From either of thosenumbers, you can figure your manure nutrient credits per acre. (If you developvariable rates, use additional sheets to determine their manure nutrient credits.) Now you havethe information you need to accurately use manure as a fertilizer!
It’s a good idea to repeat this process for any different types of spreaders or manure you routinely apply onyour farm. For more copies of this publication or information on developing a nutrient management plan foryour farm, contact your land conservation department, county extension agent or the NPM program.
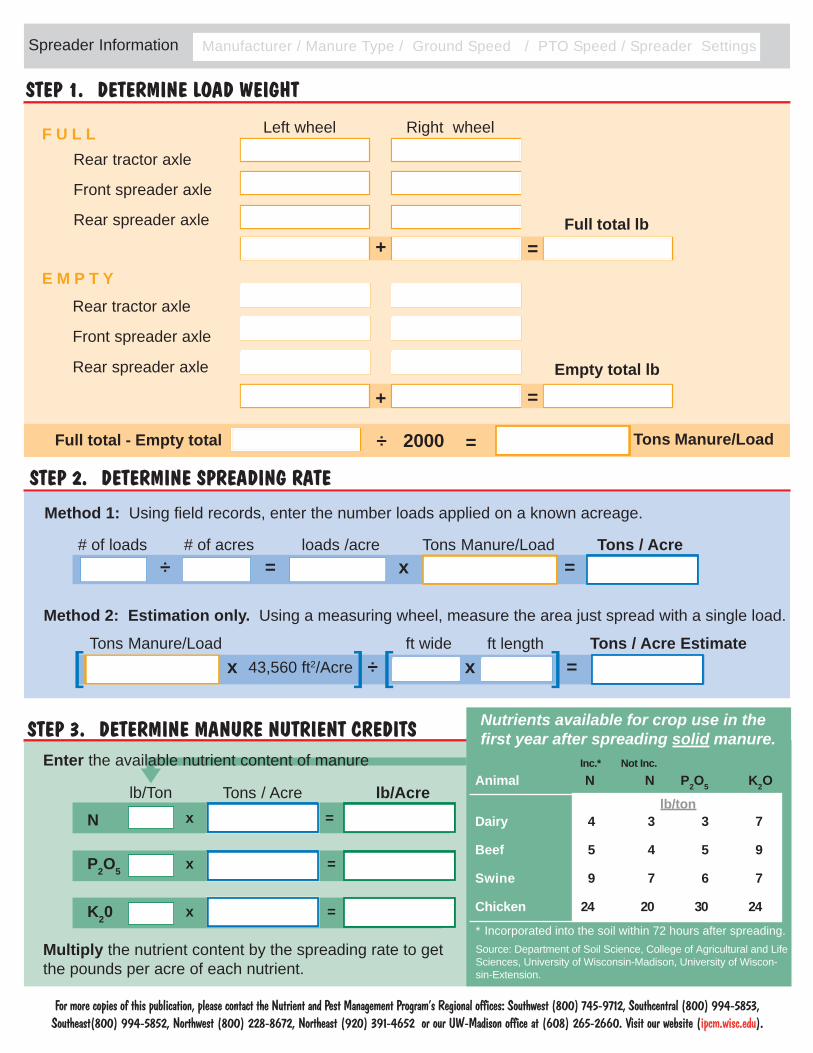
STEP 2. DETERMINE SPREADING RATE
Method 2: Estimation only. Using a measuring wheel, measure the area just spread with a single load.
Tons Manure/Loadx
Tons / Acre=
43,560 ft2/Acrex =
# of loads=÷
loads /acre # of acres
Tons Manure/Load Tons / Acre Estimate
Method 1: Using field records, enter the number loads applied on a known acreage.
ft widex÷ ]][[]
Spreader Information
For more copies of this publication, please contact the Nutrient and Pest Management Program’s Regional offices: Southwest (800) 745-9712, Southcentral (800) 994-5853,Southeast(800) 994-5852, Northwest (800) 228-8672, Northeast (920) 391-4652 or our UW-Madison office at (608) 265-2660. Visit our website (ipcm.wisc.edu).
Rear tractor axle
Front spreader axle
Rear spreader axle
Rear tractor axle
Front spreader axle
Rear spreader axle
STEP 1. DETERMINE LOAD WEIGHT
Tons Manure/Load 2000
STEP 3. DETERMINE MANURE NUTRIENT CREDITS Nutrients available for crop use in thefirst year after spreading solid manure.
* Incorporated into the soil within 72 hours after spreading.Source: Department of Soil Science, College of Agricultural and LifeSciences, University of Wisconsin-Madison, University of Wiscon-sin-Extension.
Inc.* Not Inc.Animal N N P2O5 K2O
Dairy 4 3 3 7
Beef 5 4 5 9
Swine 9 7 6 7
Chicken 24 20 30 24
lb/ton
+
+
Left wheel Right wheel
Full total lb
Empty total lb
Full total - Empty total
E M P T Y
F U L L
÷
=
=
=
N x =
P2O5 x =
Tons / Acre
K20 x =
lb/Acre
Multiply the nutrient content by the spreading rate to getthe pounds per acre of each nutrient.
ft length
Manufacturer / Manure Type / Ground Speed / PTO Speed / Spreader Settings
[[[
lb/Ton
Enter the available nutrient content of manure
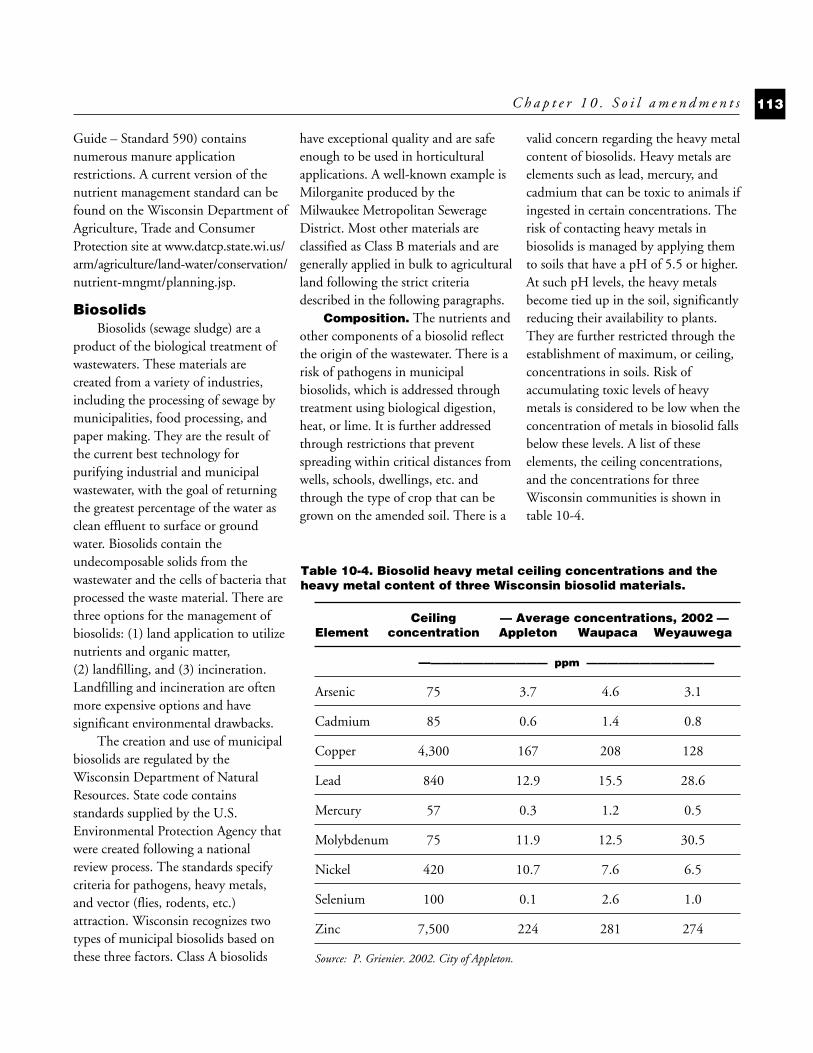
Guide – Standard 590) containsnumerous manure applicationrestrictions. A current version of thenutrient management standard can befound on the Wisconsin Department ofAgriculture, Trade and ConsumerProtection site at www.datcp.state.wi.us/arm/agriculture/land-water/conservation/nutrient-mngmt/planning.jsp.
BiosolidsBiosolids (sewage sludge) are a
product of the biological treatment ofwastewaters. These materials arecreated from a variety of industries,including the processing of sewage bymunicipalities, food processing, andpaper making. They are the result ofthe current best technology forpurifying industrial and municipalwastewater, with the goal of returningthe greatest percentage of the water asclean effluent to surface or groundwater. Biosolids contain theundecomposable solids from thewastewater and the cells of bacteria thatprocessed the waste material. There arethree options for the management ofbiosolids: (1) land application to utilizenutrients and organic matter,(2) landfilling, and (3) incineration.Landfilling and incineration are oftenmore expensive options and havesignificant environmental drawbacks.
The creation and use of municipalbiosolids are regulated by theWisconsin Department of NaturalResources. State code containsstandards supplied by the U.S.Environmental Protection Agency thatwere created following a nationalreview process. The standards specifycriteria for pathogens, heavy metals,and vector (flies, rodents, etc.)attraction. Wisconsin recognizes twotypes of municipal biosolids based onthese three factors. Class A biosolids
have exceptional quality and are safeenough to be used in horticulturalapplications. A well-known example isMilorganite produced by theMilwaukee Metropolitan SewerageDistrict. Most other materials areclassified as Class B materials and aregenerally applied in bulk to agriculturalland following the strict criteriadescribed in the following paragraphs.
Composition. The nutrients andother components of a biosolid reflectthe origin of the wastewater. There is arisk of pathogens in municipalbiosolids, which is addressed throughtreatment using biological digestion,heat, or lime. It is further addressedthrough restrictions that preventspreading within critical distances fromwells, schools, dwellings, etc. andthrough the type of crop that can begrown on the amended soil. There is a
valid concern regarding the heavy metalcontent of biosolids. Heavy metals areelements such as lead, mercury, andcadmium that can be toxic to animals ifingested in certain concentrations. Therisk of contacting heavy metals inbiosolids is managed by applying themto soils that have a pH of 5.5 or higher.At such pH levels, the heavy metalsbecome tied up in the soil, significantlyreducing their availability to plants.They are further restricted through theestablishment of maximum, or ceiling,concentrations in soils. Risk ofaccumulating toxic levels of heavymetals is considered to be low when theconcentration of metals in biosolid fallsbelow these levels. A list of theseelements, the ceiling concentrations,and the concentrations for threeWisconsin communities is shown intable 10-4.
C h a p t e r 1 0 . S o i l a m e n d m e n t s 113
Table 10-4. Biosolid heavy metal ceiling concentrations and theheavy metal content of three Wisconsin biosolid materials.
Ceiling — Average concentrations, 2002 —Element concentration Appleton Waupaca Weyauwega
———————————— ppm ————————————
Arsenic 75 3.7 4.6 3.1
Cadmium 85 0.6 1.4 0.8
Copper 4,300 167 208 128
Lead 840 12.9 15.5 28.6
Mercury 57 0.3 1.2 0.5
Molybdenum 75 11.9 12.5 30.5
Nickel 420 10.7 7.6 6.5
Selenium 100 0.1 2.6 1.0
Zinc 7,500 224 281 274
Source: P. Grienier. 2002. City of Appleton.
C-10 10/18/05 11:15 AM Page 113

Application of biosolids.Fields for the land spreading ofbiosolids must be individually approvedbased on specific site criteria.University of Wisconsin soil testrecommendations are used to determinethe rate of biosolid application. Cropselection is determined by the potentialcontact with the soil. For example,crops grown in the soil (e.g., carrot,potato) cannot be harvested from atreated soil within 38 months ofapplication. For crops that may touchthe soil (e.g., green beans, peas), theperiod is 14 months. The period forcommon field crops like corn andsoybean is 1 month. Most biosolidapplication rates are based on thenitrogen need of the crop. Currentrules provide a biosolid nitrogen creditof 25% of the organic nitrogen content
plus 100% of the mineral nitrogen.Before selecting a biosolid applicationrate, credits for legumes and manure,or previous biosolid applications mustfirst be subtracted from therecommended nitrogen rate. Severalmunicipalities have opted to use limestabilization in their biosolidmanagement process. Lime-stabilizedbiosolids are an excellent limingmaterial and should be used as asubstitute for aglime rather than anitrogen fertilizer.
Biosolids are an excellent source ofnitrogen and when applied properlyreplace the need for nitrogen fertilizer.Figure 10-1 shows a comparisonbetween fertilizer and biosolids appliedfor 11 consecutive years at Elkhorn,Wisconsin. Similar to manure,application of biosolids to meet crop
nitrogen needs will result in the over-application of phosphorus. Thisrelationship is even more significant inthe case of biosolids because treatmentprocesses sequester phosphorus in thesolids so that the effluent phosphorusconcentration is low. Table 10-5 showsthe soil test phosphorus values P atElkhorn following the long-termapplication of biosolids.
Whey Whey is a byproduct of cheese
making. It is the liquid remainder ofmilk after the solids (curds) areremoved. About one-third of the wheyproduced by cheese plants in theUnited States is applied to the land.The remainder is fed directly toanimals or is processed into foods,pharmaceuticals, or industrial products.
M A N A G E M E N T O F W I S C O N S I N S O I L S114
0
20
40
60
80
100
120
140
160
180
1984 1985 1986 1987 1988 1989 1990 1991 1992 1993 1994
Yie
ld (
bu
/a)
Control
Biosolid
N fertilizer
Figure 10-1. Corn response to 11 years of biosolid and nitrogen fertilizer application(Elkhorn, WI, 1984–94).
Source: Peterson, A.E. 2002. Dept. of Soil Sci. Univ. Wis.-Madison.
C-10 10/18/05 11:15 AM Page 114
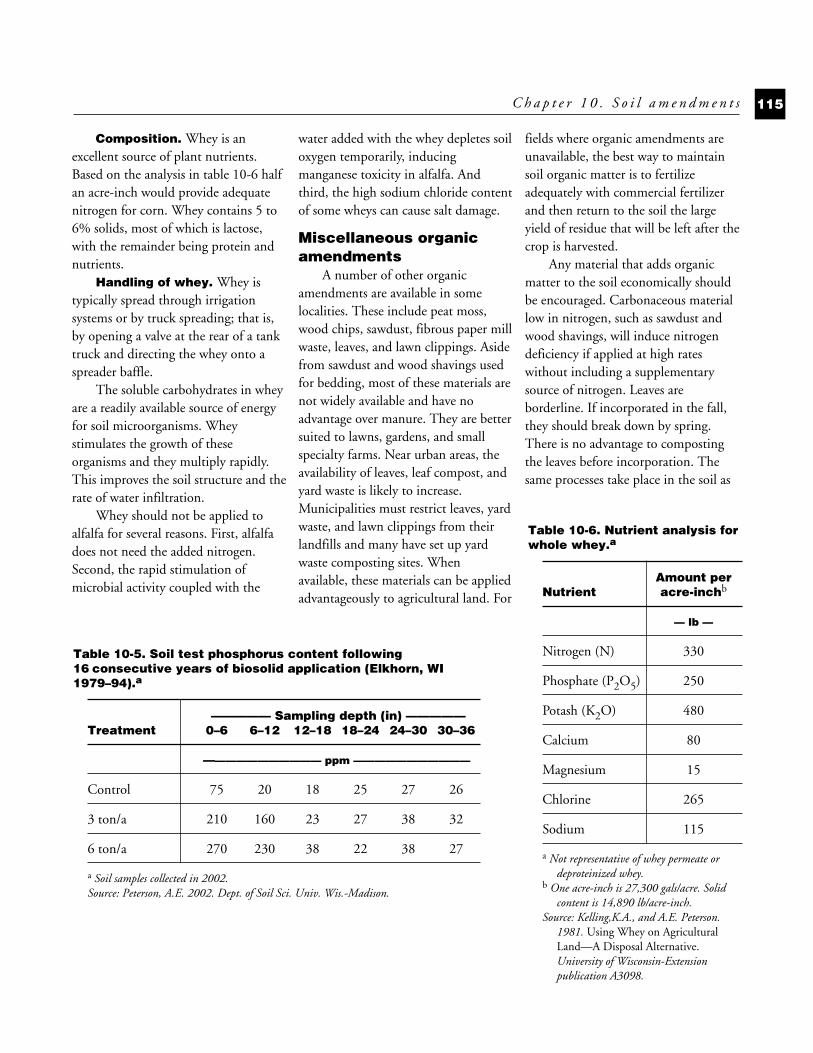
Composition. Whey is anexcellent source of plant nutrients.Based on the analysis in table 10-6 halfan acre-inch would provide adequatenitrogen for corn. Whey contains 5 to6% solids, most of which is lactose,with the remainder being protein andnutrients.
Handling of whey. Whey istypically spread through irrigationsystems or by truck spreading; that is,by opening a valve at the rear of a tanktruck and directing the whey onto aspreader baffle.
The soluble carbohydrates in wheyare a readily available source of energyfor soil microorganisms. Wheystimulates the growth of theseorganisms and they multiply rapidly.This improves the soil structure and therate of water infiltration.
Whey should not be applied toalfalfa for several reasons. First, alfalfadoes not need the added nitrogen.Second, the rapid stimulation ofmicrobial activity coupled with the
water added with the whey depletes soiloxygen temporarily, inducingmanganese toxicity in alfalfa. Andthird, the high sodium chloride contentof some wheys can cause salt damage.
Miscellaneous organicamendments
A number of other organicamendments are available in somelocalities. These include peat moss,wood chips, sawdust, fibrous paper millwaste, leaves, and lawn clippings. Asidefrom sawdust and wood shavings usedfor bedding, most of these materials arenot widely available and have noadvantage over manure. They are bettersuited to lawns, gardens, and smallspecialty farms. Near urban areas, theavailability of leaves, leaf compost, andyard waste is likely to increase.Municipalities must restrict leaves, yardwaste, and lawn clippings from theirlandfills and many have set up yardwaste composting sites. Whenavailable, these materials can be appliedadvantageously to agricultural land. For
fields where organic amendments areunavailable, the best way to maintainsoil organic matter is to fertilizeadequately with commercial fertilizerand then return to the soil the largeyield of residue that will be left after thecrop is harvested.
Any material that adds organicmatter to the soil economically shouldbe encouraged. Carbonaceous materiallow in nitrogen, such as sawdust andwood shavings, will induce nitrogendeficiency if applied at high rateswithout including a supplementarysource of nitrogen. Leaves areborderline. If incorporated in the fall,they should break down by spring.There is no advantage to compostingthe leaves before incorporation. Thesame processes take place in the soil as
C h a p t e r 1 0 . S o i l a m e n d m e n t s 115
Table 10-6. Nutrient analysis forwhole whey.a
Amount per Nutrient acre-inchb
— lb —
Nitrogen (N) 330
Phosphate (P2O5) 250
Potash (K2O) 480
Calcium 80
Magnesium 15
Chlorine 265
Sodium 115
a Not representative of whey permeate ordeproteinized whey.
b One acre-inch is 27,300 gals/acre. Solidcontent is 14,890 lb/acre-inch.
Source: Kelling,K.A., and A.E. Peterson.1981. Using Whey on AgriculturalLand—A Disposal Alternative.University of Wisconsin-Extensionpublication A3098.
Table 10-5. Soil test phosphorus content following16 consecutive years of biosolid application (Elkhorn, WI1979–94).a
————— Sampling depth (in) —————Treatment 0–6 6–12 12–18 18–24 24–30 30–36
——————————— ppm ———————————
Control 75 20 18 25 27 26
3 ton/a 210 160 23 27 38 32
6 ton/a 270 230 38 22 38 27
a Soil samples collected in 2002. Source: Peterson, A.E. 2002. Dept. of Soil Sci. Univ. Wis.-Madison.
C-10 10/18/05 11:15 AM Page 115
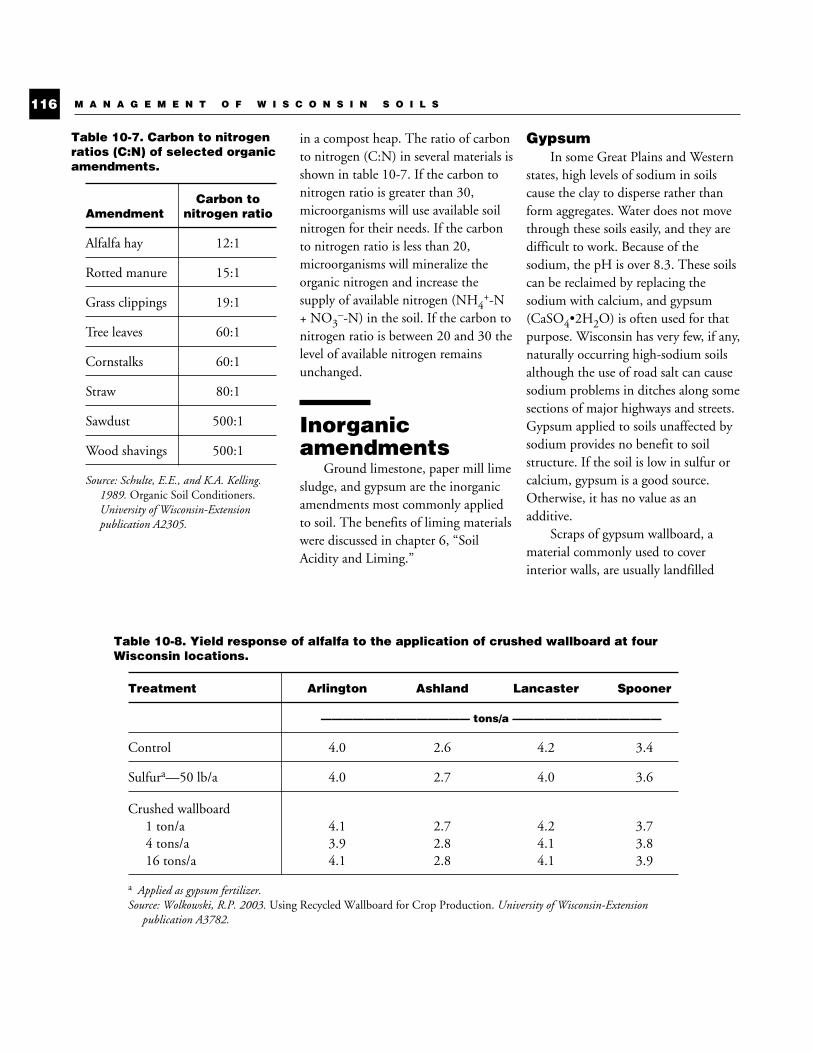
in a compost heap. The ratio of carbonto nitrogen (C:N) in several materials isshown in table 10-7. If the carbon tonitrogen ratio is greater than 30,microorganisms will use available soilnitrogen for their needs. If the carbonto nitrogen ratio is less than 20,microorganisms will mineralize theorganic nitrogen and increase thesupply of available nitrogen (NH4
+-N+ NO3
–-N) in the soil. If the carbon tonitrogen ratio is between 20 and 30 thelevel of available nitrogen remainsunchanged.
Inorganicamendments
Ground limestone, paper mill limesludge, and gypsum are the inorganicamendments most commonly appliedto soil. The benefits of liming materialswere discussed in chapter 6, “SoilAcidity and Liming.”
GypsumIn some Great Plains and Western
states, high levels of sodium in soilscause the clay to disperse rather thanform aggregates. Water does not movethrough these soils easily, and they aredifficult to work. Because of thesodium, the pH is over 8.3. These soilscan be reclaimed by replacing thesodium with calcium, and gypsum(CaSO4•2H2O) is often used for thatpurpose. Wisconsin has very few, if any,naturally occurring high-sodium soilsalthough the use of road salt can causesodium problems in ditches along somesections of major highways and streets.Gypsum applied to soils unaffected bysodium provides no benefit to soilstructure. If the soil is low in sulfur orcalcium, gypsum is a good source.Otherwise, it has no value as anadditive.
Scraps of gypsum wallboard, amaterial commonly used to coverinterior walls, are usually landfilled
M A N A G E M E N T O F W I S C O N S I N S O I L S116
Table 10-8. Yield response of alfalfa to the application of crushed wallboard at fourWisconsin locations.
Treatment Arlington Ashland Lancaster Spooner
—————————————— tons/a ——————————————
Control 4.0 2.6 4.2 3.4
Sulfura—50 lb/a 4.0 2.7 4.0 3.6
Crushed wallboard1 ton/a 4.1 2.7 4.2 3.74 tons/a 3.9 2.8 4.1 3.816 tons/a 4.1 2.8 4.1 3.9
a Applied as gypsum fertilizer.Source: Wolkowski, R.P. 2003. Using Recycled Wallboard for Crop Production. University of Wisconsin-Extension
publication A3782.
Table 10-7. Carbon to nitrogenratios (C:N) of selected organicamendments.
Carbon toAmendment nitrogen ratio
Alfalfa hay 12:1
Rotted manure 15:1
Grass clippings 19:1
Tree leaves 60:1
Cornstalks 60:1
Straw 80:1
Sawdust 500:1
Wood shavings 500:1
Source: Schulte, E.E., and K.A. Kelling.1989. Organic Soil Conditioners.University of Wisconsin-Extensionpublication A2305.
C-10 10/18/05 11:15 AM Page 116
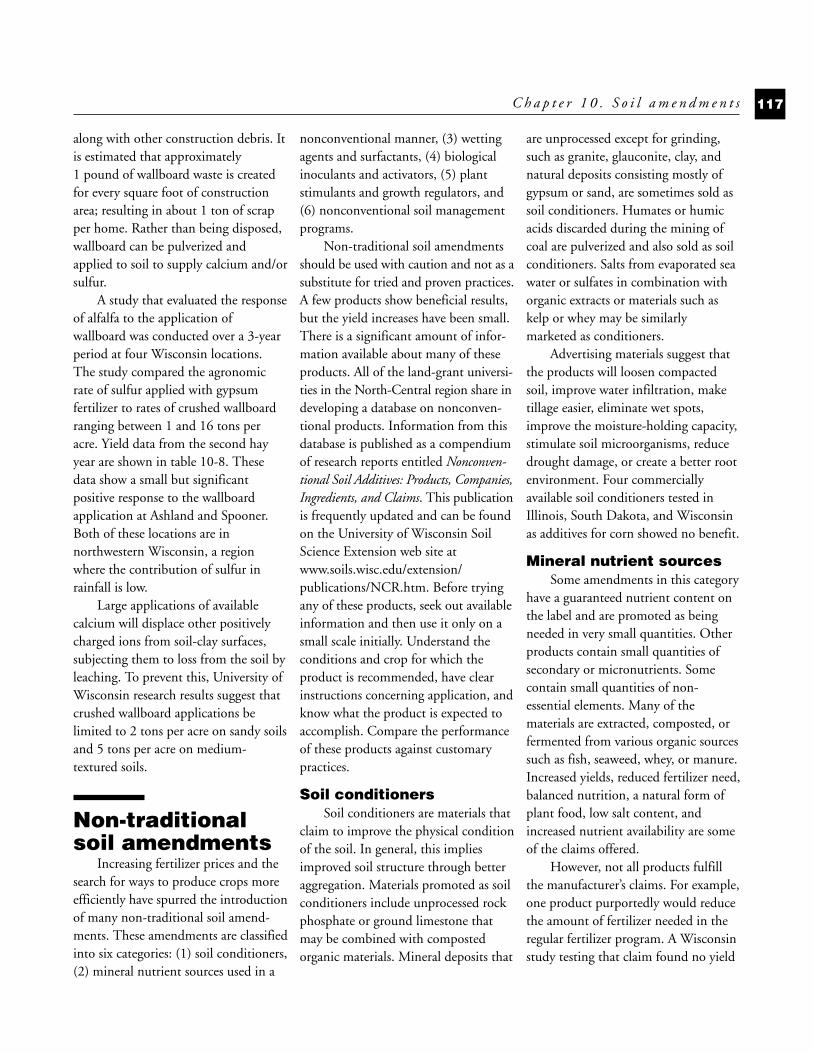
along with other construction debris. Itis estimated that approximately1 pound of wallboard waste is createdfor every square foot of constructionarea; resulting in about 1 ton of scrapper home. Rather than being disposed,wallboard can be pulverized andapplied to soil to supply calcium and/orsulfur.
A study that evaluated the responseof alfalfa to the application ofwallboard was conducted over a 3-yearperiod at four Wisconsin locations.The study compared the agronomicrate of sulfur applied with gypsumfertilizer to rates of crushed wallboardranging between 1 and 16 tons peracre. Yield data from the second hayyear are shown in table 10-8. Thesedata show a small but significantpositive response to the wallboardapplication at Ashland and Spooner.Both of these locations are innorthwestern Wisconsin, a regionwhere the contribution of sulfur inrainfall is low.
Large applications of availablecalcium will displace other positivelycharged ions from soil-clay surfaces,subjecting them to loss from the soil byleaching. To prevent this, University ofWisconsin research results suggest thatcrushed wallboard applications belimited to 2 tons per acre on sandy soilsand 5 tons per acre on medium-textured soils.
Non-traditionalsoil amendments
Increasing fertilizer prices and thesearch for ways to produce crops moreefficiently have spurred the introductionof many non-traditional soil amend-ments. These amendments are classifiedinto six categories: (1) soil conditioners,(2) mineral nutrient sources used in a
nonconventional manner, (3) wettingagents and surfactants, (4) biologicalinoculants and activators, (5) plantstimulants and growth regulators, and(6) nonconventional soil managementprograms.
Non-traditional soil amendmentsshould be used with caution and not as asubstitute for tried and proven practices.A few products show beneficial results,but the yield increases have been small.There is a significant amount of infor-mation available about many of theseproducts. All of the land-grant universi-ties in the North-Central region share indeveloping a database on nonconven-tional products. Information from thisdatabase is published as a compendiumof research reports entitled Nonconven-tional Soil Additives: Products, Companies,Ingredients, and Claims. This publicationis frequently updated and can be foundon the University of Wisconsin SoilScience Extension web site atwww.soils.wisc.edu/extension/publications/NCR.htm. Before tryingany of these products, seek out availableinformation and then use it only on asmall scale initially. Understand theconditions and crop for which theproduct is recommended, have clearinstructions concerning application, andknow what the product is expected toaccomplish. Compare the performanceof these products against customarypractices.
Soil conditioners Soil conditioners are materials that
claim to improve the physical conditionof the soil. In general, this impliesimproved soil structure through betteraggregation. Materials promoted as soilconditioners include unprocessed rockphosphate or ground limestone thatmay be combined with compostedorganic materials. Mineral deposits that
are unprocessed except for grinding,such as granite, glauconite, clay, andnatural deposits consisting mostly ofgypsum or sand, are sometimes sold assoil conditioners. Humates or humicacids discarded during the mining ofcoal are pulverized and also sold as soilconditioners. Salts from evaporated seawater or sulfates in combination withorganic extracts or materials such askelp or whey may be similarlymarketed as conditioners.
Advertising materials suggest thatthe products will loosen compactedsoil, improve water infiltration, maketillage easier, eliminate wet spots,improve the moisture-holding capacity,stimulate soil microorganisms, reducedrought damage, or create a better rootenvironment. Four commerciallyavailable soil conditioners tested inIllinois, South Dakota, and Wisconsinas additives for corn showed no benefit.
Mineral nutrient sourcesSome amendments in this category
have a guaranteed nutrient content onthe label and are promoted as beingneeded in very small quantities. Otherproducts contain small quantities ofsecondary or micronutrients. Somecontain small quantities of non-essential elements. Many of thematerials are extracted, composted, orfermented from various organic sourcessuch as fish, seaweed, whey, or manure.Increased yields, reduced fertilizer need,balanced nutrition, a natural form ofplant food, low salt content, andincreased nutrient availability are someof the claims offered.
However, not all products fulfillthe manufacturer’s claims. For example,one product purportedly would reducethe amount of fertilizer needed in theregular fertilizer program. A Wisconsinstudy testing that claim found no yield
C h a p t e r 1 0 . S o i l a m e n d m e n t s 117
C-10 10/18/05 11:15 AM Page 117
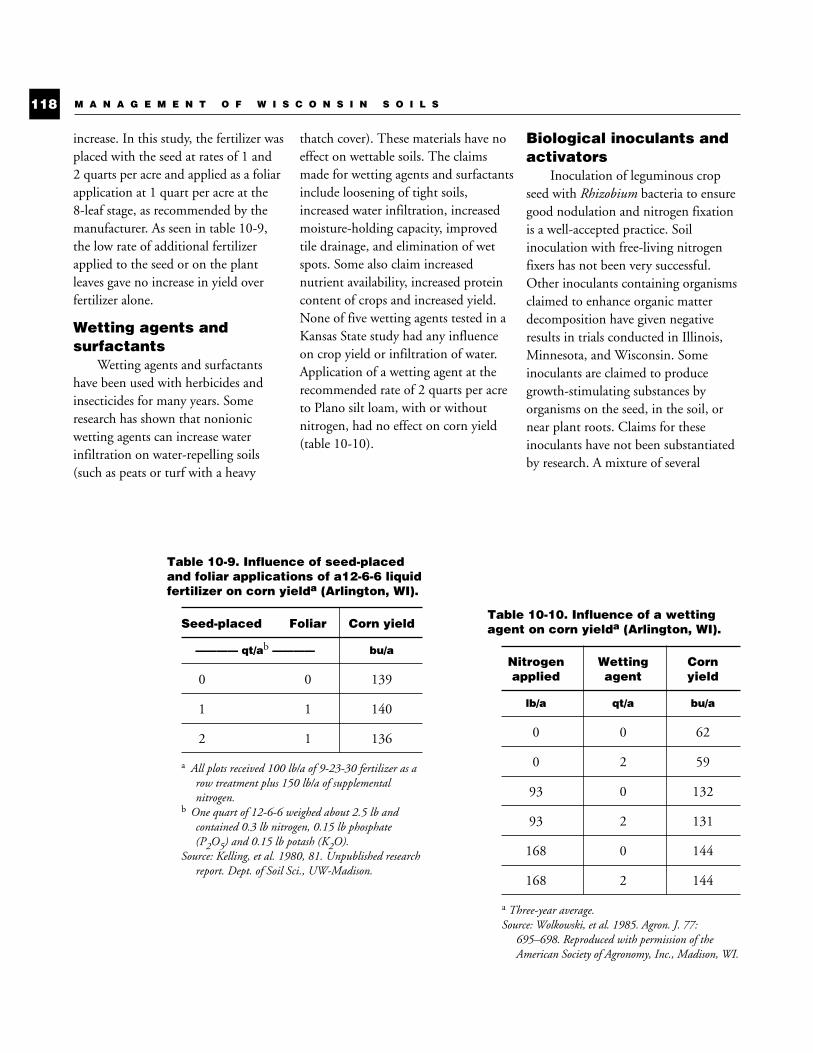
increase. In this study, the fertilizer wasplaced with the seed at rates of 1 and2 quarts per acre and applied as a foliarapplication at 1 quart per acre at the8-leaf stage, as recommended by themanufacturer. As seen in table 10-9,the low rate of additional fertilizerapplied to the seed or on the plantleaves gave no increase in yield overfertilizer alone.
Wetting agents andsurfactants
Wetting agents and surfactantshave been used with herbicides andinsecticides for many years. Someresearch has shown that nonionicwetting agents can increase waterinfiltration on water-repelling soils(such as peats or turf with a heavy
thatch cover). These materials have noeffect on wettable soils. The claimsmade for wetting agents and surfactantsinclude loosening of tight soils,increased water infiltration, increasedmoisture-holding capacity, improvedtile drainage, and elimination of wetspots. Some also claim increasednutrient availability, increased proteincontent of crops and increased yield.None of five wetting agents tested in aKansas State study had any influenceon crop yield or infiltration of water.Application of a wetting agent at therecommended rate of 2 quarts per acreto Plano silt loam, with or withoutnitrogen, had no effect on corn yield(table 10-10).
Biological inoculants andactivators
Inoculation of leguminous cropseed with Rhizobium bacteria to ensuregood nodulation and nitrogen fixationis a well-accepted practice. Soilinoculation with free-living nitrogenfixers has not been very successful.Other inoculants containing organismsclaimed to enhance organic matterdecomposition have given negativeresults in trials conducted in Illinois,Minnesota, and Wisconsin. Someinoculants are claimed to producegrowth-stimulating substances byorganisms on the seed, in the soil, ornear plant roots. Claims for theseinoculants have not been substantiatedby research. A mixture of several
M A N A G E M E N T O F W I S C O N S I N S O I L S118
Table 10-10. Influence of a wettingagent on corn yielda (Arlington, WI).
Nitrogen Wetting Cornapplied agent yield
lb/a qt/a bu/a
0 0 62
0 2 59
93 0 132
93 2 131
168 0 144
168 2 144
a Three-year average.Source: Wolkowski, et al. 1985. Agron. J. 77:
695–698. Reproduced with permission of theAmerican Society of Agronomy, Inc., Madison, WI.
Table 10-9. Influence of seed-placedand foliar applications of a12-6-6 liquidfertilizer on corn yielda (Arlington, WI).
Seed-placed Foliar Corn yield
———— qt/ab ———— bu/a
0 0 139
1 1 140
2 1 136
a All plots received 100 lb/a of 9-23-30 fertilizer as arow treatment plus 150 lb/a of supplementalnitrogen.
b One quart of 12-6-6 weighed about 2.5 lb andcontained 0.3 lb nitrogen, 0.15 lb phosphate(P2O5) and 0.15 lb potash (K2O).
Source: Kelling, et al. 1980, 81. Unpublished researchreport. Dept. of Soil Sci., UW-Madison.
C-10 10/18/05 11:15 AM Page 118
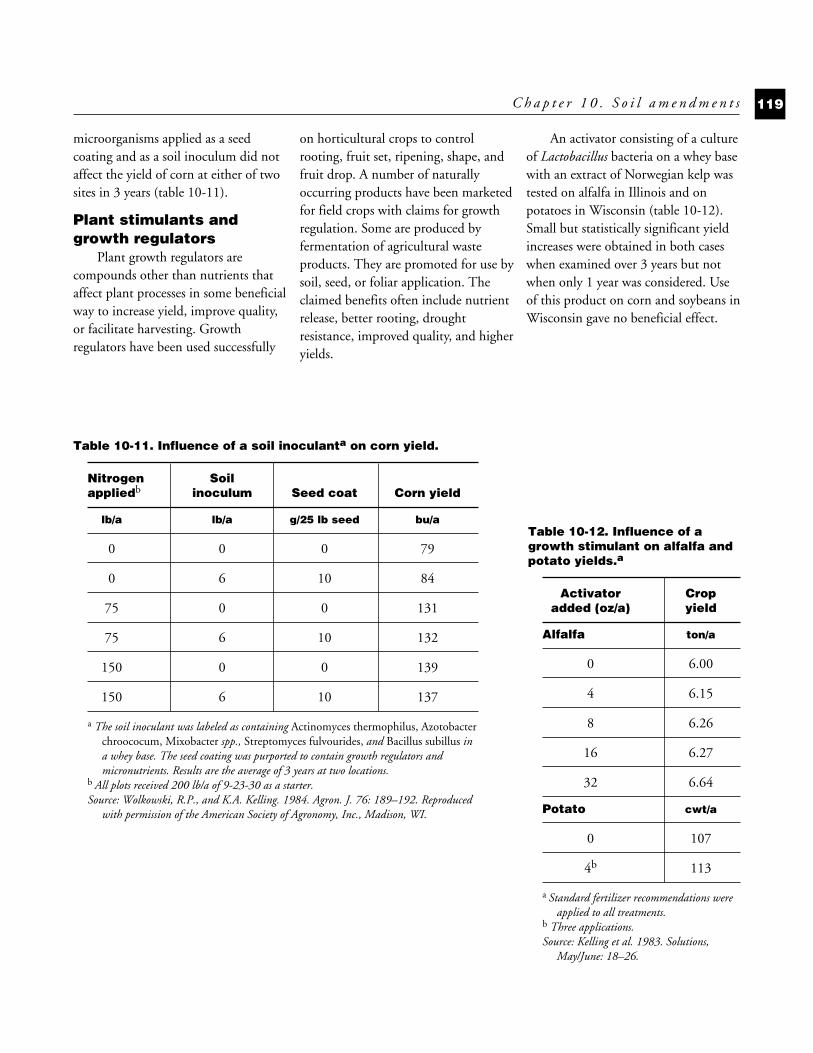
microorganisms applied as a seedcoating and as a soil inoculum did notaffect the yield of corn at either of twosites in 3 years (table 10-11).
Plant stimulants andgrowth regulators
Plant growth regulators arecompounds other than nutrients thataffect plant processes in some beneficialway to increase yield, improve quality,or facilitate harvesting. Growthregulators have been used successfully
on horticultural crops to controlrooting, fruit set, ripening, shape, andfruit drop. A number of naturallyoccurring products have been marketedfor field crops with claims for growthregulation. Some are produced byfermentation of agricultural wasteproducts. They are promoted for use bysoil, seed, or foliar application. Theclaimed benefits often include nutrientrelease, better rooting, droughtresistance, improved quality, and higheryields.
An activator consisting of a cultureof Lactobacillus bacteria on a whey basewith an extract of Norwegian kelp wastested on alfalfa in Illinois and onpotatoes in Wisconsin (table 10-12).Small but statistically significant yieldincreases were obtained in both caseswhen examined over 3 years but notwhen only 1 year was considered. Useof this product on corn and soybeans inWisconsin gave no beneficial effect.
C h a p t e r 1 0 . S o i l a m e n d m e n t s 119
Table 10-11. Influence of a soil inoculanta on corn yield.
Nitrogen Soilappliedb inoculum Seed coat Corn yield
lb/a lb/a g/25 lb seed bu/a
0 0 0 79
0 6 10 84
75 0 0 131
75 6 10 132
150 0 0 139
150 6 10 137
a The soil inoculant was labeled as containing Actinomyces thermophilus, Azotobacterchroococum, Mixobacter spp., Streptomyces fulvourides, and Bacillus subillus ina whey base. The seed coating was purported to contain growth regulators andmicronutrients. Results are the average of 3 years at two locations.
b All plots received 200 lb/a of 9-23-30 as a starter.Source: Wolkowski, R.P., and K.A. Kelling. 1984. Agron. J. 76: 189–192. Reproduced
with permission of the American Society of Agronomy, Inc., Madison, WI.
Table 10-12. Influence of agrowth stimulant on alfalfa andpotato yields.a
Activator Cropadded (oz/a) yield
Alfalfa ton/a
0 6.00
4 6.15
8 6.26
16 6.27
32 6.64
Potato cwt/a
0 107
4b 113
a Standard fertilizer recommendations wereapplied to all treatments.
b Three applications.Source: Kelling et al. 1983. Solutions,
May/June: 18–26.
C-10 10/18/05 11:15 AM Page 119

Questions1.A farmer spreads dairy manure at a
rate of 25 tons per acre on an80-acre field.
a. How many pounds per acre oftotal nitrogen, phosphate, andpotash will the field receive?
b. How many pounds of thesenutrients will be available to cropsin the growing season followingmanure application? (Assume thatthe manure is incorporated thesame day that it is applied.)
2.What benefit do manure, sewagesludge, and whey offer besidessupplying nutrients?
3.How do sewage sludge and wheycompare with manure as plantnutrient sources?
4. It is recommended that land towhich sewage sludge will be appliedshould be limed to a pH of 6.5 orhigher. Why?
5.Explain how applying sawdust tosoil could induce nitrogen deficiencyin crops.
6.Of what value is gypsum as a soilamendment? Under what conditionswould you recommend that it beused?
7.Under what conditions are wettingagents useful in crop production?
M A N A G E M E N T O F W I S C O N S I N S O I L S120
C-10 10/18/05 11:15 AM Page 120
“The earth has alwaysnurtured us, despite ourscornful abuse, and we canno longer continue to behaveas its ungrateful offspring. Itis time for us to nurture theearth in return.”
D.J. Hillel. Out of the Earth, 1991
Nutrients, pesticides, and othersubstances need to be managedproperly to meet crop requirementswithout harming human or animalhealth or the quality of our waterresources. Nutrients of concern withrespect to water quality are nitrogenand phosphorus. Generally, nitrate-nitrogen is a groundwater concern andphosphorus is a surface water issue;however, nitrogen can also be factor insome surface water quality problems.Excess nitrates in drinking water cancause human and animal healthproblems, while excess phosphorus inlakes and streams can lead to algalblooms and excessive growth of aquaticplants. Pesticides used to control weeds,insects, and diseases can cause healthproblems if they get into drinkingwater or food. (Discussion of pesticidemanagement is beyond the scope ofthis soil management publication.)Lastly, heavy metals, occurringnaturally or added incidentally, are alsoof some concern because at highconcentrations they interfere withvarious plant and animal metabolicprocesses.
Nitrates ingroundwater
Groundwater suppliesapproximately 70% of the drinkingwater in Wisconsin. Nitrate is the mostcommon contaminant of groundwater.Federal and state drinking waterstandards specify that water used forhuman consumption should notcontain more than 10 ppm of nitrate-nitrogen (NO3
–-N). This value isequivalent to 44 ppm nitrate (NO3
–).Laboratories report water nitratecontent as either nitrate-nitrogen ornitrate. Many private wells inWisconsin exceed this level.
The health concern with nitratecontamination of drinking water islargely focused on infants under 6months of age. Infants, as well as younglivestock, are susceptible to a conditioncalled methemoglobinemia, or “bluebaby syndrome” if they consume wateror formula that contains elevated levelsof nitrate-nitrogen. Bacteria in a baby’smouth and stomach convert ingestednitrate to nitrite (NO2
–). The nitritereacts with iron in the blood’shemoglobin, reducing the capacity ofblood to carry oxygen. The result, inrare circumstances, can be fatal toinfants. Although water containingmore than 10 ppm of nitrate-nitrogenis not recommended for human
121
Environmental concernsand preventive soilmanagement practices
C H A P T E R
11
C-11 10/18/05 11:16 AM Page 121
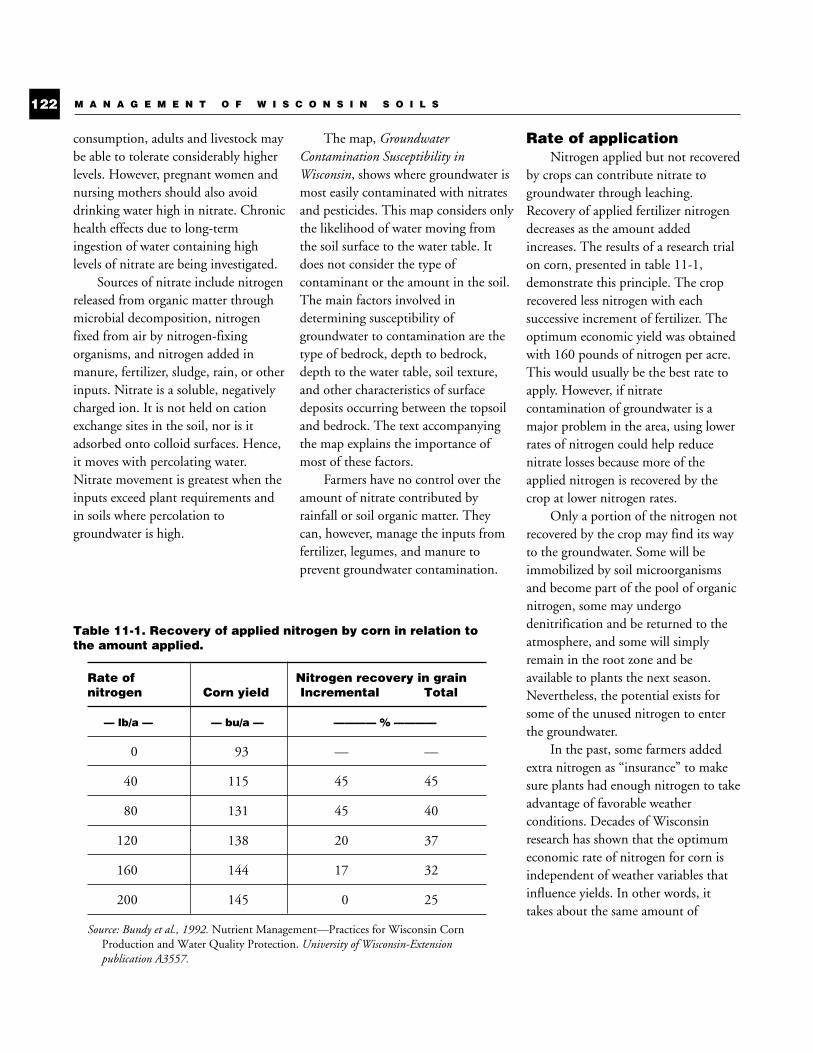
consumption, adults and livestock maybe able to tolerate considerably higherlevels. However, pregnant women andnursing mothers should also avoiddrinking water high in nitrate. Chronichealth effects due to long-termingestion of water containing highlevels of nitrate are being investigated.
Sources of nitrate include nitrogenreleased from organic matter throughmicrobial decomposition, nitrogenfixed from air by nitrogen-fixingorganisms, and nitrogen added inmanure, fertilizer, sludge, rain, or otherinputs. Nitrate is a soluble, negativelycharged ion. It is not held on cationexchange sites in the soil, nor is itadsorbed onto colloid surfaces. Hence,it moves with percolating water.Nitrate movement is greatest when theinputs exceed plant requirements andin soils where percolation togroundwater is high.
The map, GroundwaterContamination Susceptibility inWisconsin, shows where groundwater ismost easily contaminated with nitratesand pesticides. This map considers onlythe likelihood of water moving fromthe soil surface to the water table. Itdoes not consider the type ofcontaminant or the amount in the soil.The main factors involved indetermining susceptibility ofgroundwater to contamination are thetype of bedrock, depth to bedrock,depth to the water table, soil texture,and other characteristics of surfacedeposits occurring between the topsoiland bedrock. The text accompanyingthe map explains the importance ofmost of these factors.
Farmers have no control over theamount of nitrate contributed byrainfall or soil organic matter. Theycan, however, manage the inputs fromfertilizer, legumes, and manure toprevent groundwater contamination.
Rate of applicationNitrogen applied but not recovered
by crops can contribute nitrate togroundwater through leaching.Recovery of applied fertilizer nitrogendecreases as the amount addedincreases. The results of a research trialon corn, presented in table 11-1,demonstrate this principle. The croprecovered less nitrogen with eachsuccessive increment of fertilizer. Theoptimum economic yield was obtainedwith 160 pounds of nitrogen per acre.This would usually be the best rate toapply. However, if nitratecontamination of groundwater is amajor problem in the area, using lowerrates of nitrogen could help reducenitrate losses because more of theapplied nitrogen is recovered by thecrop at lower nitrogen rates.
Only a portion of the nitrogen notrecovered by the crop may find its wayto the groundwater. Some will beimmobilized by soil microorganismsand become part of the pool of organicnitrogen, some may undergodenitrification and be returned to theatmosphere, and some will simplyremain in the root zone and beavailable to plants the next season.Nevertheless, the potential exists forsome of the unused nitrogen to enterthe groundwater.
In the past, some farmers addedextra nitrogen as “insurance” to makesure plants had enough nitrogen to takeadvantage of favorable weatherconditions. Decades of Wisconsinresearch has shown that the optimumeconomic rate of nitrogen for corn isindependent of weather variables thatinfluence yields. In other words, ittakes about the same amount of
M A N A G E M E N T O F W I S C O N S I N S O I L S122
Table 11-1. Recovery of applied nitrogen by corn in relation tothe amount applied.
Rate of Nitrogen recovery in grainnitrogen Corn yield Incremental Total
— lb/a — — bu/a — ———— % ————
0 93 — —
40 115 45 45
80 131 45 40
120 138 20 37
160 144 17 32
200 145 0 25
Source: Bundy et al., 1992. Nutrient Management—Practices for Wisconsin CornProduction and Water Quality Protection. University of Wisconsin-Extensionpublication A3557.
C-11 10/18/05 11:16 AM Page 122
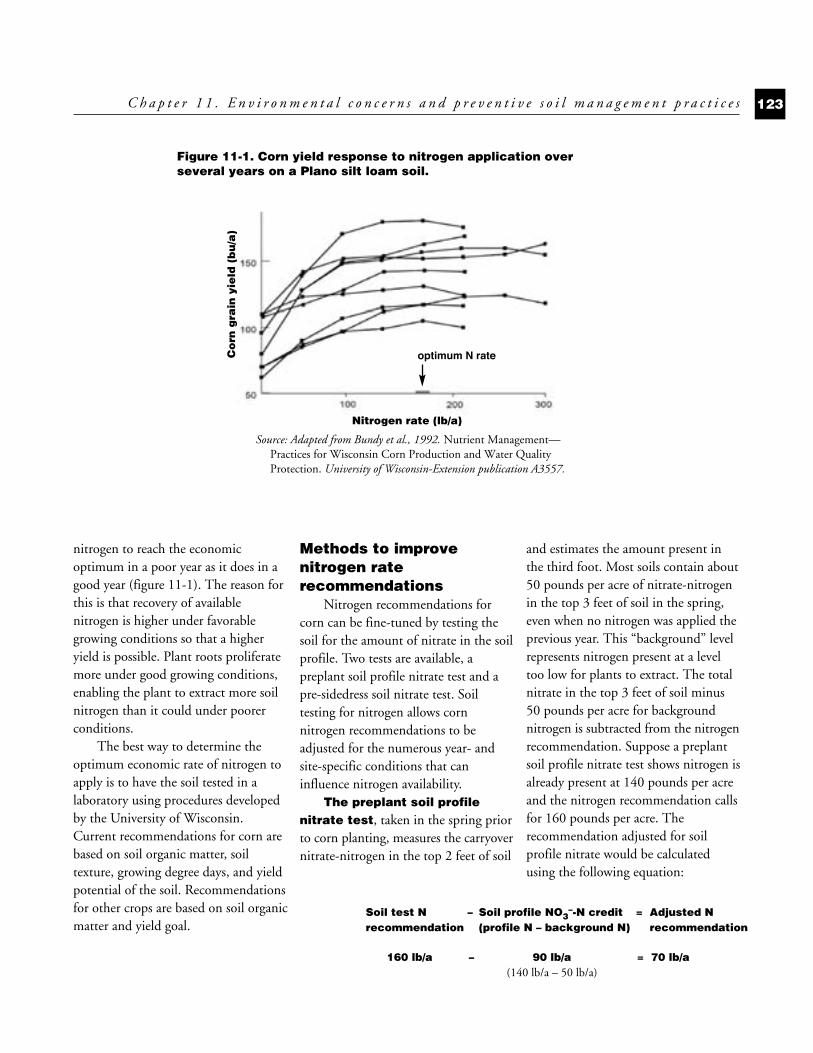
nitrogen to reach the economicoptimum in a poor year as it does in agood year (figure 11-1). The reason forthis is that recovery of availablenitrogen is higher under favorablegrowing conditions so that a higheryield is possible. Plant roots proliferatemore under good growing conditions,enabling the plant to extract more soilnitrogen than it could under poorerconditions.
The best way to determine theoptimum economic rate of nitrogen toapply is to have the soil tested in alaboratory using procedures developedby the University of Wisconsin.Current recommendations for corn arebased on soil organic matter, soiltexture, growing degree days, and yieldpotential of the soil. Recommendationsfor other crops are based on soil organicmatter and yield goal.
Methods to improvenitrogen raterecommendations
Nitrogen recommendations forcorn can be fine-tuned by testing thesoil for the amount of nitrate in the soilprofile. Two tests are available, apreplant soil profile nitrate test and apre-sidedress soil nitrate test. Soiltesting for nitrogen allows cornnitrogen recommendations to beadjusted for the numerous year- andsite-specific conditions that caninfluence nitrogen availability.
The preplant soil profilenitrate test, taken in the spring priorto corn planting, measures the carryovernitrate-nitrogen in the top 2 feet of soil
and estimates the amount present inthe third foot. Most soils contain about50 pounds per acre of nitrate-nitrogenin the top 3 feet of soil in the spring,even when no nitrogen was applied theprevious year. This “background” levelrepresents nitrogen present at a leveltoo low for plants to extract. The totalnitrate in the top 3 feet of soil minus50 pounds per acre for backgroundnitrogen is subtracted from the nitrogenrecommendation. Suppose a preplantsoil profile nitrate test shows nitrogen isalready present at 140 pounds per acreand the nitrogen recommendation callsfor 160 pounds per acre. Therecommendation adjusted for soilprofile nitrate would be calculatedusing the following equation:
C h a p t e r 1 1 . E n v i r o n m e n t a l c o n c e r n s a n d p r e v e n t i v e s o i l m a n a g e m e n t p r a c t i c e s 123
Figure 11-1. Corn yield response to nitrogen application overseveral years on a Plano silt loam soil.
Soil test N – Soil profile NO3–-N credit = Adjusted N
recommendation (profile N – background N) recommendation
160 lb/a – 90 lb/a = 70 lb/a(140 lb/a – 50 lb/a)
Co
rn g
rain
yie
ld (
bu
/a)
Nitrogen rate (lb/a)
optimum N rate
Source: Adapted from Bundy et al., 1992. Nutrient Management—Practices for Wisconsin Corn Production and Water QualityProtection. University of Wisconsin-Extension publication A3557.
C-11 10/18/05 11:16 AM Page 123
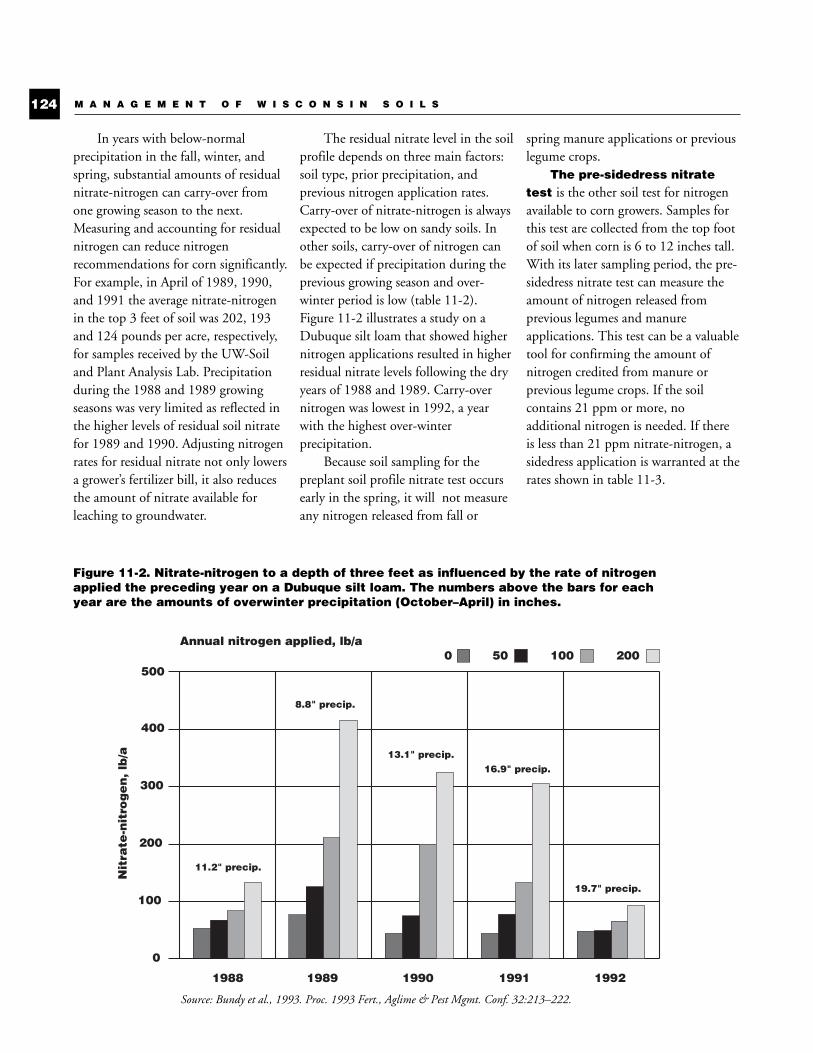
In years with below-normalprecipitation in the fall, winter, andspring, substantial amounts of residualnitrate-nitrogen can carry-over fromone growing season to the next.Measuring and accounting for residualnitrogen can reduce nitrogenrecommendations for corn significantly.For example, in April of 1989, 1990,and 1991 the average nitrate-nitrogenin the top 3 feet of soil was 202, 193and 124 pounds per acre, respectively,for samples received by the UW-Soiland Plant Analysis Lab. Precipitationduring the 1988 and 1989 growingseasons was very limited as reflected inthe higher levels of residual soil nitratefor 1989 and 1990. Adjusting nitrogenrates for residual nitrate not only lowersa grower’s fertilizer bill, it also reducesthe amount of nitrate available forleaching to groundwater.
The residual nitrate level in the soilprofile depends on three main factors:soil type, prior precipitation, andprevious nitrogen application rates.Carry-over of nitrate-nitrogen is alwaysexpected to be low on sandy soils. Inother soils, carry-over of nitrogen canbe expected if precipitation during theprevious growing season and over-winter period is low (table 11-2).Figure 11-2 illustrates a study on aDubuque silt loam that showed highernitrogen applications resulted in higherresidual nitrate levels following the dryyears of 1988 and 1989. Carry-overnitrogen was lowest in 1992, a yearwith the highest over-winterprecipitation.
Because soil sampling for thepreplant soil profile nitrate test occursearly in the spring, it will not measureany nitrogen released from fall or
spring manure applications or previouslegume crops.
The pre-sidedress nitratetest is the other soil test for nitrogenavailable to corn growers. Samples forthis test are collected from the top footof soil when corn is 6 to 12 inches tall.With its later sampling period, the pre-sidedress nitrate test can measure theamount of nitrogen released fromprevious legumes and manureapplications. This test can be a valuabletool for confirming the amount ofnitrogen credited from manure orprevious legume crops. If the soilcontains 21 ppm or more, noadditional nitrogen is needed. If thereis less than 21 ppm nitrate-nitrogen, asidedress application is warranted at therates shown in table 11-3.
M A N A G E M E N T O F W I S C O N S I N S O I L S124
Figure 11-2. Nitrate-nitrogen to a depth of three feet as influenced by the rate of nitrogenapplied the preceding year on a Dubuque silt loam. The numbers above the bars for eachyear are the amounts of overwinter precipitation (October–April) in inches.
Nit
rate
-nit
rog
en
, lb
/a
500
400
300
200
100
0
1988
Annual nitrogen applied, lb/a
1989 1990 1991 1992
0 20010050
19.7" precip.
16.9" precip.13.1" precip.
8.8" precip.
11.2" precip.
Source: Bundy et al., 1993. Proc. 1993 Fert., Aglime & Pest Mgmt. Conf. 32:213–222.
C-11 10/18/05 11:16 AM Page 124
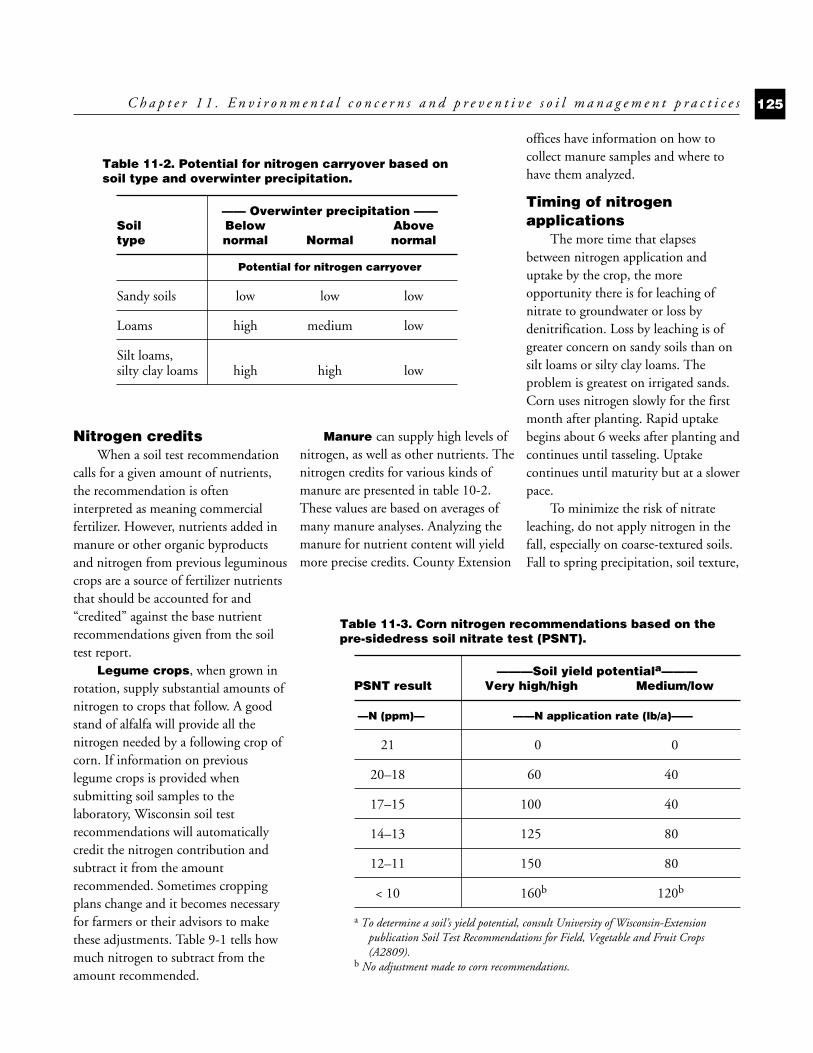
Nitrogen creditsWhen a soil test recommendation
calls for a given amount of nutrients,the recommendation is ofteninterpreted as meaning commercialfertilizer. However, nutrients added inmanure or other organic byproductsand nitrogen from previous leguminouscrops are a source of fertilizer nutrientsthat should be accounted for and“credited” against the base nutrientrecommendations given from the soiltest report.
Legume crops, when grown inrotation, supply substantial amounts ofnitrogen to crops that follow. A goodstand of alfalfa will provide all thenitrogen needed by a following crop ofcorn. If information on previouslegume crops is provided whensubmitting soil samples to thelaboratory, Wisconsin soil testrecommendations will automaticallycredit the nitrogen contribution andsubtract it from the amountrecommended. Sometimes croppingplans change and it becomes necessaryfor farmers or their advisors to makethese adjustments. Table 9-1 tells howmuch nitrogen to subtract from theamount recommended.
Manure can supply high levels ofnitrogen, as well as other nutrients. Thenitrogen credits for various kinds ofmanure are presented in table 10-2.These values are based on averages ofmany manure analyses. Analyzing themanure for nutrient content will yieldmore precise credits. County Extension
offices have information on how tocollect manure samples and where tohave them analyzed.
Timing of nitrogenapplications
The more time that elapsesbetween nitrogen application anduptake by the crop, the moreopportunity there is for leaching ofnitrate to groundwater or loss bydenitrification. Loss by leaching is ofgreater concern on sandy soils than onsilt loams or silty clay loams. Theproblem is greatest on irrigated sands.Corn uses nitrogen slowly for the firstmonth after planting. Rapid uptakebegins about 6 weeks after planting andcontinues until tasseling. Uptakecontinues until maturity but at a slowerpace.
To minimize the risk of nitrateleaching, do not apply nitrogen in thefall, especially on coarse-textured soils.Fall to spring precipitation, soil texture,
C h a p t e r 1 1 . E n v i r o n m e n t a l c o n c e r n s a n d p r e v e n t i v e s o i l m a n a g e m e n t p r a c t i c e s 125
Table 11-2. Potential for nitrogen carryover based onsoil type and overwinter precipitation.
—— Overwinter precipitation ——Soil Below Abovetype normal Normal normal
Potential for nitrogen carryover
Sandy soils low low low
Loams high medium low
Silt loams, silty clay loams high high low
Table 11-3. Corn nitrogen recommendations based on thepre-sidedress soil nitrate test (PSNT).
———Soil yield potentiala———PSNT result Very high/high Medium/low
—N (ppm)— ——N application rate (lb/a)——
21 0 0
20–18 60 40
17–15 100 40
14–13 125 80
12–11 150 80
< 10 160b 120b
a To determine a soil’s yield potential, consult University of Wisconsin-Extensionpublication Soil Test Recommendations for Field, Vegetable and Fruit Crops(A2809).
b No adjustment made to corn recommendations.
C-11 10/18/05 11:16 AM Page 125
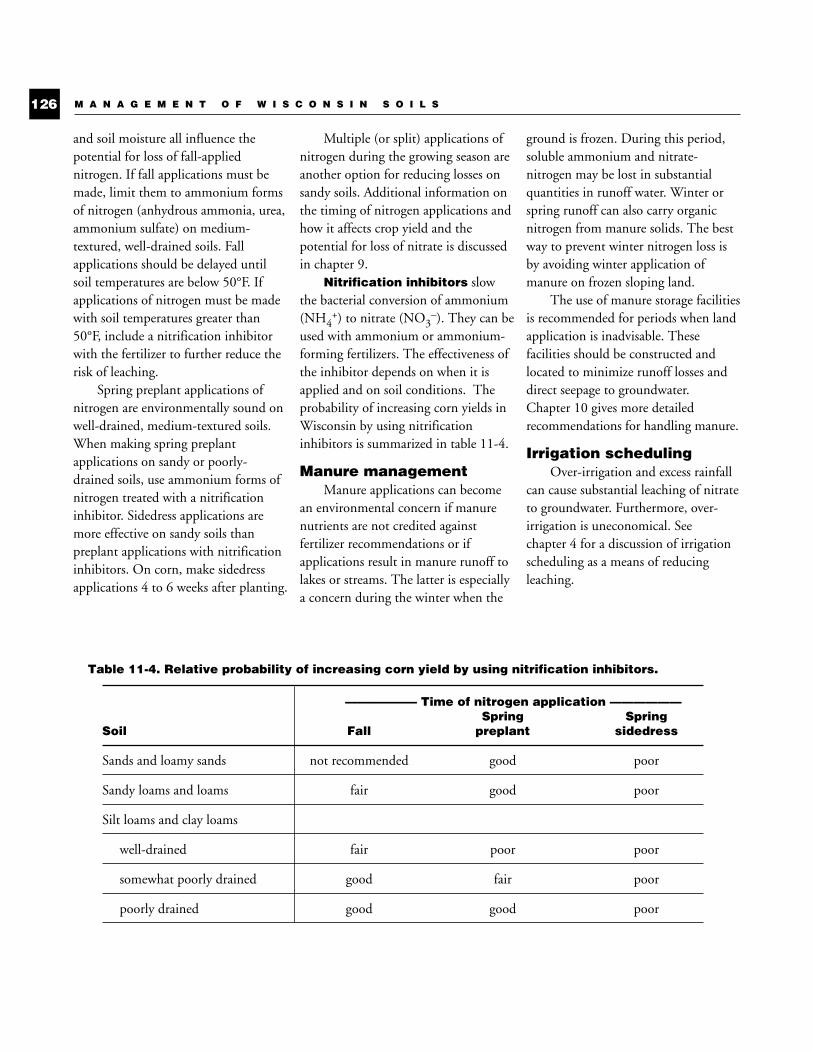
and soil moisture all influence thepotential for loss of fall-appliednitrogen. If fall applications must bemade, limit them to ammonium formsof nitrogen (anhydrous ammonia, urea,ammonium sulfate) on medium-textured, well-drained soils. Fallapplications should be delayed untilsoil temperatures are below 50°F. Ifapplications of nitrogen must be madewith soil temperatures greater than50°F, include a nitrification inhibitorwith the fertilizer to further reduce therisk of leaching.
Spring preplant applications ofnitrogen are environmentally sound onwell-drained, medium-textured soils.When making spring preplantapplications on sandy or poorly-drained soils, use ammonium forms ofnitrogen treated with a nitrificationinhibitor. Sidedress applications aremore effective on sandy soils thanpreplant applications with nitrificationinhibitors. On corn, make sidedressapplications 4 to 6 weeks after planting.
Multiple (or split) applications ofnitrogen during the growing season areanother option for reducing losses onsandy soils. Additional information onthe timing of nitrogen applications andhow it affects crop yield and thepotential for loss of nitrate is discussedin chapter 9.
Nitrification inhibitors slowthe bacterial conversion of ammonium(NH4
+) to nitrate (NO3–). They can be
used with ammonium or ammonium-forming fertilizers. The effectiveness ofthe inhibitor depends on when it isapplied and on soil conditions. Theprobability of increasing corn yields inWisconsin by using nitrificationinhibitors is summarized in table 11-4.
Manure managementManure applications can become
an environmental concern if manurenutrients are not credited againstfertilizer recommendations or ifapplications result in manure runoff tolakes or streams. The latter is especiallya concern during the winter when the
ground is frozen. During this period,soluble ammonium and nitrate-nitrogen may be lost in substantialquantities in runoff water. Winter orspring runoff can also carry organicnitrogen from manure solids. The bestway to prevent winter nitrogen loss isby avoiding winter application ofmanure on frozen sloping land.
The use of manure storage facilitiesis recommended for periods when landapplication is inadvisable. Thesefacilities should be constructed andlocated to minimize runoff losses anddirect seepage to groundwater.Chapter 10 gives more detailedrecommendations for handling manure.
Irrigation schedulingOver-irrigation and excess rainfall
can cause substantial leaching of nitrateto groundwater. Furthermore, over-irrigation is uneconomical. Seechapter 4 for a discussion of irrigationscheduling as a means of reducingleaching.
M A N A G E M E N T O F W I S C O N S I N S O I L S126
Table 11-4. Relative probability of increasing corn yield by using nitrification inhibitors.
—————— Time of nitrogen application ——————Spring Spring
Soil Fall preplant sidedress
Sands and loamy sands not recommended good poor
Sandy loams and loams fair good poor
Silt loams and clay loams
well-drained fair poor poor
somewhat poorly drained good fair poor
poorly drained good good poor
C-11 10/18/05 11:16 AM Page 126
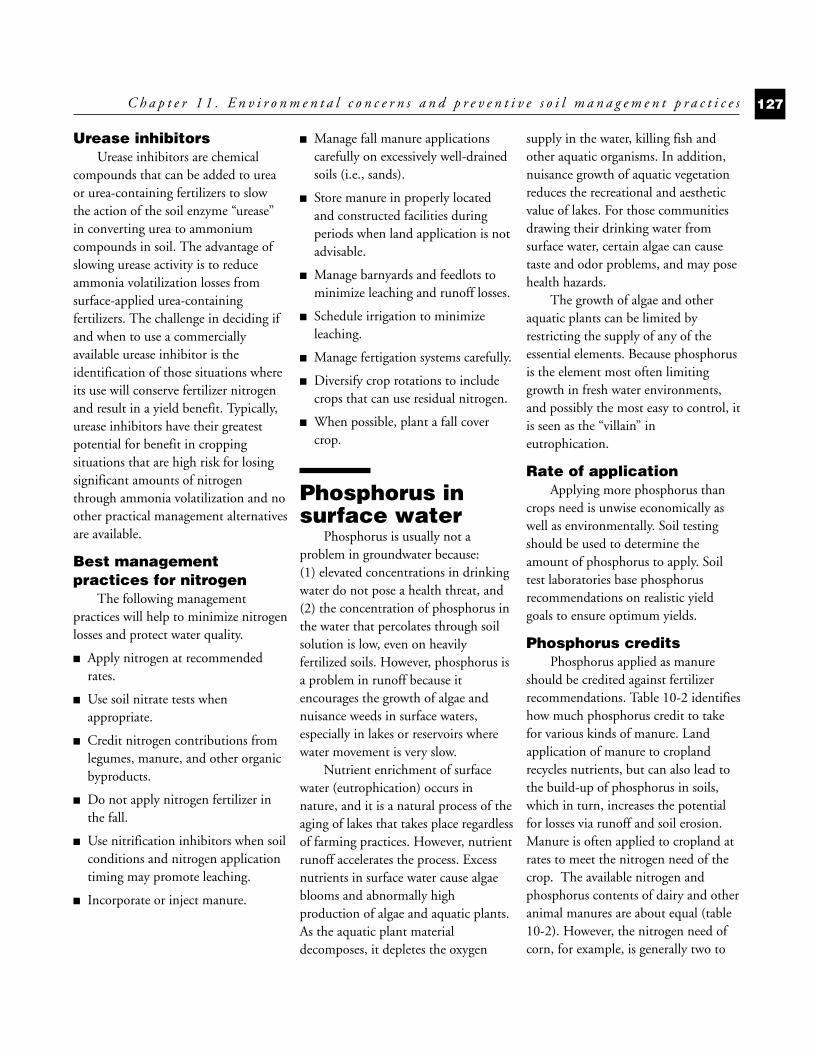
Urease inhibitorsUrease inhibitors are chemical
compounds that can be added to ureaor urea-containing fertilizers to slowthe action of the soil enzyme “urease”in converting urea to ammoniumcompounds in soil. The advantage ofslowing urease activity is to reduceammonia volatilization losses fromsurface-applied urea-containingfertilizers. The challenge in deciding ifand when to use a commerciallyavailable urease inhibitor is theidentification of those situations whereits use will conserve fertilizer nitrogenand result in a yield benefit. Typically,urease inhibitors have their greatestpotential for benefit in croppingsituations that are high risk for losingsignificant amounts of nitrogenthrough ammonia volatilization and noother practical management alternativesare available.
Best managementpractices for nitrogen
The following managementpractices will help to minimize nitrogenlosses and protect water quality.
■ Apply nitrogen at recommendedrates.
■ Use soil nitrate tests whenappropriate.
■ Credit nitrogen contributions fromlegumes, manure, and other organicbyproducts.
■ Do not apply nitrogen fertilizer inthe fall.
■ Use nitrification inhibitors when soilconditions and nitrogen applicationtiming may promote leaching.
■ Incorporate or inject manure.
■ Manage fall manure applicationscarefully on excessively well-drainedsoils (i.e., sands).
■ Store manure in properly locatedand constructed facilities duringperiods when land application is notadvisable.
■ Manage barnyards and feedlots tominimize leaching and runoff losses.
■ Schedule irrigation to minimizeleaching.
■ Manage fertigation systems carefully.
■ Diversify crop rotations to includecrops that can use residual nitrogen.
■ When possible, plant a fall covercrop.
Phosphorus insurface water
Phosphorus is usually not aproblem in groundwater because:(1) elevated concentrations in drinkingwater do not pose a health threat, and(2) the concentration of phosphorus inthe water that percolates through soilsolution is low, even on heavilyfertilized soils. However, phosphorus isa problem in runoff because itencourages the growth of algae andnuisance weeds in surface waters,especially in lakes or reservoirs wherewater movement is very slow.
Nutrient enrichment of surfacewater (eutrophication) occurs innature, and it is a natural process of theaging of lakes that takes place regardlessof farming practices. However, nutrientrunoff accelerates the process. Excessnutrients in surface water cause algaeblooms and abnormally highproduction of algae and aquatic plants.As the aquatic plant materialdecomposes, it depletes the oxygen
supply in the water, killing fish andother aquatic organisms. In addition,nuisance growth of aquatic vegetationreduces the recreational and aestheticvalue of lakes. For those communitiesdrawing their drinking water fromsurface water, certain algae can causetaste and odor problems, and may posehealth hazards.
The growth of algae and otheraquatic plants can be limited byrestricting the supply of any of theessential elements. Because phosphorusis the element most often limitinggrowth in fresh water environments,and possibly the most easy to control, itis seen as the “villain” ineutrophication.
Rate of applicationApplying more phosphorus than
crops need is unwise economically aswell as environmentally. Soil testingshould be used to determine theamount of phosphorus to apply. Soiltest laboratories base phosphorusrecommendations on realistic yieldgoals to ensure optimum yields.
Phosphorus creditsPhosphorus applied as manure
should be credited against fertilizerrecommendations. Table 10-2 identifieshow much phosphorus credit to takefor various kinds of manure. Landapplication of manure to croplandrecycles nutrients, but can also lead tothe build-up of phosphorus in soils,which in turn, increases the potentialfor losses via runoff and soil erosion.Manure is often applied to cropland atrates to meet the nitrogen need of thecrop. The available nitrogen andphosphorus contents of dairy and otheranimal manures are about equal (table10-2). However, the nitrogen need ofcorn, for example, is generally two to
C h a p t e r 1 1 . E n v i r o n m e n t a l c o n c e r n s a n d p r e v e n t i v e s o i l m a n a g e m e n t p r a c t i c e s 127
C-11 10/18/05 11:16 AM Page 127
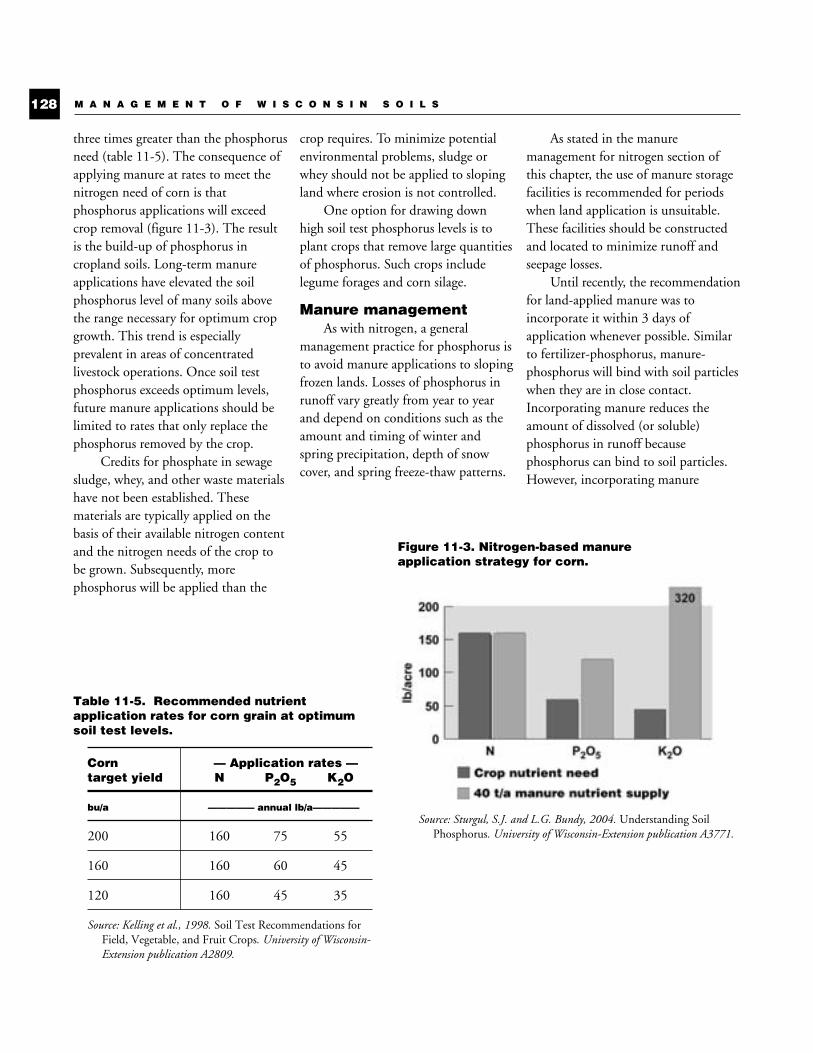
three times greater than the phosphorusneed (table 11-5). The consequence ofapplying manure at rates to meet thenitrogen need of corn is thatphosphorus applications will exceedcrop removal (figure 11-3). The resultis the build-up of phosphorus incropland soils. Long-term manureapplications have elevated the soilphosphorus level of many soils abovethe range necessary for optimum cropgrowth. This trend is especiallyprevalent in areas of concentratedlivestock operations. Once soil testphosphorus exceeds optimum levels,future manure applications should belimited to rates that only replace thephosphorus removed by the crop.
Credits for phosphate in sewagesludge, whey, and other waste materialshave not been established. Thesematerials are typically applied on thebasis of their available nitrogen contentand the nitrogen needs of the crop tobe grown. Subsequently, morephosphorus will be applied than the
crop requires. To minimize potentialenvironmental problems, sludge orwhey should not be applied to slopingland where erosion is not controlled.
One option for drawing downhigh soil test phosphorus levels is toplant crops that remove large quantitiesof phosphorus. Such crops includelegume forages and corn silage.
Manure managementAs with nitrogen, a general
management practice for phosphorus isto avoid manure applications to slopingfrozen lands. Losses of phosphorus inrunoff vary greatly from year to yearand depend on conditions such as theamount and timing of winter andspring precipitation, depth of snowcover, and spring freeze-thaw patterns.
As stated in the manuremanagement for nitrogen section ofthis chapter, the use of manure storagefacilities is recommended for periodswhen land application is unsuitable.These facilities should be constructedand located to minimize runoff andseepage losses.
Until recently, the recommendationfor land-applied manure was toincorporate it within 3 days ofapplication whenever possible. Similarto fertilizer-phosphorus, manure-phosphorus will bind with soil particleswhen they are in close contact.Incorporating manure reduces theamount of dissolved (or soluble)phosphorus in runoff becausephosphorus can bind to soil particles.However, incorporating manure
M A N A G E M E N T O F W I S C O N S I N S O I L S128
Table 11-5. Recommended nutrientapplication rates for corn grain at optimumsoil test levels.
Corn — Application rates —target yield N P2O5 K2O
bu/a ————— annual lb/a—————
200 160 75 55
160 160 60 45
120 160 45 35
Source: Kelling et al., 1998. Soil Test Recommendations forField, Vegetable, and Fruit Crops. University of Wisconsin-Extension publication A2809.
Figure 11-3. Nitrogen-based manureapplication strategy for corn.
Source: Sturgul, S.J. and L.G. Bundy, 2004. Understanding SoilPhosphorus. University of Wisconsin-Extension publication A3771.
C-11 10/18/05 11:16 AM Page 128
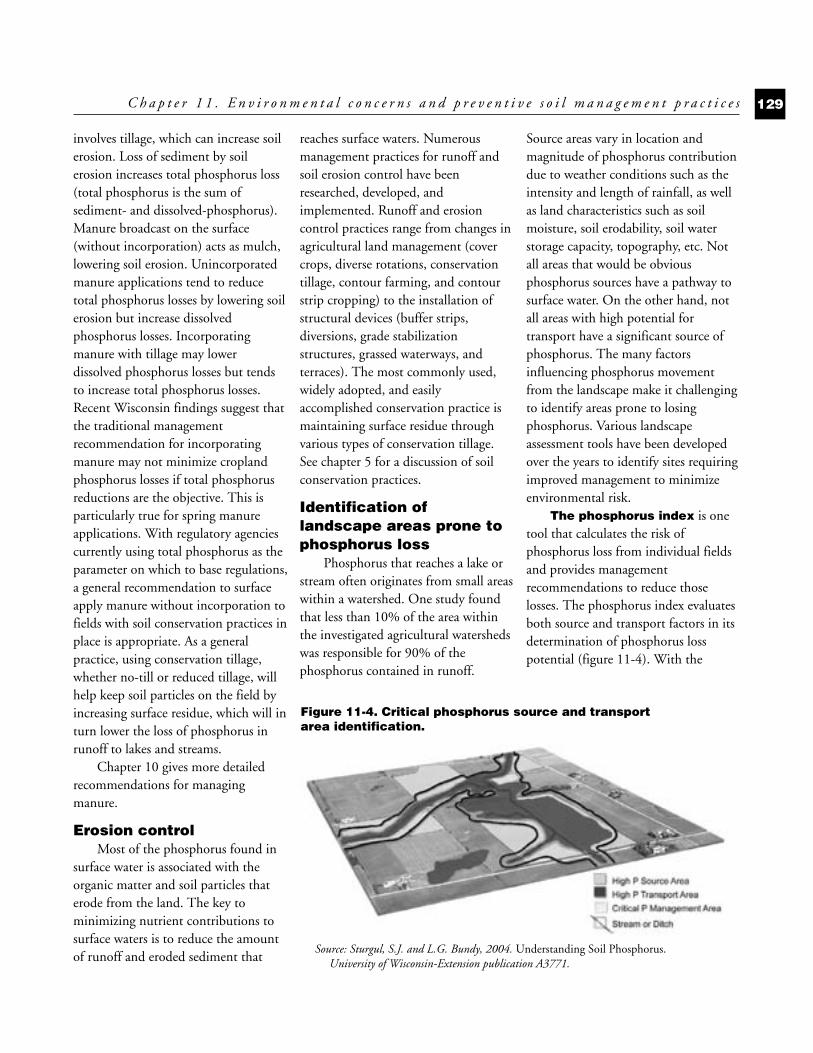
involves tillage, which can increase soilerosion. Loss of sediment by soilerosion increases total phosphorus loss(total phosphorus is the sum ofsediment- and dissolved-phosphorus).Manure broadcast on the surface(without incorporation) acts as mulch,lowering soil erosion. Unincorporatedmanure applications tend to reducetotal phosphorus losses by lowering soilerosion but increase dissolvedphosphorus losses. Incorporatingmanure with tillage may lowerdissolved phosphorus losses but tendsto increase total phosphorus losses.Recent Wisconsin findings suggest thatthe traditional managementrecommendation for incorporatingmanure may not minimize croplandphosphorus losses if total phosphorusreductions are the objective. This isparticularly true for spring manureapplications. With regulatory agenciescurrently using total phosphorus as theparameter on which to base regulations,a general recommendation to surfaceapply manure without incorporation tofields with soil conservation practices inplace is appropriate. As a generalpractice, using conservation tillage,whether no-till or reduced tillage, willhelp keep soil particles on the field byincreasing surface residue, which will inturn lower the loss of phosphorus inrunoff to lakes and streams.
Chapter 10 gives more detailedrecommendations for managingmanure.
Erosion control Most of the phosphorus found in
surface water is associated with theorganic matter and soil particles thaterode from the land. The key tominimizing nutrient contributions tosurface waters is to reduce the amountof runoff and eroded sediment that
reaches surface waters. Numerousmanagement practices for runoff andsoil erosion control have beenresearched, developed, andimplemented. Runoff and erosioncontrol practices range from changes inagricultural land management (covercrops, diverse rotations, conservationtillage, contour farming, and contourstrip cropping) to the installation ofstructural devices (buffer strips,diversions, grade stabilizationstructures, grassed waterways, andterraces). The most commonly used,widely adopted, and easilyaccomplished conservation practice ismaintaining surface residue throughvarious types of conservation tillage.See chapter 5 for a discussion of soilconservation practices.
Identification oflandscape areas prone tophosphorus loss
Phosphorus that reaches a lake orstream often originates from small areaswithin a watershed. One study foundthat less than 10% of the area withinthe investigated agricultural watershedswas responsible for 90% of thephosphorus contained in runoff.
Source areas vary in location andmagnitude of phosphorus contributiondue to weather conditions such as theintensity and length of rainfall, as wellas land characteristics such as soilmoisture, soil erodability, soil waterstorage capacity, topography, etc. Notall areas that would be obviousphosphorus sources have a pathway tosurface water. On the other hand, notall areas with high potential fortransport have a significant source ofphosphorus. The many factorsinfluencing phosphorus movementfrom the landscape make it challengingto identify areas prone to losingphosphorus. Various landscapeassessment tools have been developedover the years to identify sites requiringimproved management to minimizeenvironmental risk.
The phosphorus index is onetool that calculates the risk ofphosphorus loss from individual fieldsand provides managementrecommendations to reduce thoselosses. The phosphorus index evaluatesboth source and transport factors in itsdetermination of phosphorus losspotential (figure 11-4). With the
C h a p t e r 1 1 . E n v i r o n m e n t a l c o n c e r n s a n d p r e v e n t i v e s o i l m a n a g e m e n t p r a c t i c e s 129
Figure 11-4. Critical phosphorus source and transportarea identification.
Source: Sturgul, S.J. and L.G. Bundy, 2004. Understanding Soil Phosphorus.University of Wisconsin-Extension publication A3771.
C-11 10/18/05 11:16 AM Page 129
identification of critical areas whereboth source and transport factorscoincide, appropriate managementpractices can be applied to reducephosphorus losses. A phosphorus indexhas been developed for Wisconsin andcan be found at wpindex.soils.wisc.edu.
Best managementpractices for phosphorus
A summary of the bestmanagement practices to minimizephosphorus losses are as follows:
■ Use soil-erosion control practices tominimize soil loss and runoff.
■ Apply phosphorus at recommendedrates for the crop to be grown.
■ Base phosphorus application rates onrealistic yield goals.
■ Credit phosphorus contributionsfrom manure and other organicbyproducts.
■ Incorporate broadcast applications ofphosphorus fertilizer.
■ Incorporate or inject manure in amanner that does not increase soilerosion.
■ Avoid applying manure to slopingfrozen or saturated soils.
■ Store manure in properly locatedand constructed facilities duringperiods when land application is notadvisable.
■ Target fields with low soil testphosphorus levels for manureapplications.
■ Control runoff from barnyards andfeedlots.
■ Do not surface-apply manure onsloping, no-till cropland.
■ Install buffer strips adjacent tosurface waters receiving runoff fromcropped fields.
■ Use the phosphorus index to identifyfields prone to excessive phosphorusloss.
More extensive information on themanagement of phosphorus can befound in University of Wisconsin-Extension publication UnderstandingSoil Phosphorus: An Overview ofPhosphorus, Water Quality, andAgricultural Management Practices(A3771).
Nutrientmanagementplanning
Formal plans detailing a farm’snutrient application strategy have beendeveloped for many farms inWisconsin. A nutrient managementplan is required for participation invarious federal and state farm programsinvolving cost-sharing. A farm nutrientmanagement plan can also be arequirement of county ordinancesdealing with the construction ofmanure storage facilities or livestockexpansion.
Ideally, a farm nutrientmanagement plan is a strategy forobtaining the maximum return fromon- and off-farm fertilizer resources in amanner that protects the quality ofnearby water resources. Each of thebasic components to all farm nutrientmanagement plans are described below.
Soil testing Complete and accurate soil tests
are the starting point of any farmnutrient management plan. Allcropland fields must be tested or havebeen tested recently, generally withinthe last 4 years. From the soil testresults, base fertilizer recommendationsfor each field are given.
Assessment of on-farmnutrient resources
The amount of crop nutrientssupplied to fields from on-farmnutrient resources such as manure,legumes, and organic wastes needs tobe determined and deducted from thesoil test report’s base fertilizerrecommendations. Manure applicationsto fields supply crops with nitrogen,phosphorus, and potassium—as well assulfur and organic matter. Legumecrops such as alfalfa, clover, andsoybean supply nitrogen to the cropsthat follow them.
Nutrient creditingOnce the on-farm nutrient
resources are determined, commercialfertilizer applications need to beadjusted to reflect these nutrientcredits. This action not only reducescommercial fertilizer bills, but it alsoprotects water quality by eliminatingnutrient applications in excess of cropneed. Excessive nutrient additions tocropland can result in contamination ofgroundwater as well as lakes andstreams.
Management skills come into playwhen determining nutrient credits. Forexample, to properly credit thenutrients supplied from manure, agrower must know both the manureapplication rate and the crop-availablenutrient content of the manure. Tocredit the nitrogen available to cropsfollowing alfalfa, the condition of thealfalfa stand as well as last cutting dateand soil texture need to be known.
M A N A G E M E N T O F W I S C O N S I N S O I L S130
C-11 10/18/05 11:16 AM Page 130
Consistency with thefarm’s conservation plan
A nutrient management plan needsto be consistent with a farm’s soilconservation plan. The conservationplan is an important component of anynutrient management plan for itcontains needed information onplanned crop rotations, field slopes(which is important when planningmanure applications), and conservationmeasures needed to maintain soilerosion rates at “T” or tolerable rates.In the event that a soil conservationplan does not exist, or the existing plandoes not meet “T”, the informationcontained in a conservation plan willhave to be obtained before the nutrientmanagement plan can be developed.
Manure inventoryProbably the most challenging
aspect of developing and implementinga farm nutrient management plan is theadvance planning of manureapplications to cropland fields.
This involves estimating theamount of manure produced on thefarm and then planning specificmanure application rates for individualcropland fields. Sounds challenging—and it is, but there are some tricks tothe trade. One of them is calibratingyour manure spreader. This can bedone using scales—either platformscales or portable axle scales availablefrom the county Extension or LandConservation office. Once calibrated,the number of tons (or gallons) ofmanure the spreader typically holds isknown. With this information, specificmanure application rates for fields canbe planned.
Manure spreading planThe majority of any nutrient
management plan for livestock farmswill deal with the manure spreadingplan. The amount of manure a farmproduces has to be applied to fields in amanner that makes sense bothenvironmentally and agronomically.Planned manure applications should bemade at rates that do not exceed cropnutrient need as identified in the soiltest report. The nutrient managementplan should also prioritize those fieldsthat would benefit the most from themanure-supplied nutrients whileposing minimal threats to water quality.Also, the nutrient management planwill identify those fields with manurespreading restrictions. Examples ofsuch restrictions would be fieldsadjacent to lakes and streams, slopingfields where the threat of spring runoffprohibits manure applications in thewinter, and fields in the vicinity ofwells, sinkholes, or fractured bedrock.
The seasonal timing of manureapplications to cropland will also beidentified in a nutrient managementplan. The timing of planned manureapplications will depend upon eachfarm’s manure handling system.Manure application periods for afarmer with manure storage will besignificantly different from that of afarmer who has to haul manure on adaily basis.
The 590 nutrientmanagement standard
The 590 standard is a UnitedStates Department of Agriculture—Natural Resources ConservationService document that defines theminimum requirements andcomponents of an acceptable nutrientmanagement plan. The 590 nutrient
management standard periodicallychanges with revisions, but basicallyrequires producers to follow Universityof Wisconsin recommendations fornutrient inputs to cropland. Thestandard also contains additionalrestrictions on the timing and locationof nutrient applications to agriculturalfields. A current version of the nutrientmanagement standard can be found atwww.datcp.state.wi.us/arm/agriculture/land-water/conservation/nutrient-mngmt/planning.jsp.
Non-essentialelements
Plants take up some elements fromthe soil solution simply because theyare present even though they are notneeded by the plant. Some of these areessential to animals, such as cobalt,iodine, and selenium. At highconcentrations these non-essentialelements may pose a potential healththreat if they get into the food chain.Selenium, for example, is found at toxicconcentrations for grazing animals insome plant species that accumulate thiselement in the Great Plains, but it issometimes deficient in forage grown inWisconsin soils. Low selenium in thediet of animals causes “white muscle”disease.
All elements occur naturally insoils and in the earth’s crust. Theybecome of concern only when the levelis high enough to threaten human andanimal health. Table 11-6 identifies thepotential toxicity level of severalelements and table 11-7 lists theirsources.
One source of heavy metals ismunicipal biosolids (sewage sludge).Table 10-4 lists the concentrations of
C h a p t e r 1 1 . E n v i r o n m e n t a l c o n c e r n s a n d p r e v e n t i v e s o i l m a n a g e m e n t p r a c t i c e s 131
C-11 10/18/05 11:16 AM Page 131
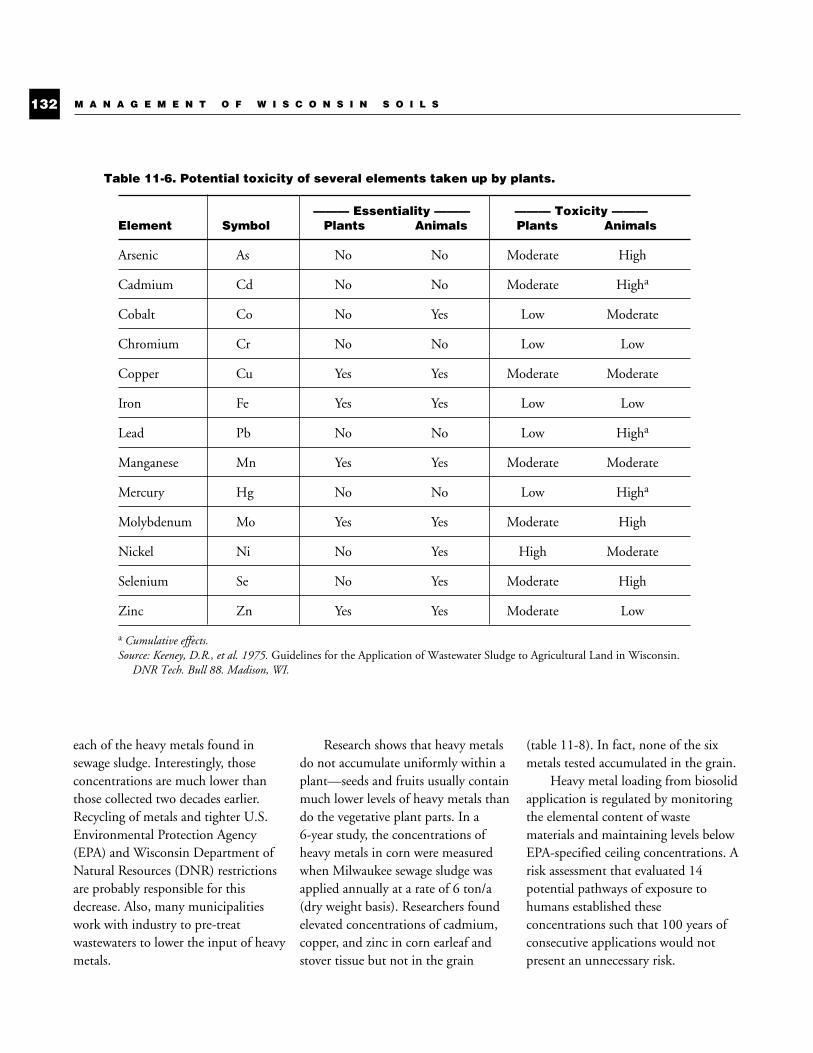
each of the heavy metals found insewage sludge. Interestingly, thoseconcentrations are much lower thanthose collected two decades earlier.Recycling of metals and tighter U.S.Environmental Protection Agency(EPA) and Wisconsin Department ofNatural Resources (DNR) restrictionsare probably responsible for thisdecrease. Also, many municipalitieswork with industry to pre-treatwastewaters to lower the input of heavymetals.
Research shows that heavy metalsdo not accumulate uniformly within aplant—seeds and fruits usually containmuch lower levels of heavy metals thando the vegetative plant parts. In a6-year study, the concentrations ofheavy metals in corn were measuredwhen Milwaukee sewage sludge wasapplied annually at a rate of 6 ton/a(dry weight basis). Researchers foundelevated concentrations of cadmium,copper, and zinc in corn earleaf andstover tissue but not in the grain
(table 11-8). In fact, none of the sixmetals tested accumulated in the grain.
Heavy metal loading from biosolidapplication is regulated by monitoringthe elemental content of wastematerials and maintaining levels belowEPA-specified ceiling concentrations. Arisk assessment that evaluated 14potential pathways of exposure tohumans established theseconcentrations such that 100 years ofconsecutive applications would notpresent an unnecessary risk.
M A N A G E M E N T O F W I S C O N S I N S O I L S132
Table 11-6. Potential toxicity of several elements taken up by plants.
——— Essentiality ——— ——— Toxicity ———Element Symbol Plants Animals Plants Animals
Arsenic As No No Moderate High
Cadmium Cd No No Moderate Higha
Cobalt Co No Yes Low Moderate
Chromium Cr No No Low Low
Copper Cu Yes Yes Moderate Moderate
Iron Fe Yes Yes Low Low
Lead Pb No No Low Higha
Manganese Mn Yes Yes Moderate Moderate
Mercury Hg No No Low Higha
Molybdenum Mo Yes Yes Moderate High
Nickel Ni No Yes High Moderate
Selenium Se No Yes Moderate High
Zinc Zn Yes Yes Moderate Low
a Cumulative effects.Source: Keeney, D.R., et al. 1975. Guidelines for the Application of Wastewater Sludge to Agricultural Land in Wisconsin.
DNR Tech. Bull 88. Madison, WI.
C-11 10/18/05 11:16 AM Page 132
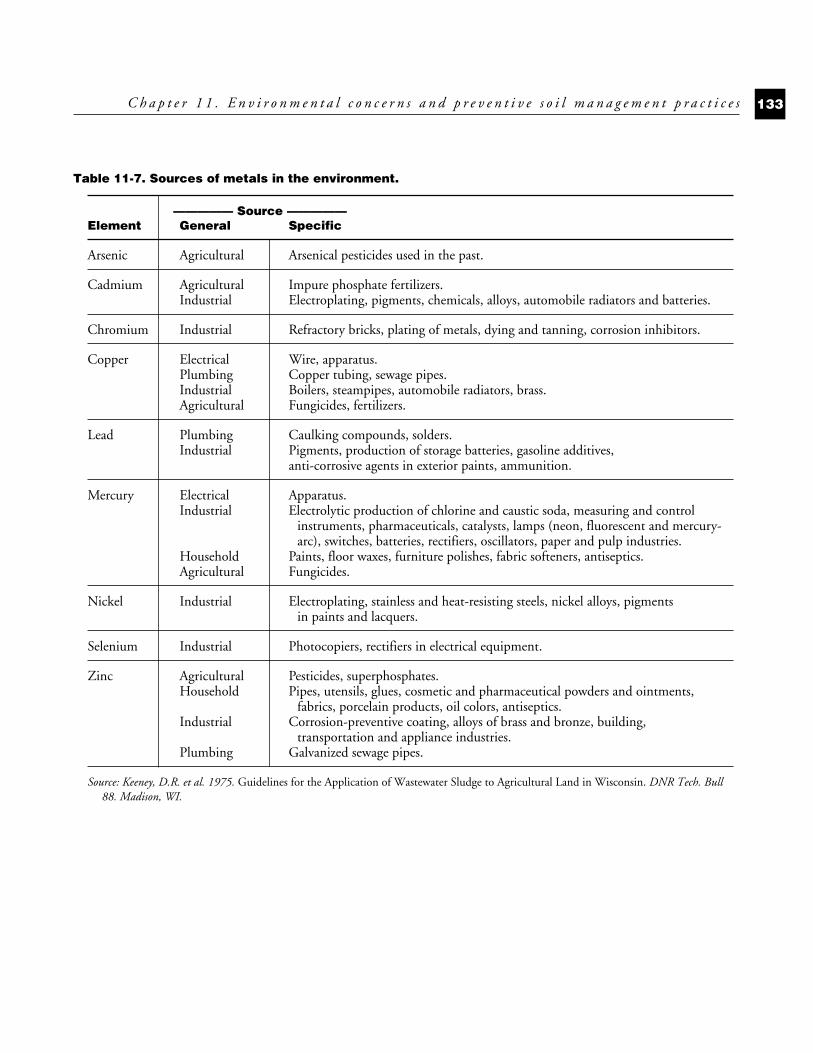
C h a p t e r 1 1 . E n v i r o n m e n t a l c o n c e r n s a n d p r e v e n t i v e s o i l m a n a g e m e n t p r a c t i c e s 133
Table 11-7. Sources of metals in the environment.
————— Source —————Element General Specific
Arsenic Agricultural Arsenical pesticides used in the past.
Cadmium Agricultural Impure phosphate fertilizers.Industrial Electroplating, pigments, chemicals, alloys, automobile radiators and batteries.
Chromium Industrial Refractory bricks, plating of metals, dying and tanning, corrosion inhibitors.
Copper Electrical Wire, apparatus.Plumbing Copper tubing, sewage pipes.Industrial Boilers, steampipes, automobile radiators, brass.Agricultural Fungicides, fertilizers.
Lead Plumbing Caulking compounds, solders.Industrial Pigments, production of storage batteries, gasoline additives,
anti-corrosive agents in exterior paints, ammunition.
Mercury Electrical Apparatus.Industrial Electrolytic production of chlorine and caustic soda, measuring and control
instruments, pharmaceuticals, catalysts, lamps (neon, fluorescent and mercury-arc), switches, batteries, rectifiers, oscillators, paper and pulp industries.
Household Paints, floor waxes, furniture polishes, fabric softeners, antiseptics.Agricultural Fungicides.
Nickel Industrial Electroplating, stainless and heat-resisting steels, nickel alloys, pigments in paints and lacquers.
Selenium Industrial Photocopiers, rectifiers in electrical equipment.
Zinc Agricultural Pesticides, superphosphates.Household Pipes, utensils, glues, cosmetic and pharmaceutical powders and ointments,
fabrics, porcelain products, oil colors, antiseptics.Industrial Corrosion-preventive coating, alloys of brass and bronze, building,
transportation and appliance industries.Plumbing Galvanized sewage pipes.
Source: Keeney, D.R. et al. 1975. Guidelines for the Application of Wastewater Sludge to Agricultural Land in Wisconsin. DNR Tech. Bull88. Madison, WI.
C-11 10/18/05 11:16 AM Page 133
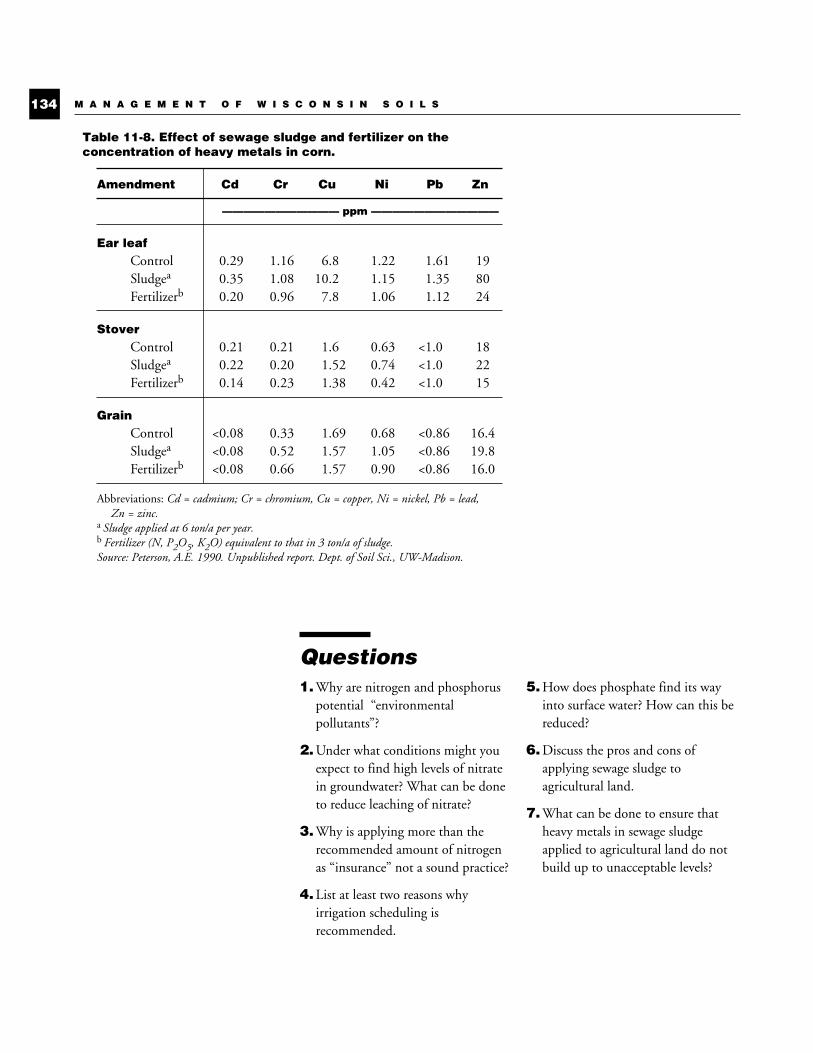
Questions1.Why are nitrogen and phosphorus
potential “environmentalpollutants”?
2.Under what conditions might youexpect to find high levels of nitratein groundwater? What can be doneto reduce leaching of nitrate?
3.Why is applying more than therecommended amount of nitrogenas “insurance” not a sound practice?
4.List at least two reasons whyirrigation scheduling isrecommended.
5.How does phosphate find its wayinto surface water? How can this bereduced?
6.Discuss the pros and cons ofapplying sewage sludge toagricultural land.
7.What can be done to ensure thatheavy metals in sewage sludgeapplied to agricultural land do notbuild up to unacceptable levels?
M A N A G E M E N T O F W I S C O N S I N S O I L S134
Table 11-8. Effect of sewage sludge and fertilizer on theconcentration of heavy metals in corn.
Amendment Cd Cr Cu Ni Pb Zn
——————————— ppm ————————————
Ear leafControl 0.29 1.16 6.8 1.22 1.61 19Sludgea 0.35 1.08 10.2 1.15 1.35 80Fertilizerb 0.20 0.96 7.8 1.06 1.12 24
StoverControl 0.21 0.21 1.6 0.63 <1.0 18Sludgea 0.22 0.20 1.52 0.74 <1.0 22Fertilizerb 0.14 0.23 1.38 0.42 <1.0 15
GrainControl <0.08 0.33 1.69 0.68 <0.86 16.4Sludgea <0.08 0.52 1.57 1.05 <0.86 19.8Fertilizerb <0.08 0.66 1.57 0.90 <0.86 16.0
Abbreviations: Cd = cadmium; Cr = chromium, Cu = copper, Ni = nickel, Pb = lead,Zn = zinc.
a Sludge applied at 6 ton/a per year.b Fertilizer (N, P2O5, K2O) equivalent to that in 3 ton/a of sludge.Source: Peterson, A.E. 1990. Unpublished report. Dept. of Soil Sci., UW-Madison.
C-11 10/18/05 11:16 AM Page 134
“This we know: The earthdoes not belong to man; manbelongs to the earth. Mandid not weave the web of life;he is merely a strand in it.To harm the earth is to heapcontempt upon its creator.”
Chief Seattle, 1852 (Reply to United States Government wanting topurchase Indian tribal lands in the Northwest)
There are a number of ways ofevaluating the nutrient status of soilsand the crops grown on them. Themost commonly used methods includethe following:
■ fertilizer trials in the field,
■ greenhouse experiments,
■ observation of crop symptoms,
■ plant analysis,
■ tissue testing in the field, and
■ soil testing.Each method has limitations.
Fertilizer trials are expensive and time-consuming so they cannot be run onvery many fields, and the results fromone field cannot be transferred easily toanother. Greenhouse experimentsrequire specialized facilities and arecostly, and the yield response is oftenquite different from that which occursin the field. Visual symptoms indicateonly severe deficiencies, and they oftenappear so late that any remedial actionmay be only partially successful. Plantanalysis and tissue tests are conductedduring the growing season to helpidentify problems, but they generallycannot be used to predict the amountof fertilizer or lime needed. Of themethods mentioned above, soil testingis the only rapid and inexpensivemethod which can be used to reliablyestimate lime and fertilizer needs inadvance of when the crop is grown. Soiltests are the only truly predictive testsavailable.
Soil testingWisconsin laboratories analyze
about 250,000 soil samples each year.The results of these tests guideWisconsin farmers in an annualexpenditure of about 165 milliondollars for lime and fertilizer. It isestimated that Wisconsin farmers haveincreased their collective crop incomeby over 400 million dollars as a resultof using lime and fertilizer.
Even though these statistics pointout the importance of soil testing, someconfusion exists as to the meaning andusefulness of soil test results. Somepeople view the soil test as only a“gimmick” to sell more lime andfertilizer. Others regard it as aninfallible and almost magical method ofpredicting exactly how much of eachplant nutrient needs to be supplied tothe crop. In fact, the soil test is neithera gimmick nor an exact science but anestimate. The accuracy of the estimatedepends on how well the soil samplerepresents the field, the quality of thelab analysis, and the accuracy of thecalibrations used to interpret the data.
A sound soil testing programrequires a tremendous amount of field,greenhouse, and laboratory research.Scientists must identify the variousforms of the available nutrients in thesoil, find chemical extractants that willremove an amount of the nutrientproportional to that extracted by crops,and determine the response to different
135
Soil testing, soil testrecommendations,and plant analysis
C H A P T E R
12
C-12 10/18/05 11:17 AM Page 135
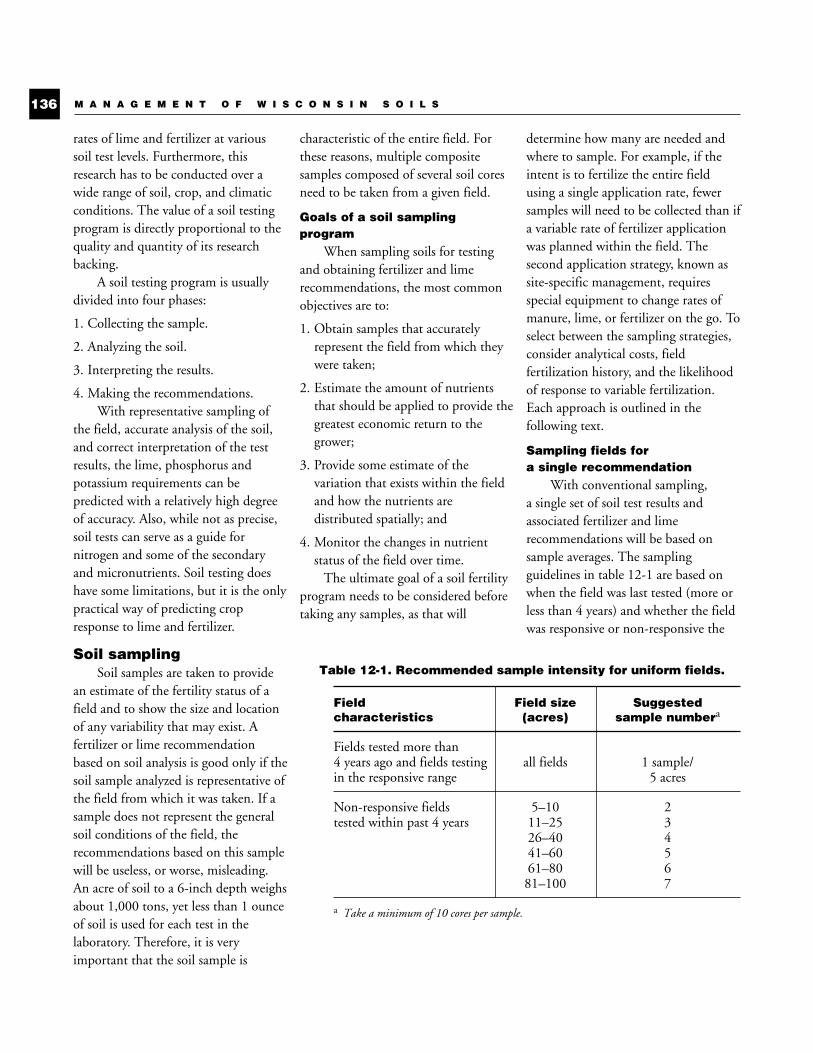
rates of lime and fertilizer at varioussoil test levels. Furthermore, thisresearch has to be conducted over awide range of soil, crop, and climaticconditions. The value of a soil testingprogram is directly proportional to thequality and quantity of its researchbacking.
A soil testing program is usuallydivided into four phases:
1. Collecting the sample.
2. Analyzing the soil.
3. Interpreting the results.
4. Making the recommendations.With representative sampling of
the field, accurate analysis of the soil,and correct interpretation of the testresults, the lime, phosphorus andpotassium requirements can bepredicted with a relatively high degreeof accuracy. Also, while not as precise,soil tests can serve as a guide fornitrogen and some of the secondaryand micronutrients. Soil testing doeshave some limitations, but it is the onlypractical way of predicting cropresponse to lime and fertilizer.
Soil samplingSoil samples are taken to provide
an estimate of the fertility status of afield and to show the size and locationof any variability that may exist. Afertilizer or lime recommendationbased on soil analysis is good only if thesoil sample analyzed is representative ofthe field from which it was taken. If asample does not represent the generalsoil conditions of the field, therecommendations based on this samplewill be useless, or worse, misleading.An acre of soil to a 6-inch depth weighsabout 1,000 tons, yet less than 1 ounceof soil is used for each test in thelaboratory. Therefore, it is veryimportant that the soil sample is
characteristic of the entire field. Forthese reasons, multiple compositesamples composed of several soil coresneed to be taken from a given field.
Goals of a soil samplingprogram
When sampling soils for testingand obtaining fertilizer and limerecommendations, the most commonobjectives are to:
1. Obtain samples that accuratelyrepresent the field from which theywere taken;
2. Estimate the amount of nutrientsthat should be applied to provide thegreatest economic return to thegrower;
3. Provide some estimate of thevariation that exists within the fieldand how the nutrients aredistributed spatially; and
4. Monitor the changes in nutrientstatus of the field over time.
The ultimate goal of a soil fertilityprogram needs to be considered beforetaking any samples, as that will
determine how many are needed andwhere to sample. For example, if theintent is to fertilize the entire fieldusing a single application rate, fewersamples will need to be collected than ifa variable rate of fertilizer applicationwas planned within the field. Thesecond application strategy, known assite-specific management, requiresspecial equipment to change rates ofmanure, lime, or fertilizer on the go. Toselect between the sampling strategies,consider analytical costs, fieldfertilization history, and the likelihoodof response to variable fertilization.Each approach is outlined in thefollowing text.
Sampling fields for a single recommendation
With conventional sampling,a single set of soil test results andassociated fertilizer and limerecommendations will be based onsample averages. The samplingguidelines in table 12-1 are based onwhen the field was last tested (more orless than 4 years) and whether the fieldwas responsive or non-responsive the
M A N A G E M E N T O F W I S C O N S I N S O I L S136
Table 12-1. Recommended sample intensity for uniform fields.
Field Field size Suggestedcharacteristics (acres) sample numbera
Fields tested more than4 years ago and fields testing all fields 1 sample/in the responsive range 5 acres
Non-responsive fields 5–10 2tested within past 4 years 11–25 3
26–40 441–60 561–80 681–100 7
a Take a minimum of 10 cores per sample.
C-12 10/18/05 11:17 AM Page 136
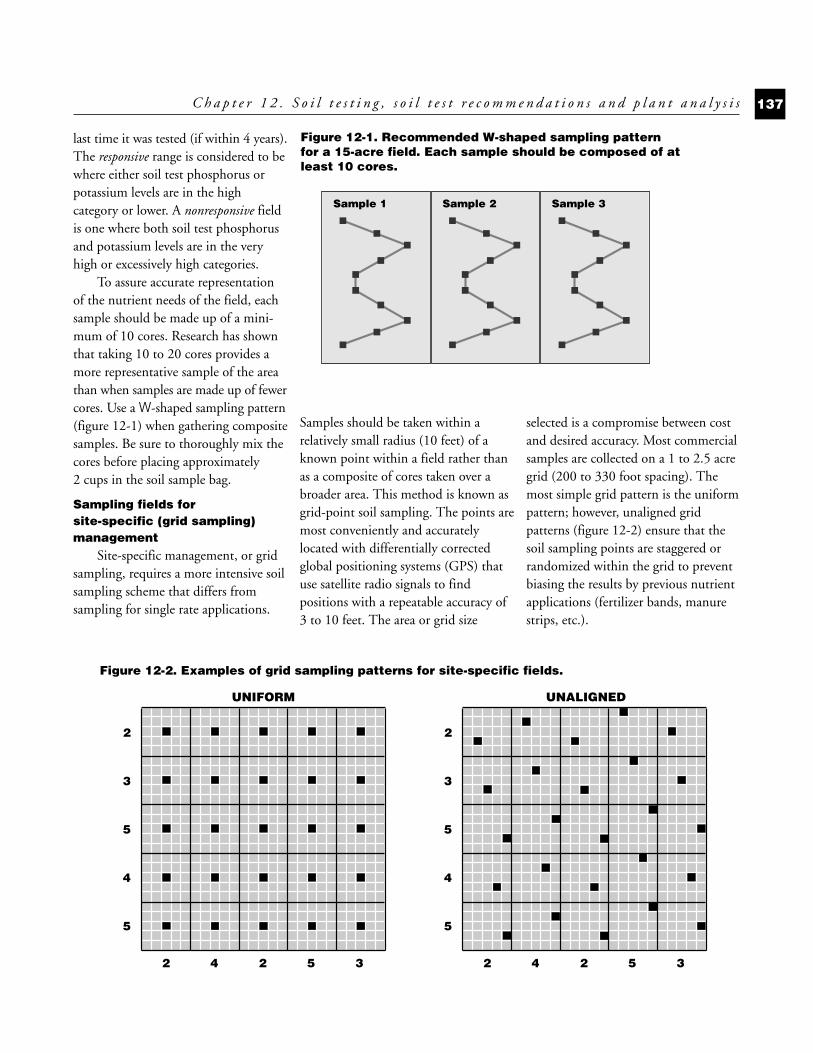
last time it was tested (if within 4 years).The responsive range is considered to bewhere either soil test phosphorus orpotassium levels are in the highcategory or lower. A nonresponsive fieldis one where both soil test phosphorusand potassium levels are in the veryhigh or excessively high categories.
To assure accurate representationof the nutrient needs of the field, eachsample should be made up of a mini-mum of 10 cores. Research has shownthat taking 10 to 20 cores provides amore representative sample of the areathan when samples are made up of fewercores. Use a W-shaped sampling pattern(figure 12-1) when gathering compositesamples. Be sure to thoroughly mix thecores before placing approximately2 cups in the soil sample bag.
Sampling fields for site-specific (grid sampling)management
Site-specific management, or gridsampling, requires a more intensive soilsampling scheme that differs fromsampling for single rate applications.
Samples should be taken within arelatively small radius (10 feet) of aknown point within a field rather thanas a composite of cores taken over abroader area. This method is known asgrid-point soil sampling. The points aremost conveniently and accuratelylocated with differentially correctedglobal positioning systems (GPS) thatuse satellite radio signals to findpositions with a repeatable accuracy of3 to 10 feet. The area or grid size
selected is a compromise between costand desired accuracy. Most commercialsamples are collected on a 1 to 2.5 acregrid (200 to 330 foot spacing). Themost simple grid pattern is the uniformpattern; however, unaligned gridpatterns (figure 12-2) ensure that thesoil sampling points are staggered orrandomized within the grid to preventbiasing the results by previous nutrientapplications (fertilizer bands, manurestrips, etc.).
C h a p t e r 1 2 . S o i l t e s t i n g , s o i l t e s t r e c o m m e n d a t i o n s a n d p l a n t a n a l y s i s 137
Sample 1 Sample 2 Sample 3
Figure 12-1. Recommended W-shaped sampling patternfor a 15-acre field. Each sample should be composed of atleast 10 cores.
2
2
3
5
4
5
4 2 5 32
2
3
5
4
5
4 2 5 3
Figure 12-2. Examples of grid sampling patterns for site-specific fields.
UNIFORM UNALIGNED
C-12 10/18/05 11:17 AM Page 137
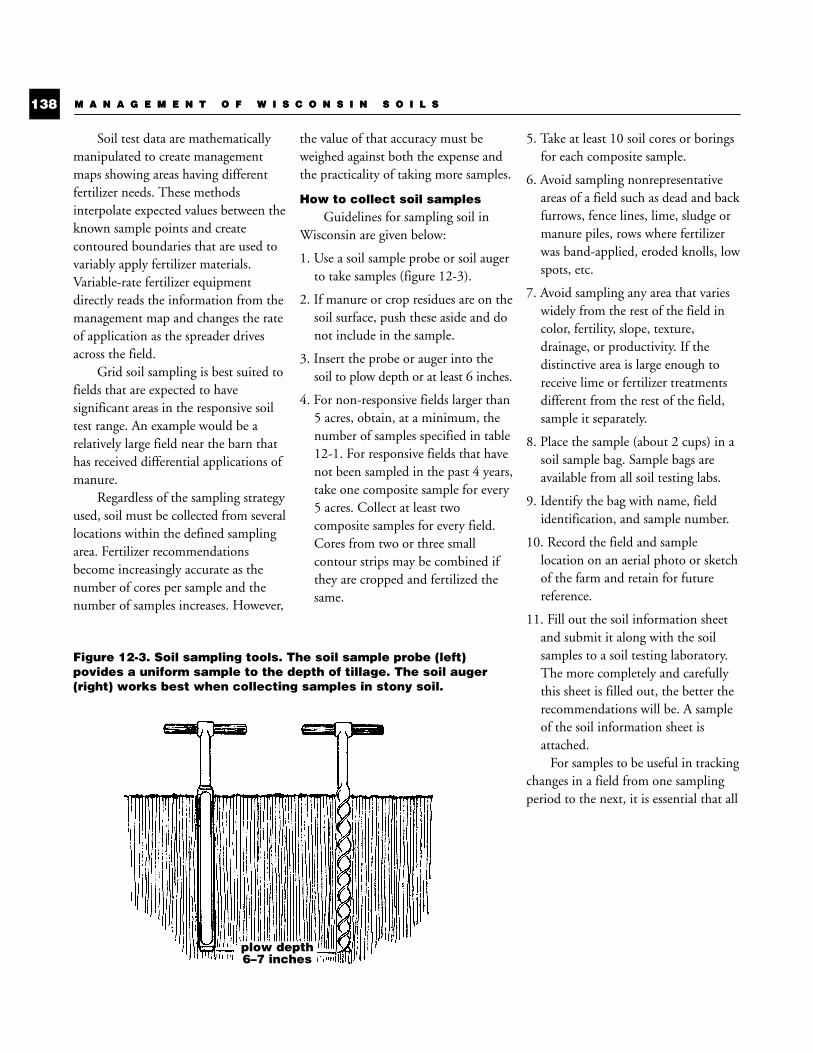
Soil test data are mathematicallymanipulated to create managementmaps showing areas having differentfertilizer needs. These methodsinterpolate expected values between theknown sample points and createcontoured boundaries that are used tovariably apply fertilizer materials.Variable-rate fertilizer equipmentdirectly reads the information from themanagement map and changes the rateof application as the spreader drivesacross the field.
Grid soil sampling is best suited tofields that are expected to havesignificant areas in the responsive soiltest range. An example would be arelatively large field near the barn thathas received differential applications ofmanure.
Regardless of the sampling strategyused, soil must be collected from severallocations within the defined samplingarea. Fertilizer recommendationsbecome increasingly accurate as thenumber of cores per sample and thenumber of samples increases. However,
the value of that accuracy must beweighed against both the expense andthe practicality of taking more samples.
How to collect soil samplesGuidelines for sampling soil in
Wisconsin are given below:
1. Use a soil sample probe or soil augerto take samples (figure 12-3).
2. If manure or crop residues are on thesoil surface, push these aside and donot include in the sample.
3. Insert the probe or auger into thesoil to plow depth or at least 6 inches.
4. For non-responsive fields larger than5 acres, obtain, at a minimum, thenumber of samples specified in table12-1. For responsive fields that havenot been sampled in the past 4 years,take one composite sample for every5 acres. Collect at least twocomposite samples for every field.Cores from two or three smallcontour strips may be combined ifthey are cropped and fertilized thesame.
5. Take at least 10 soil cores or boringsfor each composite sample.
6. Avoid sampling nonrepresentativeareas of a field such as dead and backfurrows, fence lines, lime, sludge ormanure piles, rows where fertilizerwas band-applied, eroded knolls, lowspots, etc.
7. Avoid sampling any area that varieswidely from the rest of the field incolor, fertility, slope, texture,drainage, or productivity. If thedistinctive area is large enough toreceive lime or fertilizer treatmentsdifferent from the rest of the field,sample it separately.
8. Place the sample (about 2 cups) in asoil sample bag. Sample bags areavailable from all soil testing labs.
9. Identify the bag with name, fieldidentification, and sample number.
10. Record the field and samplelocation on an aerial photo or sketchof the farm and retain for futurereference.
11. Fill out the soil information sheetand submit it along with the soilsamples to a soil testing laboratory.The more completely and carefullythis sheet is filled out, the better therecommendations will be. A sampleof the soil information sheet isattached.
For samples to be useful in trackingchanges in a field from one samplingperiod to the next, it is essential that all
M A N A G E M E N T O F W I S C O N S I N S O I L S138 M A N A G E M E N T O F W I S C O N S I N S O I L S
plow depth6–7 inches
Figure 12-3. Soil sampling tools. The soil sample probe (left)povides a uniform sample to the depth of tillage. The soil auger(right) works best when collecting samples in stony soil.
C-12 10/18/05 11:17 AM Page 138
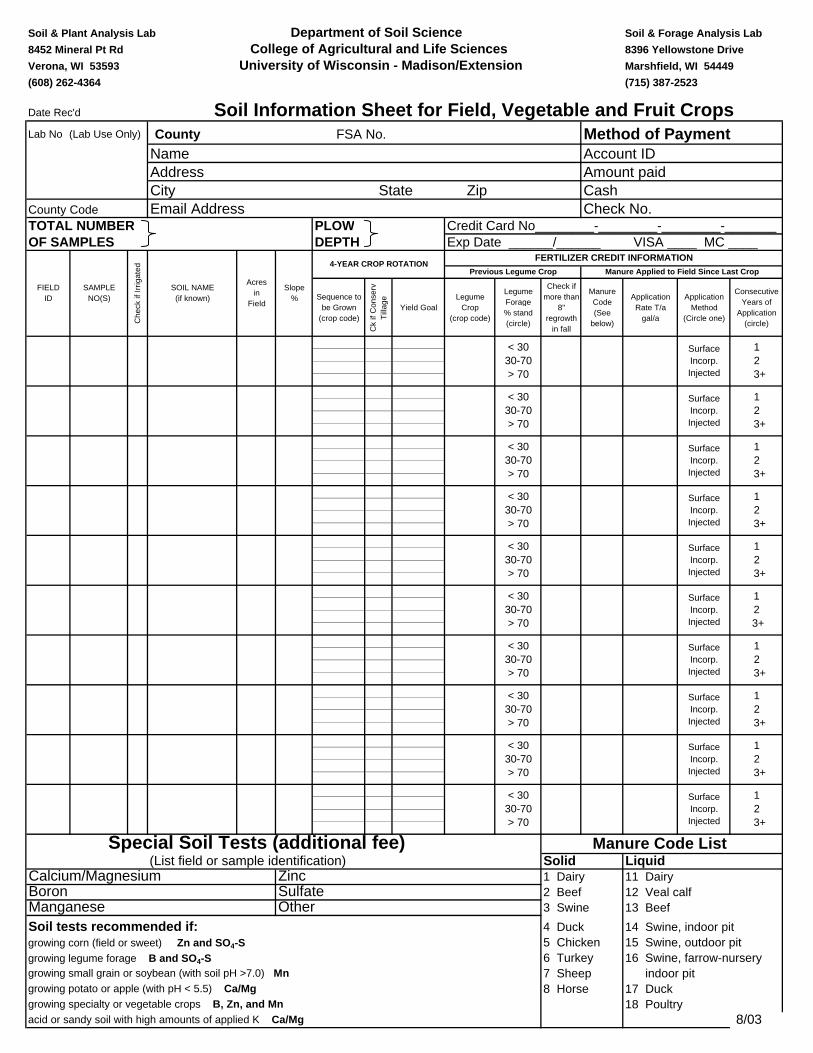
Soil & Plant Analysis Lab Department of Soil Science Soil & Forage Analysis Lab
8452 Mineral Pt Rd College of Agricultural and Life Sciences 8396 Yellowstone Drive
Verona, WI 53593 University of Wisconsin - Madison/Extension Marshfield, WI 54449
(608) 262-4364 (715) 387-2523
Date Rec'd Soil Information Sheet for Field, Vegetable and Fruit Crops Lab No (Lab Use Only) County FSA No. Method of Payment
Name Account IDAddress Amount paidCity State Zip Cash
County Code Email Address Check No.TOTAL NUMBER PLOW Credit Card No________-________-________-_______OF SAMPLES DEPTH Exp Date ______/______ VISA ____ MC ____
Sequence to be Grown
(crop code)
Ck
if C
onse
rv
Till
age
Yield GoalLegume
Crop (crop code)
Legume Forage % stand (circle)
Check if more than
8" regrowth
in fall
Manure Code (See
below)
Application Rate T/a
gal/a
Application Method
(Circle one)
Consecutive Years of
Application (circle)
Special Soil Tests (additional fee) Manure Code List (List field or sample identification) Solid LiquidCalcium/Magnesium Zinc 1 Dairy 11 DairyBoron Sulfate 2 Beef 12 Veal calfManganese Other 3 Swine 13 Beef
Soil tests recommended if: 4 Duck 14 Swine, indoor pitgrowing corn (field or sweet) Zn and SO4-S 5 Chicken 15 Swine, outdoor pitgrowing legume forage B and SO4-S 6 Turkey 16 Swine, farrow-nurserygrowing small grain or soybean (with soil pH >7.0) Mn 7 Sheep indoor pitgrowing potato or apple (with pH < 5.5) Ca/Mg 8 Horse 17 Duckgrowing specialty or vegetable crops B, Zn, and Mn 18 Poultryacid or sandy soil with high amounts of applied K Ca/Mg 8/03
FIELD ID
12
3+
< 3030-70> 70
SurfaceIncorp.Injected
12
3+
< 3030-70> 70
< 3030-70> 70
SurfaceIncorp.Injected
12
3+
< 3030-70> 70
SurfaceIncorp.Injected
12
3+
< 3030-70> 70
SurfaceIncorp.Injected
12
3+
< 3030-70> 70
SurfaceIncorp.Injected
12
3+
< 3030-70> 70
SurfaceIncorp.Injected
12
3+
SurfaceIncorp.Injected
12
3+
< 3030-70> 70
< 3030-70> 70
12
3+
SurfaceIncorp.Injected
SurfaceIncorp.Injected
Slope %
4-YEAR CROP ROTATIONFERTILIZER CREDIT INFORMATION
Previous Legume Crop Manure Applied to Field Since Last CropAcres
in Field
SAMPLE NO(S)
Che
ck if
Irrig
ated
SOIL NAME (if known)
< 3030-70> 70
12
3+
SurfaceIncorp.Injected
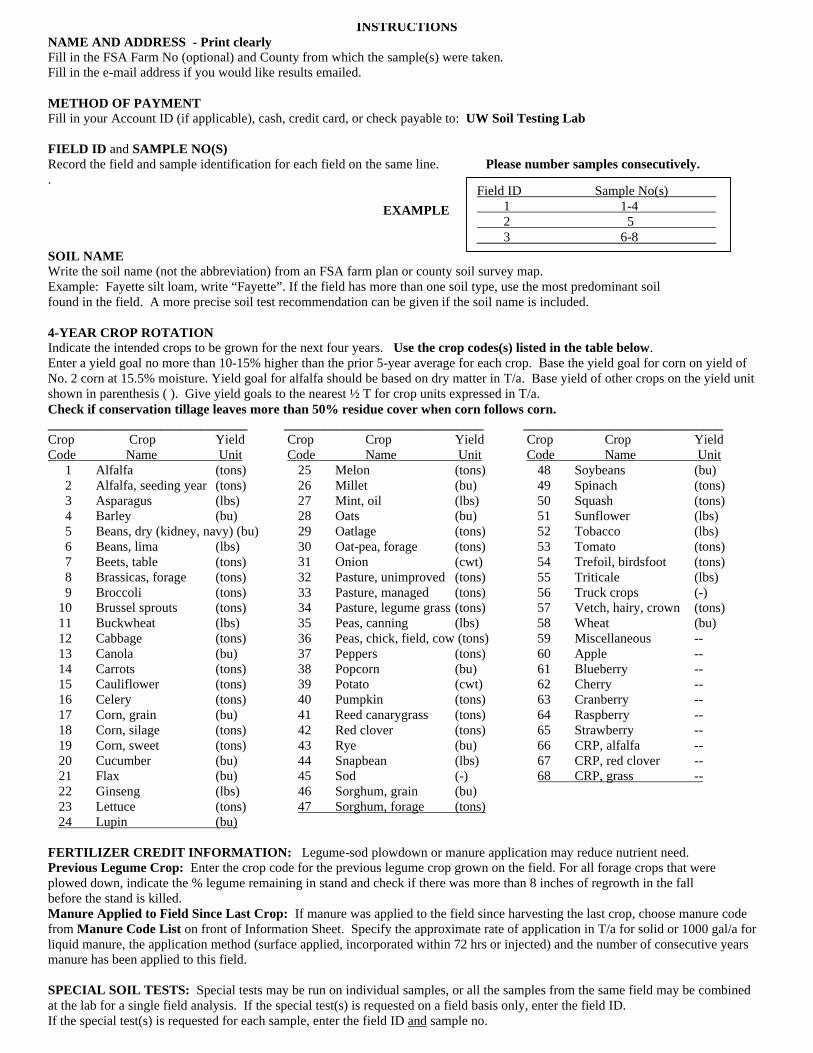
INSTRUCTIONS NAME AND ADDRESS - Print clearly Fill in the FSA Farm No (optional) and County from which the sample(s) were taken. Fill in the e-mail address if you would like results emailed. METHOD OF PAYMENT Fill in your Account ID (if applicable), cash, credit card, or check payable to: UW Soil Testing Lab FIELD ID and SAMPLE NO(S) Record the field and sample identification for each field on the same line. Please number samples consecutively. .
EXAMPLE
SOIL NAME Write the soil name (not the abbreviation) from an FSA farm plan or county soil survey map. Example: Fayette silt loam, write “Fayette”. If the field has more than one soil type, use the most predominant soil found in the field. A more precise soil test recommendation can be given if the soil name is included. 4-YEAR CROP ROTATION Indicate the intended crops to be grown for the next four years. Use the crop codes(s) listed in the table below. Enter a yield goal no more than 10-15% higher than the prior 5-year average for each crop. Base the yield goal for corn on yield of No. 2 corn at 15.5% moisture. Yield goal for alfalfa should be based on dry matter in T/a. Base yield of other crops on the yield unit shown in parenthesis ( ). Give yield goals to the nearest ½ T for crop units expressed in T/a. Check if conservation tillage leaves more than 50% residue cover when corn follows corn. ______________________________ ______________________________ ______________________________ Crop Crop Yield Crop Crop Yield Crop Crop Yield Code Name Unit Code Name Unit Code Name Unit 1 Alfalfa (tons) 25 Melon (tons) 48 Soybeans (bu) 2 Alfalfa, seeding year (tons) 26 Millet (bu) 49 Spinach (tons) 3 Asparagus (lbs) 27 Mint, oil (lbs) 50 Squash (tons) 4 Barley (bu) 28 Oats (bu) 51 Sunflower (lbs) 5 Beans, dry (kidney, navy) (bu) 29 Oatlage (tons) 52 Tobacco (lbs) 6 Beans, lima (lbs) 30 Oat-pea, forage (tons) 53 Tomato (tons) 7 Beets, table (tons) 31 Onion (cwt) 54 Trefoil, birdsfoot (tons) 8 Brassicas, forage (tons) 32 Pasture, unimproved (tons) 55 Triticale (lbs) 9 Broccoli (tons) 33 Pasture, managed (tons) 56 Truck crops (-) 10 Brussel sprouts (tons) 34 Pasture, legume grass (tons) 57 Vetch, hairy, crown (tons) 11 Buckwheat (lbs) 35 Peas, canning (lbs) 58 Wheat (bu) 12 Cabbage (tons) 36 Peas, chick, field, cow (tons) 59 Miscellaneous -- 13 Canola (bu) 37 Peppers (tons) 60 Apple -- 14 Carrots (tons) 38 Popcorn (bu) 61 Blueberry -- 15 Cauliflower (tons) 39 Potato (cwt) 62 Cherry -- 16 Celery (tons) 40 Pumpkin (tons) 63 Cranberry -- 17 Corn, grain (bu) 41 Reed canarygrass (tons) 64 Raspberry -- 18 Corn, silage (tons) 42 Red clover (tons) 65 Strawberry -- 19 Corn, sweet (tons) 43 Rye (bu) 66 CRP, alfalfa -- 20 Cucumber (bu) 44 Snapbean (lbs) 67 CRP, red clover -- 21 Flax (bu) 45 Sod (-) 68 CRP, grass -- 22 Ginseng (lbs) 46 Sorghum, grain (bu) 23 Lettuce (tons) 47 Sorghum, forage (tons) 24 Lupin (bu) FERTILIZER CREDIT INFORMATION: Legume-sod plowdown or manure application may reduce nutrient need. Previous Legume Crop: Enter the crop code for the previous legume crop grown on the field. For all forage crops that were plowed down, indicate the % legume remaining in stand and check if there was more than 8 inches of regrowth in the fall before the stand is killed. Manure Applied to Field Since Last Crop: If manure was applied to the field since harvesting the last crop, choose manure code from Manure Code List on front of Information Sheet. Specify the approximate rate of application in T/a for solid or 1000 gal/a for liquid manure, the application method (surface applied, incorporated within 72 hrs or injected) and the number of consecutive years manure has been applied to this field. SPECIAL SOIL TESTS: Special tests may be run on individual samples, or all the samples from the same field may be combined at the lab for a single field analysis. If the special test(s) is requested on a field basis only, enter the field ID. If the special test(s) is requested for each sample, enter the field ID and sample no.
Field ID Sample No(s) 1 1-4 2 5 3 6-8
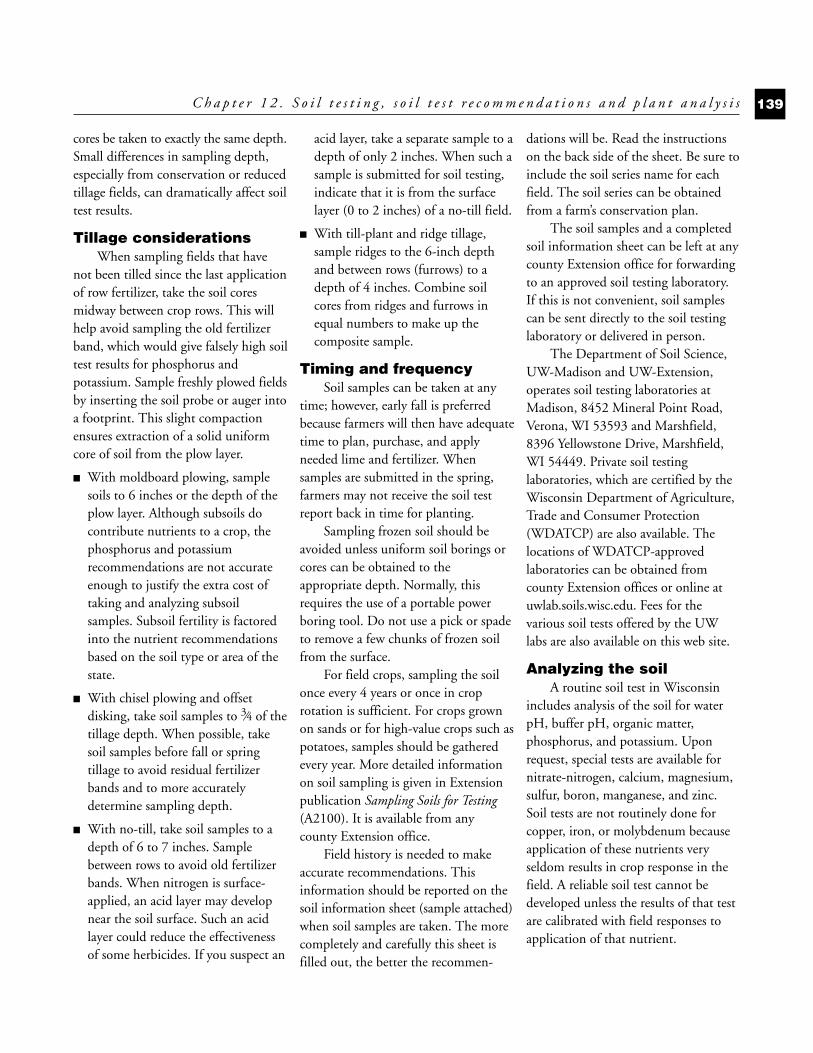
cores be taken to exactly the same depth.Small differences in sampling depth,especially from conservation or reducedtillage fields, can dramatically affect soiltest results.
Tillage considerationsWhen sampling fields that have
not been tilled since the last applicationof row fertilizer, take the soil coresmidway between crop rows. This willhelp avoid sampling the old fertilizerband, which would give falsely high soiltest results for phosphorus andpotassium. Sample freshly plowed fieldsby inserting the soil probe or auger intoa footprint. This slight compactionensures extraction of a solid uniformcore of soil from the plow layer.
■ With moldboard plowing, samplesoils to 6 inches or the depth of theplow layer. Although subsoils docontribute nutrients to a crop, thephosphorus and potassiumrecommendations are not accurateenough to justify the extra cost oftaking and analyzing subsoilsamples. Subsoil fertility is factoredinto the nutrient recommendationsbased on the soil type or area of thestate.
■ With chisel plowing and offsetdisking, take soil samples to 3⁄4 of thetillage depth. When possible, takesoil samples before fall or springtillage to avoid residual fertilizerbands and to more accuratelydetermine sampling depth.
■ With no-till, take soil samples to adepth of 6 to 7 inches. Samplebetween rows to avoid old fertilizerbands. When nitrogen is surface-applied, an acid layer may developnear the soil surface. Such an acidlayer could reduce the effectivenessof some herbicides. If you suspect an
acid layer, take a separate sample to adepth of only 2 inches. When such asample is submitted for soil testing,indicate that it is from the surfacelayer (0 to 2 inches) of a no-till field.
■ With till-plant and ridge tillage,sample ridges to the 6-inch depthand between rows (furrows) to adepth of 4 inches. Combine soilcores from ridges and furrows inequal numbers to make up thecomposite sample.
Timing and frequencySoil samples can be taken at any
time; however, early fall is preferredbecause farmers will then have adequatetime to plan, purchase, and applyneeded lime and fertilizer. Whensamples are submitted in the spring,farmers may not receive the soil testreport back in time for planting.
Sampling frozen soil should beavoided unless uniform soil borings orcores can be obtained to theappropriate depth. Normally, thisrequires the use of a portable powerboring tool. Do not use a pick or spadeto remove a few chunks of frozen soilfrom the surface.
For field crops, sampling the soilonce every 4 years or once in croprotation is sufficient. For crops grownon sands or for high-value crops such aspotatoes, samples should be gatheredevery year. More detailed informationon soil sampling is given in Extensionpublication Sampling Soils for Testing(A2100). It is available from anycounty Extension office.
Field history is needed to makeaccurate recommendations. Thisinformation should be reported on thesoil information sheet (sample attached)when soil samples are taken. The morecompletely and carefully this sheet isfilled out, the better the recommen-
dations will be. Read the instructionson the back side of the sheet. Be sure toinclude the soil series name for eachfield. The soil series can be obtainedfrom a farm’s conservation plan.
The soil samples and a completedsoil information sheet can be left at anycounty Extension office for forwardingto an approved soil testing laboratory.If this is not convenient, soil samplescan be sent directly to the soil testinglaboratory or delivered in person.
The Department of Soil Science,UW-Madison and UW-Extension,operates soil testing laboratories atMadison, 8452 Mineral Point Road,Verona, WI 53593 and Marshfield,8396 Yellowstone Drive, Marshfield,WI 54449. Private soil testinglaboratories, which are certified by theWisconsin Department of Agriculture,Trade and Consumer Protection(WDATCP) are also available. Thelocations of WDATCP-approvedlaboratories can be obtained fromcounty Extension offices or online atuwlab.soils.wisc.edu. Fees for thevarious soil tests offered by the UWlabs are also available on this web site.
Analyzing the soilA routine soil test in Wisconsin
includes analysis of the soil for waterpH, buffer pH, organic matter,phosphorus, and potassium. Uponrequest, special tests are available fornitrate-nitrogen, calcium, magnesium,sulfur, boron, manganese, and zinc.Soil tests are not routinely done forcopper, iron, or molybdenum becauseapplication of these nutrients veryseldom results in crop response in thefield. A reliable soil test cannot bedeveloped unless the results of that testare calibrated with field responses toapplication of that nutrient.
C h a p t e r 1 2 . S o i l t e s t i n g , s o i l t e s t r e c o m m e n d a t i o n s a n d p l a n t a n a l y s i s 139
C-12 10/18/05 11:17 AM Page 139
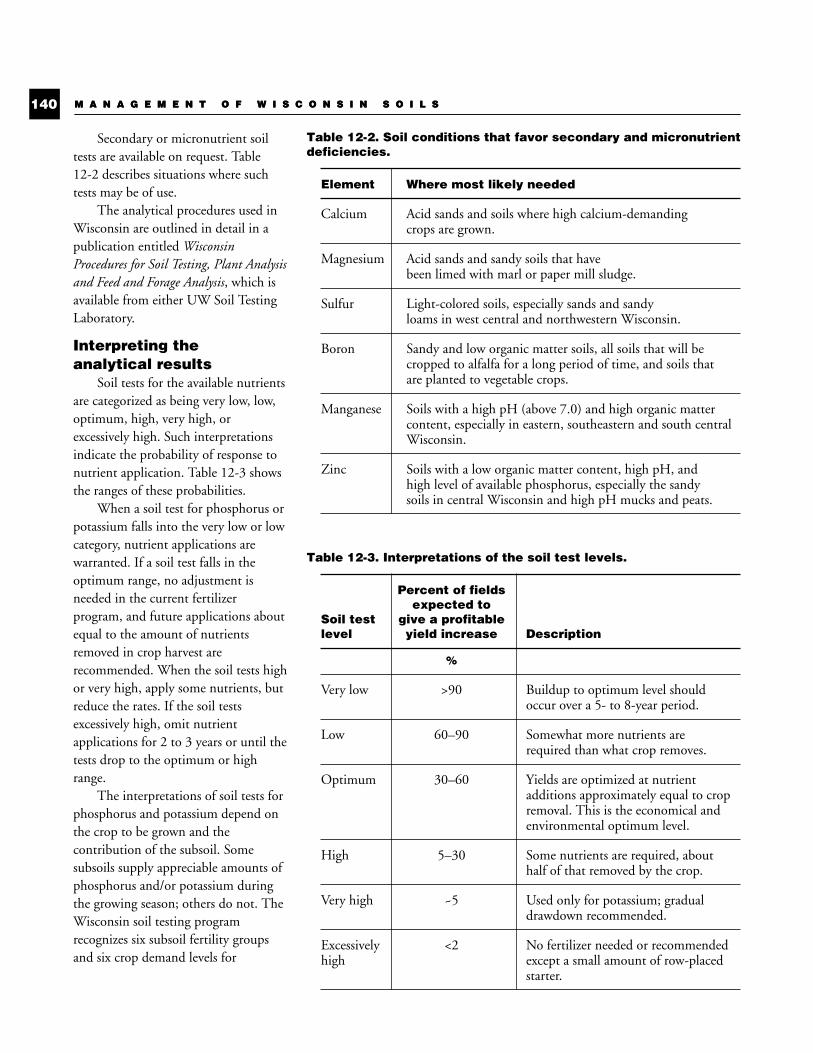
Secondary or micronutrient soiltests are available on request. Table12-2 describes situations where suchtests may be of use.
The analytical procedures used inWisconsin are outlined in detail in apublication entitled WisconsinProcedures for Soil Testing, Plant Analysisand Feed and Forage Analysis, which isavailable from either UW Soil TestingLaboratory.
Interpreting the analytical results
Soil tests for the available nutrientsare categorized as being very low, low,optimum, high, very high, orexcessively high. Such interpretationsindicate the probability of response tonutrient application. Table 12-3 showsthe ranges of these probabilities.
When a soil test for phosphorus orpotassium falls into the very low or lowcategory, nutrient applications arewarranted. If a soil test falls in theoptimum range, no adjustment isneeded in the current fertilizerprogram, and future applications aboutequal to the amount of nutrientsremoved in crop harvest arerecommended. When the soil tests highor very high, apply some nutrients, butreduce the rates. If the soil testsexcessively high, omit nutrientapplications for 2 to 3 years or until thetests drop to the optimum or highrange.
The interpretations of soil tests forphosphorus and potassium depend onthe crop to be grown and thecontribution of the subsoil. Somesubsoils supply appreciable amounts ofphosphorus and/or potassium duringthe growing season; others do not. TheWisconsin soil testing programrecognizes six subsoil fertility groupsand six crop demand levels for
M A N A G E M E N T O F W I S C O N S I N S O I L S140 M A N A G E M E N T O F W I S C O N S I N S O I L S
Table 12-3. Interpretations of the soil test levels.
Percent of fieldsexpected to
Soil test give a profitablelevel yield increase Description
%
Very low >90 Buildup to optimum level should occur over a 5- to 8-year period.
Low 60–90 Somewhat more nutrients are required than what crop removes.
Optimum 30–60 Yields are optimized at nutrient additions approximately equal to crop removal. This is the economical and environmental optimum level.
High 5–30 Some nutrients are required, about half of that removed by the crop.
Very high ~5 Used only for potassium; gradual drawdown recommended.
Excessively <2 No fertilizer needed or recommended high except a small amount of row-placed
starter.
Table 12-2. Soil conditions that favor secondary and micronutrientdeficiencies.
Element Where most likely needed
Calcium Acid sands and soils where high calcium-demandingcrops are grown.
Magnesium Acid sands and sandy soils that have been limed with marl or paper mill sludge.
Sulfur Light-colored soils, especially sands and sandy loams in west central and northwestern Wisconsin.
Boron Sandy and low organic matter soils, all soils that will be cropped to alfalfa for a long period of time, and soils that are planted to vegetable crops.
Manganese Soils with a high pH (above 7.0) and high organic matter content, especially in eastern, southeastern and south central Wisconsin.
Zinc Soils with a low organic matter content, high pH, and high level of available phosphorus, especially the sandysoils in central Wisconsin and high pH mucks and peats.
C-12 10/18/05 11:17 AM Page 140
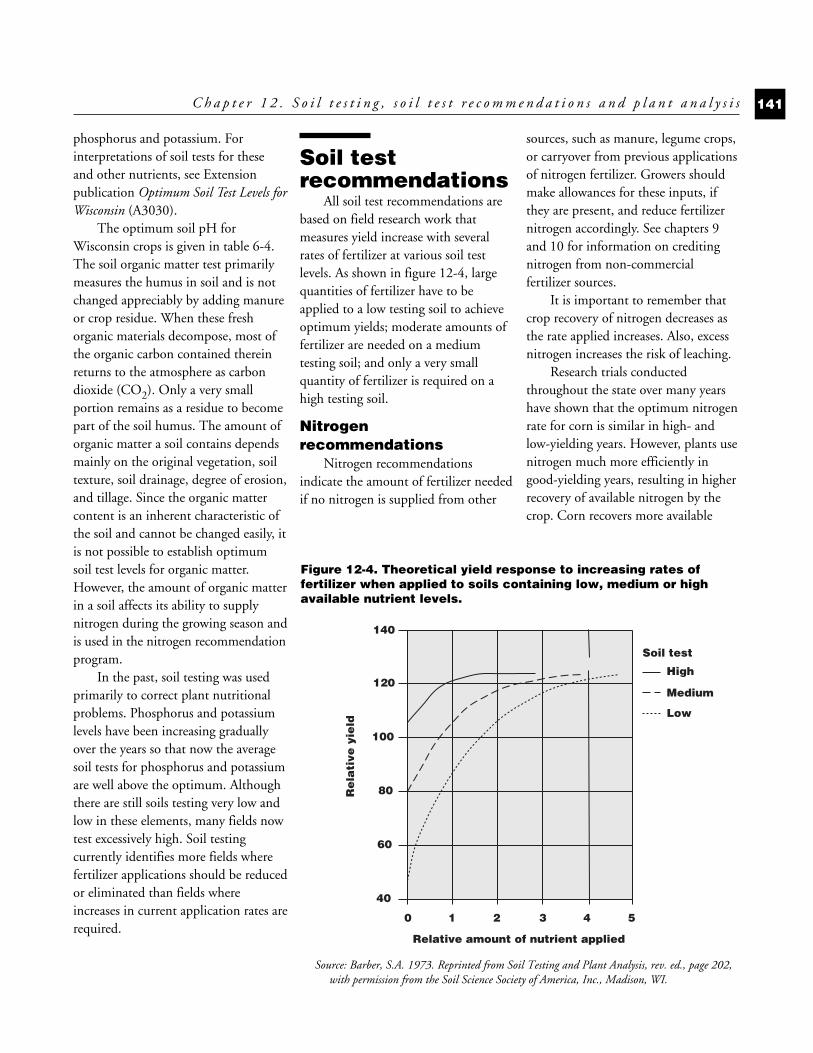
phosphorus and potassium. Forinterpretations of soil tests for theseand other nutrients, see Extensionpublication Optimum Soil Test Levels forWisconsin (A3030).
The optimum soil pH forWisconsin crops is given in table 6-4.The soil organic matter test primarilymeasures the humus in soil and is notchanged appreciably by adding manureor crop residue. When these freshorganic materials decompose, most ofthe organic carbon contained thereinreturns to the atmosphere as carbondioxide (CO2). Only a very smallportion remains as a residue to becomepart of the soil humus. The amount oforganic matter a soil contains dependsmainly on the original vegetation, soiltexture, soil drainage, degree of erosion,and tillage. Since the organic mattercontent is an inherent characteristic ofthe soil and cannot be changed easily, itis not possible to establish optimumsoil test levels for organic matter.However, the amount of organic matterin a soil affects its ability to supplynitrogen during the growing season andis used in the nitrogen recommendationprogram.
In the past, soil testing was usedprimarily to correct plant nutritionalproblems. Phosphorus and potassiumlevels have been increasing graduallyover the years so that now the averagesoil tests for phosphorus and potassiumare well above the optimum. Althoughthere are still soils testing very low andlow in these elements, many fields nowtest excessively high. Soil testingcurrently identifies more fields wherefertilizer applications should be reducedor eliminated than fields whereincreases in current application rates arerequired.
Soil testrecommendations
All soil test recommendations arebased on field research work thatmeasures yield increase with severalrates of fertilizer at various soil testlevels. As shown in figure 12-4, largequantities of fertilizer have to beapplied to a low testing soil to achieveoptimum yields; moderate amounts offertilizer are needed on a mediumtesting soil; and only a very smallquantity of fertilizer is required on ahigh testing soil.
Nitrogenrecommendations
Nitrogen recommendationsindicate the amount of fertilizer neededif no nitrogen is supplied from other
sources, such as manure, legume crops,or carryover from previous applicationsof nitrogen fertilizer. Growers shouldmake allowances for these inputs, ifthey are present, and reduce fertilizernitrogen accordingly. See chapters 9and 10 for information on creditingnitrogen from non-commercialfertilizer sources.
It is important to remember thatcrop recovery of nitrogen decreases asthe rate applied increases. Also, excessnitrogen increases the risk of leaching.
Research trials conductedthroughout the state over many yearshave shown that the optimum nitrogenrate for corn is similar in high- andlow-yielding years. However, plants usenitrogen much more efficiently ingood-yielding years, resulting in higherrecovery of available nitrogen by thecrop. Corn recovers more available
C h a p t e r 1 2 . S o i l t e s t i n g , s o i l t e s t r e c o m m e n d a t i o n s a n d p l a n t a n a l y s i s 141
Re
lati
ve y
ield
Relative amount of nutrient applied
High
140
0
120
100
80
60
40
1 2 3 4 5
Low
Medium
Soil test
Figure 12-4. Theoretical yield response to increasing rates offertilizer when applied to soils containing low, medium or highavailable nutrient levels.
Source: Barber, S.A. 1973. Reprinted from Soil Testing and Plant Analysis, rev. ed., page 202,with permission from the Soil Science Society of America, Inc., Madison, WI.
C-12 10/18/05 11:17 AM Page 141
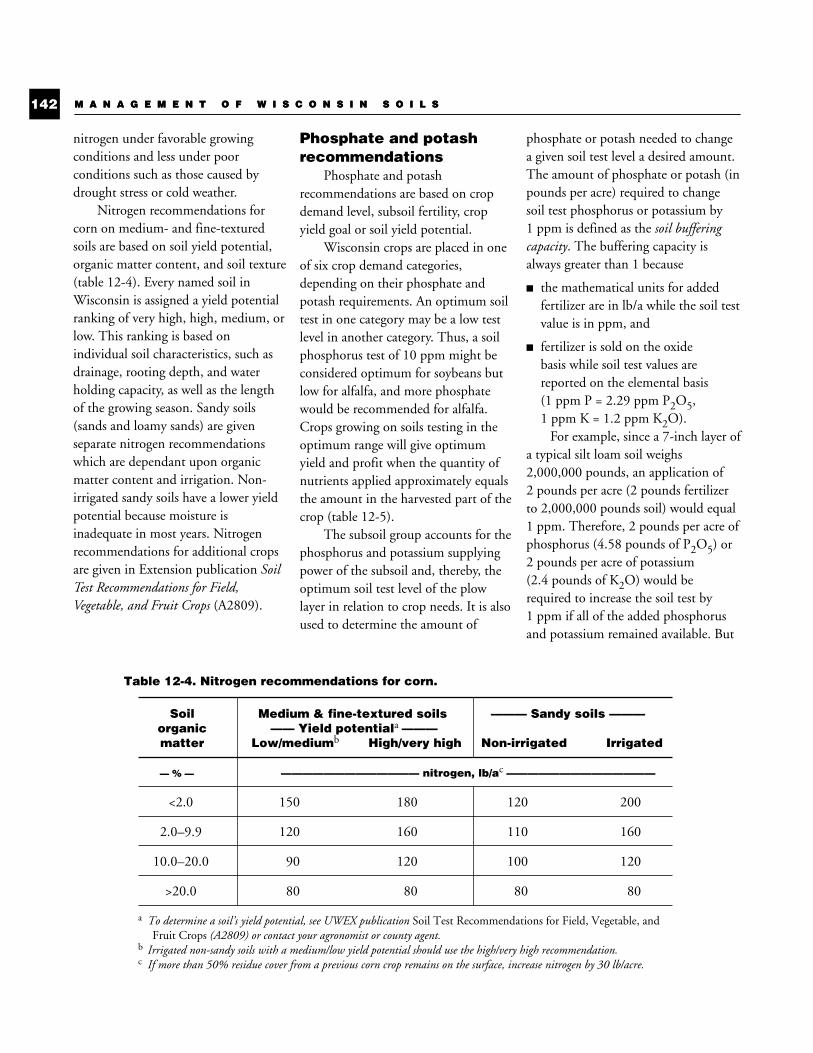
M A N A G E M E N T O F W I S C O N S I N S O I L S142 M A N A G E M E N T O F W I S C O N S I N S O I L S
nitrogen under favorable growingconditions and less under poorconditions such as those caused bydrought stress or cold weather.
Nitrogen recommendations forcorn on medium- and fine-texturedsoils are based on soil yield potential,organic matter content, and soil texture(table 12-4). Every named soil inWisconsin is assigned a yield potentialranking of very high, high, medium, orlow. This ranking is based onindividual soil characteristics, such asdrainage, rooting depth, and waterholding capacity, as well as the lengthof the growing season. Sandy soils(sands and loamy sands) are givenseparate nitrogen recommendationswhich are dependant upon organicmatter content and irrigation. Non-irrigated sandy soils have a lower yieldpotential because moisture isinadequate in most years. Nitrogenrecommendations for additional cropsare given in Extension publication SoilTest Recommendations for Field,Vegetable, and Fruit Crops (A2809).
Phosphate and potashrecommendations
Phosphate and potashrecommendations are based on cropdemand level, subsoil fertility, cropyield goal or soil yield potential.
Wisconsin crops are placed in oneof six crop demand categories,depending on their phosphate andpotash requirements. An optimum soiltest in one category may be a low testlevel in another category. Thus, a soilphosphorus test of 10 ppm might beconsidered optimum for soybeans butlow for alfalfa, and more phosphatewould be recommended for alfalfa.Crops growing on soils testing in theoptimum range will give optimumyield and profit when the quantity ofnutrients applied approximately equalsthe amount in the harvested part of thecrop (table 12-5).
The subsoil group accounts for thephosphorus and potassium supplyingpower of the subsoil and, thereby, theoptimum soil test level of the plowlayer in relation to crop needs. It is alsoused to determine the amount of
phosphate or potash needed to changea given soil test level a desired amount.The amount of phosphate or potash (inpounds per acre) required to changesoil test phosphorus or potassium by1 ppm is defined as the soil bufferingcapacity. The buffering capacity isalways greater than 1 because
■ the mathematical units for addedfertilizer are in lb/a while the soil testvalue is in ppm, and
■ fertilizer is sold on the oxide basis while soil test values arereported on the elemental basis (1 ppm P = 2.29 ppm P2O5, 1 ppm K = 1.2 ppm K2O).
For example, since a 7-inch layer ofa typical silt loam soil weighs2,000,000 pounds, an application of2 pounds per acre (2 pounds fertilizerto 2,000,000 pounds soil) would equal1 ppm. Therefore, 2 pounds per acre ofphosphorus (4.58 pounds of P2O5) or2 pounds per acre of potassium(2.4 pounds of K2O) would berequired to increase the soil test by1 ppm if all of the added phosphorusand potassium remained available. But
Table 12-4. Nitrogen recommendations for corn.
Soil Medium & fine-textured soils ——— Sandy soils ———organic —— Yield potentiala ——— matter Low/mediumb High/very high Non-irrigated Irrigated
— % — ————————————— nitrogen, lb/ac ——————————————
<2.0 150 180 120 200
2.0–9.9 120 160 110 160
10.0–20.0 90 120 100 120
>20.0 80 80 80 80
a To determine a soil’s yield potential, see UWEX publication Soil Test Recommendations for Field, Vegetable, andFruit Crops (A2809) or contact your agronomist or county agent.
b Irrigated non-sandy soils with a medium/low yield potential should use the high/very high recommendation.c If more than 50% residue cover from a previous corn crop remains on the surface, increase nitrogen by 30 lb/acre.
C-12 10/18/05 11:17 AM Page 142
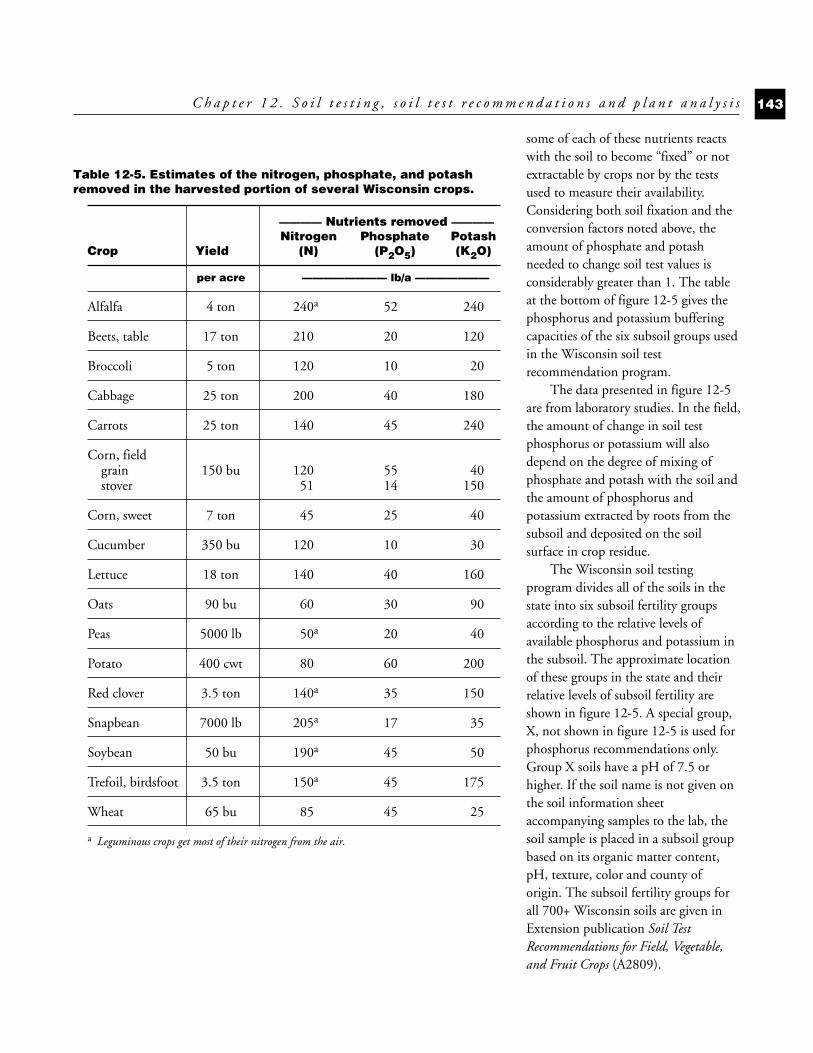
some of each of these nutrients reactswith the soil to become “fixed” or notextractable by crops nor by the testsused to measure their availability.Considering both soil fixation and theconversion factors noted above, theamount of phosphate and potashneeded to change soil test values isconsiderably greater than 1. The tableat the bottom of figure 12-5 gives thephosphorus and potassium bufferingcapacities of the six subsoil groups usedin the Wisconsin soil testrecommendation program.
The data presented in figure 12-5are from laboratory studies. In the field,the amount of change in soil testphosphorus or potassium will alsodepend on the degree of mixing ofphosphate and potash with the soil andthe amount of phosphorus andpotassium extracted by roots from thesubsoil and deposited on the soilsurface in crop residue.
The Wisconsin soil testingprogram divides all of the soils in thestate into six subsoil fertility groupsaccording to the relative levels ofavailable phosphorus and potassium inthe subsoil. The approximate locationof these groups in the state and theirrelative levels of subsoil fertility areshown in figure 12-5. A special group,X, not shown in figure 12-5 is used forphosphorus recommendations only.Group X soils have a pH of 7.5 orhigher. If the soil name is not given onthe soil information sheetaccompanying samples to the lab, thesoil sample is placed in a subsoil groupbased on its organic matter content,pH, texture, color and county oforigin. The subsoil fertility groups forall 700+ Wisconsin soils are given inExtension publication Soil TestRecommendations for Field, Vegetable,and Fruit Crops (A2809).
C h a p t e r 1 2 . S o i l t e s t i n g , s o i l t e s t r e c o m m e n d a t i o n s a n d p l a n t a n a l y s i s 143
Table 12-5. Estimates of the nitrogen, phosphate, and potashremoved in the harvested portion of several Wisconsin crops.
———— Nutrients removed ————Nitrogen Phosphate Potash
Crop Yield (N) (P2O5) (K2O)
per acre ———————— lb/a ———————
Alfalfa 4 ton 240a 52 240
Beets, table 17 ton 210 20 120
Broccoli 5 ton 120 10 20
Cabbage 25 ton 200 40 180
Carrots 25 ton 140 45 240
Corn, fieldgrain 150 bu 120 55 40stover 51 14 150
Corn, sweet 7 ton 45 25 40
Cucumber 350 bu 120 10 30
Lettuce 18 ton 140 40 160
Oats 90 bu 60 30 90
Peas 5000 lb 50a 20 40
Potato 400 cwt 80 60 200
Red clover 3.5 ton 140a 35 150
Snapbean 7000 lb 205a 17 35
Soybean 50 bu 190a 45 50
Trefoil, birdsfoot 3.5 ton 150a 45 175
Wheat 65 bu 85 45 25
a Leguminous crops get most of their nitrogen from the air.
C-12 10/18/05 11:17 AM Page 143
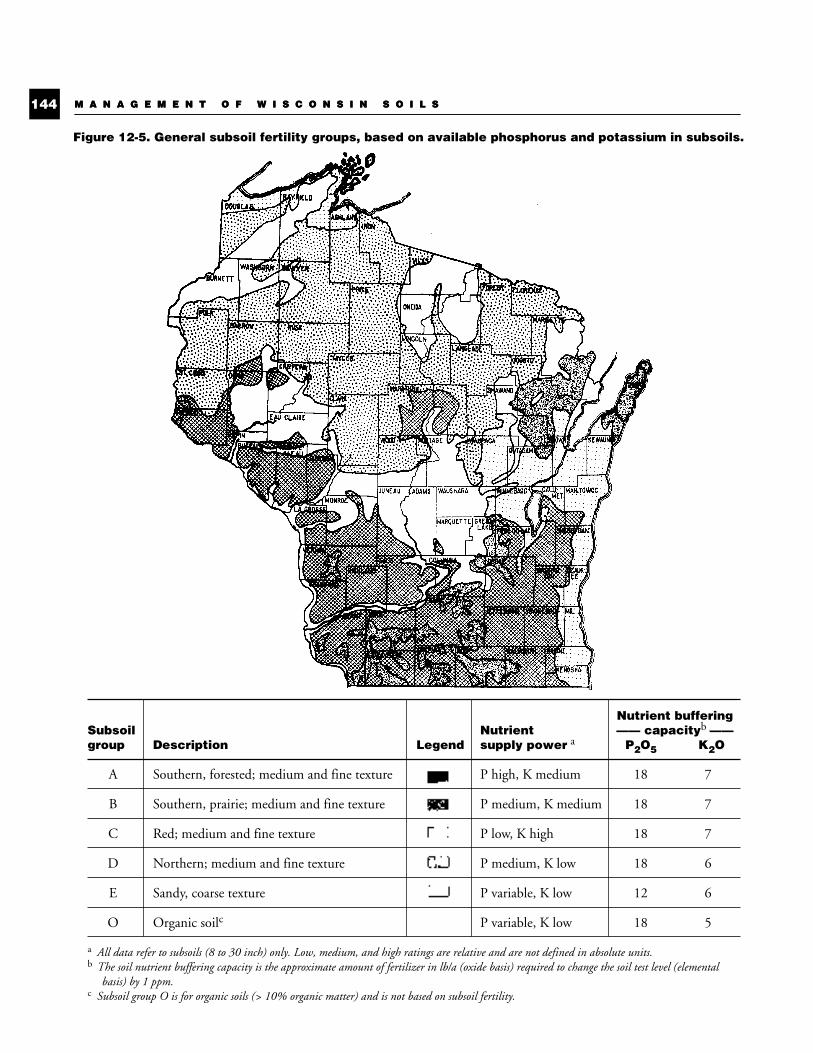
M A N A G E M E N T O F W I S C O N S I N S O I L S144 M A N A G E M E N T O F W I S C O N S I N S O I L S
Figure 12-5. General subsoil fertility groups, based on available phosphorus and potassium in subsoils.
Nutrient bufferingSubsoil Nutrient —— capacityb ——group Description Legend supply power a P2O5 K2O
A Southern, forested; medium and fine texture P high, K medium 18 7
B Southern, prairie; medium and fine texture P medium, K medium 18 7
C Red; medium and fine texture P low, K high 18 7
D Northern; medium and fine texture P medium, K low 18 6
E Sandy, coarse texture P variable, K low 12 6
O Organic soilc P variable, K low 18 5
a All data refer to subsoils (8 to 30 inch) only. Low, medium, and high ratings are relative and are not defined in absolute units.b The soil nutrient buffering capacity is the approximate amount of fertilizer in lb/a (oxide basis) required to change the soil test level (elemental
basis) by 1 ppm.c Subsoil group O is for organic soils (> 10% organic matter) and is not based on subsoil fertility.
C-12 10/18/05 11:17 AM Page 144
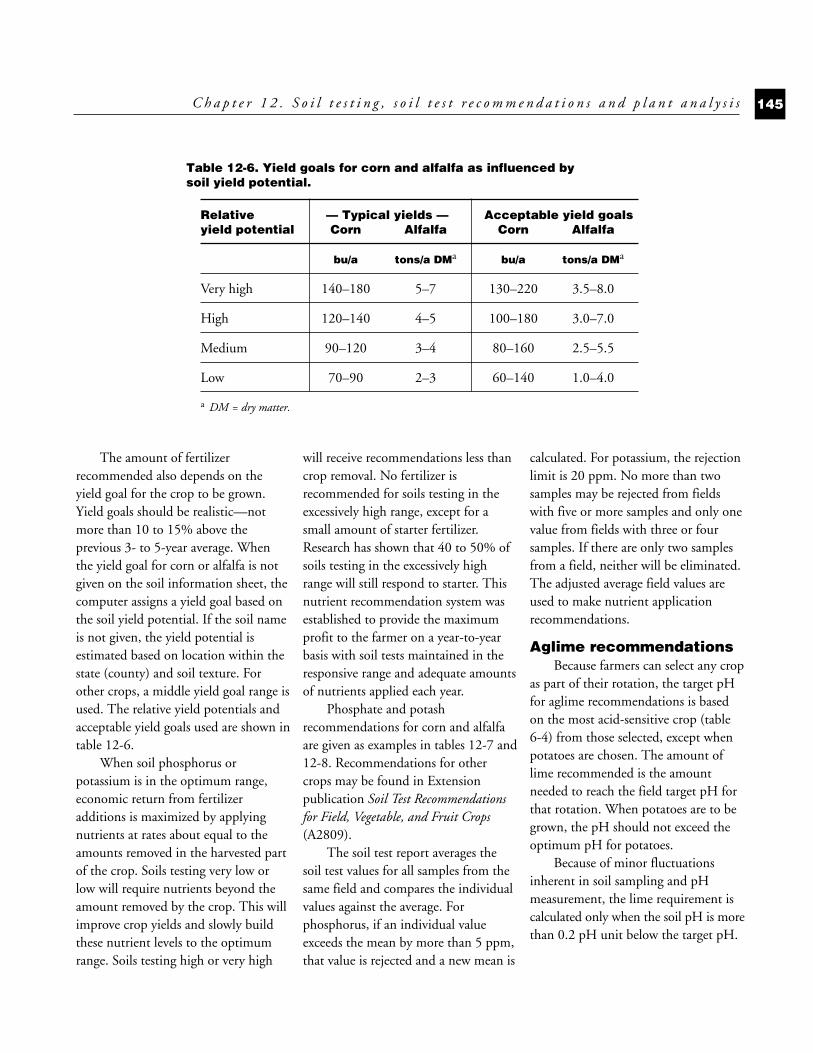
C h a p t e r 1 2 . S o i l t e s t i n g , s o i l t e s t r e c o m m e n d a t i o n s a n d p l a n t a n a l y s i s 145
The amount of fertilizerrecommended also depends on theyield goal for the crop to be grown.Yield goals should be realistic—notmore than 10 to 15% above theprevious 3- to 5-year average. Whenthe yield goal for corn or alfalfa is notgiven on the soil information sheet, thecomputer assigns a yield goal based onthe soil yield potential. If the soil nameis not given, the yield potential isestimated based on location within thestate (county) and soil texture. Forother crops, a middle yield goal range isused. The relative yield potentials andacceptable yield goals used are shown intable 12-6.
When soil phosphorus orpotassium is in the optimum range,economic return from fertilizeradditions is maximized by applyingnutrients at rates about equal to theamounts removed in the harvested partof the crop. Soils testing very low orlow will require nutrients beyond theamount removed by the crop. This willimprove crop yields and slowly buildthese nutrient levels to the optimumrange. Soils testing high or very high
will receive recommendations less thancrop removal. No fertilizer isrecommended for soils testing in theexcessively high range, except for asmall amount of starter fertilizer.Research has shown that 40 to 50% ofsoils testing in the excessively highrange will still respond to starter. Thisnutrient recommendation system wasestablished to provide the maximumprofit to the farmer on a year-to-yearbasis with soil tests maintained in theresponsive range and adequate amountsof nutrients applied each year.
Phosphate and potashrecommendations for corn and alfalfaare given as examples in tables 12-7 and12-8. Recommendations for othercrops may be found in Extensionpublication Soil Test Recommendationsfor Field, Vegetable, and Fruit Crops(A2809).
The soil test report averages thesoil test values for all samples from thesame field and compares the individualvalues against the average. Forphosphorus, if an individual valueexceeds the mean by more than 5 ppm,that value is rejected and a new mean is
calculated. For potassium, the rejectionlimit is 20 ppm. No more than twosamples may be rejected from fieldswith five or more samples and only onevalue from fields with three or foursamples. If there are only two samplesfrom a field, neither will be eliminated.The adjusted average field values areused to make nutrient applicationrecommendations.
Aglime recommendationsBecause farmers can select any crop
as part of their rotation, the target pHfor aglime recommendations is basedon the most acid-sensitive crop (table6-4) from those selected, except whenpotatoes are chosen. The amount oflime recommended is the amountneeded to reach the field target pH forthat rotation. When potatoes are to begrown, the pH should not exceed theoptimum pH for potatoes.
Because of minor fluctuationsinherent in soil sampling and pHmeasurement, the lime requirement iscalculated only when the soil pH is morethan 0.2 pH unit below the target pH.
Table 12-6. Yield goals for corn and alfalfa as influenced by soil yield potential.
Relative — Typical yields — Acceptable yield goalsyield potential Corn Alfalfa Corn Alfalfa
bu/a tons/a DMa bu/a tons/a DMa
Very high 140–180 5–7 130–220 3.5–8.0
High 120–140 4–5 100–180 3.0–7.0
Medium 90–120 3–4 80–160 2.5–5.5
Low 70–90 2–3 60–140 1.0–4.0
a DM = dry matter.
C-12 10/18/05 11:17 AM Page 145
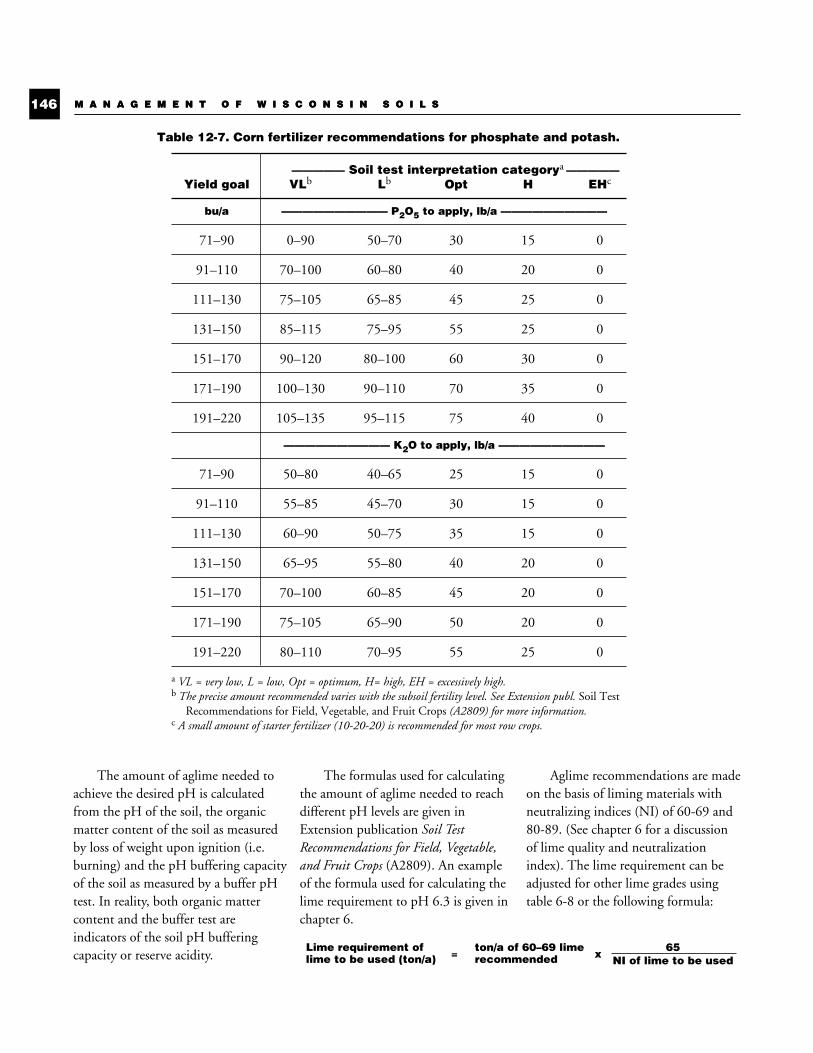
M A N A G E M E N T O F W I S C O N S I N S O I L S146 M A N A G E M E N T O F W I S C O N S I N S O I L S
The amount of aglime needed toachieve the desired pH is calculatedfrom the pH of the soil, the organicmatter content of the soil as measuredby loss of weight upon ignition (i.e.burning) and the pH buffering capacityof the soil as measured by a buffer pHtest. In reality, both organic mattercontent and the buffer test areindicators of the soil pH bufferingcapacity or reserve acidity.
The formulas used for calculatingthe amount of aglime needed to reachdifferent pH levels are given inExtension publication Soil TestRecommendations for Field, Vegetable,and Fruit Crops (A2809). An exampleof the formula used for calculating thelime requirement to pH 6.3 is given inchapter 6.
Aglime recommendations are madeon the basis of liming materials withneutralizing indices (NI) of 60-69 and80-89. (See chapter 6 for a discussionof lime quality and neutralizationindex). The lime requirement can beadjusted for other lime grades usingtable 6-8 or the following formula:
Table 12-7. Corn fertilizer recommendations for phosphate and potash.
————— Soil test interpretation categorya —————Yield goal VLb Lb Opt H EHc
bu/a —————————— P2O5 to apply, lb/a ——————————
71–90 0–90 50–70 30 15 0
91–110 70–100 60–80 40 20 0
111–130 75–105 65–85 45 25 0
131–150 85–115 75–95 55 25 0
151–170 90–120 80–100 60 30 0
171–190 100–130 90–110 70 35 0
191–220 105–135 95–115 75 40 0
—————————— K2O to apply, lb/a ——————————
71–90 50–80 40–65 25 15 0
91–110 55–85 45–70 30 15 0
111–130 60–90 50–75 35 15 0
131–150 65–95 55–80 40 20 0
151–170 70–100 60–85 45 20 0
171–190 75–105 65–90 50 20 0
191–220 80–110 70–95 55 25 0
a VL = very low, L = low, Opt = optimum, H= high, EH = excessively high.b The precise amount recommended varies with the subsoil fertility level. See Extension publ. Soil Test
Recommendations for Field, Vegetable, and Fruit Crops (A2809) for more information.c A small amount of starter fertilizer (10-20-20) is recommended for most row crops.
Lime requirement of=
ton/a of 60–69 limex
65 lime to be used (ton/a) recommended NI of lime to be used
C-12 10/18/05 11:17 AM Page 146
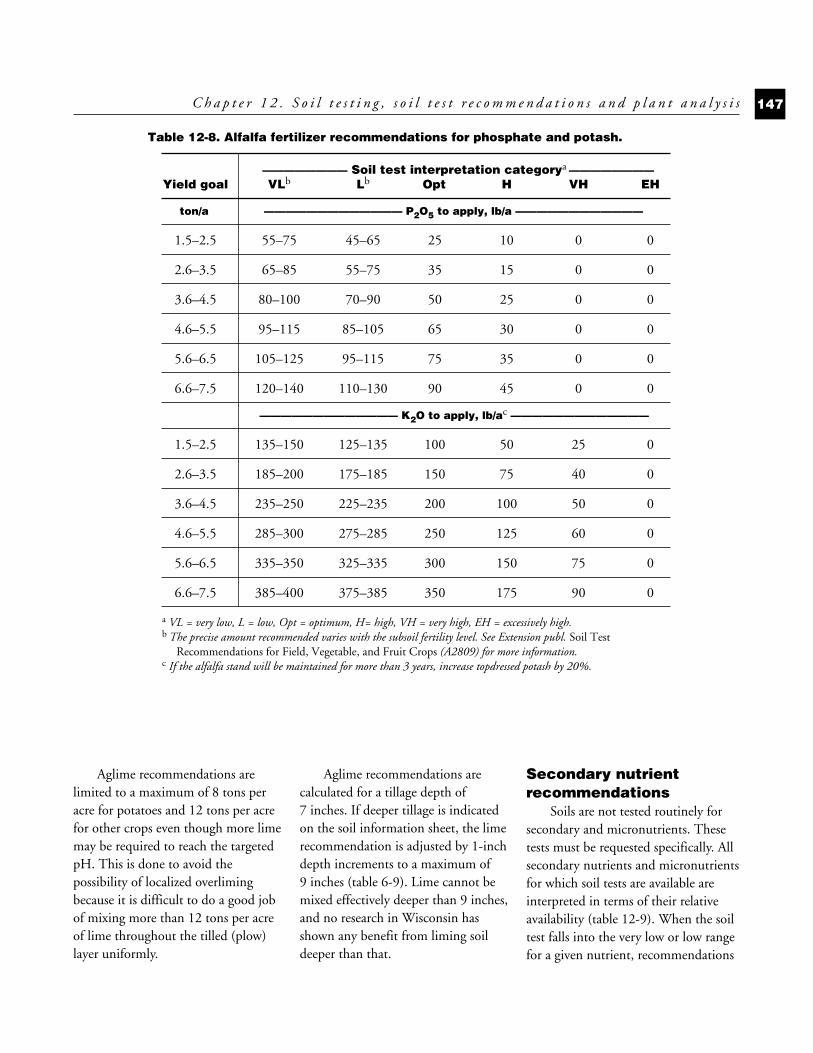
C h a p t e r 1 2 . S o i l t e s t i n g , s o i l t e s t r e c o m m e n d a t i o n s a n d p l a n t a n a l y s i s 147
Aglime recommendations arelimited to a maximum of 8 tons peracre for potatoes and 12 tons per acrefor other crops even though more limemay be required to reach the targetedpH. This is done to avoid thepossibility of localized overlimingbecause it is difficult to do a good jobof mixing more than 12 tons per acreof lime throughout the tilled (plow)layer uniformly.
Aglime recommendations arecalculated for a tillage depth of7 inches. If deeper tillage is indicatedon the soil information sheet, the limerecommendation is adjusted by 1-inchdepth increments to a maximum of9 inches (table 6-9). Lime cannot bemixed effectively deeper than 9 inches,and no research in Wisconsin hasshown any benefit from liming soildeeper than that.
Secondary nutrientrecommendations
Soils are not tested routinely forsecondary and micronutrients. Thesetests must be requested specifically. Allsecondary nutrients and micronutrientsfor which soil tests are available areinterpreted in terms of their relativeavailability (table 12-9). When the soiltest falls into the very low or low rangefor a given nutrient, recommendations
Table 12-8. Alfalfa fertilizer recommendations for phosphate and potash.
———————— Soil test interpretation categorya ————————Yield goal VLb Lb Opt H VH EH
ton/a ————————————— P2O5 to apply, lb/a ————————————
1.5–2.5 55–75 45–65 25 10 0 0
2.6–3.5 65–85 55–75 35 15 0 0
3.6–4.5 80–100 70–90 50 25 0 0
4.6–5.5 95–115 85–105 65 30 0 0
5.6–6.5 105–125 95–115 75 35 0 0
6.6–7.5 120–140 110–130 90 45 0 0
————————————— K2O to apply, lb/ac —————————————
1.5–2.5 135–150 125–135 100 50 25 0
2.6–3.5 185–200 175–185 150 75 40 0
3.6–4.5 235–250 225–235 200 100 50 0
4.6–5.5 285–300 275–285 250 125 60 0
5.6–6.5 335–350 325–335 300 150 75 0
6.6–7.5 385–400 375–385 350 175 90 0
a VL = very low, L = low, Opt = optimum, H= high, VH = very high, EH = excessively high.b The precise amount recommended varies with the subsoil fertility level. See Extension publ. Soil Test
Recommendations for Field, Vegetable, and Fruit Crops (A2809) for more information.c If the alfalfa stand will be maintained for more than 3 years, increase topdressed potash by 20%.
C-12 10/18/05 11:17 AM Page 147
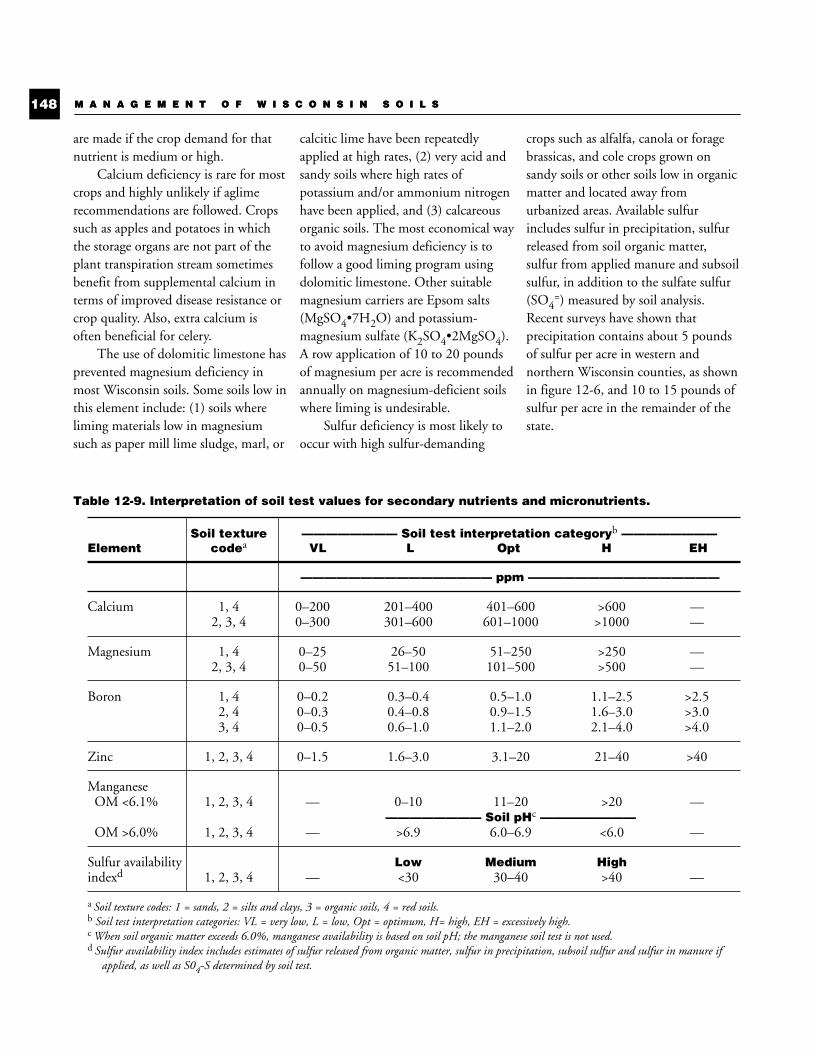
are made if the crop demand for thatnutrient is medium or high.
Calcium deficiency is rare for mostcrops and highly unlikely if aglimerecommendations are followed. Cropssuch as apples and potatoes in whichthe storage organs are not part of theplant transpiration stream sometimesbenefit from supplemental calcium interms of improved disease resistance orcrop quality. Also, extra calcium isoften beneficial for celery.
The use of dolomitic limestone hasprevented magnesium deficiency inmost Wisconsin soils. Some soils low inthis element include: (1) soils whereliming materials low in magnesiumsuch as paper mill lime sludge, marl, or
calcitic lime have been repeatedlyapplied at high rates, (2) very acid andsandy soils where high rates ofpotassium and/or ammonium nitrogenhave been applied, and (3) calcareousorganic soils. The most economical wayto avoid magnesium deficiency is tofollow a good liming program usingdolomitic limestone. Other suitablemagnesium carriers are Epsom salts(MgSO4•7H2O) and potassium-magnesium sulfate (K2SO4•2MgSO4).A row application of 10 to 20 poundsof magnesium per acre is recommendedannually on magnesium-deficient soilswhere liming is undesirable.
Sulfur deficiency is most likely tooccur with high sulfur-demanding
crops such as alfalfa, canola or foragebrassicas, and cole crops grown onsandy soils or other soils low in organicmatter and located away fromurbanized areas. Available sulfurincludes sulfur in precipitation, sulfurreleased from soil organic matter,sulfur from applied manure and subsoilsulfur, in addition to the sulfate sulfur(SO4
=) measured by soil analysis.Recent surveys have shown thatprecipitation contains about 5 poundsof sulfur per acre in western andnorthern Wisconsin counties, as shownin figure 12-6, and 10 to 15 pounds ofsulfur per acre in the remainder of thestate.
M A N A G E M E N T O F W I S C O N S I N S O I L S148 M A N A G E M E N T O F W I S C O N S I N S O I L S
Table 12-9. Interpretation of soil test values for secondary nutrients and micronutrients.
Soil texture ———————— Soil test interpretation categoryb ————————Element codea VL L Opt H EH
———————————————— ppm ————————————————
Calcium 1, 4 0–200 201–400 401–600 >600 —2, 3, 4 0–300 301–600 601–1000 >1000 —
Magnesium 1, 4 0–25 26–50 51–250 >250 —2, 3, 4 0–50 51–100 101–500 >500 —
Boron 1, 4 0–0.2 0.3–0.4 0.5–1.0 1.1–2.5 >2.52, 4 0–0.3 0.4–0.8 0.9–1.5 1.6–3.0 >3.03, 4 0–0.5 0.6–1.0 1.1–2.0 2.1–4.0 >4.0
Zinc 1, 2, 3, 4 0–1.5 1.6–3.0 3.1–20 21–40 >40
ManganeseOM <6.1% 1, 2, 3, 4 — 0–10 11–20 >20 —
———————— Soil pHc ————————OM >6.0% 1, 2, 3, 4 — >6.9 6.0–6.9 <6.0 —
Sulfur availability Low Medium Highindexd 1, 2, 3, 4 — <30 30–40 >40 —
a Soil texture codes: 1 = sands, 2 = silts and clays, 3 = organic soils, 4 = red soils.b Soil test interpretation categories: VL = very low, L = low, Opt = optimum, H= high, EH = excessively high.c When soil organic matter exceeds 6.0%, manganese availability is based on soil pH; the manganese soil test is not used.d Sulfur availability index includes estimates of sulfur released from organic matter, sulfur in precipitation, subsoil sulfur and sulfur in manure if
applied, as well as S04-S determined by soil test.
C-12 10/18/05 11:17 AM Page 148
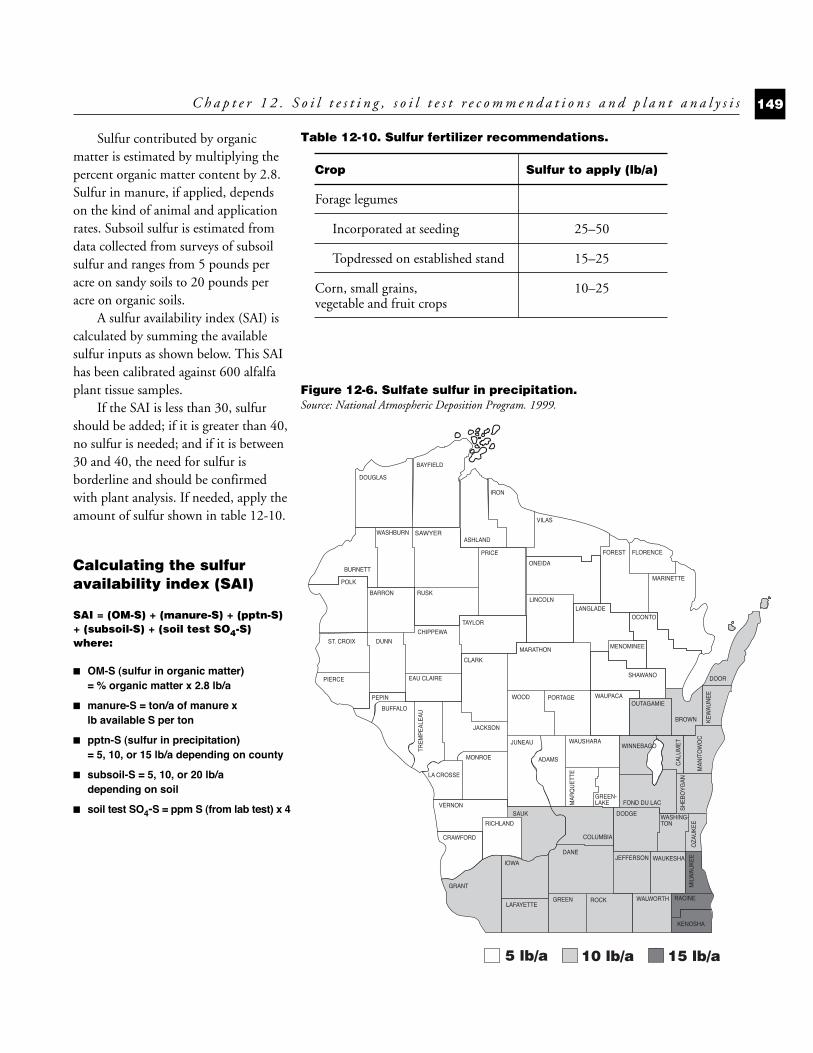
Sulfur contributed by organicmatter is estimated by multiplying thepercent organic matter content by 2.8.Sulfur in manure, if applied, dependson the kind of animal and applicationrates. Subsoil sulfur is estimated fromdata collected from surveys of subsoilsulfur and ranges from 5 pounds peracre on sandy soils to 20 pounds peracre on organic soils.
A sulfur availability index (SAI) iscalculated by summing the availablesulfur inputs as shown below. This SAIhas been calibrated against 600 alfalfaplant tissue samples.
If the SAI is less than 30, sulfurshould be added; if it is greater than 40,no sulfur is needed; and if it is between30 and 40, the need for sulfur isborderline and should be confirmedwith plant analysis. If needed, apply theamount of sulfur shown in table 12-10.
C h a p t e r 1 2 . S o i l t e s t i n g , s o i l t e s t r e c o m m e n d a t i o n s a n d p l a n t a n a l y s i s 149
Calculating the sulfuravailability index (SAI)
SAI = (OM-S) + (manure-S) + (pptn-S)+ (subsoil-S) + (soil test SO4-S)where:
■ OM-S (sulfur in organic matter)= % organic matter x 2.8 lb/a
■ manure-S = ton/a of manure x lb available S per ton
■ pptn-S (sulfur in precipitation)= 5, 10, or 15 lb/a depending on county
■ subsoil-S = 5, 10, or 20 lb/a depending on soil
■ soil test SO4-S = ppm S (from lab test) x 4
DOUGLAS
BAYFIELD
ASHLAND
IRON
BURNETT
VILAS
WASHBURN SAWYER
PRICE
ONEIDA
FOREST FLORENCE
BARRON
POLK
RUSK
TAYLOR
CHIPPEWA
PEPIN
EAU CLAIRE
CLARK
LINCOLN
MARATHON
LANGLADE
MARINETTE
OCONTO
MENOMINEE
SHAWANO DOOR
KE
WA
UN
EEWAUPACAWOOD PORTAGE
WAUSHARA
JACKSON
JUNEAU
ADAMS
MA
RQ
UE
TTE
MONROE
SAUK
MIL
WA
UK
EE
IOWA
GRANT
RICHLAND
CRAWFORD
VERNON
LA CROSSE
BUFFALO
TRE
MP
EA
LEA
U
KENOSHA
RACINE
OUTAGAMIE
BROWN
MA
NIT
OW
OC
SH
EB
OY
GA
N
FOND DU LAC
COLUMBIA
DODGE
DANEJEFFERSON WAUKESHA
WASHING-TON
OZA
UK
EE
LAFAYETTEGREEN ROCK WALWORTH
ST. CROIX DUNN
PIERCEC
ALU
ME
T
GREEN-LAKE
WINNEBAGO
5 lb/a 10 lb/a 15 lb/a
Figure 12-6. Sulfate sulfur in precipitation. Source: National Atmospheric Deposition Program. 1999.
Table 12-10. Sulfur fertilizer recommendations.
Crop Sulfur to apply (lb/a)
Forage legumes
Incorporated at seeding 25–50
Topdressed on established stand 15–25
Corn, small grains, 10–25vegetable and fruit crops
C-12 10/18/05 11:17 AM Page 149
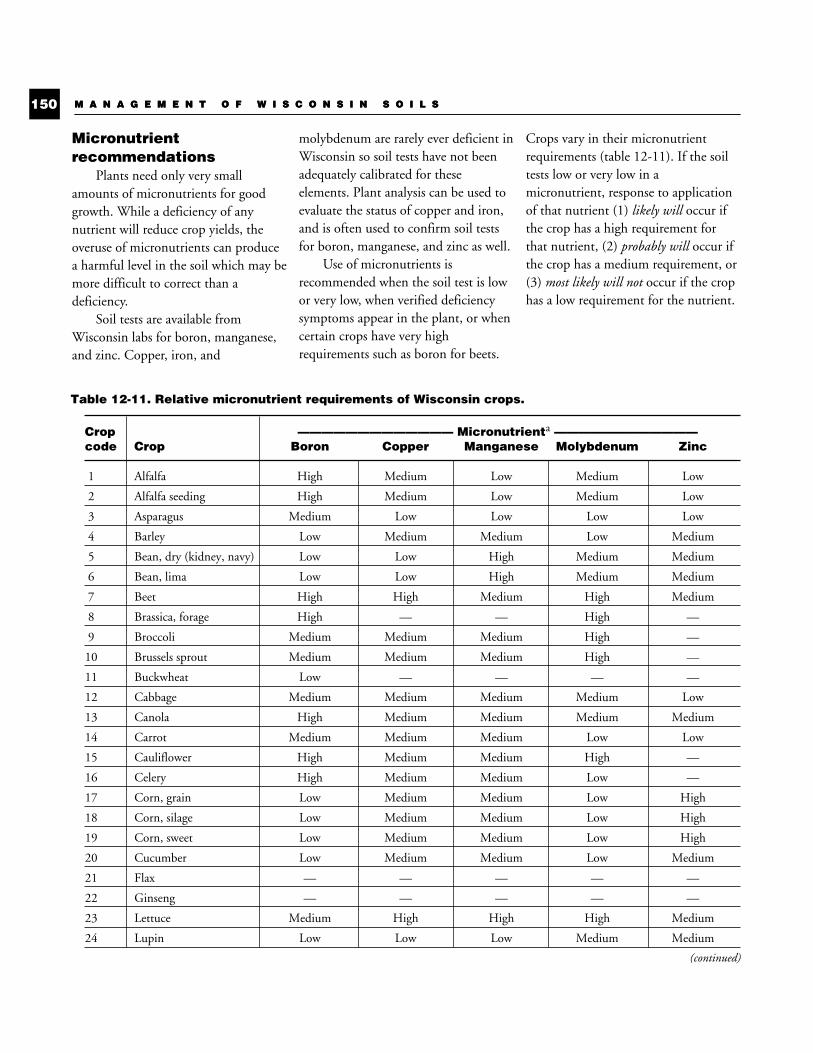
Micronutrientrecommendations
Plants need only very smallamounts of micronutrients for goodgrowth. While a deficiency of anynutrient will reduce crop yields, theoveruse of micronutrients can producea harmful level in the soil which may bemore difficult to correct than adeficiency.
Soil tests are available fromWisconsin labs for boron, manganese,and zinc. Copper, iron, and
molybdenum are rarely ever deficient inWisconsin so soil tests have not beenadequately calibrated for theseelements. Plant analysis can be used toevaluate the status of copper and iron,and is often used to confirm soil testsfor boron, manganese, and zinc as well.
Use of micronutrients isrecommended when the soil test is lowor very low, when verified deficiencysymptoms appear in the plant, or whencertain crops have very highrequirements such as boron for beets.
Crops vary in their micronutrientrequirements (table 12-11). If the soiltests low or very low in amicronutrient, response to applicationof that nutrient (1) likely will occur ifthe crop has a high requirement forthat nutrient, (2) probably will occur ifthe crop has a medium requirement, or(3) most likely will not occur if the crophas a low requirement for the nutrient.
M A N A G E M E N T O F W I S C O N S I N S O I L S150 M A N A G E M E N T O F W I S C O N S I N S O I L S
Table 12-11. Relative micronutrient requirements of Wisconsin crops.
Crop ————————————— Micronutrienta ————————————code Crop Boron Copper Manganese Molybdenum Zinc
1 Alfalfa High Medium Low Medium Low
2 Alfalfa seeding High Medium Low Medium Low
3 Asparagus Medium Low Low Low Low
4 Barley Low Medium Medium Low Medium
5 Bean, dry (kidney, navy) Low Low High Medium Medium
6 Bean, lima Low Low High Medium Medium
7 Beet High High Medium High Medium
8 Brassica, forage High — — High —
9 Broccoli Medium Medium Medium High —
10 Brussels sprout Medium Medium Medium High —
11 Buckwheat Low — — — —
12 Cabbage Medium Medium Medium Medium Low
13 Canola High Medium Medium Medium Medium
14 Carrot Medium Medium Medium Low Low
15 Cauliflower High Medium Medium High —
16 Celery High Medium Medium Low —
17 Corn, grain Low Medium Medium Low High
18 Corn, silage Low Medium Medium Low High
19 Corn, sweet Low Medium Medium Low High
20 Cucumber Low Medium Medium Low Medium
21 Flax — — — — —
22 Ginseng — — — — —
23 Lettuce Medium High High High Medium
24 Lupin Low Low Low Medium Medium
(continued)
C-12 10/18/05 11:17 AM Page 150

C h a p t e r 1 2 . S o i l t e s t i n g , s o i l t e s t r e c o m m e n d a t i o n s a n d p l a n t a n a l y s i s 151
Table 12-11. Relative micronutrient requirements of Wisconsin crops (continued).
Crop ————————————— Micronutrienta ————————————code Crop Boron Copper Manganese Molybdenum Zinc
25 Melon Medium — — — —
26 Millet Low — — — —
27 Mint, oil Low Low Medium Low Low
28 Oat Low Medium High Low Low
29 Oatlage Low Medium High Low Low
30 Oat-pea forage Low Medium High Low Low
31 Onion Low High High High High
32 Pasture, unimproved Low Low Medium Low Low
33 Pasture, managed Low Low Medium Low Low
34 Pasture, legume-grass High Medium Low High Low
35 Pea, canning Low Low Medium Medium Low
36 Pea (chick, field, cow) Low Low Medium Medium Low
37 Pepper — — — — —
38 Popcorn — — — — —
39 Potato Low Low Medium Low Medium
40 Pumpkin — — — — —
41 Reed canarygrass Low Low Medium Low Low
42 Red clover Medium Medium Low Medium Low
43 Rye Low Low Low Low Low
44 Snapbean Low Low — — —
45 Sod Low Low Medium Low Low
46 Sorghum, grain Low Medium High Low High
47 Sorghum-sudan forage Low Medium High Low Medium
48 Soybean Low Low High Medium Medium
49 Spinach Medium High High High High
50 Squash — — — — —
51 Sunflower High High — — —
52 Tobacco Medium Low Medium — Medium
53 Tomato High High Medium Medium Medium
54 Trefoil, birdsfoot High — — — —
55 Triticale Low Low Medium — —
56 Truck crops Medium Medium — — —
57 Vetch (crown, hairy) Medium — — — —
58 Wheat Low Medium High Low Low
66 CRP, alfalfa High Medium Low Medium Low
67 CRP, red clover Medium Medium Low Medium Low
68 CRP, grass Low Low Medium Low Low
— = no dataa Iron (Fe) and chloride (Cl) deficiencies have not been noted on field crops in Wisconsin.
C-12 10/18/05 11:17 AM Page 151
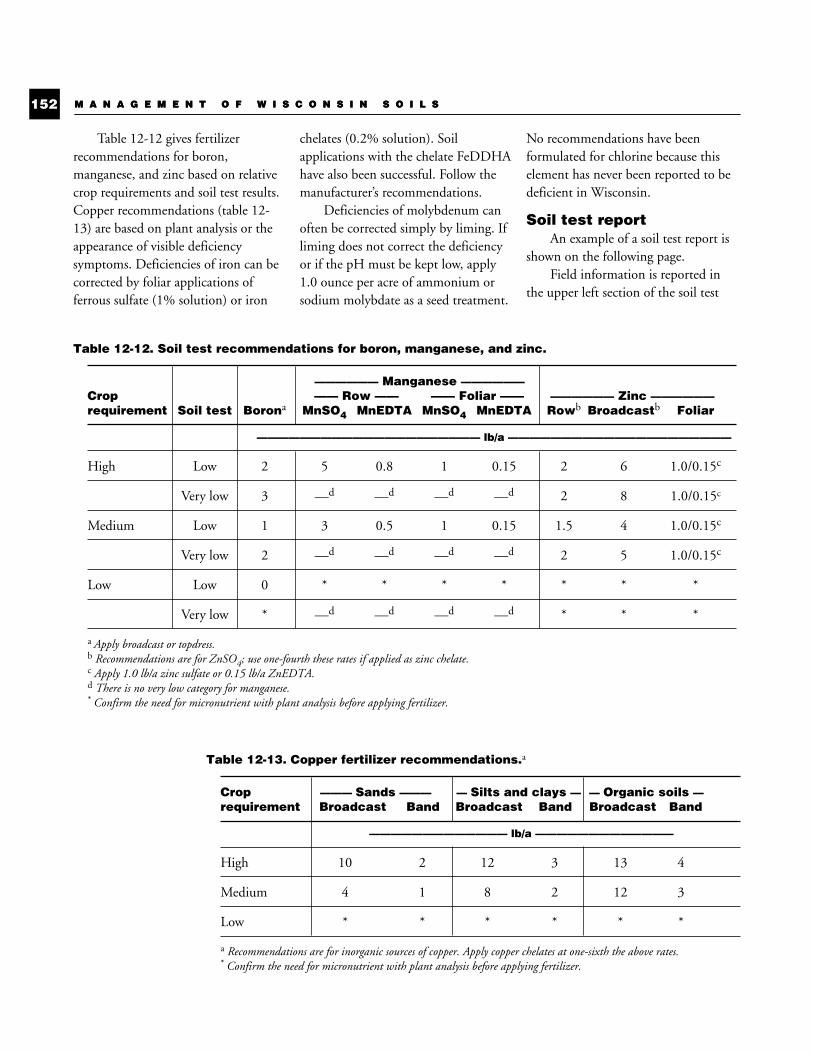
Table 12-12 gives fertilizerrecommendations for boron,manganese, and zinc based on relativecrop requirements and soil test results.Copper recommendations (table 12-13) are based on plant analysis or theappearance of visible deficiencysymptoms. Deficiencies of iron can becorrected by foliar applications offerrous sulfate (1% solution) or iron
chelates (0.2% solution). Soilapplications with the chelate FeDDHAhave also been successful. Follow themanufacturer’s recommendations.
Deficiencies of molybdenum canoften be corrected simply by liming. Ifliming does not correct the deficiencyor if the pH must be kept low, apply1.0 ounce per acre of ammonium orsodium molybdate as a seed treatment.
No recommendations have beenformulated for chlorine because thiselement has never been reported to bedeficient in Wisconsin.
Soil test reportAn example of a soil test report is
shown on the following page.Field information is reported in
the upper left section of the soil test
M A N A G E M E N T O F W I S C O N S I N S O I L S152 M A N A G E M E N T O F W I S C O N S I N S O I L S
Table 12-12. Soil test recommendations for boron, manganese, and zinc.
—————— Manganese ——————Crop —— Row —— —— Foliar —— —————— Zinc ——————requirement Soil test Borona MnSO4 MnEDTA MnSO4 MnEDTA Rowb Broadcastb Foliar
————————————————————— lb/a —————————————————————
High Low 2 5 0.8 1 0.15 2 6 1.0/0.15c
Very low 3 —d —d —d —d 2 8 1.0/0.15c
Medium Low 1 3 0.5 1 0.15 1.5 4 1.0/0.15c
Very low 2 —d —d —d —d 2 5 1.0/0.15c
Low Low 0 * * * * * * *
Very low * —d —d —d —d * * *
a Apply broadcast or topdress.b Recommendations are for ZnSO4; use one-fourth these rates if applied as zinc chelate.c Apply 1.0 lb/a zinc sulfate or 0.15 lb/a ZnEDTA.d There is no very low category for manganese.* Confirm the need for micronutrient with plant analysis before applying fertilizer.
Table 12-13. Copper fertilizer recommendations.a
Crop ——— Sands ——— — Silts and clays — — Organic soils —requirement Broadcast Band Broadcast Band Broadcast Band
————————————— lb/a —————————————
High 10 2 12 3 13 4
Medium 4 1 8 2 12 3
Low * * * * * *
a Recommendations are for inorganic sources of copper. Apply copper chelates at one-sixth the above rates.* Confirm the need for micronutrient with plant analysis before applying fertilizer.
C-12 10/18/05 11:17 AM Page 152
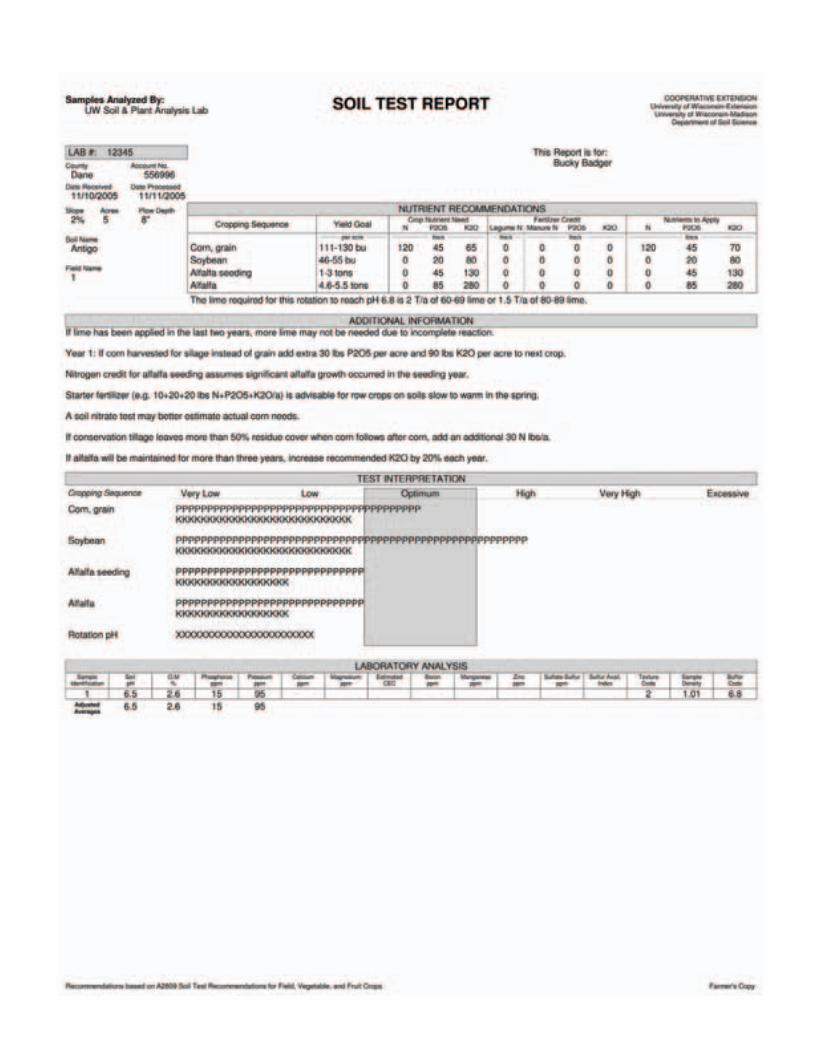
soil test report (QX) 10/19/05 8:39 AM Page 1

soil test report (QX) 10/19/05 8:39 AM Page 2
C h a p t e r 1 2 . S o i l t e s t i n g , s o i l t e s t r e c o m m e n d a t i o n s a n d p l a n t a n a l y s i s 153
report. The field history given on theinformation sheet when the soils aresubmitted for analysis is the sameinformation reported in this section ofthe report.
Field nutrient recommendationsfor fertilizer and lime are presented inthe upper portion of the report. Theserecommendations are based on theaverage results of all samples from onefield and are presented for the 4-yearcrop rotation selected. If no specificcrop rotation is selected,recommendations for a corn-soybean-alfalfa seeding-alfalfa rotation are given.Aglime recommendations for thespecific crop sequences are presenteddirectly beneath the fertilizerrecommendation for each option. Theamount of aglime needed to raise thesoil pH for the most acid-sensitive cropin the sequence is shown for limegrades with neutralizing indexes of60-69 and 80-89.
The fertilizer recommendations onthe soil test report form are adjusted forprevious legume crops or appliedmanure if this information is given onthe information sheet. Theseadjustments are also shown in theupper portion of the report. Below thefertilizer recommendations is additionalinformation for modifying therecommendations based on cropmanagement practices. The totalnutrient requirement can be applied asa combination of manure, legume,commercial fertilizer, or other nutrientsource. Applications can be made as arow treatment, a broadcast treatment,or as a combination of the two. Thedecision on how to apply the requirednutrients depends largely on the totalamount needed, soil type, crop to begrown, and personal preference.
A graphic presentation of theinterpretations of the adjusted average
soil test for phosphorus and potassiumare shown in the center section of thereport. Lines of repeated “P”s and “K”sextend into the appropriateinterpretation level for each crop.
The laboratory analysis results foreach sample are located in the lowerportion of the report. Routine soil testsinclude soil pH, buffer pH (reported inthe buffer code column), organicmatter, phosphorus, and potassium.Organic matter results are reported inpercent and nutrient tests in ppm.
Plant analysisUses of plant analysis
Plant analysis is used to measurethe concentration of essential elementsin plant tissue. It is a more precisediagnostic tool for identifyingnutritional disorders than soil tests orobservations of visual deficiencysymptoms. Plant analysis can accuratelyidentify deficiencies of macronutrientsand most micronutrients. In fact, forsome nutrients, such as copper andiron, plant analysis is the only practicaldiagnostic tool available. In addition,plant analysis can be used to evaluatefertilizer efficiency, to study nutrientinteractions, and to identify or confirmnutrient toxicities. It is also used tomake fertilizer recommendations forperennial shrubs and trees.
Plant analysis and a good soil testcan furnish a guide to more efficientcrop production. Soil tests provide agood estimate or prediction of lime andfertilizer needs. Plant analysis recordsthe actual uptake of plant nutrients andallows an evaluation of fertilizer andmanagement practices by providing anutritional “photograph” of the crop.
Soil tests and plant analyses oftenneed to be used in combination withon-site inspection to help pinpoint a
problem. For example, plant analysismight show a corn plant being low inphosphorus even though the soil testshows there is sufficient soilphosphorus. Only on-site inspectionwill reveal that the deficiency is due tocold weather, rootworm damage, orsome other factor.
Identification of nutritionaldisorders. The main use of plantanalysis is the identification ofnutritional disorders. For that reason,carbon, hydrogen, and oxygen are notanalyzed because they come from theair or water and virtually never limitplant growth. Molybdenum is analyzedonly on request because it is difficult toanalyze, is seldom deficient, and is usedas an internal standard on someanalytical equipment. Chlorine is notanalyzed because it is always sufficientunder Wisconsin field conditions.Plant analysis is also used to test foraluminum and sodium, even thoughthey are not essential elements, becausealuminum can be toxic in acid soils,and sodium improves the quality ofsome crops, such as beets and celery.
Plant analysis is unique from othercrop diagnostic tests in that it gives anoverall picture of the nutrient levelswithin the plant at the time the samplewas taken. This picture shows theconcentration levels for each of theanalyzed nutrients. Figure 12-7 showsthe relationship between nutrientconcentration levels and crop growth.Increasing the concentration of adeficient nutrient will increase cropgrowth until it reaches a maximumyield. Further additions of the elementwill cause the concentration of thatelement in the plant to rise morerapidly because it is not being dilutedby added dry matter accumulation.Eventually, toxicity of that element mayoccur.
C-12 10/18/05 11:17 AM Page 153
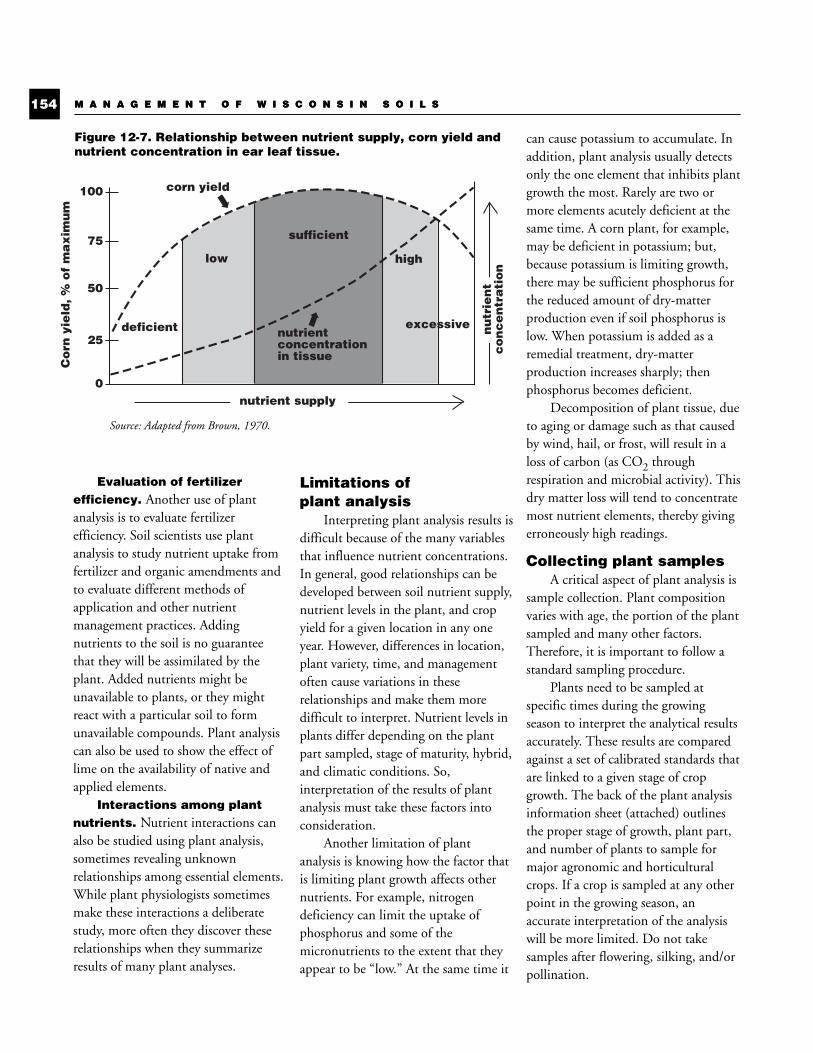
Evaluation of fertilizerefficiency. Another use of plantanalysis is to evaluate fertilizerefficiency. Soil scientists use plantanalysis to study nutrient uptake fromfertilizer and organic amendments andto evaluate different methods ofapplication and other nutrientmanagement practices. Addingnutrients to the soil is no guaranteethat they will be assimilated by theplant. Added nutrients might beunavailable to plants, or they mightreact with a particular soil to formunavailable compounds. Plant analysiscan also be used to show the effect oflime on the availability of native andapplied elements.
Interactions among plantnutrients. Nutrient interactions canalso be studied using plant analysis,sometimes revealing unknownrelationships among essential elements.While plant physiologists sometimesmake these interactions a deliberatestudy, more often they discover theserelationships when they summarizeresults of many plant analyses.
Limitations of plant analysis
Interpreting plant analysis results isdifficult because of the many variablesthat influence nutrient concentrations.In general, good relationships can bedeveloped between soil nutrient supply,nutrient levels in the plant, and cropyield for a given location in any oneyear. However, differences in location,plant variety, time, and managementoften cause variations in theserelationships and make them moredifficult to interpret. Nutrient levels inplants differ depending on the plantpart sampled, stage of maturity, hybrid,and climatic conditions. So,interpretation of the results of plantanalysis must take these factors intoconsideration.
Another limitation of plantanalysis is knowing how the factor thatis limiting plant growth affects othernutrients. For example, nitrogendeficiency can limit the uptake ofphosphorus and some of themicronutrients to the extent that theyappear to be “low.” At the same time it
can cause potassium to accumulate. Inaddition, plant analysis usually detectsonly the one element that inhibits plantgrowth the most. Rarely are two ormore elements acutely deficient at thesame time. A corn plant, for example,may be deficient in potassium; but,because potassium is limiting growth,there may be sufficient phosphorus forthe reduced amount of dry-matterproduction even if soil phosphorus islow. When potassium is added as aremedial treatment, dry-matterproduction increases sharply; thenphosphorus becomes deficient.
Decomposition of plant tissue, dueto aging or damage such as that causedby wind, hail, or frost, will result in aloss of carbon (as CO2 throughrespiration and microbial activity). Thisdry matter loss will tend to concentratemost nutrient elements, thereby givingerroneously high readings.
Collecting plant samplesA critical aspect of plant analysis is
sample collection. Plant compositionvaries with age, the portion of the plantsampled and many other factors.Therefore, it is important to follow astandard sampling procedure.
Plants need to be sampled atspecific times during the growingseason to interpret the analytical resultsaccurately. These results are comparedagainst a set of calibrated standards thatare linked to a given stage of cropgrowth. The back of the plant analysisinformation sheet (attached) outlinesthe proper stage of growth, plant part,and number of plants to sample formajor agronomic and horticulturalcrops. If a crop is sampled at any otherpoint in the growing season, anaccurate interpretation of the analysiswill be more limited. Do not takesamples after flowering, silking, and/orpollination.
M A N A G E M E N T O F W I S C O N S I N S O I L S154 M A N A G E M E N T O F W I S C O N S I N S O I L S
Figure 12-7. Relationship between nutrient supply, corn yield andnutrient concentration in ear leaf tissue.
Co
rn y
ield
, %
of
ma
xim
um
low
sufficient
high
corn yield
deficient nutrient concentrationin tissue
nutrient supply
100
75
50
25
0
excessive
➡
➡ nu
trie
nt
co
nc
en
tra
tio
n
Source: Adapted from Brown, 1970.
C-12 10/18/05 11:17 AM Page 154

3/04
P
LA
NT
AN
AL
YSI
S IN
FO
RM
AT
ION
SH
EE
T
Dep
artm
ent o
f Soi
l Sci
ence
UW
Soi
l & P
lant
Ana
lysi
s L
abor
ator
y C
olle
ge o
f Agr
icul
tura
l and
Lif
e Sc
ienc
es
84
52 M
iner
al P
oint
Roa
d U
nive
rsit
y of
Wis
cons
in-M
adis
on/E
xten
sion
Ver
ona,
WI
535
93
(60
8) 2
62-4
364
Dat
e R
ec'd
(La
b U
se O
nly)
NA
ME
AN
D A
DD
RE
SS
M
ET
HO
D O
F P
AY
ME
NT
N
ame
Am
ount
pai
d
or
Acc
t. ID
Lab
No.
A
ddre
ss
C
ash
o
r C
heck
No.
PO
#
C
ity
S
tate
Zip
C
redi
t Car
d
Cou
nty
Cod
e __
____
__
Cou
nty
sam
ple(
s) c
ame
from
: C
redi
t Car
d N
o___
____
_-__
____
__-_
____
___-
____
____
Exp
____
_/__
___
S
ampl
e N
o.
F
ield
ID
Sta
ge o
f gro
wth
In
terp
reta
tions
onl
y fo
r th
ose
liste
d.
P
lant
par
t sam
pled
(C
hoos
e le
tter
on b
ack)
C
rop
P
lant
app
eara
nce
Soi
l sub
mitt
ed fo
r
rout
ine
test
(p
H, O
M, P
and
K)
(Cho
ose
num
ber
on b
ack)
(C
ircle
one
) (C
ircle
one
)
N
orm
al
A
bnor
mal
Y
es
No
N
orm
al
A
bnor
mal
Y
es
No
N
orm
al
A
bnor
mal
Y
es
No
N
orm
al
A
bnor
mal
Y
es
No
N
orm
al
A
bnor
mal
Y
es
No
N
orm
al
A
bnor
mal
Y
es
No
N
orm
al
A
bnor
mal
Y
es
No
N
orm
al
A
bnor
mal
Y
es
No
N
orm
al
A
bnor
mal
Y
es
No
N
orm
al
A
bnor
mal
Y
es
No
In a
dditi
on to
rout
ine
test
(pH
, org
anic
mat
ter,
phos
phor
us, a
nd p
otas
sium
), ch
eck
soil
spec
ial t
est(
s) if
requ
este
d: T
here
is a
n ad
ded
char
ge p
er te
st.
Rep
ort w
ill li
st fi
elds
indi
vidu
ally
unl
ess
desi
gnat
ed o
ther
wis
e:
D
RIS
indi
ces
avai
labl
e fo
r: a
lfal
fa, a
pple
, cor
n, c
eler
y, le
ttuce
, mill
et, o
at, p
otat
o,
g
rain
sor
ghum
, tom
ato
and
whe
at
§ PA
SS in
dice
s av
aila
ble
for:
alf
alfa
, cor
n an
d so
ybea
n §
Bes
t inf
orm
atio
n fo
r non
-dia
gnos
tic s
tage
of g
row
th/p
lant
par
t
ca
n be
obt
aine
d by
com
pari
ng g
ood
and
bad
appe
arin
g pl
ants
fr
om th
e sa
me
fiel
d.
Rep
ort w
ill li
st fi
elds
sin
gula
rly
unle
ss d
esig
nate
d
I
f you
wou
ld li
ke to
hav
e re
sults
em
aile
d pl
ease
pro
vide
em
ail a
ddre
ss b
elow
:
Em
ail t
o: _
____
____
____
____
____
____
____
____
____
____
____
____
____
_
Che
ck s
peci
al te
st(s
) des
ired
:
Lis
t fie
lds
Cal
cium
/Mag
nesi
um (C
a/M
g) _
__
__
____
____
____
____
____
___
Bor
on (B
) ___
____
____
____
____
____
____
_
Man
gane
se (M
n) _
__
__
____
____
____
____
____
___
Su
lfur
(SO
4-S)
___
____
____
____
____
____
____
_
Zin
c (Z
n) _
__
__
____
____
____
____
____
___
Com
men
ts, s
peci
al in
stru
ctio
ns, b
illin
g in
form
atio
n (i
f dif
fere
nt fr
om a
bove
):
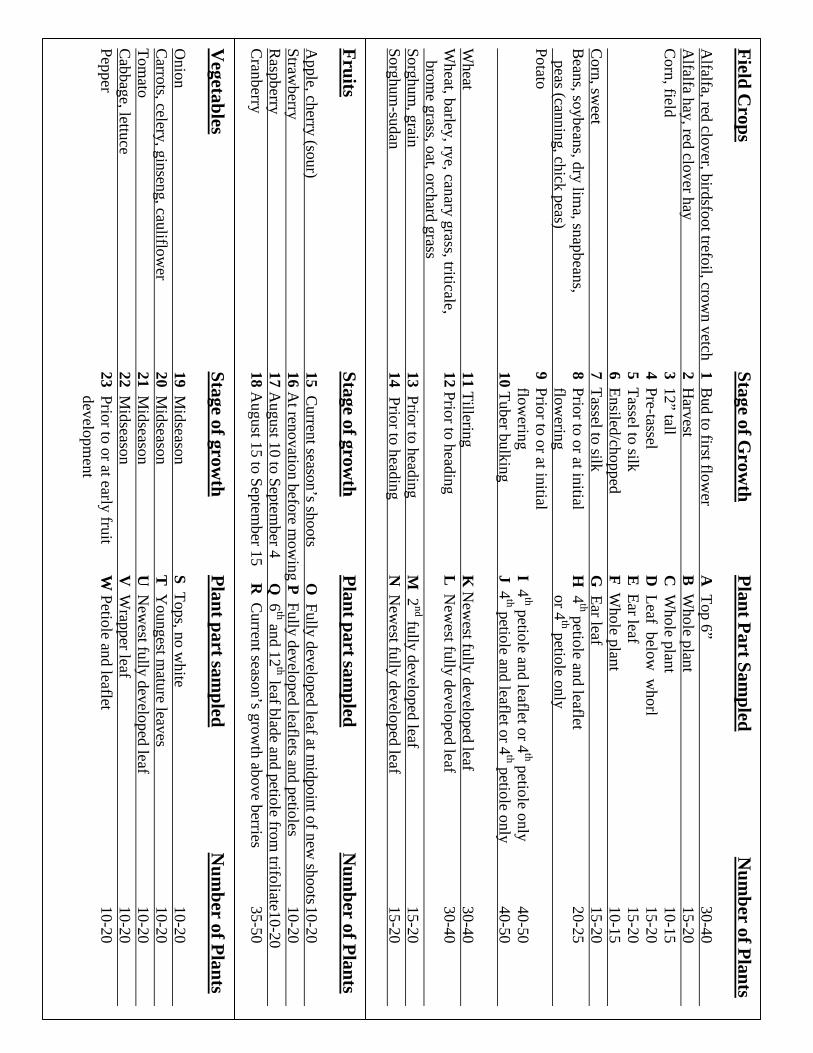
Field C
rops Stage of G
rowth
Plant P
art Sampled N
umber of P
lants A
lfalfa, red clover, birdsfoot trefoil, crown vetch
1 Bud to first flow
er A
Top 6”
30-40
A
lfalfa hay, red clover hay 2 H
arvest B
Whole plant
15-20
C
orn, field 3 12” tall
C W
hole plant 10-15
4 Pre-tassel
D L
eaf below w
horl 15-20
5 T
assel to silk E
Ear leaf
15-20
6 Ensiled/chopped
F Whole plant
10-15
C
orn, sweet
7 Tassel to silk
G E
ar leaf 15-20
Beans, soybeans, dry lim
a, snapbeans, 8 Prior to or at initial
H 4
th petiole and leaflet 20-25
peas (canning, chick peas) flow
ering or 4
th petiole only
Potato 9 Prior to or at initial
flow
ering I 4
th petiole and leaflet or 4th petiole only
40-50
10 Tuber bulking
J 4th petiole and leaflet or 4
th petiole only 40-50
Wheat
11 Tillering
K N
ewest fully developed leaf
30-40
W
heat, barley, rye, canary grass, triticale, 12 Prior to heading
L N
ewest fully developed leaf
30-40 brom
e grass, oat, orchard grass
Sorghum, grain
13 Prior to heading M
2nd fully developed leaf
15-20
Sorghum
-sudan 14 Prior to heading
N N
ewest fully developed leaf
15-20
F
ruits Stage of grow
th P
lant part sampled N
umber of P
lants A
pple, cherry (sour) 15 C
urrent season’s shoots O
Fully developed leaf at midpoint of new
shoots 10-20
Straw
berry 16 A
t renovation before mow
ing P Fully developed leaflets and petioles 10-20
Raspberry
17 August 10 to Septem
ber 4 Q
6th and 12
th leaf blade and petiole from trifoliate10-20
Cranberry
18 August 15 to Septem
ber 15 R C
urrent season’s growth above berries
35-50 V
egetables Stage of grow
th P
lant part sampled N
umber of P
lants O
nion 19 M
idseason S T
ops, no white
10-20
C
arrots, celery, ginseng, cauliflower
20 Midseason
T Y
oungest mature leaves
10-20
T
omato
21 Midseason
U N
ewest fully developed leaf
10-20
C
abbage, lettuce 22 M
idseason V
Wrapper leaf
10-20
Pepper
23 Prior to or at early fruit W
Petiole and leaflet 10-20
developm
ent
To minimize economic losses,sample plants as soon as they show anyabnormality, even if it is earlier than thestage of growth shown on the plantanalysis information sheet. In such acase, collect and submit the entireabove-ground portion of the plant foranalysis. Avoid any diseased or insect-damaged plants. When taking samplesfor trouble-shooting in a field, be sureto include a healthy specimen from thesame area. If normal and abnormalplants are tested, comparison of theresults between the two can oftendiagnose the problem. A comparisonsample is particularly helpful in theanalysis of some plants such as flowersand shrubs where a large database is notavailable for interpreting the results.
Prepare a plant sample forshipment by removing any roots andforeign material from the sample. Plantsamples contaminated with soilparticles will have erroneously highresults for iron, aluminum, andmanganese. To remove soil particles,shake or dust off the plant tissue—DO NOT WASH tissue since solublenutrients will be leached out of thesample.
Complete a plant analysisinformation sheet (sample attached)available from University laboratories,county Extension offices oruwlab.soils.wisc.edu/madison. TheExtension office will also have namesand addresses of private laboratoriesthat offer plant analysis services.
If the tissue sample is to be mailed,air-dry the sample for at least 1 day toavoid mold growth during shipment.Never mail samples on Thursday,Friday, or Saturday since the tissue maydeteriorate in the post office over theweekend. Place the plant sample in alarge paper envelope for shipment. Donot use plastic or polyethylene bags
since plant tissue molds more readily insuch bags. It is not necessary to air drysamples that will be delivered to the labwithin a day after collection of thesample. Refrigerate these samples ifpossible.
A soil sample should be submittedalong with all plant analysis samples.The soil sample should be taken fromthe same area as the plant sample. Forsome problems, the soil sample resultswill substantially improveinterpretations of the plant analysis.For example, plants suffering frommanganese toxicity are often associatedwith low pH soils.
Interpretation of plant analyses
Critical value and sufficiencyrange approaches
For most diagnostic purposes,plant analyses are interpreted on thebasis of “critical” or “sufficiency” levelsfor each nutrient. The critical level hasbeen defined as that concentrationbelow which yields decrease ordeficiency symptoms appear. For manynutrients, yield decreases even beforevisible deficiency symptoms areobserved. Because the exactconcentration of a nutrient belowwhich yields decline is difficult todetermine precisely, some define thecritical level as the nutrientconcentration at 90 or 95% ofmaximum yield.
As previously mentioned, thenutrient composition of a plantchanges as the plant matures and withthe portion of the plant sampled;therefore, critical levels are defined for aspecific plant part at a specified stage ofmaturity. For most crops, there is afairly broad optimum range ofconcentration over which yield will bemaximized rather than a single point.
Nutrient ranges representingdeficient, low, sufficient, high, andexcessive concentrations for corn andalfalfa used by the University ofWisconsin Soil and Plant AnalysisLaboratory are shown in table 12-14.For some nutrients, excessive levelshave not been well-defined becausegrowth is not depressed by excessiveuptake. These ranges are usefulguidelines for interpreting plantanalyses, but they must not be useddogmatically. Knowledge of hybridrequirements, unusual soil or climaticconditions, or other extenuatinginformation should be considered.
DRIS or nutrient ratio approachThe Diagnosis and
Recommendation Integrated System(DRIS) simultaneously considersnutrients on a ratio basis in relation tocrop growth. The DRIS approach tointerpreting the results of plant analysisinvolves creating a database from theanalysis of thousands of samples of aspecific crop. The nutrient ratioscorresponding to the highest yieldingportion of the population areestablished as the standard (norms) andused as the basis for comparison. Aratio of plant nutrient concentrationsby itself cannot be used to diagnoseplant problems, but combinations ofdifferent nutrient ratios can becombined mathematically to determinewhat nutrients are most likely to limityield. The results of such calculationsare the “DRIS indices.”
An index of 0 is consideredoptimum; however, although finer-tuning may be possible, DRIS indicesare normally calibrated so that thosewithin the range of about –15 to +25are considered normal and “inbalance.” A DRIS index less than –25indicates a likely deficiency, whereasthose between –15 and –25 represent a
C h a p t e r 1 2 . S o i l t e s t i n g , s o i l t e s t r e c o m m e n d a t i o n s a n d p l a n t a n a l y s i s 155
C-12 10/18/05 11:17 AM Page 155
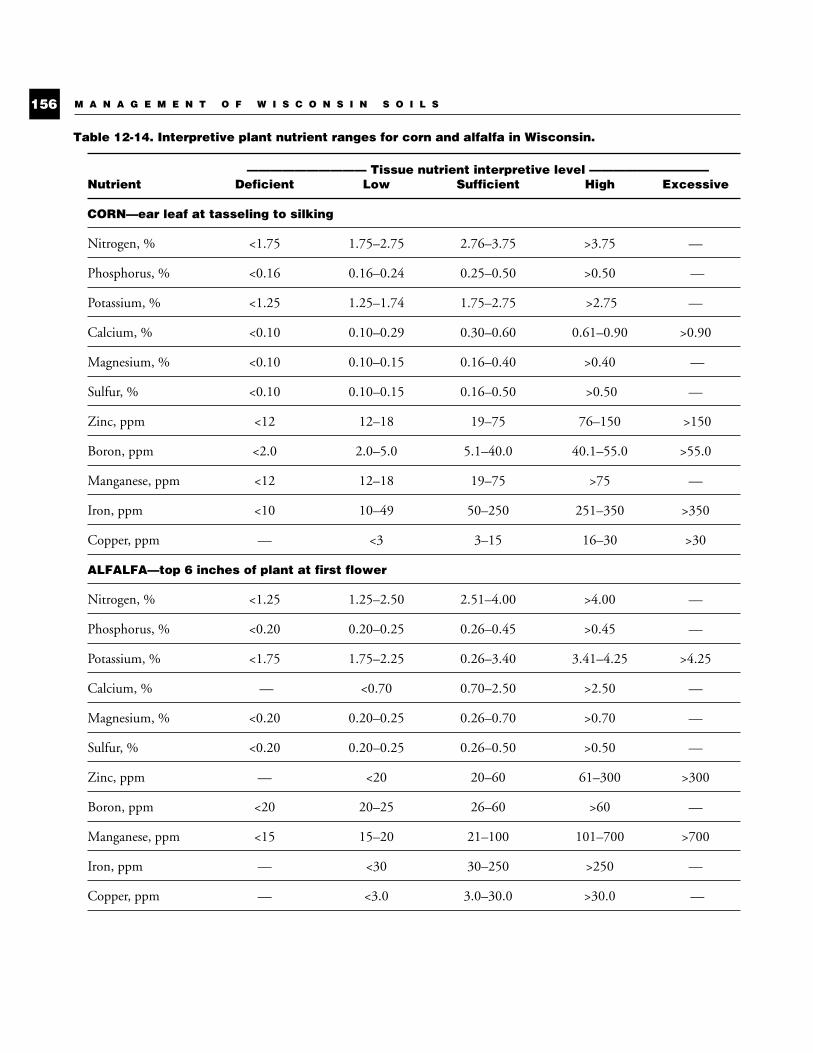
M A N A G E M E N T O F W I S C O N S I N S O I L S156
Table 12-14. Interpretive plant nutrient ranges for corn and alfalfa in Wisconsin.
—————————— Tissue nutrient interpretive level ——————————Nutrient Deficient Low Sufficient High Excessive
CORN—ear leaf at tasseling to silking
Nitrogen, % <1.75 1.75–2.75 2.76–3.75 >3.75 —
Phosphorus, % <0.16 0.16–0.24 0.25–0.50 >0.50 —
Potassium, % <1.25 1.25–1.74 1.75–2.75 >2.75 —
Calcium, % <0.10 0.10–0.29 0.30–0.60 0.61–0.90 >0.90
Magnesium, % <0.10 0.10–0.15 0.16–0.40 >0.40 —
Sulfur, % <0.10 0.10–0.15 0.16–0.50 >0.50 —
Zinc, ppm <12 12–18 19–75 76–150 >150
Boron, ppm <2.0 2.0–5.0 5.1–40.0 40.1–55.0 >55.0
Manganese, ppm <12 12–18 19–75 >75 —
Iron, ppm <10 10–49 50–250 251–350 >350
Copper, ppm — <3 3–15 16–30 >30
ALFALFA—top 6 inches of plant at first flower
Nitrogen, % <1.25 1.25–2.50 2.51–4.00 >4.00 —
Phosphorus, % <0.20 0.20–0.25 0.26–0.45 >0.45 —
Potassium, % <1.75 1.75–2.25 0.26–3.40 3.41–4.25 >4.25
Calcium, % — <0.70 0.70–2.50 >2.50 —
Magnesium, % <0.20 0.20–0.25 0.26–0.70 >0.70 —
Sulfur, % <0.20 0.20–0.25 0.26–0.50 >0.50 —
Zinc, ppm — <20 20–60 61–300 >300
Boron, ppm <20 20–25 26–60 >60 —
Manganese, ppm <15 15–20 21–100 101–700 >700
Iron, ppm — <30 30–250 >250 —
Copper, ppm — <3.0 3.0–30.0 >30.0 —
C-12 10/18/05 11:17 AM Page 156
possible deficiency. Values greater than+100 may be an indication of possiblenutrient excess. The greater themagnitude of the nutrient index, eitherpositive or negative, the more likelythat element is out of balance in theplant.
The principal advantages of theDRIS system are that stage of maturity,plant part, and cultivar are lessimportant than they are for the criticallevel or sufficiency range approaches tointerpreting plant analyses. Thus, byusing DRIS as an interpretiveapproach, it is possible to sample alfalfaat the pre-bud stage and obtainmeaningful results, rather than waitinguntil first flower.
DRIS norms are not available forall crops and some users of the DRISsystem tend to interpret the results toodogmatically. Some regard everynegative index as representing adeficiency and pay no attention topositive indices. Since not all of thenutrient norms used to develop DRISindices have been evaluated under fieldconditions, experience has shown thatthe evaluations should not be madedisregarding nutrient concentrationsaltogether. The University ofWisconsin recommends that the twointerpretive approaches—DRIS andcritical value/sufficiency range—beused together.
Plant Analysis withStandardized Scores (PASS)
The Plant Analysis withStandardized Scores (PASS) system wasdeveloped at the University ofWisconsin to combine the strengths ofthe sufficiency range (SR) and DRISmethods. The SR provides easilyinterpreted, categorical, independentnutrient indices. The DRIS givesdifficult to calculate, easily interpreted,numerical, dependent nutrient indices,and a ranking of the relativedeficiencies. The strengths of the SRare the weaknesses of the DRIS andvice-versa. The PASS system combinesan independent nutrient section and adependent nutrient section. Both typesof indices are expressed as astandardized score and can becombined to make more effectiveinterpretations. Research hasdemonstrated that PASS results inmore correct diagnoses than either ofthe other two systems. To date,however, the PASS system has beendeveloped only for alfalfa, corn, andsoybean.
Tissue testingTissue testing offers a quick field
test of plant sap. Unlike plant analysis,which is a quantitative laboratoryanalysis of plant tissue, a tissue test issemi-quantitative. Results areinterpreted as high, medium, low, ordeficient rather than in exactpercentages or parts per million. Mosttest kits analyze only nitrogen,phosphorus, and potassium. A soil pHkit is a useful supplement to the tissue-testing kit in areas with low or high pHsoils.
Tissue testing can help interpretplant growth problems in the field.Even if it does not identify nitrogen,phosphorus, or potassium as deficient,these nutrients can be ruled out, andattention can be focused elsewhere. Forquestionable test results and for resultsneeding to be verified, submit samplesto a laboratory for complete plantanalysis.
Tissue test kits can give false resultsif the reagents deteriorate or becomecontaminated.
C h a p t e r 1 2 . S o i l t e s t i n g , s o i l t e s t r e c o m m e n d a t i o n s a n d p l a n t a n a l y s i s 157
C-12 10/18/05 11:17 AM Page 157
Questions1. What is the minimum number of
composite soil samples that shouldbe taken from a 35-acre field thathas not been tested in the past 10years? How many cores or boringsshould be in each compositesample?
2. To what depth should the soil besampled in the following tillagesystems: 1) moldboard plow,2) chisel plow, 3) ridge tillage,4) no-till?
3. If a farmer has soil thatconsistently tests in the excessivelyhigh range for phosphorus andpotassium, what fertilizerrecommendations should be madefor corn? for established alfalfa?
4. Assume a farmer has a field ofcontinuous corn in Dubuque siltloam that tests 10 ppm in availablephosphorus (P). Also, assume thatenough row fertilizer is appliedeach year to replace what is beingremoved when the ear corn isharvested. About how muchbroadcast phosphate (P2O5) wouldhave to be applied to increase theavailable phosphorus (P) in the soilto 20 ppm?
5. Assume a soil test for availablepotassium (K) is 60 ppm in aMiami silt loam and that a farmerbroadcasts and thoroughlyincorporates the 300 pounds peracre of 0-0-60 (180 pounds ofK2O) recommended for this fieldin the fall. If this field wasresampled and tested again in thespring, what would be the expectedlevel of available potassium (K) onthe new soil test?
6. If a toxicity is suspected, such asboron toxicity, which of thefollowing diagnostic aids will moreaccurately define the problem: soiltest, plant analysis, or a tissue test?Why?
7. A soil sample from an alfalfa fieldtests “low” in available zinc, but norecommendations for zinc aregiven on the soil test report. Why?
8. Why is sulfur rarely recommendedfor a Tama silt loam soil in GrantCounty?
9. What is the difference betweenplant analysis and tissue testing?When would each be used?
M A N A G E M E N T O F W I S C O N S I N S O I L S158
C-12 10/18/05 11:17 AM Page 158
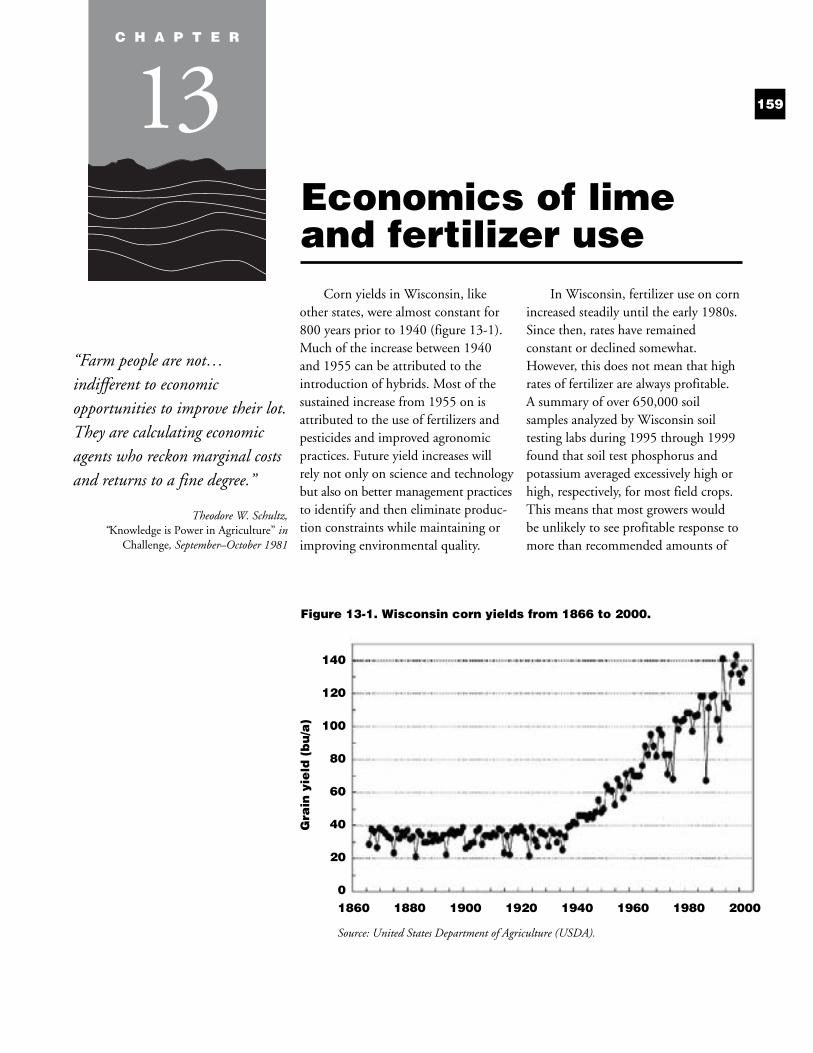
“Farm people are not…indifferent to economicopportunities to improve their lot.They are calculating economicagents who reckon marginal costsand returns to a fine degree.”
Theodore W. Schultz, “Knowledge is Power in Agriculture” in
Challenge, September–October 1981
Corn yields in Wisconsin, likeother states, were almost constant for800 years prior to 1940 (figure 13-1).Much of the increase between 1940and 1955 can be attributed to theintroduction of hybrids. Most of thesustained increase from 1955 on isattributed to the use of fertilizers andpesticides and improved agronomicpractices. Future yield increases willrely not only on science and technologybut also on better management practicesto identify and then eliminate produc-tion constraints while maintaining orimproving environmental quality.
In Wisconsin, fertilizer use on cornincreased steadily until the early 1980s.Since then, rates have remainedconstant or declined somewhat.However, this does not mean that highrates of fertilizer are always profitable.A summary of over 650,000 soilsamples analyzed by Wisconsin soiltesting labs during 1995 through 1999found that soil test phosphorus andpotassium averaged excessively high orhigh, respectively, for most field crops.This means that most growers wouldbe unlikely to see profitable response tomore than recommended amounts of
159
Economics of limeand fertilizer use
Figure 13-1. Wisconsin corn yields from 1866 to 2000.
C H A P T E R
13
Source: United States Department of Agriculture (USDA).
1860 1880 1900 1920 1940 1960 1980 2000
140
120
100
80
60
40
20
0
Gra
in y
ield
(b
u/a
)
C-13 10/18/05 11:18 AM Page 159
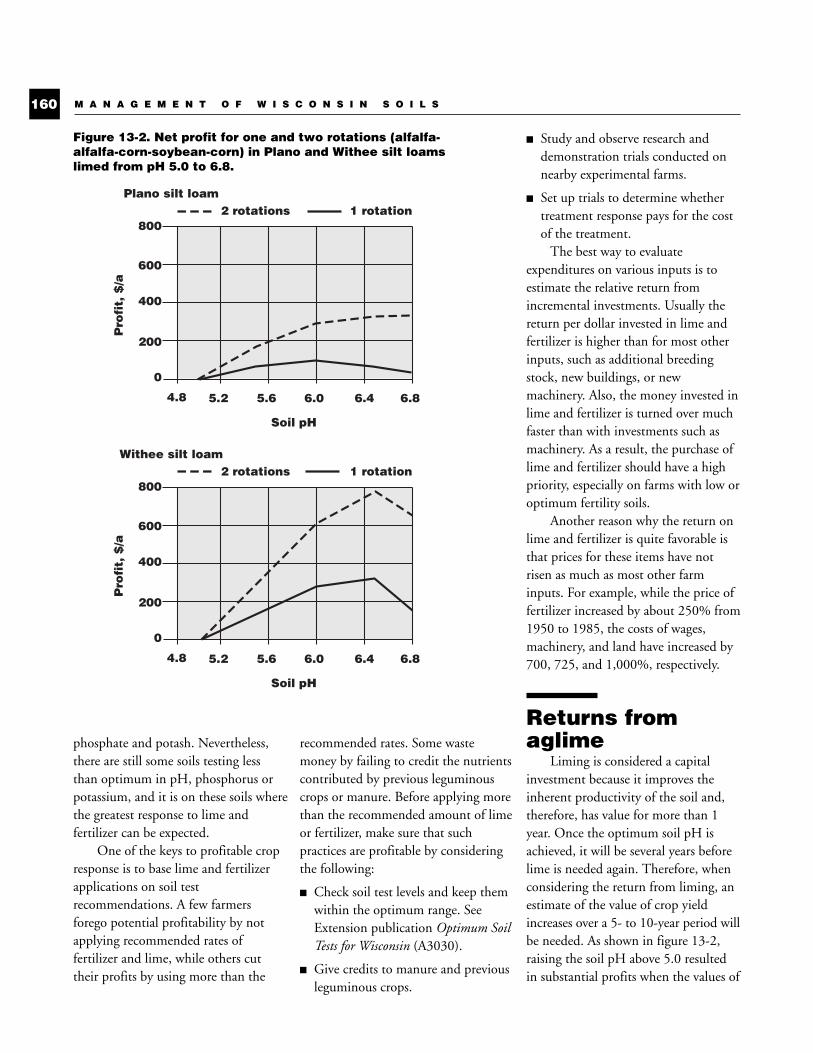
phosphate and potash. Nevertheless,there are still some soils testing lessthan optimum in pH, phosphorus orpotassium, and it is on these soils wherethe greatest response to lime andfertilizer can be expected.
One of the keys to profitable cropresponse is to base lime and fertilizerapplications on soil testrecommendations. A few farmersforego potential profitability by notapplying recommended rates offertilizer and lime, while others cuttheir profits by using more than the
recommended rates. Some wastemoney by failing to credit the nutrientscontributed by previous leguminouscrops or manure. Before applying morethan the recommended amount of limeor fertilizer, make sure that suchpractices are profitable by consideringthe following:
■ Check soil test levels and keep themwithin the optimum range. SeeExtension publication Optimum SoilTests for Wisconsin (A3030).
■ Give credits to manure and previousleguminous crops.
■ Study and observe research anddemonstration trials conducted onnearby experimental farms.
■ Set up trials to determine whethertreatment response pays for the costof the treatment.
The best way to evaluateexpenditures on various inputs is toestimate the relative return fromincremental investments. Usually thereturn per dollar invested in lime andfertilizer is higher than for most otherinputs, such as additional breedingstock, new buildings, or newmachinery. Also, the money invested inlime and fertilizer is turned over muchfaster than with investments such asmachinery. As a result, the purchase oflime and fertilizer should have a highpriority, especially on farms with low oroptimum fertility soils.
Another reason why the return onlime and fertilizer is quite favorable isthat prices for these items have notrisen as much as most other farminputs. For example, while the price offertilizer increased by about 250% from1950 to 1985, the costs of wages,machinery, and land have increased by700, 725, and 1,000%, respectively.
Returns fromaglime
Liming is considered a capitalinvestment because it improves theinherent productivity of the soil and,therefore, has value for more than 1year. Once the optimum soil pH isachieved, it will be several years beforelime is needed again. Therefore, whenconsidering the return from liming, anestimate of the value of crop yieldincreases over a 5- to 10-year period willbe needed. As shown in figure 13-2,raising the soil pH above 5.0 resultedin substantial profits when the values of
M A N A G E M E N T O F W I S C O N S I N S O I L S160
Figure 13-2. Net profit for one and two rotations (alfalfa-alfalfa-corn-soybean-corn) in Plano and Withee silt loamslimed from pH 5.0 to 6.8.
Plano silt loam
Pro
fit,
$/a
Soil pH
2 rotations
4.8
800
600
400
200
0
5.2 5.6 6.0 6.4 6.8
1 rotation
Withee silt loam
Pro
fit,
$/a
Soil pH
2 rotations
4.8
800
600
400
200
0
5.2 5.6 6.0 6.4 6.8
1 rotation
C-13 10/18/05 11:18 AM Page 160
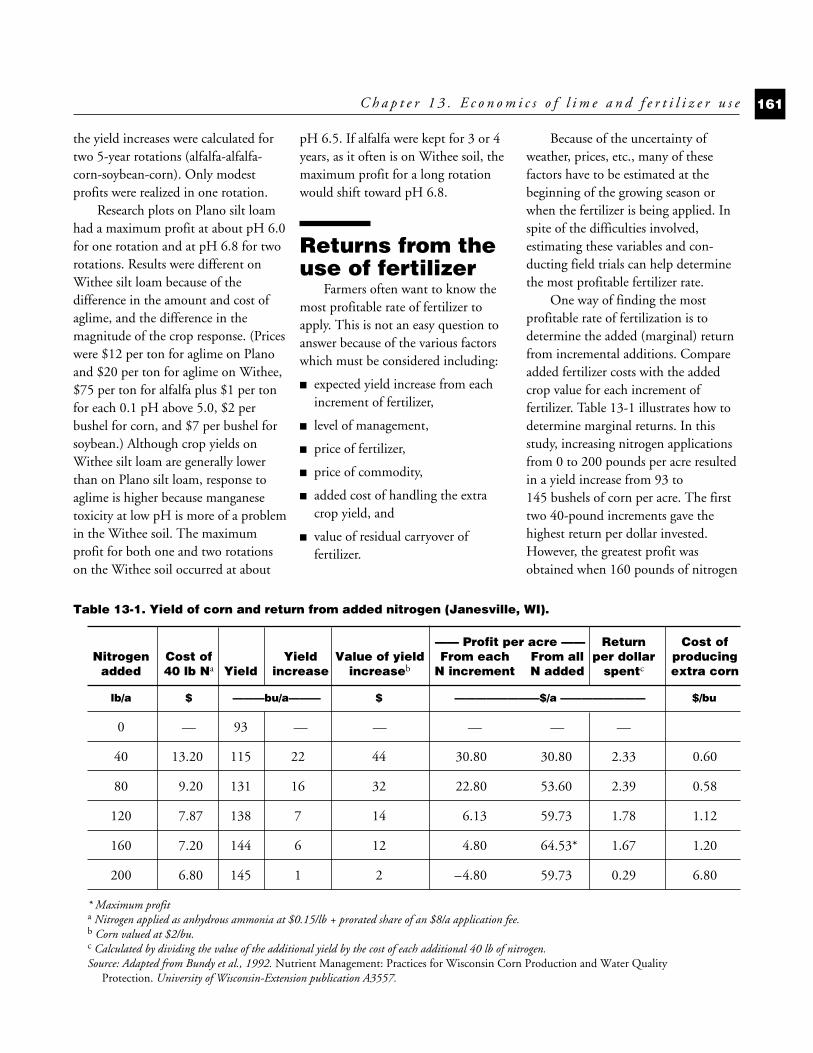
the yield increases were calculated fortwo 5-year rotations (alfalfa-alfalfa-corn-soybean-corn). Only modestprofits were realized in one rotation.
Research plots on Plano silt loamhad a maximum profit at about pH 6.0for one rotation and at pH 6.8 for tworotations. Results were different onWithee silt loam because of thedifference in the amount and cost ofaglime, and the difference in themagnitude of the crop response. (Priceswere $12 per ton for aglime on Planoand $20 per ton for aglime on Withee,$75 per ton for alfalfa plus $1 per tonfor each 0.1 pH above 5.0, $2 perbushel for corn, and $7 per bushel forsoybean.) Although crop yields onWithee silt loam are generally lowerthan on Plano silt loam, response toaglime is higher because manganesetoxicity at low pH is more of a problemin the Withee soil. The maximumprofit for both one and two rotationson the Withee soil occurred at about
pH 6.5. If alfalfa were kept for 3 or 4years, as it often is on Withee soil, themaximum profit for a long rotationwould shift toward pH 6.8.
Returns from theuse of fertilizer
Farmers often want to know themost profitable rate of fertilizer toapply. This is not an easy question toanswer because of the various factorswhich must be considered including:
■ expected yield increase from eachincrement of fertilizer,
■ level of management,
■ price of fertilizer,
■ price of commodity,
■ added cost of handling the extracrop yield, and
■ value of residual carryover offertilizer.
Because of the uncertainty ofweather, prices, etc., many of thesefactors have to be estimated at thebeginning of the growing season orwhen the fertilizer is being applied. Inspite of the difficulties involved,estimating these variables and con-ducting field trials can help determinethe most profitable fertilizer rate.
One way of finding the mostprofitable rate of fertilization is todetermine the added (marginal) returnfrom incremental additions. Compareadded fertilizer costs with the addedcrop value for each increment offertilizer. Table 13-1 illustrates how todetermine marginal returns. In thisstudy, increasing nitrogen applicationsfrom 0 to 200 pounds per acre resultedin a yield increase from 93 to145 bushels of corn per acre. The firsttwo 40-pound increments gave thehighest return per dollar invested.However, the greatest profit wasobtained when 160 pounds of nitrogen
C h a p t e r 1 3 . E c o n o m i c s o f l i m e a n d f e r t i l i z e r u s e 161
Table 13-1. Yield of corn and return from added nitrogen (Janesville, WI).
—— Profit per acre —— Return Cost ofNitrogen Cost of Yield Value of yield From each From all per dollar producing
added 40 lb Na Yield increase increaseb N increment N added spentc extra corn
lb/a $ ———bu/a——— $ ————————$/a ———————— $/bu
0 — 93 — — — — —
40 13.20 115 22 44 30.80 30.80 2.33 0.60
80 9.20 131 16 32 22.80 53.60 2.39 0.58
120 7.87 138 7 14 6.13 59.73 1.78 1.12
160 7.20 144 6 12 4.80 64.53* 1.67 1.20
200 6.80 145 1 2 –4.80 59.73 0.29 6.80
* Maximum profita Nitrogen applied as anhydrous ammonia at $0.15/lb + prorated share of an $8/a application fee.b Corn valued at $2/bu.c Calculated by dividing the value of the additional yield by the cost of each additional 40 lb of nitrogen.Source: Adapted from Bundy et al., 1992. Nutrient Management: Practices for Wisconsin Corn Production and Water Quality
Protection. University of Wisconsin-Extension publication A3557.
C-13 10/18/05 11:18 AM Page 161
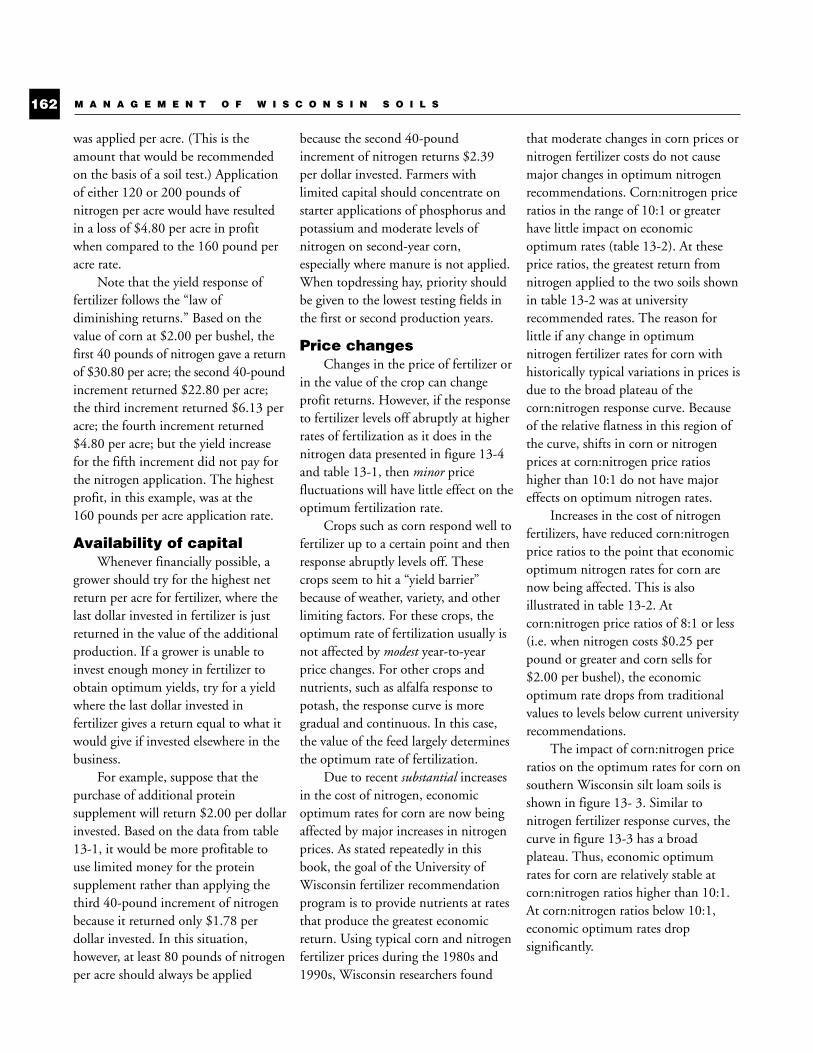
was applied per acre. (This is theamount that would be recommendedon the basis of a soil test.) Applicationof either 120 or 200 pounds ofnitrogen per acre would have resultedin a loss of $4.80 per acre in profitwhen compared to the 160 pound peracre rate.
Note that the yield response offertilizer follows the “law ofdiminishing returns.” Based on thevalue of corn at $2.00 per bushel, thefirst 40 pounds of nitrogen gave a returnof $30.80 per acre; the second 40-poundincrement returned $22.80 per acre;the third increment returned $6.13 peracre; the fourth increment returned$4.80 per acre; but the yield increasefor the fifth increment did not pay forthe nitrogen application. The highestprofit, in this example, was at the160 pounds per acre application rate.
Availability of capital Whenever financially possible, a
grower should try for the highest netreturn per acre for fertilizer, where thelast dollar invested in fertilizer is justreturned in the value of the additionalproduction. If a grower is unable toinvest enough money in fertilizer toobtain optimum yields, try for a yieldwhere the last dollar invested infertilizer gives a return equal to what itwould give if invested elsewhere in thebusiness.
For example, suppose that thepurchase of additional proteinsupplement will return $2.00 per dollarinvested. Based on the data from table13-1, it would be more profitable touse limited money for the proteinsupplement rather than applying thethird 40-pound increment of nitrogenbecause it returned only $1.78 perdollar invested. In this situation,however, at least 80 pounds of nitrogenper acre should always be applied
because the second 40-poundincrement of nitrogen returns $2.39per dollar invested. Farmers withlimited capital should concentrate onstarter applications of phosphorus andpotassium and moderate levels ofnitrogen on second-year corn,especially where manure is not applied.When topdressing hay, priority shouldbe given to the lowest testing fields inthe first or second production years.
Price changesChanges in the price of fertilizer or
in the value of the crop can changeprofit returns. However, if the responseto fertilizer levels off abruptly at higherrates of fertilization as it does in thenitrogen data presented in figure 13-4and table 13-1, then minor pricefluctuations will have little effect on theoptimum fertilization rate.
Crops such as corn respond well tofertilizer up to a certain point and thenresponse abruptly levels off. Thesecrops seem to hit a “yield barrier”because of weather, variety, and otherlimiting factors. For these crops, theoptimum rate of fertilization usually isnot affected by modest year-to-yearprice changes. For other crops andnutrients, such as alfalfa response topotash, the response curve is moregradual and continuous. In this case,the value of the feed largely determinesthe optimum rate of fertilization.
Due to recent substantial increasesin the cost of nitrogen, economicoptimum rates for corn are now beingaffected by major increases in nitrogenprices. As stated repeatedly in thisbook, the goal of the University ofWisconsin fertilizer recommendationprogram is to provide nutrients at ratesthat produce the greatest economicreturn. Using typical corn and nitrogenfertilizer prices during the 1980s and1990s, Wisconsin researchers found
that moderate changes in corn prices ornitrogen fertilizer costs do not causemajor changes in optimum nitrogenrecommendations. Corn:nitrogen priceratios in the range of 10:1 or greaterhave little impact on economicoptimum rates (table 13-2). At theseprice ratios, the greatest return fromnitrogen applied to the two soils shownin table 13-2 was at universityrecommended rates. The reason forlittle if any change in optimumnitrogen fertilizer rates for corn withhistorically typical variations in prices isdue to the broad plateau of thecorn:nitrogen response curve. Becauseof the relative flatness in this region ofthe curve, shifts in corn or nitrogenprices at corn:nitrogen price ratioshigher than 10:1 do not have majoreffects on optimum nitrogen rates.
Increases in the cost of nitrogenfertilizers, have reduced corn:nitrogenprice ratios to the point that economicoptimum nitrogen rates for corn arenow being affected. This is alsoillustrated in table 13-2. Atcorn:nitrogen price ratios of 8:1 or less(i.e. when nitrogen costs $0.25 perpound or greater and corn sells for$2.00 per bushel), the economicoptimum rate drops from traditionalvalues to levels below current universityrecommendations.
The impact of corn:nitrogen priceratios on the optimum rates for corn onsouthern Wisconsin silt loam soils isshown in figure 13- 3. Similar tonitrogen fertilizer response curves, thecurve in figure 13-3 has a broadplateau. Thus, economic optimumrates for corn are relatively stable atcorn:nitrogen ratios higher than 10:1.At corn:nitrogen ratios below 10:1,economic optimum rates dropsignificantly.
M A N A G E M E N T O F W I S C O N S I N S O I L S162
C-13 10/18/05 11:18 AM Page 162
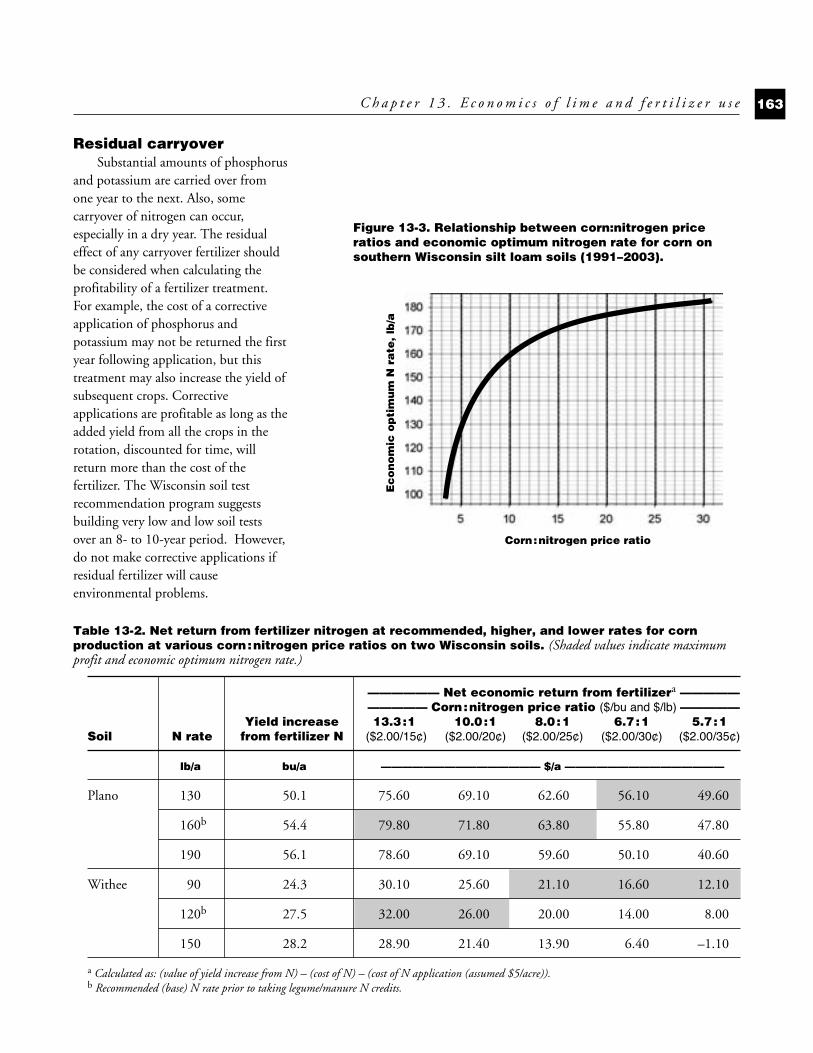
Residual carryoverSubstantial amounts of phosphorus
and potassium are carried over fromone year to the next. Also, somecarryover of nitrogen can occur,especially in a dry year. The residualeffect of any carryover fertilizer shouldbe considered when calculating theprofitability of a fertilizer treatment.For example, the cost of a correctiveapplication of phosphorus andpotassium may not be returned the firstyear following application, but thistreatment may also increase the yield ofsubsequent crops. Correctiveapplications are profitable as long as theadded yield from all the crops in therotation, discounted for time, willreturn more than the cost of thefertilizer. The Wisconsin soil testrecommendation program suggestsbuilding very low and low soil testsover an 8- to 10-year period. However,do not make corrective applications ifresidual fertilizer will causeenvironmental problems.
C h a p t e r 1 3 . E c o n o m i c s o f l i m e a n d f e r t i l i z e r u s e 163
Table 13-2. Net return from fertilizer nitrogen at recommended, higher, and lower rates for cornproduction at various corn:nitrogen price ratios on two Wisconsin soils. (Shaded values indicate maximumprofit and economic optimum nitrogen rate.)
—————— Net economic return from fertilizera —————————— Corn:nitrogen price ratio ($/bu and $/lb) —————
Yield increase 13.3:1 10.0:1 8.0 :1 6.7 :1 5.7 :1 Soil N rate from fertilizer N ($2.00/15¢) ($2.00/20¢) ($2.00/25¢) ($2.00/30¢) ($2.00/35¢)
lb/a bu/a ——————————————— $/a ———————————————
Plano 130 50.1 75.60 69.10 62.60 56.10 49.60
160b 54.4 79.80 71.80 63.80 55.80 47.80
190 56.1 78.60 69.10 59.60 50.10 40.60
Withee 90 24.3 30.10 25.60 21.10 16.60 12.10
120b 27.5 32.00 26.00 20.00 14.00 8.00
150 28.2 28.90 21.40 13.90 6.40 –1.10
a Calculated as: (value of yield increase from N) – (cost of N) – (cost of N application (assumed $5/acre)).b Recommended (base) N rate prior to taking legume/manure N credits.
Figure 13-3. Relationship between corn:nitrogen priceratios and economic optimum nitrogen rate for corn onsouthern Wisconsin silt loam soils (1991–2003).
Ec
on
om
ic o
pti
mu
m N
ra
te, lb
/a
Corn:nitrogen price ratio
C-13 10/18/05 11:18 AM Page 163
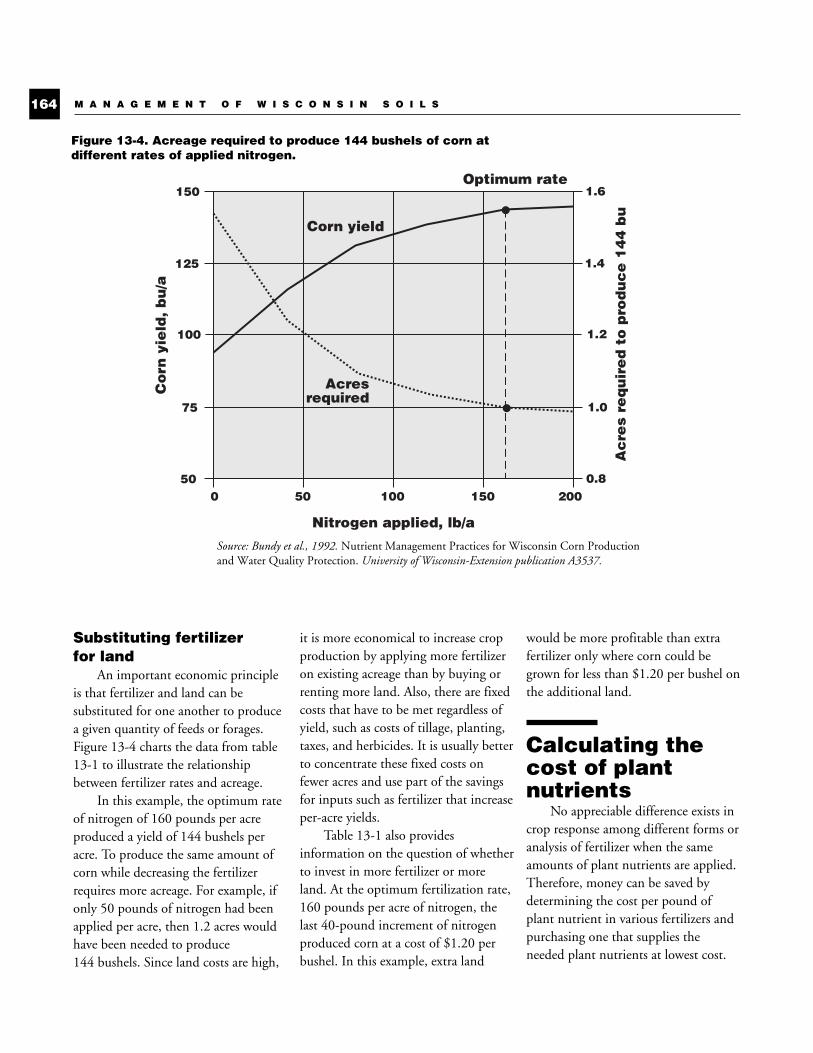
Substituting fertilizer for land
An important economic principleis that fertilizer and land can besubstituted for one another to producea given quantity of feeds or forages.Figure 13-4 charts the data from table13-1 to illustrate the relationshipbetween fertilizer rates and acreage.
In this example, the optimum rateof nitrogen of 160 pounds per acreproduced a yield of 144 bushels peracre. To produce the same amount ofcorn while decreasing the fertilizerrequires more acreage. For example, ifonly 50 pounds of nitrogen had beenapplied per acre, then 1.2 acres wouldhave been needed to produce144 bushels. Since land costs are high,
it is more economical to increase cropproduction by applying more fertilizeron existing acreage than by buying orrenting more land. Also, there are fixedcosts that have to be met regardless ofyield, such as costs of tillage, planting,taxes, and herbicides. It is usually betterto concentrate these fixed costs onfewer acres and use part of the savingsfor inputs such as fertilizer that increaseper-acre yields.
Table 13-1 also providesinformation on the question of whetherto invest in more fertilizer or moreland. At the optimum fertilization rate,160 pounds per acre of nitrogen, thelast 40-pound increment of nitrogenproduced corn at a cost of $1.20 perbushel. In this example, extra land
would be more profitable than extrafertilizer only where corn could begrown for less than $1.20 per bushel onthe additional land.
Calculating thecost of plantnutrients
No appreciable difference exists incrop response among different forms oranalysis of fertilizer when the sameamounts of plant nutrients are applied.Therefore, money can be saved bydetermining the cost per pound ofplant nutrient in various fertilizers andpurchasing one that supplies theneeded plant nutrients at lowest cost.
M A N A G E M E N T O F W I S C O N S I N S O I L S164
Co
rn y
ield
, b
u/a
Nitrogen applied, lb/a
150
125
100
75
500 50 100 150 200
Ac
res
req
uir
ed
to
pro
du
ce
14
4 b
u
Optimum rate1.6
1.4
1.2
1.0
0.8
•
•Acres
required
Corn yield
Figure 13-4. Acreage required to produce 144 bushels of corn atdifferent rates of applied nitrogen.
Source: Bundy et al., 1992. Nutrient Management Practices for Wisconsin Corn Productionand Water Quality Protection. University of Wisconsin-Extension publication A3537.
C-13 10/18/05 11:18 AM Page 164
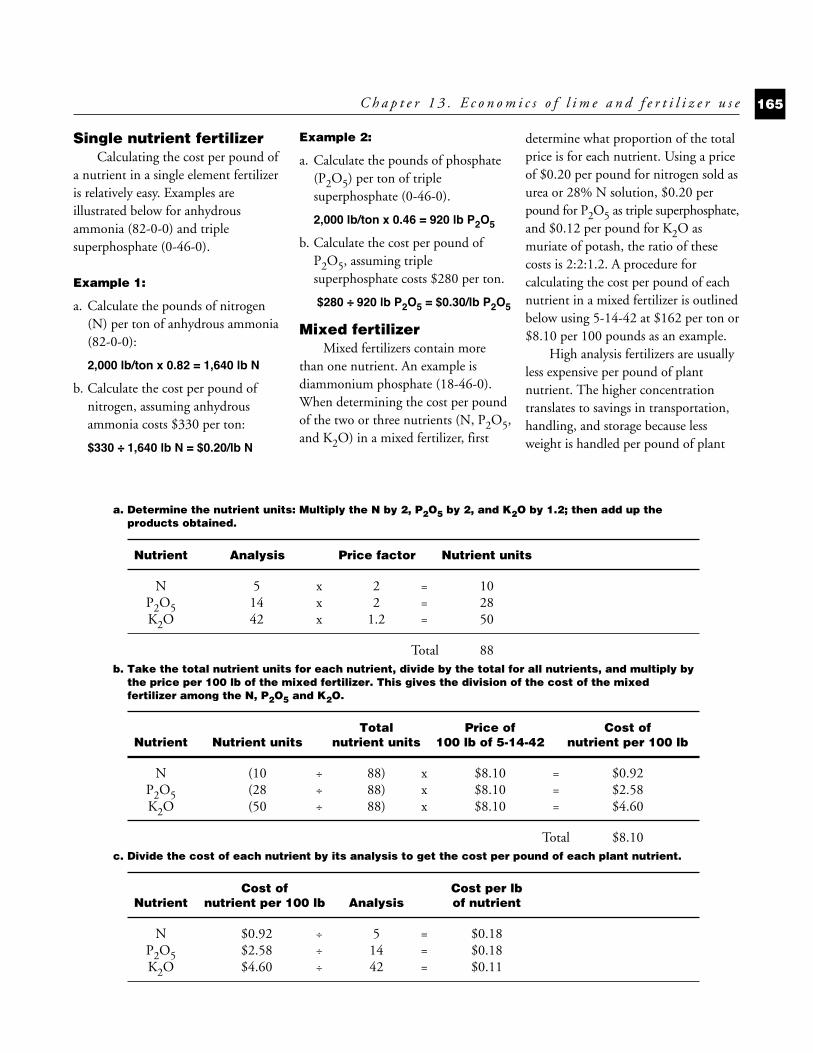
Single nutrient fertilizerCalculating the cost per pound of
a nutrient in a single element fertilizeris relatively easy. Examples areillustrated below for anhydrousammonia (82-0-0) and triplesuperphosphate (0-46-0).
Example 1:
a. Calculate the pounds of nitrogen(N) per ton of anhydrous ammonia(82-0-0):
2,000 lb/ton x 0.82 = 1,640 lb N
b. Calculate the cost per pound ofnitrogen, assuming anhydrousammonia costs $330 per ton:
$330 ÷ 1,640 lb N = $0.20/lb N
Example 2:
a. Calculate the pounds of phosphate(P2O5) per ton of triplesuperphosphate (0-46-0).
2,000 lb/ton x 0.46 = 920 lb P2O5
b. Calculate the cost per pound ofP2O5, assuming triplesuperphosphate costs $280 per ton.
$280 ÷ 920 lb P2O5 = $0.30/lb P2O5
Mixed fertilizerMixed fertilizers contain more
than one nutrient. An example isdiammonium phosphate (18-46-0).When determining the cost per poundof the two or three nutrients (N, P2O5,and K2O) in a mixed fertilizer, first
determine what proportion of the totalprice is for each nutrient. Using a priceof $0.20 per pound for nitrogen sold asurea or 28% N solution, $0.20 perpound for P2O5 as triple superphosphate,and $0.12 per pound for K2O asmuriate of potash, the ratio of thesecosts is 2:2:1.2. A procedure forcalculating the cost per pound of eachnutrient in a mixed fertilizer is outlinedbelow using 5-14-42 at $162 per ton or$8.10 per 100 pounds as an example.
High analysis fertilizers are usuallyless expensive per pound of plantnutrient. The higher concentrationtranslates to savings in transportation,handling, and storage because lessweight is handled per pound of plant
C h a p t e r 1 3 . E c o n o m i c s o f l i m e a n d f e r t i l i z e r u s e 165
a. Determine the nutrient units: Multiply the N by 2, P2O5 by 2, and K2O by 1.2; then add up theproducts obtained.
Nutrient Analysis Price factor Nutrient units
N 5 x 2 = 10P2O5 14 x 2 = 28K2O 42 x 1.2 = 50
Total 88b. Take the total nutrient units for each nutrient, divide by the total for all nutrients, and multiply by
the price per 100 lb of the mixed fertilizer. This gives the division of the cost of the mixedfertilizer among the N, P2O5 and K2O.
Total Price of Cost ofNutrient Nutrient units nutrient units 100 lb of 5-14-42 nutrient per 100 lb
N (10 ÷ 88) x $8.10 = $0.92P2O5 (28 ÷ 88) x $8.10 = $2.58K2O (50 ÷ 88) x $8.10 = $4.60
Total $8.10c. Divide the cost of each nutrient by its analysis to get the cost per pound of each plant nutrient.
Cost of Cost per lbNutrient nutrient per 100 lb Analysis of nutrient
N $0.92 ÷ 5 = $0.18P2O5 $2.58 ÷ 14 = $0.18K2O $4.60 ÷ 42 = $0.11
C-13 10/18/05 11:18 AM Page 165
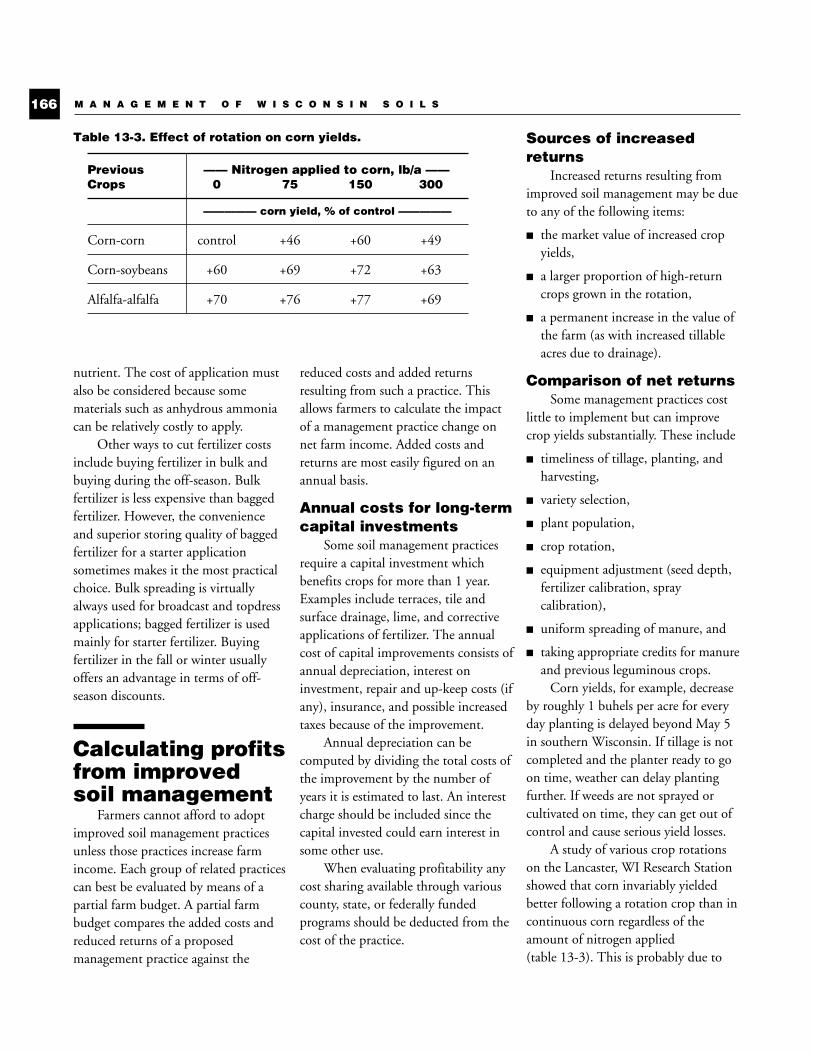
nutrient. The cost of application mustalso be considered because somematerials such as anhydrous ammoniacan be relatively costly to apply.
Other ways to cut fertilizer costsinclude buying fertilizer in bulk andbuying during the off-season. Bulkfertilizer is less expensive than baggedfertilizer. However, the convenienceand superior storing quality of baggedfertilizer for a starter applicationsometimes makes it the most practicalchoice. Bulk spreading is virtuallyalways used for broadcast and topdressapplications; bagged fertilizer is usedmainly for starter fertilizer. Buyingfertilizer in the fall or winter usuallyoffers an advantage in terms of off-season discounts.
Calculating profitsfrom improvedsoil management
Farmers cannot afford to adoptimproved soil management practicesunless those practices increase farmincome. Each group of related practicescan best be evaluated by means of apartial farm budget. A partial farmbudget compares the added costs andreduced returns of a proposedmanagement practice against the
reduced costs and added returnsresulting from such a practice. Thisallows farmers to calculate the impactof a management practice change onnet farm income. Added costs andreturns are most easily figured on anannual basis.
Annual costs for long-termcapital investments
Some soil management practicesrequire a capital investment whichbenefits crops for more than 1 year.Examples include terraces, tile andsurface drainage, lime, and correctiveapplications of fertilizer. The annualcost of capital improvements consists ofannual depreciation, interest oninvestment, repair and up-keep costs (ifany), insurance, and possible increasedtaxes because of the improvement.
Annual depreciation can becomputed by dividing the total costs ofthe improvement by the number ofyears it is estimated to last. An interestcharge should be included since thecapital invested could earn interest insome other use.
When evaluating profitability anycost sharing available through variouscounty, state, or federally fundedprograms should be deducted from thecost of the practice.
Sources of increasedreturns
Increased returns resulting fromimproved soil management may be dueto any of the following items:
■ the market value of increased cropyields,
■ a larger proportion of high-returncrops grown in the rotation,
■ a permanent increase in the value ofthe farm (as with increased tillableacres due to drainage).
Comparison of net returnsSome management practices cost
little to implement but can improvecrop yields substantially. These include
■ timeliness of tillage, planting, andharvesting,
■ variety selection,
■ plant population,
■ crop rotation,
■ equipment adjustment (seed depth,fertilizer calibration, spraycalibration),
■ uniform spreading of manure, and
■ taking appropriate credits for manureand previous leguminous crops.
Corn yields, for example, decreaseby roughly 1 buhels per acre for everyday planting is delayed beyond May 5in southern Wisconsin. If tillage is notcompleted and the planter ready to goon time, weather can delay plantingfurther. If weeds are not sprayed orcultivated on time, they can get out ofcontrol and cause serious yield losses.
A study of various crop rotationson the Lancaster, WI Research Stationshowed that corn invariably yieldedbetter following a rotation crop than incontinuous corn regardless of theamount of nitrogen applied(table 13-3). This is probably due to
M A N A G E M E N T O F W I S C O N S I N S O I L S166
Table 13-3. Effect of rotation on corn yields.
Previous —— Nitrogen applied to corn, lb/a ——Crops 0 75 150 300
————— corn yield, % of control —————
Corn-corn control +46 +60 +49
Corn-soybeans +60 +69 +72 +63
Alfalfa-alfalfa +70 +76 +77 +69
C-13 10/18/05 11:18 AM Page 166
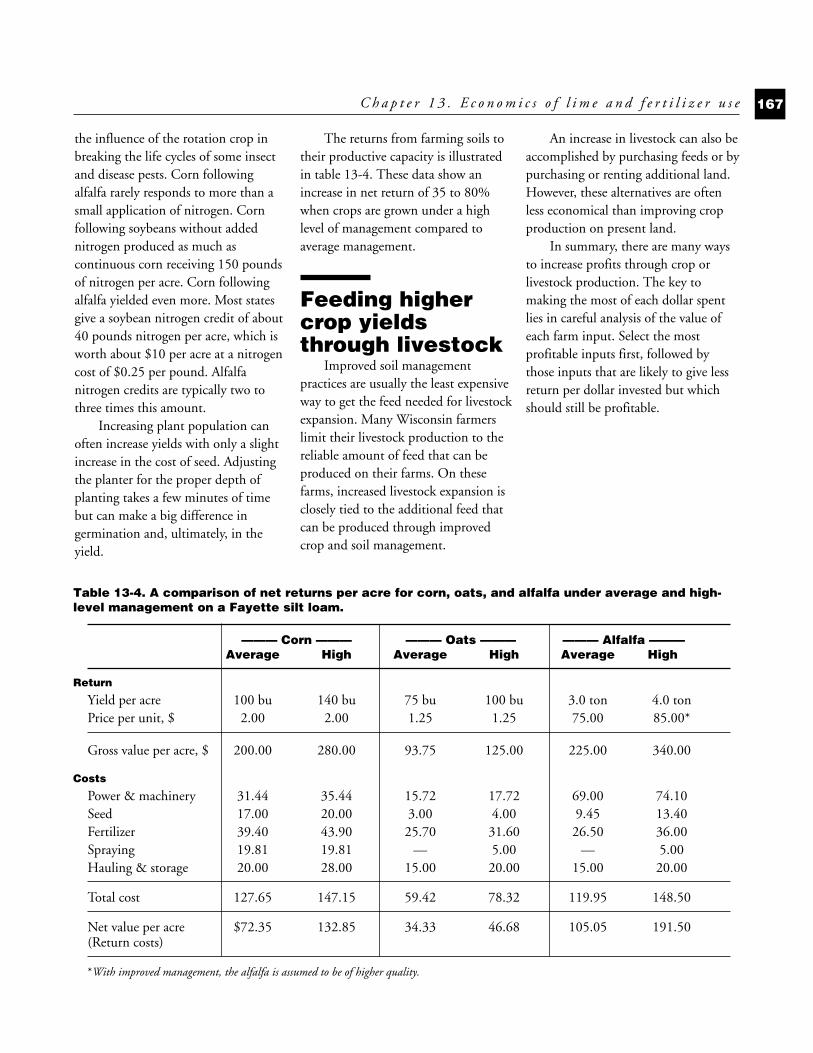
the influence of the rotation crop inbreaking the life cycles of some insectand disease pests. Corn followingalfalfa rarely responds to more than asmall application of nitrogen. Cornfollowing soybeans without addednitrogen produced as much ascontinuous corn receiving 150 poundsof nitrogen per acre. Corn followingalfalfa yielded even more. Most statesgive a soybean nitrogen credit of about40 pounds nitrogen per acre, which isworth about $10 per acre at a nitrogencost of $0.25 per pound. Alfalfanitrogen credits are typically two tothree times this amount.
Increasing plant population canoften increase yields with only a slightincrease in the cost of seed. Adjustingthe planter for the proper depth ofplanting takes a few minutes of timebut can make a big difference ingermination and, ultimately, in theyield.
The returns from farming soils totheir productive capacity is illustratedin table 13-4. These data show anincrease in net return of 35 to 80%when crops are grown under a highlevel of management compared toaverage management.
Feeding highercrop yieldsthrough livestock
Improved soil managementpractices are usually the least expensiveway to get the feed needed for livestockexpansion. Many Wisconsin farmerslimit their livestock production to thereliable amount of feed that can beproduced on their farms. On thesefarms, increased livestock expansion isclosely tied to the additional feed thatcan be produced through improvedcrop and soil management.
An increase in livestock can also beaccomplished by purchasing feeds or bypurchasing or renting additional land.However, these alternatives are oftenless economical than improving cropproduction on present land.
In summary, there are many waysto increase profits through crop orlivestock production. The key tomaking the most of each dollar spentlies in careful analysis of the value ofeach farm input. Select the mostprofitable inputs first, followed bythose inputs that are likely to give lessreturn per dollar invested but whichshould still be profitable.
C h a p t e r 1 3 . E c o n o m i c s o f l i m e a n d f e r t i l i z e r u s e 167
Table 13-4. A comparison of net returns per acre for corn, oats, and alfalfa under average and high-level management on a Fayette silt loam.
——— Corn ——— ——— Oats ——— ——— Alfalfa ———Average High Average High Average High
Return
Yield per acre 100 bu 140 bu 75 bu 100 bu 3.0 ton 4.0 tonPrice per unit, $ 2.00 2.00 1.25 1.25 75.00 85.00*
Gross value per acre, $ 200.00 280.00 93.75 125.00 225.00 340.00
Costs
Power & machinery 31.44 35.44 15.72 17.72 69.00 74.10Seed 17.00 20.00 3.00 4.00 9.45 13.40Fertilizer 39.40 43.90 25.70 31.60 26.50 36.00Spraying 19.81 19.81 — 5.00 — 5.00Hauling & storage 20.00 28.00 15.00 20.00 15.00 20.00
Total cost 127.65 147.15 59.42 78.32 119.95 148.50
Net value per acre $72.35 132.85 34.33 46.68 105.05 191.50(Return costs)
*With improved management, the alfalfa is assumed to be of higher quality.
C-13 10/18/05 11:18 AM Page 167
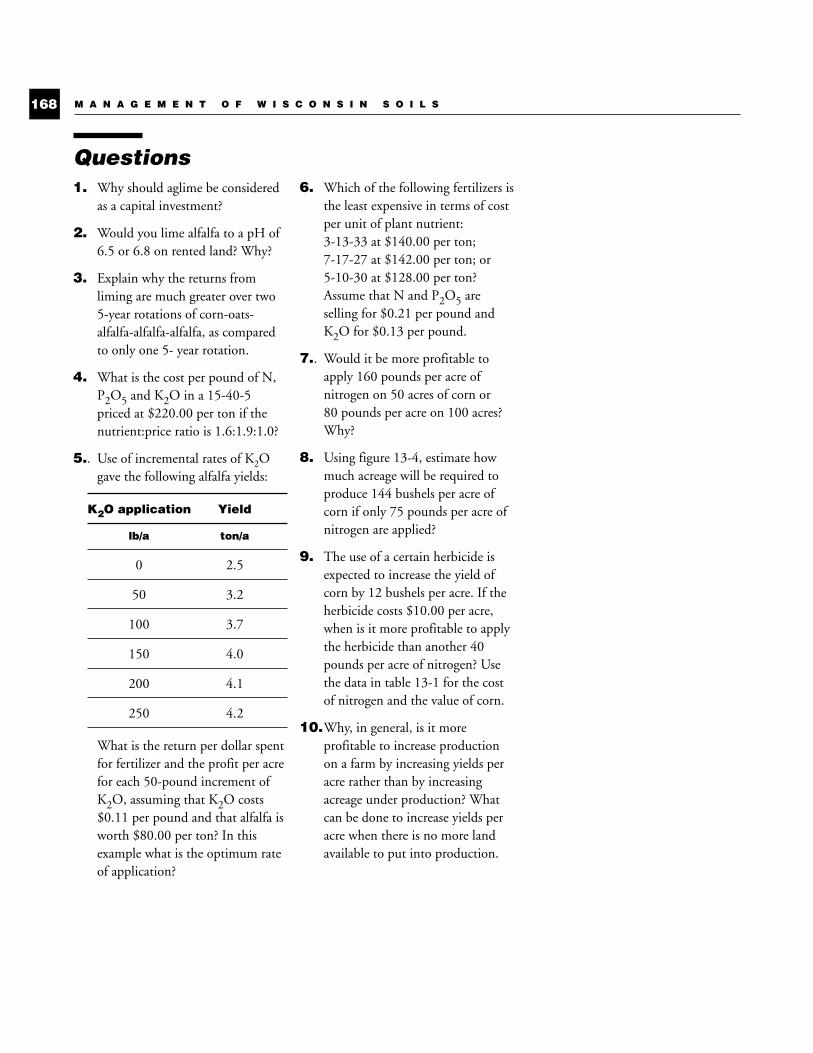
Questions1. Why should aglime be considered
as a capital investment?
2. Would you lime alfalfa to a pH of6.5 or 6.8 on rented land? Why?
3. Explain why the returns fromliming are much greater over two5-year rotations of corn-oats-alfalfa-alfalfa-alfalfa, as comparedto only one 5- year rotation.
4. What is the cost per pound of N,P2O5 and K2O in a 15-40-5priced at $220.00 per ton if thenutrient:price ratio is 1.6:1.9:1.0?
5.. Use of incremental rates of K2Ogave the following alfalfa yields:
K2O application Yield
lb/a ton/a
0 2.5
50 3.2
100 3.7
150 4.0
200 4.1
250 4.2
What is the return per dollar spentfor fertilizer and the profit per acrefor each 50-pound increment ofK2O, assuming that K2O costs$0.11 per pound and that alfalfa isworth $80.00 per ton? In thisexample what is the optimum rateof application?
6. Which of the following fertilizers isthe least expensive in terms of costper unit of plant nutrient: 3-13-33 at $140.00 per ton; 7-17-27 at $142.00 per ton; or 5-10-30 at $128.00 per ton?Assume that N and P2O5 areselling for $0.21 per pound andK2O for $0.13 per pound.
7.. Would it be more profitable toapply 160 pounds per acre ofnitrogen on 50 acres of corn or80 pounds per acre on 100 acres?Why?
8. Using figure 13-4, estimate howmuch acreage will be required toproduce 144 bushels per acre ofcorn if only 75 pounds per acre ofnitrogen are applied?
9. The use of a certain herbicide isexpected to increase the yield ofcorn by 12 bushels per acre. If theherbicide costs $10.00 per acre,when is it more profitable to applythe herbicide than another 40pounds per acre of nitrogen? Usethe data in table 13-1 for the costof nitrogen and the value of corn.
10.Why, in general, is it moreprofitable to increase productionon a farm by increasing yields peracre rather than by increasingacreage under production? Whatcan be done to increase yields peracre when there is no more landavailable to put into production.
M A N A G E M E N T O F W I S C O N S I N S O I L S168
C-13 10/18/05 11:18 AM Page 168
Aacid rain, 53actinomycetes, 51, 67adhesion, 24aeolian silts, 2aglime, 17
application timing, 62–63crop response from, 160neutralizing index, 59–60recommendations, 59–61, 145–47, 153returns from, 160–61substitutes for, 114See also liming and pH
algae, 66, 127alkaline soils, 63–64alluvial soils, 2aluminum sulfate, 63aluminum, 53, 55, 56, 63–64, 73, 86,
87, 153, 155ammonia, 78, 82–84, 126ammonification, 80anions, 73arthropods, 66atoms, 73available water, 22, 25
Bbacteria, 15, 66bedrock geology, 1Bedrock Geology of Wisconsin (map
insert), following 2biological inoculants and activators,
118–19biosolids, 113–14, 131–34blue baby syndrome, 121bogs, 2boron, 51, 72, 97–98, 100, 150–52buffer capacity, 142, 144, 146buffer strips, 45–46bulk density, 12, 18, 32–33, 38, 39
Ccadmium, 73, 113, 132, 133–34calcium carbonate
equivalent, 51, 52, 58–60,free, 63, 94insoluble salt, 74precipitates, 4, 68
calcium, 17, 50, 72, 92–93, 100, 148calcium/magnesium ratios, 92–93capability classes, 8–9capillary water, 26carbon
carbon:nitrogen ratio, 16, 116cycle, 65, 67–68levels in soil, 16plant analysis and, 153reservoirs, 68sources, 71, 72use by organisms, 67, 68, 154
carbon dioxideand formation of carbonic acid, 68and respiration, 68in atmosphere, 67in organic matter and crop residues,
4, 15, 81, 95, 141in soils, 26, 32, 52, 68reaction with lime, 58secretion by roots, 69, 74–75solubility in water, 68use by organisms, 27, 66, 67, 71, 77
cation exchange capacity (CEC), 51, 75cations, 73chelates, 4, 75chemical reactions in soil, 4chloride, 74, 91, 99, 100, 101chlorine, 51, 72, 99, 100, 153climate and soil formation, 2cobalt, 73, 131cohesion, 24colloid, 90–91complexation, 4conservation practices, 43–46
copper, 72, 99, 100, 150–52cover crop, to control erosion, 43, 45,
47, 129crop demand categories, 142crop residue, 3, 14, 15, 29–30, 33, 37,
38, 81crop rotation, 43–44, 62, 166crustaceans, 66
Ddenitrification, 39, 80–81deposition, 42, 53, 95diversions, soil, 7, 9, 43, 45, 129dolomitic limestone, 17, 58, 93, 148drainage systems, 7DRIS (Diagnosis and Recommendation
Integrated System), 155–57
Eearthworms, 15, 33, 66, 69economics, 145, 159–67elements
chemical, 73essential, 71–72non-essential, 73, 131–34trace, 71See also nutrients
eluviation, 3epsom salts, 94, 96, 148erosion
by tillage, 41, 47by water, 3, 7, 8, 41–48by wind, 3, 12, 45, 46–47control, 129estimating soil loss, 41, 46factors influencing, 43tolerable soil loss (T) values, 41–42,
112, 131eutrophication, 127evapotranspiration, 22–23, 27exudates, root, 69
169
Index
Index (qx) 10/18/05 11:19 AM Page 169
FFeDDHA, 99, 152feldspar, 4, 16, 17, 89, 90, 92fertigation, 107fertilizer
analysis, 101application methods, 85, 103–7, 138calculating nutrient costs, 164–66commercial forms, 101–3grades, 101–3liquid versus dry, 102–3starter, 102, 103–105use, economics of, 159–67
field moisture capacity, 25filter strips, 45–46fish, as soil amendment, 117590 nutrient management standard,
112–13, 131fixation
manganese, 98nitrogen, 50, 55, 73, 78–79, 99, 118phosphorus, 86, 104, 143potassium, 91, 143
fly ash, 59fungi, 51, 67
Gglacial action, 1gleization, 3grass tetany, 93gravitational water, 22, 25Groundwater Contamination
Susceptibility in Wisconsin (mapinsert), following 122
groundwater, 22, 27, 81, 107, 121–27,130
growth regulators, as soil amendments,119
gypsum, 58, 93, 116–17
Hheavy metals, 113, 131–34humification, 3humus, 2, 15, 19, 38, 79hydrologic cycle, 21–22hydrolysis, 4hypomagnesia, 93
IIce Age Deposits of Wisconsin (map
insert), following 2illuviation, 3indoleacetic acid, 98ions, 73iron, 19, 51, 63, 72, 99, 100, 150, 152irrigation scheduling, 27, 126
Kkiln dust, 59Know How Much You Haul! (insert),
following 112
LLactobacillus bacteria, 119land capability classes, 8–9laterization, 3law of diminishing returns, 162law of the minimum, 71leaching, 3, 51, 81lead, 73, 113, 132–34legumes, 68liming
benefits of, 55–58deep plowing, 63materials, 58–59See also aglime and pH
loess, 2
Mmagnesium, 17, 50, 72, 93–94, 100, 148manganese, 51, 63, 72, 98, 100, 150–52manure
calibrating spreaders, 112, 131estimating application rates, credits, 112management guidelines, 112, 126,
128–29nitrogen credits, 84nutrient availability and content, 84,
89, 92, 109–11 , 125nutrient credits, 110–12, 125phosphorus credits, 88–89potassium credits, 91–92soil amendment, benefits, 109–10storage facilities, 126sulfur credits, 96, 97
marl, 58, 94, 140, 148mercury, 73, 113, 132–33methemoglobinemia, 121mica, 16, 17, 89microbial activity, 75, 81micronutrients, 71–72, 97–99, 150–52mineral
matter, 25, 73nutrient sources, as soil amendments,
117primary, 116secondary, 116soils, 2, 16–18weathering, 12
mineralization, 3, 69, 87mollusks, 66molybdenosis, 99molybdenum, 51, 72, 99, 100, 150–53montmorillonite, 18muck soils, 2muriate of potash, 91, 165mycorrhiza, 67
Nnematodes, 66neutralizing index (NI), 59–61, 146nickel, 51, 72, 99nitrate tests, 123–24, 125nitrate-nitrogen, 79–81, 121–26nitrification inhibitors, 81, 85, 126, 127nitrogen
ammonification, 80availability, 50best management practices, 122–27credits, 80, 84, 125, 127cycle in soils, 78deficiency symptoms, 78denitrification, 80–81fertilizer materials, 82–84fixation, 78–79function in plants, 78immobilization, 81in biosolids, 114in groundwater, 121–22leaching, 81, 100, 122, 124, 125, 126mineralization, 3, 69, 87nitrification, 80nitrification inhibitors, 81, 85, 126, 127reactions in soils, 79–82recovery in corn, 122residual carryover, 123–24, 163returns from, 161–62
M A N A G E M E N T O F W I S C O N S I N S O I L S170
Index (qx) 10/18/05 11:19 AM Page 170
soil test recommendations, 141–42sources, 82–84timing of applications, 85–86,
125–26, 127volatilization, 81–82, 127
nutrient managementcrediting, 130590 standard, 112–13, 131plan, 130–31
nutrients amounts harvested, by crop, 143calculating costs, 164–66chelated, 75complexed, 75exchangeable, 74–75micro-, 71–72, 97–99, 150–52primary, 71–72reservoir, 74–75runoff, 127secondary, 71–72, 92–96, 147–49solubility, 75–76sources, 74–107susceptibility to leaching, 100See also elements
Oorganic matter, 2, 12, 15–16, 19, 25
and nutrient availability, 74, 90and soil erosion, 43and soil texture, 12decomposition of, 2, 69, 75, 87defined, 2in conservation tillage systems, 33
orthophosphate, 88oxidation, 4, 19, 51, 53oxides, 16–17, 19oxygen
depletion, 115, 121, 127in soil air, 2, 26, 39, 65, 71, 75, plant requirements, 68, 71, 72, 77, role in oxidation, 19
Ppaper mill lime sludge, 58, 59, 93, 109,
116, 140, 148parent materials, 1, 51PASS (Plant Analysis with Standardized
Scores), 157peat, 2, 19peds, 14
perched water table, 26percolation, 3, 22, 80, 100, 120, 127permanent wilting percentage, 25, 27pH
adjusting, 55–64and nutrient availability, 50–51buffer pH, 60–61, 146defined, 49fertilizers and, 52effect on yield, 55–58importance of, 50optimum crop levels, 53–55, 160See also aglime and liming
phosphorusavailability, 50best management practices, 130conversion factor, 101credits, 127–28deficiency symptoms, 86effect on yield, 88erosion control, 129fertilizer materials, 87–88fixation, 74, 86–87function in plants, 86index, 129–30in surface water, 127–30levels in soil, 72, 159–60methods of application, 89mineralization, 87reactions in soils, 86–87residual carryover, 163soil test recommendations, 142–47solubility, 75, 86–88, 100
photosynthesis, 21, 27, 67, 98, 99plant analysis, 153–57plant stimulants, as soil amendment, 119plow depth, 31, 32plow pan, 15polarity, 24polyphosphate, 88potassium
availability, 50, 90, 100conversion factor, 101 deficiency symptoms, 89fertilizer materials, 91function in plants, 89 levels in soil, 72, 159–60manure nutrient credits, 89reactions in soils, 90–91residual carryover, 163soil test recommendations, 142–47sources, 91–92
prairie soils, 2, 5, 144
precipitation as source of nutrients, 72, 82, 84, 96,
148–49atmospheric, 2, 21–22, 124, 125, 128, chemical, 4, 107,
preplant soil profile nitrate test, 123–24pre-sidedress nitrate test, 124, 125protozoa, 66pyrophosphate, 88pyroxene, 17, 92, 93
Qquartz, 16, 17
Rreserve acidity, 53, 60–61, 146residue
decomposition, 81estimating, 37management, 30, 32, 38, 43, 47surface, 31, 33–34
Rhizobium bacteria, 50, 55, 68, 78–79,118
rhizosphere, 69
Ssalinization, 3salts
defined, 73–74 injury, 104
seaweed, as soil amendment, 117sediment, 7, 41, 43, 46–47, 112, 129, seedbed, 12, 14, 18, 29–30, 31, 34, 44selenium, 73, 131sewage sludge, 113–14, 131–34silicates, 16–18sodium, 73, 153soil
aggregates, 2, 13, 14, 25, 29, 33, 38, 42, 43, 67, 116
classification, 4–5color, 19compaction, 14, 38, 40crusting, 38defined, 1depth, 7drainage, 7fauna, 66flora, 66–67
I n d e x 171
Index (qx) 10/18/05 11:19 AM Page 171
horizons, 4–5names, 5particles, 12, 14, 17, 22, 25pores, 18, 22, 24–26, 32, 33, 39, 45profiles, 5slope, 7solution, 74structure, 12, 14–15temperature, 19, 22, 32, 33texture, 11–13, 18
soil acidity, 49–53soil amendments
biosolids (sewage sludge), 113–14carbon to nitrogen ratios, 116tdefined, 109gypsum (wallboard), 116–17manure, 109–13non-traditional, 117–19organic, 109–16
soil buffering capacity, 142–44soil conditioners, as soil amendment, 117soil conservation
government agencies, 47plans, 131practices, 43–48
soil fertility, 76soil formation, 1–4soil maps, 5–6, 8
developing conservation plans and, 6soil nitrate tests, 123–24, 125, 127soil organisms, 2, 65–69Soil Regions of Wisconsin (map insert),
following 6soil survey reports, 6soil testing laboratories, 139soil tests
collecting samples, 136–39interpretations, 140recommendations, 141–53report, 150–52responsive versus nonresponsive fields,
136–38with plant analysis, 153yield goals, 145
soil types, 2soil water, 21–27, 32, 33stratification of nutrients, 33strip cropping, 45subsoil fertility groups, 143, 144subsoils, 14–15sulfur, 51, 72, 94–96, 97, 100, 148–49sulfur availability index (SAI), 149surfactants, as soil amendment, 118symbiosis, 68, 78–79
Tterraces, 45textural classes of soil, 11tile drainage, 7tillage, 15, 16, 19, 29–40
deep, 34, 63depth, 38effect on nutrient availability, 39–40primary, 30–31, 34purpose, 29secondary, 31
tillage implements, 30, 32–34chisel plow, 34–36cultivators, 34disk, 30, 34–36moldboard plow, 30–31, 35–36spring-tooth harrow, 31
tillage systems, 29, 39comparison of, 35–36conservation, 30, 31–34, 44contour, 44–45conventional, 30–31, 39mulch till, 33–34no-till, 33, 35–36, 38, 39reduced, 30, 39ridge-till, 33, 35–36, 38, 39strip-till, 33, 35–36, 38, 45subsoiler, 38
tilth, 12, 18, 31tissue testing, 157topography, 1, 3, 129transpiration, 22, 25
UUAN, 82–83urea, 84–85urease inhibitors, 85, 127
Vvadose zone, 22vermiculite, 17, 93volatilization
of nitrogen, 78, 81–82, 83, 106, 110, 127
of sulfur, 95
Wwater conservation
government agencies, 47practices, 43–48
water table, perched, 26water, soil, 21–27, 32, 33water-use efficiency, 24waterways, 45weathering and soil formation, 3–4wetting agent, as soil amendment, 118whey, as soil amendment, 114–15white muscle disease, 131wilt, incipient, 27wood ash, 58, 59
Yyield barrier, 162
Zzinc, 51, 72, 98, 100, 150–52
M A N A G E M E N T O F W I S C O N S I N S O I L S172
Index (qx) 10/18/05 11:19 AM Page 172

TOC-FM 10/20/05 10:07 AM Page 2
Copyright © 2005 by the Board of Regents of the University of Wisconsin System doing business as the division ofCooperative Extension of the University of Wisconsin-Extension. Send inquiries about copyright permission to: Manager,Cooperative Extension Publishing, 432 N. Lake St., Rm. 103, Madison, WI 53706.
Authors: E.E. Schulte, L.M. Walsh, and K.A. Kelling, professors emeriti of soil science; L.G. Bundy and W.L. Bland,professors of soil science; R.P. Wolkowski, Extension soil scientist; J.B Peters, director, University of Wisconsin Soil TestingLaboratories; and S.J. Sturgul, nutrient management specialist. All hold joint appointments with the College of Agriculturaland Life Sciences, University of Wisconsin-Madison and University of Wisconsin-Extension, Cooperative Extension.
Produced by Cooperative Extension Publications, University of Wisconsin-Extension. L.G. Deith, editor; S.A. Anderson,designer. Cover photo by B.W. Hoffmann, Life Sciences Communication.
This material is based upon work supported in part by the Cooperative State Research, Education, and Extension Service,U.S. Department of Agriculture under Agreement No. 2002-51130-01950. Any opinions, findings, conclusions, orrecommendations expressed in this publication are those of the authors and do not necessarily reflect the view of the U.S.Department of Agriculture.
University of Wisconsin-Extension, Cooperative Extension, in cooperation with the U.S. Department of Agricultureand Wisconsin counties, publishes this information to further the purpose of the May 8 and June 30, 1914 Acts ofCongress; and provides equal opportunities and affirmative action in employment and programming.
This publication is available from your Wisconsin county Extension office or from Cooperative ExtensionPublications. To order, call toll-free 877-947-7827 or visit cecommerce.uwex.edu.
A3588 Management of Wisconsin Soils R-10-2005-1.5M
TOC-FM 10/20/05 10:07 AM Page 11