Embed Size (px)
DESCRIPTION
Management Practices in Europe, the US and Emerging Markets. Nick Bloom (Stanford Economics) John Van Reenen (Stanford GSB) Lecture 5: May 21 st 2009. Management research in India. Management practices in healthcare. 2. Management is worse in developing countries. - PowerPoint PPT Presentation
Citation preview

Nick Bloom and John Van Reenen, Management Practices, Spring 2009 1
Management Practices in Europe, the US and Emerging Markets
Nick Bloom (Stanford Economics)John Van Reenen (Stanford GSB)
Lecture 5: May 21st 2009

Nick Bloom and John Van Reenen, Management Practices, Spring 2009 2
Management practices in healthcare
Management research in India

2.6 2.8 3 3.2 3.4mean of management
USGermanySweden
JapanCanadaFrance
ItalyGreat Britain
AustraliaNorthern Ireland
PolandRepublic of Ireland
PortugalBrazilIndia
ChinaGreece
Management is worse in developing countries
Average Country Management Score, firms 100 to 5000 employees(score using Bloom and Van Reenen (2007) methodology)

0.5
10
.51
0.5
10
.51
1 2 3 4 5 1 2 3 4 5 1 2 3 4 5 1 2 3 4 5
Australia Brazil Canada China
France Germany Great Britain Greece
India Ireland Italy Japan
Poland Portugal Sweden US
De
nsi
ty
managementGraphs by country1
The tails drive much of the lower developing average
Firm-Level Management Scores

This raises three linked questions
• What is the impact – if any – of bad management on firm (and ultimately national) productivity?
• If management does matter, why are some firms badly managed?
• If management does matter and some firms are badly managed, what policies could improve management?

To address these questions we ran management experiments in India
• Prior research provides evidence that management is important for productivity
• But hard to confirm causality without field experiments
• Because of the cost of doing field experiments no prior work with medium or large firms. Only with micro entrepreneurs.
• Our approach has been to work with a small sample of large firms and collect detailed data across metrics and time

The experiment randomizes a management shock
• Select 16 plants in Indian fabric firms with ave 250 employees–Textiles is the largest Indian manufacturing industry–These firms are big enough to need formalized management
• Within this group we randomly select eight matched pairs:– 8 treatment plants, given extensive free consulting– 8 control plants, given very light consulting
• Firms selected according to –Size (100 to 1000 employees)–Location (near Mumbai and within 1 hour of each other)–Data (have sufficient pre-intervention data)–Agreement (CEOs & PMs agree to free consulting)

0.2
.4
.6
.8
1
De
nsity
1 2 3 4 5management
Textile firms in India have similar management scores to the rest of manufacturing in India
0.2
.4
.6
De
nsity
1 2 3 4 5management
All manufacturing except textiles
N=424, mean=2.67, sd=0.664 (within SIC2)
Textiles (SIC2==2), N=96, mean=2.69, sd=0.548
Management scores
Management scores

Two stage project timing
• Started with a pilot wave on 6 firms in August 2008
• Started main wave on 16 firms in April 2009
• Today I am going to present data from the pilot wave
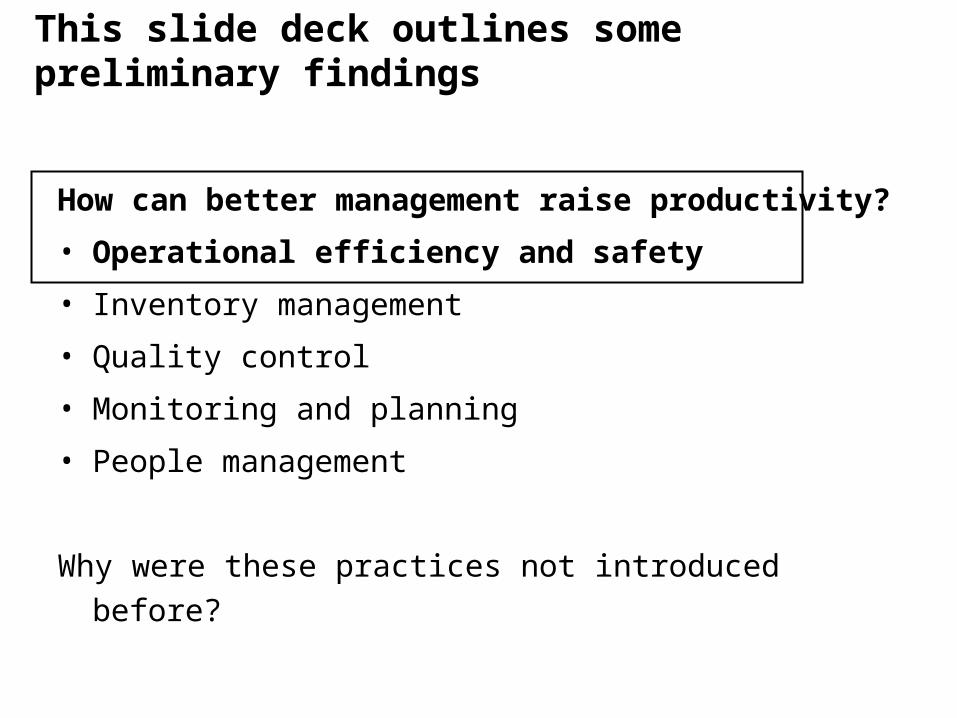
How can better management raise productivity?
• Operational efficiency and safety
• Inventory management
• Quality control
• Monitoring and planning
• People management
Why were these practices not introduced before?
This slide deck outlines some preliminary findings

Many parts of the factories are dirty and unsafe

The factories are also disorganized
Instrument not
removed after use, blocking hallway.
Cotton lying on the floor Instrument blocking the hallway
Oil leaking
from the machine

Tools lying on the floor.
Extremely dirty machine parts
And machinery and tools are not maintained (which leads to frequent production downtime)

The treated firms have started to introduce basic initiatives (called “5S”) to organize the factory
Worker involved in 5S initiative on the shop floor, marking out the area
around the model machine
Snag tagging to identify the abnormalities on & around the machines, such as
redundant materials, broken equipment, or accident areas. The operator and the maintenance team is responsible for
removing these abnormalities.

Large volumes of waste was removed from the factories and productivity is slowly rising

Daily labor productivity – one example firm
Example data from firm A

How can better management raise productivity?
• Operational efficiency and safety
• Inventory management
• Quality control
• Monitoring and planning
• People management
Why were these practices not introduced before?
This slide deck outlines some of the key areas of management that we are improving in these firms

Yarn without labeling or in any sort of order
Inventories were very disorganized, so that firms typically had more than a year of yarn inventory
Different types/colors of weft Yarn lying mixed

Stock is organized, labeled, and entered
into an Electronic Resource Planning (ERP) system which
has details of the type, age and location.
Inventory is now calculated on a daily
basis as part of the set of metrics shown to the factory manager
Organizing inventories enables firms to reduce capital stock and reduce waste (yarn rots)

New stock is ordered by demand forecast. Sales is also informed about excess stock so they can incorporate this in new designs.
Shade cards now produced for all
surplus yarn. These are sent to the design team
- which are typically based in central
Mumbai several hours drive from the factory - so they can utilize in
future designs

Inventory levels are slowly falling
Example data from firm A

No protection to prevent damage and rust
There was a similar story for spares – these could often not be found or were damaged
Spares without any labeling or order
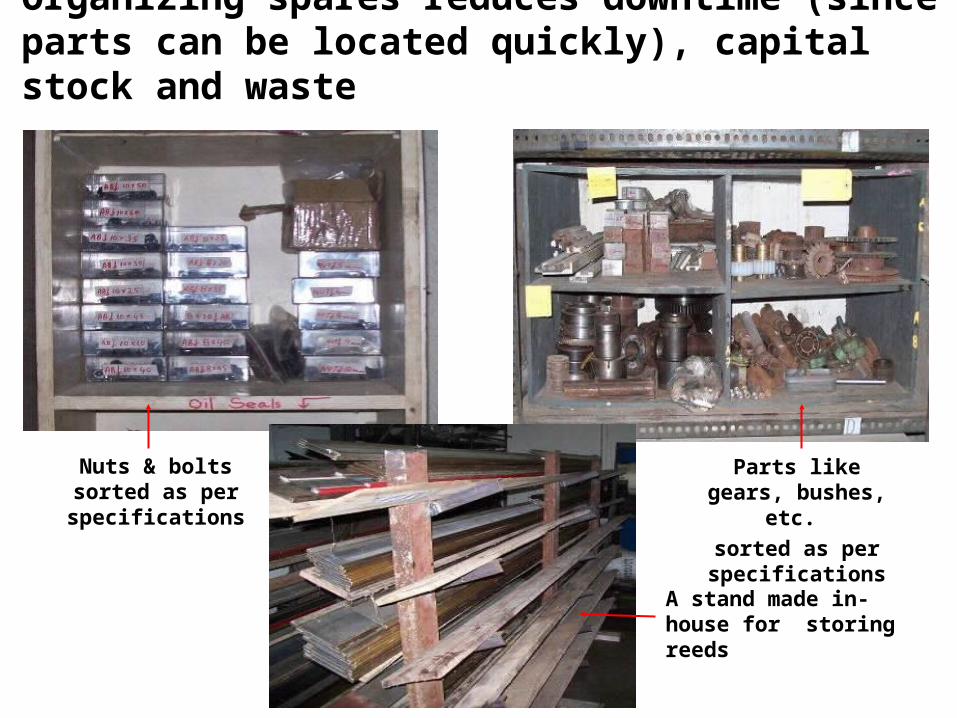
Organizing spares reduces downtime (since parts can be located quickly), capital stock and waste
Nuts & bolts sorted as per specifications
A stand made in-house for storing reeds
Parts like gears, bushes, etc.
sorted as per specifications

How can better management raise productivity?
• Operational efficiency and safety
• Inventory management
• Monitoring and planning
• Quality control
• People management
Why were these practices not introduced before?
This slide deck outlines some of the key areas of management that we are improving in these firms

Production information is collected but is rarely stored electronically or analyzed

26
Before treatment: the preventive maintenance record is not properly maintained.
After treatment: the appropriate recording format is designed and used
Part of the problem is much of the documentation is also ad hoc

Data formats were simplified & converted to electronic modes to facilitate analysis and tracking
Before After The quality defects were captured in a format with poor
readability which did not allow any data analysisQuality defects are now stored in electronic format and a
daily quality score is calculated and tracked

This data is now used in the new daily production and the weekly sales & operations meetings
Meetings aimed at continuous improvement based on high frequency performance analysis

Better organization helps in many areas – for example on time deliveries
Tracking production allows firms to change scheduling if orders are forecasted to be missed
Sales now has visibility of the production schedule so can commit to dates that are feasible when taking orders
Late production requires expensive air freight

How can better management raise productivity?
• Operational efficiency and safety
• Inventory management
• Monitoring and planning
• Quality control
• People management
Why were these practices not introduced before?
This slide deck outlines some of the key areas of management that we are improving in these firms

31
About 1/4 of employees are involved in quality checking and repair

32
Previously quality checking was only used for customer rebates
No standardized way to capture defects, so daily quality score was not available.
No standard fabric
grading norms

33
The quality format is changed to accommodate all the frequent defects. This is used to calculate a daily Quality Defects Index (QDI). This is analyzed daily.
Now quality is measured in a systematic way, on a daily basis, and used for continuous improvement

Quality is gradually improving, and as this happens less labor is used for checking and repair
Example data from firm A
Every fabric is given a grade (A, AB, B or C) at the gray checking stage
A fabric is graded as ‘A’ if it has one or lesser number of defects which can be cut from the fabric at the stage of packing
Grade A fabrics command the highest prices. Grade B or below are often unusable.

How can better management raise productivity?
• Operational efficiency and safety
• Inventory management
• Monitoring and planning
• Quality control
• People management
Why were these practices not introduced before?
This slide deck outlines some of the key areas of management that we are improving in these firms

Longer run improvements also require reforming HR practices to improve employee morale and incentives. Some limited changes have been done.
Director presenting a reward to the Top Weaver at the factory in the month of November
The names of the Top performers displayed on the notice board at the factory

How can better management raise productivity?
• Operational efficiency and safety
• Inventory management
• Monitoring and planning
• Quality control
• People management
Why were these practices not introduced before?
This slide deck outlines some of the key areas of management that we are improving in these firms

“information” and “human capital” were the main reasons these practices were not introduced beforeAcross 128 individual management improvements Accenture undertook a root-cause analysis to evaluate why these management improvements had not previously been undertaken

This informational gap is not surprising
Management practices are gradually evolving over time
But these firms do not have links with well managed domestic firms (e.g. Tata or Reliance) or foreign multinationals
They also have no employees with good engineering degrees, or any sophisticated customers
And no firm has ever hired consultants – they seem to have no idea they are particularly badly managed
So there is no easy route for better management practices to filter through into this population of firms
This suggests policies to increase managerial awareness could have major impacts
Good management – like any technology – will generate direct
productivity improvement and positive cross firm spillovers
Policies to help improve management include:
- Improved basic business and engineering education on
finance, operations and HR basics
- Greater foreign exposure via competition, ownership & exports
- Government and industry association provided training
- Encouraging a cheap domestic consulting industry

Generality of the Management Practice Tool
• The management scoring was originally designed for manufacturing and many examples are from this sector
• But almost of the questions are designed to be generic, so applicable across all industries
• Healthcare, retail, schools, tax collecting agencies......
41

42
Management practices in healthcare
Management research in India

43
THE HOSPITAL MANAGEMENT SCORECARD
PATIENT PATHWAY (2 questions) – lay-out of hospital, inventories, how changes in this occurred
MONITORING (6) - tracking, review & evaluation, follow-up etc.
TARGETS (5) - transparent, stretching, inter-connected, time horizon,
PEOPLE (5) - promotions, rewards, fix/fire, retention etc.

HOSPITAL MANAGEMENT SURVEY SAMPLE
• 161 respondents covering 100 English acute NHS hospital trusts (population sampling frame of 164)
– Response rates uncorrelated with performance (and other
observables )
• Also a smaller sample of 21 private hospitals

“EXTERNAL VALIDATION” OF THE SCORING
errorCONTROLSMANAGEMENT
EPERFORMANCHOSPITAL
_
casemix, size, noise controls
• Performance measures all taken from external sources (NHS public databases)
• Note – not a causal estimation, only an association

Improving management scores associated with significant improvements in hospital performance
Notes: This shows implied improvement in outcome (in standard deviations) following a one standard deviation increase in the hospital management score
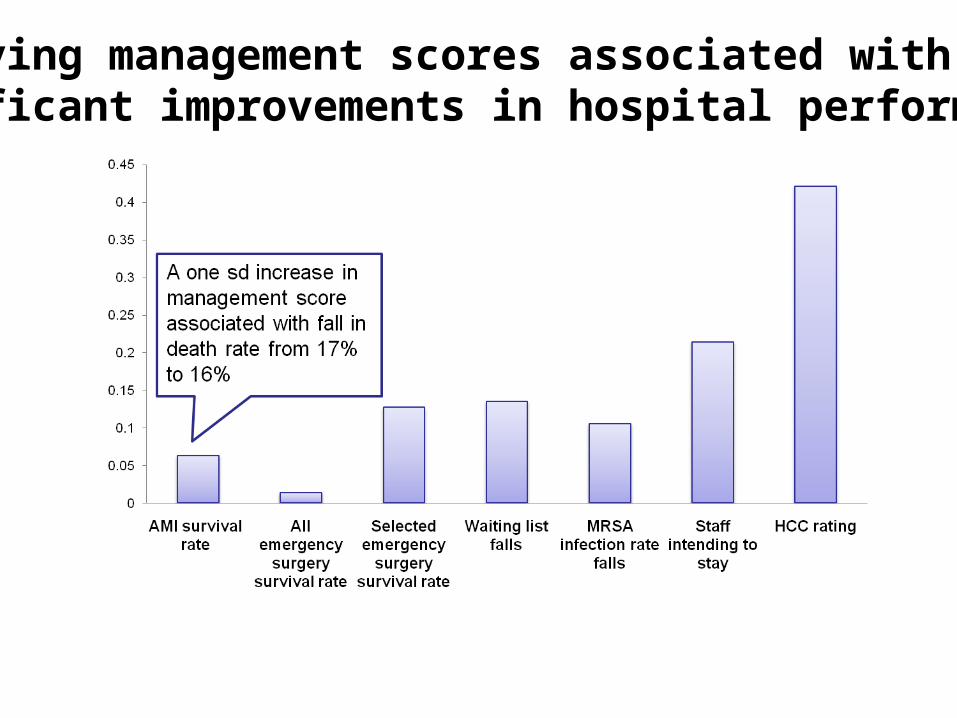
Improving management scores associated with significant improvements in hospital performance

0.5
11
.52
Den
sity
1 2 3 4Management Score (16 overlapping questions)
0.5
11
.52
Den
sity
1 2 3 4 5Management Score (16 overlapping questions)
FIG 3: MANAGEMENT SCORES LOWER FOR NHS HOSPITALS THAN PRIVATE MANUFACTURING FIRMS
Panel A: Public hospitals (161)
Panel B: UK Private manufacturingFirms (651); [50-5000 workers,No multinationals]

Gap in Management Scores: Manufacturing vs. NHS
Notes: 161 public hospitals interviews, 651 manufacturing plants., common questions only (16)

Gap in Management Scores: Private vs. Public hospitals
Notes: 161 public hospitals interviews, 21 private hospitals interviews.

Dependent variable: Management
Foundation hospital (more autonomy) 0.633***(0.180)
% managers with clinical qualification 0.926** (0.343)
BETTER MANAGED HOSPITALS HAVE ALSO HAVE MORE AUTONOMY & CLINICALLY QUALIFIED MANAGERS
Notes: 161 public hospital interviews
Helps reduce the information & communication gap between senior consultants and management (cf US system & universities)

Competition also seems to help improve hospital performance and management practices
About 20% of this effect effect is due to improvements in management
The effect of competition in the private sector is about twice as big as this
Notes: Competition is measured by the number of other hospital trusts in a 30km area Around the trust examined

Why could competition have an effect?
• Quasi-market due to healthcare reforms?
• Managerial career concerns
• Learning
• Something else? Universities?

Conclusions
• Useful tool for management in healthcare – contains information (performance results)
• Lower scores in public sector than private (especially for people management)
• Competition matters for performance & management, especially for private sector

MY FAVOURITE QUOTES:
Customer involvement
Interviewer : “Do staff sometimes end up doing the wrong sort of work for their skills?
Manager: “You mean like physicians doing nurses jobs, and nurses doing porter jobs? Yeah, all the time. Last week, we had to get the healthier patients to push around the beds for the sicker patients!

BACKUP
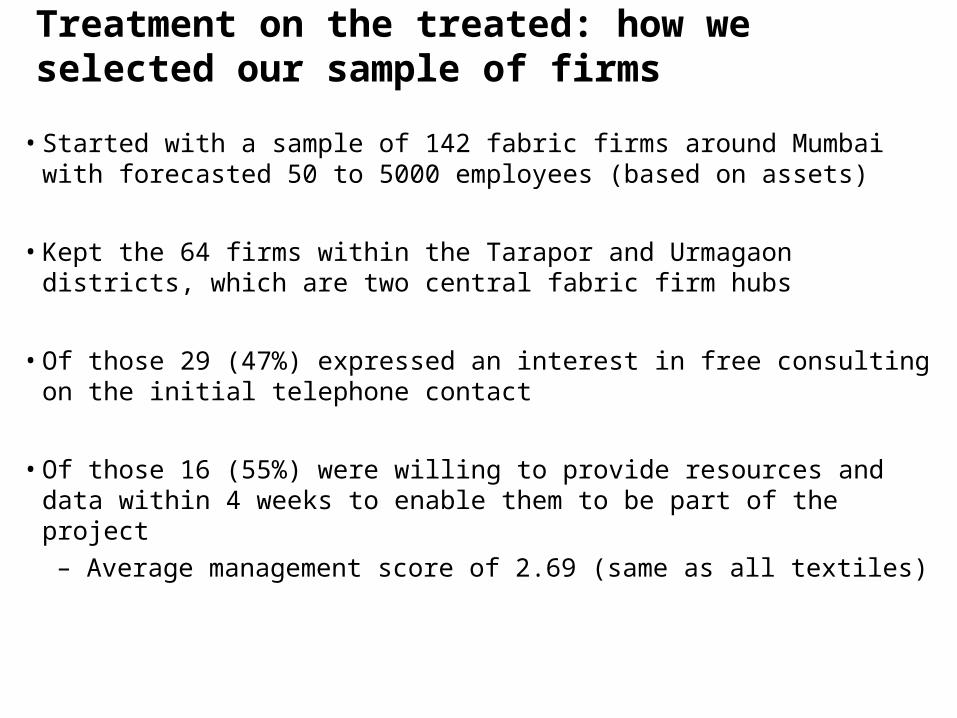
Treatment on the treated: how we selected our sample of firms
• Started with a sample of 142 fabric firms around Mumbai with forecasted 50 to 5000 employees (based on assets)
• Kept the 64 firms within the Tarapor and Urmagaon districts, which are two central fabric firm hubs
• Of those 29 (47%) expressed an interest in free consulting on the initial telephone contact
• Of those 16 (55%) were willing to provide resources and data within 4 weeks to enable them to be part of the project
– Average management score of 2.69 (same as all textiles)

Score (1): No, process improvements are made only when problems occur
(3): Improvements are made in irregular meetings involving to improve performance in their area of work (e.g., ward or theatre)
(5): Exposing problems in a structured way is integral to individuals’ responsibilities. Resolution involves all staff groups. Part of regular processes rather than by extraordinary effort
Q3 MONITORING - Continuous improvementHow do problems typically get exposed and fixed? Talk me through the Process for a recent problem that you faced. Can you give examples?

Score (1): Poor performers are rarely removed from their positions
(3) Suspected poor performers stay in a position for a few years before action is taken
(5): We move poor performers out of the hospital/department or to less critical roles as soon as a weakness is identified
Q15 PEOPLE - Removing poor performersIf you had a clinician or a nurse who could not do his job, what would you do? Could you give me a recent example? How long would underperformance be tolerated? Do some individuals always just manage to avoid being fixed/fired?
First
Inte
rvie
wee
Second Interviewee-2 -1 0 1 2
-2
-1
0
1
2
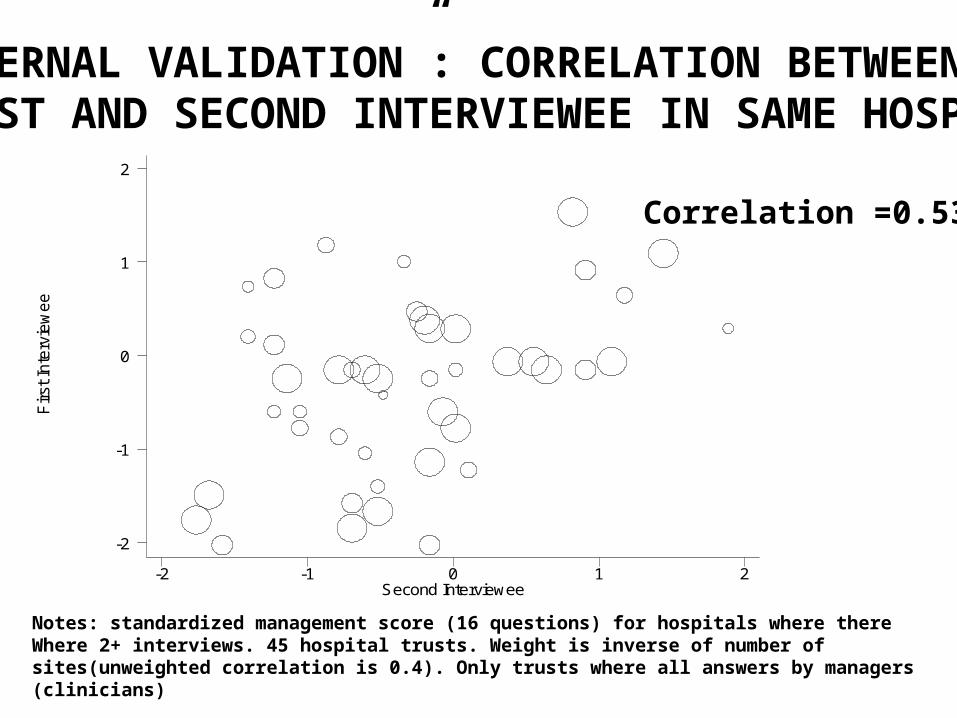
“INTERNAL VALIDATION”: CORRELATION BETWEEN FIRST AND SECOND INTERVIEWEE IN SAME HOSPITAL
Correlation =0.53
Notes: standardized management score (16 questions) for hospitals where there Where 2+ interviews. 45 hospital trusts. Weight is inverse of number of sites(unweighted correlation is 0.4). Only trusts where all answers by managers (clinicians)