Embed Size (px)
Citation preview

Management Report - 1
AXA Bank Europe Management Report 2016

Management Report - 2
Table
of
Content
• Message from the Chairman of the Board of Directors and the Chief
Executive Officer
• About AXA Bank
◊ Key numbers
◊ History
◊ AXA Group
• The economic and financial context
• Results of activities
◊ Belgian retail activities
◊ Non-retail activities
• Comments on the consolidated results
◊ Comments on the profit and loss accounts
◊ Comments on the balance sheet and off-balance sheet
• Comments on the statutory accounts and the allocations of earnings
• Significant events after 2016
• Liquidity and solvency
• Main risks and uncertainties
• Corporate Governance
◊ Composition of management bodies
◊ Modifications occurring in 2016 and since 1 January 2017
◊ Competence and independence of the Audit Committee and the Risk
Committee
◊ Competence and independence of the Nomination Committee and Remu-
neration Committee
• Remuneration policy

Management Report - 3
Message from the Chairman of the Board of Directors
& the Chief Executive Officer
In 2016, the banking sector in Europe and in Belgium
faced a contrasted environment : on one hand : persis-
tent low interest rates, extremely high volumes of mort-
gage credit refinancings and prepayments, again higher
bank levies, accelerated changes in customers’ behav-
iour, supervisory intensified scrutiny and numerous regula-
tory changes. On the other hand, some factors played
positively: abundant liquidity, low inflation, acceleration
of economic growth (albeit still at a low pace) and fur-
ther improvement of credit performance. In this environ-
ment AXA Bank was able to remain on course thanks to
its transformation plan, launched two years ago to further
strengthen its commercial and financial performances
and pursue its transformation. Despite a lower Net Bank-
ing Product due to refinancings and lower capital gains
realization, AXA Bank posted a 98 million euro net income
(FINREP) up 66 million euro vs 2015 thanks to lower admin-
istrative expenses ( -182 million euro, down -4 million euro
from 2015) and lower cost of risk (-7 million euro down -13
million euro from 2015).
The key pillars of the bank’s strategy remained, on one
hand, the focus on selective growth while being more
efficient, and, on the other side, the accelerated transfor-
mation of its platform. During the year, the bank focused
its commercial development on the strengthening of its
relationship with its clients aiming at becoming their first
banking partner. AXA Bank wants to accompany effi-
ciently its customers to realize their projects, mainly by
providing a full range of banking services with a particu-
lar emphasis on mortgages and investment products and
advice for retail clients and professional loans for inde-
pendents and very small companies. Furthermore, the
bank continued to work on improving its efficiency by
automating processes, being very disciplined on costs
while pursuing its investment in people and tools, in par-
ticular in core elements of its retail banking platform. In-
deed, the bank accelerated its transformation to im-
prove the customer’s digital experience: new functionali-
ties were added regularly on the different digital devices
(opening of new products such as cards and investment
accounts, appointment tool, etc.) while some user
convenience improvements were implemented.
On top of improving the digital experience for the clients,
AXA Bank further invested in the professionalization of its
agent network. In 2016, the bank continued the technical
-commercial training for agents to strengthen added-
value customer advice. In parallel, the bank set up a spe-
cific central Invest and Professional credit expert’s team
to support agents to extend their footprint in those activi-
ties.
AXA Bank also pursued its derivatives Intermediation
activities, providing added-value services to AXA
entities by processing and managing their derivatives in
the market, all within a very strict risk appetite.
The net new production volumes were lower than
2015. In 2016 AXA Bank continued to actively compress
its stock of derivatives allowing to neutralize the net new
production and keep, overall, the total derivatives off
balance outstanding broadly unchanged.
2016 was also marked by the final step in the derisking
of the bank with the successful signing and closing of
the sale transaction of its Hungarian business. Hungarian
activities and most of the staff were transferred to OTP
Bank Plc on October 31st. This transaction is the final
step to reposition AXA Bank as a retail bank exclusively
present on the Belgian market and operating jointly with
AXA Insurance in Belgium.
Peter Devlies
CEO
Jef Van In
Chairman of the Board of Directors

Management Report - 4
Key numbers*
Our ratios
Our Results
90
74
32
98
2015 2016
Underlying earnings Net Income
Our Solvency & Liquidity
1.000.000 clients
850 employees
700 point of sales
Our balance sheet
Our team
About
AXA Bank
76%
C/I ratio
8%
RoE
Client deposits
17.8 billion euro
Client Loans
18.1 billion euro
Mortgage loans
15.8 billion euro
About
AXA Bank
““AXA Bank is pursuing its successful repositioning as a connected and trusted
financial partner for our 1.000.000 clients in Belgium “
Peter Devlies
139%
139%
139%
169%
Liquidity
Coverage
Ratio
Net Stable
Funding
Ratio
2015 2016
20%
21,2
0%
23,1
0%23
,50%
Tier 1 ratio Capital Ratio
in million euro
*all numbers are IFRS consolidated numbers except Underlying Earnings which are an AXA Group non GAAP measure
Management Report - 5
History About
AXA Bank
2010 2011 2012 2013
2014 2015 2016 Future
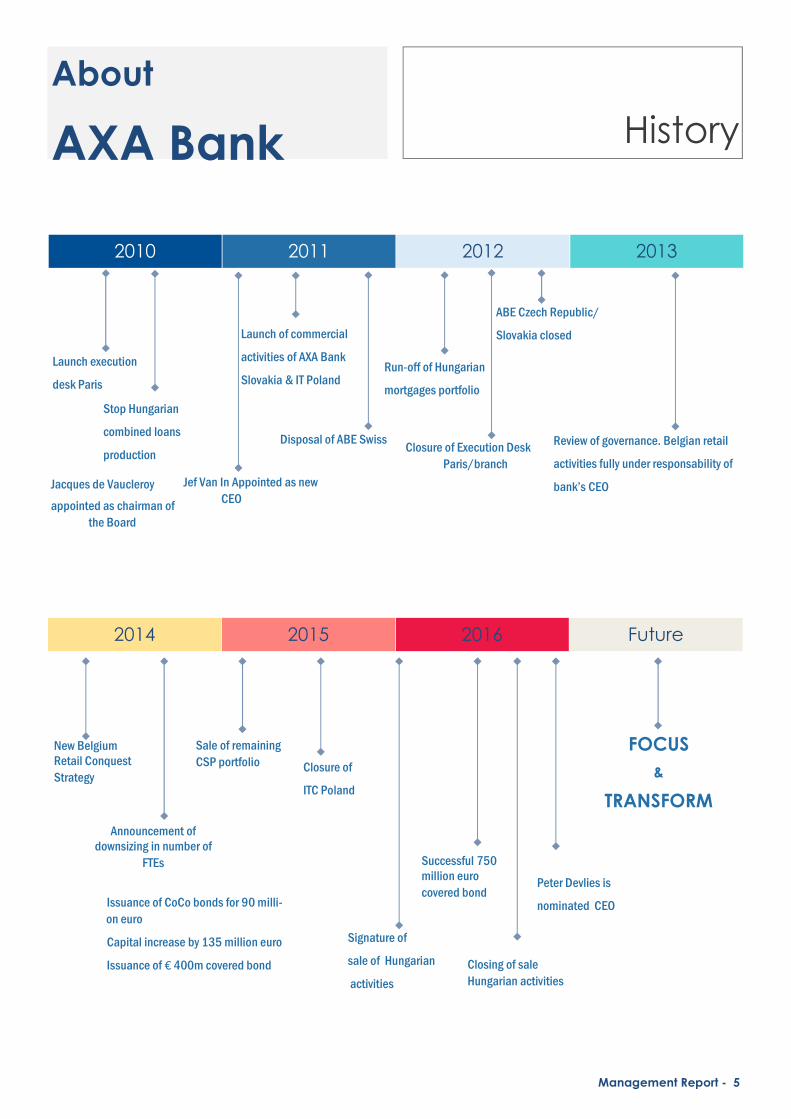
Stop Hungarian
combined loans
production
Launch execution
desk Paris
Launch of commercial
activities of AXA Bank
Slovakia & IT Poland
Jacques de Vaucleroy
appointed as chairman of
the Board
Jef Van In Appointed as new
CEO
Run-off of Hungarian
mortgages portfolio
Disposal of ABE Swiss Closure of Execution Desk
Paris/branch
ABE Czech Republic/
Slovakia closed
Review of governance. Belgian retail
activities fully under responsability of
bank’s CEO
Announcement of downsizing in number of
FTEs
Issuance of CoCo bonds for 90 milli-
on euro
Capital increase by 135 million euro
Issuance of € 400m covered bond
Closure of
ITC Poland
New Belgium Retail Conquest
Strategy
Sale of remaining
CSP portfolio
Signature of
sale of Hungarian
activities
Successful 750 million euro
covered bond Peter Devlies is
nominated CEO
FOCUS
&
TRANSFORM
Closing of sale
Hungarian activities

Management Report - 6
About
AXA Bank AXA Group Overview of AXA Group
Present in 64 countries, AXA’s 166,000 employees and exclusive distrib-utors provide their expertise in support of 103 million customers through
four core business activities: Property & Casualty Insurance; Life & Savings; Health Insurance; and Asset Management. In a fast-
evolving world, AXA anticipates change to offer services and solutions tailored to the current and future needs of its customers.
Countries where AXA Group is active
64 COUNTRIES
166,000 EMPLOYEES
103 MILLION CUSTOMERS
Based on AXA Group profile in 2015
Overview of AXA Group
9% Asia (excluding Japan)
7% Japan
14% United States
31% Northern, Central and Eastern Europe
22% France
6% United Kingdom and Ireland
5% Mediterranean Region and Latin America
3% International Insurance
2% Direct
GEOGRAPHICAL BREAKDOWN OF BUSINESS
Underlying earnings (insurance activities)

Ma
na
ge
me
nt
Re
po
rt -
7
Economic and financial context
Overall context Impact for AXA Bank Europe
Financial
Environment
• Low interest rates
• Abundant liquidity
• Low inflation
• Slight acceleration of economic growth
• Strong credit production at attractive margins
• Good credit performance with decreasing default rates
• Comfortable liquidity ratios
• Prepayments and refinancing of mortgage loans weigh down on future profitability
• Market conditions make it interesting for customers and banks to gradually shift from on-
balance sheet savings accounts towards off-balance sheet investment products
Customer
Behaviour
• Changing customer behaviour and expecta-
tions
• Fast evolution of the payments industry &
FinTech development
• Increased focus on development of digital tools for customers e.g. homebanking,
smartphone application
Political
Environment
• Geopolitical uncertainty & instability • Geopolitical environment leads to uncertainty, increased spreads & market volatility
Impact on ABE

Management Report - 8
Results
Belgian retail activities
Savings & invest The net growth of balance sheet savings & invest products reached +1.2 billion euro, a very strong increase driven by new inflows in current & savings accounts and by the inflows related to the buy-back of the Crest insurance products. Part of the Crest related flows have been transformed to off balance sheet investment products like AXA funds. The net growth in the off balance sheet invest products at +416 million euros was very
strong.
In the context of the persistent low interest rates, our clients are confronted with a rather unfavourable invest-ment environment. This results in high net inflow in the current accounts +406 million euro and savings accounts +861 million euro. This latter is also positively impacted by important inflow coming from the buy-back of Crest insurance products. Portfolio of fixed rate products remained relatively stable with a moderate increase in our
term deposits portfolio (+102million euro) and a slight decrease in our certificates portfolio (-47million euro).
The net growth in the off balance sheet investment portfolio reached 416 million euro or an increase of 341 million euro versus 2015. This strong increase is a confirmation that AXA Bank's strategy to better serve our cli-ents investment needs through advisory services and extend fund offering is being rolled-out successfully. In-deed, the largest increase was observed in the net inflow in AXA funds, which has more than doubled to 433 million euro versus 137 million euro net inflow in 2015. This includes the investments made by clients through the recurrent investment plan: a new AXA Bank product launched in June 2016. Net inflow for structured products
and third party investment funds was slightly negative -11 million euros and -5 million euros respectively.
Daily Banking All our daily banking indicators improved in 2016 in comparison with 2015: number of accounts (+14k), num-ber of active accounts (+14k), number of online clients (+22k), number of credit cards (+15k) and number of
clients using AXA Bank as their first bank (First Bank Clients) (+57k).
Credits
Mortgage Loans - After the record year of 2015, our lending volumes continued growing to 2.9 billion euro new loan production. The production level was especially high in the second half of the year during which AXA Bank slightly increased its market share. However, over the whole of 2016, we maintained our market share of 8%. The outstanding mortgage loans portfolio reached 15.8 billion euros or +7% compared to 2015. The volumes of prepayment and refinancing have remained high in the first three quarters of the year only to
slow down in the last quarter thanks to interest rate increases in that period.
Consumer loans - Sales volumes increased in 2016 in comparison with 2015 by 24 million euro or +8%. Our
production remained concentrated in car loans (180 million euro) and Immo loans (87 million euro).
Professional loans - Following our strategy to focus on the lending to independent professions and very small companies under strict risk appetite control, profession loan volume production has increased to 425 million euro or +19% compared to 2015. This production is mainly concentrated in the following products: Immo4Pro (196 million euro), Equipement4Pro (78 million euro) and Car4Pro (68 million euro). Indeed, the enhanced commercial activity focused on this segment and the review of the professional loan product offering, initiat-ed in April 2015, have resulted in strong increase of the production and steady growth of the outstanding
portfolio which reached 1.4 billion euro.
Management Report - 9
Results Belgian retail activities
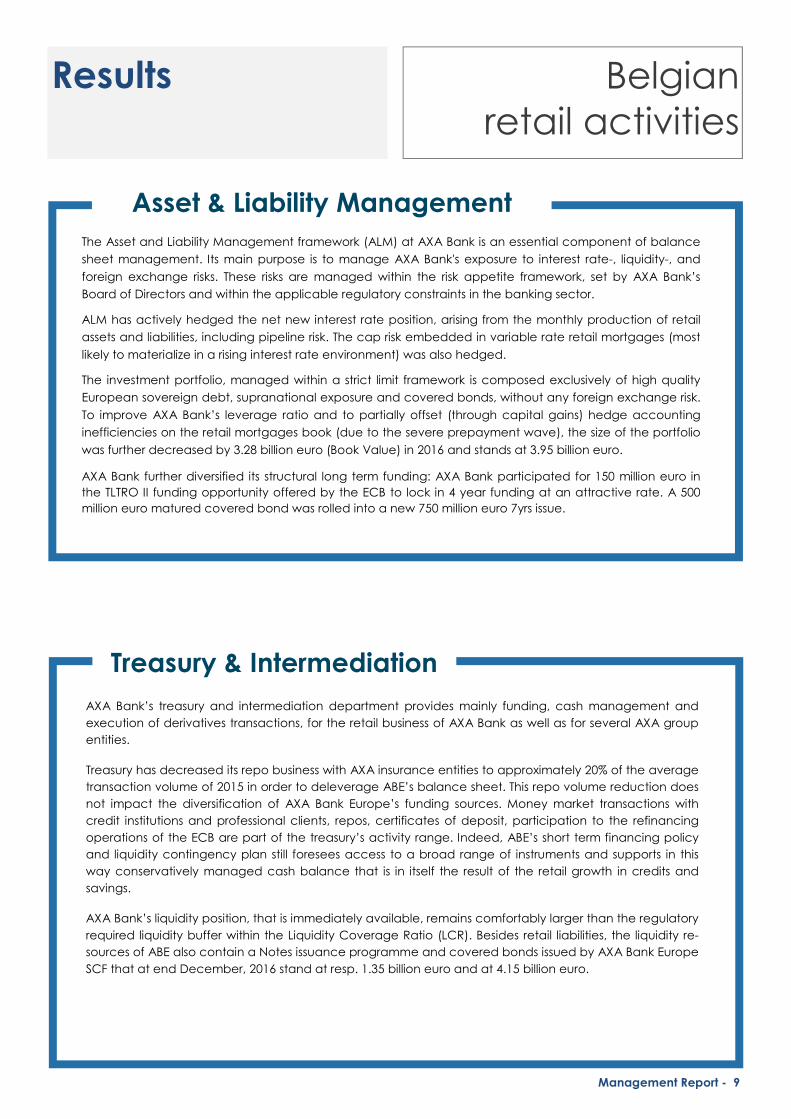
Asset & Liability Management
The Asset and Liability Management framework (ALM) at AXA Bank is an essential component of balance
sheet management. Its main purpose is to manage AXA Bank's exposure to interest rate-, liquidity-, and
foreign exchange risks. These risks are managed within the risk appetite framework, set by AXA Bank’s
Board of Directors and within the applicable regulatory constraints in the banking sector.
ALM has actively hedged the net new interest rate position, arising from the monthly production of retail
assets and liabilities, including pipeline risk. The cap risk embedded in variable rate retail mortgages (most
likely to materialize in a rising interest rate environment) was also hedged.
The investment portfolio, managed within a strict limit framework is composed exclusively of high quality
European sovereign debt, supranational exposure and covered bonds, without any foreign exchange risk.
To improve AXA Bank’s leverage ratio and to partially offset (through capital gains) hedge accounting
inefficiencies on the retail mortgages book (due to the severe prepayment wave), the size of the portfolio
was further decreased by 3.28 billion euro (Book Value) in 2016 and stands at 3.95 billion euro.
AXA Bank further diversified its structural long term funding: AXA Bank participated for 150 million euro in
the TLTRO II funding opportunity offered by the ECB to lock in 4 year funding at an attractive rate. A 500
million euro matured covered bond was rolled into a new 750 million euro 7yrs issue.
Treasury & Intermediation
AXA Bank’s treasury and intermediation department provides mainly funding, cash management and
execution of derivatives transactions, for the retail business of AXA Bank as well as for several AXA group
entities.
Treasury has decreased its repo business with AXA insurance entities to approximately 20% of the average
transaction volume of 2015 in order to deleverage ABE’s balance sheet. This repo volume reduction does
not impact the diversification of AXA Bank Europe’s funding sources. Money market transactions with
credit institutions and professional clients, repos, certificates of deposit, participation to the refinancing
operations of the ECB are part of the treasury’s activity range. Indeed, ABE’s short term financing policy
and liquidity contingency plan still foresees access to a broad range of instruments and supports in this
way conservatively managed cash balance that is in itself the result of the retail growth in credits and
savings.
AXA Bank’s liquidity position, that is immediately available, remains comfortably larger than the regulatory
required liquidity buffer within the Liquidity Coverage Ratio (LCR). Besides retail liabilities, the liquidity re-
sources of ABE also contain a Notes issuance programme and covered bonds issued by AXA Bank Europe
SCF that at end December, 2016 stand at resp. 1.35 billion euro and at 4.15 billion euro.

Management Report - 10
Results non-retail
activities
The pay-offs of the Notes issuances are structured in-house and hedged in the market by AXA Bank’s deriva-
tives specialists that also provide derivative execution and processing services, exclusively for entities of AXA
Group worldwide. The provided services include execution, clearing, valuation and (EMIR) reporting obliga-
tions. Besides the mandatory derivative volume compressions analyses, AXA Bank reduced its operational
risk through a compression of 14.3 billion euro of interest rate derivatives. Although the new volume of client
derivatives dealt over 2016 stands at 7.7 billion euro, AXA Bank’s derivative outstanding hardly rose over
2016 with 1.8 billion euro to 93.6 billion euro in 2016.
Back loading derivatives to a central clearing platform and active management of counterparty credit ex-
posure allowed for a reduction of the counterparty credit exposure to AXA Bank ’s main derivative counter-
parts.
Treasury & Intermediation

Management Report - 11
Comments on the consolidated results
Profit & Loss
million euro 2015 2016
Interest margin 322 290
Net banking product 381 356
Underlying earnings 90 74
Net income 32 98
Interest margin — Retail assets showed a strong production at resilient margins. New mortgage production
stands at 2.9 billion euro at margins of around 174Bp. Retail liabilities Net New Money of 1.2 billion euro fueled
in 2016 by Crest Buy Back at 1 billion euro.
Net Banking Product — Net Banking Product (NBP) at 356 million euro or -24 million euro below 2015. This is
driven by the persistent low interest rates which have triggered high volumes of mortgage loan prepayments
and refinancing and reduced ALM transformation results (-17 million euro). Moreover, the Intermediation ac-
tivity generated lower revenues (-28 million euro). These negative impacts on the revenues have only partially
been offset by strong volume growth in the lending business at solid margins (+13 million euro) and the good
results in the investment business resulting in higher fee income (+8 million euro). Margins on liabilities were re-
silient thanks to the consecutive client rate cuts applied on savings accounts in 2016.
Underlying Earnings — Underlying Earnings stand at 74 million euro or -16 million euro below 2015. This signifi-
cant reduction of the results is mainly explained by the decreased Net Banking Product (-24 million euro),
higher Distribution Commissions (-5 million euro) and higher Bank Levies (-4 million euro) which are only partly
offset by lower Administrative Expenses (excluding Bank Levies) (+4 million euro) and lower Cost of Risk (+13
million euro).
Indeed, Administrative Expenses excluding Bank Levies stands at 182 million euro or 4 million euro below 2015
thanks to a 4% decrease of Staff Expenses and 11% decrease of Goods & Services realized through the pursuit
of structural cost reduction measures and strict cost discipline.
Cost of Risk stands at 7 million euro or 13 million euro below 2015 as a result of derisking efforts performed over
the last few years, the adjustment of credit risk models and the sale of a portfolio of written off loans.
Net Income — Net Income Belgian Territory is at 79 million euro or -24 million euro below 2015, which is mainly
explained by UE evolution. The contribution of Hungary to the Net Income is very strong at 19 million euro. This
is mainly due to (1) the release of provisions (partial take back of 2015 provisions) +21 million euro (2) good
performance of run-off of the business with better than expected costs of risk +6 million euro (3) new provision
of 10 million euro (or 8 million euro post DTA) to cover risk of warranties and guarantees given to OTP. Conse-
quently, ABE consolidated Net Income stands at 98 million euro (RoE of 8%) well above 2015 results.
Management Report - 12
Comments on the consolidated results Balance sheet and
Off– balance sheet
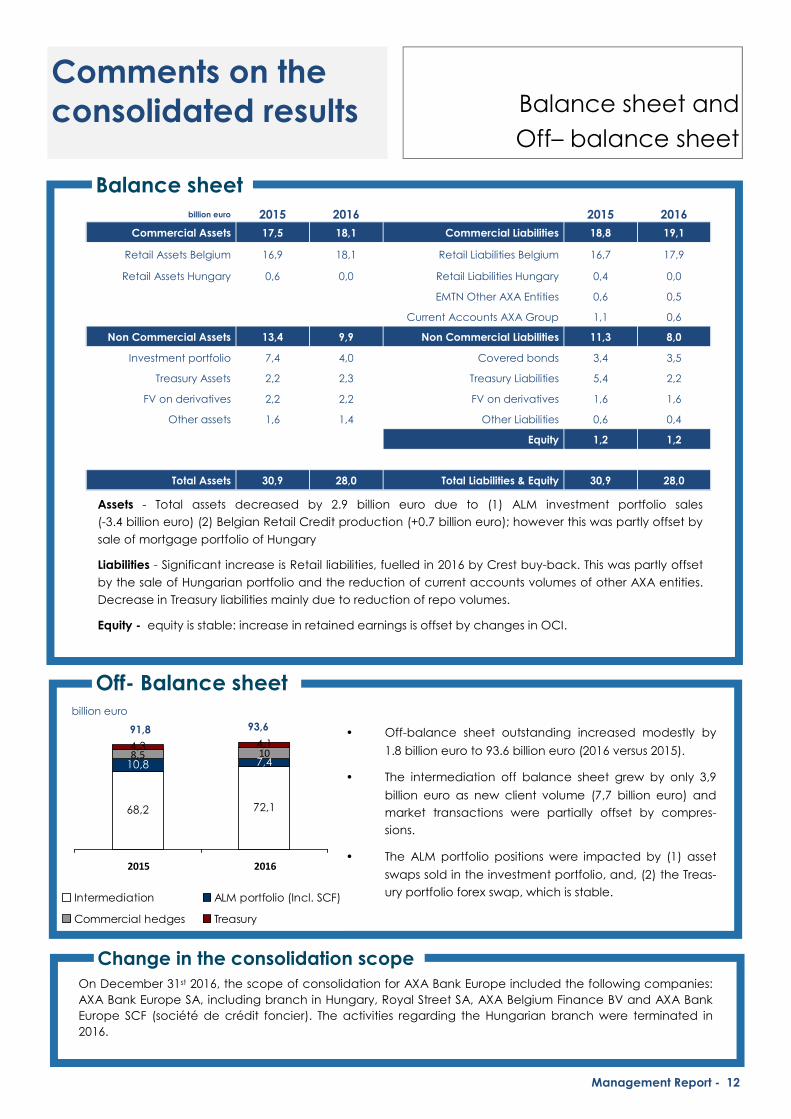
Assets - Total assets decreased by 2.9 billion euro due to (1) ALM investment portfolio sales
(-3.4 billion euro) (2) Belgian Retail Credit production (+0.7 billion euro); however this was partly offset by
sale of mortgage portfolio of Hungary
Liabilities - Significant increase is Retail liabilities, fuelled in 2016 by Crest buy-back. This was partly offset
by the sale of Hungarian portfolio and the reduction of current accounts volumes of other AXA entities.
Decrease in Treasury liabilities mainly due to reduction of repo volumes.
Equity - equity is stable: increase in retained earnings is offset by changes in OCI.
Balance sheet
Off- Balance sheet
68,2 72,1
10,8 7,48,5 104,3 4,1
2015 2016
Intermediation ALM portfolio (Incl. SCF)
Commercial hedges Treasury
• Off-balance sheet outstanding increased modestly by
1.8 billion euro to 93.6 billion euro (2016 versus 2015).
• The intermediation off balance sheet grew by only 3,9
billion euro as new client volume (7,7 billion euro) and
market transactions were partially offset by compres-
sions.
• The ALM portfolio positions were impacted by (1) asset
swaps sold in the investment portfolio, and, (2) the Treas-
ury portfolio forex swap, which is stable.
billion euro 2015 2016 2015 2016
Commercial Assets 17,5 18,1 Commercial Liabilities 18,8 19,1
Retail Assets Belgium 16,9 18,1 Retail Liabilities Belgium 16,7 17,9
Retail Assets Hungary 0,6 0,0 Retail Liabilities Hungary 0,4 0,0
EMTN Other AXA Entities 0,6 0,5
Current Accounts AXA Group 1,1 0,6
Non Commercial Assets 13,4 9,9 Non Commercial Liabilities 11,3 8,0
Investment portfolio 7,4 4,0 Covered bonds 3,4 3,5
Treasury Assets 2,2 2,3 Treasury Liabilities 5,4 2,2
FV on derivatives 2,2 2,2 FV on derivatives 1,6 1,6
Other assets 1,6 1,4 Other Liabilities 0,6 0,4
0,0 0,0 Equity 1,2 1,2
0,0 0,0 0,0 0,0
Total Assets 30,9 28,0 Total Liabilities & Equity 30,9 28,0
billion euro
On December 31st 2016, the scope of consolidation for AXA Bank Europe included the following companies:
AXA Bank Europe SA, including branch in Hungary, Royal Street SA, AXA Belgium Finance BV and AXA Bank
Europe SCF (société de crédit foncier). The activities regarding the Hungarian branch were terminated in
2016.
Change in the consolidation scope
91,8 93,6

Management Report - 13
Comments on the statutory accounts & the allocation of earnings
The statutory profit of the year 2016 amounts to 69.4 million euro. The accumulated losses at the
end of 2015 were at 57.1 million euro. Consequently, the positive cumulative impact on Decem-
ber 31st 2016 amounts to 12.3 million euro.
The Board of Directors proposes to, after allocation to the legal reserves, carry forward the result
to the next financial year.
No significant event up till now.
Significant events after 2016

Management Report - 14
Liquidity & solvency
139%
169%
139% 139%
2015 2016
Liquidity Coverage Ratio
Net Stable Funding Ratio
• Liquidity for AXA Bank Europe remained at a com-
fortable level throughout 2016. As per 31 Decem-
ber 2016, the Liquidity Coverage Ratio (LCR) is at
169% (139% in 2015) and Net Stable Funding Ratio
(NSFR) at 139% (139% in 2015). This position is based
on a combination of funding sources such as de-
posits from retail customers and covered bonds for
the institutional market.
• AXA Bank Europe shows high solvency further
strengthened over 2016 thanks to its continued
prudent investment strategy and conservative
distribution policy. All solvency ratios improved
over the year. As per 31 December 2016, AXA
Bank Europe’s Tier 1 ratio stands at 23.1% (20.0% in
2015) and total capital ratio at 23.5% (21.2% in
2015). These ratios significantly exceed the regula-
tory requirements. These same ratios fully loaded,
i.e. calculated as if Basel III were already in full
force, amounted to 23.7% and 23.9% respectively
(22.4% and 23.1% in 2015), demonstrating that the
bank has anticipated the implementation of Basel
III.
• In connection with the contemplated implemen-
tation of the non-risk based leverage ratio, basi-
cally comparing Tier1 capital to unadjusted total
assets, the bank has further decreased it bal-
ance sheet, essentially through a significant re-
duction of our bonds portfolio, also taking the
opportunity of the low interest rates throughout
2016. As a consequence, the bank's leverage
ratio lands at 4.1%. In light of the low risky assets
of AXA Bank, this level offers a comfortable buff-
er. Indeed our assets essentially include loans
with mortgage guarantees, bonds issued by
governments and supra-national bodies
(European funds) and to a lesser extent financial
instruments fully collateralised by cash or high
quality bonds.
20%
23,10%
21,20%
23,50%
2015 2016
Tier 1 ratio
Capital ratio
Management Report - 15
Because of the nature of its activities, AXA Bank is exposed to certain risks. The main risks are the credit risk (risk of
default), interest rate risk, market risk, liquidity risk and operational risk. These risks are managed within a risk appetite
framework defined annually by the Board of Directors. These various risks are described in more detail in Section 4 -
Risk management of our annual accounts.
During 2016, the Belgian mortgage loan market continued to experience a high refinancing rate due to the low
interest rate environment. While this has put pressure on margins and revenues, AXA Bank has been able to temper
the impact with the significant production of mortgage loans of strong credit quality.
AXA Bank has further reduced its credit risk by materializing the sale of its Hungarian branch. Indeed, the complete
retail business in Hungary has been transferred to OTP bank during the fourth quarter of 2016 and the official closure
of the branch "AXA Bank Hungary" is planned for next year.
The significant risk reduction has been reflected in AXA Bank's results to the European Union-wide banking stress test,
which have fed the 2016 round of Supervisory Review and Evaluation Processes (SREP) under which the European
authorities decided the appropriate capital resources that AXA Bank has to hold.
Finally, the results of the United Kingdom's referendum, in which more than 50% voted to leave the European Un-
ion, has changed the international economic landscape. On the short term, the reaction of financial markets to the
"Brexit" has barely affected AXA Bank.
A number of recent (USA) or forthcoming (France, Germany) political elections may create instability or unforeseen
changes to the economic or market environments.
Main risks
& uncertainties

Management Report - 16
Corporate Governance Composition of
management bodies
Board of Directors Management
Committee
Audit
Committee
Risk
Committee
Nomination
Committee and
Remuneration
Committee
Peter Devlies
(since 02/03/2017) Chairman
(since 02/03/2017)
Jef Van In, Chairman
(since 28/03/2017)
Chairman
(until 27/07/2016) Chairman
(since 28/03/2017)
Sabine de Rycker �
Françoise Gilles �
Jeroen Ghysel �
Marie-Cécile Plessix
Frank Goossens
(since 22/11/2016) �
Patrick Lemoine � �
Emmanuel Vercoustre
Chairman
(from 27/07/2016
until 02/03/2017)
Marc Bellis,
independent director �
Patrick Keusters,
independent director Chairman
(since 04/02/2016) �
Philippe Rucheton,
independent director � Chairman
Jacques de Vaucleroy, Chairman
(until 30/06/2016) Chairman
Frank Koster
(until 13/07/2016) �
Céline Dupont
(until 13/07/2016) �
AXA has the ambition to become worldwide the most inclusive company of the financial services. Our aim is to be-
come as diverse and inclusive as possible. Therefore we are opposed to any form of discrimination.
Auditors: PwC Bedrijfsrevisoren bcvba / PwC Reviseurs d’Entreprises sccrl, represented by Tom Meuleman (accredited
auditor)

Management Report - 17
Corporate Governance Modifications occurring in 2016
and as of 1 January 2017
Board of Directors:
• nomination of Peter Devlies effective on 2nd March
2017
• nomination of Frank Goossens effective on 22nd
November 2016
• nomination of Jef Van In as chairman of the board
effective on 28th March 2017
• resignation of Jacques de Vaucleroy effective on
30th June 2016
• resignation of Frank Koster effective on 13th July 2016
• resignation of Céline Dupont, effective on 13th July
2016
Executive Committee:
• nomination of Peter Devlies as chairman effective on
2nd March 2017
• nomination of Frank Goossens, effective on 22nd
November 2016
• resignation of Céline Dupont, effective on 13th July
2016
• resignation of Jef Van In effective on 27th July 2016
Audit Committee:
• nomination of Patrick Keusters as chairman, effec-
tive on 4th February 2016 Risk Committee:
• nomination of Patrick Keusters, effective on 1st
January 2016
Nomination Committee:
• nomination of Jef Van In effective on 28th March
2017 as chairman of the committee
• resignation of Jacques de Vaucleroy, effective on
30th June 2017
• resignation of Frank Koster, effective on 13th July
2016
Remuneration Committee:
• nomination of Jef Van In effective on 28th March
2017 as chairman of the committee
• resignation of Jacques de Vaucleroy, effective on
30th June 2017
• resignation of Frank Koster, effective on 13th July
2016

Management Report - 18
Corporate Governance
Competence and independence of
the Audit Committee
and the Risk Committee
AXA Bank Europe’s Audit Committee and Risk Committee consist of Philippe Rucheton, Patrick Keusters and Patrick
Lemoine, the first two being independent directors.
The Risk Committee was formed within the executive board by decision of the board on the 5th of December 2014, pursuant to article 27, 2nd of the law of the 25th of April 2014 relating to the articles of association and monitoring credit institutions. 5 meetings per year are scheduled and ad hoc meetings are organized in function of the need.
Both committees have the same members but a different chairman.
Its members hold the status of non-executive directors. At least one of them must be independent in the sense of
article 526 of the Companies Code. It has been in operation since 1st January 2015.
Each of its members possesses the knowledge, skills and experience required for understanding and identifying the
bank's strategy and level of risk tolerance. On these subjects, they are called on to advise the members of the Exec-
utive Board and to assist them in their role of supervising the executive committee’s implementation of the strategy.
Following on from a recommendation by the European Central Bank – namely to entrust the presidency of the Risk
and Audit Committees to different persons – the Executive Board has designated Patrick Keusters as president of the
Audit Committee, and Philippe Rucheton as the one of the Risk Committee.
Philippe Rucheton was appointed independent director of AXA Bank Europe on 24 April 2014. He is a graduate of
the Ecole Polytechnique, the Institut Supérieur des Affaires and the Sorbonne. He was a director and finance director
at Dexia between December 2008 and March 2014. Prior to that he worked at Société Générale as CFO of
Newedge Group, a brokerage firm; as Vice President of its Czech banking subsidiary and from 1995 to 2002, as ALM
director. He started his career at the Louis-Dreyfus Bank and at the BRED, and was director for 20 years at Bernard
Controls, an industrial company. At the age of 68, Philippe Rucheton thus has ample experience in banking and in-
vestment, general management as well as financial management and monitoring. He is also familiar with the Bel-
gian market since 2008.
Patrick Keusters was appointed independent director of AXA Bank Europe on 1st January 2016. He graduated in Law
and has a Master’s in Management from the Vlerick School. He began his career in 1985 at Citibank, where he spe-
cialised in Corporate Banking. He went to the Banque Degroof in 1992 where, in 2000, he became director and
member of the executive committee. In 2002 he assumed the role of managing director, first at the Banque Degroof
Luxembourg and then, between 2004 and 2015, at the Banque Degroof Belgium. His responsibilities there covered
Operations, Accounting, Compliance, Loans, Legal and Tax Affairs and Facilities. He was also president of the spe-
cialized banks section of Febelfin.
Philippe Rucheton and Patrick Keusters both meet all the criteria of independence listed in article 526 ter of the
Companies Code.
Patrick Lemoine was appointed director of AXA Bank Europe on 1st January 2010. He is a Mining Engineer (EMSE),
has a degree in Higher Accounting Studies, an MBA from INSEAD and is an actuary. He began his career in 1981 at
Crédit Lyonnais and since then has gained vast experience as a technical director in damage insurance and as a
finance director in the insurance sector, in France and in Canada.
Based on the above, the executive board is able to justify the individual and collective competence of the mem-
bers of the Audit Committee and the Risk Committee.

Management Report - 19
Corporate Governance
Competence and independence of
the Nomination Committee
and Remuneration Committee
AXA Bank Europe’s Nomination and Remuneration Committees consist of Jacques de Vaucleroy (until 30th June
2016), Frank Koster (until 13th July 2016) and Marc Bellis, all three non-executive directors.
Jacques de Vaucleroy is a lawyer, graduated from Université Catholique de Louvain (UCL) and has a Master’s in
Company Law from the Vrije Universiteit Brussel (VUB). He spent most of his career within the ING Group, where he
was notably a member of the executive committee. He had 23 years of experience in insurance, share and banking
management, in Europe and the United States, when in 2010 he was appointed managing director of AXA’s North-
ern, Central and Eastern Europe region (NORCEE). He is a member of the management committee and executive
committee of AXA (FR).
Frank Koster was appointed non-executive director of AXA Bank Europe in November 2014. Since September of the
same year, he was director and president of the management committee (CEO) of AXA Belgium. Prior to that, he
was CEO of ING Insurance Asia Pacific since 2009. He started his career within the ING Group in 1996 where he per-
formed various roles in the Netherlands and in Asia: Chief Marketing Officer of ING Insurance Korea from 2001 to
2003, CEO of ING Vysvya Life Insurance from 2004 to 2006 and the Group's Communication and Corporate Affairs
Manager in the Netherlands from 2006 to 2009.
Marc-Antoine Bellis was appointed independent director of AXA Bank Europe since the 23rd of August 2011. He is a
doctor of Law and graduated in Economic Law from ULB, and was a consultant in tax law for eight years. He was a
lawyer at the Brussels Bar. He has since then gained considerable experience in loans, ALM and risk and bank man-
agement, including internationally. Between 1994 and 2002 he was CEO of Fortis UK, and up to 2007 CEO Corporate,
Institutional & Public Banking for the Fortis Group. He was Chairman of the Belgian Luxembourg Chamber of Com-
merce in Great Britain and administrator of the Foreign Banks and Securities Houses Association.
Since 27 July 2016, as of the moment Jef Van In resigned as President of the Management Board of AXA Bank Eu-
rope, but remained as non-executive director with the function of Vice President, he was nominated as member of
the Nomination Committee and Remuneration Committee.
Jef Van In is a Commercial Engineer (K.U.L.) and has an Executive MBA from Flanders Business School. After a nation-
al and international career at ING Bank, he became CEO of AXA Bank Europe in 2011. In addition, in 2012 he be-
came responsible for the life insurance business of AXA in Central & Eastern Europe. In July 2016, Jef Van In became
CEO of AXA Belgium and beginning 2017 he became president of the Board of Directors of AXA Bank Europe.
Jef Van In was confirmed as member and President of both Committees.
Consequently, the Executive Board is able to justify the individual and collective competence of the member of the
Nomination and Remuneration Committees.

Management Report - 20
Remuneration Policy
Remuneration of the members of the Board of Directors
All the members of the Board of Directors are considered as “Identified Staff” (Category 1). As a consequence, the
principles set out under point 2 hereunder fully apply on them.
Non-executive directors
The remuneration of non-executive independent directors of AXA Bank Europe takes into account their investment in
relation to the work of the Executive Board. This is in line with market standards.
They are remunerated in the form of fees set by the General Meeting.
Furthermore, members of committees created within the Executive Board receive, for their specific roles, an annually
set remuneration by decision of the Executive Board, in accordance with the articles of association.
With non-executive non-independent directors being employees of an entity of the AXA Group, their mandate within
AXA Bank Europe’s Executive Board does not lead to any supplementary remuneration.
In general, non-executive directors do not receive any variable remuneration.
Executive directors
The remuneration policy applied by AXA Bank Europe rests on the AXA Group's remuneration policy, and is in accord-
ance with the Law relating to articles of association and monitoring credit institutions of 25 April 2014, known as the
Banking Act. The main objective involves aligning the principles and structure of AXA Bank Europe’s remunerations
with sound and efficient management of the company (including risk monitoring).
So, as to guarantee conformity with the remuneration policy, this is regularly reviewed by the Remuneration and Gov-
ernance Committee of the Group, and by the Remuneration Committee of the Executive Board concerned.
The policy concerning the remuneration of the directors should allow:
• to attract, develop, retain and motivate talent,
• to encourage and reward the best performance,
◊ both on an individual and collective level, and
◊ in the short, medium and long term
• to align the remuneration level with the results of the company,
• to guarantee adequate and efficient risk management.
The Remuneration Guidance follows three main guiding principles:
• the competitiveness and market consistency of remunerations,
• the coherence and internal equity, based on individual and collective performance, in order to ensure
fair and balanced remuneration reflecting employee’s individual quantitative and qualitative achieve-
ments and impact; and
• the results and the financial capacity of the company.

Management Report - 21
Remuneration of the “Identified Staff
“Identified Staff”
Taking into account Article 67 of the law of 25 April 2014 on the status and supervision of credit institutions and the im-
plementing decrees and the Delegated Regulation, and through additional criteria, the Board of Directors of AXA
Bank Europe has determined the perimeter of the Identified Staff as follows:
• Category 1: The members of the Board of Directors;
• Category 2: The members of the Management Committee and other Committees and their direct re-
ports;
• Category 3: The staff members with a position that implies risk-taking determined in accordance with
the Delegated Regulation and other regulations;
• Category 4: The control functions that are responsible for the operational independent control func-
tions ;
• Category 5: The staff members determined in accordance with the Delegated Regulation, of whom the
total remuneration places them on the same remuneration level as the senior management and the
persons with a position that implies risk-taking.
Structure of the remuneration of Identified Staff
The remuneration policy is structured in such a way that the total remuneration package is divided in a balanced way
between the fixed component and the variable component.
The composition of the total package aims not to encourage any risk-taking. The fixed component of the total remu-
neration package is significant enough to reward the staff members for their work, seniority, expertise and professional
experience and to guarantee a totally versatile variable remuneration policy being set out, and notably the possibility
of not paying any variable remuneration.
Fixed remuneration
Determining the fixed remuneration
The base pay of the Identified Staff is determined by taking into account the organizational responsibilities, as defined
in the job description and the positioning in relation to the external benchmark.
Certain categories of Identified Staff receive a recurring function premium. They are allocated transparently, in a non-
discriminatory way, on the basis of objective parameters and not associated with or subject to performance criteria. In
the event of changing position to a position not considered as Identified Staff, the person might no longer be entitled
to the function premium.
The fixed remuneration can also include benefits in kind.
Remuneration Policy
Management Report - 22
Evolution of the fixed remuneration
Decisions concerning the evolution of the fixed remuneration of Identified Staff are based on performance
(sustainable job fulfillment) and the positioning in relation to the external benchmark.
Individual increases are granted, based on the following principles:
• equitable treatment;
• strict delegation rules; and,
• a systematic double control by the line management and the HR- department.
Every performance year, AXA Bank Europe determines the budget available for the evolution of the fixed remunera-
tion of Identified Staff.
The results of AXA Bank Europe's past performance year (compared with the objectives defined) will be a determining
factor in setting the budget for the evolution of the fixed remuneration.
If AXA Bank Europe’s statutory results of the past performance year are negative or significantly lower than the set ob-
jectives, or for reasons of legal restrictions, AXA Bank Europe may decide to limit the budget to award those increases
that are due based on legal and/or contractual provisions.
Variable remuneration
Determining the variable remuneration
The variable remuneration is determined within the limits of the available budget and depending on the local and/or
professional market practices, the profits generated by the activity and the achievement of quantitative and qualita-
tive objectives on an individual level and on the level of the bank and the business line, as well as the contribution to
the risk management and the observance of the compliance rules.
◊ Determining the bonus budget
Each year AXA Bank Europe defines the total available budget for each “Band”.
The bonus pool is determined on the basis of a decision process that is based on the business results as well as on the
risk results. Check & Balances are key in this respect.
The envelopes for variable remuneration are determined on the basis of:
• the results generated by the activity (annual bonus pool);
• the market and achievements, amongst others with regard to risk;
• the financial situation of AXA Bank Europe, including the capital base and requirements and the liquidi-
ty;
• the realized profits; and,
• the profit expectation and long term expectation.
Each year, the bonus pools are determined in the course of the budget process by AXA Bank Europe in consultation
with the Finance and the General Management department under the surveillance and with approval of the Board of
Directors upon the advice from the Remuneration Committee. In doing so, account shall be taken of the direct input
from Risk Management on the “cost of risk” (risk-adjusted performance) or equivalent risk measures, depending on the
Remuneration Policy

Management Report - 23
scope of the budget.
Only the results realized by the institutions within the AXA-group to whom CRD IV and the Banking Law apply are taken
into consideration.
In the context of an ex ante risk adjustment, a risk analysis will be executed on the level of the enterprise and on the
level of the business line or a particular section thereof, without prejudice to the evaluation on an individual level.
Variable bonus pools for supporting functions and integrated control functions are - by way of derogation from the
above – determined independently of the performance of the business line of which they validate or control the trans-
actions.
In the event the entity performs poorly, the individual variable remunerations determined within the scope of the fund-
ing available will automatically be reduced proportionately.
◊ (Individual) performance
The performance of AXA Bank Europe, is taken into consideration by means of the result of the STIC (Short Term Incen-
tive Compensation) Grid. This “STIC Grid” consists of key indicators of activities and results with each receiving a certain
weighting, and taking risk criteria into account.
The (individual) performance is measured by the achievement of (individual) financial and non-financial performance
criteria, defined as:
• quantitative objectives (which are taken into account for at least 25% of the variable remuneration);
and,
• qualitative objectives (general attitude, risk awareness, alignment with the interests of the client, the
employee and the shareholder),
They are measured over various periods of time (achievements on a yearly basis, but also on a multiannual basis) for
the years to come by means of observed performances and individual assessments with regard to the fixed objectives.
These objectives are determined in accordance with a fixed system, whereby objectives are:
• determined based on the ‘SMART’ principle: Specific, Measurable, Assignable, Realistic, Time-related;
• determined by ‘success criteria’;
• balanced;
• validated by both parties; and,
• formalized in the performance document in ‘People In’ within the AXA Bank Europe deadline.
The Individual Performance Plan applies to the Identified Staff in all business lines of the bank and consists of an individ-
ual part that is linked to the performance score, that takes into account the results and risk/risk management objec-
tives.
◊ Ratio fixed remuneration – variable remuneration
The variable remuneration of each person of the Identified Staff is limited to a maximum of the following two amounts:
• € 50,000, without this amount being able to exceed that of the fixed remuneration
• 50% of the fixed remuneration
This restriction of the difference between the fixed remuneration and variable remuneration also applies for allocations
of variable remuneration in case of exceedance of the objectives (‘above target’) or in case of extraordinary
achievements.
Remuneration Policy

Management Report - 24
Process of allocation and individualization – individual assessment
Within AXA Bank Europe, the performance of the team to which the Identified Staff belongs and his or her individual
performance (performance is measured on the basis of the profit- and risk level with regard to that profit) is assessed (a
compulsory annual individual assessment carried out by the line manager) on the basis of at least the following ele-
ments:
• qualitative accomplishments in relation to the objectives set;
• professional behavior with regard to the values, compliance requirements and procedures applicable
at ABE, and aligned with the values and the leadership attitudes of the Group (“AXA Leadership Frame-
work”);
• contribution to risk management, including operational risk;
• the managerial behavior of the person where appropriate.
The Board of Directors, after advice from the Remuneration Committee will carry out an additional assessment for all
members of the Identified Staff taking into account:
• the contribution to the permanent control framework of the Bank;
• the involvement with material risks and subsequent decisions;
• incidents that would have occurred during the year and the corrective actions taken by the individual
or his managers.
This assessment may lead to an impact on the variable remuneration.
The assessment will be executed as much as possible with predetermined and applicable formulas and rules regarding
the assessment. Score cards or other equivalent methods will be used for this purpose, whereby from 2017 onwards a
formal evaluation will take place with regard to:
• compliance-criteria;
• a sound risk management.
The level of achievement of every objective and of the relevant leadership attitudes will be indicated amongst others
on the score card by a score and concrete remarks. In addition, an overall score (on WHAT and HOW) and a total per-
formance score will be attributed with a qualitative motivation in the relevant comment fields.
Depending on the realized quantitative and qualitative objectives, proposals for decisions will be determined.
Payment of the variable remuneration
In accordance with the Banking Act, at least 40% of the variable remuneration (up to 60% for the highest variable re-
muneration) is granted in the form of deferred variable remuneration, and at least 50% of the variable remuneration
must be paid in “financial instruments”.
This manner of remuneration, supported by employees’ long-term profit-sharing, allows a significant part of the varia-
ble remuneration to be deferred, all in accordance with the requirements of laws and national and international regu-
lations, and the requirements of national and international regulators.
◊ Conditional cash
The 50% in “financial instruments” will be paid as “conditional cash”.
Remuneration Policy

Management Report - 25
To ensure the differentiation with cash variable remuneration, the conditional cash is subject to a retention period and
targets after the retention period set in relation to
• solvability (floor 2017: 9,25%), liquidity (floor 2017:100%) & leverage (floor 2017:3%)
• A retention period of 1 year (as from grant/vesting) before the conditional cash payment will be effec-
tively made.
This leads to the following scheme:
◊ Exception for variable remuneration below € 75,000
The BNB's current administrative circulars authorize an exception to this rule for members of the Identified Staff whose
variable remuneration does not exceed € 75,000.
Malus and Clawback framework
The Bank’s malus and clawback provisions allow the Board of Directors to determine that, if appropriate, unvested ele-
ments under the deferred bonus plan can be forfeited/ adjusted or the already paid/vested variable remuneration
recovered in certain situations.
AXA Bank Europe will reduce the parts of the variable remuneration that are not yet paid or acquired of all (possibly
former) Identified Staff (malus) if AXA Bank Europe has a decreased or negative financial return on investment or if one
of the following situations is discovered:
• the Identified Staff does not comply with the applicable standards of expertise and professional integri-
ty;
• the Identified Staff is involved with practices that have led to considerable losses for AXA Bank Europe
or is responsible for such practices;
• the Identified Staff is involved with a special mechanism that has as its purpose or effect the promotion
of fiscal fraud by third parties;
• any circumstance that implies that the payment of the variable remuneration constitutes an infringe-
Assumptions
Performance year 2016
Upfront 60%
Deferred 40%
Spread over 5 years
Cash 50%
Conditional cash 50%
Payment date* 01/04/2017 01/04/2018 01/04/2019 01/04/2020 01/04/2021 01/04/2022 01/04/2023
Upfront Cash 30%
Conditional cash 30%
Deferred Total deferred granted 8% 8% 8% 8% 8%
Cash 4% 4% 4% 4% 4%
Conditional cash 4% 4% 4% 4% 4%
30% 34% 8% 8% 8% 8% 4%Total cash-flow profile
* Conditional cash is paid on the payment date if for the calendar year preceding the payment date, the condition has been
met
Remuneration Policy

Management Report - 26
ment of the good remuneration policy of AXA Bank Europe or of the risk management strategy or of its
limited to medium risk profile.
AXA Bank Europe will reclaim the variable remuneration that is already paid or acquired of all (possibly former) Identi-
fied Staff (clawback) if AXA Bank Europe has a decreased or negative financial return on investment or if one of the
following situations is discovered, and this within three years following the payment or, if the case may be, the acquisi-
tion of the variable remuneration:
• the Identified Staff does not comply with the applicable standards of expertise and professional integri-
ty;
• the Identified Staff is involved with practices which have led to considerable losses for AXA Bank Europe
or is responsible for such practices;
• the Identified Staff is involved with a special mechanism having as purpose or effect the promotion of
fiscal fraud by third parties
Clawback can be used if the malus adjustment on the unvested portion is insufficient given the nature and magnitude
of the issue.
In case of dismissal for misconduct (or for employees that already left AXA Bank Europe or its affiliated enterprises, the
conduct that would have lead to a dismissal if it were discovered while the staff member was still employed) and par-
ticularly when there is a breach of risk management procedures or a breach of the compliance or conduct rules or
dissimulation or an action that resulted in a distortion of the conditions under which the variable remuneration which
was initially allocated were set, all or part of the rights to the deferred parts of the initially allocated variable remunera-
tion shall immediately be lost (“malus”) and all elements of variable remuneration already paid shall possibly be re-
claimed (“clawback”). This principle will be entered into each plan that will be submitted to an Identified Staff mem-
ber for approval.
Specific rules relating to variable remuneration of Identified Staff employed on the trading floor
The variable remuneration fund is determined every year. It is calculated depending on the operating result of the
trading floor activities and the results of AXA Bank Europe. The distribution of the fund between the trading-floor em-
ployees as a whole is at the discretion of the management, and rests on attaining the individual quantitative and qual-
itative objectives set at the start of the year, and strictly respecting risk monitoring.
Specific rules relating to variable remuneration of independent control functions
The above mentioned principles of remuneration are similar for category 4 of the Identified Staff, namely persons oc-
cupying independent control functions (and including the Chief Risk Officer); with the following exceptions:
• AXA Bank Europe's performance is not taken into account for determining variable remuneration effec-
tively paid.
• Non-deferred variable remuneration is wholly and exclusively determined based on specific individual
criteria associated with the position (individual performance).
Remuneration Policy
Management Report - 27
Compensation in the event of contract termination
Without prejudice to the application of legal and regulatory provisions and agreements binding the company, sever-
ance payment that might be agreed with a person affected is determined so as not to reward failure or irregular be-
haviour.
For salaried members of staff, AXA Bank Europe ensures to respect the application of the legal provisions.
If an agreement relating to granting severance pay is concluded with a non-salaried director, the total of the pay-
ments granted shall not exceed 12 months of fixed and variable remuneration. An opt-out clause is only possible on
the condition of a reasoned opinion from the remuneration Committee and prior approval from the General Meeting.
Governance of the remuneration policy
AXA Bank Europe has a long-term remuneration plan, the rules of which are determined by the remuneration policy.
These rules may be adapted regularly, notably depending on decisions taken at the level of the AXA Bank’s Board of
Directors and the evolution of the (inter)national regulatory framework.
The Executive Board has decision-making competence concerning the establishment of the remuneration policy and
decision-making relating to the individual remuneration of the persons affected. In this domain, it is assisted by 2 com-
mittees: the Remuneration Committee and the Risk Committee.
The Remuneration Committee actively contributes to implementing the remuneration policy. It consists of non-
executive directors, at least one of whom is independent in the sense of the Companies Code. It is composed so as to
allow it to exercise pertinent and independent judgment on remuneration policies and practices, and on the incen-
tives created regarding the control of risks, equity requirements and the liquidity position.
The work of the Remuneration Committee consists in proposing, in the form of advice and in accordance with the re-
muneration policy, decisions to be taken by the Executive Board relating to remuneration principles and procedures. It
is also entrusted with preparing decision to be taken by the Executive Board, taking into account the repercussions on
the company's risk and risk management on the one hand and the long-term interests of shareholders, investors and
other stakeholders in the institution on the other, as well as the public interest.
The remuneration policy may be revised by decision of the Executive Board on a proposal from the Remuneration
Committee at any time, and notably in the event of legislative amendment associated with labour, accounting and
tax law, as well as in the event of the rules of governance changing.
Its implementation is subject, at least once a year, to an internal assessment aiming to verify whether it respects the
remuneration policies and procedures adopted by the Executive Board. If need be, the Remuneration Committee will
make adaptation proposals that are imposed.
The Risk Committee, consisting of non-executive directors, at least one of whom is independent in the sense of the
Companies Code, examines whether the incentives provided by the remuneration system take into account the ap-
propriate manner of risk control, equity requirements and the liquidity position of AXA Bank Europe, as well as the prob-
ability and staggering of profits, so as to ensure sound and efficient management of risk, preventing risk-taking ex-
ceeding the level tolerated by AXA Bank Europe.
Remuneration Policy

Management Report - 28
Quantitative information on remuneration awarded to Identified Staff for the financial year 2016
Total Remuneration of Identified Staff in 2016 (Excluding non executive board members compensation)
The quantitative information set out below concerns the remuneration awarded for the year 2016 to Identified Staff
within the meaning of CRDIV and the Belgian banking law, but does not reflect remuneration awarded to other em-
ployees:
Structure of the variable component of remuneration:
Deferred remuneration paid or reduced as a result of the year’s performance:
*No reduc�ons of deferred compensa�on in 2016
Number of people
concerned Amount of total compensa'on
Amount of fixed
compensa'on
Amount of variable compensa'on
awarded
54 10.931.566 € 8.451.452 € 2.480.114 €
Payment in cash Payment in shares or equivalent instruments
Variable component under 75k 100% 0%
Variable component above or equal to 75k
50% 50%
Amount of deferred compensa'on paid Amount of reduc'ons of deferred
1.434.814 € 0 €*
Remuneration Policy

Management Report - 29
Sums paid to new hires and terminations during the year
Number of MRT employees whose total remuneration for 2016 exceeded EUR 1 million
Severance Payments and number of beneficiaries Sign-on payments paid to new hires and number of
beneficiaries
Amounts paid Number of beneficiaries Amounts paid Number of beneficiaries
140.000 € 1 50.000 € 1
Total compensa'on Number of MRTs for the year 2016
Between EUR 1 million and EUR 1.5 million 0
Between EUR 1.5 million and EUR 2 million 0
Between EUR 2 million and EUR 2.5 million 0
Remuneration Policy

Ma
na
ge
me
nt
Re
po
rt -
3
0
AXA Director on 31/12/2016
Position at AXA Bank Europe
Company or external mandate
exercised Registered Office
Area of activity
Registration on regulated market
External position exercised
Shareholding rela-tionship with AXA
Bank Europe more than 5%?
Véronique Weill President of the
Board of Directors Valeo SA
43, rue Bayen – 75017 Paris Cedex 17
France
Automotive
supplier Yes
Non-executive
director No
Patrick Keusters
Virix SA
Keizershoek 350A 2550 – Kontich
Belgium
Real-estate
projects No
Non-executive
director No
Orcadia Asset Ma-
nagement SA
13, rue de l’Industrie L -8699 Windhof
GD Luxembourg
Investment com-
pany No
Non-executive
director No
Stoll Security SA
Z.A.R.E. Ilot Ouest L 4384 Ehlerange
Luxembourg Security No
Non-executive
director No
Philippe Rucheton
Independent Director and
President of the
Risk Committee
Bernard Controls
SA
4, rue d’Arsonval BP 76091 95505 Go-
nesse
France
Electro-
mechanical No
Non-executive
director No
Independent
Director and
President of the
Audit Committee
VAT BE0404.476.83533
AXA Bank Europe
2016 IFRS Consolidated Financial Statements

VAT BE0404.476.8354 –4
Contents CONSOLIDATED INCOME STATEMENT ............................................................................................................................................................6
CONSOLIDATED BALANCE SHEET ................................................................................................................................................................. 10
CONSOLIDATED STATEMENT OF CHANGES IN EQUITY ................................................................................................................................ 12
CONSOLIDATED CASH FLOW STATEMENT ................................................................................................................................................... 14
NOTES TO THE CONSOLIDATED FINANCIAL STATEMENTS .......................................................................................................................... 17
1 GENERAL ............................................................................................................................................................................................ 17
2 ACCOUNTING POLICIES ..................................................................................................................................................................... 17
2.1 CONSOLIDATION PRINCIPLES ....................................................................................................................................................... 17
2.2 FINANCIAL INSTRUMENTS – SECURITIES ..................................................................................................................................... 17
2.3 FINANCIAL INSTRUMENTS – LOANS AND RECEIVABLES ............................................................................................................. 21
2.4 TREASURY ...................................................................................................................................................................................... 24
2.5 FEE INCOMEAND FINANCIAL GUARANTEES ................................................................................................................................. 25
2.6 EQUITY ............................................................................................................................................................................................ 26
2.7 FINANCIAL LIABILITIES AND BANK DEPOSITS .............................................................................................................................. 26
2.8 FOREIGN CURRENCY TRANSLATION ............................................................................................................................................. 27
2.9 CONTINGENT ASSETS AND LIABILITIES AND PROVISIONS .......................................................................................................... 28
2.10 EMPLOYEE BENEFITS ................................................................................................................................................................ 29
2.11 INCOME TAXES ........................................................................................................................................................................... 29
2.12 PROPERTY, PLANT AND EQUIPMENT AND INTANGIBLE ASSETS ............................................................................................. 30
2.13 OTHER ASSETS AND LIABILITIES ............................................................................................................................................... 32
2.14 SUPPLEMENTARY INFORMATION .............................................................................................................................................. 33
3 APPLICATION OF IFRS BY AXA BANK EUROPE .................................................................................................................................. 35
3.1 APPLICATION DATES ...................................................................................................................................................................... 35
4 RISK MANAGEMENT .......................................................................................................................................................................... 40
4.1 GENERAL ........................................................................................................................................................................................ 40
4.2 CREDIT RISK .................................................................................................................................................................................. 41
4.3 MARKET RISK ................................................................................................................................................................................ 46
4.4 CURRENCY RISK ............................................................................................................................................................................ 47
4.5 LIQUIDITY RISK .............................................................................................................................................................................. 47
4.6 OPERATIONAL RISK ....................................................................................................................................................................... 48
4.7 STRATEGIC RISK ............................................................................................................................................................................ 49
4.8 CAPITAL MANAGEMENT ................................................................................................................................................................. 49
5 FAIR VALUE OF FINANCIAL ASSETS AND LIABILITIES ....................................................................................................................... 53
5.1 FAIR VALUE - RETAIL ACTIVITIES ................................................................................................................................................... 53
5.2 FAIR VALUE - FINANCING ACTIVITIES (TREASURY) ....................................................................................................................... 53
5.3 DAY ONE RESULTS......................................................................................................................................................................... 56
5.4 APPLICATION OF CVA AND DVA ON THE DERIVATIVE PORTFOLIO ............................................................................................... 56
6 CRITICAL ACCOUNTING ESTIMATES AND JUDGEMENTS.................................................................................................................. 57
7 FEE AND COMMISSION INCOME (EXPENSES) .................................................................................................................................. 58
8 REALISED GAINS (LOSSES) ON FINANCIAL ASSETS AND LIABILITIES NOT MEASURED AT FAIR VALUE THROUGH PROFIT OR
LOSS ........................................................................................................................................................................................................... 59
9 GAINS (LOSSES) ON FINANCIAL ASSETS AND LIABILITIES DESIGNATED AT FAIR VALUE TROUGH PROFIT AND LOSS................. 60
10 GAINS (LOSSES) FROM HEDGE ACCOUNTING .............................................................................................................................. 61
11 OTHER OPERATING NET INCOME .................................................................................................................................................. 62
12 OPERATIONAL LEASE AGREEMENTS ............................................................................................................................................ 63
13 PERSONNEL EXPENSES ................................................................................................................................................................ 64
13.1 BREAKDOWN OF PERSONNEL EXPENSES ................................................................................................................................ 64
13.2 PENSION COMMITMENTS AND OTHER BENEFITS.................................................................................................................... 64
13.3 SHARE-BASED PAYMENTS......................................................................................................................................................... 68
14 GENERAL AND ADMINISTRATIVE EXPENSES ................................................................................................................................ 71
15 IMPAIRMENT .................................................................................................................................................................................. 72
16 INCOME TAXES .............................................................................................................................................................................. 77
17 CASH AND BALANCES WITH CENTRAL BANKS ............................................................................................................................. 82
18 FINANCIAL ASSETS HELD FOR TRADING ...................................................................................................................................... 82
19 FINANCIAL ASSETS DESIGNATED AT FAIR VALUE THROUGH PROFIT OR LOSS .......................................................................... 83
VAT BE0404.476.8355 –5
20 AVAILABLE-FOR-SALE FINANCIAL ASSETS .................................................................................................................................... 84
21 LOANS AND RECEIVABLES ............................................................................................................................................................ 85
22 DERIVATIVES .................................................................................................................................................................................. 87
23 PROPERTY, PLANT AND EQUIPMENT ............................................................................................................................................ 93
24 INTANGIBLE FIXED ASSETS ........................................................................................................................................................... 94
25 INVESTMENTS IN ASSOCIATES, SUBSIDIARIES AND JOINT VENTURES ...................................................................................... 95
26 OTHER ASSETS .............................................................................................................................................................................. 96
27 FINANCIAL LIABILITIES HELD FOR TRADING ................................................................................................................................. 97
28 FINANCIAL LIABILITIES DESIGNATED AT FAIR VALUE THROUGH PROFIT OR LOSS .................................................................... 98
29 FINANCIAL LIABILITIES MEASURED AT AMORTISED COST ......................................................................................................... 100
29.1 DEPOSITS ................................................................................................................................................................................. 100
29.2 SUBORDINATED LIABILITIES.................................................................................................................................................... 101
30 REPOS AND REVERSE REPOS ..................................................................................................................................................... 103
31 PROVISIONS ................................................................................................................................................................................. 105
32 OTHER LIABILITIES ....................................................................................................................................................................... 107
33 OFFSETTING ................................................................................................................................................................................. 108
34 CONTINGENT ASSETS AND LIABILITIES ...................................................................................................................................... 110
35 EQUITY .......................................................................................................................................................................................... 112
36 PROFIT ALLOCATION AND DIVIDENDS PER SHARE .................................................................................................................... 112
37 SEGMENTED INFORMATION ....................................................................................................................................................... 113
38 RELATED-PARTY TRANSACTIONS ................................................................................................................................................ 115
39 GOVERNMENT GRANTS AND ASSISTANCE ................................................................................................................................. 117
40 FINANCIAL RELATIONSHIPS WITH AUDITORS ............................................................................................................................. 118
41 DISCONTINUED OPERATIONS ..................................................................................................................................................... 119
42 EVENTS AFTER THE BALANCE SHEET DATE ............................................................................................................................... 120
All amounts included in the tables in the financial statements are expressed in thousands of euros, and the comments in millions of
euros, unless stated otherwise. The figures are presented according to absolute values and must therefore be read in conjunction
with the description of the relevant section, except in sections where there is a distinction between profits (absolute value) and losses
(- sign).
The annual accounts of AXA Bank Europe have been officially filed at the Central Balance Sheet Office of the National Bank of Bel-
gium. This document in English is a free translation of the annual accounts produced in French and Dutch.
If a discrepancy should exist between the information contained in this publication and the official version filed at the National Bank
of Belgium (NBB), it is the latter that prevails.

VAT BE0404.476.8356 –6
Consolidated Income Statement
Consolidated income statement
in '000 EUR2016.12 2015.12 Disclosure
CONTIN UING OPERATIONS
Financial & operating income and expenses 361.772 369.813
Interest income 2.318.678 2.234.785
Financial assets held for trading (if accounted for separately) 1.720.509 1.534.124
Financial assets designated at fair value through profit or loss (if accounted for
separately)
Available-for-sale financial assets 99.635 135.250
Loans and receivables (including finance leases) 463.747 513.588
Held-to-maturity investments
Derivatives - Hedge accounting, interest rate risk 21.566 48.919
Other liabilities 16 2.903
On liabilities 13.206
(Interest expenses) 2.081.903 1.998.700
Financial liabilities held for trading (if accounted for separately)
1.691.748 1.527.653
Financial liabilities designated at fair value through profit or loss (if accounted for
separately) 36.760 39.131
Financial liabilities measured at amortised cost 203.881 260.062
Derivatives - Hedge accounting, interest rate risk 147.447 171.765
Other liabilities 90
On assets 2.068
Expenses on share capital repayable on demand
Dividend income 1.670 9
Financial assets held for trading (if accounted for separately)
Financial assets designated at fair value through profit or loss (if accounted for
separately)
Available-for-sale financial assets 1.670 9
Fee and commission income 53.001 43.888 7
(Fee and commission expenses) 42.441 35.973
Realised gains (losses) on financial assets & liabilities not measured at fair value
through profit or loss, net
261.980 59.233
8
Available-for-sale financial assets 261.089 56.383
Loans and receivables (including finance leases) 891 2.850
Held-to-maturity investments
Financial liabilities measured at amortised cost
Other
Gains (losses) on financial assets and liabilities held for trading (net) -1.589 31.949
Equity instruments and related derivatives 3.592 -2.780
Interest rate instruments and related derivatives 15.977 45.881
Foreign exchange trading -21.158 -11.152
Credit risk instruments and related derivatives
Commodities and related derivatives
Other (including hybrid derivatives)
Gains (losses) on financial assets and liabilities designated at fair value through profit
or loss (net)
2.705 44.550
9
Gains (losses) from hedge accounting -205.650 -44.645 10
Exchange differences , net 23.679 5.056
Gains (losses) on derecognition of assets other than held for sale, net -34
Other operating net income 31.675 29.661 11

VAT BE0404.476.8357 –7
Consolidated income statement
in '000 EUR2016.12 2015.12 Disclosure
Administration costs 255.852 246.821
Personnel expenses 92.421 107.190 13
General and administrative expenses 163.432 139.631 14
Depreciation 4.572 4.344
Property, Plant and Equipment 2.179 2.203 23
Investment Properties
Intangible fixed assets (other than goodwill) 2.393 2.141 24
Provisions 5.740 -6.554
Impairment 12.846 27.938 15
Impairment losses on financial assets not measured at fair value through profit or loss 12.846 27.920
Financial assets measured at cost (unquoted equity)
Available for sale financial assets
Loans and receivables (including finance leases) 12.846 27.920
Held to maturity investments
Impairment on 18
Property, plant and equipment
Investment properties
Goodwill
Intangible fixed assets (other than goodwill) 18
Investments in associates and joint ventures accounted for using the equity
method
Other
Negative goodwill immediately recognised in profit or loss
Share of the profit or loss of associatesand joint ventures accounted for using the equity
method
Profit or loss from non-current assets and disposal groups classified as held for sale not
qualifying as discontinued operations
TOTAL PROFIT OR LOSS BEFORE TAX FROM C ONTIN UING OPERATIONS
82.761 97.264
Tax expense (income) related to profit or loss from continuing operations 15.821 16.592 16
TOTAL PROFIT OR LOSS AFTER TAX FROM C ONTIN UING OPERATIONS 66.940 80.672
Total profit or loss after tax from discontinued operations 28.395 -53.444
TOTAL PROFIT OR LOSS AFTER TAX AND DISCONTINUED OPERATIONS AN D
BEFORE M INORITY INTEREST 95.335 27.228
Profit or loss attributable to minority interest
NET PROFIT OR LOSS 95.335 27.228
Table CIS.1

VAT BE0404.476.8358 –8
Consolidated statement of real ised and non-real ised results
in '000 EUR2016.12 2015.12
PROFIT (LOSS) FOR THE YEAR 95.335 27.228
N ON -REALISED RESULTS
Elements not transferrable to result -10.554 16.777 (3)
Actuarial gains (losses) on defined benefit pension plans -15.988 25.417
income tax related to previous elements 5.434 -8.639
Transferred to profit or loss -75.706 8.721
Foreign currency translation 142 -2.688
Translation gains/losses taken to equity 142 -2.688
Transferred to profit or loss
Other reclassifications
Cash flow hedges (effective portion) -17.105 12.766 (1)
Valuation gains/losses taken to equity -23.035 -16.009
Transferred to profit or loss 5.930 28.775
Transferred to initial carrying amount of hedged items
Other reclassifications
Available-for-sale financial assets -93.681 -86 (2)
Valuation gains/losses taken to equity 818 -10.407
Transferred to profit or loss -94.499 10.321
Other reclassifications
Non-current assets and disposal groups classified as held for sale -3.040 3.040
Income tax relating to components of other non-realised results 37.978 -4.311
TOTAL NON-REALISED RESULTS FOR THE YEAR -86.260 25.498
TOTAL REALISED AN D NON-REALISED RESULTS FOR THE YEAR 9.075 52.726
Attributable to equity holders of the parent 9.075 52.726
Attributable to minority interest
Table CIS.2

VAT BE0404.476.8359 –9
The table below presents the amounts before tax as well as the deferred taxes with respect to the items disclosed in the previous
table (overview in thousands of euros).
Cash f low hedges (1) 2016.12 2015.12
Gross -17.105 12.766
Tax 5.814 -4.340
Net (1) -11.291 8.426
F inancial investments available for sale (2) 2016.12 2015.12
Gross -93.681 -86
Tax 32.164 29
Net (2) -61.517 -57
Actuarial gains (losses) on defined benefit plans (3) 2016.12 2015.12
Gross -15.988 25.417
Tax 5.434 -8.639
Net (3) -10.554 16.778
Table C IS.3

VAT BE0404.476.83510 –10
Consolidated Balance Sheet
Consolidated Balance Sheet - Assets
in '000 EUR2016.12 2015.12 Annexes
Cash and balances with central banks 657.176 337.156 17
Financial assets held for trading 1.643.504 1.555.673 18 / 21
Financial assets designated at fair value through profit or loss
0 19
Available-for-sale financial assets 4.304.987 7.838.627 20
Loans and receivables 20.650.591 19.765.932 21
Held-to-maturity investments
Derivatives - hedge accounting 97.758 126.126 22
Fair value changes of the hedged items in portfolio hedge of interest rate risk
478.032 498.363
Tangible fixed assets 39.815 41.379
Property, Plant and Equipment 39.815 41.379 23
Investment property
Intangible fixed assets 8.537 6.885
Goodwill
Other intangible assets 8.537 6.885 24
Investments in associates, subsidiaries and joint ventures (accounted for using
the equity method- including goodwill)
25
Tax assets 15.939 4.833
Current tax assets 4.473 4.815 16
Deferred tax assets 11.466 18
Other assets 98.168 101.635 26
Non-current assets and disposal groups classified as held for sale
633.047
TOTAL ASSETS 27.994.508 30.909.656
Table CBS.1
Consolidated Balance Sheet - Liabilit ies
in '000 EUR2016.12 2015.12 Annexes
Financial liabilities held for trading 1.104.317 900.768 27
Financial liabilities designated at fair value through profit or loss
1.484.385 1.633.560 28
Financial liabilities measured at amortised cost22.369.680 21.466.856 29
Deposits from Credit institutions 48.640 10.783
Deposits from Other than credit institutions 17.863.958 16.988.998
Debt certificates including bonds 3.457.918 3.249.269
Subordinated liabilities 89.042 117.807
Other financial liabilities 910.121 1.099.998
Financial liabilities associated with transferred assets 1.031.061 4.082.301 30
Derivatives - hedge accounting 401.701 544.533 22
Fair value changes of the hedged items in a portfolio hedge of interest rate risk
89.180 112.118
Provisions 233.169 209.007 31
Tax liabilities 36.715 60.325
Current tax liabilities 27.945 27.672 16
Deferred tax liabilities 8.770 32.653
Other liabilities 62.466 63.778 32
Liabilities included in disposal groups classified as held for sale
662.704
Share capital repayable on demand ( e.g. cooperative shares)
TOTAL LIABILITIES 26.812.673 29.735.950
Table CBS.2

VAT BE0404.476.83511 –11
Reconciliation of the available for sale revaluation reserve
Consolidated Balance Sheet - Equity
in '000 EUR2016.12 2015.12 Annexes
Share capital 681.318 681.318
Paid in capital 681.318 681.318
Called up share capital
Share premium
Other Equity 91.125 91.120
Equity component of combined financial instruments 90.000 90.000
Other 1.125 1.120
Non-realised results 47.915 134.175
Tangible fixed assets
Intangible fixed assets
Hedge of net investments in foreign operations (effective portion)
Foreign currency translation 147 5
Cash flow hedges (effective portion) -21.859 -10.568
Available for sale financial assets 93.830 155.347
Non-current assets and disposal groups held for sale
3.040
Actuarial gains/losses relating to defined benefit plans -24.203 -13.649
Reserves (including retained earnings) 266.141 239.864
<Treasury shares>
Income from current year 95.335 27.228
<Interim dividends>
Minority interest
Revaluation reserves and other valuation differences
Other items
TOTAL EQUITY 1.181.835 1.173.706 35
TOTAL LIABILITIES AND EQUITY 27.994.508 30.909.656
Table CBS.3
2016-12 Gross value Impact on taxes net value
Opening balance 235.319 -79.971 155.348
Investment brought in prior accounting periods
Transfer to P&L following sale -143.712 48.848 -94.864
Transfers to P&L following changes in premium/discount 49.213 -16.727 32.486
Foreign exchange impact
Adjustments in the current accounting period -1.168 719 -449
Investments bought in the current accounting period
Adjustements in the current accounting period 1.985 -675 1.310
Closing balance 141.637 -47.806 93.831
Table CBS.3
2015-12 Gross value Impact on taxes net value
Opening balance 235.403 -79.998 155.405
Investment brought in prior accounting periods
Transfer to P&L following sale -56.379 -56.379
Transfers to P&L following changes in premium/discount 66.703 66.703
Foreign exchange impact -1 -1
Adjustments in the current accounting period -10.407 27 -10.380
Investments bought in the current accounting period
Adjustements in the current accounting period 0
Closing balance 235.319 -79.971 155.348
Table CBS.4

VAT BE0404.476.8351212
Consolidated Statement of Changes in Equity
* of which 95.3 million EUR attributable to the shareholders of the parent company
Pa
id in
ca
pit
al
Eq
uit
y co
mp
on
en
ts o
f co
mb
ine
d f
ina
nci
al i
nst
rum
en
ts
Oth
er
eq
uit
y in
stu
me
nts
Un
rea
lise
d g
ain
s a
nd
loss
es
- re
serv
es
fro
m f
ore
ign
cu
rre
ncy
tra
nsl
ati
on
s
Un
rea
lise
d g
ain
s a
nd
losse
s - c
ash
flo
w h
ed
ge
s
un
rea
lise
d g
ain
s a
nd
loss
es -
ava
ilab
le f
or
sale
fin
an
cia
l
ass
ets
act
ua
ria
l ga
ins
an
d lo
sse
s - p
en
sio
n b
en
efi
ts
no
n c
urr
en
t a
sse
ts a
nd
dis
po
sa
l gro
up
s - h
eld
fo
r sa
le
rese
rve
s (i
ncl
ud
ing
re
tain
ed
ea
rnin
gs)
inco
me
fro
m c
urr
en
t ye
ar*
Tota
l
Opening balance 681.318 90.000 1.120 5 -10.568 155.347 -13.649 3.040 239.864 27.228 1.173.706
changes in capital
issuance
profit (loss) 95.335 95.335
Cash dividents declared
Revaluation change of available for sale financial assets -61.517 -61.517
changes in fair value 5 142 -10.554 -10.406
cash flow hedges -11.291 -11.291
releases to retained earnings 26.276 -27.228 -952
capital reduction 0
other -3.040 -3.040
Closing balance 681.318 90.000 1.125 147 -21.859 93.830 -24.203 0 266.141 95.335 1.181.835
Table CSCE.2
Sources of equity changes
2016.12
in '000 eur

VAT BE0404.476.83513 –13
* of which 27.2 million EUR attributable to the shareholders of the parent company
Pa
id in
ca
pit
al
Eq
uit
y co
mp
on
en
ts o
f co
mb
ine
d f
ina
nci
al i
nst
rum
en
ts
Oth
er
eq
uit
y in
stu
me
nts
Un
rea
lise
d g
ain
s a
nd
loss
es
- re
serv
es
fro
m f
ore
ign
cu
rre
ncy
tra
nsl
ati
on
s
Un
rea
lise
d g
ain
s a
nd
loss
es
- ca
shfl
ow
he
dg
es
un
rea
lise
d g
ain
s a
nd
loss
es
- ava
ilab
le f
or
sale
fin
an
cia
l
ass
ets
act
ua
ria
l ga
ins
an
d lo
sse
s - p
en
sio
n b
en
efi
ts
no
n c
urr
en
t a
sse
ts a
nd
dis
po
sal g
rou
ps
- he
ld f
or
sale
rese
rve
s (i
ncl
ud
ing
re
tain
ed
ea
rnin
gs)
inco
me
fro
m c
urr
en
t ye
ar*
Tota
l
Opening balance 681.318 90.000 581 2.693 -18.995 155.405 -30.427 0 289.343 -48.150 1.121.768
changes in capital 0 0
issuance 0 0
profit (loss) 27.228 27.228
Cash dividents declared 0
Revaluation change of available for sale financial assets -58 -58
changes in fair value 539 -2.688 16.778 14.629
cash flow hedges 8.427 8.427
releases to retained earnings -49.478 48.150 -1.328
capital reduction 0
other 3.040 3.040
C losing balance 681.318 90.000 1.120 5 -10.568 155.347 -13.649 3.040 239.864 27.228 1.173.706
Table CSCE.2
Sources of equity changes
2015.12
in '000 eur

VAT BE0404.476.83514 14
Consolidated Cash Flow Statement
OPERATING AC TIVITIES2016.12
in '000 EUR
2015.12
in '000 EUR
Net profit (loss) 95.334 27.228
Adjustments to reconcile net profit or loss to net cash provided by operating activities: 15.952 120.543
(Current and deferred tax income, recognised in income statement)
Current and deferred tax expenses, recognised in income statement 15.821 16.592
Unrealised foreign currency gains and losses -2.688
FV through P&L 131 106.639
INVESTING AND FINANCING 11.678 25.728
Depreciation 4.572 4.362
Impairment 12.846 27.920
Provisions net -5.740 -6.554
Other adjustments -14.540 19.028
Cash flows from operating profits before changes in operating assets and l iabi l it ies 108.424 192.527
Decrease (increase) in working capital (excl. cash & cash equivalents): 247.359 -182.843
Decrease (increase) in operating assets (excl. cash & cash equivalents): 2.494.156 12.093.734
Decrease (increase) in balances with central banks
Decrease (increase) in loans and receivables -897.505 5.873.111
Decrease (increase) in available-for-sale assets 3.475.590 1.411.777
Decrease (increase) in financial assets held for trading -87.831 4.856.793
Decrease (increase) in financial assets designated at fair value through profit or loss
Decrease (increase) in asset-derivatives, hedge accounting 28.368 45.933
Decrease (increase) in non-current assets held for sale
Decrease (increase) in other assets (definition balance sheet) -24.466 -93.880
Increase (decrease) in operating liabilities (excl. cash & cash equivalents): -2.246.798 -12.276.577
Increase (decrease) in deposits from credit institutions 83.663 70.765
Increase (decrease) in deposits (other than credit institutions) 679.154 -75.416
Increase (decrease) in debt certificates (including bonds) 208.649 -208.095
Increase (decrease) in financial liabilities held for trading 192.317 -5.386.880
Increase (decrease) in financial liabilities designated at fair value through profit or loss -137.812 -39.293
Increase (decrease) in liability-derivatives, hedge accounting -156.730 -485.823
Increase (decrease) in other financial liabilities -3.091.117 -6.169.367
Increase (decrease) in other liabilities (definition balance sheet) -24.921,72 17.532
355.783 9.684
Income taxes (paid) refunded -2.216 -6.741
Net cash f low from operating activit ies 353.566 2.943

VAT BE0404.476.83515 15
INVESTING ACTIVITIES2016.12
en '000 EUR
2015.12
en '000 EUR
(Cash payments to acquire tangible assets) -615 2.197
Cash receipts from the sale of tangible assets
(Cash payments to acquire intangible assets) -4.045 -3.597
Net cash f low from investing activities -4.660 -1.400
FINANCING AC TIVITIES2016.12
en '000 EUR
2015.12
en '000 EUR
(Dividends paid)
Cash proceeds from the issuance of subordinated liabilities
(Cash repayments of subordinated liabilities) -28.765 -50.860
Cash proceeds from issuing shares or other equity instruments
Net cash f low from f inancing activit ies -28.765 -50.860
Effect of exchange rate changes on cash and cash equivalents
2016.12
en '000 EUR
2015.12
en '000 EUR
NET INCREASE IN CASH AND CASH EQUIVALENTS 320.020 -49.319
CASH AND CASH EQUIVALENTS AT BEGINNING OF THE PERIOD 337.156 386.474
CASH AND CASH EQUIVALENTS AT END OF THE PERIOD 657.176 337.155
Components of cash and cash equivalents:
On hand (cash) 57.389 62.342
Cash and balances with central banks 560.706 269.567
Loans and receivables 39.081 5.246
Available-for-sale assets
Total cash and cash equivalents at end of the period 657.176 337.155
Of which: amount of cash and cash equivalents held by the enterprise, but not available for use by the
group
Undrawn borrowing facilities (with breakdown if material)
Supplemental disclosures of operating cash flow information:
Interest income received 2.318.679 2.234.785
Dividend income received
Interest expense paid 2.081.904 1.998.610
2016.12
en '000 EUR
2015.12
en '000 EUR
changes arising from discontinued operation 29.657
changes arising from discontinued investment activity
changes arising from discontinued financing activities

VAT BE0404.476.83516 16
In 2016, the cash and cash equivalents increased by 320.0 million EUR, mainly due to an increase in current accounts at central banks
(+ 291.1 million EUR).
This increase is primarily found in business activities (+ 353.6 million EUR). On the other hand, cash flows from operating profits in-
creased by 108.4 million EUR. In addition, the net cash flows from changes in company asset and liabilities increased by 247.4 million
EUR. The company assets decreased by 2,494.2 million EUR, especially in the available-for-sale assets (-3,475.6 million EUR) offset by
an increase in loans and receivables (+ 897.5 million EUR). Company liabilities dropped by 2,246.8 million EUR, mainly due to a reduc-
tion in the other financial obligations by 3,091.1 million EUR (drop in repos), partly compensated by a rise in client deposits by 679.2
million EUR.
The investment activities led to a reduction in cash and cash equivalents by 4.7 million EUR. This occurred mostly in the rise in intangi-
ble assets by 4.0 million EUR.
The financing activities led to a reduction in cash and cash equivalents by 28.8 million EUR, mainly due to a repayment of deferred
loans.

VAT BE0404.476.83517 17
Notes to the Consolidated Financial Statements
1 General
At 31 December 2016, AXA Bank Europe, a limited company under Belgian law, whose registered office is at 1170 Brussels,
Vorstlaan/boulevard du Souverain 25 was a subsidiary 100% owned by AXA SA.
The legal consolidation scope of AXA Bank Europe comprises the Belgian bank activities, the branch office of AXA Bank Hungary and the
subsidiaries of Royal Street NV, AXA Belgium Finance B.V. and AXA Bank Europe SCF (Société de Crédit Foncier).
The following subsidiaries were not recognised in the consolidation scope during the financial year 2016 given their negligible signifi-
cance (see more about this under chapter 2.1).
- Motor Finance Company N.V.
- Beran NV
Further information regarding these companies is found under chapter 25 Investments in associates, subsidiaries and joint ventures.
The measurement method can be found in chapter 20 Available-for sale financial assets.
In Belgium, AXA Bank Europe provides a broad range of financial products to individuals and small businesses and has a network of
exclusive independent bank agents who also support the sale of AXA Insurance and AXA Investment Managers’ products.
The leading products of AXA Bank Europe in Belgium are St@rt2bank: a free current account and related savings account, mortgage
credits, short-term loans and, in particular, loans for home renovations.
2 Accounting Policies
2.1 Consolidation Principles
2.1.1 General
AXA Bank Europe currently only has subsidiaries, i.e., companies over which it exercises full control, and an associated company, as
mentioned under chapter 25, that is not consolidated for immateriality reasons.
Typically, all subsidiaries must be fully consolidated.
As a departure from this principle, AXA Bank Europe has decided, on the basis of the principles of relevance and immateriality, not to
integrate the subsidiaries that are out of the consolidation scope for the application of the IFRS consolidated financial statements. This
decision applies to subsidiaries whose total balance during the previous financial year constitutes less than 0.15% of the total balance
for AXA Bank Europe, unless decided otherwise by the Board of Directors.
The subsidiary AXA Belgium Finance BV as well as the SPV Royal Street NV and the SCF AXA Bank Europe (Société de Crédit Foncier) are
fully consolidated.
2.1.2 Purchase of Entities of the AXA Group
With regard to business combinations with other entities of the AXA Group, these entities fall under common control and thus, these
business combinations are not covered by IFRS 3 – Business Combinations. AXA Bank Europe applies, in such a case, a method under
which the integrated assets and liabilities retain the same carrying amount as the purchased entity. Adjustments are only implemented
to achieve harmonisation of accounting policies.
2.2 Financial Instruments – Securities
2.2.1 Fixed Income Securities
Fixed income securities are defined as negotiable securities, which generate interest revenue through coupons or interest capitalisation.
Mortgage certificates also fall under this definition.

VAT BE0404.476.83518 18
2.2.1.1 Initial Recognition
The initial recognition of fixed income securities on the balance sheet takes place on the transaction date.
When fixed income securities are initially recognised they are recognised at their fair value, i.e., their purchase value (including paid
accrued interests).
Upon their initial recognition, the fixed income securities, depending on the existing options and the measurement objective, are desig-
nated in one of the following categories:
(i) Assets at fair value held for trading
(ii) Assets designated at fair value through profit or loss;
(iii) Assets held to maturity;
(iv) Loans and receivables;
(v) Assets available for sale.
Typically, the fees related to the transaction must be capitalised with the purchase value for categories (iii), (iv) and (v). Due to the
principle of immateriality, AXA Bank Europe decided to directly include these fees in the income statement.
(i) Assets at Fair Value Held for Trading
Fixed income securities are classified as assets held at fair value for trading if they are:
- primarily acquired or entered into with the purpose of being sold or bought back in the short term;
- form part of identified financial instruments that are jointly managed and for which indications exist of a recent, actual pat-
tern of short-term profit taking.
Even though IAS 39 allows for reclassifications outside of this category under strict conditions, AXA Bank Europe has not made use of
this option up to now.
For the determination of the net profits and net losses:
- a distinction is made between profit margin and changes in value due to changes in fair value;
- no distinction is made between capital gains / losses and rating profits and losses;
- changes in value are netted.
(ii) Assets Designated at Fair Value through Profit or Loss
This classification is used at AXA Bank Europe in the following three circumstances:
1. The classification leads to more relevant information since it eliminates or significantly reduces a measurement or recogni-
tion inconsistency (sometimes referred to as ‘an accounting mismatch’) that would otherwise arise from measuring assets
or liabilities or recognising the gains and losses on them based on different rules. In most cases it involves fixed income
securities, which are hedged by derivatives, but where it was not decided to apply hedge accounting.
2. The classification leads to more relevant information since a group of financial assets, i.e., specific categories of invest-
ment funds, are managed and their performance evaluated on the basis of their fair value in accordance with a document-
ed risk management or investment strategy.
3. If it involves structured fixed income securities, where no close link exists between economic features and risks of the de-
rivative decided in the contract and economic features and risks of the basic contract.
This indication is not possible :
- where the derivative(s) determined in a contract do not lead to a major change in cash flows, which would otherwise be re-
quired by the contract; or
- where, after a swift or even no analysis, when a similar hybrid (composed) instrument is considered for the first time, it is
clear that the separation of the derivative(s) embedded in a contract is not permitted.
Following initial disclosure no reclassifications are possible within or outside this category.
For the determination of the net profits and net losses:
- a distinction is made between profit margin and changes in value due to changes in fair value;
- no distinction is made between capital gains / losses and rating profits and losses.

VAT BE0404.476.83519 19
(iii) Assets Held to Maturity
In the (rare) circumstance where AXA Bank Europe is authorised by its parent company to use this category, it involves fixed income
securities with fixed or determinable payments and a fixed maturity which are quoted on an active market and which AXA Bank Europe
definitely intends to and is able to hold until maturity.
After initial recognition, only limited reclassifications are
- possible outside of this category (disappearance of active market)
- and subject to approval by the parent company within this category.
(iv) Loans and Receivables
This category is used if it involves fixed income securities with fixed or determinable payments and a fixed maturity which are not quoted
on an active market and which AXA Bank Europe definitely intends to hold until maturity.
At AXA Bank Europe, these are promissory notes that SCF acquired from AXA Bank France for its issue of underlying covered bonds.
After initial recognition no reclassifications are possible outside of this category. Even though IAS 39 allows for reclassifications within
this category under strict conditions, AXA Bank Europe has not made use of this option up to now.
(v) Assets Available for Sale
This category is used for available-for-sale fixed income securities or for fixed income securities, which cannot be assigned to one of the
above categories. After initial recognition, only limited reclassifications are possible outside and – subject to approval of the parent
company - within this category (in relation to assets held to maturity).
2.2.1.2 Subsequent Recognition
The subsequent rating takes place as follows:
- for rating categories (i) and (ii) each change between fair value and the acquisition price is booked to the income statement,
with the fair value being the quoted price or, if there are none, recent price for similar securities or valuations. The changes in
fair value are split in the income statement into interest yield and pure fair value changes;
- for categories (iii) and (iv), the assets are valued at the amortised cost, where the interest yield is recognised in the income
statement on the basis of the effective interest rate method. In the event of objective evidence of non-recoverability, the as-
sets are subject to an individual or collective impairment test. The impairment amount is the difference between the out-
standing carrying amount and the present value of the estimated future cash flows;
- for category (v), the securities are valued at fair value, where the interest yield is included in the income statement on the ba-
sis of the effective interest rate method while each difference between fair value and amortised cost is deferred in equity.
In the case of categories (i) and (ii), no impairment test is carried out.
For category (iv) (non-quoted fixed income securities), the rules of loans and receivables apply, as mentioned in the relevant valuation
rules for impairment.
For categories (iii) and (v) and if objective evidence shows non-recoverability, the securities are the subject of an individual impairment
test related to the individual assessment.
Typically the market value in itself is not enough of an indication that impairment has occurred. AXA Bank Europe has decided to follow
the rules of the parent company. The amount of the depreciation is based on the fair value, where the unrealised loss is based on a
significant or long-term decrease in fair value of a security compared to its purchase price. This impairment loss is recognised in the
income statement.
The following principles are applied:
- securities with unrealised losses of more than 30% and which have been in existence for a consecutive period of 6 months or
more: they are decreased in value, unless it appears after inspection that no credit event has taken place. In this case, the
loss of value is attributed to, for example, a change in interest rates or other causes;
- securities with unrealised losses up to 30%: no impairment or documentation is required, only specific monitoring.
The listed unrealised losses exclude exchange rate results, as well as any individual impairment loss.
In the event that an objective indication, such as an improvement in creditworthiness, indicates that the recoverable amount has in-
creased, the individual impairment loss is reversed through the income statement.
If within the categories (iii), (iv) and (v) a derivative is embedded in the basic contract, which is not closely related to the economic
features and risks of the basic contract, the said embedded derivative must typically be detached from the basic contract and valued
separately as a derivative.
AXA Bank Europe has decided, in such cases, to designate these contracts at fair value through profit or loss (refer to the discussion of
relevant category above).

VAT BE0404.476.83520 20
The derecognition of the fixed income securities takes place at maturity date or on the transaction date in the event of a sale. In the
latter case, the difference between the received payment and the carrying amount on the transaction date (after cross-entry of potential
deferred income/costs) is recognised in the income statement as a realised capital gain or loss.
2.2.2 Non-fixed Income Securities
Non-fixed income securities are defined as shares, as well as no-par value shares in investment companies (mutual investment funds,
Sicav, hedge funds).
2.2.2.1 Initial Recognition
Non-fixed income securities are first recognised in the balance sheet on the transaction date.
They are recognised at their fair value, i.e., their purchase value.
When initially recognised, non-fixed income securities, are classified in one of the following categories, depending on the existing op-
tions and the measurement objective:
(i) Assets at fair value held for trading;
(ii) Assets designated at fair value through profit or loss;
(iii) Assets available for sale.
Typically, for rating category (iii) the fees related to the transaction must be capitalised on initial recognition at purchase value. Due to
the principle of immateriality AXA Bank Europe decided to directly include these in the income statement.
(i) Assets at Fair Value Held for Trading
Non-fixed income securities are classified as assets at fair value held for trading if they:
- -are primarily acquired or entered into with the purpose of being sold or bought back in the short term;
- -form part of identified financial instruments that are jointly managed and for which indications exist of a recent, actual pat-
tern of short-term profit taking.
For the calculation of net profits and net losses:
- a distinction is made between received dividends and value changes due to changes in fair value;
- no distinction is made between capital gains / losses and rating profits and losses;
- value changes are netted
(ii) Assets Designated at Fair Value through Profit or Loss
This classification is used at AXA Bank Europe in the following three instances.
1. the classification leads to more relevant information since it eliminates or significantly reduces a measurement or recogni-
tion inconsistency (sometimes referred to as ‘an accounting mismatch’) that would otherwise arise from measuring assets
or liabilities or recognising the gains and losses on them through using a different basis of valuation. In most cases it in-
volves non-fixed income securities, which are hedged by derivatives, but where it was not decided to apply hedge account-
ing;
2. the classification leads to more relevant information because a group of financial assets, i.e., specific categories of invest-
ment funds are managed and its performance evaluated on the basis of the fair value, in accordance with a documented
risk management or investment strategy;
3. if it involves structured fixed income securities, where no close link exists between economic features and risks of the de-
rivative decided in the contract and economic features and risks of the basic contract.
Following initial disclosure no reclassifications are possible within or outside this category.
For the determination of the net profits and net losses:
- a distinction is made between received dividends and value changes due to changes in fair value;
- no distinction is made between capital gains / losses and rating profits and losses.

VAT BE0404.476.83521 21
(iii) Assets Available for Sale
This category is used for non-fixed income securities being available for sale or for non-fixed income securities, which could not be
assigned to one of the above categories.
2.2.2.2 Subsequent Recognition
The subsequent rating takes place as follows:
- for categories (i) and (ii) each change between fair value and cost is recognised in the income statement, where the fair value
represents the quoted price or, if there is no quoted price, recent price valuations for similar securities or a rating technique;
- for category (iii) the securities are valued at fair value, where any difference between fair value and cost is deferred in the
Shareholders' equity.
In the case of categories (i) and (ii), no impairment test is carried out.
In the case of category (iii) and if there is objective evidence of non-recoverability, the securities are subjected to an impairment test
related to individual assessment. The impairment is based on the market value and subsequent counter value in euros, where the
unrealised loss is confirmed by a significant or long-term decrease in the fair value of a security compared to its cost price.
Regarding the individual assessment of the major or long-term decreases in value the following rules imposed by the parent company
need to be applied
- unrealised losses of 20% or more;
- unrealised losses for a consecutive period of more than 6 months.
The cumulative unrealised loss (including Foreign exchange results) is transferred from Shareholders' equity and is recognised on the
income statement as impairment loss.
Once an impairment on non-fixed income securities has become permanent at the end of a period, it cannot be reversed; the cost is
adjusted from the date of the impairment to the decreased amount (regardless of the scope of reason for the depreciation) and at the
same time this becomes the new cost for a potential subsequent further depreciation. Every additional depreciation is immediately
recorded in the profit and loss account.
If it is not possible to determine a share’s fair value, it is only valued at cost. In relation to the impairment test, the rules for non-fixed
income securities remain in full force.
If within category (iii) a derivative is embedded in the basic contract, and it is not closely related to the economic features and risks of
the basic contract, this embedded derivative shall be separated from the basic contract and valued separately as a derivative.
AXA Bank Europe has decided, in such cases, to designate these contracts at fair value through profit or loss (see discussion of relevant
category above).
The dividends are recognised as income when the company secures the right to collect these dividends.
The derecognition of the non-fixed income securities takes place in the event of a sale on the transaction date. On this date the differ-
ence between the received payment and the carrying amount (after cross-entering any deferred income or expenses) is recognised in
the income statement as a realised capital gain or loss.
2.3 Financial Instruments – Loans and Receivables
2.3.1 Performing Loans and Receivables
The credits granted by the company to its clients are recognised at fair value in the balance sheet on the date they are made available.
They are assigned to the category ‘Loans and receivables’ measured at amortised cost.
Within this category there are currently no derivatives embedded in basic contracts, which are not closely related to the economic fea-
tures and risks of the basic contract and consequently must be separated from the basic contract and valued separately as a derivative.
Should this still be the case, such contracts shall be fully valued at fair value through the profit-and-loss account (see the description of
relevant category within fixed income securities).
With the first entry, all marginal transaction costs are added and all remunerations received are deducted from the initial fair value:
- the acquisition costs on credit files are added to the purchase price and spread over the duration of the loans based on the
effective interest rate;
- The file costs charged on the mortgages and investment loans are deducted from the purchase price and also spread over
the duration of the loans based on the effective interest rate;

VAT BE0404.476.83522 22
- the reinvestment remunerations charged on the refinanced mortgages are deducted from the purchase price and spread
over the average duration of the mortgages.
The effective interest rate is the interest rate that discounts the expected contractual cash flows during the expected duration of the
loans exactly to the net book value of the loan.
The disposal of the loans occurs on the maturity date or earlier in the case of a whole or partial repayment. Reinvestment remunera-
tions on loans that are terminated appear all at once in the income statement. The portion of the acquisition costs yet to be written off
is in that case reversed in the income statement in proportion to the amount paid back.
For the determination of the net profits and net losses:
- a distinction is made between interest rate margin and realised capital gains and losses;
- the results are not netted.
2.3.2 Non-performing Loans and Receivables
Risks of a doubtful and uncollectible nature are:
- the problem-risks of counterparties whose inability to observe their liabilities is established or almost certain;
- and also the risks in dispute, of which it is established or almost certain that the outcome of the settlement is or will be that
the disputed receivables are uncollectible, or the disputed retrieval recourse cannot be exercised.
Risks with uncertain progression are:
- the problem-risks of counterparties of whom it has been ascertained or is predicted that they are experiencing difficulties ob-
serving their liabilities, yet whose inability is neither established or almost certain;
- and also the risks of dispute the settlement of which is uncertain.
Risks in which the counterparties are deemed ‘unlikely to pay’ occur:
- if AXA Bank Europe established a deterioration of the customer’s credit worthiness;
- if the customer is assigned a forbearance measure (restructuring) and the loan or loans involved demonstrate payment ar-
rears of 30 days;
- if the customer is in a probationary period after having been deemed ‘uncertain’.
When there is an objective indication of non-recoverability, the outstanding loan is subject to an impairment test.
AXA Bank Europe makes use of a separate provision account, which reflects the impairment , undergone by the underlying financial
asset as a result of credit losses. This provision account also takes into account the impact of the time value.
Negative differences between the calculated recoverable amounts and the carrying amount are recognised in the income statement as
an impairment loss.
The recoverable amount takes into account the time value of the funds, where the expected cash flows are updated at the contract’s
original actual interest rate. Each decrease in provision due to the time value is recognised in the income statement as interest yield.
Each increase due to a downswing is recognised through the addition for impairment accounts in the income statement.
Each decrease due to objective indicators that show that the recoverable amount increases as a result of an improvement in the as-
sessed recoverable cash flow is accounted for through the write-back of impairments in the income statement account. However, it shall
never lead to an amortised cost, which would be higher than the amortised cost if no impairment depreciation had taken place.
After the impairment was booked the interest yield is recognised in the income statement on the basis of the actual interest of the
underlying contracts.
The provisions are directly booked against the receivables if there is no possibility of recovery.
Loans with the status ‘normal progression; are valued on a collective basis based on latent indicators (the model ‘incurred but not yet
reported losses’) and the expertise of AXA Bank Europe. Where appropriate, provisions for credit lines not included are applied for loans
in the status ‘normal progression’.
For all credit types, it is the case that a non-individualised special depreciation is applied as from the status ‘unlikely to pay’ for the
expected loss on these portfolios, determined based on statistical conclusions relating to the evolution of these risks. Where appropri-
ate, provisions are applied for loans in the status ‘unlikely to pay’ for credit lines not included.

VAT BE0404.476.83523 23
For all credit types, except for instalment loans, giro accounts of private individuals and the ‘budget +’ accounts (see below), it is the
case that an individualised special depreciation is applied as from the status ‘uncertain’ for the expected loss on these portfolios, de-
termined based on statistical conclusions relating to the evolution of these risks. Where appropriate, provisions are applied for loans in
the status ‘uncertain’ for credit lines not included.
For all credit types, except for instalment loans (see below), it is the case that as from the status ‘doubtful and uncollectible’ the file is
monitored individually and special depreciations are entered, taking into account the evolution of the file and in particular the securities.
These files remain valued on an individual basis, even if the securities are sufficient. Each special depreciation is entered individually
for each file.
For instalment loans not corresponding to the loans with the status ‘normal progression’ or ‘unlikely to pay’, an individualised special
depreciation is applied for the expected loss on these portfolios, determined based on statistical conclusions relating to the evolution of
these risks.
For giro accounts of private individuals and the ‘budget +’ accounts not corresponding to the loans with the status ‘normal progression’
or ‘unlikely to pay’, an individualised depreciation is applied for the expected loss on these portfolios, determined based on collective
statistical conclusions, taking into account losses observed in the past.
For determining the net profits and losses:
- a distinction is made between the interest margin and surplus or reduced values realised;
- the results are presented net.
2.3.3 Loans and Receivables – Forbearance Measurements
Forbearance measures consist of concessions towards a borrower facing or about to face financial difficulties. Forbearance measures
can be taken only if there is a mutual agreement between the borrower and the bank on these measures.
Concessions are changes in the modalities of a credit facility or a total or partial refinancing in favour of the borrower, which are grant-
ed, when the borrower is in financial difficulties. This favour wouldn’t be granted if the debtor is not experiencing financial difficulties.
Concessions may (and not must) entail a loss for the lender and typically imply a change in the terms and conditions of the credit con-
tract.
Triggered by specific events, the bank’s credit exposure on a borrower is reviewed. On that occasion, a risk assessment is made by
experts who can be assisted by rating models. This assessment is ultimately submitted to the competent decision level. From the mo-
ment a concession will be or is granted to a borrower, the following situations must be seen as important indicators that the borrower is
in financial difficulties. Financial difficulties refer to the situation in which the debtor is considered to be unable to comply with the terms
and conditions of a credit (‘troubled debt’). Financial difficulties must always be assessed on a client level. The concession is thus to be
classified as a forbearance measure when:
1. the modified facility was totally or partially past-due by more than 30 days (without being in default) at least once during
the three months prior to its modification or would be more than 30 days past-due, totally or partially, without modification;
2. simultaneously, with or close in time to the granting of additional debt, the borrower made payments of principal or interest
on another credit within ABE; that was totally or partially 30 days past due at least once during the three months prior to its
refinancing;
3. embedded forbearance clauses are used for borrowers who are 30 days past-due. Or who would be 30 days past-due with-
out the exercise of these clauses;
When there are no indications that the debtor is in financial difficulties, the concession is not to be treated as forborne. By example, if
the consumer asks for a reduction of his interest rate otherwise he will resign his loan, this is not forbearance even if it is a concession.
The forbearance classification on performing expositions can be stopped when all of the following conditions are met:
1. the facility is considered as performing;
2. a minimum 2-year probation period has passed from the date the forborne facility was considered as performing or grant-
ed;
3. regular payments of the full foreseen amount have been made during at least half of the probation period;
4. none of the exposures to the debtor is more than 30 days past-due at the end of the probation period (= minimum period
during which a facility has to be classified as forborne).

VAT BE0404.476.83524 24
2.4 Treasury
2.4.1 Regular Interbank Investments and Interbank Deposits
The interbank investments and interbank deposits are initially recognised in the balance sheet on the availability date at fair value (i.e.,
the value at which the funds were provided or obtained).
The interest revenues and the interest expenses are recognised pro rata temporis in the income statement by making use of the effec-
tive interest rate method.
Amortisation takes place on the due date.
2.4.2 Structured Investments and Structured Deposits
Structured investments and structured deposits are investments and deposits with embedded derivatives in a contract.
In the case of structured investments and liabilities where the embedded derivatives are closely linked to economic characteristics and
risks of the basic contract, they must not be set apart.
If the derivatives embedded in the contract due to the close connection between the economic features and the risks do not have to be
separated from the basic contract, the same rating rules apply as mentioned above for regular interbank investments and deposits
without impairment to the application of the following paragraphs.
In the case of structured investments and liabilities where the closed derivatives are not closely linked to economic characteristics and
risks of the basic contract, the derivatives must be bifurcated from the host contract.
In both cases, IFRS allows for the whole contract to be valued based on the fair value including the processing of value changes to the
income statement on the condition that this classification leads to more relevant information because it eliminates or limits considera-
bly inconsistency in the valuation of the inclusion (accounting mismatch) that would otherwise occur due to valuing of assets and liabili-
ties or the inclusion of the profits and losses based on the different bases. The bank opts, on a case-by-case basis, to apply a fair value
designation if a structured liability is fully covered by a derivative instrument but without the use of any hedge model.
Such investments and deposits are initially recognised at fair value in the balance sheet on the date they become available.
Next, the changes are included at their fair value in the income statement but split into an interest rate margin and a net difference
when compared to the fair value. The changes in the fair value take into account any changes to the creditworthiness of the issuer
(which is AXA Bank Europe in the case of liabilities).
Day one gains or losses should be deferred if the fair value was established on the basis of non-observable prices. This gain or loss
must be written off over the term of the underlying instrument or until such time that observable prices are available. If material, day
one gains and losses are deferred. This adjustment shall then be written off over the life of the underlying instrument or until the ob-
servable prices become available.
Amortisation takes place either on the due date or on the date of availability in the event of early repayment. In the latter situation the
difference between the received/paid commission and the carrying amount is recognised in the income statement as a realised capital
gain or loss.
2.4.3 Derivatives
Embedded derivatives
Derivatives embedded in basic contracts, which are valued at fair value and where the fair value differences are recognised in the
income statement, are not separated.
Other derivatives
All other derivatives are recognised in the balance sheet at their fair value on the transaction date.
Changes in fair value are recognised directly in the income statement, except for derivatives used in cash flow hedges (see 2.4.4).
2.4.4 Hedge Accounting
The following types of hedges are possible:
- A portfolio interest rate fair value hedge is a relationship between derivatives and underlying financial instruments docu-
mented in a fair value hedge of the interest rate risk of the underlying hedged instrument. The effectiveness of the hedge is
checked periodically through prospective and retrospective testing. During each effective period, the fair value change relat-
ing to the hedged risk of a reference amount is booked on the portfolio of underlying financial instruments. This change in
value is amortised. Under IFRS, amortisation may be recorded as soon as a change in value has occurred. Amortisation shall
begin no later than when the hedged item ceases to be adjusted for changes in its fair value attributable to the risk being
hedged. AXA Bank Europe has decided to commence amortisation when the hedging ends. The change in existing accumu-
lated value at the end of June is amortised via the income statement over the remaining term of the instrument. In the new

VAT BE0404.476.83525 25
model, the change in fair value recognised for the hedged risk is not amortised. Depreciation begins when the hedge stops.
The deviation from fair value of the relevant derivatives is directly recognised in the income statement.
- During each ineffective period no fair value change is booked on the underlying financial instruments; The fair value change
of the relevant derivatives is directly recognised in the income statement.
- A micro fair value hedge is a relationship between derivatives and underlying financial instruments documented in a fair val-
ue hedge of one or more financial risks of the underlying hedged instrument.
The continued effectiveness of the hedge is checked periodically (prospective and retrospective testing)
During each effective period the fair value change relating to the hedged risk is recorded for the financial instrument. These
fair value changes are recognised directly in the income statement. The fair value change of the relevant derivatives is recog-
nised directly in the income statement.
Once the hedge ceases to be effective it is terminated and the value adjustments are written off in the event of debt instru-
ments over the remaining term of the instrument by adjusting the effective actual rate.
- A cash flow hedge is a relationship between derivatives and underlying financial instruments documented through a hedge of
future cash flows of the underlying hedged instrument. The effectiveness of the hedge is checked periodically through pro-
spective and retrospective testing. During each effective period, the effective portion of the fair value change of the hedging
instrument (derivative) is deferred in equity and the non-efficient portion is recognised in the income statement.
Once the hedge ceases to be effective it is terminated. The deferred value changes remain deferred in the equity until the
time that the expected future transaction takes place, after which it shall be accounted for symmetrically with the hedged risk
in the income statement.
2.4.5 Repos and Reverse Repos
All repos and reverse repos satisfy the condition for being considered as financing transactions.
When entering reverse repos in the balance sheet the amounts paid are recorded as an investment with pledging of securities.
The rating rules are the same as those applied to regular interbank investments (see 2.4.1).
If, however, the underlying securities are sold, a liability is expressed in respect of the creditor of the collateral. This liability is valued at
fair value.
Amortisation takes place on the due date.
When recognising repos in the balance sheet the amounts received are recognised as borrowings with securities collateral.
The rating rules are those applicable to regular interbank borrowings (deposits) (see 2.4.1).
For accounting purposes, the securities used as collateral under a repo are retained in the underlying securities portfolio. No accounting
transfer takes place to another line item.
Amortisation takes place on the due date.
2.4.6 Securities Investments and Borrowings
Securities borrowings are not recognised on the balance sheet.
When the borrowed security is sold, the same rules apply as for a reverse repo (see 2.4.5).
Securities investments are not recognised on the balance sheet, as the securities which were lent remain in the underlying securities
portfolio for accounting purposes. There is no accounting transfer to another line.
2.4.7 General
For the determination of the net profits and net losses:
- a distinction is made between interest rate margin and realised capital gains and losses;
- the results are not netted.
2.5 Fee Income and Financial Guarantees
2.5.1 Fee Income
A distinction is made between two types of commissions and their recognition in the income statement takes place as follows:
- commissions received for services are recognised on an accrual basis over the term of the services. Examples are reserva-
tion commissions for non-recognised credit line amounts, fees received from safe deposit boxes and management commis-
sions.

VAT BE0404.476.83526 26
- commissions received for the performance of a specific task are recognised at the time the task is performed. Examples are
commissions for the purchase and sale of securities and money transfers.
2.5.2 Financial Guarantees Provided
The initial recognition of financial guarantees provided in the balance sheet takes place on the contract date. It takes place at fair value,
which typically corresponds to the received commission for the provision of the financial guarantee. If the premium received does not
correspond to market practices, the difference with the fair value is included directly in the income statement.
For the present, the received premium is amortised pro rata temporis over the term of the contract. This takes place on a per-contract
basis.
It is subsequently checked (on the portfolio basis) whether a provision is to be created for potential or certain execution. This provision
is discounted if the impact is tangible.
Derecognition takes place at maturity date or in the event of execution. The provided guarantee shall be booked for the guaranteed
amount, which was built up through the provision.
2.6 Equity
Equity components are assessed at cost.
Treasury shares are deducted from the equity at purchase price, including directly assignable incremental transaction expenses.
Dividends are deducted from equity when they become due.
2.7 Financial Liabilities and Bank Deposits
(i) Financial Liabilities Measured at Amortised Cost
Operational debts are recognised in the balance sheet on the date they become available. They are assigned to the ‘Deposits and debts’
valuation category and valued at amortised cost.
Deposits and deposit certificates are initially recognised in the balance sheet at fair value (i.e., the amount of the obtained funding) on
the date at which they are made available. They are also assigned to the ‘Deposits and debts’ category and valued at amortised cost
without impairment to the application of the subsequent paragraphs regarding structured obligations.
On each balance sheet date interest accrued during the period is recognised in the income statement on the basis of the effective
interest method.
The effective interest rate is the interest rate that exactly discounts the future contractually specified cash flows until maturity, to the
purchase price, taking into account premiums, discounts and impact of step-up and step-down coupons.
The acquisition commissions related to deposit certificates are not amortised on an individual basis through the effective interest rate,
but debited monthly in the form of an outstanding debt commission (which does not differ materially from the approach to the effective
interest rate per individual transaction) and spread over the contractual term as interest expenses.
Deposits and deposit certificates are amortised on the expiry date or earlier in the event of early repayment. In the latter case the differ-
ence between the paid commission (deducting any penalties) and the amortised cost outstanding at the time of repayment is recog-
nised in the income statement as a realised capital gain or loss.
For the determination of the net profits and net losses:
- a distinction is made between interest rate margin and realised capital gains and losses;
- the results are not netted.
In the case of structured deposits and liabilities where the closed derivatives are closely linked to economic characteristics and risks of
the basic contract, they must not be set apart.
In the case of structured deposits where the closed derivatives are not closely linked to economic characteristics and risks of the basic
contract, they must be set apart in accordance with paragraph 11 of IAS 39.
In such case, IFRS allows for the whole contract to be designated at fair value through profit or loss if this classification leads to more
relevant information because it eliminates or limits inconsistency considerably in the valuation of the inclusion (accounting mismatch)
that would otherwise occur due to the valuing of assets and liabilities or from the inclusion of the profits and losses with regard to this
based on different rules. The bank opts, on a case-by-case basis, to apply a fair value designation if a structured liability is fully covered
by a derivative instrument but without the use of any hedge model.

VAT BE0404.476.83527 27
(ii) Liabilities Designated at Fair Value through Profit or Loss
This classification is used at AXA Bank Europe in both of the following cases:
1. the classification leads to more relevant information since it eliminates or significantly reduces a measurement or recogni-
tion inconsistency (sometimes referred to as ‘an accounting mismatch’) that would otherwise arise from measuring assets
or liabilities or recognising the gains and losses on them based on different rules;
2. if it involves structured certificates, where no close link exists between economic features and risks of the derivative decid-
ed in the contract and economic features and risks of the basic contract.
This indication is not possible :
- where the derivative(s) determined in a contract do not lead to a major change in cash flows, which would other-
wise be required by the contract;
- where, after a swift or no analysis, when a similar hybrid (composed) instrument is considered for the first time, it
is clear that the separation of the derivative(s) embedded in a contract is not permitted.
At AXA Bank Europe, it is mainly EMTN (European Medium Term Note) certificates issued by the AXA Belgium Finance subsidiary.
After initial recognition, no reclassification is possible within or outside of this category.
For the determination of net profits and net losses:
- a distinction is made between interest rate margin and changes in value due to changes in fair value;
- no distinction is made between capital gains / losses and rating profits and losses;
Such investments and deposits are initially recognised at fair value in the balance sheet on the date they become available.
Next, the changes are included at their fair value in the income statement. The changes in fair value take into account the effect of the
change in the creditworthiness of AXA Bank Europe.
The fair value at acquisition of a financial instrument is usually the transaction price agreed. However, if AXA Bank Europe considers
that the fair value is different from this transaction price and if the fair value was determined by unobservable elements, these are
deferred by day 1 changes. This change must then be amortised over the term of the underlying instrument or until the time when
observable prices are available.
Amortisation takes place on the due date or on the date of availability in the event of early repayment. In the latter situation, the differ-
ence between the received/paid commission and the carrying amount is recognised in the income statement as a realised capital gain
or loss.
2.8 Foreign Currency Translation
The presentation currency of AXA Bank Europe is the euro. The functional currency is the euro for the head office and branches located
in the Eurozone. Currently, the local currency is used as the functional currency for the branches that are located outside the Eurozone.
2.8.1 Determination of the Functional Currency
The functional currency for a branch that is located outside the Eurozone is determined on the basis of the primary economic environ-
ment in which an entity operates. This is typically the primary environment in which it generates and issues funds. Hereby account is
taken of the following factors:
1. the currency:
- which essentially determines the sale price of goods and services, and
- of the country where the competition and regulations primarily determine the sales price of its goods and services.
2. the currency, which essentially determines labour and material costs, and other costs for the delivery of goods and the pro-
vision of services.

VAT BE0404.476.83528 28
2.8.2 Conversion of a Functional Currency into a Presentation Currency
The results and financial status of a foreign branch in which the functional currency is not the euro are converted into euros on the
following basis:
1. assets and commitments are converted for each balance sheet presented (i.e. including comparative figures) at the closing
price on the balance sheet date;
2. profits and losses are converted for each income statement (i.e., including comparative figures) at an average exchange
rate;
3. all resulting currency rates are recognised as a separate equity component.
2.8.3 Conversion of Monetary Components into a Functional Currency
Monetary components are currency units held as well as assets and liabilities which must be received or paid in a fixed number or a
number to be determined of currency units. This concerns in particular fixed rate securities, loans and accounts receivable as well as
the deposits and debts.
When recognised in the balance sheet, monetary components in foreign currency are converted into the functional currency at the
current rate of exchange on the transaction date or the spot price of the underlying exchange transaction.
Each month a monetary rating process takes place on the basis of the balance, where the total outstanding monetary balance in foreign
currency is converted at the closing rate. All positive and negative differences are recognised in the income statement, regardless of the
rating category to which the monetary components belong.
At amortisation, monetary components in foreign currency are converted into euros at the current rate of exchange on the transaction
date or the spot price of the underlying exchange transaction.
2.8.4 Conversion of Non-monetary Components into a Functional Currency
Non-monetary components are components other than monetary ones. This primarily involves non-fixed income securities.
When recognised in the balance sheet, non-monetary components in foreign currency are converted into euros at the current rate of
exchange on the transaction date or the spot price of the underlying exchange transaction.
The periodic non-monetary rerating process differs depending on the rating category:
1. for non-monetary components valued at cost, once the conversion into euros has taken place, this value in euros is main-
tained until derecognised from the balance sheet;
2. for non-monetary components belonging to the valuation categories ‘Assets and liabilities held for trading’ or ‘Designated
at fair value through profit or loss’, a regular revaluation of the fair value applies, which consists of two components: the
fair value difference and the foreign exchange result. Both components are recognised in the income statement;
3. for non-monetary components belonging to the rating category ‘Assets available for sale’, the periodic revaluation to fair
value consists of two components: the fair value difference and the foreign exchange result. Both components are deferred
in equity. If a negative revaluation must be booked as an impairment, both components will be transferred from equity to
the income statement.
Upon derecognition, non-monetary components in foreign currencies are converted into euros at the current rate of exchange on the
transaction date or the spot price of the underlying exchange transaction.
2.9 Contingent Assets and Liabilities and Provisions
2.9.1 Contingent Assets and Liabilities
Contingent assets and liabilities
Contingent assets are not recognised in the balance sheet; Rather, they are included in the disclosure if an inflow of economic benefits
is probable.
Contingent liabilities are not recognised in the balance sheet; they are, however, included in the disclosure, except in the very unlikely
event of the possibility of an outflow of means including economic advantages .

VAT BE0404.476.83529 29
2.9.2 Provisions
Provisions are only created if a liability exists as a result of a past event that can be reliably assessed and where a provision is neces-
sary for a likely expense.
The existing liability can be either legally enforceable or be an actual liability.
The amount recognised as a provision shall be the best estimate of the expenditure required to settle the present obligation at the
balance sheet date, taking into account the risks and uncertainties and any future events; they are discounted if the impact of the time
value is material.
Compensation to be received in connection with the provisions made is recorded as an asset.
On each balance sheet date provisions are reassessed and adjusted, either to take into account the time value (developed through
financial expenses), or to increase it (failing adequate provisions) or to reverse it (in the event of surplus provisions).
The provision shall only be used for the expenditure for which it was created.
2.10 Employee Benefits
Employee benefits are accounted for in the income statement in the year in which the services were provided.
For short-term employee benefits, which are paid within one year of the closing date, such as salaries, social security payments, sick
leave, holiday pay and bonuses, provisions are created that are not discounted.
For long-term employee benefits not including benefit plans, such as career breaks, bonuses for 25 and 35 years of service, bonuses or
other remuneration, only paid more than one year following the closing date, the calculation of cash value of gross liabilities applies; The
actuarial differences as a result of the periodic revision of valuations and assumptions are recognised directly in the income statement.
At AXA Bank Europe, pension plans fall under the defined benefit plan category.
The amount recognised as a net liability on the basis of defined benefit rights consists of the net total of the following amounts:
1. cash value of gross liability on the basis of allocated pension rights as at the balance sheet date, where the ‘projected unit
credit’ method is used;
2. less the fair value on the balance sheet date of any fund investments from which the liabilities must be settled directly.
The latter fund investments can involve both assets and insurance contracts.
Assumptions and estimates are periodically revised and adjusted.
Profits or losses on the major curtailment or settlement of an allocated pension regulation are recognised at the time the curtailment or
settlement takes place.
Redundancy payments, including early retirement, are only recognised upon acquiring legal effect with regard to third parties. Discount-
ing is also applied if the payment is more than one year from the balance sheet date.
2.11 Income Taxes
2.11.1 Current Taxes
Taxes due and tax refunds receivable over the current reporting period relating to current and previous periods are recognised as a
liability, provided they have not yet been paid.
If the amount already paid, with respect to current and previous periods, is greater than the amount owed for these periods, the balance
is recognised as an asset.
2.11.2 Deferred Taxes
Deferred tax liabilities are booked in the balance sheet for all temporarily taxable differences. They are created:
- through the income statement if the underlying temporary difference is also recognised through the income statement;
- through equity if the underlying temporary difference is also recognised through equity.
Deferred tax assets related to tax losses carried forward for transferable tax credit are only booked in the balance sheet if the temporary
differences can be settled in accordance with local tax legislation.
Other deferred tax assets are always booked in the balance sheet since it is assumed that these temporary differences shall always be
able to be recuperated.

VAT BE0404.476.83530 30
At each closing date, the recoverability of the deferred tax asset is assessed. If the deferred tax asset cannot be recovered, impairment
is accounted for. This impairment is reassessed at each closing date and adjusted, if needed, if additional information on the recovera-
bility is obtained.
For accounting purposes netting takes place between deferred tax assets and deferred tax liabilities only inasmuch as the nature of the
tax expense and the expiry date are similar for each fiscal entity.
For presentation purposes, netting between deferred tax assets and deferred tax liabilities occurs per fiscal entity.
The outstanding balance of the deferred tax assets or deferred tax liabilities is periodically revalued to take into account the changes in
tax rates and/or tax legislation of the fiscal entity.
Assets or liabilities as a result of tax on profits are not discounted.
2.11.3 Estimate of Deferred Taxes
The following distinction is made with regard to deferred taxes and their recoverability
Deferred tax through Other Comprehensive Income
These tax assets are booked on:
- adjustments with regard to the actuarial assumptions used for the calculation of the provisions related to pension schemes;
- the valuation results on derivatives used for cash flow hedging;
- the valuation results on securities that are classified under the ‘available for sale’ category.
Generally, AXA Bank Europe does not expect to incur such losses on securities in the future since the strategy applied usually results in
these securities being held in the portfolio until their maturity date. AXA Bank Europe has been anticipating expected IFRS changes and
volatile markets into account for a few years and, therefore, the management of this ‘available for sale’ portfolio is driven, in these
cases, by following a different strategy. Deferred tax is only entered for this category to the degree in which a larger or equal deferred
tax liability is entered with regard to this portfolio that is also linked to the same underlying portfolio and to the same period.
As no impairment is noted on the receivable, no credit losses on debt instruments are expected. Therefore, the receivable is considered
as fully recoverable.
Deferred tax as a result of a difference in the timing of accounts being processed (including losses)
A deferred tax asset is recognised insofar as future accounting profits will be available to both recover the deferred tax asset and for the
unused tax credit balance that can be offset.
2.12 Property, Plant and Equipment and Intangible Assets
2.12.1 Property, Plant and Equipment
There is no capitalisation of tangible fixed assets secured under an operating lease and rental expenses are accounted for on a linear
basis and included in the income statement over the term of the lease.
The initial recognition of tangible fixed assets obtained under a financial lease takes place for the fair and cash value of the minimum
lease payments. Initially directly assignable expenses related to the acquisition are also capitalised. Financing expenses are recognised
in the income statement on the basis of the implicit interest rate.
The initial recognition of tangible fixed assets acquired takes place at purchase value plus any additional attributable expense and
directly attributable transaction costs. Financing expenses during the construction period are capitalised, if material.
Subsequent measurement takes place at amortised cost, which takes into account amortisation and periodic impairment testing.
For the depreciation, the residual value and the useful economic service life is taken into account.. Typically, the depreciation of build-
ings must take into account the ‘component approach’. Due to the principle of immateriality on the one hand and in order to, on the
other hand, also take into account the accounting policies imposed by the parent company, AXA Bank Europe has decided not to apply
the component split for the time being.
On each reporting date, the impairment test for buildings and land compares the cost after deduction of any depreciation accounted for
with the value in use determined on the basis of an independent survey:
- if the unrealised loss is less than 15%, no special impairment depreciation is booked;
- if the unrealised loss is more than 15% the ‘discounted future cash flow’ method is applied

VAT BE0404.476.83531 31
If the value based on the discounted future cash flow is lower than the carrying amount, an impairment is booked for an amount equal
to the difference between:
- the cost price after deduction of the recorded depreciation;
- the higher value of the independent surveys and the value based on discounted future cash flow.
After an impairment loss is recognised for a building, its outstanding amortisation table is adjusted.
If subsequently, the independent survey is more than 15% higher than the net carrying amount, the impairment is reversed for an
amount corresponding to the difference between:
- the net carrying amount;
- the lowest of the independent assessment and the cost after deducting the depreciation recorded (calculated on the basis of
the existing depreciation table for depreciation), with a maximum amount of for the previously booked value correction.
Subsequently the outstanding amortisation table is adjusted.
Tangible fixed assets held for sale are valued at the lowest carrying amount (cost minus previously booked depreciations) and the fair
value less selling costs.
Such tangible fixed assets are no longer amortised and are presented separately on the balance sheet.
The linear depreciation method is used.
Depreciation booked during the financial year according to their economic life expectancy.
Assets L Method (linear)
Depreciation percentage
Min. - Max.
Land for own use N/A -
Buildings for own use L 3%
Building design L 10%
IT equipment L 20%
Furniture, facilities L 10%
Non-IT machines rolling equipment L 20%
2.12.2 Intangible Fixed Assets
Set-up costs are directly recognised in the income statement, unless they can be identified as transaction costs for assets or liabilities
Purchased intangible assets, which satisfy the recognition criteria (future economic benefits and reliable measurement) and of which
the useful life exceeds a year, are accounted for at purchase value, including additional expenses and directly attributable transaction
costs. Software for which an annual license is paid is not capitalised.
The intangible assets are amortised on a linear basis over their economic life.
In the event of internally generated software, an intangible asset resulting from the development (or out of the development phase of an
internal project) is recognised if and only if all conditions below are met:

VAT BE0404.476.83532 32
1. technical feasibility to complete the intangible asset, so as to make it available for use;
2. intention to complete and use the intangible asset;
3. capacity to use the intangible asset;
4. how the intangible asset is likely to generate future economic benefits;
5. availability of adequate technical, financial and other means to complete the development and use the intangible asset;
6. capacity to reliably evaluate expenses attributable to the intangible asset during its development.
Costs that do not meet these criteria as well as research costs are not capitalised.
that do not meet these criteria as well as research costs are not capitalised.
- research phase: activities aimed at obtaining new knowledge; the search for applications or research findings or other
knowledge; the search for alternatives for devices, products, processes, systems or services; formulation, design, evaluation
and final selection of possible alternatives for new or improved devices, products, processes, systems or services.
- development phase: the design, construction and testing of pre-production or pre-use prototypes and models; the design of
new devices, products, processes, systems and services; the design, construction and operation of a specific test
environment; the design, construction and testing of a chosen alternative.
Mandatory projects, i.e. projects that are imposed by legislation, regulation or other non-avoidable and mandatory instances (e.g. sys-
tem upgrades decided by an external provider) are always considered to have a positive business case without having to specifically
demonstrate it. This is because it is considered that by doing the project high expenses are avoided such as having to manually solve
the problem, recruiting external specialists, paying fines, etc.
Intangible fixed assets are subject to an impairment test.
- AXA Bank Europe assesses at each balance sheet date whether there is an indication of impairment. If such an indication ex-
ists, the bank shall estimate the recoverable amount of the asset. This amount is the highest of the fair value minus costs to
sell or the value in use of the asset.
- If the recoverable amount of the asset is lower than the carrying amount, an impairment is booked for this difference.
- If there is an indication that an asset should be impaired, the recoverable amount of the asset shall be estimated. If it is im-
possible to estimate the recoverable amount of the asset, an entity must determine the recoverable amount of the cash-
generating unit to which the asset belongs.
- Regardless of whether there is an indication of impairment, intangible assets with indefinite useful life must be tested annu-
ally for impairment. The test takes place by comparing the carrying amount with its recoverable amount. This rule also applies
to assets that are not yet in use at the balance sheet date.
Depreciation booked during the financial year according to their economic life expectancy.
Assets
L Method (linear)
Depreciation percentage
Capital
Min. - Max.
Set-up expenses entered in the income
statement in the financial year in which they
were spent
Software for own use, purchased from third
parties
L 10% - 20%
Software internally developed L 10% - 20%
2.13 Other Assets and Liabilities
Non-operational debtors and creditors are recognised in the balance sheet on the date they become available.
Other assets are recognised at the nominal value of the claim less any impairment.
Other liabilities are recognised at the nominal value of the debt.

VAT BE0404.476.83533 33
2.14 Supplementary Information
2.14.1 Events After the Balance Sheet Date
Events after the balance sheet date that show circumstances that existed at the balance sheet date (for example, additional information
about already-made estimates), will require an adjustment to the financial statements, if material.
Events after the balance sheet date that show circumstances that were created after the balance sheet date (for example, evolution of
the dollar or the fair value of securities), will not require an adjustment to the balance sheet, the income statement, the changes in
equity or cash flow statement. However, if material, information is provided on the nature and estimated financial impact in order to
prevent the financial statements from being misleading.
2.14.2 Interim Financial Reporting
There is no specific interim financial reporting; the company only publishes its figures annually.
2.14.3 Changes in Accounting Policies and Accounting Estimates
When it is difficult to distinguish a change in an accounting policy from a change in an accounting estimate, the change is treated as a
change in an accounting estimate in accordance with IFRS.
A change in estimate is applied prospectively. Inasmuch as a change in estimate leads to changes in assets and liabilities, or relates to
a component of the equity, this change is settled in the period in which the change has taken place, by changing the carrying amount of
the relevant asset, the relevant liability or the relevant component of the equity.
Any change in the accounting policy must be applied retroactively.
If it is not feasible to determine the consequences of a change in a financial reporting policy on comparative information for one or
more previous reporting periods, the new financial reporting policy is applied on the carrying amount of assets and liabilities from the
start of the earliest period (the earliest period can be the reporting period) for which retroactive application is possible. For this period,
the initial balance for each relevant component of the equity is adjusted accordingly.
If it is not feasible to determine the cumulative effect, at the beginning of the reporting period, of the application of a new accounting
policy on all previous reporting periods, the comparative information is adjusted to apply the new financial reporting policy prospectively
from the earliest time at which it is practically feasible.
In such cases additional relevant documentation is provided in the explanatory notes.
VAT BE0404.476.83534 34
GLOSSARY
Description of Classifications in IFRS:
- Assets and liabilities held for trading:
includes assets and liabilities with a view to short-term gains, as well as all derivatives, unless they were identified as effec-
tive hedge derivatives; the changes in fair value are recognised in the income statement.
- Financial assets and liabilities designated at fair value through profit or loss (fair value option):
includes assets and liabilities which the company decides to value at fair value through profit or loss, because (1) the classi-
fication leads to more relevant information since it eliminates or significantly reduces a measurement or recognition incon-
sistency (‘an accounting mismatch’) that would otherwise arise from measuring assets or liabilities or recognising the gains
and losses on them based on different rules, or (2) because the classification leads to more relevant information since a
group of financial assets or liabilities are managed and their performance evaluated on the basis of their fair value in accord-
ance with a documented risk management or investment strategy, or (3) it involves structured assets or liabilities, where no
close link exists between economic features and risks of the derivative decided in the contract and economic features and
risks of the basic contract.
- Financial assets held to maturity:
all non-derivative financial assets with a fixed maturity date and fixed or definable payments where the intention exists, as
well as the financial possibility to be held until maturity; they are measured at amortized cost.
- Loans and receivables
all non-derivative financial assets with fixed or definable payments that are not quoted in an active market; ; they are meas-
ured at amortized cost.
- Financial assets available for sale:
all non-derivative financial assets that do not belong to one of the previous categories; they are valued at fair value where all
fair value fluctuations are recognised in the Shareholders’ equity until realisation of the assets or until the time that deprecia-
tion occurs. In that case the cumulative rerating results are recognised in the income statement.
- Deposits and liabilities:
all non-derivative financial liabilities that do not belong to one of the previous categories; they are valued at amortised cost.
- Property, plant and equipment kept for sale:
property, plant and equipment which are likely to be sold. They are valued at the lower value of carrying amount or the fair
value minus the sales costs, respectively.

VAT BE0404.476.83535 35
3 Application of IFRS by AXA Bank Europe
The consolidated financial statements of AXA Bank Europe were drawn up in compliance with the International Financial Reporting
Standards (IFRSs) – including the International Accounting Standards (IASs) and Interpretations - at 31 December 2016 as accepted
within the European Union.
Accounting policies that are not specifically mentioned comply with the IFRSs as accepted within the European Union.
3.1 Application Dates
An overview is provided below of the impact of changes with regard to the IFRS standards. Any reference to the Group should be read as
the consolidation scope of AXA Bank Europe, whose parent company is AXA Bank Europe.
Standards, amendments to standards, interpretations and amendments to interpretations that have been published, accepted within
the European Union and for the first time applicable on 1 January 2016:
- Amendments to IFRS 11 – Joint arrangements, ‘Accounting for Acquisitions of Interests in Joint Operations’ (published on 6
May 2014). These have no impact on the consolidated financial statements of the Group;
- Amendments to IAS 16 – Property, Plant and Equipment and IAS 38 – Intangible assets, ‘Clarification of Acceptable Methods
of Depreciation and Amortisation’ (published on 12 May 2014). These amendments have no impact on the consolidated fi-
nancial statements of the Group;
- Amendments to IAS 16 – Property, Plant and Equipment and IAS 41 – Agriculture, ‘Agriculture – Bearer Plants’ (published on
30 June 2014). These have no impact on the consolidated financial statements of the Group;
- Amendments to IAS 27 – Separate Financial Statements, ‘Equity Method in Separate Financial Statements’ (published on 12
August 2014). These have no impact on the consolidated financial statements of the Group;
- Amendments to IAS 1 – Presentation of Financial Statements, ‘Disclosure Initiative’ (published on 18 December 2014). The-
se amendments aim to provide better disclosures in the financial statements based on professional judgement by the com-
pany. These principles have been applied in the consolidated financial statements of the Group without major changes com-
pared to last year;
- Amendments to IFRS 10 – Consolidated Financial Statements, IFRS 12 – Disclosure of Interests in Other Entities and IAS 28
– Investments in Associates and Joint Ventures – ‘Investment Entities Applying the Consolidation Exception’ (published on 18
December 2014). These have no impact on the consolidated financial statements of the Group;
- Amendments of the 2012-2014 cycle (published on 25 September 2014). These have a minimal impact on the consolidated
financial statements of the Group:
- IFRS 5 – Non-current Assets Held for Sale and Discontinued Operations gives no additional explanation when an
entity should reclassify an asset held for sale as held for distribution or vice versa and also indicates cases in
which the processing as held for distribution should be stopped;
- IFRS 7 – Financial Instruments: Disclosures provides additional information to determine whether a management
contract is continuing involvement in a transferred asset, and also clarification in the netting notes in the abbrevi-
ated interim reporting;
- IAS 19 – Employee Benefits clarifies that the high-quality corporate bonds used for estimating the discount rate for
post-employment benefits must be in the same transaction currency as those of the fees to be paid;
- IAS 34 – Interim Financial Reporting clarifies the meaning of ‘elsewhere in the financial reporting’ and requires a
cross-reference.
Standards, amendments to standards, interpretations and amendments to interpretations that have been published, accepted within
the European Union and only applicable at a future date:
- IFRS 9 Financial Instruments was published as a final version on 24 July 2014. This standard is applicable as from the finan-
cial year 2018.
See chapter 3.2.
- IFRS 15 – Revenue from Contracts with Customers, published on 28 May 2014, originally effective since 1 January 2017,
but amended in 2015 with an effective date of 1 January 2018 includes a five-step model to determine when revenue should
be recognised.
Step 1 = Identify the contract with the customer
Step 2 = Identify the performance obligations in the contract
Step 3 = Determine the transaction price
Step 4 = Allocate the transaction price to the performance obligations in the contract Step 5 = Recognise revenue when (or as) the entity satisfies a performance obligation
This IFRS is expected to have a minimal impact on the consolidated financial statements of the Group.

VAT BE0404.476.83536 36
Other changes:
Standards, amendments to standards, interpretations and amendment to interpretations as published by the IASB are first subject to
an endorsement process in the European Union before they are applicable in the consolidated financial statements of AXA Bank Europe.
Currently a number of amendments are still in the pipeline of that EU endorsement process, of which the new standard IFRS 16 - Leas-
es is the most important. This standard has been published on 13 January 2016, is applicable for the IASB as from 1 January 2019 and
introduces a uniform accounting methodology for lessees. The Group is currently assessing the impact of this standard on the consoli-
dated financial statements.
3.2 IFRS 9
IFRS 9 – Financial Instruments contains three phases.
The first phase relates to the classification and measurement of financial instruments. An initial publication on 12 November 2009
introduced the rules for financial assets. Here the requirement is to classify financial assets based on the business model in which they
are held and based on the characteristics of the contractual provisions’ cash flows. A second publication on 28 October 2010 intro-
duced the rules for financial liabilities. The majority of rules were carried over from IAS 39, but some new requirements were set in case
the option was taken to value the financial liabilities at fair value with fair value changes in the income statement. Here the difference in
fair value is due to the change in the credit risk included in the equity (under other comprehensive income). The latter rule was pub-
lished on 19 November 2013 eligible for early adoption. On 24 July 2014 a number of additional amendments were published in con-
nection with the financial assets, which allowed a third measurement criteria for some simple liability instruments if the business model
is aimed at a combination to receive contractual cash flows and sell financial assets. The changes to fair value were included in equity
in this category (under other comprehensive income).
The second phase, last published on 24 July 2014, relates to a new method for calculating impairment on financial assets and credit
commitment. The calculations made in this method are realised based on expected credit losses and therefore no longer on incurred
credit losses. In addition, the method must be applied in the same way on loans and fixed income securities. Therefore, clauses should
be included (from the first recording) for expected credit losses as well as (after first recording) changes to the expected credit losses.
The third phase, published on 19 November 2013, relates to general hedge accounting rules. The specific rules for open portfolios and
macro hedging are still in a project phase. The requirements for these new hedge accounting rules are a more principle-based approach
and are better in line with risk management practices.
Based on the current data, AXA Bank Europe does not expect any significant impact on the balance sheet or equity under the modified
rules on classification and rating (first phase) and the general hedging rules (third phase).
As far as the second phase is concerned – the new method to calculate special impairments – AXA Bank Europe cannot provide a
precise impact analysis currently because the models are currently being developed, including the possible choices and allocations
within those models, and because the level of impairments will depend on the economic situation at the introduction of the new meth-
odology and the assessment of the credit losses at that time. Based on the current data, it is however expected that the requirement to
take the ‘lifetime expected credit losses’ into consideration with a significant increase of the credit risk since the initial recording, being
the expected credit losses over a time span of the entire duration of the debt instrument (credit or fixed-rate effect), instead of 1 year
upon initial uptake, may lead to an increase in the value of the special impairments.
Governance of the IFRS 9 Project:
The IFRS 9-project is monitored by a project Steering Committee reporting to a number of delegated members of the AXA Bank Europe
Executive Committee. The following project components were defined:
- ‘Classification and valuation’: impact study of the first phase of IFRS 9. This impact study was largely completed in Septem-
ber 2016 (with some remaining issues in 2017). A section of the investment portfolio would be classified as continued for
collecting cash flows, while another section would be deemed continued for collecting cash flows and sales. The retail activity
would be deemed continued for collecting cash flows.
- ‘Special depreciations’: impact study of the second phase of IFRS9, including the determination of the methodology and the
development of the models. The methodology was established and the models are currently being developed (see below).
This project phase will in principle be concluded in June 2017.
- ‘Accounting Information’: determination and realisation of the necessary changes to the accounting systems following the two
previous project phases. This part was commenced in August 2016 and is expected to be delivered by the end of June 2017.

VAT BE0404.476.83537 37
There are in principle no major changes in the accounting systems. The completion of this section in June 2017 serves for
commencing a parallel run in the second half of 2017.
- ‘Financial Information’: determination of the disclosures in the different financial reporting sets. This study was commenced
in October 2016. The end of this section is scheduled in September 2017.
AXA Bank Europe has the intention to apply hedge accounting under IAS 39.
The IFRS 9-project is also supervised globally by the AXA Group, which is expected to only switch to IFRS 9 in 2021.
Impairment
Based on the recommendations of the EDTF (‘Enhanced Disclosures Task Force’) of December 2015 on useful disclosure to help mar-
ket participants understand future changes in the ‘impairment’ section of IFRS 9, an overview of the key concepts, governance and
processes AXA Bank Europe considers using. Point out that these core concepts, governance and processes, as well as the applicable
bases for accounting policies and detailed procedures have not yet been validated by the Auditors by the end of 2016.
General Principle
Under IFRS 9, expected credit losses are required to be measured through a loss allowance at an amount equal to:
- the 12-month expected credit losses (expected credit losses that result from those default events on the financial instrument
that are possible within 12 months after the reporting date) (‘stage 1’); or
- full lifetime expected credit losses (expected credit losses that result from all possible default events over the life of the fi-
nancial instrument) (‘stage 2’).
Interest revenue is calculated differently according to the status of the asset with regard to credit impairment. In the case of a financial
asset for which there is no objective evidence of impairment at the reporting date (‘stages 1 and 2’), interest revenue is calculated by
applying the effective interest rate method to the gross carrying amount. In the case of a financial asset that has become credit-
impaired (‘stage 3’), interest revenue is calculated by applying the effective interest rate to the amortised cost balance, which comprises
the gross carrying amount adjusted for any loss allowance.
Significant Increase in Credit Risk
At each reporting date, AXA Bank Europe will measure the loss allowance for a financial instrument at an amount equal to the lifetime
expected credit losses. If, at the reporting date, the credit risk of a financial instrument has not increased significantly since initial
recognition, AXA Bank Europe will measure the loss allowance for that financial instrument at an amount equal to 12-month expected
credit losses.
The criteria that AXA Bank Europe intends to use in order to identify a significant increase in the credit risk of a financial instrument at
the reporting date will be based on the probability of default. AXA Bank Europe would transfer all financial instruments for which the
probability of default over 12 months between origination date and reporting date will have increased by a relative amount and to an
absolute fixed level. Additional triggers would be when the contractual payments are more than 30 days past due and in the case of
forbearance. AXA Bank Europe would not rebut the presumption of 30 days past due.
Definition of Default
AXA Bank Europe’s default definition is in line with Regulation (EU) No 575/2013 and EBA guidelines.
AXA Bank Europe will consider a financial asset to be in default when one or more of the following conditions are fulfilled:
- Unlikely to pay: the borrower is unlikely to pay its credit obligations to AXA Bank Europe in full, without recourse by AXA Bank
Europe to actions such as realising collateral;
- 90 days past due: the borrower is past due more than 90 days on any material credit obligation to AXA Bank Europe;
- Pre-litigation: the borrower is 90 days past due and in remediation;
- Litigation: the borrower is 9 months further in pre-litigation or the facility is terminated.
Assumptions used for the cure rate:
- Unlikely to pay: the borrower is no longer in forbearance, the borrower is past due less than 30 days;
- 90 days past due: the borrower is past due less than 90 days;
- Pre-litigation: no more past due amount;
- Litigation: irrevocable process.

VAT BE0404.476.83538 38
Probation period:
- Unlikely to pay: In the case of forbearance minimum 2 years since classification non-performing/facility granted;
- Pre-litigation: 6 months (no reminder over 6 months).
Inputs into the assessment of whether a financial instrument is in default and their significance may vary over time to reflect changes in
legislation, market practices,...
AXA Bank Europe has fully aligned the definition of default and credit-impaired.
Determination of Grouping
When applicable, the financial instruments will be grouped on the basis of loans with the same nature and same features:
- instrument type;
- rating
Write-off Policy
Loans and debt securities will be written off (either partially or in full) when there is no realistic prospect of recovery. This will generally
be the case when AXA Bank Europe determines that the borrower does not have assets or sources of income that could generate suffi-
cient cash flows to repay the amounts subject to the write-off. However, financial assets that are written off could still be subject to
enforcement activities in order to comply with the AXA Bank Europe’s procedures for recovery of amounts due.
Inputs, Assumptions and Estimation Techniques
The key inputs into the measurement of expected credit losses (ECL) will be the following variables:
- probability of default (PD): the probability that the counterparty will default over a certain time horizon;
- loss given default (LGD): percentage of exposure at default (EAD) to be lost in the event of default of the counterparty;
- exposure at default (EAD): amount to which the bank is exposed in the event of default of counterparty.
These parameters will generally be derived from internally developed statistical models and other historical data. They will be adjusted
to reflect forward-looking information and any prudential conservativeness will be filtered out.
Two types of PDs will be used for calculating ECLs:
- 12-month PDs – This is the estimated probability of default occurring within the next 12 months (or over the remaining life of
the financial instrument if that is less than 12 months). This will be used to calculate 12-month ECLs;
- Lifetime PDs – This is the estimated probability of default occurring over the remaining life of the financial instrument. This
will be used to calculate lifetime ECLs for ‘stage 2’ and ‘stage 3’ exposures.
AXA Bank Europe intends to derive the 12-month marginal PD from the IRB (Internal Ratings Based) model under Basel, without con-
servative adjustments.
The lifetime PD would be determined by forecasting the marginal PDs for the different time steps by including forward-looking macro-
economic information (regression model). Beyond the forecasting horizon of the macro-economic variables, a long term target PD esti-
mate would be used to which the marginal PD will converge after some time. The typically decreasing PD behaviour, due to ageing, for
certain portfolios such as mortgage loans, would be taken into account.
EAD would be determined based on an estimate of the exposure at a future default date.
LGD would be based on the difference between the contractual cash flows due and those that AXA Bank Europe would expect to re-
ceive, including from any collateral. For mortgage loans and professional loans secured by retail property, loan-to-value ratios would be
used as a key parameter in determining LGD. For this purpose, a forecasted house price index would be used. Beyond the forecasting
horizon of the loan-to-value ratios, expert opinion would be used to estimate the average yearly growth of the house price index.
AXA Bank Europe would derive the lifetime expected loss for financial instruments recognised on the balance sheet by discounting the
expected losses (using the effective interest rate), the contractual pay-offs and possible prepayments, with adjustments for missing
payments that occurred in the period before default occurred.
It is intended to calculate lifetime expected credit losses as a probability-weighted outcome probably based on 3 scenarios: a medium
up-turn scenario, a base scenario and a medium down-turn scenario.

VAT BE0404.476.83539 39
Forward-looking Information
AXA Bank Europe intends to include 3 years of forward-looking information.
The above paragraphs are applicable to AXA Bank Europe’s retail portfolio. Deviations are possible regarding the non-retail portfolio.

VAT BE0404.476.83540 40
-
4 Risk Management
4.1 General
AXA Bank Europe has continued to build towards coherent and prudent risk management in 2016. The bank has broadly implemented
robust and effective strategies, policies, processes and systems to identify, measure, manage and monitor its risks.
AXA Bank Europe has continuously adapted risk policies in order to stay on track in a constantly changing environment.
The European Central Bank (ECB) is the competent authority for prudential supervision of AXA Bank Europe. This supervision was effec-
tively carried out by the so-called Joint Supervisory Team (JST) that consists of members of the ECB and the national enforcement body.
Regular consultation took place with the relevant supervisors by means of on-site inspections, workshops, interviews and reports.
In 2016, AXA Bank Europe also took part in a ‘Supervisory Review and Evaluation Process’ (SREP), led by the JST. During this process,
the supervisor assessed the bank's risks and decided on minimum capital requirements for the bank in 2017, as well as a number of
qualitative recommendations with which the bank will have to comply in future.
The bank's credit risk dropped further in 2016 with the realisation of the sale of its Hungarian branch. All retail activities in Hungary
were transferred to OTP Bank in the last quarter of 2016. The official closure of the branch in Hungary is planned for 2017.
The Belgian mortgage market continued to suffer from a high degree of refinancing in 2016 as a result of low interest rates. AXA Bank
Europe managed to reduce the pressure on profitability by achieving a significant new production of good quality mortgage loans.
In addition to retail business, AXA Bank Europe acted as an intermediary in providing financial services, mainly derivatives to various
entities in the AXA Group.
Although a large volume of derivatives was traded in 2016 with entities in the AXA Group, the balance on AXA Bank Europe off-balance
remained relatively stable due to the usual practice of compression in derivatives, mostly to LCH (central counterparty). In addition,
fewer derivatives were needed to cover the interest rate risk in the bond portfolio since the portfolio has been significantly reduced.
The liquidity position of AXA Bank Europe remained at a comfortable level in 2016.
The bank's solvency position remains high due to a conservative investment strategy and a conservative dividends policy. The balance
sheet total has dropped further in part due to a significant decrease in our investment portfolio, resulting in a positive impact on our
leverage ratio.
AXA Bank Europe has further developed an internal stress testing program in 2016. This program describes the different stress test
exercises, the risks that are stressed on a regular basis, the use and reporting of the stress test results. The program covers all material
risks affecting AXA Bank Europe and performs different types of stress testing (per risk, based on scenarios, reverse stress testing).
Risk Appetite
The permanent identification and quantification of the bank's material risks are at the heart of the AXA Bank Europe risk policy. These
risks are measured, limited and constantly tracked using an internal risk appetite framework (Risk Appetite Framework or abbreviated
RAF).
In 2016, AXA Bank Europe has developed this so-called RAF further into a strategic tool. A strategic risk appetite was determined for the
main areas (capital, profitability, economic values and liquidity), taking the stress sensitivity of these domains into account and in line
with the guidelines of the AXA Group. This strategic risk appetite is translated into functional risk limits and forms a guide for the daily
activities in the various risks and product lines. This risk appetite model was approved by the Board of Directors and is used by this
management body and the Management Committee as a central tool for managing the risks in the bank.
All material risks are translated into relevant indicators, summarized in the ‘risk dashboard’. This includes both regulatory and internal
indicators. Different levels of severity are defined for each indicator, so management is warned in good time if an indicator approaches
its maximum risk appetite. This ‘risk dashboard’ forms an integral part of the general risk monitoring process and is reported to the
Management Committee monthly, and quarterly to the Board of Directors. These risks are also followed up in more detail by the relevant
AXA Bank Europe risk committees.
The prospects in the strategic plan and the budget are checked against the RAF limits. The strategic plan undergoes multiple iterations
until equilibrium is reached between both profitability and risks. The strategic plan was designed so all risks fall within the risk appetite
and the regulatory limits, while taking new and existing regulations into account to meet the regulatory solvency requirements.
The risks are also subject to an economic capital model that generates forecasts covering different horizons. The economic capital is
then distributed to all activities of the bank, and this based on the AXA Bank Europe risk objectives. The management of AXA Bank
Europe imposes a limit on the total economic capital applied so as to ensure the bank has sufficient financial resources at all times.

VAT BE0404.476.83541 41
Stress Testing
In 2016 AXA Bank Europe was submitted to SREP stress test exercise (SREP = ‘Supervisory Review and Evaluation Process’) of the
European Central Bank (ECB). AXA Bank Europe wasn't part of the group of banks selected by the European Banking Authority (EBA)
whose results were made public at the end of July, but of the group whose resilience was tested as input for the SREP exercise. Firstly,
the quantitative results of the stress test were used as input to determine the ECB Pillar 2 capital guidelines (P2G), while the qualitative
aspects were invoked to determine the Pillar 2 capital requirements. The qualitative aspects not only include an assessment of the
extent to which AXA Bank Europe manages to deliver the required information in a timely manner, but also an assessment of the notion
held by AXA Bank Europe of the risks contained in its business model.
The 2016 stress test was more extensive than the exercise of 2014 because the operational risk and CVA risk were also taken into
account, among others. The solvency ratios were significantly higher than the results of the 2014 stress test, and there were two rea-
sons for this. The test date was set at the end of 2015. At that time, the important risk mitigation measures were already fully imple-
mented and there were no ABS or MBS present on the balance sheet any more. In addition, the solvency ratios at the end of 2015 – the
starting point for the exercise – were significantly higher than in the previous stress test in 2014.
Most important, the exercise confirmed the causes of AXA Bank Europe's weaknesses. AXA Bank Europe's main risk exposure concerns
possible fluctuations in interest rates and government spreads that have an immediate impact due to the size of its investment portfo-
lio. It should however be noted that the investment portfolio has already been reduced by more than a third since the end of 2015. The
second biggest risk factor concerns the retail credit risk due to the concentration of mortgage loans and therefore, de facto, the expo-
sure to risks from the residential real estate market. In addition, the stress test confirmed the bank's exposure to interest rate fluctua-
tions, which could lead to a decrease in net-interest revenue in the income statement.
The SREP stress test not only allowed AXA Bank Europe to correctly estimate the risks contained in its business model, but also provid-
ed valuable material to improve its own internal stress test framework.
In the following sections, we will focus more on the important risk categories to which AXA Bank Europe was exposed to in 2016, namely
credit, market, liquidity, operational and strategic risks. All these risks have a potential impact on the bank's objectives in terms of
solvency, liquidity and profitability.
The other risks of the bank are described in the AXA Bank Europe report ‘Pillar 3 Risk Disclosure’.
4.2 Credit Risk
The credit risk is the risk of losses due to the default or deterioration of the credit quality of counter parties in credit activities.
AXA Bank Europe's main core business consists of pure retail bank activities, in other words, raising funds (daily transactions, savings
products) and the supply of loans to its customers, especially households, professionals and small businesses through its network of
independent agents. Most of the bank credit risk stems from these activities, which include both balance sheet and non-balance sheet
entries, such as unused credit lines.
The credits/deposits ratio at the end of 2016 was 98%.
AXA Bank Europe also converted a part of its retail mortgage loans into RMBS (‘Retail Mortgage-backed Securities’), part of which was
converted into covered bonds that are sold on the financial markets, so a comfortable buffer could be constructed in terms of liquidity.
Some of this liquidity is included in an investment portfolio with a low credit risk profile. (See chapter Error! Reference source not
found.)
Another source of credit risk is the derivatives activity conducted to support the AXA Group activities, as well as for the management of
repo and reverse-repo activities for the AXA Group.
4.2.1 Retail Credit Risk
AXA Bank Europe is exposed to credit risks as a result of credit activities involving Belgian retail customers. The risks associated with
the retail credit portfolio in Belgium concern mortgages, consumer loans and business loans. The largest part consists of mortgage
loans (with a share in 2016 of almost 88% of the total outstanding amounts).
The purpose of credit risk management is to prevent one or more credit events from affecting the solvency or profitability of the bank.
To achieve this objective, loan portfolios must remain within certain predetermined limits. These limits are determined by a previously
elaborated risk appetite framework (RAF) in which functional limits are defined. These functional limits are translated into operational
limits and it is these limits that are used on a daily basis to ensure the credit activity operates within the risk appetite defined by the

VAT BE0404.476.83542 42
Board of Directors. One can get a good understanding of the risk-evolutions because of these and other extensive reports by Risk Man-
agement on risk factors in the Belgian retail loan portfolio.
In addition, credit risk management has developed a framework which makes it possible to evaluate the credit activity's risk-weighted
return. A RAROC framework (risk-adjusted return on capital) was already developed for mortgage loans in 2015. The past year, a similar
framework was developed for both professional and consumer credits. Thus, the RAROC framework grew to become an essential ele-
ment in the profitability analysis of the retail credit activity.
In addition to qualitative models, risk management also includes quantitative models and opinions by experts. For instance, the bank
uses an advanced internal ratings based model (IRBA) for its Belgian credit portfolio. Internal rating models have thus been developed.
They are used to calculate capital requirements, but also for the acceptance and management of loans and for calculating provisions. Portfolio
In chapter 21 ‘Loans and Receivables’, the financial instruments are broken down by exposure to credit risk.
The mortgage loan portfolio experienced a strong net growth in 2016 by over 1 billion EUR thanks to a significant production and excel-
lent quality, but this was partially offset by a high volume of refinancing on the Belgian market.
We noticed a decrease of 15 million EUR for the consumer credit portfolio, because the production was still not sufficient to offset the
portfolio's natural erosion. This decrease is however lower than in 2015, where a decrease of 64 million EUR was observed.
In contrast to 2015, we noticed an increase of 51 million EUR on the professional loans portfolio. This is in line with the strategic initia-
tives of AXA Bank Europe to intensify the relationship in the professional segment.
Given the good coverage and the low probability of default for retail financing, the risk profile of the total loan portfolio is particularly
low.
Guarantees
Mortgage Loan Guarantees
The loan must be secured by a mortgage (registration or mandate) on an immovable property (full ownership). The properties should be
sellable in a normal manner. Property guarantees are required by law. The mortgage guarantees to be established are reusable in view
of any subsequent mortgage loans. All the guarantees in addition to the mortgage guarantees must be established before the official
registration of the credit (this therefore also applies for additional movable guarantees). With a bridging loan, a mortgage mandate is in
principle established on both the property to be sold and the property to be acquired.
Guarantees for Business Loans
The guarantees are (1) real (they concern a property, movable or immovable, with an intrinsic value), (2) personal (they consist of a right
of claim on a person) and/or (3) moral (they do not offer a bank any agent and are based on the fairness of those who issued them).
A list of guarantees that are regularly used for professional loans at AXA Bank Europe can be found in chapter 34.
Guarantees for Short Term Loans
Only one type of guarantee is used for a consumer credit: ceding a claim or ceding wages and other income. Credit Quality Performing
The credit losses amounted to a total of 3.6 million EUR in 2016, compared to 19.7 million EUR in 2015. The losses in 2016 are signifi-
cantly lower than those in 2015, for 2 main reasons. The main driver for the lower losses is the structurally improved risk profile of the
loan portfolio. It was decided in 2013 to tighten the credit policy so as to improve the quality of the portfolio. This adaptation has had a
somewhat delayed effect on the credit losses in 2016. In addition, there are some exceptional elements which made a further contribu-
tion to the huge drop in credit losses in 2016 (e.g. important additional income as a result of the sale of already written off credits, an
exceptional decline in commissions on mortgage loans due to the adjustment of the underlying commission model).
An essential part of the credit risk policy is formed by the ‘Bank Collection’ Department. The Department takes the necessary measures
to reduce the bank's risk to a minimum depending on the nature and severity of the problem. In addition, the Department determines
the monthly provisions amount needed for impairment losses.

VAT BE0404.476.83543 43
We witnessed a global recovery of the observed default rate1 (over a period of one year) in the Belgian portfolio, from which it can be
concluded that the quality has increased and that the product mix of credits in Belgium has improved.
The default rate over 12 months for mortgage loans fell from 0.8%2 in December 2015 to 0.5% in December 2016. The vintages of the
new production are still declining and it is therefore expected that this downward trend will persist when economic conditions remain
unchanged.
The default rate over 12 months for loans to professionals and small businesses dropped from 1.9% observed in December 2015 to
1.7% in December 2016, which reflects the defensive approach of the past few years.
A decrease in the default rate over 12 months was also observed for consumer loans (from 1.3% in December 2015 to 1.2% in Decem-
ber 2016) due to a better risk selection and a change of the product mix to loans with a particular purpose.
In chapter 15 ‘Impairment’, the portfolio is split into a portion that is overdue but hasn't yet gone into default (overdue ≤ 90 days) and a
portion that is overdue and in default (overdue > 90 days).
Non-performing
AXA Bank Europe's definition of default on the retail loan portfolio is fully in line with the ITS which was published by the European
Banking Authority (EBA) in July 2014. AXA Bank Europe chose to implement a very strict definition of default, resulting in an increase in
the number of loans flagged as ‘unlikely to pay’ and the corresponding commission amounts, without affecting the quality of the under-
lying portfolio changes. In concrete terms, this means that a client/loan is in default if at least one of the following conditions applies:
• The client/loan is ‘unlikely to pay’
• The client/loan has ‘> 90 days payment arrears’ but is not in ‘pre-litigation’
• The client/loan is in ‘pre-litigation’ (PCX = (‘précontentieux’)
• The client/loan is in ‘litigation’ (CX = ‘contentieux’)
See specific table in chapter 15 ‘Impairment’
4.2.2 Non-retail Credit and Concentration Risk
The Wholesale Risk Committee is responsible for the checks on the extended limit framework concerning the credit quality of non-retail
counterparties. The limit framework assesses exposures to counter parties at different levels (country, sector, type of instrument and
counterparty) and prescribes limits at these different levels to limit both the individual counterparty risk and exposure to the concentra-
tion risk. The Wholesale Risk Committee works within the risk appetite context that has been approved by the AXA Bank Europe Board
of Directors.
In addition, AXA Bank Europe also follows up on its investment portfolio in terms of:
1. Adequacy of securities for the calculation of the liquidity cover ratio (see chapter Error! Reference source not found.). The AXA
Bank Europe investment policy is almost exclusively limited to assets of the highest liquidity class, as defined by Basel III (L1);
2. Adequacy of securities for the calculation of the solvency ratio.
In addition to the fact that credit and concentration risks are followed locally, this is also monitored at the AXA Group level.
AXA Bank Europe reports on a monthly basis all of its positions to the Central Risk Management Department of AXA Group to ensure
compliance with this second set of limits.
4.2.2.1. Investment Portfolio
1 'Default rate over one year' means the ratio between the number of defaults that occurred during a period beginning one year before a
date T (observation date) and the number of debtors that is assigned to this degree or pool, one year before that date (example date).
2 Based on the old default definition

VAT BE0404.476.83544 44
In 2016, the investment portfolio book value (including the non-realized capital gains and losses) dropped from 7.4 billion EUR to 4
billion EUR, mainly due to the sale and maturing of government bonds. The majority of the AXA Bank Europe investments consist of high
quality government bonds (67%) and supranational bonds (29%).
* In billions EUR
In addition, credit ratings and changes in the market price of AXA Bank Europe positions are carefully monitored to examine the vulner-
ability of the loan portfolio for a number of adverse developments. No position has a rating lower than investment grade.
Geographically, the credit risk of the investment portfolio is limited to countries who are members of the European Union.
Breakdown of the government portfolio national and supranational (December 2016)
AXA Bank Europe follows its exposure to PIIGS countries closely. As several PIIGS government bonds matured in 2016 and were not
reinvested, the total exposure to these PIIGS countries has dropped by 72.9 million EUR.
Exposure to Spain has dropped (from 197 million EUR to 151 million EUR), exposure to Italy has remained virtually stable and that to
Portugal (15 million EUR end 2015) is gone. AXA Bank Europe only invests in government bonds of Spain and Italy.
You will find a list of accounting PIIGS-exposure as at 31 December:
Country Type of Instrument Market value 2015 Market value 2016 % evolution
Spain Sovereign 197,077 151,155 -23%
Italy Sovereign 340,062 328,758 -3%
Portugal Sovereign 15,491 0 -100%
VAT BE0404.476.83545 45
4.2.2.2. Counterparty Credit Risk of the Trading Room Activity
AXA Bank Europe offers a centralised platform for the entities of AXA Group to access financial markets. Several insurance entities
within AXA Group use this platform, which offers two services. First of all, AXA Bank Europe is an intermediary for pure derivatives such
as interest rate swaps that the AXA Group’s insurance entities use to hedge market risk on their life insurance. In order to measure the
counterparty credit risk of these derivatives, we take into account the possible future evolution of the derivative value in case of coun-
terparty default. To achieve this, the derivatives are valued after applying market shocks. The losses that are caused by these market
shocks should stay under the allowed limit for the counterparty. Secondly, AXA Bank Europe provides liquidity to insurance entities via
standardized money market transactions (‘reverse repos’) in which AXA Bank Europe buys high-quality government bonds and commits
to sell these bonds again at a specific future date and price. The volume of this activity amounted to 926 million EUR at the end of
2016, with maturities up to maximum 1 year. The value of the bonds should be 10% above the cash value for these transactions. This
protects AXA Bank Europe from a loss due to negative price evolution of the bonds in case of a counterparty default.
The bank's exposure to derivatives and money market transactions, including the transactions within the AXA Group, which are de-
scribed in the previous paragraph, is limited via a very strict policy regarding collateral requirements. Exposures to such transactions are
subject to a daily credit risk monitoring and collateralized on a daily basis with both market counterparties and AXA Group counterpar-
ties. Guarantees exchanged are limited to cash and high-quality securities in order to ensure adequate limitation of credit exposures.
The counterparties for the trading room activity of treasury and derivatives are selected based on external ratings of three rating agen-
cies (Fitch, Moody's and Standard & Poor's) which results in an internal AXA rating. In order to qualify as an active trading partner, coun-
terparties should have an AXA rating of at least A-. There are also ‘passive’ counterparties which have a rating of at least BBB+. With
these counterparties, there are still open positions from, but no new trades are allowed. These counterparties are of course monitored
closely. For all derivatives, it is mandatory to enter into an ‘ISDA Master Agreement’ and a ‘Collateral Service Agreement’. For repo
transactions, it is mandatory to enter into a ‘Global Master Repurchase Agreement’. Every new counterparty should be presented to and
approved by the Wholesale Risk Committee.
Exposure at Default
AXA Bank Europe provides insight below in the so-called exposures at default of a counterparty related to the trading room activity, both
for derivatives and (reverse) repos. The regulatory definition is used that takes the nature of the instruments into account and simulates
the exposure amount incase of a counterparty default. This exposure is used to calculate the risk-weighted assets and capital require-
ments.
(i) Repo & Reverse Repo
AXA Bank Europe had two counter parties for this activity on 31 December 2016. AXA Belgium and LCH Clearnet Ltd, the central coun-
terparty for these transactions. On the AXA Belgium side (reverse repo) there is no exposure at default as AXA Bank Europe receives
sufficient collateral to cover the exposure on AXA Belgium. On LCH Clearnet side (repo) there is exposure (51.9 million EUR) considering
that LCH Clearnet requires additional collateral from all its members.
(ii) Derivatives
The regulatory method to determine exposure at default for derivatives counterparties includes the following steps:
a) Transactions are grouped in ‘netting sets’, in which it is legally possible to add positive and negative market values;
b) For each transaction a risk factor is determined, which reflects the possible negative evolution of the transaction value in case of
counterparty default;
c) (a) and (b) are added to the collateral that is given to a counterparty (if (a) is negative) or received from a party (if (a) is positive).
The outcome of this calculation gives the exposure at failure per counterparty.
The aggregated results as at 31 December are displayed step by step below.
a) The sum of all positive market values amounts to 4,816 million EUR. Of these positive market values amounts, 3,978 million EUR
is neutralised by negative market values. AXA Bank Europe emphasises here that this neutralisation goes beyond purely account-
ing netting of balance sheet items that is discussed in chapter 33 based on legally enforceable netting rights. Chapter 34 elabo-
rates on the nature of the collateral.

VAT BE0404.476.83546 46
b) The sum of the risk factors amounts to 429 million EUR. To clarify: this is the regulatory prescribed calculation of a negative evolu-
tion of the derivatives portfolio at the simultaneous default by all counterparties in stressed market conditions.
c) In total, AXA Bank Europe pledged 1,338 million EUR collateral and received 805 million EUR collateral. When we look across all
counter parties, and charge the collateral at a) and b), we arrive at a total exposure of 511 million EUR in stressed market condi-
tions and at the simultaneous default by all counterparties. Under stable conditions, this exposure still amounts to EUR 174 mil-
lion. It is important to note that EUR 139 million in these figures stems from the high collateral requirements of the central coun-
terparty LCH Clearnet. As AXA Bank Europe has very high standards regarding the quality of its counterparties, none of the (reverse) repos and derivatives are past due or impaired. Concentration Risk
AXA Bank Europe follows the regulatory requirements regarding the limitation of large exposures, where the exposure to a group of
affiliated counterparties may not exceed 25% of the eligible capital. Due to the diversification of counterparties, the exposure to AXA
Group is the only exposure that exceeds 10%, but it remains signicantly below the limit, which indicates a low concentration risk.
4.2.2.3. Securitisation of Retail Credits
With its covered bond program, AXA Bank Europe wants to complement its traditional funding basis of retail deposits with another
stable funding source. The strong underlying quality of the mortgage and promissory loans is the iedeal collateral for a covered bond
program.
The bank launched its first covered bonds in November 2010. The covered bond program amounts to 4,150 million EUR in 2016 of
which 3,400 million EUR remains on a consolidated level: 3,400 million EUR in the market and the 750 million EUR retained by AXA
Bank Europe were eliminated in the consolidated balance sheet. AXA Banque France has subscribed 400 million EUR of these covered
bonds.
4.3 Market Risk
For market risk, AXA Bank Europe differentiates between the market risk that is related to the ‘trading book’ (accounting classification),
and interest rate risk related to the ‘banking book’. The trading book includes all financial instruments that are used in the context of
specific trading activities. AXA Bank Europe does not carry out any trading activities for its own account. The financial instruments falling
under the ‘trading book’ accounting classification, mainly concern the derivatives activity for AXA entities. The banking book includes all
other financial instruments that do not belong to the trading book. These mainly concern the bank's retail business.
The Management Board of AXA Bank Europe is responsible for the management of market risk. However, day-to-day management is
delegated to the ‘Assets & Liabilities Committee’ (ALCO) for interest rate risk concerning the banking book and to the ‘Wholesale Risk
Committee’ (WRC) for the market risk concerning the trading book. In addition, ALCO and WRC evaluate the risk reports submitted by
the AXA Bank Europe Risk Management Department. Finally, both committees also supervise compliance with the limits set out in the
risk appetite framework.
4.3.1 Interest Rate Risk Banking Book
The interest rate risk in the banking book is defined as the risk of a decrease in economic value or the net interest income of the bank-
ing book as a result of changes in the market interest rates. It can be subdivided further into yield curve risk (also sometimes called gap
risk), basic risk and risk through interest options.
At AXA Bank Europe, basic risk and risks due to interest options consist especially of mortgage loans with variable interest rates. The
interest rates of these residential credits in Belgium are linked to the evolution of the OLO interest rates (‘Obligation Linéaire’/’Lineaire
Obligatie’). As a result, changes in the spread between OLO interest rates and interbank or swap interest rates, give rise to changes in
the value and income of the banking book (= basic risk). In addition, the maximum interest rates of these mortgage loans are limited to
protect the client (= risk due to interest).
The interest rate risk for AXA Bank Europe and its subsidiaries is measured and managed at the AXA Bank Europe Head Office level. In
this context, the ‘Assets & Liabilities Management’ (ALM) Department acts as first-line of defence and the Risk Management Depart-
ment as a second autonomous line of defence.

VAT BE0404.476.83547 47
The monthly ALCO follows some (internal and regulatory) indicators to check and steer the interest rate risk. Both the risk of a drop in
economic value (= ‘value approach’ indicators) and the risk of a drop in interest income (= ‘earnings approach’ indicators) are moni-
tored.
The following table lists the values for 2 internal indicators: the Bank SI (‘Solvency Indicator’) and the Bank NII (‘Net Interest Income’).
The absolute Bank SI gives the impact of a parallel rise in market interest rates by 1% on the economic value of the banking book. The
relative Bank SI expresses this impact as a percentage of the regulatory capital.
The Bank NII gives the impact of a parallel rise in market interest rates by 1% on the interest result of the banking book. This indicator
corresponds to a new definition developed in the course of 2016 and wasn't available at the end of 2015.
Dec-15 Dec-16
Bank SI (absolute) -343 million EUR -241 million EUR
Bank SI (relative) -33% -22%
Bank NII 15.7 million EUR
4.3.2 Market Risk Trading Book
Value at Risk
AXA Bank Europe maintains a conservative approach of the trading book market risk. The trading activities of the bank are mainly
derived from AXA Bank Europe's role as centralized platform to the derivatives markets for the AXA Group insurance entities. The market
risk is strongly limited because all positions at AXA Group entities within the trading activities are mirrored by positions with external
counterparties on a ‘back-to-back’ basis. The AXA Bank Europe market risk consists primarily of the interest rate risk. In addition, the
equity risk arising from the issue of ‘Euro Medium Term Notes’ (EMTN) is immaterial, since AXA Bank Europe hedged this exposure in
the financial markets. AXA Bank Europe is also not involved in the trading activity of commodities.
All these activities are closely followed up by the AXA Bank Europe Risk Management Department within a framework of very strict
limits. The ‘Value at Risk’ (VaR) for all activities related to the trading book is limited to 2.17 million EUR. The VaR at a confidence level
of 99.5% and a time horizon of 10 days is calculated on a daily basis using 5000 ‘Monte Carlo’ simulations. The VaR for all trading book
activities at the end of 2016 was equal to 1.36 million EUR and is therefore well within the specified limit. In addition, this result is
representative of the entire 2016. Finally, this model is also subjected to appropriate annual back testing in order to preserve the accu-
racy and relevance of the model.
Materiality Thresholds of the National Bank of Belgium
The trading book was subject to materiality thresholds that have been introduced by the National Bank of Belgium (NBB) in 2015 in the
framework of the new Belgian banks legislation. The ‘Non Risk-Based Ratio’ for AXA Bank Europe, which is based purely on volume, is
well below the threshold defined by the NBB. The ‘Risk-Based Ratio’, which reflects the underlying risks, is also remarkably lower for AXA
Bank Europe than the regulatory threshold. This can be explained by the limited market risk resulting in low Market Risk Weighted
Assets.
Furthermore, the risk limit framework of AXA Bank Europe ensures that the VaR with a 99% confidence level and a holding period of 1
day does not exceed 0.25% of T1 capital.
4.4 Currency Risk
Currency risk is the risk that the fair value or future cash flows of a financial instrument fluctuate due to changes in exchange rates. AXA
Bank Europe operates a policy to minimise exposure to currency risk. Any material residual positions are hedged systematically. This
risk was followed up and hedged on a monthly basis in ALCO in 2016. In addition, there is a capital charge for this risk when the total
net position represents more than 2% of the equity. Finally, the currency risk in relation to the activities in Hungary disappeared with the
completion of the sale of the Hungarian entity during 2016.
4.5 Liquidity Risk

VAT BE0404.476.83548 48
The ‘Basel Committee on Banking Supervision’ (BCBS) defines the liquidity risk as the risk of not being able to quickly and easily in-
crease the cash position to absorb shocks as a result of financial and economic stress.
In recent years, liquidity management was one of AXA Bank Europe's key priorities. This resulted in a suitable framework for liquidity
risks, which is based on both regulatory and internal indicators. At the same time, the bank's liquidity contingency plan was adapted and
the bank has set up a special task force which must intervene immediately and take the appropriate actions in case of systemic and
idiosyncratic liquidity crises. This has led to a stronger awareness of liquidity risk at all management levels, as well as a more rigorous
follow-up. Regular forward-looking projections of the main liquidity ratios support the active management of the liquidity risk within AXA
Bank Europe.
AXA Bank Europe's strong liquidity position is reflected by a significant cash surplus, both in terms of regulatory Basel III-ratios and in
terms of internal indicators. The internal indicators were brought in line with the AXA Group liquidity indicators, but adapted to the spe-
cific context of AXA Bank Europe. In addition, these internal stress indicators include both short term stress (one-month time frame) and
long term (1 year time frame) that can occur today or tomorrow in our business plan.
AXA Bank Europe follows the Basel III liquidity indicators proactively. The LCR (‘Liquidity Coverage Ratio’) is binding since October 2015
and the NSFR (‘Net Stable Funding Ratio’) becomes binding in 2018. AXA Bank Europe has successfully adapted its strategy to meet
these required indicators. For example, this strategy includes the bank's investment policy that is limited to quite liquid assets and
attracting long-term stable funding. The main sources of stable funding are retail deposits (18.2 billion EUR at 31/12/2016) and cov-
ered bonds (3.4 billion at 31/12/2016). In view of the comfortable stock of liquid assets and a solid financing structure, the AXA Bank
Europe LCR and NSFR clearly surpassed the minimum requirements by the end of 2016.
Maturity Analysis Graph (High Level)
The fair value of derivatives is not included in this table since AXA Bank Europe doesn't consider these derivatives to be ‘funding’, con-
sidering the fact that they mostly form part of AXA Bank Europe's ‘back-to-back’ activities.
4.6 Operational Risk
Operational risk means: the risk of loss resulting from inadequate or missing internal processes, human error, or failing systems. A
shortcoming or inadequacy can have both internal and external causes.
AXA Bank Europe applies the operational risk management framework that was developed by the AXA Group. This framework consists of
an annual cycle that identifies, evaluates and quantifies the operational risks to which AXA Bank Europe can be exposed. This frame-
2016 (in EUR) < 3 months < 12 months > 12 months Total
Central Bank financing 200.000.000 0 150.000.000 350.000.000
Loans from financial customers 1.176.679.390 2.103.631 1.312.960 1.180.095.981
Unsecured funding (savings & current accounts of
'other financial corporates' + CIFP)135.469.209 2.103.631 1.312.960 138.885.800
Repurchase Agreements 1.041.210.181 0 0 1.041.210.181
Secured loans 0 0 0 0
Retail funding: 15.965.513.425 354.063.197 1.900.823.301 18.220.399.924
Non maturing retail funding (savings and current
accounts) 15.650.076.800 0 0 15.650.076.800
Maturing retail funding (deposits with agreed
maturity, EMTN for retail, customer saving
certificates)
315.436.626 354.063.197 1.900.823.301 2.570.323.124
AXA Group Financing: 102.463.221 7.247.765 698.974.714 808.685.700
Unsecured financing 98.574.422 0 0 98.574.422
EMTN 3.888.799 7.247.765 698.974.714 710.111.278
Other counterparties 3.300.425 1.000.000.000 2.413.035.409 3.416.335.834
Unsecured funding from non-financial customers 3.300.425 0 130.000 3.430.425
Covered bonds 0 1.000.000.000 2.412.905.409 3.412.905.409
Total 17.447.956.461 1.363.414.593 5.164.146.384 23.975.517.438

VAT BE0404.476.83549 49
work also includes a process to collect, aggregate and report data from incidents and losses in a continuous way. Remedial actions are
taken for the greatest risks and losses; the ultimate objective is to mitigate the operational risk for the bank as a whole.
Just as in past years, there was also a major focus in 2016 on detecting and combating fraud and cyber risks (hacking, phishing and
cyber-attacks). The cooperation with the other control lines (Audit, Compliance, Information Security) was further strengthened and more
work was done on the ‘risk awareness’ throughout the entire organization (organisation of training courses for the different business
lines, participation of the Operational Risk service in major projects and product launches). An ‘operational risk dashboard’ was also
operated in 2016. This dashboard contains indicators for the main domains and potential sources of operational risk; these indicators
as such fulfil an important signalling function towards AXA Bank Europe's management.
In 2017, the focus will be on structural formalising, implementing and following up of actions to mitigate the greatest risks and inci-
dents. The ‘Loss Data Collection’ process will be further optimized and formalized to ensure uniformity and maturity throughout the
organization. Work will also be done on the ‘Operational Risk Framework’ to clearly define the borders and the playing field for all ser-
vices and processes in AXA Bank Europe.
4.7 Strategic Risk
Strategic risk is the risk that the main objectives of AXA Bank Europe (in terms of profitability, solvency, liquidity and creating value) may
not be realized due to wrong decisions, inappropriate resource allocation or not responding correctly to changes in the environment. It
refers to decisions that are needed to adapt to the external business environment, to improve the internal organisation or exploiting new
strategic opportunities.
The strategic threats are tracked through annual strategic planning, financial planning processes, processes concerning the approval of
products and management of strategic projects.
AXA Bank Europe continued to implement the transformation plan that it had announced in 2014, in 2016. This plan focuses on two
core activities: retail in Belgium and Intermediation services that are exclusively offered to entities of the AXA Group.
The bank's strategic plan confirms AXA Bank Europe's positioning as a simple and low-risk bank. The goal is to achieve sustainable
growth, strengthening structural profitability and a superior customer experience.
4.8 Capital Management
4.8.1 Management
The capital risk is the risk that the bank has or may have insufficient capital to cover the risks to which the bank is exposed.
In practice, this is translated into a cross-check of the capital base against the minimum regulatory capital requirements (Pillar 1) and
the economic capital requirements (Pillar 2).
The capital base is carefully monitored by the ‘Capital Management Committee’ that forms a partial working group of the ‘Asset & Liabil-
ity Committee’ (ALCO) and that reports to the ALCO on a periodic basis. The Committee oversees the new regulations (‘regulatory
watch’), follows up on the current and projected solvency ratios, anticipates and manages the economic and regulatory capital require-
ments.
The calculations for regulatory capital are reported to the supervisor (COREP) on a quarterly basis.
The bank reports the required economic capital to the supervisor in an annual ICAAP file (‘Internal Capital Adequacy Assessment Pro-
cess’). The ICAAP is the internal review process of the institution itself, which allows it to assess the adequacy of its capital in light of its
risk profile and its organisation.
4.8.2 Regulatory Environment
The EU introduced stricter rules around capital requirements for banks in the aftermath of the financial crisis that are based on the
Basel III accords. The requirements for banks are set out in the ‘Capital Requirements Regulation’ (CRR) and the ‘Capital Requirements
Directive’ (CRD IV). The CRR/CRD IV was gradually introduced since 1 January 2014 and will be fully in force in 2019.
The minimum capital ratios (Pillar 1 requirements) which are to be met according to CRR/CRD IV are 4.5% for the core capital (CET1),
6.0% for the tier 1 capital ratio and 8.0% for the total capital ratio.
Besides the minimum own funds requirements of the CRR, AXA Bank Europe should also comply with the various buffers that can be
imposed in accordance with CRD IV.
The CRD IV provides for a capital conservation buffer. In times of an economic boom, this can be up to 2.5%. The premise is to reserve
additional capital in times of financial prosperity. In times of financial stress, the institution will be able to use this capital. The condition
is then that the institution may not pay out a dividend to shareholders. This buffer applied to the bank in 2016.

VAT BE0404.476.83550 50
AXA Bank Europe may also be obliged to build a counter-cyclical capital buffer representing an additional Core Tier 1 capital require-
ment. This buffer's aim is to protect the bank against risks arising from the financial cycle and can be up to 2.5%, possibly higher. This
requirement came into effect in 2016.
The Belgian regulator has appointed AXA Bank Europe as O-SII or ‘other system-relevant institution’ and therefore subject to an addi-
tional Core Tier 1 capital requirement (O-SII buffer) of 0.75%. The introduction of this buffer is phased in over a period from 1 January
2016 until 1 January 2018. This means that an additional capital requirement of 0.25% was imposed on AXA Bank Europe in 2016,
which will be increased by 0.25% in 2017 and again in 2018.
In addition to the Basel III capital requirements, AXA Bank Europe must also comply with the solvency ratio of Basel I, and this until
December 2017. In other words, the capital that the bank must hold must at all times be greater than or equal to 80% of the total
minimum amount of capital that the bank would be required to hold in accordance with the Basel I rules.
Following his ‘Supervisory Review and Evaluation Process’ review, (SREP), the competent supervisory authority (the European Central
Bank for AXA Bank Europe) may impose higher minimum ratios (= Pillar 2 requirements), because, for example, not all risks are properly
reflected in the regulatory Pillar 1-calculations.
4.8.3 Own Funds
The accounting core capital will be adjusted with:
• prudential filters, which exclude certain items of own funds, such as changes in the value of own credit risk and additional
value adjustments in the context of prudent ratings;
• and other deductions, such as intangible fixed assets, the deferred tax assets which are based on future profitability, deficits
in terms of provision of ‘Internal Rating Based approach’ (IRB). When IRB is applied to calculate the credit risk, the Tier 1 cap-
ital is corrected with a surplus or shortage of provisions in relation to the IRB estimate of the expected losses.
The reconciliation of the shareholders' accounting equity with the useful equity based on IFRS can be seen in the table below.
The CET1 amounts to 993.7 million EUR in 2016 versus 890.3 million EUR in 2015.
AXA Bank Europe is allowed to include the consolidated net profit for 2016 (EUR 95.3 million) in the Core Tier 1 capital. The evolution of
CET1 is further determined by the movements in accumulated other comprehensive income and the value adjustments. The total equity includes:
• CET1
• additional Tier 1 capital consisting of applicable convertible bonds;
• Tier 2 capital, consisting of the useful value of the subordinated loans, perpetual subordinated loans and including Basel III
transitional measures
COMPOSITION OF USEFUL CAPITAL 31/12/2016 31/12/2015
( in '000 Eur)
Paid in capital instruments 681.318 681.318
Reserves (including retained earnings) 266.141 239.864
Result of the current year 95.335 27.228
Other reserves 1.125 1.120
Accumulated other comprehensive income 47.915 134.175
ACCOUNTING CET1 CAPITAL 1.091.835 1.083.706
Prudential filters (26.221) (13.266)
Value adjustment of own credit risk (18.672) (11.503)
Value adjustment of prudent valuation (7.550) (1.763)
Deductions of CET1 capital (71.919) (180.088)
Regulatory adjustments accumulated other comprehensive income (35.518) (137.814)
Immaterial fixed assets (8.537) (6.885)
Deferred tax assets that rely on future profitability (11.073) (13.584)
IRB provison shortfall (16.791) (21.806)
USEFUL CAPITAL (CET1) 993.695 890.352

VAT BE0404.476.83551 51
The total useful own funds evolves from EUR 1,038.1 million in 2015 to 1,104.9 million EUR in 2016
4.8.4 Risk Weighted Assets
The weighted risk volume is calculated according to the specific Basel calculation rules for weighted risks for which ABE has received
approval. The bank uses the ‘Internal Ratings Based’ approach (IRB) to calculate the credit risk for the Belgian retail credit portfolio.
Consideration is also given to the decision of the NBB to use an ‘add-on’ of five percentage points on the risk weight for exposures to
Belgian mortgage loans of banks that use the IRB approach.
The standardised approach (SA) is applied for other credit exposures and market risks. The requirement concerning the operational risk
follows the BIA (‘Basic Indicator Approach’).
AXA Bank Europe meets all the minimum capital requirements imposed by Basel III. The bank also meets the strictest percentage of Tier
1 capital imposed under SREP.
4.8.5 Capital Ratios
The Common Equity T1, T1 and total capital ratio shall consider the transitional provisions of Basel III. The ‘fully loaded’ capital ratios
assume a full implementation of Basel III.
AXA Bank Europe meets all minimum capital requirements imposed by Basel III. The bank also complies with the stricter percentages on
Tier 1 capital imposed by SREP.
TOTAL OWN FUNDS FOR SOLVENCY REQUIREMENTS 31/12/2016 31/12/2015
CET1 capital 993.695 890.352
Additional Tier 1 capital 90.000 90.000
TIER 1 1.083.695 980.352
TIER 2 21.202 57.781
Subordinated debts 11.636 31.116
Perpetual subordinated debts 9.566 26.665
Perpetuals 15.943 38.093
perpetuals phase out (6.377) (11.428)
TOTAL OWN FUNDS FOR SOLVENCY REQUIREMENTS 1.104.897 1.038.133
RISK WEIGHTED ASSETS 31/12/2016 31/12/2015
( in '000 EUR)
Risk weighted assets for credit risk 3.733.507 3.949.383
Risk weighted assets for market risk 135.603 111.638
Risk weighted assets for operational risk 736.386 731.892
Risk exposure amount for credit valuation adjustment ( CVA-risk) 86.709 98.074
TOTAL RISK WEIGHTED ASSETS 4.692.204 4.890.987
CAPITAL RATIOS 31/12/2016 31/12/2015
CET1 ratio 21,2% 18,2%
T1 ratio 23,1% 20,0%
CRD ratio 23,5% 21,2%
Fully loaded CET1 ratio 21,8% 20,6%
Fully loaded T1 ratio 23,7% 22,4%
Fully loaded total Capital ratio 23,9% 23,1%

VAT BE0404.476.83552 52
4.8.6 Leverage Ratio
The leverage ratio is a complementary measure within the Basel framework. It is the carry between Tier 1 and the total exposure meas-
ure (balance and off-balance sheet items).
The aim is to constrain excessive leverage and to bring institutions’ assets more in line with their capital.
The ratio will become binding on 1 January 2018 but the guidelines of the BCBS (‘Basel Committee on Banking Supervision’) anticipate
the disclosure of the leverage ratio and its components from 1 January 2015.
According to the current CRR legislation (‘Delegated Act’), the AXA Bank Europe leverage ratio corresponds with the minimum bench-
mark of 3% and is equal to 4.1%. Fully loaded, the ratio is 4.2%.
LEVERAGE RATIO 31/12/2016 31/12/2015
Phase -in ratio 4,1% 3,4%
fully loaded ratio 4,2% 3,8%

VAT BE0404.476.83553 53
5 Fair Value of Financial Assets and Liabilities
5.1 Fair Value - Retail Activities
For short-term assets and liabilities or at sight, AXA Bank Europe uses the book value as the best approach.
The fair value of the retail products is calculated in different steps:
- first, future cash flows are calculated based on product features (client's interest rate, payment frequency, etc.);
- these cash flows are subsequently adjusted for retail credits in order to take into account early repayments (2.5% on an an-
nual basis for mortgage loans, 4% for investment credits, 10% on an annual basis for instalment loans);
- the calculation of the fair value, based on the Monte Carlo technique, includes the caps and floors embedded in floating
mortgage loans. In this methodology, a group of interest rate scenarios are generated. The cash flows of the mortgage loans
are simulated in each of these scenarios while taking into account the caps and floors. For example, the customer reset rate
will depend on the simulated market rate, but shall not be higher than the contractually embedded cap linked to the mort-
gage loan. The fair value of the portfolio is determined by taking the average of the discounted cash flows in the Monte Carlo
scenario.
Lastly, the (adjusted) cash flows are discounted on the basis of the IRS curve. The IRS curve is adjusted by the spread of costs for each
product to take into account the management costs of the product concerned.
5.2 Fair Value - Financing Activities (Treasury)
The financial instruments are subdivided into 3 categories.
The first category consists of financial instruments for which a fair value level 1 is determined based on market prices in an active
market.
Visibility of an active market is generally clear with market information available to the public and investors. There is no clear line or
minimum activity threshold that represents 'transactions regularly taking place on the market', such that the level of actual transactions
must be assessed while taking into account frequency and volume. However, low trading volume still represents a price if it is deter-
mined in a normal objective environment on an objective basis. The amounts of the transaction are important indicators of the fair
value.
In the absence of an active market for a specific instrument or if market prices are not available or are not regularly available, valuation
techniques will be used on the basis of the present value of future cash flows and the price will be determined on the basis of option
models. These valuation techniques use market data such as yield curves, dividend yield, index levels and volatility. AXA Bank Europe
uses information from Bloomberg, Markit and/or Interactive Data or provided by a reliable intermediary. These prices are then subject
to an internal validation or are valued using internal rating techniques.
The use of observable input parameters results in a fair value level 2, while the use of unobservable input parameters leads to a fair
value level 3, unless their influence is not significant. Observable inputs are developed using market data such as publicly available
information about actual events or transactions, and reflect the assumptions market participants would use in setting the price of the
instrument.
The significance of non-observable parameters is assessed (1) at the level of each individual financial instrument and (2) cumulatively.
1. the specific impact of non-observable parameters on the fair value of any financial instrument is assessed as soon as its
mark-to-market exceeds [ 0.05% ] of the total balance sheet. It is considered that it has more than an insignificant effect
when it influences the change in fair value of a financial instrument by [ 30% ] or more. In the case where AXA Bank Europe
could not measure the specific impact of the unobservable parameter on the fair value of the instrument with reasonable
efforts, the instrument is automatically classified in level 3;
2. at cumulative level, it is verified that the overall mark-to-market of all financial instruments using non-observable parame-
ters that are not classified under level 3 does not exceed [2% ] of the total balance sheet;
AXA Bank Europe uses a decision table in order to justify the level assigned to each class of instrument on the basis of these criteria.
A dedicated committee ensures a regular revision, at least once a year, of this decision table to ensure its accuracy and comprehen-
siveness. The dedicated committee is, at least, composed of the managers of the accounting policies (including CTFM) and the middle-
office representing the business.

VAT BE0404.476.83554 54
If, at level of this dedicated committee, there were still to be a disagreement over the fair value , the point would be escalated to the
CFO of AXA Bank Europe for a decision on the level classification.
The second category includes the following elements:
Assets
Receivables from other bankers
Receivables from other bankers include interbank investments and reverse repo transactions.
The estimated fair value is based on discounted cash flows at current market conditions.
Loans and receivables from clients
These loans and receivables are recognised for their net carrying amount, after impairment. The estimated fair value of loans and
receivables represents the discounted amount of the future expected cash flows. These expected cash flows are discounted in accord-
ance with current market conditions, thus determining the fair value.
Liabilities
Deposits and borrowings
The estimated fair value of fixed-yield deposits, repo transactions and other fixed-yield borrowings without quoted market price is based
on discounted cash flows at current market conditions.
Issued debt instruments
For issued certificates of deposit a discounted cash flow model is used based on a current yield curve applicable to the remaining term
of the instrument until the expiry date.
Overview of assets and liabilities measured at fair value
Assets / Liabil it ies
2016.12
in '000 EUR
Re
cog
nis
ed
or
dis
clo
sed
fa
ir v
alu
es
Fa
ir V
alu
e d
ete
min
ed
on
th
e b
asi
s o
f st
ock
ma
rke
t p
rice
s
Fa
ir V
alu
e d
ete
min
ed
on
th
e b
asi
s o
f
ob
serv
ab
le d
ata
oth
er
the
n s
tock
ma
rke
t
pri
ces
Fa
ir V
alu
e n
ot
de
tem
ine
d o
n t
he
ba
sis
of
ma
rke
t d
ata
Trading assets 1.643.504 16 1.617.633 25.856
Financial assets designated at fair value through profit or loss
Available-for-sale financial assets 4.304.987 4.297.280 978 6.730
Assets derivatives - hedge accounting 97.758 97.758
Financial liabilities held for trading 1.104.317 1.096.959 7.358
Financial liabilities designated at fair value through profit or loss 1.484.385 1.007.492 476.892
Liablitities derivatives - hedge accounting 401.701 401.701
Table FVAL.1
Assets / Liabil it ies
2015.12
in '000 EUR
Re
cog
nis
ed
or
dis
clo
sed
fa
ir v
alu
es
Fa
ir V
alu
e d
ete
min
ed
on
th
e b
asi
s o
f st
ock
ma
rke
t p
rice
s
Fa
ir V
alu
e d
ete
min
ed
on
th
e b
asi
s o
f
ob
serv
ab
le d
ata
oth
er
the
n s
tock
ma
rke
t
pri
ces
Fa
ir V
alu
e n
ot
de
tem
ine
d o
n t
he
ba
sis
of
ma
rke
t d
ata
Trading assets 1.555.673 1.534.226 21.448
Financial assets designated at fair value through profit or loss
Available-for-sale financial assets 7.838.627 7.831.826 70 6.731
Assets derivatives - hedge accounting 126.126 126.126
Financial liabilities held for trading 900.768 57 892.632 8.080
Financial liabilities designated at fair value through profit or loss 1.633.560 1.249.136 384.424
Liablitities derivatives - hedge accounting 544.533 544.533
Table FVAL.2
(1) Only applied if such valuation technique is based on assumptions that are not supported by prices from observable current market transactions in the same instrument (i.e. without modification or
repackaging) and not based on available observable market data.
(1) Only applied if such valuation technique is based on assumptions that are not supported by prices from observable current market transactions in the same instrument (i.e. without modification or
repackaging) and not based on available observable market data.

VAT BE0404.476.83555 55
See also chapter 33 Offsetting.
Financial assets held for sale for which the fair value is not based on the market value include shares that are recognised for their
purchase price as the best estimate of the market value.
EMTNs issued by AXA Belgium Finance are financial liabilities held for trading purposes. Its fair value was determined on the basis of
the ‘discounted cash flow’ method, where volatilities based on historical data were used as non-observable inputs. An increase (de-
crease) of 10% would lead to an increase (decrease) in fair value by 19.0 million EUR (2015: 18,0 million EUR).
The movements in the financial instruments for which the fair value is based on quoted prices or observable data other than quoted
prices are mainly due to the following elements (in ‘000 EUR):
The evolution of financial assets and liabilities held for transaction purposes is mainly due to derivative transactions within the ‘hub’
activities of AXA Bank Europe (access to the market for the main insurance entities of the AXA Group).
Level 3 fair va lue of f inancial assets / l iabilit ies ( in
EUR '000)
31.12.2016RW Level 3
OPENING BALANCEW&V OCI
(b) Purchases,
Sales and
Settlements
(c) Net transfer in
and out of Level 3
RW Level 3
CLOSING BALANCE
Assets available for sale 6.731 0 0 0 -1 6.730
Financial assets at fair value with fair value through profit and
loss 0 0 0 0 0 0
Financial assets held for trading 21.448 3.997 0 364 47 25.856
Financial liabilities held for trading -392.504 -1.476 0 -113.140 22.871 -484.250
Total level 3 f inancial assets / l iabilit ies -364.326 2.521 0 -112.776 22.917 -451.664
Table F VAL.3
Level 3 fair va lue of f inancial assets / l iabilit ies ( in
EUR '000)
31.12.2015RW Level 3
OPENING BALANCEW&V OCI
(b) Purchases,
Sales and
Settlements
(c) Net transfer in
and out of Level 3
RW Level 3
CLOSING BALANCE
Assets available for sale 6.731 0 0 0 0 6.731
Financial assets at fair value with fair value through profit and
loss 0 0 0 0 0 0
Financial assets held for trading 91.955 -71.768 0 1.261 0 21.448
Financial liabilities held for trading -354.783 21.200 0 -58.922 0 -392.504
Total level 3 f inancial assets / l iabilit ies -256.097 -50.568 0 -57.661 0 -364.326
Table F VAL.4
(a) Net gains and losses included
in:
(a) Corresponds to the realized and unrealized P & L and OCI during the period of financial assets / liabilities classified as Level 3 at the beginning (including the impact of foreign exchange income, interest income, impairment losses and
(b) Settlements during the period of financial assets / OBLIGATIONS classified as level 3 at the beginning (Purchases, Sales and redemption of securities)
(c) The net transfers in and out of Level 3 consists of the following movements: transfers from Level 2 to Level 3
(a) Net gains and losses included
in:
FV 2016 Level 1 Level 2 Level 3
Purchase/Sale/repurchase -3.515.075
From Level 2 to Level 1
From Level 3 to Level 2 1 -1
Delta compared to evolution Market Value -19.471 906
TOTAAL -3.534.546 907 -1
FV 2015 Level 1 Level 2 Level 3
Purchase/Sale/repurchase -950.416 -464.829
From Level 2 to Level 1 568.412 -568.412
From Level 3 to Level 2
Delta compared to evolution Market Value -10.000 45
TOTAAL -392.004 -1.033.196

VAT BE0404.476.83556 56
5.3 Day One Results
No day one results were recognised during the 2016 financial year.
5.4 Application of CVA and DVA on the Derivative Portfolio
Based on internal assessment by AXA Bank Europe, management believes that the impact of the application of CVA (Credit Value Ad-
justment) and DVA (Debit Value Adjustment) on the derivative portfolio amounted to gross CVA of 27.9 million EUR and gross DVA
of 23.5 million EUR. The net impact (earnings) thus came to 4.4 million EUR (before tax).
IFRS 13 defines the concept of fair value. Concerning derivatives in particular, this standard requires integrating a measure of credit risk
in the calculation of fair value through a CVA and a DVA. The CVA measures credit risk incurred by AXA Bank Europe on its counterpart
while the DVA measures the credit risk incurred by the counterpart on AXA Bank Europe.
The CVA and DVA are calculated net by counterpart. The CVA (DVA) depends on the exposure at the closing date, the counterparty credit
spread (AXA Bank Europe) and maturity of the deals. For any given offset, exposure consists of part of the current exposure, i.e. the
difference between the fair value of the position at the reporting date and the value of collateral exchanged at the said date and, sec-
ondly, of the potential future exposure, i.e. the expected change in the fair value of the position over a period of 10 days.
This total exposure is maintained until the average maturity of deals.
The subpart ‘current exposure’ changes over time. For the first 10 days, it corresponds to the difference between the fair value of the
positions on the closing date and the value of the collateral exchanged on that date. From the 11th day, this current exposure is re-
placed by the current maximum exposure as defined in the collateral contract (CSA Threshold and Minimum Transfer Amount) to which
any initial margin paid/received is added at the closing date as well as any possible structural and important difference between the
paid/received collateral and the valuations of AXA Bank Europe.
Fair value hierarchy: f inancial instruments at amortised cost
Asset/Liabil ity
2016.12
In '000 eur
carr
yin
g a
mo
un
t (i
f d
iffe
ren
t fr
om
fa
ir v
alu
e)
Re
cog
nis
ed
or
dis
clo
sed
fa
ir v
alu
es
Fa
ir V
alu
e d
ete
min
ed
on
th
e b
asi
s o
f st
ock
ma
rke
t p
rice
s
Fa
ir V
alu
e d
ete
min
ed
on
th
e b
asi
s o
f
ob
serv
ab
le d
ata
oth
er
the
n s
tock
ma
rke
t
pri
ces
Fa
ir V
alu
e n
ot
de
tem
ine
d o
n t
he
ba
sis
of
ma
rke
t d
ata
Loans & receivables 20.650.591 22.476.946 22.476.946
Debt securities
Loans and advances 20.650.591 22.476.946 22.476.946
Held-to-maturity investments
Debt securities
Loans and advances
Financial liabilities measured at amortised cost 23.400.741 23.566.539 3.597.950 19.968.589
Deposits 18.943.659 18.943.659 18.943.659
Debt securities issued 3.546.961 3.712.759 3.597.950 114.809
Other financial liabilities 910.121 910.121 910.121
Table.FVAL.7
Fair value hierarchy: f inancial instruments at amortised cost
1 2 3
Asset/Liabil ity
2015.12
In '000 eur
carr
yin
g a
mo
un
t (i
f d
iffe
ren
t fr
om
fa
ir
va
lue
)
Re
co
gn
ise
d o
r d
isclo
sed
fa
ir v
alu
es
Fa
ir V
alu
e d
ete
min
ed
on
th
e b
asi
s o
f
sto
ck
ma
rke
t p
rice
s
Fa
ir V
alu
e d
ete
min
ed
on
th
e b
asi
s o
f
ob
serv
ab
le d
ata
oth
er
the
n s
tock
ma
rke
t p
rice
s
Fa
ir V
alu
e n
ot
de
tem
ine
d o
n t
he
ba
sis
of
ma
rke
t d
ata
Loans & receivables 19.765.932 21.494.970 21.494.970
Debt securities
Loans and advances 19.765.932 21.494.970 21.494.970
Held-to-maturity investments
Debt securities
Loans and advances
Financial liabilities measured at amortised cost 25.549.158 25.743.637 3.399.040 22.344.597
Deposits 21.082.083 21.082.083 21.082.083
Debt securities issued 3.367.077 3.561.556 3.399.040 162.517
Other financial liabilities 1.099.998 1.099.998 1.099.998
Table.FVAL.8
Loans and receivables (including finance leases) whose fair value was calculated in the same manner as for the covered bond (for which the fair value is based on information obtained by more than 20 market participants or obtained from Bloomberg.
The estimated Fair value of loans and receivables result from a calculation of the discounted amount of the loan cash flows using the 6 months swap curve

VAT BE0404.476.83557 57
6 Critical Accounting Estimates and Judgements
AXA Bank Europe uses estimates and judgements when drawing up its consolidated financial statements on the basis of IFRS. These
estimates and judgements are continuously tested and are based on past experience and other factors, including an acceptable
assessment of future events based on currently known conditions.
Estimates and judgements take place primarily in the following areas:
- estimation of the realisable value for impairments on loans and receivables (see chapter 2.3), available for sale financial
assets (see chapter 20) and property, plant and equipment and intangibles (see chapter 2.12)
- determination of the fair value of non-quoted financial instruments (see chapter 5)
- estimation of impairment for loan losses (see chapter 2.3)
- estimate of deferred tax assets (see chapters 2.11.3 and 16)
- valuation of CVA and DVA (see chapter 5.4)
- estimate of provisions for pension obligations (see chapter 13.2)
- estimate of current obligations resulting from past events when determining the level of provisions (see chapter 0)
- judgement on the classification of financial instruments (see chapters 2.2, 2.3, 2.4 and 2.7) and the mapping to the levels
for determining the fair value (see chapter 5)
- estimation of the useful life for property, plant and equipment and intangible assets (see chapter 2.12).

VAT BE0404.476.83558 58
7 Fee and Commission Income (Expenses)
Fee and commission income and expenses
in '000 EUR2016.12 2015.12
Fee and commission income
Securities 20.057 16.146
Issued 18.169 13.658
Transfer orders 101 96
Other 1.787 2.391
Clearing and settlement
Trust and fiduciary activities 977 1.019
Asset management
Custody 977 1.019
Other fiduciary transactions
Loan commitments
Payment services 7.138 7.009
Structured finance
Servicing fees from securitization activities
Other 24.829 19.714
TOTAL 53.001 43.888
Fee and commission expenses
Commissions to agents (acquisition costs) 32.267 26.805
Clearing, settlement and consignment 898 874
Other 9.276 8.294
TOTAL 42.441 35.973
Table FCIE.1

VAT BE0404.476.83559 59
8 Realised Gains (Losses) on Financial Assets and Liabilities Not Measured at Fair Value through Profit or Loss
Net income from financial instruments not classif ied as fair value
through prof it or loss
2016.12
in '000 EUR
Ne
t
Available-for-sale financial assets 261.089
Loans and receivables (including finance leases) 891
Held-to-maturity investments
Financial liabilities measured at amortised cost
Other
TOTAL 261.980
Table GLNPL.1
Net income from financial instruments not classif ied as fair value
through prof it or loss
2015.12
in '000 EUR
Ne
t
Available-for-sale financial assets 56.383
Loans and receivables (including finance leases) 2.850
Held-to-maturity investments
Financial liabilities measured at amortised cost
Other
TOTAL 59.233
Table GLNPL.2
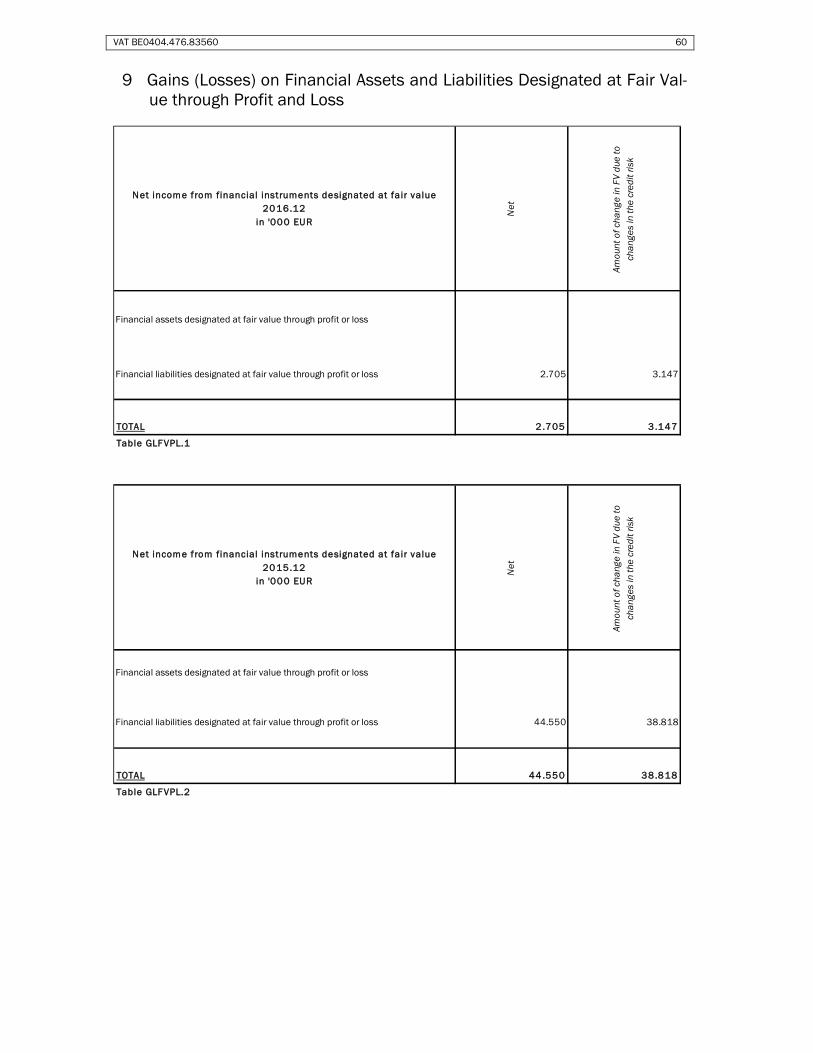
VAT BE0404.476.83560 60
9 Gains (Losses) on Financial Assets and Liabilities Designated at Fair Val-ue through Profit and Loss
Net income from financial instruments designated at fair value
2016.12
in '000 EUR
Ne
t
Am
ou
nt
of
cha
ng
e in
FV
du
e t
o
cha
ng
es
in t
he
cre
dit
ris
k
Financial assets designated at fair value through profit or loss
Financial liabilities designated at fair value through profit or loss 2.705 3.147
TOTAL 2.705 3.147
Table GLFVPL.1
Net income from financial instruments designated at fair value
2015.12
in '000 EUR
Ne
t
Am
ou
nt
of
cha
ng
e in
FV
du
e t
o
cha
ng
es in
th
e c
red
it r
isk
Financial assets designated at fair value through profit or loss
Financial liabilities designated at fair value through profit or loss 44.550 38.818
TOTAL 44.550 38.818
Table GLFVPL.2

VAT BE0404.476.83561 61
10 Gains (Losses) from Hedge Accounting
This includes the amortisation of the fair value change of the hedged position.
Net income from hedging activit ies
2016.12
in '000 EUR
Ne
t
Fair value changes of the hedging instrument [including discontinuation] -102.670
Fair value changes of the hedged item attributable to the hedged risk -102.501
Ineffectiveness in profit or loss from cash flow hedges -479
Ineffectiveness in profit or loss from hedges of net investments in foreign operations
TOTAL -205.650
Table GLHA.1
Net income from hedging activit ies
2015.12
in '000 EUR
Ne
t
Fair value changes of the hedging instrument [including discontinuation] 126.885
Fair value changes of the hedged item attributable to the hedged risk -147.404
Ineffectiveness in profit or loss from cash flow hedges -24.126
Ineffectiveness in profit or loss from hedges of net investments in foreign operations
TOTAL -44 .645
Table GLHA.2

VAT BE0404.476.83562 62
11 Other Operating Net Income
Other operating income and expenses
in '000 EUR2016.12 2015.12
INCOME 33.382 30.904
Tangible assets measured using the revaluation model
Investment property
Rental income from investment property
Cumulative change in fair value recognized in profit or loss on a sale of
investment property from a pool of assets in which the cost model is used
into a pool in which the fair value model is used
Other income related to investment property
Operating leases
Other 33.382 30.904
EXPENSES 1.707 1.243
Tangible assets measured using the revaluation model
Investment property
Direct operating expenses (including repair and maintenance) arising from
investment property that generated rental income during the period
Direct operating expenses (including repair and maintenance) arising from
investment property that did not generated rental income during the period
Cumulative change in fair value recognized in profit or loss on a sale of
investment property from a pool of assets in which the cost model is used
into a pool in which the fair value model is used
Operating leases 1.705 1.243
Other 1
TOTAL 31.675 29.661
Table OONI.1

VAT BE0404.476.83563 63
12 Operational Lease Agreements
Leasing activities do not belong to the set of activities of AXA Bank Europe.
As lessee, AXA Bank Europe only has operational lease contracts.
Regarding operational lease arrangements, the tables below show the lease agreements of both company cars and corporate buildings.
Assets held under an operating lease as a lessee
2016.12
in '000 EUR
Tota
l am
ou
nt
of
futu
re
min
imu
m le
ase
pa
yme
nts
un
de
r n
on
-
can
cella
ble
op
era
tin
g le
ase
s
Tota
l am
ou
nt
of
futu
re
min
imu
m s
ub
lea
se p
aym
en
ts
exp
ect
ed
to
be
re
ceiv
ed
un
de
r n
on
-ca
nce
llab
le
sub
lea
ses
Min
imu
m le
ase
pa
yme
nts
reco
gn
ize
d a
s e
xpe
nse
Co
nti
ng
en
t le
ase
pa
yme
nts
reco
gn
ize
d a
s e
xpe
nse
Su
ble
ase
pa
yme
nts
reco
gn
ize
d a
s e
xpe
nse
For the lessee - residual maturity
< 1 year 1.085 803
> 1 year ≤ 5 year 1.759
> 5 year 54
TOTAAL NOMINAL AMOUNT 2.898 803
Table OLA.1
Assets held under an operating lease as a lessee
2015.2
in '000 EUR
Tota
l am
ou
nt
of
futu
re
min
imu
m le
ase
pa
yme
nts
un
de
r n
on
-
can
cella
ble
op
era
tin
g le
ase
s
Tota
l am
ou
nt
of
futu
re
min
imu
m s
ub
lea
se p
aym
en
ts
exp
ect
ed
to
be
re
ceiv
ed
un
de
r
no
n-c
an
cella
ble
su
ble
ase
s
Min
imu
m le
ase
pa
yme
nts
reco
gn
ize
d a
s e
xpe
nse
Co
nti
ng
en
t le
ase
pa
yme
nts
reco
gn
ize
d a
s e
xpe
nse
Su
ble
ase
pa
yme
nts
re
cog
niz
ed
as
exp
en
se
For the lessee - residual maturity
< 1 year 875 1.091
> 1 year ≤ 5 year 1.485
> 5 year 55
TOTAAL NOMINAL AMOUNT 2.416 1.091
Table OLA.2

VAT BE0404.476.83564 64
13 Personnel Expenses
13.1 Breakdown of Personnel Expenses
13.2 Pension Liabilities and Other Benefits
13.2.1 General Principles
13.2.1.1 Defined Benefit Plans
The measured plans represent the pension plans on the one hand and the medical benefits on the other related to hospitalisation cover
after retirement.
AXA Bank Europe has set up 12 pension plans of which 7 are legally structured as defined contribution type plans.
Pension plans are subject to social and prudential rules applicable in Belgium, in particular the law on supplementary pensions.
Because Belgian legislation is applicable to the second-pillar pension plans (law on supplementary pensions), all Belgian pension plans
of the defined contributions type should be considered under IFRS as defined pension benefit plans. The law on supplementary pen-
sions states that under the defined-contribution-type plans, the employer must ensure a minimum return of 3.75% on personal employ-
ee contributions and 3.25% on employer contributions. Since 2016, this minimum rate of return becomes a variable rate based on
Belgian government bonds OLO but with a minimum fixed income at 1.75% and a fixed maximum income at 3.75%.
Because of this minimum income guarantee in Belgium for defined-contribution-type pension plans, the employer is exposed to a finan-
cial risk (there is a legal obligation to pay further contributions if the underlying assets do not produce sufficient income in accordance
with the legal requirements by paying all the employee benefits relating to the services rendered by the employee during the current and
prior periods). Consequently, these pension plans should be classified and accounted for as defined pension benefit plans under IAS 19
Employee Benefits.
For this pension type, the accounting methods used to measure the assets and liabilities are as follows:
• The defined benefit obligation is determined by projecting the guaranteed minimal reserve on the calculation date against the
minimum guaranteed rate at the targeted pension date, and by discounting this based on the determined discount rate, tak-
ing into account mortality and leave assumptions.
• The fair value of the assets is determined based on the actual build-up of reserves (taking into account the amounts deposit-
ed and the actual returns on the calculation date).
On the other hand, AXA Bank Europe provides ‘hospitalisation’ cover to employees at retirement. The cover offered is similar to that
offered during the period of employment for a large part of the staff. AXA Bank Europe partially funds these employee benefits after
retirement.
The financial assumptions used in the valuation of each plan at 31 December of each year are as follows:
Employee benefits
in '000 EUR2016.12 2015.12
Wages and salaries 60.974 72.579
Social security charges 24.645 25.696
Pension and similar expenses -49 960
Share based payments
Other 6.851 7.954
TOTAL 92.421 107.190
Table PE.1

VAT BE0404.476.83565 65
Health care costs increase at an estimated 2% yearly.
The mortality tables used to calculate these liabilities are the MR/FR mortality tables (1988-1989) with an age adjustment of minus five
years.
The normal retirement age is 65 years in order to comply with expected long-term trends.
The probability of departure before retirement rate is set according to age according to the table below:
All of these assumptions have been set in keeping with the statistical observations on the populations concerned as well as with eco-
nomic expectations.
The discount rate is determined at the closing date from the AA corporate bond market rates in the Eurozone and depending on the
duration and characteristics of the plans. The duration of the liabilities is about 11 years at the end of 2016 compared to about 13
years at the end of 2015.
A decrease of 0.5% in the discount rate would change the total DBO (defined benefit obligation) to +5.7% and service costs during the
period of +5.3%.
An increase of 0.5% discount rate would reduce the total DBO by -5.1% and service costs during the period by -4.8%.
An increase of 0.5% in the inflation rate would change the total DBO by +3.3% and service costs during the period would increase by
+4.5%.
An increase of 0.5% in the inflation rate for medical costs would give rise to an increase in total DBO of +0.4% and service costs during
the period would increase by +0.6%.
An increase of 0.5% in salaries would increase the total DBO by 7.0% while service costs during the period would increase by +8.3%.
13.2.1.2 Variation Annual Pension Liabilities and Other Benefits
The annual change in the defined benefit obligation is calculated based on the following items:
- service costs during the period representing the increase in the actuarial liability for an additional year of seniority;
- interest on the actuarial liability representing the cost of discounting over one year (interest cost);
- employee contributions;
- changes of plans (modification, curtailment, settlement, acquisitions and disposals, etc.);
- actuarial profits and losses due to changes in assumptions and to experience;
- the benefits paid by the employer and by the assets.
13.2.2 Information Presented in the Balance Sheet
Information presented in the balance sheet for pension and other benefits shows the difference between the benefit obligation and the
fair value of plan assets. When this difference is positive, a provision is recognised. When this difference is negative, a prepaid charge is
recorded in the balance sheet.
2016 2015 2014 2013 2012
Discount rate 1,50% 2,30% 1,80% 3,40% 2,20%
Inflation rate 1,60% 1,60% 2,00% 2,00% 2,00%
Percentage of salry increase 2,60% 2,60% 3,00% 3,50% 3,50%
Table PE.2
percentage
0,0%
20 year <= 24 year 8,0%
25 year <= 29 year 8,0%
30 year <= 34 year 7,0%
35 year <= 39 year 5,0%
40 year <= 44 year 3,5%
45 year <= 49 year 2,0%
50 year <= 54 year 1,2%
55 year <= 59 year 0,8%
60 year <= 65 year 0,8%
Table PE.3
< 20 year
Age

VAT BE0404.476.83566 66
In addition, and in accordance with IAS 19 Employee Benefits, an asset class, called ‘separate assets’ is presented in the balance
sheet. IFRS has created the concept of ‘separate assets’ which are assets that cannot be deducted from the actuarial debt. At AXA Bank
Europe, separate assets are insurance contracts issued by certain subsidiaries to cover their defined benefit plans. In accounting terms,
the result of separate assets is an increase in the provision recorded or a decrease in the prepaid charge. These assets are presented in
a separate section of the following table. These assets are available to potential creditors only in case of bankruptcy. Their economic
nature is thus similar to that of Plan Assets on a going-concern basis. However, this is because these assets are made available through
an insurance policy that IFRS requires to recognise them in the category ‘separate assets’, despite their economic nature.
Following IAS 19, AXA Bank Europe recognises all actuarial gains and losses in a special line in other comprehensive income (OCI).
Actuarial gains and losses are defined as adjustments due to changes in actuarial assumptions and experience effects (changes in
population characteristics between two assessments). Actuarial losses and gains also include differences between the expected income
(that corresponds to the discount rate in accordance with IAS 19) and the actual income from financial investments.
In addition to changes between the expected return from assets as mentioned above, IAS 19 requires the management of tax and
social contributions applicable to pensions and healthcare in Belgium.
The table below shows the changes in the benefit obligation and changes in plan assets for pension plans and other benefits under the
categories ‘plan assets’ and ‘separate assets’ at 31 December 2016.
This variation is mainly explained by changes in financial assumptions, the discount rate changed from 2.30% at the end of 2015 to
1.50% at end of 2016.
12.2016 1 2.20 15
Changes in the commitment
Actuarial liability at the start of the period 145.792 161.060
Service cost 5.133 4.043
Interest on the actuarial liability 2.699 2.911
Employee contributions. 447 416
Modification, curtailment, (incl. acquisitions and disposals, etc.)
Actuarial profits and losses due to changes to experience. 599 -2.899
Actuarial differences resulting from change in the hyp for Demographics
Actuarial differences resulting from change in the hyp for Financials 17.511 -20.713
Benefits paid -10.888 -9.284
Benefits paid directly by the employer. -100 -94
Amendment to IAS 19 (cf. Note 1.General principles) 11.239
Effect of exchange rate changes -887
Actuarial l iabil ity at the end of period (A) 161.193 145.792
Evolution of Plan Assets hedging
Fair value of assets at beginning of period 10.106 11.070
Implicit return on assets 187 188
Actual return on plan hedging assets, excluding the implicit return on assets 576 136
Employer contributions. 639 5
Employee contributions. 5
Incoming (outgoing) transfers (incl. acquisitions and disposals)
Benefits paid -653 -1.292
Effect of exchange rate changes
Fair value of assets at end of period (B) 10.860 10.106
Changes in Separate Assets
Fair value of assets at beginning of period 91.908 82.649
Implicit return on assets 1.666 1.442
Actual return on plan hedging assets, excluding the implicit return on assets 1.548 1.838
Employer contributions. 6.183 2.583
Employee contributions. 442 411
Incoming (outgoing) transfers (incl. acquisitions and disposals)
Benefits paid -10.335 -8.086
Effect of exchange rate changes
Recording off DC plans 11.069
Fair value of assets at end of period 91.412 91.908
Funding of l iabil ities
Underfunded plans (plan by plan) -150.333 -135.686
Overfunded plans (plan by plan)
Unfunded commitments (B) - (A) -150.333 -135.686
Unrecognised past service cost
Cumulative impact of asset ceiling
Liabil it ies recorded in the statement of f inancial position (excluding Separate Assets)
Recognised assets
Provisions recorded -150.333 -135.686
Net position (excluding Separate Assets) -150.333 -135.686
Net economic funding
(including: Separate Assets)
Net position (excluding Separate Assets) -150.333 -135.686
Fair value of Separate Assets at end of period 91.412 91.908
Net economic funding ( including: Separate Assets) -58.921 -43.778
Table PE.4
(In '000 EUR)

VAT BE0404.476.83567 67
13.2.3 Annual Pension and Other Benefits Expense
Annual pension and other benefits expense recorded in the income statement (included in ‘cost of pension obligations and other bene-
fits’) is presented below at 31 December 2016 and 31 December 2015:
13.2.4 Evolution of the Provision on the Balance Sheet (Excluding Separate Assets)
Change in the provision recorded on the balance sheet between 1 January 2016 and 31 December 2016 only presents the change of
the provision recognised in the accounts of AXA Bank Europe. This reconciliation does not include ‘separate assets’. It thus does not
fully represent the economic reality. The table below shows the detailed changes in the liabilities recorded on the balance sheet with
separate assets added at the end of each financial year.
The separate assets represent the fair value of assets backing the obligations under defined benefit plans covered by both insurance
policies at AXA Bank Europe that give direct rights to employees and by insurance policies with related parties which are outside the
consolidation scope. In such circumstances, these assets cannot qualify as plan assets deducted from the commitments but represent
reimbursement rights recognised as separate assets in accordance with the recommendations of IAS 19. Assets and insurance tech-
nical reserves (in the case of entities in the consolidation scope) also remain in the consolidated balance sheet.
The change in net economic funding commitments between 1 January 2016 and 31 December 2016 reflects the changes in the provi-
sion recognised in the accounts of AXA Bank Europe and the changes in separate assets.
13.2.5 Upcoming Outflows (Benefits Paid and Employer Contributions)
Estimated future benefit payments
Expected future benefits amounted to 1.5 million EUR for 2017 and 2 million EUR for 2018. These amounts may vary depending on
differences between assumptions and reality in future years.
Expected employer contributions to plan assets and separate assets
Entities must annually pay the cost to benefits for which the contributions are determined as a percentage of pensionable salary de-
pending on the age or the seniority of the beneficiaries. The estimated amount of employer contributions payable in 2017 for pension
commitments is 6.2 million EUR. This amount may vary depending on differences between assumptions and reality in future years and
represents contributions not directly related to the IFRS annual pension expense and other benefits.
13.2.6 Pension Assets
(In '000 EUR) 12.2016 12.2015
5.580 4.459
-447 -416
2.699 2.911
-1.853 -1.630
Restrictions/settlement -887
5.979 4.437
Table PE.5
Implicit return on Plan assets/separate assets
Total
Annual pension expense and other benefits
Service cost
Curtailments and settlements
Employee contributions
Interest on the actuarial liability
12.2016 12.2015
Progression in the provision recorded in the statement of financia l position at the start of the period -135.686 -149.990
Annual pension expense and other benefits -8.087 -6.295
Employer contributions. 639 5
Employer benefits 100 94
Benefits paid by Seperate Assets 10.235 7.992
Actuarial gain/losses recognised in Soci component -17.534 23.748
DC plans -11.239
Provisions presented in the statement of financial position at the end of the period -150.333 -135.686
Fair value of separate assets at end of the period 91.412 91.908
-58.921 -43.778
Table PE.6
(in '000 EUR)
Net economic funding for commitments at the end o f the period

VAT BE0404.476.83568 68
Due to the longevity of pension liabilities, plan assets generally include stocks, bonds and real estate.
The plan assets of AXA Bank Europe are mainly insurance contracts with a guaranteed rate of return. These contracts are underwritten
by AXA Belgium.
Regarding the existing Anhyp former regime, as of 1 July 1983, the funding vehicle is a pension fund. The financial assets contribution
to the pension fund at 31 December.2016 is 18% shares, 82% bonds.
13.3 Share-based Payments
13.3.1 General Principles
The instruments specified below for share paymenst are mainly instruments settled in shares, but also include instruments with cash
settlement. The unit costs of the share based payments with settlement in shares do not vary for a given plan while the costs of the
instruments settled in cash are updated at every closure.
The total burden for AXA Bank Europe is not significant.
13.3.2 Stock Options AXA SA
The group of Senior Executives can receive shares from AXA within the framework of the share option schemes of the company. These
options can be subscription options that imply the issue of new AXA shares or purchase options that imply the transfer of personal
shares. The conditions for each option grant can vary. Currently, the options (i) are allocated for a price not lower than the average of
the closing prices of AXA shares on the Paris stock exchange for the twenty days preceding the allocation; (ii) are valid for at least 10
years, and (iii) they can generally be exercised in tranches of 33.33% per year from the third up to the fifth anniversary of the option
allocation date.
For beneficiaries, the stock options granted have been unconditionally acquired for the first two tranches while the third tranche can be
exercised if a performance condition for AXA shares is met when compared to the ‘DowJones Europe Stoxx Insurance’ benchmark index.
The following table provides an overview of current options.
The number of options in circulation and the number of options that can be exercised at 31 December 2016 are shown thereafter in
accordance with the expiry date:
2016.12
Options
( in '000 EUR)
Average Price
EUR
Outstanding at 1/1 405,0
Allocations 0,0
Capital increases 0,0
Excercised -4,5 13,99
Options expired and cancelled -1,0 14,89
Movements within the Group 2,9
Outstanding at 31.12 402,4 18,92
Table PE.7
2015.12
Options
(in '000 EUR)
Average Price
EUR
Outstanding at 1/1 559,7
Allocations 31,2 22,90
Capital increases 0,0
Exercised -174,4 16,60
Options expired and cancelled -6,0 19,70
Movements within the Group -5,5
Outstanding at 31.12 405,0 19,06
Table PE.8

VAT BE0404.476.83569 69
The Black and Scholes model for valuing options has been used to establish the fair value of the AXA share options. The consequence
of exercising options before their expiry date is taken into consideration based on a hypothesis for the expected lifecycle that arises
from the observation of historical data. The volatility of the AXA share is estimated using the implicit volatility method validated through
the analysis of historical volatility to ascertain the hypothesis’ coherence.
The hypothesis for the expected dividend of the AXA share is based on market consensus. The risk-free return arises from the interest
curve of the Euro Swap for the corresponding maturity.
13.3.3 Shareplan AXA SA
AXA gives its employees the option of becoming shareholders thanks to a special issue that is reserved for them. In the countries that
meet legal and tax requirements, two investment options are proposed: the traditional shareholder plan and the plan with leverage.
The traditional plan gives employees the option to subscribe to AXA shares based on the initial contribution (through the mutual
investment fund of the company or through shares held directly) with a maximum discount of 20%. These shares are unavailable for 5
years (unless there is an accelerated release as provided by the applicable regulations). Employees carry the risk of all share evolutions
when compared to the subscription price.
The leverage plan gives employees the option to subscribe to AXA shares based on 10 times their initial contribution (through the
mutual investment fund of the company or through shares held directly) with a discount. The leverage on the personal contribution of
employees takes place in the form of a loan (without recovery on the employee above the value of the shares) that is granted by a third
party bank. These shares are unavailable for 5 years (unless there is an accelerated release as provided by the applicable regulations).
Employees who participate in the leverage scheme are given the guarantee of their initial personal contribution and also a certain
percentage of the value increase of the share (when compared to the unreduced reference price) for the total invested amount.
At the end of the unavailability period of 5 years, employees can choose from the following: to buy out their saving credit (exit with cash
settlement) or transfer their credit invested in the leverage formula to the traditional fund.
The costs of the shareholder plan are valued by taking into account the 5-year restriction for the employee. The approach adopted
prices the share based on a replication strategy by which the participant would sell the share on the stock exchange after the 5 year
restrictive period and would borrow the amount that is required to immediately purchase an unencumbered share with loan funding by
future selling and the dividends paid out during the restrictive period. The opportunity profit must be added to the cost of the plan for
the leverage plan that is implicitly offered by AXA since it allows its employees to enjoy the institutional price (and not the stock
exchange retail price) for the derivatives.
The AXA Group has proposed to its employees within the framework of the Group employees shareholding policy that they subscribe to a
reserved capital increase for a price of 15,53 EUR for the traditional plan (20% discount when compared to the reference price of 19,40
EUR calculated based on the average of the 20 closing prices on the stock exchange before the date of the announcement) and 17,73
EUR for the leverage plan (8,63% discount when compared to the reference price) during the past financial year. The AXA Bank Europe
employees subscribed for an amount of 0.5 million EUR.
Date of Grant Excercise
Price
Outstanding Exercisable
2006-03-31 27,75 € 86.097,00 86.097,00
2007-05-10 32,95 € 75.775,00 75.775,00
2008-04-01 21,00 € 37.947,00 37.947,00
2009-03-20 9,76 € 14.567,00 14.567,00
2010-03-19 15,43 € 16.968,00 16.968,00
2011-03-18 14,73 € 40.571,00 40.571,00
2012-03-16 12,22 € 25.500,00 25.500,00
2013-03-22 13,81 € 36.800,00 24.533,33
2014-03-24 18,68 € 36.960,00 12.320,00
2015-06-19 22,90 € 31.249,00 0,00
Table PE.9

VAT BE0404.476.83570 70
13.3.4 AXA Miles
AXA (the controlling parent company of AXA Bank Europe) allocated 50 free shares to each employee of the Group on 16 March 2012.
This allocation and its 4+0 scheme also benefited AXA Bank Europe employees (therefore, a period of 4 years for acquiring the rights
without a non-transferability period).
The free shares are valued based on the approximation that was selected for the Share Plan described in this section with assumptions
adjusted to the structure of the plan based on the price of 13.18 EUR per share on 16 March 2012 and an expected waiving of the
rights of 5% is applied prior to their acquisition.
In march 2016 the AXA miles have been converted into AXA shares.
13.3.5 Performance Shares
In 2013, AXA established common procedures for awarding ‘Performance Shares’ to employees eligible for this. Under the terms of the
plan, the beneficiaries of ‘Performance Shares’ are entitled to receive a specific number of shares from AXA, based on performance
criteria defined by AXA. The period for measuring that performance is 2 years. The period for acquisition of the rights is 3 years. Payment
of the performance shares awarded (2013 plan) is made in shares.
Since 2014 the performance period is 2 years for the first tranche and 3 years for the second, followed by a deferred acquisition period
of 1 year.
For performance shares granted from 2015, the performance period is 3 years followed by a deferred acquisition period of 1 year.
Traditional Leveraged Traditional Leveraged
Plan maturity (in years) 5 5 5 5
[A] Discount to face value 20.00% 8.63% 20.00% 8,57%
Reference price (in 'OOO' EUR) 19,4 19,4 22,17 22,17
Subscription price (in '000' EUR) 15,53 17,73 17,74 20,27
Interest rate on employee loan 6,85% 7,26% 7,24% 7,60%
5-year risk-free rate (euro zone) -0,07% -0,07% 0,36% 0,36%
Dividend yield 7,18% 7,18% 6,59% 6,59
Early exit rate 2,63% 2,63% 1,20% 1,20%
Debit interest rate -0,39% -0,39% -0,09% -0,09%
Retail/institutional volatility spread N/A 2,77% N/A 2,39%
[B] Cost of the lock-up for the employee 18,72% 8,57% 19,68% 8,54%
[C] Opportunity gain 0,00% 1,91% N/A 1,99%
Tableau PE.10
2016 2015

VAT BE0404.476.83571 71
14 General and Administrative Expenses
Banking taxes
On 11 August 2016, the law of 3 August 2016 enacting the new regime for banking taxes was published in the Belgian Official Journal.
The new regime simplifies the landscape by replacing the following 4 taxes and contributions by a single banking tax:
- subscription tax (annual tax on collective investment institutions, credit institutions and insurance institutions);
- subscription tax ‘bis’ (annual tax on credit institutions);
- contribution for the financial stability by Belgian banks to the Belgian resolution fund;
- deduction limitations in corporate tax (in relation to tax losses carried forward, dividends received and notional interest de-
duction).
The taxable basis for the banking tax is the arithmetic mean of the monthly amount of ‘debt towards clients’ in the Schema A reporting
of the year preceding the tax year. For 2016 however it has been based on the amount of ‘debt towards clients’ as of 31 December
2015 (i.e. not on an arithmetic mean of the monthly amount) The tax rate at this moment is 0.13231% (the tax rate shall be adapted on
a yearly base, based on new data concerning the taxable base and the target budgetary purposes). As such, the 2016 banking tax
amounts to 54.8 million EUR for AXA Bank Europe.
Contribution to the Single Resolution Mechanism
The Single Resolution Mechanism (SRM) is one of the pillars of the European Union’s banking union. The SRM came into force on 19
August 2014 and is directly responsible for the resolution of the entities and groups directly supervised by the European Central Bank
(ECB). The centralised decision making is built around the Single Resolution Board (SRB).
In 2016, the contributions are based on a combination of 2 guidelines:
- 60% in accordance with a target determined at national level (Belgian deposit guarantee system)
- 40% in accordance with a target determined at the Banking Union level
These percentages will gradually evolve during the next years to become 100% based on the Banking Union target by 2023.
The contributions to be paid by each institution are determined in proportion to its relative risk profile, based on a detailed calculation
methodology. Of these contributions 1/8 of the 2015 payment to the national authority is deducted. As such, the 2016 contribution for
AXA Bank Europe amounts to 13 million EUR.
Furthermore, in application of the EU regulations, the SRB has decided to accept that 15% of the 2016 payment obligation of institu-
tions may take the form of irrevocable payment commitments (IPC’s).
IPC’s can be defined as an obligation on the part of credit institutions to pay their contributions in the future. The IPC’s are mandatorily
backed by a cash collateral for the same amount as the IPC’s. The SRB is entitled to call for payment of the IPC by sending a notice to
the credit institution.
Contrary to cash contributions, which are reflected in the profit and loss statement (P&L) upon their payment, the IPC’s and the cash
collateral are considered as contingent liabilities under IFRS. Contingent liabilities are not recognised on the balance sheet nor in the
income statement, but – if the possibility of any outflow in settlement is not remote – they are disclosed.
As from the moment of providing the cash collateral to the SRB, the cash is transferred on the balance sheet from ‘Cash and balances
with central banks’ to ‘Other assets’.
As there are currently no indications that the SRB would call for cash payment (and so no present obligation), no provision has been set
up.
AXA Bank Europe has used IPC’s as payment of its 2016 contributions for an amount of 2 million EUR
Other operating expenses
in '000 EUR2016.12 2015.12
Marketing expenses 8.794 9.048
Professional fees 44.228 44.569
IT expenses 5.076 4.911
Rents to pay or to receive -1.656 -930
Other 106.990 82.033
TOTAL 163.432 139.631
Table GAE.1

VAT BE0404.476.83572 72
15 Impairment
2016.12
in '000 EUR
Ove
rdu
e
≤ 9
0 d
ays
Ove
rdu
e
> 9
0 d
ays
& ≤
18
0 d
ays
Ove
rdu
e
> 1
80
da
ys
& ≤
1 y
ea
r
Ove
rdu
e
> 1
ye
ar
Ne
t ca
rryi
ng
am
ou
nt
of
the
imp
air
ed
ass
ets
Sp
eci
fic a
llow
an
ce
s fo
r in
div
idu
ally
ass
ess
ed
fin
an
cia
l ass
ets
Sp
eci
fic
allo
wa
nce
s f
or
colle
ctiv
ely
ass
ess
ed
fin
an
cia
l ass
ets
of
wh
ich
fo
rbe
ara
nce
Co
llate
ral a
nd
oth
er
cre
dit
en
ha
nce
me
nts
rece
ive
d a
s se
curi
ty f
or
the
re
late
d im
pa
ire
d a
nd
pa
st
du
e a
sse
ts
Equity instruments 23
Quoted
Unquoted but FV determinable 23
Equity instruments at cost
Debt instruments
Central governments
Credit institutions
Non credit institutions
Corporate
Loans & advances 1.096.040 39 46 37 255.707 70.973 19.327 3.026
Central governments 236
Credit institutions
Non credit institutions 26.239 0 1 5.214 1.670 70 40
Corporate 50.612 0 4 11 17.318 12.865 420 607
Retail 1.018.953 38 42 26 233.174 56.439 18.836 2.379
Bills & own acceptances
Finance leases
Securitized loans
Consumer Credit 111.936 11.431 7.728
Mortgage loans 882.106 5 215.107 39.856 9.480 2.179
Term loans 14.797 2.726 7.382 1.415
Current accounts 10.115 33 42 26 3.801 7.208 213
Other 107 1.992
Other financial assets
TOTAL 1.096.040 39 46 37 255.707 70.973 19.327 8.231
Allowances for incurred but not reported losses on financial assets 7.286
Non specifically attributable collaterals
Table IM P.1

VAT BE0404.476.83573 73
2015.12
in '000 EUR
Ove
rdu
e
≤ 9
0 d
ays
Ove
rdu
e
> 9
0 d
ays
& ≤
18
0 d
ays
Ove
rdu
e
> 1
80
da
ys &
≤ 1
ye
ar
Ove
rdu
e
> 1
ye
ar
Ne
t ca
rryi
ng
am
ou
nt
of
the
imp
air
ed
ass
ets
Sp
ecif
ic a
llow
an
ces f
or
ind
ivid
ua
lly a
sse
sse
d
fin
an
cia
l ass
ets
Sp
eci
fic
allo
wa
nce
s fo
r co
llect
ive
ly a
sse
sse
d
fin
an
cia
l a
sse
ts
of
wh
ich
fo
rbe
ara
nce
Co
llate
ral a
nd
oth
er
cre
dit
en
ha
nce
me
nts
rece
ive
d a
s se
cu
rity
fo
r th
e r
ela
ted
imp
air
ed
an
d
pa
st d
ue
ass
ets
Equity instruments 23
Quoted
Unquoted but FV determinable 23
Equity instruments at cost
Debt instruments 23
Central governments
Credit institutions
Non credit institutions
Corporate
Loans & advances 1.114.486 637 111 41 276.165 75.760 22.479 2.717
Central governments 36
Credit institutions
Non credit institutions 25.760 5 8 1 3.257 1.812 51 24
Corporate 48.132 60 64 13 24.868 14.245 582 757
Retail 1.040.557 572 39 27 248.040 59.703 21.846 1.936
Bills & own acceptances
Finance leases
Securitized loans
Consumer Credit 115.758 15.982 10.217 211
Mortgage loans 903.280 447 223.828 41.164 10.496 1.725
Term loans 14.449 4.635 9.011 915
Current accounts 7.069 125 39 27 3.267 7.129 218
Other 329 2.399
Other financial assets
TOTAL 1.114.486 637 111 41 276.165 75.760 22.479 2.717
Allowances for incurred but not reported losses on financial assets 11.962
Non specifically attributable collaterals
Table IM P.2

VAT BE0404.476.8357474
Overview of impairment
2016.12
in '000 EUR Ad
dit
ion
s
Re
vers
als
Tota
l
Impairment losses on financial assets not measured at fair value through profit or loss
47.184 34.338 12.846
Financial assets measured at cost (unquoted equity and related derivatives)
Available for sale financial assets measured at fair value through equity
Loans and receivables measured at amortized cost (including finance leases)
47.184 34.338 12.846
Held to maturity investments measured at amortized cost
Impairment on
Property, plant and equipment
Investment properties
Intangible fixed assets
Goodwill
Other
Investments in associates and joint ventures accounted for using the equity method
Other
TOTAL 47.184 34.338 12.846
Interest income on impaired financial assets accrued in accordance with IAS 39
Table IMP.3
Overview of impairment
2015.12
in '000 EUR Ad
dit
ion
s
Re
vers
als
Tota
l
Impairment losses on financial assets not measured at fair value through profit or loss
57.682 29.761 27.920
Financial assets measured at cost (unquoted equity and related derivatives)
Available for sale financial assets measured at fair value through equity
Loans and receivables measured at amortized cost (including finance leases)
57.682 29.761 27.920
Held to maturity investments measured at amortized cost
Impairment on
Property, plant and equipment
Investment properties
Intangible assets
Goodwill
Other
Investments in associates and joint ventures accounted for using the equity method
Other
TOTAL 57.682 29.761 27.920
Interest income on impaired financial assets accrued in accordance with IAS 39
Table IMP.4

VAT BE0404.476.8357575
Allowances movements for credit losses
2016.12
in '000 EUR
Op
en
ing
ba
lan
ce
Incre
ase
s d
ue
to
am
ou
nts
se
t a
sid
e f
or
est
ima
ted
lo
an
loss
es
De
cre
ase
s d
ue
to
am
ou
nts
re
vers
ed
fo
r
esti
ma
ted
loa
n lo
sse
s d
uri
ng
th
e p
eri
od
De
cre
ase
s d
ue
to
am
ou
nts
ta
ken
ag
ain
st
allo
wa
nce
s
Tra
nsfe
rs b
etw
ee
n a
llo
wa
nce
s
Oth
er
ad
just
me
nts
Clo
sin
g b
ala
nc
e
Specif ic allowances for indiv idually assessed financial assets -75.760 -20.424 3.826 20.671 714 -70.973
Central banks
Central governments
Credit institutions
Non credit institutions -1.812 -480 90 486 46 -1.670
Corporate -14.245 -3.702 693 3.747 643 -12.865
Retail -59.703 -16.242 3.042 16.438 25 -56.439
Specif ic allowances for co llectively assessed financial assets -22.479 -2.245 5.398 -19.327
Central banks
Central governments
Credit institutions
Non credit institutions -51 -19 -70
Corporate -582 -49 211 -420
Retail -21.846 -2.178 5.187 -18.836
Allowances for incurred but not reported losses on financial assets -11.962 0 4.676 -7.286
TOTAL -110.201 -22.670 13.899 20.671 714 -97.586
Tabel IM P.5
Allowances movements for credit losses
2015.12
in '000 EUR
Op
en
ing
ba
lan
ce
Incr
ea
ses
du
e t
o a
mo
un
ts s
et
asid
e f
or
est
ima
ted
loa
n lo
sse
s
De
cre
ase
s d
ue
to
am
ou
nts
re
vers
ed
fo
r
est
ima
ted
loa
n lo
sse
s d
uri
ng
th
e p
eri
od
De
cre
ase
s d
ue
to
am
ou
nts
ta
ken
ag
ain
st
allo
wa
nce
s
Tra
nsf
ers
be
twe
en
allo
wa
nce
s
Oth
er
ad
justm
en
ts
Clo
sin
g b
ala
nc
e
Specif ic allowances for indiv idually assessed financial assets -198.787 -26.849 6.456 21.848 121.571 -75.761
Central banks
Central governments
Credit institutions
Non credit institutions -1.623 -643 154 523 -224 -1.813
Corporate -14.965 -5.048 1.214 4.108 445 -14.246
Retail -182.199 -21.158 5.088 17.217 121.350 -59.702
Specif ic allowances for co llectively assessed financial assets -63.401 -4.811 897 44.835 -22.480
Central banks
Central governments
Credit institutions
Non credit institutions -106 -11 2,00 64 -51
Corporate -558 -125 23,00 77 -583
Retail -62.737 -4.675 872,00 44.694 -21.846
Allowances for incurred but not reported losses on financial assets -28.133 -1.191 561 16.802 -11.961
TOTAL -290.321 -32.851 7.914 21.848 183.208 -110.202
Table IM P.6

VAT BE0404.476.8357676
The amount recorded as ‘maximum credit exposure’ refers to the recorded book value except for loans and advances where the unused
granted credit line margin has also been added.
For the rules applied regarding the accounting of impairments we refer to section 2.2 and 2.3 above.
More details on collateral and guarantees received can be found in chapter 34.
Credit exposure
2016.12
in '000 EUR
Ma
xim
um
cre
dit
exp
osu
re
Equity 7.804
Debt instruments 4.298.683
Loans & advances (balance) 20.650.591
Loans & advances (credit margin on credit lines) 1.065.007
Derivatives 1.739.763
Other 98.168
TOTAAL 27.860.016
Carrying amount of financial assets pledged as collateral for 4.474.130
Liabilities 2.966.594
Contingent liabilities 1.507.536
Table IMP.7
Credit exposure
2015.12
in '000 EUR
Ma
xim
um
cre
dit
exp
osu
re
Equity 6.857
Debt instruments 7.831.770
Loans & advances (balance) 19.765.932
Loans & advances (credit margin on credit lines) 1.051.391
Derivatives 1.554.504
Other 101.635
TOTAAL 30.312.089
Carrying amount of financial assets pledged as collateral for 7.624.691
Liabilities 5.986.939
Contingent liabilities 1.637.752
Table IMP.8

VAT BE0404.476.8357777
16 Income Taxes
In the 2015 financial year, the taxable base did not result in any corporation tax owed. The total notional interest deduction (deduction
for risk capital) of the current financial year, amounting to 8.7 million EUR, was used. It was nevertheless not possible to use (a part of)
the stock accrued from previous financial years up to and including 2011. The limitation of transferability means the stock of transfera-
ble notional interest deduction is further reduced to 58.6 EUR: of which a maximum of 26.4 million EUR is still usable in 2018 (2019 tax
year).
In contrast, the stock of transferred DBI reduction from the previous years (7.1 million EUR), as well as the DBI deduction of the current
year (2.9 million EUR) could indeed be employed. No DBI deduction is transferred to next year.
Significant elements of the tax estimate:
- Accounting result based on Belgian accounting rules (‘Belgian GAAP’): 69.4 million EUR (including result of the AXA Bank
Hungary branch office)
- Rejected expenses: 2.2 million EUR
- Taxed reserves movements: 8.9 million EUR
- Taxed depreciations: -0.1 million EUR
- DBI deduction: 10.0 million EUR
- Deduction for risk capital: 8.7 million EUR
- Imputation of transferable fiscal losses: 37.5 million EUR
The positive accounting result of the AXA Bank Hungary branch did not give rise to a tax charge in Hungary at the end of 2016.
In its equity, AXA Bank Europe has tax-free reserves amounting to 213.1 million EUR (unchanged compared with 2015), on which no
deferred tax amounting to 72.4 million EUR (unchanged compared with previous financial year) was calculated. If these reserves were
paid out, these would be taxed. Provided the bank is a ‘going concern’, these reserves are required as part of the equity for the bank’s
business operations, and there is no intention to pay these out.
Based on the budget exercise over a five-year time horizon of AXA Bank Europe, with a margin concerning uncertainties in the assump-
tions used being taken into account, a deferred tax on the assets was included for a section of non-employed fiscal transferable losses
(106.2 million EUR). AXA Bank Europe did not enter any deferred tax on the assets for the remaining section of the non-employed fiscal
transferable losses (52.3 million EUR).
The limitation of the fiscal deduction for credit institutions in corporation tax (so-called Michel I tax – see chapter 14 – General and
administrative expenses – ‘Banking taxes’), as this entered into force during the course of 2015 and which could amount to a maximum
of 11.9 million EUR for AXA Bank Europe in 2016, was ceased over the course of 2016 (within the scope of introducing a new annual
tax on credit institutions to replace the existing annual taxes, the deduction-limiting measures in corporation tax and the special
amounts for financial stability).

VAT BE0404.476.8357878
Reconciliation of statutory tax to effective tax
2016.12
in '000 EUR
Ne
t a
mo
un
t
%
1. Tax expense using statutory rate 37.298
1.1. Net profit before taxes 109.732
1.2. Statutory tax rate 33,99%
2. Tax impact of rates in other jurisdictions -4.034
3. Tax impact of non taxable revenues -8.586
4. Tax impact of non tax deductible expenses 479
5. Tax impact of utilisation of previously unrecognised tax losses
6. Tax impact on tax benefit not previously recognised in profit or loss
7. Tax impact from reassessment of unrecognised deferred tax assets
8. Tax impact of change in tax rates
9. Tax impact from under or over provisions in prior periods -5.314
10. Other increase (decrease) in statutory tax charge -15.802
11. Tax expense using effective rate 14.398
11.1. Net profit before taxes 109.732
11.2. Effective tax rate 13,12%
Table IT.1
Reconciliation of statutory tax to effective tax
2015.12
in '000 EUR
Ne
tto
be
dra
g
%
1. Tax expense using statutory rate 15.103
1.1. Net profit before taxes 44.433
1.2. Statutory tax rate 33,99%
2. Tax impact of rates in other jurisdictions 37.524
3. Tax impact of non taxable revenues -9.694
4. Tax impact of non tax deductible expenses -598
5. Tax impact of utilisation of previously unrecognised tax losses
6. Tax impact on tax benefit not previously recognised in profit or loss
7. Tax impact from reassessment of unrecognised deferred tax assets
8. Tax impact of change in tax rates
9. Tax impact from under or over provisions in prior periods 990
10. Other increase (decrease) in statutory tax charge -45.509
11. Tax expense using effective rate 17.203
11.1. Net profit before taxes 44.433
11.2. Effective tax rate 38,72%
Table IT.2

VAT BE0404.476.8357979
The tax claim recognised by AXA Bank Europe includes taxable reserves and provisions as well as tax claims on temporary differences
due to IFRS restatements and fiscally transferred losses. Regarding these temporary differences, the major part relates to fair value
changes in the investment portfolio. It can be momentarily assumed that most of these securities will be held until maturity. Based on
the budget analyses carried out by management, AXA Bank Europe does not expect any issues regarding the recoverability of these
claims.
In the following analysis of assets and deferred tax liabilities, no legal entity is distinguished.
A break-down of the recoverability of the deferred tax assets appears below:
31/12/2016 31/12/2016 31/12/2016
Analysis of deferred tax assets and l iabil it ies Net deferred tax assets N et deferred tax l iabil it ies Net deferred taxes
Deferred taxes through result 112.247 84.882 27.365
Deferred taxes through revaluation reserve for financial assets available for sale 5.185 52.992 -47.807
Deferred taxes through cash flow hedge revaluation reserve 11.255 0 11.255
Deferred taxes through profit and losss on defined benefit plans 12.463 0 12.463
Deferred taxes on reserves for income through Stock Option Plan 0 579 -579
Total deferred taxes 141.150 138.453 2.697
Table IT.3
31/12/2015 31/12/2015 31/12/2015
Analysis of deferred tax assets and l iabil it ies Net deferred tax assets N et deferred tax l iabil it ies Net deferred taxes
Deferred taxes through result 128.478 93.036 35.442
Deferred taxes through revaluation reserve for financial assets available for sale 3.377 83.348 -79.971
Deferred taxes through cash flow hedge revaluation reserve 5.462 20 5.442
Deferred taxes through profit and losss on defined benefit plans 7.028 0 7.028
Deferred taxes on reserves for income through Stock Option Plan 0 577 -577
Total deferred taxes 144.345 176.981 -32.636
Table IT.4
Income tax ex pense current and deffered
in '000 ' EUR
2016.12 2015.12
Current income tax expense, net 7.743 2.405
Deferred tax expense, net 8.078 14.187
Total 15.821 16.592
Table IT.5

VAT BE0404.476.8358080
Deferred tax assets per expected date of utilizat ion
31/12/2016
Deferred tax asset-
expected date of
utilization
Deferred tax asset-
expected date of
utilization
Deferred tax asset-
expected date of
utilization
Deferred tax asset-
expected date of
utilization
Deferred tax asset-
expected date of
utilization
Deferred tax asset-
expected date of
utilization
Deferred tax asset-
expected date of
utilization
Deferred tax asset-
expected date of
utilization
Deferred tax asset-
expected date of
utilization
TOTAL
1 year 2 year 3 year 4 year 5 year 6 year Between 7 and 11 years > 11 years No date determined
Deferred tax asset on taxable transferred losses 3.943 3.721 5.078 10.984 12.384 36.110
Other deferred tax assets 15.048 715 704 614 31.318 8 189 56.444 105.040
TOTAL DTA 18.991 4.436 5.782 11.598 43.702 8 189 56.444 0 141.150
Table IT.6
Deferred tax assets per expected date of utilizat ion
31/12/2015
Deferred tax asset-
expected date of
utilization
Deferred tax asset-
expected date of
utilization
Deferred tax asset-
expected date of
utilization
Deferred tax asset-
expected date of
utilization
Deferred tax asset-
expected date of
utilization
Deferred tax asset-
expected date of
utilization
Deferred tax asset-
expected date of
utilization
Deferred tax asset-
expected date of
utilization
Deferred tax asset-
expected date of
utilization
TOTAL
1 year 2 year 3 year 4 year 5 year 6 year Between 7 and 11 years > 11 years No date determined
Deferred tax asset on taxable transferred losses 6.025 4.839 20.707 2.388 33.959
Other deferred tax assets 5.959 3.469 21 11 38.610 8 18 62.290 110.386
TOTAL DTA 5.959 3.469 6.046 4.850 59.317 2.396 18 62.290 0 144.345
Table IT.7
Deferred tax assets as on the last use date
31/12/2016 DTA last use date DTA last use date DTA last use date DTA last use date DTA last use date DTA last use date DTA last use date DTA last use date DTA last use date TOTAL
1 year 2 year 3 year 4 year 5 year 6 year Between 7 and 11 years > 11 years No due date
DTA on taxable transferred losses 36.110 36.110
Other deferred tax assets 11.268 13 2 181 5.004 88.572 105.040
TOTAL DTA 11.268 13 2 0 0 0 181 5.004 124.682 141.150
Table IT.8
Deferred tax assets as on the last use date
31/12/2015 DTA last use date DTA last use date DTA last use date DTA last use date DTA last use date DTA last use date DTA last use date DTA last use date DTA last use date TOTAL
1 year 2 year 3 year 4 year 5 year 6 year Between 7 and 11 years > 11 years No due date
DTA on taxable transferred losses 33.959 33.959
Other deferred tax assets 2.047 3.460 13 336 38.602 3.377 62.551 110.386
TOTAL DTA 2 .047 3.460 13 336 38.602 0 0 3.377 96.510 144.345
Table IT.9

VAT BE0404.476.8358181
Deferred tax l iabil it ies per expected date of uti l ization
31/12/2016
Deferred tax liability-
expected date of
utilization
Deferred tax liability-
expected date of
utilization
Deferred tax liability-
expected date of
utilization
Deferred tax liability-
expected date of
utilization
Deferred tax liability-
expected date of
utilization
Deferred tax liability-
expected date of
utilization
Deferred tax liability-
expected date of
utilization
Deferred tax liability-
expected date of
utilization
Deferred tax liability-
expected date of
utilization
TOTAL
1 year 2 year 3 year 4 year 5 year 6 year Between 7 and 11 years > 11 years No date determined
Other deferred tax l iabil it ies 1.625 4.414 5.822 10.730 52.160 6.235 10.637 46.251 579 138.453
TOTAL DTL 1.625 4.414 5.822 10.730 52.160 6.235 10.637 46.251 579 138.453
Table IT.10
Deferred tax l iabil it ies per expected date of uti l ization
31/12/2015
Deferred tax liability-
expected date of
utilization
Deferred tax liability-
expected date of
utilization
Deferred tax liability-
expected date of
utilization
Deferred tax liability-
expected date of
utilization
Deferred tax liability-
expected date of
utilization
Deferred tax liability-
expected date of
utilization
Deferred tax liability-
expected date of
utilization
Deferred tax liability-
expected date of
utilization
Deferred tax liability-
expected date of
utilization
TOTAL
1 year 2 year 3 year 4 year 5 year 6 year Between 7 and 11 years > 11 years No date determined
Other deferred tax l iabil it ies 14.439 29.808 33.912 520 47.529 309 4.191 45.696 577 176.981
TOTAL DTL 14.439 29.808 33.912 520 47.529 309 4.191 45.696 577 176.981
Table IT.11
Deferred tax liability as on the last use date
31/12/2016 DTL last use date DTL last use date DTL last use date DTL last use date DTL last use date DTL last use date DTL last use date DTL last use date DTL last use date TOTAL
1 year 2 year 3 year 4 year 5 year 6 yearBetween 7 and 11
years> 11 years No due date
Other deferred tax liability 1.625 635 5.822 10.730 55.939 6.235 10.637 843 45.987 138.453
TOTAL DTL 1.625 635 5.822 10.730 55.939 6.235 10.637 843 45.987 138.453
Table IT.12
Deferred tax liability as on the last use date
31/12/2015 DTL last use date DTL last use date DTL last use date DTL last use date DTL last use date DTL last use date DTL last use date DTL last use date DTL last use date TOTAL
1 year 2 year 3 year 4 year 5 year 6 yearBetween 7 and 11
years> 11 years No due date
Other deferred tax liability 5.078 4.602 392 10.881 57.617 21.565 30.573 189 46.084 176.981
55.939
TOTAL DTL 5.078 4.602 392 10.881 57.617 21.565 30.573 189 46.084 176.981
Table IT.13

VAT BE0404.476.8358282
17 Cash and Balances with Central Banks
18 Financial Assets Held for Trading
2016.12
en '000 EUR
2015.12
en '000 EUR
Components of cash and cash equivalents
On hand (cash) 57.389 62.342
Cash and balances with central banks 560.706 269.567
Loans and receivables 39.081 5.246
Available for sale assets
TOTAL 657.176 337.155
Table CBCB.1
Counterparty breakdown
Carrying value
in '000 EUR
2016.12 2015.12
Derivatives held for trading 1.642.004 1.554.504
Equity instruments
Quoted
Unquoted but FV determinable
Equity instruments at cost
Debt instruments issued by 1.499 1.169
Central governments
Credit institutions1.488 1.169
Non credit institutions 3
Corporate 8
Loans & advances to
Central governments
Credit institutions
Non credit institutions
Corporate
Retail
Accrued income (if accounted for separately)
TOTAL 1.643.504 1.555.673
Table FATRA.1

VAT BE0404.476.8358383
19 Financial Assets Designated at Fair Value through Profit or Loss
Counterparty breakdown
Carrying value
in '000 EUR
2016.12 2015.12
Equity instruments
Quoted
Unquoted but FV determinable
Debt instruments issued by
Central governments
Credit institutions
Non credit institutions
Corporate
Loans & advances to
Central governments
Credit institutions
Non credit institutions
Corporate
Retail
Accrued income if accounted for separately
TOTAL 0 0
Table FAFVPL.1

VAT BE0404.476.8358484
20 Available-for-sale Financial Assets
AXA Bank Europe has currently no investments in equity related funds and has a very small equity portfolio of 7.8 million EUR. These
shares mainly represent for 6.7 million EUR participating interests in non-consolidated subsidiaries, such as Motor Finance Company
N.V. and Beran N.V. (see chapter 25 Investments in associates, subsidiaries and joint ventures). In line with IAS 39 Financial Instru-
ments: Recognition and Measurement, the shares have been measured at cost as they do not have a quoted price in an active market
and because their fair value cannot be reliably measured. Furthermore AXA Bank Europe has also some participations in financial
intermediary entities (such as Visa Belgium) for 1.0 million EUR. The General Shareholders meeting of Visa Belgium decided on 16
December 2016 to grant a dividend to the shareholders of Visa Belgium under the form of cash (AXA Bank Europe: 0.6 million EUR),
shares (AXA Bank Europe: 0.5 million EUR) and a deferred payment until 2017 (AXA Bank Europe: 0.2 million EUR). These amounts
were recognised as dividend in the income statement. Another amount (AXA Bank Europe: 0.9 million EUR) was not distributed. This
amount has been booked as an unrealised gain on the share of Visa Belgium (through other comprehensive income, OCI). Lastly, AXA
Bank Europe has a very immaterial amount (0.1 million EUR) investments in shares. In 2016, there were no other realised or unrealised
gains or losses on available-for-sale equity instruments.
Counterparty breakdown
2016.12
in '000 EUR
Fa
ir v
alu
e o
f u
nim
pa
ire
d a
sse
ts
Fa
ir v
alu
e o
f im
pa
ire
d a
sse
ts
Tota
l ne
t ca
rryi
ng
am
ou
nt
< Im
pa
irm
en
t >
Equity 7.781 23 7.804 11
Quoted 96 96
Unquoted but FV determinable 978 978
Equity instruments at cost 6.707 23 6.730 11
Debt instruments issued by 4.297.184 4.297.184
Central governments 3.670.691 3.670.691
Credit institutions 626.493 626.493
Non credit institutions
Corporate
Loans & advances to
Central governments
Credit institutions
Non credit institutions
Corporate
Retail
Accrued income (if accounted for separately)
TOTAL 4.304.965 23 4.304.988 11
Table FAAVS.1
Counterparty breakdown
2015.12
in '000 EUR
Fa
ir v
alu
e o
f
un
imp
air
ed
ass
ets
Fa
ir v
alu
e o
f im
pa
ire
d
ass
ets
Tota
l ne
t ca
rryi
ng
am
ou
nt
< Im
pa
irm
en
t >
Equity 6.835 23 6.857 11
Quoted 56 56
Unquoted but FV determinable
70 70
Equity instruments at cost 6.708 23 6.731 11
Debt instruments issued by 7.831.770 7.831.770
Central governments 7.082.401 7.082.401
Credit institutions 749.369 749.369
Non credit institutions 0
Corporate
Loans & advances to
Central governments
Credit institutions
Non credit institutions
Corporate
Retail
Accrued income (if accounted for separately)
TOTAL 7.838.604 23 7.838.627 11
Table FAAVS.2

VAT BE0404.476.8358585
21 Loans and Receivables
Loans and receivables with maturity > 1 year:16,838 million EUR (2016) and 18,603 million EUR (2015).
C ounterparty breakdown
2 01 6.12
in '0 00 EUR
Un
imp
air
ed
ass
ets
Imp
air
ed
ass
ets
(to
tal c
arr
yin
g
am
ou
nt)
of
wh
ich
fo
rbe
ara
nce
me
asu
rem
en
ts
< A
llow
an
ces
for
ind
ivid
ua
lly
ass
ess
ed
fin
an
cia
l ass
ets
>
< A
llow
an
ces
for
colle
ctiv
ely
ass
ess
ed
fin
an
cia
l ass
ets
>
Tota
l ne
t ca
rryi
ng
am
ou
nt
Ave
rag
e n
et
carr
yin
g a
mo
un
t
Debts instruments issued by
Central governments
Credit institutions
Non credit institutions
Corporate
Loans and receivables to20.394.884 353.293 214.487 -70.973 -26.613 20.650.591 20.495.990
Central governments 677 677 508
Credit institutions 1.120.614 1.120.614 1.449.243
Non credit institutions 1.603.557 6.954 11.593 -1.670 -70 1.608.772 1.674.128
Corporate 867.559 30.603 14.218 -12.865 -420 884.877 863.851
Retail 16.802.478 315.736 188.676 -56.439 -26.123 17.035.652 16.508.260
Accrued income (if accounted for separately)
TOTAL 20.3 94.8 84 35 3.29 3 214 .487 -70.9 73 -2 6.61 3 20 .650 .59 1 2 0.49 5.99 0
Table LR.1
C ounterparty breakdown
2 01 5.12
in '0 00 EUR
Un
imp
air
ed
ass
ets
Imp
air
ed
ass
ets
(to
tal c
arr
yin
g
am
ou
nt)
of
wh
ich
fo
rbe
ara
nce
me
asu
rem
en
ts
< A
llow
an
ces
for
ind
ivid
ua
lly
ass
ess
ed
fin
an
cia
l ass
ets
>
< A
llow
an
ces
for
colle
ctiv
ely
ass
ess
ed
fin
an
cia
l ass
ets
>
Tota
l ne
t ca
rryi
ng
am
ou
nt
Ave
rag
e n
et
carr
yin
g a
mo
un
t
Debts instruments issued by
Central governments
Credit institutions
Non credit institutions
Corporate
Loans and receivables to19.489.767 386.367 188.268 -75.760 -34.441 19.765.932 24.079.826
Central governments 167 167 73
Credit institutions 1.265.904 1.265.904 1.847.101
Non credit institutions 1.673.968 5.120 10.143 -1.812 -51 1.677.225 5.121.299
Corporate 815.353 39.695 13.537 -14.245 -582 840.221 838.269
Retail 15.734.374 341.551 164.588 -59.703 -33.808 15.982.415 16.261.670
Accrued income (if accounted for separately)
TOTAL 19.4 89.7 67 38 6.36 7 188 .268 -75.7 60 -3 4.44 1 19 .765 .93 2 2 4.07 9.82 6
Table LR.2

VAT BE0404.476.8358686
Loans and receivables (excluding credit institutions)
2016.12
in '000 EUR
Ce
ntr
al g
ove
rnm
en
ts
No
n c
red
it in
stit
uti
on
s
Co
rpo
rate
Re
tail
Bills & own acceptances
Finance leases
Reverse repo 925.605
Consumer Credit 3.606 4.217 823.906
Mortgage loans 413 61.028 763 15.851.063
Term loans 264 425.665 863.991 223.624
Current accounts 3.144 15.906 52.372
Other 189.725 84.687
TOTAL 677 1.608.773 884.877 17.035.652
Table LR.3
Loans and receivables (excluding credit institutions)
2015.12
in '000 EUR
Ce
ntr
al g
ove
rnm
en
ts
No
n c
red
it in
sti
tuti
on
s
Co
rpo
rate
Re
tail
Bills & own acceptances
Finance leases
Reverse repo 962.374
Consumer Credit 3.287 3.640 839.980
Mortgage loans 47.734 796 14.809.307
Term loans 167 428.432 817.802 216.253
Current accounts 3.067 17.983 52.453
Other 232.331 64.422
TOTAL 167 1.677.225 840.221 15.982.415
Table LR.4

VAT BE0404.476.8358787
22 Derivatives
Derivatives are understood to mean swaps, futures, forwards and options. The value of these contracts is calculated according to the
case, based on the closing price, interest-rate level, exchange rate, rate of the underlying assets, implicit or historical volatility, expected
dividends or the correlation between the different underlying instruments.
Within the scope of its banking activities, AXA Bank Europe uses the following derived financial instruments, classified based on the
IFRS categories:
Far Value Hedge
1. Macro hedging of a part of the mortgages portfolio with fixed interest rate
AXA Bank Europe uses interest-rate swaps to hedge the fair value fluctuations of the mortgages portfolio with fixed interest
rate due to the evolution of the interest rate. AXA Bank Europe thus hedges the interest-rate risk between mortgages (long-
term interest rate) and their financing (short-term interest rate).
AXA Bank Europe has therefore set up a model of fair value hedge for a section of the mortgages portfolio with fixed interest
rate. This model was first applied on 1 April 2015, but was adjusted in July 2009 in order to refine the modelling of the in-
strument hedged, and thus to enhance the efficiency of the hedge relationship.
The efficiency of the hedge relationship is periodically examined using prospective and retrospective tests. If the model is ef-
ficient, the fluctuation of the fair value of the instrument hedged, namely the section of the mortgages portfolio with fixed in-
terest rate included in the fair value hedge documentation, is included in the result, just like the fluctuation of the fair value
of the derivatives concerned.
Due to the significant volumes of refinancing and repayments established, AXA Bank Europe regularly checks whether any
over-hedge is occurring. This check is performed by comparing the mortgage portfolio with fixed interest with the hedge-
swaps portfolio, the respective volumes of which being classified for each interest level group and taking a commercial mar-
gin into account.
Based on this check, an overhedge of a nominal amount of 72 million EUR has been observed at the end of 2016. Therefore,
interest rate swaps for this amount have been closed early. This transaction has led to a realised loss of 21 million EUR, for
the negative value of the swaps (replacing the outstanding unrealised loss at the early closure of the swaps). Simultaneously,
a part of the accounting hedge reserve linked to these swaps has been transferred one shot to the profit and loss account,
leading to a loss of 22 million EUR.
Next to this, a series of additional swaps for a notional amount of 557 million EUR has been closed early in a proactive way
and replaced by swaps at current market conditions in order to keep the interest rate position of AXA Bank Europe un-
changed. This transaction has led to a realised loss of 36 million EUR compensated by a write-back of the fair value correc-
tion for the same amount. The part of the hedging reserve linked to these swaps – 38 million EUR – has been amortised in
the profit and loss account until the initial maturity date of the terminated swaps or the possible observation of an additional
overhedge. The negative impact for 2016 is 3 million EUR.
2. Micro Hedge of Fixed-rate Securities with Interest Swaps
Existing fixed-rate securities of AXA Bank Europe’s investment portfolio are individually hedged using an interest swap. In the
event the efficiency of this fair value hedge can be demonstrated, the value fluctuation of the instrument hedged resulting
from the evolution of the interest rate of the fixed-rate security is included in the result.
3. Micro Hedging of a Part of the Mortgages Portfolio with Floating Interest Rate
AXA Bank Europe has purchased interest caps on the market in order to hedge the margin of the mortgages portfolio with
floating interest rate. AXA Bank Europe hedges the risk of the fair value fluctuations of the caps in the mortgages that could
be performed depending on the importance of the increase in the Euribor interest rate. This hedge occurs in the form of a dy-
namic portfolio hedge. This model is regularly analysed in order, if necessary, to add new hedge instruments to it, and to take
the new mortgage allocations into account. A regression analysis on a quarterly basis provides an efficiency test of the model.
This model has been applied since July 2010.

VAT BE0404.476.8358888
4. Micro Hedging of the Covered Bonds Issued by AXA Bank Europe SCF
The covered bonds issued by AXA Bank Europe SCF are hedged by interest swaps within the scope of micro fair-value hedge.
A regression analysis on a quarterly basis provides an efficiency test of the model. During the efficient periods, the fair value
fluctuation of the covered bonds is entered in the result in accordance with the hedge of the interest risk.
5. Micro Hedge of Fixed-interest Securities Swapped Using Long-term Sale Contracts and Interest Swaps
In order to establish a number of latent surplus values on certain lines of fixed-interest securities from the investment portfo-
lio that have already been hedged by interest swaps, AXA Bank Europe has in addition concluded a series of long-term sale
contracts of those securities, as well as receiver swaps with deferred departure date. These elements were documented in a
micro hedge relationship of the total fair value of these securities.
The entirety of these documented transactions expired in 2016.
Cash Flow Hedge
A hedge of latent surplus value on a part of the investment portfolio, the interest risk of which was not hedged by interest swaps, was
terminated by concluding long-term sale contracts with maturity dates running up to 2017. This involves micro hedge relationships in
the strict sense with the aim of safeguarding the cash flows received by AXA Bank Europe. These transactions have delivered a positive
result of 21.6 million EUR in 2016 and an expected result in 2017 of 30.8 million EUR.
These transactions on fixed-interest securities are of a definite nature, provided the long-term selling entails non-optional contractual
liabilities.
Fair Value Option
The EMTN issues, the performance swaps serving as hedge and the structured deposits or securities used as a means of transferring
the saving funds concerned between AXA Belgium Finance and AXA Bank Europe are classified as fair value option, based on the princi-
ple of a close economic relationship between these transactions, and as far as possible to avoid any imbalance concerning recognising
the results.
Freestanding Derivatives
1. Macro Hedge Transactions
Within the scope of the additional hedge of the mortgages portfolio, and specifically mortgages with floating interest rate ad-
justed every five years, swaptions are used as macro hedge of the risk in the interest caps that are part of the mortgages in-
volved.
This category furthermore consists of old interest caps for which no hedge model was developed.
2. Trading Activity
The trading portfolio, primarily resulting from AXA Bank Europe’s intermediation activity for the benefit of the insurance com-
panies of the AXA group, consists of interest swaps, total return swaps, currency swaps of exchange-term contracts, swap-
tions and index options.

VAT BE0404.476.8358989
Derivatives – Held for Trading Purposes
By nature
By type
2016.12
in '000 EUR
No
tio
na
l am
ou
nt
Ca
rryin
g a
mo
un
t A
sse
ts
Ca
rryin
g a
mo
un
t L
iab
iliti
es
Interest rate Option / Cap / Floor / Collar / Swaption 7.305.535 354.450 21.178
IRS 61.045.884 1.068.036 950.536
FRA
Forward
Interest future 270.002
Other 665.799
Equity instruments Equity forward
Equity future
Equity option
Warrant
Other 7.235.778 115.165 10.229
Currency (FX) FX forward 4.096.225 93.557 94.143
FX future
Cross currency swap 329.866 10.796 28.231
FX option
FX forward rate agreement
Other
Credit Credit default swap
Credit spread option
Total return swap
Other
Commodity
Other
Accrued income / expenses (if accounted for
separately)
TOTAL 80.949.088 1.642.004 1.104 .317
Table DHA.1
By nature
By type
2015.12
in '000 EUR
No
tio
na
l am
ou
nt
Ca
rryi
ng
am
ou
nt
Ass
ets
Ca
rryi
ng
am
ou
nt
Lia
bilit
ies
Interest rate Option / Cap / Floor / Collar / Swaption 6.101.421 17.959 16.721
IRS 59.053.900 1.351.436 807.971
FRA
Forward
Interest future 856.521
Other 752.133
Equity instruments Equity forward
Equity future
Equity option
Warrant
Other 6.121.943 102.111 8.740
Currency (FX) FX forward 4.886.807 79.471 32.178
FX future
Cross currency swap 296.411 3.527 35.101
FX option
FX forward rate agreement
Other
Credit Credit default swap
Credit spread option
Total return swap
Other
Commodity
Other
Accrued income / expenses (if accounted for
separately)
TOTAL 78.069.137 1.554.504 900.712
Tabel DHA.2

VAT BE0404.476.8359090
Derivatives – Hedging Activities (Micro Hedging)
By type of risk
By instrument
2016.12
in '000 EUR
Ca
rryi
ng
am
ou
nt
Ass
ets
Ca
rryi
ng
am
ou
nt
Lia
bili
tie
s
No
tio
na
l am
ou
nt
Fair value hedges
Interest rate Option / Cap / Floor / Collar / Swaption
IRS 89.564 57.853 4.858.500
FRA
Forward
Interest future
Other
Equity instruments Equity forward
Equity future
Equity option
Warrant
Other
Currency (FX) FX forward
FX future
Cross currency swap
FX option
FX forward rate agreement
Other
Credit Credit default swap
Credit spread option
Total return swap
Other
Commodity
Other
TOTAL 89.564 57.853 4.858.500
Cash f low hedg es
Interest rate Option / Cap / Floor / Collar / Swaption
IRS
FRA
Forward
Interest future
Other
Equity instruments Equity forward
Equity future
Equity option
Warrant
Other
Currency (FX) FX forward
FX future
Cross currency swap
FX option
FX forward rate agreement
Other
Credit Credit default swap
Credit spread option
Total return swap
Other
Commodity
Other
FULL Cash flow hedge Forward Sale debt security 33.114 678.000
TOTAL 33.114 678.000
Hedges of a net investment in a foreign operation
TOTAL 89.564 90.967 5.536.500
Table DHA.3

VAT BE0404.476.8359191
By type of risk
By instrument
2015.12
in '000 EUR
Ca
rryin
g a
mo
un
t A
sse
ts
Ca
rryin
g a
mo
un
t L
iab
ilit
ies
No
tio
na
l a
mo
un
t
Fair value hedges
Interest rate Option / Cap / Floor / Collar / Swaption
IRS 49.672 208.637 6.549.000
FRA
Forward
Interest future
Other
Equity instruments Equity forward
Equity future
Equity option
Warrant
Other
Currency (FX) FX forward
FX future
Cross currency swap
FX option
FX forward rate agreement
Other
Credit Credit default swap
Credit spread option
Total return swap
Other
Commodity
Other
TOTAL 49.672 208.637 6.549 .000
Cash f low hedges
Interest rate Option / Cap / Floor / Collar / Swaption
IRS
FRA
Forward
Interest future
Other
Equity instruments Equity forward
Equity future
Equity option
Warrant
Other
Currency (FX) FX forward
FX future
Cross currency swap
FX option
FX forward rate agreement
Other
Credit Credit default swap
Credit spread option
Total return swap
Other
Commodity
Other
FULL Cash flow hedge Forward Sale debt security 61 16.070 884.000
TOTAL 61 16.070 884.000
Hedges of a net investment in a foreign operation
TOTAL 49.733 224.707 7.433 .000
Table DHA.4

VAT BE0404.476.8359292
Derivatives - Hedging Activities (Macro Hedging)
See also chapter 33 Offsetting.
Hedging of interest rate portfo lio
2016.12
in '000 EUR
Ca
rryi
ng
am
ou
nt
Asse
ts
Ca
rryi
ng
am
ou
nt
Lia
bili
tie
s
No
tio
na
l am
ou
nt
Fair value hedges 8.194 310.735 7.074.409
Cash flow hedges
Table DHA.5
Hedging of interest rate portfolio
2015.12
in '000 EURC
arr
yin
g a
mo
un
t A
sse
ts
Ca
rryi
ng
am
ou
nt
Lia
bili
tie
s
No
tio
na
l am
ou
nt
Fair value hedges 76.393 319.826 6.310.662
Cash flow hedges
Table DHA.6

VAT BE0404.476.8359393
23 Property, Plant and Equipment
PPE measured after recognition using the revaluation model
2016.12
in '000 EUR
Ow
ne
r-o
ccu
pie
d la
nd
an
d b
uild
ing
IT e
qu
ipm
en
t
Off
ice
eq
uip
me
nt
Oth
er
eq
uip
me
nt
(in
clu
din
g c
ars
)
Tota
l ca
rryi
ng
am
ou
nt
Opening balance 40.502 231 298 349 41.379
Additions 571 13 91 675
Acquisition through business combinations
Disposals -250 -250
Disposals through business combinations
Depreciation -1.913 -183 -32 -51 -2.179
Impairment losses recognized in profit or loss
Impairment losses reversed in profit or loss
Foreign currency translation effects
Transfers 67 67
To and from non-current assets held for sale
To and from investment property
Other changes 9 114 123
Ending balance 38.976 57 279 503 39.815
Amortization financial year 1.913 183 32 51 -2.179
Amortization previous year 26.662 1.903 2.019 481 31.065
Cumulated Amortization 28.575 2.086 2.051 532 33.244
Table PPE.1
PPE measured after recognition using the revaluation model
2015.12
in '000 EUR
Ow
ne
r-o
ccu
pie
d la
nd
an
d b
uild
ing
IT e
qu
ipm
en
t
Off
ice
eq
uip
me
nt
Oth
er
eq
uip
me
nt
(in
clu
din
g c
ars
)
Tota
l ca
rryi
ng
am
ou
nt
Opening balance 43.321 1.143 65 1.250 45.779
Additions 625 295 7 927
Acquisition through business combinations
Disposals
Disposals through business combinations
Depreciation -1.844 -290 -14 -55 -2.203
Impairment losses recognized in profit or loss
-282 -49 -807 -1.138
Impairment losses reversed in profit or loss
Foreign currency translation effects
Transfers
To and from non-current assets held for sale
To and from investment property
Other changes -1.600 -340 -46 -1.986
Ending balance 40.502 231 298 349 41.379
Amortization financial year 1.844 290 14 55 2.203
Amortization previous year 24.818 1.613 2.005 426 28.862
Cumulated Amortization 26.662 1.903 2.019 481 31.065
Table PPE.2

VAT BE0404.476.8359494
24 Intangible Fixed Assets
Currently there is no goodwill recognised in the consolidation scope of AXA Bank Europe.
AXA Bank Europe launched an IT programme by the name of SWITCH in 2015. In April 2015, in consultation with AXA Group, AXA Bank
Europe decided to transform the initial big-bang project approach into a multi-annual roadmap of different independent projects (Atlas,
Loan Origination and Credit Scoring) with the same final objective of a radically simplified bank (architecture and retail business sys-
tems and processes) with lower costs structurally. The project costs associated with this for the year 2016 are a combination of costs
related to project management, study phase and development phase. Based on the IFRS rules, an amount of 2.9 million EUR was
capitalised in 2016 (Atlas 1.6 million EUR – Loan Origination 0.9 million EUR – Credit Scoring 0.4 million EUR).
Other intangible assets accounted for by using the revaluation model
2016.12
in '000 EUR Go
od
will
Inte
rna
lly d
eve
lop
ed
so
ftw
are
Acq
uir
ed
so
ftw
are
Oth
er
inte
rna
lly d
eve
lop
ed
inta
ng
ible
ass
ets
Oth
er
inta
ng
ible
ass
ets
Tota
l ca
rryi
ng
am
ou
nt
Opening balance 6.886 0 0 6.885
Additions from internal development3.848 3.848
Additions from separate acquisition
Adjustments from business combinations
Retirement & disposals
Transfers to and from non-current assets Held for Sale
Adjustments resulting from subsequent recognition of deferred tax assets
Amortization recognized -2.289 -104 -2.393
Increases or decreases resulting from revaluations and impairment losses
recognized or reversed directly in equity
Impairment recognized in profit or loss
Impairment reversed in profit or loss
Foreign currency translation effects
Other movements 71 104 22 197
Ending balance
8.515 0 22 8.537
Amortization financial year 2.289 104 2.393
Amortization previous year 13.525 3.012 7 16.543
Cumulated Amort izat ion 15.814 3.116 7 18.937
Table IFA.1
Other intangible assets accounted for by using the revaluation model
2015.12
in '000 EUR Go
od
will
Inte
rna
lly d
eve
lop
ed
so
ftw
are
Acq
uir
ed
so
ftw
are
Oth
er
inte
rna
lly d
eve
lop
ed
inta
ng
ible
asse
ts
Oth
er
inta
ng
ible
asse
ts
Tota
l ca
rryi
ng
am
ou
nt
Opening balance 3.888 1.394 165 5.447
Additions from internal development
4.802 110 4.912
Additions from separate acquisition
Adjustments from business combinations
Retirement & disposals
Transfers to and from non-current assets Held for Sale
Adjustments resulting from subsequent recognition of deferred tax assets
Amortization recognized
-1.758 -383 -2.141
Increases or decreases resulting from revaluations and impairment losses
recognized or reversed directly in equity
Impairment recognized in profit or loss
-1.508 -165 -1.673
Impairment reversed in profit or loss
Foreign currency translation effects
Other movements
-46 387 341
Ending balance 6.886 0 0 6.885
Amortization financial year 1.758 383 2.141
Amortization previous year 11.767 2.629 7 14.402
Cumulated Amort izat ion 13.525 3.012 7 16.543
Table IFA.2

VAT BE0404.476.8359595
25 Investments in Associates, Subsidiaries and Joint Ventures
AXA Bank Europe has the following limited number of subsidiaries:
- AXA Belgium Finance bv (NL), Griekenweg 213 - 4835 NA Breda (Netherlands)
- AXA Bank Europe SCF (Société de Crédit Foncier), rue Carnot 203/205 - 94138 Fontenay-sous-Bois (France)
- Motor Finance Company N.V., Grotesteenweg 214 - 2600 Berchem (Belgium)
- Beran N.V., Grotesteenweg 214 - 2600 Berchem (Belgium).
AXA Bank Europe holds a participation of 10% in the SPV Royal Street. A fair representation of the consolidated position requires that
SPV is included and this in line with SIC-12 principles. The interest rate risk remains at ABE given the mutual exchange of interest pay-
ments via a total return swap. The credit risk also remains on the balance sheet of AXA Bank Europe as the junior-branches of RMBS,
issued by SPV, would be impacted first in the case of credit default.
In addition, it also holds a 20% stake in Bancontact Mister Cash. Alongside AXA Bank Europe, four other banks each own 20% in this
company. The firm aims to manage and license intellectual property rights, whether or not related to payment schemes with cards and
all other related transactions. Every shareholder is entitled to 1 director for each 20% bracket of the share ownership and the decisions
of the Board must be taken with a majority of 4/5. Because of its low materiality, this company is not included in the consolidation
scope.
AXA Belgium Finance bv was included in the consolidation scope. This is a Dutch private limited company, which issues securities and
other debt instruments on the Luxembourg securities market.
SPV Royal Street and AXA Bank Europe SCF are two entities that are used by AXA Bank Europe to attract funds in addition to the more
traditional forms of retail financing through securitisation operations and issue of covered bonds. The structure as it has now been set
up does not have a transfer of risk or rewards as a result of the total return swap between AXA Bank Europe and SPV Royal Street. Both
entities were thus integrally included in the AXA Bank Europe consolidation scope.
The funds of these subordinated loans were used for the establishment of a reserve fund in the SPV which has never been applied to
date.
To support its operation, AXA Bank Europe has granted a subordinated loan of 64 million EUR to the SPV.
There were no changes to the consolidation scope during the 2016 financial year.
Further explanation regarding these companies that have not been included in the consolidation scope of AXA Bank Europe in view of
the intangible nature:
Motor Finance Company N.V.
This is the vehicle in which investments in self-banking devices , which are leased to agents, are housed.
Beran NV
On 22 January 2008, Beran NV purchased the residual rights and the emphyteutic lease relating to immovable property located at Grote
Steenweg 214 in Berchem resulting in the termination of co-ownership with Fortis.
Entite it
2016.12
in '000 EUR
Accumulated equity
interest (%)Assets Liabilities Profit or loss Reporting date
Accounted for by using full consolidation :
AXA Belgium Finance bv (NL) 100,00% 1.643.905 1.638.620 721 31/12/2015
SPV Royal Street 10,00% 6.014.291 6.005.795 31/12/2015
AXA BANK Europe SCF 100,00% 4.859.656 4.744.622 3.287 31/12/2015
Entite it
2016.12
in '000 EUR
Accumulated equity
interest (%)Assets Liabilities Profit or loss Reporting date
Not accounted for by using full consolidation :
Beran N.V. 100,00% 2.038 13 -17 31/12/2015
Motor Finance Company N.V. 100,00% 10.043 6.128 -315 31/12/2015
Bancontact-Mister Cash (voorheen Brand & Licence Cy) 20,00% 9.237 3.173 429 31/12/2015
Tabel IASJ.1
Summ arised financial
inform at ion of subsidiaries
and joint ventures

VAT BE0404.476.8359696
26 Other Assets
Carrying amount
in '000 EUR2016.12 2015.12
Employee benefits92.532 92.759
Servicing assets for servicing rights
Prepaid charges973 921
Accrued income (other than interest income from financial assets)
4.655 6.809
Precious metals, goods and commodities
Other advances 46 46
Other -38 1.099
TOTAL 98.168 101.635
Table OA.1

VAT BE0404.476.8359797
27 Financial Liabilities Held for Trading
Counterparty breakdown
Carrying amount
in '000 EUR
2016.12 2015.12
Deposits from credit institutions
Current accounts / overnight deposits
Deposits with agreed maturity
Deposits redeemable at notice
Other deposits
Derivatives held for trading 1.104.317 900.712
Short positions 57
In equity instruments
In fixed income instruments 57
Deposits (other than from credit institutions)
Current accounts / overnight deposits
Deposits with agreed maturity
Deposits redeemable at notice
Other deposits
Debt certificates (including bonds)
Certificates of deposits
Customer saving certificates (also when dematerialised)
Bonds
Convertible
Non-convertible
Other
Other financial liabilities
Accrued expenses (if accounted for separately)
TOTAL 1.104.317 900.768
Table FLTRA.1

VAT BE0404.476.8359898
28 Financial Liabilities Designated at Fair Value through Profit or Loss
Debt certificates include EMTNs (European Medium-term Notes).. These EMTNs are issued by AXA Belgium Finance, a subsidiary of AXA
Bank Europe. AXA Bank Europe has opted for valuation at fair value through profit or loss and has therefore included these issues in the
balance sheet at their market value.
AXA Bank Europe has chosen to evaluate its own credit risk based on EMTN according to the spread AXA Bank Europe pays in the
primary market - as defined at the reporting date - since much larger volumes are traded on the primary than on the secondary market.
That is why they offer a more adequate assessment of the credit risk of AXA Bank Europe on the retail market. This method calculates
the difference between the margin's level that AXA Bank Europe applies to the issues for private investors on the date of issue and the
same level on the reporting date. This difference is used to determine the cash flow at the date of each coupon. They are then
discounted to determine the credit risk ratio for each issue.
This fair value amounted to a total of 1,484 million EUR with a nominal amount of 4,923 million EUR on 31 December 2016.
The year-to-date impact of the share in the bank's own credit risk in the amount of the fair value resulted in a decrease of 3.2 million
EUR of the fair value of the liabilities.

VAT BE0404.476.8359999
Counterparty breakdown
2016.12
in '000 EUR
Ca
rryin
g a
mo
un
t
Am
ou
nt
of
cu
mu
lati
ve
ch
an
ge
in f
air
va
lue
s a
ttri
bu
tab
le t
o
ch
an
ge
s in
cre
dit
ris
k
Dif
fere
nce
be
twe
en
th
e
carr
yin
g a
mo
un
t a
nd
th
e
am
ou
nt
con
tra
ctu
ally
re
qu
ire
d
to p
ay
at
ma
turi
ty
Deposits from credit institutions
Current accounts / overnight deposits
Deposits with agreed maturity
Deposits redeemable at notice
Other deposits
Deposits (other than from credit institutions)
Current accounts / overnight deposits
Deposits with agreed maturity
Deposits redeemable at notice
Other deposits
Debt certificates (including bonds) 1.484.385 4.522 3.438.816
Certificates of deposits
Customer saving certificates (also when dematerialised)
Bonds 1.484.385 4.522 3.438.816
Convertible
Non-convertible 1.484.385 4.522 3.438.816
Other
Subordinated liabilities
Other financial liabilities
Accrued Expense (if accounted for separately)
TOTAL 1.484.385 4.522 3.438.816
Table FLFVPL.1
Counterparty breakdown
2015.12
in '000 EUR
Ca
rryi
ng
am
ou
nt
Am
ou
nt
of
cum
ula
tive
ch
an
ge
in
fair
va
lue
s a
ttri
bu
tab
le t
o c
ha
ng
es
in c
red
it r
isk
Dif
fere
nce
be
twe
en
th
e c
arr
yin
g
am
ou
nt
an
d t
he
am
ou
nt
con
tra
ctu
ally
re
qu
ire
d t
o p
ay
at
ma
turi
ty
Deposits from credit institutions
Current accounts / overnight deposits
Deposits with agreed maturity
Deposits redeemable at notice
Other deposits
Deposits (other than from credit institutions)
Current accounts / overnight deposits
Deposits with agreed maturity
Deposits redeemable at notice
Other deposits
Debt certificates (including bonds) 1.633.560 7.669 -159.651
Certificates of deposits
Customer saving certificates (also when dematerialised)
Bonds 1.633.560 7.669 -159.651
Convertible
Non-convertible 1.633.560 7.669 -159.651
Other
Subordinated liabilities
Other financial liabilities
Accrued Expense (if accounted for separately)
TOTAL 1.633.560 7.669 -159.651
Table FLFVPL.2
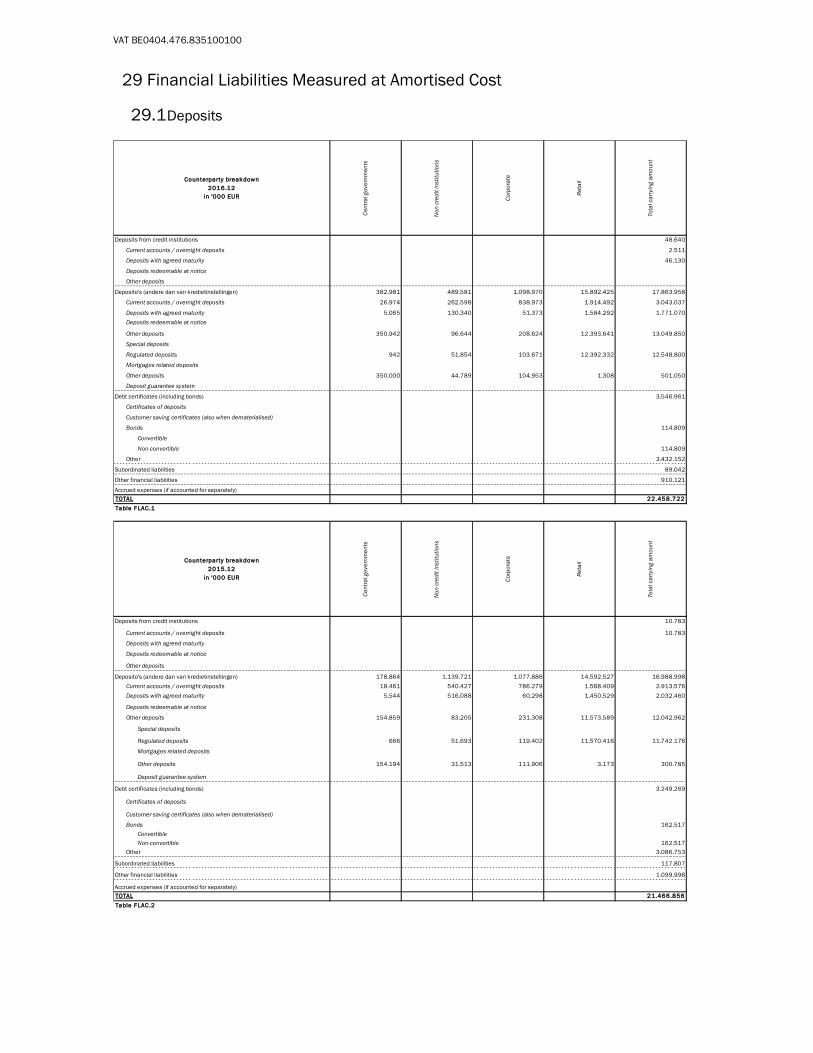
VAT BE0404.476.835100100
29 Financial Liabilities Measured at Amortised Cost
29.1 Deposits
Counterparty breakdown
2016.12
in '000 EUR
Ce
ntr
al g
ove
rnm
en
ts
No
n c
red
it in
stit
uti
on
s
Co
rpo
rate
Re
tail
Tota
l ca
rryi
ng
am
ou
nt
Deposits from credit institutions 48.640
Current accounts / overnight deposits 2.511
Deposits with agreed maturity 46.130
Deposits redeemable at notice
Other deposits
Deposito's (andere dan van kredietinstellingen) 382.981 489.581 1.098.970 15.892.425 17.863.958
Current accounts / overnight deposits 26.974 262.598 838.973 1.914.492 3.043.037
Deposits with agreed maturity 5.065 130.340 51.373 1.584.292 1.771.070
Deposits redeemable at notice
Other deposits 350.942 96.644 208.624 12.393.641 13.049.850
Special deposits
Regulated deposits 942 51.854 103.671 12.392.332 12.548.800
Mortgages related deposits
Other deposits 350.000 44.789 104.953 1.308 501.050
Deposit guarantee system
Debt certificates (including bonds) 3.546.961
Certificates of deposits
Customer saving certificates (also when dematerialised)
Bonds 114.809
Convertible
Non-convertible 114.809
Other 3.432.152
Subordinated liabilities 89.042
Other financial liabilities 910.121
Accrued expenses (if accounted for separately)
TOTAL 22.458.722
Table FLAC.1
Counterparty breakdown
2015.12
in '000 EUR
Ce
ntr
al g
ove
rnm
en
ts
No
n c
red
it in
stit
uti
on
s
Co
rpo
rate
Re
tail
Tota
l ca
rryi
ng
am
ou
nt
Deposits from credit institutions 10.783
Current accounts / overnight deposits 10.783
Deposits with agreed maturity
Deposits redeemable at notice
Other deposits
Deposito's (andere dan van kredietinstellingen) 178.864 1.139.721 1.077.886 14.592.527 16.988.998
Current accounts / overnight deposits 18.461 540.427 786.279 1.568.409 2.913.576
Deposits with agreed maturity 5.544 516.088 60.298 1.450.529 2.032.460
Deposits redeemable at notice
Other deposits 154.859 83.205 231.308 11.573.589 12.042.962
Special deposits
Regulated deposits 666 51.693 119.402 11.570.416 11.742.176
Mortgages related deposits
Other deposits 154.194 31.513 111.906 3.173 300.785
Deposit guarantee system
Debt certificates (including bonds) 3.249.269
Certificates of deposits
Customer saving certificates (also when dematerialised)
Bonds 162.517
Convertible
Non-convertible 162.517
Other 3.086.753
Subordinated liabilities 117.807
Other financial liabilities 1.099.998
Accrued expenses (if accounted for separately)
TOTAL 21.466.856
Table FLAC.2

VAT BE0404.476.835101101
29.2 Subordinated Liabilities
Maturity date
2016.12
in '000 EUR
Co
nve
rtib
le s
ub
ord
ina
ted
de
bts
No
n c
on
ve
rtib
le s
ub
ord
ina
ted
de
bts
Oth
er
term
su
bo
rdin
ate
d d
eb
ts
Su
bo
rdin
ate
d a
dva
nce
s
Current year
Current year +1 46.351
Current year +2 12.014
Current year +3 4.129
Current year +4 3.505
Current year +5 2.911
Current year +6
Current year +7
Current year +8
Current year +9
Current year +10
More than current year +10
Perpetuals 20.132
TOTAL 89.042
Table FLAC .3
Maturity date
2015.12
in '000 EUR
Co
nve
rtib
le s
ub
ord
ina
ted
de
bts
No
n c
on
vert
ible
su
bo
rdin
ate
d
de
bts
Oth
er
term
su
bo
rdin
ate
d d
eb
ts
Su
bo
rdin
ate
d a
dva
nce
s
Current year
Current year +1 12.135
Current year +2 45.020
Current year +3 12.014
Current year +4 4.129
Current year +5 3.505
Current year +6 2.911
Current year +7
Current year +8
Current year +9
Current year +10
More than current year +10
Perpetuals 38.093
TOTAL 117.807
Table FLAC .4

VAT BE0404.476.835102102
29.3 TLTRO-loans
AXA Bank Europe has subscribed to 150 million EUR of TLTRO-II loans with a 4-year term. The TLTROs are Eurosystem operations that
provide financing to credit institutions for periods of up to 4 years. They offer long-term funding at attractive conditions to banks in order
to further ease private sector credit conditions and stimulate bank lending to the real economy. The benefit of the below-market interest
rate is accrued in the income statement over the life of the TLTRO-II. The outstanding TLTRO-I loans have been fully repaid.

VAT BE0404.476.835103103
30 Repos and Reverse Repos
The debt certificates specified below are related to financial assets that have been recognised here for their IFRS book value.
Transferor : Repo
No derecognit ion of t ransfers of f inancial assets out of :
2016.12
in '000 EUR
Eq
uit
y in
stru
me
nts
De
bt
inst
rum
en
ts
Lo
an
s a
nd
ad
van
ces
Oth
er
Tota
l
Financial assets held for trading
Financial assets designated at fair value through profit or loss
Available-for-sale financial assets 2.568 2.568
Loans & receivables (including finances leases)
Held-to-maturity investments
Other
TOTAL 2.568 2.568
Table RRR.1
Transferor : Repo
No derecognit ion of t ransfers of f inancial assets out of :
2015.12
in '000 EUR
Eq
uit
y in
stru
me
nts
De
bt
inst
rum
en
ts
Lo
an
s a
nd
ad
van
ces
Oth
er
Tota
l
Financial assets held for trading
Financial assets designated at fair value through profit or loss
Available-for-sale financial assets 3.568.953 3.568.953
Loans & receivables (including finances leases)
Held-to-maturity investments
Other
TOTAL 3.568.953 3.568.953
Table RRR.2
Transferor : Liabil ities ( financing obtained)
2016.12
in '000 EUR
Tota
l
Repo
Credit institutions
Other than credit institutions 1.031.061
Total 1.031.061
Table RRR.3
Transferor : Liabil ities ( financing obtained)
2015.12
in '000 EUR
Tota
l
Repo
Credit institutions 1.426.009
Other than credit institutions 2.656.292
Total 4.082.301
Table RRR.4

VAT BE0404.476.835104104
The inclusion of the repurchase agreements and reverse repurchase agreements occurs here for the paid amounts and received
amounts, respectively.
See also Chapter 33.
Transferee : Assets (f inancing granted)
2016.12
in '000 EUR
Tota
l
Reverse repo
Credit institutions
Other than credit institutions 925.605
Total 925.605
Table RRR.5
Transferee : Assets (f inancing granted)
2015.12
in '000 EUR
Tota
l
Reverse repo
Credit institutions
Other than credit institutions 962.374
Total 962.374
Table RRR.6

VAT BE0404.476.835105105
31 Provisions
2016.12
in '000 EUR
Re
stru
ctu
rin
g
Pro
visi
on
s f
or
Tax
liti
ga
tio
n a
nd
pe
nd
ing
leg
al i
ssu
es
Pe
nsio
ns a
nd
oth
er
po
st r
eti
rem
en
t
be
ne
fit
ob
liga
tio
ns
Lo
an
co
mm
itm
en
ts a
nd
gu
ara
nte
es
Oth
er
pro
visi
on
s
TOTA
L
Opening balance 34.544 154.708 318 19.436 209.006
Additions 949 3.156 9.854 6.893 20.853
Amounts used -404 -8.176 -3.603 -12.183
Unused amounts reversed during the period
Acquisitions (disposals) through business combination
Increase in the discounted amount (passage of time) and effect of any change
in the discount rate
Exchange differences
Other movements 4.470 15.492 -318 -4.151 15.493
C losing balance 39.559 165.180 9.854 18.575 233.169
Table PROV.1
2015.12
in '000 EUR
Re
str
uct
uri
ng
Pro
vis
ion
s fo
r Ta
x lit
iga
tio
n
an
d p
en
din
g le
ga
l is
su
es
Pe
nsi
on
s a
nd
oth
er
po
st
reti
rem
en
t b
en
efi
t
ob
liga
tio
ns
Lo
an
co
mm
itm
en
ts a
nd
gu
ara
nte
es
Oth
er
pro
visio
ns
TOTA
L
Opening balance 34.590 173.199 1.784 119.563 329.136
Additions 5.934 5.627 11.561
Amounts used -9.541 -717 -7.858 -18.116
Unused amounts reversed during the period
Acquisitions (disposals) through business combination
Increase in the discounted amount (passage of time) and effect of any change
in the discount rate
Exchange differences
Other movements -46 -14.884 -749 -97.896 -113.574
C losing balance 34.544 154.708 318 19.436 209.007
Table PROV.2

VAT BE0404.476.835106106
Clarifications regarding the major components of these provisions at AXA Bank Europe appear below.
Provisions for Tax Disputes
This section includes provisions as part of possible additional taxes, which are contested by the bank. In this context a number of clients
claimed compensation from the bank, for which provisions were also recognised.
In the short term no major development is expected in these cases.
Ongoing Legal Disputes
The main element of this section is the provision for litigation concerning agents and former agents. It mainly concerns disputes due to
cases of fraud. In 2016 this provision has been set to zero.
Estimates vary as to the period of settlement of these disputes that are heterogenous and unpredictable at times.
Restructurings
The social liabilities are formed by liability of the company Anhyp for the fusion with Ippa, from which AXA Bank Europe arose. This
involve individual arrangement running up to 2018 at latest, the most significant amounts of which were entered in the 2007-2008
period.
Pension Obligations and Other Benefits under Pension Obligations
The majority here relates to the provision under IAS19. For more details and information, please refer to chapter 13.2 Pension liabilities
and other benefits.
The group plan on social liabilities mentioned under the ‘restructuring’ point is also included here. No provision has been recorded since
the beginning of the year. The provision was completely extinguished at the year-end 2014.
During the 2016 financial year, new provisions of 2.7 million EUR and an allocation of the provision of 7.0 million EUR were established
under the existing regulations at AXA Bank Europe. Therefore, on 31 December 2016, these provisions were 11.2 million EUR. They
were included in the CTC of 7 May 2007 and in its extension of 25 November 2009 and in the CTC of 16 March 2011.
The balance of the provision for credit time was 0.2 million EUR at 1 January 2016. In 2016, no provision was added. At 31 December
2016 an amount of 0.1 million EUR has been used.
Other provisions
The column ‘Other provisions’ includes mainly the provision for closure of the Hongarian branch (13.2 million EUR). ‘Other provisions’
also includes a provision for early departure of 4.2 million EUR in line with the expectations of management.

VAT BE0404.476.835107107
32 Other Liabilities
Carrying amount
in '000 EUR2016.12 2015.12
Employee benefits -2.071 476
Social security charges 18.086 22.819
Servicing liabilities for servicing rights
Leasing liabilities
Accrued charges (other than from interest expenses on financial liabilities) 1.893 2.825
Income received in advance 1.389 1.641
Other debts 47.069 36.031
Other -3.900 -14
TOTAL 62.466 63.778
Table OL.1

VAT BE0404.476.835108108
33 Offsetting
Offsetting in the Balance Sheet
IAS 32 – Financial Instruments - Presentation requires the presentation of financial assets and financial liabilities on a net basis when
doing so reflects an entity’s expected future cash flows from settling two or more separate financial instruments.
A financial asset and a financial liability shall be offset and the net amount presented in the balance sheet when, and only when, AXA
Bank Europe
(a) currently has a legally enforceable right to set off the recognised amounts; and
(b) intends either to settle on a net basis, or to realise the asset and settle the liability simultaneously.
To meet the criterion (a), AXA Bank Europe must currently have a legally enforceable right of set-off. This means that the right of set-off:
(a) must not be contingent on a future event; and
(b) must be legally enforceable in all of the following circumstances:
(i) the normal course of business;
(ii) the event of default; and
(iii) the event of insolvency or bankruptcy of the entity and all of the counterparties.
To meet criterion (b), AXA Bank Europe must intend either to settle on a net basis or to realise the asset and settle the liability simulta-
neously. Although AXA Bank Europe may have a right to settle net, it may still realise the asset and settle the liability separately.
AXA Bank Europe clears the positions on its OTC interest rate swaps daily with a number of intermediary banks:
- LCH Clearnet CM CSI (Credit Suisse)
- LCH Clearnet CM HSBC Bank Plc (HSBC)
- AXA LIFE EUROPE LTD (France FoS VA)
- AXA LIFE EUROPE LTD (GERMANY branch)
- AXA LIFE EUROPE LTD (MEDLA branch)
- AXA LIFE EUROPE LTD (UK FoS VA Bus)
- AXA LIFE EUROPE LTD (GMAB)
- AXA LIFE EUROPE LTD (JAPAN)
For each of the clearing members, the amounts cleared include:
- interest payments on the swap and all other payments (upfront fees, premiums, early termination amounts, ...)
- variation margin evolutions, covering the changes in the positive/negative net value of all traded derivatives through the in-
termediary bank.
The clearing is performed separately for each currency. The calculation is made at the end of day, and the difference versus the previ-
ous day is settled net in one single cash payment on the following day, for each currency.
The netting of the derivatives position is legally enforceable and is not contingent on a future event, therefore meeting the IFRS re-
quirements.
The amounts that have been netted in the balance sheet can be found in the first three figures columns in the tables below.
Repos and reverse repos are currently not subject to offsetting as they are currently not part of master netting agreements that allow for
offsetting in all circumstances.
Offsetting in the Disclosures
IAS 32 requires that, in other circumstances than mentioned above, financial assets and financial liabilities should be presented sepa-
rately from each other consistently with their characteristics as resources or obligations of the entity. Financial instrument transactions
under a ‘master netting arrangement’ with a counterparty that only provide for a single net settlement of all financial instruments cov-
ered by the agreement in the event of default on, or termination of, any one contract do not provide a basis for offsetting unless both of
the criteria above are satisfied.
At AXA Bank Europe, all transactions under master netting agreements not mentioned above are reported gross.
Furthermore, IFRS 7 – Financial Instruments - Disclosures requires disclosure of the following quantitative information:
- the amounts subject to an enforceable master netting agreement or similar agreement that are not offset,, including

VAT BE0404.476.835109109
- amounts related to recognised financial instruments that do not meet some or all of the offsetting criteria of IAS
32
- amounts related to financial collateral (including cash collateral); and
- the net amount after deducting these amounts from the net amounts presented in the financial position.
AXA Bank Europe simulates this potential netting based on the following criteria:
- netting by counterparty
- of all repos, reverse repos derivatives and the related collaterals
- for derivatives: separately for hedging and trading positions
- collateral: initial and variation margin
The amounts of this potential netting can be found in the other figure columns in the tables below.
F inancial assets – offsetting
C arrying amounts
in '000 EUR
2016.12
Gross am ounts before
offsetting
Amounts set off
against f inancial
liabi li ties
Net amounts after
offsettingFinancial instruments Financial guarantees Net position
Derivatives - trading 4.677.865 3.035.861 1.642.004 1.090.990 509.580 41.434
Derivatives - hedging 138.755 40.997 97.758 63.237 30.338 4.183
Reverse Repos 925.605 0 925.605 925.605 0 0
Total 5.742.225 3.076.858 2.665.367 2.079.832 539.918 45.617
Tableau OFFS.1
F inancial l iabil ities - offsetting
C arrying amounts
in '000 EUR
2016.12
Gross am ounts before
offsetting
Amounts set off
against f inancial
assets
Net amounts after
offsettingFinancial instruments Financial guarantees Net position
0
Derivatives - trading 4.550.588 3.446.271 1.104.317 578.455 474.331 51.531
Derivatives - hedging 727.177 325.476 401.701 253.537 141.049 7.114
Repos 1.031.061 0 1.031.061 1.031.061 0 0
Total 6.308.826 3.771.747 2.537.079 1.863.053 615.380 58.645
Tableau OFFS.2
F inancial assets – offsetting
C arrying amounts
in '000 EUR
2015.12
Gross am ounts before
offsetting
Amounts set off
against f inancial
assets
Net amounts after
offsettingFinancial instruments Financial guarantees Net position
Derivatives - trading 4.784.460 3.228.787 1.555.673 929.355 626.318 0
Derivatives - hedging 146.792 20.666 126.126 71.953 50.779 3.394
Reverse Repos 962.374 0 962.374 962.370 9 4
Total 5.893.626 3.249.453 2.644.173 1.963.678 677.106 3.398
Tableau OFFS.3
F inancial l iabil ities - offsetting
C arrying amounts
in '000 EUR
2015.12
Gross am ounts before
offsetting
Amounts set off
against f inancial
assets
Net amounts after
offsettingFinancial instruments Financial guarantees Net position
Derivatives - trading 4.635.980 3.735.212 900.768 314.141 586.627 0
Derivatives - hedging 866.755 322.222 544.533 237.983 287.476 19.074
Repos 4.082.301 0 4.082.301 4.070.303 10.276 1.722
Total 9.585.036 4.057.434 5.527.602 4.622.427 884.379 20.796
Tableau OFFS.4
Amounts from master netting agreements -
not set off
Amounts from master netting agreements -
not set off
Amounts from master netting agreements -
not set off
Amounts from master netting agreements -
not set off

VAT BE0404.476.835110110
34 Contingent Assets and Liabilities
Information regarding the most important lines:
The line ‘Non-included section of the credit lines’ contains the margin available on the credit lines involved. A credit line involved is the
fixed liability for granting a credit line. The liability applies as fixed if it cannot be revoked at any moment with immediate effect.
The line ‘Credit-replacing security’ contains the securities received on loans and the securities provided relating to liabilities due to
borrowing or due to deferred payment. Given collateral on loans include the liabilities of the bank to retail clients. The risk is very limited because of diversification of the port-folio and mainly the fact that the granted loans are guaranteed by the clients.
Received collateral on loans are related to mortgage loans, consumer loans and professional loans.
Mortgage loans must be fully guaranteed by a mortgage (recording or mandate) on real property (full property). Property guarantees are
required by law. The mortgage guarantees that must be provided can be reused in the context of potential subsequent mortgage loans.
All guarantees complementing mortgage guarantees must be provided before registering the loan. This also applies to additional
collateral securities. A mortgage mandate is usually drawn up for both the property to be purchased and the property to be sold in the
case of a bridge loan.
For consumer loans only one type of guarantee is used: transfer of debt collection or act of relinquishment of wages and other income.
For professional loans the most important guarantees are the following:
- Fair guarantees
- Mortgage and mortgage registration
- Authentic pledging of business
- Subrogation to the benefit of the seller of movable property
- Securities collateral
- Pledging of account balance
- Transfer of all ‘traditional life insurance’ rights
- Transfer of all insurance policy rights Branch 21 and 23
- Transfer of salary
- Personal or moral guarantees
- Security
- Mortgage mandate
- Irrevocable commitment by a third party
Valuation of these guarantees:
- Mortgage and mortgage registration: valuation in function of
CONTINGENT ASSETS AND LIABILITIES
Reference amounts
2016.12
en '000 EUR
Provided Received
Non-included section of the credit lines 1.065.007
Credit-replacing security 1.486.648 22.564.554
Collateral concerning repos, reverse repos and derivatives 1.870.561 2.881.340
Other obligations 2.988.894 3.313.422
Tableau CAL.1
CONTINGENT ASSETS AND LIABILITIES
Reference amounts
2015.12
en '000 EUR
Provided Received
Non-included section of the credit lines 1.051.391 158.238
Credit-replacing security 1.616.194 24.397.922
Collateral concerning repos, reverse repos and derivatives 6.007.831 2.172.645
Other obligations 1.229.813 3.100.819
Tableau CAL.2

VAT BE0404.476.835111111
- The appraisal value of the property on the basis of a valuation report or updated valuation by a professional (such
as a real estate expert, a notary or a broker), a recent purchase, based on knowledge of the property by the point
of sale, etc.
- The rank of the subscription
- The voidability of the subscription because of a suspicious period in view of a bankruptcy
- Note: mortgage mandates are not booked
- Business asset pledge: valuation in function of
- The importance and the marketability of the fixed asset
- The size and distribution of receivables
- The size of the inventory of non-perishable raw materials or finished products
- The value of the rental property
- Privileges of higher rank (lessor, equipment)
- Transferability as a ‘going concern’
- The rank of the subscription
- The voidability of the subscription because of a suspicious period in view of a bankruptcy
- The assessment of the administrator or liquidator
- Substitution in the privilege of the seller of movable property (including transfer of debts and transfer of pay): valuation in
function of
- The creditworthiness of the assigned debtor
- Whether or not the character of the transferred claim is disputed
- Pledging of account balances: appreciation to 100% of the deposit
- Transfer of insurance policy rights: appreciation at 0%
- Personal or moral guarantees: valuation in function of the proven solvency of the security deposit (especially its real estate
assets) or its determination to honour the commitment through a respected serious debt reduction plan.
The line ‘Collateral concerning repos, reverse repos and derivatives’ contains the assets provided and received by the bank within the
scope of its ‘repo-reverse repo’ and derivatives activities, depending on the fluctuation of the market value of the transactions.
In the framework of the ‘Global Master Repurchase Agreement’ (GMRA), AXA Bank Europe only accepts government bonds. Since
August 2007 however, AXA Bank Europe has concluded one GMRA with AXA IM in which she also accepted non-governmental paper,
provided it qualifies as collateral by the ECB. Currently there are no open positions in this GMRA.
In the repo activity, a distinction can be made between 2 types of collateral:
- the collateral received when concluding a new deal, mostly Belgian (and sometimes French) government bonds.
- the collateral required during the term of the deals according to the fluctuation of the market value of the initially provided
collateral. This additional collateral is mostly settled in cash (at Eonia interest rate) but sometimes in Belgian or French
government bonds.
In derivatives activities, the general rule applies that collateral is systematically requested. Only cash (at Eonia interest rate) and
Belgian, German, Italian, French, Swiss and UK government bonds with a residual term of minimum 1 year and maximum 10 years will
be considered for this collateral.
All collateral received can be sold or reused by AXA Bank Europe as collateral.
AXA Bank Europe is obliged to return this collateral.
The line ‘Other obligations’ contains all other obligations received and provided.
Encumbered Assets
Certain assets have been encumbered : securities given in repo, bonds given as collateral to the European Central Bank (ECB) for ob-
taining financing and bonds given as collateral to the Belgian tax authorities.

VAT BE0404.476.835112112
35 Equity
For figures see ‘Consolidated balance sheet– equity’
The paid-in capital amounts to 681.3 million EUR and consists of 493,744,650 shares without making a reference to the nominal value.
It was paid up in full.
The other capital equity instruments issued consist of Contingency Convertible Bonds.
The reserves from other comprehensive income include the reserves from the foreign currency translation, the revaluation of the avail-
able-for-sale financial assets, the revaluation of the cash flow hedges and the reserves for pension liabilities (non-realised results and
actuarial gains and losses on defined benefit plans).
The ‘other reserves’ section comprises the legal reserves and the transferred results from the AXA Bank Europe parent company and
the consolidation reserves resulting from the first IFRS inclusion into this latter and all consolidation reserves for the subsidiaries.
The consolidation reserves also include the Fund for General Bank Risks. It was established by the bank to deal with unforeseeable
risks and future unexpected losses. This fund amounts to 32 million EUR.
36 Profit Allocation and Dividends per Share
The Board of Directors proposes to transfer the statutory profit for the year, together with the retained earnings, to the next financial
year, after allocation to the legal reserve. No dividends will be distributed.
VAT BE0404.476.835113113
37 Segmented Information
Operating segments are components of AXA Bank Europe
- that engage in business activities from which it may earn revenues and incur expenses;
- whose operating results are regularly reviewed by the Management Committee of AXA Bank Europe to make decisions about
resources to be allocated to the segments and assess their performance, and;
- for which discrete financial information is available.
The Management Committee of AXA Bank Europe is considered to be the chief operating decision maker as defined under IFRS 8 –
Operating Segments.
The following operating segments are reported separately based on the guidelines of IFRS 8:
- Retail banking (including Treasury and ALM);
- Intermediation activities.
The retail banking activity consists mainly of collecting funding (daily operations, savings products) and providing loans to its customers
(households, professionals and small businesses) through its network of independent agents. The reported figures include the related
ALM results (Assets and Liabilities Management), whose main purpose is to manage the exposure of AXA Bank Europe to interest rate,
liquidity and foreign exchange risks. The treasury activity consists of providing short term liquidity and funding as a support for the
growth of the retail business.
The intermediation activities consist mainly of providing funding, cash management and derivatives for several AXA Group entities.
Transactions between the different operating segments are carried out on an arm's length basis.
The following principles are applied:
- allocation of ALM results: in addition to the commercial margin, AXA Bank Europe may grant a conversion margin for its retail
activities. The parameters used for determining said grant are economic capital together with assets and liabilities of the re-
tail activities;
- funds transfer pricing: the management of cash resources and ALM within AXA Bank Europe is centralised. With a view to
transferring the interest rate risk of the commercial activities to the centralised ALM, the funds transfer pricing methodology
is used. This means that deposits that are provided for safekeeping by the commercial business units are reinvested at the
central ALM and that the loans allocated by the commercial business units are financed by the central ALM while using the
funds transfer pricing interest rate.
The reconciliations between the total of the operating segments and the group result are mainly:
- differences in mapping between the segment reporting and the consolidated income statement;
- elements not included in operating income in the segment reporting;
- differences between the valuation rules of the segment reporting (based on AXA Group rules) and the consolidated income
statement (based on AXA Bank Europe rules).

VAT BE0404.476.835114114
Segment reporting – income statement
Major items reported in the column ‘Reconciliation’:
a) Interest margin
- difference in mapping between the segment reporting and the consolidated income statement (2016: 8.9 million EUR –
2015: -9.6 million EUR
- elements not included in underlying earnings in the segment reporting (2016: 31.4 million EUR – 2015: 35.9 million EUR,
mainly forex results and fair value measurements)
- differences between the valuation rules of the segment reporting (based on AXA Group rules) and the consolidated income
statement (based on AXA Bank Europe rules) (2016: -3.6 million EUR – 2015: -9.9 million EUR, mainly due to a different
starting date of a cash flow hedge (effect in 2015), and the revaluation of the working capital of the Hungarian branch (effect
in 2015 and 2016))
b) Operating expenses:
- difference in mapping between the segment reporting and the consolidated income statement (2016: -3.4 million EUR –
2015: 6.4 million EUR)
- certain expenses that are not included in operating income in the segment reporting (2016: -25.0 million EUR – 2015: -15.3
million EUR)
c) Impairment on loans:
- differences in mapping between the segment reporting and the consolidated income statement (2016: -5.5 million EUR –
2015: -7.2 million EUR)
d) Taxes:
- elements not included in underlying earnings in the segment reporting (2016: -9.1 million EUR – 2015: -14.7 million EUR, tax
effects on the elements not included in underlying earnings)
- differences between the valuation rules of the segment reporting (based on AXA Group rules) and the consolidated income
statement (based on AXA Bank Europe rules) (2016: 1.0 million EUR – 2015: 4.7 million EUR, mainly due to the differed tax-
es on the differences in valuation rules).
2016
in '000 EUR
‘Retail banking
( including Treasury and
ALM)
Intermediation ReconciliationAmounts consi lidated
financial account
Interest margin (incl. commissions and realized gains) 306.985 17.172 37.615 361.772
Operating expenses -225.335 -11.238 -29.592 -266.165
Impairments -6.949 -5.897 -12.846
Taxes -6.143 -175 -9503 -15.821
Underlying earnings 68.558 5.759 -7.377 66.940
Discontinued Operations 28.395
Net income 95.335
Tabel SI.1
2015
in '000 EUR
‘Retail banking
( including Treasury and
ALM)
Intermediation ReconciliationAmounts consi lidated
financial account
Interest margin (incl. commissions and realized gains) 310.420 40.915 18.478 369.813
Operating expenses -219.738 -13.422 -11.469 -244.629
Impairments -19.562 0 -8.358 -27.920
Taxes -6.570 -588 -9.434 -16.592
Underlying earnings 64.550 26.905 -10.783 80.672
Discontinued Operations -53.444
Net income 27.228
Tabel SI.2

VAT BE0404.476.835115115
38 Related-party Transactions
Selected financial assets 122.263 4.774 462 1.489.002
Shares
Bonds
Loans 122.263 4.774 462 1.489.002
Selected financial liabilities 264 349 865.595
Deposits 264 349 102.899
Issued securities 762.695
Notional amount of granted credit lines, financial guarantees and other
guarantees9.244
Received credit lines, financial guarantees and other guarantees
Notional amount of derivatives 36.245.861
Provisions for impairment on debt instruments, guarantees and commitments
Table RPT.1
Interest received 2029 1.157.211
Interest paid 1 1.191.619
Dividends received
Commission received 213 3.266
Commission paid 3.829
Income or (-) expenses on the sale of financial assets and liabilities not at fair
value through profit or loss
Income or (-) expenses on the sale of non-financial assets
Expenses or (-) write-back of expenses during the current period concerning
amortised debt instruments, guarantees and commitments
Table RPT.2
Key management
personnelOther related parties
Parent companySubsidiaries and other
entities of the same group
Participations and jo int
ventures
Key management
personnelOther related parties
Amounts to be paid and to be received from re lated part ies
2016.12
in '000 EUR
Expenses and income resulting f rom transact ions w ith re lated parties
2016.12
in '000 EUR
Parent companySubsidiaries and other
entities of the same group
Participations and jo int
ventures
Selected financial assets 120.363 4.913 606 2.180.574
Shares
Bonds
Loans 120.363 4.913 606 2.180.574
Selected financial liabilities 383 2.274 1.223.603
Deposits 383 2.274 385.838
Issued securities 837.765
Notional amount of granted credit lines, financial guarantees and other
guarantees10.744
Received credit lines, financial guarantees and other guarantees 158.238
Notional amount of derivatives 33.556.299
Provisions for impairment on debt instruments, guarantees and commitments
Table RPT.3
Interest received 128 954.137
Interest paid 1.018.285
Dividends received
Commission received 3.618
Commission paid 3.779
Income or (-) expenses on the sale of financial assets and liabilities not at fair
value through profit or loss
Income or (-) expenses on the sale of non-financial assets
Expenses or (-) write-back of expenses during the current period concerning
amortised debt instruments, guarantees and commitments
Table RPT.4
Other related parties
Expenses and income resulting f rom transact ions w ith re lated parties
2015.12
in '000 EUR
Parent companySubsidiaries and other
entities of the same group
Participations and jo int
ventures
Key management
personnelOther related parties
Amounts to be paid and to be received from re lated part ies
2015.12
in '000 EUR
Parent companySubsidiaries and other
entities of the same group
Participations and jo int
ventures
Key management
personnel
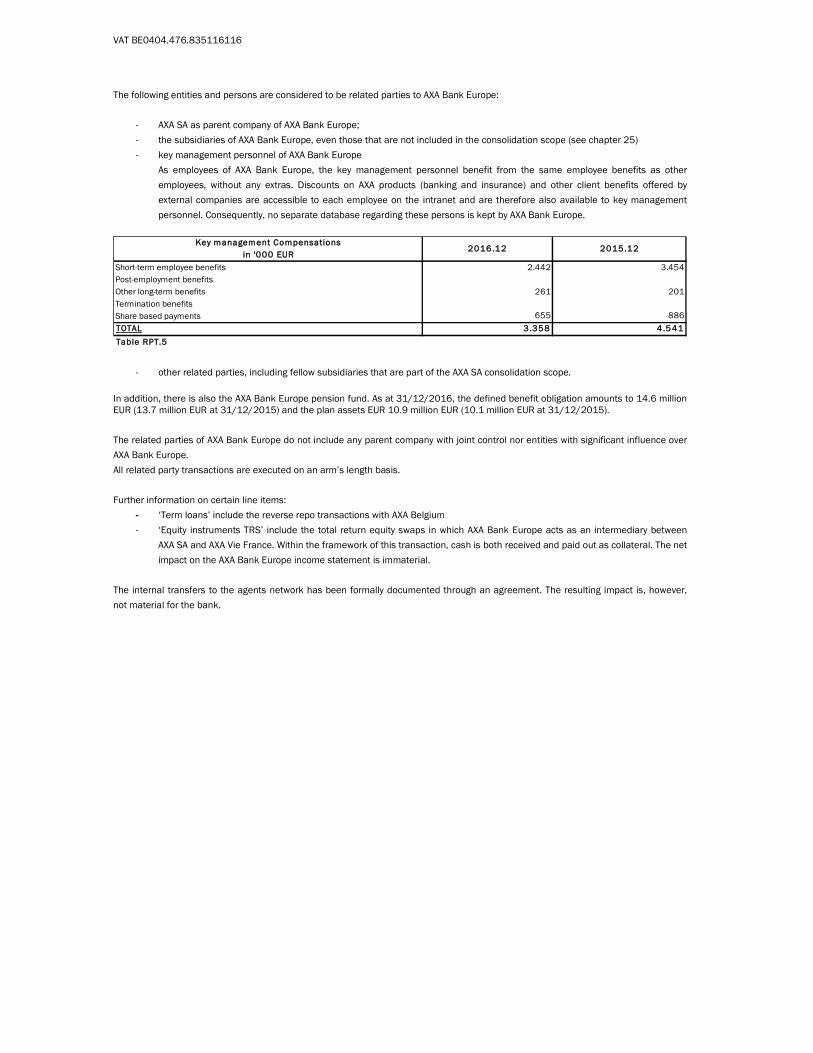
VAT BE0404.476.835116116
The following entities and persons are considered to be related parties to AXA Bank Europe:
- AXA SA as parent company of AXA Bank Europe;
- the subsidiaries of AXA Bank Europe, even those that are not included in the consolidation scope (see chapter 25)
- key management personnel of AXA Bank Europe
As employees of AXA Bank Europe, the key management personnel benefit from the same employee benefits as other
employees, without any extras. Discounts on AXA products (banking and insurance) and other client benefits offered by
external companies are accessible to each employee on the intranet and are therefore also available to key management
personnel. Consequently, no separate database regarding these persons is kept by AXA Bank Europe.
- other related parties, including fellow subsidiaries that are part of the AXA SA consolidation scope.
In addition, there is also the AXA Bank Europe pension fund. As at 31/12/2016, the defined benefit obligation amounts to 14.6 million EUR (13.7 million EUR at 31/12/2015) and the plan assets EUR 10.9 million EUR (10.1 million EUR at 31/12/2015).
The related parties of AXA Bank Europe do not include any parent company with joint control nor entities with significant influence over
AXA Bank Europe.
All related party transactions are executed on an arm’s length basis.
Further information on certain line items:
- ‘Term loans’ include the reverse repo transactions with AXA Belgium
- ‘Equity instruments TRS’ include the total return equity swaps in which AXA Bank Europe acts as an intermediary between
AXA SA and AXA Vie France. Within the framework of this transaction, cash is both received and paid out as collateral. The net
impact on the AXA Bank Europe income statement is immaterial.
The internal transfers to the agents network has been formally documented through an agreement. The resulting impact is, however,
not material for the bank.
Key management Compensations
in '000 EUR2016.12 2015.12
Short-term employee benefits 2.442 3.454
Post-employment benefits
Other long-term benefits 261 201
Termination benefits
Share based payments 655 886
TOTAL 3.358 4.541
Table RPT.5

VAT BE0404.476.835117117
39 Government Grants and Assistance
AXA Bank Europe receives structural deductions within the framework of social security. These deductions primarily involve two types:
- Structural one-off deductions calculated in compliance with the Royal Decrees of May 2003 and January 2004.
- Deductions related to the ‘older employees’ target group (above the age of 57).
The amounts thus established totalled approximately 2.3 million EUR and 0.2 million EUR

VAT BE0404.476.835118118
40 Financial Relationships with Auditors
Carrying amount
in '000 EUR2016.12 2015.12
PWC PWC
Remuneration of the auditors 454 515
Remuneration for exceptional activities or
special commissions performed within the company
by the auditors
Other audit activities 130 115
Advisory activities
Other activities outside audit activities 0 0
Remuneration of persons with wich the auditors:
are connected to the excercise of a mandate 69 52
on the level of the group of which the company that publishes the information
at the head
Remunaration for exceptional or special commissions performed within the company
by persins associated with the auditors
Other audit activities 6 8
Taks advice 0 0
Other activities outsiede audit activities 2 8
Table FRWA.1

VAT BE0404.476.835119119
41 Discontinued Operations
The management of AXA Bank Europe has reached its target by completing the transfer of the Hungarian activities of the bank to OTP,
the largest Hungarian bank. This sale constitutes the final step of the repositioning of AXA Bank Europe as a retail bank, 100% oriented
to the Belgian market.
The sale to OTP covers all the Hungarian activities of AXA Bank Europe, including the credit and deposit portfolios and operational
systems. In Belgium, the sale had no impact on employees. In Hungary, all the employment contracts were transferred to the buyer.
Compared to the provision at end 2015, the Hungarian activity generated a positive impact on the AXA Bank Europe’s 2016 income
statement.
Consolidated income statement
in '000 EUR2016.12 2015.12
Discontinued operations
Financial & operating income and expenses -31.481 41.567
Interest income 23.029 52.511
(Interest expense) 10.531 17.696
Expenses on share capital repayable in demand
Dividend income
Fee and commission income 4.667 6.513
(Fee and commission expenses) 3.246 1.807
Realised gains (losses) on financial assets & liabilities not measured at fair value through profit or loss, net 7.644 319
Gains (losses) on financial assets and liabilities held for trading (net) -53.865 61.132
Gains (losses) on financial assets and liabilities designated at fair value through profit or loss (net)
Gains (losses) from hedge accounting
Exchange differences, net 436 -89.804
Gains (losses) on derecognition of assets other than held for sale, net -458 -26
Other operating net income 842 30.425
Administration costs 24.281 27.414
Depreciation 824 1.047
Provisions -467 -109.485
Impairment losses on financial assets not measured at fair vaue through profit or loss -83.359 98.614
Impairment losses on property, plant and equipment 266
Impairment losses on financial assets not measured at fair vaue through profit or loss resulting to discontinued
operations 76.808
Taks expense (income) related to profit or loss from discontinued opertions -1.422 612
TOTAL PROFIT OR LOSS AFTER TAX FROM DISCONTINUED OPERATIONS 28.396 -53.444

VAT BE0404.476.835120120
42 Events After the Balance Sheet Date
There have been no material events after the balance sheet date that would require adjustments to the 2016 IFRS Consolidated Finan-
cial Statements of AXA Bank Europe.

VAT BE0404.476.835121121
Board of Directors
Peter Devlies (since 2 March 2017)
Jef Van In, chairman (since 28 March 2017)
Sabine De Rycker
Françoise Gilles
Jeroen Ghysel
Marie-Cécile Plessix
Patrick Lemoine
Emmanuel Vercoustre
Marc Bellis (*)
Patrick Keusters (*)
Philippe Rucheton (*)
Frank Goossens (since 22 November 2016)
Jacques de Vaucleroy, chairman (until 30 June 2016)
Céline Dupont (until 13 July 2016)
Frank Koster (until 13 July 2016)
Management Committee
Peter Devlies, chairman (since 2 March 2017)
Sabine De Rycker
Françoise Gilles
Jeroen Ghysel
Emmanuel Vercoustre, chairman (since 27 July 2016 – until 2 March 2017)
Frank Goossens (since 22 November 2016)
Jef Van In, chairman (until 27 July 2016)
Céline Dupont (until 13 July 2016)
Audit Committee
Patrick Keusters, chairman (*) (since 4 February 2016)
Philippe Rucheton, (*)
Patrick Lemoine
Nomination Committee
Jef Van In, chairman (since 28 March 2017)
Marc Bellis (*)
Jacques de Vaucleroy, chairman (until 30 June 2016)
Frank Koster (until 13 July 2016)
Remuneration Committee
Jef Van In, chairman (since 28 March 2017)
Marc Bellis (*)
Jacques de Vaucleroy, chairman (until 30 June 2016)
Frank Koster (until 13 July 2016)
Risk Committee
Philippe Rucheton (*) (chairman)
Patrick Lemoine
Patrick Keusters (*) (since 1 January 2016)
Statutory Auditor
PwC, Auditors, bcvba, represented by Tom Meuleman (licenced auditor)
(*) independent director, according to art 526 Company Code

Free Translation
AXA BANK EUROPE NV Statutory auditor's report to the general shareholders’ meeting on the consolidated financial statements for the year ended 31 December 2016 6 April 2017

PwC Bedrijfsrevisoren cvba, burgerlijke vennootschap met handelsvorm - PwC Reviseurs d'Entreprises scrl, société civile à forme commerciale - Financial Assurance Services Maatschappelijke zetel/Siège social: Woluwe Garden, Woluwedal 18, B-1932 Sint-Stevens-Woluwe T: +32 (0)2 710 4211, F: +32 (0)2 710 4299, www.pwc.com BTW/TVA BE 0429.501.944 / RPR Brussel - RPM Bruxelles / ING BE43 3101 3811 9501 - BIC BBRUBEBB / BELFIUS BE92 0689 0408 8123 - BIC GKCC BEBB
Free Translation
This document is a free translation of the report issued by PwC Bedrijfsrevisoren/PwC Reviseurs d’Entreprises bcvba/sccrl in the Dutch and French language on 6 April 2017 on the consolidated financial statements of AXA Bank Europe NV (prepared in the Dutch and French language). The audited consolidated financial statements of AXA Bank Europe NV and the accompanying auditor’s report will be deposited and will be available at the National Bank of Belgium (www.nbb.be). The accompanying free translation of the consolidated financial statements has not been audited by PwC Bedrijfsrevisoren/PwC Reviseurs d’Entreprises bcvba/sccrl, so we are therefore only liable in the context of our audit report originally drafted in the Dutch and French language.
STATUTORY AUDITOR'S REPORT TO THE GENERAL SHAREHOLDERS’ MEETING OF THE COMPANY AXA BANK EUROPE NV ON THE CONSOLIDATED FINANCIAL STATEMENTS FOR THE YEAR ENDED 31 DECEMBER 2016
In accordance with the legal requirements, we report to you in the context of our statutory auditor’s mandate. This report includes our opinion on the consolidated financial statements, as well as the required additional statement. The consolidated financial statements comprise the consolidated balance sheet as at 31 December 2016 and the consolidated income statement, statement of changes in equity and cash flow statement for the year then ended, and notes, comprising a summary of significant accounting policies and other explanatory information. Report on the consolidated financial statements – Unqualified opinion We have audited the consolidated financial statements of AXA Bank Europe NV (“the Company”) and its subsidiaries (jointly “the Group”) for the year ended 31 December 2016, prepared in accordance with International Financial Reporting Standards (IFRS) as adopted by the European Union, and with the legal and regulatory requirements applicable in Belgium. The total of the consolidated balance sheet amounts to EUR ‘000’ 27.994.508 and the consolidated income statement shows a profit for the year of EUR ‘000’ 95.335. Board of directors’ responsibility for the preparation of the consolidated financial statements The board of directors is responsible for the preparation and fair presentation of these consolidated financial statements in accordance with International Financial Reporting Standards (IFRS) as adopted by the European Union, and with the legal and regulatory requirements applicable in Belgium, and for such internal control as the board of directors determines, is necessary to enable the preparation of consolidated financial statements that are free from material misstatement, whether due to fraud or error. Statutory auditor’s responsibility Our responsibility is to express an opinion on these consolidated financial statements based on our audit. We conducted our audit in accordance with International Standards on Auditing (ISAs), as endorsed in Belgium. Those standards require that we comply with ethical requirements and plan and perform the audit to obtain reasonable assurance about whether the consolidated financial statements are free from material misstatement.

2
An audit involves performing procedures to obtain audit evidence about the amounts and disclosures in the consolidated financial statements. The procedures selected depend on the statutory auditor’s judgment, including the assessment of the risks of material misstatement of the consolidated financial statements, whether due to fraud or error. In making those risk assessments, the statutory auditor considers internal control relevant to the Group’s preparation and fair presentation of the consolidated financial statements in order to design audit procedures that are appropriate in the circumstances, but not for the purpose of expressing an opinion on the effectiveness of the Group’s internal control. An audit also includes evaluating the appropriateness of accounting policies used and the reasonableness of accounting estimates made by the board of directors, as well as evaluating the overall presentation of the consolidated financial statements. We have obtained from the board of directors and the Company’s officials the explanations and information necessary for performing our audit. We believe that the audit evidence we have obtained is sufficient and appropriate to provide a basis for our opinion. Unqualified Opinion In our opinion, the consolidated financial statements give a true and fair view of the Group’s net equity and consolidated balance sheet as at 31 December 2016 and of its consolidated income statement and its consolidated cash flow statement for the year then ended in accordance with International Financial Reporting Standards (IFRS) as adopted by the European Union, and with the legal and regulatory requirements applicable in Belgium. Report on other legal and regulatory requirements The board of directors is responsible for the preparation and the content of the directors’ report on the consolidated financial statements. In the context of our mandate and in accordance with the Belgian standard which is complementary to the International Standards on Auditing (ISAs) as applicable in Belgium, our responsibility is to verify, in all material respects, compliance with certain legal and regulatory requirements. On this basis, we provide the following additional statement which does not impact our opinion on the consolidated financial statements:
The directors’ report on the consolidated financial statements includes the information required by law, is consistent with the consolidated financial statements and does not present any material inconsistencies with the information that we became aware of during the performance of our mandate.
Sint-Stevens-Woluwe, 6 April 2017 The statutory auditor PwC Bedrijfsrevisoren bcvba represented by Tom Meuleman Accredited auditor