Embed Size (px)
Citation preview
Management Systems and Price Risk Management in multi-site Dairy Operations
A report for
Paul Niven 2014 Nuffield Scholar
January 2016 Nuffield Australia Project No 1420
Sponsored by:
© 2016 Nuffield Australia. All rights reserved. This publication has been prepared in good faith on the basis of information available at the date of publication without any independent verification. Nuffield Australia does not guarantee or warrant the accuracy, reliability, completeness of currency of the information in this publication nor its usefulness in achieving any purpose. Readers are responsible for assessing the relevance and accuracy of the content of this publication. Nuffield Australia will not be liable for any loss, damage, cost or expense incurred or arising by reason of any person using or relying on the information in this publication. Products may be identified by proprietary or trade names to help readers identify particular types of products but this is not, and is not intended to be, an endorsement or recommendation of any product or manufacturer referred to. Other products may perform as well or better than those specifically referred to. This publication is copyright. However, Nuffield Australia encourages wide dissemination of its research, providing the organisation is clearly acknowledged. For any enquiries concerning reproduction or acknowledgement contact the Publications Manager on ph: (03) 54800755. Scholar Contact Details Paul Gerard Niven Hub Director Falcon Dairy Holdings Limited Unit 507 -509 Tower C2, Oriental Plaza Beijing 100738, China Phone: +86 138 1041 2282 Fax: +86 10 5952 0501 Email: [email protected]
In submitting this report, the Scholar has agreed to Nuffield Australia publishing this material in its edited form. NUFFIELD AUSTRALIA Contact Details Nuffield Australia Telephone: (03) 54800755 Facsimile: (03) 54800233 Mobile: 0412696076 Email: [email protected] 586 Moama NSW 2731
iii
Executive Summary Largescaledairybusinessesthroughouttheworldmonitorandmanagethemarginbetween
theinputsandoutputsfromthebusiness.Inordertodothis,theyneedrealtimedatafor
both physical and financial parameters so that the people who are working at the
operational,tacticalandstrategiclevelscanmakeinformedandtimelydecisions.
ThisstudyfocusedonNewZealandandtheUnitedStatesofAmerica(USA).Thepurposeof
visiting these countries was to see large dairy businesses that cover the range of dairy
productionsystemsfromfullypasturefedtofullyconfined.NewZealandproducesabout20
billionlitresofmilkandexports95%oftotalproduction;themajorityoffarmsarepasture
based. TheUSAdairy industryproducesaround85billion litresofmilkandexportsabout
15%.Themajorityoffarmshavefreestalledcowsfedonatotalmixedration(TMR).
Within both countries, there are many large businesses that manage multi-site farming
operations.IntheUSA,onebusinesshad60,000milkingcowsoneightfarms(intwostates)
andhadhadyoungstock infourstates. InNewZealand,thegovernmentownedbusiness
Landcorphad59farmsfromthetopoftheNorthIslandtothebottomoftheSouthIsland
andhadpeakcownumbersof55,000. Thesebusinesses,andallbusinessesvisited,made
useofcommerciallyavailablesoftwareandhardwaresystemstomanagedifferentpartsof
the total business such as cows, feeding and financials. Many of the large New Zealand
businesseshaddevelopedtheirownwaysof linkingthesemanyprograms intoaportalso
people at all levels ofmanagement could access the informationneeded froma common
source. However,allthebusinessesthathaddonethishadinternaldedicatedhumanand
financialresourcestocollateandsupportthisinformation.Furthermore,externalsuppliers
(offarminputssuchasfertiliser,fertiliserspreading,semenandartificialinsemination(AI))
hadbuilttheirownsystems,whichwereusedextensivelybycorporatefarmers.
The context ofmilk pricing and price riskmanagement forNew Zealand and theUSA are
substantiallydifferent.Therearefederalgovernmentmarginprotectionmechanismsinthe
USA, whereas New Zealand has no price support to the farmer. The percentage of the
nationalmilkpoolthatisexportedfromeachcountryalsoaffectstheexposuretochangesin
worldpricesofdairycommodities,withNewZealandveryexposed.Duetothesediffering
contexts,approachtopriceriskandincreasingordecreasingproductionrelativetomilkand
iv
other commodity prices vary between the countries. The majority of New Zealand
businesses focus on being “a low cost producer”,with very fewbusinesses using forward
pricingorhedgingtools(andonlyafewtoolsareavailable).Incomparison,adairyfarmerin
the USA has many and varied tools available to manage price risk. Most large dairy
businesses had a dedicated person monitoring a variety of input (feed) prices and milk
prices,andselling,buyingortakingfuturepricepositionsonmilkandorfeed.
Therearemanymanagement systemsavailable formeasuringandmanaging thedifferent
partsof thedairybusiness,butas yet,nothing is commerciallyavailable thatbrings these
differentsystemstogether. Forall systems, Internetaccess inNewZealand,Australiaand
partsoftheUSAis impairingtherolloutandutilisationofthesesystemsfordatacollation
anduse.Asoftwarebusinesshastheopportunitytodevelopatoolthatlinksthekeytools
usedby farmers. Largeand corporatedairybusinesses arebuilding their own systemsas
theyhaveconcludedthatacentralportal,andthelinkingofsystemshavebenefitsfortheir
business. However,businessesthat implementanyanimal, feed,financialorothersystem
mustputsufficientresource(time,humanandfinancial)toimplementandthensupportthe
system.
Thedebatesandviewsoftherelativemeritsofeachfarmingsystem(from100%pastureto
100%TMR)inAustraliaandNewZealandhavebeenwellresearchedanddocumented.The
key finding is that the differences in median profits achieved between farms using low/
moderate or high concentrate feeding are small compared with the variability in profit
withineachconcentratefeedinglevel.Thissuggeststhatthefarmercanchooseanysystem
and gain similar returns, provided they have the required skills and the standard of
management is high. Therefore, the farmer, whether a small family business or a large
corporate business with multiple sites and tens of thousands of cows must know their
farmingsystemintimately. Theyneedtounderstand,measure,monitorandmanagetheir
keyphysicalandfinancialmetricsregularly,withafocusonleadindicators.Theymustalso
haveclearlydefineddecision-makingpointsforinputcosts(feed,fertiliser,energy)andmilk,
and documented action plans. They also need to evaluate and understand the price risk
managementtoolsavailabletothem,andestablishaframeworkorbusinessphilosophyon
theiruse.
v
Table of Contents ExecutiveSummary........................................................................................................................iiiTableofContents............................................................................................................................vForeword......................................................................................................................................viiAcknowledgments..........................................................................................................................ixAbbreviations.................................................................................................................................xiObjectives.....................................................................................................................................13Chapter1:IntroductionandContext.............................................................................................14
1.1TheVanDiemen’s’LandCompany..............................................................................................141.2TheVDLdairyfarmingsystem.....................................................................................................141.3Makingchangeforvariationincommodityprices(milkandfeedcosts)....................................15
Chapter2AnimalandFarmManagementSystems........................................................................172.1Literaturereview.........................................................................................................................172.2 NewZealand............................................................................................................................17
2.2.1 Livestock Improvement Corporation ................................................................................ 182.3.2 Landcorp ............................................................................................................................... 212.3.3 Craigmore Sustainables ........................................................................................................ 242.3.4 Pye Group ............................................................................................................................. 252.3.5 Dairy Holdings ...................................................................................................................... 262.3.6 MyFarm ............................................................................................................................. 29
2.4 China........................................................................................................................................312.5USA..............................................................................................................................................32
2.5.1 Fernandes Brothers ............................................................................................................... 322.5.2 Observations from other dairy farms in the USA ................................................................. 34
2.6Limitationsofthestudy...............................................................................................................35Chapter3Managingriskandchanginginputandoutputprices.....................................................36
3.1Context:VDL................................................................................................................................363.2Literaturereview.........................................................................................................................36
3.2.1 TasMilk 60 Study ................................................................................................................. 363.2.2 New Zealand ......................................................................................................................... 373.2.3 Global warming .................................................................................................................... 38
3.3NewZealand................................................................................................................................393.3.1 Landcorp ............................................................................................................................... 393.3.2 Pye Group .......................................................................................................................... 413.3.3 Dairy Holdings .................................................................................................................. 423.3.4 MyFarm ............................................................................................................................. 44
3.4USAFarmBusinessVisits.............................................................................................................453.4.1 Federal margin protection tools for US Dairy Farmers ........................................................ 453.4.2 Bidart Dairies, California ...................................................................................................... 473.4.3 Fernandes Brothers, California ............................................................................................. 473.4.4 Redtop Dairy, California ...................................................................................................... 493.4.5 Noblehurst Farms, New York State ...................................................................................... 513.4.6 United Dairies, Minnesota .................................................................................................... 543.4.7 Riverview, Minnesota ........................................................................................................... 56
3.5USABrokersandMarkets............................................................................................................593.5.1 INTL FC Stone ..................................................................................................................... 593.5.2 Rice Dairy ............................................................................................................................. 60
3.6Limitationsofthestudy...............................................................................................................61Chapter4Conclusions...................................................................................................................62
4.1FarmManagementSystems........................................................................................................624.2PriceRiskManagement...............................................................................................................62
Chapter5Recommendations........................................................................................................65
vi
5.1RecommendationsforFarmManagementSystems...................................................................655.2RecommendationsforPriceRiskManagement..........................................................................66
References....................................................................................................................................68PlainEnglishCompendiumSummary.............................................................................................70
vii
Foreword WhenI lefthighschool,all Iwantedtodowasworkinthesheepindustry. Now,23years
later,allIwanttodoisstayinthedairyindustry.BeingawardedaNuffieldScholarshiphas
transformed my life. I have been able to meet and learn from numerous passionate,
intelligentandcommittedpeople.Iamverygratefulforthisopportunity.
Afterfouryearsoutsideagriculture,IjoinedtheVanDiemen’sLand(VDL)CompanyinMarch
2011asBusinessManager-Dairy.Atthattime,VDLhad23farms,milked17,000cowsand
produced5millionkilogramsofmilk solids. Itwasavery steep learningcurve,and Iwas
very lucky tohaveagood team, including thevery knowledgeableandhardworkingHugo
Avery. With theVDLDairyOperations team,we set aboutdeveloping, implementingand
refining the management systems for the people, cows, inputs and assets to measure,
monitorandmanagethebusiness.
As the business developed more systems, the management team developed a greater
understanding of the key profit drivers within the business. As with many farming
businesses,wewereexposedtovariationsinrainfallandcommodityprices.Ourchallenge
wastounderstandandadjusttheriskprofileofthebusiness.Ourobjectivewastomakethe
business flexible to react toboth increasinganddecreasingmilkprice, and increasingand
decreasinginputprices.
WhenAnthonyBrandsema(2006Scholar)suggestedtomeIapplyforaNuffieldScholarship
inJune2013,IwasunsuccessfulinconvincinghimthatIwastoobusy.Atthattime,wehad
just built our second new dairy conversion, were in a capital raising program and the
businesshadjustcomeoffaconsiderableloss.Sure,Ihadtime!
Inourdiscussion,Anthonyencouragedme to think aboutwhat I could learnby travelling
abroad. Very relevant to my situation was gaining an understanding of how other
businesses managed multiple site animal operations and adjusted their businesses to
changesincommodityprices.Thisreportoutlinesmyfindings.
viii
InDecember2014,theDirectorsofVDLmademyroleredundant,andIleftthebusinessin
March 2015. VDL are on track to produce over 7.4million kilograms ofmilk solids from
20,000cowson25farms,anddeliverthesecondconsecutiveyearofprofit.
Everycountryhasadifferentoperatingcontext.Thevariablesthatneedtobemanagedand
controlled are different in every country and often different in regions of countries.
However,theprinciplestoidentifyandaddressthesebusinesschallengesarethesame.Itis
withthisworldview,thatIwillmovetoChinainApril2015toleadthedevelopmentofnew
dairyfarms.Iamlookingforwardtothenextchapterofmylife.
ix
Acknowledgments
The generosity and support ofmanypeoplemademyNuffield experience a fantastic and
rewardingone.
IamverythankfultoAnthonyBrandsema,NuffieldScholarfromTurner’sBeachinTasmania
whoencouragedme(andtwistedmyarm)toapply.Withouthispersistence,thiswouldnot
havehappened.
To theothernineScholarsof the India2014GlobalFocusProgram- Ienjoyedour journey
andnowhavefriendsthroughouttheworld
WithintheUSA,thegenuineandfriendlyoffersofassistanceweregreat. Someofthekey
peoplewhohelpedarrangemytripsincludedRobertCheslerfromFCStone,TrevorSlegers
andBrianRicefromRiceDairyandMarkDoornickfromValleyAgSoftware.Aspecialthanks
toCharliePerottiandEddieOrmondeforhostingmeinCalifornia,MaryLedmanforopening
herhometoacompletestrangerandLarryvandeValk,andAnnandTomShepardfortheir
assistanceinNewYorkstate.
In New Zealand, Greg Hamill and Garth Stearn from LIC arranged a fantastic trip and
connectedmewithmanykeypeople.LouiseCook,MatthewJohnsonandMarkJulianfrom
Landcorpwere both generouswith their time and information sharing. Colin Glass from
DairyHoldingswasveryopenabouthowtheyoperateandmanagetheirbusiness. Itwas
greattocatchupwithformercolleaguesErinO’ConnerandLauraJohnstonwhoweregreat
hostsandhelpedmakeconnections.
Thepeople in theengineroomofNuffieldalsohelpedconsiderably throughout thewhole
Nuffieldexperience.Forme,thiswasJimGeltch,TerryHehirandJaneBennett.
x
Oursponsors, inmycaseDairyAustralia, investheavilyintheNuffieldprogram. Aspecial
thanks to IanHalliday,ShaneHellwedgeandBernieBaxter for their support, contactsand
encouragement.
Lastly,andmostimportantly,thankyoutomyfantasticwifeAliceandchildrenLachie,Darcy,
AdelaideandTed. Thanksforallthesmiles,FaceTimecallsandhostingwhatwehopeisa
regularflowofvisitingNuffieldScholarsfromaroundtheworld.
xi
Abbreviations AI Artificialinsemination
APC Averagepasturecover
BST
BW
Bovinesomatotropin
Breedingworth(NewZealand)
CCTV
CEO
CFO
Closedcircuittelevision
ChiefExecutiveOfficer
ChiefFinancialOfficer
CME ChicagoMercantileExchange
DAL
DC305
DairyAutomationLimited(NewZealand)
DairyComp305
DFA
DM
DairyFarmersofAmerica
Drymatter(expressedasapercentageofthetotalweight)
DPR
EBIT
EBITDA
Dairyproductionreporting(Landcorp,NewZealand)
Earningsbeforeinterestandtax
Earningsbeforeinterestandtax,depreciationandamortisation
EID
FCE
FMS
FY
GIS
Electronicidentification
Feedconversionefficiency
Farmmanagementsystem(Landcorp,NewZealand)
Financialyear
Geographicinformationsystem
GPS Globalpositioningsystem
Ha Hectare
IRMP
Kg
KPI
lb
LIC
ML
IntegratedRiskManagementProgram
Kilogram
Keyperformanceindicator
Pound(weight)
LivestockImprovementCorporation(NewZealand)
Megalitre
xii
MOFC Marginoverfeedcosts
MPP Marginprotectionprogram(USA)
NAIT NationalAnimalIdentificationandTracing(NewZealand)
NLIS
NZD
NationalLivestockIdentificationScheme(Australia)
NewZealanddollar
P&L Profitandloss
PKE Palmkernelextract
PMR Partialmixedration
PW Productionworth(NewZealand)
RFID
ROA
ROE
Radiofrequencyidentificationdevice
Returnonassets
Returnonequity
SCC
SMP
TMR
Somaticcellcount
Skimmilkpowder
Totalmixedration
TOP
T4C
USA
USD
VAS
Traitsotherthanproduction(NewZealand)
TimeforCows(Lely)
UnitedStatesofAmerica
UnitedStatesofAmericadollar
ValleyAgSoftware
VDL TheVanDiemen’sLandCompany
13
Objectives
Theobjectivesofthisstudywereto:
• Understandhowlargeagriculturalbusinesshavetheright information inthehands
oftherightpeopleattherighttimetomakechangetoabusiness
• Understandthemanagementsystemsusedtomanagemultiplesitedairybusinesses
• Understand how businesses measure, monitor and manage changes in input and
outputpricing
• Understandhowbusinessesare setup toadjustor changewhen inputandoutput
pricingchanges
Theaimofansweringthesequestionswastodevelopandimplementabusiness-widetool
for VDL to monitor the physical and financial performance of each farm, and adjust the
farming business depending on commodity prices. However, this piece of work is also
relevanttoothermultiplesitebusinesses. It isalsorelevanttoalldairybusinesses. Every
businessneedstoknowhowchangesininputandoutputpricingaffectprofitabilityandhow
thebusinesscanchangeinresponse.
14
Chapter 1: Introduction and Context 1.1 The Van Diemen’s’ Land Company
TheVanDiemen’s LandCompanywas formed in London inMay1824by a groupofmen
closelyconnectedwiththewoolandtextiletrades(Pink,2003).Theyweregranted350,000
acres of Van Diemen’s Land (renamed Tasmania in 1856) under Royal Charter for the
“cultivationandimprovementofwastelandsinhisMajesty’sislandofVanDiemen’sLand”.
VDL is Australia’s second oldest company, and the only one to still own and operate
farmlandthatwaspartoftheoriginallandgrant(Pink,2003).
In2008,theinvestmentarmoftheNewPlymouthDistrictCouncil(inNewZealand)became
themajorityShareholder(74.33%)inVDL.Theybroughtnewcapital intothebusinessand
soughttoimprovethephysicalstateoftheassetandthefinancialreturnofthebusiness.In
2008,thebusinesscomprisedof23farms,14,200dairycows,excludingreplacements,with
anaggregatedproductionof3.4millionkilogramsofmilksolidsfortheyearending31stMay
2008.Thebusinessreportedearningsbeforeinterestandtax,depreciationandamortisation
(EBITDA)of$4.6mwiththefarmgatepriceof$6.46.
1.2 The VDL dairy farming system
Eachfarmhasasetamountof land. Thereforethekeyobjectiveofapasturebaseddairy
system is to grow and utilise as much feed as possible, per unit of land, as cheaply as
possible.Thenextstepistothenmatchascloselyaspossibletheavailability(growth)with
thedemand(calvingtimeandstageoflactation).Refiningandimplementingthisphilosophy
hasledtothecurrentsystems:autumncalvingsystemonmostofWoolnorth(summerdry)
andspringcalvingonmostoffWoolnorth farms(verywet inwinter-averaging120mmin
eachofJune,July,AugustandSeptember).
At the start of 2012, VDL had 13,500 autumn calving cows and 6,500 spring calving cows
across24 farms. All farms (exceptone)atWoolnorthwereautumncalving (plusone that
wassplit-autumnandspring).TheoffWoolnorthfarmswereallspringcalving(fromAugust
onwards)andonewassplit(autumnandspring).
15
Over the preceding six years, there has been a comprehensive program to increase grass
productiononVDL farms. In termsof priorities, the approachhasbeen taken to address
drainage,soilpH,phosphorous(andpotassiumandsulphur) levels,andthengrassspecies.
Thishasbeen implementedasaprogramof re-grassingabout10%ofeach farmannually.
Novelentophyte,longseasonperennialryegrassesaresownintheautumn,andreachfull
productionintwelvemonths.
TheVDLphilosophyistogrowasmuchaspossiblewhentheconditionsarefavourable.This
means that in the spring, we aim to grow and harvest asmuch surplus as possible. This
conservedfodderisthenfedoutinthefeedgaps.Inthespringcalvingsystem,thesurplusis
harvestedandfedoutinthesummerandautumn.Intheautumncalvingsystem,thesilage
isfedintheautumnandwintertofillthefeedgap.
Withall thesemanagementpractices,wearenow ina repeatable, sustainableproduction
systemtogrowasmuchfodderaswecanforthe leastcost. There isnowopportunityto
furtherrefinethedifferentfeedoptionsbyanalysinghistoricalcostsovermultipleseasons.
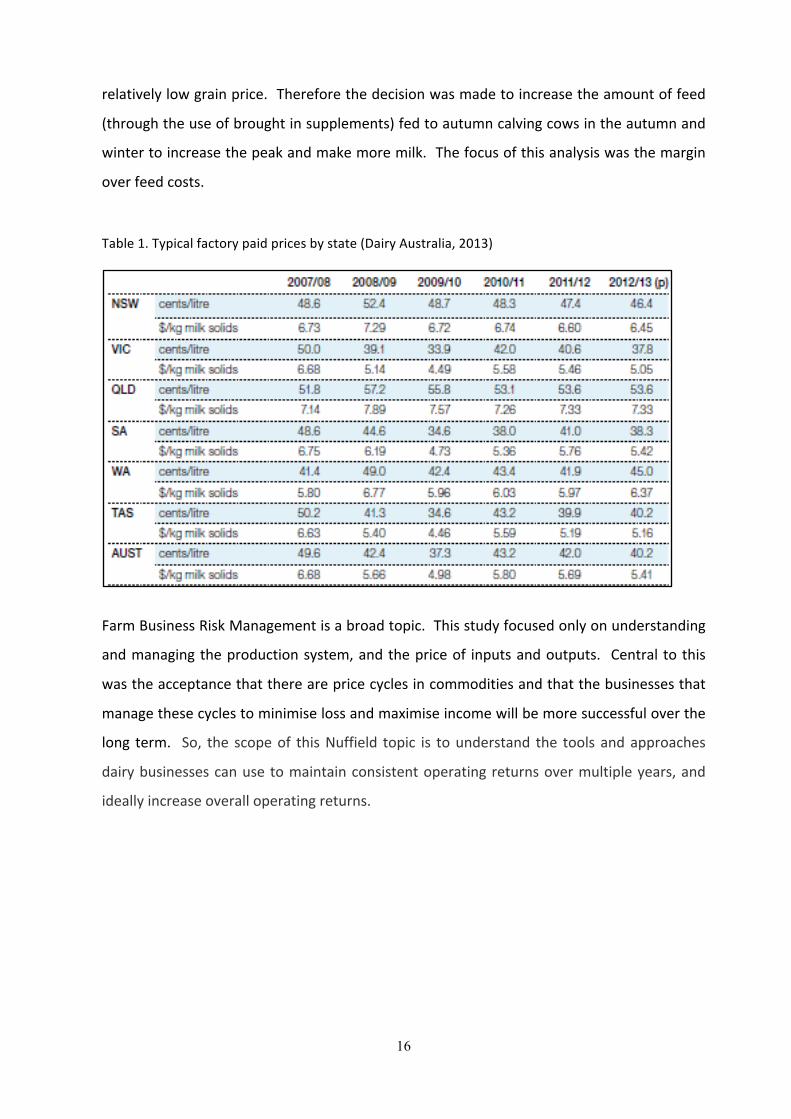
1.3 Making change for variation in commodity prices (milk and feed costs)
Withthisbasemodelunderstoodandstable, thebusinessnowhastheflexibility toadjust
stocking rates and brought-in feed to capitalise on increased milk prices. Milk price
fluctuatesbetweenyears(asshowninTable1).Thisiswithinacontextthatmostcostson
the farm are relatively fixed - labour, shed costs, repairs andmaintenance, fertiliser, and
pasture renewal. Adjusting cow numbers and additional feed affects feed costs, animal
healthandbreeding,andwithlargechangesincownumbers,alsolabour.
Thisoverarchingsituationhasnowbeenwellunderstoodwithinthebusinessfor18months.
This knowledge was applied in November 2013 to January 2014, to plan for the autumn
herd.VDLhadthesituationwhereweknewwewereinahighmilkpriceperiodandhada
16
relativelylowgrainprice.Thereforethedecisionwasmadetoincreasetheamountoffeed
(throughtheuseofbroughtinsupplements)fedtoautumncalvingcowsintheautumnand
wintertoincreasethepeakandmakemoremilk.Thefocusofthisanalysiswasthemargin
overfeedcosts.
Table1.Typicalfactorypaidpricesbystate(DairyAustralia,2013)
FarmBusinessRiskManagementisabroadtopic.Thisstudyfocusedonlyonunderstanding
andmanagingtheproductionsystem,andthepriceof inputsandoutputs. Central tothis
wastheacceptancethattherearepricecyclesincommoditiesandthatthebusinessesthat
managethesecyclestominimiselossandmaximiseincomewillbemoresuccessfuloverthe
long term. So, the scopeof thisNuffield topic is tounderstand the tools andapproaches
dairybusinessescanusetomaintainconsistentoperatingreturnsovermultipleyears,and
ideallyincreaseoveralloperatingreturns.
17
Chapter 2 Animal and Farm Management Systems 2.1 Literature review
Theliteratureisrelativelysparsewithpapersthatgivebothasummaryandcomparisonof
farm management software available to dairy farmers. It is easy to find promotional
materialformanyandvariedprogramsfromaroundtheworld.However,AllenandWolfert
(2012) completed a comprehensive stocktake of farmmanagement tools used by farmers
andruralprofessionalsinNewZealand.Theyfoundthatthetoolsavailableandusedwere
mostlyforstock,feedandfinancial,andwereunderrepresentedintheareasofnutrientand
labourmanagement. They foundthat thegeneral feelingwas that theavailabilityof farm
managementtoolswasnotthelimitingfactortofarmproductivity.
Theirstudyfoundthattheinterconnectivityofdifferenttoolsandthespeedandavailability
ofInternetconnectionswerebothconsiderableissues.Thesetwoissuesleadtopoortime
efficiency due to data being entered into multiple tools and waiting for uploads and
downloads.Ofparticularinterest,AllenandWolfert(2012)identifiedthatgoodinformation
systemsshouldoperateattheoperational,tacticalandstrategiclevels.Theylinkedtheseto
planning horizon, and defined the periods as: strategic (planning/ monitoring between
years);tactical(planningandmonitoringwithinayear);andoperational(daily/weeklyuse).
This observation is particularly relevant for a multi-site business and a corporate model
where different layers in an organisation are accountable for different information and
decisions,butneedtobereviewingthesamedataset.
2.2 New Zealand
NewZealandwasvisited inFebruary2015,ata timewhenmilkpriceshadalmosthalved:
from$8.40forthe2013-14season(arecordhigh)to$4.70forthe2014-15season.Bythe
end of the season, it had dropped further to $4.40. This coupled with a “drought” (the
definition and criteria for a drought inNew Zealand is different toAustralia),meantNew
Zealanddairyfarmerswereseriouslyreviewinginputcostsandincome.
18
NewZealandproduced20.7billion litresofmilk in2013/14,an increaseof10.1%overthe
previous year and was at a record production level (Dairy NZ, 2014). There were
approximately12,000dairy farms,withanationalherdof4.92millioncows. Seventyfour
percentofherdsand60%ofcowsareontheNorthIsland,with24%ofcowsintheWaikato
and13%inCanterbury.
NewZealandexportsaround90to95%ofproduction.Thecooperative,Fonterra,purchases
around75%ofallmilk.Thisapproachseemstobeworking,butdoesexposeNewZealand
farmers (and Fonterra) to massive swings in commodity prices (such as those being
experienced between 2013-14 and 2014-15). The one advantage of Fonterra is that the
farmersdohaveafactorytosendtheirmilk.Thismayseemasimplestatementbutisvery
importantwhenmilkpricedropsandglobalpurchaserscancelsupplyagreements.
2.2.1 LivestockImprovementCorporation
LivestockImprovementCorporation(LIC)isoneoftheoldestfarmingco-operativesinNew
Zealand.ThekeyobjectiveofLIChasbeen to improve theproductivityandprofitabilityof
the New Zealand Dairy herd. Today, they provide herd recording services (milk testing),
liquid (fresh) and frozen semen, DNA technology to genomically identify and select elite
sires,andashortgestationbullteambredtodeliveroffspringanaveragetendaysearly.To
manageandcollateallthisinformation,theyhaveacomprehensivecowdatabasethatthe
majority(85%ormore)ofNewZealanddairyfarmersuse.ThisprogramiscalledMinda.
MindacollatesallthecowinformationfromacrossNewZealandintoonecentraldatabase.
Each individual farmer has their own set ofMinda records,which they access tomanage
their herd. This is usually done with a desktop computer in the dairy or house. All
informationthensynchronisesbacktotheLICdatabase.Therearealsohandhelddevices,
whichrunMindaMobile.LICrunaherdtestingserviceandthisinformationisenteredinto
Minda.Together,thisinformationisusedtocreatebreedingworth(BW)foracow.There
are 46 core fields set by the herd testing standards,which includedmating dates, calving
19
dates,milkquality,pedigreeandanadditional140fieldsforanimalevaluationoftraitsother
thanproduction (TOP). To implement this system inAustraliaoranyothercountry, there
wouldneedtobeanalignmentofthedefinitionsofthetraits. Farmerscanaddindividual
cow information (health treatments and events). Farmers then use this data for
managementoftheirherd,inparticularcullingdecisions.
The farmer is encouraged to keep all pedigree information for all calves. Minda also
connectstotheNewZealandAnimalEvaluationUnitDatabasewhereallBreedingWorthand
Production Worth figures are stored and where an animal’s profitability indexes are
calculated.MindaalsohasaninterfacewiththeNewZealandNationalAnimalIdentification
and Tracing (NAIT) database. This allows farmers to easily record sales and transfers in
Minda that then link directly to the New Zealand National database. Under the NAIT
program,cattlearetracedusingradiofrequencyidentificationdevice(RFID)eartags.Once
tagged,theseanimalsareregisteredinanationaldatabase,andthedetailsoftheanimal’s
location,itsmovementandthepersoninchargeoftheanimal.
All theLICAI techniciansusehandhelddeviceswhen inseminatingcows. Therearea few
typesofunitsused, includingPsion,DatamateandTrimble. Theyenter the cow’sear tag
number(mostofthetimemanually)priortoinseminatingwithaparticularbull.Theycheck
to ensure that the bull being used is not a (close) relative of the cow. This is done by
calculating the inbreeding coefficient. The technician, who synchronises their handheld
device, then uploads all the information daily. When pregnancy testing is done, the
informationiseithercollectedmanuallyorenteredintoMindaorcanbeenteredintoahand
helddevice.ThehandhelddevicecanbeconnectedtoaRFIDreader.
2.3.1.1 LIC Dairy Shed automation
LICalsosellanautomationsystem,Protrack,whichlinkstoMinda.Protrackdoesnothave
theabilitytohaveindividualmilkmetres,althoughitdoesallowforindividualcowfeeding.
However,basedontheaveragelowlevelofin-shedsupplementaryfeeding(ofgrainorpalm
kernelextract(PKE)),itwasasurprisethatitwasregularlypresentedasakeyfeature.The
20
keyfeaturesformanagementistheidentificationofcowsundertreatment,auto-draftingof
cowsandwalkoverscales.ProtrackisonlysoldinNewZealand.
LIChaverecentlypurchasedanothercompanyDairyAutomationLimited(DAL),whichhasin-
shed,in-linemilkmeters.TheacquisitionofDALmilkmetersandcellsensetalksdirectlyto
Protrackandthisdoesallowthefarmertofeedcowstodemand.TheDALmetersgivesfat,
proteinandyield,andalsothecellsensegivesanactualsomaticcellcount(SCC)score.They
costaround$400NZDperunit.
2.3.1.2 Heat detection camera
LIC havedeveloped their own technology for heat detectionusing devices on cows and a
camera.ItiscalledProtrackEZHeat-assisteddetection.TheEziheatcamerausedforheat
detectionhasnowbeenusedforaboutfouryears;itcommunicatesdatadirectlytoProtrack
anddraftsallactivatedormissingheatdetectors.
At an advertised price of $20,000NZD, this is very practical tool to reduce labour on the
farm. This systemworkswith an automatic drafting gate. The Protrack drafting systems
startat$25,000NZDandincreaseto$80,000NZDforfullautomation.
2.3.1.3 Minda Land and Feed
This isapasturemanagementandfeedbudgetingprogramprovidedbyLIC. It isgenerally
quitebasic,butuserfriendly.Italsohasafeedwedgeforecasterwhichisausefultool.Itis
verysimilartoPasturePlus,whichisusedbyVDL.
2.3.1.4 Agrimetrics
Agrimetrics is a database and dashboard that sits over Minda. It incorporates climate
information, stock numbers, production, benchmarking and reproduction. It has been
developedby LIC for key accounts (large and corporate customers). Thebenchmarking is
regionalandmaintains confidentiality. This system is veryusefulas it consolidates lotsof
keyfarminformationintoonewebportal.
21
2.3.2Landcorp
Landcorp Farming is a New Zealand government-owned Enterprise, owning or leasing
376,942hectares(Ha)ofland.With137propertiesand1.6millionstockunits,theyareone
of New Zealand's largest farming organisations. They have sheep, beef, deer and dairy
operations.Theyhavetheirownfarms,plusmanagefarmsforothers.
Landcorp operates 59 dairy farms,with peakmilking cows of 55,000 from the top of the
NorthIslandtothebottomoftheSouthisland.Theyhave20,000Haallocatedtodairyand
300staff.Inthe2013-14year,theyproduced18.6millionkilogramsofmilksolids.Thedairy
businesscontributed$129millionNZDofthe$141millionNZDoperationalincomein2013-
14(LandcorpFarmingLimited,2014).TimewasspentonWairakeiEstate,nearTaupoonthe
NorthIslandwheretheyhave10farms,withabout12,500cows. Theirlong-termgoalfor
theareaistohave32,000cows.ThelandonWairakeiEstateiscomingoutofforestry.Itis
pumicesoils,hasanOlsenPof12withapHof5.3andrainfallis1000mmperannum.They
run a pasturebased system,with some farmshaving irrigation. Their stocking rate is 2.6
cowsperhectareonnon-irrigatedland.
2.3.2.1 Management reporting
Landcorphasadetailedwebportalthatallowsalllevelsofmanagementtolookatdifferent
sectionsofthebusiness.ItiscalledtheGatewayandisanInternetsite.Thisportalhasbeen
developed in-house, and incorporates data frommilk companies (Fonterra,Westland and
Synlait). Generally, the reporting is broken into complexes and type of farm. Each Farm
OperatorreportstoaFarmBusinessManagerwhooverseesabout7,000cows.
The Gateway incorporates the Dairy Production Reporting (DPR), the Farm Management
System(FMS),allhoursworkedbystaffandthebudgetingtool(TM1,fromIBM).Eachfarm
operator (Manager, Sharemilker, Sharefarmer) completes aweekly report, which includes
feeding,availablehectaresandcownumbers(inmilk,hospital,deaths).Thisinformationis
collatedwithmilkdatatoproducetheDPR.Thereisadashboardreportforeachfarmeach
week. The FMS is used for two key parts: the company stock reconciliation and all land
22
activities. FMS isaproduct fromFarm IQ,and isusedbyLandcorponall its farms (dairy,
beef,sheep,anddeer).Ithasaseriesofdropdownmapsthatcanbeusedtoplancropping,
fertiliser, effluent, chemical applications, pasture covers and recordpaddockhistory. This
informationiscollatedbytheLandcorpagronomyteaminWellingtontoorderfertiliserand
seed,anddevelopnutrientbudgets.
2.3.2.2 Farm IQ
FarmIQisabusinessestablishedasaPrimaryGrowthPartnershipbetweentheNewZealand
Government and industry. It is producing integrated solutions for the redmeat industry.
FarmIQisafarmsystemmanagementtooltocollateGeographic informationsystem(GIS)
datawith land and animalmanagement at its core. The systemwas launched in August
2014.Theprogrambringsindatafrommanysources.ItincorporatesdatafromTrackmap;
aglobalpositioningsystem(GPS)basedspreadingsystemforfertilizer.Italsocommunicates
withNAIT.TheaimistolinkFarmIQtoFarmax.
LandcorphaveembracedFarmIQasabusiness-widesolution.Overtime,theobjectivefor
the dairy farms is to introduce Farmax Dairy as a business planning tool, link it into the
company financemodels and then link thenutrientmanagement intoOverseer. Thiswill
meetbothonfarmneedsandregulatoryandreportingrequirements.
Minda is used on approximately half the farms. LIC prepare and send through weekly
breedingreports,whicharevisibleintheGateway.Ontheotherhalfofthefarms,MilkHub
isused. MilkHubisusedonmanyfarmsintheTaupoarea. MilkHubisusedforallanimal
health information, does individual milk production on a daily basis, can do individual
feeding,isusedforpregnancytestingresultsandislinkedtoauto-drafting.Onthesefarms,
herdtestingisnotconducted.MilkHubisnotlinkedtoMindacurrently.Theendgoalisto
link MilkHub into Minda and/or the national database so they build BW and production
worth(PW)foralltheircows.
23
Farmfinancialsarebrokendownbyfarmtocomparerunningcosts(excludingrent)withthe
budgetonamonthlybasis.Budgetsarereviewedquarterly.
2.3.2.3 On Farm
Landcorp doesmove cows between farms tomanage feed availability and demand. The
transfer in cow data ismanaged throughMinda. On farms that don’t haveMilkHub, the
farmoperatorisaccountableforkeepingallcowrecords. TheFarmBusinessManagercan
logontoMindaremotelyandlookatcowinformation.Thiswouldbemostlyfordeveloping
listsofcowstocull.
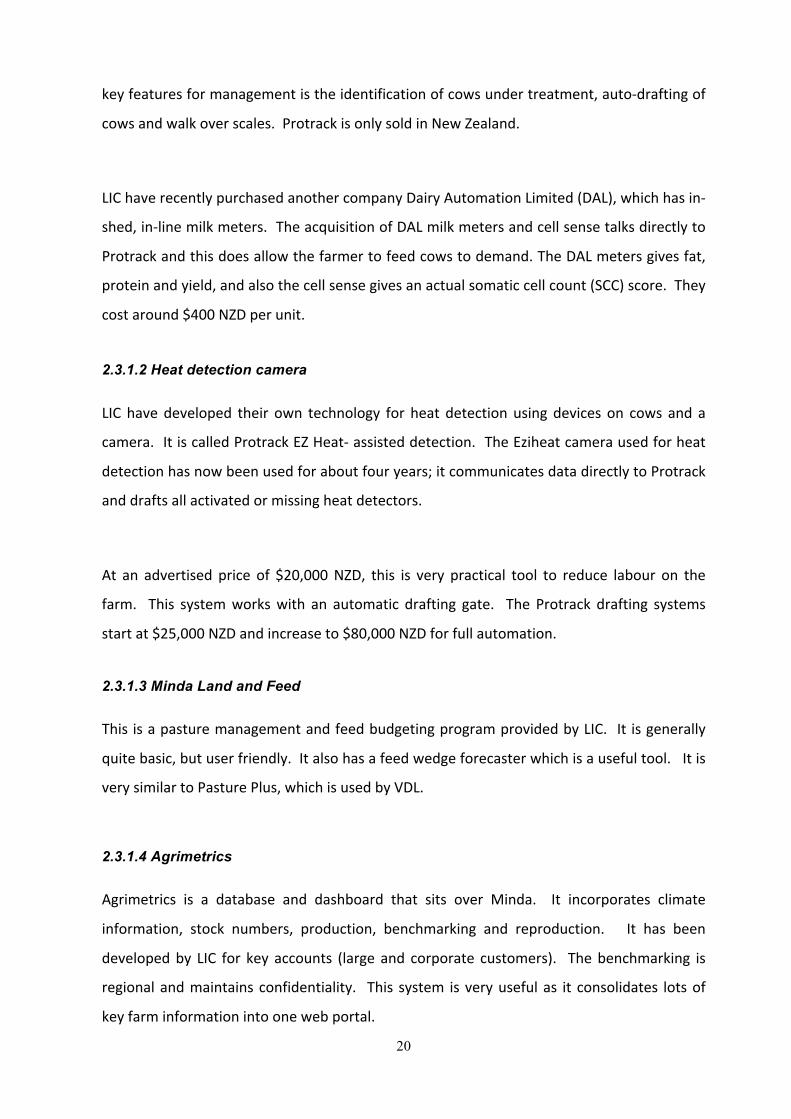
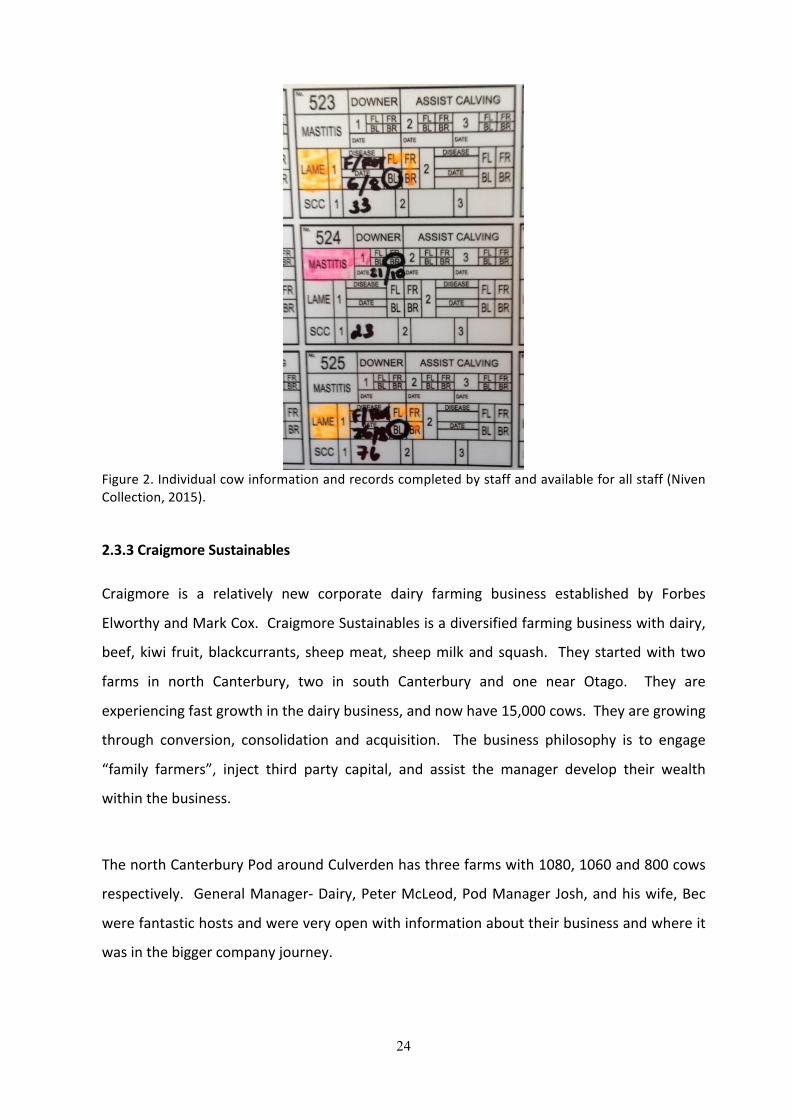
OnoneLandcorpFarm(withoutMilkHub),themanagerhaddevelopedasimplesystemfor
therecordingofallcowevents. Itwasveryuserfriendlysoallstaffonthefarmcouldsee
andrecordcowevents.ThisisshowninFigures1and2.
Figure1.LandcorpFarmBusinessManagersLouiseCookandMatthewJohnson intheofficeat thedairywiththewallchartofeverycowonan800-cowfarm(NivenCollection,2015)
24
Figure2.Individualcowinformationandrecordscompletedbystaffandavailableforallstaff(NivenCollection,2015). 2.3.3CraigmoreSustainables
Craigmore is a relatively new corporate dairy farming business established by Forbes
ElworthyandMarkCox.CraigmoreSustainablesisadiversifiedfarmingbusinesswithdairy,
beef,kiwi fruit,blackcurrants, sheepmeat, sheepmilkandsquash. Theystartedwith two
farms in north Canterbury, two in south Canterbury and one near Otago. They are
experiencingfastgrowthinthedairybusiness,andnowhave15,000cows.Theyaregrowing
through conversion, consolidation and acquisition. The business philosophy is to engage
“family farmers”, inject third party capital, and assist the manager develop their wealth
withinthebusiness.
ThenorthCanterburyPodaroundCulverdenhasthreefarmswith1080,1060and800cows
respectively. GeneralManager-Dairy,PeterMcLeod,PodManagerJosh,andhiswife,Bec
werefantastichostsandwereveryopenwithinformationabouttheirbusinessandwhereit
wasinthebiggercompanyjourney.
25
IntheCulverdenPod,thethreefarmmanagerscompleteadailyreport(onasmartphone).
Thesedailyfeeddetailsfromthephoneappgotoacentralplaceandarecollatedandsent
back to PodManager and senior staff. The information includes supplement consumed,
grassconsumed,areagrazedandcowsmilked.Thefarmmanagersandpodmanagermeet
togetherweekly. Minda’s Land and Feed is usedon all farms toprovide averagepasture
cover(APC),growthratesandapasturewedge.Thekeymetrictomonitorissupplementary
feed.Theobjectiveofthispodisthatfarmmanagersdon’thaveanyofficework.Theywant
thefarmmanagersworkingonthings“wheretheymovetheneedlethemost”.
Thefarmingsystemissetuptohave17%ofthelactatingcowdietasbroughtinfeed.Thisis
composedof200kgofgrain,150kgofsilageandtoppedupwithPKE.Basedonlastseason,
12.6Tofpasturewaseatenperhectare. Muchof the farmarea is irrigated,with4mmof
waterappliedperdayperhectarefrom1stNovemberto31stMarch(atotalof600mm).This
isinadditiontothe650mmrainfall.Ureaisappliedatarateof300kgperHaperyear.
Financial reporting is done throughmonthly accrual accounting for a profit and loss. The
business is developing new systems to prepare management reports. They have just
commencedcomparingfarmphysicalandfinancialperformanceonamonthlybasis.
2.3.4PyeGroup
ThePyeGroupisafamilycompanywithdairyfarms,largescalecropping(potatoes,carrots
andarable),atransportbusinessandacarrotwashingfacility.TheCompanyisownedand
run by husband and wife team of Michelle and Leighton Pye. Michelle had spent time
workingwithAlanHubbard,andLeighton’sfatherAlanPyewasinvolvedwithDairyHoldings.
Theystartedin2002withonedairyunitandstartedbuildinganother.Theyhavegrownthis
businesstoninedairyfarms,milkingover7,000cowsandproducing3millionkilogramsfrom
1,689Ha.
They run a simple business model where they have contract milkers and sharefarmers.
These FarmOperators provide their own utes, quad bikes, employ staff and pay all shed
26
costs. All farm operators report to Leighton, who is on farm regularly. Each farm is
responsibleforkeepingalltheircowrecordsinMindauptodate.Thereisnomovementof
cows between farms. All heifers are reared centrally, but each farm receives back the
heiferstheysent.MostcowsarewinteredonfodderbeetonaPyeGrouprun-offblockthat
iswalkingdistancefromthefarms.Eachfarmisallocatedpaddocksforthewinteringperiod.
Theyraiseinvoicesbetweenthedifferentpartsofthebusinesssothateverythingiscosted.
Reportingfromthefarmismonthly,andisfocusedonstocknumbers,sales,farmphysicals,
healthandsafety,environmentalconsents(irrigationandeffluent)andemployment.Thisis
asimpletwo-pagereportthatwouldtakeonly15minutestocomplete.Onamonthlybasis,
all FarmOperators come to the company office to review and approve invoices for their
farm.InformationfromFonterraforproductionandfarmfinancialsisthenfedbacktoeach
farm. Each farm only sees its own data. However, all information is collated for
managementreporting for thecomparisonbetweenfarms. Thekeymetric is thecostper
kilogramofmilksolidspermonth.
2.3.5DairyHoldings
Dairy Holdings was started in September 2000 by Alan Pye and Allan Hubbard who
purchasedsevenfarms,mostlyfromcorporatefarmersTasmanFarmsandDairyBrands.By
2001/2,theyhad30farmsandproduced7.95millionkilogramsofmilksolidsandreceived
$5.30 per kilogram. In 2002/3, the milk price dropped to $3.63, and the business
commenced a “return to basics” program. Their aimwas to have repeatable and simple
systems that lead toprofitability. In2014/15, theynowhave56dairy farmsplus support
land,with44,500cowson13,500Haproducing15.8mkilogramsofsolids.
Theyarebased in fourhubsandareself-containedforwinteringandheiferrearing. Their
governancestructure isaboardof five, includingtwo independentdirectors (includingthe
chair)andonerepresentative fromeachof the threeowners. Theboardmeet four times
peryear,andbyphonewhenrequired.TheChiefExecutiveissupportedbyaChiefFinancial
Officer (CFO),FinancialController,ContractsManagerandthreeOperationsManagersand
fiveFarmSupervisors.EachofthethreeOperationsManagershasabout13farmsreporting
27
to them,ofwhichhalfareherdowning. TheFarmSupervisors typicallyoperateone farm
themselves andoversee six toeight farmswhicharemostly lowerorder share farmersor
contractmilkers.Thebusinesshas50:50Sharefarmers,lowerordersharefarmerswithand
without cows, contractmilkers andmanagers. The trends between2009-10 and2014-15
includeareductioninmanagers(24to2),anincreaseinlowerordersharemilkerswithcows
(1 to15)andcontractmilkershave increased from8 to25. ThishascoincidedwithDairy
Holdings becoming an Investors in People company that has included a strong focus on
careerprogressionand theability tobuildequityandwealth. ChiefExecutive,ColinGlass
(2015)2,saysthatmovingtobecomingInvestorsinPeoplewasawatershedmoment.Within
DairyHoldingsnow,Glassexplains, “progression is constantanddynamic…and therewill
alwaysbeopportunitiesfortopperformers”,Glassfurtherstates,“onestructureisthereto
facilitatetheother,andamixedmodelworksthebest”.
The Dairy Holdings business uses many tools to measure the performance of each farm,
farmsinregions,farmsoiltypes,thefarmsofdifferentoperationsmanagerandthebusiness
asawhole.
2.3.5.1 Internal approach
Thekeymeasurethatisusedinthebusinessisearningsbeforeinterestandtax(EBIT).They
alsousesimplekeyperformanceindicators(KPIs)suchas-milksolidsproduction,cellcount,
nitrogenapplied,averagefarmcoverandpastureharvestedperhectare.Asabusiness,they
planinphysicalsandreportinfinancials.
Wherepossible,theyusesupplier’sdata. Theyhavefoundmonitoringthe10-dayaverage
bulksomaticcellcount;theyeartodateaverageandthevarianceisagoodleadindicatorif
thingsaren’tundercontrolonafarm.Theyusethemonitorandreviewapproachthatgives
focusandinsighttothepeoplewhoworkonthefarms.Theinformationispresentedineasy
tounderstandgraphs.
28
Theyalsopresentaweeklydashboardofpasturewalkswhichincludesinformationsuchas
whenlastcompleted,averagepasturecover,pre-grazingcover,greatestcover,postgrazing
target and lowest cover and growth rates. This is great way to create peer pressure for
thosewhohavenotcompletedtheirpasturewalks.
The business runs its own Internet site as a central portal to everything the managers,
sharefarmers and staff need. This includes a link to Fonterra, internal reports (mostly
financial)andtheLICsite. Italso includes irrigation information,suchaswater takes,and
soil information on time below refill points and time above saturation collected through
telemetry. There are three layers of access, Board and senior management, Operations
ManagersandFarmOperators.Theyalsohaveaportalfortheirbankers.
Dairy Holdings use LIC to generate customised reports at key times throughout the year.
ThisprovidesthemwithHerdTest,matingandreproduction,Mindaandotherinformation
inoneplace.Mindaisreconciledtothemonthlystockreconciliation.PriortousingLand&
Feed,theyusedPastureCoachformonitoringpasture.
AGISsystemforproofofplacementforfertiliserhasbeeninplaceforthepastthreeseasons
andhelpstoensurefertiliserplansareeffectivelycarriedout.Assessingmanagementisthe
nextpartof thebusinesswheretheyare lookingtouseasystemtomeasureandmonitor
businessperformance.
2.3.5.2 Externally
Dairy Holdings also benchmarks itselfwith external sources. New Zealand has a detailed
industry-benchmarking tool called DairyBase, which consolidates physical and financial
performance.DairyHoldingspridesitselfonbeingasgoodasowneroperatordairyfarms.
Analysis conducted by Baker and Associates for the 2009/10-year showed Dairy Holdings
farmswerearoundorbetterthanowneroperatorfarmsfortheoperatingprofitperhectare
for all the regions where they farmed (coastal Canterbury, inland Canterbury, Otago/
Southland, Waitaki and West Coast). For example, a 50:50 sharefarmer in coastal
29
Canterburyhad$2,400(NZD)profitperhectarecomparedwithanowneroperatorat$2,000
(NZD)(Glass,20152).
2.3.6 MyFarm
Myfarm Investments was established in 1990, and today has $550 million (NZD) of farm
assetsundermanagement.Theyhave300syndicatedinvestorsinamixofdairy,sheepand
beef farms in New Zealand’s key farming regions. They have 47 Dairy farms under
management.
For their dairy syndicates,Myfarm aims to attract experienced contractmilkers and farm
managers to manage the investment and achieve performance targets. Some MyFarm
syndicates alsooffer farmers theopportunity to invest in the farm syndicate as an equity
manager.ThesyndicatemanagersworkwiththeMyFarmAgribusinessManagertomanage
and operate the farm using the MyFarm processes and systems (MyFarm, 2014). Each
syndicatehasaboardwithaChairmanandisrunasanindividualentity.MyFarmprovides
managementservices,whichrangefromhourlyconsultingtoanannualmanagementfee.
FelixMcGirr is theAgribusinessManagerbased inChristchurch. Hemanages seven farms
thatrangefrom160to500Ha,carryingbetween700and1600cows.Allarepivotirrigated
and all have Protrack. Felix was very generous with his time and how the MyFarm
managementserviceworks.
The management service provided by MyFarm includes a formal monthly visit, and an
additionaloneortwovisitspermonth.Farmaxisusedonallfarmsandissynchronisedso
theAgribusinessManagercanseeallfarms. AllphysicalsarebudgetedandthentheFarm
Managerentersactualseverytendays.Theyfillintheirpasturewalkinformation,nitrogen
application,croppingdetailsonaten-daycycle. Milkreportsaregeneratedevery10days.
TheFarmManagercompletesamonthlyreportbythe5thofthemonthwhichincludesthe
stock reconciliation, cownumbersand class (dry,milking frequency) feeding, supplements
on hand plus a commentary. These reports are reviewed and edited by MyFarm
30
Management and sent to all shareholders. MyFarm produce a monthly profit and loss
report(comparingactualwiththeapprovedbudget)andaquarterlycomprehensivereport
includingproduction, stock reconciliation,profit and loss (accrualbasis), cash flows, capex
andindustryupdate.
All accounts for the farm are received centrally, scanned and collated into a form for
approval by the Farm Operator, Agribusiness Manager and the Chairman. This happens
withintwodays.
Forthemanagementofphysicalsonthefarm,MyFarmhaveanumberofInternetenabled
tools.AllherdsareonMinda.AllshedshaveProtrackVantage,thepremiumofferingfrom
LIC.Thisallowsforindividualcowfeeding.Italsohasthefunctionalityforweightdrafting
cows basedonweight change. MyFarmhave theAgrimetrics tool from LIC and this is of
considerablebenefittoAgribusinessManagerswhocanseeadashboardofthereproductive
performanceoftheirfarms.
MyFarm also utilise an excellent web based tool called Aghub from fertiliser supplier
Ballance. It is linked to all aspects of land andwater use for all the farms. It shows the
monitoring of all irrigation pump sheds (litres per second), the outputs from on-farm
weatherstations(irradiance,evapotranspiration)andsoilconditions(re-fill,wiltingandsoil
temperature). It is also used for all fertiliser planning and application. The Agribusiness
ManagerloadsthefertiliserplanandtheFarmOperatorplacestheorder.Theprogramhas
different permissions as to who can adjust orders. The program then records proof of
placement,includingwhoapplieditandwhen.ItisallGPStrackedandyoucanseeonthe
screenexactlywherethetruckwent.
Itwasnotedthatwithsuchgoodreal-timesystems,thereisalsotheneedtohaveapointin
timeobservation.Forbusinessesfocusedonfinancialvalues,particularlyforbalancesheet
reporting,programsneedtobeabletonotonlyshowreal-timeinformation,butalsobeable
toholdahistoryatasetpoint intime. Thechallengeforsuchsystemsthatarebasedon-
31
farm,wherepowersupplyandInternetconnectivityarenotalwaysavailable,istofillinthe
gaps, rather than report no data. This is particularly important for livestock and feed
monitoring.
OfallthebusinessesIvisitedinNewZealand,MyFarmhadthebestsystems,whichcollated
animals (throughProtrack,Mindawith theAgrimetricswebportal), businessplanningand
feedmanagement(inFarmax)andwaterandfertilizermanagement(inAgHub).Thismade
iteasyfortheAgribusinessManagertohavealltheinformationathisfingertipstomonitor
whatwasreallyhappeningonfarm.
2.4 China
Chinahasagrowingthirstfordairyproducts. Between2000and2011,averagepercapita
milkconsumptiontripledfrom9litreequivalentsperpersonperyearto30litreequivalents
of dairy products. By comparison, Australia’s average consumption is around 300 litre
equivalents per person per year (IFCN, 2012). In 2011, China produced around 32 billion
litresofmilk,andconsumed42billionlitreequivalentsofproduct.
The domestic Chinese dairy industry is growing. Based on visits, there seems to be two
growth engines. Firstly, large Chinese corporations are utilising foreign investment and
knowledgetobuildandoperatelarge(over1000cow)houseddairyfarms.Fonterraarean
exampleofabusinessthatisoperatinginthisspace.Secondly,therearenumeroussmaller
farms(between200and1000cows)thatarebeingsetupby localbusinesspeople. Iwas
veryfortunatetoseetenofthesetypesofbusinessesinShandongprovidence.
The Fonterra farms used DairyComp 305 (DC305) and Feedwatch tomanage their farms.
ValleyAgSoftware (VAS)have investedandputa supportoffice inChina to support their
offeringsthere.
32
2.5 USA
TheUSAwasvisitedtwiceduring2014,visitingCalifornia,NewYorkState,Illinois,Wisconsin
andMinnesota. Thepeoplemetwithhad farms in these states plus operations in Texas,
New Mexico, Michigan, North Dakota and South Dakota. People trading in commodities
linkedtothedairyindustrywereinChicagoandNewYork.
The USA produces about 85 billion litres of milk (IFCN, 2012) and exports about 15% of
production. The three largest processors are co-operatives:Dairy Farmers ofAmerica (all
states)20%,CaliforniaDairies9%,andLandO’Lakes7%(NorthWeststates).
2.5.1FernandesBrothers
The five Fernandes brothers run two dairy farms (3600 and 3000 cows) and a cropping
businesswith3000acres (1214Ha) for forage for cows. Ameetingwith JaredFernandes
washeldatFernOakDairy.
DairyComp305isusedforallcows.JaredalsousesaprogramcalledPenBot,fromVAS.It
scanseverycow’selectronicidentification(EID)tagwhentheywalkontotheplatform.This
is very similar to the EasyDairy program or Protrack systems used in Australia and New
Zealand.Generally,intheUS,cowsontherotaryareonlymilked.Thisisbecausethecows
arehousedandarecheckedmostly for reproductionperformancewhilst instanchions. In
AustraliaandNewZealand,most reproductiveassessmentandmany treatmentsaredone
on the rotary. Also, cows are fed on the rotary in Australia and New Zealand, whereas
almostnocowsarefedintheparlourintheUSA.
PenBot (aVASproduct)was installedsocowscouldbe injectedwithBovinesomatotropin
(BST)whilstontheplatform.Thiswastosavetime.Itisalsousedtoidentifycowsthatare
inthewrongpen.
33
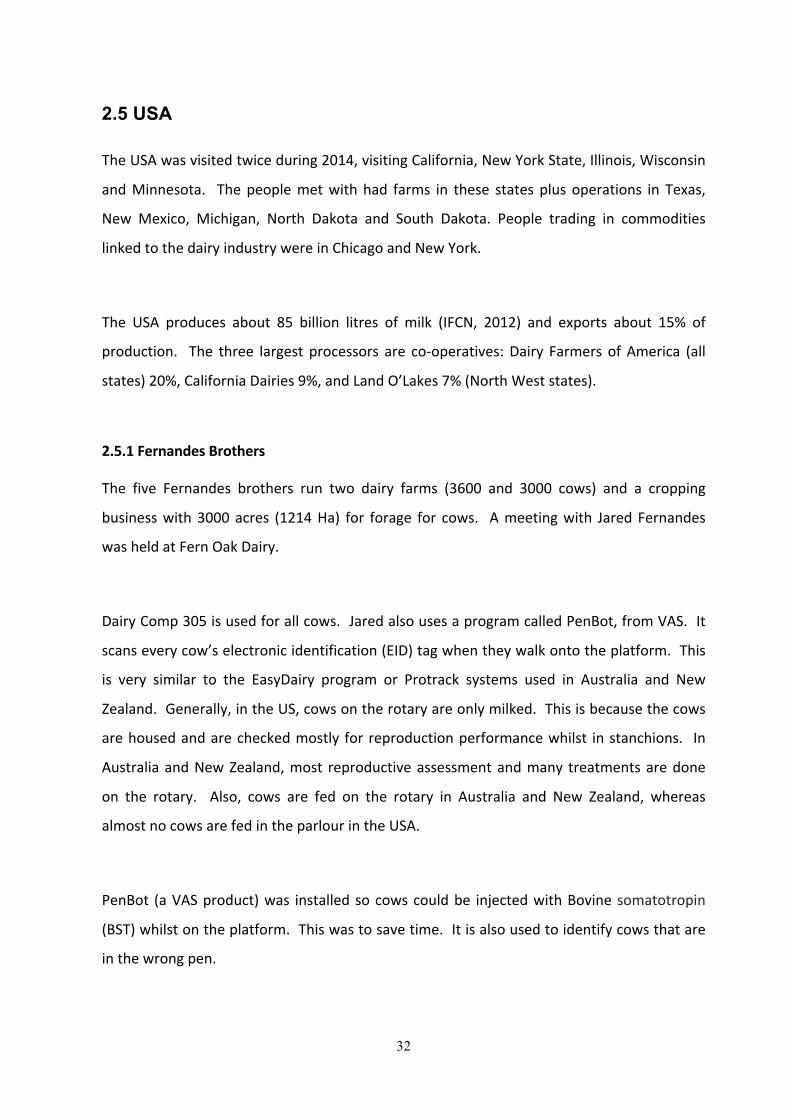
Thedairyoffice is thecontrolcentre for the farm. Thereareanumberofcomputersand
screenswhereCCTV footage is shown. There isalsocow informationdisplayed (shown in
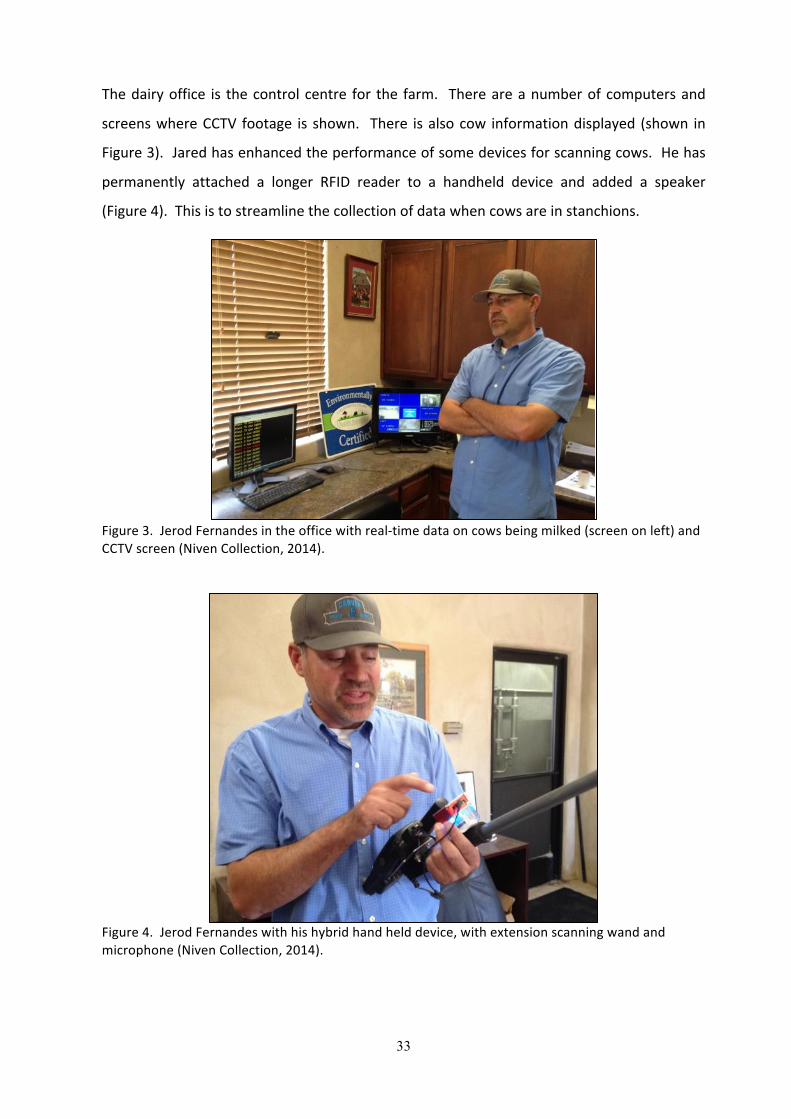
Figure3).Jaredhasenhancedtheperformanceofsomedevicesforscanningcows.Hehas
permanently attached a longer RFID reader to a handheld device and added a speaker
(Figure4).Thisistostreamlinethecollectionofdatawhencowsareinstanchions.
Figure3.JerodFernandesintheofficewithreal-timedataoncowsbeingmilked(screenonleft)andCCTVscreen(NivenCollection,2014).
Figure4.JerodFernandeswithhishybridhandhelddevice,withextensionscanningwandandmicrophone(NivenCollection,2014).
34
2.5.2ObservationsfromotherdairyfarmsintheUSA
Ofthe30plusdairyfarmsvisitedintheUSA,allusedDC305.Allfarmerslikedtheprogram
andsaiditmettheirrequirements.Veryfewproducerswerechallengingthemanagement
system, and therefore challenging how DC 305 worked on a farm. Those that were
challenging the system were looking at options to use DC 305 in the milking shed, and
thereforeconductsomeactivities(suchasinjections)ontheplatform.DC305wasnotable
tomeetthisrequirement.
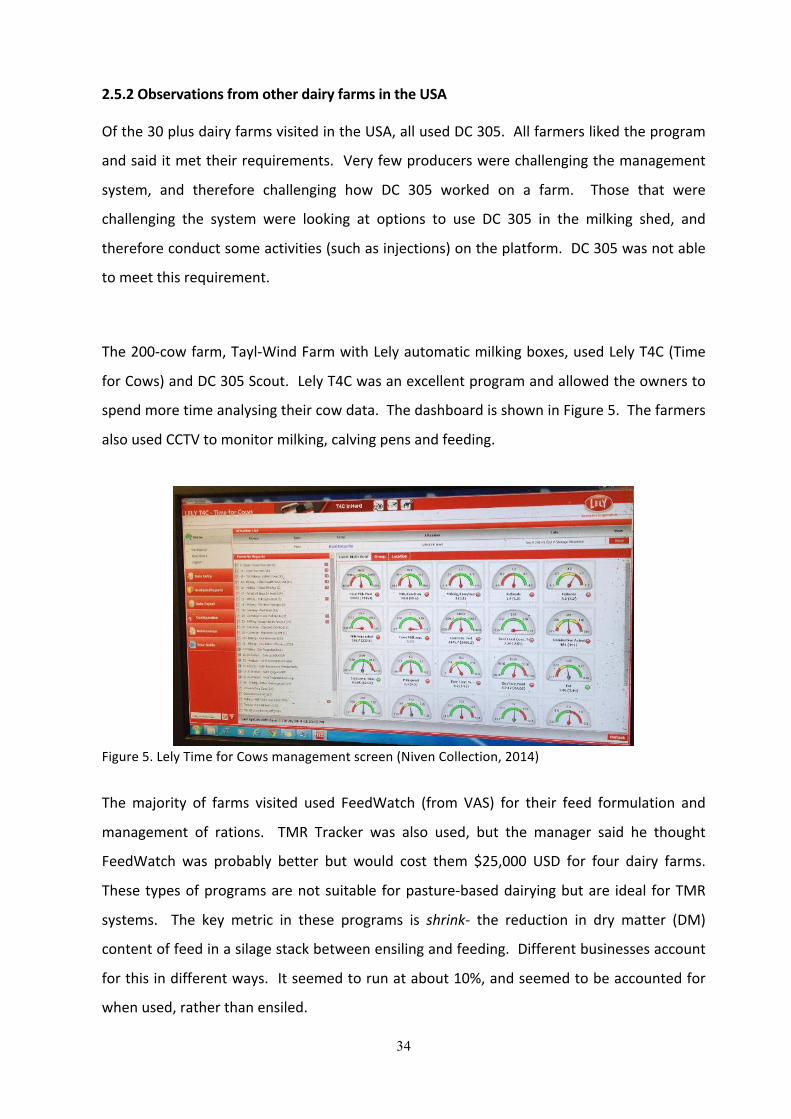
The200-cowfarm,Tayl-WindFarmwithLelyautomaticmilkingboxes,usedLelyT4C(Time
forCows)andDC305Scout.LelyT4Cwasanexcellentprogramandallowedtheownersto
spendmoretimeanalysingtheircowdata.ThedashboardisshowninFigure5.Thefarmers
alsousedCCTVtomonitormilking,calvingpensandfeeding.
Figure5.LelyTimeforCowsmanagementscreen(NivenCollection,2014)
Themajority of farms visited used FeedWatch (from VAS) for their feed formulation and
management of rations. TMR Tracker was also used, but the manager said he thought
FeedWatch was probably better but would cost them $25,000 USD for four dairy farms.
Thesetypesofprogramsarenotsuitable forpasture-baseddairyingbutare ideal forTMR
systems. The key metric in these programs is shrink- the reduction in dry matter (DM)
contentoffeedinasilagestackbetweenensilingandfeeding.Differentbusinessesaccount
forthisindifferentways.Itseemedtorunatabout10%,andseemedtobeaccountedfor
whenused,ratherthanensiled.
35
VAShadanumberofothertools,includingParlourwatch(formeasuringproductionfroma
penofcows)andanewandexcitingtoolcalledChemwatchformeasuringDMofsilage in
thestack.
2.6 Limitations of the study
ThisstudylookedatsystemsusedinChina,TheNetherlands,USAandNewZealand.Itdid
notlookatsystemsusedintheUK,IrelandorSouthAmerica.
Thefocuswasmostlyonthemanagementofthecowsandtheuseofnutrients(fertiliser).It
didnotfocusonthesystemsusedinbroadacrecropping.
Thisstudywasfocusedondairyfarms.Onemeetingwasheldwitheggproducerswhoran
multiplesiteoperationsindifferentpartsofNewYorkState. ThiswaswithBrettDKreher
and Vaughan Gingerich, from Kreher's Farm Fresh Eggs. This was an extremely valuable
discussion.However,theywerereallyrunningeachfacilityasastand-aloneoperation.They
didcentrallymanageprocurementandsalesofinputsandoutputs.
36
Chapter 3 Managing risk and changing input and output prices 3.1 Context: VDL
Since 2011, VDL has started using tools tomanage price variation in inputs. These take
contractsforkeyinputsforfixedvolumesfordefinedperiods.Thesetoolshavebeenused
forurea,fertilizer,grainandelectricity.Onthesalesside,VDLconsideredafixedsalesprice
forcertainamountsofmilkinthe2013-14and2014-15years.
Withintheworldcontext,VDLdidnothaveadetailedpriceriskmanagementstrategyand
wasonlyusingafewofthetoolsavailable.
3.2 Literature review
Within Australia and New Zealand, there is often debate on the relative efficiency and
therefore profitability of the farm system. For the purpose of this work, the dairy farm
systemisdefinedasthequantityandtypeoffeedthatisusedtofeedmilkingcows.Often,
the farm system is linked to the risk profile of the business. Changing or adjusting the
farmingsystemisseenasawaytochange,andideallyreducebusinessrisk.Recentstudies
fromAustraliaandNewZealandhaveexploredthispremise.
3.2.1TasMilk60Study
Themost relevantAustralianworkwas conductedaspart ofDairyAustralia’sGrains2Milk
Program(2011).Theprojectwastoanalysephysicalandfinancialdatafrom69Tasmanian
dairyfarmsforbetweenoneandthreeconsecutivefinancialyears2006/07to2008/09.Fifty-
six farmswerestudiedforall threeyears. Farmsweregrouped intothreesystemsonthe
amountofgrain/concentratesfedtocows:low(<1T),medium(1T–2T)andhigh(>2T)per
cowperyear.
The findings from the studywere analysed in relation to either performance (physical) or
profitability (financial). The study found no simple relationship between the amounts of
37
concentrate fed per cow and the pasture utilisation per hectare. Good andpoor pasture
managementoccurredatall levelsofconcentrate feeding. Total feed intakespercoware
notalwayshigheronfarmswheremoreconcentratewasfed.Therewasalsofoundtobea
significantvariationintheproteintofatratioinmilkfromfarmtofarm.
The profitability study found that there was no best concentrate feeding level for
production/feedingsystem.Anyconcentratefeedinglevelofaproduction/feedingsystem
canbeprofitableinanyyeargiventheappropriatemixofmanagement,milkpriceandinput
costs.Thedifferenceinaverageormedianprofitsbetweenfarmsusingthelow/moderate/
highconcentratefeedinglevelsaresmallcomparedwiththevariabilityinprofitwithineach
concentratefeedinglevel.
Thefindingsconcludedthatforallfeedingsystemsthereisamixofrisk,performance,and
management principles. The farmer can successfully balance risk and reward by
understandingandmanagingtheseprinciples. Pastureutilisation,pasturequalityandcore
costspercowarekeyprofitdrivers inallpasture-basedfeedingsystems,regardlessof the
levelofconcentratefed,andcanbeusedbyallfarmers.
3.2.2NewZealand
DairyBase is the New Zealand national database used by dairy farmers and professional
advisorsinNewZealandtoanalysefarmresultsandbenchmarkthemwiththeirpeers.Itis
runbyDairyNZ,andprovidesastandardisedmethodologytoanalyseandreviewKPIsforan
individualfarmbusiness.Thereisnolicencefeeforafarmer,butthefarmerhastousean
accredited DairyBase rural professional to enter data, which is done at commercial
consultingrates.
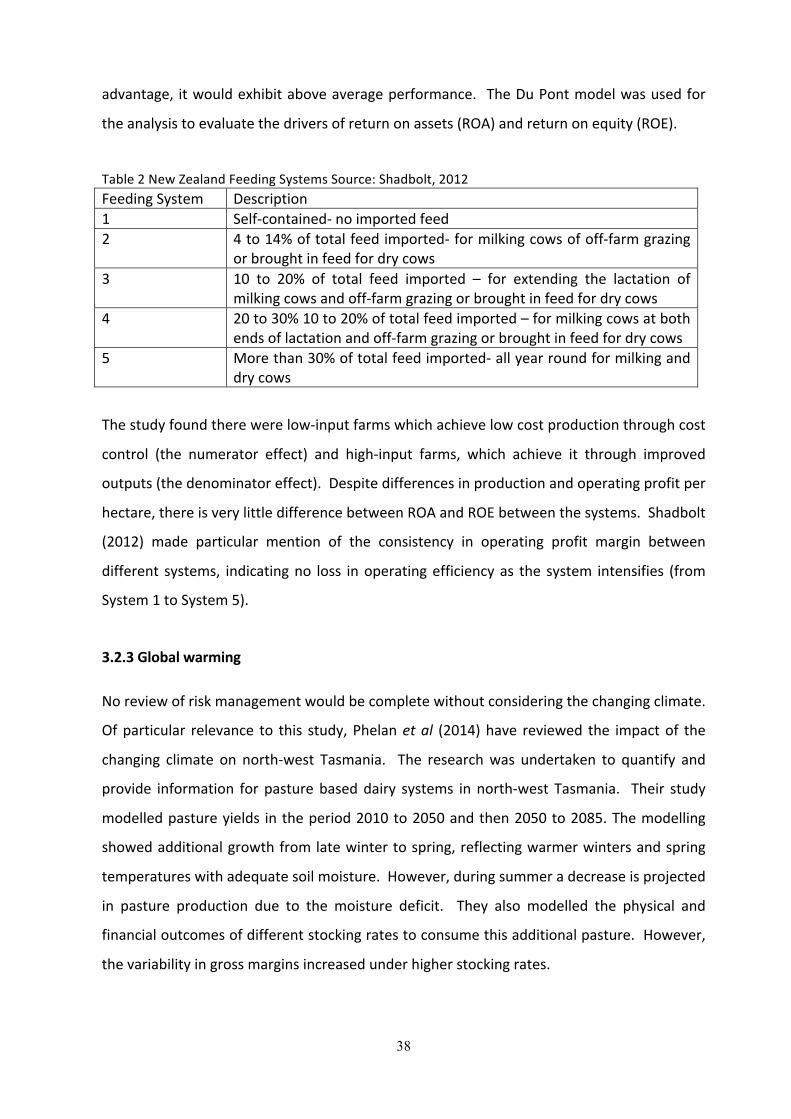
Shadbolt (2012)used theDairyBasedata from2006/07,2007/08and2008/09 toexamine
thefinancialperformanceofthefiveNewZealanddairyfarmingsystemstodetermineany
differencesinthedriversoffinancialsuccessbetweensystems.Thefivesystemsareshown
in Table 2. This test examined the premise that if a farm system had a comparative
38
advantage, itwouldexhibitaboveaverageperformance. TheDuPontmodelwasusedfor
theanalysistoevaluatethedriversofreturnonassets(ROA)andreturnonequity(ROE).
Table2NewZealandFeedingSystemsSource:Shadbolt,2012FeedingSystem Description1 Self-contained-noimportedfeed2 4to14%oftotalfeedimported-formilkingcowsofoff-farmgrazing
orbroughtinfeedfordrycows3 10 to 20% of total feed imported – for extending the lactation of
milkingcowsandoff-farmgrazingorbroughtinfeedfordrycows4 20to30%10to20%oftotalfeedimported–formilkingcowsatboth
endsoflactationandoff-farmgrazingorbroughtinfeedfordrycows5 Morethan30%oftotalfeedimported-allyearroundformilkingand
drycows
Thestudyfoundtherewerelow-inputfarmswhichachievelowcostproductionthroughcost
control (the numerator effect) and high-input farms, which achieve it through improved
outputs(thedenominatoreffect).Despitedifferencesinproductionandoperatingprofitper
hectare,thereisverylittledifferencebetweenROAandROEbetweenthesystems.Shadbolt
(2012) made particular mention of the consistency in operating profit margin between
different systems, indicatingno loss inoperatingefficiencyas the system intensifies (from
System1toSystem5).
3.2.3Globalwarming
Noreviewofriskmanagementwouldbecompletewithoutconsideringthechangingclimate.
Ofparticular relevance to this study,Phelanetal (2014)have reviewed the impactof the
changing climate on north-west Tasmania. The researchwas undertaken to quantify and
provide information forpasturebaseddairy systems innorth-west Tasmania. Their study
modelledpastureyields intheperiod2010to2050andthen2050to2085.Themodelling
showedadditionalgrowthfromlatewintertospring,reflectingwarmerwintersandspring
temperatureswithadequatesoilmoisture.However,duringsummeradecreaseisprojected
in pasture production due to the moisture deficit. They also modelled the physical and
financialoutcomesofdifferentstockingratestoconsumethisadditionalpasture.However,
thevariabilityingrossmarginsincreasedunderhigherstockingrates.
39
Thisstudysupportsalong-termviewthatTasmaniawillremainagoodplacetogrowgrass
forconsumptionbydairycows.Ultimately,thissupportsdairybusinessesintheareatoplan
forthefuture.
3.3 New Zealand 3.3.1Landcorp 3.3.1.1 On the ground- Farm Operator and Farm Business Manager
Thefarmoperator’sworkwiththeFarmBusinessManagerstosetannualbudgetsandthree-
year plans. Within season, and as part of reviews with milk and feed pricing, the Farm
BusinessManagersdolotsofscenarioplanning.MostofthisworkisdoneinanExcel-based
program,builtbyLandcorpcalledFeedplanner.Itwasdescribedasamodelthatwassimilar
toUdder,buteasierformultiplescenarioplanning.
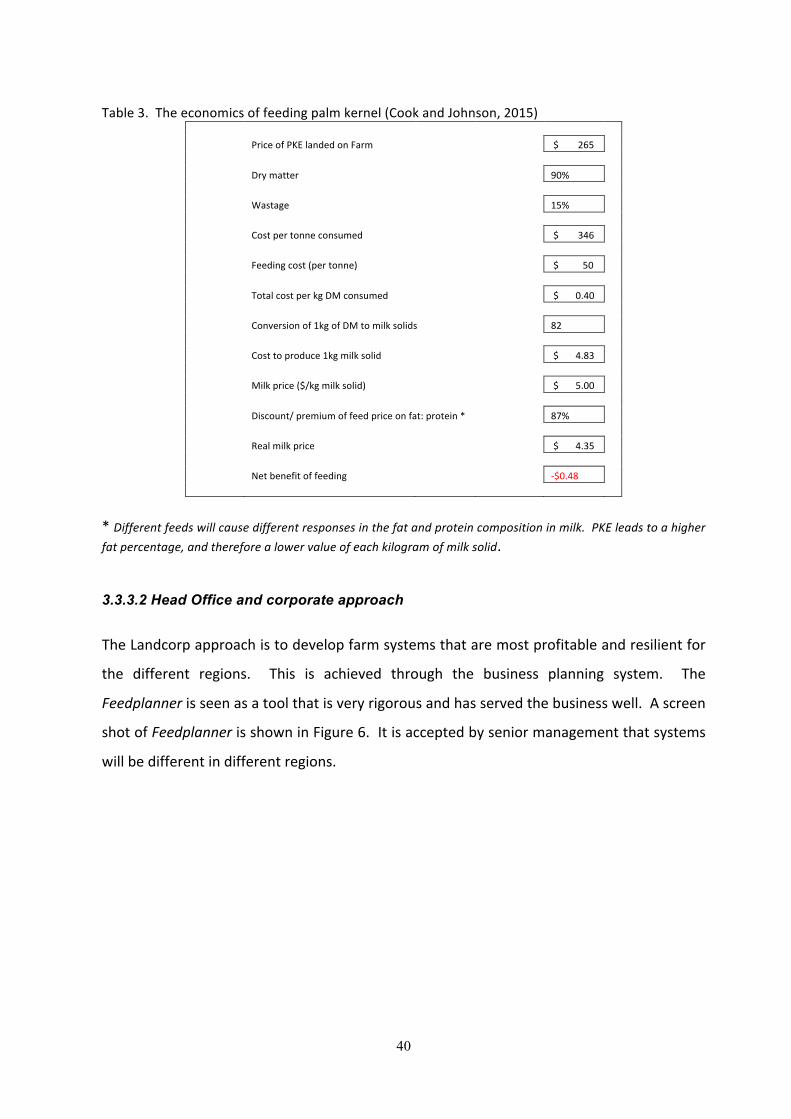
At Farm BusinessManager level, therewas a very good understanding of supplementary
feeding costs andmilk income. The scenario tool, shown in Table 3,was developed in a
workingsessionwheretheauthorwasshowntheeconomicsoffeedingpalmkernel.Atthe
timeofthevisit,thereweredryingconditionsthroughmostofthedairyregions.Milkprice
wasat$4.70,comingoffarecordof$8.40forthepreviousyear. Businessesweremaking
thedecisiontodrycowsoffratherthantobringinfeed(suchasPKE)andcontinuemilking
them.
40
Table3.Theeconomicsoffeedingpalmkernel(CookandJohnson,2015)
PriceofPKElandedonFarm
$265
Drymatter
90%
Wastage
15%
Costpertonneconsumed
$346
Feedingcost(pertonne)
$50
TotalcostperkgDMconsumed
$0.40
Conversionof1kgofDMtomilksolids
82
Costtoproduce1kgmilksolid
$4.83
Milkprice($/kgmilksolid)
$5.00
Discount/premiumoffeedpriceonfat:protein* 87%
Realmilkprice
$4.35
Netbenefitoffeeding
-$0.48
*Differentfeedswillcausedifferentresponsesinthefatandproteincompositioninmilk.PKEleadstoahigherfatpercentage,andthereforealowervalueofeachkilogramofmilksolid. 3.3.3.2 Head Office and corporate approach
TheLandcorpapproachistodevelopfarmsystemsthataremostprofitableandresilientfor
the different regions. This is achieved through the business planning system. The
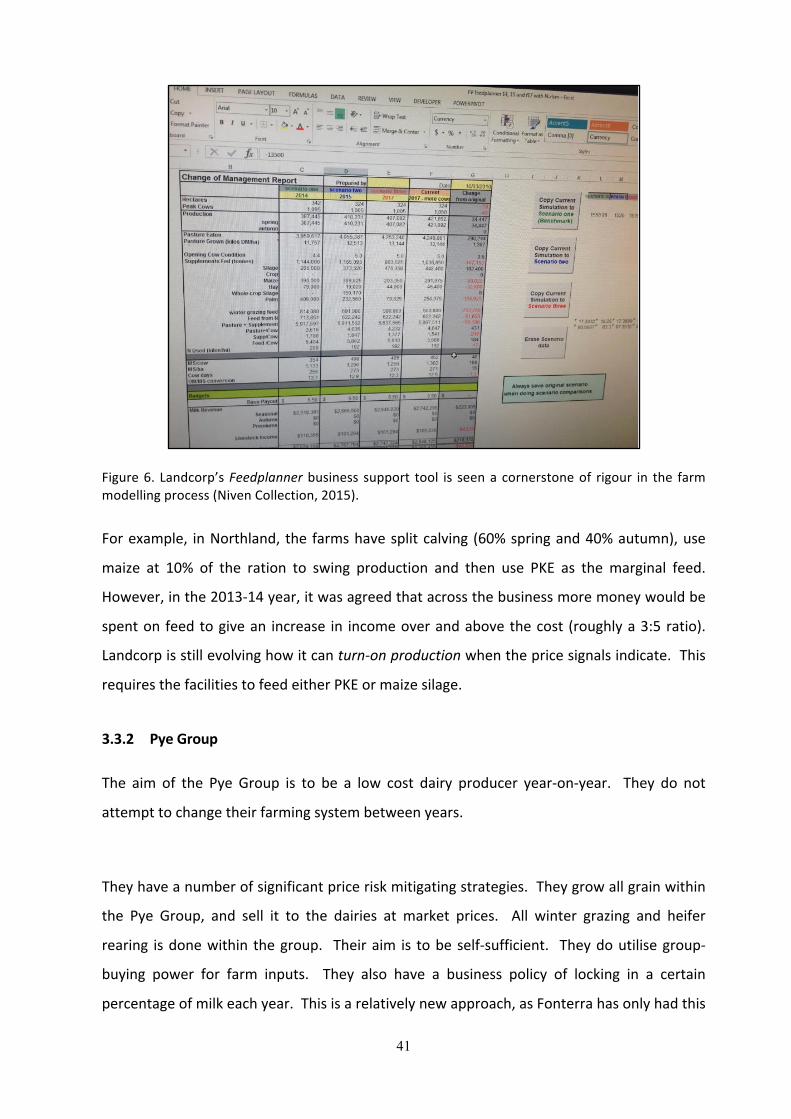
Feedplannerisseenasatoolthatisveryrigorousandhasservedthebusinesswell.Ascreen
shotofFeedplannerisshowninFigure6.Itisacceptedbyseniormanagementthatsystems
willbedifferentindifferentregions.
41
Figure6. Landcorp’sFeedplannerbusiness support tool is seena cornerstoneof rigour in the farmmodellingprocess(NivenCollection,2015).
Forexample, inNorthland, the farmshavesplitcalving (60%springand40%autumn),use
maize at 10% of the ration to swing production and then use PKE as themarginal feed.
However,inthe2013-14year,itwasagreedthatacrossthebusinessmoremoneywouldbe
spenton feedtogivean increase in incomeoverandabovethecost (roughlya3:5ratio).
Landcorpisstillevolvinghowitcanturn-onproductionwhenthepricesignalsindicate.This
requiresthefacilitiestofeedeitherPKEormaizesilage.
3.3.2 PyeGroup
The aim of the Pye Group is to be a low cost dairy producer year-on-year. They do not
attempttochangetheirfarmingsystembetweenyears.
Theyhaveanumberofsignificantpriceriskmitigatingstrategies.Theygrowallgrainwithin
the Pye Group, and sell it to the dairies at market prices. All winter grazing and heifer
rearing isdonewithin thegroup. Theiraim is tobeself-sufficient. Theydoutilisegroup-
buying power for farm inputs. They also have a business policy of locking in a certain
percentageofmilkeachyear.Thisisarelativelynewapproach,asFonterrahasonlyhadthis
42
optionforthelasttwoseasons.Acrosstheotherpartsofthebusiness,theyhavecontracted
pricesforallpotatoes,carrotsandgrain.
Thisisasimpleandrepeatablebusinessmodelthatprovidesfocusoncostmanagementon-
farm. The centrally managed procurement and risk mitigation approaches have made it
appearaverysustainableandresilientbusiness.
3.3.3 DairyHoldings
Thisbusinesshasa very soundand thoroughunderstandingof costsandprofit. Theyare
veryclear there isno linkbetween theamountof feedpurchasedandprofit in theirNew
Zealand setting. Wheremore feed is brought in, themargin is reducedby feedwastage.
ThereisalinearrelationshipbetweenpastureharvestedandprofitinNewZealand.Intheir
research,supplementaryfeedcostsinNewZealand,comparedtomilkpricearethehighest
in the world, whereas feed price, relative to milk price is the least in the USA. Their
approachistousePKEwhengrassisnotavailable,suchasduringdrought.
Theyfocusonleavingagrazingresidualof1500kgDM/Ha,andonlyputfeedintoholdthe
rotationlength.Ifresidualsfallbelow1300,grassgrowthiscompromised.Theyaimtocalve
downwithacoverof2200to2300kgDM/Ha,dropto1900onbreakevendayandmanage
thisperiodwitha spring rotationplanner. Thisway theycanmakeearlydecisions. Their
objectiveistominimiseanysilage,andwillonlycutagenuinesurplus.
CEO,ColinGlass(2015)1saysthebusinessisnotshyofdebt,andthishasledtothebusiness
being able to expand and seize opportunities. Glass states, “If a balance sheet gets too
strong,managementgetlazy”.
Afterthe2008globalfinancialcrisis,DairyHoldingsrevieweditsriskprofile. Thekeycosts
thatwerethemostvariablepartoffarmexpenditurewerefeed,grazingandfertiliser.Inthe
periodfinancialyear(FY)2008toFY2011,thebusinessstrategicallyreducedcownumbers
tomorecloselymatchpasturegrowthratesandthereforereducedthebroughtinfeedper
43
cow.Thisleadtothebusinessreducingitsexternalgrazingandexposuretopurchasedfeed
risk.
The business is also not afraid to build internal capacity to give the total business cost
savings. Theyarenowself-sufficient forheifergrazing,afterpoorlygrownheifers, grazed
externally,werethenumberonecomplaintandexcuseforpoorperformance.Inadditionto
theyoungstockoperations, theynowhave11 farmsthatwintergraze27,000mixedaged
dairy cowsover thenon-lactatingmonths of June and July. This next year theywill have
1000 Ha of fodder beet for wintering of dry cows. Table 4, below, outlines the
disproportionateincreaseinheiferrearinganddrycowwinteringoverrecentyears.
Table 4. Relativemilk price andwintering costs in the South IslandofNewZealand. Source:Glass(2015)1 Milkprice($/kgMS) Winteringcostperweek2001 $5.00 $102014 $8.40 $30
Afterthe2013windevents,wherenumerouspivotirrigatorswereblownoverinthesouth
islandofNewZealand,DairyHoldingsinternalisedthisbusiness.Intheprocess,theyfound
thatsparepartsforthepivotswereapproximately2.5timesthevalueofnewirrigators.This
leadtochangeinthewaythebusinessoperated.
The business has also mitigated risk of availability of water for irrigation. They have
internalisedacontractingbusinessanddevelopedon-farmstorageofdairyshedeffluenton
approximately30farms.
Thereissomecentralisedpurchasing.However,theyonlytakecontractsifthereisaliftin
themarket.Thebusinessphilosophyistobuyonspotprices.Thisissothemoneystaysin
theirbusiness’sbankaccountandthefeedisn’ton-farm,whichwouldtemptpeopletofeed
it(andreducepastureutilisation).
44
Thebusinesshasnothedgedmilk.Thephilosophyisthatthebusinessshouldbeagileand
respondtomarketsignals. Takingafixedpricewouldmeanthatthebusinessdoesn’tfeel
the pain and therefore slower to respond to market signals. The approach is to have a
strongbalancesheettobeatspotpricing.Theviewisthatifabusinesswastofixorcommit,
it should take a similar viewevery year, and take the sameproportionsof feed andmilk.
Glass(2015)2said“overtime,no-oneisgoodenoughtobeatthemarket”.
Theyhave focusedon furtherdeveloping their irrigated landand typesof irrigation. They
havefoundthatirrigationgivestheFarmOperator(andtheoverallbusiness)theconfidence
topushthefarmhard.Theydonotwanttouseirrigationconservatively.Changingthetype
of irrigation increases pasture growth, as shown in Table 5. Furthermore, as the ease of
applicationincreases,thelowertheskilloftheFarmOperatorneeded.
Table 5. Relative pasture growth rates from the same volume of water used through differentapplicationmethods.Source:Glass(2015)1 Pasturegrown IncrementalcostBorderDyke(flood) 10T Rotarainer 12T $2,000Pivot 16T $4,000
DairyHoldingsbenefitfromasimplebusinessmodelthathaslowlevelsofbrought-infeed.
Thismeansthebusiness isapermanent low-costproducer. Thisbusinessalsoshowshow
businesses evolve and grow, with a constant CEO and relatively consistent owners. The
business measures the key performance indicators of each farm and these are
communicatedtoeveryoneinthebusiness.Thisbusinesshasacriticalfocusoncosts,andis
happy tomanage spotpricing. They see their stable, variable-order sharefarmersachieve
improvedperformanceyear-after-year.Datadrivestheirdecisionsandgainscomeinsmall
steps.
3.3.4 MyFarm
MyFarmgoesthroughtheprocessofestablishingamanagementsystemandthensyndicates
theinvestment.TheFarmManagerandAgribusinessManagerthenoperatethefarmtothis
plan. Forexample, inthe InformationmemorandumfortheTePahauLimitedPartnership
45
(May,2014), there isadetailedpropertyoverviewandbusinessplanfortheasset. Inthis
memorandum, they also detail the “procurement power” of the MyFarm Management
group, and state that gains are between 3% and 15% and therefore cover the cost of
approximatelyonethirdoftheMyFarmmanagementfee.MyFarmalsostatethey“consider
feedpricetrendsandrecommendthetake-upoflongertermfeedcontracts”totheBoardof
managementofthesyndicate.
FelixMcGirr (2015) saysMyFarm generally feeds cows better thanmost dairy farmers in
New Zealand. This is partially to ensure cow condition and also tomaintain theMyFarm
brand. “OneMyFarm ContractMilker canmakeMyFarm look really good or really bad”
(McGirr,2015).Therefore,ContractMilkerselectioniscriticaltothesuccessofthesyndicate
and to MyFarm. The Agribusiness Manager is accountable for the appointment of the
ContractMilker.
Theygenerallybasetheirfarmingsystemonbringingin700kgofsupplementaryconcentrate
(grainand/orPKE)percow.However,McGirr(2015)saysthefarmmust“neverlosesightof
the pastures”. Interestingly, MyFarm have, in some parts of the business, responded to
changes inmilkprices. In2013, they increased supplementary feedingofbrought in feed
fromSeptemberon someSouthland farms. ThiswasdonewithBoard approval. Overall,
theybroughtinanadditional300kgDMpercowoffeed,whichleadtoanextra70kgofmilk.
Thiswas,inpart,duetoimprovementandapparentfullutilisationofpasture.Inthecurrent
year,withadropof$3perkilogramofmilksolids,theystrippedoutcostsforfeedandcows
at the first quarterly review in October. MyFarm are also aware of the impact that this
decisionwillhaveonaContractMilker
3.4 USA Farm Business Visits 3.4.1FederalmarginprotectiontoolsforUSDairyFarmers
Government support formilk pricingwas undergoing structural change in 2014. Allprice
supporthadbeenremovedwiththeintroductionofmarginprotectioninsurance.TheFarm
Bill 2014- Dairy, introduced aMargin Protection Program (MPP) (MPP (Dairy) Fact sheet,
46
June 2015). MPP is a voluntary riskmanagement program looking atmargin protection.
Producersneedtoenrolfortheprogram,whichwillbeinplaceuntil2018.Eachyear,milk
producers can take out insurance through the United States Department of Agriculture
(USDA) to protect a margin. Different premiums buy different levels of insurance. The
backgroundforthemodelwastheUSDA’scropinsuranceprogram.
FortheMPP,theUSDAcalculatesafeedcost(soy,corn,alfalfa)andtheAllMilkprice.Thisis
usedtocalculatethemargin.Thereisnolinktotheindividualfarm’scostsormilkprice,and
noadjustmentsforstates.Thereisfreecatastrophicprotectionforamarginoflessthan$4
(themaximum is $8). The aimof theprogram is topreventdairyproducers goingoutof
businesswhenmarginsdropbelow$4.Forthelast10years,theaveragemarginisaround
$8,withpeaksof$15in2007and2014,andlowsof$2.50in2009andlate2012.Producers
cancommitbetween25%and90%oftheirmilk(in5%increments)foramarginbetween$4
and $8 in 50c increments (MPP (Dairy) Fact Sheet, 2014). There is a break point for
premiums for more than 4 million pounds of milk. This would be the equivalent annual
productionfroma200-cowherd.Thisappearstobeanincentivetoprotectsmallfarmers.
Thisprogramhas thepotential tochangethe landscapeofhowdairy farmersusehedging
tools in their business. For an administration fee of $100 per year, any and every dairy
producer can effectively insure 95% of their milk for a margin of $4.
(http://www.futurefordairy.com/).Specifically,theMPPwasseentoreducethenumberof
peopleonforwardcontracts.
There was a general view from the businesses visited that these types of government
programswere not useful to the industry as awhole. This, in part,was reflective of the
farmsvisited;large,familyrunbusinesses,whichwereoftenintegratedwithprocessing.The
issuewiththeprogramswasthattheychangedbehavioursoffarmerstoacceptandplanfor
asafetynet.Theprogramwasalsocriticisedforkeepingsmallproducersintheindustry.
47
3.4.2BidartDairies,California
BidartDairyFarmsisbasednearBakersfieldinCalifornia.Theymilk9900cowsthroughfour
35persidedoubleupparloursononesite.JohnBidart,athirdgenerationdairyfarmer,runs
thebusiness.
JohnBidartalsositsontheBoardofCaliforniaDairies.CaliforniaDairies,Inc.isthelargest
member-ownedmilkmarketingandprocessingcooperativeinCalifornia,processing47%of
California’smilk. Co-ownedbymore than410dairyproducerswho ship18billionpounds
(8.165billionkilograms)ofmilkannually,CaliforniaDairies,Inc.isamanufacturerofquality
butter, fluidmilk products andmilk powders. California Dairies process 10% of theUSA’s
milk, 45% of California’s milk and are responsible for 12% of all US exports.
(www.californiadairies.com)
Withinhisbusiness,Johnmanagestheprocurementoffeed.Theyhave7,000acres(2832.8
Ha)forgrowingtheirownforages.Theyprocurecorngluten,millrun,canola,drydistiller’s
grain (fromethanol plants) and almondhulls. His approach to procurement has changed
overthe last fiveyears. Theyusedtohavecontracts forat leastoneyearout. Theythen
movedtomorespotpricepurchases. Nowtheyhaveestablishedandbuy inprice (value)
ranges.Theywillbuymoreaspricesdrop,andmovefromonesourceoffeedtoanotheras
prices rise. Forexample,at thetimeofmyvisit inOctober2014, therewasnosoy in the
rationduetopriceandtheywereusingcanola.
BidartDairyFarmsdoesnottakepositionsonmilkprice;JohnBidart(2014)statedthatyou
“can’tbeattheguysinthesuits”.
3.4.3FernandesBrothers,California
JaredFernandesmanagestheriskprofileofthedairybusiness.Hedoesthebuyingoffeed,
andhedgesmilk. Forbuying feed, heuses abusiness calledCommodities Pluswhowork
with about 30 dairies. They change a retainer and provide their clients with market
informationandleveragetheircombinedsizeforbetterprocurementoptions.Basedonthe
48
pricing of different feed options, Jerrod then speaks with nutritionist and rations are
adjusted.
Formilkpricing,Fernandesknowshisrelativecostsofproduction,andgenerallyusestools
toallowhimtosellofftothetopofapricerangetoprotectthefloormilkpricing.Asforall
producersinCalifornia,thebasisisdifferent,whichdoescreatesomechallengesforrelative
pricing. Jerrod believes that very few other Californian dairy farmers are using similar
approachestomanagerisk.Hisphilosophyisthattheywon’tmakealotofmoney(fromthe
pricespikes)butwillstayinbusiness.
Fernandes alsouses aweb-based tool tomanageprice risk. The tool uses three years of
financialstodevelopoperatingcosts,includingfeedcosts,rationsandcosttofeed.Thetool
thenallowsfortheanalysisofwhathedgingwoulddoforthebusiness.Itusesalinktoasoy
and corn equivalent (which can be traded on the ChicagoMercantile Exchange (CME). It
takestheapproachthatallfeedisboughtontothefarm.Itdevelopsasensitivityanalysisof
margin and shows the effect of forward selling milk. Jared was keen to point out the
differencesbetweenprotectingamarginandlockingamargin.Ifamarginwaslocked,there
wasnoupsidepotential.
3.4.3.1 Other external impacts of price risk management
OneofthelargestriskstotheFernandes’businessisthelackofwater.Theyhadneverreally
thoughtaboutwater,butoverthe last fiveyears, it isnowaconsiderable issue. Theyare
nowmovingawayfromgrowingcorntogrowingsorghum,asitismorewaterefficient.
Fernandesreportedthathehasexperiencedinputfrombanksthatwillreduceinterestrates
for farmers who lockmilk price. This was the first report of banks financially rewarding
producersfortheactivemanagementofpricerisk.
49
3.4.4RedtopDairy,California
RedtopDairy is runbyManagingPartner, ScottWickstrom,a fourthgenerationdairyman.
Theydescribethemselvesasalargefamilyfarm,milking4,000jerseycows.InOctober2014,
average production was 4.8% fat, 3.8% protein and 63 pounds (28.58kg) per day. It is
understoodtobethelast large-scaledairyfarmbuilt inCalifornia. Buildingcommencedin
1999,buttooksevenyearstocompleteconstruction.Thedelaywastopreventthethreatof
litigation as during the period, the bulk of changes to environmentalmanagement codes
took place. At the time, USD$350,000 (up to the beginning of the building process) was
spenttogetenvironmentalconsentsandlicences.Itisnowunderstoodthatnocountiesin
Californiaareissuingenvironmentallicencesfornewdairyfarms.
At Redtop they have twophilosophies: produce and buy feed as cheaply as possible, and
makethehighestproductionaspossibleofthehighestvaluemilk.Wickstrom(2014)says
“theyneverwanttosacrificeproduction”.
TheyseeCaliforniaasagreatlocationforpurchasingfeedstuffs,anduseupto15ingredients
intheir rations. These ingredients includecornsilage,wheatsilage, lucerne,wholecotton
seed, dried distillers grain, almond hulls, pomegranate, tomatoes, onion, grape pumice
(squishedgrapes),soyhulls,canola, rolledcornandcerealgrains. Theygrow95%oftheir
cornandwheatsilage,andbuy50%of lucernehayandsilage. TheyarepayingUSD$350/
metrictonneforlucernehayat22%protein.ThiscompareswithcornsilageatUSD$80per
metricwettonne(USD$240TDM)landedonfarm.
Theyuseafeedbrokertoprocurefeedingredients.Thebrokerwillengagedirectlywiththe
nutritionistiftheyseeanopportunitywithafeedtype.Thebrokeralsoorganisesdelivery.
They lock in some feed ingredients that are standard; they do this based on a monthly
forwardprojectionofvolumes.
50
Theydonotcurrentlyhedgemilk.Theyhaddonesimplecheesecontractsfor3monthsor
60days.Theydidthisover10yearsago,butnowlooktootheropportunitiestoprotecthe
bottomline.
Theyusedanumberofapproachestoprotectaftertaxdollars. Thisincludedoptionsfrom
the Co-Op to allow for the deferring of milk income. They also have the option with
suppliers to pre-pay some expenses. Their focus on protectingafter-tax dollars was very
impressive,andwastheonlybusinessvisitedthroughouttheworldthatarticulatedsucha
focus.
Their approach tomilk pricingwas to let it ride themarket. Wickstromused 2014 as an
example, stating “no-one saw the price increase coming” (2014). He also outlined that
havingastrongrelationshipwithyourbankiskey.Dependingondebtgearing,manybanks
requiredairybusinessestopre-payfeesandestablishanadditional lineofcredittotakea
position.
3.4.4.1Environmentalregulationandrisk
Wickstrom outlined that the biggest risk, and where he spent bulk of his time, was in
environmental management. In 15 years, it has gone from minimal time to a massive
management input. This has been as a result of changes to the Californian political
environment;underpinnedbyalargeurbanpopulation.Wickstromacknowledgestoomany
things were not environmentally stable, but considers it has now gone to excess. For
example,recordsneedtobekeptofhowmanyhoursageneratorruns,thenumberoftyres
coveringasilagestackisauditedandtheyhavejusthadtochangefromsixinchtofourinch
stickersonpressurisedvessels.Asabusiness,theyhavetohireexpertstobecompliantand
toobtainpermits.Scottisfrustratedthatitisnotdoneforthebenefitoftheenvironment,
“it'sdoneforCMA”(covermyarse).
Twentyyearsago,dairy farming inCaliforniawasperceivedtobethebestbusinessmodel
with inexpensive landandabundantwater. Producers couldeasily and cheaplybuy feed.
51
This has now changed, with demand from other industries such as nut trees and
horticulture,andiscompoundedbytheincreasingcostandreducedavailabilityofwater.
3.4.5NoblehurstFarms,NewYorkState
John Noble and his son, Christopher (eighth generation farmer) farm in upper New York
State. After their family arrived in the USA from Scotland and Ireland, they spent four
generations just feedingtheir families. Inthe1960’s,theyhad5sites,milking40cowson
eachsite,whichwaslargescaleforthetime.Theyhavenowexpandedtohave30peoplein
the business, including both family and non-family. Of these, 12 work every day on the
farms. In2009,theylostonethirdoftheirequity inthebusinesswithlowmilkpricesand
the global financial crisis; this lead to the business re-evaluating their objectives.
ChristopherreturnedtothebusinessinMay2009.
Theiraimistokeepaviablebusinessforthenextgeneration.Theirbusinessnowincludesa
farmmachinerybusiness,dairyfarmcontractmanagement,fivedairyfarmsmilkingatotal
of 5,000 cows anda commodity tradingbusiness. Their drivers are tobring clever young
people into agriculture, value-add to products and set the business up for subsequent
generations.Theirobjectivesaretobegoodstewardsofthe land,ofthefamilyandofthe
community.
They have internalised the monitoring, management and procurement of inputs. They
establishedLinwoodCommoditiesasabookkeepingandtradingcompany.Itisownedby9
businessesandtransactsover$20mperyear.Christopherhasanagribusinessdegreefrom
Cornellandhadworkedforasmallcommodityhedgefund,andforRabobankinNewYork,
foreightyears.HeworkswithDick,theinternalcommoditytradertomonitorandpurchase
inputs. They use trading ranges for different commodities and have buy-points. They
centralisethepurchasingoffeedthroughthecentraldesk,buteachfarmbuystheirownfuel
and consumables. They also look at alternative feed options, and Dick works with
nutritioniststoreviewoptions.Theyhavemovedfromusingonenutritionisttomultipleto
accessmoreinnovativethinking.
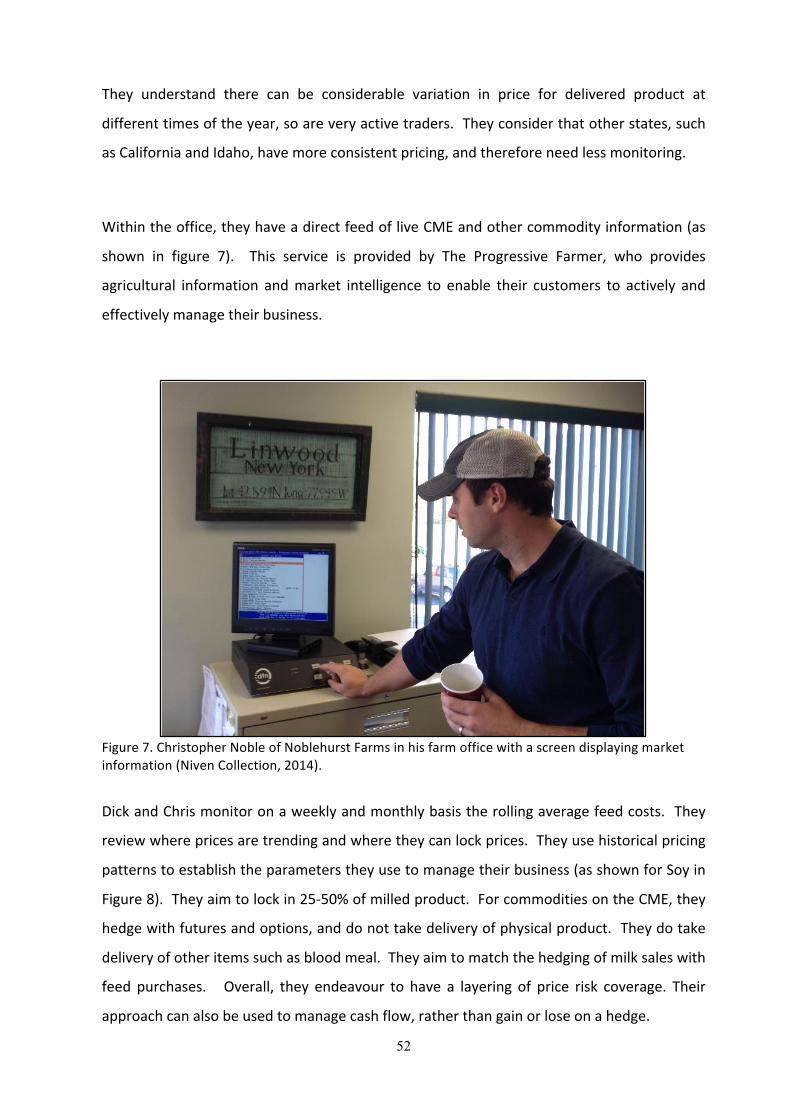
52
They understand there can be considerable variation in price for delivered product at
differenttimesoftheyear,soareveryactivetraders.Theyconsiderthatotherstates,such
asCaliforniaandIdaho,havemoreconsistentpricing,andthereforeneedlessmonitoring.
Withintheoffice,theyhaveadirectfeedofliveCMEandothercommodityinformation(as
shown in figure 7). This service is provided by The Progressive Farmer, who provides
agricultural information andmarket intelligence to enable their customers to actively and
effectivelymanagetheirbusiness.
Figure7.ChristopherNobleofNoblehurstFarmsinhisfarmofficewithascreendisplayingmarketinformation(NivenCollection,2014).
DickandChrismonitoronaweeklyandmonthlybasistherollingaveragefeedcosts.They
reviewwherepricesaretrendingandwheretheycanlockprices.Theyusehistoricalpricing
patternstoestablishtheparameterstheyusetomanagetheirbusiness(asshownforSoyin
Figure8).Theyaimtolockin25-50%ofmilledproduct.ForcommoditiesontheCME,they
hedgewithfuturesandoptions,anddonottakedeliveryofphysicalproduct.Theydotake
deliveryofotheritemssuchasbloodmeal.Theyaimtomatchthehedgingofmilksaleswith
feed purchases. Overall, they endeavour to have a layering of price risk coverage. Their
approachcanalsobeusedtomanagecashflow,ratherthangainorloseonahedge.
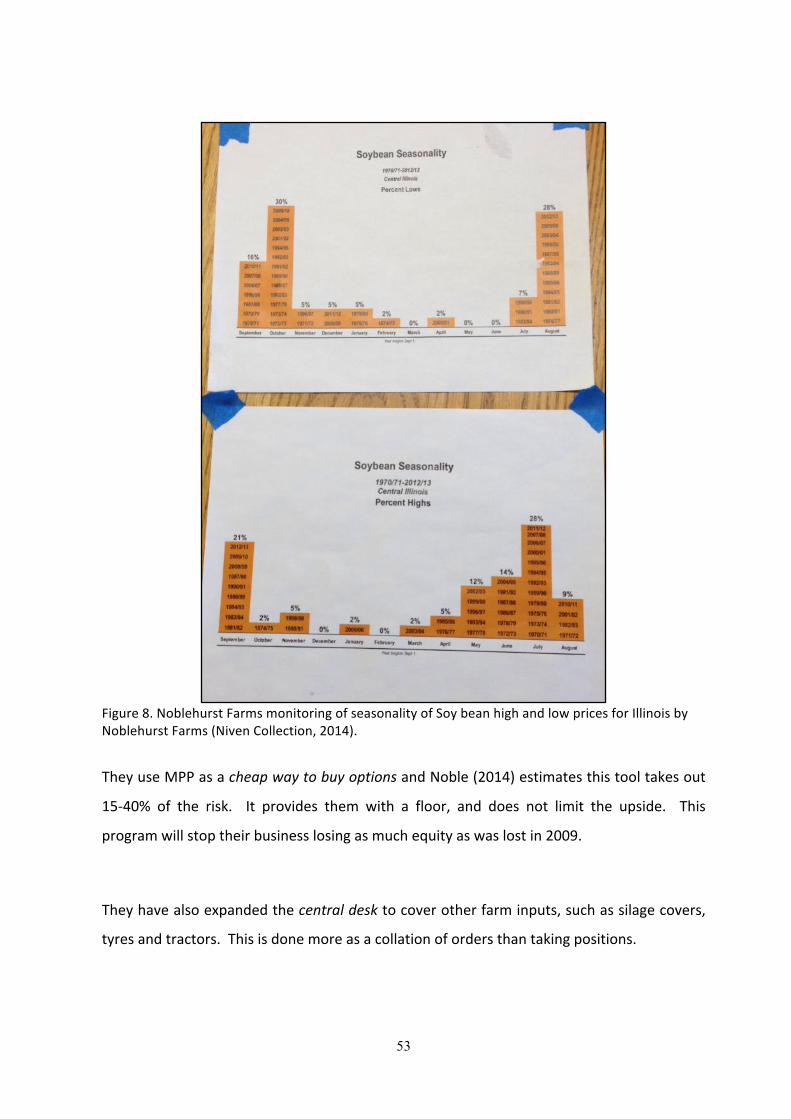
53
Figure8.NoblehurstFarmsmonitoringofseasonalityofSoybeanhighandlowpricesforIllinoisbyNoblehurstFarms(NivenCollection,2014).
TheyuseMPPasacheapwaytobuyoptionsandNoble(2014)estimatesthistooltakesout
15-40% of the risk. It provides them with a floor, and does not limit the upside. This
programwillstoptheirbusinesslosingasmuchequityaswaslostin2009.
Theyhavealsoexpandedthecentraldesktocoverotherfarminputs,suchassilagecovers,
tyresandtractors.Thisisdonemoreasacollationofordersthantakingpositions.
54
In October 2014, Noblehurst Farms were starting to commission a milk plant that made
crèmeandskimmilk;thenextphaseisartisancheese.Theirpointsofdifferentiationwere
thatallthemilkwasBSTfree,andtheplantusessustainableenergysources,suchassolar
panelsandenergyfromthebio-digesteronaneighbouringdairyfarm.Theplant isa joint
venture with dairy cooperative Dairy Farmers of America (DFA), with DFA the managing
partner.
3.4.6UnitedDairies,Minnesota
United Dairies (purchased 2003) operate three farms, eachwith 1500milking cows, near
Litchfield inMinnesota. Nick Ridgeway, a former banker, is the GeneralManager. They
calve all cowson theonedairy (UnionDairy) and thenmovemost first and some second
lactationcowstoWestlandDairy.SecondlactationcowsgotoCottonwooddairy.Cowson
their thirdormore lactation, or cows that transitionedpoorly, stay atUnion.UnionDairy
wasoriginallydesignedasaLandO’Lakes(dairycooperative)modelfarm.Theyalsobought
a20,000headbeeffeedlotinKansas(twostatesaway)wheretheyreartheirheifers.They
havechosenthismodel,asthecosttobuildaheiferfacilityinMinnesotawouldbetentimes
thepriceduetotherequirementsforallcowstobeinbarns.
Thebusiness isstructuredasfourfarmswithfourmanagers,andRidgewayastheGeneral
Manager.Anotherpartnermanagesoneofthefarms.EachfarmhasaP&Landreviewat
thebudgetandcostseverymonth.
Ridgeway’sroleincludesthemanagementofprocurementandhedging.Theyfocusonthe
purchasingofelectricityandusealocalcountycooperativetopurchasesomeoftheirpower
needs. Thecooperativetendersforthebestpricefromgeneratorsandusesthecollective
buyingpowertosecurelowercosts.
The business’ aim is tomaximise income, notmaximise production. Thiswas a different
philosophy tomostproducers inCalifornia. Ridgeway says thepartners (as investors) like
predictability. They aim tomakemoney every year, pay a dividend and increase equity.
55
Theyusehedgingandforwardpricingtogivethispredictability.Althoughtheyseetheserisk
management tools as useful, Ridgeway says the business must start with a low cost of
productionandthebestmanagementpractices.Thenthebusinesscanutilisethesetoolsto
supportthebusiness,notdrivethebusiness.
Theyhavedevelopeddetailedmodelstocalculatethepriceofcornsilage.Theyestablished
asystemwheretheybuytheseed(thatis,asthepurchaser,theychoosesthevarietytobe
grown)andthentheypayseventimestheethanolpricelessthebasispriceforcornsilage.
Thismodelhasworkedwell,buttheynowwanttoworktowardsalocalprice.Theyareinan
areawithanegativebasisprice,whichrangesfrom20cto$1.Theycontractgrow100%of
theircornsilage. Theymanagetheir lucernehaylageinasimilarway,andfixthepricefor
threeyears,whichisconsideredthelifespanofthestand(atfourcutsperyear).Ifsilageis
producedonafarm,theypaythesamepricesoastoensurethereisanaccurateandtrue
priceoffeed.
Asabusiness, they lock60%oftheir inputsand60%oftheiroutputs. Theaim is towards
65%, andpartnershave changed their viewon lockingprices. Theyunderstand theymay
loseoutonupsideprices,buttheyhaveprotectedtheirfloor.Ridgeway(2014)saysthekey
totheirbusinessistolockinaprofit,makeamargin,andacceptthatthey’llmissthetopof
themarket.
TheysellmilkusingafacilityfromcooperativeLandOLakes.Itcosts12cperhundredweight
(45.4kg)ofmilk.Theycoulddotheactivitythemselvesfor8cperhundredweight,butwould
needanadditionallineofcredittofundthetransaction.Theyaimtolockclass-threemilkat
thecostofproductionandthengetanextra$2to$3basedonpremiumsforcomponents,
SCCandquality. InMinnesota,dairyfarmersneedtobemembersofacooperativetosell
theirmilkasthereareonlyafewindependentbuyersofmilk.
NickplanstoenrolthebusinessintheMPP.However,whateverthebusinessdoes,theykey
is to ensure transparency of the decision-making. He recommends that all businesses
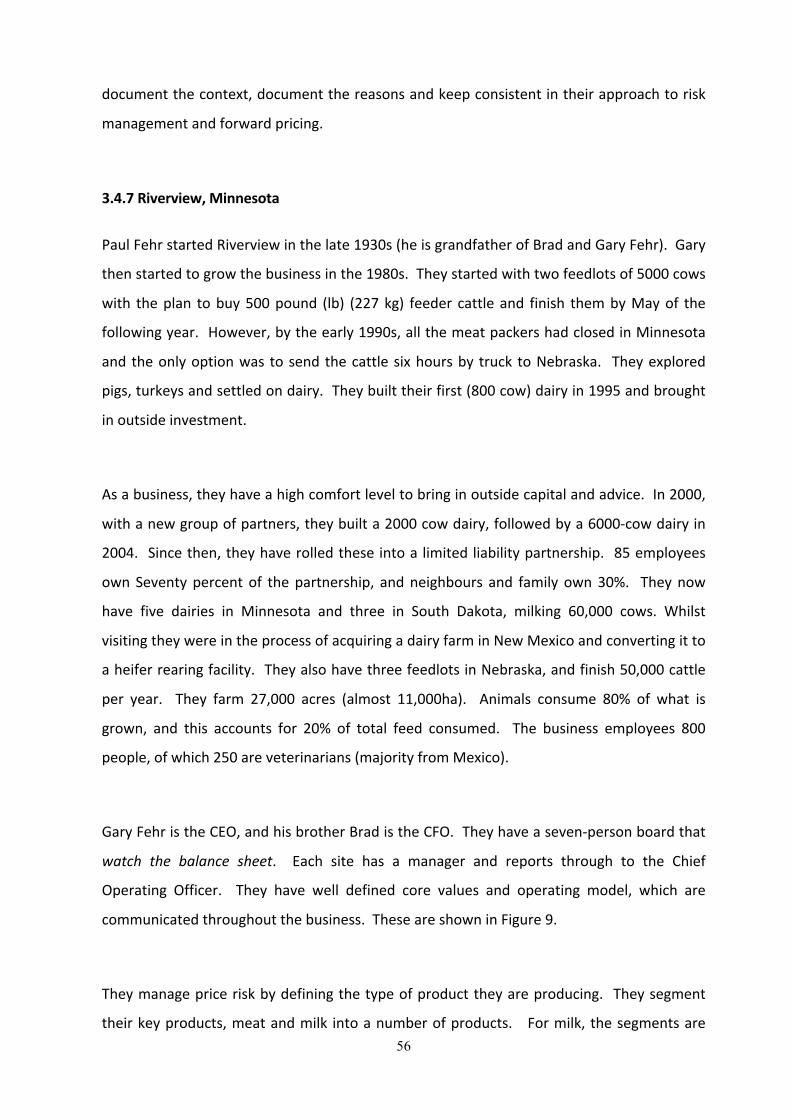
56
documentthecontext,documentthereasonsandkeepconsistentintheirapproachtorisk
managementandforwardpricing.
3.4.7Riverview,Minnesota
PaulFehrstartedRiverviewinthelate1930s(heisgrandfatherofBradandGaryFehr).Gary
thenstartedtogrowthebusinessinthe1980s.Theystartedwithtwofeedlotsof5000cows
with theplan tobuy500pound (lb) (227kg) feeder cattleand finish thembyMayof the
followingyear.However,bytheearly1990s,allthemeatpackershadclosedinMinnesota
andtheonlyoptionwas tosendthecattlesixhoursby truck toNebraska. Theyexplored
pigs,turkeysandsettledondairy.Theybuilttheirfirst(800cow)dairyin1995andbrought
inoutsideinvestment.
Asabusiness,theyhaveahighcomfortleveltobringinoutsidecapitalandadvice.In2000,
withanewgroupofpartners,theybuilta2000cowdairy,followedbya6000-cowdairyin
2004. Sincethen,theyhaverolledtheseintoa limitedliabilitypartnership. 85employees
ownSeventypercentof thepartnership, andneighbours and family own30%. Theynow
have five dairies in Minnesota and three in South Dakota, milking 60,000 cows. Whilst
visitingtheywereintheprocessofacquiringadairyfarminNewMexicoandconvertingitto
aheiferrearingfacility.TheyalsohavethreefeedlotsinNebraska,andfinish50,000cattle
per year. They farm 27,000 acres (almost 11,000ha). Animals consume 80% of what is
grown, and this accounts for 20% of total feed consumed. The business employees 800
people,ofwhich250areveterinarians(majorityfromMexico).
GaryFehristheCEO,andhisbrotherBradistheCFO.Theyhaveaseven-personboardthat
watch the balance sheet. Each site has a manager and reports through to the Chief
Operating Officer. They have well defined core values and operating model, which are
communicatedthroughoutthebusiness.TheseareshowninFigure9.
Theymanagepriceriskbydefiningthetypeofproducttheyareproducing. Theysegment
theirkeyproducts,meatandmilk intoanumberofproducts. Formilk, thesegmentsare
57
fromorganic tocommodity. Forbeef, theyseetensegments fromorganic tocommodity.
Within their beef business, they are all natural and hormone free. All except one of the
dairies are antibiotic free. They are BST free. They have changed the mindset from
treatmenttoprevention.Theyregularlyconductanimalwelfareauditsofthefarms.
They aremoving to all jersey genetics; they are about tomove to sexed semen and are
rearingaround40%replacementscurrently.Theircullrateiscurrently35%.
They use ten core ingredients in the cow’s diets. These included corn silage, lucerne,
distiller’s grain, canolameal, soyandamineralpack.Theyalsouse corn syrupby-product
and pressed beet pulp. They determine their own corn price, and silage produced by
neighboursispricedoffthisbase.TheysetapriceinMarchforLucernebaleage.Theysell
themanurebacktothefarmsasfertiliseranditisinjectedintotheground.Thisreducesthe
loss of nutrients and reduces odour. It alsomeans that there are fewermatters for the
people in the community to complain about. They use long term supply contracts with
neighbourstoprovidethefeedtheyneedfortheiroperation.
Thiswasthelargestdairybusinessvisited.OfallthedairyfarmsvisitedduringtheNuffield
scholarship,theRiverviewhomefarmwasthemostprofessional,hadthebestpresentation
(equalwithfarmsinCaliforniaandTheNetherlands)andhadworkhealthandsafetyatthe
centreofhowthebusinesswasrun.
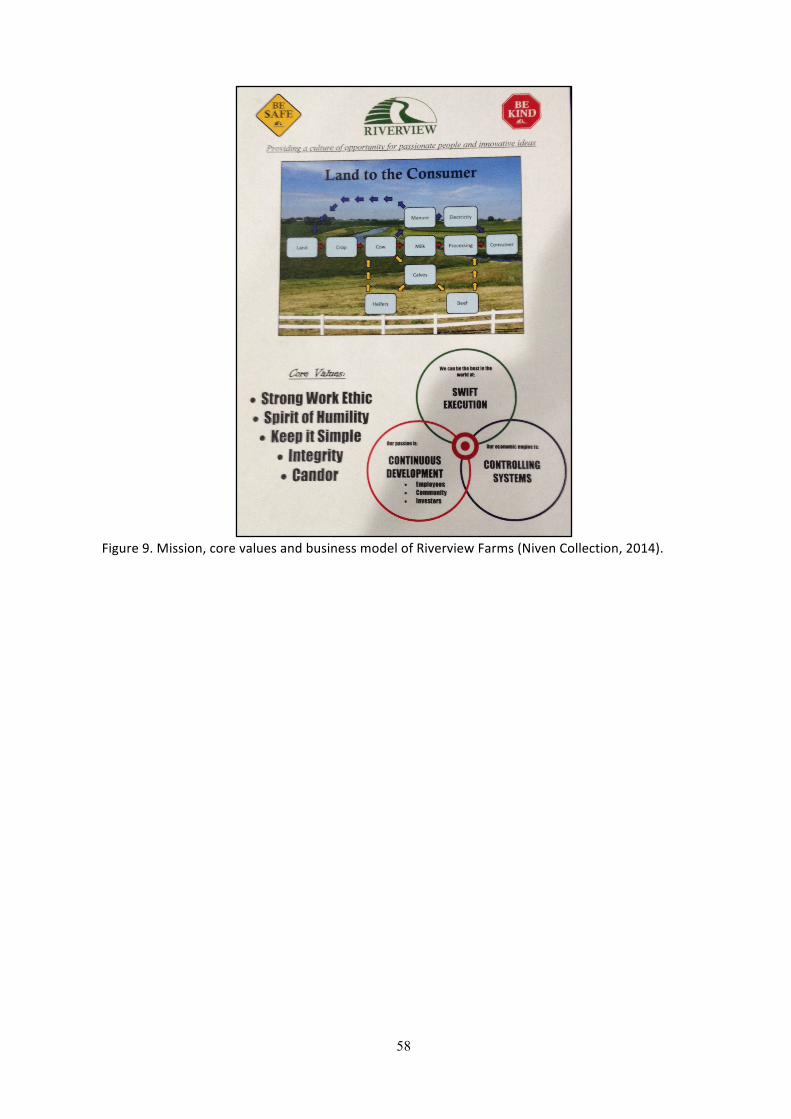
58
Figure9.Mission,corevaluesandbusinessmodelofRiverviewFarms(NivenCollection,2014).
59
3.5 USA Brokers and Markets 3.5.1INTLFCStone
INTL FC Stone is a Fortune 500 company that provides clients, across the globe, with a
comprehensiverangeofcustomisedfinancialservicesandtools tohelpthemprotect their
marginsandmanagevolatility.INTLFCStone'scustomersincludetheproducers,processors
and end users of virtually every major traded commodity; commercial counter-parties;
governmental, non-governmental and charitable organizations; as well as institutional
investors,brokers,professionaltraders,commercialandmajorinvestmentbanks.
Theyofferthesecustomersacomprehensiverangeofproductsandservices.Amongthese
services is their proprietary Integrated Risk Management Program (IRMP), as well as
exchange,andexecutionandclearingservicesdesigned to limit riskandenhancemargins,
and bottom-line results. They also support the physical trading in precious metals and
grains,aglobalforeignexchangeandcurrencypaymentservice,assetmanagement,equities
market-making,securitiesexecutionandtrading,andinvestmentbankingadvisoryservices.
ItwasapleasuretomeetwithRobertChesler,VicePresidentoftheFoodsDivision.Chesler
outlinedhowtheirbusinessprovidesservicestodairyproducers,andprovidedatourofthe
CME.Chesler’steamhavetoolsthatareusedbydairyfarmerstounderstandtheircostsand
managetheirrisk.Itbringsindetailsoftheration,andaddscostpercommodity,andcost
forkeycomponentssuchasprotein.Theyalsohavetheabilitytoaddinfixedcosts.With
this,theythenfocusthefarmertolookattheirmarginoverfeedcosts(MOFC).Withthese
parameters set, it allows the FC Stone advisor to show the producer their exposure to
different changes in feedandmilk costs. From there, the farmer,dependingon their risk
profile,maychoosetohedgefeedinputsormilk.
Likemanyclevertoolsdesignedbyindustryspecialists,thechallengeforFCStoneistohave
accesstoproducersandengagethemintheconversationaboutriskmanagement.FCStone
60
werelookingatnewanddifferentwaystoengageproducersintheconversationaboutprice
riskmanagement.
3.5.2RiceDairy
RiceDairy isaboutiquebrokeragefirm,offeringguidance,analysis,andexecutionservices
onfutures,options,spot,andforwardmarkets,specializing indairyandmarketsatdairy’s
periphery.Theyhelpproducersmakedecisions.Theyarebrokersratherthanapartnerin
thetransactiontakingamarginonly.Morerecently,theyareworkingwithsomeAustralian
basedcompanies.
InmeetingswithJonSpainhourandTrevorSlegers,andthenSlegersandfounderBrianRice
(inJulyandOctoberof2014,respectively)theysharedadeepunderstandingofthemilkand
inputmarketsintheUS.Since2007,whentheUSdairymarketbecamemoreexportaware,
they have expanded to lookmore at globalmilkmarkets and pricing. This resulted from
trading companies entering the butter market in the US to make money out of spreads
betweentheUSmarketandoverseasmarkets.
Priorto2007andthesubsequentintroductionoftheGlobalDairyTrade(GDT),theUSwas
notabletoeasilyaccessexportmarkets.SincetheGDT,ithasledtheUStofocusmoreinto
skimmilkpowerandcheese. Itwastheviewof thepeopleatRicethatNewZealandhad
considerable exposure to China, considering 50% of their dairy product is whole milk
powder,and100%ofitisexportedtoChina.NewZealandhadleftskimmilkpowder(SMP)
andcheese,andtheUShadenteredthismarket.However,withchangesinNewZealand’s
productionprofile(backtoSMPandcheese),thiswill leadtoapricedrop intheUS. The
real issuefortheUSdairyindustryisthespeedwithwhichprocessorscanswitchbetween
products. It’s not just aboutmaking product, it’s about having the customers ready, and
thenthehedgepositionsthattheproducer,processorandendusermake.
61
3.6 Limitations of the study
From aUS perspective, this study focused onmilk as one of the fourwhite commodities
(rice, sugar and cotton being the other three). This study did not investigate how
commodities in theUSA,notassociatedwithdairycows,were traded. Therewasgeneral
discussionthatdairyriskmanagementtoolswerenotasadvancedasforcorn,butthiswas
notinvestigated.ItwasalsomentionedthatthenewFarmBillwithmarginprotectionwas
modelledonthemechanisminplaceforcornfarmers.
ThisstudydidnotexplorethetoolsavailabletoEuropeanfarmers.Throughthemechanism
of the European CommonAgricultural Policy, theremay be tools that could be useful for
dairyfarmersoutsideEurope.
62
Chapter 4 Conclusions 4.1 Farm Management Systems
“Thechallengeforallbusinessesistheexpertiseofpeopleonthegroundtoimplementand
seniormanagement’sabilitytomonitorandmanage”RobertPoole(2015).
NewZealandandtheUSAeachhaveadominantprogramusedtomanagecowdata(Minda
and DC 305 respectively). Each of these programs also has associated and compatible
programsformanagingfeeding.Neitherofthesesystems,however,isdirectlytransferable
to an Australian pasture based dairy farm. In the case ofMinda, it is linked to the New
ZealandnationalcowdatabaseandthisexcludestheassimilationofAustraliandata.DC305
isdesignedforcows insheds,whereallanimalactivities,suchasbreedingandtreatments
aredoneinthepen.ThisisnotcurrentlyfullycompatiblewithanAustralianorNewZealand
systemwhereallanimalactivitiesaredoneinthedairyshed,andusuallywhilstmilking.
In both the USA and New Zealand,more work is required to have better portability and
functionalityofthedatabaseonsmallhandhelddevices.InsomeareasoftheUSAandmany
areasofNewZealand,Internetaccessisnotsufficienttooperatethesesystemsinrealtime.
Therearemanysolutionsinplace(Wi-Fianddailysyncing),butthesearenotyetideal.
4.2 Price Risk Management
Throughout the US and New Zealand, price fluctuations for inputs and outputs are
considered a usual part of the external operating environment for a dairy business.
However, there are very different ways that farmers in each country can manage the
businessriskcreatedbythepricefluctuations.
InAustraliaandNewZealand,dairyfarmersoftenusethefarmsystemasasurrogateforrisk
management.Farmersoftenchangetheirfarmsystemtomanagethepricerisksassociated
with brought in feed. InNewZealand, therewere views that a businesswithminimal or
63
evennobrought in feedwere less risky (andalsomoreprofitable) thanabusinesswhere
somefeedhadtocomeineveryyear. WithinanAustralianandNewZealandcontext,this
viewwasbasedontheissueofdrought.Duringanextendeddrought,feedpricesincrease
dramatically and in some regions, no feed would be available for purchase at any price.
Alternatively,somedairybusinesseschangetheirsystemtoincludeasetamountofbrought
in feed (usuallycerealgrainorPKE inNewZealand) to increasestockingrateand increase
production.
Analysisofdairybusinesses inNewZealandandAustralia,however, showthatall farming
systems,fromnosupplementthroughtohighsupplementcanbeasprofitableastheothers.
Therefore,itistimethatthedebatemovesfromwhichsystemisthemostprofitabletohow
doImakemysystemmostprofitable.
Throughout theUS andNew Zealand, the businesses thatwere themost profitable knew
their system, knew their costs and how to manage their costs. They had a clear
understandingof their feed costs, their feed requirement and themilk income from their
farm at different milk prices. The best businesses focused on having the best people
managingthekeybusinessdrivers.
Whenitcametotoolsavailabletodairyfarmerstomanagetheriskassociatedwithchanging
inputandoutputprices,therewerevastdifferencesbetweenthecountries.IntheUS,the
toolswerewelldeveloped,andcommonlyavailable;mostdairyproducershadusedsomeof
the tools at least for some inputs, for some time. ManyUSdairy businesses employed a
specific person to monitor input and output prices, and then buy physical product for
immediateordelayeddelivery,orusefuturesoroptionstotakealongtermposition.Most
businesseshada riskmanagementphilosophyas to thepercentageof feedandmilk they
wantedhedged.
Bycontrast,toolsavailablefortheNewZealanddairyfarmertomanagingriskarevirtually
non-existent.Mostproducersacceptedtheywerepricetakersformilkinaglobalmarket.
64
Everyone explained that they committed their business to produce milk without even
knowingtheprice theywouldreceive. Against thisbackdrop, theoverwhelmingapproach
wastobealowinputandthereforelowcostproducer.Inthelasttwoyears,FonterraNew
Zealandhadbeenoffering fixedmilkpricing foraproportionofa farmorbusiness’smilk.
Theuptakeofthistoolwasgreatestamongstcorporatebusinesses.
65
Chapter 5 Recommendations 5.1 Recommendations for Farm Management Systems
Thefollowingrecommendationsaremadetothemanufacturersofsoftwareprograms:
- Those companies operating in the USA, and other placeswhere cows are housed,
should consider the improvements to their offerings by looking at pasture-based
dairy farming where all activities are done in the dairy shed. This should lead to
improvedlabourefficiencyandfastercollectionofdata.(p15)
- The hand held devices available forMinda and DC 305 are robust, but are not as
user-friendly as they could be. Improving the hand held devices will improve
usability.ThisappliestotheUSmarketasmuchastheAustralianmarket.(pp23,24)
- Itisessentialforlargeherdswithmultiplestaffthatthehandhelddeviceshavethe
ability to electronically scan EID tags into the device to bring up cow information,
ratherthanrelyonmanualdataentry.(p23)
- There is opportunity for a software provider to develop and sell the overarching
architecture to link and consolidate animal, feed, and financial information to all
farmers, irrespectiveof size. Sucha systemwill improve thealignmentofphysical
and financial information toassistdairy farmersmanage theirbusiness. (pp20,21,
22)
Recommendationsfordairyfarmmanagementsystems
- For both software developers and dairy businesses looking to install a new farm
management system, separate the requirement of the software with the
functionalityofthehardware.(p14)
- Forbusinessesconsidering installingand implementing farmmanagementsoftware
(and hardware) consider both the initial set-up cost and the on-going resource
(peopleandmoney)tosupportandmaintainthesystem.(pp16,22)
- Internet coverage remains a considerable limitation to implementing a real-time
system inAustralia,New Zealand and parts of theUSA. Governments and service
providersneedtocontinueworkingonprovidingphoneandInternetaccesstorural
andregionalareas.
66
- All businesses that are embarking on implementing a farm management system
should looktohavethe leastnumberofdataentrypointsaspossible forthesame
informationtomaximiseefficiencies.(p18)
- The best system is one that is used throughout the organisation: from the person
puttingthecupsoncowsthroughtotheCEO(pp13,16,20,31)
- Businesses need to know the levers they can pull on business costs and milk
production-howfast,howmuch,andtheimpactofchangesovermanyyears.
- Ensure there is transparency in how records of physical parameters are converted
intofinancialdata.Thisallowsalllevelsofmanagementtolinkactionontheground
withimprovedfinancialperformanceofthebusiness.
5.2 Recommendations for Price Risk Management
Thefollowingapproachhasbeendesignedforanydairybusinessintheworld-irrespective
ofsize,ownershiporsystem,tomanagepricerisk.
1. Chooseanddefineyourfarmingsystem; it isnecessarytounderstand it inorderto
manageit.
2. Understand cost structures; understand the ranges for fixed and variable costs
betweenyearsandseasons.
3. Use benchmarks for your farming system and cost structure to look for
improvementsinthebusiness.
4. Understandthepricecyclesoffinancecosts,inputsandyouroutputs(milk).Itmay
benecessarytoseekadvicefromanadviserorexpert.
5. Setpricetriggerpoints for inputsandoutputs,andunderstandthefinancial impact
onthetotalprofitabilityofchanges
6. Decideonapriceriskmanagementstrategy.Thiscanvaryfromnoriskmanagement
throughto100%ofinputsandoutputsboughtatpre-determinedprices.
7. Getadviceonthetoolsavailabletoimplementapriceriskmanagementstrategy.
8. Commencemeasuring,monitoringandmanagingpricerisk.
9. Re-assessthepriceriskmanagementstrategyeverysixmonths,andpriortomaking
anyfarmsystemchanges.
67
Generalrecommendations
- Everydairybusinessmustunderstand,measure,monitorandmanagetheirtopthree
physicalandfinancialKPIs(pp20,21,31,32,35,36)
- Consider the lead indicators for the future success of the business. Retrospective
KPIsarenotusefulformanagingfuturebusinessrisk.(p.37)
- WithinAustraliaandNewZealand,itistimetomovethedebatefromwhichsystemis
themostprofitabletohowdoImakemychosensystemmostprofitable.(p.29)
- Withrareexception,dairyfarmersmustacceptthattheyareinacommoditymarket
andpriceswill fluctuatefor inputsandoutputs. It is thereforenecessarytohavea
systemtoaccessandmonitorcommodityprices.(p.12,35,38)
- Dairy businesses need to access professional advice and information. This can be
throughexternalsupportor,fora largebusiness,bringingthisservice in-house.(pp
38,40,42)
- Whenmakingbusinessdecisions tomitigateprice risk, thecontext for thedecision
should be documented. This is importantwhen others in the organisation review
thesedecisionsatalatertime.
- The development of DairyBase Australia, the Australian national database of dairy
farmperformance,needstobeapriority.Thiswillassistfarmerstobenchmarktheir
businessesandoptimiseperformance.
68
References Allan, J andWolfert S (2012). Farming for the Future- towards better information-baseddecision-makingandcommunication.Phase1:Australasianstocktakeoffarmmanagementtools used by farmers and rural professionals. Centre of Excellence in Farm BusinessManagement.Bidart,J(October2014).Personalcommunication.BidartDairy.Bakersfield,California.USA.Chestler,R(July2014).Personalcommunication.INTLFCStone.Chicago,Illinois,USA.Cook,LandJohnson,M(February,2015).Personalcommunication.WairakeiEstate,Taupo.Landcorp,NewZealand.DairyAustralia(2013).AustralianDairyIndustryinFocus2013.FarmingforNZ(2014).LandcorpFarmingLimited,AnnualReport2014.Fehr,B(October,2015).Personalcommunication.CFO,Riverview.Minnesota,USA.Fernandes,J(October2014).Personalcommunication.FernandesDairy.Hanford,California.USA.Glass,C(February2015)1.FromapresentationtoLICShareholdersCouncil,Ashburton.NewZealand.Glass,C(February2015)2.Personalcommunication.CEO,DairyHoldings.NewZealand.International Farm Comparison Network (IFCN) (2012) Dairy Report 2012 – For a betterunderstandingofmilkproductionworldwide.McGirr, F (February, 2015). Personal communication. Agribusiness Manager, MyFarm,Canterbury.NewZealand.McLeod, P (February, 2015). Personal communication.GeneralManager-Dairy, CraigmoreSustainables.Canterbury.NewZealand. Margin Protection Program for Dairy (MPP-Dairy) (June 2014) 2014 Farm Bill Fact Sheet,FarmServicesAgency.UnitedStatesDepartmentofAgriculture.MyFarm(2014).YourGuidetoworkingwithMyFarm.MyFarmLimited(May2014)TePahauLimitedParnershipInformationMemorandum.NewZealandDairy Statistics (2014) Livestock ImprovementCorporation Limited andDairyNZLimited.
69
Noble,C (October2014).Personalcommunication. NoblehurstFarms.Linwood,NewYorkState.USA.Pink,K(2003).WindsofChange-ahistoryofWoolnorth.Phelan, D.C, Kemmerer, E and Parsons, D (2014). Planning for climate change: spatialinterpolationofpastureyieldsinnorth-westTasmania.Performance,ProfitandRiskinPasture-basedDairyFeedingSystems(2011).FindingsfromtheTasMilk60study.ProducedbyDairyAustralia’sGrainstoMilkProgram.DairyAustralia.Poole, R (February, 2015). Personal communication. VDLBoardDirector. Taranaki,NewZealand.Pye, M (February, 2015) Personal communication. Director, Pye Group. Temuka, NewZealand.Rice,BandSlegers,T(October,2015).Personalcommunication.RiceDairy.Chicago,Illinois,USA.Ridgeway,N (October, 2015). Personal communication. GeneralManager,UnitedDairies.Minnesota,USA.Shadbolt, N (2012) Comparative strategy analysis of NZ pastoral dairy farming systems.InternationalJournalofAgriculturalManagement1:3pp19-27.Spainhour,JandSlegers,T(July,2015).Personalcommunication.RiceDairy.Chicago,Illinois,USA.Wickstrom,S(October2014).Personalcommunication. RedTopDairy.Merced,California.USA.
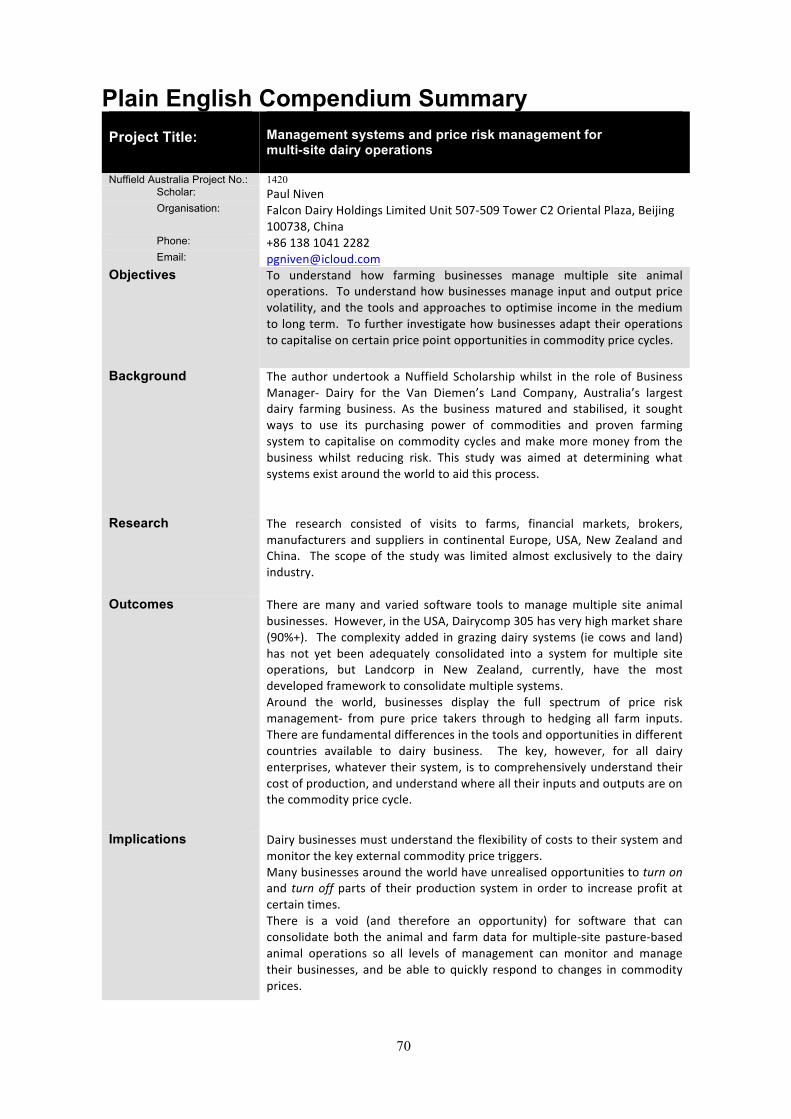
70
Plain English Compendium Summary Project Title:
Management systems and price risk management for multi-site dairy operations
Nuffield Australia Project No.: 1420 Scholar: PaulNiven Organisation: FalconDairyHoldingsLimitedUnit507-509TowerC2OrientalPlaza,Beijing
100738,China Phone: +8613810412282 Email: [email protected] To understand how farming businesses manage multiple site animal
operations. Tounderstandhowbusinessesmanage inputandoutputpricevolatility,andthetoolsandapproachestooptimise income inthemediumtolongterm.Tofurtherinvestigatehowbusinessesadapttheiroperationstocapitaliseoncertainpricepointopportunitiesincommoditypricecycles.
Background The author undertook aNuffield Scholarshipwhilst in the role of BusinessManager- Dairy for the Van Diemen’s Land Company, Australia’s largestdairy farming business. As the business matured and stabilised, it soughtways to use its purchasing power of commodities and proven farmingsystemtocapitaliseoncommoditycyclesandmakemoremoney fromthebusiness whilst reducing risk. This study was aimed at determining whatsystemsexistaroundtheworldtoaidthisprocess.
Research The research consisted of visits to farms, financial markets, brokers,manufacturersand suppliers in continental Europe,USA,NewZealandandChina. The scope of the studywas limited almost exclusively to the dairyindustry.
Outcomes There aremany and varied software tools tomanagemultiple site animalbusinesses.However,intheUSA,Dairycomp305hasveryhighmarketshare(90%+). The complexityadded ingrazingdairy systems (ie cowsand land)has not yet been adequately consolidated into a system for multiple siteoperations, but Landcorp in New Zealand, currently, have the mostdevelopedframeworktoconsolidatemultiplesystems.Around the world, businesses display the full spectrum of price riskmanagement- from pure price takers through to hedging all farm inputs.Therearefundamentaldifferencesinthetoolsandopportunitiesindifferentcountries available to dairy business. The key, however, for all dairyenterprises,whatevertheirsystem, is tocomprehensivelyunderstandtheircostofproduction,andunderstandwherealltheirinputsandoutputsareonthecommoditypricecycle.
Implications Dairybusinessesmustunderstandtheflexibilityofcoststotheirsystemandmonitorthekeyexternalcommoditypricetriggers.Manybusinessesaroundtheworldhaveunrealisedopportunitiestoturnonand turnoffpartsof theirproduction system inorder to increaseprofit atcertaintimes.There is a void (and therefore an opportunity) for software that canconsolidate both the animal and farmdata formultiple-site pasture-basedanimal operations so all levels of management can monitor and managetheir businesses, andbe able to quickly respond to changes in commodityprices.