Embed Size (px)
Citation preview

Encana Corporation
Management’s Discussion and Analysis
For the period ended September 30, 2013
(Prepared in U.S. Dollars)

Management’s Discussion and Analysis Encana Corporation Prepared using U.S. GAAP in US$ 1
Management’s Discussion and Analysis
This Management’s Discussion and Analysis (“MD&A”) for Encana Corporation (“Encana” or the “Company”) should be read with the unaudited interim Condensed Consolidated Financial Statements for the period ended September 30, 2013 (“Interim Condensed Consolidated Financial Statements”), as well as the audited Consolidated Financial Statements and MD&A for the year ended December 31, 2012. The Interim Condensed Consolidated Financial Statements and comparative information have been prepared in accordance with United States (“U.S.”) generally accepted accounting principles (“U.S. GAAP”) and in U.S. dollars, except where another currency has been indicated. Production volumes are presented on an after royalties basis consistent with U.S. oil and gas reporting standards and the disclosure of U.S. oil and gas companies. The term “liquids” is used to represent oil, natural gas liquids (“NGLs”) and condensate. The term “liquids rich” is used to represent natural gas streams with associated liquids volumes. This document is dated October 22, 2013. Certain measures in this document do not have any standardized meaning as prescribed by U.S. GAAP and, therefore, are considered non-GAAP measures. Non-GAAP measures are commonly used in the oil and gas industry and by Encana to provide shareholders and potential investors with additional information regarding the Company’s liquidity and its ability to generate funds to finance its operations. Non-GAAP measures include: Cash Flow; Operating Earnings; Revenues, Net of Royalties, Excluding Unrealized Hedging; Net Debt to Debt Adjusted Cash Flow; Debt to Debt Adjusted Cash Flow; Adjusted Earnings Before Interest, Taxes, Depreciation and Amortization (“Adjusted EBITDA”); Debt to Adjusted EBITDA; and Debt to Adjusted Capitalization. Further information can be found in the Non-GAAP Measures section of this MD&A, including reconciliations of Cash from Operating Activities to Cash Flow and of Net Earnings to Operating Earnings. Readers should also read the Advisory section located at the end of this document, which provides information on Forward-Looking Statements, Oil and Gas Information and Currency and References to Encana.
Encana’s Strategic Objectives Encana is a leading North American energy producer that is focused on developing its strong portfolio of diverse resource plays producing natural gas, oil and NGLs. Encana is committed to growing long-term shareholder value and paying dividends. The Company is pursuing the key business objectives of maintaining financial strength, optimizing capital investments in its highest return projects, maximizing profitability through operating efficiencies, reducing costs and leveraging flexibility through market fundamentals. Encana also actively advocates expanding the use of natural gas in North American power generation, transportation and industrial applications. Encana is in the process of developing a new strategy, which is expected to be implemented in 2014. Encana has a history of entering prospective plays early and leveraging technology to unlock resources and build the underlying productive capacity at a low cost. Encana continually strives to improve operating efficiencies, foster technological innovation and lower its cost structures, while reducing its environmental footprint through resource play optimization. The Company’s resource play hub model, which utilizes highly integrated production facilities, is used to develop resources by drilling multiple wells from central pad sites. Ongoing cost reductions are achieved through repeatable operations, optimizing equipment and processes, by applying continuous improvement techniques. Encana hedges a portion of its expected natural gas and oil production volumes. The Company’s hedging program reduces volatility and helps sustain Cash Flow and netbacks during periods of lower prices. Further information on the Company’s commodity price positions as at September 30, 2013 can be found in the Results Overview section of this MD&A and in Note 17 to the Interim Condensed Consolidated Financial Statements. Additional information on expected results can be found in Encana’s 2013 Corporate Guidance on the Company’s website www.encana.com

Management’s Discussion and Analysis Encana Corporation Prepared using U.S. GAAP in US$ 2
Encana’s Business Encana’s reportable segments are determined based on the Company’s operations and geographic locations as follows:
� Canadian Division includes the exploration for, development of, and production of natural gas, oil and NGLs and other related activities within Canada.
� USA Division includes the exploration for, development of, and production of natural gas, oil and NGLs
and other related activities within the U.S. � Market Optimization is primarily responsible for the sale of the Company's proprietary production. These
results are included in the Canadian and USA Divisions. Market optimization activities include third party purchases and sales of product that provide operational flexibility for transportation commitments, product type, delivery points and customer diversification. These activities are reflected in the Market Optimization segment.
� Corporate and Other mainly includes unrealized gains or losses recorded on derivative financial
instruments. Once amounts are settled, the realized gains and losses are recorded in the reporting segment to which the derivative instrument relates.
Market Optimization sells substantially all of the Company's upstream production to third party customers. Transactions between segments are based on market values and are eliminated on consolidation. Financial information is presented on an after eliminations basis within this MD&A.
Management’s Discussion and Analysis Encana Corporation Prepared using U.S. GAAP in US$ 3
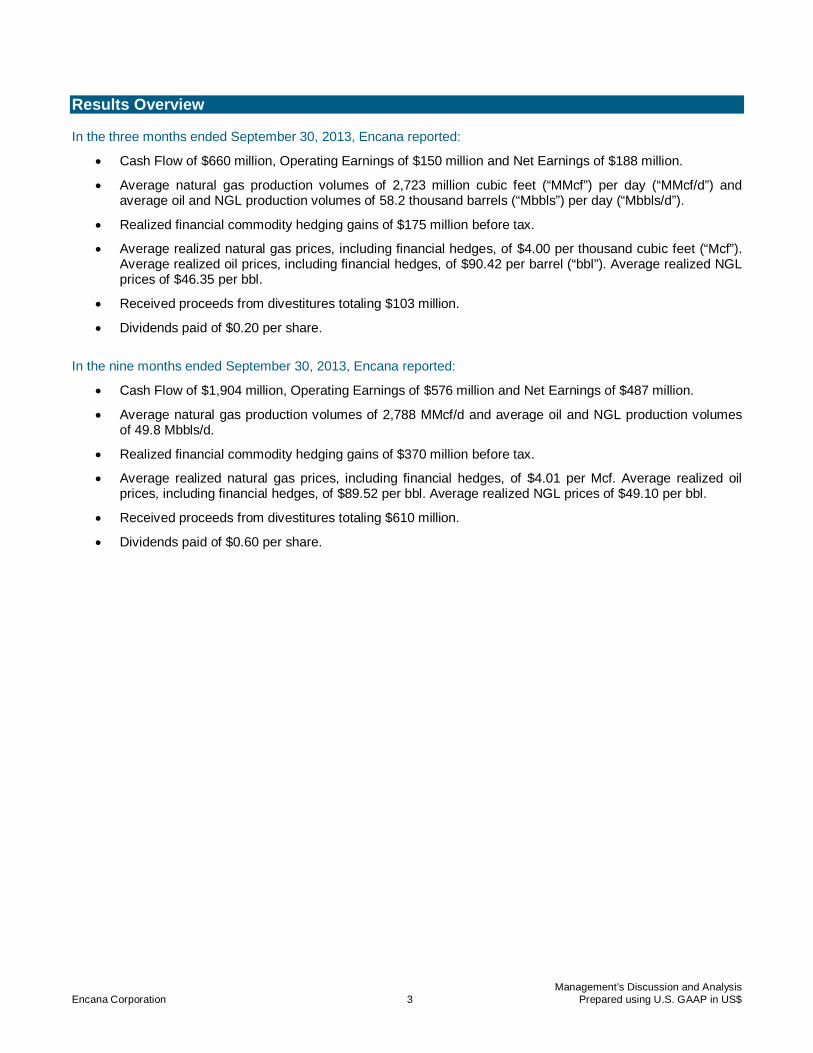
Results Overview In the three months ended September 30, 2013, Encana reported:
� Cash Flow of $660 million, Operating Earnings of $150 million and Net Earnings of $188 million.
� Average natural gas production volumes of 2,723 million cubic feet (“MMcf”) per day (“MMcf/d”) and average oil and NGL production volumes of 58.2 thousand barrels (“Mbbls”) per day (“Mbbls/d”).
� Realized financial commodity hedging gains of $175 million before tax.
� Average realized natural gas prices, including financial hedges, of $4.00 per thousand cubic feet (“Mcf”). Average realized oil prices, including financial hedges, of $90.42 per barrel (“bbl”). Average realized NGL prices of $46.35 per bbl.
� Received proceeds from divestitures totaling $103 million.
� Dividends paid of $0.20 per share.
In the nine months ended September 30, 2013, Encana reported:
� Cash Flow of $1,904 million, Operating Earnings of $576 million and Net Earnings of $487 million.
� Average natural gas production volumes of 2,788 MMcf/d and average oil and NGL production volumes of 49.8 Mbbls/d.
� Realized financial commodity hedging gains of $370 million before tax.
� Average realized natural gas prices, including financial hedges, of $4.01 per Mcf. Average realized oil prices, including financial hedges, of $89.52 per bbl. Average realized NGL prices of $49.10 per bbl.
� Received proceeds from divestitures totaling $610 million.
� Dividends paid of $0.60 per share.

Management’s Discussion and Analysis Encana Corporation Prepared using U.S. GAAP in US$ 4
Financial Results
Nine months ended
September 30
2013
2012 2011
($ millions, except per share) 2013 2012 Q3 Q2 Q1 Q4 Q3 Q2 Q1 Q4 Cash Flow (1) $ 1,904 $ 2,728 $ 660 $ 665 $ 579 $ 809 $ 913 $ 794 $ 1,021 $ 983
per share - diluted 2.58 3.71 0.89 0.90 0.79 1.10 1.24 1.08 1.39 1.33
Operating Earnings (1) 576 701 150 247 179 296 263 198 240 232
per share - diluted 0.78 0.95 0.20 0.34 0.24 0.40 0.36 0.27 0.33 0.31
Net Earnings (Loss) 487 (2,714) 188 730 (431) (80) (1,244) (1,482) 12 (476)
per share - basic and diluted 0.66 (3.69) 0.25 0.99 (0.59) (0.11) (1.69) (2.01) 0.02 (0.65)
Production Volumes
Natural Gas (MMcf/d) 2,788 2,993 2,723 2,766 2,877 2,948 2,905 2,802 3,272 3,459
Oil and NGLs (Mbbls/d)
Oil 23.4 17.3 27.2 22.9 20.0 18.5 17.5 17.9 16.5 13.7
NGLs 26.4 12.0 31.0 24.7 23.5 17.7 12.8 10.3 12.8 10.2
Total Oil and NGLs 49.8 29.3 58.2 47.6 43.5 36.2 30.3 28.2 29.3 23.9 Capital Investment 1,995 2,696 641 639 715 780 779 797 1,120 1,008
Net Acquisitions & (Divestitures) (449) (2,337) (51) (312) (86) (1,327) 31 (8) (2,360) (1,538) Revenues, Net of Royalties 4,435 3,555 1,392 1,984 1,059 1,605 1,025 731 1,799 2,461 Revenues, Net of Royalties, Excluding Unrealized Hedging (1) 4,486 4,878 1,518 1,523 1,445
1,723 1,623 1,526 1,729 1,883
Realized Hedging Gains, before tax 370 1,741 175 52 143
420 578 636 527 331
Ceiling Test Impairments, after tax - (2,888) - - -
(291) (1,193) (1,695) - (1,105)
(1) A non-GAAP measure, which is defined under the Non-GAAP measures section of this MD&A.
Three months ended September 30, 2013 versus September 30, 2012 Cash Flow of $660 million decreased $253 million primarily due to lower realized financial hedging gains of $403 million before tax, partially offset by higher oil and NGL production volumes which increased revenues $187 million. In the three months ended September 30, 2013, Cash Flow was impacted by the following significant items:
� Realized financial hedging gains before tax were $175 million compared to $578 million in 2012.
� Average realized natural gas prices, excluding financial hedges, were $3.26 per Mcf compared to $2.77 per Mcf in 2012 reflecting higher benchmark prices. Average natural gas production volumes of 2,723 MMcf/d decreased 182 MMcf/d from 2,905 MMcf/d in 2012 primarily as a result of the Company’s capital investment focus in oil and liquids rich natural gas plays, a reduced capital investment program and natural declines, partially offset by shut-in production volumes in 2012.
� Average oil and NGL production volumes of 58.2 Mbbls/d increased 27.9 Mbbls/d from 30.3 Mbbls/d in 2012 primarily due to successful drilling programs in oil and liquids rich natural gas plays, the extraction of additional liquids volumes processed through third party facilities and additional NGL volumes resulting from renegotiated gathering and processing agreements.
� Transportation and processing expense increased $69 million primarily due to costs related to higher production volumes processed through third party facilities, costs related to the Deep Panuke offshore natural gas project and higher firm processing costs.

Management’s Discussion and Analysis Encana Corporation Prepared using U.S. GAAP in US$ 5
Operating Earnings of $150 million decreased $113 million primarily due to the items discussed in the Cash Flow section, partially offset by lower depreciation, depletion and amortization (“DD&A”) and lower deferred tax. Net Earnings of $188 million increased primarily due to the inclusion of an after-tax non-cash ceiling test impairment of $1,193 million in the 2012 comparative and the items discussed in the Cash Flow and Operating Earnings sections. Net Earnings for the third quarter of 2013 also increased due to lower unrealized hedging losses of $339 million after tax and were partially offset by a lower after-tax non-operating foreign exchange gain. The Company’s after-tax non-cash ceiling test impairment in the third quarter of 2012 primarily resulted from the decline in the 12-month average trailing natural gas prices. Under full cost accounting, the carrying amount of Encana’s natural gas and oil properties within each country cost centre is subject to a ceiling test performed quarterly. Ceiling test impairments are recognized when the capitalized costs aggregated by country exceed the sum of the estimated after-tax future net cash flows from proved reserves as calculated under Securities and Exchange Commission (“SEC”) requirements using the 12-month average trailing prices and discounted at 10 percent. Nine months ended September 30, 2013 versus September 30, 2012 Cash Flow of $1,904 million decreased $824 million primarily due to lower realized financial hedging gains of $1,371 million before tax, partially offset by higher realized natural gas prices which increased revenues $721 million. In the nine months ended September 30, 2013, Cash Flow was impacted by the following significant items:
� Realized financial hedging gains before tax were $370 million compared to $1,741 million in 2012.
� Average realized natural gas prices, excluding financial hedges, were $3.53 per Mcf compared to $2.62 per Mcf in 2012 reflecting higher benchmark prices. Average natural gas production volumes of 2,788 MMcf/d decreased 205 MMcf/d from 2,993 MMcf/d in 2012 primarily as a result of the Company’s capital investment focus in oil and liquids rich natural gas plays, a reduced capital investment program and natural declines, partially offset by shut-in production volumes in 2012.
� Average realized liquids prices, excluding hedges, were $68.07 per bbl compared to $78.63 per bbl in 2012. Average oil and NGL production volumes of 49.8 Mbbls/d increased 20.5 Mbbls/d from 29.3 Mbbls/d in 2012 primarily due to successful drilling programs in oil and liquids rich natural gas plays, the extraction of additional liquids volumes processed through third party facilities and additional NGL volumes resulting from renegotiated gathering and processing agreements.
� Transportation and processing expense increased $158 million primarily due to costs related to higher production volumes processed through third party facilities, firm processing costs, additional NGL volumes resulting from renegotiated gathering and processing agreements and costs related to the Deep Panuke offshore natural gas project.
� Current tax was a recovery of $166 million compared to $262 million in 2012 as discussed in the Other Operating Results section of this MD&A.
Operating Earnings of $576 million decreased $125 million primarily due to the items discussed in the Cash Flow section, partially offset by lower DD&A and lower deferred tax. Net Earnings of $487 million increased primarily due to the inclusion of an after-tax non-cash ceiling test impairment of $2,888 million in the 2012 comparative and the items discussed in the Cash Flow and Operating Earnings sections. Net Earnings for the first nine months of 2013 also increased due to lower unrealized hedging losses of $907 million after tax and were partially offset by an after-tax non-operating foreign exchange loss. Encana’s quarterly net earnings can be significantly impacted by fluctuations in commodity prices, realized and unrealized hedging gains and losses, production volumes, foreign exchange rates and non-cash ceiling test impairments which are provided in the Financial Results table and Quarterly Prices and Foreign Exchange Rates table within this MD&A.

Management’s Discussion and Analysis Encana Corporation Prepared using U.S. GAAP in US$ 6
Quarterly Prices and Foreign Exchange Rates
Nine months ended
September 30 2013
2012 2011
(average for the period) 2013 2012 Q3 Q2 Q1 Q4 Q3 Q2 Q1 Q4 Encana Realized Pricing
Natural Gas ($/Mcf)
Including hedging $ 4.01 $ 4.75 $ 4.00 $ 4.17 $ 3.86 $ 5.02 $ 4.91 $ 4.79 $ 4.58 $ 4.79
Excluding hedging 3.53 2.62 3.26 3.99 3.35 3.45 2.77 2.25 2.80 3.73
Liquids ($/bbl)
Oil (1) 89.52 85.60 90.42 88.27 89.71 79.75 80.04 84.62 92.65 87.18
NGLs 49.10 68.55 46.35 49.63 52.24 52.97 61.34 72.88 72.30 83.11
Total (1) 68.09 78.63 66.95 68.25 69.45 66.65 72.17 80.32 83.77 85.44
Natural Gas Price Benchmarks
NYMEX ($/MMBtu) 3.67 2.59 3.58 4.09 3.34 3.40 2.81 2.22 2.74 3.55
AECO (C$/Mcf) 3.16 2.18 2.82 3.59 3.08 3.06 2.19 1.83 2.52 3.47
Rockies (Opal) ($/MMBtu) 3.51 2.42 3.37 3.89 3.26 3.26 2.56 2.01 2.67 3.47
HSC ($/MMBtu) 3.65 2.55 3.55 4.11 3.30 3.35 2.84 2.17 2.65 3.49
Basis Differential ($/MMBtu)
AECO/NYMEX 0.57 0.41 0.89 0.56 0.27 0.32 0.62 0.39 0.22 0.17
Rockies/NYMEX 0.16 0.17 0.21 0.20 0.08 0.14 0.25 0.21 0.07 0.08
HSC/NYMEX 0.02 0.04 0.03 (0.02) 0.04 0.05 (0.03) 0.05 0.09 0.06
Oil Price Benchmark
West Texas Intermediate (WTI) ($/bbl) 98.20 96.16 105.81 94.17 94.36 88.22 92.20 93.35 103.03 94.02
Edmonton Light Sweet (C$/bbl) 94.83 87.04 103.65 92.67 87.43 83.99 84.33 83.95 92.23 97.35
Foreign Exchange
U.S./Canadian Dollar Exchange Rate 0.977 0.998 0.963 0.977 0.992 1.009 1.005 0.990 0.999 0.978 (1) Including realized hedging gains for 2013. The Company did not settle any oil hedges during 2012 or 2011.
Encana’s financial results are influenced by fluctuations in commodity prices, price differentials and the U.S./Canadian dollar exchange rate. In the third quarter and first nine months of 2013, Encana’s average realized natural gas price, excluding hedging, reflected higher benchmark prices compared to 2012. Hedging activities contributed an additional $0.74 per Mcf to the average realized natural gas price in the third quarter of 2013 and an additional $0.48 per Mcf in the first nine months of 2013. Encana’s average realized oil price, excluding hedging for the third quarter and first nine months of 2013 reflected higher benchmark prices. Hedging activities reduced the average realized oil price by $5.67 per bbl in the third quarter of 2013 and contributed an additional $0.04 per bbl to the average realized oil price in the first nine months of 2013. As a means of managing commodity price volatility and its impact on cash flows, Encana enters into various financial hedge agreements. Unsettled derivative financial contracts are recorded at the date of the financial statements based on the fair value of the contracts. Changes in fair value result from volatility in forward curves of commodity prices and changes in the balance of unsettled contracts between periods. The changes in fair value are recognized in revenue as unrealized hedging gains and losses. Realized hedging gains and losses are recognized in revenue when derivative financial contracts are settled. At September 30, 2013, Encana has hedged approximately 2,255 MMcf/d of expected October to December 2013 natural gas production using NYMEX fixed price contracts at an average price of $4.37 per Mcf, approximately 1,538 MMcf/d of expected 2014 production at an average price of $4.19 per Mcf and approximately 825 MMcf/d of expected 2015 production at an average price of $4.37 per Mcf. In addition, Encana has hedged approximately 9.3 Mbbls/d of expected October to December 2013 oil production using Brent fixed price contracts at an average

Management’s Discussion and Analysis Encana Corporation Prepared using U.S. GAAP in US$ 7
price of $108.22 per bbl, approximately 7.6 Mbbls/d of expected October to December 2013 oil production using WTI fixed price contracts at an average price of $98.71 per bbl and approximately 9.5 Mbbls/d of expected 2014 oil production using WTI fixed price contracts at an average price of $94.19 per bbl. The Company’s hedging program helps sustain Cash Flow and netbacks during periods of lower prices. For additional information, see the Risk Management - Financial Risks section of this MD&A. Production and Net Capital Investment Production Volumes (After Royalties)
Three months ended
September 30 Nine months ended
September 30
(average daily) 2013 2012 2013 2012 Natural Gas (MMcf/d)
Canadian Division 1,414 1,299 1,400 1,343
USA Division 1,309 1,606 1,388 1,650
2,723 2,905 2,788 2,993 Oil (Mbbls/d)
Canadian Division 12.3 7.1 10.2 7.2
USA Division 14.9 10.4 13.2 10.1
27.2 17.5 23.4 17.3 NGLs (Mbbls/d)
Canadian Division 20.5 10.9 17.4 10.9
USA Division 10.5 1.9 9.0 1.1
31.0 12.8 26.4 12.0 Total Oil and NGLs (Mbbls/d)
Canadian Division 32.8 18.0 27.6 18.1
USA Division 25.4 12.3 22.2 11.2
58.2 30.3 49.8 29.3
Average natural gas production volumes in the third quarter and first nine months of 2013 compared to 2012 were impacted by the Company’s capital investment focus in oil and liquids rich natural gas plays and a reduced capital investment program, partially offset by shut-in production volumes in 2012. In the third quarter of 2013, average natural gas production volumes of 2,723 MMcf/d decreased 182 MMcf/d from 2012. In the first nine months of 2013, average natural gas production volumes of 2,788 MMcf/d decreased 205 MMcf/d from 2012. The Canadian Division volumes were higher primarily due to shut-in production volumes in 2012 and successful drilling programs at Cutbank Ridge and Peace River Arch, partially offset by the sale of the Jean Marie natural gas assets in Greater Sierra and natural declines. The USA Division volumes were lower primarily due to natural declines, partially offset by shut-in production volumes in 2012. In the third quarter of 2013, average oil and NGL production volumes of 58.2 Mbbls/d increased 27.9 Mbbls/d from 2012. In the first nine months of 2013, average oil and NGL production volumes of 49.8 Mbbls/d increased 20.5 Mbbls/d from 2012. The Canadian Division volumes were higher primarily due to the extraction of additional liquids volumes at the Gordondale plant in Peace River Arch and the Musreau plant in Bighorn and successful drilling programs in Peace River Arch, Bighorn and Clearwater. The USA Division volumes were higher primarily due to successful drilling programs in oil and liquids rich natural gas plays and renegotiated gathering and processing agreements which resulted in additional NGL volumes in Piceance and Jonah.
Management’s Discussion and Analysis Encana Corporation Prepared using U.S. GAAP in US$ 8
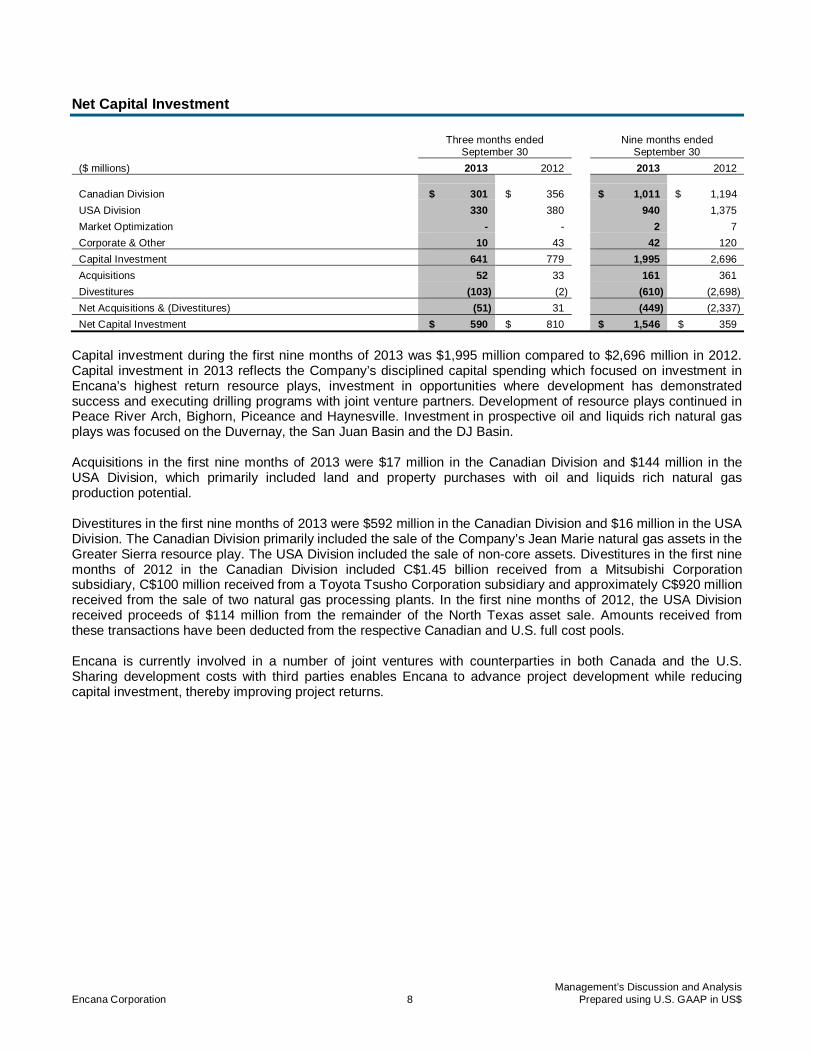
Net Capital Investment
Three months ended
September 30 Nine months ended
September 30
($ millions) 2013 2012 2013 2012 Canadian Division $ 301 $ 356 $ 1,011 $ 1,194
USA Division 330 380 940 1,375
Market Optimization - - 2 7
Corporate & Other 10 43 42 120
Capital Investment 641 779 1,995 2,696
Acquisitions 52 33 161 361
Divestitures (103) (2) (610) (2,698)
Net Acquisitions & (Divestitures) (51) 31 (449) (2,337)
Net Capital Investment $ 590 $ 810 $ 1,546 $ 359
Capital investment during the first nine months of 2013 was $1,995 million compared to $2,696 million in 2012. Capital investment in 2013 reflects the Company’s disciplined capital spending which focused on investment in Encana’s highest return resource plays, investment in opportunities where development has demonstrated success and executing drilling programs with joint venture partners. Development of resource plays continued in Peace River Arch, Bighorn, Piceance and Haynesville. Investment in prospective oil and liquids rich natural gas plays was focused on the Duvernay, the San Juan Basin and the DJ Basin. Acquisitions in the first nine months of 2013 were $17 million in the Canadian Division and $144 million in the USA Division, which primarily included land and property purchases with oil and liquids rich natural gas production potential. Divestitures in the first nine months of 2013 were $592 million in the Canadian Division and $16 million in the USA Division. The Canadian Division primarily included the sale of the Company’s Jean Marie natural gas assets in the Greater Sierra resource play. The USA Division included the sale of non-core assets. Divestitures in the first nine months of 2012 in the Canadian Division included C$1.45 billion received from a Mitsubishi Corporation subsidiary, C$100 million received from a Toyota Tsusho Corporation subsidiary and approximately C$920 million received from the sale of two natural gas processing plants. In the first nine months of 2012, the USA Division received proceeds of $114 million from the remainder of the North Texas asset sale. Amounts received from these transactions have been deducted from the respective Canadian and U.S. full cost pools. Encana is currently involved in a number of joint ventures with counterparties in both Canada and the U.S. Sharing development costs with third parties enables Encana to advance project development while reducing capital investment, thereby improving project returns.
Management’s Discussion and Analysis Encana Corporation Prepared using U.S. GAAP in US$ 9
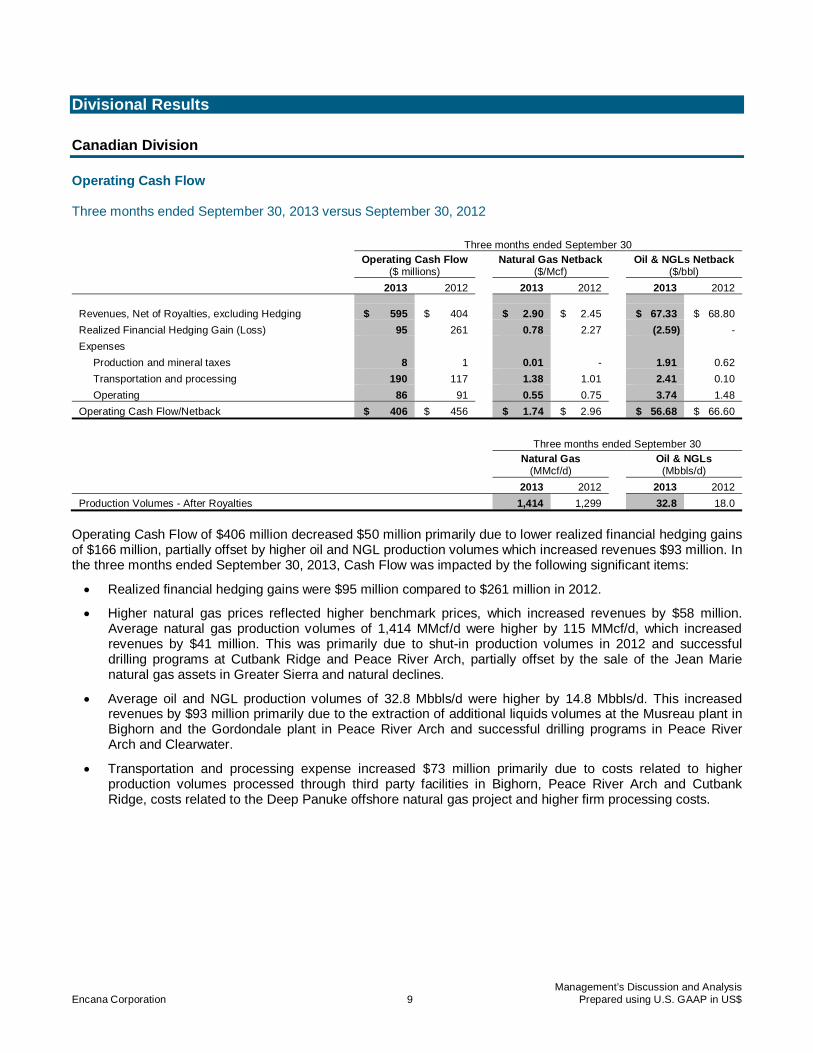
Divisional Results Canadian Division Operating Cash Flow Three months ended September 30, 2013 versus September 30, 2012
Three months ended September 30
Operating Cash Flow
($ millions) Natural Gas Netback
($/Mcf) Oil & NGLs Netback
($/bbl)
2013 2012 2013 2012 2013 2012 Revenues, Net of Royalties, excluding Hedging $ 595 $ 404 $ 2.90 $ 2.45 $ 67.33 $ 68.80
Realized Financial Hedging Gain (Loss) 95 261 0.78 2.27 (2.59) -
Expenses
Production and mineral taxes 8 1 0.01 - 1.91 0.62
Transportation and processing 190 117 1.38 1.01 2.41 0.10
Operating 86 91 0.55 0.75 3.74 1.48
Operating Cash Flow/Netback $ 406 $ 456 $ 1.74 $ 2.96 $ 56.68 $ 66.60
Three months ended September 30
Natural Gas
(MMcf/d) Oil & NGLs
(Mbbls/d)
2013 2012 2013 2012
Production Volumes - After Royalties 1,414 1,299 32.8 18.0
Operating Cash Flow of $406 million decreased $50 million primarily due to lower realized financial hedging gains of $166 million, partially offset by higher oil and NGL production volumes which increased revenues $93 million. In the three months ended September 30, 2013, Cash Flow was impacted by the following significant items:
� Realized financial hedging gains were $95 million compared to $261 million in 2012.
� Higher natural gas prices reflected higher benchmark prices, which increased revenues by $58 million. Average natural gas production volumes of 1,414 MMcf/d were higher by 115 MMcf/d, which increased revenues by $41 million. This was primarily due to shut-in production volumes in 2012 and successful drilling programs at Cutbank Ridge and Peace River Arch, partially offset by the sale of the Jean Marie natural gas assets in Greater Sierra and natural declines.
� Average oil and NGL production volumes of 32.8 Mbbls/d were higher by 14.8 Mbbls/d. This increased revenues by $93 million primarily due to the extraction of additional liquids volumes at the Musreau plant in Bighorn and the Gordondale plant in Peace River Arch and successful drilling programs in Peace River Arch and Clearwater.
� Transportation and processing expense increased $73 million primarily due to costs related to higher production volumes processed through third party facilities in Bighorn, Peace River Arch and Cutbank Ridge, costs related to the Deep Panuke offshore natural gas project and higher firm processing costs.

Management’s Discussion and Analysis Encana Corporation Prepared using U.S. GAAP in US$ 10
Nine months ended September 30, 2013 versus September 30, 2012
Nine months ended September 30
Operating Cash Flow
($ millions) Natural Gas Netback
($/Mcf) Oil & NGLs Netback
($/bbl)
2013 2012 2013 2012 2013 2012 Revenues, Net of Royalties, excluding Hedging $ 1,793 $ 1,249 $ 3.26 $ 2.37 $ 66.13 $ 75.13
Realized Financial Hedging Gain (Loss) 186 775 0.48 2.15 (0.09) -
Expenses
Production and mineral taxes 11 7 0.01 - 1.12 1.44
Transportation and processing 531 395 1.33 1.09 1.83 0.74
Operating 282 271 0.62 0.71 4.29 1.42
Operating Cash Flow/Netback $ 1,155 $ 1,351 $ 1.78 $ 2.72 $ 58.80 $ 71.53
Nine months ended September 30
Natural Gas
(MMcf/d) Oil & NGLs
(Mbbls/d)
2013 2012 2013 2012
Production Volumes - After Royalties 1,400 1,343 27.6 18.1
Operating Cash Flow of $1,155 million decreased $196 million primarily due to lower realized financial hedging gains of $589 million, partially offset by higher realized natural gas prices which increased revenues $344 million. In the nine months ended September 30, 2013, Cash Flow was impacted by the following significant items:
� Realized financial hedging gains were $186 million compared to $775 million in 2012.
� Higher natural gas prices reflected higher benchmark prices, which increased revenues by $344 million. Average natural gas production volumes of 1,400 MMcf/d were higher by 57 MMcf/d, which increased revenues by $66 million. This was primarily due to shut-in production volumes in 2012 and successful drilling programs at Cutbank Ridge and Peace River Arch, partially offset by natural declines.
� Average oil and NGL production volumes of 27.6 Mbbls/d were higher by 9.5 Mbbls/d. This increased revenues by $195 million primarily due to the extraction of additional liquids volumes at the Gordondale plant in Peace River Arch and the Musreau plant in Bighorn and successful drilling programs in Peace River Arch and Bighorn. Lower liquids prices decreased revenues by $67 million.
� Transportation and processing expense increased $136 million primarily due to costs related to higher production volumes processed through third party facilities in Cutbank Ridge, Peace River Arch and Bighorn, higher firm processing costs and costs related to the Deep Panuke offshore natural gas project.

Management’s Discussion and Analysis Encana Corporation Prepared using U.S. GAAP in US$ 11
Results by Resource Play Three months ended September 30
Natural Gas Production
(MMcf/d) Oil & NGLs Production
(Mbbls/d) Capital
($ millions)
2013 2012 2013 2012 2013 2012 Cutbank Ridge 554 447 2.0 1.6 $ 28 $ 53
Bighorn 253 235 9.9 5.0 68 82
Peace River Arch 138 99 10.4 2.7 109 56
Clearwater 332 336 9.8 8.0 26 17
Greater Sierra 105 182 - 0.4 1 13
Other and emerging 32 - 0.7 0.3 69 135
Total Canadian Division 1,414 1,299 32.8 18.0 $ 301 $ 356
Nine months ended September 30
Natural Gas Production
(MMcf/d) Oil & NGLs Production
(Mbbls/d) Capital
($ millions)
2013 2012 2013 2012 2013 2012 Cutbank Ridge 503 433 1.8 1.4 $ 98 $ 168
Bighorn 246 242 8.3 4.7 229 267
Peace River Arch 124 105 7.5 2.7 295 165
Clearwater 336 376 9.1 8.7 105 94
Greater Sierra 177 185 0.4 0.5 16 104
Other and emerging 14 2 0.5 0.1 268 396
Total Canadian Division 1,400 1,343 27.6 18.1 $ 1,011 $ 1,194
Other and emerging resource plays primarily includes results from the Duvernay prospective oil and liquids rich natural gas play and the Deep Panuke offshore natural gas project. In the second quarter of 2013, the Canadian Division closed the sale of the Jean Marie natural gas assets included in the Greater Sierra resource play. As a result of the sale, natural gas production volumes in Greater Sierra were lower by approximately 79 MMcf/d in the third quarter of 2013 compared to the same period of 2012. Average oil and NGL production volumes during the third quarter and first nine months of 2013 increased primarily due to the extraction of additional liquids volumes at the Gordondale plant in Peace River Arch and the Musreau plant in Bighorn and successful drilling programs in Peace River Arch, Bighorn and Clearwater.

Management’s Discussion and Analysis Encana Corporation Prepared using U.S. GAAP in US$ 12
Other Divisional Expenses
Three months ended
September 30 Nine months ended
September 30
($ millions) 2013 2012 2013 2012 Depreciation, depletion and amortization $ 148 $ 176 $ 445 $ 572
Impairments - 1,074 - 1,822
In the third quarter and first nine months of 2013, DD&A decreased from 2012 due to a lower depletion rate, partially offset by higher production volumes. The lower depletion rate primarily resulted from ceiling test impairments recognized in the second and third quarters of 2012 and deductions from the full cost pool for amounts received from divestitures during 2012 and 2013. In the third quarter and first nine months of 2012, the Division recognized non-cash ceiling test impairments before tax of $1,074 million and $1,822 million, respectively. The impairments primarily resulted from the decline in the 12-month average trailing natural gas prices, which reduced the Division’s proved reserves volumes and values as calculated under SEC requirements. The 12-month average trailing prices used in the ceiling test calculations were based on benchmark prices which were adjusted for basis differentials to determine local reference prices, transportation costs and tariffs, heat content and quality. At September 30, 2013, the 12-month average trailing price for AECO was C$3.09/MMBtu compared to C$2.41/MMBtu at September 30, 2012. The 12-month average trailing price for Edmonton Light Sweet at September 30, 2013 was C$93.18/bbl compared to C$88.74/bbl at September 30, 2012.

Management’s Discussion and Analysis Encana Corporation Prepared using U.S. GAAP in US$ 13
USA Division Operating Cash Flow Three months ended September 30, 2013 versus September 30, 2012
Three months ended September 30
Operating Cash Flow
($ millions) Natural Gas Netback
($/Mcf) Oil & NGLs Netback
($/bbl)
2013 2012 2013 2012 2013 2012 Revenues, Net of Royalties, excluding Hedging $ 616 $ 538 $ 3.66 $ 3.02 $ 72.53 $ 77.12
Realized Financial Hedging Gain (Loss) 77 300 0.69 2.03 (2.73) -
Expenses
Production and mineral taxes 27 29 0.13 0.15 4.90 6.46
Transportation and processing 184 169 1.53 1.14 - -
Operating 94 102 0.65 0.62 5.13 7.69
Operating Cash Flow/Netback $ 388 $ 538 $ 2.04 $ 3.14 $ 59.77 $ 62.97
Three months ended September 30
Natural Gas
(MMcf/d) Oil & NGLs
(Mbbls/d)
2013 2012 2013 2012
Production Volumes - After Royalties 1,309 1,606 25.4 12.3
Operating Cash Flow of $388 million decreased $150 million primarily due to lower realized financial hedging gains of $223 million, partially offset by higher oil and NGL production volumes which increased revenues $94 million. In the three months ended September 30, 2013, Cash Flow was impacted by the following significant items:
� Realized financial hedging gains were $77 million compared to $300 million in 2012.
� Higher natural gas prices reflected higher benchmark prices, which increased revenues by $76 million. Average natural gas production volumes of 1,309 MMcf/d were lower by 297 MMcf/d. This decreased revenues by $82 million primarily due to natural declines, partially offset by shut-in production volumes in 2012.
� Average oil and NGL production volumes of 25.4 Mbbls/d were higher by 13.1 Mbbls/d. This increased revenues by $94 million primarily due to successful drilling programs in oil and liquids rich natural gas plays and renegotiated gathering and processing agreements which resulted in additional NGL volumes in Piceance and Jonah.

Management’s Discussion and Analysis Encana Corporation Prepared using U.S. GAAP in US$ 14
Nine months ended September 30, 2013 versus September 30, 2012
Nine months ended September 30
Operating Cash Flow
($ millions) Natural Gas Netback
($/Mcf) Oil & NGLs Netback
($/bbl)
2013 2012 2013 2012 2013 2012 Revenues, Net of Royalties, excluding Hedging $ 1,891 $ 1,551 $ 3.81 $ 2.82 $ 70.48 $ 84.28
Realized Financial Hedging Gain 181 957 0.47 2.12 0.15 -
Expenses
Production and mineral taxes 86 62 0.15 0.09 4.68 7.25
Transportation and processing 547 490 1.44 1.08 - 0.09
Operating 303 290 0.64 0.60 8.24 5.44
Operating Cash Flow/Netback $ 1,136 $ 1,666 $ 2.05 $ 3.17 $ 57.71 $ 71.50
Nine months ended September 30
Natural Gas
(MMcf/d) Oil & NGLs
(Mbbls/d)
2013 2012 2013 2012
Production Volumes - After Royalties 1,388 1,650 22.2 11.2
Operating Cash Flow of $1,136 million decreased $530 million primarily due to lower realized financial hedging gains of $776 million, partially offset by higher realized natural gas prices which increased revenues $377 million. In the nine months ended September 30, 2013, Cash Flow was impacted by the following significant items:
� Realized financial hedging gains were $181 million compared to $957 million in 2012.
� Higher natural gas prices reflected higher benchmark prices, which increased revenues by $377 million. Average natural gas production volumes of 1,388 MMcf/d were lower by 262 MMcf/d. This decreased revenues by $206 million primarily due to natural declines, partially offset by shut-in production volumes in 2012.
� Average oil and NGL production volumes of 22.2 Mbbls/d were higher by 11.0 Mbbls/d. This increased revenues by $253 million primarily due to successful drilling programs in oil and liquids rich natural gas plays and renegotiated gathering and processing agreements which resulted in additional NGL volumes in Piceance and Jonah. Lower liquids prices decreased revenues by $87 million.
� Production and mineral taxes expense increased $24 million primarily due to higher natural gas prices.
� Transportation and processing expense increased $57 million primarily due to costs related to renegotiated gathering and processing agreements.

Management’s Discussion and Analysis Encana Corporation Prepared using U.S. GAAP in US$ 15
Results by Resource Play Three months ended September 30
Natural Gas Production
(MMcf/d) Oil & NGLs Production
(Mbbls/d) Capital
($ millions)
2013 2012 2013 2012 2013 2012 Piceance 444 476 5.5 2.7 $ 81 $ 68
Jonah 320 407 4.8 4.3 15 13
Haynesville 336 475 - - 44 46
Texas 132 157 - 0.1 5 14
Other and emerging 77 91 15.1 5.2 185 239
Total USA Division 1,309 1,606 25.4 12.3 $ 330 $ 380
Nine months ended September 30
Natural Gas Production
(MMcf/d) Oil & NGLs Production
(Mbbls/d) Capital
($ millions)
2013 2012 2013 2012 2013 2012 Piceance 456 478 5.0 2.1 $ 180 $ 286
Jonah 332 427 4.8 4.1 36 87
Haynesville 377 479 - - 131 321
Texas 141 172 - 0.1 13 59
Other and emerging 82 94 12.4 4.9 580 622
Total USA Division 1,388 1,650 22.2 11.2 $ 940 $ 1,375
Other and emerging resource plays include results from prospective oil and liquids rich natural gas plays including the DJ Basin, the San Juan Basin, the Tuscaloosa Marine Shale and Eaglebine. Average oil and NGL production volumes during the third quarter and first nine months of 2013 increased primarily due to successful drilling programs in the DJ Basin and San Juan Basin and renegotiated gathering and processing agreements which resulted in additional NGL volumes in Piceance and Jonah. Average natural gas production volumes during the third quarter and first nine months of 2013 in Jonah and Haynesville were impacted by natural declines and a reduced capital investment program.

Management’s Discussion and Analysis Encana Corporation Prepared using U.S. GAAP in US$ 16
Other Divisional Expenses
Three months ended
September 30 Nine months ended
September 30
($ millions) 2013 2012 2013 2012 Depreciation, depletion and amortization $ 205 $ 247 $ 623 $ 864
Impairments - 608 - 2,386
In the third quarter and first nine months of 2013, DD&A decreased from 2012 due to a lower depletion rate and lower production volumes. The lower depletion rate primarily resulted from ceiling test impairments recognized during 2012. In the third quarter and first nine months of 2012, the Division recognized non-cash ceiling test impairments before tax of $608 million and $2,386 million, respectively. The impairments primarily resulted from the decline in the 12-month average trailing natural gas prices, which reduced the Division’s proved reserves volumes and values as calculated under SEC requirements. The 12-month average trailing prices used in the ceiling test calculations were based on benchmark prices which were adjusted for basis differentials to determine local reference prices, transportation costs and tariffs, heat content and quality. At September 30, 2013, the 12-month average trailing price for Henry Hub was $3.60/MMBtu compared to $2.82/MMBtu at September 30, 2012. The 12-month average trailing price for WTI at September 30, 2013 was $95.20/bbl compared to $94.97/bbl at September 30, 2012.

Management’s Discussion and Analysis Encana Corporation Prepared using U.S. GAAP in US$ 17
Market Optimization
Three months ended
September 30 Nine months ended
September 30
($ millions) 2013 2012 2013 2012 Revenues $ 104 $ 102 $ 357 $ 320
Expenses
Operating 13 22 26 38
Purchased product 85 75 303 265
Depreciation, depletion and amortization 3 3 9 9
$ 3 $ 2 $ 19 $ 8
Market Optimization revenues and purchased product expense relate to activities that provide operational flexibility for transportation commitments, product type, delivery points and customer diversification. Revenues and purchased product expense increased in the third quarter and first nine months of 2013 compared to 2012 primarily due to higher commodity prices partially offset by lower volumes required for optimization. Corporate and Other
Three months ended
September 30 Nine months ended
September 30
($ millions) 2013 2012 2013 2012 Revenues $ (95) $ (580) $ 27 $ (1,297)
Expenses
Transportation and processing 2 21 (7) 28
Operating 12 7 27 12
Depreciation, depletion and amortization 32 26 100 66
Impairments 21 - 21 -
$ (162) $ (634) $ (114) $ (1,403)
Revenues mainly include unrealized hedging gains or losses recorded on derivative financial contracts which result from the volatility in forward curves of commodity prices and changes in the balance of unsettled contracts between periods. Transportation and processing expense reflects unrealized financial hedging gains or losses related to the Company’s power financial derivative contracts. DD&A includes amortization of corporate assets, such as computer equipment, office buildings, furniture and leasehold improvements. Impairment expense relates to certain corporate assets.
Management’s Discussion and Analysis Encana Corporation Prepared using U.S. GAAP in US$ 18
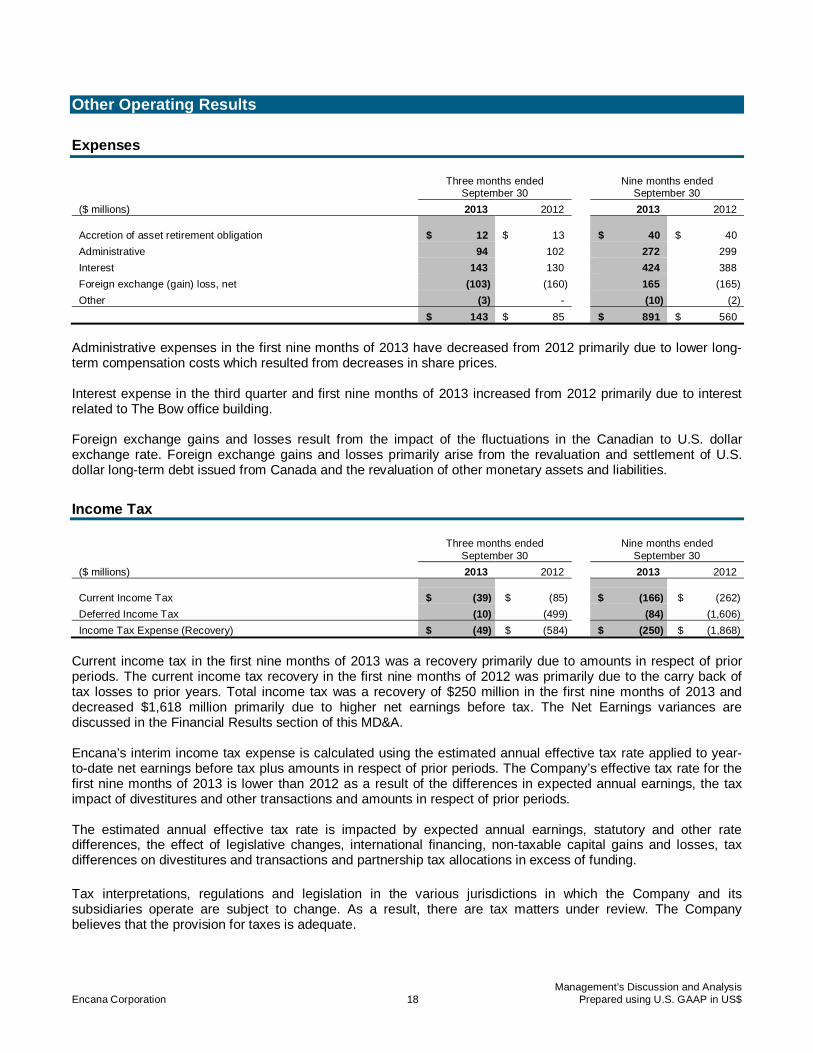
Other Operating Results Expenses
Three months ended
September 30 Nine months ended
September 30
($ millions) 2013 2012 2013 2012 Accretion of asset retirement obligation $ 12 $ 13 $ 40 $ 40
Administrative 94 102 272 299
Interest 143 130 424 388
Foreign exchange (gain) loss, net (103) (160) 165 (165)
Other (3) - (10) (2)
$ 143 $ 85 $ 891 $ 560
Administrative expenses in the first nine months of 2013 have decreased from 2012 primarily due to lower long-term compensation costs which resulted from decreases in share prices. Interest expense in the third quarter and first nine months of 2013 increased from 2012 primarily due to interest related to The Bow office building. Foreign exchange gains and losses result from the impact of the fluctuations in the Canadian to U.S. dollar exchange rate. Foreign exchange gains and losses primarily arise from the revaluation and settlement of U.S. dollar long-term debt issued from Canada and the revaluation of other monetary assets and liabilities.
Income Tax
Three months ended
September 30 Nine months ended
September 30
($ millions) 2013 2012 2013 2012 Current Income Tax $ (39) $ (85) $ (166) $ (262)
Deferred Income Tax (10) (499) (84) (1,606)
Income Tax Expense (Recovery) $ (49) $ (584) $ (250) $ (1,868)
Current income tax in the first nine months of 2013 was a recovery primarily due to amounts in respect of prior periods. The current income tax recovery in the first nine months of 2012 was primarily due to the carry back of tax losses to prior years. Total income tax was a recovery of $250 million in the first nine months of 2013 and decreased $1,618 million primarily due to higher net earnings before tax. The Net Earnings variances are discussed in the Financial Results section of this MD&A. Encana’s interim income tax expense is calculated using the estimated annual effective tax rate applied to year-to-date net earnings before tax plus amounts in respect of prior periods. The Company’s effective tax rate for the first nine months of 2013 is lower than 2012 as a result of the differences in expected annual earnings, the tax impact of divestitures and other transactions and amounts in respect of prior periods. The estimated annual effective tax rate is impacted by expected annual earnings, statutory and other rate differences, the effect of legislative changes, international financing, non-taxable capital gains and losses, tax differences on divestitures and transactions and partnership tax allocations in excess of funding. Tax interpretations, regulations and legislation in the various jurisdictions in which the Company and its subsidiaries operate are subject to change. As a result, there are tax matters under review. The Company believes that the provision for taxes is adequate.

Management’s Discussion and Analysis Encana Corporation Prepared using U.S. GAAP in US$ 19
Liquidity and Capital Resources
Three months ended
September 30 Nine months ended
September 30
($ millions) 2013 2012 2013 2012 Net Cash From (Used In)
Operating activities $ 935 $ 1,142 $ 1,827 $ 2,390
Investing activities (522) (864) (1,339) (221)
Financing activities (107) (148) (365) (961) Foreign exchange gain (loss) on cash and cash
equivalents held in foreign currency 36 35
(44) 31
Increase (Decrease) in Cash and Cash Equivalents $ 342 $ 165 $ 79 $ 1,239
Cash and Cash Equivalents, End of Period $ 3,258 $ 2,039 $ 3,258 $ 2,039
Operating Activities Net cash from operating activities in the third quarter of 2013 of $935 million decreased $207 million from the third quarter of 2012. This decrease is a result of the Cash Flow variances discussed in the Financial Results section of this MD&A. In the third quarter of 2013, the net change in non-cash working capital was a surplus of $300 million compared to a surplus of $242 million in the third quarter of 2012. Net cash from operating activities in the first nine months of 2013 of $1,827 million decreased $563 million from the first nine months of 2012. This decrease is primarily a result of the Cash Flow variances discussed in the Financial Results section of this MD&A. In the first nine months of 2013, the net change in non-cash working capital was a surplus of $4 million compared to a deficit of $267 million in the first nine months of 2012. The Company had a working capital surplus of $1,786 million at September 30, 2013 compared to $2,865 million at December 31, 2012. The decrease in working capital is primarily due to an increase in the current portion of long-term debt and a decrease in accounts receivable and accrued revenues, partially offset by a decrease in accounts payable and accrued liabilities. At September 30, 2013, working capital included cash and cash equivalents of $3,258 million compared to $3,179 million at December 31, 2012. Encana expects that it will continue to meet the payment terms of its suppliers.
Investing Activities Net cash used in investing activities in the first nine months of 2013 was $1,339 million compared to $221 million in the first nine months of 2012. The net cash used in investing activities primarily resulted from lower divestiture proceeds, partially offset by lower capital expenditures and lower acquisition costs. Reasons for these changes are discussed further in the Net Capital Investment section of this MD&A. Investing activities in the first nine months of 2013 also included proceeds received from the sale of the Company’s 30 percent interest in the proposed Kitimat liquefied natural gas export terminal in British Columbia which closed in February 2013. Net cash used in investing activities in the first nine months of 2013 also included cash in reserve released from escrow of $20 million compared to $411 million in the first nine months of 2012. Cash in reserve includes monies which are not available for general operating use, are segregated or held in escrow and include amounts received from counterparties related to jointly developed assets.

Management’s Discussion and Analysis Encana Corporation Prepared using U.S. GAAP in US$ 20
Financing Activities Long-Term Debt
Encana’s long-term debt, excluding the current portion, totaled $6,149 million at September 30, 2013 and $7,175 million at December 31, 2012. The current portion of long-term debt outstanding was $1,500 million at September 30, 2013 compared to $500 million at December 31, 2012. On October 15, 2013, the Company repaid its 4.75 percent $500 million debt maturity from cash and the remaining $1,000 million matures on May 1, 2014. There were no outstanding balances under the Company’s revolving credit facilities at September 30, 2013 or December 31, 2012. Encana has the flexibility to refinance maturing long-term debt or repay debt maturities from existing sources of liquidity. Encana’s primary sources of liquidity include cash and cash equivalents, revolving bank credit facilities, working capital, operating cash flow and proceeds from asset divestitures. The Company anticipates maintaining adequate liquidity to fund future debt repayments as they come due. Credit Facilities and Shelf Prospectuses
Encana maintains two committed revolving bank credit facilities and a U.S. dollar shelf prospectus. In June 2013, the Company extended the maturity date of its existing revolving bank credit facilities to June 2018 and reduced the Canadian facility from C$4.0 billion to C$3.5 billion. As at September 30, 2013, Encana had available unused committed revolving bank credit facilities of $4.4 billion and unused capacity under a shelf prospectus for up to $4.0 billion.
� Encana has in place a revolving bank credit facility for C$3.5 billion ($3.4 billion) that remains committed through June 2018, of which C$3.5 billion ($3.4 billion) remained unused.
� One of Encana’s U.S. subsidiaries has in place a revolving bank credit facility for $1.0 billion that remains committed through June 2018, of which $999 million remained unused.
� Encana has in place a shelf prospectus whereby it may issue from time to time up to $4.0 billion, or the equivalent in foreign currencies, of debt securities in the U.S. At September 30, 2013, the shelf prospectus remained unutilized, the availability of which is dependent upon market conditions. The shelf prospectus expires in June 2014.
Encana had in place an unutilized shelf prospectus for up to C$2.0 billion, or the equivalent in foreign currencies, of debt securities in Canada which expired in June 2013. Encana did not renew the shelf prospectus as the Company had sufficient cash balances on hand and does not believe that access to the debt capital market in Canada will be required in the near term. Encana is currently in compliance with, and expects that it will continue to be in compliance with, all financial covenants under its credit facility agreements. Management monitors Debt to Adjusted Capitalization as a proxy for Encana’s financial covenant under its credit facility agreements which require debt to adjusted capitalization to be less than 60 percent. The definitions used in the covenant under the credit facilities adjust capitalization for cumulative historical ceiling test impairments that were recorded as at December 31, 2011 in conjunction with the Company’s January 1, 2012 adoption of U.S. GAAP. Debt to Adjusted Capitalization was 37 percent at September 30, 2013 and December 31, 2012. Outstanding Share Data
As at September 30, 2013 and October 21, 2013, Encana had 740.2 million common shares outstanding and 31.6 million outstanding stock options with Tandem Stock Appreciation Rights (“TSARs”) attached (15.4 million exercisable). A TSAR gives the option holder the right to receive a cash payment equal to the excess of the market price of Encana’s common shares at the time of exercise over the original grant price. During 2013, Encana cancelled 767,327 common shares reserved for issuance to shareholders upon exchange of predecessor companies’ shares. In accordance with the terms of the merger agreement which formed Encana, shares which have remained unexchanged were extinguished.

Management’s Discussion and Analysis Encana Corporation Prepared using U.S. GAAP in US$ 21
Under the Company’s dividend reinvestment plan, Encana issued 2.5 million common shares totaling $41 million during the third quarter of 2013 and 4.7 million common shares totaling $80 million during the first nine months of 2013. Dividends
Encana pays quarterly dividends to shareholders at the discretion of the Board of Directors. Dividend payments were $148 million or $0.20 per share for the third quarter of 2013 (2012 - $147 million or $0.20 per share) and $442 million or $0.60 per share for the first nine months of 2013 (2012 - $441 million or $0.60 per share). As disclosed above, the dividends paid included $41 million in common shares for the third quarter of 2013 and $80 million in common shares for the first nine months of 2013, which were issued in lieu of cash dividends under the Company’s dividend reinvestment plan. Capital Structure
The Company’s capital structure consists of shareholders’ equity plus long-term debt, including the current portion. The Company’s objectives when managing its capital structure are to maintain financial flexibility to preserve Encana’s access to capital markets and its ability to meet financial obligations and finance internally generated growth, as well as potential acquisitions. Encana has a long-standing practice of maintaining capital discipline and managing and adjusting its capital structure according to market conditions to maintain flexibility while achieving the Company’s objectives. To manage the capital structure, the Company may adjust capital spending, adjust dividends paid to shareholders, purchase shares for cancellation pursuant to normal course issuer bids, issue new shares, issue new debt or repay existing debt. In managing its capital structure, the Company monitors several non-GAAP financial metrics as indicators of its overall financial strength, which are defined in the Non-GAAP Measures section of this MD&A. The financial metrics the Company currently monitors are below.
September 30, 2013 December 31, 2012 Net Debt to Debt Adjusted Cash Flow 1.4x 1.1x
Debt to Debt Adjusted Cash Flow 2.4x 2.0x
Debt to Adjusted EBITDA 2.5x 2.0x
Debt to Adjusted Capitalization 37% 37%

Management’s Discussion and Analysis Encana Corporation Prepared using U.S. GAAP in US$ 22
Commitments and Contingencies Commitments
The following table outlines the Company’s commitments at September 30, 2013:
Expected Future Payments
($ millions, undiscounted) 2013 2014 2015 2016 2017 Thereafter Total Transportation and Processing $ 221 $ 956 $ 974 $ 886 $ 867 $ 5,078 $ 8,982
Drilling and Field Services 192 155 100 66 38 69 620
Operating Leases 12 47 44 37 29 69 238
Commitments $ 425 $ 1,158 $ 1,118 $ 989 $ 934 $ 5,216 $ 9,840
In addition to the Commitments disclosed above, Encana has development commitments with joint venture partners resulting from the Company’s prior arrangements. A portion of these joint venture commitments may be satisfied by the Drilling and Field Services commitments included in the table above. Further information regarding Encana’s significant arrangements is provided in the Company’s annual MD&A for the year ended December 31, 2012. Further to the Commitments disclosed above, Encana also has obligations related to its risk management program and to fund its defined benefit pension and other post-employment benefit plans. Further information can be found in Note 17 to the Interim Condensed Consolidated Financial Statements regarding the Company’s risk management program. The Company expects to fund its 2013 commitments and obligations from Cash Flow and cash and cash equivalents. Contractual obligations arising from long-term debt, asset retirement obligations, capital leases, The Bow office building and the Deep Panuke Production Field Centre are recognized on the Company’s balance sheet. Further information can be found in the note disclosures to the Interim Condensed Consolidated Financial Statements. Contingencies
Encana is involved in various legal claims and actions arising in the course of the Company’s operations. Although the outcome of these claims cannot be predicted with certainty, the Company does not expect these matters to have a material adverse effect on Encana’s financial position, cash flows or results of operations. If an unfavorable outcome were to occur, there exists the possibility of a material adverse impact on the Company’s consolidated net earnings or loss in the period in which the outcome is determined. Accruals for litigation and claims are recognized if the Company determines that the loss is probable and the amount can be reasonably estimated. The Company believes it has made adequate provision for such legal claims.

Management’s Discussion and Analysis Encana Corporation Prepared using U.S. GAAP in US$ 23
Risk Management Encana’s business, prospects, financial condition, results of operation and cash flows, and in some cases its reputation, are impacted by risks that are categorized as follows:
� financial risks;
� operational risks; and
� safety, environmental and regulatory risks. Issues affecting, or with the potential to affect, Encana’s reputation are generally of a strategic nature or emerging issues that can be identified early and then managed, but occasionally include unforeseen issues that must be managed on an urgent basis. Encana takes a proactive approach to the identification and management of issues that affect the Company’s reputation and has established consistent and clear policies, procedures, guidelines and responsibilities for identifying and managing these issues. Encana continues to implement its business model of focusing on developing low-risk and low-cost long-life resource plays, which allows the Company to respond well to market uncertainties. Management adjusts financial and operational risk strategies to proactively respond to changing economic conditions and to mitigate or reduce risk. Financial Risks
Encana defines financial risks as the risk of loss or lost opportunity resulting from financial management and market conditions that could have a positive or negative impact on Encana’s business. Financial risks include, but are not limited to:
� market pricing of natural gas and liquids;
� credit and liquidity;
� foreign exchange rates; and
� interest rates.
Encana partially mitigates its exposure to financial risks through the use of various financial instruments and physical contracts. The use of derivative financial instruments is governed under formal policies and is subject to limits established by the Board of Directors. All derivative financial agreements are with major financial institutions in Canada and the U.S. or with counterparties having investment grade credit ratings. Encana has in place policies and procedures with respect to the required documentation and approvals for the use of derivative financial instruments and specifically ties their use, in the case of commodities, to the mitigation of price risk to achieve investment returns and growth objectives, while maintaining prescribed financial metrics. To partially mitigate commodity price risk, the Company may enter into transactions that fix or set a floor and cap on prices. To help protect against regional price differentials, Encana executes transactions to manage the price differentials between its production areas and various sales points. Further information, including the details of Encana’s financial instruments as at September 30, 2013, is disclosed in Note 17 to the Interim Condensed Consolidated Financial Statements. Counterparty and credit risks are regularly and proactively managed. A substantial portion of Encana’s credit exposure is with customers in the oil and gas industry or financial institutions. This credit exposure is mitigated through the use of Board-approved credit policies governing the Company’s credit portfolio, including credit practices that limit transactions and grant payment terms according to counterparties’ credit quality. The Company manages liquidity risk using cash and debt management programs. The Company has access to cash equivalents and a range of funding alternatives at competitive rates through committed revolving bank credit

Management’s Discussion and Analysis Encana Corporation Prepared using U.S. GAAP in US$ 24
facilities and debt capital markets. Encana closely monitors the Company’s ability to access cost-effective credit and ensures that sufficient liquidity is in place to fund capital expenditures and dividend payments. The Company minimizes its liquidity risk by managing its capital structure. In managing the capital structure, the Company may adjust capital spending, adjust dividends paid to shareholders, purchase shares for cancellation pursuant to normal course issuer bids, issue new shares, issue new debt or repay existing debt. Operational Risks
Operational risks are defined as the risk of loss or lost opportunity resulting from the following:
� reserves and resources replacement;
� capital activities; and
� operating activities. The Company’s ability to operate, generate cash flows, complete projects, and value reserves and resources is subject to financial risks, including commodity prices mentioned above, continued market demand for its products and other risk factors outside of its control, which include: general business and market conditions; economic recessions and financial market turmoil; the overall state of the capital markets, including investor appetite for investments in the oil and gas industry generally and the Company’s securities in particular; the ability to secure and maintain cost effective financing for its commitments; legislative, environmental and regulatory matters; unexpected cost increases; royalties; taxes; volatility in natural gas and liquids prices; the availability of drilling and other equipment; the ability to access lands; the ability to access water for hydraulic fracturing operations; weather; the availability of processing capacity; the availability and proximity of pipeline capacity; technology failures; accidents; the availability of skilled labour; and reservoir quality. If Encana fails to acquire or find additional natural gas and liquids reserves and resources, its reserves, resources and production will decline materially from their current levels and, therefore, its cash flows are highly dependent upon successfully exploiting current reserves and resources and acquiring, discovering or developing additional reserves and resources. To mitigate these risks, as part of the capital approval process, the Company’s projects are evaluated on a fully risked basis, including geological risk and engineering risk. When making operating and investing decisions, Encana’s business model allows flexibility in capital allocation to optimize investments focused on project returns, long-term value creation and risk mitigation. Encana also mitigates operational risks through a number of other policies, systems and processes as well as by maintaining a comprehensive insurance program. Safety, Environmental and Regulatory Risks
The Company is committed to safety in its operations and has high regard for the environment and stakeholders, including regulators. The Company’s business is subject to all of the operating risks normally associated with the exploration for, development of and production of natural gas, oil and NGLs and the operation of midstream facilities. When assessing the materiality of the environmental risk factors, Encana takes into account a number of qualitative and quantitative factors, including, but not limited to, financial, operational, reputational and regulatory aspects of the identified risk factor. These risks are managed by executing policies and standards that are designed to comply with or exceed government regulations and industry standards. In addition, Encana maintains a system that identifies, assesses and controls safety, security and environmental risk and requires regular reporting to Senior Management and the Board of Directors. The Corporate Responsibility, Environment, Health & Safety Committee of Encana’s Board of Directors provides recommended environmental policies for approval by Encana’s Board of Directors and oversees compliance with government laws and regulations. Monitoring and reporting programs for environmental, health and safety performance in day-to-day operations, as well as inspections and audits, are designed to provide assurance that environmental and regulatory standards are met. Contingency plans are in place for a timely response to environmental events and remediation/reclamation strategies are utilized to restore the environment. Encana’s operations are subject to regulation and intervention by governments that can affect or prohibit the drilling, completion, including hydraulic fracturing and tie-in of wells, production, the construction or expansion of

Management’s Discussion and Analysis Encana Corporation Prepared using U.S. GAAP in US$ 25
facilities and the operation and abandonment of fields. Changes in government regulation could impact the Company’s existing and planned projects as well as impose a cost of compliance. In June 2013, the U.S. Environmental Protection Agency (the “EPA”) announced it has suspended its study of the potential environmental impacts of hydraulic fracturing, including the impacts on drinking water sources and public health, at Encana's Pavillion natural gas field in Wyoming. The agency has stated that the results in its 2011 draft report were inconclusive and it does not plan to finalize, seek peer review of or rely upon the conclusions of the draft report. Further, no aspects of the draft report will be incorporated into the EPA's larger ongoing national study of hydraulic fracturing. Instead, the EPA will support additional scientific investigation of the Pavillion groundwater being led by the Wyoming Department of Environmental Quality and the Wyoming Oil and Gas Conservation Commission. Any implication of a potential connection between hydraulic fracturing and groundwater quality may potentially subject Encana to regulatory, operational and/or reputation risks. A comprehensive discussion of Encana’s risk management is provided in the Company’s annual MD&A for the year ended December 31, 2012.

Management’s Discussion and Analysis Encana Corporation Prepared using U.S. GAAP in US$ 26
Accounting Policies and Estimates Critical Accounting Estimates Refer to the annual MD&A for the year ended December 31, 2012 for a comprehensive discussion of Encana’s Critical Accounting Policies and Estimates.
Recent Accounting Pronouncements Changes in Accounting Policies and Practices
As of January 1, 2013, Encana adopted the following accounting standards updates issued by the Financial Accounting Standards Board (“FASB”), which have not had a material impact on the Company’s Interim Condensed Consolidated Financial Statements: � Accounting Standards Update 2011-11, Disclosures about Offsetting Assets and Liabilities, and Accounting
Standards Update 2013-01, Clarifying the Scope of Disclosures about Offsetting Assets and Liabilities, require disclosure of both gross and net information about certain financial instruments eligible for offset in the balance sheet and certain financial instruments subject to master netting arrangements. The amendments have been applied retrospectively.
� Accounting Standards Update 2013-02, Reporting of Amounts Reclassified Out of Accumulated Other Comprehensive Income, requires enhanced disclosures about amounts reclassified out of accumulated other comprehensive income. The amendments have been applied prospectively.
New Standards Issued Not Yet Adopted
As of January 1, 2014, Encana will be required to adopt the following accounting standards updates issued by the FASB, which are not expected to have a material impact on the Company’s Consolidated Financial Statements: � Accounting Standards Update 2013-04, Obligations Resulting from Joint and Several Liability Arrangements
for Which the Total Amount of the Obligation is Fixed at the Reporting Date, clarifies guidance for the recognition, measurement and disclosure of liabilities resulting from joint and several liability arrangements. The amendments will be applied retrospectively.
� Accounting Standards Update 2013-05, Parent’s Accounting for the Cumulative Translation Adjustment upon Derecognition of Certain Subsidiaries or Groups of Assets within a Foreign Entity or of an Investment in a Foreign Entity, clarifies the applicable guidance for certain transactions that result in the release of the cumulative translation adjustment into net earnings. The amendments will be applied prospectively.
� Accounting Standards Update 2013-11, Presentation of an Unrecognized Tax Benefit When a Net Operating Loss Carryforward, a Similar Tax Loss, or a Tax Credit Carryforward Exists, clarifies that a liability related to an unrecognized tax benefit or portions thereof should be presented as a reduction to a deferred tax asset for a net operating loss carryforward, a similar tax loss or a tax credit carryforward, except under specific situations. The amendments will be applied prospectively.

Management’s Discussion and Analysis Encana Corporation Prepared using U.S. GAAP in US$ 27
Non-GAAP Measures Certain measures in this document do not have any standardized meaning as prescribed by U.S. GAAP and therefore, are considered non-GAAP measures. These measures may not be comparable to similar measures presented by other issuers. These measures are commonly used in the oil and gas industry and by Encana to provide shareholders and potential investors with additional information regarding the Company’s liquidity and its ability to generate funds to finance its operations. Non-GAAP measures include: Cash Flow; Cash Flow per share - diluted; Operating Earnings; Operating Earnings per share - diluted; Revenues, Net of Royalties, Excluding Unrealized Hedging; Net Debt to Debt Adjusted Cash Flow; Debt to Debt Adjusted Cash Flow; Debt to Adjusted EBITDA; and Debt to Adjusted Capitalization. Management’s use of these measures is discussed further below.
Cash Flow Cash Flow is a non-GAAP measure commonly used in the oil and gas industry and by Encana to assist Management and investors in measuring the Company’s ability to finance capital programs and meet financial obligations. Cash Flow is defined as cash from operating activities excluding net change in other assets and liabilities, net change in non-cash working capital and cash tax on sale of assets.
Nine months ended
September 30 2013 2012 2011
($ millions) 2013 2012 Q3 Q2 Q1 Q4 Q3 Q2 Q1 Q4 Cash From (Used in) Operating Activities $ 1,827 $ 2,390 $ 935 $ 554 $ 338
$ 717 $ 1,142 $ 631 $ 617 $ 1,005
(Add back) deduct:
Net change in other assets and liabilities (59) (55) (15) (22) (22)
(23) (9)
(26) (20)
(30)
Net change in non-cash working capital 4 (267) 300 (81) (215)
(56)
242
(134) (375)
166
Cash tax on sale of assets (22) (16) (10) (8) (4) (13) (4) (3) (9) (114)
Cash Flow $ 1,904 $ 2,728 $ 660 $ 665 $ 579 $ 809 $ 913 $ 794 $ 1,021 $ 983

Management’s Discussion and Analysis Encana Corporation Prepared using U.S. GAAP in US$ 28
Operating Earnings Operating Earnings is a non-GAAP measure that adjusts Net Earnings by non-operating items that Management believes reduces the comparability of the Company’s underlying financial performance between periods. Operating Earnings is commonly used in the oil and gas industry and by Encana to provide investors with information that is more comparable between periods. Operating Earnings is defined as Net Earnings excluding non-recurring or non-cash items that Management believes reduces the comparability of the Company's financial performance between periods. These after-tax items may include, but are not limited to, unrealized hedging gains/losses, impairments, foreign exchange gains/losses, income taxes related to divestitures and adjustments to normalize the effect of income taxes calculated using the estimated annual effective tax rate.
Nine months ended
September 30 2013 2012 2011
($ millions) 2013 2012 Q3 Q2 Q1 Q4 Q3 Q2 Q1 Q4 Net Earnings (Loss) $ 487 $ (2,714) $ 188 $ 730 $ (431) $ (80) $ (1,244) $ (1,482) $ 12 $ (476)
After-tax (addition) / deduction: Unrealized hedging gain (loss) (23)
(930) (89) 332 (266)
(72) (428) (547)
45
397
Impairments (16) (2,888) (16) - - (300) (1,193) (1,695) - (1,105) Non-operating foreign
exchange gain (loss)
(158) 158
105
(162) (101)
(66)
162 (90)
86
82
Income tax adjustments 108 245 38 313 (243) 62 (48) 652 (359) (82)
Operating Earnings $ 576 $ 701 $ 150 $ 247 $ 179 $ 296 $ 263 $ 198 $ 240 $ 232
Revenues, Net of Royalties, Excluding Unrealized Hedging Revenues, Net of Royalties, Excluding Unrealized Hedging is a non-GAAP measure that adjusts revenues, net of royalties for unrealized hedging gains/losses. Unrealized hedging gains/losses result from the fair value changes in unsettled derivative financial contracts. Management monitors Revenues, Net of Royalties, Excluding Unrealized Hedging as it reflects the realized hedging impact of the Company’s settled financial contracts.
Nine months ended
September 30 2013 2012 2011
($ millions) 2013 2012 Q3 Q2 Q1 Q4 Q3 Q2 Q1 Q4 Revenues, Net of Royalties $ 4,435 $ 3,555 $ 1,392 $ 1,984 $ 1,059 $ 1,605 $ 1,025 $ 731 $ 1,799 $ 2,461
(Add) / deduct: Unrealized hedging gain (loss), before tax (51) (1,323) (126) 461
(386)
(118) (598) (795) 70 578
Revenues, Net of Royalties, Excluding Unrealized Hedging $ 4,486 $ 4,878 $ 1,518 $ 1,523 $ 1,445
$ 1,723 $ 1,623 $ 1,526 $ 1,729 $ 1,883
Management’s Discussion and Analysis Encana Corporation Prepared using U.S. GAAP in US$ 29
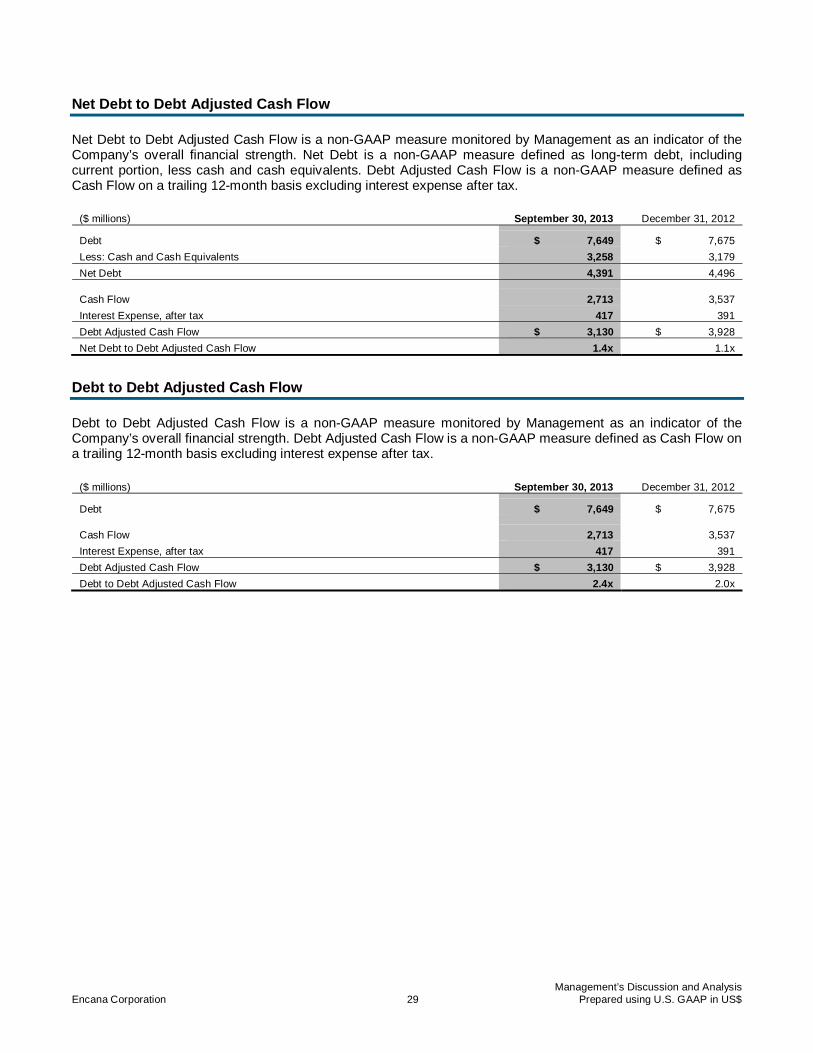
Net Debt to Debt Adjusted Cash Flow Net Debt to Debt Adjusted Cash Flow is a non-GAAP measure monitored by Management as an indicator of the Company’s overall financial strength. Net Debt is a non-GAAP measure defined as long-term debt, including current portion, less cash and cash equivalents. Debt Adjusted Cash Flow is a non-GAAP measure defined as Cash Flow on a trailing 12-month basis excluding interest expense after tax.
($ millions) September 30, 2013 December 31, 2012 Debt $ 7,649 $ 7,675
Less: Cash and Cash Equivalents 3,258 3,179
Net Debt 4,391 4,496 Cash Flow 2,713 3,537
Interest Expense, after tax 417 391
Debt Adjusted Cash Flow $ 3,130 $ 3,928
Net Debt to Debt Adjusted Cash Flow 1.4x 1.1x
Debt to Debt Adjusted Cash Flow Debt to Debt Adjusted Cash Flow is a non-GAAP measure monitored by Management as an indicator of the Company’s overall financial strength. Debt Adjusted Cash Flow is a non-GAAP measure defined as Cash Flow on a trailing 12-month basis excluding interest expense after tax.
($ millions) September 30, 2013 December 31, 2012 Debt $ 7,649 $ 7,675 Cash Flow 2,713 3,537
Interest Expense, after tax 417 391
Debt Adjusted Cash Flow $ 3,130 $ 3,928
Debt to Debt Adjusted Cash Flow 2.4x 2.0x

Management’s Discussion and Analysis Encana Corporation Prepared using U.S. GAAP in US$ 30
Debt to Adjusted EBITDA Debt to Adjusted EBITDA is a non-GAAP measure monitored by Management as an indicator of the Company’s overall financial strength. Adjusted EBITDA is a non-GAAP measure defined as trailing 12-month Net Earnings before income taxes, foreign exchange gains or losses, interest, accretion of asset retirement obligation, DD&A, impairments, unrealized hedging gains and losses and other expenses.
($ millions) September 30, 2013 December 31, 2012 Debt $ 7,649 $ 7,675 Net Earnings (Loss) 407 (2,794)
Add (deduct):
Interest 558 522
Income tax expense (recovery) (419) (2,037)
Depreciation, depletion and amortization 1,622 1,956
Impairments 508 4,695
Accretion of asset retirement obligation 53 53
Foreign exchange (gain) loss, net 223 (107)
Unrealized (gain) loss on risk management 158 1,465
Other (7) 1
Adjusted EBITDA $ 3,103 $ 3,754
Debt to Adjusted EBITDA 2.5x 2.0x
Debt to Adjusted Capitalization Debt to Adjusted Capitalization is a non-GAAP measure, which adjusts capitalization for historical ceiling test impairments that were recorded as at December 31, 2011. Management monitors Debt to Adjusted Capitalization as a proxy for Encana’s financial covenant under its credit facility agreements which require debt to adjusted capitalization to be less than 60 percent. Adjusted Capitalization includes debt, shareholders’ equity and an equity adjustment for cumulative historical ceiling test impairments recorded as at December 31, 2011 in conjunction with the Company’s January 1, 2012 adoption of U.S. GAAP.
($ millions) September 30, 2013 December 31, 2012 Debt $ 7,649 $ 7,675
Shareholders’ Equity 5,413 5,295
Equity Adjustment for Impairments at December 31, 2011 7,746 7,746
Adjusted Capitalization $ 20,808 $ 20,716
Debt to Adjusted Capitalization 37% 37%
Management’s Discussion and Analysis Encana Corporation Prepared using U.S. GAAP in US$ 31
Advisory Forward-Looking Statements In the interest of providing Encana shareholders and potential investors with information regarding the Company and its subsidiaries, including Management’s assessment of Encana’s and its subsidiaries’ future plans and operations, certain statements contained in this document constitute forward-looking statements or information (collectively referred to herein as “forward-looking statements”) within the meaning of the “safe harbour” provisions of applicable securities legislation. Forward-looking statements are typically identified by words such as “anticipate”, “believe”, “expect”, “plan”, “intend”, “forecast”, “target”, “project”, “objective”, “strategy”, “strives”, “agreed to” or similar words suggesting future outcomes or statements regarding an outlook. Forward-looking statements in this document include, but are not limited to, statements with respect to: achieving the Company’s focus on developing its strong portfolio of diverse resource plays producing natural gas, oil and NGLs; commitment to growing long-term shareholder value and paying dividends; pursuing its key business objectives of maintaining financial strength, optimizing capital investments in its highest return projects, maximizing profitability through operating efficiencies, reducing costs and leveraging flexibility through market fundamentals; expanding the use of natural gas in North America; developing and implementing a new strategy for 2014 and its projected success; ability to continue entering prospective plays early and leveraging technology to unlock resources and build the underlying productive capacity at low cost; achieving operating efficiencies, fostering technological innovation, lowering cost structures and success of resource play hub model; anticipated future proceeds from various joint venture, partnership and other agreements entered into by the Company, including their successful implementation, expected future benefits and the Company’s ability to fund future development costs associated with those agreements; projections contained in the 2013 Corporate Guidance (including estimates of cash flow including per share, natural gas, oil and NGLs production, capital investment and its allocation, net divestitures, operating costs, and 2013 estimated sensitivities of cash flow and operating earnings); estimates of reserves and resources; expectation that the discounted after-tax future net cash flows from proved reserves used in ceiling test calculations is not indicative of the fair market value of Encana’s oil and gas properties or of the future net cash flows expected to be generated from such properties; projections relating to the adequacy of the Company’s provision for taxes and legal claims; possibility of legal actions in connection with the matters relating to the allegations of collusion with competitors regarding land leasing in Michigan in 2010; the flexibility of capital spending plans and the source of funding therefore; the benefits of the Company’s risk management program, including the impact of derivative financial instruments; projections that the Company has access to cash equivalents and a range of funding at competitive rates; the Company’s ability to meet payment terms of its suppliers and be in compliance with all financial covenants under its credit facility agreements; expectations surrounding environmental legislation including regulations relating to climate change and hydraulic fracturing and the impact such regulations could have on the Company and the results of additional scientific investigations of the Pavillion groundwater; anticipated flexibility to refinance maturing long-term debt or repay existing maturities from existing sources of liquidity; expectation to fund 2013 commitments from Cash Flow, cash and cash equivalents; expectation not to access the debt capital market in Canada in the near term; the effect of the Company’s risk mitigation policies, systems, processes and insurance program; the Company’s ability to manage its Net Debt to Debt Adjusted Cash Flow, Debt to Debt Adjusted Cash Flow, Debt to Adjusted EBITDA and Debt to Adjusted Capitalization ratios; and the expected impact and timing of various accounting pronouncements, rule changes and standards on the Company and its financial statements. Readers are cautioned not to place undue reliance on forward-looking statements, as there can be no assurance that the plans, intentions or expectations upon which they are based will occur. By their nature, forward-looking statements involve numerous assumptions, known and unknown risks and uncertainties, both general and specific, that contribute to the possibility that the predictions, forecasts, projections and other forward-looking statements will not occur, which may cause the Company’s actual performance and financial results in future periods to differ materially from any estimates or projections of future performance or results expressed or implied by such forward-looking statements. These assumptions, risks and uncertainties include, among other things: volatility of, and assumptions regarding natural gas and liquids prices, including substantial or extended decline of the same and their adverse effect on the Company’s operations and financial condition and the value and amount of its reserves; assumptions based upon the Company’s current guidance; fluctuations in currency and interest rates; risk that the Company may not conclude divestitures of certain assets or other transactions or receive
Management’s Discussion and Analysis Encana Corporation Prepared using U.S. GAAP in US$ 32
amounts contemplated under the transaction agreements (such transactions may include third party capital investments, farm-outs or partnerships, which Encana may refer to from time to time as “partnerships” or “joint ventures” and the funds received in respect thereof which Encana may refer to from time to time as “proceeds”, “deferred purchase price” and/or “carry capital”, regardless of the legal form) as a result of various conditions not being met; product supply and demand; market competition; risks inherent in the Company’s and its subsidiaries’ marketing operations, including credit risks; imprecision of reserves estimates and estimates of recoverable quantities of natural gas and liquids from resource plays and other sources not currently classified as proved, probable or possible reserves or economic contingent resources, including future net revenue estimates; marketing margins; potential disruption or unexpected technical difficulties in developing new facilities; unexpected cost increases or technical difficulties in constructing or modifying processing facilities; risks associated with technology; the Company’s ability to acquire or find additional reserves; hedging activities resulting in realized and unrealized losses; business interruption and casualty losses; risk of the Company not operating all of its properties and assets; counterparty risk; downgrade in credit rating and its adverse effects; liability for indemnification obligations to third parties; variability of dividends to be paid; its ability to generate sufficient cash flow from operations to meet its current and future obligations; its ability to access external sources of debt and equity capital; the timing and the costs of well and pipeline construction; the Company’s ability to secure adequate product transportation; changes in royalty, tax, environmental, greenhouse gas, carbon, accounting and other laws or regulations or the interpretations of such laws or regulations; political and economic conditions in the countries in which the Company operates; terrorist threats; risks associated with existing and potential future lawsuits and regulatory actions made against the Company; risk arising from price basis differential; risk arising from inability to enter into attractive hedges to protect the Company’s capital program; and other risks and uncertainties described from time to time in the reports and filings made with securities regulatory authorities by Encana. Although Encana believes that the expectations represented by such forward-looking statements are reasonable, there can be no assurance that such expectations will prove to be correct. Readers are cautioned that the foregoing list of important factors is not exhaustive. Furthermore, the forward-looking statements contained in this document are made as of the date hereof and, except as required by law, Encana undertakes no obligation to update publicly or revise any forward-looking statements, whether as a result of new information, future events or otherwise. The forward-looking statements contained in this document are expressly qualified by this cautionary statement. Forward-looking information respecting anticipated 2013 cash flow for Encana is based upon, among other things, achieving average production for 2013 of between 2.7 billion cubic feet per day (“Bcf/d”) and 2.8 Bcf/d of natural gas and 50,000 bbls/d to 60,000 bbls/d of liquids, commodity prices for natural gas and liquids based on NYMEX $3.75 per Mcf and WTI of $95 per bbl, an estimated U.S./Canadian dollar foreign exchange rate of $1.00 and a weighted average number of outstanding shares for Encana of approximately 736 million. Forward-looking statements with respect to matters relating to allegations of collusion with competitors regarding land leasing in Michigan in 2010 are qualified by the fact that, while Encana intends to vigorously defend against any claims of liability alleged in any lawsuits arising out of such allegations, the Company cannot predict the outcome of any governmental investigations or the commencement or outcome of any future legal proceedings involving Encana or whether such proceedings would lead to monetary damages which could have a material adverse effect on the Company’s financial position, or whether there will be other proceedings arising out of these allegations. Assumptions relating to forward-looking statements generally include Encana’s current expectations and projections made in light of, and generally consistent with, its historical experience and its perception of historical trends, including the conversion of resources into reserves and production as well as expectations regarding rates of advancement and innovation, generally consistent with and informed by its past experience, all of which are subject to the risk factors identified elsewhere in this document. Encana is required to disclose events and circumstances that occurred during the period to which this MD&A relates that are reasonably likely to cause actual results to differ materially from material forward-looking statements for a period that is not yet complete that Encana has previously disclosed to the public and the expected differences thereto. Such disclosure can be found in Encana’s news release dated October 23, 2013, which is available on Encana’s website at www.encana.com, on SEDAR at www.sedar.com and EDGAR at www.sec.gov.

Management’s Discussion and Analysis Encana Corporation Prepared using U.S. GAAP in US$ 33
Oil and Gas Information National Instrument 51-101 (“NI 51-101”) of the Canadian Securities Administrators imposes oil and gas disclosure standards for Canadian public companies engaged in oil and gas activities. The Canadian protocol disclosure is contained in Appendix A and under “Narrative Description of the Business” in the Company’s Annual Information Form (“AIF”). Encana obtained an exemption dated January 4, 2011 from certain requirements of NI 51-101 to permit it to provide certain disclosure prepared in accordance with U.S. disclosure requirements, in addition to the Canadian protocol disclosure. The Company’s U.S. protocol disclosure is included in Note 22 (unaudited) to the Company’s Consolidated Financial Statements for the year ended December 31, 2012 and in Appendix D of the AIF. A description of the primary differences between the disclosure requirements under the Canadian standards and the U.S. standards is set forth under the heading “Reserves and Other Oil and Gas Information” in the AIF. Resource Play
Resource play is a term used by Encana to describe an accumulation of hydrocarbons known to exist over a large areal expanse and/or thick vertical section, which when compared to a conventional play, typically has a lower geological and/or commercial development risk and lower average decline rate.
Currency and References to Encana All information included in this document and the Interim Condensed Consolidated Financial Statements and comparative information is shown on a U.S. dollar, after royalties basis, unless otherwise noted. References to C$ are to Canadian dollars. Encana’s financial results are consolidated in Canadian dollars, however, the Company has adopted the U.S. dollar as its reporting currency to facilitate a more direct comparison to other North American oil and gas companies. All proceeds from divestitures are provided on a before-tax basis. For convenience, references in this document to “Encana”, the “Company”, “we”, “us”, “our” and “its” may, where applicable, refer only to or include any relevant direct and indirect subsidiary corporations and partnerships (“Subsidiaries”) of Encana Corporation, and the assets, activities and initiatives of such Subsidiaries.
Additional Information Further information regarding Encana Corporation, including its Annual Information Form, can be accessed under the Company’s public filings found on SEDAR at www.sedar.com, on EDGAR at www.sec.gov and on the Company’s website at www.encana.com.