Embed Size (px)
Citation preview
MANAGEMENT’S DISCUSSION AND ANALYSIS AND INTERIM CONDENSED CONSOLIDATED FINANCIAL STATEMENTS
As at September 30, 2018 and for the three months and nine months ended September 30, 2018 and 2017
CONTENTS
1 Management’s Discussion and Analysis
25 Interim Condensed Consolidated Financial Statements
29 Notes to the Interim Condensed Consolidated Financial Statements
Management’s Discussion and Analysis | 1
MANAGEMENT’S DISCUSSION AND ANALYSIS
This management’s discussion and analysis (“MD&A“) should be read in conjunction with Tourmaline’s unaudited
interim condensed consolidated financial statements and related notes as at and for the three and nine months
ended September 30, 2018 and the consolidated financial statements for the year ended December 31, 2017.
The consolidated financial statements and the MD&A can be found at www.sedar.com. This MD&A is dated
November 7, 2018.
The financial information contained herein has been prepared in accordance with International Financial
Reporting Standards (“IFRS”) and sometimes referred to in this MD&A as Generally Accepted Accounting
Principles (“GAAP”) as issued by the International Accounting Standards Board. All dollar amounts are
expressed in Canadian currency, unless otherwise noted.
Certain financial measures referred to in this MD&A are not prescribed by IFRS. See “Non-GAAP Financial
Measures” for information regarding the following non-GAAP financial measures used in this MD&A: “cash flow”,
“operating netback”, “working capital (adjusted for the fair value of financial instruments)”, “net debt", “adjusted
EBITDA”, “senior debt”, “total debt”, and “total capitalization”.
Additional information relating to Tourmaline can be found at www.sedar.com or at www.tourmalineoil.com.
Forward-Looking Statements - Certain information regarding Tourmaline set forth in this MD&A, including
management's assessment of the Company’s future plans and operations, contains forward-looking statements
that involve substantial known and unknown risks and uncertainties. The use of any of the words "anticipate",
"continue", "estimate", "expect", "may", "will", "project", "should", "believe" and similar expressions are intended to
identify forward-looking statements. Such statements represent Tourmaline's internal projections, forecasts,
estimates or beliefs concerning, among other things, an outlook on the estimated amounts and timing of capital
investment or expenditures, anticipated future debt, expenses, production, cash flow and revenues or other
expectations, beliefs, plans, objectives, assumptions, intentions or statements about future events or
performance. These statements are only predictions and actual events or results may differ materially. Although
Tourmaline believes that the expectations reflected in the forward-looking statements are reasonable, it cannot
guarantee future results, levels of activity, performance or achievement since such expectations are inherently
subject to significant business, economic, competitive, political and social risks, uncertainties and contingencies.
In particular, forward-looking statements included in this MD&A include, but are not limited to, statements with
respect to: the size of, and future net revenues and cash flow from, crude oil, NGL (natural gas liquids) and
natural gas reserves; future prospects; the focus of and timing of capital expenditures; expectations regarding the
ability to raise capital and to continually add to reserves through acquisitions and development; access to debt
and equity markets; projections of market prices and costs; the performance characteristics of the Company's
crude oil, NGL and natural gas properties; crude oil, NGL and natural gas production levels and product mix; the
payment of dividends and the timing and amount thereof; Tourmaline’s future operating and financial results;
capital investment programs; supply and demand for crude oil, NGL and natural gas; future royalty rates; drilling,
development and completion plans and the results therefrom; future land expiries; dispositions and joint venture
Management’s Discussion and Analysis | 2
arrangements; amount of operating, transportation and general and administrative expenses; treatment under
governmental regulatory regimes and tax and environmental laws and regulations; and estimated tax pool
balances. In addition, statements relating to "reserves" are deemed to be forward-looking statements, as they
involve the implied assessment, based on certain estimates and assumptions, that the reserves described can be
profitably produced in the future.
These forward-looking statements are subject to numerous risks and uncertainties, most of which are beyond the
Company’s control, including the impact of general economic conditions; volatility and uncertainty in market
prices for crude oil, NGL and natural gas; industry conditions; currency fluctuation; imprecision of reserve
estimates; liabilities inherent in crude oil, NGL and natural gas operations; environmental risks; incorrect
assessments of the value of acquisitions and exploration and development programs; competition; the lack of
availability of qualified personnel or management and skilled labour; changes in income tax and environmental
laws and regulations and incentive programs relating to the oil and gas industry; hazards such as fire, explosion,
blowouts, cratering, and spills, any of which could result in substantial damage to wells, production facilities, other
property and the environment or in personal injury; stock market volatility; ability to access sufficient capital from
internal and external sources; the receipt of applicable regulatory or third-party approvals; and the other risks
considered under "Risk Factors" in Tourmaline’s most recent annual information form available at
www.sedar.com.
With respect to forward-looking statements contained in this MD&A, Tourmaline has made assumptions
regarding: prevailing and future commodity prices and royalty regimes and tax laws; future well production rates
and reserve volumes; availability of skilled labour; timing and amount of capital expenditures; future exchange
rates; the impact of increasing competition; conditions in general economic and financial markets; availability of
drilling and related equipment and services; effects of regulation by governmental agencies; future operating
costs; decommissioning obligations; and ability to market crude oil, natural gas and NGL successfully. Without
limitation of the foregoing, future dividend payments, if any, and the level thereof is uncertain, as the Company's
dividend policy and the funds available for the payment of dividends from time to time will be dependent upon,
among other things, cash flow, financial requirements for the Company's operations and the execution of its
growth strategy, fluctuations in working capital and the timing and amount of capital expenditures, debt service
requirements and other factors beyond the Company's control. Further, the ability of Tourmaline to pay dividends
will be subject to applicable laws (including the satisfaction of the solvency test contained in applicable corporate
legislation) and contractual restrictions contained in the instruments governing its indebtedness, including its
credit facility.
Management has included the above summary of assumptions and risks related to forward-looking statements
provided in this MD&A in order to provide readers with a more complete perspective on Tourmaline’s future
operations and such information may not be appropriate for other purposes. Tourmaline’s actual results,
performance or achievement could differ materially from those expressed in, or implied by, these forward-looking
statements and, accordingly, no assurance can be given that any of the events anticipated by the forward-looking
statements will transpire or occur, or if any of them do so, what benefits, if any, that the Company will derive
therefrom. Readers are cautioned that the foregoing lists of factors are not exhaustive.
Management’s Discussion and Analysis | 3
These forward-looking statements are made as of the date of this MD&A and the Company disclaims any intent
or obligation to update publicly any forward-looking statements, whether as a result of new information, future
events or results or otherwise, other than as required by applicable securities laws.
Boe Conversions - Per barrel of oil equivalent amounts have been calculated using a conversion rate of six
thousand cubic feet of natural gas to one barrel of oil equivalent (6:1). Barrel of oil equivalents (boe) may be
misleading, particularly if used in isolation. A boe conversion ratio of 6 mcf:1 bbl is based on an energy
equivalency conversion method primarily applicable at the burner tip and does not represent a value equivalency
at the wellhead. In addition, as the value ratio between natural gas and crude oil based on current prices of
natural gas and crude oil is significantly different from the energy equivalency of 6:1, utilizing a conversion on a
6:1 basis may be misleading as an indication of value.
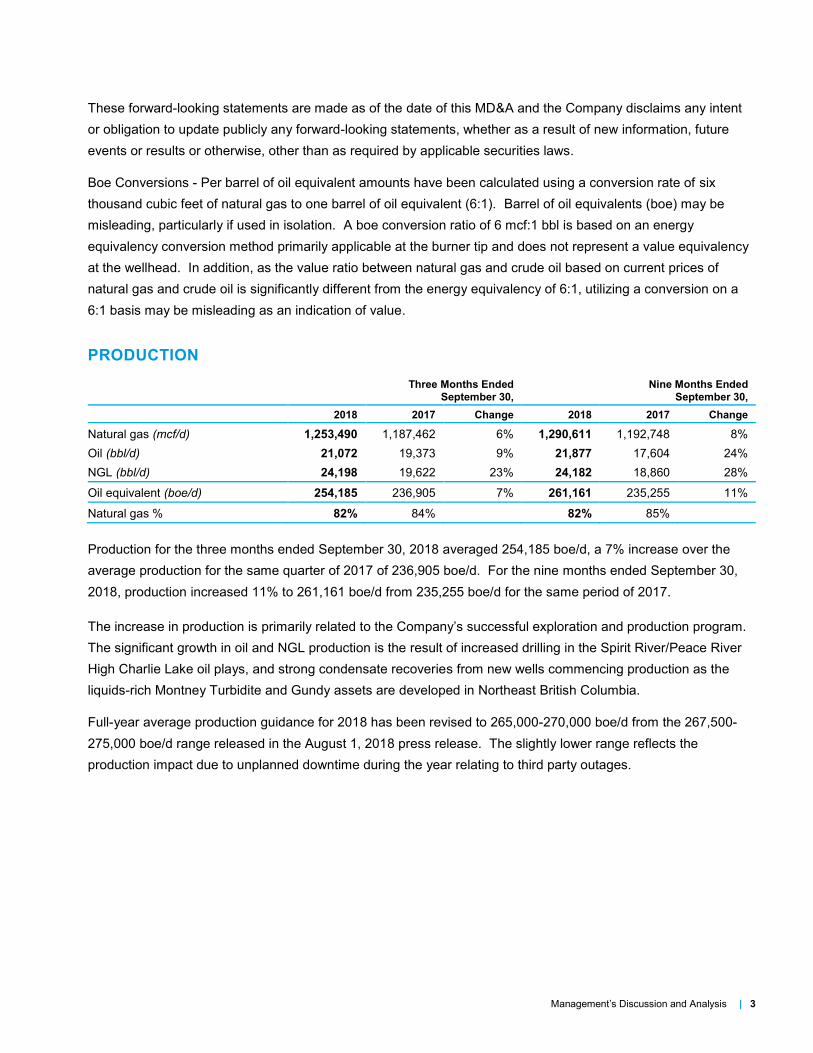
PRODUCTION
Three Months Ended
September 30,
Nine Months Ended
September 30,
2018 2017 Change 2018 2017 Change
Natural gas (mcf/d) 1,253,490 1,187,462 6% 1,290,611 1,192,748 8%
Oil (bbl/d) 21,072 19,373 9% 21,877 17,604 24%
NGL (bbl/d) 24,198 19,622 23% 24,182 18,860 28%
Oil equivalent (boe/d) 254,185 236,905 7% 261,161 235,255 11%
Natural gas % 82% 84% 82% 85%
Production for the three months ended September 30, 2018 averaged 254,185 boe/d, a 7% increase over the
average production for the same quarter of 2017 of 236,905 boe/d. For the nine months ended September 30,
2018, production increased 11% to 261,161 boe/d from 235,255 boe/d for the same period of 2017.
The increase in production is primarily related to the Company’s successful exploration and production program.
The significant growth in oil and NGL production is the result of increased drilling in the Spirit River/Peace River
High Charlie Lake oil plays, and strong condensate recoveries from new wells commencing production as the
liquids-rich Montney Turbidite and Gundy assets are developed in Northeast British Columbia.
Full-year average production guidance for 2018 has been revised to 265,000-270,000 boe/d from the 267,500-
275,000 boe/d range released in the August 1, 2018 press release. The slightly lower range reflects the
production impact due to unplanned downtime during the year relating to third party outages.
Management’s Discussion and Analysis | 4
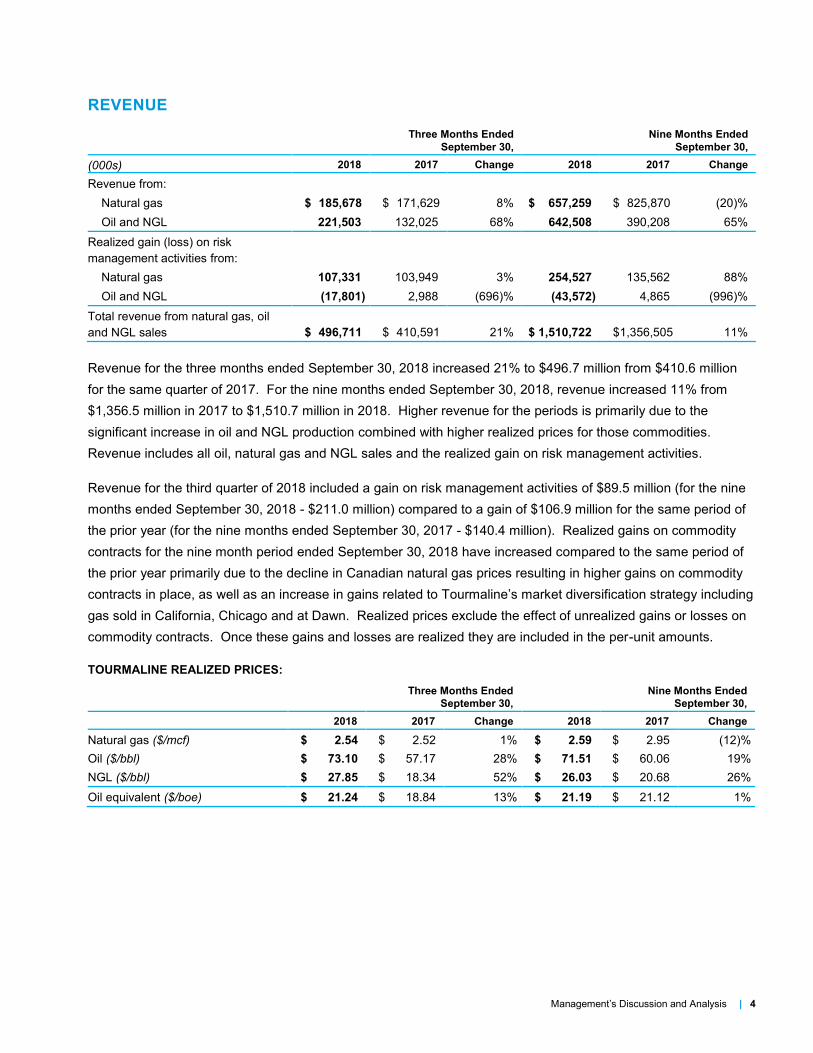
REVENUE
Three Months Ended
September 30,
Nine Months Ended
September 30,
(000s) 2018 2017 Change 2018 2017 Change
Revenue from:
Natural gas $ 185,678 $ 171,629 8% $ 657,259 $ 825,870 (20)%
Oil and NGL 221,503 132,025 68% 642,508 390,208 65%
Realized gain (loss) on risk
management activities from:
Natural gas 107,331 103,949 3% 254,527 135,562 88%
Oil and NGL (17,801) 2,988 (696)% (43,572) 4,865 (996)%
Total revenue from natural gas, oil
and NGL sales $ 496,711 $ 410,591 21% $ 1,510,722 $1,356,505 11%
Revenue for the three months ended September 30, 2018 increased 21% to $496.7 million from $410.6 million
for the same quarter of 2017. For the nine months ended September 30, 2018, revenue increased 11% from
$1,356.5 million in 2017 to $1,510.7 million in 2018. Higher revenue for the periods is primarily due to the
significant increase in oil and NGL production combined with higher realized prices for those commodities.
Revenue includes all oil, natural gas and NGL sales and the realized gain on risk management activities.
Revenue for the third quarter of 2018 included a gain on risk management activities of $89.5 million (for the nine
months ended September 30, 2018 - $211.0 million) compared to a gain of $106.9 million for the same period of
the prior year (for the nine months ended September 30, 2017 - $140.4 million). Realized gains on commodity
contracts for the nine month period ended September 30, 2018 have increased compared to the same period of
the prior year primarily due to the decline in Canadian natural gas prices resulting in higher gains on commodity
contracts in place, as well as an increase in gains related to Tourmaline’s market diversification strategy including
gas sold in California, Chicago and at Dawn. Realized prices exclude the effect of unrealized gains or losses on
commodity contracts. Once these gains and losses are realized they are included in the per-unit amounts.
TOURMALINE REALIZED PRICES:
Three Months Ended
September 30,
Nine Months Ended
September 30,
2018 2017 Change 2018 2017 Change
Natural gas ($/mcf) $ 2.54 $ 2.52 1% $ 2.59 $ 2.95 (12)%
Oil ($/bbl) $ 73.10 $ 57.17 28% $ 71.51 $ 60.06 19%
NGL ($/bbl) $ 27.85 $ 18.34 52% $ 26.03 $ 20.68 26%
Oil equivalent ($/boe) $ 21.24 $ 18.84 13% $ 21.19 $ 21.12 1%
Management’s Discussion and Analysis | 5
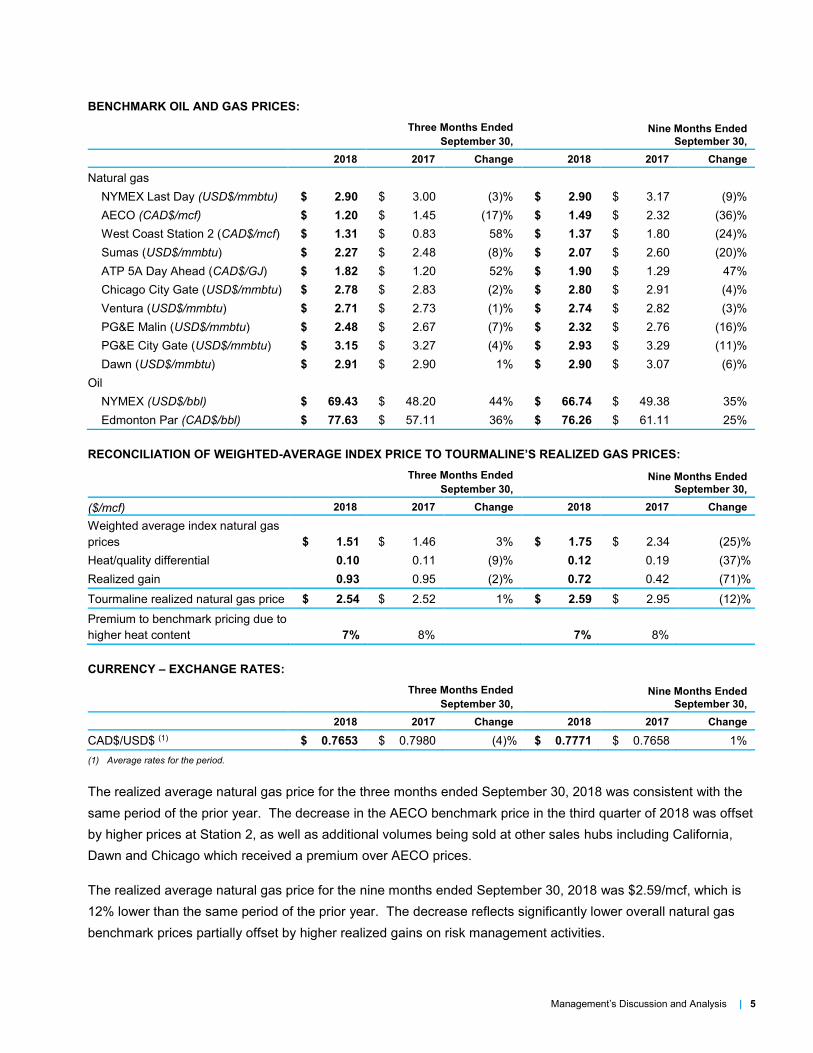
BENCHMARK OIL AND GAS PRICES:
Three Months Ended
September 30,
Nine Months Ended
September 30,
2018 2017 Change 2018 2017 Change
Natural gas
NYMEX Last Day (USD$/mmbtu) $ 2.90 $ 3.00 (3)% $ 2.90 $ 3.17 (9)%
AECO (CAD$/mcf) $ 1.20 $ 1.45 (17)% $ 1.49 $ 2.32 (36)%
West Coast Station 2 (CAD$/mcf) $ 1.31 $ 0.83 58% $ 1.37 $ 1.80 (24)%
Sumas (USD$/mmbtu) $ 2.27 $ 2.48 (8)% $ 2.07 $ 2.60 (20)%
ATP 5A Day Ahead (CAD$/GJ) $ 1.82 $ 1.20 52% $ 1.90 $ 1.29 47%
Chicago City Gate (USD$/mmbtu) $ 2.78 $ 2.83 (2)% $ 2.80 $ 2.91 (4)%
Ventura (USD$/mmbtu) $ 2.71 $ 2.73 (1)% $ 2.74 $ 2.82 (3)%
PG&E Malin (USD$/mmbtu) $ 2.48 $ 2.67 (7)% $ 2.32 $ 2.76 (16)%
PG&E City Gate (USD$/mmbtu) $ 3.15 $ 3.27 (4)% $ 2.93 $ 3.29 (11)%
Dawn (USD$/mmbtu) $ 2.91 $ 2.90 1% $ 2.90 $ 3.07 (6)%
Oil
NYMEX (USD$/bbl) $ 69.43 $ 48.20 44% $ 66.74 $ 49.38 35%
Edmonton Par (CAD$/bbl) $ 77.63 $ 57.11 36% $ 76.26 $ 61.11 25%
RECONCILIATION OF WEIGHTED-AVERAGE INDEX PRICE TO TOURMALINE’S REALIZED GAS PRICES:
Three Months Ended
September 30,
Nine Months Ended
September 30,
($/mcf) 2018 2017 Change 2018 2017 Change
Weighted average index natural gas
prices $ 1.51 $ 1.46 3% $ 1.75 $ 2.34 (25)%
Heat/quality differential 0.10 0.11 (9)% 0.12 0.19 (37)%
Realized gain 0.93 0.95 (2)% 0.72 0.42 (71)%
Tourmaline realized natural gas price $ 2.54 $ 2.52 1% $ 2.59 $ 2.95 (12)%
Premium to benchmark pricing due to
higher heat content 7% 8% 7% 8%
CURRENCY – EXCHANGE RATES:
Three Months Ended
September 30,
Nine Months Ended
September 30,
2018 2017 Change 2018 2017 Change
CAD$/USD$ (1) $ 0.7653 $ 0.7980 (4)% $ 0.7771 $ 0.7658 1%
(1) Average rates for the period.
The realized average natural gas price for the three months ended September 30, 2018 was consistent with the
same period of the prior year. The decrease in the AECO benchmark price in the third quarter of 2018 was offset
by higher prices at Station 2, as well as additional volumes being sold at other sales hubs including California,
Dawn and Chicago which received a premium over AECO prices.
The realized average natural gas price for the nine months ended September 30, 2018 was $2.59/mcf, which is
12% lower than the same period of the prior year. The decrease reflects significantly lower overall natural gas
benchmark prices partially offset by higher realized gains on risk management activities.
Management’s Discussion and Analysis | 6
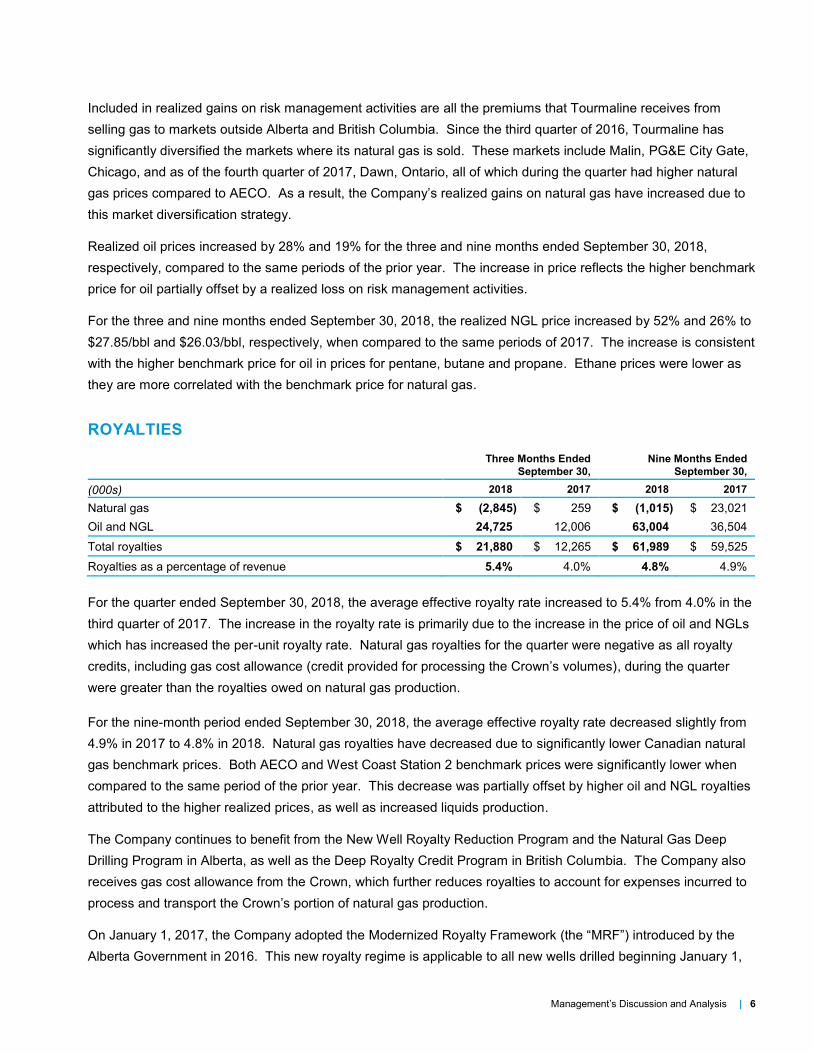
Included in realized gains on risk management activities are all the premiums that Tourmaline receives from
selling gas to markets outside Alberta and British Columbia. Since the third quarter of 2016, Tourmaline has
significantly diversified the markets where its natural gas is sold. These markets include Malin, PG&E City Gate,
Chicago, and as of the fourth quarter of 2017, Dawn, Ontario, all of which during the quarter had higher natural
gas prices compared to AECO. As a result, the Company’s realized gains on natural gas have increased due to
this market diversification strategy.
Realized oil prices increased by 28% and 19% for the three and nine months ended September 30, 2018,
respectively, compared to the same periods of the prior year. The increase in price reflects the higher benchmark
price for oil partially offset by a realized loss on risk management activities.
For the three and nine months ended September 30, 2018, the realized NGL price increased by 52% and 26% to
$27.85/bbl and $26.03/bbl, respectively, when compared to the same periods of 2017. The increase is consistent
with the higher benchmark price for oil in prices for pentane, butane and propane. Ethane prices were lower as
they are more correlated with the benchmark price for natural gas.
ROYALTIES
Three Months Ended
September 30,
Nine Months Ended
September 30,
(000s) 2018 2017 2018 2017
Natural gas $ (2,845) $ 259 $ (1,015) $ 23,021
Oil and NGL 24,725 12,006 63,004 36,504
Total royalties $ 21,880 $ 12,265 $ 61,989 $ 59,525
Royalties as a percentage of revenue 5.4% 4.0% 4.8% 4.9%
For the quarter ended September 30, 2018, the average effective royalty rate increased to 5.4% from 4.0% in the
third quarter of 2017. The increase in the royalty rate is primarily due to the increase in the price of oil and NGLs
which has increased the per-unit royalty rate. Natural gas royalties for the quarter were negative as all royalty
credits, including gas cost allowance (credit provided for processing the Crown’s volumes), during the quarter
were greater than the royalties owed on natural gas production.
For the nine-month period ended September 30, 2018, the average effective royalty rate decreased slightly from
4.9% in 2017 to 4.8% in 2018. Natural gas royalties have decreased due to significantly lower Canadian natural
gas benchmark prices. Both AECO and West Coast Station 2 benchmark prices were significantly lower when
compared to the same period of the prior year. This decrease was partially offset by higher oil and NGL royalties
attributed to the higher realized prices, as well as increased liquids production.
The Company continues to benefit from the New Well Royalty Reduction Program and the Natural Gas Deep
Drilling Program in Alberta, as well as the Deep Royalty Credit Program in British Columbia. The Company also
receives gas cost allowance from the Crown, which further reduces royalties to account for expenses incurred to
process and transport the Crown’s portion of natural gas production.
On January 1, 2017, the Company adopted the Modernized Royalty Framework (the “MRF”) introduced by the
Alberta Government in 2016. This new royalty regime is applicable to all new wells drilled beginning January 1,
Management’s Discussion and Analysis | 7
2017, and all other wells drilled prior to January 1, 2017 will follow the old framework for a further 10 years. The
Company believes that the MRF is generally consistent with the initial goal of incentivizing the use of technology
to improve productivity and rewards producers deploying the most competitive operating practices. Under the
MRF, if commodity prices stayed consistent, the Company anticipates an increase in the corporate royalty rate
but based on the Company’s current development plans and operational practices, the increase is not expected
to be significant.
The Company expects its royalty rate for 2018 to be approximately 5%, which is consistent with the guidance
provided in the Company’s March 31, 2018 MD&A. The royalty rate is sensitive to commodity prices, and as
such, fluctuations in commodity prices will impact the actual rate.
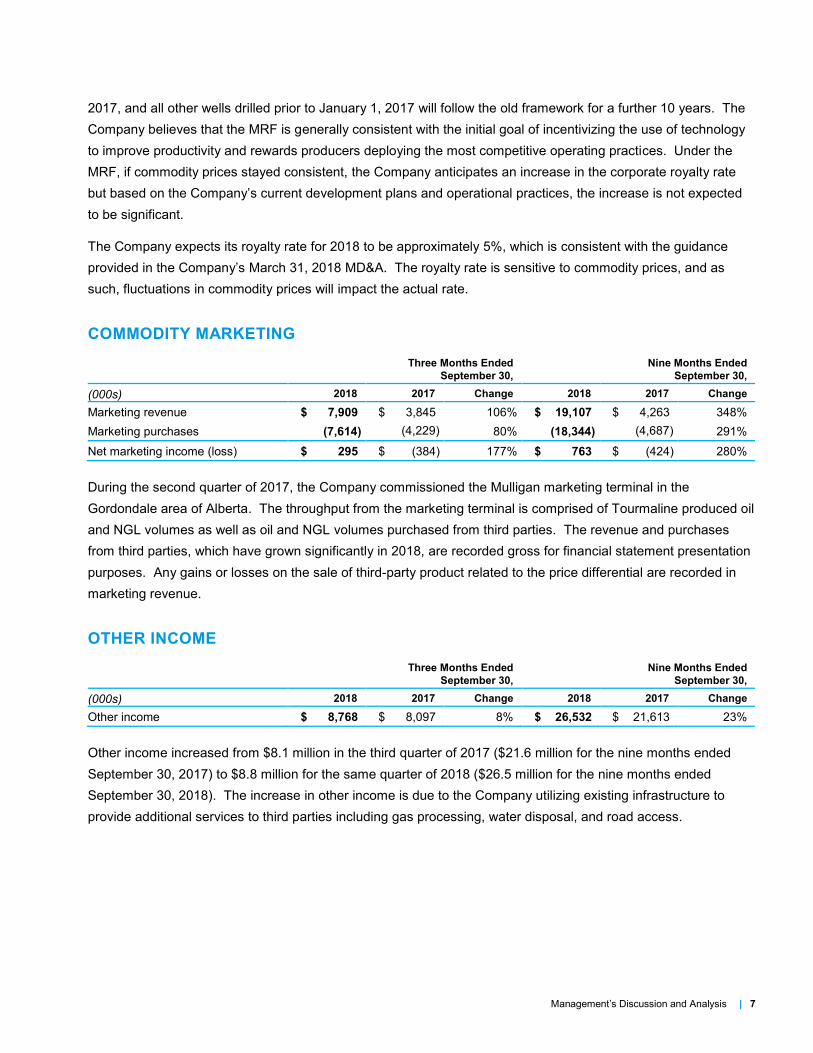
COMMODITY MARKETING
Three Months Ended
September 30,
Nine Months Ended
September 30,
(000s) 2018 2017 Change 2018 2017 Change
Marketing revenue $ 7,909 $ 3,845 106% $ 19,107 $ 4,263 348%
Marketing purchases (7,614) (4,229) 80% (18,344) (4,687) 291%
Net marketing income (loss) $ 295 $ (384) 177% $ 763 $ (424) 280%
During the second quarter of 2017, the Company commissioned the Mulligan marketing terminal in the
Gordondale area of Alberta. The throughput from the marketing terminal is comprised of Tourmaline produced oil
and NGL volumes as well as oil and NGL volumes purchased from third parties. The revenue and purchases
from third parties, which have grown significantly in 2018, are recorded gross for financial statement presentation
purposes. Any gains or losses on the sale of third-party product related to the price differential are recorded in
marketing revenue.
OTHER INCOME
Three Months Ended
September 30,
Nine Months Ended
September 30,
(000s) 2018 2017 Change 2018 2017 Change
Other income $ 8,768 $ 8,097 8% $ 26,532 $ 21,613 23%
Other income increased from $8.1 million in the third quarter of 2017 ($21.6 million for the nine months ended
September 30, 2017) to $8.8 million for the same quarter of 2018 ($26.5 million for the nine months ended
September 30, 2018). The increase in other income is due to the Company utilizing existing infrastructure to
provide additional services to third parties including gas processing, water disposal, and road access.
Management’s Discussion and Analysis | 8
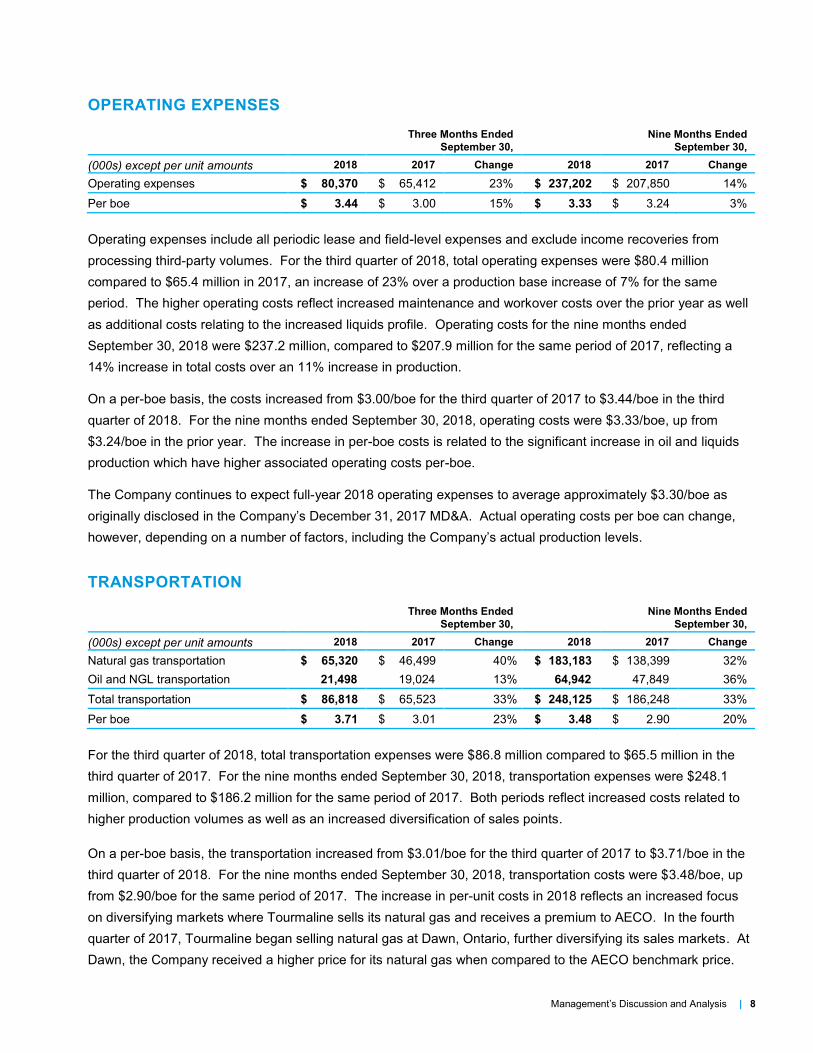
OPERATING EXPENSES
Three Months Ended
September 30,
Nine Months Ended
September 30,
(000s) except per unit amounts 2018 2017 Change 2018 2017 Change
Operating expenses $ 80,370 $ 65,412 23% $ 237,202 $ 207,850 14%
Per boe $ 3.44 $ 3.00 15% $ 3.33 $ 3.24 3%
Operating expenses include all periodic lease and field-level expenses and exclude income recoveries from
processing third-party volumes. For the third quarter of 2018, total operating expenses were $80.4 million
compared to $65.4 million in 2017, an increase of 23% over a production base increase of 7% for the same
period. The higher operating costs reflect increased maintenance and workover costs over the prior year as well
as additional costs relating to the increased liquids profile. Operating costs for the nine months ended
September 30, 2018 were $237.2 million, compared to $207.9 million for the same period of 2017, reflecting a
14% increase in total costs over an 11% increase in production.
On a per-boe basis, the costs increased from $3.00/boe for the third quarter of 2017 to $3.44/boe in the third
quarter of 2018. For the nine months ended September 30, 2018, operating costs were $3.33/boe, up from
$3.24/boe in the prior year. The increase in per-boe costs is related to the significant increase in oil and liquids
production which have higher associated operating costs per-boe.
The Company continues to expect full-year 2018 operating expenses to average approximately $3.30/boe as
originally disclosed in the Company’s December 31, 2017 MD&A. Actual operating costs per boe can change,
however, depending on a number of factors, including the Company’s actual production levels.
TRANSPORTATION
Three Months Ended
September 30,
Nine Months Ended
September 30,
(000s) except per unit amounts 2018 2017 Change 2018 2017 Change
Natural gas transportation $ 65,320 $ 46,499 40% $ 183,183 $ 138,399 32%
Oil and NGL transportation 21,498 19,024 13% 64,942 47,849 36%
Total transportation $ 86,818 $ 65,523 33% $ 248,125 $ 186,248 33%
Per boe $ 3.71 $ 3.01 23% $ 3.48 $ 2.90 20%
For the third quarter of 2018, total transportation expenses were $86.8 million compared to $65.5 million in the
third quarter of 2017. For the nine months ended September 30, 2018, transportation expenses were $248.1
million, compared to $186.2 million for the same period of 2017. Both periods reflect increased costs related to
higher production volumes as well as an increased diversification of sales points.
On a per-boe basis, the transportation increased from $3.01/boe for the third quarter of 2017 to $3.71/boe in the
third quarter of 2018. For the nine months ended September 30, 2018, transportation costs were $3.48/boe, up
from $2.90/boe for the same period of 2017. The increase in per-unit costs in 2018 reflects an increased focus
on diversifying markets where Tourmaline sells its natural gas and receives a premium to AECO. In the fourth
quarter of 2017, Tourmaline began selling natural gas at Dawn, Ontario, further diversifying its sales markets. At
Dawn, the Company received a higher price for its natural gas when compared to the AECO benchmark price.
Management’s Discussion and Analysis | 9
Also, in the second quarter of 2018, Tourmaline added an additional 100 mmcf/day of transportation capacity to
access the Malin and PG&E markets. The increased proportion of natural gas sold outside Alberta and the
increased distance resulted in higher per-boe fuel and transportation costs.
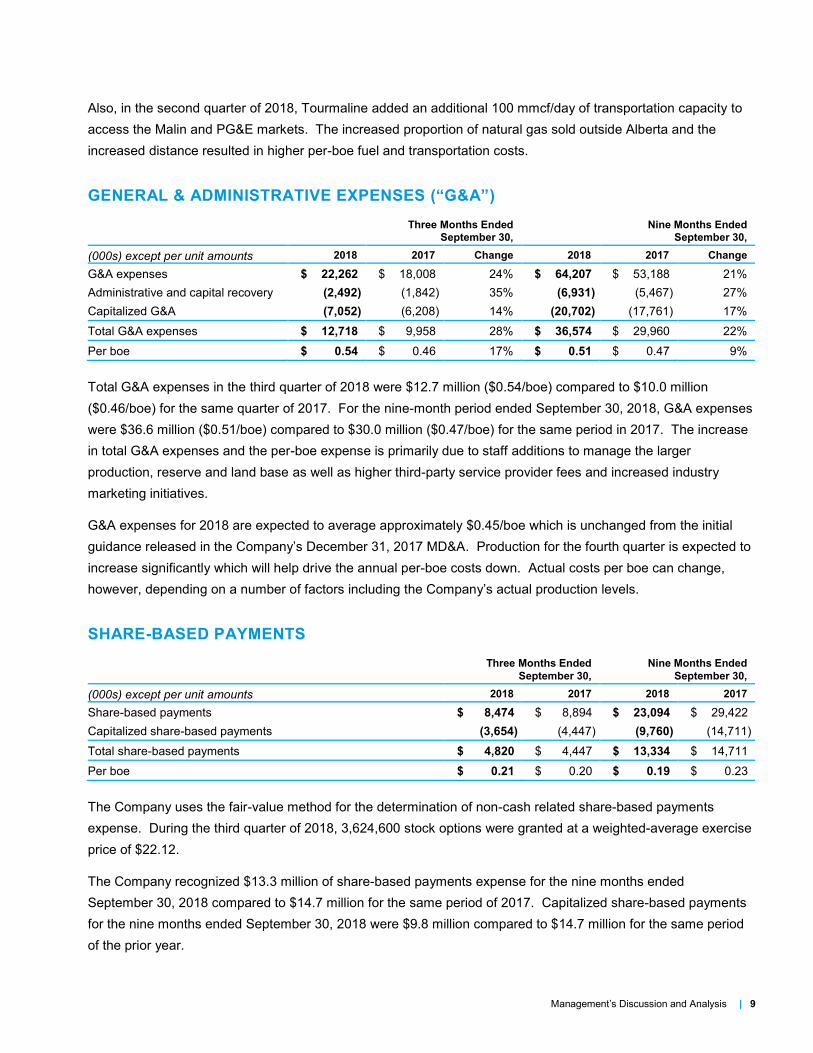
GENERAL & ADMINISTRATIVE EXPENSES (“G&A”)
Three Months Ended
September 30,
Nine Months Ended
September 30,
(000s) except per unit amounts 2018 2017 Change 2018 2017 Change
G&A expenses $ 22,262 $ 18,008 24% $ 64,207 $ 53,188 21%
Administrative and capital recovery (2,492) (1,842) 35% (6,931) (5,467) 27%
Capitalized G&A (7,052) (6,208) 14% (20,702) (17,761) 17%
Total G&A expenses $ 12,718 $ 9,958 28% $ 36,574 $ 29,960 22%
Per boe $ 0.54 $ 0.46 17% $ 0.51 $ 0.47 9%
Total G&A expenses in the third quarter of 2018 were $12.7 million ($0.54/boe) compared to $10.0 million
($0.46/boe) for the same quarter of 2017. For the nine-month period ended September 30, 2018, G&A expenses
were $36.6 million ($0.51/boe) compared to $30.0 million ($0.47/boe) for the same period in 2017. The increase
in total G&A expenses and the per-boe expense is primarily due to staff additions to manage the larger
production, reserve and land base as well as higher third-party service provider fees and increased industry
marketing initiatives.
G&A expenses for 2018 are expected to average approximately $0.45/boe which is unchanged from the initial
guidance released in the Company’s December 31, 2017 MD&A. Production for the fourth quarter is expected to
increase significantly which will help drive the annual per-boe costs down. Actual costs per boe can change,
however, depending on a number of factors including the Company’s actual production levels.
SHARE-BASED PAYMENTS
Three Months Ended
September 30,
Nine Months Ended
September 30,
(000s) except per unit amounts 2018 2017 2018 2017
Share-based payments $ 8,474 $ 8,894 $ 23,094 $ 29,422
Capitalized share-based payments (3,654) (4,447) (9,760) (14,711)
Total share-based payments $ 4,820 $ 4,447 $ 13,334 $ 14,711
Per boe $ 0.21 $ 0.20 $ 0.19 $ 0.23
The Company uses the fair-value method for the determination of non-cash related share-based payments
expense. During the third quarter of 2018, 3,624,600 stock options were granted at a weighted-average exercise
price of $22.12.
The Company recognized $13.3 million of share-based payments expense for the nine months ended
September 30, 2018 compared to $14.7 million for the same period of 2017. Capitalized share-based payments
for the nine months ended September 30, 2018 were $9.8 million compared to $14.7 million for the same period
of the prior year.
Management’s Discussion and Analysis | 10
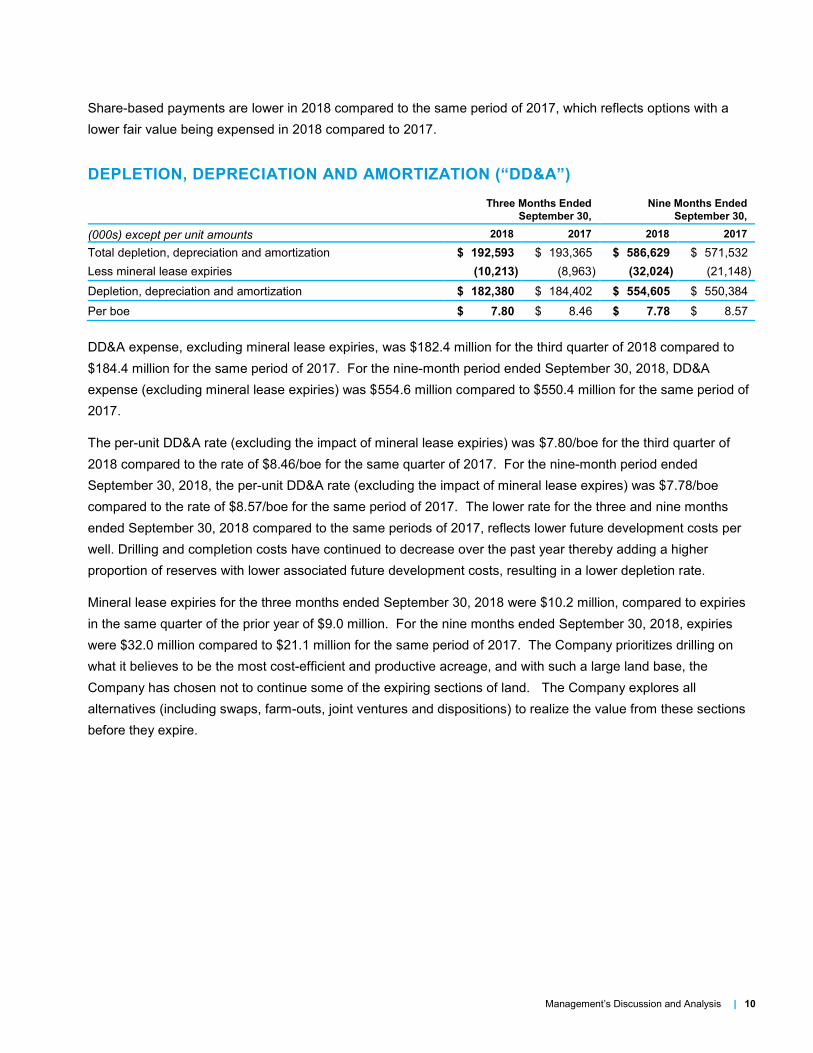
Share-based payments are lower in 2018 compared to the same period of 2017, which reflects options with a
lower fair value being expensed in 2018 compared to 2017.
DEPLETION, DEPRECIATION AND AMORTIZATION (“DD&A”)
Three Months Ended
September 30,
Nine Months Ended
September 30,
(000s) except per unit amounts 2018 2017 2018 2017
Total depletion, depreciation and amortization $ 192,593 $ 193,365 $ 586,629 $ 571,532
Less mineral lease expiries (10,213) (8,963) (32,024) (21,148)
Depletion, depreciation and amortization $ 182,380 $ 184,402 $ 554,605 $ 550,384
Per boe $ 7.80 $ 8.46 $ 7.78 $ 8.57
DD&A expense, excluding mineral lease expiries, was $182.4 million for the third quarter of 2018 compared to
$184.4 million for the same period of 2017. For the nine-month period ended September 30, 2018, DD&A
expense (excluding mineral lease expiries) was $554.6 million compared to $550.4 million for the same period of
2017.
The per-unit DD&A rate (excluding the impact of mineral lease expiries) was $7.80/boe for the third quarter of
2018 compared to the rate of $8.46/boe for the same quarter of 2017. For the nine-month period ended
September 30, 2018, the per-unit DD&A rate (excluding the impact of mineral lease expires) was $7.78/boe
compared to the rate of $8.57/boe for the same period of 2017. The lower rate for the three and nine months
ended September 30, 2018 compared to the same periods of 2017, reflects lower future development costs per
well. Drilling and completion costs have continued to decrease over the past year thereby adding a higher
proportion of reserves with lower associated future development costs, resulting in a lower depletion rate.
Mineral lease expiries for the three months ended September 30, 2018 were $10.2 million, compared to expiries
in the same quarter of the prior year of $9.0 million. For the nine months ended September 30, 2018, expiries
were $32.0 million compared to $21.1 million for the same period of 2017. The Company prioritizes drilling on
what it believes to be the most cost-efficient and productive acreage, and with such a large land base, the
Company has chosen not to continue some of the expiring sections of land. The Company explores all
alternatives (including swaps, farm-outs, joint ventures and dispositions) to realize the value from these sections
before they expire.
Management’s Discussion and Analysis | 11
FINANCE EXPENSES
Three Months Ended
September 30,
Nine Months Ended
September 30,
(000s) 2018 2017 Change 2018 2017 Change
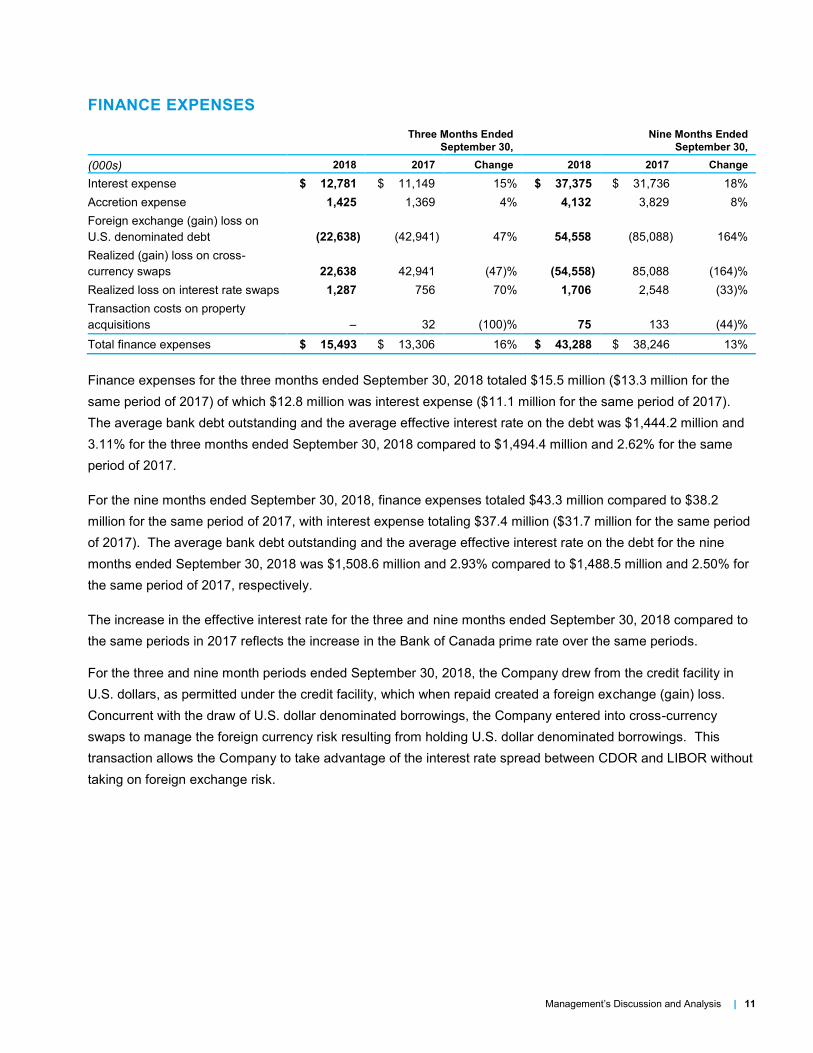
Interest expense $ 12,781 $ 11,149 15% $ 37,375 $ 31,736 18%
Accretion expense 1,425 1,369 4% 4,132 3,829 8%
Foreign exchange (gain) loss on
U.S. denominated debt (22,638) (42,941) 47% 54,558 (85,088) 164%
Realized (gain) loss on cross-
currency swaps 22,638 42,941 (47)% (54,558) 85,088 (164)%
Realized loss on interest rate swaps 1,287 756 70% 1,706 2,548 (33)%
Transaction costs on property
acquisitions 32 (100)% 75 133 (44)%
Total finance expenses $ 15,493 $ 13,306 16% $ 43,288 $ 38,246 13%
Finance expenses for the three months ended September 30, 2018 totaled $15.5 million ($13.3 million for the
same period of 2017) of which $12.8 million was interest expense ($11.1 million for the same period of 2017).
The average bank debt outstanding and the average effective interest rate on the debt was $1,444.2 million and
3.11% for the three months ended September 30, 2018 compared to $1,494.4 million and 2.62% for the same
period of 2017.
For the nine months ended September 30, 2018, finance expenses totaled $43.3 million compared to $38.2
million for the same period of 2017, with interest expense totaling $37.4 million ($31.7 million for the same period
of 2017). The average bank debt outstanding and the average effective interest rate on the debt for the nine
months ended September 30, 2018 was $1,508.6 million and 2.93% compared to $1,488.5 million and 2.50% for
the same period of 2017, respectively.
The increase in the effective interest rate for the three and nine months ended September 30, 2018 compared to
the same periods in 2017 reflects the increase in the Bank of Canada prime rate over the same periods.
For the three and nine month periods ended September 30, 2018, the Company drew from the credit facility in
U.S. dollars, as permitted under the credit facility, which when repaid created a foreign exchange (gain) loss.
Concurrent with the draw of U.S. dollar denominated borrowings, the Company entered into cross-currency
swaps to manage the foreign currency risk resulting from holding U.S. dollar denominated borrowings. This
transaction allows the Company to take advantage of the interest rate spread between CDOR and LIBOR without
taking on foreign exchange risk.
Management’s Discussion and Analysis | 12
DEFERRED INCOME TAXES
For the three months ended September 30, 2018, the provision for deferred income tax expense was $26.2
million compared to deferred income tax expense of $23.1 million for the same period in 2017. The increase in
deferred income tax expense is primarily due to the increase in pre-tax income which was $81.8 million compared
to the pre-tax income of $73.6 million for the same period of 2017.
For the nine months ended September 30, 2018, the provision for deferred income tax expense was $90.6 million
compared to deferred income tax expense of $109.8 million for the same period in 2017. The decrease in
deferred income tax expense is primarily due to the decrease in pre-tax income which was $301.8 million in 2018
compared to the pre-tax income of $368.3 million for the same period of 2017.
CASH FLOW FROM OPERATING ACTIVITIES, CASH FLOW AND NET EARNINGS
Three Months Ended
September 30,
Nine Months Ended
September 30,
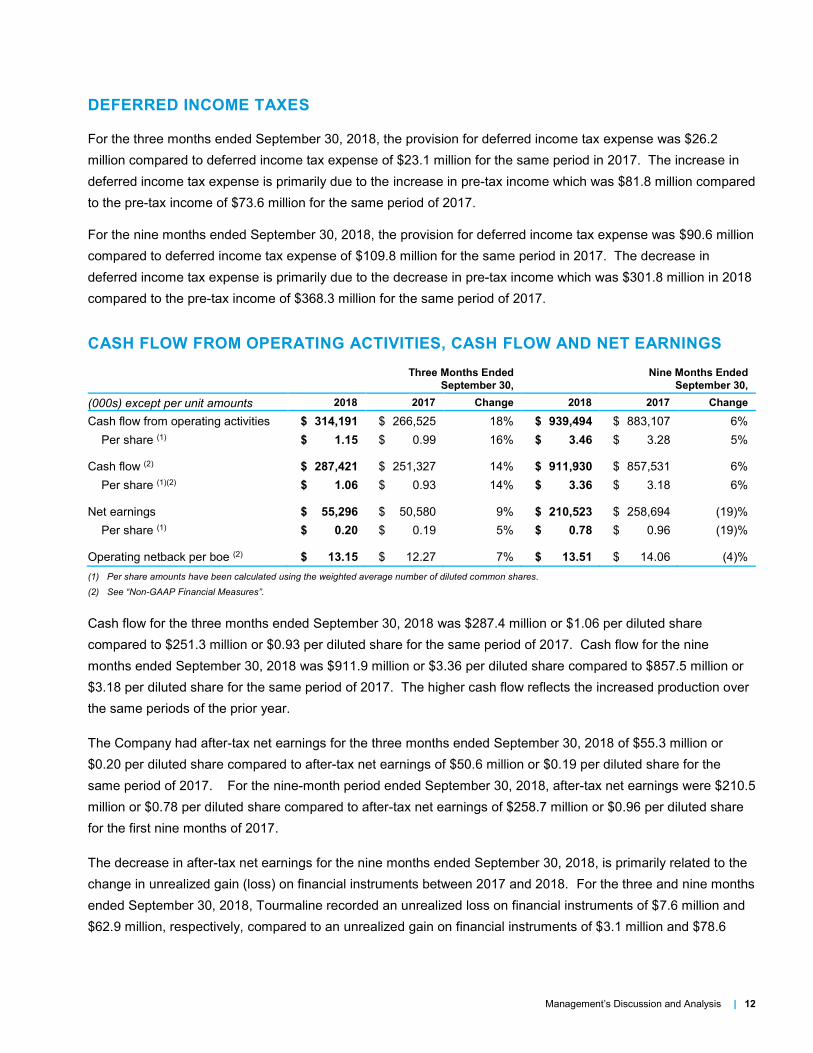
(000s) except per unit amounts 2018 2017 Change 2018 2017 Change
Cash flow from operating activities $ 314,191 $ 266,525 18% $ 939,494 $ 883,107 6%
Per share (1) $ 1.15 $ 0.99 16% $ 3.46 $ 3.28 5%
Cash flow (2) $ 287,421 $ 251,327 14% $ 911,930 $ 857,531 6%
Per share (1)(2) $ 1.06 $ 0.93 14% $ 3.36 $ 3.18 6%
Net earnings $ 55,296 $ 50,580 9% $ 210,523 $ 258,694 (19)%
Per share (1) $ 0.20 $ 0.19 5% $ 0.78 $ 0.96 (19)%
Operating netback per boe (2) $ 13.15 $ 12.27 7% $ 13.51 $ 14.06 (4)%
(1) Per share amounts have been calculated using the weighted average number of diluted common shares.
(2) See “Non-GAAP Financial Measures”.
Cash flow for the three months ended September 30, 2018 was $287.4 million or $1.06 per diluted share
compared to $251.3 million or $0.93 per diluted share for the same period of 2017. Cash flow for the nine
months ended September 30, 2018 was $911.9 million or $3.36 per diluted share compared to $857.5 million or
$3.18 per diluted share for the same period of 2017. The higher cash flow reflects the increased production over
the same periods of the prior year.
The Company had after-tax net earnings for the three months ended September 30, 2018 of $55.3 million or
$0.20 per diluted share compared to after-tax net earnings of $50.6 million or $0.19 per diluted share for the
same period of 2017. For the nine-month period ended September 30, 2018, after-tax net earnings were $210.5
million or $0.78 per diluted share compared to after-tax net earnings of $258.7 million or $0.96 per diluted share
for the first nine months of 2017.
The decrease in after-tax net earnings for the nine months ended September 30, 2018, is primarily related to the
change in unrealized gain (loss) on financial instruments between 2017 and 2018. For the three and nine months
ended September 30, 2018, Tourmaline recorded an unrealized loss on financial instruments of $7.6 million and
$62.9 million, respectively, compared to an unrealized gain on financial instruments of $3.1 million and $78.6
Management’s Discussion and Analysis | 13
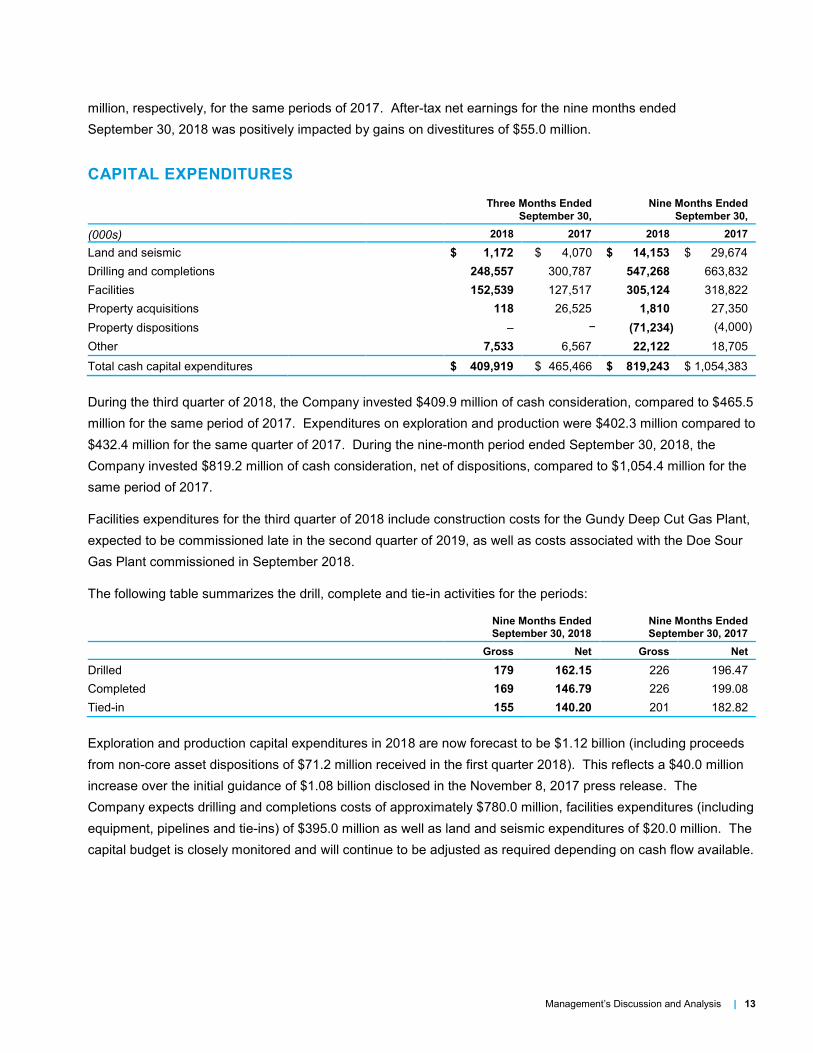
million, respectively, for the same periods of 2017. After-tax net earnings for the nine months ended
September 30, 2018 was positively impacted by gains on divestitures of $55.0 million.
CAPITAL EXPENDITURES
Three Months Ended
September 30,
Nine Months Ended
September 30,
(000s) 2018 2017 2018 2017
Land and seismic $ 1,172 $ 4,070 $ 14,153 $ 29,674
Drilling and completions 248,557 300,787 547,268 663,832
Facilities 152,539 127,517 305,124 318,822
Property acquisitions 118 26,525 1,810 27,350
Property dispositions − (71,234) (4,000)
Other 7,533 6,567 22,122 18,705
Total cash capital expenditures $ 409,919 $ 465,466 $ 819,243 $ 1,054,383
During the third quarter of 2018, the Company invested $409.9 million of cash consideration, compared to $465.5
million for the same period of 2017. Expenditures on exploration and production were $402.3 million compared to
$432.4 million for the same quarter of 2017. During the nine-month period ended September 30, 2018, the
Company invested $819.2 million of cash consideration, net of dispositions, compared to $1,054.4 million for the
same period of 2017.
Facilities expenditures for the third quarter of 2018 include construction costs for the Gundy Deep Cut Gas Plant,
expected to be commissioned late in the second quarter of 2019, as well as costs associated with the Doe Sour
Gas Plant commissioned in September 2018.
The following table summarizes the drill, complete and tie-in activities for the periods:
Nine Months Ended
September 30, 2018
Nine Months Ended
September 30, 2017
Gross Net Gross Net
Drilled 179 162.15 226 196.47
Completed 169 146.79 226 199.08
Tied-in 155 140.20 201 182.82
Exploration and production capital expenditures in 2018 are now forecast to be $1.12 billion (including proceeds
from non-core asset dispositions of $71.2 million received in the first quarter 2018). This reflects a $40.0 million
increase over the initial guidance of $1.08 billion disclosed in the November 8, 2017 press release. The
Company expects drilling and completions costs of approximately $780.0 million, facilities expenditures (including
equipment, pipelines and tie-ins) of $395.0 million as well as land and seismic expenditures of $20.0 million. The
capital budget is closely monitored and will continue to be adjusted as required depending on cash flow available.
Management’s Discussion and Analysis | 14
Acquisitions and Dispositions
2018
On February 28, 2018, the Company completed the sale of a number of undeveloped assets across all three
cash-generating units (“CGUs”) for proceeds of approximately $71.2 million, before customary closing
adjustments.
2017
On July 20, 2017, the Company completed an asset swap in NEBC allowing for the consolidation in the Sundown
complex. The Company exchanged predominantly Exploration and Evaluation (“E&E”) assets and cash
consideration of $19.0 million for producing properties, land and reserves.
LIQUIDITY AND CAPITAL RESOURCES
On May 15, 2018, the Company issued 1,000,000 flow-through common shares at a price of $30.00 per share,
for total consideration of $30.0 million. The proceeds were used to temporarily reduce bank debt and then to
fund the Company’s 2018 exploration program.
The Company has a covenant-based, unsecured, five-year extendible revolving credit facility in place with a
syndicate of banks, in the amount of $1,800.0 million. In May 2018, the Company extended the maturity date of
the revolving credit facility to June 2023. In addition, the financial covenants were amended to a maximum ratio
of total debt to total capitalization of 0.6 times and a minimum ratio of adjusted EBITDA to interest expense of 3.0
times, respectively. With the exception of the change in maturity date and the changes to the financial covenants
the revolving credit facility was renewed under the same terms and conditions as those described in note 9 of the
Company’s consolidated financial statements for the year ended December 31, 2017. The maturity date may, at
the request of the Company and with consent of the lenders, be extended on an annual basis. The revolving
credit facility includes an expansion feature (“accordion”) which allows the Company, upon approval from the
lenders, to increase the revolving credit facility amount by up to $500.0 million by adding a new financial
institution or by increasing the commitment of its existing lenders. The revolving credit facility can be drawn in
either Canadian or U.S. funds and bears interest at the bank’s prime lending rate, banker’s acceptance rates or
LIBOR (for U.S. borrowings), plus applicable margins.
The Company also has a $950.0 million term loan with a syndicate of banks. In May 2018, the Company
extended the maturity date of the term loan resulting in an initial maturity date of June 2023. The covenants for
the term loan were also amended and are the same as those under the Company’s revolving credit facility. The
term loan ranks equally with the obligation under the Company’s revolving credit facility. With the exception of
the change in maturity date and financial covenants the term loan was renewed under the same terms and
conditions as those described in note 9 of the Company’s consolidated financial statements for the year ended
December 31, 2017. The term loan can be drawn in either Canadian or U.S. funds and bears interest at the
bank’s prime lending rate, banker’s acceptance rates or LIBOR (for U.S. borrowings), plus 157.5 basis points.
Management’s Discussion and Analysis | 15
The maturity date may, at the request of the Company and with consent of the lenders, be extended on an annual
basis.
The Company has a covenant based, unsecured, operating credit facility with a Canadian bank in the amount of
$50.0 million. The operating credit facility has a maturity date of June 2019, which may, at the request of the
Company and with consent of the lender, be extended on an annual basis. The covenants are the same as the
revolving credit facility. In May 2018, this operating credit facility replaced the revolving operating credit facility
that was outstanding at December 31, 2017.
Additionally, the Company has a letter of credit facility payable on demand in the amount of $50.0 million with a
Canadian bank. Tourmaline has outstanding letters of credit of $9.1 million (December 31, 2017 - $17.6 million),
which reduces the credit available on this facility.
The Company’s aggregate borrowing capacity is $2.85 billion at September 30, 2018. As at, and for the quarter
ended September 30, 2018, the Company is in compliance with all debt covenants.
As at September 30, 2018, the Company had negative working capital of $342.0 million, after adjusting for the fair
value of financial instruments (the unadjusted working capital deficiency was $411.7 million) (December 31, 2017
– $202.5 million and $219.2 million, respectively). As at September 30, 2018, the Company had $947.7 million in
long-term debt outstanding and $399.2 million drawn against the revolving credit facility for total bank debt of
$1,346.9 million (net of prepaid interest and debt issue costs) (December 31, 2017 - $1,534.8 million). Net debt
at September 30, 2018 was $1,688.9 million excluding the fair value of financial instruments (December 31, 2017
- $1,737.2 million).
The 2018 exploration and development program continues to be diligently monitored and adjusted as necessary
depending on commodity prices. As at September 30, 2018, the Company has $1,494.0 million in unutilized
borrowing capacity. Management is dedicated to keeping a strong balance sheet, which has proven to be very
important, especially in the current commodity price environment.
On September 28, 2018, the Company paid a cash dividend of $27.1 million.
SHARES AND STOCK OPTIONS OUTSTANDING
As at November 7, 2018, the Company has 272,042,659 common shares and 22,515,801 stock options
outstanding.
Management’s Discussion and Analysis | 16
COMMITMENTS AND CONTRACTUAL OBLIGATIONS
In the normal course of business, the Company is obligated to make future payments. These obligations
represent contracts and other commitments that are known and non-cancellable.
PAYMENTS DUE BY YEAR
(000s) 1 Year 2-3 Years 4-5 Years >5 Years Total
Operating leases $ 5,229 $ 7,134 $ 5,989 $ 10,480 $ 28,832
Firm transportation and processing agreements 366,187 769,076 657,166 1,825,229 3,617,658
Capital commitments (1) 311,625 442,877 8,772 74,792 838,066
Flow-through share commitments 19,037 19,037
Credit facility (2) 468,083 468,083
Term debt (3) 32,269 64,537 1,003,754 1,100,560
$ 734,347 $ 1,283,624 $ 2,143,764 $ 1,910,501 $ 6,072,236
(1) Includes drilling commitments, power commitments, and capital spending commitments under the joint arrangement in the Spirit River complex of $300.0 million
per year until 2020. The capital spending commitment can be deferred to future periods in the event of an economic downturn, and as agreed upon by both
parties.
(2) Includes interest expense at an annual rate of 3.30% being the rate applicable to outstanding debt on the credit facility at September 30, 2018.
(3) Includes interest expense at an annual rate of 3.40% being the fixed rate on the term debt at September 30, 2018.
OFF BALANCE SHEET ARRANGEMENTS
The Company has certain lease arrangements, all of which are reflected in the commitments and contractual
obligations table above, which were entered into in the normal course of operations. All leases have been treated
as operating leases whereby the lease payments are included in operating expenses or general and
administrative expenses depending on the nature of the lease.
FINANCIAL RISK MANAGEMENT
The Board of Directors has overall responsibility for the establishment and oversight of the Company’s risk
management framework. The Board has implemented and monitors compliance with risk management policies.
The Company’s risk management policies are established to identify and analyze the risks faced by the
Company, to set appropriate risk limits and controls, and to monitor risks and adherence to market conditions and
the Company’s activities. The Company’s financial risks are discussed in note 5 of the Company’s audited
consolidated financial statements for the year ended December 31, 2017.
As at September 30, 2018, the Company has entered into certain financial derivative contracts in order to
manage commodity price and interest rate risk. These instruments are not used for trading or speculative
purposes. The Company has not designated its financial derivative contracts as effective accounting hedges,
even though the Company considers all commodity contracts to be effective economic hedges. Such financial
derivative contracts are recorded on the consolidated statement of financial position at fair value, with changes in
the fair value being recognized as an unrealized gain (loss) on the consolidated statement of income and
comprehensive income. The contracts that the Company has in place at September 30, 2018 are summarized
and disclosed in note 3 of the Company’s unaudited interim condensed consolidated financial statements for the
three and nine months ended September 30, 2018 and 2017.
Management’s Discussion and Analysis | 17
The Company has entered into physical delivery sales contracts to manage commodity risk. These contracts are
considered normal sales contracts and are not recorded at fair value in the consolidated financial statements.
Physical contracts in place at September 30, 2018 have been summarized and disclosed in note 3 of the
Company’s unaudited interim condensed consolidated financial statements for the three and nine months ended
September 30, 2018 and 2017.
APPLICATION OF CRITICAL ACCOUNTING ESTIMATES
Certain accounting policies require that management make appropriate decisions with respect to the formulation
of estimates and assumptions that affect the reported amounts of assets, liabilities, revenues and expenses.
Management reviews its estimates on a regular basis. The emergence of new information and changed
circumstances may result in actual results or changes to estimates that differ materially from current estimates.
The Company’s use of estimates and judgments in preparing the interim condensed consolidated financial
statements is discussed in note 1 of the consolidated financial statements for the year ended December 31,
2017.
DISCLOSURE CONTROLS AND PROCEDURES AND INTERNAL CONTROLS OVER
FINANCIAL REPORTING
The Company's Chief Executive Officer and Chief Financial Officer have designed, or caused to be designed
under their supervision, disclosure controls and procedures ("DC&P"), as defined by National Instrument 52-109.
The Company’s Chief Executive Officer and Chief Financial Officer have designed, or caused to be designed
under their supervision, internal controls over financial reporting ("ICFR"), as defined by National Instrument 52-
109, to provide reasonable assurance regarding the reliability of the Company’s financial reporting and the
preparation of financial statements for external purposes in accordance with IFRS.
There were no changes in the Company's DC&P or ICFR during the period beginning on July 1, 2018 and ending
on September 30, 2018 that have materially affected, or are reasonably likely to materially affect, the Company's
ICFR. It should be noted that a control system, including the Company's disclosure and internal controls and
procedures, no matter how well conceived can provide only reasonable, but not absolute assurance that the
objectives of the control system will be met and it should not be expected that the disclosure and internal controls
and procedures will prevent all errors or fraud.
The Company uses the guidelines as set in the Committee of Sponsoring Organizations of the Treadway
Commission 2013 Internal Control-Integrated Framework.
BUSINESS RISKS AND UNCERTAINTIES
Tourmaline monitors and complies with current government regulations that affect its activities, although
operations may be adversely affected by changes in government policy, regulations or taxation. In addition,
Tourmaline maintains a level of liability, property and business interruption insurance which is believed to be
adequate for Tourmaline’s size and activities, but is unable to obtain insurance to cover all risks within the
business or in amounts to cover all possible claims.
Management’s Discussion and Analysis | 18
See "Forward-Looking Statements" in this MD&A and "Risk Factors" in Tourmaline's most recent annual
information form for additional information regarding the risks to which Tourmaline and its business and
operations are subject.
IMPACT OF ENVIRONMENTAL REGULATIONS
The oil and gas industry is currently subject to regulation pursuant to a variety of provincial and federal
environmental legislation, all of which is subject to governmental review and revision from time to time. Such
legislation provides for, among other things, restrictions and prohibitions on the spill, release or emission of
various substances produced in association with certain oil and gas industry operations, such as sulphur dioxide
and nitrous oxide. In addition, such legislation sets out the requirements with respect to oilfield waste handling
and storage, habitat protection and the satisfactory operation, maintenance, abandonment and reclamation of
well and facility sites. Compliance with such legislation can require significant expenditures and a breach of such
requirements may result in suspension or revocation of necessary licenses and authorizations, civil liability and
the imposition of material fines and penalties.
The use of fracture stimulations has been ongoing safely in an environmentally responsible manner in western
Canada for decades. With the increase in the use of fracture stimulations in horizontal wells, there is increased
communication between the oil and natural gas industry and a wider variety of stakeholders regarding the
responsible use of this technology. This increased attention to fracture stimulations may result in increased
regulation or changes of law which may make the operation of the Company’s business more expensive or
prevent the Company from operating its business as currently conducted. Tourmaline focuses on conducting
transparent, safe and responsible operations.
CHANGES IN ACCOUNTING POLICIES
The following pronouncements as issued by the International Accounting Standards Board (“IASB”) have been
adopted by the Company effective January 1, 2018.
IFRS 9 – Financial Instruments replaces the existing guidance in IAS 39 Financial Instruments:
Recognition and Measurement. The new standard includes revised guidance on the classification and
measurement of financial instruments, including a new expected credit loss model for calculating impairment
on financial assets, and the new general hedge accounting requirements. It also carries forward the
guidance on recognition and derecognition of financial instruments from IAS 39.
The three principal classification categories under the new standard for financial instruments are: measured
at amortized cost, fair value through other comprehensive income (“FVOCI”) and fair value through profit and
loss (“FVTPL”). The classification of financial instruments under IFRS 9 is generally based on the business
model in which a financial instrument is managed and its contractual cash flow characteristics. The previous
categories under IAS 39 of held to maturity, loans and receivables and available for sale have been
removed.
Management’s Discussion and Analysis | 19
IFRS 9 replaces the “incurred loss” model in IAS 39 with an “expected loss” model. The new impairment
model applies to financial instruments measured at amortized cost, and contract assets and debt
investments measured at FVOCI. Under IFRS 9, credit losses will be recognized earlier than under IAS 39.
Cash and cash equivalents, accounts receivable, accounts payable and accrued liabilities, and bank debt
continue to be measured at amortized cost and are now classified as “amortized cost”. There were no
changes to the Company’s classifications of its financial instrument assets and liabilities as FVTPL. None of
the Company’s financial instruments have been classified as FVOCI.
The Company did not formerly apply hedge accounting to its financial instruments and has not elected to
apply hedge accounting to any of its financial instruments upon adoption of IFRS 9. There was no impact to
the Company as a result of adopting the new standard.
IFRS 15 – Revenue from Contracts with Customers establishes a comprehensive framework for
determining whether, how much and when revenue is recognized. It replaces existing revenue recognition
guidance, including IAS 18 Revenue, IAS 11 Construction Contracts and IFRIC 13 Customer Loyalty
Programmes. The Company has adopted IFRS 15 using the modified retrospective approach on January 1,
2018. Based on the Company’s review of contracts with customers and its assessment of various revenue
streams using the IFRS 15 five step model, there were no material changes to net income, the timing of
revenue recognized, income statement line classification or to opening retained earnings as at January 1,
2018. Tourmaline has expanded disclosures in the notes to its interim condensed consolidated financial
statements as prescribed by IFRS 15, including disclosing the Company’s disaggregated revenue streams
by product type. As a result of adopting IFRS 15 the Company’s revenue recognition policy is now:
Revenue Recognition:
Revenue from the sale of crude oil, natural gas and natural gas liquids is recorded when control of the
product is transferred to the buyer based on the consideration specified in the contracts with customers.
This usually occurs when the product is physically transferred at the delivery point agreed upon in the
contract and legal title to the product passes to the customer. The Company evaluates its arrangements with
third parties and partners to determine if the Company acts as the principal or as an agent. In making this
evaluation, the Company considers if it obtains control of the product delivered or services provided, which is
indicated by the Company having the primary responsibility for the delivery of the product or rendering of the
service, having the ability to establish prices or having inventory risk. If the Company acts in the capacity of
an agent rather than as a principal in a transaction, then the revenue is recognized on a net-basis, only
reflecting the fee, if any, realized by the Company from the transaction.
Management’s Discussion and Analysis | 20
STANDARDS ISSUED BUT NOT YET ADOPTED
The following pronouncement from the IASB will become effective for financial reporting periods beginning
January 1, 2019 and have not yet been adopted by the Company. This new standard permits early adoption with
transitional arrangements depending upon the date of initial application.
IFRS 16 – Leases sets out the principles for the recognition, measurement, presentation and disclosure of
leases for both parties to a contract, i.e. the customer (“lessee”) and the supplier (“lessor”) and replaces the
previous leases standard, IAS 17-Leases and IFRIC 4-Determining whether an Arrangement contains a
Lease. IFRS 16 is effective for annual reporting periods beginning on or after January 1, 2019. The
standard is required to be adopted either retrospectively or using a modified retrospective approach. The
Company will adopt IFRS 16 using the modified retrospective approach. The Company has completed an
initial assessment of the potential impact on its consolidated financial statements but has not yet completed
its detailed assessment. The actual impact of applying IFRS 16 on the financial statements in the period of
initial application will depend on multiple factors and conditions, including but not limited to, the Company’s
borrowing rate at January 1, 2019, the composition of the Company’s lease portfolio at that date, the
Company’s latest assessment of whether it will exercise any lease renewal options, and the extent to which
the Company chooses to use practical expedients and recognition exemptions.
Thus far, the most significant impact identified is that the Company will now recognize new assets and
liabilities on its consolidated statement of financial position for its office leases. In addition, the nature of the
expenses related to those leases will change. Straight-line operating lease expense will be replaced with a
depreciation charge for right-of-use assets and interest expense on lease liabilities.
The Company continues to review all existing contracts in detail. The full extent of the impact has not yet
been determined. For the remainder of the year, the Company will also be focused on developing and
implementing changes to policies, internal controls, information systems and business and accounting
processes.
NON-GAAP FINANCIAL MEASURES
This MD&A or documents referred to in this MD&A make reference to the terms “cash flow”, “operating netback”,
“working capital (adjusted for the fair value of financial instruments)”, “net debt”, “adjusted EBITDA”, “total debt”,
and “total capitalization” which are not recognized measures under GAAP, and do not have a standardized
meaning prescribed by GAAP. Accordingly, the Company’s use of these terms may not be comparable to
similarly defined measures presented by other companies. Management uses the terms “cash flow”, “operating
netback”, “working capital (adjusted for the fair value of financial instruments)” and “net debt”, for its own
performance measures and to provide shareholders and potential investors with a measurement of the
Company’s efficiency and its ability to generate the cash necessary to fund a portion of its future growth
expenditures or to repay debt. Investors are cautioned that the non-GAAP measures should not be construed as
an alternative to net income determined in accordance with GAAP as an indication of the Company’s
performance. The terms “adjusted EBITDA”, “total debt”, and “total capitalization” are not used by management
in measuring performance but are used in the financial covenants under the Company’s credit facility. Under the
Management’s Discussion and Analysis | 21
Company’s credit facility “adjusted EBITDA” means generally net income or loss, excluding extraordinary items,
plus interest expense and income taxes and adjusted for non-cash items and gains or losses on dispositions,
“total debt” means generally the sum of debt plus subordinated debt (Tourmaline currently does not have any
subordinated debt), and “total capitalization” means generally the sum of the Company’s shareholders’ equity and
all other indebtedness of the Company including bank debt, all determined on a consolidated basis in accordance
with GAAP.
Cash Flow
A summary of the reconciliation of cash flow from operating activities (per the statements of cash flow), to cash
flow, is set forth below:
Three Months Ended,
September 30,
Nine Months Ended
September 30,
(000s) 2018 2017 2018 2017
Cash flow from operating activities (per GAAP) $ 314,191 $ 266,525 $ 939,494 $ 883,107
Change in non-cash working capital (26,770) (15,198) (27,564) (25,576)
Cash flow $ 287,421 $ 251,327 $ 911,930 $ 857,531
Operating Netback
Operating netback is calculated on a per-boe basis and is defined as oil and natural gas sales plus realized gain
(loss) on risk management activities less royalties, transportation costs and operating expenses, as shown below:
Three Months Ended,
September 30,
Nine Months Ended
September 30,
($/boe) 2018 2017 2018 2017
Oil and natural gas sales $ 17.41 $ 13.93 $ 18.23 $ 18.93
Realized gain on risk management activities 3.83 4.91 2.96 2.19
Royalties (0.94) (0.56) (0.87) (0.93)
Transportation costs (3.71) (3.01) (3.48) (2.90)
Operating expenses (3.44) (3.00) (3.33) (3.24)
Operating netback $ 13.15 $ 12.27 $ 13.51 $ 14.06
The Company discloses operating netback after the effect of realized gains or losses on risk management
activities. These gains or losses represent the portion of risk management activities that have settled in cash
during the period and disclosing this impact provides management and investors with transparent measures that
reflect how the Company’s risk management program has impacted its netback.
Management’s Discussion and Analysis | 22
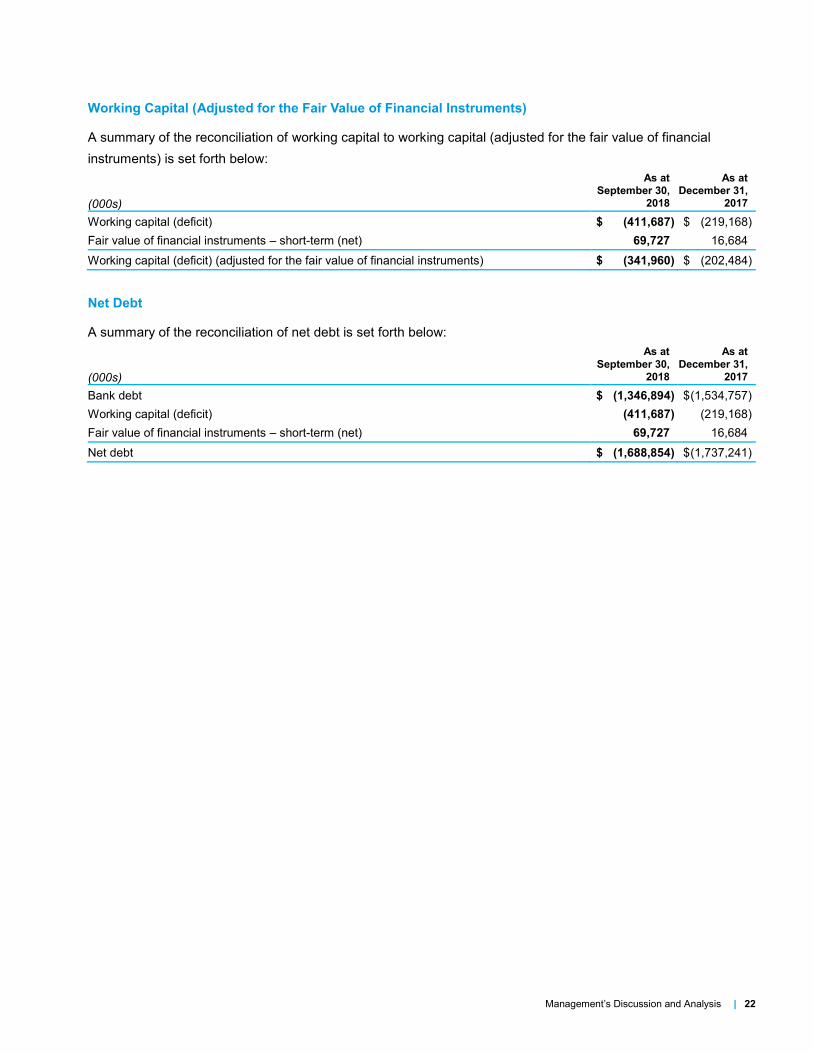
Working Capital (Adjusted for the Fair Value of Financial Instruments)
A summary of the reconciliation of working capital to working capital (adjusted for the fair value of financial
instruments) is set forth below:
(000s)
As at
September 30,
2018
As at
December 31,
2017
Working capital (deficit) $ (411,687) $ (219,168)
Fair value of financial instruments – short-term (net) 69,727 16,684
Working capital (deficit) (adjusted for the fair value of financial instruments) $ (341,960) $ (202,484)
Net Debt
A summary of the reconciliation of net debt is set forth below:
(000s)
As at
September 30,
2018
As at
December 31,
2017
Bank debt $ (1,346,894) $ (1,534,757)
Working capital (deficit) (411,687) (219,168)
Fair value of financial instruments – short-term (net) 69,727 16,684
Net debt $ (1,688,854) $ (1,737,241)
Management’s Discussion and Analysis | 23
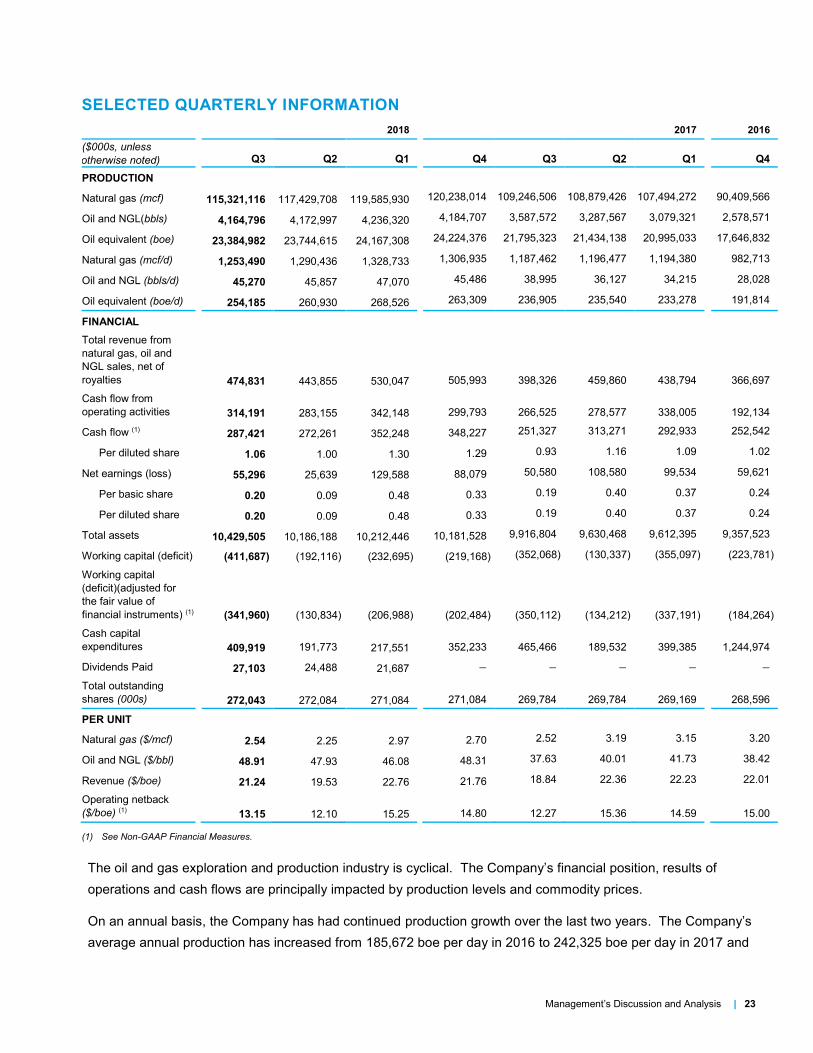
SELECTED QUARTERLY INFORMATION
2018 2017 2016
($000s, unless
otherwise noted)
Q3 Q2 Q1 Q4 Q3 Q2 Q1 Q4
PRODUCTION
Natural gas (mcf) 115,321,116 117,429,708 119,585,930 120,238,014 109,246,506 108,879,426 107,494,272 90,409,566
Oil and NGL(bbls) 4,164,796 4,172,997 4,236,320 4,184,707 3,587,572 3,287,567 3,079,321 2,578,571
Oil equivalent (boe) 23,384,982 23,744,615 24,167,308 24,224,376 21,795,323 21,434,138 20,995,033 17,646,832
Natural gas (mcf/d) 1,253,490 1,290,436 1,328,733 1,306,935 1,187,462 1,196,477 1,194,380 982,713
Oil and NGL (bbls/d) 45,270 45,857 47,070 45,486 38,995 36,127 34,215 28,028
Oil equivalent (boe/d) 254,185 260,930 268,526 263,309 236,905 235,540 233,278 191,814
FINANCIAL
Total revenue from
natural gas, oil and
NGL sales, net of
royalties
474,831 443,855 530,047
505,993 398,326 459,860 438,794
366,697
Cash flow from
operating activities
314,191 283,155 342,148
299,793 266,525 278,577 338,005
192,134
Cash flow (1) 287,421 272,261 352,248 348,227 251,327 313,271 292,933 252,542
Per diluted share 1.06 1.00 1.30 1.29 0.93 1.16 1.09 1.02
Net earnings (loss) 55,296 25,639 129,588 88,079 50,580 108,580 99,534 59,621
Per basic share 0.20 0.09 0.48 0.33 0.19 0.40 0.37 0.24
Per diluted share 0.20 0.09 0.48 0.33 0.19 0.40 0.37 0.24
Total assets 10,429,505 10,186,188 10,212,446 10,181,528 9,916,804 9,630,468 9,612,395 9,357,523
Working capital (deficit) (411,687) (192,116) (232,695) (219,168) (352,068) (130,337) (355,097) (223,781)
Working capital
(deficit)(adjusted for
the fair value of
financial instruments) (1)
(341,960) (130,834) (206,988)
(202,484) (350,112) (134,212) (337,191)
(184,264)
Cash capital
expenditures
409,919 191,773 217,551
352,233 465,466 189,532 399,385
1,244,974
Dividends Paid 27,103 24,488 21,687
Total outstanding
shares (000s)
272,043 272,084 271,084
271,084 269,784 269,784 269,169
268,596
PER UNIT
Natural gas ($/mcf) 2.54 2.25 2.97 2.70 2.52 3.19 3.15 3.20
Oil and NGL ($/bbl) 48.91 47.93 46.08 48.31 37.63 40.01 41.73 38.42
Revenue ($/boe) 21.24 19.53 22.76 21.76 18.84 22.36 22.23 22.01
Operating netback
($/boe) (1)
13.15 12.10 15.25
14.80 12.27 15.36 14.59
15.00
(1) See Non-GAAP Financial Measures.
The oil and gas exploration and production industry is cyclical. The Company’s financial position, results of
operations and cash flows are principally impacted by production levels and commodity prices.
On an annual basis, the Company has had continued production growth over the last two years. The Company’s
average annual production has increased from 185,672 boe per day in 2016 to 242,325 boe per day in 2017 and
Management’s Discussion and Analysis | 24
261,161 boe per day in the first nine months of 2018. The production growth can be attributed primarily to the
Company’s exploration and development activities, and from acquisitions of producing properties.
The Company’s cash flow was $731.8 million in 2016, $1,205.8 million in 2017 and forecast 2018 cash flow is
$1,319.0 million. The increase in forecast cash flow in 2018 reflects the increase in forecast annual average
production over 2017. Commodity price fluctuations can indirectly impact expected production by changing the
amount of funds available to reinvest in exploration, development and acquisition activities in the future.
Changes in commodity prices impact revenue and cash flow available for exploration, and also the economics of
potential capital projects as low commodity prices can potentially reduce the quantities of reserves that are
commercially recoverable. The Company’s capital program is dependent on cash flow generated from operations
and access to capital markets.
Interim Condensed Consolidated Financial Statements | 25
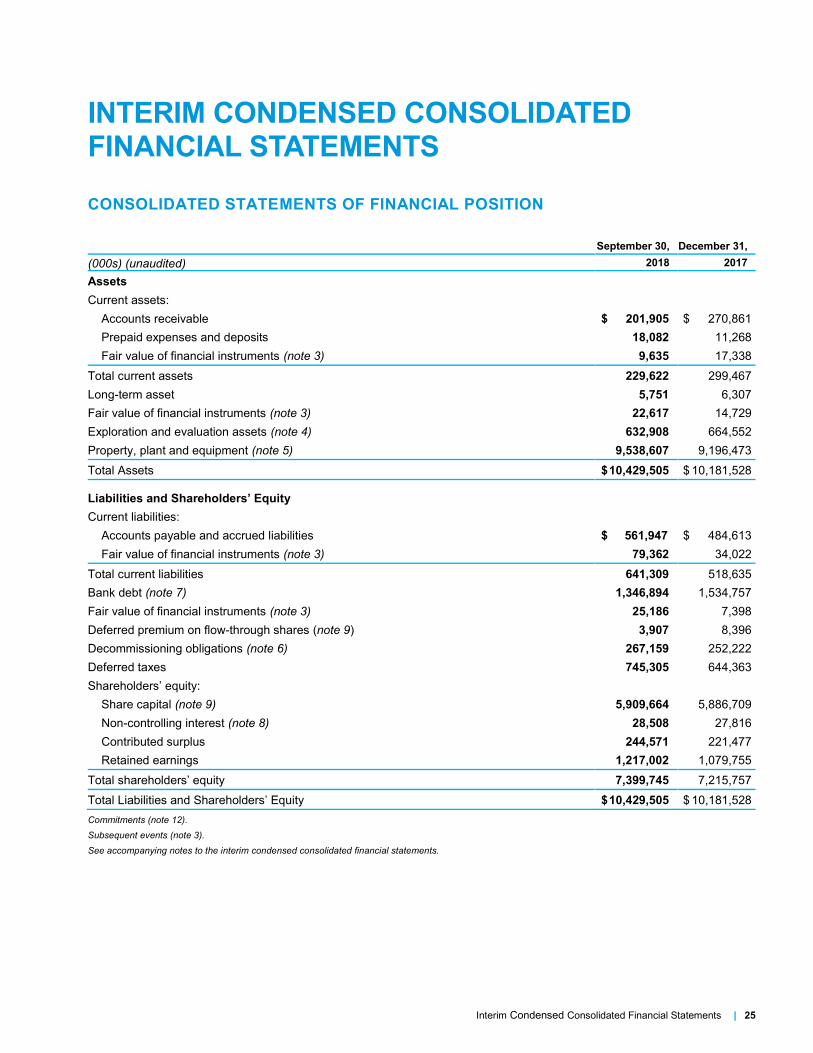
INTERIM CONDENSED CONSOLIDATED FINANCIAL STATEMENTS
CONSOLIDATED STATEMENTS OF FINANCIAL POSITION
September 30, December 31,
(000s) (unaudited) 2018 2017
Assets
Current assets:
Accounts receivable $ xx,201,905 $ xx,270,861
Prepaid expenses and deposits 18,082 11,268
Fair value of financial instruments (note 3) 9,635 17,338
Total current assets 229,622 299,467
Long-term asset 5,751 6,307
Fair value of financial instruments (note 3) 22,617 14,729
Exploration and evaluation assets (note 4) 632,908 664,552
Property, plant and equipment (note 5) 9,538,607 9,196,473
Total Assets $ 10,429,505 $ 10,181,528
Liabilities and Shareholders’ Equity
Current liabilities:
Accounts payable and accrued liabilities $xx,561,947 $ xx,484,613
Fair value of financial instruments (note 3) 79,362 34,022
Total current liabilities 641,309 518,635
Bank debt (note 7) 1,346,894 1,534,757
Fair value of financial instruments (note 3) 25,186 7,398
Deferred premium on flow-through shares (note 9) 3,907 8,396
Decommissioning obligations (note 6) 267,159 252,222
Deferred taxes 745,305 644,363
Shareholders’ equity:
Share capital (note 9) 5,909,664 5,886,709
Non-controlling interest (note 8) 28,508 27,816
Contributed surplus 244,571 221,477
Retained earnings 1,217,002 1,079,755
Total shareholders’ equity 7,399,745 7,215,757
Total Liabilities and Shareholders’ Equity $ 10,429,505 $ 10,181,528
Commitments (note 12).
Subsequent events (note 3).
See accompanying notes to the interim condensed consolidated financial statements.
Interim Condensed Consolidated Financial Statements | 26
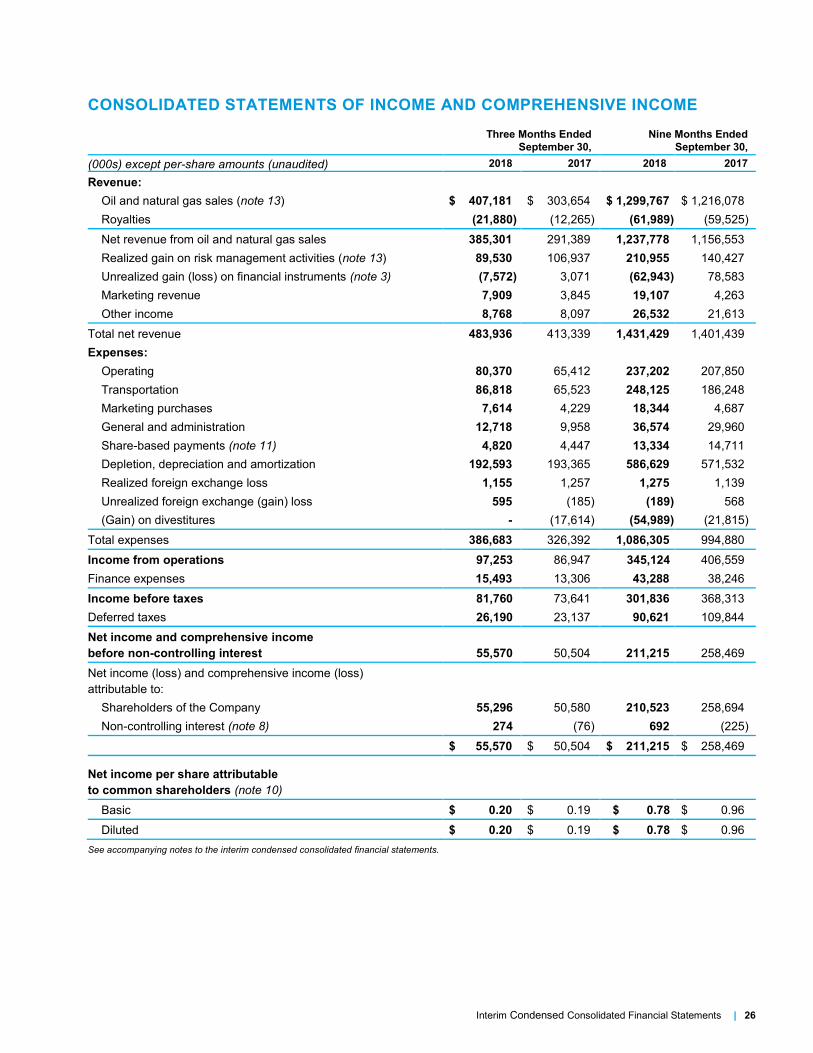
CONSOLIDATED STATEMENTS OF INCOME AND COMPREHENSIVE INCOME
Three Months Ended
September 30,
Nine Months Ended
September 30,
(000s) except per-share amounts (unaudited) 2018 2017 2018 2017
Revenue:
Oil and natural gas sales (note 13) $ 407,181 $ 303,654 $ 1,299,767 $ 1,216,078
Royalties (21,880) (12,265) (61,989) (59,525)
Net revenue from oil and natural gas sales 385,301 291,389 1,237,778 1,156,553
Realized gain on risk management activities (note 13) 89,530 106,937 210,955 140,427
Unrealized gain (loss) on financial instruments (note 3) (7,572) 3,071 (62,943) 78,583
Marketing revenue 7,909 3,845 19,107 4,263
Other income 8,768 8,097 26,532 21,613
Total net revenue 483,936 413,339 1,431,429 1,401,439
Expenses:
Operating 80,370 65,412 237,202 207,850
Transportation 86,818 65,523 248,125 186,248
Marketing purchases 7,614 4,229 18,344 4,687
General and administration 12,718 9,958 36,574 29,960
Share-based payments (note 11) 4,820 4,447 13,334 14,711
Depletion, depreciation and amortization 192,593 193,365 586,629 571,532
Realized foreign exchange loss 1,155 1,257 1,275 1,139
Unrealized foreign exchange (gain) loss 595 (185) (189) 568
(Gain) on divestitures - (17,614) (54,989) (21,815)
Total expenses 386,683 326,392 1,086,305 994,880
Income from operations 97,253 86,947 345,124 406,559
Finance expenses 15,493 13,306 43,288 38,246
Income before taxes 81,760 73,641 301,836 368,313
Deferred taxes 26,190 23,137 90,621 109,844
Net income and comprehensive income
before non-controlling interest 55,570 50,504 211,215 258,469
Net income (loss) and comprehensive income (loss)
attributable to:
Shareholders of the Company 55,296 50,580 210,523 258,694
Non-controlling interest (note 8) 274 (76) 692 (225)
$ 55,570 $ 50,504 $ 211,215 $ 258,469
Net income per share attributable
to common shareholders (note 10)
Basic $ 0.20 $ 0.19 $ 0.78 $ 0.96
Diluted $ 0.20 $ 0.19 $ 0.78 $ 0.96
See accompanying notes to the interim condensed consolidated financial statements.
Interim Condensed Consolidated Financial Statements | 27
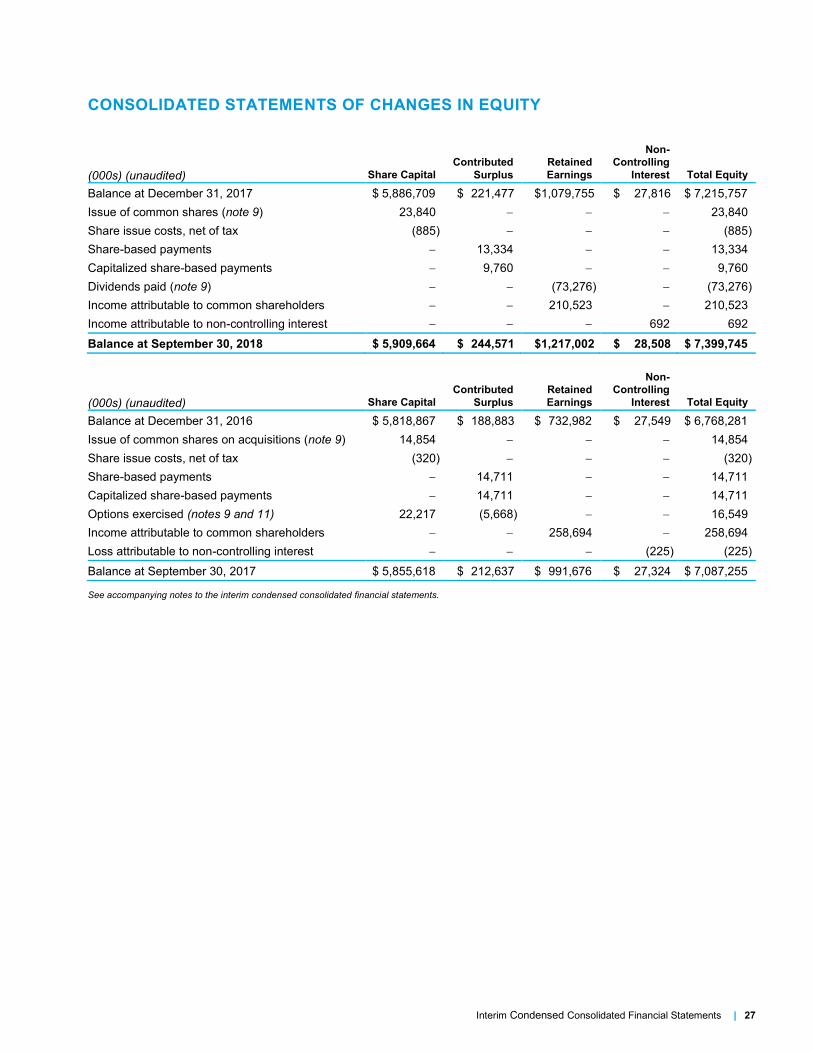
CONSOLIDATED STATEMENTS OF CHANGES IN EQUITY
(000s) (unaudited) Share Capital
Contributed
Surplus
Retained
Earnings
Non-
Controlling
Interest Total Equity
Balance at December 31, 2017 $ 5,886,709 $ 221,477 $1,079,755 $ 27,816 $ 7,215,757
Issue of common shares (note 9) 23,840 23,840
Share issue costs, net of tax (885) (885)
Share-based payments 13,334 13,334
Capitalized share-based payments 9,760 9,760
Dividends paid (note 9) (73,276) (73,276)
Income attributable to common shareholders 210,523 210,523
Income attributable to non-controlling interest 692 692
Balance at September 30, 2018 $ 5,909,664 $ 244,571 $1,217,002 $ 28,508 $ 7,399,745
(000s) (unaudited) Share Capital
Contributed
Surplus
Retained
Earnings
Non-
Controlling
Interest Total Equity
Balance at December 31, 2016 $ 5,818,867 $ 188,883 $ 732,982 $ 27,549 $ 6,768,281
Issue of common shares on acquisitions (note 9) 14,854 14,854
Share issue costs, net of tax (320) (320)
Share-based payments 14,711 14,711
Capitalized share-based payments 14,711 14,711
Options exercised (notes 9 and 11) 22,217 (5,668) 16,549
Income attributable to common shareholders 258,694 258,694
Loss attributable to non-controlling interest (225) (225)
Balance at September 30, 2017 $ 5,855,618 $ 212,637 $ 991,676 $ 27,324 $ 7,087,255
See accompanying notes to the interim condensed consolidated financial statements.
Interim Condensed Consolidated Financial Statements | 28
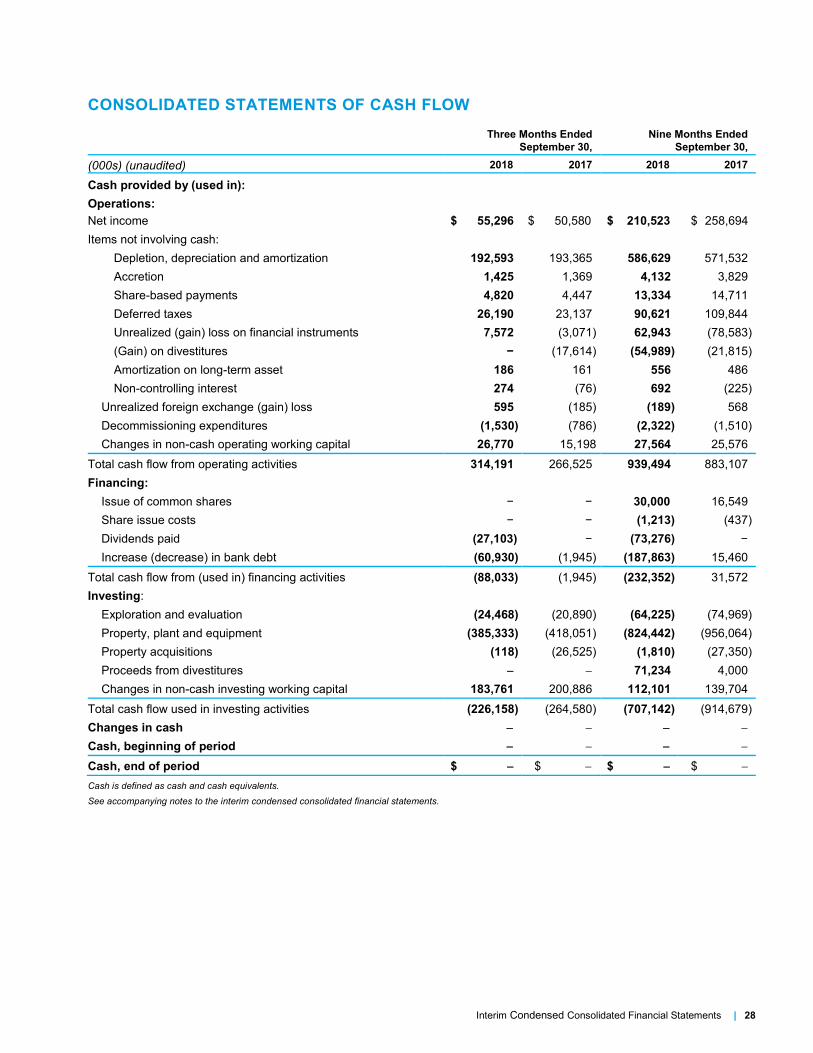
CONSOLIDATED STATEMENTS OF CASH FLOW
Three Months Ended
September 30,
Nine Months Ended
September 30,
(000s) (unaudited) 2018 2017 2018 2017
Cash provided by (used in):
Operations:
Net income $ 55,296 $ 50,580 $ 210,523 $ 258,694
Items not involving cash:
Depletion, depreciation and amortization 192,593 193,365 586,629 571,532
Accretion 1,425 1,369 4,132 3,829
Share-based payments 4,820 4,447 13,334 14,711
Deferred taxes 26,190 23,137 90,621 109,844
Unrealized (gain) loss on financial instruments 7,572 (3,071) 62,943 (78,583)
(Gain) on divestitures − (17,614) (54,989) (21,815)
Amortization on long-term asset 186 161 556 486
Non-controlling interest 274 (76) 692 (225)
Unrealized foreign exchange (gain) loss 595 (185) (189) 568
Decommissioning expenditures (1,530) (786) (2,322) (1,510)
Changes in non-cash operating working capital 26,770 15,198 27,564 25,576
Total cash flow from operating activities 314,191 266,525 939,494 883,107
Financing:
Issue of common shares − − 30,000 16,549
Share issue costs − − (1,213) (437)
Dividends paid (27,103) − (73,276) −
Increase (decrease) in bank debt (60,930) (1,945) (187,863) 15,460
Total cash flow from (used in) financing activities (88,033) (1,945) (232,352) 31,572
Investing:
Exploration and evaluation (24,468) (20,890) (64,225) (74,969)
Property, plant and equipment (385,333) (418,051) (824,442) (956,064)
Property acquisitions (118) (26,525) (1,810) (27,350)
Proceeds from divestitures 71,234 4,000
Changes in non-cash investing working capital 183,761 200,886 112,101 139,704
Total cash flow used in investing activities (226,158) (264,580) (707,142) (914,679)
Changes in cash
Cash, beginning of period
Cash, end of period $ $ $ $
Cash is defined as cash and cash equivalents.
See accompanying notes to the interim condensed consolidated financial statements.
Notes to the Unaudited Interim Condensed Consolidated Financial Statements | 29
NOTES TO THE INTERIM CONDENSED CONSOLIDATED FINANCIAL STATEMENTS
AS AT SEPTEMBER 30, 2018 AND FOR THE THREE AND NINE MONTHS ENDED SEPTEMBER 30, 2018 AND 2017
(tabular amounts in thousands of dollars, unless otherwise noted) (unaudited)
Corporate Information:
Tourmaline Oil Corp. (the “Company”) was incorporated under the laws of the Province of Alberta on July 21,
2008. The Company is engaged in the acquisition, exploration, development and production of petroleum and
natural gas properties.
These unaudited interim condensed consolidated financial statements reflect only the Company’s proportionate
interest in such activities. The unaudited interim condensed consolidated financial statements were authorized
for issue by the Board of Directors on November 7, 2018.
The Company’s registered office is located at Suite 2400, 525 – 8th Avenue S.W., Calgary, Alberta, Canada
T2P 1G1.
1. BASIS OF PREPARATION
These unaudited interim condensed consolidated financial statements have been prepared in accordance with
International Accounting Standard 34, “Interim Financial Reporting”. These unaudited interim condensed
consolidated financial statements do not include all of the information and disclosure required in the annual
financial statements and should be read in conjunction with the Company’s consolidated financial statements for
the year ended December 31, 2017.
These unaudited interim condensed consolidated financial statements are presented in Canadian dollars and
include the accounts of Tourmaline Oil Corp., and its 90.6% owned subsidiary Exshaw Oil Corp. (note 8), which
both have a functional currency of Canadian dollars. Tourmaline Oil Corp. also includes its 100% owned
subsidiary Tourmaline Oil Marketing Corp., which has a functional currency of US dollars.
The accounting policies and significant accounting judgments, estimates, and assumptions used in these
unaudited interim condensed consolidated financial statements are consistent with those described in notes 1
and 2 of the Company’s consolidated financial statements for the year ended December 31, 2017, except as
noted below.
Changes in Accounting Policies
IFRS 9
On January 1, 2018, the Company adopted IFRS 9 - Financial instruments, which replaces the existing guidance
in IAS 39 Financial Instruments: Recognition and Measurement. The new standard includes revised guidance on
the classification and measurement of financial instruments, including a new expected credit loss model for
calculating impairment on financial assets, and the new general hedge accounting requirements. It also carries
forward the guidance on recognition and derecognition of financial instruments from IAS 39.
Notes to the Unaudited Interim Condensed Consolidated Financial Statements | 30
The three principal classification categories under the new standard for financial instruments are: measured at
amortized cost, fair value through other comprehensive income (“FVOCI”) and fair value through profit and loss
(“FVTPL”). The classification of financial instruments under IFRS 9 is generally based on the business model in
which a financial instrument is managed and its contractual cash flow characteristics. The previous categories
under IAS 39 of held to maturity, loans and receivables and available for sale have been removed.
IFRS 9 replaces the “incurred loss” model in IAS 39 with an “expected loss” model. The new impairment model
applies to financial instruments measured at amortized cost, and contract assets and debt investments measured
at FVOCI. Under IFRS 9, credit losses will be recognized earlier than under IAS 39.
Cash and cash equivalents, accounts receivable, accounts payable and accrued liabilities, and bank debt
continue to be measured at amortized cost and are now classified as “amortized cost”. There were no changes
to the Company’s classifications of its financial instrument assets and liabilities as FVTPL. None of the
Company’s financial instruments have been classified as FVOCI.
The Company did not formerly apply hedge accounting to its financial instruments and has not elected to apply
hedge accounting to any of its financial instruments upon adoption of IFRS 9. There was no impact to the
Company as a result of adopting the new standard.
IFRS 15
On January 1, 2018 the Company adopted IFRS 15 – Revenue from Contracts with Customers, which
establishes a comprehensive framework for determining whether, how much and when revenue is recognized. It
replaces existing revenue recognition guidance, including IAS 18 Revenue, IAS 11 Construction Contracts and
IFRIC 13 Customer Loyalty Programmes. The Company has adopted IFRS 15 using the modified retrospective
approach on January 1, 2018. Based on the Company’s review of contracts with customers and its assessment
of various revenue streams using the IFRS 15 five step model there were no material changes to net income, the
timing of revenue recognized, income statement line classification or to opening retained earnings as at
January 1, 2018. Tourmaline has expanded disclosures in the notes to its interim condensed consolidated
financial statements as prescribed by IFRS 15, including disclosing the Company’s disaggregated revenue
streams by product type. As a result of adopting IFRS 15 the Company’s revenue recognition policy is now:
Revenue Recognition:
Revenue from the sale of crude oil, natural gas and natural gas liquids is recorded when control of the product is
transferred to the buyer based on the consideration specified in the contracts with customers. This usually
occurs when the product is physically transferred at the delivery point agreed upon in the contract and legal title
to the product passes to the customer. The Company evaluates its arrangements with third parties and partners
to determine if the Company acts as the principal or as an agent. In making this evaluation, the Company
considers if it obtains control of the product delivered or services provided, which is indicated by the Company
having the primary responsibility for the delivery of the product or rendering of the service, having the ability to
establish prices or having inventory risk. If the Company acts in the capacity of an agent rather than as a
principal in a transaction, then the revenue is recognized on a net-basis, only reflecting the fee, if any, realized by
the Company from the transaction.
Future Accounting Changes
The following pronouncement from the IASB will become effective for financial reporting periods beginning
January 1, 2019 and has not yet been adopted by the Company. This new or revised standard permits early
adoption with transitional arrangements depending upon the date of initial application.
Notes to the Unaudited Interim Condensed Consolidated Financial Statements | 31
IFRS 16 – Leases sets out the principles for the recognition, measurement, presentation and disclosure of leases
for both parties to a contract, i.e. the customer (“lessee”) and the supplier (“lessor”) and replaces the previous
leases standard, IAS 17 - Leases and IFRIC 4 - Determining whether an Arrangement contains a Lease. IFRS
16 is effective for annual reporting periods beginning on or after January 1, 2019. The standard is required to be
adopted either retrospectively or using a modified retrospective approach. The Company will adopt IFRS 16
using the modified retrospective approach. The Company has completed an initial assessment of the potential
impact on its consolidated financial statements but has not yet completed its detailed assessment. The actual
impact of applying IFRS 16 on the financial statements in the period of initial application will depend on multiple
factors and conditions, including but not limited to, the Company’s borrowing rate at January 1, 2019, the
composition of the Company’s lease portfolio at that date, the Company’s latest assessment of whether it will
exercise any lease renewal options, and the extent to which the Company chooses to use practical expedients
and recognition exemptions.
Thus far, the most significant impact identified is that the Company will now recognize new assets and liabilities
on its consolidated statements of financial position for its office leases. In addition, the nature of the expenses
related to those leases will change. Straight-line operating lease expense will be replaced with a depreciation
charge for right-of-use assets and interest expense on lease liabilities.
The Company continues to review all existing contracts in detail. The full extent of the impact has not yet been
determined. For the remainder of the year, the Company will also be focused on developing and implementing
changes to policies, internal controls, information systems and business and accounting processes.
2. DETERMINATION OF FAIR VALUE
A number of the Company’s accounting policies and disclosures require the determination of fair value, for both
financial and non-financial assets and liabilities. Fair values have been determined for measurement and/or
disclosure purposes based on the following methods. When applicable, further information about the
assumptions made in determining fair values is disclosed in the notes specific to that asset or liability.
Tourmaline classifies the fair value of transactions according to the following hierarchy based on the amount of
observable inputs used to value the instrument.
Level 1 – Quoted prices are available in active markets for identical assets or liabilities as of the reporting
date. Active markets are those in which transactions occur in sufficient frequency and volume to provide
pricing information on an ongoing basis.
Level 2 – Pricing inputs are other than quoted prices in active markets included in Level 1. Prices are either
directly or indirectly observable as of the reporting date. Level 2 valuations are based on inputs, including
quoted forward prices for commodities, time value and volatility factors, which can be substantially observed
or corroborated in the marketplace.
Level 3 – Valuations in this level are those with inputs for the asset or liability that are not based on
observable market data.
The fair value of accounts receivable, and accounts payable and accrued liabilities approximate their carrying
amounts due to their short term nature. Bank debt bears interest at a floating market rate with applicable variable
margins, and accordingly the fair market value approximates the carrying amount. The Company’s financial
instruments have been assessed on the fair value hierarchy described above and classified as Level 2.
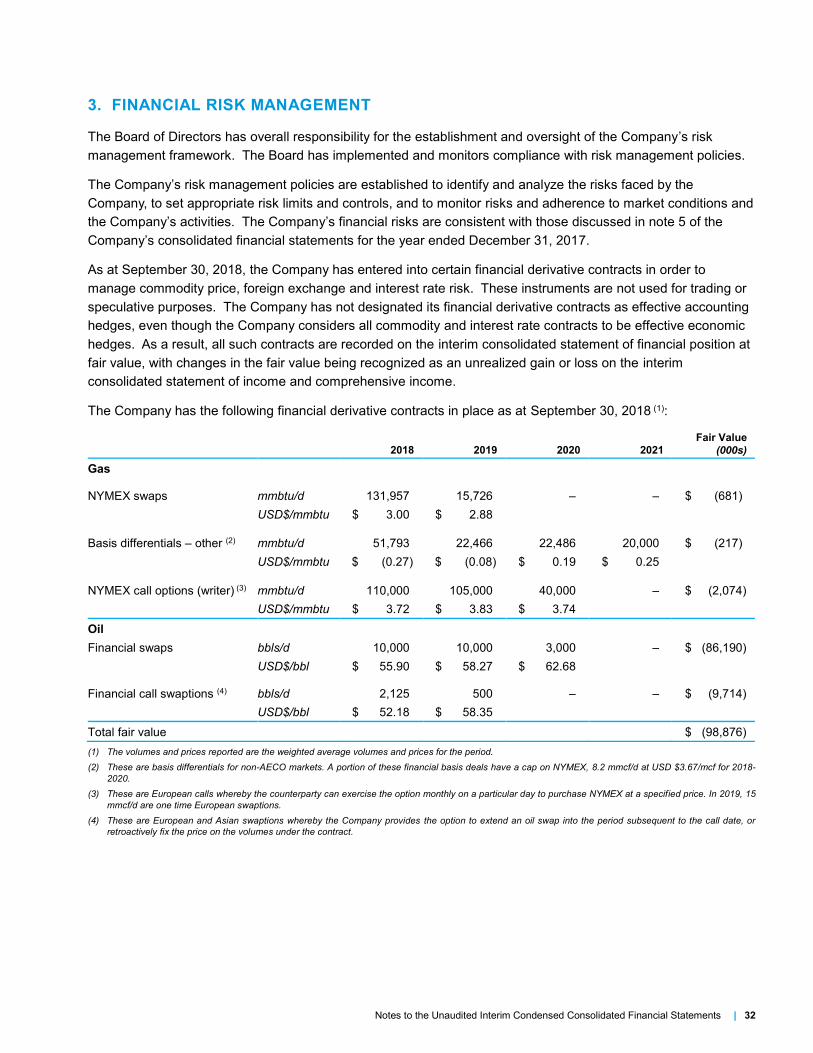
Notes to the Unaudited Interim Condensed Consolidated Financial Statements | 32
3. FINANCIAL RISK MANAGEMENT
The Board of Directors has overall responsibility for the establishment and oversight of the Company’s risk
management framework. The Board has implemented and monitors compliance with risk management policies.
The Company’s risk management policies are established to identify and analyze the risks faced by the
Company, to set appropriate risk limits and controls, and to monitor risks and adherence to market conditions and
the Company’s activities. The Company’s financial risks are consistent with those discussed in note 5 of the
Company’s consolidated financial statements for the year ended December 31, 2017.
As at September 30, 2018, the Company has entered into certain financial derivative contracts in order to
manage commodity price, foreign exchange and interest rate risk. These instruments are not used for trading or
speculative purposes. The Company has not designated its financial derivative contracts as effective accounting
hedges, even though the Company considers all commodity and interest rate contracts to be effective economic
hedges. As a result, all such contracts are recorded on the interim consolidated statement of financial position at
fair value, with changes in the fair value being recognized as an unrealized gain or loss on the interim
consolidated statement of income and comprehensive income.
The Company has the following financial derivative contracts in place as at September 30, 2018 (1):
2018 2019 2020 2021
Fair Value
(000s)
Gas
NYMEX swaps mmbtu/d 131,957 15,726 – – $ (681)
USD$/mmbtu $ 3.00 $ 2.88
Basis differentials – other (2) mmbtu/d 51,793 22,466 22,486 20,000 $ (217)
USD$/mmbtu $ (0.27) $ (0.08) $ 0.19 $ 0.25
NYMEX call options (writer) (3) mmbtu/d 110,000 105,000 40,000 – $ (2,074)
USD$/mmbtu $ 3.72 $ 3.83 $ 3.74
Oil
Financial swaps bbls/d 10,000 10,000 3,000 – $ (86,190)
USD$/bbl $ 55.90 $ 58.27 $ 62.68
Financial call swaptions (4) bbls/d 2,125 500 – – $ (9,714)
USD$/bbl $ 52.18 $ 58.35
Total fair value $ (98,876)
(1) The volumes and prices reported are the weighted average volumes and prices for the period.
(2) These are basis differentials for non-AECO markets. A portion of these financial basis deals have a cap on NYMEX, 8.2 mmcf/d at USD $3.67/mcf for 2018-
2020.
(3) These are European calls whereby the counterparty can exercise the option monthly on a particular day to purchase NYMEX at a specified price. In 2019, 15
mmcf/d are one time European swaptions.
(4) These are European and Asian swaptions whereby the Company provides the option to extend an oil swap into the period subsequent to the call date, or
retroactively fix the price on the volumes under the contract.
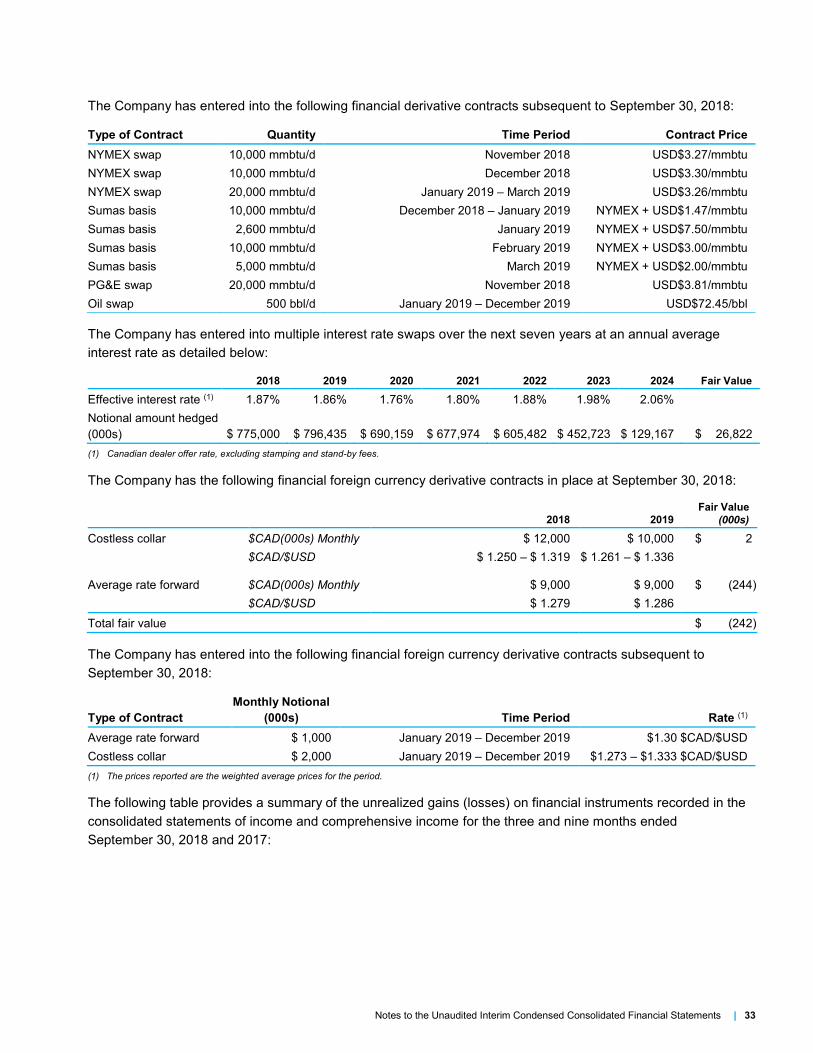
Notes to the Unaudited Interim Condensed Consolidated Financial Statements | 33
The Company has entered into the following financial derivative contracts subsequent to September 30, 2018:
Type of Contract Quantity Time Period Contract Price
NYMEX swap 10,000 mmbtu/d November 2018 USD$3.27/mmbtu
NYMEX swap 10,000 mmbtu/d December 2018 USD$3.30/mmbtu
NYMEX swap 20,000 mmbtu/d January 2019 – March 2019 USD$3.26/mmbtu
Sumas basis 10,000 mmbtu/d December 2018 – January 2019 NYMEX + USD$1.47/mmbtu
Sumas basis 2,600 mmbtu/d January 2019 NYMEX + USD$7.50/mmbtu
Sumas basis 10,000 mmbtu/d February 2019 NYMEX + USD$3.00/mmbtu
Sumas basis 5,000 mmbtu/d March 2019 NYMEX + USD$2.00/mmbtu
PG&E swap 20,000 mmbtu/d November 2018 USD$3.81/mmbtu
Oil swap 500 bbl/d January 2019 – December 2019 USD$72.45/bbl
The Company has entered into multiple interest rate swaps over the next seven years at an annual average
interest rate as detailed below:
2018 2019 2020 2021 2022 2023 2024 Fair Value
Effective interest rate (1) 1.87% 1.86% 1.76% 1.80% 1.88% 1.98% 2.06%
Notional amount hedged
(000s) $ 775,000 $ 796,435 $ 690,159 $ 677,974 $ 605,482 $ 452,723 $ 129,167 $ 26,822
(1) Canadian dealer offer rate, excluding stamping and stand-by fees.
The Company has the following financial foreign currency derivative contracts in place at September 30, 2018:
2018 2019
Fair Value
(000s)
Costless collar $CAD(000s) Monthly $ 12,000 $ 10,000 $ 2
$CAD/$USD $ 1.250 – $ 1.319 $ 1.261 – $ 1.336
Average rate forward $CAD(000s) Monthly $ 9,000 $ 9,000 $ (244)
$CAD/$USD $ 1.279 $ 1.286
Total fair value $ (242)
The Company has entered into the following financial foreign currency derivative contracts subsequent to
September 30, 2018:
Type of Contract
Monthly Notional
(000s) Time Period Rate (1)
Average rate forward $ 1,000 January 2019 – December 2019 $1.30 $CAD/$USD
Costless collar $ 2,000 January 2019 – December 2019 $1.273 – $1.333 $CAD/$USD
(1) The prices reported are the weighted average prices for the period.
The following table provides a summary of the unrealized gains (losses) on financial instruments recorded in the
consolidated statements of income and comprehensive income for the three and nine months ended
September 30, 2018 and 2017:
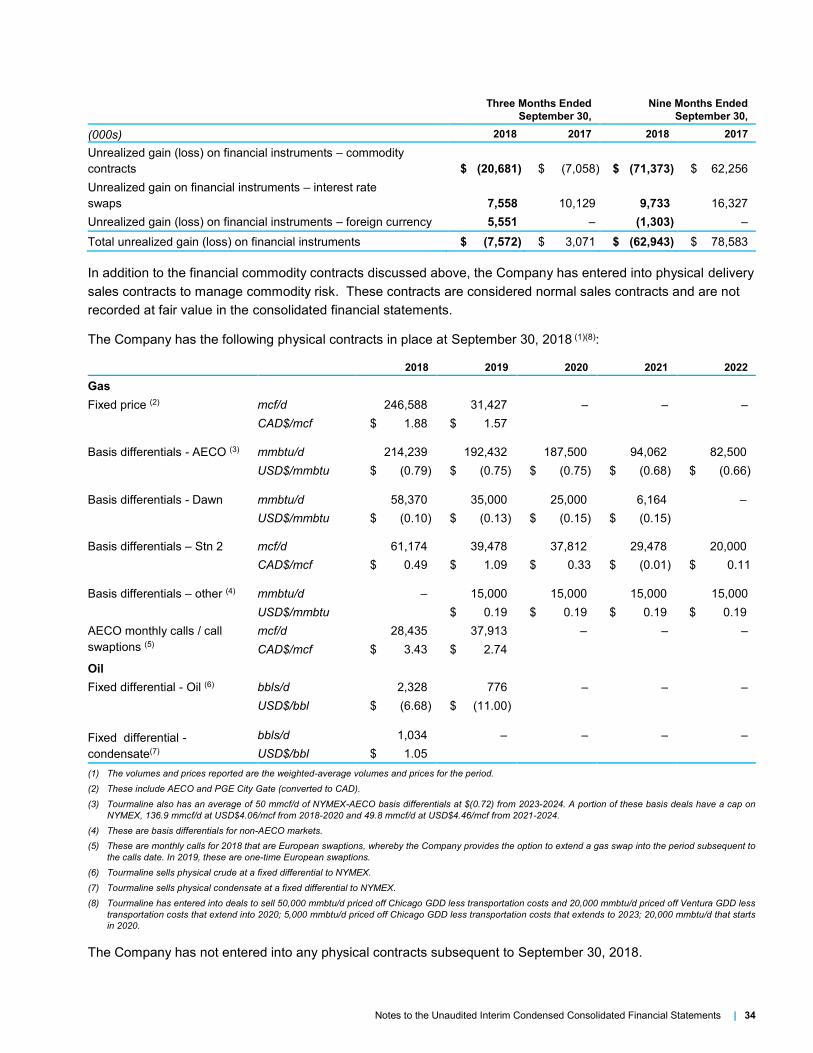
Notes to the Unaudited Interim Condensed Consolidated Financial Statements | 34
Three Months Ended
September 30,
Nine Months Ended
September 30,
(000s) 2018 2017 2018 2017
Unrealized gain (loss) on financial instruments – commodity
contracts $ (20,681) $ (7,058) $ (71,373) $ 62,256
Unrealized gain on financial instruments – interest rate
swaps 7,558 10,129 9,733 16,327
Unrealized gain (loss) on financial instruments – foreign currency 5,551 – (1,303) –
Total unrealized gain (loss) on financial instruments $ (7,572) $ 3,071 $ (62,943) $ 78,583
In addition to the financial commodity contracts discussed above, the Company has entered into physical delivery
sales contracts to manage commodity risk. These contracts are considered normal sales contracts and are not
recorded at fair value in the consolidated financial statements.
The Company has the following physical contracts in place at September 30, 2018 (1)(8):
2018 2019 2020 2021 2022
Gas
Fixed price (2) mcf/d 246,588 31,427 – – –
CAD$/mcf $ 1.88 $ 1.57
Basis differentials - AECO (3) mmbtu/d 214,239 192,432 187,500 94,062 82,500
USD$/mmbtu $ (0.79) $ (0.75) $ (0.75) $ (0.68) $ (0.66)
Basis differentials - Dawn mmbtu/d 58,370 35,000 25,000 6,164 –
USD$/mmbtu $ (0.10) $ (0.13) $ (0.15) $ (0.15)
Basis differentials – Stn 2 mcf/d 61,174 39,478 37,812 29,478 20,000
CAD$/mcf $ 0.49 $ 1.09 $ 0.33 $ (0.01) $ 0.11
Basis differentials – other (4) mmbtu/d – 15,000 15,000 15,000 15,000
USD$/mmbtu $ 0.19 $ 0.19 $ 0.19 $ 0.19
AECO monthly calls / call
swaptions (5)
mcf/d 28,435 37,913 – – –
CAD$/mcf $ 3.43 $ 2.74
Oil
Fixed differential - Oil (6) bbls/d 2,328 776 – – –
USD$/bbl $ (6.68) $ (11.00)
Fixed differential -
condensate(7)
bbls/d 1,034 – – – –
USD$/bbl $ 1.05
(1) The volumes and prices reported are the weighted-average volumes and prices for the period.
(2) These include AECO and PGE City Gate (converted to CAD).
(3) Tourmaline also has an average of 50 mmcf/d of NYMEX-AECO basis differentials at $(0.72) from 2023-2024. A portion of these basis deals have a cap on
NYMEX, 136.9 mmcf/d at USD$4.06/mcf from 2018-2020 and 49.8 mmcf/d at USD$4.46/mcf from 2021-2024.
(4) These are basis differentials for non-AECO markets.
(5) These are monthly calls for 2018 that are European swaptions, whereby the Company provides the option to extend a gas swap into the period subsequent to
the calls date. In 2019, these are one-time European swaptions.
(6) Tourmaline sells physical crude at a fixed differential to NYMEX.
(7) Tourmaline sells physical condensate at a fixed differential to NYMEX.
(8) Tourmaline has entered into deals to sell 50,000 mmbtu/d priced off Chicago GDD less transportation costs and 20,000 mmbtu/d priced off Ventura GDD less
transportation costs that extend into 2020; 5,000 mmbtu/d priced off Chicago GDD less transportation costs that extends to 2023; 20,000 mmbtu/d that starts
in 2020.
The Company has not entered into any physical contracts subsequent to September 30, 2018.
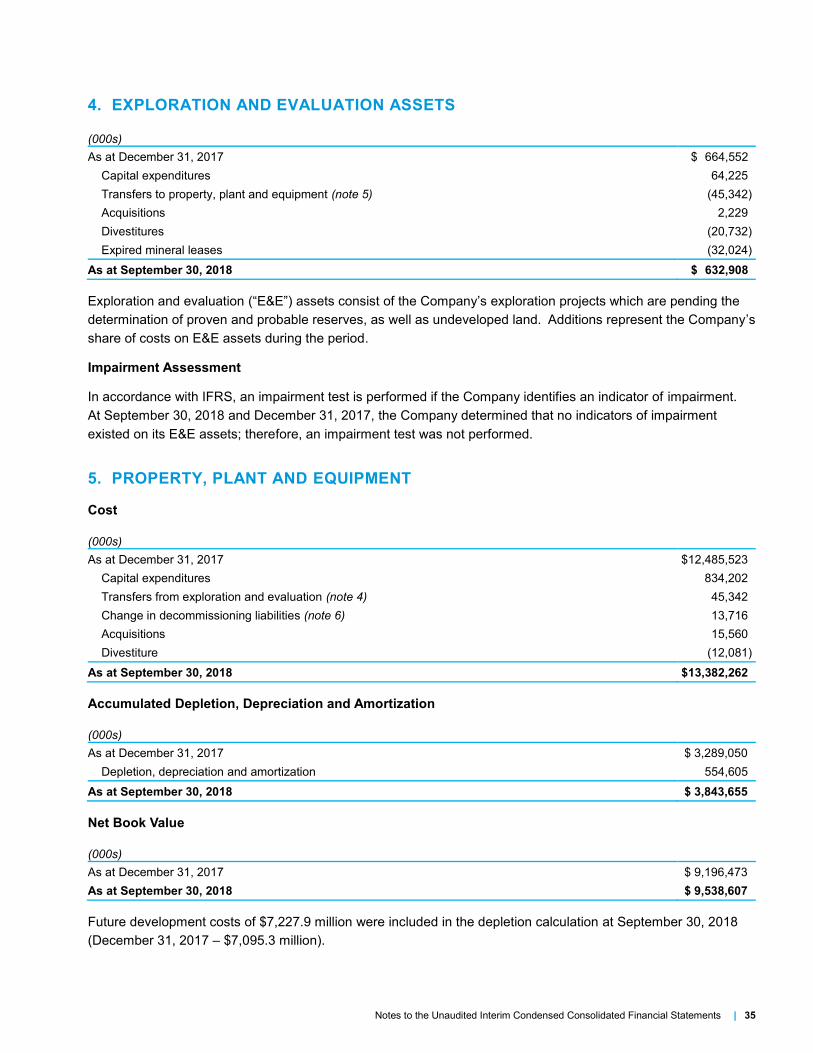
Notes to the Unaudited Interim Condensed Consolidated Financial Statements | 35
4. EXPLORATION AND EVALUATION ASSETS
(000s)
As at December 31, 2017 $ 664,552
Capital expenditures 64,225
Transfers to property, plant and equipment (note 5) (45,342)
Acquisitions 2,229
Divestitures (20,732)
Expired mineral leases (32,024)
As at September 30, 2018 $ 632,908
Exploration and evaluation (“E&E”) assets consist of the Company’s exploration projects which are pending the
determination of proven and probable reserves, as well as undeveloped land. Additions represent the Company’s
share of costs on E&E assets during the period.
Impairment Assessment
In accordance with IFRS, an impairment test is performed if the Company identifies an indicator of impairment.
At September 30, 2018 and December 31, 2017, the Company determined that no indicators of impairment
existed on its E&E assets; therefore, an impairment test was not performed.
5. PROPERTY, PLANT AND EQUIPMENT
Cost
(000s)
As at December 31, 2017 $12,485,523
Capital expenditures 834,202
Transfers from exploration and evaluation (note 4) 45,342
Change in decommissioning liabilities (note 6) 13,716
Acquisitions 15,560
Divestiture (12,081)
As at September 30, 2018 $13,382,262
Accumulated Depletion, Depreciation and Amortization
(000s)
As at December 31, 2017 $ 3,289,050
Depletion, depreciation and amortization 554,605
As at September 30, 2018 $ 3,843,655
Net Book Value
(000s)
As at December 31, 2017 $ 9,196,473
As at September 30, 2018 $ 9,538,607
Future development costs of $7,227.9 million were included in the depletion calculation at September 30, 2018
(December 31, 2017 – $7,095.3 million).
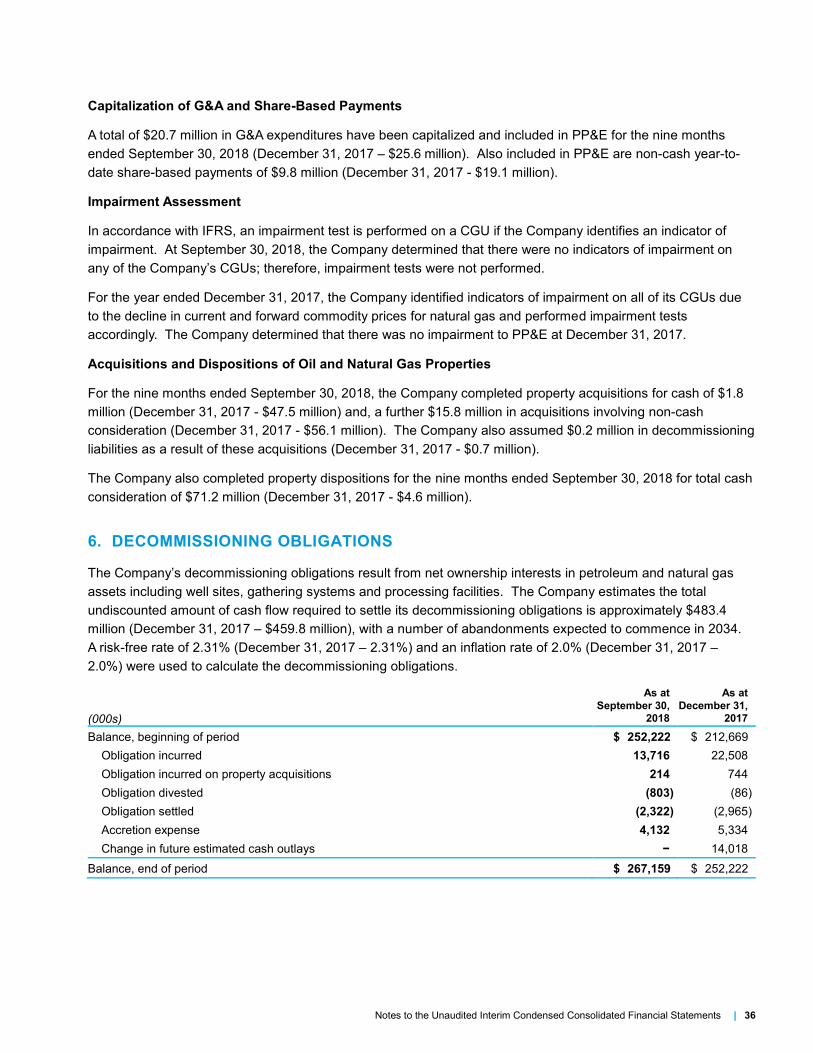
Notes to the Unaudited Interim Condensed Consolidated Financial Statements | 36
Capitalization of G&A and Share-Based Payments
A total of $20.7 million in G&A expenditures have been capitalized and included in PP&E for the nine months
ended September 30, 2018 (December 31, 2017 – $25.6 million). Also included in PP&E are non-cash year-to-
date share-based payments of $9.8 million (December 31, 2017 - $19.1 million).
Impairment Assessment
In accordance with IFRS, an impairment test is performed on a CGU if the Company identifies an indicator of
impairment. At September 30, 2018, the Company determined that there were no indicators of impairment on
any of the Company’s CGUs; therefore, impairment tests were not performed.
For the year ended December 31, 2017, the Company identified indicators of impairment on all of its CGUs due
to the decline in current and forward commodity prices for natural gas and performed impairment tests
accordingly. The Company determined that there was no impairment to PP&E at December 31, 2017.
Acquisitions and Dispositions of Oil and Natural Gas Properties
For the nine months ended September 30, 2018, the Company completed property acquisitions for cash of $1.8
million (December 31, 2017 - $47.5 million) and, a further $15.8 million in acquisitions involving non-cash
consideration (December 31, 2017 - $56.1 million). The Company also assumed $0.2 million in decommissioning
liabilities as a result of these acquisitions (December 31, 2017 - $0.7 million).
The Company also completed property dispositions for the nine months ended September 30, 2018 for total cash
consideration of $71.2 million (December 31, 2017 - $4.6 million).
6. DECOMMISSIONING OBLIGATIONS
The Company’s decommissioning obligations result from net ownership interests in petroleum and natural gas
assets including well sites, gathering systems and processing facilities. The Company estimates the total
undiscounted amount of cash flow required to settle its decommissioning obligations is approximately $483.4
million (December 31, 2017 – $459.8 million), with a number of abandonments expected to commence in 2034.
A risk-free rate of 2.31% (December 31, 2017 – 2.31%) and an inflation rate of 2.0% (December 31, 2017 –
2.0%) were used to calculate the decommissioning obligations.
(000s)
As at
September 30,
2018
As at
December 31,
2017
Balance, beginning of period $ 252,222 $ 212,669
Obligation incurred 13,716 22,508
Obligation incurred on property acquisitions 214 744
Obligation divested (803) (86)
Obligation settled (2,322) (2,965)
Accretion expense 4,132 5,334
Change in future estimated cash outlays − 14,018
Balance, end of period $ 267,159 $ 252,222
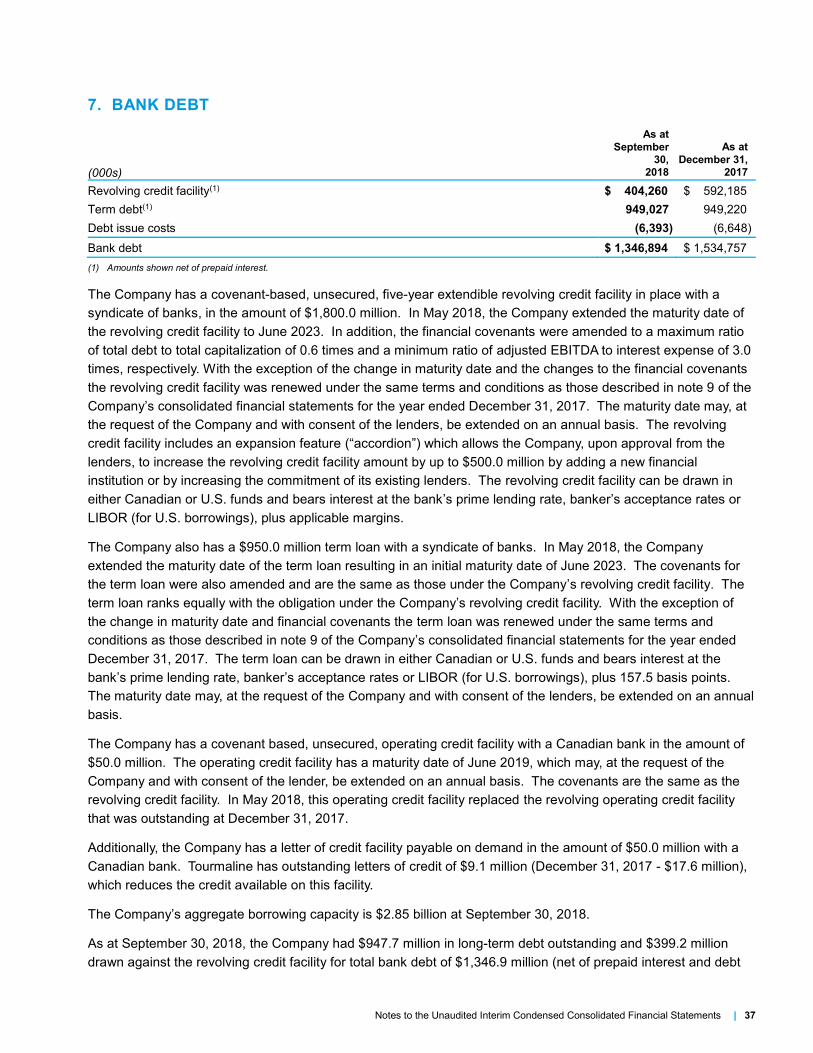
Notes to the Unaudited Interim Condensed Consolidated Financial Statements | 37
7. BANK DEBT
(000s)
As at
September
30,
2018
As at
December 31,
2017
Revolving credit facility(1) $ 404,260 $ 592,185
Term debt(1) 949,027 949,220
Debt issue costs (6,393) (6,648)
Bank debt $ 1,346,894 $ 1,534,757
(1) Amounts shown net of prepaid interest.
The Company has a covenant-based, unsecured, five-year extendible revolving credit facility in place with a
syndicate of banks, in the amount of $1,800.0 million. In May 2018, the Company extended the maturity date of
the revolving credit facility to June 2023. In addition, the financial covenants were amended to a maximum ratio
of total debt to total capitalization of 0.6 times and a minimum ratio of adjusted EBITDA to interest expense of 3.0
times, respectively. With the exception of the change in maturity date and the changes to the financial covenants
the revolving credit facility was renewed under the same terms and conditions as those described in note 9 of the
Company’s consolidated financial statements for the year ended December 31, 2017. The maturity date may, at
the request of the Company and with consent of the lenders, be extended on an annual basis. The revolving
credit facility includes an expansion feature (“accordion”) which allows the Company, upon approval from the
lenders, to increase the revolving credit facility amount by up to $500.0 million by adding a new financial
institution or by increasing the commitment of its existing lenders. The revolving credit facility can be drawn in
either Canadian or U.S. funds and bears interest at the bank’s prime lending rate, banker’s acceptance rates or
LIBOR (for U.S. borrowings), plus applicable margins.
The Company also has a $950.0 million term loan with a syndicate of banks. In May 2018, the Company
extended the maturity date of the term loan resulting in an initial maturity date of June 2023. The covenants for
the term loan were also amended and are the same as those under the Company’s revolving credit facility. The
term loan ranks equally with the obligation under the Company’s revolving credit facility. With the exception of
the change in maturity date and financial covenants the term loan was renewed under the same terms and
conditions as those described in note 9 of the Company’s consolidated financial statements for the year ended
December 31, 2017. The term loan can be drawn in either Canadian or U.S. funds and bears interest at the
bank’s prime lending rate, banker’s acceptance rates or LIBOR (for U.S. borrowings), plus 157.5 basis points.
The maturity date may, at the request of the Company and with consent of the lenders, be extended on an annual
basis.
The Company has a covenant based, unsecured, operating credit facility with a Canadian bank in the amount of
$50.0 million. The operating credit facility has a maturity date of June 2019, which may, at the request of the
Company and with consent of the lender, be extended on an annual basis. The covenants are the same as the
revolving credit facility. In May 2018, this operating credit facility replaced the revolving operating credit facility
that was outstanding at December 31, 2017.
Additionally, the Company has a letter of credit facility payable on demand in the amount of $50.0 million with a
Canadian bank. Tourmaline has outstanding letters of credit of $9.1 million (December 31, 2017 - $17.6 million),
which reduces the credit available on this facility.
The Company’s aggregate borrowing capacity is $2.85 billion at September 30, 2018.
As at September 30, 2018, the Company had $947.7 million in long-term debt outstanding and $399.2 million
drawn against the revolving credit facility for total bank debt of $1,346.9 million (net of prepaid interest and debt
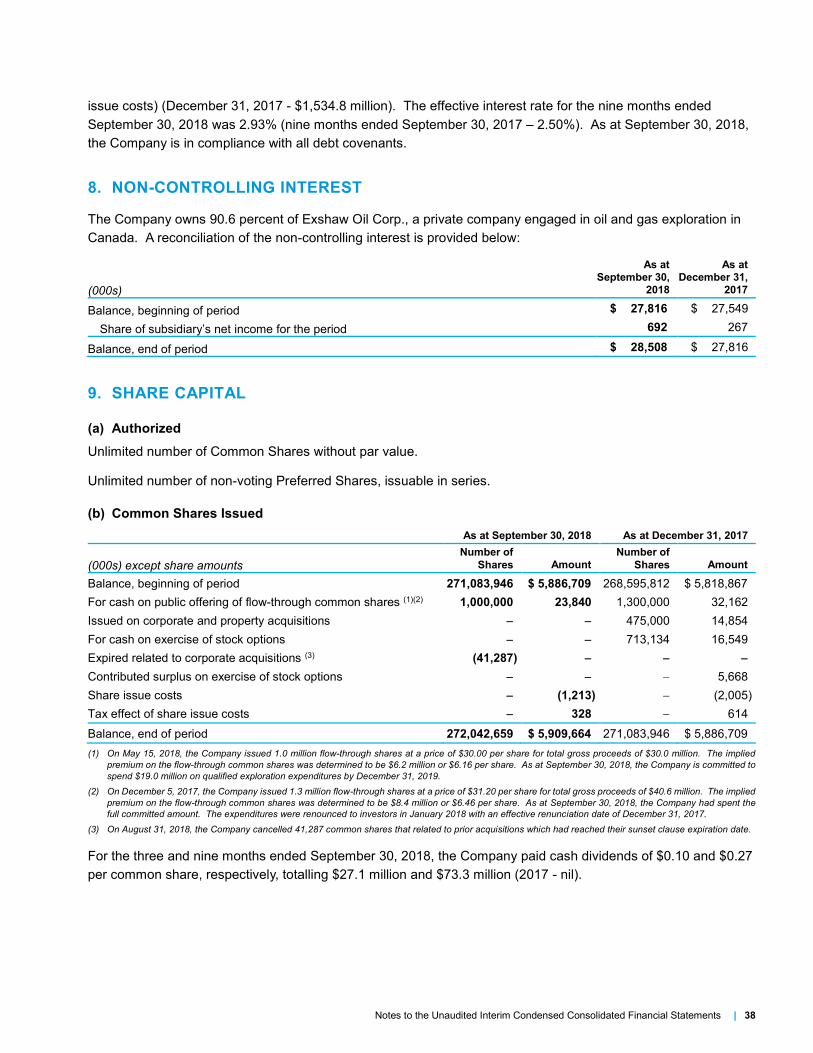
Notes to the Unaudited Interim Condensed Consolidated Financial Statements | 38
issue costs) (December 31, 2017 - $1,534.8 million). The effective interest rate for the nine months ended
September 30, 2018 was 2.93% (nine months ended September 30, 2017 – 2.50%). As at September 30, 2018,
the Company is in compliance with all debt covenants.
8. NON-CONTROLLING INTEREST
The Company owns 90.6 percent of Exshaw Oil Corp., a private company engaged in oil and gas exploration in
Canada. A reconciliation of the non-controlling interest is provided below:
(000s)
As at
September 30,
2018
As at
December 31,
2017
Balance, beginning of period $ 27,816 $ 27,549
Share of subsidiary’s net income for the period 692 267
Balance, end of period $ 28,508 $ 27,816
9. SHARE CAPITAL
(a) Authorized
Unlimited number of Common Shares without par value.
Unlimited number of non-voting Preferred Shares, issuable in series.
(b) Common Shares Issued
As at September 30, 2018 As at December 31, 2017
(000s) except share amounts Number of
Shares Amount
Number of
Shares Amount
Balance, beginning of period 271,083,946 $ 5,886,709 268,595,812 $ 5,818,867
For cash on public offering of flow-through common shares (1)(2) 1,000,000 23,840 1,300,000 32,162
Issued on corporate and property acquisitions 475,000 14,854
For cash on exercise of stock options 713,134 16,549
Expired related to corporate acquisitions (3) (41,287)
Contributed surplus on exercise of stock options 5,668
Share issue costs (1,213) (2,005)
Tax effect of share issue costs 328 614
Balance, end of period 272,042,659 $ 5,909,664 271,083,946 $ 5,886,709
(1) On May 15, 2018, the Company issued 1.0 million flow-through shares at a price of $30.00 per share for total gross proceeds of $30.0 million. The implied
premium on the flow-through common shares was determined to be $6.2 million or $6.16 per share. As at September 30, 2018, the Company is committed to
spend $19.0 million on qualified exploration expenditures by December 31, 2019.
(2) On December 5, 2017, the Company issued 1.3 million flow-through shares at a price of $31.20 per share for total gross proceeds of $40.6 million. The implied
premium on the flow-through common shares was determined to be $8.4 million or $6.46 per share. As at September 30, 2018, the Company had spent the
full committed amount. The expenditures were renounced to investors in January 2018 with an effective renunciation date of December 31, 2017.
(3) On August 31, 2018, the Company cancelled 41,287 common shares that related to prior acquisitions which had reached their sunset clause expiration date.
For the three and nine months ended September 30, 2018, the Company paid cash dividends of $0.10 and $0.27
per common share, respectively, totalling $27.1 million and $73.3 million (2017 - nil).
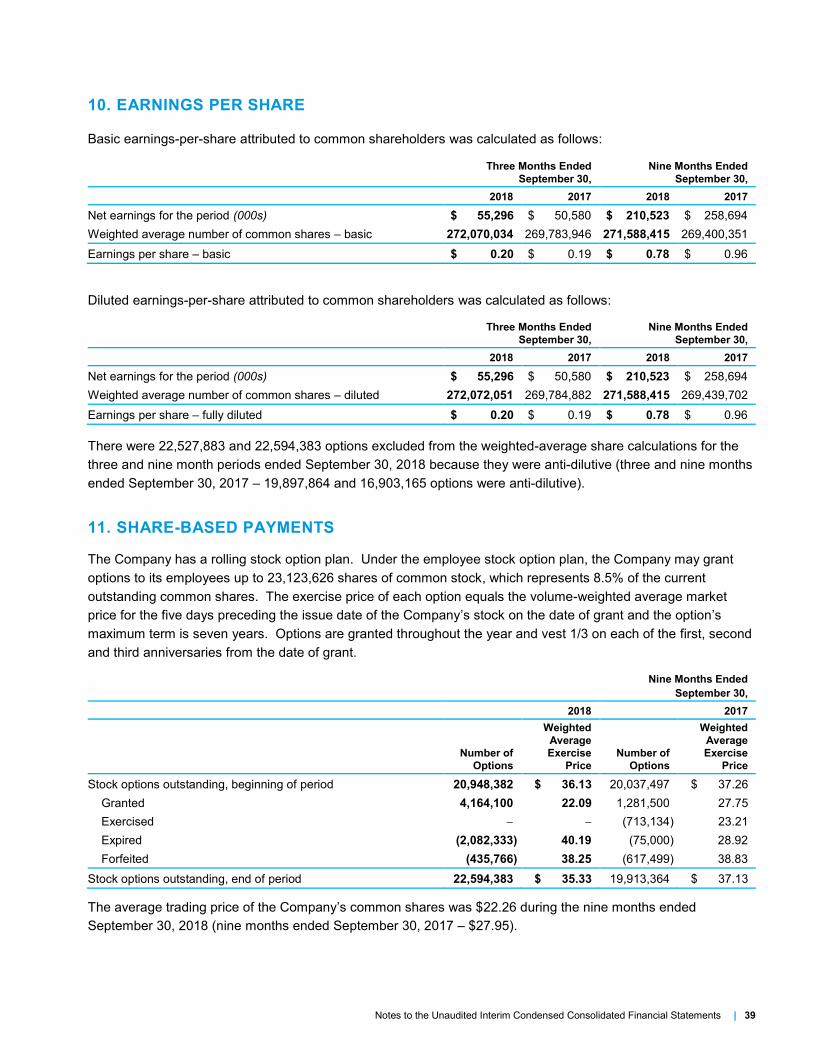
Notes to the Unaudited Interim Condensed Consolidated Financial Statements | 39
10. EARNINGS PER SHARE
Basic earnings-per-share attributed to common shareholders was calculated as follows:
Three Months Ended
September 30,
Nine Months Ended
September 30,
2018 2017 2018 2017
Net earnings for the period (000s) $ 55,296 $ 50,580 $ 210,523 $ 258,694
Weighted average number of common shares – basic 272,070,034 269,783,946 271,588,415 269,400,351
Earnings per share – basic $ 0.20 $ 0.19 $ 0.78 $ 0.96
Diluted earnings-per-share attributed to common shareholders was calculated as follows:
Three Months Ended
September 30,
Nine Months Ended
September 30,
2018 2017 2018 2017
Net earnings for the period (000s) $ 55,296 $ 50,580 $ 210,523 $ 258,694
Weighted average number of common shares – diluted 272,072,051 269,784,882 271,588,415 269,439,702
Earnings per share – fully diluted $ 0.20 $ 0.19 $ 0.78 $ 0.96
There were 22,527,883 and 22,594,383 options excluded from the weighted-average share calculations for the
three and nine month periods ended September 30, 2018 because they were anti-dilutive (three and nine months
ended September 30, 2017 – 19,897,864 and 16,903,165 options were anti-dilutive).
11. SHARE-BASED PAYMENTS
The Company has a rolling stock option plan. Under the employee stock option plan, the Company may grant
options to its employees up to 23,123,626 shares of common stock, which represents 8.5% of the current
outstanding common shares. The exercise price of each option equals the volume-weighted average market
price for the five days preceding the issue date of the Company’s stock on the date of grant and the option’s
maximum term is seven years. Options are granted throughout the year and vest 1/3 on each of the first, second
and third anniversaries from the date of grant.
Nine Months Ended
September 30,
2018 2017
Number of
Options
Weighted
Average
Exercise
Price
Number of
Options
Weighted
Average
Exercise
Price
Stock options outstanding, beginning of period 20,948,382 $ 36.13 20,037,497 $ 37.26
Granted 4,164,100 22.09 1,281,500 27.75
Exercised (713,134) 23.21
Expired (2,082,333) 40.19 (75,000) 28.92
Forfeited (435,766) 38.25 (617,499) 38.83
Stock options outstanding, end of period 22,594,383 $ 35.33 19,913,364 $ 37.13
The average trading price of the Company’s common shares was $22.26 during the nine months ended
September 30, 2018 (nine months ended September 30, 2017 – $27.95).
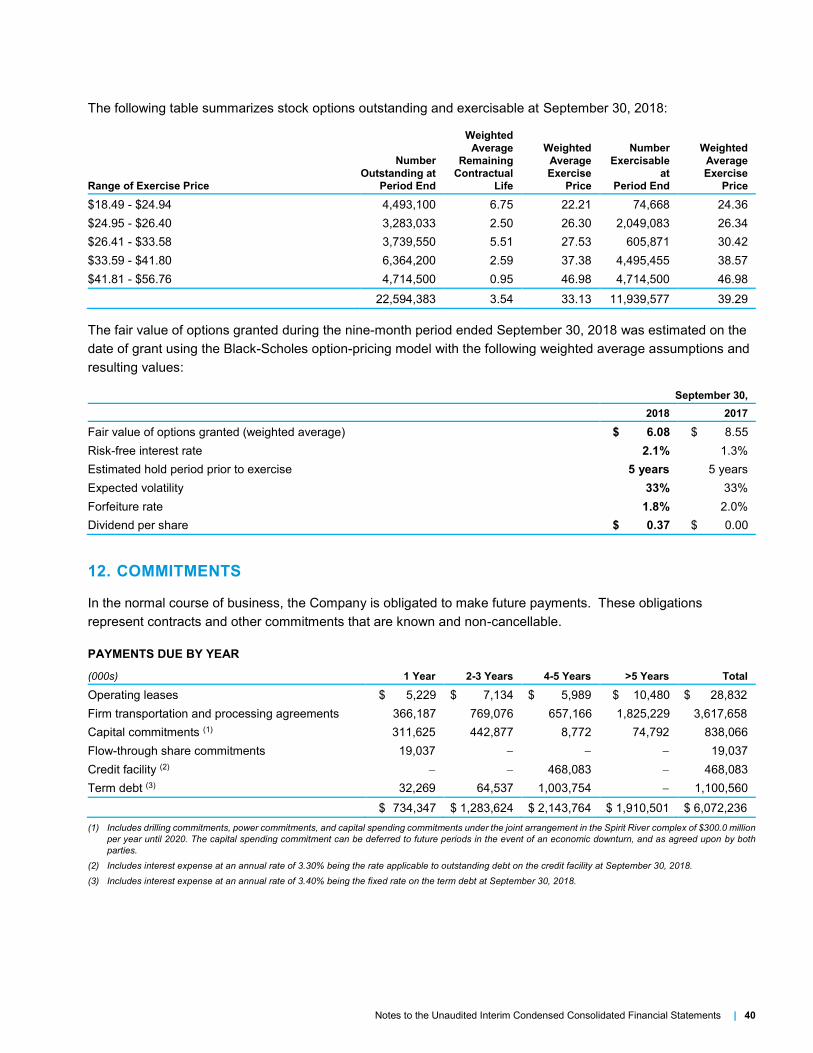
Notes to the Unaudited Interim Condensed Consolidated Financial Statements | 40
The following table summarizes stock options outstanding and exercisable at September 30, 2018:
Range of Exercise Price
Number
Outstanding at
Period End
Weighted
Average
Remaining
Contractual
Life
Weighted
Average
Exercise
Price
Number
Exercisable
at
Period End
Weighted
Average
Exercise
Price
$18.49 - $24.94 4,493,100 6.75 22.21 74,668 24.36
$24.95 - $26.40 3,283,033 2.50 26.30 2,049,083 26.34
$26.41 - $33.58 3,739,550 5.51 27.53 605,871 30.42
$33.59 - $41.80 6,364,200 2.59 37.38 4,495,455 38.57
$41.81 - $56.76 4,714,500 0.95 46.98 4,714,500 46.98
22,594,383 3.54 33.13 11,939,577 39.29
The fair value of options granted during the nine-month period ended September 30, 2018 was estimated on the
date of grant using the Black-Scholes option-pricing model with the following weighted average assumptions and
resulting values:
September 30,
2018 2017
Fair value of options granted (weighted average) $ 6.08 $ 8.55
Risk-free interest rate 2.1% 1.3%
Estimated hold period prior to exercise 5 years 5 years
Expected volatility 33% 33%
Forfeiture rate 1.8% 2.0%
Dividend per share $ 0.37 $ 0.00
12. COMMITMENTS
In the normal course of business, the Company is obligated to make future payments. These obligations
represent contracts and other commitments that are known and non-cancellable.
PAYMENTS DUE BY YEAR
(000s) 1 Year 2-3 Years 4-5 Years >5 Years Total
Operating leases $ 5,229 $ 7,134 $ 5,989 $ 10,480 $ 28,832
Firm transportation and processing agreements 366,187 769,076 657,166 1,825,229 3,617,658
Capital commitments (1) 311,625 442,877 8,772 74,792 838,066
Flow-through share commitments 19,037 19,037
Credit facility (2) 468,083 468,083
Term debt (3) 32,269 64,537 1,003,754 1,100,560
$ 734,347 $ 1,283,624 $ 2,143,764 $ 1,910,501 $ 6,072,236
(1) Includes drilling commitments, power commitments, and capital spending commitments under the joint arrangement in the Spirit River complex of $300.0 million
per year until 2020. The capital spending commitment can be deferred to future periods in the event of an economic downturn, and as agreed upon by both
parties.
(2) Includes interest expense at an annual rate of 3.30% being the rate applicable to outstanding debt on the credit facility at September 30, 2018.
(3) Includes interest expense at an annual rate of 3.40% being the fixed rate on the term debt at September 30, 2018.
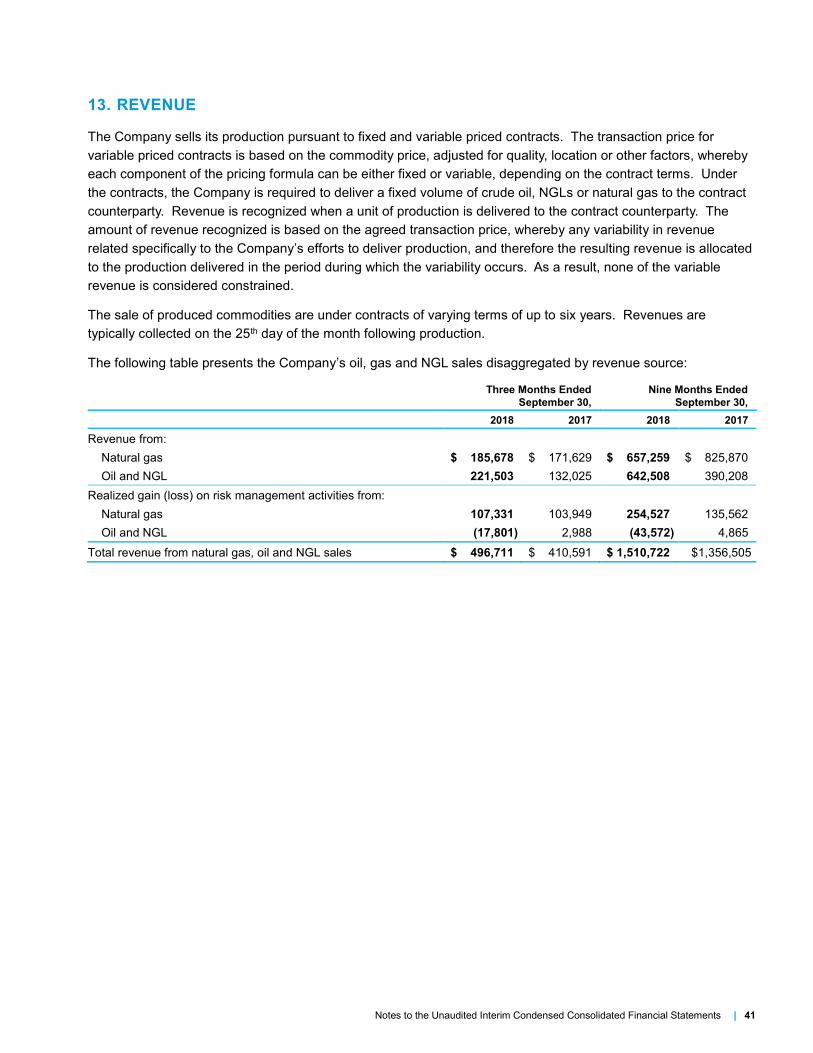
Notes to the Unaudited Interim Condensed Consolidated Financial Statements | 41
13. REVENUE
The Company sells its production pursuant to fixed and variable priced contracts. The transaction price for
variable priced contracts is based on the commodity price, adjusted for quality, location or other factors, whereby
each component of the pricing formula can be either fixed or variable, depending on the contract terms. Under
the contracts, the Company is required to deliver a fixed volume of crude oil, NGLs or natural gas to the contract
counterparty. Revenue is recognized when a unit of production is delivered to the contract counterparty. The
amount of revenue recognized is based on the agreed transaction price, whereby any variability in revenue
related specifically to the Company’s efforts to deliver production, and therefore the resulting revenue is allocated
to the production delivered in the period during which the variability occurs. As a result, none of the variable
revenue is considered constrained.
The sale of produced commodities are under contracts of varying terms of up to six years. Revenues are
typically collected on the 25th day of the month following production.
The following table presents the Company’s oil, gas and NGL sales disaggregated by revenue source:
Three Months Ended
September 30,
Nine Months Ended
September 30,
2018 2017 2018 2017
Revenue from:
Natural gas $ 185,678 $ 171,629 $ 657,259 $ 825,870
Oil and NGL 221,503 132,025 642,508 390,208
Realized gain (loss) on risk management activities from:
Natural gas 107,331 103,949 254,527 135,562
Oil and NGL (17,801) 2,988 (43,572) 4,865
Total revenue from natural gas, oil and NGL sales $ 496,711 $ 410,591 $ 1,510,722 $1,356,505