Embed Size (px)
Citation preview

Management’s Discussion and Analysis of the Financial Condition and Results of Operations For the three and six months ended November 30, 2016 and November 30, 2015 (Expressed in Canadian Dollars)
ANACONDA MINING INC. MANAGEMENT’S DISCUSSION AND ANALYSIS
P a g e | 1
This management discussion and analysis (“MD&A”) has been prepared based on information available to Anaconda Mining Inc. (“Anaconda” or the “Company”) as at January 12, 2017. The MD&A of the operating results and financial condition of the Company for the three months ended November 30, 2016 (the “Quarter”) and six months ended November 30, 2016, should be read in conjunction with the Company’s condensed consolidated interim financial statements (the “Financial Statements”) and the related notes thereto, and the Company’s audited financial statements for the year ended May 31, 2016, prepared in accordance with International Financial Reporting Standards (“IFRS”). All amounts are expressed in Canadian dollars unless otherwise noted. Other information contained in this document has also been prepared by management and is consistent with the data contained in the Financial Statements. This MD&A contains forward-looking statements about expected future events and financial and operating performance of the Company, and actual events may vary from management's expectations. Additional information relating to the Company can be found on the Company’s website at www.anacondamining.com or on SEDAR at www.sedar.com.
Executive summary General Anaconda Mining Inc. is incorporated under the laws of Ontario, with its registered head office located at 150 York Street, Suite 410, Toronto, Ontario, M5H 3S5. Anaconda is a growth-oriented, gold mining and exploration company with four projects on the Baie Verte and Northern Peninsulas of Newfoundland - the Point Rousse Project (“Point Rousse”), the Viking Project (“Viking”), the Great Northern Project and the Tilt Cove Property. The Company has been consistently producing gold at Point Rousse since the summer of 2010. Point Rousse includes an open pit mining operation, other exploration and development properties, and complete mill infrastructure (the “Pine Cove Mill”) capable of processing approximately 400,000 tonnes of ore annually. Mill throughput is currently approximately 1,300 tonnes per operating day with a recovery rate of 85-87%. Point Rousse consists of 660 hectares of original mining rights located on the Ming's Bight Peninsula, which is situated within the larger Baie Verte Mining District on the north-central part of Newfoundland. In 2012, 2013 and 2015, the Company entered into option agreements to acquire a 100% interest in seven additional exploration properties and staked five other properties. The agreements and staked claims increased the Company’s land package of the Point Rousse Project almost ten-fold to 6,316 hectares, controlling significant portions of three gold trends (the Scrape, Goldenville and Deer Cove Trends) totaling over 20 kilometres of cumulative strike length and containing several gold deposits and zones. The Company acquired the Viking Project in February 2016, which has 6,225 hectares of property in White Bay, Newfoundland, approximately 100 km by water (180 km via road) from the Pine Cove Mill. Viking contains the Thor Deposit with Indicated and Inferred Resources containing approximately 83,000 and 31,000 ounces of gold respectively (see August 29, 2016 Technical Report) and other gold prospects and showings. In September 2016, the Company entered into an agreement with Shore Line Aggregates (“SLA”), a subsidiary of the Company’s local contract miner, Guy J. Bailey Ltd., where Anaconda has granted a right, for $0.60 per tonne, to SLA to mine, crush and ship an aggregates product made from Anaconda’s surplus stockpiled rock and in-situ rock from the Pine Cove pit at the Point Rousse Project. SLA is working with a dry bulk ship owner/operator, Phoenix Bulk Carriers (BVI) Ltd. (“Phoenix”), a subsidiary of Pangaea Logistics Solutions Ltd., to fulfill a 3,500,000-tonne aggregates contract (the “Aggregates Venture”) for a project located on the eastern seaboard of the United States. SLA and Phoenix began shipping the aggregates product at the end of September 2016 and expect it will take up to approximately 14 months to fulfill the contract. In November 2016, on the Northern Peninsula, Anaconda acquired 1,325 hectares (the “Jackson’s Arm Property”) and staked 5,050 hectares of contiguous mineral lands totaling 6,375 hectares, collectively referred to as the Great Northern Project.

ANACONDA MINING INC. MANAGEMENT’S DISCUSSION AND ANALYSIS
P a g e | 2
The Company also acquired 350 hectares referred to as the Tilt Cove Property in November 2016, located 60 kilometres east of the Company’s Point Rousse Project within the Baie Verte Mining District. Strategy The Company plans to substantially increase production at its Newfoundland operations from the current approximately 16,000 ounces of gold per year. Its strategy centres around leveraging the existing infrastructure at the Pine Cove Mill and expanding mineral resources through exploration at its four projects. With additional resources and a centralized milling facility, Anaconda plans to develop and mine multiple deposits and process the various ores at the Pine Cove Mill to optimize gold production. On a larger scale, the Company’s vision is to become a prominent junior gold mining company with operations across Atlantic Canada, with annual production of approximately 100,000 ounces per year via organic and corporate growth. As the only pure-play gold producer in the region, Anaconda has a 1,300-tonne per operating day gold mill, substantial tailings capacity, a dock facility and an experienced workforce, all of which serve as the platform for future growth. Highlights for the three and six months ended November 30, 2016 As at November 30, 2016, the Company had cash and cash equivalents of $480,210 and net working capital
of $1,752,360. For the three months ended November 30, 2016, the Company sold 4,388 ounces of gold and generated
$7,411,279 in revenue at an average sales price of $1,689 (USD $1,273) per ounce. For the six months ended November 30, 2016, the Company sold 7,307 ounces of gold and generated
$12,331,016 in revenue at an average sales price of $1,688 (USD $1,287) per ounce. Cash cost per ounce sold at the Point Rousse Project for the three and six months ended November 30,
2016, was $1,036 (USD $781) and $1,119 (USD $853) per ounce, respectively. All-in sustaining cash cost per ounce sold (“AISC”) (see Reconciliation of Non-GAAP Financial Measures),
including corporate administration, capital expenditures and exploration costs for the three and six months ended November 30, 2016, was $1,625 (USD $1,225) and $1,938 (USD $1,477) per ounce, respectively.
The mill processed 1,302 tonnes of ore per operating day for the three months ended November 30, 2016. The overall recovery in the mill for the three and six months ended November 30, 2016, was 85%. At the Point Rousse Project, EBITDA (see Reconciliation of Non-GAAP Financial Measures) for the three
and six months ended November 30, 2016, was $3,029,080 and $4,316,647, respectively. On a consolidated basis, EBITDA for the three and six months ended November 30, 2016, was $2,359,601
and $2,964,380, respectively. Net income for the three and six months ended November 30, 2016, was $723,181 and $343,616,
respectively. Purchase of property, mill and equipment for the six months ended November 30, 2016, was $1,496,493.
Key items included tailings and polishing pond construction of $1,087,000, mill equipment upgrades of $291,000 and permitting/legal costs of $84,000 related to the construction of the dock facility for the Aggregates Venture.
Production stripping assets for the six months ended November 30, 2016, include additions of $1,283,856 and amortization of $235,326.
Approximately $2,015,000 was spent on exploration for the six months ended November 30, 2016, which included drilling, trenching, mapping and mineral resource estimates.
Overall performance

ANACONDA MINING INC. MANAGEMENT’S DISCUSSION AND ANALYSIS
P a g e | 3
Net income for the three months ended November 30, 2016, was $723,181 (net income for the three months ended November 30, 2015, was $766,040). The Company generated a gross margin of $1,232,605 for the three months ended November 30, 2016 ($1,335,770 for the three months ended November 30, 2015). Earnings over the comparative periods were negatively impacted as a result of higher mill operations cost of $333,843, mining costs of $282,407 and depletion and depreciation expense of $138,538. This was partially offset by higher gold sales of $613,204. The Company generated EBITDA of $2,359,601 for the three months ended November 30, 2016 ($2,032,078 for the three months ended November 30, 2015). Cash flow from operations for the three months ended November 30, 2016, was $1,857,353. Cash of approximately $2.0 million was used in exploration activities and capital expenditures. Net income for the six months ended November 30, 2016, was $343,616 (net income for the three months ended November 30, 2015, was $581,121). The Company generated a gross margin of $1,596,220 for the six months ended November 30, 2016 ($1,744,770 for the six months ended November 30, 2015). Earnings over the comparative periods were negatively impacted as a result of lower gold sales of $252,860 and higher milling costs of $403,872. This was partially offset by lower mining costs of $507,926. The Company generated positive EBITDA of $2,964,380 for the six months ended November 30, 2016 ($2,972,055 for the six months ended November 30, 2015). Cash flow from operations for the six months ended November 30, 2016, was $1,894,034. Cash of approximately $3.5 million was used in exploration activities and capital expenditures. Unit cost analysis During the quarter ended November 30, 2016, cash operating cost per ounce was $1,036 compared to cash operating cost in the first quarter of fiscal 2017 of $1,244. The reduction in cash cost was driven by the Company’s higher sales volume of 4,388 ounces compared to 2,919 ounces in the previous quarter of fiscal 2017. AISC per ounce was $1,625 in the second quarter compared to $2,408 in the first quarter of fiscal 2017. The primary drivers of the reduction in AISC per ounce were sales volume and a decrease in the strip ratio from 8.2 : 1 to 4.6 : 1. The average quarterly AISC per ounce for the trailing eight quarters has been $1,600. Based on the mine plan, the Company expects a further reduction in the strip ratio to 3.3 : 1 and all-in sustaining cash cost for the second half of fiscal 2017 to be $1,434 per ounce.
Second Quarter Remaining 2 Trailing 8 FY17 Quarters FY17 Quarters
$ $ $
Operating cash cost 4,545,729 8,530,000 34,513,346
Corporate administration 665,659 1,350,000 5,007,787 Purchase of property, mill and equipment 688,160 850,000 4,134,181 Purchase of exploration and evaluation assets 1,229,452 1,100,000 3,812,713 Additions to production stripping assets - - 3,399,615
All-in sustaining cash cost 7,129,000 11,830,000 50,867,642

ANACONDA MINING INC. MANAGEMENT’S DISCUSSION AND ANALYSIS
P a g e | 4
Second Quarter Remaining 2 Trailing 8 FY17 Quarters FY17 Quarters
$ / oz sold $ / oz sold $ / oz soldGold sales - ounces 4,388 8,250 31,787 Operating cash cost 1,036 1,034 1,086
Corporate administration 152 164 158 Purchase of property, mill and equipment 157 103 130 Purchase of exploration and evaluation assets 280 133 120 Additions to production stripping assets - - 107
All-in sustaining cash cost 1,625 1,434 1,600
The Point Rousse Project The Company owns 100% of the Point Rousse Project, which contains five mining leases totaling 1,053 hectares and 27 mining licenses totaling 5,263 hectares not accounted for within the mining leases. The mining leases were optioned from Tenacity Gold Mining Company Ltd. ("Tenacity"), 1512513 Alberta Ltd. (“Alberta”), which is a subsidiary of Coordinates Capital Corporation (“Coordinates”), and Seaside Realty Ltd. ("Seaside"), while the mining licenses were optioned from several different parties including Tenacity, Alberta, Fair Haven Resources Inc. (“Fair Haven”), Herb Froude (“Froude”), and Messrs Alexander Duffitt and Paul Strong (“Duffitt and Strong”). Five of the licenses are owned by Anaconda. The Point Rousse Project contains an operating open pit mine, milling and processing plant and equipment, a permitted tailings storage and a dock facility. Operations overview During the three months ended November 30, 2016, gold sales volume of 4,388 ounces represented a 5% decrease over the same period in fiscal 2016, largely due to a 17% decrease in grade. The decline in grade was offset by 13% higher throughput compared to the second quarter in fiscal 2016. Average sales price for the three months ended November 30, 2016, of $1,689 per ounce was 14% more than the $1,476 per ounce realized during the same period in fiscal 2016. Driven by the higher gold price and mill throughput, gross revenue for the three months ended November 30, 2016, of $7,411,279 was higher than the same period in fiscal 2016 by $613,204, or 9%.

ANACONDA MINING INC. MANAGEMENT’S DISCUSSION AND ANALYSIS
P a g e | 5
Milling operations The following table summarizes the key mill operating metrics for the three and six months ended November 30, 2016 and 2015:
November 30 November 30 November 30 November 302016 2015 2016 2015
MillOperating days 83 81 171 167 Availability 91% 88% 94% 91%Dry tonnes processed 108,045 95,629 207,486 192,161 Tonnes per 24-hour period 1,302 1,181 1,213 1,151 Grade (grams per tonne) 1.38 1.66 1.28 1.64 Overall mill recovery 85% 87% 85% 87%Gold sales volume (troy oz.) 4,388 4,605 7,307 8,561
OPERATING STATISTICS: For the three months ended For the six months ended
The Pine Cove Mill operated for 83 days during the second quarter of fiscal 2017 at an availability rate of 91%, a three-percentage-point increase over the availability in the second quarter of fiscal 2016. The mill achieved an average run rate of 1,302 tonnes per operating day compared to 1,181 tonnes per operating day in the second quarter of fiscal 2016, a 10% increase. The Pine Cove Mill processed 108,045 dry tonnes of ore during the Quarter compared to 95,629 dry tonnes of ore in the similar period of fiscal 2016, a 13% increase. Overall mill recovery was 85% compared to 87% in second quarter fiscal 2016. Average feed grade during the Quarter was 1.38 grams per tonne (“g/t”), lower than the second quarter of fiscal 2016, but 18% higher than the first quarter of fiscal 2017 and in line with expectations for the remainder of the year.
ANACONDA MINING INC. MANAGEMENT’S DISCUSSION AND ANALYSIS
P a g e | 6
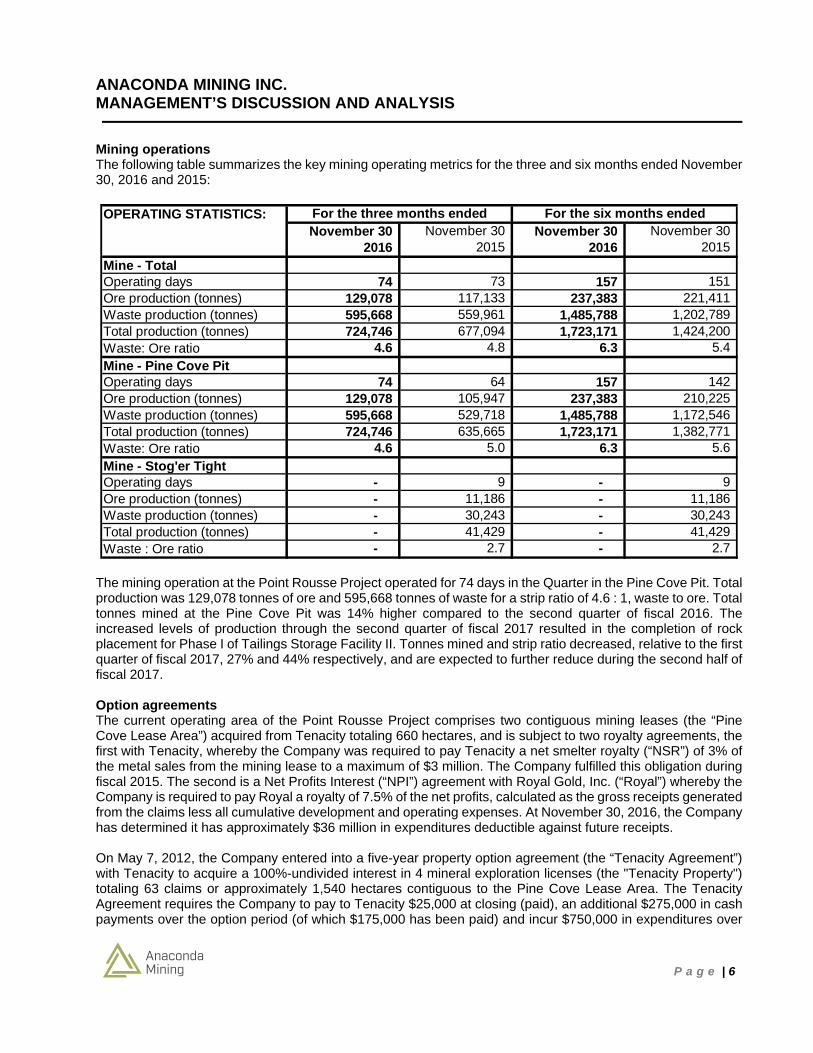
Mining operations The following table summarizes the key mining operating metrics for the three and six months ended November 30, 2016 and 2015:
November 30 November 30 November 30 November 302016 2015 2016 2015
Mine - TotalOperating days 74 73 157 151 Ore production (tonnes) 129,078 117,133 237,383 221,411 Waste production (tonnes) 595,668 559,961 1,485,788 1,202,789 Total production (tonnes) 724,746 677,094 1,723,171 1,424,200 Waste: Ore ratio 4.6 4.8 6.3 5.4
Mine - Pine Cove PitOperating days 74 64 157 142 Ore production (tonnes) 129,078 105,947 237,383 210,225 Waste production (tonnes) 595,668 529,718 1,485,788 1,172,546 Total production (tonnes) 724,746 635,665 1,723,171 1,382,771 Waste: Ore ratio 4.6 5.0 6.3 5.6
Mine - Stog'er TightOperating days - 9 - 9 Ore production (tonnes) - 11,186 - 11,186 Waste production (tonnes) - 30,243 - 30,243 Total production (tonnes) - 41,429 - 41,429 Waste : Ore ratio - 2.7 - 2.7
OPERATING STATISTICS: For the three months ended For the six months ended
The mining operation at the Point Rousse Project operated for 74 days in the Quarter in the Pine Cove Pit. Total production was 129,078 tonnes of ore and 595,668 tonnes of waste for a strip ratio of 4.6 : 1, waste to ore. Total tonnes mined at the Pine Cove Pit was 14% higher compared to the second quarter of fiscal 2016. The increased levels of production through the second quarter of fiscal 2017 resulted in the completion of rock placement for Phase I of Tailings Storage Facility II. Tonnes mined and strip ratio decreased, relative to the first quarter of fiscal 2017, 27% and 44% respectively, and are expected to further reduce during the second half of fiscal 2017. Option agreements The current operating area of the Point Rousse Project comprises two contiguous mining leases (the “Pine Cove Lease Area”) acquired from Tenacity totaling 660 hectares, and is subject to two royalty agreements, the first with Tenacity, whereby the Company was required to pay Tenacity a net smelter royalty (“NSR”) of 3% of the metal sales from the mining lease to a maximum of $3 million. The Company fulfilled this obligation during fiscal 2015. The second is a Net Profits Interest (“NPI”) agreement with Royal Gold, Inc. (“Royal”) whereby the Company is required to pay Royal a royalty of 7.5% of the net profits, calculated as the gross receipts generated from the claims less all cumulative development and operating expenses. At November 30, 2016, the Company has determined it has approximately $36 million in expenditures deductible against future receipts. On May 7, 2012, the Company entered into a five-year property option agreement (the “Tenacity Agreement”) with Tenacity to acquire a 100%-undivided interest in 4 mineral exploration licenses (the "Tenacity Property") totaling 63 claims or approximately 1,540 hectares contiguous to the Pine Cove Lease Area. The Tenacity Agreement requires the Company to pay to Tenacity $25,000 at closing (paid), an additional $275,000 in cash payments over the option period (of which $175,000 has been paid) and incur $750,000 in expenditures over

ANACONDA MINING INC. MANAGEMENT’S DISCUSSION AND ANALYSIS
P a g e | 7
the life of the option. At the Company’s option, 50% of the cash payments can be settled with the issuance of common shares, with value determined based on a weighted average of the 30 trading days preceding payment. The Tenacity Agreement also entitles Tenacity to an NSR of 3% when the average price of gold is less than US$2,000 per ounce for the calendar quarter or at 4% when the average price of gold is more than US$2,000 per ounce for the calendar quarter, with a cap on the NSR of $3 million. On July 19, 2012, the Company entered into a five-year property option agreement (the “Fair Haven Agreement”) with Fair Haven to acquire a 100%-undivided interest in 11 exploration licenses (the “Fair Haven Property”) totaling 71 claims or approximately 1,775 hectares. The Fair Haven Property runs adjacent to the optioned Tenacity Property. The Fair Haven Agreement requires the Company to pay to Fair Haven $10,000 at closing (paid) and to fund expenditures over the life of the option to a minimum of $750,000. The Fair Haven Agreement also entitles Fair Haven to an NSR of 2% to an aggregate sum of $3 million; following this, and after 200,000 ounces of gold has been sold from the Fair Haven Property, Fair Haven is then entitled to a 1% NSR. On November 13, 2012, the Company entered into a five-year property option agreement (the “Froude Agreement”) with Froude to acquire a 100%-undivided interest in 1 exploration license (the “Froude Property”) totaling 11 claims or approximately 275 hectares. The Froude Property is contiguous and now inclusive in the Point Rousse Project. The Froude Agreement requires the Company to pay to Froude $10,000 on January 1, 2013 (paid) and to fund expenditures over the life of the option to a minimum of $125,000. The Froude Agreement also entitles Froude to an NSR of 3% to an aggregate sum of $3 million; following this, and after 200,000 ounces of gold has been sold from the Froude Property, Froude is then entitled to a 1% NSR. On November 19, 2012, the Company entered into a five-year property option agreement (the “DS Agreement”) with Duffitt and Strong to acquire a 100%-undivided interest in 2 exploration licenses (the “Duffitt and Strong Property”) totaling 7 claims or approximately 175 hectares. The Duffitt and Strong Property is contiguous with and now inclusive in the Point Rousse Project. The DS Agreement requires the Company to pay to Duffitt and Strong $20,000 at closing (paid) and to fund expenditures over the life of the option to a minimum of $125,000. The DS Agreement also entitles Duffitt and Strong to an NSR of 3% to an aggregate sum of $3 million; following this, and after 200,000 ounces of gold has been sold from the Duffitt and Strong Property, Duffitt and Strong is then entitled to a 1% NSR. On November 13, 2013, the Company entered into a three-year property option agreement (the “Deer Cove Agreement”) with Alberta to acquire a 100%-undivided interest in one mining lease, a surface lease and three exploration licenses (the “Deer Cove Property”) totaling 48 claims or approximately 1,200 hectares contiguous to the Point Rousse Project. The Deer Cove Agreement requires the Company to pay to Alberta $25,000 at closing (paid), an additional $175,000 in cash payments over the option period (of which $100,000 has been paid) and incur $500,000 in expenditures over the life of the option. The Deer Cove Agreement also entitles Alberta to an NSR of 3%. The Company has the right to buy back 1.8% of the NSR for $1 million. On November 13, 2013, the Company entered into a three-year property option agreement (the “Stog'er Tight Agreement”) with Alberta to acquire a 100%-undivided interest in one mining lease and one surface lease (the “Stog'er Tight Property”) totaling approximately 35 hectares contiguous to the Point Rousse Project. The Stog'er Tight Agreement requires the Company to pay to Alberta $25,000 at closing (paid), an additional $175,000 in cash payments over the option period (of which $100,000 has been paid) and incur $500,000 in expenditures over the life of the option. The Stog'er Tight Agreement also entitles Alberta to an NSR of 3%. The Company has the right to buy back 1.8% of the NSR for $1 million. On July 29, 2015, the Company entered into an option agreement with Seaside to acquire a 100%-undivided interest in one mining lease (the “Corkscrew Property”), totaling 346 hectares contiguous with the Point Rousse Project and is required to make aggregate payments to Seaside of $75,000 ($50,000 paid at closing) over a two-year period. Any future gold production from the Corkscrew Property will be subject to a 2% NSR, capped at $2,000,000.
ANACONDA MINING INC. MANAGEMENT’S DISCUSSION AND ANALYSIS
P a g e | 8
The Viking Project On February 5, 2016, the Company entered into an option agreement with Spruce Ridge Resources Ltd. (“Spruce Ridge”), to acquire 100%-undivided interest in the Viking Property, which contains the Thor Deposit. On February 5, 2016, the Company also entered into a second option agreement with Spruce Ridge to acquire a 100%-undivided interest in the Kramer Property, which is contiguous to the Viking Property and contains numerous gold prospects and showings similar in geological character and setting to the Thor Deposit. On January 29, 2016, Anaconda also staked an additional 2,200 hectares of prospective mineral lands contiguous to the Viking Property and Kramer Property. In total, the Company now controls 6,225 hectares of property in White Bay, Newfoundland, now called the Viking Project. Option Agreements To earn a 100%-undivided interest in the Viking Property, the Company is required to make aggregate payments to Spruce Ridge of $300,000 over a five-year period based on milestones to production, including a final payment of $175,000 upon commencement of commercial production. The Company has paid $50,000 to date and can pay all remaining option payments at any time during the option period to earn its 100% interest. In addition, the Company granted, at closing, warrants to Spruce Ridge to purchase 350,000 common shares of Anaconda at an exercise price of $0.10 per share, expiring three years from the date of the agreement. Further, the Viking Agreement provides for a 0.5% NSR to Spruce Ridge on the sale of gold from the Viking Property. To earn a 100%-undivided interest in the Kramer Property, the Company is required to make aggregate payments to Spruce Ridge of $132,500 over the five-year period, beginning with an initial payment of $12,500 paid on closing with increasing payments on the anniversary of the date of the agreement. The Company also issued 250,000 common shares, at closing, to Spruce Ridge and a 2% NSR to Spruce Ridge on the sale of gold from the Kramer Property. The NSR is capped at $2,500,000, after which the NSR will be reduced to 1%. Anaconda is required to spend a total of $750,000 in qualified exploration expenditures on the Kramer Property during the option period. Two previous NSR agreements held by Altius Resources Inc. ("Altius") and a prospector, Paul Crocker, in relation to Viking will be terminated upon Anaconda earning its 100%-undivided interest in the Viking Property and/or the Kramer Property. These agreements will be replaced by new NSR agreements that stipulate that the Company will pay Altius a 2.5% NSR granted on the Viking Property, a 1% NSR granted on the Kramer Property and a 1.5% NSR granted on an area of interest within 3 km of the combined Viking and Kramer properties. The Great Northern Project On November 8, 2016, Anaconda entered into an option agreement (the “Jackson’s Arm Agreement”) with Metals Creek Resources Corp. (“MEK”) to acquire a 100% undivided interest in 1,325 hectares (the “Jackson’s Arm Property”) and staked 5,050 hectares of contiguous mineral lands totaling 6,375 hectares (collectively, the “Great Northern Project”). Option Agreement To earn a 100%-undivided interest in the Jackson’s Arm Property (within the Great Northern Project), the Company is required to make aggregate payments to MEK of $200,000 (of which $20,000 has been paid) in cash and 500,000 common shares of Anaconda (of which 50,000 have been issued) over a three-year period, with increasing payments on the anniversary of the date of the agreement. The Jackson’s Arm Agreement provides for a 2% NSR to MEK on the sale of gold-bearing mineral products from the Jackson’s Arm Property. The NSR is capped at $1,500,000, after which, the NSR will be reduced to 1%. Anaconda is required to spend a total of $750,000 in qualified exploration expenditures on the Jackson’s Arm Property during the option period.

ANACONDA MINING INC. MANAGEMENT’S DISCUSSION AND ANALYSIS
P a g e | 9
The Tilt Cove Property On November 8, 2016, Anaconda entered into an option agreement (the “Tilt Cove Agreement”) with MEK to acquire a 100% undivided interest in 350 hectares (the “Tilt Cove Property”) located 60 kilometres east of the Company’s Point Rousse Project within the Baie Verte Mining District. Option Agreement To earn a 100%-undivided interest in the Tilt Cove Property, the Company is required to make aggregate payments to MEK of $200,000 (of which $20,000 has been paid) in cash and 500,000 common shares of Anaconda (of which 50,000 have been issued) over a three-year period, with increasing payments on the anniversary of the date of the agreement. The Tilt Cove Agreement provides for a 1% NSR to MEK on the sale of gold-bearing mineral products from the Tilt Cove Property. Anaconda is also assuming an existing 2% NSR (the “Existing NSR”) on one of the two licenses that comprises the Tilt Cove Property. 1% of the Existing NSR is purchasable for $1,250,000. Anaconda is required to spend a total of $750,000 in qualified exploration expenditures on the Tilt Cove Property during the option period. Exploration The Company is pursuing a strategy to leverage the existing operating infrastructure at Point Rousse (Pine Cove Mill, tailings facilities and Port Rousse) by exploring and developing the mineral licenses and mining leases at all of its projects. Most recently, the Company has been working on expanding its resources at the Point Rousse and Viking Projects. It is not only attempting to increase overall resources and reserves, but also targeting potentially higher-grade deposits to blend with relatively lower grade ore found at the Pine Cove and Thor Deposits. In recent months, the Company refined its exploration strategy to focus on near-surface resource expansion as well as targeting relatively higher-grade mineral resources, compared to the Pine Cove Pit (1.8 g/t gold over the life of mine), at four main areas – Stog’er Tight, Argyle, Goldenville and Viking. The Company envisions creating an operating complex on the Ming’s Bight Peninsula and at Viking, with multiple pits and trucking the ore, or concentrate, back to the Pine Cove Mill to reach its goal of increasing annual production. Consistent with this strategy, for the second quarter of fiscal 2017, the Company made the following advances in exploration:
On September 20 and October 12, 2016, the Company announced drill results for the Argyle Project indicating the presence of a mineralized zone which extends to depth.
On October 27, 2016, the Company announced drill results from the Stog’er Tight area indicating the presence of mineralization to the west of the Stog’er Tight Deposit.
On November 8, 2016, the Company announced the acquisition of two new projects referred to as the Great Northern Project and the Tilt Cove Property, located on the Northern Peninsula and east of the Point Rousse Project, respectively.
On November 17, 2016, the Company announced the extension of the Thor Deposit within the Viking Project.
On December 13, 2016, the Company announced the commencement of a second phase of drilling at Argyle and Viking as well as reporting the results of drilling at Goldenville.
Since the acquisition of the Viking Project and, more recently, the Great Northern Project and the Tilt Cove Property, the Company has tripled the size of its land position to almost 20,000 hectares in a very tight, geographic area within striking distance of the Pine Cove Mill. The Long Range Fault and its secondary splays, which are the key structures shared by all of Anaconda’s projects, have similar geologic characteristics to other gold bearing structures within Newfoundland. These structures suggest there is great potential to find gold

ANACONDA MINING INC. MANAGEMENT’S DISCUSSION AND ANALYSIS
P a g e | 10
mineralization as evidenced by the existing deposits and gold occurrences on the Baie Verte and Northern Peninsulas. With growing understanding of the regional geology through the Company’s current Point Rousse and Viking Projects and an active mining operation in the region, Anaconda is well-positioned to expand resources and build a much larger, district production play. The Point Rousse Project During the course of Anaconda’s exploration and development efforts at the Point Rousse Project, three primary gold trends have been identified within the Point Rousse area - the Scrape, Goldenville and Deer Cove Trends, with a cumulative prospective strike length of approximately 20 kilometres. The Company’s recent exploration work, combined with historical results, has brought more clarity, understanding and confidence to the Company’s geological interpretations and models. The Company believes it has the potential to discover and develop additional deposits on the Ming’s Bight Peninsula. As a result, Anaconda believes that the Point Rousse Project area has the potential to host resources which could allow the Company to extend and/or increase production at the Pine Cove Mill. Below is a brief overview of the gold trends on the Ming’s Bight Peninsula and Anaconda’s exploration efforts within them, with specific reference to the Argyle Prospect, Stog’er Tight Deposit and Goldenville. The Scrape Trend The Scrape Trend consists of a belt of highly-prospective rocks approximately 7 kilometres long and approximately 1 to 2 kilometres wide. It begins southwest of the Pine Cove Pit and continues eastward to the community of Ming’s Bight. The Scrape Trend includes the Pine Cove and Stog’er Tight Deposits as well as the Romeo & Juliet, Anoroc and Animal Pond Prospects and a new discovery referred to as the Argyle Prospect. These gold occurrences align with a fault delineated by a topographic lineament. The Scrape Trend hosts deposits ranging in reserve and resource grades of up to 1.8 g/t and up to 3.59 g/t, respectively. The Argyle Prospect In August and September of 2016, the Company completed a 1,638-metre diamond drill program at the Argyle Prospect. The drill program intersected gold mineralization in 17 of the 22 holes drilled, from near-surface to a depth of approximately 70 metres. The results are highlighted by 6.09 g/t over 8.9 metres in hole AE-16-11 and 4.50 g/t over 6.3 metres in hole AE-16-06. The results of the Phase I drilling program indicate that the alteration zone hosting gold mineralization, dips shallowly northward at least 100 metres and along strike for 410 metres. Assays from the program indicate that gold mineralization occurs 33 metres vertically from surface and that the dip extends down to at least 80 metres. The alteration and mineralization zones are still open along strike and down-dip.
ANACONDA MINING INC. MANAGEMENT’S DISCUSSION AND ANALYSIS
P a g e | 11
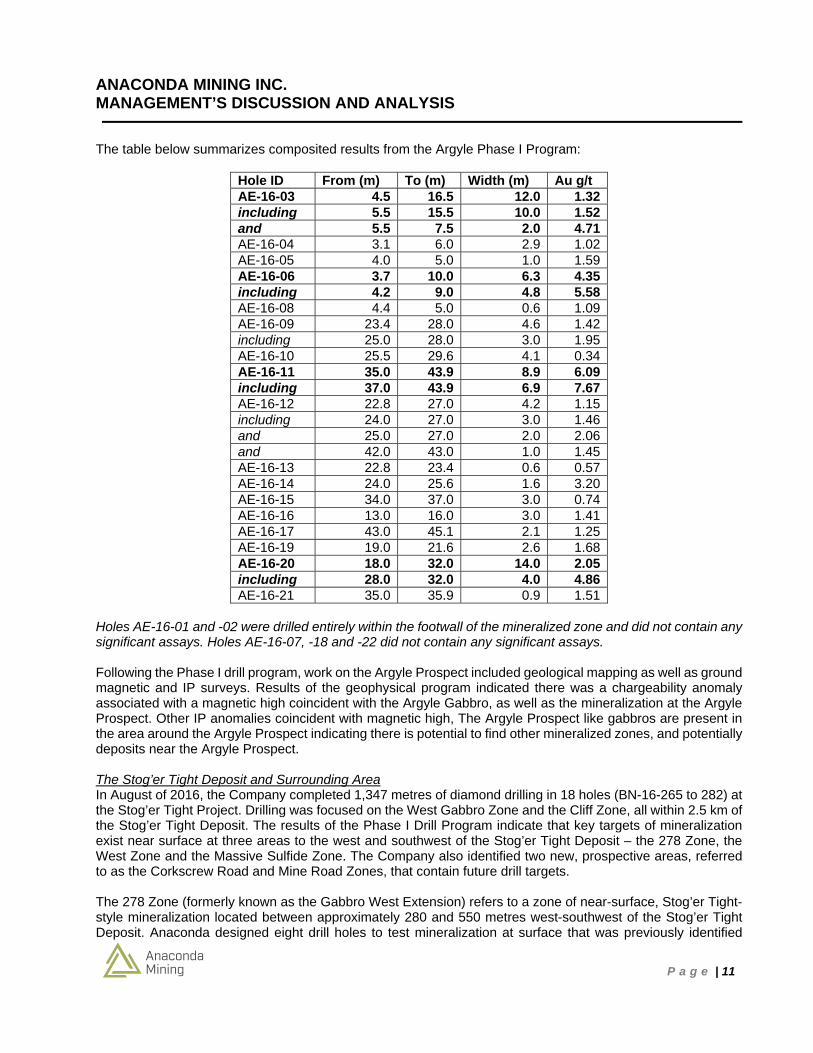
The table below summarizes composited results from the Argyle Phase I Program:
Hole ID From (m) To (m) Width (m) Au g/t AE-16-03 4.5 16.5 12.0 1.32 including 5.5 15.5 10.0 1.52 and 5.5 7.5 2.0 4.71 AE-16-04 3.1 6.0 2.9 1.02 AE-16-05 4.0 5.0 1.0 1.59 AE-16-06 3.7 10.0 6.3 4.35 including 4.2 9.0 4.8 5.58 AE-16-08 4.4 5.0 0.6 1.09 AE-16-09 23.4 28.0 4.6 1.42 including 25.0 28.0 3.0 1.95 AE-16-10 25.5 29.6 4.1 0.34 AE-16-11 35.0 43.9 8.9 6.09 including 37.0 43.9 6.9 7.67 AE-16-12 22.8 27.0 4.2 1.15 including 24.0 27.0 3.0 1.46 and 25.0 27.0 2.0 2.06 and 42.0 43.0 1.0 1.45 AE-16-13 22.8 23.4 0.6 0.57 AE-16-14 24.0 25.6 1.6 3.20 AE-16-15 34.0 37.0 3.0 0.74 AE-16-16 13.0 16.0 3.0 1.41 AE-16-17 43.0 45.1 2.1 1.25 AE-16-19 19.0 21.6 2.6 1.68 AE-16-20 18.0 32.0 14.0 2.05 including 28.0 32.0 4.0 4.86 AE-16-21 35.0 35.9 0.9 1.51
Holes AE-16-01 and -02 were drilled entirely within the footwall of the mineralized zone and did not contain any significant assays. Holes AE-16-07, -18 and -22 did not contain any significant assays. Following the Phase I drill program, work on the Argyle Prospect included geological mapping as well as ground magnetic and IP surveys. Results of the geophysical program indicated there was a chargeability anomaly associated with a magnetic high coincident with the Argyle Gabbro, as well as the mineralization at the Argyle Prospect. Other IP anomalies coincident with magnetic high, The Argyle Prospect like gabbros are present in the area around the Argyle Prospect indicating there is potential to find other mineralized zones, and potentially deposits near the Argyle Prospect. The Stog’er Tight Deposit and Surrounding Area In August of 2016, the Company completed 1,347 metres of diamond drilling in 18 holes (BN-16-265 to 282) at the Stog’er Tight Project. Drilling was focused on the West Gabbro Zone and the Cliff Zone, all within 2.5 km of the Stog’er Tight Deposit. The results of the Phase I Drill Program indicate that key targets of mineralization exist near surface at three areas to the west and southwest of the Stog’er Tight Deposit – the 278 Zone, the West Zone and the Massive Sulfide Zone. The Company also identified two new, prospective areas, referred to as the Corkscrew Road and Mine Road Zones, that contain future drill targets. The 278 Zone (formerly known as the Gabbro West Extension) refers to a zone of near-surface, Stog’er Tight-style mineralization located between approximately 280 and 550 metres west-southwest of the Stog’er Tight Deposit. Anaconda designed eight drill holes to test mineralization at surface that was previously identified

ANACONDA MINING INC. MANAGEMENT’S DISCUSSION AND ANALYSIS
P a g e | 12
through historical prospecting, geological mapping and limited diamond drilling. Of the eight drill holes, six intersected mineralization and alteration. The diamond drill results demonstrated that the 278 Zone extends at least 180 metres along strike and 80 metres down-dip from surface. The zone remains open to the southwest, and further drilling between widely spaced holes is warranted at shallow depths. Highlights of the Phase I Drilling Program testing the 278 Zone are shown below:
Hole ID From (m) To (m) Interval (m) Gold g/t
BN-16-276 29.0 33.0 4.0 1.13
BN-16-278 21.0 29.8 8.8 1.28
BN-16-279 49.9 52.9 3.0 3.81 The West Zone, which has been previously drilled (see press release of June 2, 2016) is adjacent to the Stog’er Tight Deposit and is thought to be the faulted offset and western extension of the deposit. Prior to the Phase I Drilling Program, the strike length and the dip extent of the West Zone (including the Gabbro Zone as reported on June 2, 2016) were approximately 100 metres and 130 metres, respectively. During the Phase I Drilling Program, Anaconda tested the extents of the West Zone with 8 diamond drill holes (BN-16-265 to BN-16-272), of which five holes intersected mineralization and alteration. The results of the program indicate that the mineralization within the West Zone extends farther westward, at least 50 metres along strike and at least 40 metres down-dip to the north. The West Zone now has a dip extent of approximately 150 metres and a strike extent of approximately 150 metres and is generally within 50 metres of surface. Between the West Zone and the Stog’er Tight Deposit, the combined strike length is approximately 550 metres. Highlights from Phase I Drilling Program for the West Zone are shown in the table below:
Hole ID From (m) To (m) Interval (m) Gold g/t
BN-16-265 28.7 33.0 4.3 1.20
BN-16-266 27.6 31.8 4.2 1.61
BN-16-269 47.7 49.5 1.8 3.93 The Massive Sulfide Zone is located approximately 250 metres west of the Stog’er Tight Deposit and is characterized by the presence of an iron formation, which is different than the typical gabbro hosted mineralization seen in other areas adjacent to the Stog’er Tight Deposit.
Anaconda tested the extent of the Massive Sulfide Zone with three diamond drillholes (BN-16-269 (top portion), -273, -277). The three holes, plus a fourth historic hole (BN-88-08) drilled in the area, intersected the iron formation with associated sulfides containing widths of 2.0 to 3.4 metres over a strike length of 150 metres near surface. Hole BN-88-08 intersected mineralization of 3.10 g/t over 1.0 metre and hole BN-16-273 intersected mineralization of 2.10 g/t over 1.3 metres.
More significantly, an iron formation trends northwesterly, for approximately a kilometre, away from the Stog’er Tight Deposit. Anaconda believes the iron formation trend, referred to as the Corkscrew Road Zone, may be the northwesterly continuation of the Massive Sulfide Zone. Based on historical data, the Corkscrew Road Zone is also host to a convergence of anomalous gold-in-soil anomalies and a series of chargeability anomalies. Coincident gold-in-soil and chargeability anomalies such as these are also characteristics of both the Pine Cove and Stog’er Tight Deposits. The Corkscrew Road Zone has not been previously drilled.
In addition, Anaconda has other prospective drill targets adjacent to the Stog’er Tight Deposit in an area referred to as the Mine Road Zone. It is characterized by the easterly continuation of a Stog’er Tight gabbro, which is coincident with a string of ground IP – chargeability anomalies. The Mine Road Zone has not previously been explored by drilling.

ANACONDA MINING INC. MANAGEMENT’S DISCUSSION AND ANALYSIS
P a g e | 13
A table showing all significant drill intersections from the overall Phase I Drilling Program are given below:
Hole ID From (m) To (m) Interval (m) Au g/t
BN-16-265 28.7 33.0 4.3 1.20
BN-16-266 27.6 31.8 4.2 1.61
BN-16-268 4.9 6.0 1.1 0.78
BN-16-269 31.0 32.0 1.0 0.89
and 47.7 49.5 1.8 3.93
and 53.5 54.5 1.0 1.00
BN-16-271 16.0 16.8 0.8 0.50
BN-16-273 53.0 54.3 1.3 2.10
BN-16-275 26.0 30.0 4.0 0.56
BN-16-276 29.0 33.0 4.0 1.13
BN-16-278 21.0 29.8 8.8 1.28
including 25.0 29.8 4.8 1.82
including 25.0 26.0 1.0 5.91
BN-16-279 49.9 52.9 3.0 3.81
BN-16-281 27.7 30.0 2.3 1.46 The Goldenville Trend The Goldenville Trend is an 8-kilometre long trend of highly prospective rocks centered on an iron stone unit referred to as the Goldenville Horizon. The Company believes the trend to be highly prospective because it is thought to contain ironstone hosted gold deposits including the Corkscrew Deposit optioned from Seaside. Mineralization within the Goldenville Trend is a well-established geological model and the region is known to host these deposits, such as the Nugget Pond Deposit, which produced approximately 166,000 ounces of gold at an average grade of approximately 11 g/t. The Goldenville Trend includes numerous gold prospects including four small, historical, hand-dug shafts, which were developed to mine visible gold. The Eastern Goldenville Trend Drilling
A drill program was conducted in the fall 2016 to test specific areas of the Goldenville ironstone in search of Nugget Pond-style mineralization. The Company completed 1,686 metres of diamond drilling at Goldenville in 14 drill holes. While intersecting several areas with characteristics like Nugget Pond, the program did not result in intersections of significant gold mineralization.
The gold deposit type sought is expected to have a relatively small footprint. During the recent program, approximately 10% of the prospective length of the Goldenville Trend was tested and locally the geological processes involved in forming deposits were observed. Building on knowledge gained through this program, the exploration model for this type of mineralization has been updated. Future work along the Goldenville Trend will make use of this knowledge and focus on other areas of interest associated with the Goldenville Horizon.
The Deer Cove Trend The Deer Cove Trend is located in the northern part of the Ming’s Bight Peninsula and consists of a belt of prospective rocks approximately 3.5 kilometres in strike length. It is associated with the Deer Cove thrust fault and includes the Deer Cove Deposit as well as various other showings and prospects. Historical drill results suggest that the Deer Cove Deposit could be a source of high-grade feed for the Pine Cove Mill. No significant exploration field work was conducted during the first half of fiscal 2017.

ANACONDA MINING INC. MANAGEMENT’S DISCUSSION AND ANALYSIS
P a g e | 14
Future Plans Immediate exploration plans at Point Rousse are focused on the Argyle Prospect where the Company is attempting to delineate a new deposit. Based on surface expressions, the mineralization appears to be similar in style and geological setting to the Stog’er Tight Deposit. Initial drill results indicate that mineralization extends at depth. Future work on the Argyle Prospect will include additional drilling and geologic modelling of the results of the Phase I Drill Program. The Viking Project On February 10, 2016, the Company announced it had acquired the Viking Project, which contains the Thor Deposit and adjacent, contiguous prospective geology. Viking is located near the communities of Pollards Point and Sop's Arm in White Bay, Newfoundland and Labrador, approximately 180 km by road (100 km by barge) from Point Rousse, and is accessible via a 2.5 km forest road from provincially-maintained paved road networks. The Viking Project encompass 6,225 hectares of highly-prospective mineral lands. The Thor Deposit1 contains a mineral resource estimate as summarized below:
Resource Category Cut-off (g/t) Tonnes Grade (g/t) Ounces of gold (Au) Indicated 0.5 1,847,000 1.42 83,000 Inferred 0.5 847,000 1.15 31,000
The Viking Project is the first step out from the Point Rousse Project and adds significant resources to the Company’s portfolio within striking distance of the Pine Cove Mill. The intent of the Company is to process any ore mined from this project at the Pine Cove Mill. Beyond the historical Indicated and Inferred Mineral Resources at the Viking Project, the Company is encouraged by the overall gold-bearing potential of the project. During the second quarter of fiscal 2017, the Company continued its Phase I Exploration Program, which was focused on three general target areas: the north and south strike extensions of the Thor Deposit, Thor’s Cross and the Viking Trend, with the primary goal of discovering new resources at the Viking Project. The program consisted of a review of previously drilled core and geochemical characterization of the Thor Deposit, geological mapping, 4,136 metres of diamond drilling and the reprocessing of historic magnetic and ground IP geophysical data. Anaconda was successful in extending the strike length of the Thor Deposit and outlined broad zones of mineralization at the Viking Trend along with discovering new mineralization at Thor’s Cross. The Viking Trend and Thor’s Cross also contained localized high-grade intersections. Highlights of the Phase I Exploration Program include:
Gold bearing alteration zones intersected in 21 of 27 drill holes illustrating a widespread mineralizing system present at Viking;
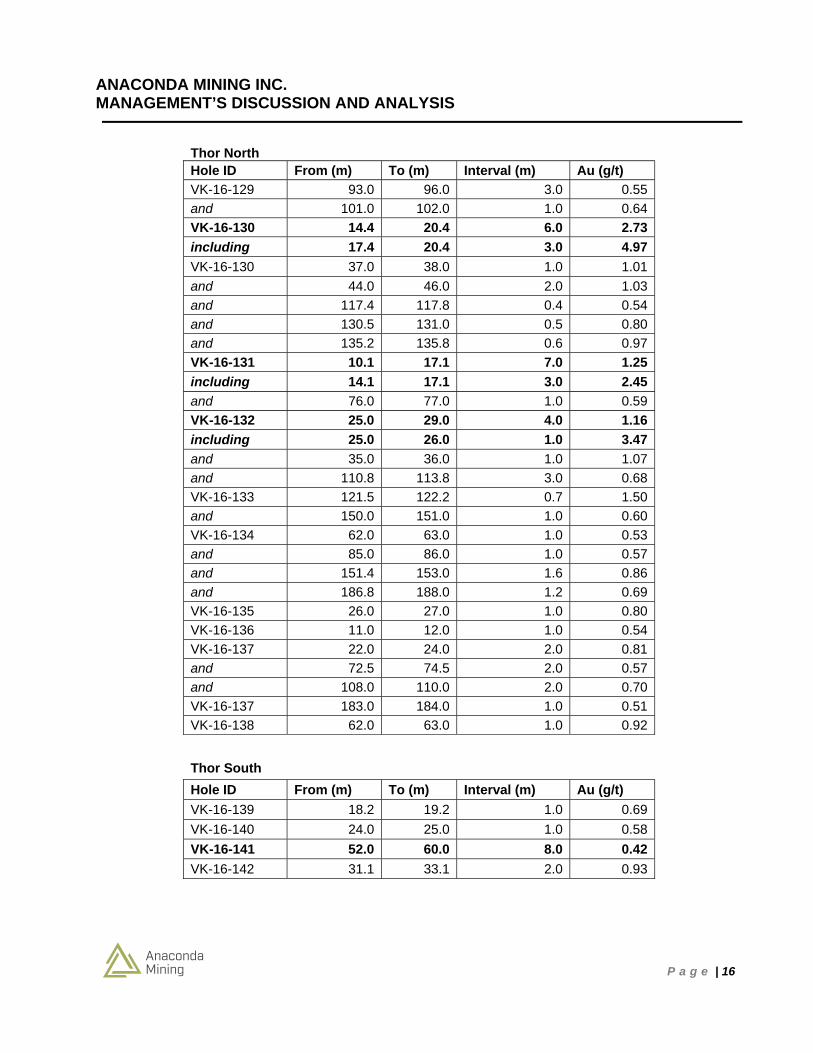
Extending the Thor Deposit 100 metres north along strike, for a total of 650 metres of strike length, at shallow depths, as demonstrated by 2.73 g/t gold over 6.0 metres in hole VK-16-30, 1.25 g/t gold over 7.0 metres in hole VK-16-31, and 1.16 g/t gold over 4.0 metres in hole VK-16-132;
Intersecting a 40 to 80-metre-wide zone of very intense alteration and broad zones of gold mineralization that characterize the Viking Trend as exemplified by 0.45 g/t gold over 20 metres in hole VK-16-151 and 0.37 g/t gold over 16.5 metres in an historic drill hole VK-11-125, as well as local high grades as indicated by 7.43 g/t gold over 1.0 metre in hole VK-16-155;
Determining that Thor’s Cross is an area at least 100 metres in strike length, characterized by a 20-metre-wide zone of alteration and gold mineralization coincident with a fault structure as demonstrated by 0.78 g/t gold over 10.3 metres in hole VK-16-144, 0.42 g/t gold over 8.0 metres in hole VK-16-141 and 0.45 g/t gold over 7.9 metres in hole VK-16-143, as well as local high grades as indicated by 9.93 g/t gold over 0.3 metres in hole VK-16-148, and;

ANACONDA MINING INC. MANAGEMENT’S DISCUSSION AND ANALYSIS
P a g e | 15
Fingerprinting of the key geochemical, geophysical and structural characteristics of the Thor Deposit and developing new, refined drill targets based on the fingerprint characteristics. Follow-up drilling will focus on new targets at the Viking Trend and south of the Thor Deposit as well as at the Asgard/Kramer Trend where significant gold mineralization is associated with a quartz veining and the quartzite unit exemplified by historic drill holes – 1.12 g/t gold over 20 metres in hole KR-10-07 and 1.50 g/t gold over 14.0 metres in hole KR-10-07.
The Phase I Diamond Drill results confirm a widespread mineralized system exists throughout the areas of the Viking Project that have been tested by the Company. There are broad zones of lower-grade mineralization along with narrow zones of higher-grade mineralization. In addition, historic drill results reaffirm this notion in similar areas and areas that have not yet been drilled by Anaconda. It’s significant because it demonstrates that the gold mineralization process is occurring over a wide area, which raises the potential of finding additional mineral resources. The tables below contain certain current and historic diamond drill results from selected areas that illustrate the occurrence of varying gold tenor over a large area.
The Viking Trend
Hole ID From (m) To (m) Interval (m) Au (g/t) Age of Core
VK-16-154 48.0 68.0 20.0 0.45 Current
VK-16-155 36.0 37.0 1.0 7.43 Current
VK-11-125 12.5 29.0 16.5 0.37 Historic
VK-10-88 2.6 29.3 26.7 0.29 Historic
SM-89-01 30.1 35.4 5.3 0.56 Historic
The Asgard/Kramer Trend
Hole ID From (m) To (m) Interval (m) Au (g/t) Age of Core
KR-13-17 19.2 20.2 1.0 13.21 Historic
KR-10-07 53.5 73.6 20.1 1.12 Historic
KR-10-08 66.9 81.3 14.4 1.50 Historic
KR-10-14 27.8 39.5 11.7 1.04 Historic
Through the Phase I Exploration Program and incorporating previous work, the Company has outlined a broad area of alteration and gold mineralization associated with structures adjacent to the Doucer’s Valley Fault, which is almost six kilometres long. These features are a key indicator for the presence of large orogenic gold deposits. Anaconda is focused on finding the key areas, like the Thor Deposit, within this broad gold-bearing system.
ANACONDA MINING INC. MANAGEMENT’S DISCUSSION AND ANALYSIS
P a g e | 16
Thor North Hole ID From (m) To (m) Interval (m) Au (g/t)
VK-16-129 93.0 96.0 3.0 0.55
and 101.0 102.0 1.0 0.64
VK-16-130 14.4 20.4 6.0 2.73
including 17.4 20.4 3.0 4.97
VK-16-130 37.0 38.0 1.0 1.01
and 44.0 46.0 2.0 1.03
and 117.4 117.8 0.4 0.54
and 130.5 131.0 0.5 0.80
and 135.2 135.8 0.6 0.97
VK-16-131 10.1 17.1 7.0 1.25
including 14.1 17.1 3.0 2.45
and 76.0 77.0 1.0 0.59
VK-16-132 25.0 29.0 4.0 1.16
including 25.0 26.0 1.0 3.47
and 35.0 36.0 1.0 1.07
and 110.8 113.8 3.0 0.68
VK-16-133 121.5 122.2 0.7 1.50
and 150.0 151.0 1.0 0.60
VK-16-134 62.0 63.0 1.0 0.53
and 85.0 86.0 1.0 0.57
and 151.4 153.0 1.6 0.86
and 186.8 188.0 1.2 0.69
VK-16-135 26.0 27.0 1.0 0.80
VK-16-136 11.0 12.0 1.0 0.54
VK-16-137 22.0 24.0 2.0 0.81
and 72.5 74.5 2.0 0.57
and 108.0 110.0 2.0 0.70
VK-16-137 183.0 184.0 1.0 0.51
VK-16-138 62.0 63.0 1.0 0.92
Thor South
Hole ID From (m) To (m) Interval (m) Au (g/t)
VK-16-139 18.2 19.2 1.0 0.69
VK-16-140 24.0 25.0 1.0 0.58
VK-16-141 52.0 60.0 8.0 0.42
VK-16-142 31.1 33.1 2.0 0.93

ANACONDA MINING INC. MANAGEMENT’S DISCUSSION AND ANALYSIS
P a g e | 17
Thor's Cross
Hole ID From (m) To (m) Interval (m) Au (g/t)
VK-16-143 8.5 16.4 7.9 0.45
and 20.5 21.0 0.5 0.66
VK-16-144 30.0 40.3 10.3 0.78 including 37.3 40.3 3.0 1.22 and 42.9 45.4 2.5 0.49 and 49.4 50.4 1.0 0.53 and 55.6 57.6 2.0 0.49 VK-16-145 29.8 39.8 10.1 0.49 and 47.8 50.1 2.3 0.50 and 81.0 84.0 3.0 0.94 VK-16-146 49.0 51.0 2.0 0.56 and 89.0 90.7 1.7 1.09 and 97.0 99.0 2.0 0.53 VK-16-148 96.1 96.4 0.3 9.93 VK-16-149 6.0 8.0 2.0 1.73 and 79.0 80.0 1.0 0.84 and 123.8 125.0 1.2 0.89 and 145.0 146.0 1.0 1.13 and 156.0 157.0 1.0 0.50 and 158.0 162.0 4.0 0.47
The Viking Trend
Hole ID From (m) To (m) Interval (m) Au (g/t)
VK-16-150 34.0 38.0 4.0 0.47
VK-16-151 28.0 28.9 0.9 0.62
and 30.0 32.0 2.0 0.85
VK-16-151 89.0 92.0 3.0 0.51
and 94.8 96.0 1.2 0.50
VK-16-152 75.0 78.0 3.0 0.60
and 91.0 92.0 1.0 0.67
VK-16-153 27.5 28.5 1.0 0.53
VK-16-154 48.0 68.0 20.0 0.45
including 49.0 50.7 1.7 2.42
VK-16-155 8.0 9.0 1.0 0.61
and 36.0 37.0 1.0 7.43
and 45.0 46.0 1.0 0.65

ANACONDA MINING INC. MANAGEMENT’S DISCUSSION AND ANALYSIS
P a g e | 18
The Viking Project is located along the Doucer’s Valley Fault, part of the Long Range fault system, which is a significant geological control on as many as nine gold deposits, which collectively include millions of ounces of gold. The Doucer’s Valley Fault is considered integral in the formation of gold deposits, including Anaconda’s Thor Deposit (83,000 ounces Indicated and 31,000 ounces Inferred Resources1) and the Rattling Brook Deposit (495,000 ounces Inferred Resources2) which are hosted within the same rocks adjacent to the Doucer’s Valley Fault and approximately 20 kilometres from one another. The regional geological setting, along with the known deposits and specific exploration results at Viking, suggest the potential to delineate additional mineral resources throughout the project area.
Based on the results of the Phase I Drill Program, the Company initiated a soil sampling and ground magnetic and IP survey to identify key targets consistent with the characteristics of the Thor Deposit. Following the completion of these programs, the Company recently completed a second phase of drilling at its Viking Project to test several exploration targets including the Viking Trend, Thor South and the Whiskey Jack showing within the Asgard Trend. The program consisted of 1,151 metres of diamond drilling in 6 drill holes. Samples from this program have been submitted for assay and the results are expected in January 2017.
Future Exploration Plans Future exploration plans at Viking will be based on the final results of the Phase 2 Drill Program. The Great Northern Project In November 2016, the Company made significant property acquisitions on the Northern Peninsula, 20 kilometres north of its Viking Project, where it acquired a 100%-undivided interest in 1,325 hectares and staked 5,050 hectares of contiguous mineral lands, totaling 6,375 hectares, collectively referred to as the Great Northern Project.
Key exploration highlights
The Great Northern Project is located near the community of Jackson’s Arm, Newfoundland, and is centred along the Doucer’s Valley Fault, a regional splay off the Long Range Fault. It boasts several gold prospects and showings, including the Shrik, Stocker, Boot N’ Hammer and 954 Prospects and the Incinerator Trail Zone. Surface grab samples assaying up to 20.2 g/t gold and 1,232.0 g/t silver at the Boot N’ Hammer Prospect; up to 56.7 g/t gold and 2.75 ounces per tonne silver at the Stocker Prospect; up to 7.2 g/t gold at the Shrik Prospect; and 13.6 g/t gold at the 954 Prospect. The Incinerator Trail Zone has been tested by four reconnaissance-style diamond drill holes in the 1980’s and returned gold assays of 1.78 g/t over 4.00 metres (hole RB-35) and 2.30 g/t gold over 4.05 metres (hole RB-41).
Anaconda conducted a field program on the Great Northern Project in the fall of 2016, which included geological mapping of existing prospects and surrounding areas and the development of drill targets.
Exploration plans Future exploration plans for the Great Northern Project include a digital compilation of all historical exploration data, geological mapping and development of a detailed exploration plan.
Tilt Cove Property
Anaconda has also entered into an option agreement with MEK to acquire a 100%-undivided interest in 350 hectares located within the Baie Verte Mining District, near the community of La Scie, Newfoundland, approximately 60 kilometres by road from the Company’s Pine Cove Mill. The Tilt Cove Property sits within the Nugget Pond Horizon, which is characterized by the same geological environment as the Goldenville Horizon, part of the Point Rousse Project. The Nugget Pond Horizon is an iron formation that hosted the historical high-grade-gold Nugget Pond Mine, which produced 166,000 ounces of gold with an average grade of approximately 11 g/t. The Tilt Cove Property has several occurrences with high-grade gold grab samples from prospecting

ANACONDA MINING INC. MANAGEMENT’S DISCUSSION AND ANALYSIS
P a g e | 19
including 69.38 g/t gold from the Scarp Zone, 13.47 g/t gold from the Shaft Zone and 6.02 g/t gold from the Road showing.
The area in which the Tilt Cove Property is located is also host to several historical (1864-1967) open pit and underground copper mines. Gold is typically associated with copper mineralization and several of the historic copper deposits require follow-up testing for gold potential. A stockpile of gold-bearing ore from historical mining, estimated at 30,000 tonnes, is located on the Tilt Cove Property.
Near‐term exploration plans Immediate exploration plans at the Tilt Cove Property will include a thorough review and compilation of all historical data and field investigations to determine the highest priority drill targets and metallurgical test work on the stockpile.
1Resource taken from the NI 43-101 Technical Report for the Viking Project entitled “NI 43-101 Technical Report and Mineral Resource Estimate on the Thor Deposit, Viking Project, White Bay Area, Newfoundland and Labrador, Canada” with an effective date of August 29, 2016” and using a cut off grade of 0.5 g/t.
2Resource taken from the NI 43-101 Technical Report for the Jackson’s Arm Project entitled “TECHNICAL REPORT ON MINERAL RESOURCE ESTIMATE FOR JACKSON’S ARM GOLD PROJECT WHITE BAY AREA NEWFOUNDLAND AND LABRADOR, Latitude 49o 53’ 2.65’’North, Longitude 56 o 50’ 7.09’’ West”, with an effective date of April 20th, 2009. Prepared For: Kermode Resources Ltd. by Mercator Geological Services Limited.
The information contained within the exploration section above has been reviewed and approved by Paul McNeill, P. Geo., VP Exploration with Anaconda Mining Inc., a "Qualified Person", under National Instrument 43-101 Standard for Disclosure for Mineral Projects. Results of operations For the three months ended November 30, 2016 Revenue For the three months ended November 30, 2016, the Company generated $7,411,279 in revenue, a 9% increase from the three months ended November 30, 2015. The comparatively higher revenue was primarily a result of a 14% increase in realized gold price from $1,476 to $1,689 per ounce sold. Cost of sales and gross margin For the three months ended November 30, 2016, cost of sales was $6,178,674, yielding a gross margin of $1,232,605 compared to the same period in fiscal 2016, which generated cost of sales of $5,462,305, yielding a gross margin of $1,335,770. Gross margin was negatively impacted as a result of comparatively higher milling costs of $333,843, mining costs of $282,407 and depletion and depreciation expense of $138,538. This was partially offset by higher gold sales of $613,204. Milling costs were higher due to increased mill maintenance and laboratory expenses. The increase in mining costs were driven by the increase in tonnes mined during the three months ended November 30, 2016, compared to the same period in fiscal 2016. Depletion and depreciation expense increased due to unit-of-production expenses related to a change in reserve base. Administrative expenses Corporate administration expenses consist of consulting/professional fees, corporate salaries/benefits, office and general expenses, travel and regulatory related costs. For the three months ended November 30, 2016, administrative expenses totaled $665,659 compared to $546,286 in the similar period of fiscal 2016. The increases in corporate expenses are associated with the Company’s continued public relations/awareness campaign, due diligence costs and accrued personnel costs.

ANACONDA MINING INC. MANAGEMENT’S DISCUSSION AND ANALYSIS
P a g e | 20
Finance expense Finance expenses of $65,881 include costs related to the Auramet gold financing agreement and costs associated with the surety bond for the decommissioning liability. Other revenue Other revenue of $398,856 relates to the Aggregates Venture during the three months ended November 30, 2016, compared to $nil for the similar fiscal period in fiscal 2016. Net income Net income for the three months ended November 30, 2016, was $723,181 compared with net income for the three months ended November 30, 2015, of $766,040. The decrease in net income is largely due to a decrease in gross margin of $103,165, an increase in corporate administration of $119,373 and an increase of deferred tax expense of $220,000 which was partially offset by other revenue of $398,856. For the six months ended November 30, 2016 Revenue For the six months ended November 30, 2016, the Company generated $12,331,016 in revenue at an average sales price of $1,688 per ounce. Revenue and gold ounces sold decreased by 2% and 15% respectively from the same period in fiscal 2016. Gold sales volume was down significantly because of a 22% decrease in grade over the comparative periods. Revenue was only slightly down because the lower sales volume was offset by higher realized gold price. Cost of sales and gross margin For the six months ended November 30, 2016, cost of sales was $10,734,796 yielding a gross margin of $1,596,220 compared to the same period in fiscal 2016, which generated a cost of sales of $10,839,106, yielding a gross margin of $1,744,770. The lower gross margin during the six months ended November 30, 2016 relative to the same period in fiscal 2016 is attributed to lower gold sales of $252,860 and higher milling costs of $403,873, offset by lower mining costs of $507,926. Incremental milling costs are largely a result of increased maintenance and laboratory expenses. Mining costs decreased due to inventory adjustments for stockpiles which have increased as at November 30, 2016 compared to the same period in fiscal 2016. Administrative expenses Corporate administration expenses consist of consulting/professional fees, corporate salaries/benefits, office and general expenses, travel and regulatory related costs. For the six months ended November 30, 2016, administrative expenses totaled $1,321,603 compared to $1,043,430 for the same period in fiscal 2016. Corporate expenses have increased because of a larger investment in public and investor relations, as well as higher accrued personnel costs. Other expenses Other expenses for the six months ended November 30, 2016, were $30,664 compared to $41,794 in the similar period of fiscal 2016 to record accounting and legal costs associated with the Company’s Chilean iron ore assets. Net income Net income for the six months ended November 30, 2016, was $343,616 compared with net income for the six months ended November 30, 2016 of $581,121. The change in net income is due to a decrease in gross margin of $148,550, an increase in corporate administration of $278,173 and an increase of deferred tax expense of $201,000 which was partially offset by other revenue of $398,856.

ANACONDA MINING INC. MANAGEMENT’S DISCUSSION AND ANALYSIS
P a g e | 21
Exploration and evaluation assets For the six months ended November 30, 2016, the Company spent $2,015,451 at Point Rousse and Viking on exploration. The Company's exploration initiatives included publishing an NI 43-101 Technical Report on the Viking Project, diamond drilling and other exploration activities at Stog’er Tight, Argyle, Goldenville and Viking as well as personnel costs. Summary of quarterly results
November 30 August 31 May 31 February 292016 2016 2016 2016
$ $ $ $Total assets 33,262,888 32,217,230 30,870,912 28,828,238 Decommissioning liability 1,888,961 1,878,430 1,867,899 1,356,438 Loans 719,359 424,754 409,447 399,265 Shareholders’ equity 26,132,574 25,337,012 23,855,707 23,688,886 Total revenues 7,411,279 4,919,737 6,789,532 4,988,063 Net income (loss) 723,181 (379,565) 238,325 (623,997)
Net income (loss) per share - basic1 0.003 (0.002) 0.001 (0.003)
Net income (loss) per share - fully-diluted1
0.003 (0.002) 0.001 (0.003)
November 30 August 31 May 31 February 282015 2015 2015 2015
$ $ $ $Total assets 29,102,166 27,661,563 27,721,558 27,214,596 Decommissioning liability 1,341,423 1,316,435 1,311,393 1,297,035 Loans 179,231 62,844 42,404 47,167 Shareholders’ equity 24,143,732 23,291,111 23,395,221 22,691,978 Total revenues 6,798,075 5,785,801 5,657,526 6,266,754 Net income (loss) 766,040 (184,919) 685,340 (114,122)
Net income (loss) per share - basic1 0.004 (0.001) 0.004 (0.001)
Net income (loss) per share - fully-diluted1
0.004 (0.001) 0.004 (0.001) 1 In periods of loss, net loss per share basic and fully-diluted are the same, as inclusion of options and/or warrants would be anti-dilutive. Liquidity, working capital and capital resources As at November 30, 2016, the Company had cash and cash equivalents of $480,210 (May 31, 2016 - $1,636,161) and net working capital of $1,752,360 (May 31, 2016 – $819,322), an accumulated deficit of $9,688,463 (May 31, 2016 - $10,042,429) and positive cash flow from operations for the six months ended November 30, 2016, of $1,894,034 (six months ended November 30, 2015 – $1,988,097). The Company’s principal source of cash during the periods were sales of gold production from Point Rousse and the completion of a $2,037,265 flow-through financing in July 2016. The Company’s primary uses of cash include cash costs of gold production, capital expenditures and exploration and acquisition costs. Anaconda’s

ANACONDA MINING INC. MANAGEMENT’S DISCUSSION AND ANALYSIS
P a g e | 22
ability to continue to grow its business is dependent on its ability to continue to generate cash from its primary sources in excess of its primary uses.
Operating activities During the six months ended November 30, 2016, the Company generated cash flow from operations of $1,857,353. Trade and other receivables increased by $396,445, HST recoverable decreased by $208,400, prepaid expenses and deposits increased by $60,119, inventory balances increased by $1,222,164 (as a result of timing of gold dore sales and larger stockpiles of ore) and trade and other payables increased by $197,359. Investing activities Changes to investing activities during the six months ended November 30, 2016, were:
Additions to property, mill and equipment of $1,496,493 including tailings facility, polishing pond construction and permitting/legal fees associated with the Aggregates Venture;
Additions to exploration and evaluation assets of $2,015,451 related to exploration programs, and; Additions to production stripping assets of $1,283,856.
Financing activities During the six months ended November 30, 2016, the Company received cash of $2,037,265 in proceeds from a flow-through financing agreement of which $246,372 was paid for issuance costs. Government loans of $450,000 were also received. Bank loans were repaid in the amount of $3,862, $19,860 was repaid on two capital leases and $16,800 was repaid on government loans. A $454,556 change in unearned revenue was recognized related to a gold financing agreement. As at November 30, 2016, the capital structure of the Company consisted primarily of all the components of shareholders' equity and loans. To adjust or maintain its capital structure, the Company may adjust the amount of any of its debt through repayment, or may enter into new credit facilities or issue new common shares. The Company has payment requirements against outstanding accounts payable and accrued liabilities of $4,307,236 as at November 30, 2016. In addition, the Company has a bank loan, two government loans and two capital leases. Remuneration of key management and transactions with related parties Key management personnel include the members of the Board of Directors, the President/ Chief Executive Officer (“CEO”) and the Chief Financial Officer (“CFO”). Compensation of key management personnel (including directors) was as follows: For the six months ended November 30 November 30
2016 2015 $ $
Salaries and short term benefits 1 365,318 326,767
Share based payments 2 75,364 110,100 440,682 436,867
1 Includes salary, management bonus, benefits and directors’ fees 2 Includes share based payments vested during the period As at November 30, 2016, included in trade and other payables is $33,000 (November 30, 2015 - $48,750) of amounts due for directors’ fees.
ANACONDA MINING INC. MANAGEMENT’S DISCUSSION AND ANALYSIS
P a g e | 23
Capital management and off statement of financial position transactions The Company’s capital structure is adjusted based on management and the Board of Directors’ decision to fund expenditures, outside of operating cash flow, with the issuance of debt or equity such that it may complete the acquisition, exploration and development of properties for the mining of minerals that are economically recoverable. The Board of Directors does not establish quantitative return on capital criteria, but rather relies on the expertise of management and other professionals to sustain future development of the business. The Company would supplement its operating cash flow and raise funds externally as and when required to finance obligations or complete projects. There is no assurance that the Company will be able to raise additional funds on reasonable terms. The sources of future funds available to Anaconda are cash flow from operations, the exercise of outstanding stock options and/or warrants, the sale of equity capital of the Company, the issuance of further loans and/or debentures or the sale by Anaconda of an interest in any of its properties in whole or in part. The ability of the Company to arrange such financing in the future will depend in part upon the prevailing capital market conditions, as well as the business performance of the Company. There can be no assurance that Anaconda will be successful in its efforts to arrange additional financing, if needed, on terms satisfactory to the Company. Management reviews its capital management approach on an ongoing basis and believes that this approach, given the relative size of the Company, is reasonable. There were no changes in the Company’s approach to capital management during the six months ended November 30, 2016. The Company is not subject to externally-imposed capital restrictions. Critical accounting policies and estimates Significant accounting judgments and estimates The preparation of these Financial Statements requires management to make judgements and estimates and form assumptions that affect the reported amounts of assets and liabilities at the date of the Financial Statements and reported amounts of revenues and expenses during the reporting period. On an ongoing basis, management evaluates its judgements and estimates in relation to assets, liabilities, revenue and expenses. Management uses historical experience and various other factors it believes to be reasonable under the given circumstances as the basis for its judgements and estimates. Actual outcomes may differ from these estimates under different assumptions and conditions. The most significant estimates relate to asset retirement obligations, the useful lives of property, mill and equipment, life of the Point Rousse and Viking Reserves and Resources as they impact depletion expense, recoverability of property, mill and equipment, exploration and evaluation assets, profitability of future operations as impacting realization of tax losses and the valuation of share-based payments. The most significant judgements relate to meeting recognition criteria of deferred tax assets and liabilities, assessment of the going concern assumption and the determination of the technical feasibility and the economic viability of a project impacting asset classification. Estimated recoverable reserves and resources The information relating to the geological data on the size, depth and shape of the ore body requires complex geological judgments to interpret the data. Cost estimates are based on feasibility study estimates or operating history. Estimates are prepared by appropriately qualified persons, but will be affected by forecasted commodity prices, inflation rates, exchange rates, capital and production costs and recoveries amongst other factors. Changes in reserve and resource estimates may impact the carrying value of property, plant and equipment, goodwill, reclamation and remediation obligations, recognition of deferred tax amounts and depreciation, depletion and amortization.
ANACONDA MINING INC. MANAGEMENT’S DISCUSSION AND ANALYSIS
P a g e | 24
Exploration and evaluation assets Exploration and evaluation assets consist of costs associated with the Company’s exploration properties. Exploration and evaluation costs include:
• Acquisition and leasehold/preservation costs of exploration properties; • Gathering exploration data through topographical and geological studies; • Exploratory drilling, trenching and sampling; • Determining the volume and grade of the resource; • Test work on geology, metallurgy, mining, geotechnical and environmental, and; • Conducting engineering, marketing and financial studies.
Exploration and evaluation costs are capitalized as incurred and deferred until management establishes the technical feasibility and commercial viability of a property with proven and/or probable reserves and commences permitting and development at which point the associated carrying costs are reclassified to property, mill and equipment as property. Upon disposal or abandonment of exploration and evaluation assets, the carrying costs are derecognized and a gain/loss is recorded in operations. Development costs and commercial production Development costs are capitalized during permitting and mine construction. Commercial production is achieved and capitalization of costs incurred ceases when the property’s operating metrics, as defined in its operating plan, are met. The operating plan costs incurred to maintain commercial production are included in mine operating costs. Property, mill and equipment Property, mill and equipment (“PME”) are stated at cost less accumulated depreciation and accumulated impairment losses. The cost of an item of PME consists of the purchase price, any costs directly attributable to bringing the asset to the location and condition necessary for its intended use. Interest and amortization related to equipment used for exploration is capitalized. Assets in the course of construction are capitalized as construction in progress. On completion, the cost of construction is transferred to the appropriate category of PME, and depreciation will commence when the asset is available for its intended use. Depletion and depreciation are provided at rates calculated to write off the cost of PME, less their estimated residual value, using the declining balance method or unit‐of‐production (“UOP”) method over the following expected useful lives:
Equipment 20% Property and mill units-of-production
Equipment and leasehold improvements are recorded at cost and are amortized on a straight-line basis over their estimated useful life, estimated at between 2 and 5 years. PME at Point Rousse are depleted over the expected life of the mine using the UOP method for determining depreciation, depletion and amortization. The expected useful lives used in the UOP calculations are determined based on the facts and circumstances associated with the mineral interest and is the portion of Mineral Resources considered to be probable of economic extraction. The Company conducts an annual assessment of the residual balances, useful lives and depreciation methods being used for PME and any changes arising from the assessment are applied by the Company prospectively. The expected useful life used in determining UOP does not exceed the estimated life of the ore body based on recoverable ounces to be mined. Any changes in estimates of useful lives are accounted for prospectively from the date of the change.
ANACONDA MINING INC. MANAGEMENT’S DISCUSSION AND ANALYSIS
P a g e | 25
Where an item of PME comprises major components with different useful lives, the components are accounted for as separate items of PME. Expenditures incurred to replace a component of an item of PME that is accounted for separately, including major inspection and overhaul expenditures, are capitalized. Impairment of non-current assets At each date of the statement of financial position, the Company reviews the carrying amounts of its tangible and intangible non-current assets to determine whether events or changes in circumstances indicate that the carrying value may not be recoverable. If any such indication exists, the recoverable amount of the asset is estimated in order to determine the extent of the impairment loss (if any). The estimated recoverable amount is determined on an asset by asset basis, except where such assets do not generate cash flows independent of other assets, in which case the recoverable amount is estimated at the cash generating unit ("CGU") level. The recoverable amount is the higher of fair value less costs to sell and value in use. In assessing value in use, the estimated future cash flows are discounted to their present value using a pre‐tax discount rate that reflects current market assessments of the time value of money and the risks specific to the asset. If the recoverable amount of an asset (or CGU) is estimated to be less than its carrying amount, the carrying amount of the asset (or CGU) is reduced to its recoverable amount. An impairment loss is recognized immediately in the statement of comprehensive income, unless the relevant asset is carried at a re-valued amount, in which case the impairment loss is treated as a revaluation decrease. Where an impairment loss subsequently reverses, the carrying amount of the asset (or CGU) is increased to the revised estimate of its recoverable amount, but so that the increased carrying amount does not exceed the carrying amount that would have been determined had no impairment loss been recognized for the asset (or CGU) in prior years. Depletion and amortization Property and mill are recorded at cost and amortized using the UOP basis and the calculated amounts will be charged to the income statement over the useful life of the mine. Production stripping costs are recorded at cost when mining activities yield a strip ratio above the life of mine strip ratio and are amortized on a “units-of-mine-production” when mining activities yield a strip ratio below the life of mine strip ratio. Office furniture, fixtures and equipment and leasehold improvements are recorded at cost and are amortized on a declining-balance basis at a rate of 20% per year. Fair value of the warrants issued with common shares Proceeds from unit placements are allocated between shares and warrants issued using the residual method to determine the fair value of warrants issued. Proceeds are first attributed to the shares according to the fair market value at the time of issuance and any residual amount is allocated to the warrants. Fair value of the warrants issued to brokers The Company uses the fair value method based on the Black-Scholes pricing model to determine the fair value of the warrants issued to brokers and record a debit in share issue expenses with a corresponding credit to warrants. Dividends The Company has neither declared nor paid any dividends on its common shares. The Company intends to retain its earnings, if any, to finance growth and expand its operation and does not anticipate paying any dividends on its common shares in the foreseeable future.
ANACONDA MINING INC. MANAGEMENT’S DISCUSSION AND ANALYSIS
P a g e | 26
Risks and uncertainties Readers should consider carefully the following risks and other information included in the Company’s historical consolidated financial statements and related notes. The risks below are not the only ones facing the Company. Additional risk factors may be found in the Company’s other public filings on SEDAR at www.sedar.com. As well, risks not currently known to the Company, or that the Company currently deems immaterial, may also impair the Company’s operations. If any of the following risks actually occur, the Company’s business, financial condition and operating results could be adversely affected. As a result, the trading price of the Company’s outstanding shares could decline and investors could lose part or all of their investment. Financial risks Credit risk is the risk of loss associated with a counter-party’s inability to fulfill its payment obligations. The credit risk is primarily attributable to cash, trade and other receivables, HST recoverable, and prepaid expenses and deposits. Cash is held with a tier-1 Canadian chartered bank and as such management believes the risk of loss to be minimal. Trade and accounts receivable may also consist of amounts due from the Company’s metals merchant regarding processed gold and silver enroute to the merchant. Management believes the credit risk associated with the financial instruments contained in trade and accounts receivable is minimal. Financial instruments include “due from related parties” in the amount of $20,745. The credit risk associated with these financial instruments is limited to its carrying value at November 30, 2016. Liquidity risk As at November 30, 2016, the Company had net working capital of $1,752,360. The Company maintains operations from the cash flow generated from the Point Rousse Project’s operations. If necessary, the Company may seek financing for capital projects or general working capital purposes. As discussed previously, there can be no assurance that Anaconda will be successful in its efforts to arrange additional financing on terms satisfactory to the Company. At November 30, 2016, the carrying value and fair value amounts of the Company’s financial instruments are approximately equal. Market risk Market risk is the risk of loss that may arise from changes in market factors such as interest rates, foreign exchange rates, commodity prices and/or stock market movements (“price risk”). Interest rate risk The Company has no interest-bearing assets and only fixed-interest debts. Anaconda invests excess cash, when available, in a cashable money market account. Anaconda periodically monitors the investments it makes and is satisfied with the creditworthiness of its cash investments. Foreign currency risk The Company’s functional currency is the Canadian Dollar. The Company sells its gold production and transacts business using the Canadian Dollar. There are some operational and other expenses incurred by the Company which are received/paid in US Dollars. The assets and liabilities of the Company are recorded in Canadian Dollars. As a result, fluctuations in the US Dollar against the Canadian Dollar could result in material fluctuations in the financial results of the Company.

ANACONDA MINING INC. MANAGEMENT’S DISCUSSION AND ANALYSIS
P a g e | 27
Price risk The Company is exposed to price risk with respect to commodity prices. Commodity price risk is the potential adverse impact on earnings and economic value due to commodity price movements and volatilities. The Company closely monitors commodity prices as it relates to minerals (and specifically, gold) to determine the appropriate course of action to be taken by the Company. The Company is further exposed to price risk as it enters into non-hedged forward sales contracts from time to time. Capital requirements The Company may not have a source of funds to continue current operations or to engage in additional exploration and development which may be necessary to develop its properties, other than the exercise of stock options and further financings. No assurance can be given that the Company will be successful in obtaining the required financing on acceptable terms, if at all. Requirement of additional financing The exploration and development of the Company’s properties, including continuing exploration and development projects, the construction of mining facilities, the commencement of new mining operations and the continuation of ongoing mining operations may require substantial additional financing. Failure to obtain sufficient financing will result in a delay or indefinite postponement of exploration, development or production on any or all of the Company’s properties or even the loss of a property interest. Sources of funds now available to the Company are limited. Additional financing may not be available when needed or, even if available, the terms of such financing might not be favourable to the Company and might involve substantial dilution to existing shareholders or sale or other dispositions of an interest in any of the Company’s assets or properties. Failure to raise capital when needed would have a material adverse effect on the Company’s business, financial condition and results of operations. Risks factors of the business The Company’s operations will be subject to all of the hazards and risks normally incidental to exploring, developing and exploiting natural resources. Some of these risks include: Environmental hazards; Industrial accidents; Labour disputes; Unusual or unexpected geologic formations or other geological or grade problems; Unanticipated changes in metallurgical characteristics and recovery; Unanticipated ground or water conditions, cave-ins, pit wall failures, flooding or rock bursts; Periodic interruptions due to bad or hazardous weather conditions and other acts of God, and; Unfavourable operating conditions.
Any of these risks and hazards could adversely affect the Company’s exploration or mining activities, resulting in: An increase in the cost of exploration, development or production to a point where it is no longer
economically feasible to continue; A project being unfeasible to continue; The Company writing down the carrying value of one or more properties or mines; Delays or a stoppage in the exploration, development or production of its projects; Damage to, or destruction of, mineral properties or processing facilities, and/or; Personal injury, death and/or legal liability.
Any of these results may have a material adverse effect on the Company’s financial condition, results of operations and future cash flows.
ANACONDA MINING INC. MANAGEMENT’S DISCUSSION AND ANALYSIS
P a g e | 28
Mining industry risks The exploration for, and development of, mineral deposits involves a high degree of risk. Few properties that are explored are ultimately developed into producing mines. Substantial expenses may be required to locate and establish ore reserves, develop metallurgical processes and construct mining and processing facilities at a particular site. It is impossible to ensure that the exploration programs planned by the Company or its joint venture partners will result in a profitable commercial mining operation. Whether a mineral deposit will be commercially viable depends on a number of factors, some of which are: the particular attributes of the deposit, such as size, grade and proximity to infrastructure; metal prices, which are inherently cyclical and cannot be predicted with certainty, and; government regulations, including those relating to prices, taxes, royalties, land tenure, land use, importing and exporting of minerals and environmental protection. As a result, it is possible that actual costs and economic returns will differ significantly from those currently estimated for these projects. In addition, it is not unusual in mining operations to experience unexpected problems during both the start-up and during ongoing operations. To the extent that unexpected problems occur affecting the production in the future, the Company’s revenues may be reduced, costs may increase and the Company’s profitability and ability to continue its mining operation may be adversely affected. Environmental risks and hazards All phases of the Company’s operations are subject to environmental regulation in the jurisdictions in which it operates. Environmental legislation is evolving in a manner which will require stricter standards and enforcement, increased fines and penalties for non-compliance, more stringent environmental assessments of proposed projects and a heightened degree of responsibility for companies and their officers, directors and employees. There is no assurance that existing or future environmental regulation will not materially adversely affect the Company’s business, financial condition and results of operations. Environmental hazards may exist on the properties on which the Company holds interests which are unknown to the Company at present and which have been caused by previous or existing owners or operators of the properties. Government approvals and permits are currently, or may in the future be, required in connection with the Company’s operations. To the extent such approvals are required and not obtained, the Company may be curtailed or prohibited from proceeding with planned exploration, development or production of mineral properties. Failure to comply with applicable laws, regulations and permitting requirements may result in enforcement actions thereunder, including orders issued by regulatory or judicial authorities causing operations to cease or be curtailed, and may include corrective measures requiring capital expenditures, installation of additional equipment, or remedial actions. Parties engaged in mining operations, including the Company, may be required to compensate those suffering loss or damage by reason of the mining activities and may have civil or criminal fines or penalties imposed for violations of applicable laws or regulations. Amendments to current laws, regulations and permits governing operations and activities of mining companies, or more stringent implementation thereof, could have a material adverse impact on the Company and cause increases in exploration expenses, capital expenditures or production costs, reduction in levels of production at producing properties, or abandonment or delays in development of new mining properties. Governmental regulation of the mining industry The mining and mineral exploration activities of the Company are subject to various laws governing prospecting, development, production, taxes, labour standards, employment and occupational health, mine safety, use of water, toxic substances and waste disposal, environmental and other matters. These activities are also subject to various laws and regulations relating to protection of the environment. Although the Company believes that its mining and mineral exploration activities are currently carried out in accordance with all applicable rules and regulations, no assurance can be given that new rules and regulations will not be enacted or that existing rules and regulations will not be applied in a manner that could limit or curtail production or development. Amendments to current laws and regulations governing the operations and activities of the Company or more stringent implementation thereof could have a material adverse effect on the business, financial condition and results of operations of the Company.
ANACONDA MINING INC. MANAGEMENT’S DISCUSSION AND ANALYSIS
P a g e | 29
Title matters The acquisition of title to mineral properties is a very detailed and time-consuming process. Title to, and the area of, mineral concessions may be disputed. Although the Company believes it has taken reasonable measures to ensure proper title to its properties, there is no guarantee that title to any of its properties will not be challenged or impaired. Third parties may have valid claims underlying portions of the Company’s interests. Licenses and permits The operations of the Company may require licenses and permits from various governmental authorities. Obtaining necessary permits and licenses can be a complex, time consuming process and the Company cannot be certain that it will be able to obtain necessary permits on acceptable terms in a timely manner or at all. The costs and delays associated with obtaining necessary permits and complying with these permits and applicable laws and regulations could stop, delay or restrict the Company from proceeding with the development of an exploration project or the development and operation of a mine. Any failure to comply with applicable laws and regulations or permits could result in interruption or closure of exploration, development or mining operations, or fines, penalties or other liabilities. The Company could also lose its mining concessions under the terms of its existing agreements. Fluctuations in the market price of mineral commodities The profitability of the Company’s operations will be dependent upon the market price of mineral commodities. Mineral prices fluctuate widely and are affected by numerous factors beyond the control of the Company. The level of interest rates, the rate of inflation, the world supply of mineral commodities and the stability of exchange rates can all cause significant fluctuations in prices. Such external economic factors are in turn influenced by changes in international investment patterns, monetary systems and political developments. The price of mineral commodities has fluctuated widely in recent years, and future price declines could cause commercial production to be impracticable, thereby having a material adverse effect on the Company’s business, financial condition and results of operations. Furthermore, reserve calculations and life-of-mine plans using significantly lower metal prices could result in material write-downs of the Company’s investment in mining properties and increased amortization, reclamation and closure charges. In addition to adversely affecting the Company’s reserve estimates and its financial condition, declining commodity prices can impact operations by requiring a reassessment of the feasibility of a particular project. Such a reassessment may be the result of a management decision or may be required under financing arrangements related to a particular project. Even if a project is ultimately determined to be economically viable, the need to conduct such a reassessment may cause substantial delays or may interrupt operations until the reassessment can be completed. Infrastructure Exploration, development and operating activities depend on adequate infrastructure, including reliable roads, power sources and water supply. The Company’s inability to secure adequate water and power resources, as well as other events outside of its control such as unusual weather, sabotage, government or other interference in the maintenance or provision of such infrastructure, could adversely affect the Company’s operations and financial condition. Increase in production costs Changes in the Company’s production costs could have a major impact on its profitability. Its main production expenses are contractor costs, materials, personnel costs and energy. Changes in costs of the Company’s mining and processing operations could occur as a result of unforeseen events, including international and local economic and political events, a change in commodity prices, increased costs (including oil, steel and diesel) and scarcity of labour, and could result in changes in profitability or reserve estimates. Many of these factors may be beyond the Company’s control.

ANACONDA MINING INC. MANAGEMENT’S DISCUSSION AND ANALYSIS
P a g e | 30
The Company relies on third-party suppliers for a number of raw materials. Any material increase in the cost of raw materials, or the inability by the Company to source third-party suppliers for the supply of its raw materials, could have a material adverse effect on the Company’s results of operations or financial condition. Uncertainty in the estimation of mineral reserves and mineral resources To extend the lives of its mines and projects, ensure the continued operation of the business and realize its growth strategy, it is essential that the Company continues to realize its existing identified reserves, convert resources into reserves, develop its resource base through the realization of identified mineralized potential, and/or undertake successful exploration or acquire new resources. The figures for Mineral Reserves and Mineral Resources contained in NI 43-101 Technical Reports and other filings of the Company made on SEDAR at www.sedar.com are estimates only and no assurance can be given that the anticipated tonnages and grades will be achieved, that the indicated level of recovery will be realized or that Mineral Reserves could be mined or processed profitably. Actual reserves may not conform to geological, metallurgical or other expectations, and the volume and grade of ore recovered may be below the estimated levels. There are numerous uncertainties inherent in estimating Mineral Reserves and Mineral Resources, including many factors beyond the Company’s control. Such estimation is a subjective process, and the accuracy of any Mineral Reserve or Resource Estimate is a function of the quantity and quality of available data and of the assumptions made and judgments used in engineering and geological interpretation. Short-term operating factors relating to the Mineral Reserves, such as the need for orderly development of the ore bodies or the processing of new or different ore grades, may cause the mining operation to be unprofitable in any particular accounting period. In addition, there can be no assurance that gold recoveries in small-scale laboratory tests will be duplicated in larger-scale tests under on-site conditions or during production. Lower market prices, increased production costs, reduced recovery rates and other factors may result in a revision of its Mineral Reserve Estimates from time to time or may render the Company’s reserves uneconomic to exploit. Reserve data is not indicative of future results of operations. If the Company’s actual Mineral Reserves and Resources are less than current estimates or if the Company fails to develop its resource base through the realization of identified mineralized potential, its results of operations or financial condition may be materially and adversely affected. Evaluation of Mineral Reserves and Resources occurs from time to time and they may change depending on further geological interpretation, drilling results and metal prices. The category of Inferred Resources is often the least reliable resource category and is subject to the most variability. The Company regularly evaluates its resources and it often determines the merits of increasing the reliability of its overall resources. Uncertainty relating to Inferred Mineral Resources Inferred Mineral Resources that are not Mineral Reserves do not have demonstrated economic viability. Due to the uncertainty, which may attach to Inferred Mineral Resources, there is no assurance that Inferred Mineral Resources will be upgraded to Proven and Probable Mineral Reserves as a result of continued exploration. Need for additional reserves Given that mines have limited lives based on Proven and Probable Mineral Reserves, the Company must continually replace and expand its reserves at its gold mines. The life-of-mine estimates included contained in NI 43-101 Technical Reports and other filings of the Company made on SEDAR at www.sedar.com may not be correct. The Company’s ability to maintain or increase its annual production of gold will be dependent in significant part on its ability to bring new mines into production and to expand reserves at existing mines. History of profitability The Company has a history of profitability in four of the previous five years. There can be no assurance that the operations of the Company will be profitable in the future. The Company has limited financial resources and may require additional financing to further explore, develop, operate, acquire and retain its property interests and if financing is not available for any reason, the Company may become unable to acquire and retain its mineral concessions and carry out its business.
ANACONDA MINING INC. MANAGEMENT’S DISCUSSION AND ANALYSIS
P a g e | 31
Uninsured risks The Company does not carry insurance to protect against certain risks. Risks not insured include certain environmental pollution events, earthquake damage, mine flooding or other hazards against which the Company cannot insure or against which the Company may elect not to insure because of high premium costs or other reasons. Failure to have insurance coverage for any one or more of such risks or hazards could have a material adverse effect on the Company’s business, financial condition and results of operations. Competition The mining industry is intensely competitive in all of its phases and the Company will compete with many companies possessing greater financial and technical resources than itself. Competition in the base and precious metals mining industry is primarily for: mineral-rich properties which can be developed and produced economically; the technical expertise to find, develop, and operate such properties; the labour to operate the properties, and; the capital for the purpose of funding such properties. Many competitors not only explore for and mine precious metals, but also conduct refining and marketing operations on a worldwide basis. Such competition may result in the Company being unable to acquire desired properties (due to the auction process involved in property acquisition), to recruit or retain qualified employees or to obtain the capital necessary to fund its operations and develop its properties. Existing or future competition in the mining industry could materially adversely affect the Company’s prospects for mineral exploration and success in the future. An inability to obtain the capital necessary to fund its operations and develop its properties may cause the Company to not satisfy the requirements under the option agreements pursuant to which it holds its interest in the properties. Further, increased competition can result in increased costs and lower prices for metal and minerals produced and reduced profitability. Consequently, the revenues of the Company, its operations and financial condition could be materially adversely affected. Instability of political and economic environments The mining interests of the Company may be affected in varying degrees by political or economic uncertainty. Associated risks include, but are not limited to: extreme fluctuations in currency exchange rates and high rates of inflation. Any change in regulations or shifts in political attitudes are beyond the control of the Company and may materially adversely affect its business, financial condition and results of operations. Operations may also be affected in varying degrees by such factors as government regulations (or changes thereto) with respect to the restrictions on production, export controls, income taxes, expropriation of property, repatriation of profits, land use, environmental legislation, water use, land claims of local people, and mine safety. The effect of these factors cannot be accurately predicted. Dependence upon key management personnel and executives The Company will be dependent upon the continued support and involvement of a number of key management personnel. The loss of the services of one or more of such personnel could have a material adverse effect on the Company. The Company’s ability to manage its exploration, development and operating activities and, hence, its success, will depend in large part on the efforts of these individuals. The Company faces intense competition for qualified personnel and there can be no assurance that the Company will be able to attract and retain such personnel. Possible conflicts of interest of directors and officers of the Company Certain directors and officers of the Company also serve as directors, officers and/or advisors of and to other companies involved in natural resource exploration and development. Consequently, there exists the possibility for such directors and officers to be in a position of conflict. The Company expects that any decision made by any of such directors and officers involving the Company will be made in accordance with their duties and obligations to deal fairly and in good faith with a view to the best interests of the Company and its shareholders, but there can be no assurance in this regard. In addition, each of the directors is required to declare and refrain from voting on any matter in which such directors may have a conflict of interest or which are governed by the procedures set forth in the Business Corporations Act (Ontario) and any other applicable law.
ANACONDA MINING INC. MANAGEMENT’S DISCUSSION AND ANALYSIS
P a g e | 32
Absence of dividends The Company has never paid a dividend on its shares, and does not expect to do so in the foreseeable future. Any future determination to pay dividends will be at the discretion of the Board of Directors of the Company and will depend upon the capital requirements of the Company, results of operations and such other factors as the Board of Directors considers relevant. Accordingly, it is likely that investors will not receive any return on their investment in the shares other than possible capital gains. Risk of dilution Under applicable Canadian law, shareholder approval is not required for the Company to issue shares in a number of circumstances. Moreover, the Company has commitments that could require the issuance of a substantial number of additional shares, in particular options to acquire shares under the stock option plan of the Company. The future business of the Company will require substantial additional financing which will likely involve the sale of equity capital. The Company can also be expected to issue additional options, warrants and other financial instruments, which may include debt. Future issuances of equity capital may have a substantial dilutive effect on existing shareholders. The Company is not able at this time to predict the future amount of such issuances or dilution. Disclosure of outstanding share information The following table sets forth information concerning the outstanding securities of the Company as at January 12, 2017:
Common shares of no par value NumberShares 209,332,750Options Warrants
17,845,00016,278,449
Disclosure controls and procedures and internal controls over financial reporting Disclosure controls and procedures are designed to provide reasonable assurance that all relevant information is gathered and reported to senior management, including the CEO and the CFO on a timely basis so that appropriate decisions can be made regarding public disclosure. As at November 30, 2016, the Company's management, with the participation of the CEO and CFO, has evaluated the effectiveness of the Company's disclosure controls and procedures as defined in National Instrument 52-109 Certification of Disclosure in Issuers’ Annual and Interim Filings of the Canadian Securities Administrators and has concluded that such controls and procedures are effective. Internal control over financial reporting Management is responsible for certifying the design of the Company’s Internal Control of Financial Reporting (“ICFR”) as required by National Instrument 52-109 – Certification of Disclosure in Issuers Annual and Interim Filings. The Company’s ICFR is intended to provide reasonable assurance regarding the reliability of financial reporting and the preparation of financial statements for external purposes in accordance with applicable IFRS. ICFR should include those policies and procedures that establish the following: Maintenance of records, in reasonable detail, that accurately and fairly reflect the transactions and
dispositions of the Company’s assets; Reasonable assurance that transactions are recorded as necessary to permit preparation of
financial statements in accordance with applicable IFRS;
ANACONDA MINING INC. MANAGEMENT’S DISCUSSION AND ANALYSIS
P a g e | 33
Receipts and expenditures are only being made in accordance with authorizations of management and the Board of Directors, and;
Reasonable assurance regarding prevention or timely detection of unauthorized collection, use or disposition of the Company’s assets that could have a material effect on the financial statements.
Because of its inherent limitations, ICFR may not prevent or detect misstatements. Also, projections of any evaluation of effectiveness to future periods are subject to the risk that controls may become inadequate because of changes in conditions, or that the degree of compliance with the policies or procedures may deteriorate. Management, including the CEO and CFO, carried out an assessment of the design of the Company’s ICFR using the COSO Internal Control – Integrated Framework (2013) (“COSO 2013”) and concluded, subject to the inherent limitation noted below, that the Company has sufficient controls to meet the requirements as stated above and that one weakness existed as at November 30, 2016, as disclosed below. Segregation of duties Segregation of duties is a basic, key internal control and one of the most difficult to achieve in a small company. It is used to ensure that errors or irregularities are prevented or detected on a timely basis by employees in the normal course of business. Due to the Company’s small size and limited resources, a complete segregation of duties within the Company’s accounting group cannot be fully achieved and a material weakness exists. The result is that the Company is highly reliant on the performance of mitigating procedures during the process of closing its financial statements in order to ensure the financial statements are presented fairly in all material respects. Management will identify and hire additional accounting resources where cost effective and when required. Where it is not cost effective to obtain additional accounting resources, management will review existing mitigating controls and, if appropriate, implement changes to its internal control processes whereby more effective mitigating controls will be adopted. The CEO and the CFO have concluded however, that no material misstatements exist in the Company’s financial reporting as at November 30, 2016. There have been no changes in the Company’s internal control over financial reporting during the three months ended November 30, 2016. The Company currently uses COSO 2013 to design, implement and test internal controls and disclosure controls. During this fiscal year, the Company reviewed the design and implementation of its internal controls and disclosure controls. Top down risk-based assessments were utilized to evaluate the risk areas. No changes in internal controls were noted. The Company’s annual validation and testing of controls for operating effectiveness was conducted in the fourth quarter of fiscal 2016. High-risk controls were tested and validated. No material weaknesses were noted. Reconciliation of Non-GAAP financial measures The Company has included certain non-GAAP financial measures in this document. These measures are not defined under IFRS and should not be considered in isolation. The Company believes that these measures, together with measures determined in accordance with IFRS, provide investors with an improved ability to evaluate the underlying performance of the Company. The inclusion of these measures is meant to provide additional information and should not be used as a substitute for performance measures prepared in accordance with IFRS. These measures are not necessarily standard and therefore may not be comparable to other issuers. Adjusted net earnings measure the performance of the Company, excluding certain impacts which the Company believes are not reflective of the Company’s underlying performance for the reporting period, such as the impact of foreign exchange gains and losses, impairment charges, and non-hedge derivative gains and losses.
ANACONDA MINING INC. MANAGEMENT’S DISCUSSION AND ANALYSIS
P a g e | 34
Although some of the items are recurring, the Company believes that they are not reflective of the underlying operating performance of its current business and are not necessarily indicative of future operating results. The following table provides a reconciliation of adjusted net earnings for the three and six months ended November 30, 2016 and 2015:
For the three months ended For the six months endedNovember 30 November 30 November 30 November 30
2016 2015 2016 2015 $ $ $ $
Net income 723,181 766,040 343,616 581,121
Adjusting items:Foreign exchange (gain) loss 5 (20,312) (4) (17,461) Unrealized gain on forward sales contract derivative (32,444) (29,423) (58,234) (26,615) Reclamation expense 10,531 24,988 21,062 30,030
Total adjustments (21,908) (24,747) (37,176) (14,046) Adjusted net earnings 701,273 741,293 306,440 567,075
Cash cost per ounce sold is cost of sales from the period before depletion, depreciation and amortization of production stripping assets divided by the number of ounces of gold sold in the period. AISC per ounce includes total cash costs plus the sum of corporate administrative expenses, sustaining capital expenditures, the addition of production stripping assets and certain exploration and evaluation expenses, all divided by the number of ounces sold in the period. This measure seeks to reflect the full cost to sustain the current level of gold production from the Company’s operations. Certain other cash expenditures, including income tax payments and financing costs are not included. Certain prior period amounts included in the calculation of AISC have been changed to conform to the presentation adopted in the current period.

ANACONDA MINING INC. MANAGEMENT’S DISCUSSION AND ANALYSIS
P a g e | 35
The following table provides a reconciliation of cash cost per ounce sold and all-in sustaining cash cost per ounce sold for the three and six months ended November 30, 2016 and 2015:
For the three months ended For the six months endedNovember 30 November 30 November 30 November 30
2016 2015 2016 2015 Cost of sales 6,178,674 5,462,305 10,734,796 10,839,106 Less: Amortization of production stripping assets (235,326) (37,258) (235,326) (37,258) Less: Depletion and depreciation (1,397,619) (1,259,081) (2,321,571) (2,312,509) Cash operating cost 4,545,729 4,165,966 8,177,899 8,489,339 Corporate administration 665,659 546,286 1,321,603 1,043,430 Purchase of property, mill and equipment 688,160 832,904 1,387,530 1,484,170 Purchase of exploration and evaluation assets 1,229,452 438,688 1,986,522 760,878 Additions to production stripping assets - - 1,283,856 414,397 All-in cash cost 7,129,000 5,983,844 14,157,411 12,192,214
Gold ounces sold 4,388 4,605 7,307 8,561 Cash cost per ounce sold 1,036 905 1,119 992 All-in sustaining cash cost per ounce sold 1,625 1,299 1,938 1,424
(in USD$)Cash cost per ounce sold 781 685 853 764 All-in sustaining cash cost per ounce sold 1,225 984 1,477 1,097
EBITDA is earnings before finance expense, foreign exchange loss (gain), unrealized gain on forward sales contract derivative, share-based compensation, income tax recovery and depreciation and depletion. Point Rousse Project EBITDA is EBITDA before corporate administration and other expenses.

ANACONDA MINING INC. MANAGEMENT’S DISCUSSION AND ANALYSIS
P a g e | 36
The following table provides a reconciliation of EBITDA for the three and six months ended November 30, 2016 and 2015:
For the three months ended For the six months endedNovember 30 November 30 November 30 November 30
2016 2015 2016 2015 $ $ $ $
Net income 723,181 766,040 343,616 581,121
Adjustments:Finance expense 18,359 3,111 68,573 3,111 Foreign exchange (gain) loss 5 (20,312) (4) (17,461) Unrealized gain on forward sales contract derivative (32,444) (29,423) (58,234) (26,615) Share-based compensation 65,881 86,581 135,858 167,390 Deferred income tax recovery 187,000 (33,000) 153,000 (48,000) Depletion and depreciation 1,397,619 1,259,081 2,321,571 2,312,509 EBITDA 2,359,601 2,032,078 2,964,380 2,972,055 Corporate administration 665,659 546,286 1,321,603 1,043,430 Other expenses 3,820 16,487 30,664 41,794 Point Rousse Project EBITDA 3,029,080 2,594,851 4,316,647 4,057,279
Cautionary note regarding forward-looking information This document contains or refers to forward-looking information. Such forward-looking information includes, among other things, statements regarding targets, estimates and/or assumptions in respect of future production, mine development costs, unit costs, capital costs, timing of commencement of operations and future economic, market and other conditions, and is based on current expectations that involve a number of business risks and uncertainties. Factors that could cause actual results to differ materially from any forward-looking statement include, but are not limited to: the grade and recovery of ore which is mined varying from estimates; capital and operating costs varying significantly from estimates; inflation; changes in exchange rates; fluctuations in commodity prices; delays in the development of the any project caused by unavailability of equipment, labour or supplies, climatic conditions or otherwise; termination or revision of any debt financing; failure to raise additional funds required to finance the completion of a project; and other factors. Forward-looking statements are subject to significant risks and uncertainties and other factors that could cause actual results to differ materially from expected results. Readers should not place undue reliance on forward-looking statements. These forward-looking statements are made as of the date hereof and the Company assumes no responsibility to update them or revise them to reflect new events or circumstances, except as required by law. Additional information and continuous disclosure This MD&A has been prepared as at January 12, 2017. Additional information on the Company is available through regular filings of press releases, financial statements and the Company’s Annual Information Form, on SEDAR (www.sedar.com) and on the Company’s website (www.anacondamining.com).
ANACONDA MINING INC. MANAGEMENT’S DISCUSSION AND ANALYSIS
P a g e | 37
Management’s responsibility Management is responsible for all information contained in this MD&A. The Financial Statements have been prepared in accordance with IFRS and include amounts based on management’s informed judgments and estimates. The financial and operating information included in this MD&A is consistent with that contained in the Financial Statements in all material aspects. Management maintains internal controls to provide reasonable assurance that financial information is reliable and accurate and assets are safeguarded. The Company’s Board of Directors has reviewed with management and approved the Financial Statements and this MD&A. “Dustin Angelo” “Errol Farr”Dustin Angelo President and Chief Executive Officer
Errol Farr Chief Financial Officer