Embed Size (px)
Citation preview
MANAGEMENT’S DISCUSSION AND ANALYSIS
For the quarter ended September 30, 2017 and 2016
The following Management’s Discussion and Analysis (“MD&A”) is prepared as at November 14, 2017 and is based on the
consolidated financial position and operating results of Leon’s Furniture Limited/Meubles Leon Ltée (the “Company”) as of
September 30, 2017 and for the three and nine months ended September 30, 2017, and 2016. It should be read in conjunction
with the fiscal year 2016 consolidated financial statements and the notes thereto. For additional detail and information relating
to the Company, readers are referred to the fiscal 2016 quarterly financial statements and corresponding MD&As which are
published separately and available at www.sedar.com.
Cautionary Statement Regarding Forward-Looking Statements This MD&A is intended to provide readers with the information that management believes is required to gain an understanding
of Leon’s Furniture Limited’s current results and to assess the Company’s future prospects. This MD&A, and in particular the
section under heading “Outlook”, includes forward-looking statements, which are based on certain assumptions and reflect
Leon’s Furniture Limited’s current plans and expectations. These forward-looking statements are subject to a number of risks
and uncertainties that could cause actual results and future prospects to differ materially from current expectations. Some of
the factors that can cause actual results to differ materially from current expectations are: a further drop in consumer confidence;
dependency on product from third party suppliers, further changes to the Canadian bank lending rates; and a further fluctuations
of the Canadian dollar vs. the US dollar. (Given these risks, uncertainties and the integration risk associated with the acquisition
of The Brick Ltd. (“The Brick”), investors should not place undue reliance on forward-looking statements as a prediction of
actual results.) Readers of this report are cautioned that actual events and results may vary.
Financial Statements Governance Practice Leon’s Furniture Limited’s unaudited interim condensed consolidated financial statements have been prepared in accordance
with the requirements of IAS 34, Interim Financial Reporting as issued by the International Accounting Standards Board
(“IASB”), which is within the framework of International Financial Reporting Standards (“IFRS”). The amounts expressed are
in Canadian dollars. Per share amounts are calculated using the weighted average number of shares outstanding before and
after considering the potential dilutive effects of the convertible debentures for the applicable period.
The Audit Committee of the Board of Directors of Leon’s Furniture Limited reviewed the MD&A and the unaudited interim
condensed consolidated financial statements, and recommended that the Board of Directors approve them. Following review
by the full Board, the unaudited interim condensed consolidated financial statements and MD&A were approved on November
14, 2017.
1
TABLE OF CONTENTS 1. BUSINESS OVERVIEW .................................................................................................................... 3
2. NON-IFRS FINANCIAL MEASURES .............................................................................................. 4
3. RESULTS OF OPERATION .............................................................................................................. 6
4. SUMMARY OF CONSOLIDATED QUARTERLY RESULTS ....................................................... 9
5. FINANCIAL POSITION .................................................................................................................... 9
6. LIQUIDITY AND CAPITAL RESOURCES ................................................................................... 10
7. OUTLOOK ........................................................................................................................................ 12
8. OUTSTANDING COMMON SHARES ........................................................................................... 12
9. RELATED PARTY TRANSACTIONS ........................................................................................... 12
10. CRITICAL ASSUMPTIONS ............................................................................................................ 12
11. RISKS AND UNCERTAINTIES ...................................................................................................... 16
12. CONTROLS AND PROCEDURES ................................................................................................. 18
2
1. BUSINESS OVERVIEW
Leon’s Furniture Limited is the largest network of home furnishings, mattresses, appliances and electronics stores in Canada.
Our retail banners include: Leon’s; The Brick; The Brick Mattress Store; The Brick Clearance Centre; and The Brick Outlet.
As well, The Brick’s Midnorthern Appliance banner alongside with the Appliance Canada banner, makes the Company the
country’s largest commercial retailer of appliances to builders, developers, hotels and property management companies.
Finally, the Company operates three websites: leons.ca, thebrick.com and our newest website furniture.ca.
The Company’s repair service division, Trans Global Services (“TGS”), provides household furniture, electronics and
appliance repair services to its customers. The TGS division has contracts to support several manufacturers’ warranty service
work in addition to servicing a number of individual programs offered by other dealers. This division also performs work for
products sold with extended warranties and is an integral part of the retail offering. These extended warranties, underwritten
by the Company’s wholly-owned subsidiaries are offered on appliances, electronics and furniture to provide coverage that
extends beyond the manufacturer’s warranty period by up to five years. The warranty contracts provide both repair and
replacement service depending upon the nature of the warranty claim.
The Company’s wholly-owned subsidiaries Trans Global Insurance Company (“TGI”) and its sister company, Trans Global
Life Insurance Company (“TGLI”) also offer credit insurance on the customers’ outstanding financing balances. This credit
insurance coverage includes life, dismemberment, disability, critical illness and involuntary unemployment. These credit
insurance policies are underwritten by TGI and TGLI as they are licensed as insurance companies in all Canadian provinces
and territories.
The Company has foreign operations in Asia, through its wholly owned subsidiary First Oceans Trading Corporation. These
operations relate to the Company’s import and quality control program for sourcing products from Asia for resale in Canada
through its retail operations.
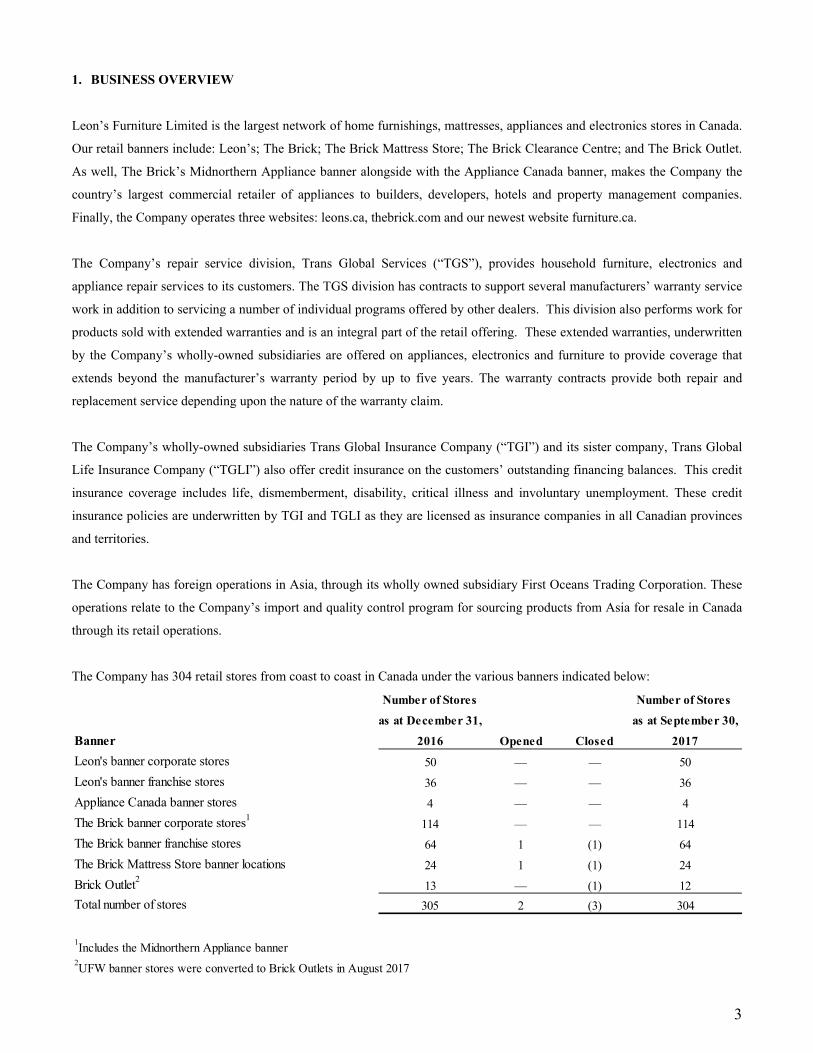
The Company has 304 retail stores from coast to coast in Canada under the various banners indicated below:
Number of Stores Number of Stores
as at December 31, as at September 30,
Banner 2016 Opened Closed 2017
Leon's banner corporate stores 50 — — 50
Leon's banner franchise stores 36 — — 36
Appliance Canada banner stores 4 — — 4
The Brick banner corporate stores1114 — — 114
The Brick banner franchise stores 64 1 (1) 64
The Brick Mattress Store banner locations 24 1 (1) 24
Brick Outlet2 13 — (1) 12
Total number of stores 305 2 (3) 304
1Includes the Midnorthern Appliance banner
2UFW banner stores were converted to Brick Outlets in August 2017
3
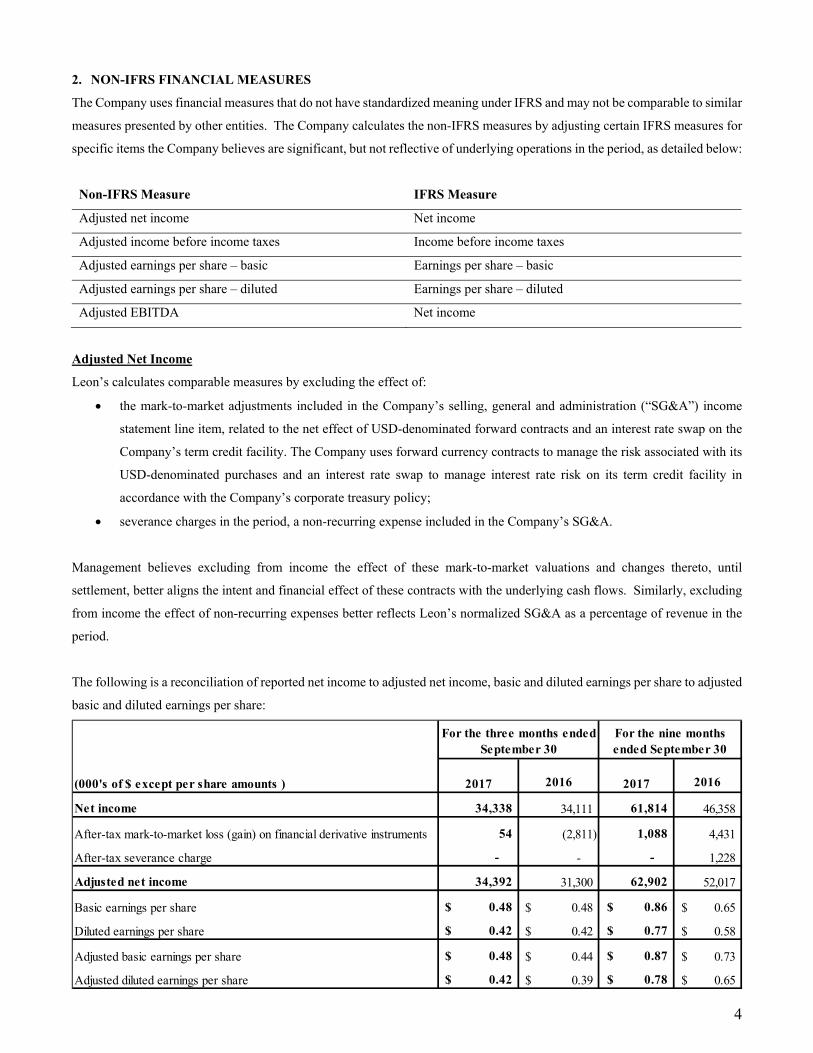
2. NON-IFRS FINANCIAL MEASURES
The Company uses financial measures that do not have standardized meaning under IFRS and may not be comparable to similar
measures presented by other entities. The Company calculates the non-IFRS measures by adjusting certain IFRS measures for
specific items the Company believes are significant, but not reflective of underlying operations in the period, as detailed below:
Non-IFRS Measure IFRS Measure
Adjusted net income Net income
Adjusted income before income taxes Income before income taxes
Adjusted earnings per share – basic Earnings per share – basic
Adjusted earnings per share – diluted Earnings per share – diluted
Adjusted EBITDA Net income
Adjusted Net Income
Leon’s calculates comparable measures by excluding the effect of:
the mark-to-market adjustments included in the Company’s selling, general and administration (“SG&A”) income
statement line item, related to the net effect of USD-denominated forward contracts and an interest rate swap on the
Company’s term credit facility. The Company uses forward currency contracts to manage the risk associated with its
USD-denominated purchases and an interest rate swap to manage interest rate risk on its term credit facility in
accordance with the Company’s corporate treasury policy;
severance charges in the period, a non-recurring expense included in the Company’s SG&A.
Management believes excluding from income the effect of these mark-to-market valuations and changes thereto, until
settlement, better aligns the intent and financial effect of these contracts with the underlying cash flows. Similarly, excluding
from income the effect of non-recurring expenses better reflects Leon’s normalized SG&A as a percentage of revenue in the
period.
The following is a reconciliation of reported net income to adjusted net income, basic and diluted earnings per share to adjusted
basic and diluted earnings per share:
(000's of $ except per share amounts ) 2017 2016 2017 2016
Net income 34,338 34,111 61,814 46,358
After-tax mark-to-market loss (gain) on financial derivative instruments 54 (2,811) 1,088 4,431
After-tax severance charge - - - 1,228
Adjusted net income 34,392 31,300 62,902 52,017
Basic earnings per share 0.48$ 0.48$ 0.86$ 0.65$
Diluted earnings per share 0.42$ 0.42$ 0.77$ 0.58$
Adjusted basic earnings per share 0.48$ 0.44$ 0.87$ 0.73$
Adjusted diluted earnings per share 0.42$ 0.39$ 0.78$ 0.65$
For the three months ended September 30
For the nine months ended September 30
4
Adjusted EBITDA
Adjusted earnings before interest, income taxes, depreciation and amortization, mark-to-market adjustment due to the changes
in the fair value of the Company’s financial derivative instruments and any non-recurring charges to income (“Adjusted
EBITDA”) is a non-IFRS financial measure used by the Company. The Company considers Adjusted EBITDA to be an
effective measure of profitability on an operational basis and is commonly regarded as an indirect measure of operating cash
flow, a significant indicator of success for many businesses. Adjusted EBITDA is a non-IFRS financial measure used by the
Company. The Company’s Adjusted EBITDA may not be comparable to the Adjusted EBITDA measure of other companies,
but in management’s view appropriately reflects Leon’s specific financial condition. This measure is not intended to replace
net income, which, as determined in accordance with IFRS, is an indicator of operating performance.
The following is a reconciliation of reported net income to adjusted EBITDA:
Same Store Sales
Same store sales are defined as sales generated by stores that have been open or closed for more than 12 months on a fiscal
basis. Same store sales is not an earnings measure recognized by IFRS, and does not have a standardized meaning prescribed
by IFRS, but it is a key indicator used by the Company to measure performance against prior period results. Same store sales
as discussed in this MD&A may not be comparable to similar measures presented by other issuers, however this measure is
commonly used in the retail industry. We believe that disclosing this measure is meaningful to investors because it enables
them to better understand the level of growth of our business.
Total System Wide Sales
Total system wide sales refer to the aggregation of revenue recognized in the Company’s consolidated financial statements
plus the franchise sales occurring at franchise stores to their customers which are not included in the revenue figure presented
in the Company’s consolidated financial statements. Total system wide sales is not a measure recognized by IFRS, and does
not have a standardized meaning prescribed by IFRS, but it is a key indicator used by the Company to measure performance
against prior period results. Therefore, total system wide sales as discussed in this MD&A may not be comparable to similar
measures presented by other issuers. We believe that disclosing this measure is meaningful to investors because it serves as an
indicator of the strength of the Company’s overall store network, which ultimately impacts financial performance.
(000's of $) 2017 2016 2017 2016
Net income 34,338 34,111 61,814 46,358
Income tax expense 12,088 12,163 22,754 16,997
Net finance costs 2,800 3,635 8,186 10,955
Depreciation and amortization 9,729 10,212 28,953 30,581
Severance charge - - - 1,700
Mark-to-market loss (gain) on financial derivative instruments 74 (3,919) 1,491 6,070
Adjusted EBITDA 59,029 56,202 123,198 112,661
For the three months ended September 30
For the nine months ended September 30
5
Franchise Sales
Franchise sales figures refer to sales occurring at franchise stores to their customers which are not included in the revenue
figures presented in the Company’s consolidated financial statements, or in the same store sales figures in this MD&A.
Franchise sales is not a measure recognized by IFRS, and does not have a standardized meaning prescribed by IFRS, but it is
a key indicator used by the Company to measure performance against prior period results. Therefore, franchise sales as
discussed in this MD&A may not be comparable to similar measures presented by other issuers. Once again we believe that
disclosing this measure is meaningful to investors because it serves as an indicator of the strength of the Company’s brands,
which ultimately impacts financial performance.
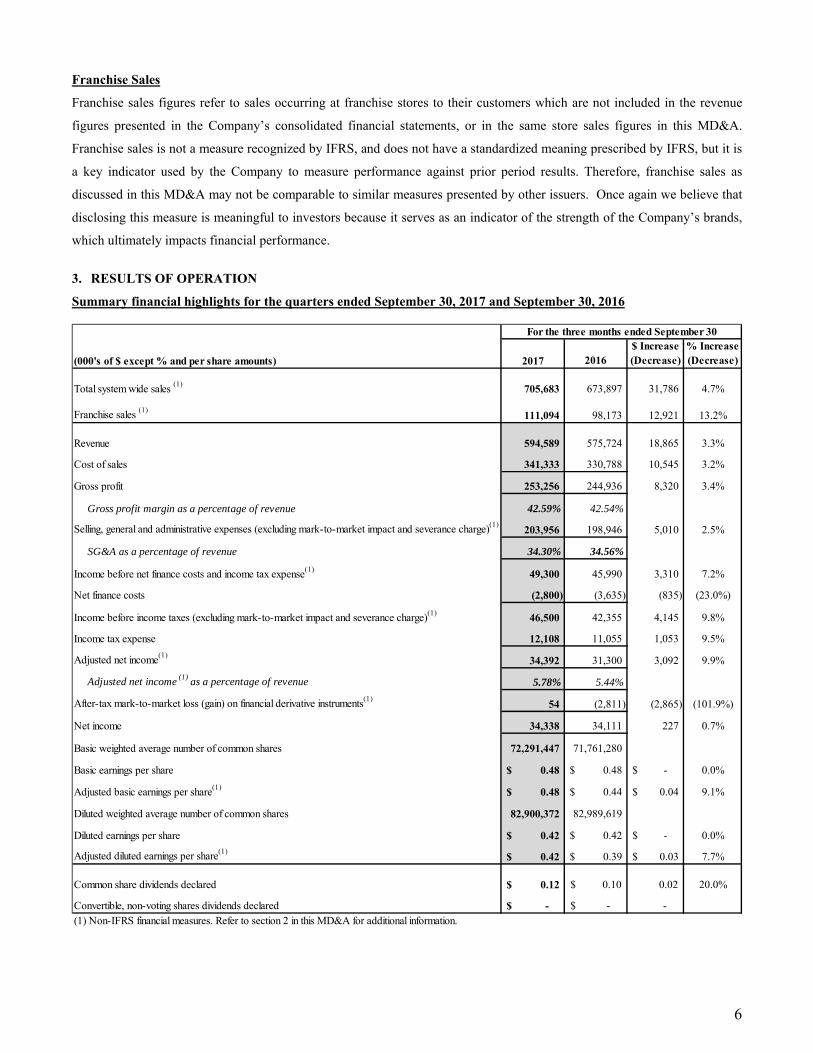
3. RESULTS OF OPERATION
Summary financial highlights for the quarters ended September 30, 2017 and September 30, 2016
(000's of $ except % and per share amounts) 2017 2016$ Increase(Decrease)
% Increase(Decrease)
Total system wide sales (1) 705,683 673,897 31,786 4.7%
Franchise sales (1)111,094 98,173 12,921 13.2%
Revenue 594,589 575,724 18,865 3.3%
Cost of sales 341,333 330,788 10,545 3.2%
Gross profit 253,256 244,936 8,320 3.4%
Gross profit margin as a percentage of revenue 42.59% 42.54%
Selling, general and administrative expenses (excluding mark-to-market impact and severance charge)(1)203,956 198,946 5,010 2.5%
SG&A as a percentage of revenue 34.30% 34.56%
Income before net finance costs and income tax expense(1) 49,300 45,990 3,310 7.2%
Net finance costs (2,800) (3,635) (835) (23.0%)
Income before income taxes (excluding mark-to-market impact and severance charge)(1) 46,500 42,355 4,145 9.8%
Income tax expense 12,108 11,055 1,053 9.5%
Adjusted net income(1)34,392 31,300 3,092 9.9%
Adjusted net income (1) as a percentage of revenue 5.78% 5.44%
After-tax mark-to-market loss (gain) on financial derivative instruments(1)54 (2,811) (2,865) (101.9%)
Net income 34,338 34,111 227 0.7%
Basic weighted average number of common shares 72,291,447 71,761,280
Basic earnings per share 0.48$ 0.48$ -$ 0.0%
Adjusted basic earnings per share(1) 0.48$ 0.44$ 0.04$ 9.1%
Diluted weighted average number of common shares 82,900,372 82,989,619
Diluted earnings per share 0.42$ 0.42$ -$ 0.0%
Adjusted diluted earnings per share(1) 0.42$ 0.39$ 0.03$ 7.7%
Common share dividends declared 0.12$ 0.10$ 0.02 20.0%
Convertible, non-voting shares dividends declared -$ -$ - (1) Non-IFRS financial measures. Refer to section 2 in this MD&A for additional information.
For the three months ended September 30
6
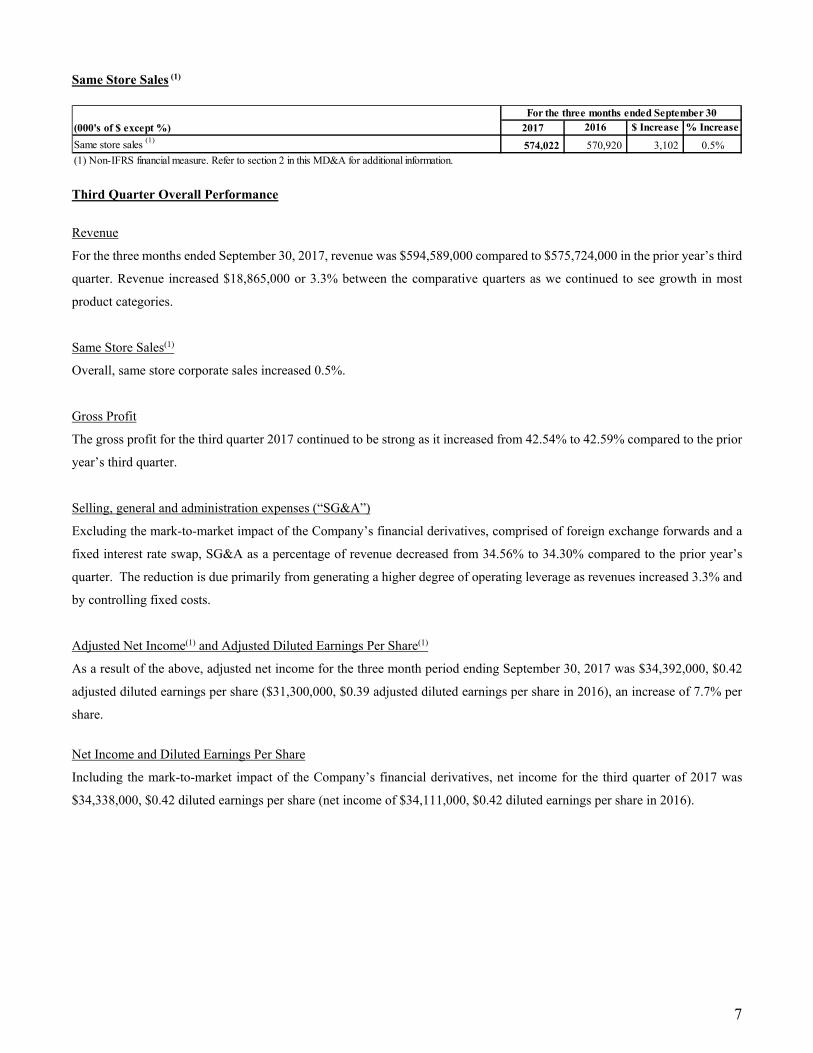
Same Store Sales (1)
Third Quarter Overall Performance
Revenue
For the three months ended September 30, 2017, revenue was $594,589,000 compared to $575,724,000 in the prior year’s third
quarter. Revenue increased $18,865,000 or 3.3% between the comparative quarters as we continued to see growth in most
product categories.
Same Store Sales(1)
Overall, same store corporate sales increased 0.5%.
Gross Profit
The gross profit for the third quarter 2017 continued to be strong as it increased from 42.54% to 42.59% compared to the prior
year’s third quarter.
Selling, general and administration expenses (“SG&A”)
Excluding the mark-to-market impact of the Company’s financial derivatives, comprised of foreign exchange forwards and a
fixed interest rate swap, SG&A as a percentage of revenue decreased from 34.56% to 34.30% compared to the prior year’s
quarter. The reduction is due primarily from generating a higher degree of operating leverage as revenues increased 3.3% and
by controlling fixed costs.
Adjusted Net Income(1) and Adjusted Diluted Earnings Per Share(1)
As a result of the above, adjusted net income for the three month period ending September 30, 2017 was $34,392,000, $0.42
adjusted diluted earnings per share ($31,300,000, $0.39 adjusted diluted earnings per share in 2016), an increase of 7.7% per
share.
Net Income and Diluted Earnings Per Share
Including the mark-to-market impact of the Company’s financial derivatives, net income for the third quarter of 2017 was
$34,338,000, $0.42 diluted earnings per share (net income of $34,111,000, $0.42 diluted earnings per share in 2016).
(000's of $ except %) 2017 2016 $ Increase % Increase
Same store sales (1)574,022 570,920 3,102 0.5%
For the three months ended September 30
(1) Non-IFRS financial measure. Refer to section 2 in this MD&A for additional information.
7
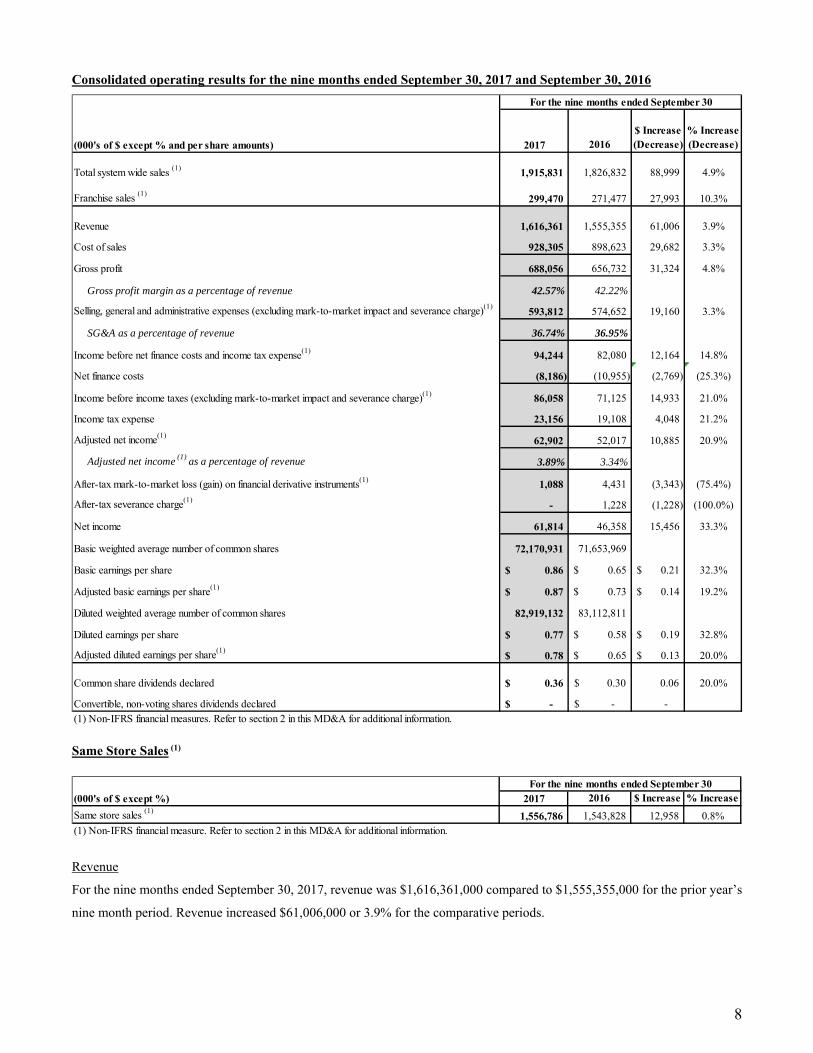
Consolidated operating results for the nine months ended September 30, 2017 and September 30, 2016
Same Store Sales (1)
Revenue
For the nine months ended September 30, 2017, revenue was $1,616,361,000 compared to $1,555,355,000 for the prior year’s
nine month period. Revenue increased $61,006,000 or 3.9% for the comparative periods.
(000's of $ except % and per share amounts) 2017 2016$ Increase(Decrease)
% Increase(Decrease)
Total system wide sales (1) 1,915,831 1,826,832 88,999 4.9%
Franchise sales (1)299,470 271,477 27,993 10.3%
Revenue 1,616,361 1,555,355 61,006 3.9%
Cost of sales 928,305 898,623 29,682 3.3%
Gross profit 688,056 656,732 31,324 4.8%
Gross profit margin as a percentage of revenue 42.57% 42.22%
Selling, general and administrative expenses (excluding mark-to-market impact and severance charge)(1)593,812 574,652 19,160 3.3%
SG&A as a percentage of revenue 36.74% 36.95%
Income before net finance costs and income tax expense(1) 94,244 82,080 12,164 14.8%
Net finance costs (8,186) (10,955) (2,769) (25.3%)
Income before income taxes (excluding mark-to-market impact and severance charge)(1) 86,058 71,125 14,933 21.0%
Income tax expense 23,156 19,108 4,048 21.2%
Adjusted net income(1)62,902 52,017 10,885 20.9%
Adjusted net income (1) as a percentage of revenue 3.89% 3.34%
After-tax mark-to-market loss (gain) on financial derivative instruments(1) 1,088 4,431 (3,343) (75.4%)
After-tax severance charge(1)- 1,228 (1,228) (100.0%)
Net income 61,814 46,358 15,456 33.3%
Basic weighted average number of common shares 72,170,931 71,653,969
Basic earnings per share 0.86$ 0.65$ 0.21$ 32.3%
Adjusted basic earnings per share(1) 0.87$ 0.73$ 0.14$ 19.2%
Diluted weighted average number of common shares 82,919,132 83,112,811
Diluted earnings per share 0.77$ 0.58$ 0.19$ 32.8%
Adjusted diluted earnings per share(1) 0.78$ 0.65$ 0.13$ 20.0%
Common share dividends declared 0.36$ 0.30$ 0.06 20.0%
Convertible, non-voting shares dividends declared -$ -$ - (1) Non-IFRS financial measures. Refer to section 2 in this MD&A for additional information.
For the nine months ended September 30
(000's of $ except %) 2017 2016 $ Increase % Increase
Same store sales (1)1,556,786 1,543,828 12,958 0.8%
For the nine months ended September 30
(1) Non-IFRS financial measure. Refer to section 2 in this MD&A for additional information.
8
Same Store Sales(1)
Overall, same store corporate sales increased 0.8%.
Gross Profit
The gross profit for the nine months ended September 30, 2017 continued to be strong as it increased from 42.22% to 42.57%
compared to the prior year’s nine month period.
Selling, general and administration expenses (“SG&A”)
Excluding severance payments and the mark-to-market impact of the Company’s financial derivatives, comprised of foreign
exchange forwards and a fixed interest rate swap, SG&A as a percentage of revenue decreased from 36.95% to 36.74%. Like
the third quarter results, the reduction is due primarily from generating a higher degree of operating leverage as revenues
increased 3.9% for the nine month period and by controlling fixed costs.
Adjusted Net Income(1) and Adjusted Diluted Earnings Per Share(1)
As a result of the above, adjusted net income for the nine month period ending September 30, 2017 was $62,902,000, $0.78
adjusted diluted earnings per share ($52,017,000, $0.65 adjusted diluted earnings per share in 2016), an increase of 20.0%.
Net Income and Diluted Earnings Per Share
Including the severance payments and the mark-to-market impact of the Company’s financial derivatives, net income for the
nine month period ending September 30, 2017 was $61,814,000, $0.77 diluted earnings per share (net income of $46,358,000,
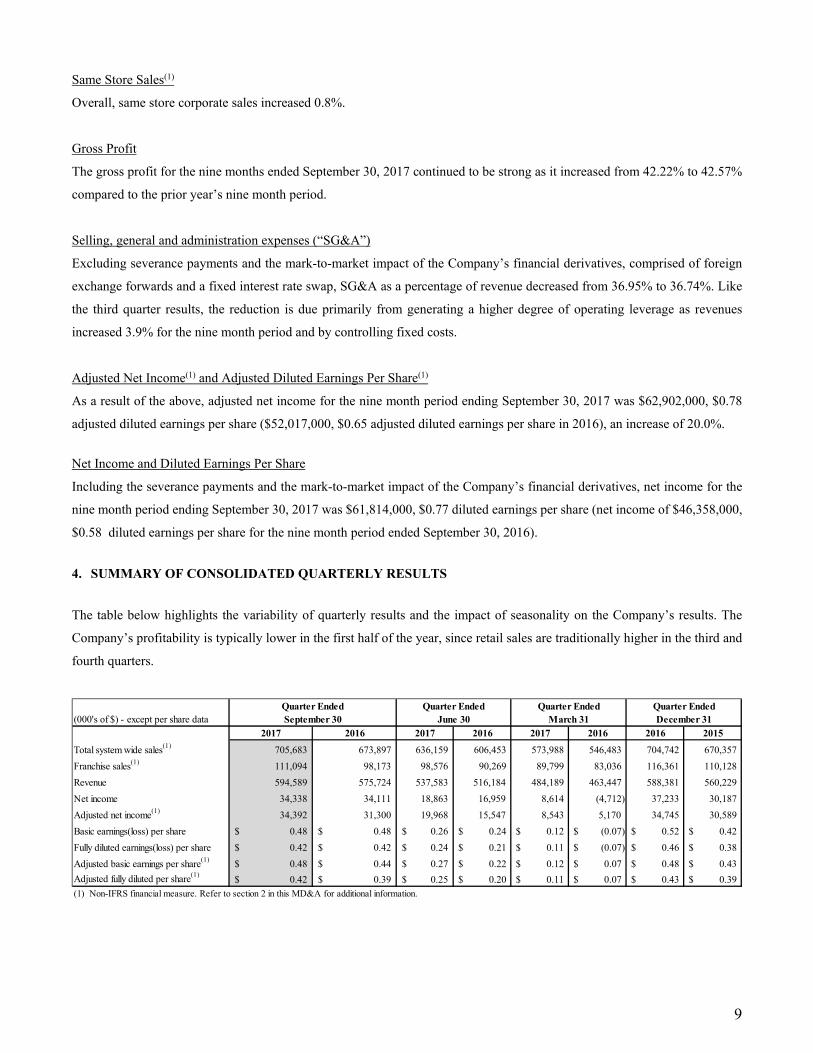
$0.58 diluted earnings per share for the nine month period ended September 30, 2016). 4. SUMMARY OF CONSOLIDATED QUARTERLY RESULTS
The table below highlights the variability of quarterly results and the impact of seasonality on the Company’s results. The
Company’s profitability is typically lower in the first half of the year, since retail sales are traditionally higher in the third and
fourth quarters.
(000's of $) - except per share data
2017 2016 2017 2016 2017 2016 2016 2015
Total system wide sales(1) 705,683 673,897 636,159 606,453 573,988 546,483 704,742 670,357
Franchise sales(1) 111,094 98,173 98,576 90,269 89,799 83,036 116,361 110,128
Revenue 594,589 575,724 537,583 516,184 484,189 463,447 588,381 560,229
Net income 34,338 34,111 18,863 16,959 8,614 (4,712) 37,233 30,187
Adjusted net income(1) 34,392 31,300 19,968 15,547 8,543 5,170 34,745 30,589
Basic earnings(loss) per share 0.48$ 0.48$ 0.26$ 0.24$ 0.12$ (0.07)$ 0.52$ 0.42$
Fully diluted earnings(loss) per share 0.42$ 0.42$ 0.24$ 0.21$ 0.11$ (0.07)$ 0.46$ 0.38$
Adjusted basic earnings per share(1) 0.48$ 0.44$ 0.27$ 0.22$ 0.12$ 0.07$ 0.48$ 0.43$
Adjusted fully diluted per share(1)0.42$ 0.39$ 0.25$ 0.20$ 0.11$ 0.07$ 0.43$ 0.39$
Quarter EndedDecember 31
(1) Non-IFRS financial measure. Refer to section 2 in this MD&A for additional information.
Quarter EndedMarch 31
Quarter EndedJune 30
Quarter EndedSeptember 30
9
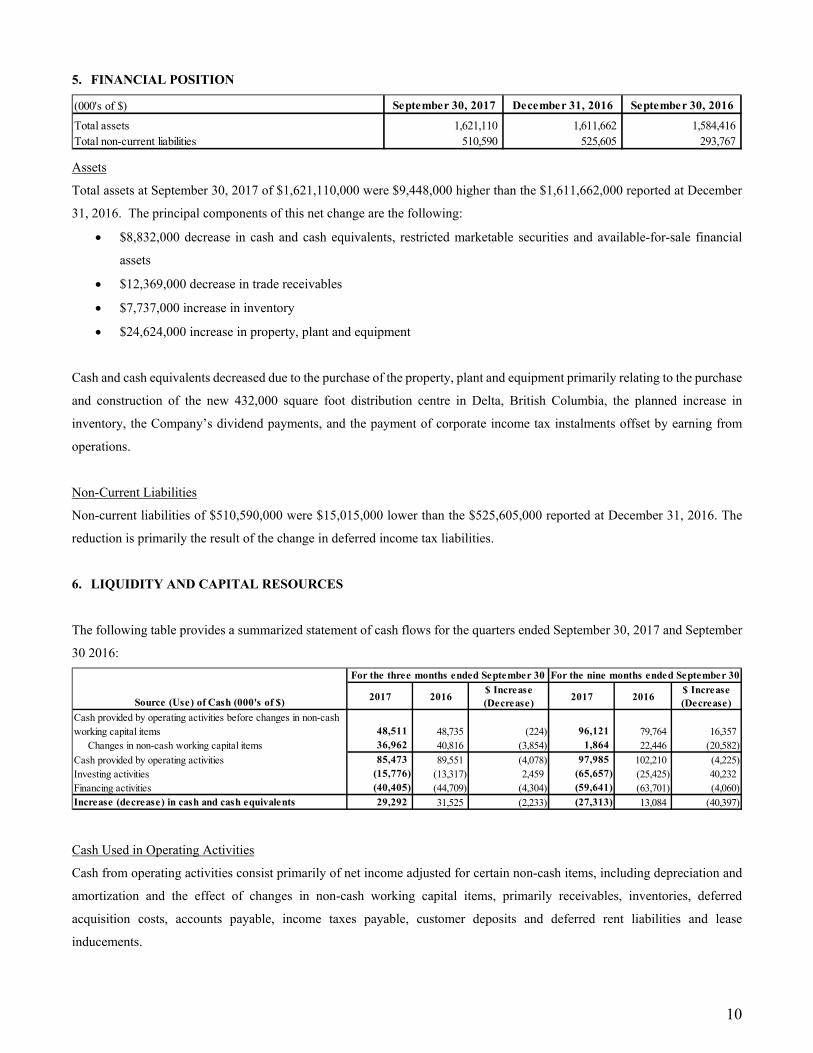
5. FINANCIAL POSITION
Assets
Total assets at September 30, 2017 of $1,621,110,000 were $9,448,000 higher than the $1,611,662,000 reported at December
31, 2016. The principal components of this net change are the following:
$8,832,000 decrease in cash and cash equivalents, restricted marketable securities and available-for-sale financial
assets
$12,369,000 decrease in trade receivables
$7,737,000 increase in inventory
$24,624,000 increase in property, plant and equipment
Cash and cash equivalents decreased due to the purchase of the property, plant and equipment primarily relating to the purchase
and construction of the new 432,000 square foot distribution centre in Delta, British Columbia, the planned increase in
inventory, the Company’s dividend payments, and the payment of corporate income tax instalments offset by earning from
operations.
Non-Current Liabilities
Non-current liabilities of $510,590,000 were $15,015,000 lower than the $525,605,000 reported at December 31, 2016. The
reduction is primarily the result of the change in deferred income tax liabilities.
6. LIQUIDITY AND CAPITAL RESOURCES
The following table provides a summarized statement of cash flows for the quarters ended September 30, 2017 and September
30 2016:
Cash Used in Operating Activities
Cash from operating activities consist primarily of net income adjusted for certain non-cash items, including depreciation and
amortization and the effect of changes in non-cash working capital items, primarily receivables, inventories, deferred
acquisition costs, accounts payable, income taxes payable, customer deposits and deferred rent liabilities and lease
inducements.
(000's of $) September 30, 2017 December 31, 2016 September 30, 2016
Total assets 1,621,110 1,611,662 1,584,416 Total non-current liabilities 510,590 525,605 293,767
Source (Use) of Cash (000's of $) 2017 2016$ Increase(Decrease)
2017 2016$ Increase(Decrease)
Cash provided by operating activities before changes in non-cash working capital items 48,511 48,735 (224) 96,121 79,764 16,357 Changes in non-cash working capital items 36,962 40,816 (3,854) 1,864 22,446 (20,582)
Cash provided by operating activities 85,473 89,551 (4,078) 97,985 102,210 (4,225) Investing activities (15,776) (13,317) 2,459 (65,657) (25,425) 40,232 Financing activities (40,405) (44,709) (4,304) (59,641) (63,701) (4,060) Increase (decrease) in cash and cash equivalents 29,292 31,525 (2,233) (27,313) 13,084 (40,397)
For the three months ended September 30 For the nine months ended September 30
10
In the third quarter of 2017 cash provided by operating activities changed by $4,078,000 compared to the prior year’s quarter. The net decrease is primarily the result of the change in non-cash working capital, trade receivables, income taxes payable and inventories.
Cash Used In Investing Activities
Investing Activities relate primarily to capital expenditures and the purchase and sale of available-for-sale financial assets.
In the third quarter of 2017 cash used in investing activities increased by $2,459,000 compared to the prior year’s quarter. This
change is the net result of increased purchases of property, plant and equipment offset by the change in the purchase and sale
of available-for-sale financial assets.
Cash Used in Financing Activities
Financing Activities consist primarily of cash used to pay dividends and the loans and borrowings used to acquire The Brick.
In the third quarter of 2017 cash used in financing activities decreased by $4,304,000 compared to the prior year’s quarter. The
change relates to the repayment of the Company’s revolving loan and the term loan. In the third quarter of 2017, there was a
$30,000,000 repayment compared to a $35,000,000 repayment in the comparative period.
Adequacy of Financial Resources
At September 30, 2017, the Company’s current assets exceeded its current liabilities by $138,165,000 and its cash and cash
equivalents, available-for-sale financial assets and restricted marketable securities were $90,832,000 compared to $99,664,000
at December 31, 2016. Under the Company’s Senior Secured Credit Agreement we had unused borrowing capacity of
$49,595,000 as at September 30, 2017 ($49,500,000 as at December 31, 2016). The Company believes that its existing
financing resources together with its continuing cash flow from operations will provide a sound liquidity and working capital
position throughout the next twelve months.
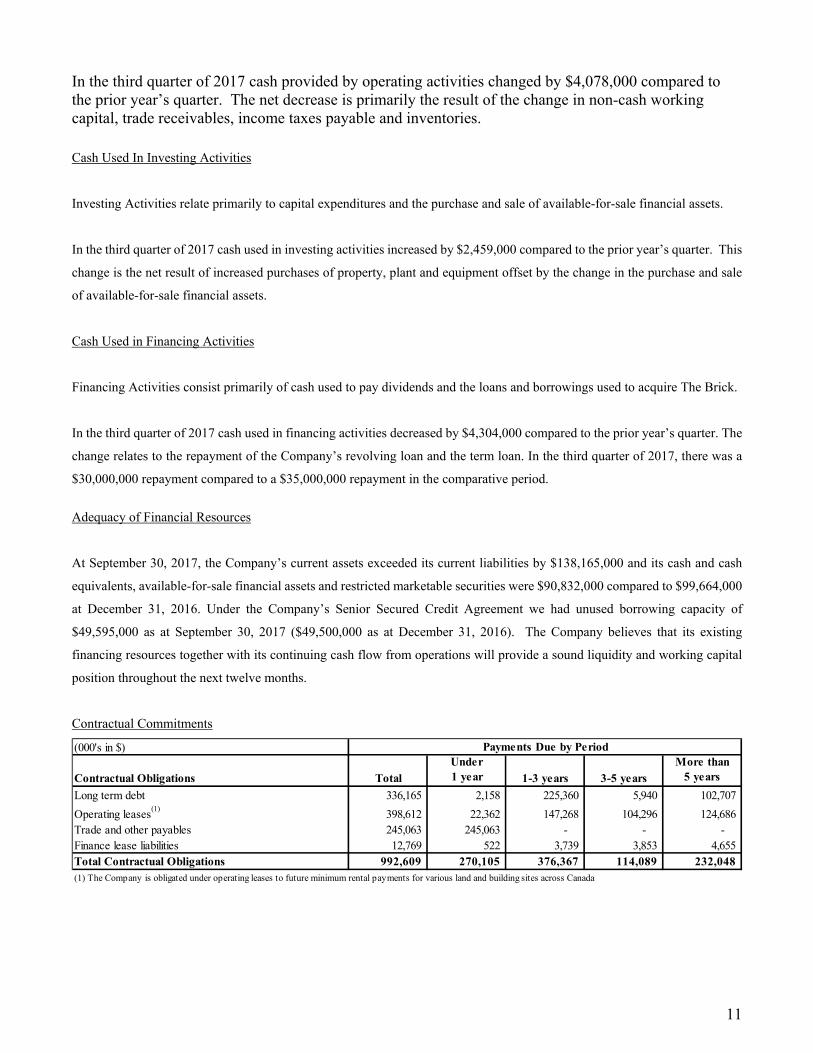
Contractual Commitments
(000's in $)
Contractual Obligations Total
Under1 year 1-3 years 3-5 years
More than5 years
Long term debt 336,165 2,158 225,360 5,940 102,707
Operating leases(1)
398,612 22,362 147,268 104,296 124,686 Trade and other payables 245,063 245,063 - - - Finance lease liabilities 12,769 522 3,739 3,853 4,655 Total Contractual Obligations 992,609 270,105 376,367 114,089 232,048 (1) The Company is obligated under operating leases to future minimum rental payments for various land and building sites across Canada
Payments Due by Period
11
7. OUTLOOK
With the expansion of nine new retail locations and our continuing strong growth in ecommerce, we expect to see continued
growth in sales for 2017, maintain gross margins and continue to drive efficiencies.
8. OUTSTANDING COMMON SHARES
At September 30, 2017, there were 72,322,220 common shares issued and outstanding. During the quarter ended September
30, 2017, 8,092 series 2009 shares, 11,500 series 2012 shares, 29,550 series 2013, 1,425 series 2014 shares and $nil convertible
debentures were converted into common shares. For details on the Company’s commitments related to its redeemable shares
please refer to Note 11 of the unaudited interim consolidated financial statements.
9. RELATED PARTY TRANSACTIONS
At September 30, 2017, we had no transactions with related parties as defined in IAS24 – Related Party Disclosures, except
those pertaining to transactions with key management personnel in the ordinary course of their employment.
10. CRITICAL ASSUMPTIONS
Use of Estimates and Judgments
Management has exercised judgment in the process of applying the Company’s accounting policies. The preparation of
consolidated financial statements in accordance with IFRS requires management to make estimates and assumptions that affect
the reported amounts of assets and liabilities and disclosure of contingent assets and liabilities at the consolidated balance sheet
dates and the reported amounts of revenue and expenses during the reporting period. Estimates and other judgments are
continuously evaluated and are based on management’s experience and other factors, including expectations about future events
that are believed to be reasonable under the circumstances. Actual results could differ from those estimates. The following
discusses the most significant accounting judgments and estimates that the Company has made in the preparation of the
consolidated financial statements.
Extended Warranty Revenue Recognition
The Company offers extended warranties on certain merchandise. Management has applied judgment in determining the basis
upon and period over which to recognize deferred warranty revenue.
Inventories
The Company estimates the net realizable value as the amount at which inventories are expected to be sold by taking into
account fluctuations of retail prices due to prevailing market conditions. If required, inventories are written down to net
realizable value when the cost of inventories is estimated to not be recoverable due to obsolescence, damage or declining sales
prices.
12
Reserves for slow moving and damaged inventory are deducted in the Company’s valuation of inventories. Management has
estimated the amount of reserve for slow moving inventory based on the Company’s historic retail experience.
Impairment of available-for-sale financial assets and marketable securities
The Company exercises judgment in the determination of whether there are objective indicators of impairment with respect to
its available-for-sale financial assets and marketable securities. This includes making judgments as to whether a potential
impairment is either significant or prolonged with respect to equity securities held.
Impairment of property, plant and equipment
The Company exercises judgment in the determination of cash-generating units (“CGUs”) for purposes of assessing any
impairment of property, plant and equipment, as well as in determining whether there are indicators of impairment present.
Should indicators of impairment be present, management estimates the recoverable amount of the relevant CGU. This
estimation requires assumptions about future cash flows, margins and discount rates.
Impairment of goodwill and intangible assets
The Company tests goodwill and indefinite life intangible assets at least annually and reviews other long-lived intangible assets
for any indication that the asset might be impaired. Significant judgments are required in determining the CGUs or groups of
CGUs for purposes of assessing impairment. Significant judgments are also required in determining whether to allocate
goodwill to CGUs or groups of CGUs. When performing impairment tests, the Company estimates the recoverable amount of
the CGUs or groups of CGUs to which goodwill and indefinite life intangible assets have been allocated using a discounted
cash flow model that requires assumptions about future cash flows, margins and discount rates.
Provisions
The Company exercises judgment in the determination of recognizing a provision. The Company recognizes a provision when
it has a present legal or constructive obligation as a result of a past event and a reliable estimate of the obligation can be made.
Significant judgments are required to be made in determining what the probable outflow of resources will be required to settle
the obligation.
Materiality
In preparing this MD&A and the information contained herein, management considers the likelihood that a reasonable investor
would be influenced to buy or not buy, or to sell or hold securities of the Company if such information were omitted or
misstated. This concept of materiality is consistent with the notion of materiality applied to financial statements and contained
in IFRS.
13
Recent Accounting Pronouncements
IFRS 9 Financial Instruments
In July 2014, the IASB issued the final amendments to IFRS 9, Financial Instruments (“IFRS 9”), which provides guidance on
the classification and measurement of financial assets and liabilities, impairment of financial assets, and general hedge
accounting. IFRS 9 will replace IAS 39 ‘Financial Instruments: Recognition and Measurement’ for accounting periods
commencing on or after 1 January 2018. Any changes to recognition and measurement will be applied retrospectively by
adjusting the opening balance sheet at that time. There is no requirement to restate comparative amounts.
The core areas addressed within IFRS 9 are Classification and measurement of financial assets and liabilities, impairment of
financial assets and hedge accounting
The most significant impact on the Company is likely to be in relation to impairment of financial assets as outlined in the
relevant section below.
Classification and measurement
Under IFRS 9, existing IAS 39 classification and measurement categories are being replaced with fair value through the income
statement (FVTPL), fair value through other comprehensive income (FVOCI) and amortized cost.
The classification of financial assets and liabilities is expected to remain consistent under IFRS 9 with the possible exception
of equity securities. Under IFRS 9, the Company will have the option to designate equity securities as financial assets at fair
value through other comprehensive income, where they will be recorded initially at fair value with changes in fair value
recognized in other comprehensive income which will not be subsequently transferred into earnings (loss). If the Company
does not make this election, changes in fair value of the equity securities will be recognized in earnings (loss).
Under IFRS 9, the financial liabilities categories going forward are FVTPL and amortized cost. These are consistent with the
categories under IAS 39 and it is expected there will be no impact on transition to and reporting under IFRS 9.
Impairment of financial assets
The measurement of impairment of financial assets is based on an expected credit loss model. It is no longer necessary for a
triggering event to have occurred before credit losses are recognized. IFRS 9 also includes new disclosure requirements about
expected credit losses and credit risk. This change is not expected to be material.
Hedge accounting
The new general hedge accounting model more closely aligns hedge accounting with risk management activities undertaken
by entities when hedging their financial and non-financial risk exposures. The new model will provide more opportunities to
apply hedge accounting to reflect actual risk management activities.
14
IFRS 9 will require certain additional disclosures, however, overall the changes are not expected to have any major impact on
the Group’s current accounting treatment.
IFRS 15, Revenue from Contracts with Customers
IFRS 15, Revenue from Contracts with Customers (“IFRS 15”), was issued in May 2014, which will replace IAS 11,
Construction Contracts, IAS 18, Revenue Recognition, IFRIC 13, Customer Loyalty Programmes, IFRIC 15, Agreements for
the Construction of Real Estate, IFRIC 18, Transfers of Assets from Customers, and SIC-31, Revenue – Barter Transactions
Involving Advertising Services. IFRS 15 provides a single, principles based five-step model that will apply to all contracts with
customers with limited exceptions, including, but not limited to, leases within the scope of IAS 17, Leases (“IAS 17”); financial
instruments and other contractual rights or obligations within the scope of IFRS 9, IFRS 10, Consolidated Financial Statements
and IFRS 11, Joint Arrangements (“IFRS 11”).
To apply this principle, entities must follow the five-step model below:
1. Identify the contract(s) with a customer – written, oral or implied by an entity’s customary business practices.
2. Identify the performance obligations in the contract(s) – evaluate the terms in the contract to identify all the promised
goods or services and then determine which of these will be treated as separate performance obligations. They are separate
if the customer can benefit from the good or service on its own (i.e. it is distinct).
3. Determine the transaction price – the amount that an entity expects to be entitled to in exchange for transferring goods or
services to a customer, excluding amounts collected on behalf of third parties.
4. Allocate the transaction price to the performance obligations – generally in proportion to their stand-alone selling prices.
5. Recognize revenue when (or as) the entity satisfies each performance – when control of a promised good or service
transfers to the customer.
In addition to the five-step model, the standard specifies how to account for the incremental costs of obtaining a contract and
the costs directly related to fulfilling a contract. The incremental costs of obtaining a contract must be recognized as an asset if
the entity expects to recover these costs.
The standard’s requirements will also apply to the recognition and measurement of gains and losses on the sale of some
nonfinancial assets that are not an output of the entity’s ordinary activities. The Company will have to apply the requirements
for constraining estimates of variable consideration to any gain or loss that will be recognized. The standard requires a risk-
and-rewards test to identify the date of disposal which may lead to a change in the date of disposal, if the risks and rewards
transfer at a different date from control which may happen if the consideration includes a deferred or variable payment and the
Company retains risks and rewards through that variability.
15
The Company has performed a detailed impact assessment during the year, identifying all current sources of revenue and
analyzing the accounting requirements for each under IFRS 15. Currently the Group does not expect any material changes to
either revenue or profit as a result of adopting IFRS 15.
In January 2016, the IASB issued IFRS 16, Leases, which will replace IAS 17. The new standard will be effective for fiscal
years beginning on or after January 1, 2019. Earlier application is permitted. Under the new standard, all leases will be on the
balance sheet of lessees, except those that meet limited exception criteria. As the Company has significant contractual
obligations in the form of operating leases under the existing standard, there will be a material increase to both assets and
liabilities upon adoption of the new standard. The Company is analyzing the new standard to determine its impact on the
Company’s consolidated financial statements.
IFRS 17 Insurance Contracts
IFRS 17, Insurance Contracts, was issued in May 2017 to replace IFRS 4 Insurance Contracts. IFRS 17 establishes the
principles for the recognition, measurement, presentation and disclosure of insurance contracts. The objective of IFRS 17 is to
ensure that an entity provides relevant information that faithfully represents the contracts. The standard requires the Company
to distinguish between groups of contracts expected to be profit making and groups of contracts expected to be loss making.
The new standard is effective for annual periods beginning on or after January 1, 2021. Earlier adoption is permitted. The
Company has not yet assessed the impact of this standard on the Company’s consolidated financial statements.
IFRIC 23 Uncertainty over Income Tax Treatments
IFRIC 23, Uncertainty over Income Tax Treatments, was issued in June 2017. IFRIC 23 clarifies how the recognition and
measurement requirements of IAS are applied where there is uncertainty over income tax treatments. If an entity concludes
that it is probable the tax authority will accept an uncertain tax treatment on a tax return it should determine its accounting for
income taxes consistently with the tax treatment. IF an entity concludes that it is not probable it should reflect the effect of the
uncertainty in its tax accounting in the period in which that determination is made. IFRIC 23 is effective for annual periods
beginning on or after January 1, 2019. Earlier adoption is permitted. The Company has not yet assessed the impact of this
interpretation on the Company’s consolidated financial statements.
11. RISKS AND UNCERTAINTIES
Careful consideration should be given to the following risk factors. These descriptions of risks are not the only ones facing the
Company. Additional risks and uncertainties not presently known to Leon’s, or that the Company deems immaterial, may also
impair the operations of the Company. If any of such risks actually occur, the business, financial condition, liquidity, and results
of operations of the Company could be materially adversely affected.
Readers of this MD&A are also encouraged to refer to Leon’s Annual Information Form (“AIF”) dated March 28, 2017 which
provides information on the risk factors facing the Company. The March 28, 2017 AIF can be found on line at www.sedar.com.
16
Sensitivity to General Economic Conditions
The household furniture, mattress, appliance and home electronics retailing industry in Canada has historically been subject to
cyclical variations in the general economy and to uncertainty regarding future economic prospects. The Company’s sales are
impacted by the health of the economy in Canada as a whole, and in the regional markets in which the Company operates.
The Company’s sales and financial results are subject to numerous uncertainties. Weakness in sales or consumer confidence
could result in an increasingly challenging operating environment.
Maintaining Profitability & Managing Growth
There can be no assurance that the Company’s business and growth strategy will enable it to sustain profitability in future
periods. The Company’s future operating results will depend on a number of factors, including (i) the Company’s ability to
continue to successfully execute its strategic initiatives, (ii) the level of competition in the household furniture, mattress,
appliance and home electronics retailing industry in the markets in which the Company operates, (iii) the Company’s ability to
remain a low-cost retailer, (iv) the Company’s ability to realize increased sales and greater levels of profitability through its
retail stores, (v) the effectiveness of the Company’s marketing programs, (vi) the Company’s ability to successfully identify
and respond to changes in fashion trends and consumer tastes in the household furniture, mattress, appliance and home
electronics retailing industry, (vii) the Company’s ability to maintain cost effective delivery of its products, (viii) the
Company’s ability to hire, train, manage and retain qualified retail store management and sales professionals, (ix) the
Company’s ability to continuously improve its service to achieve new and enhanced customer benefits and better quality, and
(x) general economic conditions and consumer confidence.
Financial Condition of Commercial Sales Customers & Franchisees
Through its commercial sales division, the Company sells products and extends credit to high-rise and condominium builders
who purchase large quantities of products. The Company also sells products and extends credit to its franchisees. Negative
changes in the financial condition of a significant commercial sales customer or a franchisee could impact on the Company’s
receivables and ultimately result in the Company having to take a bad-debt write-off in excess of allowance for bad debts. The
occurrence of such an event could have a material adverse effect on the Company’s business, financial condition, liquidity and
results of operations.
Competition
The household furniture, mattress, appliance and home electronics retailing industry is highly competitive and highly
fragmented. The Company faces competition in all regions in which its operations are located by existing stores that sell similar
products and also by stores that may be opened in the future by existing or new competitors in such markets. The Company
competes directly with many different types of retail stores that sell many of the products sold by the Company. Such
competitors include (i) department stores, (ii) specialty stores (such as specialty electronics, appliance, or mattress retailers),
(iii) other national or regional chains offering household furniture, mattresses, appliances and home electronics, (iv) ecommerce
entities, and (v) other independent retailers, particularly those associated with larger buying groups. The highly competitive
17
nature of the industry means the Company is constantly subject to the risk of losing market share to its competitors. As a result,
the Company may not be able to maintain or to raise the prices of its products in response to competitive pressures. In addition,
the entrance of additional competitors to the markets in which the Company operates, particularly large furniture, appliance or
electronics retailers from the United States could increase the competitive pressure on the Company and have a material adverse
effect on the Company’s market share. The actions and strategies of the Company’s current and potential competitors could
have a material adverse effect on the Company’s business, financial condition, liquidity and results of operations.
12. CONTROLS AND PROCEDURES
Disclosure Controls & Procedures
Management is responsible for establishing and maintaining a system of disclosure controls and procedures to provide
reasonable assurance that all material information relating to the Company is gathered and reported on a timely basis to senior
management, including the Chief Executive Officer and Chief Financial Officer so that appropriate decisions can be made by
them regarding public disclosure. Based on the evaluation of disclosure controls and procedures, the CEO and CFO have
concluded that the Company's disclosure controls and procedures were effective as at September 30, 2017.
Internal Controls over Financial Reporting
Management is also responsible for establishing and maintaining disclosure controls and procedures and internal controls over
financial reporting for the Company. The control framework used in the design of disclosure controls and procedures and
internal control over financial reporting is based on the criteria set forth by the Committee of Sponsoring Organizations of the
Treadway Commission in Internal Control-Integrated Framework (2013).
Management, including the CEO and CFO, does not expect that the Company’s disclosure controls or internal controls over
financial reporting will prevent or detect all errors and all fraud or will be effective under all potential future conditions. A
control system is subject to inherent limitations and, no matter how well designed and operated, can provide only reasonable,
not absolute, assurance that the control systems objectives will be met.
During the three months ended September 30, 2017, there have been no changes in the Company’s internal controls over
financial reporting that have materially affected, or are reasonably likely to materially affect, the Company’s internal controls
over financial reporting.
18