Embed Size (px)
Citation preview
JPMorgan Chase & Co. / 2006 Annual Report 23
ness loans, investments and insurance. Over 1,200 additional mortgage offi-cers provide home loans throughout the country.
Card ServicesWith more than 154 million cards in circulation and $152.8 billion in managedloans, Chase Card Services (“CS”) is one of the nation’s largest credit cardissuers. Customers used Chase cards for over $339 billion worth of transac-tions in 2006.
Chase offers a wide variety of general-purpose cards to satisfy the needs ofindividual consumers, small businesses and partner organizations, includingcards issued with AARP, Amazon, Continental Airlines, Marriott, SouthwestAirlines, Sony, United Airlines, Walt Disney Company and many other well-known brands and organizations. Chase also issues private-label cards withCircuit City, Kohl’s, Sears Canada and BP.
Chase Paymentech Solutions, LLC, a joint venture with JPMorgan Chase andFirst Data Corporation, is the largest processor of MasterCard and Visa pay-ments in the world, having handled over 18 billion transactions in 2006.
Commercial BankingCommercial Banking (“CB”) serves more than 30,000 clients, including corpo-rations, municipalities, financial institutions and not-for-profit entities. Theseclients generally have annual revenues ranging from $10 million to $2 billion.Commercial bankers serve clients nationally throughout the RFS footprint andin offices located in other major markets.
Commercial Banking offers its clients industry knowledge, experience, a dedi-cated service model, comprehensive solutions and local expertise. The Firm’sbroad platform positions CB to deliver extensive product capabilities –including lending, treasury services, investment banking and asset manage-ment – to meet its clients’ U.S. and international financial needs.
Treasury & Securities Services Treasury & Securities Services (“TSS”) is a global leader in providing transac-tion, investment and information services to support the needs of institutionalclients worldwide. TSS is one of the largest cash management providers in theworld and a leading global custodian. Treasury Services (“TS”) provides a vari-ety of cash management products, trade finance and logistics solutions, whole-sale card products, and liquidity management capabilities to small and midsizedcompanies, multinational corporations, financial institutions and governmententities. TS partners with the Commercial Banking, Retail Financial Servicesand Asset Management businesses to serve clients firmwide. As a result, cer-tain TS revenues are included in other segments’ results. Worldwide SecuritiesServices (“WSS”) stores, values, clears and services securities and alternativeinvestments for investors and broker-dealers; and manages Depositary Receiptprograms globally.
INTRODUCT ION
JPMorgan Chase & Co., a financial holding company incorporated underDelaware law in 1968, is a leading global financial services firm and one ofthe largest banking institutions in the United States, with $1.4 trillion inassets, $115.8 billion in stockholders’ equity and operations worldwide. TheFirm is a leader in investment banking, financial services for consumers andbusinesses, financial transaction processing, asset management and privateequity. Under the JPMorgan and Chase brands, the Firm serves millions of cus-tomers in the United States and many of the world’s most prominent corpo-rate, institutional and government clients.
JPMorgan Chase’s principal bank subsidiaries are JPMorgan Chase Bank,National Association (“JPMorgan Chase Bank, N.A.”), a national bankingassociation with branches in 17 states; and Chase Bank USA, NationalAssociation (“Chase Bank USA, N.A.”), a national bank that is the Firm’scredit card issuing bank. JPMorgan Chase’s principal nonbank subsidiary isJ.P. Morgan Securities Inc., the Firm’s U.S. investment banking firm.
JPMorgan Chase’s activities are organized, for management reporting purposes,into six business segments, as well as Corporate. The Firm’s wholesale busi-nesses comprise the Investment Bank, Commercial Banking, Treasury &Securities Services and Asset Management segments. The Firm’s consumerbusinesses comprise the Retail Financial Services and Card Services segments.A description of the Firm’s business segments, and the products and servicesthey provide to their respective client bases, follows.
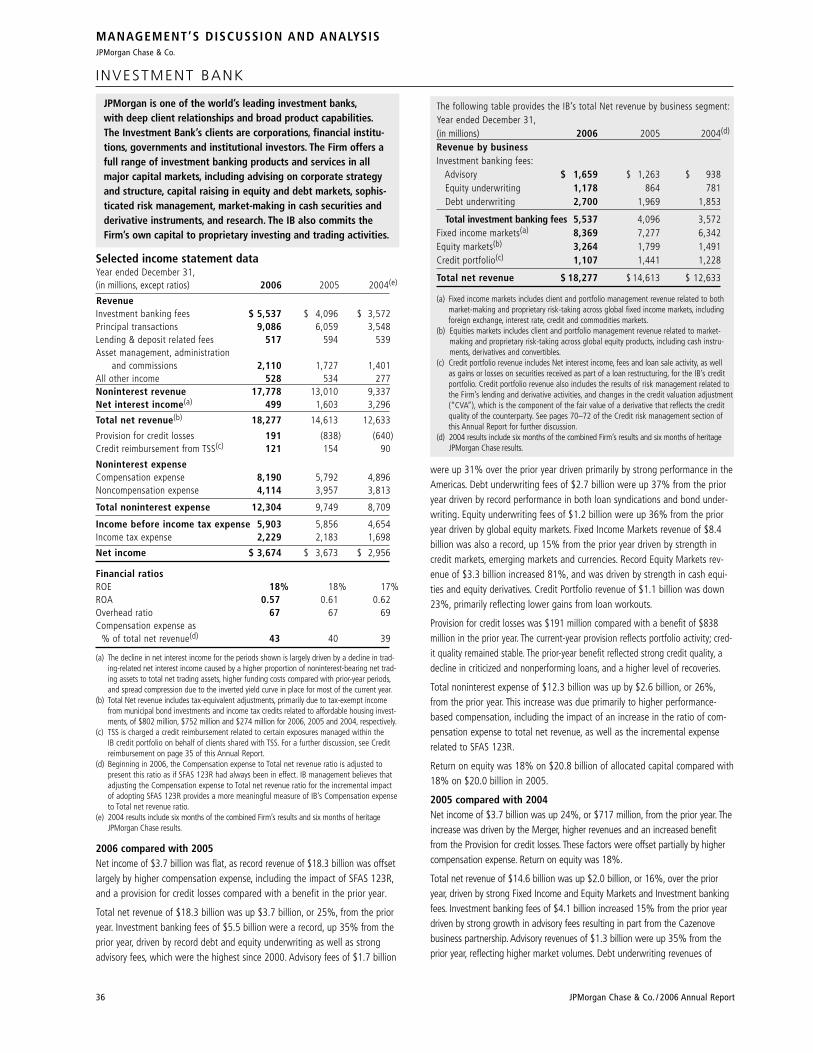
Investment BankJPMorgan is one of the world’s leading investment banks, with deep clientrelationships and broad product capabilities. The Investment Bank’s clients arecorporations, financial institutions, governments and institutional investors. TheFirm offers a full range of investment banking products and services in allmajor capital markets, including advising on corporate strategy and structure,capital raising in equity and debt markets, sophisticated risk management,market-making in cash securities and derivative instruments, and research. TheInvestment Bank (“IB”) also commits the Firm’s own capital to proprietaryinvesting and trading activities.
Retail Financial ServicesRetail Financial Services (“RFS”), which includes Regional Banking, MortgageBanking and Auto Finance reporting segments, helps meet the financial needsof consumers and businesses. RFS provides convenient consumer bankingthrough the nation’s fourth-largest branch network and third-largest ATM net-work. RFS is a top-five mortgage originator and servicer, the second-largesthome equity originator, the largest noncaptive originator of automobile loansand one of the largest student loan originators.
RFS serves customers through more than 3,000 bank branches, 8,500 ATMsand 270 mortgage offices, and through relationships with more than 15,000auto dealerships and 4,300 schools and universities. More than 11,000 branchsalespeople assist customers, across a 17-state footprint from New York toArizona, with checking and savings accounts, mortgage, home equity and busi-
This section of the Annual Report provides management’s discussion and analysis
(“MD&A”) of the financial condition and results of operations for JPMorgan Chase.
See the Glossary of terms on pages 145–146 for definitions of terms used through-
out this Annual Report. The MD&A included in this Annual Report contains state-
ments that are forward-looking within the meaning of the Private Securities
Litigation Reform Act of 1995. Such statements are based upon the current beliefs
and expectations of JPMorgan Chase’s management and are subject to significant
risks and uncertainties. These risks and uncertainties could cause JPMorgan Chase’s
results to differ materially from those set forth in such forward-looking statements.
Certain of such risks and uncertainties are described herein (see Forward-looking
statements on page 147 of this Annual Report) and in the JPMorgan Chase Annual
Report on Form 10-K for the year ended December 31, 2006 (“2006 Form 10-K”),
in Part I, Item 1A: Risk factors, to which reference is hereby made.
MANAGEMENT’S DISCUSSION AND ANALYSISJPMorgan Chase & Co.

MANAGEMENT’S DISCUSSION AND ANALYSISJPMorgan Chase & Co.
24 JPMorgan Chase & Co. / 2006 Annual Report
Asset ManagementWith assets under supervision of $1.3 trillion, Asset Management (“AM”) is aglobal leader in investment and wealth management. AM clients include institu-tions, retail investors and high-net-worth individuals in every major marketthroughout the world. AM offers global investment management in equities,fixed income, real estate, hedge funds, private equity and liquidity, includingboth money market instruments and bank deposits. AM also provides trust andestate and banking services to high-net-worth clients, and retirement servicesfor corporations and individuals. The majority of AM’s client assets are in activelymanaged portfolios.
Merger with Bank One Corporation Effective July 1, 2004, Bank One Corporation (“Bank One”) merged with andinto JPMorgan Chase & Co. (the “Merger”). As a result of the Merger, each outstanding share of common stock of Bank One was converted in a stock-for-stock exchange into 1.32 shares of common stock of JPMorgan Chase &Co. The Merger was accounted for using the purchase method of accounting.Accordingly, the Firm’s results of operations for 2004 include six months ofheritage JPMorgan Chase results and six months of the combined Firm’sresults. For additional information regarding the Merger, see Note 2 on pages95–96 of this Annual Report.
2006 Business events Acquisition of the consumer, business banking and middle-marketbanking businesses of The Bank of New York in exchange forselected corporate trust businesses, including trustee, payingagent, loan agency and document management servicesOn October 1, 2006, JPMorgan Chase completed the acquisition of The Bankof New York Company, Inc.’s (“The Bank of New York”) consumer, businessbanking and middle-market banking businesses in exchange for selected cor-porate trust businesses plus a cash payment of $150 million. This acquisitionadded 339 branches and more than 400 ATMs, and it significantly strengthensRFS’s distribution network in the New York Tri-state area. The Bank of NewYork businesses acquired were valued at a premium of $2.3 billion; the Firm’scorporate trust businesses that were transferred (i.e., trustee, paying agent,loan agency and document management services) were valued at a premiumof $2.2 billion. The Firm also may make a future payment to The Bank of NewYork of up to $50 million depending on certain new account openings. Thistransaction included the acquisition of approximately $7.7 billion in loans and$12.9 billion in deposits from The Bank of New York. The Firm also recog-nized core deposit intangibles of $485 million which will be amortized usingan accelerated method over a 10 year period. JPMorgan Chase recorded anafter-tax gain of $622 million related to this transaction in the fourth quarterof 2006.
JPMorgan Partners managementOn August 1, 2006, the buyout and growth equity professionals of JPMorganPartners (“JPMP”) formed an independent firm, CCMP Capital, LLC (“CCMP”),and the venture professionals separately formed an independent firm,Panorama Capital, LLC (“Panorama”). The investment professionals of CCMPand Panorama continue to manage the former JPMP investments pursuant to amanagement agreement with the Firm.
Sale of insurance underwriting businessOn July 1, 2006, JPMorgan Chase completed the sale of its life insurance andannuity underwriting businesses to Protective Life Corporation for cash pro-ceeds of approximately $1.2 billion, consisting of $900 million of cashreceived from Protective Life Corporation and approximately $300 million ofpreclosing dividends received from the entities sold. The after-tax impact ofthis transaction was negligible. The sale included both the heritage Chaseinsurance business and the insurance business that Bank One had boughtfrom Zurich Insurance in 2003.
Acquisition of private-label credit card portfolio from Kohl’s CorporationOn April 21, 2006, JPMorgan Chase completed the acquisition of $1.6 billionof private-label credit card receivables and approximately 21 million accountsfrom Kohl’s Corporation (“Kohl’s”). JPMorgan Chase and Kohl’s have alsoentered into an agreement under which JPMorgan Chase will offer private-label credit cards to both new and existing Kohl’s customers.
Collegiate Funding ServicesOn March 1, 2006, JPMorgan Chase acquired, for approximately $663 mil-lion, Collegiate Funding Services, a leader in education loan servicing andconsolidation. This acquisition included $6 billion of education loans and willenable the Firm to create a comprehensive education finance business.
Acquisition of certain operations from Paloma PartnersOn March 1, 2006, JPMorgan Chase acquired the middle and back officeoperations of Paloma Partners Management Company (“Paloma”), which waspart of a privately owned investment fund management group. The partiesalso entered into a multiyear contract under which JPMorgan Chase will pro-vide daily operational services to Paloma. The acquired operations have beencombined with JPMorgan Chase’s current hedge fund administration unit,JPMorgan Tranaut.
JPMorgan and Fidelity Brokerage CompanyOn February 28, 2006, the Firm announced a strategic alliance with FidelityBrokerage to become the exclusive provider of new issue equity securities andthe primary provider of fixed income products to Fidelity’s brokerage clientsand retail customers, effectively expanding the Firm’s existing distributionplatform.
JPMorgan Chase & Co. / 2006 Annual Report 25
Business overview The Firm reported record 2006 net income of $14.4 billion, or $4.04 pershare, compared with net income of $8.5 billion, or $2.38 per share, for2005. The return on common equity was 13% compared with 8% in 2005.Reported results include discontinued operations related to the exchange ofselected corporate trust businesses for the consumer, business banking andmiddle-market banking businesses of The Bank of New York. Discontinuedoperations produced $795 million of net income in 2006 compared with$229 million in the prior year. The primary driver of the increase was a one-time gain of $622 million related to the sale of the corporate trust business(for further information on discontinued operations see Note 3 on page 97 ofthis Annual Report). Income from continuing operations was a record $13.6billion, or $3.82 per share, compared with $8.3 billion, or $2.32 per share, for2005. For a detailed discussion of the Firm's consolidated results of opera-tions, see pages 28–31 of this Annual Report.
Effective December 31, 2006, William B. Harrison, Jr. retired as Chairman ofthe Board and was succeeded as Chairman by Chief Executive Officer JamesDimon.
The Firm’s record 2006 results were affected positively by global economicconditions, investment in each line of business and the successful completionof milestones in the execution of its Merger integration plan. A key milestonerelated to the Merger integration was the New York Tri-state consumer con-version, which linked the Firm’s more than 2,600 branches in 17 states on acommon systems platform (excluding 339 branches acquired from The Bankof New York on October 1, 2006). The Tri-state conversion, along with manyother merger integration activities, resulted in continued efficiencies. As aresult the Firm made significant progress toward reaching its annual merger-related savings target of approximately $3.0 billion by the end of 2007. TheFirm realized approximately $675 million of incremental merger savings in2006, bringing estimated cumulative savings for 2006 to $2.5 billion, and theannualized run-rate of savings entering 2007 is approximately $2.8 billion. Inorder to achieve these savings, the Firm expensed Merger costs of $305 mil-lion during the year (including a modest amount of costs related to The Bank
of New York transaction), bringing the total cumulative amount expensed sincethe Merger announcement to approximately $3.4 billion (including capitalizedcosts). Management currently estimates remaining Merger costs of approxi-mately $400 million, which are expected to be incurred during 2007 and willinclude a modest amount of expense related to the acquisition of The Bank ofNew York’s consumer, business banking and middle-market banking businesses.
The Firm also continued active management of its portfolio of businesses dur-ing 2006. Actions included: exchanging selected corporate trust businesses forthe consumer, business banking and middle-market banking businesses of TheBank of New York; divesting the insurance underwriting business; purchasingCollegiate Funding Services to develop further the education finance business;acquiring Kohl’s private-label credit card portfolio; acquiring the middle andback office operations of Paloma Partners to expand the Firm’s hedge fundadministration capabilities; and announcing a strategic alliance with FidelityBrokerage to provide new issue equity and fixed income products.
In 2006, the global economy continued to expand, which supported contin-ued rapid growth in the emerging market economies. Global gross domesticproduct increased by an estimated 5%, with the European economy gainingmomentum, Japan making steady progress and emerging Asian economiesexpanding approximately 8%. The U.S. economy rebounded early in the yearfrom the prior-year hurricane disruptions, but weakened in the second half ofthe year as home construction declined, automobile manufacturing weakenedand the benefit of reconstruction from hurricane disruptions dissipated. TheU.S. experienced rising interest rates during the first half of the year, as theFederal Reserve Board increased the federal funds rate from 4.25% to5.25%. With an anticipated slowing of economic growth, lower inflation andstabilizing energy prices, the federal funds rate was held steady during thesecond half of the year. The yield curve subsequently inverted as recedinginflation expectations pushed long-term interest rates below the federal fundsrate. Equity markets, both domestic and international, reflected positive perform-ance, with the S&P 500 up 13% on average and international indices increasing16% on average during 2006. Global capital markets activity was strong during2006, with debt and equity underwriting and merger and acquisition activitysurpassing 2005 levels. Demand for wholesale loans in the U.S. was strong withgrowth of approximately 14%, while U.S. consumer loans grew an estimated4% during 2006. U.S. consumer spending grew at a solid pace, supported bystrong equity markets, low unemployment and income growth, and lower ener-gy prices in the second half of the year. This strength came despite a significantdecline in real estate appreciation.
The 2006 economic environment was a contributing factor to the perform-ance of the Firm and each of its businesses. The overall economic expansion,strong level of capital markets activity and positive performance in equitymarkets helped to drive new business volume and organic growth withineach of the Firm’s businesses while also contributing to the stable credit qual-ity within the loan portfolio. However, the interest rate environment affectednegatively wholesale loan spread and consumer loan and deposit spreads.Spreads related to wholesale liabilities widened compared with the prior year,but this benefit declined over the course of 2006.
EXECUT IVE OVERV IEW
This overview of management’s discussion and analysis highlights selected information and may not contain all of the information that is important to readers of thisAnnual Report. For a more complete understanding of events, trends and uncertainties, as well as the capital, liquidity, credit and market risks, and the Criticalaccounting estimates, affecting the Firm and and its various lines of business, this Annual Report should be read in its entirety.
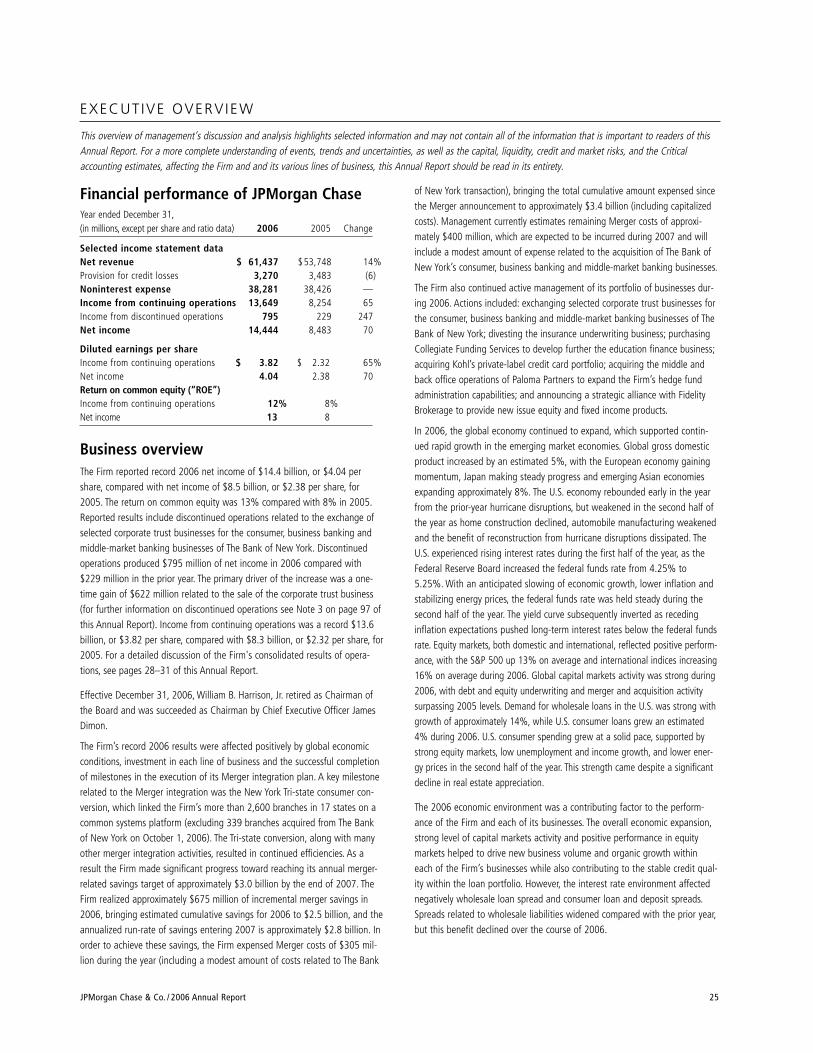
Financial performance of JPMorgan ChaseYear ended December 31,(in millions, except per share and ratio data) 2006 2005 Change
Selected income statement dataNet revenue $ 61,437 $53,748 14%Provision for credit losses 3,270 3,483 (6)Noninterest expense 38,281 38,426 —Income from continuing operations 13,649 8,254 65Income from discontinued operations 795 229 247Net income 14,444 8,483 70
Diluted earnings per shareIncome from continuing operations $ 3.82 $ 2.32 65%Net income 4.04 2.38 70Return on common equity (“ROE”)Income from continuing operations 12% 8%Net income 13 8
MANAGEMENT’S DISCUSSION AND ANALYSISJPMorgan Chase & Co.
26 JPMorgan Chase & Co. / 2006 Annual Report
The discussion that follows highlights the performance of each business segment compared with the prior year, and discusses results on a managedbasis unless otherwise noted. For more information about managed basis,See Explanation and reconciliation of the Firm’s use of non-GAAP financialmeasures on pages 32–33 of this Annual Report.
Investment Bank net income was flat compared with the prior year, asrecord revenue was offset by higher compensation expense and a provision forcredit losses compared with a benefit in the prior year. Revenue benefitedfrom investments in key business initiatives, increased market share and higherglobal capital markets activity. Record investment banking fees were driven byrecord debt and equity underwriting fees and strong advisory fees. Fixedincome markets revenue set a new record with strength in credit markets,emerging markets and currencies. Equity markets revenue was also at a recordlevel, reflecting strength in cash equities and equity derivatives. The current-year Provision for credit losses reflects portfolio activity; credit qualityremained stable. The increase in expense was primarily the result of higherperformance-based compensation including the impact of a higher ratio ofcompensation expense to revenue and the adoption of SFAS 123R.
Retail Financial Services net income was down from the prior year aslower results in Mortgage Banking were offset partially by improved perform-ance in Regional Banking and Auto Finance. Revenue declined due to lowerrevenue in Mortgage Banking, narrower loan and deposit spreads in RegionalBanking and the sale of the insurance business on July 1, 2006. Deposit andloan spreads reflected the current interest rate and competitive environments.These factors were offset partially by increases in average deposit and loanbalances and higher deposit-related and branch production fees in RegionalBanking, which benefited from the continued investment in the retail bankingdistribution network and the overall strength of the U.S. economy. The provi-sion for credit losses declined from the prior year due to the absence of a spe-cial provision related to Hurricane Katrina in 2005, partially offset by theestablishment of additional allowance for loan losses related to loans acquiredfrom The Bank of New York. Expense increased, reflecting the purchase ofCollegiate Funding Services in the first quarter of 2006 and ongoing invest-ments in the retail banking distribution network, with the net addition duringthe year of 438 branch offices (including 339 from The Bank of New York),1,194 ATMs and over 500 personal bankers. Partially offsetting these increaseswere the sale of the insurance business and merger-related and other operat-ing efficiencies.
Card Services net income was a record, increasing significantly comparedwith the prior year, primarily the result of a lower provision for credit losses.Net revenue (excluding the impact of the deconsolidation of Paymentech)declined slightly from the prior year. Net interest income was flat as the bene-fit of an increase in average managed loan balances, partially due to portfolioacquisitions as well as marketing initiatives, was offset by the challenginginterest rate and competitive environments. Noninterest revenue declined asincreased interchange income related to higher charge volume from increasedconsumer spending was more than offset by higher volume-driven paymentsto partners, including Kohl’s, and increased rewards expense. The managedprovision for credit losses benefited from significantly lower bankruptcy-relatedcredit losses following the new bankruptcy legislation that became effective inOctober 2005. Underlying credit quality remained strong. Expense (excludingthe impact of the deconsolidation of Paymentech) increased driven by highermarketing spending and acquisitions, partially offset by merger savings.
Commercial Banking net income was a record in 2006. Record revenuebenefited from higher liability balances, higher loan volumes and increasedinvestment banking revenue, all of which benefited from increased salesefforts and U.S. economic growth. Partially offsetting these benefits were loanspread compression and a shift to narrower-spread liability products. The pro-vision for credit losses increased compared with the prior year reflecting port-folio activity and the establishment of additional allowances for loan lossesrelated to loans acquired from The Bank of New York, partially offset by arelease of the unused portion of the special reserve established in 2005 forHurricane Katrina. Credit quality remained stable. Expense increased due tohigher compensation expense related to the adoption of SFAS 123R andincreased expense related to higher client usage of Treasury Services’ products.
Treasury & Securities Services net income was a record and increasedsignificantly over the prior year. Revenue was at a record level driven by high-er average liability balances, business growth, increased product usage byclients and higher assets under custody, all of which benefited from globaleconomic growth and capital markets activity. This growth was offset partiallyby a shift to narrower-spread liability products. Expense increased due tohigher compensation related to business growth, investments in new productsand the adoption of SFAS 123R. The expense increase was offset partially bythe absence of a prior-year charge to terminate a client contract.
Asset Management net income was a record in 2006. Record revenue ben-efited from increased assets under management driven by net asset inflowsand strength in global equity markets, and higher performance and placementfees. The Provision for credit losses was a benefit reflecting net loan recover-ies. Expense increased due primarily to higher performance-based compensa-tion, incremental expense from the adoption of SFAS 123R, and increasedminority interest expense related to Highbridge Capital Management, LLC(“Highbridge”), offset partially by the absence of BrownCo.
Corporate segment reported significantly improved results (excluding theimpact of discontinued operations, as discussed further, below) driven bylower expense, improved revenue and the benefit of tax audit resolutions.Revenue benefited from lower securities losses, improved net interest spreadand a higher level of available-for-sale securities partially offset by theabsence of the gain on the sale of BrownCo and lower Private Equity results.Expense benefited from the absence of prior-year litigation reserve charges,higher insurance recoveries relating to certain material litigation, lower merg-er-related costs and other operating efficiencies. These benefits were offsetpartially by incremental expense related to the adoption of SFAS 123R.
On October 1, 2006, the Firm completed the exchange of selected corporatetrust businesses, including trustee, paying agent, loan agency and documentmanagement services, for the consumer, business banking and middle-marketbanking businesses of The Bank of New York. The corporate trust businesses,which were previously reported in TSS, were reported as discontinued opera-tions. The related balance sheet and income statement activity is reflected inthe Corporate segment for all periods presented. During 2006, these busi-nesses produced $795 million of net income compared with net income of$229 million in the prior year. Net income from discontinued operations wassignificantly higher in 2006 due to a one-time after-tax gain of $622 millionrelated to the sale of these businesses. A modest amount of costs associatedwith the acquisition side of this transaction are included in Merger costs.
JPMorgan Chase & Co. / 2006 Annual Report 27
Credit costs for the Firm were $5.5 billion compared with $7.3 billion in theprior year. The $1.8 billion decrease was due primarily to lower bankruptcy-related losses in Card Services and the release in the current year of a portionof the $400 million special provision related to Hurricane Katrina that wastaken in 2005. The decline was offset partially by an increase in the wholesaleprovision. The wholesale provision was $321 million compared with a benefitof $811 million in the prior year. The increase was due primarily to portfolioactivity, partly offset by a decrease in nonperforming loans. Credit quality inthe wholesale portfolio was stable. The benefit in 2005 was due to improve-ment in credit quality, reflected by significant reductions in criticized exposuresand nonperforming loans. Consumer provision for credit losses was $5.2 bil-lion compared with $8.1 billion in the prior year. The reduction primarilyreflected the impact of significantly lower bankruptcy-related credit losses anda special provision for credit losses in 2005 related to Hurricane Katrina.
The Firm had, at year end, total stockholders’ equity of $115.8 billion, and aTier 1 capital ratio of 8.7%. The Firm purchased $3.9 billion, or 91 millionshares of common stock during the year.
2007 Business outlookThe following forward-looking statements are based upon the current beliefsand expectations of JPMorgan Chase’s management and are subject to sig-nificant risks and uncertainties. These risks and uncertainties could causeJPMorgan Chase’s results to differ materially from those set forth in such for-ward-looking statements.
JPMorgan Chase’s outlook for 2007 should be viewed against the backdrop ofthe global economy, financial markets activity and the geopolitical environment,all of which are linked integrally. While the Firm considers outcomes for, and hascontingency plans to respond to, stress environments, the basic outlook for2007 is predicated on the interest rate movements implied in the forward ratecurve for U.S. Treasury securities, the continuation of favorable U.S. and interna-tional equity markets and continued expansion of the global economy.
The Investment Bank enters 2007 with a strong investment banking feepipeline and remains focused on developing new products and capabilities.Asset Management anticipates growth driven by continued net asset inflows.Commercial Banking and Treasury & Securities Services expect growth due toincreased business activity and product sales with some competitive and ratepressures. However, the performance of the Firm’s wholesale businesses willbe affected by overall global economic growth and by financial market move-ments and activity levels in any given period.
Retail Financial Services anticipates benefiting from the continued expansionof the branch network and sales force, including the addition of The Bank ofNew York’s 339 branches, and improved sales productivity and cross-selling inthe branches. Loan and deposit spreads are expected to experience continuedcompression due to the interest rate and competitive environments.
Card Services anticipates growth in managed receivables and sales volume,both of which are expected to benefit from marketing initiatives and newpartnerships. Expenditures on marketing are expected to be lower than the2006 level.
In the Corporate segment, the revenue outlook for the Private Equity businessis directly related to the strength of the equity markets and the performanceof the underlying portfolio investments. If current market conditions persist,the Firm anticipates continued realization of private equity gains in 2007, butresults can be volatile from quarter to quarter. Management believes that thenet loss in Treasury and Other Corporate, on a combined basis, will be approxi-mately $50 to $100 million per quarter in 2007, reflecting merger savings andother expense efficiency initiatives, such as less excess real estate.
The Provision for credit losses in 2007 is anticipated to be higher than in2006, primarily driven by a trend toward a more normal level of provisioningfor credit losses in both the wholesale and consumer businesses. The con-sumer Provision for credit losses should reflect a higher level of net charge-offs as bankruptcy filings continue to increase from the significantly lowerthan normal levels experienced in 2006 related to the change in bankruptcylaw in 2005.
Firmwide expenses are anticipated to reflect investments in each business,continued merger savings and other operating efficiencies. Annual Mergersavings are expected to reach approximately $3.0 billion by the end of 2007,upon the completion of the last significant conversion activity, the wholesaledeposit conversion scheduled for the second half of 2007. Offsetting mergersavings will be continued investment in distribution enhancements and newproduct offerings, and expenses related to recent acquisitions including TheBank of New York transaction. Merger costs of approximately $400 millionare expected to be incurred during 2007 (including a modest amount relatedto The Bank of New York transaction). These additions are expected to bringtotal cumulative merger costs to $3.8 billion by the end of 2007.
MANAGEMENT’S DISCUSSION AND ANALYSISJPMorgan Chase & Co.
28 JPMorgan Chase & Co. / 2006 Annual Report
The following section provides a comparative discussion of JPMorganChase’s consolidated results of operations on a reported basis for thethree-year period ended December 31, 2006. Factors that are related pri-marily to a single business segment are discussed in more detail withinthat business segment than they are in this consolidated section. Total netrevenue, Noninterest expense and Income tax expense have been revisedto reflect the impact of discontinued operations. For a discussion of theCritical accounting estimates used by the Firm that affect the Consolidatedresults of operations, see pages 83–85 of this Annual Report.
RevenueYear ended December 31, (in millions) 2006 2005 2004(a)
Investment banking fees $ 5,520 $ 4,088 $ 3,536Principal transactions 10,346 7,669 5,148Lending & deposit related fees 3,468 3,389 2,672Asset management, administration
and commissions 11,725 9,891 7,682Securities gains (losses) (543) (1,336) 338Mortgage fees and related income 591 1,054 803Credit card income 6,913 6,754 4,840Other income 2,175 2,684 826
Noninterest revenue 40,195 34,193 25,845Net interest income 21,242 19,555 16,527
Total net revenue $ 61,437 $ 53,748 $ 42,372
(a) 2004 results include six months of the combined Firm’s results and six months of heritageJPMorgan Chase results.
2006 compared with 2005 Total net revenue for 2006 was $61.4 billion, up by $7.7 billion, or 14%, fromthe prior year. The increase was due to higher Principal transactions, primarilyfrom strong trading revenue results, record Asset management, administrationand commissions revenue, and record Investment banking fees. Also contribut-ing to the increase was higher Net interest income and lower securities portfo-lio losses. These improvements were offset partially by a decline in Otherincome partly as a result of the gain recognized in 2005 on the sale ofBrownCo, and lower Mortgage fees and related income.
The increase in Investment banking fees was driven by record debt and equityunderwriting as well as strong advisory fees. For a further discussion ofInvestment banking fees, which are recorded primarily in the IB, see the IBsegment results on pages 36–37 of this Annual Report.
Principal transactions revenue consists of realized and unrealized gains andlosses from trading activities, including physical commodities inventories thatare accounted for at the lower of cost or fair value, primarily in the IB, andPrivate equity gains and losses, primarily in the private equity business ofCorporate. Trading revenue increased compared with 2005 due to record per-formance in Equity and Fixed income markets. For a further discussion ofPrincipal transactions revenue, see the IB and Corporate segment results onpages 36–37 and 53–54, respectively, of this Annual Report.
Lending & deposit related fees rose slightly in comparison with 2005 as aresult of higher fee income on deposit-related fees and, in part, from TheBank of New York transaction. For a further discussion of the change inLending & deposit related fees, which are recorded in RFS, see the RFS seg-ment results on pages 38–42 of this Annual Report.
The increase in Asset management, administration and commissions revenuein 2006 was driven by growth in assets under management in AM, which
exceeded $1 trillion at the end of 2006, higher equity-related commissions inIB and higher performance and placement fees. The growth in assets undermanagement reflected net asset inflows in the institutional and retail seg-ments. Also contributing to the increase were higher assets under custody inTSS driven by market value appreciation and new business; and growth indepositary receipts, securities lending and global clearing, all of which weredriven by a combination of increased product usage by existing clients andnew business. In addition, commissions in the IB rose as a result of strengthacross regions, partly offset by the sale of the insurance business andBrownCo. For additional information on these fees and commissions, see thesegment discussions for AM on pages 50–52, TSS on pages 48–49 and RFSon pages 38–42, of this Annual Report.
The favorable variance in Securities gains (losses) was due primarily to lowerSecurities losses in Treasury in 2006 from portfolio repositioning activities inconnection with the management of the Firm’s assets and liabilities. For a fur-ther discussion of Securities gains (losses), which are mostly recorded in theFirm’s Treasury business, see the Corporate segment discussion on pages53–54 of this Annual Report.
Mortgage fees and related income declined in comparison with 2005 reflect-ing a reduction in net mortgage servicing revenue and higher losses on mort-gage loans transferred to held-for-sale. These declines were offset partly bygrowth in production revenue as a result of higher volume of loans sales andwider gain on sale margins. Mortgage fees and related income exclude theimpact of NII and AFS securities gains related to mortgage activities. For adiscussion of Mortgage fees and related income, which is recorded primarilyin RFS’s Mortgage Banking business, see the Mortgage Banking discussion onpage 41 of this Annual Report.
Credit card income increased from 2005, primarily from higher customercharge volume that favorably impacted interchange income and servicing feesearned in connection with securitization activities, which benefited from lowercredit losses incurred on securitized credit card loans. These increases wereoffset partially by increases in volume-driven payments to partners, expensesrelated to reward programs, and interest paid to investors in the securitizedloans. Credit card income also was impacted negatively by the deconsolida-tion of Paymentech in the fourth quarter of 2005.
The decrease in Other income compared with the prior year was due to a $1.3billion pretax gain recognized in 2005 on the sale of BrownCo and lower gainsfrom loan workouts. Partially offsetting these two items were higher automo-bile operating lease revenue; an increase in equity investment income, in partic-ular, from Chase Paymentech Solutions, LLC; and a pretax gain of $103 millionon the sale of MasterCard shares in its initial public offering.
Net interest income rose due largely to improvement in Treasury’s net interestspread and increases in wholesale liability balances, wholesale and consumerloans, available-for-sale securities, and consumer deposits. Increases in con-sumer and wholesale loans and deposits included the impact of The Bank ofNew York transaction. These increases were offset partially by narrowerspreads on both trading-related assets and loans, a shift to narrower-spreaddeposit products, RFS’s sale of the insurance business and the absence ofBrownCo in AM. The Firm’s total average interest-earning assets for 2006were $995.5 billion, up 11% from the prior year, primarily as a result of anincrease in loans and other liquid earning assets, partially offset by a declinein interests in purchased receivables as a result of the restructuring anddeconsolidation during the second quarter of 2006 of certain multi-seller con-
CONSOL IDATED RESULTS OF OPERAT IONS
JPMorgan Chase & Co. / 2006 Annual Report 29
volume-driven payments to partners and rewards expense. For a further dis-cussion of Credit card income, see CS segment results on pages 43–45 ofthis Annual Report.
The increase in Other income primarily reflected a $1.3 billion pretax gain onthe sale of BrownCo; higher gains from loan workouts and loan sales; andhigher automobile operating lease income.
Net interest income rose as a result of higher average volume of, and widerspreads on, liability balances. Also contributing to the increase was higheraverage volume of wholesale and consumer loans, in particular, real estateand credit card loans, which partly reflected a private label portfolio acquisi-tion by CS. These increases were offset partially by narrower spreads on con-sumer and wholesale loans and on trading-related assets, as well as theimpact of the repositioning of the Treasury investment portfolio, and thereversal of revenue related to increased bankruptcies in CS. The Firm’s totalaverage interest-earning assets in 2005 were $899.1 billion, up 23% from theprior year. The net interest yield on these assets, on a fully taxable-equivalentbasis, was 2.20%, a decrease of seven basis points from the prior year.
Provision for credit losses Year ended December 31,(in millions) 2006 2005 2004(a)
Provision for credit losses $ 3,270 $ 3,483 $ 2,544
(a) 2004 results include six months of the combined Firm’s results and six months of heritageJPMorgan Chase results.
2006 compared with 2005 The Provision for credit losses in 2006 declined $213 million from the prioryear due to a $1.3 billion decrease in the consumer Provision for credit losses,partly offset by a $1.1 billion increase in wholesale Provision for credit losses.The decrease in the consumer provision was driven by CS, reflecting lowerbankruptcy-related losses, partly offset by higher contractual net charge-offs.The 2005 consumer provision also reflected $350 million of a special provisionrelated to Hurricane Katrina, a portion of which was released in the currentyear. The increase in the wholesale provision was due primarily to portfolioactivity, partly offset by a decrease in nonperforming loans. The benefit in2005 was due to strong credit quality, reflected in significant reductions incriticized exposure and nonperforming loans. Credit quality in the wholesaleportfolio was stable. For a more detailed discussion of the loan portfolio andthe Allowance for loan losses, refer to Credit risk management on pages64–76 of this Annual Report.
2005 compared with 2004The Provision for credit losses was $3.5 billion, an increase of $939 million, or37%, from 2004, reflecting the full-year impact of the Merger. The wholesaleProvision for credit losses was a benefit of $811 million for the year comparedwith a benefit of $716 million in the prior year, reflecting continued strength incredit quality. The wholesale loan net recovery rate was 0.06% in 2005, animprovement from a net charge-off rate of 0.18% in the prior year. The totalconsumer Provision for credit losses was $4.3 billion, $1.9 billion higher thanthe prior year, primarily due to the Merger, higher bankruptcy-related netcharge-offs in Card Services and a $350 million special provision for HurricaneKatrina. Also included in 2004 were accounting policy conformity adjustmentsas a result of the Merger. Excluding these items, the consumer portfolio contin-ued to show strength in credit quality.
duits that the Firm administered. The net yield on interest-earning assets, on afully taxable-equivalent basis, was 2.16%, a decrease of four basis pointsfrom the prior year. For a further discussion of Net interest income, see theBusiness Segment Results section on pages 34–35 of this Annual Report.
2005 compared with 2004Total net revenue for 2005 was $53.7 billion, up 27% from 2004, primarily dueto the Merger, which affected every revenue category. The increase from 2004also was affected by a $1.3 billion gain on the sale of BrownCo; higher Principaltransactions revenue; and higher Asset management, administration and com-missions, which benefited from several new investments and growth in Assetsunder management and Assets under custody. These increases were offset partlyby available-for-sale (“AFS”) securities losses as a result of repositioning of theFirm’s Treasury investment portfolio. The discussions that follow highlight factorsother than the Merger that affected the 2005 versus 2004 comparison.
The increase in Investment banking fees was driven by strong growth in advisoryfees resulting in part from the Cazenove business partnership. For a further dis-cussion of Investment banking fees, which are primarily recorded in the IB, seethe IB segment results on pages 36–37 and Note 2 on page 97 of this AnnualReport.
Revenue from Principal transactions increased compared with 2004, driven bystronger, although volatile, trading results across commodities, emerging mar-kets, rate markets and currencies. Private equity gains were higher due to a con-tinuation of favorable capital markets conditions. For a further discussion ofPrincipal transactions revenue, see the IB and Corporate segment results onpages 36–37 and 53–54, respectively, of this Annual Report.
The higher Lending & deposit related fees were driven by the Merger; absentthe effects of the Merger, the deposit-related fees would have been lowerdue to rising interest rates. In a higher interest rate environment, the value ofdeposit balances to a customer is greater, resulting in a reduction of deposit-related fees. For a further discussion of liability balances (including deposits)see the CB and TSS segment discussions on pages 46–47 and 48–49, respec-tively, of this Annual Report.
The increase in Asset management, administration and commissions revenuewas driven by incremental fees from several new investments, including theacquisition of a majority interest in Highbridge, the Cazenove business part-nership and the acquisition of Vastera. Also contributing to the higher level ofrevenue was an increase in Assets under management, reflecting net assetinflows in equity-related products and global equity market appreciation. Inaddition, Assets under custody were up due to market value appreciation andnew business. Commissions rose as a result of a higher volume of brokeragetransactions. For additional information on these fees and commissions, seethe segment discussions for IB on pages 36–37, AM on pages 50–52 and TSSon pages 48–49 of this Annual Report.
The decline in Securities gains (losses) reflected $1.3 billion of securities loss-es, as compared with $338 million of gains in 2004. The losses were due torepositioning of the Firm’s Treasury investment portfolio, to manage exposureto interest rates. For a further discussion of Securities gains (losses), whichare recorded primarily in the Firm’s Treasury business, see the Corporate seg-ment discussion on pages 53–54 of this Annual Report.
Mortgage fees and related income increased due to improved MSR risk-man-agement results. For a discussion of Mortgage fees and related income, which isrecorded primarily in RFS’s Mortgage Banking business, see the segment discus-sion for RFS on pages 38–42 of this Annual Report.
Credit card income rose as a result of higher interchange income associatedwith the increase in charge volume. This increase was offset partially by higher
MANAGEMENT’S DISCUSSION AND ANALYSISJPMorgan Chase & Co.
30 JPMorgan Chase & Co. / 2006 Annual Report
and 2005, respectively, pertaining to certain material litigation matters. For a fur-ther discussion of litigation, refer to Note 27 on pages 130–131 of this AnnualReport. Also contributing to the decline from the prior year were charges of $93million in connection with the termination of a client contract in TSS in 2005;and in RFS, the sale of the insurance business in the third quarter of 2006. Theseitems were offset partially by higher charges related to other litigation, and theimpact of growth in business volume, acquisitions and investments in the busi-nesses.
For discussion of Amortization of intangibles and Merger costs, refer to Note 16and Note 9 on pages 121–123 and 108, respectively, of this Annual Report.
2005 compared with 2004Noninterest expense for 2005 was $38.4 billion, up 13% from 2004, primarilydue to the full-year impact of the Merger. Excluding Litigation reserve chargesand Merger costs, Noninterest expense would have been $35.1 billion, up 22%.In addition to the Merger, expenses increased as a result of higher performance-based incentives, continued investment spending in the Firm’s businesses andincremental marketing expenses related to launching the new Chase brand, par-tially offset by merger-related savings and operating efficiencies throughout theFirm. Each category of Noninterest expense was affected by the Merger. The dis-cussions that follow highlight factors other than the Merger that affected the2005 versus 2004 comparison.
Compensation expense rose as a result of higher performance-based incentives;additional headcount due to the insourcing of the Firm’s global technologyinfrastructure (effective December 31, 2004, when JPMorgan Chase terminatedthe Firm’s outsourcing agreement with IBM); the impact of several investments,including Cazenove, Highbridge and Vastera; the accelerated vesting of certainemployee stock options; and business growth. The effect of the terminationof the IBM outsourcing agreement was to shift expenses from Technologyand communications expense to Compensation expense. The increase inCompensation expense was offset partially by merger-related savings through-out the Firm. For a detailed discussion of employee stock-based incentives, seeNote 8 on pages 105–107 of this Annual Report.
The increase in Occupancy expense was due primarily to the Merger, partiallyoffset by lower charges for excess real estate and a net release of excessproperty tax accruals, as compared with $103 million of charges for excessreal estate in 2004.
Technology and communications expense was down slightly. This reductionreflects the offset of six months of the combined Firm’s results for 2004against the full-year 2005 impact from termination of the JPMorgan Chaseoutsourcing agreement with IBM. The reduction in Technology and communi-cations expense due to the outsourcing agreement termination is offset most-ly by increases in Compensation expense related to additional headcount andinvestments in the Firm’s hardware and software infrastructure.
Professional and outside services were higher compared with the prior year asa result of the insourcing of the Firm’s global technology infrastructure,upgrades to the Firm’s systems and technology, and business growth. Theseexpenses were offset partially by operating efficiencies.
Marketing expense was higher compared with the prior year, primarily as aresult of the Merger and the cost of advertising campaigns to launch the newChase brand.
Noninterest expenseYear ended December 31,(in millions) 2006 2005 2004(a)
Compensation expense $ 21,191 $ 18,065 $ 14,291Occupancy expense 2,335 2,269 2,058Technology, communications and
equipment expense 3,653 3,602 3,687Professional & outside services 3,888 4,162 3,788Marketing 2,209 1,917 1,335Other expense 3,272 6,199 6,537Amortization of intangibles 1,428 1,490 911Merger costs 305 722 1,365
Total noninterest expense $ 38,281 $ 38,426 $ 33,972
(a) 2004 results include six months of the combined Firm’s results and six months of heritageJPMorgan Chase results.
2006 compared with 2005 Total noninterest expense for 2006 was $38.3 billion, down slightly from the prioryear. The decrease was due to material litigation-related insurance recoveries of$512 million in 2006 compared with a net charge of $2.6 billion (includes $208million material litigation-related insurance recoveries) in 2005, primarily associat-ed with the settlement of the Enron and WorldCom class action litigations and forcertain other material legal proceedings. Also contributing to the decrease werelower Merger costs, the deconsolidation of Paymentech, the sale of the insurancebusiness, and merger-related savings and operating efficiencies. These items wereoffset mostly by higher performance-based compensation and incrementalexpense of $712 million related to SFAS 123R, the impact of acquisitions andinvestments in businesses, as well as higher Marketing expenditures.
The increase in Compensation expense from 2005 was primarily a result ofhigher performance-based incentives, incremental expense related to SFAS123R of $712 million for 2006, and additional headcount in connection withgrowth in business volume, acquisitions, and investments in the businesses.These increases were offset partially by merger-related savings and otherexpense efficiencies throughout the Firm. For a detailed discussion of the adop-tion of SFAS 123R and employee stock-based incentives see Note 8 on pages105–107 of this Annual Report.
The increase in Occupancy expense from 2005 was due to ongoing investmentsin the retail distribution network, which included the incremental expense fromThe Bank of New York branches, partially offset by merger-related savings andother operating efficiencies.
The slight increase in Technology, communications and equipment expense for2006 was due primarily to higher depreciation expense on owned automobilessubject to operating leases and higher technology investments to support busi-ness growth, partially offset by merger-related savings and operating efficiencies.
Professional & outside services decreased from 2005 due to merger-relatedsavings and operating efficiencies, lower legal fees associated with severallegal matters settled in 2005 and the Paymentech deconsolidation. Thedecrease was offset partly by acquisitions and business growth.
Marketing expense was higher compared with 2005, reflecting the costs ofcampaigns for credit cards.
Other expense was lower due to significant litigation-related charges of $2.8 bil-lion in 2005, associated with the settlement of the Enron and WorldCom classaction litigations and certain other material legal proceedings. In addition, theFirm recognized insurance recoveries of $512 million and $208 million, in 2006
JPMorgan Chase & Co. / 2006 Annual Report 31
The decrease in Other expense reflected lower litigation reserve charges forcertain material legal proceedings in 2005: $1.9 billion related to the settle-ment of the Enron class action litigation and for certain other material legalproceedings, and $900 million for the settlement of the WorldCom class actionlitigation; and in 2004, $3.7 billion to increase litigation reserves. Also con-tributing to the decrease were a $208 million insurance recovery related tocertain material litigation, lower software impairment write-offs, merger-relat-ed savings and operating efficiencies. These were offset partially by $93 mil-lion in charges taken by TSS to terminate a client contract and a $40 millioncharge taken by RFS related to the dissolution of a student loan joint venture.
For a discussion of Amortization of intangibles and Merger costs, refer to Note16 and Note 9 on pages 121–123 and 108, respectively, of this Annual Report.
Income tax expenseThe Firm’s Income from continuing operations before income tax expense,Income tax expense and Effective tax rate were as follows for each of theperiods indicated:
Year ended December 31,(in millions, except rate) 2006 2005 2004(a)
Income from continuing operationsbefore income tax expense $19,886 $ 11,839 $ 5,856
Income tax expense 6,237 3,585 1,596Effective tax rate 31.4% 30.3% 27.3%
(a) 2004 results include six months of the combined Firm’s results and six months of heritageJPMorgan Chase results.
2006 compared with 2005 The increase in the effective tax rate for 2006, as compared with the prioryear, was primarily the result of higher reported pretax income combined withchanges in the proportion of income subject to federal, state and local taxes.Also contributing to the increase in the effective tax rate were the litigationcharges in 2005 and lower Merger costs, reflecting a tax benefit at a 38%marginal tax rate, partially offset by benefits related to tax audit resolutionsof $367 million in 2006.
2005 compared with 2004The increase in the effective tax rate was primarily the result of higherreported pretax income combined with changes in the proportion of incomesubject to federal, state and local taxes. Also contributing to the increasewere lower 2005 litigation charges and a gain on the sale of BrownCo, whichwere taxed at marginal tax rates of 38% and 40%, respectively. Theseincreases were offset partially by a tax benefit in 2005 of $55 million record-ed in connection with the repatriation of foreign earnings.
Income from discontinued operations As a result of the transaction with The Bank of New York on October 1, 2006,the results of operations of the selected corporate trust businesses (i.e.,trustee, paying agent, loan agency and document management services) werereported as discontinued operations.
The Firm’s Income from discontinued operations (after-tax) were as follows foreach of the periods indicated:
Year ended December 31,(in millions) 2006 2005 2004(a)
Income from discontinued operations $ 795 $ 229 $ 206
(a) 2004 results include six months of the combined Firm’s results and six months of heritageJPMorgan Chase results.
The increases from the prior two periods in Income from discontinued opera-tions were due primarily to a gain of $622 million from exiting the corporatetrust business in the fourth quarter of 2006.
(Table continues on next page)
Year ended December 31, 2006 2005
(in millions, except Reported Credit Tax-equivalent Managed Reported Credit Tax-equivalent Managedper share and ratio data) results card(b) adjustments basis results card(b) adjustments basis
RevenueInvestment banking fees $ 5,520 $ — $ — $ 5,520 $ 4,088 $ — $ — $ 4,088Principal transactions 10,346 — — 10,346 7,669 — — 7,669Lending & deposit related fees 3,468 — — 3,468 3,389 — — 3,389Asset management, administration and
commissions 11,725 — — 11,725 9,891 — — 9,891Securities gains (losses) (543) — — (543) (1,336) — — (1,336)Mortgage fees and related income 591 — — 591 1,054 — — 1,054Credit card income 6,913 (3,509) — 3,404 6,754 (2,718) — 4,036Other income 2,175 — 676 2,851 2,684 — 571 3,255
Noninterest revenue 40,195 (3,509) 676 37,362 34,193 (2,718) 571 32,046Net interest income 21,242 5,719 228 27,189 19,555 6,494 269 26,318
Total net revenue 61,437 2,210 904 64,551 53,748 3,776 840 58,364Provision for credit losses 3,270 2,210 — 5,480 3,483 3,776 — 7,259Noninterest expense 38,281 — — 38,281 38,426 — — 38,426
Income from continuing operations before income tax expense 19,886 — 904 20,790 11,839 — 840 12,679
Income tax expense 6,237 — 904 7,141 3,585 — 840 4,425
Income from continuing operations 13,649 — — 13,649 8,254 — — 8,254Income from discontinued operations 795 — — 795 229 — — 229
Net income $ 14,444 $ — $ — $ 14,444 $ 8,483 $ — $ — $ 8,483
Income from continuing operations– diluted earnings per share $ 3.82 $ — $ — $ 3.82 $ 2.32 $ — $ — $ 2.32
Return on common equity(a) 12% —% —% 12% 8% —% —% 8%Return on common equity less goodwill(a) 20 — — 20 13 — — 13Return on assets(a) 1.04 NM NM 1.00 0.70 NM NM 0.67Overhead ratio 62 NM NM 59 71 NM NM 66Loans–Period-end $ 483,127 $ 66,950 $ — $ 550,077 $ 419,148 $ 70,527 — $ 489,675Total assets – average 1,313,794 65,266 — 1,379,060 1,185,066 67,180 — 1,252,246
(a) Based on Income from continuing operations.(b) The impact of credit card securitizations affects CS. See pages 43–45 of this Annual Report for further information.(c) 2004 results include six months of the combined Firm’s results and six months of heritage JPMorgan Chase results.
MANAGEMENT’S DISCUSSION AND ANALYSISJPMorgan Chase & Co.
32 JPMorgan Chase & Co. / 2006 Annual Report
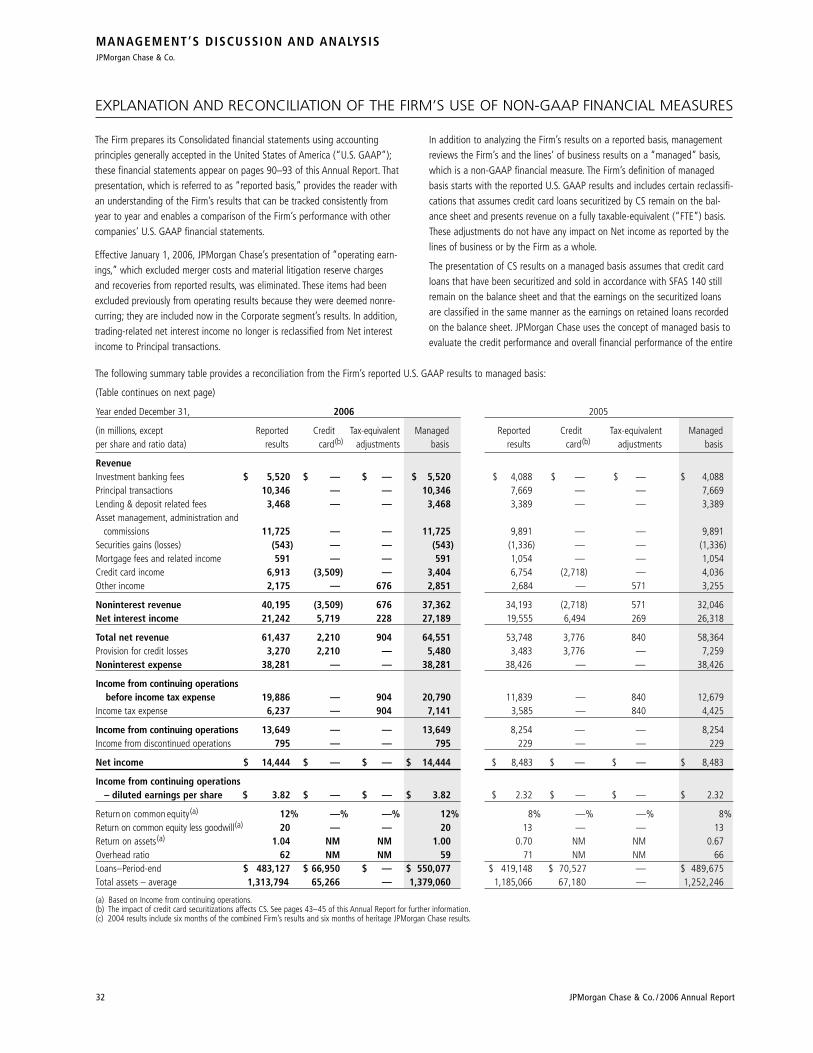
The following summary table provides a reconciliation from the Firm’s reported U.S. GAAP results to managed basis:
The Firm prepares its Consolidated financial statements using accountingprinciples generally accepted in the United States of America (“U.S. GAAP”);these financial statements appear on pages 90–93 of this Annual Report. Thatpresentation, which is referred to as “reported basis,” provides the reader withan understanding of the Firm’s results that can be tracked consistently fromyear to year and enables a comparison of the Firm’s performance with othercompanies’ U.S. GAAP financial statements.
Effective January 1, 2006, JPMorgan Chase’s presentation of “operating earn-ings,” which excluded merger costs and material litigation reserve chargesand recoveries from reported results, was eliminated. These items had beenexcluded previously from operating results because they were deemed nonre-curring; they are included now in the Corporate segment’s results. In addition,trading-related net interest income no longer is reclassified from Net interestincome to Principal transactions.
In addition to analyzing the Firm’s results on a reported basis, managementreviews the Firm’s and the lines’ of business results on a “managed” basis,which is a non-GAAP financial measure. The Firm’s definition of managedbasis starts with the reported U.S. GAAP results and includes certain reclassifi-cations that assumes credit card loans securitized by CS remain on the bal-ance sheet and presents revenue on a fully taxable-equivalent (“FTE”) basis.These adjustments do not have any impact on Net income as reported by thelines of business or by the Firm as a whole.
The presentation of CS results on a managed basis assumes that credit cardloans that have been securitized and sold in accordance with SFAS 140 stillremain on the balance sheet and that the earnings on the securitized loansare classified in the same manner as the earnings on retained loans recordedon the balance sheet. JPMorgan Chase uses the concept of managed basis toevaluate the credit performance and overall financial performance of the entire
EXPLANATION AND RECONCILIATION OF THE FIRM’S USE OF NON-GAAP FINANCIAL MEASURES
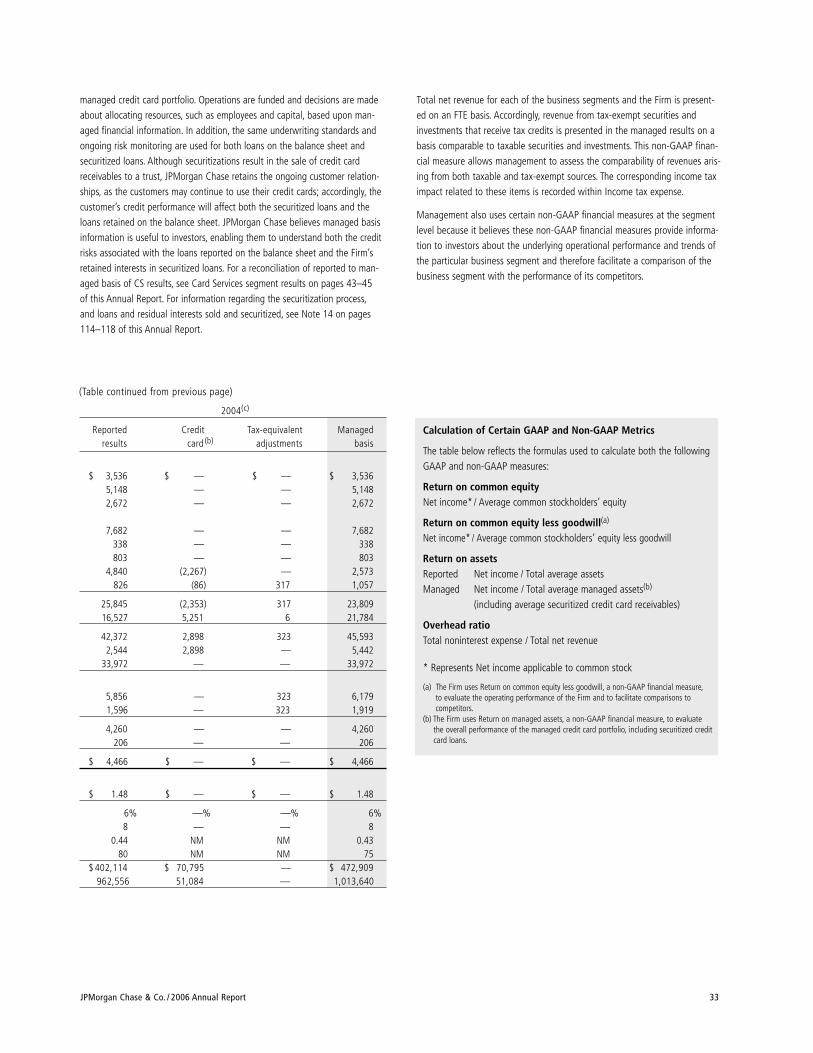
(Table continued from previous page)
2004(c)
Reported Credit Tax-equivalent Managedresults card (b) adjustments basis
$ 3,536 $ — $ — $ 3,5365,148 — — 5,1482,672 — — 2,672
7,682 — — 7,682338 — — 338803 — — 803
4,840 (2,267) — 2,573826 (86) 317 1,057
25,845 (2,353) 317 23,80916,527 5,251 6 21,784
42,372 2,898 323 45,5932,544 2,898 — 5,442
33,972 — — 33,972
5,856 — 323 6,1791,596 — 323 1,919
4,260 — — 4,260206 — — 206
$ 4,466 $ — $ — $ 4,466
$ 1.48 $ — $ — $ 1.48
6% —% —% 6%8 — — 8
0.44 NM NM 0.4380 NM NM 75
$ 402,114 $ 70,795 — $ 472,909962,556 51,084 — 1,013,640
JPMorgan Chase & Co. / 2006 Annual Report 33
Calculation of Certain GAAP and Non-GAAP Metrics
The table below reflects the formulas used to calculate both the followingGAAP and non-GAAP measures:
Return on common equityNet income* / Average common stockholders’ equity
Return on common equity less goodwill(a)
Net income* / Average common stockholders’ equity less goodwill
Return on assetsReported Net income / Total average assetsManaged Net income / Total average managed assets(b)
(including average securitized credit card receivables)
Overhead ratioTotal noninterest expense / Total net revenue
* Represents Net income applicable to common stock
(a) The Firm uses Return on common equity less goodwill, a non-GAAP financial measure,to evaluate the operating performance of the Firm and to facilitate comparisons to competitors.
(b) The Firm uses Return on managed assets, a non-GAAP financial measure, to evaluate the overall performance of the managed credit card portfolio, including securitized creditcard loans.
managed credit card portfolio. Operations are funded and decisions are madeabout allocating resources, such as employees and capital, based upon man-aged financial information. In addition, the same underwriting standards andongoing risk monitoring are used for both loans on the balance sheet andsecuritized loans. Although securitizations result in the sale of credit cardreceivables to a trust, JPMorgan Chase retains the ongoing customer relation-ships, as the customers may continue to use their credit cards; accordingly, thecustomer’s credit performance will affect both the securitized loans and theloans retained on the balance sheet. JPMorgan Chase believes managed basisinformation is useful to investors, enabling them to understand both the creditrisks associated with the loans reported on the balance sheet and the Firm’sretained interests in securitized loans. For a reconciliation of reported to man-aged basis of CS results, see Card Services segment results on pages 43–45of this Annual Report. For information regarding the securitization process,and loans and residual interests sold and securitized, see Note 14 on pages114–118 of this Annual Report.
Total net revenue for each of the business segments and the Firm is present-ed on an FTE basis. Accordingly, revenue from tax-exempt securities andinvestments that receive tax credits is presented in the managed results on abasis comparable to taxable securities and investments. This non-GAAP finan-cial measure allows management to assess the comparability of revenues aris-ing from both taxable and tax-exempt sources. The corresponding income taximpact related to these items is recorded within Income tax expense.
Management also uses certain non-GAAP financial measures at the segmentlevel because it believes these non-GAAP financial measures provide informa-tion to investors about the underlying operational performance and trends ofthe particular business segment and therefore facilitate a comparison of thebusiness segment with the performance of its competitors.
MANAGEMENT’S DISCUSSION AND ANALYSISJPMorgan Chase & Co.
34 JPMorgan Chase & Co. / 2006 Annual Report
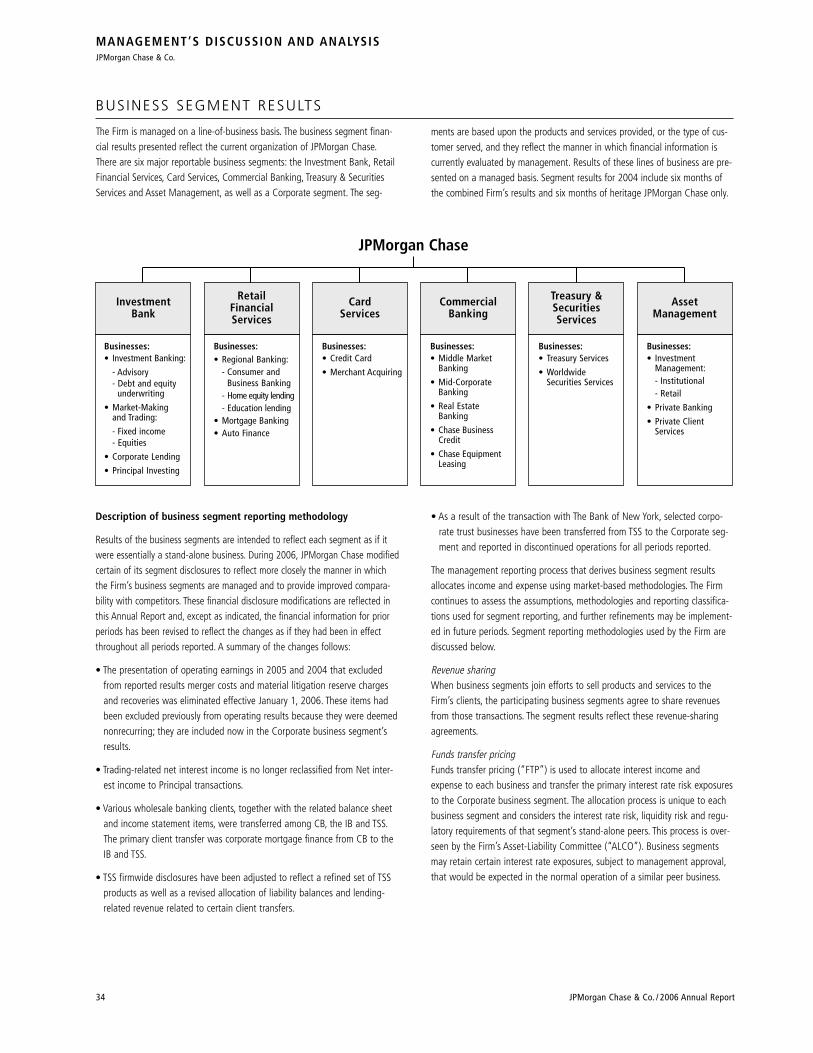
BUS INESS SEGMENT RESULTS
The Firm is managed on a line-of-business basis. The business segment finan-cial results presented reflect the current organization of JPMorgan Chase.There are six major reportable business segments: the Investment Bank, RetailFinancial Services, Card Services, Commercial Banking, Treasury & SecuritiesServices and Asset Management, as well as a Corporate segment. The seg-
ments are based upon the products and services provided, or the type of cus-tomer served, and they reflect the manner in which financial information iscurrently evaluated by management. Results of these lines of business are pre-sented on a managed basis. Segment results for 2004 include six months ofthe combined Firm’s results and six months of heritage JPMorgan Chase only.
AssetManagement
Businesses:• Treasury Services
• WorldwideSecurities Services
JPMorgan Chase
Businesses:• Middle Market
Banking
• Mid-CorporateBanking
• Real EstateBanking
• Chase BusinessCredit
• Chase EquipmentLeasing
CommercialBanking
Businesses:• Investment Banking:
- Advisory- Debt and equity
underwriting
• Market-Makingand Trading:
- Fixed income - Equities
• Corporate Lending
• Principal Investing
InvestmentBank
RetailFinancialServices
CardServices
Businesses:• Investment
Management:- Institutional- Retail
• Private Banking
• Private ClientServices
Businesses:• Credit Card
• Merchant Acquiring
Businesses:• Regional Banking:
- Consumer andBusiness Banking
- Home equity lending- Education lending
• Mortgage Banking• Auto Finance
Treasury &SecuritiesServices
Description of business segment reporting methodology
Results of the business segments are intended to reflect each segment as if itwere essentially a stand-alone business. During 2006, JPMorgan Chase modifiedcertain of its segment disclosures to reflect more closely the manner in whichthe Firm’s business segments are managed and to provide improved compara-bility with competitors. These financial disclosure modifications are reflected inthis Annual Report and, except as indicated, the financial information for priorperiods has been revised to reflect the changes as if they had been in effectthroughout all periods reported. A summary of the changes follows:
• The presentation of operating earnings in 2005 and 2004 that excludedfrom reported results merger costs and material litigation reserve chargesand recoveries was eliminated effective January 1, 2006. These items hadbeen excluded previously from operating results because they were deemednonrecurring; they are included now in the Corporate business segment’sresults.
• Trading-related net interest income is no longer reclassified from Net inter-est income to Principal transactions.
• Various wholesale banking clients, together with the related balance sheetand income statement items, were transferred among CB, the IB and TSS.The primary client transfer was corporate mortgage finance from CB to theIB and TSS.
• TSS firmwide disclosures have been adjusted to reflect a refined set of TSSproducts as well as a revised allocation of liability balances and lending-related revenue related to certain client transfers.
• As a result of the transaction with The Bank of New York, selected corpo-rate trust businesses have been transferred from TSS to the Corporate seg-ment and reported in discontinued operations for all periods reported.
The management reporting process that derives business segment resultsallocates income and expense using market-based methodologies. The Firmcontinues to assess the assumptions, methodologies and reporting classifica-tions used for segment reporting, and further refinements may be implement-ed in future periods. Segment reporting methodologies used by the Firm arediscussed below.
Revenue sharingWhen business segments join efforts to sell products and services to theFirm’s clients, the participating business segments agree to share revenuesfrom those transactions. The segment results reflect these revenue-sharingagreements.
Funds transfer pricingFunds transfer pricing (“FTP”) is used to allocate interest income andexpense to each business and transfer the primary interest rate risk exposuresto the Corporate business segment. The allocation process is unique to eachbusiness segment and considers the interest rate risk, liquidity risk and regu-latory requirements of that segment’s stand-alone peers. This process is over-seen by the Firm’s Asset-Liability Committee (“ALCO”). Business segmentsmay retain certain interest rate exposures, subject to management approval,that would be expected in the normal operation of a similar peer business.
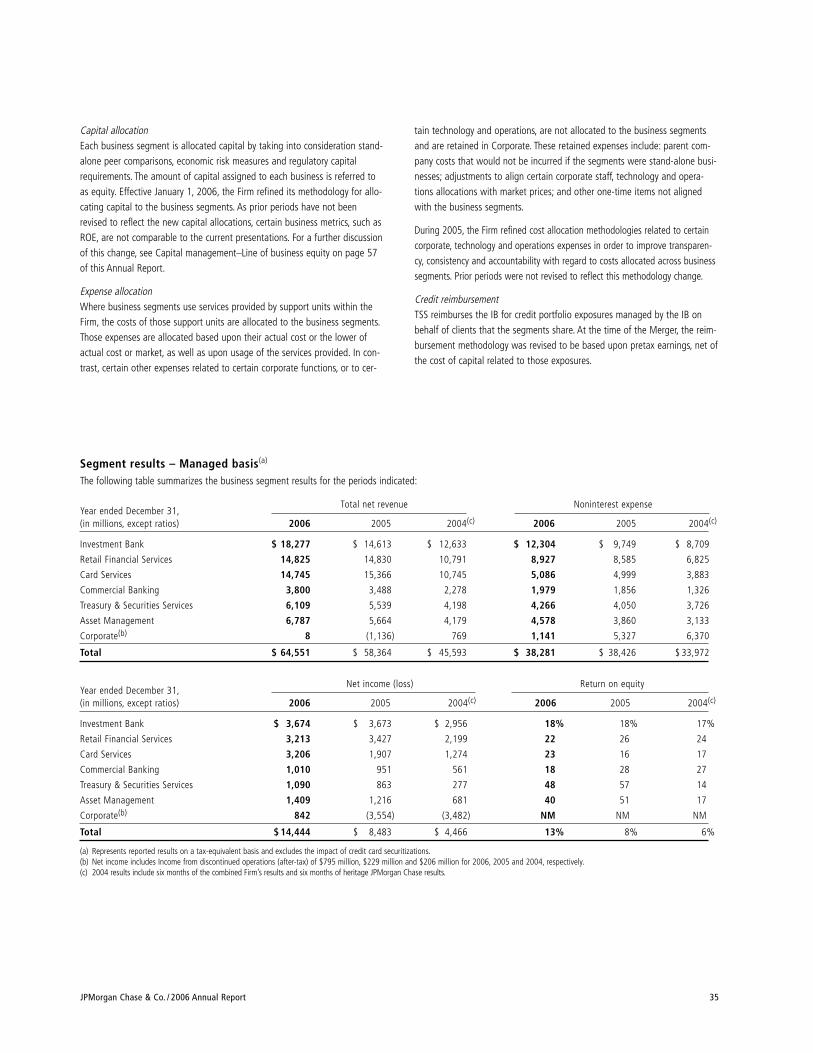
Year ended December 31,Net income (loss) Return on equity
(in millions, except ratios) 2006 2005 2004(c) 2006 2005 2004(c)
Investment Bank $ 3,674 $ 3,673 $ 2,956 18% 18% 17%
Retail Financial Services 3,213 3,427 2,199 22 26 24
Card Services 3,206 1,907 1,274 23 16 17
Commercial Banking 1,010 951 561 18 28 27
Treasury & Securities Services 1,090 863 277 48 57 14
Asset Management 1,409 1,216 681 40 51 17
Corporate(b) 842 (3,554) (3,482) NM NM NM
Total $ 14,444 $ 8,483 $ 4,466 13% 8% 6%
(a) Represents reported results on a tax-equivalent basis and excludes the impact of credit card securitizations.(b) Net income includes Income from discontinued operations (after-tax) of $795 million, $229 million and $206 million for 2006, 2005 and 2004, respectively.(c) 2004 results include six months of the combined Firm’s results and six months of heritage JPMorgan Chase results.
JPMorgan Chase & Co. / 2006 Annual Report 35
Capital allocationEach business segment is allocated capital by taking into consideration stand-alone peer comparisons, economic risk measures and regulatory capitalrequirements. The amount of capital assigned to each business is referred toas equity. Effective January 1, 2006, the Firm refined its methodology for allo-cating capital to the business segments. As prior periods have not beenrevised to reflect the new capital allocations, certain business metrics, such asROE, are not comparable to the current presentations. For a further discussionof this change, see Capital management–Line of business equity on page 57of this Annual Report.
Expense allocationWhere business segments use services provided by support units within theFirm, the costs of those support units are allocated to the business segments.Those expenses are allocated based upon their actual cost or the lower ofactual cost or market, as well as upon usage of the services provided. In con-trast, certain other expenses related to certain corporate functions, or to cer-
tain technology and operations, are not allocated to the business segmentsand are retained in Corporate. These retained expenses include: parent com-pany costs that would not be incurred if the segments were stand-alone busi-nesses; adjustments to align certain corporate staff, technology and opera-tions allocations with market prices; and other one-time items not alignedwith the business segments.
During 2005, the Firm refined cost allocation methodologies related to certaincorporate, technology and operations expenses in order to improve transparen-cy, consistency and accountability with regard to costs allocated across businesssegments. Prior periods were not revised to reflect this methodology change.
Credit reimbursementTSS reimburses the IB for credit portfolio exposures managed by the IB onbehalf of clients that the segments share. At the time of the Merger, the reim-bursement methodology was revised to be based upon pretax earnings, net ofthe cost of capital related to those exposures.
Segment results – Managed basis(a)
The following table summarizes the business segment results for the periods indicated:
Year ended December 31,Total net revenue Noninterest expense
(in millions, except ratios) 2006 2005 2004(c) 2006 2005 2004(c)
Investment Bank $ 18,277 $ 14,613 $ 12,633 $ 12,304 $ 9,749 $ 8,709
Retail Financial Services 14,825 14,830 10,791 8,927 8,585 6,825
Card Services 14,745 15,366 10,745 5,086 4,999 3,883
Commercial Banking 3,800 3,488 2,278 1,979 1,856 1,326
Treasury & Securities Services 6,109 5,539 4,198 4,266 4,050 3,726
Asset Management 6,787 5,664 4,179 4,578 3,860 3,133
Corporate(b) 8 (1,136) 769 1,141 5,327 6,370
Total $ 64,551 $ 58,364 $ 45,593 $ 38,281 $ 38,426 $ 33,972
INVESTMENT BANK
JPMorgan is one of the world’s leading investment banks,with deep client relationships and broad product capabilities.The Investment Bank’s clients are corporations, financial institu-tions, governments and institutional investors. The Firm offers afull range of investment banking products and services in allmajor capital markets, including advising on corporate strategyand structure, capital raising in equity and debt markets, sophis-ticated risk management, market-making in cash securities andderivative instruments, and research. The IB also commits theFirm’s own capital to proprietary investing and trading activities.
Selected income statement data Year ended December 31,(in millions, except ratios) 2006 2005 2004(e)
RevenueInvestment banking fees $ 5,537 $ 4,096 $ 3,572Principal transactions 9,086 6,059 3,548Lending & deposit related fees 517 594 539Asset management, administration
and commissions 2,110 1,727 1,401All other income 528 534 277Noninterest revenue 17,778 13,010 9,337Net interest income(a) 499 1,603 3,296
Total net revenue(b) 18,277 14,613 12,633
Provision for credit losses 191 (838) (640)Credit reimbursement from TSS(c) 121 154 90
Noninterest expenseCompensation expense 8,190 5,792 4,896Noncompensation expense 4,114 3,957 3,813
Total noninterest expense 12,304 9,749 8,709
Income before income tax expense 5,903 5,856 4,654Income tax expense 2,229 2,183 1,698
Net income $ 3,674 $ 3,673 $ 2,956
Financial ratiosROE 18% 18% 17%ROA 0.57 0.61 0.62Overhead ratio 67 67 69Compensation expense as
% of total net revenue(d) 43 40 39
(a) The decline in net interest income for the periods shown is largely driven by a decline in trad-ing-related net interest income caused by a higher proportion of noninterest-bearing net trad-ing assets to total net trading assets, higher funding costs compared with prior-year periods,and spread compression due to the inverted yield curve in place for most of the current year.
(b) Total Net revenue includes tax-equivalent adjustments, primarily due to tax-exempt incomefrom municipal bond investments and income tax credits related to affordable housing invest-ments, of $802 million, $752 million and $274 million for 2006, 2005 and 2004, respectively.
(c) TSS is charged a credit reimbursement related to certain exposures managed within the IB credit portfolio on behalf of clients shared with TSS. For a further discussion, see Creditreimbursement on page 35 of this Annual Report.
(d) Beginning in 2006, the Compensation expense to Total net revenue ratio is adjusted topresent this ratio as if SFAS 123R had always been in effect. IB management believes thatadjusting the Compensation expense to Total net revenue ratio for the incremental impactof adopting SFAS 123R provides a more meaningful measure of IB’s Compensation expenseto Total net revenue ratio.
(e) 2004 results include six months of the combined Firm’s results and six months of heritageJPMorgan Chase results.
2006 compared with 2005Net income of $3.7 billion was flat, as record revenue of $18.3 billion was offsetlargely by higher compensation expense, including the impact of SFAS 123R,and a provision for credit losses compared with a benefit in the prior year.
Total net revenue of $18.3 billion was up $3.7 billion, or 25%, from the prioryear. Investment banking fees of $5.5 billion were a record, up 35% from theprior year, driven by record debt and equity underwriting as well as strongadvisory fees, which were the highest since 2000. Advisory fees of $1.7 billion
The following table provides the IB’s total Net revenue by business segment:Year ended December 31,(in millions) 2006 2005 2004(d)
Revenue by businessInvestment banking fees:
Advisory $ 1,659 $ 1,263 $ 938Equity underwriting 1,178 864 781Debt underwriting 2,700 1,969 1,853
Total investment banking fees 5,537 4,096 3,572Fixed income markets(a) 8,369 7,277 6,342Equity markets(b) 3,264 1,799 1,491Credit portfolio(c) 1,107 1,441 1,228
Total net revenue $ 18,277 $ 14,613 $ 12,633
(a) Fixed income markets includes client and portfolio management revenue related to bothmarket-making and proprietary risk-taking across global fixed income markets, includingforeign exchange, interest rate, credit and commodities markets.
(b) Equities markets includes client and portfolio management revenue related to market-making and proprietary risk-taking across global equity products, including cash instru-ments, derivatives and convertibles.
(c) Credit portfolio revenue includes Net interest income, fees and loan sale activity, as well as gains or losses on securities received as part of a loan restructuring, for the IB’s creditportfolio. Credit portfolio revenue also includes the results of risk management related tothe Firm’s lending and derivative activities, and changes in the credit valuation adjustment(“CVA”), which is the component of the fair value of a derivative that reflects the creditquality of the counterparty. See pages 70–72 of the Credit risk management section ofthis Annual Report for further discussion.
(d) 2004 results include six months of the combined Firm’s results and six months of heritageJPMorgan Chase results.
36 JPMorgan Chase & Co. / 2006 Annual Report
were up 31% over the prior year driven primarily by strong performance in theAmericas. Debt underwriting fees of $2.7 billion were up 37% from the prioryear driven by record performance in both loan syndications and bond under-writing. Equity underwriting fees of $1.2 billion were up 36% from the prioryear driven by global equity markets. Fixed Income Markets revenue of $8.4billion was also a record, up 15% from the prior year driven by strength incredit markets, emerging markets and currencies. Record Equity Markets rev-enue of $3.3 billion increased 81%, and was driven by strength in cash equi-ties and equity derivatives. Credit Portfolio revenue of $1.1 billion was down23%, primarily reflecting lower gains from loan workouts.
Provision for credit losses was $191 million compared with a benefit of $838million in the prior year. The current-year provision reflects portfolio activity; cred-it quality remained stable. The prior-year benefit reflected strong credit quality, adecline in criticized and nonperforming loans, and a higher level of recoveries.
Total noninterest expense of $12.3 billion was up by $2.6 billion, or 26%,from the prior year. This increase was due primarily to higher performance-based compensation, including the impact of an increase in the ratio of com-pensation expense to total net revenue, as well as the incremental expenserelated to SFAS 123R.
Return on equity was 18% on $20.8 billion of allocated capital compared with18% on $20.0 billion in 2005.
2005 compared with 2004Net income of $3.7 billion was up 24%, or $717 million, from the prior year. Theincrease was driven by the Merger, higher revenues and an increased benefitfrom the Provision for credit losses. These factors were offset partially by highercompensation expense. Return on equity was 18%.
Total net revenue of $14.6 billion was up $2.0 billion, or 16%, over the prioryear, driven by strong Fixed Income and Equity Markets and Investment bankingfees. Investment banking fees of $4.1 billion increased 15% from the prior yeardriven by strong growth in advisory fees resulting in part from the Cazenovebusiness partnership. Advisory revenues of $1.3 billion were up 35% from theprior year, reflecting higher market volumes. Debt underwriting revenues of
MANAGEMENT’S DISCUSSION AND ANALYSISJPMorgan Chase & Co.
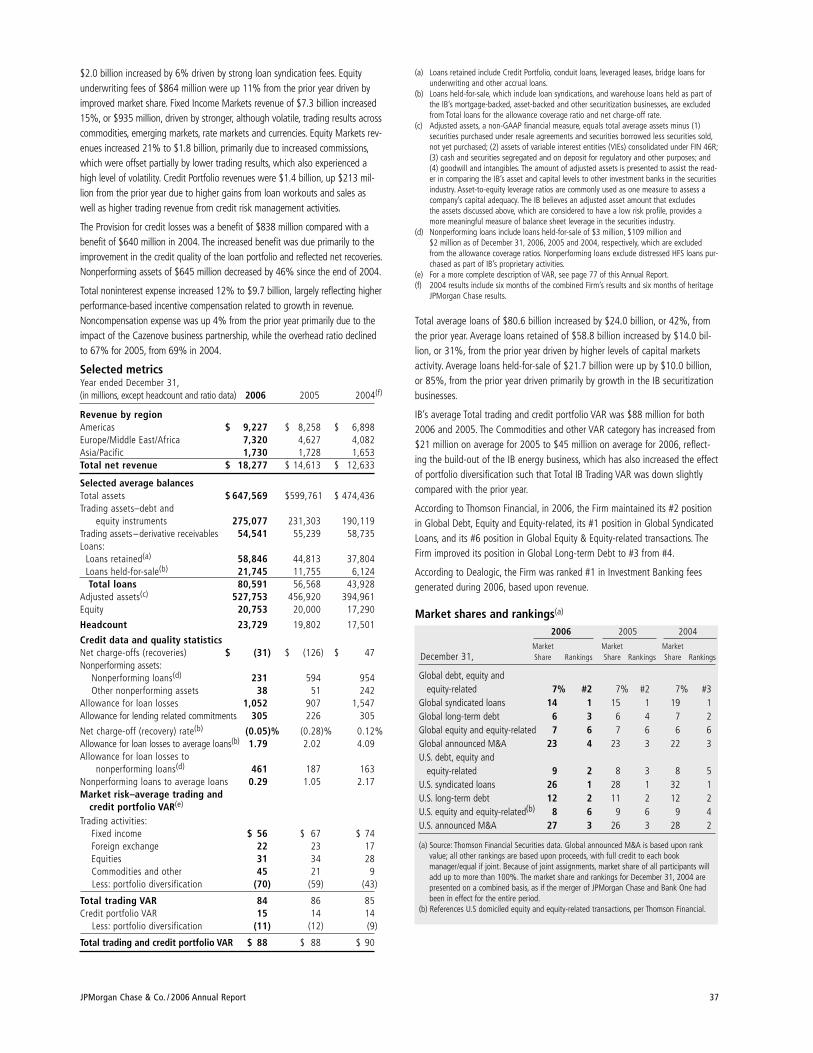
(a) Loans retained include Credit Portfolio, conduit loans, leveraged leases, bridge loans forunderwriting and other accrual loans.
(b) Loans held-for-sale, which include loan syndications, and warehouse loans held as part ofthe IB’s mortgage-backed, asset-backed and other securitization businesses, are excludedfrom Total loans for the allowance coverage ratio and net charge-off rate.
(c) Adjusted assets, a non-GAAP financial measure, equals total average assets minus (1)securities purchased under resale agreements and securities borrowed less securities sold,not yet purchased; (2) assets of variable interest entities (VIEs) consolidated under FIN 46R;(3) cash and securities segregated and on deposit for regulatory and other purposes; and(4) goodwill and intangibles. The amount of adjusted assets is presented to assist the read-er in comparing the IB’s asset and capital levels to other investment banks in the securitiesindustry. Asset-to-equity leverage ratios are commonly used as one measure to assess acompany’s capital adequacy. The IB believes an adjusted asset amount that excludes the assets discussed above, which are considered to have a low risk profile, provides amore meaningful measure of balance sheet leverage in the securities industry.
(d) Nonperforming loans include loans held-for-sale of $3 million, $109 million and $2 million as of December 31, 2006, 2005 and 2004, respectively, which are excludedfrom the allowance coverage ratios. Nonperforming loans exclude distressed HFS loans pur-chased as part of IB’s proprietary activities.
(e) For a more complete description of VAR, see page 77 of this Annual Report.(f) 2004 results include six months of the combined Firm’s results and six months of heritage
JPMorgan Chase results.
Total average loans of $80.6 billion increased by $24.0 billion, or 42%, fromthe prior year. Average loans retained of $58.8 billion increased by $14.0 bil-lion, or 31%, from the prior year driven by higher levels of capital marketsactivity. Average loans held-for-sale of $21.7 billion were up by $10.0 billion,or 85%, from the prior year driven primarily by growth in the IB securitizationbusinesses.
IB’s average Total trading and credit portfolio VAR was $88 million for both2006 and 2005. The Commodities and other VAR category has increased from$21 million on average for 2005 to $45 million on average for 2006, reflect-ing the build-out of the IB energy business, which has also increased the effectof portfolio diversification such that Total IB Trading VAR was down slightly compared with the prior year.
According to Thomson Financial, in 2006, the Firm maintained its #2 positionin Global Debt, Equity and Equity-related, its #1 position in Global SyndicatedLoans, and its #6 position in Global Equity & Equity-related transactions. TheFirm improved its position in Global Long-term Debt to #3 from #4.
According to Dealogic, the Firm was ranked #1 in Investment Banking feesgenerated during 2006, based upon revenue.
Market shares and rankings(a)
2006 2005 2004
Market Market MarketDecember 31, Share Rankings Share Rankings Share Rankings
Global debt, equity and equity-related 7% #2 7% #2 7% #3
Global syndicated loans 14 1 15 1 19 1Global long-term debt 6 3 6 4 7 2Global equity and equity-related 7 6 7 6 6 6Global announced M&A 23 4 23 3 22 3U.S. debt, equity and
equity-related 9 2 8 3 8 5U.S. syndicated loans 26 1 28 1 32 1U.S. long-term debt 12 2 11 2 12 2U.S. equity and equity-related(b) 8 6 9 6 9 4U.S. announced M&A 27 3 26 3 28 2
(a) Source: Thomson Financial Securities data. Global announced M&A is based upon rankvalue; all other rankings are based upon proceeds, with full credit to each book manager/equal if joint. Because of joint assignments, market share of all participants willadd up to more than 100%. The market share and rankings for December 31, 2004 arepresented on a combined basis, as if the merger of JPMorgan Chase and Bank One hadbeen in effect for the entire period.
(b) References U.S domiciled equity and equity-related transactions, per Thomson Financial.
$2.0 billion increased by 6% driven by strong loan syndication fees. Equityunderwriting fees of $864 million were up 11% from the prior year driven byimproved market share. Fixed Income Markets revenue of $7.3 billion increased15%, or $935 million, driven by stronger, although volatile, trading results acrosscommodities, emerging markets, rate markets and currencies. Equity Markets rev-enues increased 21% to $1.8 billion, primarily due to increased commissions,which were offset partially by lower trading results, which also experienced ahigh level of volatility. Credit Portfolio revenues were $1.4 billion, up $213 mil-lion from the prior year due to higher gains from loan workouts and sales aswell as higher trading revenue from credit risk management activities.
The Provision for credit losses was a benefit of $838 million compared with abenefit of $640 million in 2004. The increased benefit was due primarily to theimprovement in the credit quality of the loan portfolio and reflected net recoveries.Nonperforming assets of $645 million decreased by 46% since the end of 2004.
Total noninterest expense increased 12% to $9.7 billion, largely reflecting higherperformance-based incentive compensation related to growth in revenue.Noncompensation expense was up 4% from the prior year primarily due to theimpact of the Cazenove business partnership, while the overhead ratio declinedto 67% for 2005, from 69% in 2004.
Selected metricsYear ended December 31,(in millions, except headcount and ratio data) 2006 2005 2004(f)
Revenue by regionAmericas $ 9,227 $ 8,258 $ 6,898Europe/Middle East/Africa 7,320 4,627 4,082Asia/Pacific 1,730 1,728 1,653Total net revenue $ 18,277 $ 14,613 $ 12,633
Selected average balancesTotal assets $ 647,569 $599,761 $ 474,436Trading assets–debt and
equity instruments 275,077 231,303 190,119Trading assets–derivative receivables 54,541 55,239 58,735Loans:
Loans retained(a) 58,846 44,813 37,804Loans held-for-sale(b) 21,745 11,755 6,124Total loans 80,591 56,568 43,928
Adjusted assets(c) 527,753 456,920 394,961Equity 20,753 20,000 17,290
Headcount 23,729 19,802 17,501
Credit data and quality statisticsNet charge-offs (recoveries) $ (31) $ (126) $ 47Nonperforming assets:
Nonperforming loans(d) 231 594 954Other nonperforming assets 38 51 242
Allowance for loan losses 1,052 907 1,547Allowance for lending related commitments 305 226 305
Net charge-off (recovery) rate(b) (0.05)% (0.28)% 0.12%Allowance for loan losses to average loans(b) 1.79 2.02 4.09Allowance for loan losses to
nonperforming loans(d) 461 187 163Nonperforming loans to average loans 0.29 1.05 2.17Market risk–average trading and
credit portfolio VAR(e)
Trading activities:Fixed income $ 56 $ 67 $ 74Foreign exchange 22 23 17Equities 31 34 28Commodities and other 45 21 9Less: portfolio diversification (70) (59) (43)
Total trading VAR 84 86 85Credit portfolio VAR 15 14 14
Less: portfolio diversification (11) (12) (9)
Total trading and credit portfolio VAR $ 88 $ 88 $ 90
JPMorgan Chase & Co. / 2006 Annual Report 37

RETA IL F INANCIAL SERV ICES
Retail Financial Services, which includes Regional Banking,Mortgage Banking and Auto Finance reporting segments, helpsmeet the financial needs of consumers and businesses. RFS pro-vides convenient consumer banking through the nation’s fourth-largest branch network and third-largest ATM network. RFS is atop-five mortgage originator and servicer, the second-largesthome equity originator, the largest noncaptive originator of auto-mobile loans and one of the largest student loan originators.
RFS serves customers through more than 3,000 bank branches,8,500 ATMs and 270 mortgage offices, and through relation-ships with more than 15,000 auto dealerships and 4,300schools and universities. More than 11,000 branch salespeopleassist customers, across a 17-state footprint from New York toArizona, with checking and savings accounts, mortgage, homeequity and business loans, investments and insurance. Over1,200 additional mortgage officers provide home loansthroughout the country.
During the first quarter of 2006, RFS completed the purchase of CollegiateFunding Services, which contributed an education loan servicing capability andprovided an entry into the Federal Family Education Loan Program consolida-tion market. On July 1, 2006, RFS sold its life insurance and annuity underwrit-ing businesses to Protective Life Corporation. On October 1, 2006, JPMorganChase completed The Bank of New York transaction, significantly strengtheningRFS’s distribution network in the New York Tri-state area.
Selected income statement data Year ended December 31,(in millions, except ratios) 2006 2005 2004(b)
RevenueLending & deposit related fees $ 1,597 $ 1,452 $ 1,013Asset management, administration
and commissions 1,422 1,498 1,020Securities gains (losses) (57) 9 (83)Mortgage fees and related income 618 1,104 866Credit card income 523 426 230Other income 557 136 31
Noninterest revenue 4,660 4,625 3,077Net interest income 10,165 10,205 7,714
Total net revenue 14,825 14,830 10,791
Provision for credit losses 561 724 449
Noninterest expenseCompensation expense 3,657 3,337 2,621Noncompensation expense 4,806 4,748 3,937Amortization of intangibles 464 500 267
Total noninterest expense 8,927 8,585 6,825
Income before income tax expense 5,337 5,521 3,517Income tax expense 2,124 2,094 1,318
Net income $ 3,213 $ 3,427 $ 2,199
Financial ratiosROE 22% 26% 24%ROA 1.39 1.51 1.18Overhead ratio 60 58 63Overhead ratio excluding core
deposit intangibles(a) 57 55 61
(a) Retail Financial Services uses the overhead ratio (excluding the amortization of core depositintangibles (“CDI”)), a non-GAAP financial measure, to evaluate the underlying expensetrends of the business. Including CDI amortization expense in the overhead ratio calculation
results in a higher overhead ratio in the earlier years and a lower overhead ratio in lateryears; this method would result in an improving overhead ratio over time, all things remain-ing equal. This non-GAAP ratio excludes Regional Banking’s core deposit intangible amorti-zation expense related to The Bank of New York transaction and the Bank One merger of$458 million, $496 million and $264 million for the years ended December 31, 2006, 2005and 2004, respectively.
(b) 2004 results include six months of the combined Firm’s results and six months of heritageJPMorgan Chase results.
2006 compared with 2005Net income of $3.2 billion was down by $214 million, or 6%, from the prioryear. A decline in Mortgage Banking was offset partially by improved results inRegional Banking and Auto Finance.
Total net revenue of $14.8 billion was flat compared with the prior year. Netinterest income of $10.2 billion was down slightly due to narrower spreads onloans and deposits in Regional Banking, lower auto loan and lease balancesand the sale of the insurance business. These declines were offset by the benefitof higher deposit and loan balances in Regional Banking, wider loan spreads inAuto Finance and The Bank of New York transaction. Noninterest revenue of$4.7 billion was up $35 million, or 1%, from the prior year. Results benefitedfrom increases in deposit-related and branch production fees, higher automobileoperating lease revenue and The Bank of New York transaction. This benefit wasoffset by lower net mortgage servicing revenue, the sale of the insurance busi-ness and losses related to loans transferred to held-for-sale. In 2006, losses of$233 million, compared with losses of $120 million in 2005, were recognized inRegional Banking related to mortgage loans transferred to held-for-sale; andlosses of $50 million, compared with losses of $136 million in the prior year,were recognized in Auto Finance related to automobile loans transferred toheld-for-sale.
The provision for credit losses of $561 million was down by $163 million fromthe prior-year provision due to the absence of a $250 million special provisionfor credit losses related to Hurricane Katrina in the prior year, partially offsetby the establishment of additional allowance for loan losses related to loansacquired from The Bank of New York.
Noninterest expense of $8.9 billion was up by $342 million, or 4%, primarilydue to The Bank of New York transaction, the acquisition of CollegiateFunding Services, investments in the retail distribution network and higherdepreciation expense on owned automobiles subject to operating leases. Theseincreases were offset partially by the sale of the insurance business and merg-er-related and other operating efficiencies and the absence of a $40 millionprior-year charge related to the dissolution of a student loan joint venture.
2005 compared with 2004Net income was $3.4 billion, up $1.2 billion from the prior year. The increasewas due largely to the Merger but also reflected increased deposit balancesand wider spreads, higher home equity and subprime mortgage balances, andexpense savings in all businesses. These benefits were offset partially by nar-rower spreads on retained loan portfolios, the special provision for HurricaneKatrina and net losses associated with portfolio loan sales in RegionalBanking and Auto Finance.
Total net revenue increased to $14.8 billion, up $4.0 billion, or 37%, due pri-marily to the Merger. Net interest income of $10.2 billion increased by $2.5billion as a result of the Merger, increased deposit balances and widerspreads, and growth in retained consumer real estate loans. These benefitswere offset partially by narrower spreads on loan balances and the absenceof loan portfolios sold in late 2004 and early 2005. Noninterest revenue of$4.6 billion increased by $1.5 billion due to the Merger, improved MSR riskmanagement results, higher automobile operating lease income and increased
MANAGEMENT’S DISCUSSION AND ANALYSISJPMorgan Chase & Co.
38 JPMorgan Chase & Co. / 2006 Annual Report
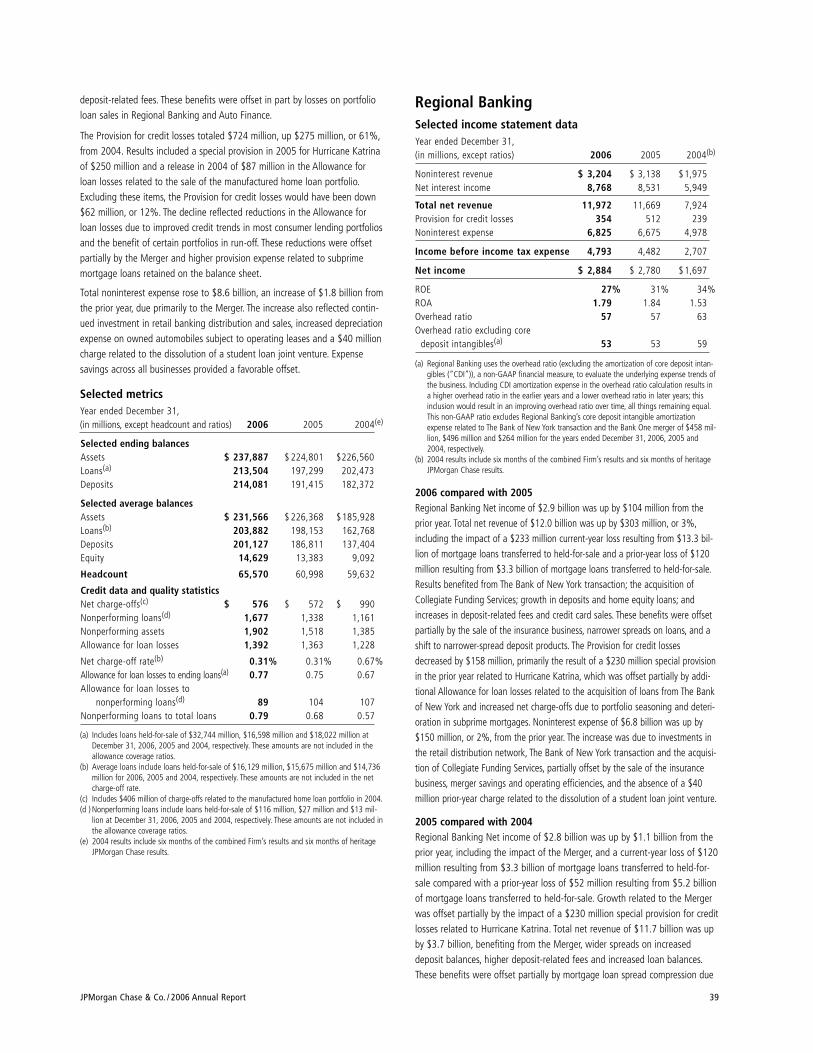
JPMorgan Chase & Co. / 2006 Annual Report 39
Regional BankingSelected income statement data Year ended December 31,(in millions, except ratios) 2006 2005 2004(b)
Noninterest revenue $ 3,204 $ 3,138 $1,975Net interest income 8,768 8,531 5,949
Total net revenue 11,972 11,669 7,924Provision for credit losses 354 512 239Noninterest expense 6,825 6,675 4,978
Income before income tax expense 4,793 4,482 2,707
Net income $ 2,884 $ 2,780 $1,697
ROE 27% 31% 34%ROA 1.79 1.84 1.53Overhead ratio 57 57 63Overhead ratio excluding core
deposit intangibles(a) 53 53 59
(a) Regional Banking uses the overhead ratio (excluding the amortization of core deposit intan-gibles (“CDI”)), a non-GAAP financial measure, to evaluate the underlying expense trends ofthe business. Including CDI amortization expense in the overhead ratio calculation results ina higher overhead ratio in the earlier years and a lower overhead ratio in later years; thisinclusion would result in an improving overhead ratio over time, all things remaining equal.This non-GAAP ratio excludes Regional Banking’s core deposit intangible amortizationexpense related to The Bank of New York transaction and the Bank One merger of $458 mil-lion, $496 million and $264 million for the years ended December 31, 2006, 2005 and2004, respectively.
(b) 2004 results include six months of the combined Firm’s results and six months of heritageJPMorgan Chase results.
2006 compared with 2005Regional Banking Net income of $2.9 billion was up by $104 million from theprior year. Total net revenue of $12.0 billion was up by $303 million, or 3%,including the impact of a $233 million current-year loss resulting from $13.3 bil-lion of mortgage loans transferred to held-for-sale and a prior-year loss of $120million resulting from $3.3 billion of mortgage loans transferred to held-for-sale.Results benefited from The Bank of New York transaction; the acquisition ofCollegiate Funding Services; growth in deposits and home equity loans; andincreases in deposit-related fees and credit card sales. These benefits were offsetpartially by the sale of the insurance business, narrower spreads on loans, and ashift to narrower-spread deposit products. The Provision for credit lossesdecreased by $158 million, primarily the result of a $230 million special provisionin the prior year related to Hurricane Katrina, which was offset partially by addi-tional Allowance for loan losses related to the acquisition of loans from The Bankof New York and increased net charge-offs due to portfolio seasoning and deteri-oration in subprime mortgages. Noninterest expense of $6.8 billion was up by$150 million, or 2%, from the prior year. The increase was due to investments inthe retail distribution network, The Bank of New York transaction and the acquisi-tion of Collegiate Funding Services, partially offset by the sale of the insurancebusiness, merger savings and operating efficiencies, and the absence of a $40million prior-year charge related to the dissolution of a student loan joint venture.
2005 compared with 2004Regional Banking Net income of $2.8 billion was up by $1.1 billion from theprior year, including the impact of the Merger, and a current-year loss of $120million resulting from $3.3 billion of mortgage loans transferred to held-for-sale compared with a prior-year loss of $52 million resulting from $5.2 billionof mortgage loans transferred to held-for-sale. Growth related to the Mergerwas offset partially by the impact of a $230 million special provision for creditlosses related to Hurricane Katrina. Total net revenue of $11.7 billion was upby $3.7 billion, benefiting from the Merger, wider spreads on increaseddeposit balances, higher deposit-related fees and increased loan balances.These benefits were offset partially by mortgage loan spread compression due
deposit-related fees. These benefits were offset in part by losses on portfolioloan sales in Regional Banking and Auto Finance.
The Provision for credit losses totaled $724 million, up $275 million, or 61%,from 2004. Results included a special provision in 2005 for Hurricane Katrinaof $250 million and a release in 2004 of $87 million in the Allowance forloan losses related to the sale of the manufactured home loan portfolio.Excluding these items, the Provision for credit losses would have been down$62 million, or 12%. The decline reflected reductions in the Allowance forloan losses due to improved credit trends in most consumer lending portfoliosand the benefit of certain portfolios in run-off. These reductions were offsetpartially by the Merger and higher provision expense related to subprimemortgage loans retained on the balance sheet.
Total noninterest expense rose to $8.6 billion, an increase of $1.8 billion fromthe prior year, due primarily to the Merger. The increase also reflected contin-ued investment in retail banking distribution and sales, increased depreciationexpense on owned automobiles subject to operating leases and a $40 millioncharge related to the dissolution of a student loan joint venture. Expense savings across all businesses provided a favorable offset.
Selected metricsYear ended December 31,(in millions, except headcount and ratios) 2006 2005 2004(e)
Selected ending balancesAssets $ 237,887 $ 224,801 $226,560Loans(a) 213,504 197,299 202,473Deposits 214,081 191,415 182,372
Selected average balancesAssets $ 231,566 $ 226,368 $185,928Loans(b) 203,882 198,153 162,768Deposits 201,127 186,811 137,404Equity 14,629 13,383 9,092
Headcount 65,570 60,998 59,632
Credit data and quality statisticsNet charge-offs(c) $ 576 $ 572 $ 990Nonperforming loans(d) 1,677 1,338 1,161Nonperforming assets 1,902 1,518 1,385Allowance for loan losses 1,392 1,363 1,228
Net charge-off rate(b) 0.31% 0.31% 0.67%Allowance for loan losses to ending loans(a) 0.77 0.75 0.67Allowance for loan losses to
nonperforming loans(d) 89 104 107Nonperforming loans to total loans 0.79 0.68 0.57
(a) Includes loans held-for-sale of $32,744 million, $16,598 million and $18,022 million atDecember 31, 2006, 2005 and 2004, respectively. These amounts are not included in theallowance coverage ratios.
(b) Average loans include loans held-for-sale of $16,129 million, $15,675 million and $14,736million for 2006, 2005 and 2004, respectively. These amounts are not included in the netcharge-off rate.
(c) Includes $406 million of charge-offs related to the manufactured home loan portfolio in 2004.(d ) Nonperforming loans include loans held-for-sale of $116 million, $27 million and $13 mil-
lion at December 31, 2006, 2005 and 2004, respectively. These amounts are not included inthe allowance coverage ratios.
(e) 2004 results include six months of the combined Firm’s results and six months of heritageJPMorgan Chase results.
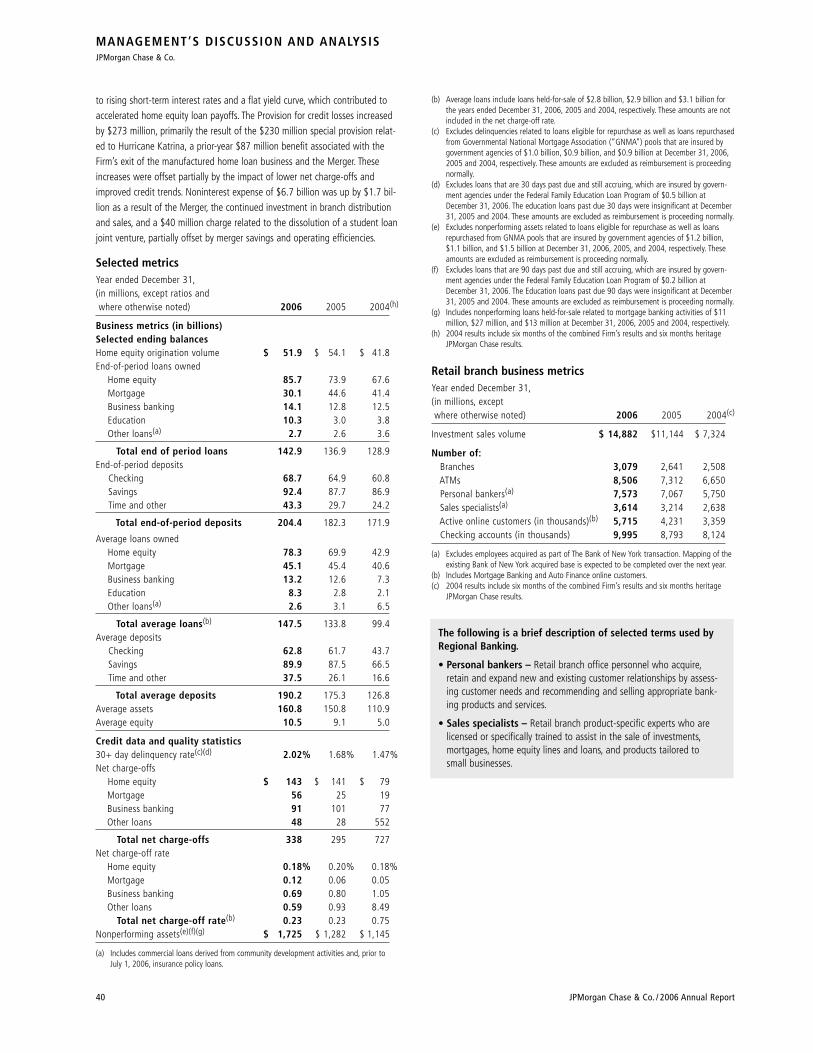
MANAGEMENT’S DISCUSSION AND ANALYSISJPMorgan Chase & Co.
40 JPMorgan Chase & Co. / 2006 Annual Report
to rising short-term interest rates and a flat yield curve, which contributed toaccelerated home equity loan payoffs. The Provision for credit losses increasedby $273 million, primarily the result of the $230 million special provision relat-ed to Hurricane Katrina, a prior-year $87 million benefit associated with theFirm’s exit of the manufactured home loan business and the Merger. Theseincreases were offset partially by the impact of lower net charge-offs andimproved credit trends. Noninterest expense of $6.7 billion was up by $1.7 bil-lion as a result of the Merger, the continued investment in branch distributionand sales, and a $40 million charge related to the dissolution of a student loanjoint venture, partially offset by merger savings and operating efficiencies.
Selected metrics Year ended December 31,(in millions, except ratios and where otherwise noted) 2006 2005 2004(h)
Business metrics (in billions)Selected ending balancesHome equity origination volume $ 51.9 $ 54.1 $ 41.8End-of-period loans owned
Home equity 85.7 73.9 67.6Mortgage 30.1 44.6 41.4Business banking 14.1 12.8 12.5Education 10.3 3.0 3.8Other loans(a) 2.7 2.6 3.6
Total end of period loans 142.9 136.9 128.9End-of-period deposits
Checking 68.7 64.9 60.8Savings 92.4 87.7 86.9Time and other 43.3 29.7 24.2
Total end-of-period deposits 204.4 182.3 171.9
Average loans ownedHome equity 78.3 69.9 42.9Mortgage 45.1 45.4 40.6Business banking 13.2 12.6 7.3Education 8.3 2.8 2.1Other loans(a) 2.6 3.1 6.5
Total average loans(b) 147.5 133.8 99.4Average deposits
Checking 62.8 61.7 43.7Savings 89.9 87.5 66.5Time and other 37.5 26.1 16.6
Total average deposits 190.2 175.3 126.8Average assets 160.8 150.8 110.9Average equity 10.5 9.1 5.0
Credit data and quality statistics30+ day delinquency rate(c)(d) 2.02% 1.68% 1.47%Net charge-offs
Home equity $ 143 $ 141 $ 79Mortgage 56 25 19Business banking 91 101 77Other loans 48 28 552
Total net charge-offs 338 295 727Net charge-off rate
Home equity 0.18% 0.20% 0.18%Mortgage 0.12 0.06 0.05Business banking 0.69 0.80 1.05Other loans 0.59 0.93 8.49
Total net charge-off rate(b) 0.23 0.23 0.75Nonperforming assets(e)(f)(g) $ 1,725 $ 1,282 $ 1,145
(a) Includes commercial loans derived from community development activities and, prior to July 1, 2006, insurance policy loans.
(b) Average loans include loans held-for-sale of $2.8 billion, $2.9 billion and $3.1 billion forthe years ended December 31, 2006, 2005 and 2004, respectively. These amounts are notincluded in the net charge-off rate.
(c) Excludes delinquencies related to loans eligible for repurchase as well as loans repurchasedfrom Governmental National Mortgage Association (“GNMA”) pools that are insured bygovernment agencies of $1.0 billion, $0.9 billion, and $0.9 billion at December 31, 2006,2005 and 2004, respectively. These amounts are excluded as reimbursement is proceedingnormally.
(d) Excludes loans that are 30 days past due and still accruing, which are insured by govern-ment agencies under the Federal Family Education Loan Program of $0.5 billion atDecember 31, 2006. The education loans past due 30 days were insignificant at December31, 2005 and 2004. These amounts are excluded as reimbursement is proceeding normally.
(e) Excludes nonperforming assets related to loans eligible for repurchase as well as loansrepurchased from GNMA pools that are insured by government agencies of $1.2 billion,$1.1 billion, and $1.5 billion at December 31, 2006, 2005, and 2004, respectively. Theseamounts are excluded as reimbursement is proceeding normally.
(f) Excludes loans that are 90 days past due and still accruing, which are insured by govern-ment agencies under the Federal Family Education Loan Program of $0.2 billion atDecember 31, 2006. The Education loans past due 90 days were insignificant at December31, 2005 and 2004. These amounts are excluded as reimbursement is proceeding normally.
(g) Includes nonperforming loans held-for-sale related to mortgage banking activities of $11million, $27 million, and $13 million at December 31, 2006, 2005 and 2004, respectively.
(h) 2004 results include six months of the combined Firm’s results and six months heritageJPMorgan Chase results.
Retail branch business metricsYear ended December 31,(in millions, except where otherwise noted) 2006 2005 2004(c)
Investment sales volume $ 14,882 $11,144 $ 7,324
Number of:Branches 3,079 2,641 2,508ATMs 8,506 7,312 6,650Personal bankers(a) 7,573 7,067 5,750Sales specialists(a) 3,614 3,214 2,638Active online customers (in thousands)(b) 5,715 4,231 3,359Checking accounts (in thousands) 9,995 8,793 8,124
(a) Excludes employees acquired as part of The Bank of New York transaction. Mapping of theexisting Bank of New York acquired base is expected to be completed over the next year.
(b) Includes Mortgage Banking and Auto Finance online customers.(c) 2004 results include six months of the combined Firm’s results and six months heritage
JPMorgan Chase results.
The following is a brief description of selected terms used byRegional Banking.
• Personal bankers – Retail branch office personnel who acquire,retain and expand new and existing customer relationships by assess-ing customer needs and recommending and selling appropriate bank-ing products and services.
• Sales specialists – Retail branch product-specific experts who arelicensed or specifically trained to assist in the sale of investments,mortgages, home equity lines and loans, and products tailored to small businesses.

JPMorgan Chase & Co. / 2006 Annual Report 41
Mortgage Banking Selected income statement dataYear ended December 31, (in millions,except ratios and where otherwise noted) 2006 2005 2004(a)
Production revenue $ 833 $ 744 $ 916Net mortgage servicing revenue:
Servicing revenue 2,300 2,115 2,070Changes in MSR asset fair value:
Due to inputs or assumptions inmodel 165 770 (248)
Other changes in fair value (1,440) (1,295) (1,309)Derivative valuation adjustments
and other (544) (494) 361
Total net mortgage servicing revenue 481 1,096 874
Total net revenue 1,314 1,840 1,790Noninterest expense 1,341 1,239 1,364
Income (loss) before income tax expense (27) 601 426
Net income (loss) $ (17) $ 379 $ 269
ROE NM 24% 17%ROA NM 1.69 1.10Business metrics (in billions)
Third-party mortgage loans serviced(ending) $ 526.7 $ 467.5 $ 430.9
MSR net carrying value (ending) 7.5 6.5 5.1Average mortgage loans held-for-sale 12.8 12.1 11.4Average assets 25.8 22.4 24.4Average equity 1.7 1.6 1.6
Mortgage origination volume bychannel (in billions)
Retail $ 40.4 $ 46.3 $ 47.9Wholesale 32.8 34.2 33.5Correspondent (including negotiated
transactions) 45.9 48.5 64.2
Total $ 119.1 $ 129.0 $ 145.6
(a) 2004 results include six months of the combined Firm’s results and six months heritageJPMorgan Chase results.
2006 compared with 2005Mortgage Banking Net loss was $17 million compared with net income of$379 million in the prior year. Total net revenue of $1.3 billion was down by$526 million from the prior year due to a decline in net mortgage servicingrevenue offset partially by an increase in production revenue. Production rev-enue was $833 million, up by $89 million, reflecting increased loan salesand wider gain on sale margins that benefited from a shift in the sales mix.Net mortgage servicing revenue, which includes loan servicing revenue, MSRrisk management results and other changes in fair value, was $481 millioncompared with $1.1 billion in the prior year. Loan servicing revenue of $2.3billion increased by $185 million on a 13% increase in third-party loansserviced. MSR risk management revenue of negative $379 million was downby $655 million from the prior year, including the impact of a $235 millionnegative valuation adjustment to the MSR asset in the third quarter of 2006due to changes and refinements to assumptions used in the MSR valuationmodel. This result also reflected a fully hedged position in the current year.Other changes in fair value of the MSR asset, representing runoff of theasset against the realization of servicing cash flows, were negative $1.4 bil-lion. Noninterest expense was $1.3 billion, up by $102 million, or 8%, dueprimarily to higher compensation expense related to an increase in the num-ber of loan officers.
Mortgage Banking origination channels comprise the following:
Retail – Borrowers who are buying or refinancing a home work directlywith a mortgage banker employed by the Firm using a branch office, theInternet or by phone. Borrowers are frequently referred to a mortgagebanker by real estate brokers, home builders or other third parties.
Wholesale – A third-party mortgage broker refers loan applications to a mortgage banker at the Firm. Brokers are independent loan originatorsthat specialize in finding and counseling borrowers but do not providefunding for loans.
Correspondent – Banks, thrifts, other mortgage banks and other financial institutions sell closed loans to the Firm.
Correspondent negotiated transactions (“CNT”) – Mid- to large-sized mortgage lenders, banks and bank-owned mortgage companies sell servicing to the Firm on an as-originated basis. These transactionssupplement traditional production channels and provide growth opportu-nities in the servicing portfolio in stable and rising rate periods.
2005 compared with 2004Mortgage Banking Net income was $379 million compared with $269 millionin the prior year. Net revenue of $1.8 billion was up by $50 million from theprior year. Revenue comprises production revenue and net mortgage servicingrevenue. Production revenue was $744 million, down by $172 million, due toan 11% decrease in mortgage originations. Net mortgage servicing revenue,which includes loan servicing revenue, MSR risk management results and otherchanges in fair value, was $1.1 billion compared with $874 million in the prioryear. Loan servicing revenue of $2.1 billion increased by $45 million on an 8%increase in third-party loans serviced. MSR risk management revenue of $276million was up by $163 million from the prior year, reflecting positive risk man-agement results. Other changes in fair value of the MSR asset, representingrunoff of the asset against the realization of servicing cash flows, were nega-tive $1.3 billion. Noninterest expense of $1.2 billion was down by $125 mil-lion, or 9%, reflecting lower production volume and operating efficiencies.
Net Mortgage servicing revenue components:
Production income – Includes net gain or loss on sales of mortgageloans, and other production related fees.
Servicing revenue – Represents all revenues earned from servicingmortgage loans for third parties, including stated service fees, excess serv-ice fees, late fees, and other ancillary fees.
Changes in MSR asset fair value due to inputs or assumptionsin model – Represents MSR asset fair value adjustments due to changesin market-based inputs, such as interest rates and volatility, as well asupdates to valuation assumptions used in the valuation model.
Changes in MSR asset fair value due to other changes – Includeschanges in the MSR value due to servicing portfolio runoff (or timedecay). Effective January 1, 2006, the Firm implemented SFAS 156,adopting fair value for the MSR asset. For the years ended December 31,2005 and 2004, this amount represents MSR asset amortization expensecalculated in accordance with SFAS 140.
Derivative valuation adjustments and other – Changes in the fairvalue of derivative instruments used to offset the impact of changes inmarket-based inputs to the MSR valuation model.
MSR risk management results – Includes “Changes in MSR asset fairvalue due to inputs or assumptions in model” and “Derivative valuationadjustments and other.”
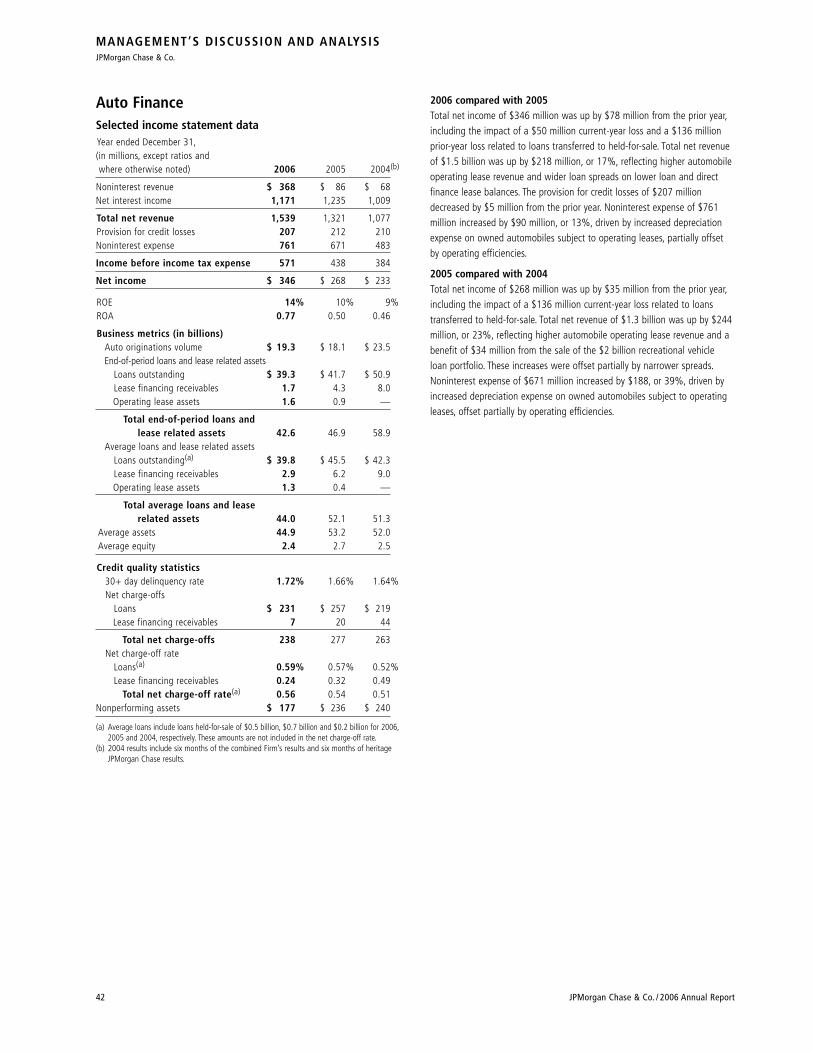
MANAGEMENT’S DISCUSSION AND ANALYSISJPMorgan Chase & Co.
42 JPMorgan Chase & Co. / 2006 Annual Report
Auto FinanceSelected income statement data Year ended December 31,(in millions, except ratios andwhere otherwise noted) 2006 2005 2004(b)
Noninterest revenue $ 368 $ 86 $ 68Net interest income 1,171 1,235 1,009
Total net revenue 1,539 1,321 1,077Provision for credit losses 207 212 210Noninterest expense 761 671 483
Income before income tax expense 571 438 384
Net income $ 346 $ 268 $ 233
ROE 14% 10% 9%ROA 0.77 0.50 0.46
Business metrics (in billions)Auto originations volume $ 19.3 $ 18.1 $ 23.5End-of-period loans and lease related assets
Loans outstanding $ 39.3 $ 41.7 $ 50.9Lease financing receivables 1.7 4.3 8.0Operating lease assets 1.6 0.9 —
Total end-of-period loans andlease related assets 42.6 46.9 58.9
Average loans and lease related assetsLoans outstanding(a) $ 39.8 $ 45.5 $ 42.3Lease financing receivables 2.9 6.2 9.0Operating lease assets 1.3 0.4 —
Total average loans and leaserelated assets 44.0 52.1 51.3
Average assets 44.9 53.2 52.0Average equity 2.4 2.7 2.5
Credit quality statistics30+ day delinquency rate 1.72% 1.66% 1.64%Net charge-offs
Loans $ 231 $ 257 $ 219Lease financing receivables 7 20 44
Total net charge-offs 238 277 263Net charge-off rate
Loans(a) 0.59% 0.57% 0.52%Lease financing receivables 0.24 0.32 0.49
Total net charge-off rate(a) 0.56 0.54 0.51Nonperforming assets $ 177 $ 236 $ 240
(a) Average loans include loans held-for-sale of $0.5 billion, $0.7 billion and $0.2 billion for 2006,2005 and 2004, respectively. These amounts are not included in the net charge-off rate.
(b) 2004 results include six months of the combined Firm’s results and six months of heritageJPMorgan Chase results.
2006 compared with 2005Total net income of $346 million was up by $78 million from the prior year,including the impact of a $50 million current-year loss and a $136 millionprior-year loss related to loans transferred to held-for-sale. Total net revenueof $1.5 billion was up by $218 million, or 17%, reflecting higher automobileoperating lease revenue and wider loan spreads on lower loan and directfinance lease balances. The provision for credit losses of $207 milliondecreased by $5 million from the prior year. Noninterest expense of $761million increased by $90 million, or 13%, driven by increased depreciationexpense on owned automobiles subject to operating leases, partially offsetby operating efficiencies.
2005 compared with 2004Total net income of $268 million was up by $35 million from the prior year,including the impact of a $136 million current-year loss related to loanstransferred to held-for-sale. Total net revenue of $1.3 billion was up by $244million, or 23%, reflecting higher automobile operating lease revenue and abenefit of $34 million from the sale of the $2 billion recreational vehicleloan portfolio. These increases were offset partially by narrower spreads.Noninterest expense of $671 million increased by $188, or 39%, driven byincreased depreciation expense on owned automobiles subject to operatingleases, offset partially by operating efficiencies.
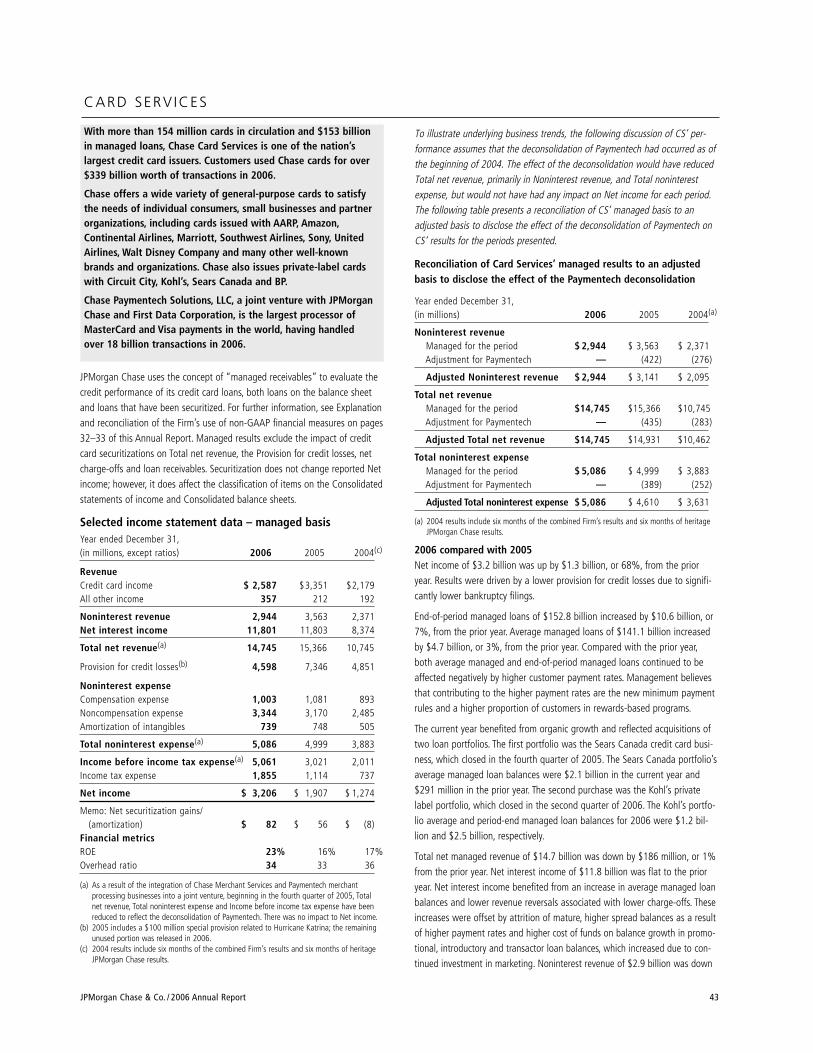
CARD SERV ICES
With more than 154 million cards in circulation and $153 billionin managed loans, Chase Card Services is one of the nation’slargest credit card issuers. Customers used Chase cards for over$339 billion worth of transactions in 2006.
Chase offers a wide variety of general-purpose cards to satisfythe needs of individual consumers, small businesses and partnerorganizations, including cards issued with AARP, Amazon,Continental Airlines, Marriott, Southwest Airlines, Sony, UnitedAirlines, Walt Disney Company and many other well-knownbrands and organizations. Chase also issues private-label cardswith Circuit City, Kohl’s, Sears Canada and BP.
Chase Paymentech Solutions, LLC, a joint venture with JPMorganChase and First Data Corporation, is the largest processor ofMasterCard and Visa payments in the world, having handledover 18 billion transactions in 2006.
JPMorgan Chase uses the concept of “managed receivables” to evaluate thecredit performance of its credit card loans, both loans on the balance sheetand loans that have been securitized. For further information, see Explanationand reconciliation of the Firm’s use of non-GAAP financial measures on pages32–33 of this Annual Report. Managed results exclude the impact of creditcard securitizations on Total net revenue, the Provision for credit losses, netcharge-offs and loan receivables. Securitization does not change reported Netincome; however, it does affect the classification of items on the Consolidatedstatements of income and Consolidated balance sheets.
Selected income statement data – managed basisYear ended December 31,(in millions, except ratios) 2006 2005 2004(c)
RevenueCredit card income $ 2,587 $3,351 $2,179All other income 357 212 192
Noninterest revenue 2,944 3,563 2,371Net interest income 11,801 11,803 8,374
Total net revenue(a) 14,745 15,366 10,745
Provision for credit losses(b) 4,598 7,346 4,851
Noninterest expenseCompensation expense 1,003 1,081 893Noncompensation expense 3,344 3,170 2,485Amortization of intangibles 739 748 505
Total noninterest expense(a) 5,086 4,999 3,883
Income before income tax expense(a) 5,061 3,021 2,011Income tax expense 1,855 1,114 737
Net income $ 3,206 $ 1,907 $ 1,274
Memo: Net securitization gains/(amortization) $ 82 $ 56 $ (8)
Financial metricsROE 23% 16% 17%Overhead ratio 34 33 36
(a) As a result of the integration of Chase Merchant Services and Paymentech merchant processing businesses into a joint venture, beginning in the fourth quarter of 2005, Totalnet revenue, Total noninterest expense and Income before income tax expense have beenreduced to reflect the deconsolidation of Paymentech. There was no impact to Net income.
(b) 2005 includes a $100 million special provision related to Hurricane Katrina; the remainingunused portion was released in 2006.
(c) 2004 results include six months of the combined Firm’s results and six months of heritageJPMorgan Chase results.
JPMorgan Chase & Co. / 2006 Annual Report 43
To illustrate underlying business trends, the following discussion of CS’ per-formance assumes that the deconsolidation of Paymentech had occurred as ofthe beginning of 2004. The effect of the deconsolidation would have reducedTotal net revenue, primarily in Noninterest revenue, and Total noninterestexpense, but would not have had any impact on Net income for each period.The following table presents a reconciliation of CS’ managed basis to anadjusted basis to disclose the effect of the deconsolidation of Paymentech onCS’ results for the periods presented.
Reconciliation of Card Services’ managed results to an adjustedbasis to disclose the effect of the Paymentech deconsolidation
Year ended December 31,(in millions) 2006 2005 2004(a)
Noninterest revenueManaged for the period $ 2,944 $ 3,563 $ 2,371Adjustment for Paymentech — (422) (276)
Adjusted Noninterest revenue $ 2,944 $ 3,141 $ 2,095
Total net revenueManaged for the period $14,745 $15,366 $10,745Adjustment for Paymentech — (435) (283)
Adjusted Total net revenue $14,745 $14,931 $10,462
Total noninterest expenseManaged for the period $ 5,086 $ 4,999 $ 3,883Adjustment for Paymentech — (389) (252)
Adjusted Total noninterest expense $ 5,086 $ 4,610 $ 3,631
(a) 2004 results include six months of the combined Firm’s results and six months of heritageJPMorgan Chase results.
2006 compared with 2005 Net income of $3.2 billion was up by $1.3 billion, or 68%, from the prioryear. Results were driven by a lower provision for credit losses due to signifi-cantly lower bankruptcy filings.
End-of-period managed loans of $152.8 billion increased by $10.6 billion, or7%, from the prior year. Average managed loans of $141.1 billion increasedby $4.7 billion, or 3%, from the prior year. Compared with the prior year,both average managed and end-of-period managed loans continued to beaffected negatively by higher customer payment rates. Management believesthat contributing to the higher payment rates are the new minimum paymentrules and a higher proportion of customers in rewards-based programs.
The current year benefited from organic growth and reflected acquisitions oftwo loan portfolios. The first portfolio was the Sears Canada credit card busi-ness, which closed in the fourth quarter of 2005. The Sears Canada portfolio’saverage managed loan balances were $2.1 billion in the current year and$291 million in the prior year. The second purchase was the Kohl’s privatelabel portfolio, which closed in the second quarter of 2006. The Kohl’s portfo-lio average and period-end managed loan balances for 2006 were $1.2 bil-lion and $2.5 billion, respectively.
Total net managed revenue of $14.7 billion was down by $186 million, or 1%from the prior year. Net interest income of $11.8 billion was flat to the prioryear. Net interest income benefited from an increase in average managed loanbalances and lower revenue reversals associated with lower charge-offs. Theseincreases were offset by attrition of mature, higher spread balances as a resultof higher payment rates and higher cost of funds on balance growth in promo-tional, introductory and transactor loan balances, which increased due to con-tinued investment in marketing. Noninterest revenue of $2.9 billion was down
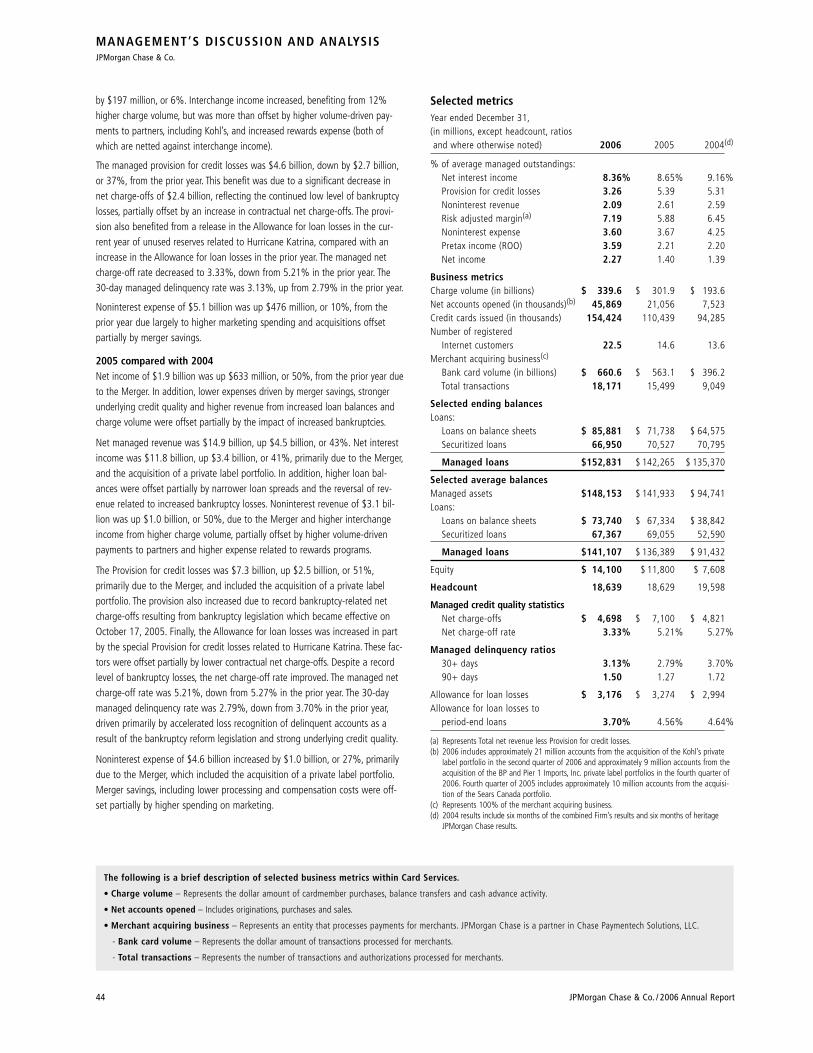
MANAGEMENT’S DISCUSSION AND ANALYSISJPMorgan Chase & Co.
44 JPMorgan Chase & Co. / 2006 Annual Report
by $197 million, or 6%. Interchange income increased, benefiting from 12%higher charge volume, but was more than offset by higher volume-driven pay-ments to partners, including Kohl’s, and increased rewards expense (both ofwhich are netted against interchange income).
The managed provision for credit losses was $4.6 billion, down by $2.7 billion,or 37%, from the prior year. This benefit was due to a significant decrease innet charge-offs of $2.4 billion, reflecting the continued low level of bankruptcylosses, partially offset by an increase in contractual net charge-offs. The provi-sion also benefited from a release in the Allowance for loan losses in the cur-rent year of unused reserves related to Hurricane Katrina, compared with anincrease in the Allowance for loan losses in the prior year. The managed netcharge-off rate decreased to 3.33%, down from 5.21% in the prior year. The30-day managed delinquency rate was 3.13%, up from 2.79% in the prior year.
Noninterest expense of $5.1 billion was up $476 million, or 10%, from theprior year due largely to higher marketing spending and acquisitions offsetpartially by merger savings.
2005 compared with 2004Net income of $1.9 billion was up $633 million, or 50%, from the prior year dueto the Merger. In addition, lower expenses driven by merger savings, strongerunderlying credit quality and higher revenue from increased loan balances andcharge volume were offset partially by the impact of increased bankruptcies.
Net managed revenue was $14.9 billion, up $4.5 billion, or 43%. Net interestincome was $11.8 billion, up $3.4 billion, or 41%, primarily due to the Merger,and the acquisition of a private label portfolio. In addition, higher loan bal-ances were offset partially by narrower loan spreads and the reversal of rev-enue related to increased bankruptcy losses. Noninterest revenue of $3.1 bil-lion was up $1.0 billion, or 50%, due to the Merger and higher interchangeincome from higher charge volume, partially offset by higher volume-drivenpayments to partners and higher expense related to rewards programs.
The Provision for credit losses was $7.3 billion, up $2.5 billion, or 51%,primarily due to the Merger, and included the acquisition of a private labelportfolio. The provision also increased due to record bankruptcy-related netcharge-offs resulting from bankruptcy legislation which became effective onOctober 17, 2005. Finally, the Allowance for loan losses was increased in partby the special Provision for credit losses related to Hurricane Katrina. These fac-tors were offset partially by lower contractual net charge-offs. Despite a recordlevel of bankruptcy losses, the net charge-off rate improved. The managed netcharge-off rate was 5.21%, down from 5.27% in the prior year. The 30-daymanaged delinquency rate was 2.79%, down from 3.70% in the prior year,driven primarily by accelerated loss recognition of delinquent accounts as aresult of the bankruptcy reform legislation and strong underlying credit quality.
Noninterest expense of $4.6 billion increased by $1.0 billion, or 27%, primarilydue to the Merger, which included the acquisition of a private label portfolio.Merger savings, including lower processing and compensation costs were off-set partially by higher spending on marketing.
Selected metricsYear ended December 31,(in millions, except headcount, ratiosand where otherwise noted) 2006 2005 2004(d)
% of average managed outstandings:Net interest income 8.36% 8.65% 9.16%Provision for credit losses 3.26 5.39 5.31Noninterest revenue 2.09 2.61 2.59Risk adjusted margin(a) 7.19 5.88 6.45Noninterest expense 3.60 3.67 4.25Pretax income (ROO) 3.59 2.21 2.20Net income 2.27 1.40 1.39
Business metricsCharge volume (in billions) $ 339.6 $ 301.9 $ 193.6Net accounts opened (in thousands)(b) 45,869 21,056 7,523Credit cards issued (in thousands) 154,424 110,439 94,285Number of registered
Internet customers 22.5 14.6 13.6Merchant acquiring business(c)
Bank card volume (in billions) $ 660.6 $ 563.1 $ 396.2Total transactions 18,171 15,499 9,049
Selected ending balancesLoans:
Loans on balance sheets $ 85,881 $ 71,738 $ 64,575Securitized loans 66,950 70,527 70,795
Managed loans $152,831 $ 142,265 $ 135,370
Selected average balancesManaged assets $148,153 $ 141,933 $ 94,741Loans:
Loans on balance sheets $ 73,740 $ 67,334 $ 38,842Securitized loans 67,367 69,055 52,590
Managed loans $141,107 $ 136,389 $ 91,432
Equity $ 14,100 $ 11,800 $ 7,608
Headcount 18,639 18,629 19,598
Managed credit quality statistics Net charge-offs $ 4,698 $ 7,100 $ 4,821Net charge-off rate 3.33% 5.21% 5.27%
Managed delinquency ratios 30+ days 3.13% 2.79% 3.70%90+ days 1.50 1.27 1.72
Allowance for loan losses $ 3,176 $ 3,274 $ 2,994Allowance for loan losses to
period-end loans 3.70% 4.56% 4.64%
(a) Represents Total net revenue less Provision for credit losses.(b) 2006 includes approximately 21 million accounts from the acquisition of the Kohl’s private
label portfolio in the second quarter of 2006 and approximately 9 million accounts from theacquisition of the BP and Pier 1 Imports, Inc. private label portfolios in the fourth quarter of2006. Fourth quarter of 2005 includes approximately 10 million accounts from the acquisi-tion of the Sears Canada portfolio.
(c) Represents 100% of the merchant acquiring business.(d) 2004 results include six months of the combined Firm’s results and six months of heritage
JPMorgan Chase results.
The following is a brief description of selected business metrics within Card Services.
• Charge volume – Represents the dollar amount of cardmember purchases, balance transfers and cash advance activity.
• Net accounts opened – Includes originations, purchases and sales.
• Merchant acquiring business – Represents an entity that processes payments for merchants. JPMorgan Chase is a partner in Chase Paymentech Solutions, LLC.
- Bank card volume – Represents the dollar amount of transactions processed for merchants.
- Total transactions – Represents the number of transactions and authorizations processed for merchants.
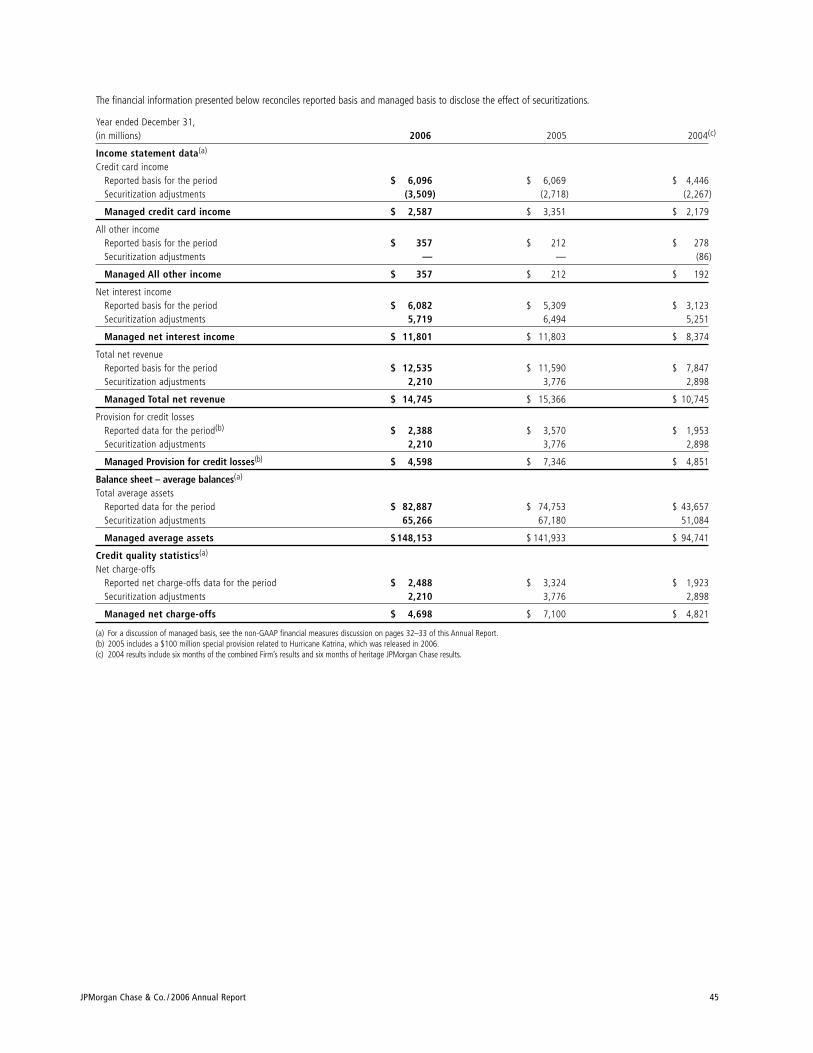
JPMorgan Chase & Co. / 2006 Annual Report 45
The financial information presented below reconciles reported basis and managed basis to disclose the effect of securitizations.
Year ended December 31,(in millions) 2006 2005 2004(c)
Income statement data(a)
Credit card incomeReported basis for the period $ 6,096 $ 6,069 $ 4,446Securitization adjustments (3,509) (2,718) (2,267)
Managed credit card income $ 2,587 $ 3,351 $ 2,179
All other incomeReported basis for the period $ 357 $ 212 $ 278Securitization adjustments — — (86)
Managed All other income $ 357 $ 212 $ 192
Net interest incomeReported basis for the period $ 6,082 $ 5,309 $ 3,123Securitization adjustments 5,719 6,494 5,251
Managed net interest income $ 11,801 $ 11,803 $ 8,374
Total net revenueReported basis for the period $ 12,535 $ 11,590 $ 7,847Securitization adjustments 2,210 3,776 2,898
Managed Total net revenue $ 14,745 $ 15,366 $ 10,745
Provision for credit lossesReported data for the period(b) $ 2,388 $ 3,570 $ 1,953Securitization adjustments 2,210 3,776 2,898
Managed Provision for credit losses(b) $ 4,598 $ 7,346 $ 4,851
Balance sheet – average balances(a)
Total average assetsReported data for the period $ 82,887 $ 74,753 $ 43,657Securitization adjustments 65,266 67,180 51,084
Managed average assets $ 148,153 $ 141,933 $ 94,741
Credit quality statistics(a)
Net charge-offsReported net charge-offs data for the period $ 2,488 $ 3,324 $ 1,923Securitization adjustments 2,210 3,776 2,898
Managed net charge-offs $ 4,698 $ 7,100 $ 4,821
(a) For a discussion of managed basis, see the non-GAAP financial measures discussion on pages 32–33 of this Annual Report.(b) 2005 includes a $100 million special provision related to Hurricane Katrina, which was released in 2006.(c) 2004 results include six months of the combined Firm’s results and six months of heritage JPMorgan Chase results.
COMMERCIAL BANKING
Commercial Banking serves more than 30,000 clients, includingcorporations, municipalities, financial institutions and not-for-profit entities. These clients generally have annual revenuesranging from $10 million to $2 billion. Commercial bankers serveclients nationally throughout the RFS footprint and in officeslocated in other major markets.
Commercial Banking offers its clients industry knowledge, experi-ence, a dedicated service model, comprehensive solutions and localexpertise. The Firm’s broad platform positions CB to deliverextensive product capabilities – including lending, treasury serv-ices, investment banking and asset management – to meet itsclients’ U.S. and international financial needs.
On October 1, 2006, JPMorgan Chase completed the acquisition of The Bank ofNew York’s consumer, business banking and middle-market banking businesses,adding approximately $2.3 billion in loans and $1.2 billion in deposits.
Selected income statement data Year ended December 31,(in millions, except ratios) 2006 2005 2004(c)
RevenueLending & deposit related fees $ 589 $ 572 $ 438Asset management, administration
and commissions 67 57 30All other income(a) 417 357 217
Noninterest revenue 1,073 986 685Net interest income 2,727 2,502 1,593
Total net revenue 3,800 3,488 2,278
Provision for credit losses(b) 160 73 41
Noninterest expenseCompensation expense 740 654 461Noncompensation expense 1,179 1,137 831Amortization of intangibles 60 65 34
Total noninterest expense 1,979 1,856 1,326
Income before income tax expense 1,661 1,559 911Income tax expense 651 608 350
Net income $ 1,010 $ 951 $ 561
Financial ratiosROE 18% 28% 27%ROA 1.75 1.82 1.72Overhead ratio 52 53 58
(a) IB-related and commercial card revenues are included in All other income.(b) 2005 includes a $35 million special provision related to Hurricane Katrina.(c) 2004 results include six months of the combined Firm’s results and six months of heritage
JPMorgan Chase results.
Commercial Banking operates in 14 of the top 15 U.S. metropolitan areas andis divided into three businesses: Middle Market Banking, Mid-CorporateBanking and Real Estate Banking. General coverage for corporate clients is pro-vided by Middle Market Banking, which covers clients with annual revenuesgenerally ranging between $10 million and $500 million. Mid-CorporateBanking covers clients with annual revenues generally ranging between $500million and $2 billion and focuses on clients that have broader investment-banking needs. The third segment, Real Estate Banking, serves large regionaland national real estate customers across the United States. In addition tothese three customer segments, CB offers several products to the Firm’s entirecustomer base:
MANAGEMENT’S DISCUSSION AND ANALYSISJPMorgan Chase & Co.
46 JPMorgan Chase & Co. / 2006 Annual Report
• Asset-based financing, syndications and collateral analysis through ChaseBusiness Credit.
• A variety of equipment finance and leasing products, with specialties inaircraft finance, public sector, healthcare and information technologythrough Chase Equipment Leasing.
• Alternative capital strategies that provide a broader range of financingoptions, such as mezzanine and second lien loans and preferred equity,through Chase Capital Corporation.
With a large customer base across these segments and products, manage-ment believes the CB loan portfolio is highly diversified across a broad rangeof industries and geographic locations.
2006 compared with 2005 Net income of $1.0 billion increased by $59 million, or 6%, from the prioryear due to higher revenue, partially offset by higher expense and provisionfor credit losses.
Record net revenue of $3.8 billion increased 9%, or $312 million. Net inter-est income increased to $2.7 billion, primarily driven by higher liability bal-ances and loan volumes, partially offset by loan spread compression and ashift to narrower-spread liability products. Noninterest revenue was $1.1 bil-lion, up $87 million, or 9%, due to record IB-related revenue and higher com-mercial card revenue.
Revenue grew for each CB business compared with the prior year, driven by increased treasury services, investment banking and lending revenue.Compared with the prior year, Middle Market Banking revenue of $2.5 billionincreased by $177 million, or 8%. Mid-Corporate Banking revenue of $656million increased by $105 million, or 19%, and Real Estate Banking revenueof $458 million increased by $24 million, or 6%.
Provision for credit losses was $160 million, up from $73 million in the prioryear, reflecting portfolio activity and the establishment of additional allowancefor loan losses related to loans acquired from The Bank of New York, partiallyoffset by a release of the unused portion of the special reserve established in2005 for Hurricane Katrina. Net charge-offs were flat compared with the prioryear. Nonperforming loans declined 56%, to $121 million.
Total noninterest expense of $2.0 billion increased by $123 million, or 7%,from last year, primarily related to incremental Compensation expense relatedto SFAS 123R and increased expense resulting from higher client usage ofTreasury Services’ products.
2005 compared with 2004Net income of $951 million was up $390 million, or 70%, from the prioryear, primarily due to the Merger.
Total net revenue of $3.5 billion increased by $1.2 billion, or 53%, primarilyas a result of the Merger. In addition to the overall increase from the Merger,Net interest income of $2.5 billion was positively affected by wider spreadson higher volume related to liability balances and increased loan volumes,partially offset by narrower loan spreads. Noninterest revenue of $986 millionwas positively impacted by the Merger and higher IB revenue, partially offsetby lower deposit-related fees due to higher interest rates.
Each business within CB demonstrated revenue growth over the prior year,primarily due to the Merger. Middle Market Banking revenue was $2.4 billion,an increase of $861 million, or 58%, over the prior year; Mid-CorporateBanking revenue was $551 million, an increase of $183 million, or 50%; and
JPMorgan Chase & Co. / 2006 Annual Report 47
Real Estate Banking revenue was $434 million, up $162 million, or 60%. Inaddition to the Merger, revenue was higher for each business due to widerspreads and higher volume related to liability balances and increased invest-ment banking revenue, partially offset by narrower loan spreads.
Provision for credit losses of $73 million increased by $32 million, primarilydue to a special provision related to Hurricane Katrina, increased loan bal-ances and refinements in the data used to estimate the allowance for creditlosses. The credit quality of the portfolio was strong with net charge-offs of$26 million, down $35 million from the prior year, and nonperforming loansof $272 million were down $255 million, or 48%.
Total noninterest expense of $1.9 billion increased by $530 million, or 40%,primarily due to the Merger and to an increase in allocated unit costs forTreasury Services’ products.
Selected metricsYear ended December 31,(in millions, except headcount and ratios) 2006 2005 2004(d)
Revenue by product:Lending $ 1,344 $ 1,215 $ 805Treasury services 2,243 2,062 1,335Investment banking 253 206 118Other (40) 5 20Total Commercial Banking revenue $ 3,800 $ 3,488 $ 2,278IB revenue, gross(a) 716 552 NA
Revenue by business:Middle Market Banking $ 2,535 $ 2,358 $ 1,497Mid-Corporate Banking 656 551 368Real Estate Banking 458 434 272Other 151 145 141Total Commercial Banking revenue $ 3,800 $ 3,488 $ 2,278
Selected average balancesTotal assets $ 57,754 $ 52,358 $ 32,547Loans and leases(b) 53,596 48,117 28,914Liability balances(c) 73,613 66,055 47,646Equity 5,702 3,400 2,093
Average loans by business:Middle Market Banking $ 33,225 $ 31,193 $ 17,500Mid-Corporate Banking 8,632 6,388 4,354Real Estate Banking 7,566 6,909 4,047Other 4,173 3,627 3,013Total Commercial Banking loans $ 53,596 $ 48,117 $ 28,914
Headcount 4,459 4,418 4,527
Credit data and quality statistics:Net charge-offs $ 27 $ 26 $ 61Nonperforming loans 121 272 527Allowance for loan losses 1,519 1,392 1,322Allowance for lending-related commitments 187 154 169
Net charge-off rate(b) 0.05% 0.05% 0.21%Allowance for loan losses to average loans(b) 2.86 2.91 4.57Allowance for loan losses to
nonperforming loans 1,255 512 251Nonperforming loans to average loans 0.23 0.57 1.82
(a) Represents the total revenue related to investment banking products sold to CB clients.(b) Average loans include loans held-for-sale of $442 million and $283 million for 2006 and
2005, respectively. This information is not available for 2004. Loans held-for-sale amounts arenot included in the net charge-off rate or allowance coverage ratios.
(c) Liability balances include deposits and deposits swept to on–balance sheet liabilities.(d) 2004 results include six months of the combined Firm’s results and six months of heritage
JPMorgan Chase results.
Commercial Banking revenues comprise the following:
Lending includes a variety of financing alternatives, which are often provided on a basis secured by receivables, inventory, equipment, realestate or other assets. Products include:
• Term loans
• Revolving lines of credit
• Bridge financing
• Asset-based structures
• Leases
Treasury services includes a broad range of products and servicesenabling clients to transfer, invest and manage the receipt and disbursement of funds, while providing the related information reporting.These products and services include:
• U.S. dollar and multi-currency clearing
• ACH
• Lockbox
• Disbursement and reconciliation services
• Check deposits
• Other check and currency-related services
• Trade finance and logistics solutions
• Commercial card
• Deposit products, sweeps and money market mutual funds
Investment banking provides clients with sophisticated capital-raisingalternatives, as well as balance sheet and risk management tools,through:
• Advisory
• Equity underwriting
• Loan syndications
• Investment-grade debt
• Asset-backed securities
• Private placements
• High-yield bonds
• Derivatives
• Foreign exchange hedges
• Securities sales
TREASURY & SECUR IT IES SERV ICES
Treasury & Securities Services is a global leader in providingtransaction, investment and information services to support theneeds of institutional clients worldwide. TSS is one of the largestcash management providers in the world and a leading globalcustodian. Treasury Services provides a variety of cash manage-ment products, trade finance and logistics solutions, wholesalecard products, and short-term liquidity management capabilitiesto small and mid-sized companies, multinational corporations,financial institutions and government entities. TS partners withthe Commercial Banking, Retail Financial Services and AssetManagement businesses to serve clients firmwide. As a result,certain TS revenues are included in other segments’ results.Worldwide Securities Services stores, values, clears and servicessecurities and alternative investments for investors and broker-dealers; and manages Depositary Receipt programs globally.
As a result of the transaction with The Bank of New York on October 1, 2006,selected corporate trust businesses were transferred from TSS to the Corporatesegment and are reported in discontinued operations for all periods presented.
Selected income statement data Year ending December 31,(in millions, except ratios) 2006 2005 2004(c)
RevenueLending & deposit related fees $ 735 $ 731 $ 649Asset management, administration
and commissions 2,692 2,409 1,963All other income 612 519 361
Noninterest revenue 4,039 3,659 2,973Net interest income 2,070 1,880 1,225
Total net revenue 6,109 5,539 4,198
Provision for credit losses (1) — 7Credit reimbursement to IB(a) (121) (154) (90)
Noninterest expenseCompensation expense 2,198 1,874 1,414Noncompensation expense 1,995 2,095 2,254Amortization of intangibles 73 81 58
Total noninterest expense 4,266 4,050 3,726
Income before income tax expense 1,723 1,335 375Income tax expense 633 472 98
Net income $ 1,090 $ 863 $ 277
Financial ratiosROE 48% 57% 14%Overhead ratio 70 73 89Pretax margin ratio(b) 28 24 9
(a) TSS is charged a credit reimbursement related to certain exposures managed within the IBcredit portfolio on behalf of clients shared with TSS. For a further discussion, see Creditreimbursement on page 35 of this Annual Report.
(b) Pretax margin represents Income before income tax expense divided by Total net revenue,which is a measure of pretax performance and another basis by which management evalu-ates its performance and that of its competitors.
(c) 2004 results include six months of the combined Firm’s results and six months of heritageJPMorgan Chase results.
MANAGEMENT’S DISCUSSION AND ANALYSISJPMorgan Chase & Co.
48 JPMorgan Chase & Co. / 2006 Annual Report
2006 compared with 2005Net income was $1.1 billion, an increase of $227 million, or 26%, from theprior year. Earnings benefited from increased revenue, and was offset by high-er compensation expense and the absence of prior-year charges of $58 mil-lion (after-tax) related to the termination of a client contract.
Total net revenue was $6.1 billion, an increase of $570 million, or 10%.Noninterest revenue was $4.0 billion, up by $380 million, or 10%. Theimprovement was due primarily to an increase in assets under custody to$13.9 trillion, which was driven by market value appreciation and new busi-ness. Also contributing to the improvement was growth in depositary receipts,securities lending, and global clearing, all of which were driven by a combina-tion of increased product usage by existing clients and new business. Netinterest income was $2.1 billion, an increase of $190 million, or 10%, bene-fiting from a 22% increase in average liability balances, partially offset by theimpact of growth in narrower-spread liability products.
Treasury Services Total net revenue of $2.8 billion was up 4%. WorldwideSecurities Services Total net revenue of $3.3 billion grew by $473 million, or17%. TSS firmwide Total net revenue, which includes Treasury Services Totalnet revenue recorded in other lines of business, grew to $8.6 billion, up by$778 million, or 10%. Treasury Services firmwide Total net revenue grew to$5.2 billion, an increase of $305 million, or 6%.
Total noninterest expense was $4.3 billion, up $216 million, or 5%. Theincrease was due to higher compensation expense related to increased clientactivity, business growth, investment in new product platforms and incremen-tal expense related to SFAS 123R, partially offset by the absence of prior-yearcharges of $93 million related to the termination of a client contract.
2005 compared with 2004Net income was $863 million, an increase of $586 million, or 212%. Primarilydriving the improvement in revenue were the Merger, business growth, andwidening spreads on and growth in average liability balances. Noninterestexpense increased primarily due to the Merger and higher compensationexpense. Results for 2005 also included charges of $58 million (after-tax) to terminate a client contract. Results for 2004 also included software-impairment charges of $97 million (after-tax) and a gain of $10 million (after-tax) on the sale of a business.
Total net revenue of $5.5 billion increased $1.3 billion, or 32%. Net interestincome grew to $1.9 billion, up $655 million, due to wider spreads on liabilitybalances, a change in the corporate deposit pricing methodology in 2004 andgrowth in average liability balances. Noninterest revenue of $3.7 billionincreased by $686 million, or 23%, due to product growth across TSS, theMerger and the acquisition of Vastera. Leading the product revenue growthwas an increase in assets under custody to $10.7 trillion, primarily driven bymarket value appreciation and new business, along with growth in wholesalecard, securities lending, foreign exchange, trade, clearing and ACH revenues.Partially offsetting this growth in noninterest revenue was a decline in deposit-related fees due to higher interest rates and the absence, in the current period,of a gain on the sale of a business.
JPMorgan Chase & Co. / 2006 Annual Report 49
TS Total net revenue of $2.7 billion grew by $635 million, and WSS Total netrevenue of $2.8 billion grew by $706 million. TSS firmwide Total net revenue,which includes TS Total net revenue recorded in other lines of business, grewto $7.8 billion, up $2.1 billion, or 38%. Treasury Services firmwide Total netrevenue grew to $4.9 billion, up $1.4 billion, or 41%.
Credit reimbursement to the Investment Bank was $154 million, an increaseof $64 million, primarily as a result of the Merger. TSS is charged a creditreimbursement related to certain exposures managed within the InvestmentBank credit portfolio on behalf of clients shared with TSS.
Total noninterest expense of $4.1 billion was up $324 million, or 9%, due tothe Merger, increased compensation expense resulting from new businessgrowth and the Vastera acquisition, and charges of $93 million to terminate aclient contract. Partially offsetting these increases were higher product unit costscharged to other lines of business, primarily Commercial Banking, lower allo-cations of Corporate segment expenses, merger savings and business efficien-cies. The prior year included software-impairment charges of $155 million.
Treasury & Securities Services firmwide metrics include certain TSSproduct revenues and liability balances reported in other lines of businessfor customers who are also customers of those lines of business.Management reviews firmwide metrics such as liability balances, revenuesand overhead ratios in assessing financial performance for TSS as suchfirmwide metrics capture the firmwide impact of TS’ and TSS’ productsand services. Management believes such firmwide metrics are necessaryin order to understand the aggregate TSS business.
Selected metrics Year ending December 31,(in millions, except headcount, ratio data and where otherwise noted) 2006 2005 2004(g)
Revenue by businessTreasury Services $ 2,792 $ 2,695 $ 2,060Worldwide Securities Services 3,317 2,844 2,138
Total net revenue $ 6,109 $ 5,539 $ 4,198
Business metricsAssets under custody (in billions) $ 13,903 $ 10,662 $ 9,300Number of:
US$ ACH transactions originated (in millions) 3,503 2,966 1,994Total US$ clearing volume (in thousands) 104,846 95,713 81,162International electronic funds transfer
volume (in thousands)(a) 145,325 89,537 45,654Wholesale check volume (in millions) 3,409 3,735 NAWholesale cards issued (in thousands)(b) 17,228 13,206 11,787
Selected balance sheets (average)Total assets $ 31,760 $ 28,206 $ 24,815Loans 15,564 12,349 9,840Liability balances(c) 189,540 154,731 115,514Equity 2,285 1,525 1,989
Headcount 25,423 22,207 20,467
TSS firmwide metricsTreasury Services firmwide revenue(d) $ 5,242 $ 4,937 $ 3,508Treasury & Securities Services
firmwide revenue(d) 8,559 7,781 5,646Treasury Services firmwide overhead ratio(e) 56% 58% 65%Treasury & Securities Services
firmwide overhead ratio(e) 62 65 78Treasury Services firmwide liability
balances (average)(f) $162,020 $ 139,579 $102,785Treasury & Securities Services firmwide
liability balances(f) 262,678 220,781 163,169
(a) International electronic funds transfer includes non-US$ ACH and clearing volume.(b) Wholesale cards issued include domestic commercial card, stored value card, prepaid card,
and government electronic benefit card products.(c) Liability balances include deposits and deposits swept to on-balance sheet liabilities.(d) Firmwide revenue includes TS revenue recorded in the CB, Regional Banking and AM lines of
business (see below) and excludes FX revenues recorded in the IB for TSS-related FX activity.
(in millions) 2006 2005 2004(g)
Treasury Services revenue reported in CB $ 2,243 $ 2,062 $ 1,335Treasury Services revenue reported in
other lines of business 207 180 113
TSS firmwide FX revenue, which includes FX revenue recorded in TSS and FX revenue associ-ated with TSS customers who are FX customers of the IB, was $445 million, $382 millionand $320 million for the years ended December 31, 2006, 2005 and 2004, respectively.
(e) Overhead ratios have been calculated based upon firmwide revenues and TSS and TS expens-es, respectively, including those allocated to certain other lines of business. FX revenues andexpenses recorded in the IB for TSS-related FX activity are not included in this ratio.
(f) Firmwide liability balances include TS’ liability balances recorded in certain other lines ofbusiness. Liability balances associated with TS customers who are also customers of the CBline of business are not included in TS liability balances.
(g) 2004 results include six months of the combined Firm’s results and six months of heritageJPMorgan Chase results.
ASSET MANAGEMENT
With assets under supervision of $1.3 trillion, AM is a globalleader in investment and wealth management. AM clients includeinstitutions, retail investors and high-net-worth individuals inevery major market throughout the world. AM offers globalinvestment management in equities, fixed income, real estate,hedge funds, private equity and liquidity, including both money-market instruments and bank deposits. AM also provides trustand estate and banking services to high-net-worth clients, andretirement services for corporations and individuals. The majorityof AM’s client assets are in actively managed portfolios.
Selected income statement dataYear ended December 31,(in millions, except ratios) 2006 2005 2004(b)
RevenueAsset management, administration
and commissions $ 5,295 $ 4,189 $ 3,140All other income 521 394 243
Noninterest revenue 5,816 4,583 3,383Net interest income 971 1,081 796
Total net revenue 6,787 5,664 4,179
Provision for credit losses (28) (56) (14)
Noninterest expenseCompensation expense 2,777 2,179 1,579Noncompensation expense 1,713 1,582 1,502Amortization of intangibles 88 99 52
Total noninterest expense 4,578 3,860 3,133
Income before income tax expense 2,237 1,860 1,060Income tax expense 828 644 379
Net income $ 1,409 $ 1,216 $ 681
Financial ratiosROE 40% 51% 17%Overhead ratio 67 68 75Pretax margin ratio(a) 33 33 25
(a) Pretax margin represents Income before income tax expense divided by Total net revenue,which is a measure of pretax performance and another basis by which management evaluatesits performance and that of its competitors.
(b) 2004 results include six months of the combined Firm’s results and six months of heritageJPMorgan Chase results.
2006 compared with 2005 Net income was a record $1.4 billion, up by $193 million, or 16%, from theprior year. Improved results were driven by increased revenue offset partiallyby higher performance-based compensation expense, incremental expensefrom the adoption of SFAS 123R and the absence of a tax credit recognized inthe prior year.
Total net revenue was a record $6.8 billion, up by $1.1 billion, or 20%, fromthe prior year. Noninterest revenue, principally fees and commissions, of $5.8billion was up by $1.2 billion, or 27%. This increase was due largely toincreased assets under management and higher performance and placementfees. Net interest income was $971 million, down by $110 million, or 10%,from the prior year. The decline was due primarily to narrower spreads ondeposit products and the absence of BrownCo, partially offset by higherdeposit and loan balances.
MANAGEMENT’S DISCUSSION AND ANALYSISJPMorgan Chase & Co.
50 JPMorgan Chase & Co. / 2006 Annual Report
Institutional revenue grew 41%, to $2.0 billion, due to net asset inflows andhigher performance fees. Private Bank revenue grew 13%, to $1.9 billion, dueto increased placement activity, higher asset management fees and higherdeposit balances, partially offset by narrower average spreads on deposits.Retail revenue grew 22%, to $1.9 billion, primarily due to net asset inflows,partially offset by the sale of BrownCo. Private Client Services revenuedecreased 1%, to $1.0 billion, as higher deposit and loan balances were morethan offset by narrower average deposit and loan spreads.
Provision for credit losses was a benefit of $28 million compared with a bene-fit of $56 million in the prior year. The current-year benefit reflects a high levelof recoveries and stable credit quality.
Total noninterest expense of $4.6 billion was up by $718 million, or 19%,from the prior year. The increase was due to higher performance-based com-pensation, incremental expense related to SFAS 123R, increased salaries andbenefits related to business growth, and higher minority interest expenserelated to Highbridge, partially offset by the absence of BrownCo.
2005 compared with 2004Net income of $1.2 billion was up $535 million from the prior year due tothe Merger and increased revenue, partially offset by higher compensationexpense.
Total net revenue was $5.7 billion, up $1.5 billion, or 36%. Noninterest rev-enue, primarily fees and commissions, of $4.6 billion was up $1.2 billion,principally due to the Merger, the acquisition of a majority interest inHighbridge in 2004, net asset inflows and global equity market appreciation.Net interest income of $1.1 billion was up $285 million, primarily due to theMerger, higher deposit and loan balances, partially offset by narrower depositspreads.
Private Bank revenue grew 9%, to $1.7 billion. Retail revenue grew 30%, to$1.5 billion. Institutional revenue grew 57%, to $1.4 billion, due to the acquisi-tion of a majority interest in Highbridge. Private Client Services revenue grew88%, to $1.0 billion.
Provision for credit losses was a benefit of $56 million, compared with a benefit of $14 million in the prior year, due to lower net charge-offs andrefinements in the data used to estimate the allowance for credit losses.
Total noninterest expense of $3.9 billion increased by $727 million, or 23%,reflecting the Merger, the acquisition of Highbridge and increased compensa-tion expense related primarily to higher performance-based incentives.
JPMorgan Chase & Co. / 2006 Annual Report 51
Selected metrics Year ended December 31,(in millions, except headcount, ranking data, and where otherwise noted) 2006 2005 2004(e)
Revenue by client segmentInstitutional $ 1,972 $ 1,395 $ 891Retail 1,885 1,544 1,184Private Bank 1,907 1,689 1,554Private Client Services 1,023 1,036 550
Total net revenue $ 6,787 $ 5,664 $ 4,179
Business metricsNumber of:
Client advisors 1,506 1,484 1,377Retirement planning services participants 1,362,000 1,299,000 918,000
% of customer assets in 4 & 5 Star Funds(a) 58% 46% 48%% of AUM in 1st and 2nd quartiles:(b)
1 year 83 69 663 years 77 68 715 years 79 74 68
Selected average balance sheets dataTotal assets $ 43,635 $ 41,599 $ 37,751Loans(c) 26,507 26,610 21,545Deposits(c)(d) 50,607 42,123 32,431Equity 3,500 2,400 3,902
Headcount 13,298 12,127 12,287
Credit data and quality statisticsNet charge-offs (recoveries) $ (19) $ 23 $ 72Nonperforming loans 39 104 79Allowance for loan losses 121 132 216Allowance for lending-related commitments 6 4 5
Net charge-off (recovery) rate (0.07)% 0.09% 0.33%Allowance for loan losses to average loans 0.46 0.50 1.00Allowance for loan losses to nonperforming loans 310 127 273Nonperforming loans to average loans 0.15 0.39 0.37
(a) Derived from Morningstar for the United States; Micropal for the United Kingdom,Luxembourg, Hong Kong and Taiwan; and Nomura for Japan.
(b) Quartile rankings sourced from Lipper for the United States and Taiwan; Micropal for theUnited Kingdom, Luxembourg, Hong Kong and Taiwan; and Nomura for Japan.
(c) The sale of BrownCo, which closed on November 30, 2005, included $3.0 billion in bothloans and deposits.
(d) Reflects the transfer in 2005 of certain consumer deposits from RFS to AM.(e) 2004 results include six months of the combined Firm’s results and six months of heritage
JPMorgan Chase results.
AM’s client segments comprise the following:
Institutional brings comprehensive global investment services – includingasset management, pension analytics, asset-liability management andactive risk budgeting strategies – to corporate and public institutions,endowments, foundations, not-for-profit organizations and governmentsworldwide.
Retail provides worldwide investment management services and retire-ment planning and administration through third-party and direct distribu-tion of a full range of investment vehicles.
The Private Bank addresses every facet of wealth management for ultra-high-net-worth individuals and families worldwide, including investmentmanagement, capital markets and risk management, tax and estate plan-ning, banking, capital raising and specialty-wealth advisory services.
Private Client Services offers high-net-worth individuals, families andbusiness owners in the United States comprehensive wealth managementsolutions, including investment management, capital markets and risk man-agement, tax and estate planning, banking, and specialty-wealth advisoryservices.
MANAGEMENT’S DISCUSSION AND ANALYSISJPMorgan Chase & Co.
52 JPMorgan Chase & Co. / 2006 Annual Report
Assets under supervision(a) (in billions)As of or for the year ended December 31, 2006 2005 2004
Assets by asset classLiquidity(b) $ 311 $ 238 $ 232Fixed income 175 165 171Equities & balanced 427 370 326Alternatives 100 74 62
Total Assets under management 1,013 847 791Custody/brokerage/administration/deposits 334 302 315
Total Assets under supervision $ 1,347 $ 1,149 $ 1,106
Assets by client segment Institutional(c) $ 538 $ 481 $ 466Retail(c) 259 169 133Private Bank 159 145 139Private Client Services 57 52 53
Total Assets under management $ 1,013 $ 847 $ 791
Institutional(c) $ 539 $ 484 $ 487Retail(c) 343 245 221Private Bank 357 318 304Private Client Services 108 102 94
Total Assets under supervision $ 1,347 $ 1,149 $ 1,106
Assets by geographic regionU.S./Canada $ 630 $ 562 $ 554International 383 285 237
Total Assets under management $ 1,013 $ 847 $ 791
U.S./Canada $ 889 $ 805 $ 815International 458 344 291
Total Assets under supervision $ 1,347 $ 1,149 $1,106
Mutual fund assets by asset classLiquidity $ 255 $ 182 $ 183Fixed income 46 45 41Equities 206 150 104
Total mutual fund assets $ 507 $ 377 $ 328
Assets under management rollforward(d)
Beginning balance, January 1 $ 847 $ 791 $ 561Flows:
Liquidity 44 8 3Fixed income 11 — (8)Equities, balanced and alternative 34 24 14
Acquisitions/divestitures(e) — — 183Market/performance/other impacts 77 24 38
Ending balance, December 31 $ 1,013 $ 847 $ 791
Assets under supervision rollforward(d)
Beginning balance, January 1 $ 1,149 $1,106 $ 764Net asset flows 102 49 42Acquisitions /divestitures(f) — (33) 221Market/performance/other impacts 96 27 79
Ending balance, December 31 $ 1,347 $1,149 $1,106
(a) Excludes Assets under management of American Century Companies, Inc.(b) 2006 data reflects the reclassification of $19 billion of assets under management into liq-
uidity from other asset classes. Prior period data were not restated.(c) In 2006, assets under management of $22 billion from Retirement planning services has
been reclassified from the Institutional client segment to the Retail client segment in orderto be consistent with the revenue by client segment reporting.
(d) 2004 results include six months of the combined Firm’s results and six months of heritageJPMorgan Chase results.
(e) Reflects the Merger with Bank One ($176 billion) and the acquisition of a majority interestin Highbridge ($7 billion) in 2004.
(f) Reflects the sale of BrownCo ($33 billion) in 2005, and the Merger with Bank One ($214 billion) and the acquisition of a majority interest in Highbridge ($7 billion) in 2004.
Assets under supervision2006 compared with 2005Assets under supervision (“AUS”) were $1.3 trillion, up 17%, or $198 billion,from the prior year. Assets under management (“AUM”) were $1.0 trillion, up20%, or $166 billion, from the prior year. The increase was the result of netasset inflows in the Retail segment, primarily in equity-related products,Institutional segment flows, primarily in liquidity products, and market appre-ciation. Custody, brokerage, administration and deposit balances were $334billion, up by $32 billion. The Firm also has a 43% interest in AmericanCentury Companies, Inc., whose AUM totaled $103 billion and $101 billion atDecember 31, 2006 and 2005, respectively.
2005 compared with 2004AUS at December 31, 2005, were $1.1 trillion, up 4%, or $43 billion, fromthe prior year despite a $33 billion reduction due to the sale of BrownCo.AUM were $847 billion, up 7%. The increase was primarily the result of netasset inflows in equity-related products and global equity market apprecia-tion. Custody, brokerage, administration, and deposits were $302 billion,down $13 billion due to a $33 billion reduction from the sale of BrownCo.The Firm also has a 43% interest in American Century Companies, Inc.,whose AUM totaled $101 billion and $98 billion at December 31, 2005 and2004, respectively.
CORPORATE
The Corporate sector comprises Private Equity, Treasury, corpo-rate staff units and expenses that are centrally managed.Private Equity includes the JPMorgan Partners and ONE EquityPartners businesses. Treasury manages the structural interestrate risk and investment portfolio for the Firm. The corporatestaff units include Central Technology and Operations, InternalAudit, Executive Office, Finance, Human Resources, Marketing& Communications, Office of the General Counsel, CorporateReal Estate and General Services, Risk Management, andStrategy and Development. Other centrally managed expensesinclude the Firm’s occupancy and pension-related expenses, netof allocations to the business.
On August 1, 2006, the buyout and growth equity professionals of JPMorganPartners (“JPMP”) formed an independent firm, CCMP Capital, LLC (“CCMP”),and the venture professionals separately formed an independent firm,Panorama Capital, LLC (“Panorama”). The investment professionals of CCMPand Panorama continue to manage the former JPMP investments pursuant to amanagement agreement with the Firm.
On October 1, 2006, the Firm completed the exchange of selected corporate trustbusinesses, including trustee, paying agent, loan agency and document manage-ment services, for the consumer, business banking and middle-market bankingbusinesses of The Bank of New York. These corporate trust businesses, which werepreviously reported in TSS, are now reported as discontinued operations for allperiods presented within Corporate. The related balance sheet and income state-ment activity were transferred to the Corporate segment commencing with thesecond quarter of 2006. Periods prior to the second quarter of 2006 have beenrevised to reflect this transfer.
Selected income statement data Year ended December 31,(in millions) 2006 2005 2004(f)
RevenuePrincipal transactions $ 1,175 $ 1,524 $ 1,542Securities gains (losses) (608) (1,487) 332All other income(a) 485 1,583 109
Noninterest revenue 1,052 1,620 1,983Net interest income (1,044) (2,756) (1,214)
Total net revenue 8 (1,136) 769
Provision for credit losses(b) (1) 10 748
Noninterest expenseCompensation expense 2,626 3,148 2,426Noncompensation expense(c) 2,351 5,962 7,418Merger costs 305 722 1,365Subtotal 5,282 9,832 11,209Net expenses allocated to other businesses (4,141) (4,505) (4,839)
Total noninterest expense 1,141 5,327 6,370
Income (loss) from continuing operationsbefore income tax expense (1,132) (6,473) (6,349)
Income tax expense (benefit)(d) (1,179) (2,690) (2,661)
Income (loss) from continuing operations 47 (3,783) (3,688)Income from discontinued operations(e) 795 229 206
Net income (loss) $ 842 $ (3,554) $(3,482)
JPMorgan Chase & Co. / 2006 Annual Report 53
(a) Includes a gain of $103 million in 2006 related to the initial public offering of Mastercard,and a gain of $1.3 billion on the sale of BrownCo in 2005.
(b) 2004 includes $858 million related to accounting policy conformity adjustments in connec-tion with the Merger.
(c) Includes insurance recoveries related to material legal proceedings of $512 million and$208 million in 2006 and 2005, respectively. Includes litigation reserve charges of $2.8 bil-lion and $3.7 billion in 2005 and 2004, respectively.
(d) Includes tax benefits recognized upon resolution of tax audits.(e) Includes a $622 million gain from exiting the corporate trust business in the fourth quarter
of 2006.(f) 2004 results include six months of the combined Firm’s results and six months of heritage
JPMorgan Chase results.
2006 compared with 2005Net income was $842 million compared with a net loss of $3.6 billion in theprior year. In comparison with the prior year, Private Equity earnings was $627million, down from $821 million; Treasury net loss was $560 million comparedwith a net loss of $2.0 billion; the net loss in Other Corporate (includingMerger costs) was $20 million compared with a net loss of $2.6 billion; andthe Net income from discontinued operations was $795 million compared with$229 million.
Total net revenue was $8 million, as compared with a negative $1.1 billion inthe prior year. Net interest income was a negative $1.0 billion compared withnegative $2.8 billion in the prior year. Treasury was the primary driver of theimprovement, with Net interest income of negative $140 million comparedwith negative $1.7 billion in the prior year, benefiting primarily from animprovement in Treasury’s net interest spread and an increase in available-for-sale securities. Noninterest revenue was $1.1 billion compared with $1.6 bil-lion, reflecting the absence of the $1.3 billion gain on the sale of BrownColast year and lower Private Equity gains of $1.3 billion compared with gains of$1.7 billion in the prior year. These declines were offset by $619 million insecurities losses in Treasury compared with securities losses of $1.5 billion inthe prior year and a gain of $103 million related to the sale of Mastercardshares in its initial public offering in the current year.
Total noninterest expense was $1.1 billion, down by $4.2 billion from $5.3 billionin the prior year. Insurance recoveries relating to certain material litigation were$512 million in the current year, while the prior-year results included a material lit-igation charge of $2.8 billion, and related insurance recoveries of $208 million.Prior-year expense included a $145 million cost due to the accelerated vesting ofstock options. Merger costs were $305 million compared with $722 million in theprior year.
Discontinued operations include the results of operations of selected corporatetrust businesses sold to The Bank of New York on October 1, 2006. Prior to thesale, the selected corporate trust businesses produced $173 million of Netincome in the current year compared with Net income of $229 million in theprior year. Net income from discontinued operations for 2006 also included aone-time gain of $622 million related to the sale of these businesses.
2005 compared with 2004Total net revenue was a negative $1.1 billion compared with Total net revenueof $769 million in the prior year. Noninterest revenue of $1.6 billion decreasedby $363 million and included securities losses of $1.5 billion due to the fol-lowing: repositioning of the Treasury investment portfolio to manage exposureto interest rates; the gain on the sale of BrownCo of $1.3 billion; and theincrease in private equity gains of $262 million. For further discussion on thesale of BrownCo, see Note 2 on page 97 of this Annual Report.
MANAGEMENT’S DISCUSSION AND ANALYSISJPMorgan Chase & Co.
54 JPMorgan Chase & Co. / 2006 Annual Report
Private equity portfolio2006 compared with 2005 The carrying value of the private equity portfolio declined by $95 million to$6.1 billion as of December 31, 2006. This decline was due primarily to salesoffset partially by new investment activity. The portfolio represented 8.6% ofthe Firm’s stockholders’ equity less goodwill at December 31, 2006, downfrom 9.7% at December 31, 2005.
2005 compared with 2004The carrying value of the private equity portfolio declined by $1.3 billion to$6.2 billion as of December 31, 2005. This decline was primarily the result ofsales and recapitalizations of direct investments. The portfolio represented9.7% and 12% of JPMorgan Chase’s stockholders’ equity less goodwill atDecember 31, 2005 and 2004, respectively.
Selected income statement and balance sheet data
Year ended December 31,(in millions) 2006 2005 2004(d)
TreasurySecurities gains (losses)(a) $ (619) $ (1,486) $ 339Investment portfolio (average) 63,361 46,520 57,776Investment portfolio (ending) 82,091 30,741 64,949
Private equity gains (losses)Realized gains $ 1,223 $ 1,969 $ 1,423Write-ups / (write-downs) (73) (72) (192)Mark-to-market gains (losses) 72 (338) 164
Total direct investments 1,222 1,559 1,395Third-party fund investments 77 132 34
Total private equity gains (losses)(b) 1,299 1,691 1,429
Private equity portfolio information(c)
Direct investmentsPublic securitiesCarrying value $ 587 $ 479 $ 1,170Cost 451 403 744Quoted public value 831 683 1,758
Private direct securitiesCarrying value 4,692 5,028 5,686Cost 5,795 6,463 7,178
Third-party fund investmentsCarrying value 802 669 641Cost 1,080 1,003 1,042
Total private equity portfolioCarrying value $ 6,081 $ 6,176 $ 7,497Cost $ 7,326 $ 7,869 $ 8,964
(a) Gains/losses reflect repositioning of the Treasury investment securities portfolio. Excludesgains/losses on securities used to manage risk associated with MSRs.
(b) Included in Principal transactions.(c) For further information on the Firm’s policies regarding the valuation of the private equity
portfolio, see Critical accounting estimates used by the Firm on pages 84–85 and Note 4 onpages 98–99 of this Annual Report, respectively.
(d) 2004 results include six months of the combined Firm’s results and six months of heritageJPMorgan Chase results.
Net interest income was a loss of $2.8 billion compared with a loss of $1.2 billion in the prior year. Actions and policies adopted in conjunction with the Merger and the repositioning of the Treasury investment portfoliowere the main drivers of the increased loss.
Total noninterest expense was $5.3 billion, down $1.1 billion from $6.4 billionin the prior year. Material litigation charges were $2.8 billion compared with$3.7 billion in the prior year. Merger costs were $722 million compared with$1.4 billion in the prior year. These decreases were offset primarily by the costof accelerated vesting of certain employee stock options.
On September 15, 2004, JPMorgan Chase and IBM announced the Firm’s plansto reintegrate the portions of its technology infrastructure – including datacenters, help desks, distributed computing, data networks and voice networks– that were previously outsourced to IBM. In January 2005, approximately3,100 employees and 800 contract employees were transferred to the Firm.
Selected metrics Year ended December 31,(in millions, except headcount) 2006 2005 2004(e)
Total net revenuePrivate equity $ 1,142 $ 1,521 $ 1,211Treasury (797) (3,278) 81Corporate other(a) (337) 621 (523)
Total net revenue $ 8 $ (1,136) $ 769
Net income (loss)Private equity $ 627 $ 821 $ 602Treasury (560) (2,028) (106)Corporate other(a)(b)(c) 169 (2,128) (3,337)Merger costs (189) (448) (847)
Income (loss) from continuing operations 47 (3,783) (3,688)
Income from discontinued operations (after-tax)(d) 795 229 206
Total net income (loss) $ 842 $ (3,554) $(3,482)
Headcount 23,242 30,666 26,956
(a) Includes a gain of $64 million ($103 million pretax) in 2006 related to the initial publicoffering of Mastercard, and a gain of $752 million ($1.3 billion pretax) on the sale ofBrownCo in 2005.
(b) Includes insurance recoveries (after-tax) related to material legal proceedings of $317 mil-lion and $129 million in 2006 and 2005, respectively. Includes litigation reserve charges(after-tax) of $1.7 billion and $2.3 billion in 2005 and 2004, respectively.
(c) Includes tax benefits recognized upon resolution of tax audits.(d) Includes a $622 million gain from exiting the corporate trust business in the fourth quarter of
2006.(e) 2004 results include six months of the combined Firm’s results and six months of heritage
JPMorgan Chase results.
JPMorgan Chase & Co. / 2006 Annual Report 55
BALANCE SHEET ANALYS IS
Selected balance sheet dataDecember 31, (in millions) 2006 2005
AssetsCash and due from banks $ 40,412 $ 36,670Deposits with banks 13,547 21,661Federal funds sold and securities purchased
under resale agreements 140,524 133,981Securities borrowed 73,688 74,604Trading assets:
Debt and equity instruments 310,137 248,590Derivative receivables 55,601 49,787
Securities:Available-for-sale 91,917 47,523Held-to-maturity 58 77
Interests in purchased receivables – 29,740Loans, net of Allowance for loan losses 475,848 412,058Other receivables 27,585 27,643Goodwill 45,186 43,621Other intangible assets 14,852 14,559All other assets 62,165 58,428
Total assets $ 1,351,520 $ 1,198,942
LiabilitiesDeposits $ 638,788 $ 554,991Federal funds purchased and securities sold
under repurchase agreements 162,173 125,925Commercial paper and other borrowed funds 36,902 24,342Trading liabilities:
Debt and equity instruments 90,488 94,157Derivative payables 57,469 51,773
Long-term debt and trust preferred capital debt securities 145,630 119,886
Beneficial interests issued by consolidated VIEs 16,184 42,197All other liabilities 88,096 78,460
Total liabilities 1,235,730 1,091,731Stockholders’ equity 115,790 107,211
Total liabilities and stockholders’ equity $ 1,351,520 $ 1,198,942
Balance sheet overview At December 31, 2006, the Firm’s total assets were $1.4 trillion, an increase of $152.6 billion, or 13%, from December 31, 2005. Total liabilities were $1.2 trillion, an increase of $144.0 billion, or 13%, from December 31, 2005.Stockholders’ equity was $115.8 billion, an increase of $8.6 billion, or 8% fromDecember 31, 2005. The following is a discussion of the significant changes inbalance sheet items during 2006.
Federal funds sold and securities purchased under resale agreements;Securities borrowed; Federal funds purchased and securities soldunder repurchase agreements; and Commercial paper and Other bor-rowed funds
The Firm utilizes Federal funds sold and securities purchased under resale agree-ments, Securities borrowed, Federal funds purchased and securities sold underrepurchase agreements and Commercial paper and other borrowed funds aspart of its liquidity management activities, in order to manage the Firm’s cashpositions, risk-based capital requirements, and to maximize liquidity access andminimize funding costs. In 2006, Federal funds sold increased in connectionwith higher levels of funds that were available for short-term investments.
Securities sold under repurchase agreements and Commercial paper and otherborrowed funds increased primarily due to short-term requirements to fundtrading positions and AFS securities inventory levels, as well as the result ofgrowth in volume related to sweeps and other cash management products. Foradditional information on the Firm’s Liquidity risk management, see pages62–63 of this Annual Report.
Trading assets and liabilities – debt and equity instrumentsThe Firm uses debt and equity trading instruments for both market-making andproprietary risk-taking activities. These instruments consist primarily of fixedincome securities (including government and corporate debt), equity securitiesand convertible cash instruments, as well as physical commodities. The increasein trading assets over December 31, 2005, was due primarily to the more favor-able capital markets environment, with growth in client-driven market-makingactivities across both products (such as interest rate, credit and equity markets)and regions. For additional information, refer to Note 4 on page 98 of thisAnnual Report.
Trading assets and liabilities – derivative receivables and payablesThe Firm utilizes various interest rate, foreign exchange, equity, credit and com-modity derivatives for market-making, proprietary risk-taking and risk-manage-ment purposes. The increases in derivative receivables and payables fromDecember 31, 2005, primarily stemmed from an increase in credit derivativesand equity contracts. For additional information, refer to Derivative contractsand Note 4 on pages 69–72 and 98, respectively, of this Annual Report.
SecuritiesThe Firm’s securities portfolio, almost all of which is classified as AFS, is usedprimarily to manage the Firm’s exposure to interest rate movements. The AFSportfolio increased by $44.4 billion from the 2005 year end, primarily due to netpurchases in the Treasury investment securities portfolio, in connection withrepositioning the Firm’s portfolio to manage exposure to interest rates. For addi-tional information related to securities, refer to the Corporate segment discus-sion and to Note 10 on pages 53–54 and 108–111, respectively, of this AnnualReport.
Interests in purchased receivables and Beneficial interests issued byconsolidated VIEsInterests in purchased receivables and Beneficial interests issued by consolidat-ed VIEs declined from December 2005, as a result of the restructuring duringthe second quarter of 2006 of Firm-administered multi-seller conduits. Therestructuring resulted in the deconsolidation of $29 billion of Interests in pur-chased receivables, $3 billion of Loans and $1 billion of AFS securities, as wellas a corresponding decrease in Beneficial interests issued by consolidated VIEs.For additional information related to multi-seller conduits, refer to Off–balancesheet arrangements and contractual cash obligations on pages 59–60 andNote 15 on pages 118–120 of this Annual Report.
MANAGEMENT’S DISCUSSION AND ANALYSISJPMorgan Chase & Co.
56 JPMorgan Chase & Co. / 2006 Annual Report
LoansThe Firm provides loans to customers of all sizes, from large corporate clients toindividual consumers. The Firm manages the risk/reward relationship of eachportfolio and discourages the retention of loan assets that do not generate apositive return above the cost of risk-adjusted capital. The $63.8 billion increasein loans, net of the Allowance for loan losses, from December 31, 2005, was dueprimarily to an increase of $33.6 billion in the wholesale portfolio, mainly in theIB, reflecting an increase in capital markets activity, including financings associat-ed with client acquisitions, securitizations and loan syndications. CB loans alsoincreased as a result of organic growth and The Bank of New York transaction.The $30.3 billion increase in consumer loans was due largely to increases in CS(reflecting strong organic growth, a reduction in credit card securitization activity,and the acquisitions of private-label credit card portfolios), increases in educationloans resulting from the 2006 first-quarter acquisition of Collegiate FundingServices, and as a result of The Bank of New York transaction. These increaseswere offset partially by a decline in auto loans and leases. The Allowance forloan losses increased $189 million, or 3%, from December 31, 2005. For a moredetailed discussion of the loan portfolio and the Allowance for loan losses, referto Credit risk management on pages 64–76 of this Annual Report.
GoodwillGoodwill arises from business combinations and represents the excess of thecost of an acquired entity over the net fair value amounts assigned to assetsacquired and liabilities assumed. The $1.6 billion increase in Goodwill primarilyresulted from the addition of $1.8 billion of goodwill from The Bank of NewYork transaction in the 2006 fourth quarter and from the 2006 first-quarteracquisition of Collegiate Funding Services. Partially offsetting the increase inGoodwill were reductions of $402 million resulting from the sale of selectedcorporate trust businesses to The Bank of New York; purchase accountingadjustments associated with the 2005 fourth-quarter acquisition of the SearsCanada credit card business; the 2006 second quarter sale of the insurancebusiness; and a reduction related to reclassifying net assets of a subsidiary asheld-for-sale. For additional information, see Notes 3 and 16 on pages 97 and121–123 of this Annual Report.
Other intangible assetsThe Firm’s other intangible assets consist of mortgage servicing rights (“MSRs”),purchased credit card relationships, other credit card–related intangibles, coredeposit intangibles, and all other intangibles. The $293 million increase in Otherintangible assets primarily reflects higher MSRs due to growth in the servicingportfolio, the addition of core deposit intangibles from The Bank of New Yorktransaction and purchase accounting adjustments related to the Sears Canadacredit card business. Partially offsetting these increases were the amortization ofintangibles and a $436 million reduction in Other intangible assets as a result ofthe sale of selected corporate trust businesses to The Bank of New York. For addi-tional information on MSRs and other intangible assets, see Notes 3 and 16 onpages 97 and 121–123 of this Annual Report.
DepositsThe Firm’s deposits represent a liability to customers, both retail and wholesale,for funds held on their behalf. Deposits are generally classified by location (U.S.and non-U.S.), whether they are interest- or noninterest-bearing, and by type(demand, money market deposit accounts (“MMDAs”), savings, time, negotiableorder of withdrawal (“NOW”) accounts), and help provide a stable and consis-tent source of funding to the Firm. Deposits increased by 15% from December31, 2005. Growth in retail deposits reflected The Bank of New York transaction,new account acquisitions, and the ongoing expansion of the retail branch distri-bution network. Wholesale deposits increased driven by growth in business vol-umes. Partially offsetting the growth in wholesale deposits was a $24.0 billiondecline as a result of the sale of selected corporate trust businesses to The Bankof New York. For more information on deposits, refer to the RFS segment discus-sion and the Liquidity risk management discussion on pages 38–42 and 62–63,respectively, of this Annual Report. For more information on wholesale liabilitybalances, including deposits, refer to the CB and TSS segment discussions onpages 46–47 and 48–49, respectively, of this Annual Report.
Long-term debt and trust preferred capital debt securitiesThe Firm utilizes Long-term debt and trust preferred capital debt securities aspart of its liquidity and capital management activities. Long-term debt and trustpreferred capital debt securities increased by $25.7 billion, or 21%, fromDecember 31, 2005, primarily due to net new issuances. Continued strong for-eign investor participation in the global corporate markets allowed JPMorganChase to identify attractive opportunities globally to further diversify its fundingand capital sources. During 2006, JPMorgan Chase issued approximately $56.7billion of long-term debt and trust preferred capital debt securities. Theseissuances were offset partially by $34.3 billion of long-term debt and trust pre-ferred capital debt securities that matured or were redeemed. For additionalinformation on the Firm’s long-term debt activities, see the Liquidity risk man-agement discussion on pages 62–63 and Note 19 on pages 124–125 of thisAnnual Report.
Stockholders’ equityTotal stockholders’ equity increased by $8.6 billion, or 8%, from year-end 2005to $115.8 billion at December 31, 2006. The increase was primarily the result ofNet income for 2006 and net shares issued under the Firm’s employee stock-based compensation plans, offset partially by the declaration of cash dividends,stock repurchases, a charge of $1.1 billion to Accumulated other comprehensiveincome (loss) related to the prospective adoption, as required on December 31,2006, of SFAS 158 for the Firm’s defined benefit pension and OPEB plans, andthe redemption of preferred stock. For a further discussion of capital, see theCapital management section that follows. For a further discussion of SFAS 158,see Note 7 on pages 100–105 of this Annual Report.
JPMorgan Chase & Co. / 2006 Annual Report 57
CAP ITAL MANAGEMENT
The Firm’s capital management framework is intended to ensure that there iscapital sufficient to support the underlying risks of the Firm’s business activi-ties, as measured by economic risk capital, and to maintain “well-capitalized”status under regulatory requirements. In addition, the Firm holds capital abovethese requirements in amounts deemed appropriate to achieve management’sregulatory and debt rating objectives. The process of assigning equity to thelines of business is integrated into the Firm’s capital framework and is over-seen by ALCO.
Line of business equityThe Firm’s framework for allocating capital is based upon the following objectives:• integrate firmwide capital management activities with capital management
activities within each of the lines of business;• measure performance consistently across all lines of business; and• provide comparability with peer firms for each of the lines of business.
Equity for a line of business represents the amount the Firm believes the busi-ness would require if it were operating independently, incorporating sufficientcapital to address economic risk measures, regulatory capital requirements andcapital levels for similarly rated peers. Return on equity is measured and internaltargets for expected returns are established as a key measure of a business seg-ment’s performance.
Effective January 1, 2006, the Firm refined its methodology for allocating capitalto the lines of business. As a result of this refinement, RFS, CS, CB, TSS and AMhad higher amounts of capital allocated to them commencing in the first quarterof 2006. The revised methodology considers for each line of business, amongother things, goodwill associated with such line of business’ acquisitions since theMerger. In management’s view, the revised methodology assigns responsibility tothe lines of business to generate returns on the amount of capital supportingacquisition-related goodwill. As part of this refinement in the capital allocationmethodology, the Firm assigned to the Corporate segment an amount of equitycapital equal to the then-current book value of goodwill from and prior to theMerger. As prior periods have not been revised to reflect the new capital alloca-tions, capital allocated to the respective lines of business for 2006 is not compara-ble to prior periods; and certain business metrics, such as ROE, are not compara-ble to the current presentation. The Firm may revise its equity capital-allocationmethodology again in the future.
In accordance with SFAS 142, the lines of business perform the required goodwillimpairment testing. For a further discussion of goodwill and impairment testing,see Critical accounting estimates and Note 16 on pages 83–85 and 121–123,respectively, of this Annual Report.
Line of business equity Yearly Average(in billions) 2006 2005
Investment Bank $ 20.8 $ 20.0Retail Financial Services 14.6 13.4Card Services 14.1 11.8Commercial Banking 5.7 3.4Treasury & Securities Services 2.3 1.5Asset Management 3.5 2.4Corporate(a) 49.7 53.0
Total common stockholders’ equity $110.7 $105.5
(a) 2006 and 2005 include $41.7 billion and $43.1 billion, respectively, of equity to offsetgoodwill and $8.0 billion and $9.9 billion, respectively, of equity, primarily related toTreasury, Private Equity and the Corporate Pension Plan.
Economic risk capitalJPMorgan Chase assesses its capital adequacy relative to the risks underlyingthe Firm’s business activities, utilizing internal risk-assessment methodologies.The Firm assigns economic capital primarily based upon four risk factors:credit risk, market risk, operational risk and private equity risk, principally forthe Firm’s private equity business.
Economic risk capital Yearly Average(in billions) 2006 2005
Credit risk $ 22.1 $ 22.6Market risk 9.9 9.8Operational risk 5.7 5.5Private equity risk 3.4 3.8
Economic risk capital 41.1 41.7Goodwill 43.9 43.1Other(a) 25.7 20.7(b)
Total common stockholders’ equity $ 110.7 $ 105.5
(a) Reflects additional capital required, in management’s view, to meet its regulatory and debtrating objectives.
(b) Includes $2.1 billion of capital previously reported as business risk capital.
Credit risk capitalCredit risk capital is estimated separately for the wholesale businesses (IB,CB, TSS and AM) and consumer businesses (RFS and CS).
Credit risk capital for the overall wholesale credit portfolio is defined in termsof unexpected credit losses, both from defaults and declines in market valuedue to credit deterioration, measured over a one-year period at a confidencelevel consistent with the level of capitalization necessary to achieve a targeted‘AA’ solvency standard. Unexpected losses are in excess of those for whichprovisions for credit losses are maintained. In addition to maturity and corre-lations, capital allocation is based upon several principal drivers of credit risk:exposure at default (or loan-equivalent amount), likelihood of default, lossseverity and market credit spread.
• Loan-equivalent amount for counterparty exposure in an over-the-counterderivative transaction is represented by the expected positive exposure basedupon potential movements of underlying market rates. The loan-equivalentamount for unused revolving credit facilities represents the portion of theunused commitment or other contingent exposure that is expected, basedupon average portfolio historical experience, to become outstanding in theevent of a default by an obligor.
• Default likelihood is based upon current market conditions for allInvestment Bank clients by referencing equity and credit derivatives mar-kets, as well as certain other publicly traded entities that are not IB clients.This methodology facilitates, in the Firm’s view, more active risk manage-ment by utilizing a dynamic, forward-looking measure of credit. This meas-ure changes with the credit cycle over time, impacting the level of creditrisk capital. For privately held firms and individuals in the Commercial Bankand Asset Management, default likelihood is based upon longer-term aver-ages through the credit cycles.
• Loss severity of exposure is based upon the Firm’s average historical experience during workouts, with adjustments to account for collateral or subordination.
Credit risk capital for the consumer portfolio is based upon product and other rel-evant risk segmentation. Actual segment level default and severity experience areused to estimate unexpected losses for a one-year horizon at a confidence levelequivalent to the ‘AA’ solvency standard. Statistical results for certain segments or
MANAGEMENT’S DISCUSSION AND ANALYSISJPMorgan Chase & Co.
58 JPMorgan Chase & Co. / 2006 Annual Report
portfolios are adjusted to ensure that capital is consistent with external bench-marks, such as subordination levels on market transactions or capital held at rep-resentative monoline competitors, where appropriate.
Market risk capitalThe Firm calculates market risk capital guided by the principle that capitalshould reflect the risk of loss in the value of portfolios and financial instrumentscaused by adverse movements in market variables, such as interest and foreignexchange rates, credit spreads, securities prices and commodities prices. DailyValue-at-Risk (“VAR”), monthly stress-test results and other factors are used todetermine appropriate capital levels. The Firm allocates market risk capital toeach business segment according to a formula that weights that segment’s VARand stress-test exposures. See Market risk management on pages 77–80 of thisAnnual Report for more information about these market risk measures.
Operational risk capitalCapital is allocated to the lines of business for operational risk using a risk-basedcapital allocation methodology which estimates operational risk on a bottom-upbasis. The operational risk capital model is based upon actual losses and potentialscenario-based stress losses, with adjustments to the capital calculation to reflectchanges in the quality of the control environment or the use of risk-transfer prod-ucts. The Firm believes the model is consistent with the new Basel II Frameworkand expects to propose it eventually for qualification under the advanced meas-urement approach for operational risk.
Private equity risk capitalCapital is allocated to privately- and publicly-held securities, third-party fundinvestments and commitments in the Private Equity portfolio to cover the potentialloss associated with a decline in equity markets and related asset devaluations.
Regulatory capital The Firm’s federal banking regulator, the Federal Reserve Board, establishes capi-tal requirements, including well-capitalized standards for the consolidated finan-cial holding company. The Office of the Comptroller of the Currency (“OCC”)establishes similar capital requirements and standards for the Firm’s nationalbanks, including JPMorgan Chase Bank, N.A. and Chase Bank USA, N.A.
On December 14, 2006, the federal banking regulatory agencies announcedan interim decision that SFAS 158 will not impact regulatory capital. Until fur-ther guidance is issued, any amounts included in Accumulated other compre-hensive income (loss) within Stockholders’ equity related to the adoption ofSFAS 158 will be excluded from regulatory capital. For further discussion ofSFAS 158, refer to Note 7 on pages 100–105 of this Annual Report.
In the first quarter of 2006, the federal banking regulatory agencies issued afinal rule that provides regulatory capital relief for certain cash-collateralized,securities-borrowed transactions. The final rule, which became effectiveFebruary 22, 2006, also broadens the types of transactions qualifying for reg-ulatory capital relief under the interim rule. Adoption of the rule did not havea material effect on the Firm’s capital ratios.
On March 1, 2005, the Federal Reserve Board issued a final rule, whichbecame effective April 11, 2005, that continues the inclusion of trust pre-ferred capital debt securities in Tier 1 capital, subject to stricter quantitativelimits and revised qualitative standards, and broadens the definition ofrestricted core capital elements. The rule provides for a five-year transitionperiod. As an internationally active bank holding company, JPMorgan Chaseis subject to the rule’s limitation on restricted core capital elements, includingtrust preferred capital debt securities, to 15% of total core capital elements,net of goodwill less any associated deferred tax liability. At December 31,2006, JPMorgan Chase’s restricted core capital elements were 15.1% of totalcore capital elements.
The following tables show that JPMorgan Chase maintained a well-capitalizedposition based upon Tier1and Total capital ratios at December 31,2006 and 2005.
Capital ratios Well-capitalizedDecember 31, 2006 2005 ratios
Tier 1 capital ratio 8.7% 8.5% 6.0%Total capital ratio 12.3 12.0 10.0Tier 1 leverage ratio 6.2 6.3 NATotal stockholders’ equity to assets 8.6 8.9 NA
Risk-based capital components and assetsDecember 31, (in millions) 2006 2005
Total Tier 1 capital $ 81,055 $ 72,474Total Tier 2 capital 34,210 29,963
Total capital $ 115,265 $ 102,437
Risk-weighted assets $ 935,909 $ 850,643Total adjusted average assets 1,308,699 1,152,546
Tier 1 capital was $81.1 billion at December 31, 2006, compared with $72.5billion at December 31, 2005, an increase of $8.6 billion. The increase wasdue primarily to net income of $14.4 billion, net issuances of common stockunder the Firm’s employee stock based compensation plans of $3.8 billion and$873 million of additional qualifying trust preferred capital debt securities.Partially offsetting these increases were changes in stockholders’ equity net ofAccumulated other comprehensive income (loss) due to dividends declared of$4.9 billion, common share repurchases of $3.9 billion, the redemption of pre-ferred stock of $139 million, a $1.2 billion increase in the deduction for good-will and other nonqualifying intangibles and a $563 million reduction in quali-fying minority interests. Additional information regarding the Firm’s capitalratios and the federal regulatory capital standards to which it is subject is pre-sented in Note 26 on pages 129–130 of this Annual Report.
Basel II The Basel Committee on Banking Supervision published the new Basel IIFramework in 2004 in an effort to update the original international bank capitalaccord (“Basel I”), which has been in effect since 1988. The goal of the Basel IIFramework is to make regulatory capital more risk-sensitive, and promoteenhanced risk management practices among large, internationally active bank-ing organizations.
U.S. banking regulators are in the process of incorporating the Basel II Frameworkinto the existing risk-based capital requirements. JPMorgan Chase will berequired to implement advanced measurement techniques in the U.S., commenc-ing in 2009, by employing internal estimates of certain key risk drivers to derivecapital requirements. Prior to its implementation of the new Basel II Framework,JPMorgan Chase will be required to demonstrate to its U.S. bank supervisors thatits internal criteria meet the relevant supervisory standards. JPMorgan Chaseexpects to be in compliance within the established timelines with all relevantBasel II rules. During 2007 and 2008, the Firm will adopt Basel II rules in certainnon-U.S. jurisdictions, as required.
DividendsThe Firm’s common stock dividend policy reflects JPMorgan Chase’s earnings out-look, desired dividend payout ratios, need to maintain an adequate capital leveland alternative investment opportunities. In 2006, JPMorgan Chase declaredquarterly cash dividends on its common stock of $0.34 per share. The Firm con-tinues to target a dividend payout ratio of 30-40% of net income over time.
JPMorgan Chase & Co. / 2006 Annual Report 59
The following table shows the common dividend payout ratio based uponreported Net income:
Common dividend payout ratioYear ended December 31, 2006 2005 2004
Common dividend payout ratio 34% 57% 88%
For information regarding restrictions on JPMorgan Chase’s ability to pay divi-dends, see Note 25 on page 129 of this Annual Report.
Stock repurchasesOn March 21, 2006, the Board of Directors approved a stock repurchase pro-gram that authorizes the repurchase of up to $8 billion of the Firm’s commonshares, which supercedes a $6 billion stock repurchase program approved in2004. The $8 billion authorization includes shares to be repurchased to offsetissuances under the Firm’s employee stock-based plans. The actual number ofshares repurchased is subject to various factors, including: market conditions;legal considerations affecting the amount and timing of repurchase activity; theFirm’s capital position (taking into account goodwill and intangibles); internalcapital generation; and alternative potential investment opportunities. Therepurchase program does not include specific price targets or timetables; maybe executed through open market purchases or privately negotiated transac-tions, or utilizing Rule 10b5-1 programs; and may be suspended at any time.
For the year ended December 31, 2006, under the respective stock repurchaseprograms then in effect, the Firm repurchased a total of 91 million shares for $3.9billion at an average price per share of $43.41. Under the original $6 billion stockrepurchase program, during 2005, the Firm repurchased 94 million shares for $3.4billion at an average price per share of $36.46.
As of December 31, 2006, $5.2 billion of authorized repurchase capacity remainedunder the current stock repurchase program.
The Firm has determined that it may, from time to time, enter into written tradingplans under Rule 10b5-1 of the Securities Exchange Act of 1934 to facilitatethe repurchase of common stock in accordance with the repurchase program.A Rule 10b5-1 repurchase plan would allow the Firm to repurchase sharesduring periods when it would not otherwise be repurchasing common stock –for example, during internal trading “black-out periods.” All purchases under aRule 10b5-1 plan must be made according to a predefined plan that is estab-lished when the Firm is not aware of material nonpublic information.
For additional information regarding repurchases of the Firm’s equity securi-ties, see Part II, Item 5, Market for registrant’s common equity, related stock-holder matters and issuer purchases of equity securities, on page 11 ofJPMorgan Chase’s 2006 Form 10-K.
OFF–BALANCE SHEET ARRANGEMENTS AND CONTRACTUAL CASH OBL IGAT IONS
Special-purpose entitiesJPMorgan Chase is involved with several types of off–balance sheet arrange-ments, including special purpose entities (“SPEs”), lines of credit and loancommitments. The principal uses of SPEs are to obtain sources of liquidity forJPMorgan Chase and its clients by securitizing financial assets, and to createother investment products for clients. These arrangements are an importantpart of the financial markets, providing market liquidity by facilitatinginvestors’ access to specific portfolios of assets and risks. For example, SPEsare integral to the markets for mortgage-backed securities, commercial paperand other asset-backed securities.
The basic SPE structure involves a company selling assets to the SPE. The SPEfunds the purchase of those assets by issuing securities to investors. To insulateinvestors from creditors of other entities, including the seller of assets, SPEsare generally structured to be bankruptcy-remote.
JPMorgan Chase is involved with SPEs in three broad categories: loan securitizations,multi-seller conduits and client intermediation. Capital is held, as deemed appropri-ate, against all SPE-related transactions and related exposures, such as derivativetransactions and lending-related commitments. For further discussion of SPEs andthe Firm’s accounting for these types of exposures, see Note 1 on page 94, Note14 on pages 114–118 and Note 15 on pages 118–120 of this Annual Report.
The Firm has no commitments to issue its own stock to support any SPE trans-action, and its policies require that transactions with SPEs be conducted atarm’s length and reflect market pricing. Consistent with this policy, no JPMorganChase employee is permitted to invest in SPEs with which the Firm is involvedwhere such investment would violate the Firm’s Code of Conduct. These rulesprohibit employees from self-dealing and acting on behalf of the Firm in trans-actions with which they or their family have any significant financial interest.
For certain liquidity commitments to SPEs, the Firm could be required to provide funding if the short-term credit rating of JPMorgan Chase Bank, N.A.were downgraded below specific levels, primarily P-1, A-1 and F1 for Moody’s,Standard & Poor’s and Fitch, respectively. The amount of these liquidity commit-ments was $74.4 billion and $71.3 billion at December 31, 2006 and 2005,respectively. Alternatively, if JPMorgan Chase Bank, N.A. were downgraded, theFirm could be replaced by another liquidity provider in lieu of providing funding
under the liquidity commitment, or, in certain circumstances, could facilitate thesale or refinancing of the assets in the SPE in order to provide liquidity.
Of the $74.4 billion in liquidity commitments to SPEs at December 31, 2006,$74.0 billion was included in the Firm’s other unfunded commitments to extendcredit and asset purchase agreements, as shown in the table on the followingpage. Of the $71.3 billion of liquidity commitments to SPEs at December 31,2005, $38.9 billion was included in the Firm’s other unfunded commitments toextend credit and asset purchase agreements. Of these commitments, $356 mil-lion and $32.4 billion have been excluded from the table at December 31, 2006and 2005, respectively, as the underlying assets of the SPEs have been includedon the Firm’s Consolidated balance sheets due to the consolidation of certainmulti-seller conduits as required under FIN 46R. The decrease from the 2005year end is due to the deconsolidation during the 2006 second quarter of sever-al multi-seller conduits administrated by the Firm. For further information, referto Note 15 on pages 118–120 of this Annual Report.
The Firm also has exposure to certain SPEs arising from derivative transactions;these transactions are recorded at fair value on the Firm’s Consolidated balancesheets with changes in fair value (i.e., mark-to-market (“MTM”) gains and losses)recorded in Principal transactions. Such MTM gains and losses are not included inthe revenue amounts reported in the following table.
The following table summarizes certain revenue information related to consoli-dated and nonconsolidated variable interest entities (“VIEs”) with which theFirm has significant involvement, and qualifying SPEs (“QSPEs”). The revenuereported in the table below primarily represents servicing and credit fee income.For further discussion of VIEs and QSPEs, see Note 1, Note 14 and Note 15, onpages 94, 114–118 and 118–120, respectively, of this Annual Report.
Revenue from VIEs and QSPEsYear ended December 31,(in millions) VIEs(c) QSPEs Total
2006 $ 209 $ 3,183 $ 3,3922005(a) 222 2,940 3,1622004(a)(b) 154 2,732 2,886
(a) Prior-period results have been restated to reflect current methodology.(b) 2004 results include six months of the combined Firm’s results and six months of heritage
JPMorgan Chase results.(c) Includes VIE-related revenue (i.e., revenue associated with consolidated and significant
nonconsolidated VIEs).
60 JPMorgan Chase & Co. / 2006 Annual Report
Off–balance sheet lending-related financialinstruments and guaranteesJPMorgan Chase utilizes lending-related financial instruments (e.g., commitmentsand guarantees) to meet the financing needs of its customers. The contractualamount of these financial instruments represents the maximum possible creditrisk should the counterparty draw down the commitment or the Firm berequired to fulfill its obligation under the guarantee, and the counterpartysubsequently fail to perform according to the terms of the contract. Most ofthese commitments and guarantees expire without a default occurring orwithout being drawn. As a result, the total contractual amount of theseinstruments is not, in the Firm’s view, representative of its actual future creditexposure or funding requirements. Further, certain commitments, primarilyrelated to consumer financings, are cancelable, upon notice, at the option ofthe Firm. For further discussion of lending-related commitments and guaran-tees and the Firm’s accounting for them, see Credit risk management onpages 64–76 and Note 29 on pages 132–134 of this Annual Report.
Contractual cash obligationsIn the normal course of business, the Firm enters into various contractual obligations that may require future cash payments. Commitments for future cashexpenditures primarily include contracts to purchase future services and capitalexpenditures related to real estate–related obligations and equipment.
The accompanying table summarizes, by remaining maturity, JPMorgan Chase’soff–balance sheet lending-related financial instruments and significant contractual cash obligations at December 31, 2006. Contractual purchasesand capital expenditures in the table below reflect the minimum contractualobligation under legally enforceable contracts with terms that are both fixedand determinable. Excluded from the following table are a number of obliga-tions to be settled in cash, primarily in under one year. These obligations arereflected on the Firm’s Consolidated balance sheets and include Federal funds purchased and securities sold under repurchase agreements; Other borrowed funds; purchases of Debt and equity instruments; Derivative payables;and certain purchases of instruments that resulted in settlement failures. Fordiscussion regarding Long-term debt and trust preferred capital securities, seeNote 19 on pages 124–125 of this Annual Report. For discussion regardingoperating leases, see Note 27 on page 130 of this Annual Report.
Off–balance sheet lending-related financial instruments and guarantees2006
By remaining maturity at December 31, Under 1–<3 3–5 Over 2005(in millions) 1 year years years 5 years Total Total
Lending-relatedConsumer(a) $ 677,784 $ 3,807 $ 3,604 $ 62,340 $ 747,535 $ 655,596Wholesale:
Other unfunded commitments to extend credit(b)(c)(d) 92,829 52,465 67,250 16,660 229,204 208,469Asset purchase agreements(e) 20,847 38,071 7,186 1,425 67,529 31,095Standby letters of credit and guarantees(c)(f)(g) 23,264 21,286 38,812 5,770 89,132 77,199Other letters of credit(c) 4,628 823 101 7 5,559 4,346
Total wholesale 141,568 112,645 113,349 23,862 391,424 321,109
Total lending-related $ 819,352 $ 116,452 $ 116,953 $ 86,202 $ 1,138,959 $ 976,705
Other guaranteesSecurities lending guarantees(h) $ 318,095 $ — $ — $ — $ 318,095 $ 244,316Derivatives qualifying as guarantees(i) 13,542 10,656 24,414 22,919 71,531 61,759
Contractual cash obligationsTime deposits $ 195,187 $ 5,314 $ 2,329 $ 1,519 $ 204,349 $ 147,381Long-term debt 28,272 41,015 28,189 35,945 133,421 108,357Trust preferred capital debt securities — — — 12,209 12,209 11,529FIN 46R long-term beneficial interests(j) 70 63 413 7,790 8,336 2,354Operating leases(k) 1,058 1,995 1,656 6,320 11,029 9,734Contractual purchases and capital expenditures 770 524 154 136 1,584 2,324Obligations under affinity and co-brand programs 1,262 2,050 1,906 897 6,115 6,877Other liabilities(l) 638 718 769 3,177 5,302 11,646
Total $ 227,257 $ 51,679 $ 35,416 $ 67,993 $ 382,345 $ 300,202
(a) Includes Credit card lending-related commitments of $657 billion and $579 billion at December 31, 2006 and 2005, respectively, that represent the total available credit to the Firm’s cardholders.The Firm has not experienced, and does not anticipate, that all of its cardholders will utilize their entire available lines of credit at the same time. The Firm can reduce or cancel a credit card commit-ment by providing the cardholder prior notice or, in some cases, without notice as permitted by law.
(b) Includes unused advised lines of credit totaling $39.0 billion and $28.3 billion at December 31, 2006 and 2005, respectively, which are not legally binding. In regulatory filings with the FederalReserve Board, unused advised lines are not reportable.
(c) Represents contractual amount net of risk participations totaling $32.8 billion and $29.3 billion at December 31, 2006 and 2005, respectively.(d) Excludes unfunded commitments to private third-party equity funds of $589 million and $242 million at December 31, 2006 and 2005, respectively.(e) The maturity is based upon the weighted-average life of the underlying assets in the SPE, which are primarily multi-seller asset-backed commercial paper conduits. Represents asset purchase agree-
ments with the Firm’s administered multi-seller asset-backed commercial paper conduits, which excludes $356 million and $32.4 billion at December 31, 2006 and 2005, respectively, related to con-duits that were consolidated in accordance with FIN 46R, as the underlying assets of the conduits are reported in the Firm’s Consolidated balance sheets. It also includes $1.4 billion and $1.3 billionof asset purchase agreements to other third-party entities at December 31, 2006 and 2005, respectively. Certain of the Firm’s administered multi-seller conduits were deconsolidated as of June2006; the assets deconsolidated were approximately $33 billion.
(f) JPMorgan Chase held collateral relating to $13.5 billion and $9.0 billion of these arrangements at December 31, 2006 and 2005, respectively.(g) Includes unused commitments to issue standby letters of credit of $45.7 billion and $37.5 billion at December 31, 2006 and 2005, respectively.(h) Collateral held by the Firm in support of securities lending indemnification agreements was $317.9 billion and $245.0 billion at December 31, 2006 and 2005, respectively.(i) Represents notional amounts of derivatives qualifying as guarantees. For further discussion of guarantees, see Note 29 on pages 132–134 of this Annual Report.(j) Included on the Consolidated balance sheets in Beneficial interests issued by consolidated VIEs.(k) Excludes benefit of noncancelable sublease rentals of $1.2 billion and $1.3 billion at December 31, 2006 and 2005, respectively.(l) Includes deferred annuity contracts. Excludes contributions for pension and other postretirement benefits plans, if any, as these contributions are not reasonably estimatable at this time.
MANAGEMENT’S DISCUSSION AND ANALYSISJPMorgan Chase & Co.
JPMorgan Chase & Co. / 2006 Annual Report 61
R ISK MANAGEMENT
Risk is an inherent part of JPMorgan Chase’s business activities. The Firm’srisk management framework and governance structure are intended to pro-vide comprehensive controls and ongoing management of the major risksinherent in its business activities. The Firm’s ability to properly identify, meas-ure, monitor and report risk is critical to both its soundness and profitability.
• Risk identification: The Firm’s exposure to risk through its daily businessdealings, including lending, trading and capital markets activities, is identi-fied and aggregated through the Firm’s risk management infrastructure.
• Risk measurement: The Firm measures risk using a variety of method-ologies, including calculating probable loss, unexpected loss and value-at-risk, and by conducting stress tests and making comparisons to externalbenchmarks. Measurement models and related assumptions are routinelyreviewed with the goal of ensuring that the Firm’s risk estimates are rea-sonable and reflect underlying positions.
• Risk monitoring/control: The Firm’s risk management policies and pro-cedures incorporate risk mitigation strategies and include approval limitsby customer, product, industry, country and business. These limits are moni-tored on a daily, weekly and monthly basis, as appropriate.
• Risk reporting: Risk reporting is executed on a line of business and con-solidated basis. This information is reported to management on a daily,weekly and monthly basis, as appropriate.
There are eight major risk types identified in the business activities of theFirm: liquidity risk, credit risk, market risk, interest rate risk, private equity risk,operational risk, legal and reputation risk, and fiduciary risk.
Risk governanceThe Firm’s risk governance structure starts with each line of business beingresponsible for managing its own risk. Each line of business works closelywith Risk Management of the Firm, through its own risk committee and, inmost cases, its own chief risk officer. Each risk committee is responsible fordecisions regarding the business’ risk strategy, policies and controls.
Overlaying the line of business risk management are five corporate functionswith risk management–related responsibilities, including the Asset-LiabilityCommittee, Treasury, Chief Investment Office, Office of the General Counseland Risk Management.
The Asset-Liability Committee is responsible for approving the Firm’s liquiditypolicy, including contingency funding planning and exposure to SPEs (and anyrequired liquidity support by the Firm of such SPEs). The committee also over-sees the Firm’s capital management and funds transfer pricing policy (throughwhich lines of business “transfer” interest and foreign exchange risk toTreasury in the Corporate segment). The Committee is composed of the Firm’sChief Financial Officer, Chief Risk Officer, Chief Investment Officer, CorporateTreasurer and the Chief Financial Officers of each line of business.
Treasury and the Chief Investment Office are responsible for measuring, moni-toring, reporting and managing the Firm’s liquidity, interest rate and foreignexchange risk.
The Office of the General Counsel has oversight for legal and reputation andfiduciary risks.
Risk Management is responsible for providing a firmwide function of risk man-agement and controls. Within Risk Management are units responsible for creditrisk, market risk, operational risk and private equity risk, as well as RiskManagement Services and Risk Technology and Operations. Risk ManagementServices is responsible for risk policy and methodology, risk reporting and riskeducation; and Risk Technology and Operations is responsible for building theinformation technology infrastructure used to monitor and manage risk. RiskManagement is headed by the Firm’s Chief Risk Officer, who is a member of theOperating Committee and reports to the Chief Executive Officer and the Boardof Directors, primarily through the Board’s Risk Policy Committee and AuditCommittee. The person who filled the position of Chief Risk Officer during 2006retired at the end of the year. Until his replacement is named, the Firm’s ChiefExecutive Officer is acting as the interim Chief Risk Officer.
In addition to the risk committees of the lines of business and the above-ref-erenced corporate functions, the Firm also has an Investment Committee,which oversees global merger and acquisition activities undertaken byJPMorgan Chase for its own investment account, that fall outside the scopeof the Firm’s private equity and other principal finance activities.
InvestmentCommittee
Operating Committee
Asset-LiabilityCommittee
Treasury and Chief Investment Office (Liquidity Risk and Nontrading Interest Rate and Foreign Exchange Risk)
Risk Management (Credit Risk, Market Risk, Private Equity Risk, Operational Risk, Risk Technology & Operations,Risk Management Services)
Office of the General Counsel (Legal and Reputation Risk, and Fiduciary Risk)
CommercialBanking
Risk Committee
Investment Bank Risk Committee
Retail FinancialServices RiskCommittee
Card ServicesRisk Committee
Treasury & Securities ServicesRisk Committee
Asset ManagementRisk Committee
MANAGEMENT’S DISCUSSION AND ANALYSISJPMorgan Chase & Co.
62 JPMorgan Chase & Co. / 2006 Annual Report
L IQUID ITY R ISK MANAGEMENT
Liquidity risk arises from the general funding needs of the Firm’s activities andin the management of its assets and liabilities. JPMorgan Chase’s liquiditymanagement framework is intended to maximize liquidity access and mini-mize funding costs. Through active liquidity management the Firm seeks topreserve stable, reliable and cost-effective sources of funding. This accessenables the Firm to replace maturing obligations when due and fund assetsat appropriate maturities and rates. To accomplish this, management uses avariety of measures to mitigate liquidity and related risks, taking into consid-eration market conditions, prevailing interest rates, liquidity needs and thedesired maturity profile of liabilities, among other factors.
The three primary measures of the Firm’s liquidity position include the following:
• Holding company short-term position: Holding company short-termposition measures the parent holding company’s ability to repay all obliga-tions with a maturity of less than one year at a time when the ability of theFirm’s subsidiaries to pay dividends to the parent company is constrained.
• Cash capital position: Cash capital position is a measure intended toensure the illiquid portion of the balance sheet can be funded by equity,long-term debt, trust preferred capital debt securities and deposits the Firmbelieves to be core.
• Basic surplus: Basic surplus measures the Bank’s ability to sustain a 90-day stress event that is specific to the Firm where no new funding can beraised to meet obligations as they come due.
Liquidity is managed so that, based upon the measures described above,management believes there is sufficient surplus liquidity.
An extension of liquidity management is the Firm’s contingency funding plan.The goal of the plan is to ensure appropriate liquidity during normal andstress periods. The plan considers numerous temporary and long-term stressscenarios where access to unsecured funding is severely limited or nonexist-ent, taking into account both on– and off–balance sheet exposures, separate-ly evaluating access to funds by the parent holding company, JPMorganChase Bank, N.A. and Chase Bank USA, N.A.
Part of the Firm’s contingency funding plan is its ratings downgrade analysis.For this analysis, the impact of numerous rating agency downgrade scenariosare considered.
The various analytics used to manage the Firm’s liquidity and related risks relyon management’s judgment regarding JPMorgan Chase’s ability to liquidateassets or use assets as collateral for borrowings and take into account histori-cal data on the funding of loan commitments (for example, commercial paperback-up facilities), liquidity commitments to SPEs, commitments with ratingtriggers and collateral posting requirements.
GovernanceThe Firm’s Asset-Liability Committee approves the Firm’s liquidity policy andoversees the policy’s execution. Treasury is responsible for measuring, monitor-ing, reporting and managing the Firm’s liquidity risk profile. Treasury formulatesthe Firm’s liquidity targets and strategies; monitors the Firm’s on– and off–bal-ance sheet liquidity obligations; maintains contingency planning, including rat-ings downgrade stress testing; and identifies and measures internal and exter-nal liquidity warning signals to permit early detection of liquidity issues.
FundingSources of fundsConsistent with its liquidity management policy, the Firm has raised funds atthe parent holding company sufficient to cover its obligations and those of its nonbank subsidiaries that mature over the next 12 months.
As of December 31, 2006, the Firm’s liquidity position remained strong basedupon its liquidity metrics. JPMorgan Chase’s long-dated funding, includingcore liabilities, exceeded illiquid assets, and the Firm believes its obligations can be met even if access to funding is impaired.
The diversity of the Firm’s funding sources enhances financial flexibility andlimits dependence on any one source, thereby minimizing the cost of funds.The deposits held by the RFS, CB, TSS and AM lines of business are generally astable and consistent source of funding for JPMorgan Chase Bank, N.A. As ofDecember 31, 2006, total deposits for the Firm were $639 billion. A significantportion of the Firm’s deposits are retail deposits, which are less sensitive tointerest rate changes and therefore are considered more stable than market-based (i.e., wholesale) deposits. In addition to these deposits, the Firm benefitsfrom substantial liability balances originated by RFS, CB, TSS and AM throughthe normal course of business. These franchise-generated liability balances arealso a stable and consistent source of funding due to the nature of the busi-nesses from which they are generated. For a further discussion of deposit andliability balance trends, see Business Segment Results and Balance SheetAnalysis on pages 36–52 and 55–56, respectively, of this Annual Report.
Additional sources of funds include a variety of both short- and long-terminstruments, including federal funds purchased, commercial paper, bank notes,long-term debt, and trust preferred capital debt securities. This funding ismanaged centrally, using regional expertise and local market access, to ensureactive participation by the Firm in the global financial markets while main-taining consistent global pricing. These markets serve as a cost-effective anddiversified source of funds and are a critical component of the Firm’s liquidity management. Decisions concerning the timing and tenor of accessingthese markets are based upon relative costs, general market conditions,prospective views of balance sheet growth and a targeted liquidity profile.
Finally, funding flexibility is provided by the Firm’s ability to access the repur-chase and asset securitization markets. These markets are evaluated on anongoing basis to achieve an appropriate balance of secured and unsecuredfunding. The ability to securitize loans, and the associated gains on those secu-ritizations, are principally dependent upon the credit quality and yields of theassets securitized and are generally not dependent upon the credit ratings ofthe issuing entity. Transactions between the Firm and its securitization struc-tures are reflected in JPMorgan Chase’s consolidated financial statements andnotes to the consolidated financial statements; these relationships includeretained interests in securitization trusts, liquidity facilities and derivativetransactions. For further details, see Off–balance sheet arrangements andcontractual cash obligations and Notes 14 and 29 on pages 59–60, 114–118and 132–134, respectively, of this Annual Report.
The Board of Directors exercises its oversight of risk management, principallythrough the Board’s Risk Policy Committee and Audit Committee. The RiskPolicy Committee oversees senior management risk-related responsibilities,including reviewing management policies and performance against these poli-cies and related benchmarks. The Audit Committee is responsible for oversight
of guidelines and policies that govern the process by which risk assessmentand management is undertaken. In addition, the Audit Committee reviewswith management the system of internal controls and financial reporting thatis relied upon to provide reasonable assurance of compliance with the Firm’soperational risk management processes.
JPMorgan Chase & Co. / 2006 Annual Report 63
Credit ratingsThe credit ratings of JPMorgan Chase’s parent holding company and each of its significant banking subsidiaries, as of December 31, 2006, were as follows:
Short-term debt Senior long-term debt
Moody’s S&P Fitch Moody’s S&P Fitch
JPMorgan Chase & Co. P-1 A-1 F1 Aa3 A+ A+JPMorgan Chase Bank, N.A. P-1 A-1+ F1+ Aa2 AA- A+Chase Bank USA, N.A. P-1 A-1+ F1+ Aa2 AA- A+
IssuanceContinued strong foreign investor participation in the global corporate markets allowed JPMorgan Chase to identify attractive opportunities globally tofurther diversify its funding and capital sources. During 2006, JPMorganChase issued approximately $56.7 billion of long-term debt and trust pre-ferred capital debt securities. These issuances were offset partially by $34.3billion of long-term debt and trust preferred capital debt securities thatmatured or were redeemed, and by the Firm’s redemption of $139 million ofpreferred stock. In addition, in 2006 the Firm securitized approximately $16.8billion of residential mortgage loans and $9.7 billion of credit card loans,resulting in pretax gains on securitizations of $85 million and $67 million,respectively. In addition, the Firm securitized approximately $2.4 billion ofautomobile loans resulting in an insignificant gain. For a further discussion ofloan securitizations, see Note 14 on pages 114–118 of this Annual Report.
In connection with the issuance of certain of its trust preferred capital debtsecurities, the Firm has entered into Replacement Capital Covenants (“RCCs”)granting certain rights to the holder of “covered debt,” as defined in theRCCs, that prohibit the repayment, redemption or purchase of the trust pre-ferred capital debt securities except, with limited exceptions, to the extent thatJPMorgan Chase has received specified amounts of proceeds from the sale ofcertain qualifying securities. Currently the Firm’s covered debt is its 5.875%Junior Subordinated Deferrable Interest Debentures, Series O, due 2035. Formore information regarding these covenants, see the Forms 8-K filed by theFirm on August 17, 2006, September 28, 2006 and February 2, 2007.
Cash FlowsCash Flows from Operating ActivitiesFor the years ended December 31, 2006 and 2005, net cash used in operatingactivities was $49.6 billion and $30.2 billion, respectively. Net cash was usedto support the Firm’s lending and capital markets activities, as well as to sup-port loans originated or purchased with an initial intent to sell. JPMorganChase’s operating assets and liabilities vary significantly in the normal course ofbusiness due to the amount and timing of cash flows. Management believescash flows from operations, available cash balances and short- and long-termborrowings will be sufficient to fund the Firm’s operating liquidity needs.
Cash Flows from Investing ActivitiesThe Firm’s investing activities primarily include originating loans to be held tomaturity, other receivables, and the available-for-sale investment portfolio. Forthe year ended December 31, 2006, net cash of $99.6 billion was used ininvesting activities, primarily due to increased loans in the wholesale portfolio,mainly in the IB, reflecting an increase in capital markets activity, as well asorganic growth in CB. On the consumer side, increases in CS loans reflectedstrong organic growth, the acquisitions of private-label credit card portfoliosand the 2006 first-quarter acquisition of Collegiate Funding Services, offsetpartially by credit card securitization activity and a decline in auto loans andleases. Cash also was used to fund the increase in the Treasury investmentsecurities portfolio, primarily in connection with repositioning of the Firm’sportfolio to manage exposure to interest rates.
For the year ended December 31, 2005, net cash of $12.9 billion was used ininvesting activities, primarily attributable to growth in consumer loans, prima-rily home equity and in CS, reflecting growth in new account originations andthe acquisition of the Sears Canada credit card business, offset partially bysecuritization activity and a decline in auto loans reflecting a difficult autolending market. Net cash was generated by the Treasury investment securitiesportfolio primarily from maturities of securities, as purchases and sales ofsecurities essentially offset each other.
Cash Flows from Financing ActivitiesThe Firm’s financing activities primarily include the issuance of debt andreceipt of customer deposits. JPMorgan Chase pays quarterly dividends on itscommon stock and has an ongoing stock repurchase program. In 2006, netcash provided by financing activities was $152.7 billion due to growth indeposits, reflecting the ongoing expansion of the retail branch distributionnetwork and higher wholesale business volumes; and net new issuances ofLong-term debt and trust preferred capital debt securities, offset partially bythe payment of cash dividends and stock repurchases.
In 2005, net cash provided by financing activities was $45.1 billion due togrowth in deposits, reflecting, on the retail side, new account acquisitions andthe ongoing expansion of the branch distribution network, and higher whole-sale business volumes; and net new issuances of Long-term debt and trustpreferred capital debt securities, offset partially by the payment of cash divi-dends and stock repurchases.
On February 14, 2007, S&P raised the senior long-term debt ratings onJPMorgan Chase & Co. and the operating bank subsidiaries to AA- and AA,respectively. Additionally, S&P raised the short-term debt rating of JPMorganChase & Co. to A-1+. Similarly, on February 16, 2007, Fitch raised the seniorlong-term debt rating on JPMorgan Chase & Co. and operating bank sub-sidiaries to AA-. Fitch also raised the short-term debt rating of JPMorgan Chase& Co. to F1+. The cost and availability of unsecured financing are influenced bycredit ratings. A reduction in these ratings could have an adverse affect on theFirm’s access to liquidity sources, increase the cost of funds, trigger additionalcollateral requirements and decrease the number of investors and counterpar-ties willing to lend. Critical factors in maintaining high credit ratings include astable and diverse earnings stream, strong capital ratios, strong credit qualityand risk management controls, diverse funding sources and disciplined liquiditymonitoring procedures.
If the Firm’s ratings were downgraded by one notch, the Firm estimates theincremental cost of funds and the potential loss of funding to be negligible.Additionally, the Firm estimates the additional funding requirements for VIEs and other third-party commitments would not be material. In the current environment, the Firm believes a downgrade is unlikely. For additionalinformation on the impact of a credit ratings downgrade on the fundingrequirements for VIEs, and on derivatives and collateral agreements, seeSpecial-purpose entities on page 59 and Ratings profile of derivative receiv-ables mark-to-market (“MTM”) on page 71, of this Annual Report.
64 JPMorgan Chase & Co. / 2005 Annual Report
CREDIT R ISK MANAGEMENT
Credit risk is the risk of loss from obligor or counterparty default. The Firmprovides credit (for example, through loans, lending-related commitments andderivatives) to customers of all sizes, from large corporate clients to the indi-vidual consumer. The Firm manages the risk/reward relationship of each creditand discourages the retention of assets that do not generate a positive returnabove the cost of risk-adjusted capital. The majority of the Firm’s wholesalesyndicated loan originations (primarily to IB clients) continues to be distributedinto the marketplace, with residual holds by the Firm averaging less than10%. Wholesale loans generated by CB and AM are generally retained on thebalance sheet. With regard to the consumer credit market, the Firm focuses oncreating a portfolio that is diversified from both a product and a geographicperspective. Within the mortgage business, originated loans are retained on thebalance sheet as well as securitized and sold selectively to U.S. governmentagencies and U.S. government-sponsored enterprises; the latter category ofloans is routinely classified as held-for-sale.
Credit risk organizationCredit risk management is overseen by the Chief Risk Officer. The Firm’s creditrisk management governance consists of the following primary functions:
• establishing a comprehensive credit risk policy framework
• calculating the allowance for credit losses and ensuring appropriate credit risk-based capital management
• assigning and managing credit authorities in connection with the approval of all credit exposure
• monitoring and managing credit risk across all portfolio segments
• managing criticized exposures
Risk identificationThe Firm is exposed to credit risk through lending and capital markets activi-ties. Credit risk management works in partnership with the business segmentsin identifying and aggregating exposures across all lines of business.
Risk measurementTo measure credit risk, the Firm employs several methodologies for estimatingthe likelihood of obligor or counterparty default. Losses generated by consumerloans are more predictable than wholesale losses, but are subject to cyclicaland seasonal factors. Although the frequency of loss is higher on consumerloans than on wholesale loans, the severity of loss is typically lower and moremanageable on a portfolio basis. As a result of these differences, methodolo-gies vary depending on certain factors, including type of asset (e.g., consumerinstallment versus wholesale loan), risk measurement parameters (e.g., delin-quency status and credit bureau score versus wholesale risk rating) and riskmanagement and collection processes (e.g., retail collection center versuscentrally managed workout groups). Credit risk measurement is based uponthe amount of exposure should the obligor or the counterparty default, theprobability of default and the loss severity given a default event. Based uponthese factors and related market-based inputs, the Firm estimates both prob-able and unexpected losses for the wholesale and consumer portfolios.Probable losses, reflected in the Provision for credit losses, primarily are basedupon statistical estimates of credit losses over time, anticipated as a result ofobligor or counterparty default. However, probable losses are not the soleindicators of risk. If losses were entirely predictable, the probable loss ratecould be factored into pricing and covered as a normal and recurring cost ofdoing business. Unexpected losses, reflected in the allocation of credit riskcapital, represent the potential volatility of actual losses relative to the proba-ble level of losses. (Refer to Capital management on pages 57–59 of thisAnnual Report for a further discussion of the credit risk capital methodology.)Risk measurement for the wholesale portfolio is assessed primarily on a risk-
rated basis; for the consumer portfolio, it is assessed primarily on a credit-scored basis.
Risk-rated exposure For portfolios that are risk-rated, probable and unexpected loss calculationsare based upon estimates of probability of default and loss given default.Probability of default is the expected default calculated on an obligor basis.Loss given default is an estimate of losses that are based upon collateral andstructural support for each credit facility. Calculations and assumptions arebased upon management information systems and methodologies which areunder continual review. Risk ratings are assigned and reviewed on an ongoingbasis by Credit Risk Management and revised, if needed, to reflect the borrowers’current risk profiles and the related collateral and structural positions.
Credit-scored exposureFor credit-scored portfolios (generally held in RFS and CS), probable loss isbased upon a statistical analysis of inherent losses over discrete periods oftime. Probable losses are estimated using sophisticated portfolio modeling,credit scoring and decision-support tools to project credit risks and establishunderwriting standards. In addition, common measures of credit quality derivedfrom historical loss experience are used to predict consumer losses. Other riskcharacteristics evaluated include recent loss experience in the portfolios, changesin origination sources, portfolio seasoning, loss severity and underlying creditpractices, including charge-off policies. These analyses are applied to theFirm’s current portfolios in order to forecast delinquencies and severity oflosses, which determine the amount of probable losses. These factors andanalyses are updated on a quarterly basis.
Risk monitoringThe Firm has developed policies and practices that are designed to preservethe independence and integrity of decision-making and ensure credit risks areassessed accurately, approved properly, monitored regularly and managedactively at both the transaction and portfolio levels. The policy frameworkestablishes credit approval authorities, concentration limits, risk-ratingmethodologies, portfolio-review parameters and guidelines for managementof distressed exposure. Wholesale credit risk is monitored regularly on bothan aggregate portfolio level and on an individual customer basis. For con-sumer credit risk, the key focus items are trends and concentrations at theportfolio level, where potential problems can be remedied through changes inunderwriting policies and portfolio guidelines. Consumer Credit RiskManagement monitors trends against business expectations and industrybenchmarks. In order to meet credit risk management objectives, the Firmseeks to maintain a risk profile that is diverse in terms of borrower, producttype, industry and geographic concentration. Additional management of theFirm’s exposure is accomplished through loan syndication and participations,loan sales, securitizations, credit derivatives, use of master netting agreementsand collateral and other risk-reduction techniques.
Risk reportingTo enable monitoring of credit risk and decision-making, aggregate creditexposure, credit metric forecasts, hold-limit exceptions and risk profilechanges are reported regularly to senior credit risk management. Detailedportfolio reporting of industry, customer and geographic concentrationsoccurs monthly, and the appropriateness of the allowance for credit losses isreviewed by senior management at least on a quarterly basis. Through therisk reporting and governance structure, credit risk trends and limit exceptionsare provided regularly to, and discussed with, the Operating Committee.
MANAGEMENT’S DISCUSSION AND ANALYSISJPMorgan Chase & Co.
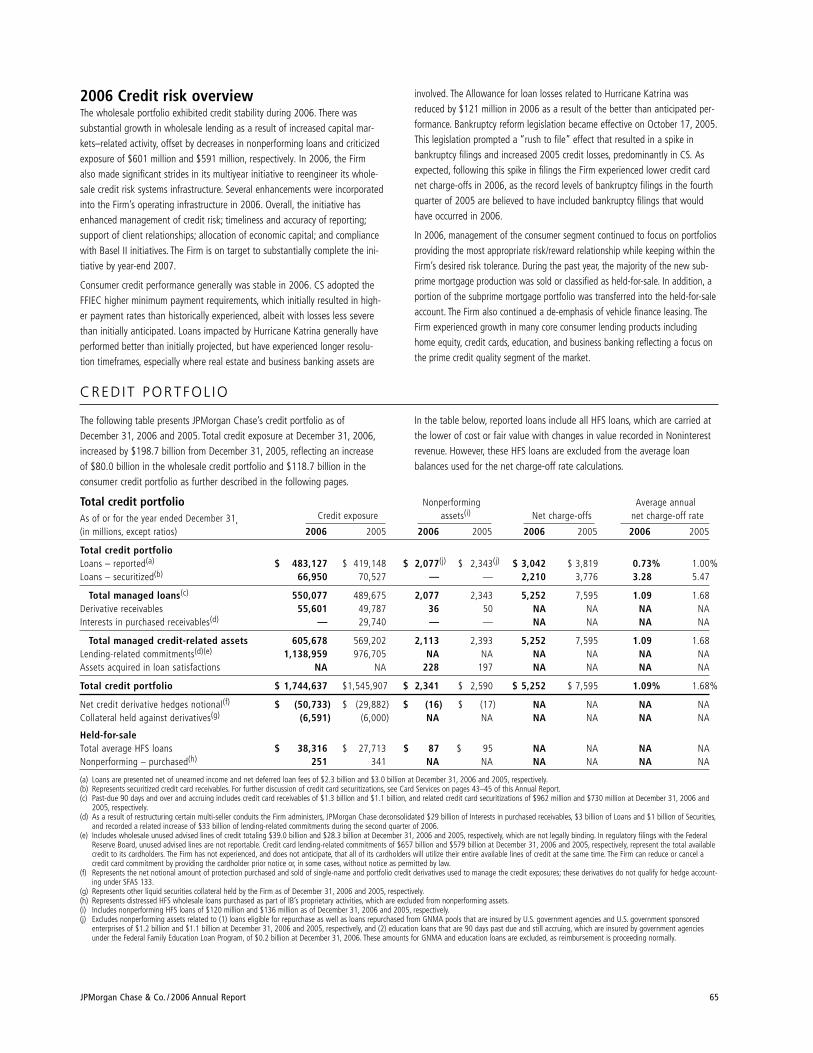
CREDIT PORTFOL IO
JPMorgan Chase & Co. / 2006 Annual Report 65
2006 Credit risk overviewThe wholesale portfolio exhibited credit stability during 2006. There was substantial growth in wholesale lending as a result of increased capital mar-kets–related activity, offset by decreases in nonperforming loans and criticizedexposure of $601 million and $591 million, respectively. In 2006, the Firmalso made significant strides in its multiyear initiative to reengineer its whole-sale credit risk systems infrastructure. Several enhancements were incorporatedinto the Firm’s operating infrastructure in 2006. Overall, the initiative hasenhanced management of credit risk; timeliness and accuracy of reporting;support of client relationships; allocation of economic capital; and compliancewith Basel II initiatives. The Firm is on target to substantially complete the ini-tiative by year-end 2007.
Consumer credit performance generally was stable in 2006. CS adopted theFFIEC higher minimum payment requirements, which initially resulted in high-er payment rates than historically experienced, albeit with losses less severethan initially anticipated. Loans impacted by Hurricane Katrina generally haveperformed better than initially projected, but have experienced longer resolu-tion timeframes, especially where real estate and business banking assets are
involved. The Allowance for loan losses related to Hurricane Katrina wasreduced by $121 million in 2006 as a result of the better than anticipated per-formance. Bankruptcy reform legislation became effective on October 17, 2005.This legislation prompted a “rush to file” effect that resulted in a spike inbankruptcy filings and increased 2005 credit losses, predominantly in CS. Asexpected, following this spike in filings the Firm experienced lower credit cardnet charge-offs in 2006, as the record levels of bankruptcy filings in the fourthquarter of 2005 are believed to have included bankruptcy filings that wouldhave occurred in 2006.
In 2006, management of the consumer segment continued to focus on portfoliosproviding the most appropriate risk/reward relationship while keeping within theFirm’s desired risk tolerance. During the past year, the majority of the new sub-prime mortgage production was sold or classified as held-for-sale. In addition, aportion of the subprime mortgage portfolio was transferred into the held-for-saleaccount. The Firm also continued a de-emphasis of vehicle finance leasing. TheFirm experienced growth in many core consumer lending products includinghome equity, credit cards, education, and business banking reflecting a focus onthe prime credit quality segment of the market.
Total credit portfolio Nonperforming Average annual
As of or for the year ended December 31, Credit exposure assets(i) Net charge-offs net charge-off rate
(in millions, except ratios) 2006 2005 2006 2005 2006 2005 2006 2005
Total credit portfolioLoans – reported(a) $ 483,127 $ 419,148 $ 2,077(j) $ 2,343(j) $ 3,042 $ 3,819 0.73% 1.00%Loans – securitized(b) 66,950 70,527 — — 2,210 3,776 3.28 5.47
Total managed loans(c) 550,077 489,675 2,077 2,343 5,252 7,595 1.09 1.68Derivative receivables 55,601 49,787 36 50 NA NA NA NAInterests in purchased receivables(d) — 29,740 — — NA NA NA NA
Total managed credit-related assets 605,678 569,202 2,113 2,393 5,252 7,595 1.09 1.68Lending-related commitments(d)(e) 1,138,959 976,705 NA NA NA NA NA NAAssets acquired in loan satisfactions NA NA 228 197 NA NA NA NA
Total credit portfolio $ 1,744,637 $1,545,907 $ 2,341 $ 2,590 $ 5,252 $ 7,595 1.09% 1.68%
Net credit derivative hedges notional(f) $ (50,733) $ (29,882) $ (16) $ (17) NA NA NA NACollateral held against derivatives(g) (6,591) (6,000) NA NA NA NA NA NA
Held-for-saleTotal average HFS loans $ 38,316 $ 27,713 $ 87 $ 95 NA NA NA NANonperforming – purchased(h) 251 341 NA NA NA NA NA NA
(a) Loans are presented net of unearned income and net deferred loan fees of $2.3 billion and $3.0 billion at December 31, 2006 and 2005, respectively.(b) Represents securitized credit card receivables. For further discussion of credit card securitizations, see Card Services on pages 43–45 of this Annual Report.(c) Past-due 90 days and over and accruing includes credit card receivables of $1.3 billion and $1.1 billion, and related credit card securitizations of $962 million and $730 million at December 31, 2006 and
2005, respectively.(d) As a result of restructuring certain multi-seller conduits the Firm administers, JPMorgan Chase deconsolidated $29 billion of Interests in purchased receivables, $3 billion of Loans and $1 billion of Securities,
and recorded a related increase of $33 billion of lending-related commitments during the second quarter of 2006.(e) Includes wholesale unused advised lines of credit totaling $39.0 billion and $28.3 billion at December 31, 2006 and 2005, respectively, which are not legally binding. In regulatory filings with the Federal
Reserve Board, unused advised lines are not reportable. Credit card lending-related commitments of $657 billion and $579 billion at December 31, 2006 and 2005, respectively, represent the total availablecredit to its cardholders. The Firm has not experienced, and does not anticipate, that all of its cardholders will utilize their entire available lines of credit at the same time. The Firm can reduce or cancel acredit card commitment by providing the cardholder prior notice or, in some cases, without notice as permitted by law.
(f) Represents the net notional amount of protection purchased and sold of single-name and portfolio credit derivatives used to manage the credit exposures; these derivatives do not qualify for hedge account-ing under SFAS 133.
(g) Represents other liquid securities collateral held by the Firm as of December 31, 2006 and 2005, respectively.(h) Represents distressed HFS wholesale loans purchased as part of IB’s proprietary activities, which are excluded from nonperforming assets.(i) Includes nonperforming HFS loans of $120 million and $136 million as of December 31, 2006 and 2005, respectively.(j) Excludes nonperforming assets related to (1) loans eligible for repurchase as well as loans repurchased from GNMA pools that are insured by U.S. government agencies and U.S. government sponsored
enterprises of $1.2 billion and $1.1 billion at December 31, 2006 and 2005, respectively, and (2) education loans that are 90 days past due and still accruing, which are insured by government agenciesunder the Federal Family Education Loan Program, of $0.2 billion at December 31, 2006. These amounts for GNMA and education loans are excluded, as reimbursement is proceeding normally.
The following table presents JPMorgan Chase’s credit portfolio as ofDecember 31, 2006 and 2005. Total credit exposure at December 31, 2006,increased by $198.7 billion from December 31, 2005, reflecting an increaseof $80.0 billion in the wholesale credit portfolio and $118.7 billion in theconsumer credit portfolio as further described in the following pages.
In the table below, reported loans include all HFS loans, which are carried atthe lower of cost or fair value with changes in value recorded in Noninterestrevenue. However, these HFS loans are excluded from the average loan balances used for the net charge-off rate calculations.
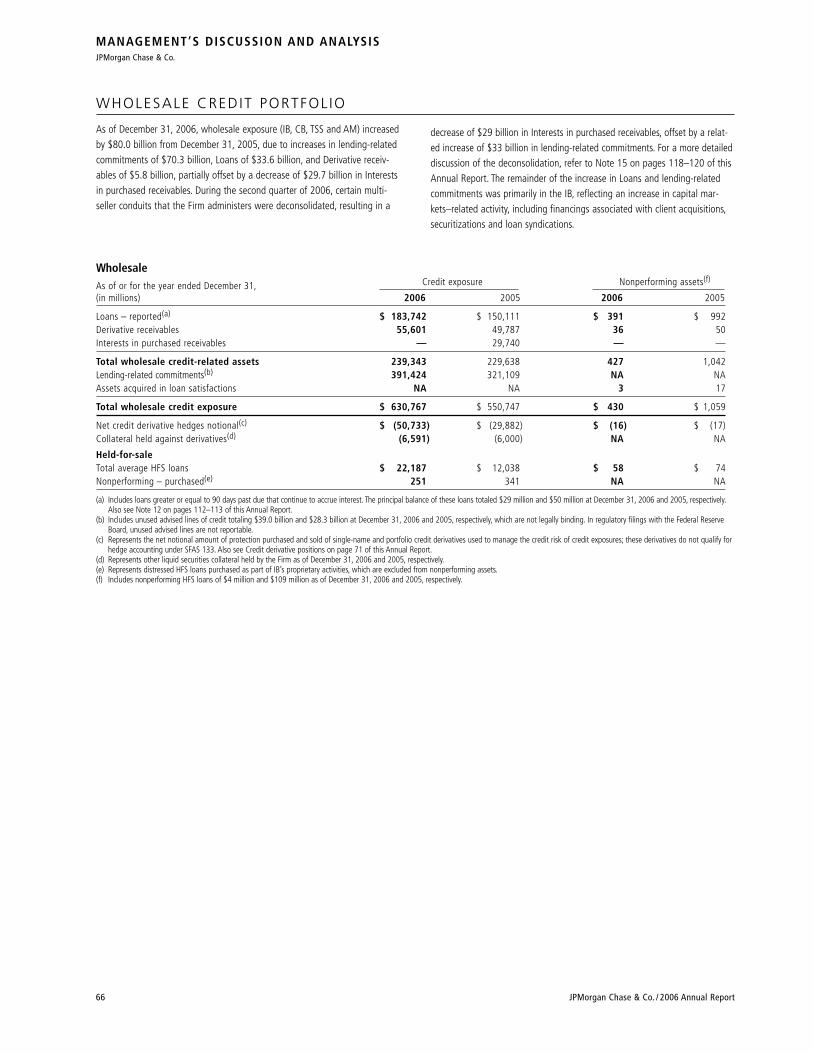
WHOLESALE CREDIT PORTFOL IO
As of December 31, 2006, wholesale exposure (IB, CB, TSS and AM) increasedby $80.0 billion from December 31, 2005, due to increases in lending-relatedcommitments of $70.3 billion, Loans of $33.6 billion, and Derivative receiv-ables of $5.8 billion, partially offset by a decrease of $29.7 billion in Interestsin purchased receivables. During the second quarter of 2006, certain multi-seller conduits that the Firm administers were deconsolidated, resulting in a
WholesaleAs of or for the year ended December 31, Credit exposure Nonperforming assets(f)
(in millions) 2006 2005 2006 2005
Loans – reported(a) $ 183,742 $ 150,111 $ 391 $ 992Derivative receivables 55,601 49,787 36 50Interests in purchased receivables — 29,740 — —
Total wholesale credit-related assets 239,343 229,638 427 1,042Lending-related commitments(b) 391,424 321,109 NA NAAssets acquired in loan satisfactions NA NA 3 17
Total wholesale credit exposure $ 630,767 $ 550,747 $ 430 $ 1,059
Net credit derivative hedges notional(c) $ (50,733) $ (29,882) $ (16) $ (17)Collateral held against derivatives(d) (6,591) (6,000) NA NA
Held-for-saleTotal average HFS loans $ 22,187 $ 12,038 $ 58 $ 74Nonperforming – purchased(e) 251 341 NA NA
(a) Includes loans greater or equal to 90 days past due that continue to accrue interest. The principal balance of these loans totaled $29 million and $50 million at December 31, 2006 and 2005, respectively.Also see Note 12 on pages 112–113 of this Annual Report.
(b) Includes unused advised lines of credit totaling $39.0 billion and $28.3 billion at December 31, 2006 and 2005, respectively, which are not legally binding. In regulatory filings with the Federal ReserveBoard, unused advised lines are not reportable.
(c) Represents the net notional amount of protection purchased and sold of single-name and portfolio credit derivatives used to manage the credit risk of credit exposures; these derivatives do not qualify forhedge accounting under SFAS 133. Also see Credit derivative positions on page 71 of this Annual Report.
(d) Represents other liquid securities collateral held by the Firm as of December 31, 2006 and 2005, respectively.(e) Represents distressed HFS loans purchased as part of IB’s proprietary activities, which are excluded from nonperforming assets.(f) Includes nonperforming HFS loans of $4 million and $109 million as of December 31, 2006 and 2005, respectively.
MANAGEMENT’S DISCUSSION AND ANALYSISJPMorgan Chase & Co.
66 JPMorgan Chase & Co. / 2006 Annual Report
decrease of $29 billion in Interests in purchased receivables, offset by a relat-ed increase of $33 billion in lending-related commitments. For a more detaileddiscussion of the deconsolidation, refer to Note 15 on pages 118–120 of thisAnnual Report. The remainder of the increase in Loans and lending-relatedcommitments was primarily in the IB, reflecting an increase in capital mar-kets–related activity, including financings associated with client acquisitions,securitizations and loan syndications.
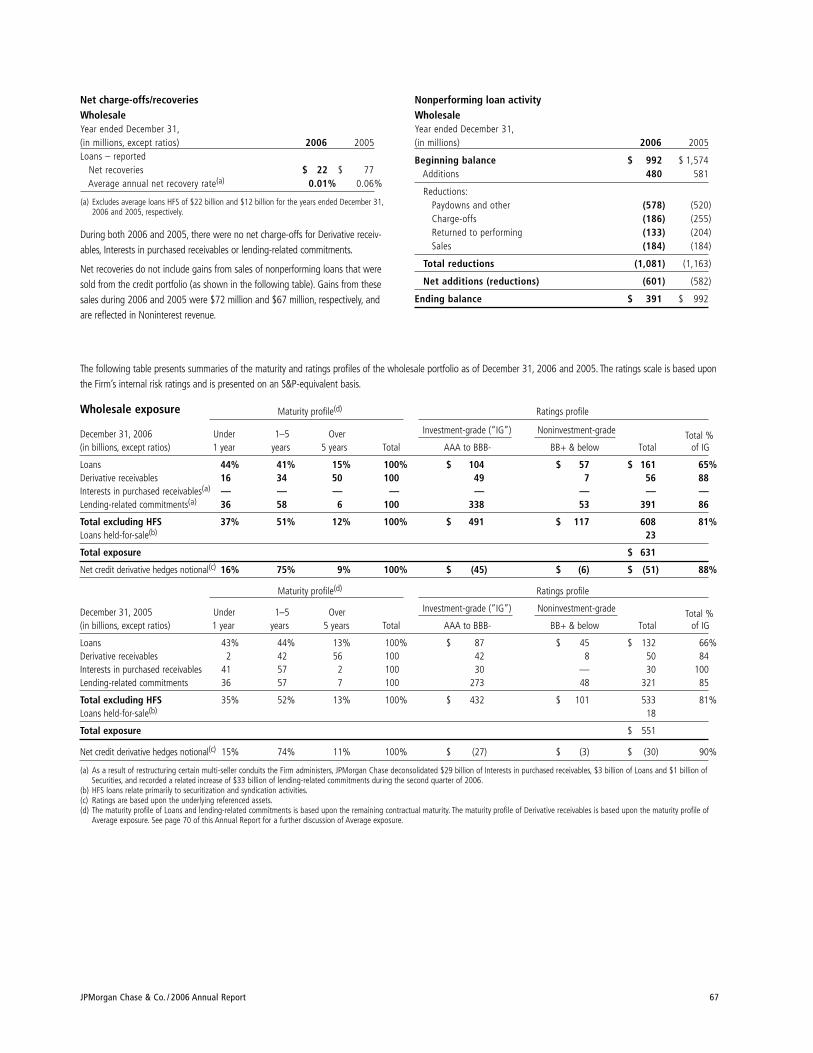
JPMorgan Chase & Co. / 2006 Annual Report 67
Net charge-offs/recoveries WholesaleYear ended December 31,(in millions, except ratios) 2006 2005Loans – reported
Net recoveries $ 22 $ 77Average annual net recovery rate(a) 0.01% 0.06%
(a) Excludes average loans HFS of $22 billion and $12 billion for the years ended December 31,2006 and 2005, respectively.
During both 2006 and 2005, there were no net charge-offs for Derivative receiv-ables, Interests in purchased receivables or lending-related commitments.
Net recoveries do not include gains from sales of nonperforming loans that weresold from the credit portfolio (as shown in the following table). Gains from thesesales during 2006 and 2005 were $72 million and $67 million, respectively, andare reflected in Noninterest revenue.
The following table presents summaries of the maturity and ratings profiles of the wholesale portfolio as of December 31, 2006 and 2005. The ratings scale is based uponthe Firm’s internal risk ratings and is presented on an S&P-equivalent basis.
Wholesale exposure Maturity profile(d) Ratings profile
December 31, 2006 Under 1–5 Over Investment-grade (“IG”) Noninvestment-grade Total %(in billions, except ratios) 1 year years 5 years Total AAA to BBB- BB+ & below Total of IG
Loans 44% 41% 15% 100% $ 104 $ 57 $ 161 65%Derivative receivables 16 34 50 100 49 7 56 88Interests in purchased receivables(a) — — — — — — — —Lending-related commitments(a) 36 58 6 100 338 53 391 86
Total excluding HFS 37% 51% 12% 100% $ 491 $ 117 608 81%Loans held-for-sale(b) 23
Total exposure $ 631
Net credit derivative hedges notional(c) 16% 75% 9% 100% $ (45) $ (6) $ (51) 88%
Maturity profile(d) Ratings profile
December 31, 2005 Under 1–5 Over Investment-grade (“IG”) Noninvestment-grade Total %(in billions, except ratios) 1 year years 5 years Total AAA to BBB- BB+ & below Total of IG
Loans 43% 44% 13% 100% $ 87 $ 45 $ 132 66%Derivative receivables 2 42 56 100 42 8 50 84Interests in purchased receivables 41 57 2 100 30 — 30 100Lending-related commitments 36 57 7 100 273 48 321 85
Total excluding HFS 35% 52% 13% 100% $ 432 $ 101 533 81%Loans held-for-sale(b) 18
Total exposure $ 551
Net credit derivative hedges notional(c) 15% 74% 11% 100% $ (27) $ (3) $ (30) 90%
(a) As a result of restructuring certain multi-seller conduits the Firm administers, JPMorgan Chase deconsolidated $29 billion of Interests in purchased receivables, $3 billion of Loans and $1 billion ofSecurities, and recorded a related increase of $33 billion of lending-related commitments during the second quarter of 2006.
(b) HFS loans relate primarily to securitization and syndication activities.(c) Ratings are based upon the underlying referenced assets.(d) The maturity profile of Loans and lending-related commitments is based upon the remaining contractual maturity. The maturity profile of Derivative receivables is based upon the maturity profile of
Average exposure. See page 70 of this Annual Report for a further discussion of Average exposure.
Nonperforming loan activityWholesaleYear ended December 31,(in millions) 2006 2005
Beginning balance $ 992 $ 1,574Additions 480 581
Reductions:Paydowns and other (578) (520)Charge-offs (186) (255)Returned to performing (133) (204)Sales (184) (184)
Total reductions (1,081) (1,163)
Net additions (reductions) (601) (582)
Ending balance $ 391 $ 992
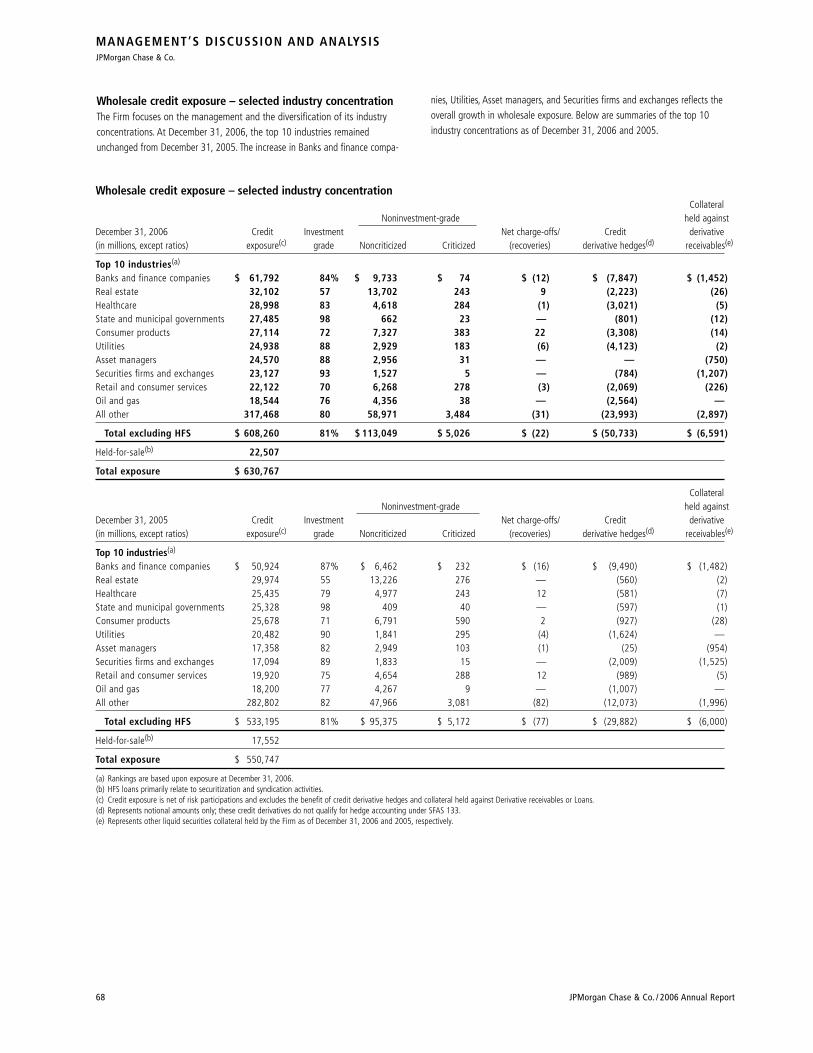
MANAGEMENT’S DISCUSSION AND ANALYSISJPMorgan Chase & Co.
68 JPMorgan Chase & Co. / 2006 Annual Report
Wholesale credit exposure – selected industry concentrationThe Firm focuses on the management and the diversification of its industryconcentrations. At December 31, 2006, the top 10 industries remainedunchanged from December 31, 2005. The increase in Banks and finance compa-
Wholesale credit exposure – selected industry concentrationCollateral
Noninvestment-grade held againstDecember 31, 2006 Credit Investment Net charge-offs/ Credit derivative(in millions, except ratios) exposure(c) grade Noncriticized Criticized (recoveries) derivative hedges(d) receivables(e)
Top 10 industries(a)
Banks and finance companies $ 61,792 84% $ 9,733 $ 74 $ (12) $ (7,847) $ (1,452)Real estate 32,102 57 13,702 243 9 (2,223) (26)Healthcare 28,998 83 4,618 284 (1) (3,021) (5)State and municipal governments 27,485 98 662 23 — (801) (12)Consumer products 27,114 72 7,327 383 22 (3,308) (14)Utilities 24,938 88 2,929 183 (6) (4,123) (2)Asset managers 24,570 88 2,956 31 — — (750)Securities firms and exchanges 23,127 93 1,527 5 — (784) (1,207)Retail and consumer services 22,122 70 6,268 278 (3) (2,069) (226)Oil and gas 18,544 76 4,356 38 — (2,564) —All other 317,468 80 58,971 3,484 (31) (23,993) (2,897)
Total excluding HFS $ 608,260 81% $ 113,049 $ 5,026 $ (22) $ (50,733) $ (6,591)
Held-for-sale(b) 22,507
Total exposure $ 630,767
CollateralNoninvestment-grade held against
December 31, 2005 Credit Investment Net charge-offs/ Credit derivative(in millions, except ratios) exposure(c) grade Noncriticized Criticized (recoveries) derivative hedges(d) receivables(e)
Top 10 industries(a)
Banks and finance companies $ 50,924 87% $ 6,462 $ 232 $ (16) $ (9,490) $ (1,482)Real estate 29,974 55 13,226 276 — (560) (2)Healthcare 25,435 79 4,977 243 12 (581) (7)State and municipal governments 25,328 98 409 40 — (597) (1)Consumer products 25,678 71 6,791 590 2 (927) (28)Utilities 20,482 90 1,841 295 (4) (1,624) —Asset managers 17,358 82 2,949 103 (1) (25) (954)Securities firms and exchanges 17,094 89 1,833 15 — (2,009) (1,525)Retail and consumer services 19,920 75 4,654 288 12 (989) (5)Oil and gas 18,200 77 4,267 9 — (1,007) —All other 282,802 82 47,966 3,081 (82) (12,073) (1,996)
Total excluding HFS $ 533,195 81% $ 95,375 $ 5,172 $ (77) $ (29,882) $ (6,000)
Held-for-sale(b) 17,552
Total exposure $ 550,747
(a) Rankings are based upon exposure at December 31, 2006.(b) HFS loans primarily relate to securitization and syndication activities.(c) Credit exposure is net of risk participations and excludes the benefit of credit derivative hedges and collateral held against Derivative receivables or Loans.(d) Represents notional amounts only; these credit derivatives do not qualify for hedge accounting under SFAS 133.(e) Represents other liquid securities collateral held by the Firm as of December 31, 2006 and 2005, respectively.
nies, Utilities, Asset managers, and Securities firms and exchanges reflects theoverall growth in wholesale exposure. Below are summaries of the top 10industry concentrations as of December 31, 2006 and 2005.
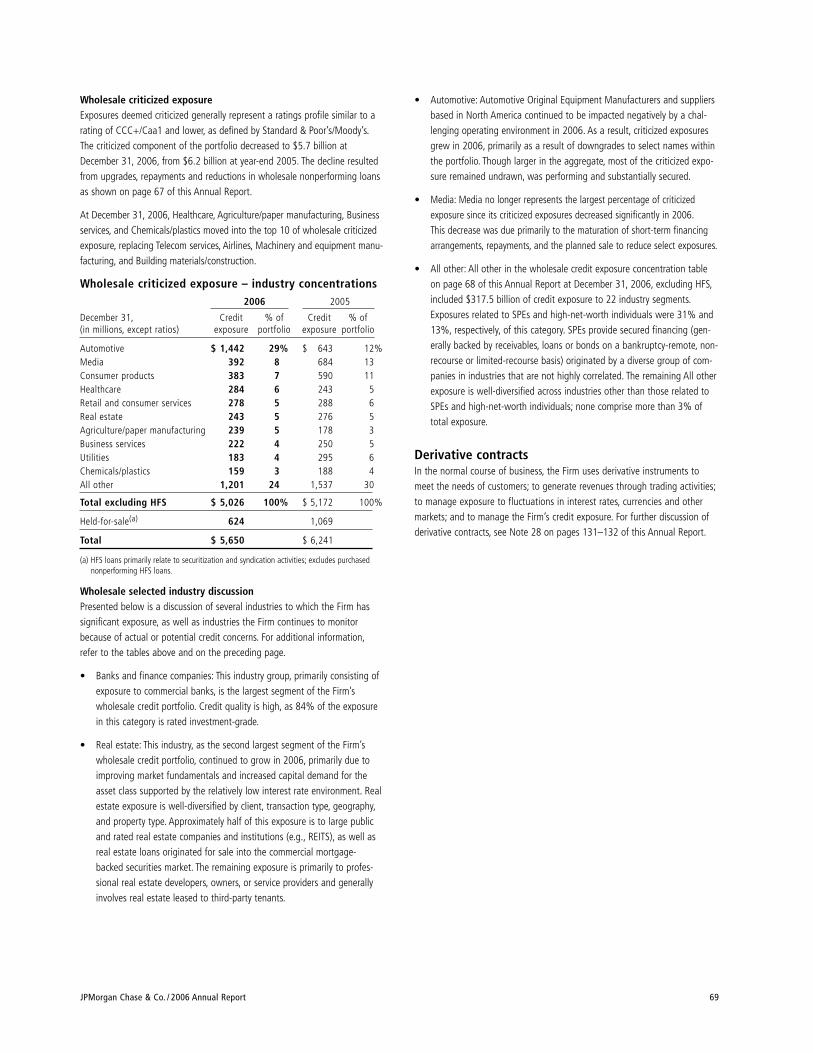
JPMorgan Chase & Co. / 2006 Annual Report 69
• Automotive: Automotive Original Equipment Manufacturers and suppliersbased in North America continued to be impacted negatively by a chal-lenging operating environment in 2006. As a result, criticized exposuresgrew in 2006, primarily as a result of downgrades to select names withinthe portfolio. Though larger in the aggregate, most of the criticized expo-sure remained undrawn, was performing and substantially secured.
• Media: Media no longer represents the largest percentage of criticizedexposure since its criticized exposures decreased significantly in 2006.This decrease was due primarily to the maturation of short-term financingarrangements, repayments, and the planned sale to reduce select exposures.
• All other: All other in the wholesale credit exposure concentration tableon page 68 of this Annual Report at December 31, 2006, excluding HFS,included $317.5 billion of credit exposure to 22 industry segments.Exposures related to SPEs and high-net-worth individuals were 31% and13%, respectively, of this category. SPEs provide secured financing (gen-erally backed by receivables, loans or bonds on a bankruptcy-remote, non-recourse or limited-recourse basis) originated by a diverse group of com-panies in industries that are not highly correlated. The remaining All otherexposure is well-diversified across industries other than those related toSPEs and high-net-worth individuals; none comprise more than 3% oftotal exposure.
Derivative contractsIn the normal course of business, the Firm uses derivative instruments tomeet the needs of customers; to generate revenues through trading activities;to manage exposure to fluctuations in interest rates, currencies and othermarkets; and to manage the Firm’s credit exposure. For further discussion ofderivative contracts, see Note 28 on pages 131–132 of this Annual Report.
Wholesale criticized exposureExposures deemed criticized generally represent a ratings profile similar to arating of CCC+/Caa1 and lower, as defined by Standard & Poor’s/Moody’s.The criticized component of the portfolio decreased to $5.7 billion atDecember 31, 2006, from $6.2 billion at year-end 2005. The decline resultedfrom upgrades, repayments and reductions in wholesale nonperforming loansas shown on page 67 of this Annual Report.
At December 31, 2006, Healthcare, Agriculture/paper manufacturing, Businessservices, and Chemicals/plastics moved into the top 10 of wholesale criticizedexposure, replacing Telecom services, Airlines, Machinery and equipment manu-facturing, and Building materials/construction.
Wholesale criticized exposure – industry concentrations2006 2005
December 31, Credit % of Credit % of(in millions, except ratios) exposure portfolio exposure portfolio
Automotive $ 1,442 29% $ 643 12%Media 392 8 684 13Consumer products 383 7 590 11Healthcare 284 6 243 5Retail and consumer services 278 5 288 6Real estate 243 5 276 5Agriculture/paper manufacturing 239 5 178 3Business services 222 4 250 5Utilities 183 4 295 6Chemicals/plastics 159 3 188 4All other 1,201 24 1,537 30
Total excluding HFS $ 5,026 100% $ 5,172 100%
Held-for-sale(a) 624 1,069
Total $ 5,650 $ 6,241
(a) HFS loans primarily relate to securitization and syndication activities; excludes purchasednonperforming HFS loans.
Wholesale selected industry discussionPresented below is a discussion of several industries to which the Firm hassignificant exposure, as well as industries the Firm continues to monitorbecause of actual or potential credit concerns. For additional information,refer to the tables above and on the preceding page.
• Banks and finance companies: This industry group, primarily consisting ofexposure to commercial banks, is the largest segment of the Firm’swholesale credit portfolio. Credit quality is high, as 84% of the exposurein this category is rated investment-grade.
• Real estate: This industry, as the second largest segment of the Firm’swholesale credit portfolio, continued to grow in 2006, primarily due toimproving market fundamentals and increased capital demand for theasset class supported by the relatively low interest rate environment. Realestate exposure is well-diversified by client, transaction type, geography,and property type. Approximately half of this exposure is to large publicand rated real estate companies and institutions (e.g., REITS), as well asreal estate loans originated for sale into the commercial mortgage-backed securities market. The remaining exposure is primarily to profes-sional real estate developers, owners, or service providers and generallyinvolves real estate leased to third-party tenants.
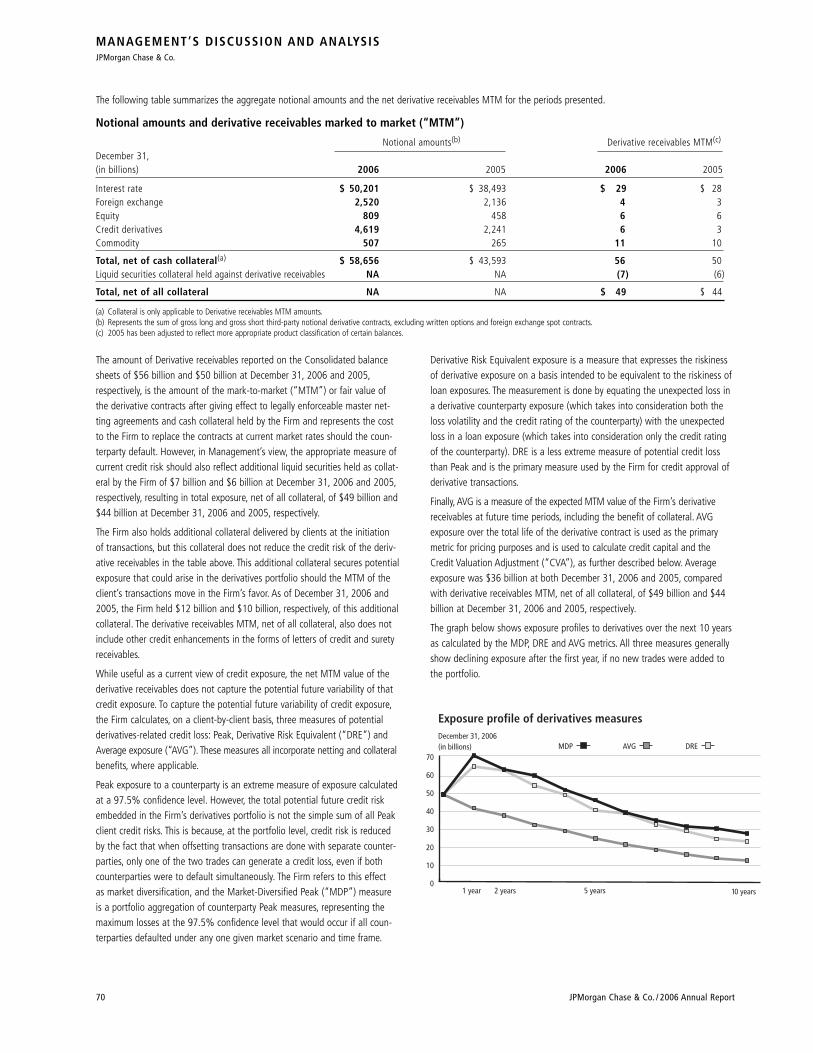
MANAGEMENT’S DISCUSSION AND ANALYSISJPMorgan Chase & Co.
70 JPMorgan Chase & Co. / 2006 Annual Report
The following table summarizes the aggregate notional amounts and the net derivative receivables MTM for the periods presented.
Notional amounts and derivative receivables marked to market (“MTM”)
Notional amounts(b) Derivative receivables MTM(c)
December 31,(in billions) 2006 2005 2006 2005
Interest rate $ 50,201 $ 38,493 $ 29 $ 28Foreign exchange 2,520 2,136 4 3Equity 809 458 6 6Credit derivatives 4,619 2,241 6 3Commodity 507 265 11 10
Total, net of cash collateral(a) $ 58,656 $ 43,593 56 50Liquid securities collateral held against derivative receivables NA NA (7) (6)
Total, net of all collateral NA NA $ 49 $ 44
(a) Collateral is only applicable to Derivative receivables MTM amounts.(b) Represents the sum of gross long and gross short third-party notional derivative contracts, excluding written options and foreign exchange spot contracts.(c) 2005 has been adjusted to reflect more appropriate product classification of certain balances.
0
10
20
30
40
50
60
70
Exposure profile of derivatives measuresDecember 31, 2006(in billions) MDP AVG DRE
1 year 2 years 5 years 10 years
The amount of Derivative receivables reported on the Consolidated balancesheets of $56 billion and $50 billion at December 31, 2006 and 2005,respectively, is the amount of the mark-to-market (“MTM”) or fair value ofthe derivative contracts after giving effect to legally enforceable master net-ting agreements and cash collateral held by the Firm and represents the costto the Firm to replace the contracts at current market rates should the coun-terparty default. However, in Management’s view, the appropriate measure ofcurrent credit risk should also reflect additional liquid securities held as collat-eral by the Firm of $7 billion and $6 billion at December 31, 2006 and 2005,respectively, resulting in total exposure, net of all collateral, of $49 billion and$44 billion at December 31, 2006 and 2005, respectively.
The Firm also holds additional collateral delivered by clients at the initiationof transactions, but this collateral does not reduce the credit risk of the deriv-ative receivables in the table above. This additional collateral secures potentialexposure that could arise in the derivatives portfolio should the MTM of theclient’s transactions move in the Firm’s favor. As of December 31, 2006 and2005, the Firm held $12 billion and $10 billion, respectively, of this additionalcollateral. The derivative receivables MTM, net of all collateral, also does notinclude other credit enhancements in the forms of letters of credit and suretyreceivables.
While useful as a current view of credit exposure, the net MTM value of thederivative receivables does not capture the potential future variability of thatcredit exposure. To capture the potential future variability of credit exposure,the Firm calculates, on a client-by-client basis, three measures of potentialderivatives-related credit loss: Peak, Derivative Risk Equivalent (“DRE”) andAverage exposure (“AVG”). These measures all incorporate netting and collateralbenefits, where applicable.
Peak exposure to a counterparty is an extreme measure of exposure calculatedat a 97.5% confidence level. However, the total potential future credit riskembedded in the Firm’s derivatives portfolio is not the simple sum of all Peakclient credit risks. This is because, at the portfolio level, credit risk is reducedby the fact that when offsetting transactions are done with separate counter-parties, only one of the two trades can generate a credit loss, even if bothcounterparties were to default simultaneously. The Firm refers to this effect as market diversification, and the Market-Diversified Peak (“MDP”) measureis a portfolio aggregation of counterparty Peak measures, representing themaximum losses at the 97.5% confidence level that would occur if all coun-terparties defaulted under any one given market scenario and time frame.
Derivative Risk Equivalent exposure is a measure that expresses the riskinessof derivative exposure on a basis intended to be equivalent to the riskiness ofloan exposures. The measurement is done by equating the unexpected loss ina derivative counterparty exposure (which takes into consideration both theloss volatility and the credit rating of the counterparty) with the unexpectedloss in a loan exposure (which takes into consideration only the credit ratingof the counterparty). DRE is a less extreme measure of potential credit lossthan Peak and is the primary measure used by the Firm for credit approval ofderivative transactions.
Finally, AVG is a measure of the expected MTM value of the Firm’s derivativereceivables at future time periods, including the benefit of collateral. AVGexposure over the total life of the derivative contract is used as the primarymetric for pricing purposes and is used to calculate credit capital and theCredit Valuation Adjustment (“CVA”), as further described below. Averageexposure was $36 billion at both December 31, 2006 and 2005, comparedwith derivative receivables MTM, net of all collateral, of $49 billion and $44billion at December 31, 2006 and 2005, respectively.
The graph below shows exposure profiles to derivatives over the next 10 yearsas calculated by the MDP, DRE and AVG metrics. All three measures generallyshow declining exposure after the first year, if no new trades were added tothe portfolio.
JPMorgan Chase & Co. / 2006 Annual Report 71
The Firm actively pursues the use of collateral agreements to mitigatecounterparty credit risk in derivatives. The percentage of the Firm’s derivativestransactions subject to collateral agreements decreased slightly, to 80% as of December 31, 2006, from 81% at December 31, 2005.
The Firm posted $27 billion of collateral as of both December 31, 2006 and2005. Certain derivative and collateral agreements include provisions thatrequire the counterparty and/or the Firm, upon specified downgrades in theirrespective credit ratings, to post collateral for the benefit of the other party.As of December 31, 2006, the impact of a single-notch ratings downgrade toJPMorgan Chase Bank, N.A., from its rating of AA- to A+ at December 31,2006, would have required $1.1 billion of additional collateral to be posted bythe Firm; the impact of a six-notch ratings downgrade (from AA- to BBB-)would have required $3.1 billion of additional collateral. Certain derivative con-tracts also provide for termination of the contract, generally upon a downgradeof either the Firm or the counterparty, at the then-existing MTM value of thederivative contracts.
Credit derivatives The following table presents the Firm’s notional amounts of credit derivativesprotection purchased and sold by the respective businesses as of December 31,2006 and 2005:
Credit derivatives positions
Notional amount
Credit portfolio Dealer/client
December 31, Protection Protection Protection Protection(in billions) purchased sold purchased sold Total
2006 $ 52(a) $ 1 $ 2,277 $ 2,289 $ 4,6192005 31 1 1,096 1,113 2,241
(a) Includes $23 billion which represents the notional amount for structured portfolio protection;the Firm retains the first risk of loss on this portfolio.
In managing wholesale credit exposure, the Firm purchases single-name andportfolio credit derivatives; this activity does not reduce the reported level of assets on the balance sheet or the level of reported off–balance sheet commitments. The Firm also diversifies exposures by providing (i.e., selling)credit protection, which increases exposure to industries or clients where theFirm has little or no client-related exposure. This activity is not material to theFirm’s overall credit exposure.
The following table summarizes the ratings profile of the Firm’s Derivative receivables MTM, net of other liquid securities collateral, for the dates indicated:
Ratings profile of derivative receivables MTM
Rating equivalent 2006 2005
December 31, Exposure net of % of exposure net Exposure net of % of exposure net (in millions, except ratios) all collateral of all collateral all collateral of all collateral
AAA to AA-(a) $ 28,150 58% $ 20,735 48%A+ to A- 7,588 15 8,074 18BBB+ to BBB- 8,044 16 8,243 19BB+ to B- 5,150 11 6,580 15CCC+ and below 78 — 155 —
Total $ 49,010 100% $ 43,787 100%
(a) The increase in AAA to AA- was due primarily to exchange-traded commodity activities.
The MTM value of the Firm’s derivative receivables incorporates an adjustment,the CVA, to reflect the credit quality of counterparties. The CVA is based upon the Firm’s AVG to a counterparty and the counterparty’s credit spread inthe credit derivatives market. The primary components of changes in CVA arecredit spreads, new deal activity or unwinds, and changes in the underlying
market environment. The Firm believes that active risk management is essen-tial to controlling the dynamic credit risk in the derivatives portfolio. The Firmrisk manages exposure to changes in CVA by entering into credit derivativetransactions, as well as interest rate, foreign exchange, equity and commodityderivative transactions.

MANAGEMENT’S DISCUSSION AND ANALYSISJPMorgan Chase & Co.
72 JPMorgan Chase & Co. / 2006 Annual Report
JPMorgan Chase has limited counterparty exposure as a result of credit derivatives transactions. Of the $55.6 billion of total Derivative receivablesMTM at December 31, 2006, approximately $5.7 billion, or 10%, was associ-ated with credit derivatives, before the benefit of liquid securities collateral.
Dealer/clientAt December 31, 2006, the total notional amount of protection purchased andsold in the dealer/client business increased $2.4 trillion from year-end 2005 asa result of increased trade volume in the market. This business has a mismatchbetween the total notional amounts of protection purchased and sold. However,in the Firm’s view, the risk positions are largely matched when securities usedto risk-manage certain derivative positions are taken into consideration andthe notional amounts are adjusted to a duration-based equivalent basis or toreflect different degrees of subordination in tranched structures.
Credit portfolio management activities
Use of single-name and portfolio credit derivativesDecember 31, Notional amount of protection purchased(in millions) 2006 2005
Credit derivatives used to manage:Loans and lending-related commitments $ 40,755 $ 18,926Derivative receivables 11,229 12,088
Total $ 51,984(a) $ 31,014
(a) Includes $23 billion which represents the notional amount for structured portfolio protection;the Firm retains the first loss on this portfolio.
The credit derivatives used by JPMorgan Chase for credit portfolio manage-ment activities do not qualify for hedge accounting under SFAS 133, andtherefore, effectiveness testing under SFAS 133 is not performed. These deriv-atives are reported at fair value, with gains and losses recognized in Principaltransactions. The MTM value incorporates both the cost of credit derivativepremiums and changes in value due to movement in spreads and creditevents; in contrast, the loans and lending-related commitments being risk-managed are accounted for on an accrual basis. Loan interest and fees aregenerally recognized in Net interest income, and impairment is recognized inthe Provision for credit losses. This asymmetry in accounting treatment,between loans and lending-related commitments and the credit derivatives uti-lized in portfolio management activities, causes earnings volatility that is notrepresentative, in the Firm’s view, of the true changes in value of the Firm’soverall credit exposure. The MTM related to the Firm’s credit derivatives used formanaging credit exposure, as well as the MTM related to the CVA, whichreflects the credit quality of derivatives counterparty exposure, are included inthe table below. These results can vary from year to year due to market condi-tions that impact specific positions in the portfolio.
Year ended December 31,(in millions) 2006 2005 2004(c)
Hedges of lending-related commitments(a) $ (246) $ 24 $ (234)CVA and hedges of CVA(a) 133 84 188
Net gains (losses)(b) $ (113) $ 108 $ (46)
(a) These hedges do not qualify for hedge accounting under SFAS 133.(b) Excludes gains of $56 million, $8 million and $52 million for the years ended December 31,
2006, 2005 and 2004, respectively, of other Principal transactions revenues that are notassociated with hedging activities.
(c) 2004 results include six months of the combined Firm’s results and six months of heritageJPMorgan Chase results.
The Firm also actively manages wholesale credit exposure through loan and commitment sales. During 2006, 2005 and 2004, the Firm sold $3.1 bil-lion, $4.0 billion and $5.9 billion of loans and commitments, respectively, rec-ognizing gains (losses) of $73 million, $76 million and ($8) million in 2006,2005 and 2004, respectively. The gains include gains on sales of nonperform-ing loans as discussed on page 67 of this Annual Report. These activities arenot related to the Firm’s securitization activities, which are undertaken for liq-uidity and balance sheet management purposes. For a further discussion ofsecuritization activity, see Liquidity Risk Management and Note 14 on pages62–63 and 114–118, respectively, of this Annual Report.
Lending-related commitments The contractual amount of wholesale lending-related commitments was$391.4 billion at December 31, 2006, compared with $321.1 billion at December 31, 2005. See page 66 of this Annual Report for an explanation ofthe increase in exposure. In the Firm’s view, the total contractual amount ofthese instruments is not representative of the Firm’s actual credit risk expo-sure or funding requirements. In determining the amount of credit risk expo-sure the Firm has to wholesale lending-related commitments, which is usedas the basis for allocating credit risk capital to these instruments, the Firm hasestablished a “loan-equivalent” amount for each commitment; this amountrepresents the portion of the unused commitment or other contingent expo-sure that is expected, based upon average portfolio historical experience, tobecome outstanding in the event of a default by an obligor. The loan-equivalentamount of the Firm’s lending-related commitments was $212 billion and$178 billion as of December 31, 2006 and 2005, respectively.
Emerging markets country exposure The Firm has a comprehensive internal process for measuring and managingexposures and risk in emerging markets countries – defined as those countriespotentially vulnerable to sovereign events. As of December 31, 2006, basedupon its internal methodology, the Firm’s exposure to any individual emerging-markets country was not significant, in that total exposure to any such countrydid not exceed 0.75% of the Firm’s total assets. In evaluating and managingits exposures to emerging markets countries, the Firm takes into considerationall credit-related lending, trading, and investment activities, whether cross-bor-der or locally funded. Exposure amounts are then adjusted for credit enhance-ments (e.g., guarantees and letters of credit) provided by third parties locatedoutside the country, if the enhancements fully cover the country risk as well asthe credit risk. For information regarding the Firm’s cross-border exposure,based upon guidelines of the Federal Financial Institutions ExaminationCouncil (“FFIEC”), see Part 1, Item 1, “Loan portfolio, Cross-border outstand-ings,” on page 155, of the Firm’s Annual Report on Form 10-K for the yearended December 31,2006.
JPMorgan Chase & Co. / 2006 Annual Report 73
CONSUMER CREDIT PORTFOL IO
JPMorgan Chase’s consumer portfolio consists primarily of residential mortgages,home equity loans, credit cards, auto loans and leases, education loans and busi-ness banking loans and reflects the benefit of diversification from both a productand a geographic perspective. The primary focus is serving the prime consumercredit market. There are no products in the real estate portfolios that result in
negative amortization. However, RFS offers Home Equity lines of credit andMortgage loans with interest-only payment options to predominantly prime bor-rowers. The Firm actively manages its consumer credit operation. Ongoing effortsinclude continual review and enhancement of credit underwriting criteria andrefinement of pricing and risk management models.
The following table presents managed consumer credit–related information for the dates indicated:
Consumer portfolio
Credit Nonperforming Average annualAs of or for the year ended December 31, exposure assets(e) Net charge-offs net charge-off rate(g)
(in millions, except ratios) 2006 2005 2006 2005 2006 2005 2006 2005
Retail Financial ServicesHome equity $ 85,730 $ 73,866 $ 454 $ 422 $ 143 $ 141 0.18% 0.20%Mortgage 59,668 58,959 769 442 56 25 0.12 0.06Auto loans and leases(a) 41,009 46,081 132 193 238 277 0.56 0.54All other loans 27,097 18,393 322 281 139 129 0.65 0.83
Card Services – reported(b) 85,881 71,738 9 13 2,488 3,324 3.37 4.94
Total consumer loans – reported 299,385 269,037 1,686(f) 1,351(f) 3,064 3,896 1.17 1.56
Card Services – securitizations (b)(c) 66,950 70,527 — — 2,210 3,776 3.28 5.47
Total consumer loans – managed(b) 366,335 339,564 1,686 1,351 5,274 7,672 1.60 2.41Assets acquired in loan satisfactions NA NA 225 180 NA NA NA NA
Total consumer related assets – managed 366,335 339,564 1,911 1,531 5,274 7,672 1.60 2.41Consumer lending–related commitments:Home equity 69,559 58,281 NA NA NA NA NA NAMortgage 6,618 5,944 NA NA NA NA NA NAAuto loans and leases 7,874 5,665 NA NA NA NA NA NAAll other loans 6,375 6,385 NA NA NA NA NA NACard Services(d) 657,109 579,321 NA NA NA NA NA NA
Total lending-related commitments 747,535 655,596 NA NA NA NA NA NA
Total consumer credit portfolio $ 1,113,870 $ 995,160 $1,911 $ 1,531 $ 5,274 $ 7,672 1.60% 2.41%
Total average HFS loans $ 16,129 $ 15,675 $ 29 $ 21 NA NA NA NAMemo: Credit card – managed 152,831 142,265 9 13 $ 4,698 $ 7,100 3.33% 5.21%
(a) Excludes operating lease–related assets of $1.6 billion and $858 million at December 31, 2006 and 2005, respectively.(b) Past-due loans 90 days and over and accruing includes credit card receivables of $1.3 billion and $1.1 billion at December 31, 2006 and 2005, and related credit card securitizations of $962 million
and $730 million at December 31, 2006 and 2005, respectively.(c) Represents securitized credit card receivables. For a further discussion of credit card securitizations, see Card Services on pages 43–45 of this Annual Report.(d) The credit card lending–related commitments represent the total available credit to the Firm’s cardholders. The Firm has not experienced, and does not anticipate, that all of its cardholders will utilize
their entire available lines of credit at the same time. The Firm can reduce or cancel a credit card commitment by providing the cardholder prior notice or, in some cases, without notice as permittedby law.
(e) Includes nonperforming HFS loans of $116 million and $27 million at December 31, 2006 and 2005, respectively.(f) Excludes nonperforming assets related to (1) loans eligible for repurchase as well as loans repurchased from GNMA pools that are insured by U.S. government agencies and U.S. government-sponsored
enterprises of $1.2 billion and $1.1 billion for December 31, 2006 and 2005, respectively, and (2) education loans that are 90 days past due and still accruing, which are insured by U.S. governmentagencies under the Federal Family Education Loan Program of $0.2 billion at December 31, 2006. These amounts for GNMA and education loans are excluded, as reimbursement is proceeding normally.
(g) Net charge-off rates exclude average loans HFS of $16 billion for the years ended December 31, 2006 and 2005.
Total managed consumer loans as of December 31, 2006, were $366.3 bil-lion, up from $339.6 billion at year-end 2005 reflecting growth in most con-sumer portfolios. Consumer lending-related commitments increased by 14%,to $747.5 billion at December 31, 2006, primarily reflecting growth in creditcards and home equity lines of credit. The following discussion relates to thespecific loan and lending-related categories within the consumer portfolio.
Retail Financial Services:Average RFS loan balances for 2006 were $203.9 billion. The net charge-offrate for retail loans in 2006 was 0.31%, which was flat compared with theprior year, reflecting stable credit trends in most consumer lending portfolios.New loans originated in 2006 primarily reflect high credit quality consistent
with management’s focus on prime and near-prime credit market segmenta-tion. The Firm regularly evaluates market conditions and the overall economicreturns of new originations and makes an initial determination of whether toclassify specific new originations as held-for-investment or held-for-sale. TheFirm also periodically evaluates the overall economic returns of its held-for-investment loan portfolio under prevailing market conditions to determinewhether to retain or sell loans in the portfolio. When it is determined that aloan that was previously classified as held-for-investment will be sold it istransferred into a held-for-sale account. Held-for-sale loans are accounted forat the lower of cost or fair value, with changes in value recorded inNoninterest revenue.
MANAGEMENT’S DISCUSSION AND ANALYSISJPMorgan Chase & Co.
74 JPMorgan Chase & Co. / 2006 Annual Report
Home equity: Home equity loans at December 31, 2006, were $85.7 billion,an increase of $11.9 billion from year-end 2005. Growth in the portfolioreflected organic growth, as well as The Bank of New York transaction. Thegeographic distribution is well-diversified as shown in the table below.
Mortgage: Mortgage loans at December 31, 2006, were $59.7 billion.Mortgage receivables as of December 31, 2006, reflected an increase of $709 million from the prior year. Although the Firm provides mortgage loans
to the full spectrum of credit borrowers, more than 75% of RFS’ mortgageloans on the balance sheet are to prime borrowers. In addition, the Firm sells or securitizes virtually all fixed-rate mortgage originations, as well as aportion of its adjustable rate originations. As a result, the portfolio of resi-dential mortgage loans held-for-investment consists primarily of adjustablerate products. The geographic distribution is well-diversified as shown in thetable below.
Auto loans and leases: As of December 31, 2006, Auto loans and leasesdecreased to $41.0 billion from $46.1 billion at year-end 2005. The decreasein outstanding loans was caused primarily by the de-emphasis of vehiclefinance leasing, which comprised $2 billion of outstanding loans as ofDecember 31, 2006, down from $4 billion in the prior year. The Auto loanportfolio reflects a high concentration of prime and near-prime quality credits.
All other loans: All other loans primarily include business banking loans(which are highly collateralized loans, often with personal loan guarantees),Education loans and community development loans. As of December 31,2006, Other loans increased to $27.1 billion compared with $18.4 billion atyear-end 2005. This increase is due primarily to an increase in educationloans as a result of the acquisition of Collegiate Funding Services. Loan bal-ances also increased in Business banking primarily as a result of The Bank ofNew York transaction.
Card ServicesJPMorgan Chase analyzes its credit card portfolio on a managed basis, whichincludes credit card receivables on the consolidated balance sheet and thosereceivables sold to investors through securitization. Managed credit cardreceivables were $152.8 billion at December 31, 2006, an increase of $10.6billion from year-end 2005, reflecting organic growth and acquisitions, par-tially offset by higher customer payment rates.
The managed credit card net charge-off rate decreased to 3.33% for 2006,from 5.21% in 2005. This decrease was due primarily to lower bankruptcy-related net charge-offs. The 30-day delinquency rates increased to 3.13% atDecember 31, 2006, from 2.79% at December 31, 2005, primarily driven byaccelerated loss recognition of delinquent accounts in 2005, as a result of the2005 bankruptcy reform legislation. The managed credit card portfolio contin-ues to reflect a well-seasoned portfolio that has good U.S. geographic diversi-fication.
Year ended December 31, Mortgage
(in billions, except ratios) 2006 2005
California $ 14.5 24% $ 13.8 23%New York 8.9 15 9.2 16Florida 7.1 12 6.8 12New Jersey 2.6 4 2.6 4Illinois 2.4 4 2.2 4Texas 2.1 4 2.3 4Virginia 1.5 3 1.7 3Michigan 1.5 3 1.5 3Arizona 1.5 3 1.2 2Maryland 1.4 2 1.5 3All other 16.2 26 16.2 26
Total $ 59.7 100% $ 59.0 100%
Consumer real estate loans by geographic location
Year ended December 31, Home equity
(in billions, except ratios) 2006 2005
California $ 12.9 15% $ 10.5 14%New York 12.2 14 10.2 14Illinois 6.2 7 5.5 7Texas 5.8 7 5.3 7Arizona 5.4 6 4.5 6Ohio 5.3 6 5.2 7Florida 4.4 5 3.5 5Michigan 3.8 4 3.7 5New Jersey 3.5 4 2.6 4Indiana 2.6 3 2.6 4All other 23.6 29 20.3 27
Total $ 85.7 100% $ 73.9 100%
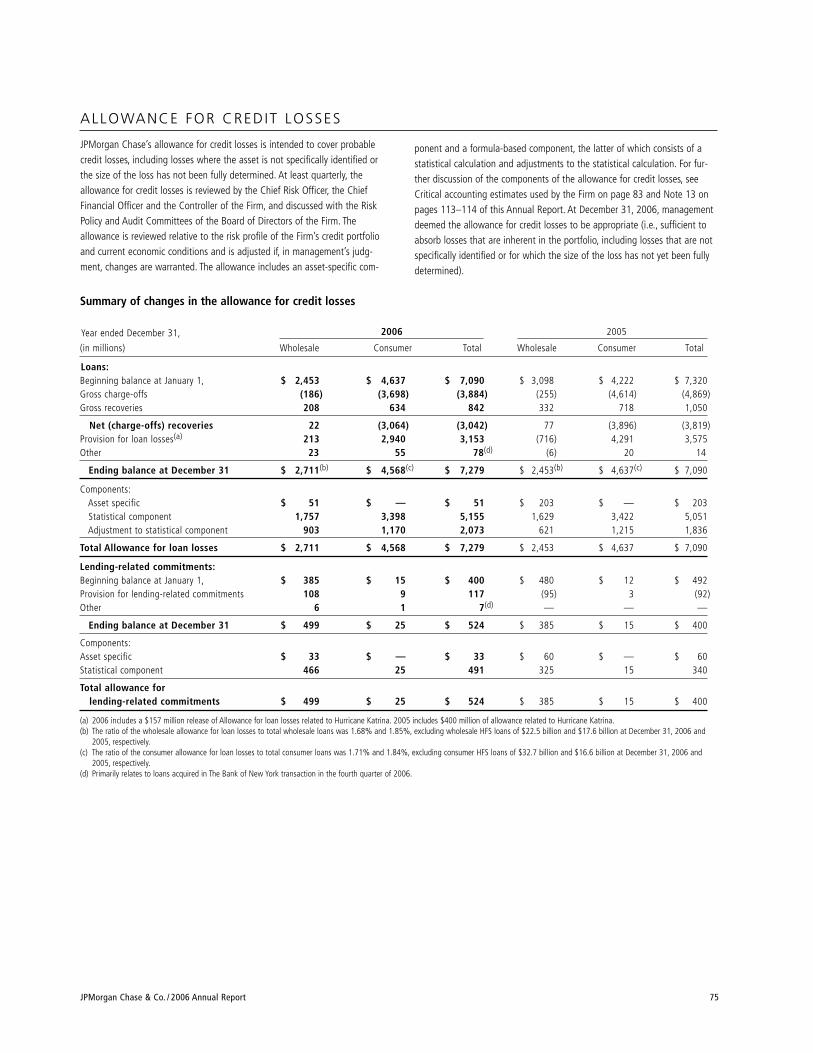
JPMorgan Chase & Co. / 2006 Annual Report 75
Summary of changes in the allowance for credit losses
Year ended December 31, 2006 2005
(in millions) Wholesale Consumer Total Wholesale Consumer Total
Loans:Beginning balance at January 1, $ 2,453 $ 4,637 $ 7,090 $ 3,098 $ 4,222 $ 7,320Gross charge-offs (186) (3,698) (3,884) (255) (4,614) (4,869)Gross recoveries 208 634 842 332 718 1,050
Net (charge-offs) recoveries 22 (3,064) (3,042) 77 (3,896) (3,819)Provision for loan losses(a) 213 2,940 3,153 (716) 4,291 3,575Other 23 55 78(d) (6) 20 14
Ending balance at December 31 $ 2,711(b) $ 4,568(c) $ 7,279 $ 2,453(b) $ 4,637(c) $ 7,090
Components:Asset specific $ 51 $ — $ 51 $ 203 $ — $ 203Statistical component 1,757 3,398 5,155 1,629 3,422 5,051Adjustment to statistical component 903 1,170 2,073 621 1,215 1,836
Total Allowance for loan losses $ 2,711 $ 4,568 $ 7,279 $ 2,453 $ 4,637 $ 7,090
Lending-related commitments:Beginning balance at January 1, $ 385 $ 15 $ 400 $ 480 $ 12 $ 492Provision for lending-related commitments 108 9 117 (95) 3 (92)Other 6 1 7(d) — — —
Ending balance at December 31 $ 499 $ 25 $ 524 $ 385 $ 15 $ 400
Components:Asset specific $ 33 $ — $ 33 $ 60 $ — $ 60Statistical component 466 25 491 325 15 340
Total allowance for lending-related commitments $ 499 $ 25 $ 524 $ 385 $ 15 $ 400
(a) 2006 includes a $157 million release of Allowance for loan losses related to Hurricane Katrina. 2005 includes $400 million of allowance related to Hurricane Katrina.(b) The ratio of the wholesale allowance for loan losses to total wholesale loans was 1.68% and 1.85%, excluding wholesale HFS loans of $22.5 billion and $17.6 billion at December 31, 2006 and
2005, respectively.(c) The ratio of the consumer allowance for loan losses to total consumer loans was 1.71% and 1.84%, excluding consumer HFS loans of $32.7 billion and $16.6 billion at December 31, 2006 and
2005, respectively.(d) Primarily relates to loans acquired in The Bank of New York transaction in the fourth quarter of 2006.
ALLOWANCE FOR CREDIT LOSSES
JPMorgan Chase’s allowance for credit losses is intended to cover probablecredit losses, including losses where the asset is not specifically identified orthe size of the loss has not been fully determined. At least quarterly, theallowance for credit losses is reviewed by the Chief Risk Officer, the ChiefFinancial Officer and the Controller of the Firm, and discussed with the RiskPolicy and Audit Committees of the Board of Directors of the Firm. Theallowance is reviewed relative to the risk profile of the Firm’s credit portfolioand current economic conditions and is adjusted if, in management’s judg-ment, changes are warranted. The allowance includes an asset-specific com-
ponent and a formula-based component, the latter of which consists of astatistical calculation and adjustments to the statistical calculation. For fur-ther discussion of the components of the allowance for credit losses, seeCritical accounting estimates used by the Firm on page 83 and Note 13 onpages 113–114 of this Annual Report. At December 31, 2006, managementdeemed the allowance for credit losses to be appropriate (i.e., sufficient toabsorb losses that are inherent in the portfolio, including losses that are notspecifically identified or for which the size of the loss has not yet been fullydetermined).
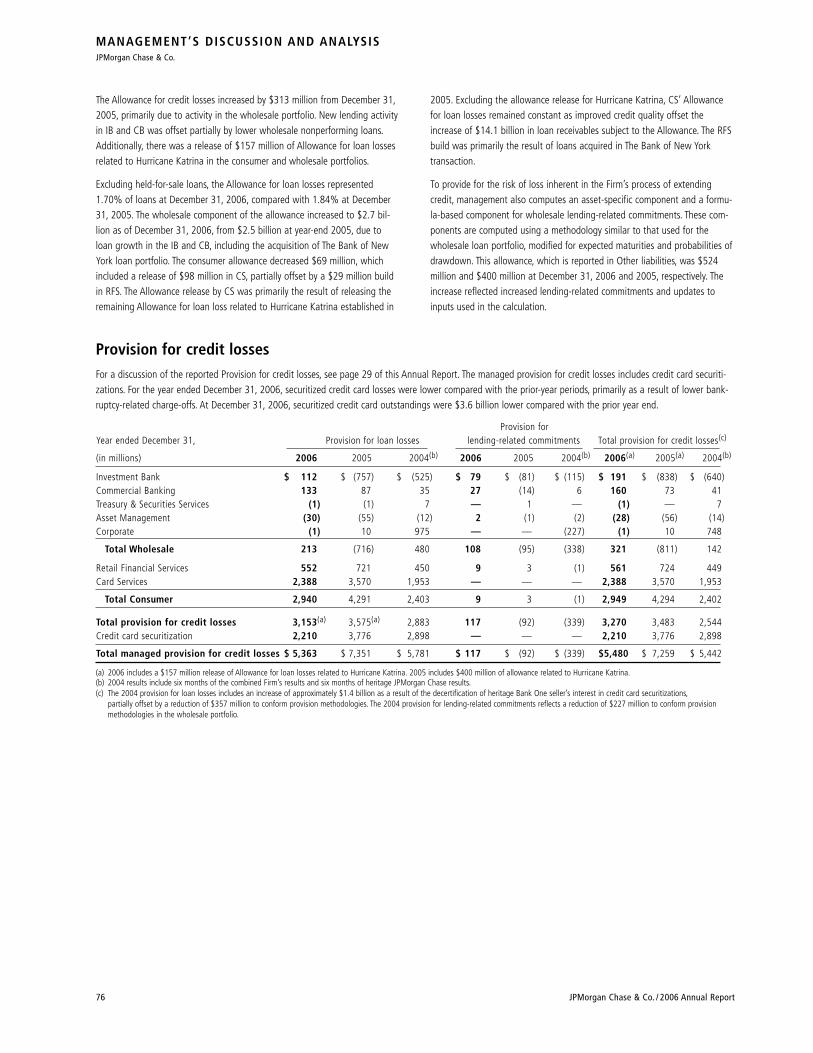
MANAGEMENT’S DISCUSSION AND ANALYSISJPMorgan Chase & Co.
76 JPMorgan Chase & Co. / 2006 Annual Report
The Allowance for credit losses increased by $313 million from December 31,2005, primarily due to activity in the wholesale portfolio. New lending activityin IB and CB was offset partially by lower wholesale nonperforming loans.Additionally, there was a release of $157 million of Allowance for loan lossesrelated to Hurricane Katrina in the consumer and wholesale portfolios.
Excluding held-for-sale loans, the Allowance for loan losses represented1.70% of loans at December 31, 2006, compared with 1.84% at December31, 2005. The wholesale component of the allowance increased to $2.7 bil-lion as of December 31, 2006, from $2.5 billion at year-end 2005, due toloan growth in the IB and CB, including the acquisition of The Bank of NewYork loan portfolio. The consumer allowance decreased $69 million, whichincluded a release of $98 million in CS, partially offset by a $29 million buildin RFS. The Allowance release by CS was primarily the result of releasing theremaining Allowance for loan loss related to Hurricane Katrina established in
2005. Excluding the allowance release for Hurricane Katrina, CS’ Allowancefor loan losses remained constant as improved credit quality offset theincrease of $14.1 billion in loan receivables subject to the Allowance. The RFSbuild was primarily the result of loans acquired in The Bank of New Yorktransaction.
To provide for the risk of loss inherent in the Firm’s process of extendingcredit, management also computes an asset-specific component and a formu-la-based component for wholesale lending-related commitments. These com-ponents are computed using a methodology similar to that used for thewholesale loan portfolio, modified for expected maturities and probabilities ofdrawdown. This allowance, which is reported in Other liabilities, was $524million and $400 million at December 31, 2006 and 2005, respectively. Theincrease reflected increased lending-related commitments and updates toinputs used in the calculation.
Provision for credit lossesFor a discussion of the reported Provision for credit losses, see page 29 of this Annual Report. The managed provision for credit losses includes credit card securiti-zations. For the year ended December 31, 2006, securitized credit card losses were lower compared with the prior-year periods, primarily as a result of lower bank-ruptcy-related charge-offs. At December 31, 2006, securitized credit card outstandings were $3.6 billion lower compared with the prior year end.
Provision forYear ended December 31, Provision for loan losses lending-related commitments Total provision for credit losses(c)
(in millions) 2006 2005 2004(b) 2006 2005 2004(b) 2006(a) 2005(a) 2004(b)
Investment Bank $ 112 $ (757) $ (525) $ 79 $ (81) $ (115) $ 191 $ (838) $ (640)Commercial Banking 133 87 35 27 (14) 6 160 73 41Treasury & Securities Services (1) (1) 7 — 1 — (1) — 7Asset Management (30) (55) (12) 2 (1) (2) (28) (56) (14)Corporate (1) 10 975 — — (227) (1) 10 748
Total Wholesale 213 (716) 480 108 (95) (338) 321 (811) 142
Retail Financial Services 552 721 450 9 3 (1) 561 724 449Card Services 2,388 3,570 1,953 — — — 2,388 3,570 1,953
Total Consumer 2,940 4,291 2,403 9 3 (1) 2,949 4,294 2,402
Total provision for credit losses 3,153(a) 3,575(a) 2,883 117 (92) (339) 3,270 3,483 2,544Credit card securitization 2,210 3,776 2,898 — — — 2,210 3,776 2,898
Total managed provision for credit losses $ 5,363 $ 7,351 $ 5,781 $ 117 $ (92) $ (339) $5,480 $ 7,259 $ 5,442
(a) 2006 includes a $157 million release of Allowance for loan losses related to Hurricane Katrina. 2005 includes $400 million of allowance related to Hurricane Katrina.(b) 2004 results include six months of the combined Firm’s results and six months of heritage JPMorgan Chase results.(c) The 2004 provision for loan losses includes an increase of approximately $1.4 billion as a result of the decertification of heritage Bank One seller’s interest in credit card securitizations,
partially offset by a reduction of $357 million to conform provision methodologies. The 2004 provision for lending-related commitments reflects a reduction of $227 million to conform provisionmethodologies in the wholesale portfolio.
JPMorgan Chase & Co. / 2006 Annual Report 77
MARKET R ISK MANAGEMENT
Market risk is the exposure to an adverse change in the market value of port-folios and financial instruments caused by a change in market prices or rates.
Market risk management Market risk is identified, measured, monitored, and controlled by an independentcorporate risk governance function. Market risk management seeks to facilitateefficient risk/return decisions, reduce volatility in operating performance and makethe Firm’s market risk profile transparent to senior management, the Board ofDirectors and regulators. Market risk management is overseen by the Chief RiskOfficer and performs the following primary functions:
• Establishment of a comprehensive market risk policy framework• Independent measurement, monitoring and control
of business segment market risk• Definition, approval and monitoring of limits• Performance of stress testing and qualitative risk assessments
The Firm’s business segments also have valuation teams whose functions are toprovide independent oversight of the accuracy of the valuations of positions thatexpose the Firm to market risk. These valuation functions reside within the marketrisk management area and have a reporting line into Finance.
Risk identification and classificationThe market risk management group works in partnership with the businesssegments to identify market risks throughout the Firm and to refine and mon-itor market risk policies and procedures. All business segments are responsiblefor comprehensive identification and verification of market risks within theirunits. Risk-taking businesses have functions that act independently from trad-ing personnel and are responsible for verifying risk exposures that the busi-ness takes. In addition to providing independent oversight for market riskarising from the business segments, Market risk management also is responsi-ble for identifying exposures which may not be large within individual busi-ness segments, but which may be large for the Firm in aggregate. Regularmeetings are held between Market risk management and the heads of risk-taking businesses to discuss and decide on risk exposures in the context ofthe market environment and client flows.
Positions that expose the Firm to market risk can be classified into two cate-gories: trading and nontrading risk. Trading risk includes positions that are heldby the Firm as part of a business segment or unit whose main business strategyis to trade or make markets. Unrealized gains and losses in these positions aregenerally reported in Principal transactions revenue. Nontrading risk includessecurities and other assets held for longer-term investment, mortgage servic-ing rights, and securities and derivatives used to manage the Firm’s asset/liabil-ity exposures. Unrealized gains and losses in these positions are generally notreported in Principal transactions revenue.
Trading riskFixed income risk (which includes interest rate risk and credit spread risk),foreign exchange, equities and commodities and other trading risks involvethe potential decline in Net income or financial condition due to adversechanges in market rates, whether arising from client activities or proprietarypositions taken by the Firm.
Nontrading riskNontrading risk arises from execution of the Firm’s core business strategies,the delivery of products and services to its customers, and the discretionarypositions the Firm undertakes to risk-manage exposures.
These exposures can result from a variety of factors, including differences in the timing among the maturity or repricing of assets, liabilities and off–balance sheet instruments. Changes in the level and shape of marketinterest rate curves also may create interest rate risk, since the repricing characteristics of the Firm’s assets do not necessarily match those of its liabilities. The Firm also is exposed to basis risk, which is the difference in repricing characteristics of two floating-rate indices, such as the prime rateand 3-month LIBOR. In addition, some of the Firm’s products have embeddedoptionality that impact pricing and balances.
The Firm’s mortgage banking activities also give rise to complex interest raterisks. The interest rate exposure from the Firm’s mortgage banking activities is a result of changes in the level of interest rates, as well as option and basisrisk. Option risk arises primarily from prepayment options embedded in mort-gages and changes in the probability of newly originated mortgage commit-ments actually closing. Basis risk results from different relative movementsbetween mortgage rates and other interest rates.
Risk measurementTools used to measure riskBecause no single measure can reflect all aspects of market risk, the Firmuses various metrics, both statistical and nonstatistical, including:
• Nonstatistical risk measures• Value-at-risk (“VAR”)• Loss advisories• Economic value stress testing• Earnings-at-risk stress testing• Risk identification for large exposures (“RIFLE”)
Nonstatistical risk measuresNonstatistical risk measures other than stress testing include net open positions,basis point values, option sensitivities, market values, position concentrationsand position turnover. These measures provide granular information on theFirm’s market risk exposure. They are aggregated by line of business and by risktype, and are used for monitoring limits, one-off approvals and tactical control.
Value-at-risk JPMorgan Chase’s primary statistical risk measure, VAR, estimates the potentialloss from adverse market moves in an ordinary market environment and provides a consistent cross-business measure of risk profiles and levels ofdiversification. VAR is used for comparing risks across businesses, monitoringlimits, one-off approvals, and as an input to economic capital calculations.VAR provides risk transparency in a normal trading environment. Each busi-ness day the Firm undertakes a comprehensive VAR calculation that includesboth its trading and its nontrading risks. VAR for nontrading risk measures theamount of potential change in the fair values of the exposures related to theserisks; however, for such risks, VAR is not a measure of reported revenue sincenontrading activities are generally not marked to market through earnings.
MANAGEMENT’S DISCUSSION AND ANALYSISJPMorgan Chase & Co.
78 JPMorgan Chase & Co. / 2006 Annual Report
To calculate VAR, the Firm uses historical simulation, which measures riskacross instruments and portfolios in a consistent and comparable way. Thisapproach assumes that historical changes in market values are representativeof future changes. The simulation is based upon data for the previous twelve
months. The Firm calculates VAR using a one-day time horizon and an expectedtail-loss methodology, which approximates a 99% confidence level. This meansthe Firm would expect to incur losses greater than that predicted by VAR esti-mates only once in every 100 trading days, or about two to three times a year.
IB Trading and Credit Portfolio VARIB trading VAR by risk type and credit portfolio VAR
2006 2005
As of or for the year ended Average Minimum Maximum Average Minimum Maximum At December 31,December 31, (in millions) VAR VAR VAR VAR VAR VAR 2006 2005
By risk type:Fixed income $ 56 $ 35 $ 94 $ 67 $ 37 $ 110 $ 44 $ 89Foreign exchange 22 14 42 23 16 32 27 19Equities 31 18 50 34 15 65 49 24Commodities and other 45 22 128 21 7 50 41 34
Less: portfolio diversification (70)(c) NM(d) NM(d) (59)(c) NM(d) NM(d) (62)(c) (63)(c)
Trading VAR(a) 84 55 137 86 53 130 99 103
Credit portfolio VAR(b) 15 12 19 14 11 17 15 15Less: portfolio diversification (11)(c) NM(d) NM(d) (12)(c) NM(d) NM(d) (10)(c) (10)(c)
Total trading and creditportfolio VAR $ 88 $ 61 $ 138 $ 88 $ 57 $ 130 $ 104 $ 108
(a) Trading VAR does not include VAR related to the MSR portfolio or VAR related to other corporate functions, such as Treasury and Private Equity. For a discussion of MSRs and the corporate functions,see pages 53–54 and Note 16 on pages 121–122 of this Annual Report, respectively. Trading VAR includes substantially all trading activities in IB; however, particular risk parameters of certain prod-ucts are not fully captured, for example, correlation risk.
(b) Includes VAR on derivative credit valuation adjustments, hedges of the credit valuation adjustment and mark-to-market hedges of the accrual loan portfolio, which are all reported in Principal transac-tions revenue. This VAR does not include the accrual loan portfolio, which is not marked to market.
(c) Average and period-end VARs are less than the sum of the VARs of its market risk components, which is due to risk offsets resulting from portfolio diversification. The diversification effect reflects the fact that the risks are not perfectly correlated. The risk of a portfolio of positions is therefore usually less than the sum of the risks of the positions themselves.
(d) Designated as not meaningful (“NM”) because the minimum and maximum may occur on different days for different risk components, and hence it is not meaningful to compute a portfolio diversification effect.
Investment Bank’s average Total Trading and Credit Portfolio VAR was $88 mil-lion for both 2006 and 2005. Commodities and other VAR increased due tocontinued expansion of the energy trading business, while Fixed income VARdecreased due to reduced risk positions, as well as to lower market volatilitycompared with 2005. These changes also led to an increase in portfolio diver-sification, as Average Trading VAR diversification increased to $70 million, or45% of the sum of the components, during 2006; from $59 million, or 41% ofthe sum of the components, during 2005. In general, over the course of theyear, VAR exposures can vary significantly as positions change, market volatilityfluctuates and diversification benefits change.
VAR back-testingTo evaluate the soundness of its VAR model, the Firm conducts daily back-testingof VAR against daily IB market risk-related revenue, which is defined as thechange in value of Principal transactions revenue less Private Equity gains/lossesplus any trading-related net interest income, brokerage commissions, underwrit-ing fees or other revenue. The following histogram illustrates the daily marketrisk-related gains and losses for IB trading businesses for the year endedDecember 31, 2006. The chart shows that IB posted market risk-related gains on227 out of 260 days in this period, with 29 days exceeding $100 million. Theinset graph looks at those days on which IB experienced losses and depicts theamount by which VAR exceeded the actual loss on each of those days. Losseswere sustained on 33 days, with no loss greater than $100 million, and with noloss exceeding the VAR measure.
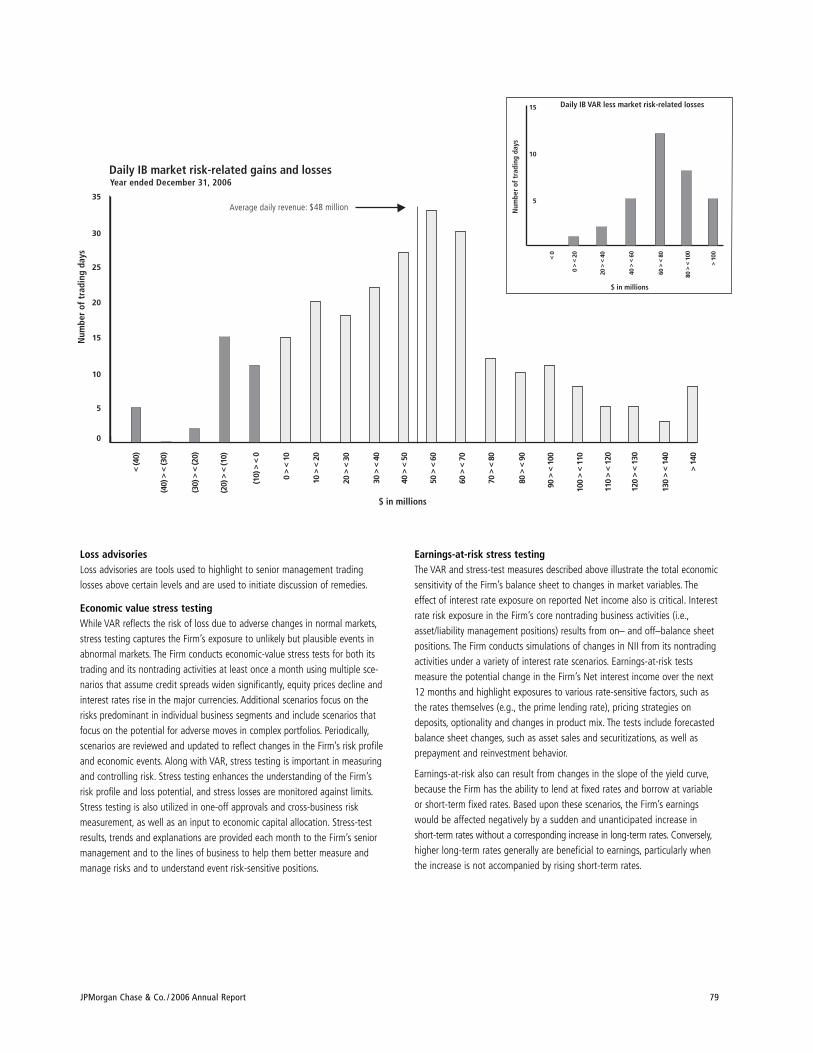
JPMorgan Chase & Co. / 2006 Annual Report 79
< (4
0)
10>
< 20
0>
< 10
20>
< 30
30>
< 40
40>
< 50
50>
< 60
60>
< 70
70>
< 80
80>
< 90
90>
< 10
0
100
> <
110
> 14
0
(10)
> <
0
(20)
> <
(10)
Daily IB market risk-related gains and lossesYear ended December 31, 2006
Num
ber
of t
radi
ng d
ays
Average daily revenue: $48 million
0
5
10
15
20
25
30
35
$ in millions
5
10
15
< 0
0>
< 20
20>
< 40
40>
< 60
60>
< 80
>10
0
$ in millions
Num
ber
of t
radi
ng d
ays
Daily IB VAR less market risk-related losses
80>
< 10
0
110
> <
120
(40)
> <
(30)
(30)
> <
(20)
130
> <
140
120
> <
130
Loss advisoriesLoss advisories are tools used to highlight to senior management tradinglosses above certain levels and are used to initiate discussion of remedies.
Economic value stress testingWhile VAR reflects the risk of loss due to adverse changes in normal markets,stress testing captures the Firm’s exposure to unlikely but plausible events inabnormal markets. The Firm conducts economic-value stress tests for both itstrading and its nontrading activities at least once a month using multiple sce-narios that assume credit spreads widen significantly, equity prices decline andinterest rates rise in the major currencies. Additional scenarios focus on therisks predominant in individual business segments and include scenarios thatfocus on the potential for adverse moves in complex portfolios. Periodically,scenarios are reviewed and updated to reflect changes in the Firm’s risk profileand economic events. Along with VAR, stress testing is important in measuringand controlling risk. Stress testing enhances the understanding of the Firm’srisk profile and loss potential, and stress losses are monitored against limits.Stress testing is also utilized in one-off approvals and cross-business riskmeasurement, as well as an input to economic capital allocation. Stress-testresults, trends and explanations are provided each month to the Firm’s seniormanagement and to the lines of business to help them better measure andmanage risks and to understand event risk-sensitive positions.
Earnings-at-risk stress testingThe VAR and stress-test measures described above illustrate the total economicsensitivity of the Firm’s balance sheet to changes in market variables. Theeffect of interest rate exposure on reported Net income also is critical. Interestrate risk exposure in the Firm’s core nontrading business activities (i.e.,asset/liability management positions) results from on– and off–balance sheetpositions. The Firm conducts simulations of changes in NII from its nontradingactivities under a variety of interest rate scenarios. Earnings-at-risk testsmeasure the potential change in the Firm’s Net interest income over the next12 months and highlight exposures to various rate-sensitive factors, such asthe rates themselves (e.g., the prime lending rate), pricing strategies ondeposits, optionality and changes in product mix. The tests include forecastedbalance sheet changes, such as asset sales and securitizations, as well as prepayment and reinvestment behavior.
Earnings-at-risk also can result from changes in the slope of the yield curve,because the Firm has the ability to lend at fixed rates and borrow at variableor short-term fixed rates. Based upon these scenarios, the Firm’s earningswould be affected negatively by a sudden and unanticipated increase inshort-term rates without a corresponding increase in long-term rates. Conversely,higher long-term rates generally are beneficial to earnings, particularly whenthe increase is not accompanied by rising short-term rates.
80 JPMorgan Chase & Co. / 2006 Annual Report
Immediate changes in interest rates present a limited view of risk, and so anumber of alternative scenarios also are reviewed. These scenarios include theimplied forward curve, nonparallel rate shifts and severe interest rate shockson selected key rates. These scenarios are intended to provide a comprehensiveview of JPMorgan Chase’s earnings-at-risk over a wide range of outcomes.
JPMorgan Chase’s 12-month pretax earnings sensitivity profile as ofDecember 31, 2006 and 2005, were as follows:
Immediate change in rates
(in millions) +200bp +100bp -100bp -200bp
December 31, 2006 $ (101) $ 28 $ (21) $(182)December 31, 2005 265 172 (162) (559)
The primary change in earnings-at-risk from December 31, 2005, reflects ahigher level of AFS securities and other repositioning. The Firm is exposed toboth rising and falling rates. The Firm’s risk to rising rates is largely the resultof increased funding costs. In contrast, the exposure to falling rates is theresult of higher anticipated levels of loan and securities prepayments.
Risk identification for large exposures (“RIFLE”)Individuals who manage risk positions, particularly those that are complex,are responsible for identifying potential losses that could arise from specific,unusual events, such as a potential tax change, and estimating the probabilitiesof losses arising from such events. This information is entered into the Firm’sRIFLE database. Trading management has access to RIFLE, thereby permittingthe Firm to monitor further earnings vulnerability not adequately covered bystandard risk measures.
Risk monitoring and controlLimitsMarket risk is controlled primarily through a series of limits. Limits reflect theFirm’s risk appetite in the context of the market environment and businessstrategy. In setting limits, the Firm takes into consideration factors such as mar-ket volatility, product liquidity, business trends and management experience.
Market risk management regularly reviews and updates risk limits. Seniormanagement, including the Firm’s Chief Executive Officer and Chief RiskOfficer, is responsible for reviewing and approving risk limits at least once ayear. Market risk management further controls the Firm’s exposure by specifi-cally designating approved financial instruments and tenors, known as instru-ment authorities, for each business segment.
The Firm maintains different levels of limits. Corporate-level limits include VARand stress. Similarly, line-of-business limits include VAR and stress limits andmay be supplemented by loss advisories, nonstatistical measurements andinstrument authorities. Businesses are responsible for adhering to establishedlimits, against which exposures are monitored and reported. Limit breachesare reported in a timely manner to senior management, and the affectedbusiness segment is required either to reduce trading positions or consult withsenior management on the appropriate action.
Qualitative reviewThe market risk management group also performs periodic reviews as neces-sary of both businesses and products with exposure to market risk in order toassess the ability of the businesses to control their market risk. Strategies,market conditions, product details and risk controls are reviewed, and specificrecommendations for improvements are made to management.
Model reviewSome of the Firm’s financial instruments cannot be valued based upon quotedmarket prices but are instead valued using pricing models. Such models areused for management of risk positions, such as reporting against limits, as wellas for valuation. The Model Risk Group, independent of the businesses andmarket risk management, reviews the models the Firm uses and assessesmodel appropriateness and consistency. The model reviews consider a numberof factors about the model’s suitability for valuation and risk management ofa particular product, including whether it accurately reflects the characteristicsof the transaction and its significant risks, the suitability and convergenceproperties of numerical algorithms, reliability of data sources, consistency ofthe treatment with models for similar products, and sensitivity to input param-eters and assumptions that cannot be priced from the market.
Reviews are conducted of new or changed models, as well as previouslyaccepted models, to assess whether there have been any changes in theproduct or market that may impact the model’s validity and whether there are theoretical or competitive developments that may require reassessment of the model’s adequacy. For a summary of valuations based upon models,see Critical Accounting Estimates used by the Firm on pages 83–85 of thisAnnual Report.
Risk reportingNonstatistical exposures, value-at-risk, loss advisories and limit excesses arereported daily for each trading and nontrading business. Market risk exposuretrends, value-at-risk trends, profit and loss changes, and portfolio concentra-tions are reported weekly. Stress-test results are reported monthly to businessand senior management.
MANAGEMENT’S DISCUSSION AND ANALYSISJPMorgan Chase & Co.

JPMorgan Chase & Co. / 2006 Annual Report 81
OPERAT IONAL R ISK MANAGEMENT
Operational risk is the risk of loss resulting from inadequate or failed processesor systems, human factors or external events.
OverviewOperational risk is inherent in each of the Firm’s businesses and supportactivities. Operational risk can manifest itself in various ways, including errors,fraudulent acts, business interruptions, inappropriate behavior of employeesor vendors that do not perform in accordance with outsourcing arrangements.These events could result in financial losses and other damage to the Firm,including reputational harm.
To monitor and control operational risk, the Firm maintains a system of com-prehensive policies and a control framework designed to provide a sound andwell-controlled operational environment. The goal is to keep operational risk atappropriate levels, in light of the Firm’s financial strength, the characteristicsof its businesses, the markets in which it operates, and the competitive andregulatory environment to which it is subject. Notwithstanding these control measures, the Firm incurs operational losses.
The Firm’s approach to operational risk management is intended to mitigate suchlosses by supplementing traditional control-based approaches to operationalrisk with risk measures, tools and disciplines that are risk-specific, consistentlyapplied and utilized firmwide. Key themes are transparency of information,escalation of key issues and accountability for issue resolution.
The Firm’s operational risk framework is supported by Phoenix, an internallydesigned operational risk software tool. Phoenix integrates the individualcomponents of the operational risk management framework into a unified,web-based tool. Phoenix enhances the capture, reporting and analysis ofoperational risk data by enabling risk identification, measurement, monitor-ing, reporting and analysis to be done in an integrated manner, therebyenabling efficiencies in the Firm’s monitoring and management of its opera-tional risk.
For purposes of identification, monitoring, reporting and analysis, the Firmcategorizes operational risk events as follows:
• Client service and selection• Business practices• Fraud, theft and malice• Execution, delivery and process management• Employee disputes• Disasters and public safety• Technology and infrastructure failures
Risk identification and measurementRisk identification is the recognition of the operational risk events that management believes may give rise to operational losses.
All businesses utilize the Firm’s newly redesigned firmwide self-assessmentprocess and supporting architecture as a dynamic risk management tool. Thegoal of the self-assessment process is for each business to identify the keyoperational risks specific to its environment and assess the degree to which itmaintains appropriate controls. Action plans are developed for control issuesidentified, and businesses are held accountable for tracking and resolvingthese issues on a timely basis.
Risk monitoringThe Firm has a process for monitoring operational risk-event data, permittinganalysis of errors and losses as well as trends. Such analysis, performed bothat a line-of-business level and by risk-event type, enables identification of thecauses associated with risk events faced by the businesses. Where available,the internal data can be supplemented with external data for comparativeanalysis with industry patterns. The data reported enables the Firm to back-test against self-assessment results. The Firm is a founding member of theOperational Risk Data Exchange, a not-for-profit industry association formedfor the purpose of collecting operational loss data and sharing data in ananonymous form and benchmarking results back to members. Such informa-tion supplements the Firm’s ongoing operational risk analysis.
Risk reporting and analysisOperational risk management reports provide timely and accurate information,including information about actual operational loss levels and self-assessmentresults, to the lines of business and senior management. The purpose of thesereports is to enable management to maintain operational risk at appropriatelevels within each line of business, to escalate issues and to provide consistentdata aggregation across the Firm’s businesses and support areas.
Audit alignment Internal Audit utilizes a risk-based program of audit coverage to provide anindependent assessment of the design and effectiveness of key controls overthe Firm’s operations, regulatory compliance and reporting. Audit partnerswith business management and members of the control community in providingguidance on the operational risk framework and reviewing the effectivenessand accuracy of the business self-assessment process as part of its businessunit audits.
PR IVATE EQUITY R ISK MANAGEMENT
Risk managementThe Firm makes direct principal investments in private equity. The illiquid natureand long-term holding period associated with these investments differentiatesprivate equity risk from the risk of positions held in the trading portfolios.The Firm’s approach to managing private equity risk is consistent with theFirm’s general risk governance structure. Controls are in place establishingtarget levels for total and annual investment in order to control the overallsize of the portfolio. Industry and geographic concentration limits are in placeand intended to ensure diversification of the portfolio; and periodic reviews
are performed on the portfolio to substantiate the valuations of the invest-ments. The valuation function within Market risk management that reportsinto Finance is responsible for reviewing the accuracy of the carrying values ofprivate equity investments held by Private Equity. At December 31, 2006, thecarrying value of the private equity businesses was $6.1 billion, of which $587million represented positions traded in the public market.
MANAGEMENT’S DISCUSSION AND ANALYSISJPMorgan Chase & Co.
82 JPMorgan Chase & Co. / 2006 Annual Report
A firm’s success depends not only on its prudent management of the liquidity,credit, market and operational risks that are part of its business risks, butequally on the maintenance among many constituents – clients, investors,regulators, as well as the general public – of a reputation for business practicesof the highest quality. Attention to reputation always has been a key aspectof the Firm’s practices, and maintenance of reputation is the responsibility ofeveryone at the Firm. JPMorgan Chase bolsters this individual responsibility in many ways, including through the Firm’s Code of Conduct, training, main-taining adherence to policies and procedures, and oversight functions thatapprove transactions. These oversight functions include a Conflicts Office,which examines wholesale transactions with the potential to create conflictsof interest for the Firm, and a Policy Review Office that reviews certain trans-actions with clients, especially complex derivatives and structured financetransactions that have the potential to affect adversely the Firm’s reputation.
Policy Review OfficeThe Policy Review Office is the most senior approval level for client transactionsinvolving reputation risk issues. The mandate of the Policy Review Office is toopine on specific transactions brought by the Regional Reputation Risk ReviewCommittees and consider changes in policies or practices relating to reputationrisk. The head of the Policy Review Office consults with the Firm’s most seniorexecutives on specific topics and provides regular updates. The Policy ReviewOffice reinforces the Firm’s procedures for examining transactions in terms ofappropriateness, ethical issues and reputation risk. It focuses on the purposeand effect of its transactions from the client’s point of view, with the goal thatthese transactions are not used to mislead investors or others.
Primary responsibility for adherence to the policies and procedures designedto address reputation risk lies with the business units conducting the transac-tions in question. The Firm’s transaction approval process requires reviewfrom, among others, internal legal/compliance, conflicts, tax and accountinggroups. Transactions involving an SPE established by the Firm receive particu-lar scrutiny intended to ensure that every such entity is properly approved,documented, monitored and controlled.
Business units also are required to submit to regional Reputation Risk ReviewCommittees proposed transactions that may give rise to heightened reputa-tion risk. The committees may approve, reject or require further clarificationon or changes to the transactions. The members of these committees are sen-ior representatives of the business and support units in the region. The com-mittees may escalate transaction review to the Policy Review Office.
Fiduciary risk managementThe risk management committees within each line of business include in their mandate the oversight of the legal, reputational and, where appropriate,fiduciary risks in their businesses that may produce significant losses or reputational damage. The Fiduciary Risk Management function works with therelevant line-of-business risk committees with the goal of ensuring that busi-nesses providing investment or risk management products or services thatgive rise to fiduciary duties to clients perform at the appropriate standard rel-ative to their fiduciary relationship with a client. Of particular focus are thepolicies and practices that address a business’ responsibilities to a client,including client suitability determination, disclosure obligations and communi-cations, and performance expectations with respect to risk managementproducts or services being provided by the Firm, that give rise to such fiduciaryduties. In this way, the relevant line-of-business risk committees, together withthe Fiduciary Risk Management function, provide oversight of the Firm’sefforts to monitor, measure and control the risks that may arise in the deliveryof the products or services to clients that give rise to such duties, as well asthose stemming from any of the Firm’s fiduciary responsibilities to employeesunder the Firm’s various employee benefit plans.
REPUTAT ION AND F IDUCIARY R ISK MANAGEMENT
JPMorgan Chase & Co. / 2006 Annual Report 83
JPMorgan Chase’s accounting policies and use of estimates are integral tounderstanding its reported results. The Firm’s most complex accounting estimates require management’s judgment to ascertain the valuation ofassets and liabilities. The Firm has established detailed policies and controlprocedures intended to ensure that valuation methods, including any judgmentsmade as part of such methods, are well-controlled, independently reviewedand applied consistently from period to period. In addition, the policies andprocedures are intended to ensure that the process for changing methodologiesoccurs in an appropriate manner. The Firm believes its estimates for determin-ing the valuation of its assets and liabilities are appropriate. The following is abrief description of the Firm’s critical accounting estimates involving signifi-cant valuation judgments.
Allowance for credit lossesJPMorgan Chase’s allowance for credit losses covers the wholesale and consumer loan portfolios as well as the Firm’s portfolio of wholesale lending-related commitments. The Allowance for credit losses is intended to adjust thevalue of the Firm’s loan assets for probable credit losses as of the balancesheet date. For further discussion of the methodologies used in establishingthe Firm’s Allowance for credit losses, see Note 13 on pages 113–114 of thisAnnual Report.
Wholesale loans and lending-related commitmentsThe methodology for calculating both the Allowance for loan losses and theAllowance for lending-related commitments involves significant judgment.First and foremost, it involves the early identification of credits that are deteri-orating. Second, it involves judgment in establishing the inputs used to esti-mate the allowances. Third, it involves management judgment to evaluate cer-tain macroeconomic factors, underwriting standards, and other relevant inter-nal and external factors affecting the credit quality of the current portfolioand to refine loss factors to better reflect these conditions.
The Firm uses a risk rating system to determine the credit quality of its whole-sale loans. Wholesale loans are reviewed for information affecting the oblig-or’s ability to fulfill its obligations. In assessing the risk rating of a particularloan, among the factors considered are the obligor’s debt capacity and finan-cial flexibility, the level of the obligor’s earnings, the amount and sources forrepayment, the level and nature of contingencies, management strength, andthe industry and geography in which the obligor operates. These factors arebased upon an evaluation of historical and current information, and involvesubjective assessment and interpretation. Emphasizing one factor over anoth-er or considering additional factors could impact the risk rating assigned bythe Firm to that loan.
The Firm applies its judgment to establish loss factors used in calculating theallowances. Wherever possible, the Firm uses independent, verifiable data orthe Firm’s own historical loss experience in its models for estimating theallowances. Many factors can affect estimates of loss, including volatility ofloss given default, probability of default and rating migrations. Considerationis given as to whether the loss estimates should be calculated as an averageover the entire credit cycle or at a particular point in the credit cycle, as wellas to which external data should be used and when they should be used.Choosing data that are not reflective of the Firm’s specific loan portfolio char-acteristics could also affect loss estimates. The application of different inputswould change the amount of the allowance for credit losses determinedappropriate by the Firm.
Management also applies its judgment to adjust the loss factors derived, tak-ing into consideration model imprecision, external factors and economic eventsthat have occurred but are not yet reflected in the loss factors. The resultantadjustments to the statistical calculation on the performing portfolio are deter-mined by creating estimated ranges using historical experience of both lossgiven default and probability of default. Factors related to concentrated anddeteriorating industries also are incorporated where relevant. The estimatedranges and the determination of the appropriate point within the range arebased upon management’s view of uncertainties that relate to current macro-economic and political conditions, quality of underwriting standards and otherrelevant internal and external factors affecting the credit quality of the currentportfolio. The adjustment to the statistical calculation for the wholesale loanportfolio for the period ended December 31, 2006, was $903 million basedupon management’s assessment of current economic conditions.
Consumer loansFor scored loans in the consumer lines of business, loss is determined primarilyby applying statistical loss factors and other risk indicators to pools of loans byasset type. These loss estimates are sensitive to changes in delinquency status,credit bureau scores, the realizable value of collateral and other risk factors.
Adjustments to the statistical calculation are accomplished in part by analyzingthe historical loss experience for each major product segment. Managementanalyzes the range of credit loss experienced for each major portfolio segment,taking into account economic cycles, portfolio seasoning and underwriting criteria, and then formulates a range that incorporates relevant risk factors thatimpact overall credit performance. The recorded adjustment to the statisticalcalculation for the period ended December 31, 2006, was $1.2 billion basedupon management’s assessment of current economic conditions.
Fair value of financial instruments, MSRs and commodities inventory A portion of JPMorgan Chase’s assets and liabilities are carried at fair value,including trading assets and liabilities, AFS securities, private equity investmentsand mortgage servicing rights (“MSRs”). Held-for-sale loans and physical com-modities are carried at the lower of fair value or cost. At December 31, 2006,approximately $526.8 billion of the Firm’s assets were recorded at fair value.
The fair value of a financial instrument is defined as the amount at which theinstrument could be exchanged in a current transaction between willing parties, other than in a forced or liquidation sale. The majority of the Firm’s assetsreported at fair value are based upon quoted market prices or upon internally developed models that utilize independently sourced market parameters,including interest rate yield curves, option volatilities and currency rates.
The degree of management judgment involved in determining the fair valueof a financial instrument is dependent upon the availability of quoted marketprices or observable market parameters. For financial instruments that aretraded actively and have quoted market prices or parameters readily available,there is little-to-no subjectivity in determining fair value. When observablemarket prices and parameters do not exist, management judgment is necessaryto estimate fair value. The valuation process takes into consideration
CRIT ICAL ACCOUNT ING EST IMATES USED BY THE F IRM
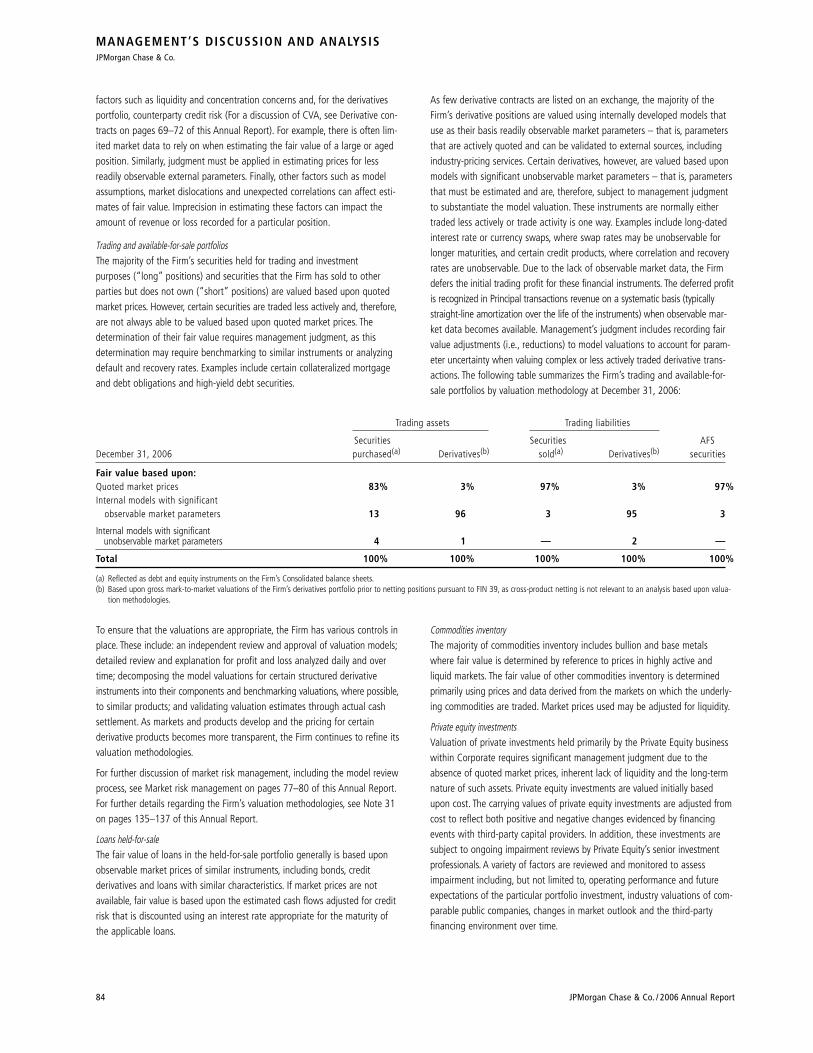
MANAGEMENT’S DISCUSSION AND ANALYSISJPMorgan Chase & Co.
84 JPMorgan Chase & Co. / 2006 Annual Report
factors such as liquidity and concentration concerns and, for the derivativesportfolio, counterparty credit risk (For a discussion of CVA, see Derivative con-tracts on pages 69–72 of this Annual Report). For example, there is often lim-ited market data to rely on when estimating the fair value of a large or agedposition. Similarly, judgment must be applied in estimating prices for lessreadily observable external parameters. Finally, other factors such as modelassumptions, market dislocations and unexpected correlations can affect esti-mates of fair value. Imprecision in estimating these factors can impact theamount of revenue or loss recorded for a particular position.
Trading and available-for-sale portfoliosThe majority of the Firm’s securities held for trading and investment purposes (“long” positions) and securities that the Firm has sold to other parties but does not own (“short” positions) are valued based upon quotedmarket prices. However, certain securities are traded less actively and, therefore,are not always able to be valued based upon quoted market prices. The determination of their fair value requires management judgment, as thisdetermination may require benchmarking to similar instruments or analyzingdefault and recovery rates. Examples include certain collateralized mortgageand debt obligations and high-yield debt securities.
As few derivative contracts are listed on an exchange, the majority of theFirm’s derivative positions are valued using internally developed models thatuse as their basis readily observable market parameters – that is, parametersthat are actively quoted and can be validated to external sources, includingindustry-pricing services. Certain derivatives, however, are valued based uponmodels with significant unobservable market parameters – that is, parametersthat must be estimated and are, therefore, subject to management judgmentto substantiate the model valuation. These instruments are normally eithertraded less actively or trade activity is one way. Examples include long-datedinterest rate or currency swaps, where swap rates may be unobservable forlonger maturities, and certain credit products, where correlation and recoveryrates are unobservable. Due to the lack of observable market data, the Firmdefers the initial trading profit for these financial instruments. The deferred profitis recognized in Principal transactions revenue on a systematic basis (typicallystraight-line amortization over the life of the instruments) when observable mar-ket data becomes available. Management’s judgment includes recording fairvalue adjustments (i.e., reductions) to model valuations to account for param-eter uncertainty when valuing complex or less actively traded derivative trans-actions. The following table summarizes the Firm’s trading and available-for-sale portfolios by valuation methodology at December 31, 2006:
Trading assets Trading liabilities
Securities Securities AFSDecember 31, 2006 purchased(a) Derivatives(b) sold(a) Derivatives(b) securities
Fair value based upon:Quoted market prices 83% 3% 97% 3% 97%Internal models with significant
observable market parameters 13 96 3 95 3
Internal models with significantunobservable market parameters 4 1 — 2 —
Total 100% 100% 100% 100% 100%
(a) Reflected as debt and equity instruments on the Firm’s Consolidated balance sheets.(b) Based upon gross mark-to-market valuations of the Firm’s derivatives portfolio prior to netting positions pursuant to FIN 39, as cross-product netting is not relevant to an analysis based upon valua-
tion methodologies.
To ensure that the valuations are appropriate, the Firm has various controls inplace. These include: an independent review and approval of valuation models;detailed review and explanation for profit and loss analyzed daily and overtime; decomposing the model valuations for certain structured derivativeinstruments into their components and benchmarking valuations, where possible,to similar products; and validating valuation estimates through actual cashsettlement. As markets and products develop and the pricing for certain derivative products becomes more transparent, the Firm continues to refine itsvaluation methodologies.
For further discussion of market risk management, including the model reviewprocess, see Market risk management on pages 77–80 of this Annual Report.For further details regarding the Firm’s valuation methodologies, see Note 31on pages 135–137 of this Annual Report.
Loans held-for-saleThe fair value of loans in the held-for-sale portfolio generally is based uponobservable market prices of similar instruments, including bonds, credit derivatives and loans with similar characteristics. If market prices are notavailable, fair value is based upon the estimated cash flows adjusted for creditrisk that is discounted using an interest rate appropriate for the maturity ofthe applicable loans.
Commodities inventoryThe majority of commodities inventory includes bullion and base metalswhere fair value is determined by reference to prices in highly active and liquid markets. The fair value of other commodities inventory is determinedprimarily using prices and data derived from the markets on which the underly-ing commodities are traded. Market prices used may be adjusted for liquidity.
Private equity investmentsValuation of private investments held primarily by the Private Equity businesswithin Corporate requires significant management judgment due to theabsence of quoted market prices, inherent lack of liquidity and the long-termnature of such assets. Private equity investments are valued initially basedupon cost. The carrying values of private equity investments are adjusted fromcost to reflect both positive and negative changes evidenced by financingevents with third-party capital providers. In addition, these investments aresubject to ongoing impairment reviews by Private Equity’s senior investmentprofessionals. A variety of factors are reviewed and monitored to assessimpairment including, but not limited to, operating performance and futureexpectations of the particular portfolio investment, industry valuations of com-parable public companies, changes in market outlook and the third-partyfinancing environment over time.
JPMorgan Chase & Co. / 2006 Annual Report 85
For a discussion of the accounting for Private equity investments, see Note 4on pages 98–99 of this Annual Report.
MSRs and certain other retained interests in securitizationsMSRs and certain other retained interests from securitization activities do nottrade in an active, open market with readily observable prices. For example,sales of MSRs do occur, but the precise terms and conditions typically are notreadily available. Accordingly, the Firm estimates the fair value of MSRs andcertain other retained interests in securitizations using discounted future cashflow (DCF) models.
For MSRs, the Firm uses an option adjusted spread (“OAS”) valuation modelin conjunction with the Firm’s proprietary prepayment model to project MSRcash flows over multiple interest rate scenarios, which are then discounted atrisk-adjusted rates to estimate an expected fair value of the MSRs. The OASmodel considers portfolio characteristics, contractually specified servicing fees,prepayment assumptions, delinquency rates, late charges, other ancillary rev-enues, costs to service and other economic factors.
For certain other retained interests in securitizations (such as interest-onlystrips), a single interest rate path DCF model is used and generally includesassumptions based upon projected finance charges related to the securitizedassets, estimated net credit losses, prepayment assumptions, and contractualinterest paid to third-party investors. Changes in the assumptions used mayhave a significant impact on the Firm’s valuation of retained interests.
For both MSRs and certain other retained interests in securitizations, the Firmcompares its fair value estimates and assumptions to observable market datawhere available and to recent market activity and actual portfolio experience.
For further discussion of the most significant assumptions used to valueretained interests in securitizations and MSRs, as well as the applicable stresstests for those assumptions, see Notes 14 and 16 on pages 114–118 and121–122, respectively, of this Annual Report.
Goodwill impairmentUnder SFAS 142, goodwill must be allocated to reporting units and tested forimpairment. The Firm tests goodwill for impairment at least annually, and morefrequently if events or circumstances, such as adverse changes in the businessclimate, indicate that there may be justification for conducting an interim test.Impairment testing is performed at the reporting-unit level (which is generallyone level below the six major business segments identified in Note 33 on pages 139–141 of this Annual Report, plus Private Equity which is included inCorporate). The first part of the test is a comparison, at the reporting unit level,of the fair value of each reporting unit to its carrying amount, including good-will. If the fair value is less than the carrying value, then the second part of thetest is needed to measure the amount of potential goodwill impairment. Theimplied fair value of the reporting unit goodwill is calculated and comparedwith the carrying amount of goodwill recorded in the Firm’s financial records.If the carrying value of reporting unit goodwill exceeds the implied fair value ofthat goodwill, then the Firm would recognize an impairment loss in the amountof the difference, which would be recorded as a charge against Net income.
The fair values of the reporting units are determined using discounted cashflow models based upon each reporting unit’s internal forecasts. In addition,analysis using market-based trading and transaction multiples, where available,are used to assess the reasonableness of the valuations derived from the discounted cash flow models.
Accounting for share-based paymentsEffective January 1, 2006, the Firm adopted SFAS 123R and all related inter-pretations using the modified prospective transition method. SFAS 123Rrequires all share-based payments to employees, including employee stockoptions and stock-settled stock appreciation right (“SARs”), to be measuredat their grant date fair values. For additional information related to SFAS123R, see Note 8 on pages 105–107 of this Annual Report.
Accounting for certain hybrid financial instruments – an amend-ment of FASB Statements No. 133 and 140In February 2006, the FASB issued SFAS 155, which applies to certain“hybrid financial instruments” which are defined as financial instrumentsthat contain embedded derivatives. The new standard establishes a require-ment to evaluate beneficial interests in securitized financial assets to deter-mine if the interests represent freestanding derivatives or are hybrid finan-cial instruments containing embedded derivatives requiring bifurcation. It
also permits an irrevocable election for fair value remeasurement of anyhybrid financial instrument containing an embedded derivative that other-wise would require bifurcation under SFAS 133. The Firm adopted this stan-dard effective January 1, 2006. For additional information related to SFAS155, see Note 1 on page 95 of this Annual Report.
Accounting for servicing of financial assetsIn March 2006, the FASB issued SFAS 156, which is effective as of the begin-ning of the first fiscal year beginning after September 15, 2006, with earlyadoption permitted. JPMorgan Chase elected to adopt the standard effectiveJanuary 1, 2006. The standard permits an entity a one-time irrevocable elec-tion to adopt fair value accounting for a class of servicing assets. The Firmhas defined MSRs as one class of servicing assets for this election. For addi-tional information related to the Firm’s adoption of SFAS 156 with respect toMSRs, see Note 16 on pages 121–122 of this Annual Report.
ACCOUNT ING AND REPORT ING DEVELOPMENTS
MANAGEMENT’S DISCUSSION AND ANALYSISJPMorgan Chase & Co.
86 JPMorgan Chase & Co. / 2006 Annual Report
Postretirement benefit plansIn September 2006, the FASB issued SFAS 158, which requires recognition inthe Consolidated balance sheets of the overfunded or underfunded status ofdefined benefit postretirement plans, measured as the difference betweenthe fair value of plan assets and the amount of the benefit obligation. TheFirm adopted SFAS 158 on a prospective basis on December 31, 2006. SFAS158 has no impact either on the measurement of the Firm’s plan assets orbenefit obligations, or on how the Firm determines its net periodic benefitcosts. For additional information related to SFAS 158, see Note 7 on pages100–105 of this Annual Report.
Accounting for uncertainty in income taxes and changes in timingof cash flows related to income taxes generated by a leveragedleaseIn July 2006, the FASB issued two pronouncements: FIN 48, which clarifiesthe accounting for uncertainty in income taxes recognized under SFAS 109,and the related FSP FAS 13-2. FIN 48 addresses the recognition and meas-urement of tax positions taken or expected to be taken, and also providesguidance on derecognition, classification, interest and penalties, accountingin interim periods, and disclosure. FSP FAS 13-2 requires the recalculation ofreturns on leveraged leases if there is a change or projected change in thetiming of cash flows relating to income taxes generated by a leveragedlease. The Firm will apply FIN 48 to all of its income tax positions at therequired effective date of January 1, 2007 under the transition provisions ofthe Interpretation. JPMorgan Chase currently estimates that the cumulativeeffect adjustment to implement FIN 48 will increase the January 1, 2007balance of Retained earnings by approximately $400 million. However, thestandard continues to be interpreted and the FASB is expected to issueadditional guidance on FIN 48, which could affect this estimate. Accordingly,JPMorgan Chase will continue its assessment of the impact of FIN 48 on itsfinancial condition and results of operations. The guidance in FSP FAS 13-2will also be effective for the Firm on January 1, 2007. Implementation ofFSP FAS 13-2 is expected to result in immaterial adjustments.
Fair value measurementsIn September 2006, the FASB issued SFAS 157, which is effective for fiscalyears beginning after November 15, 2007, with early adoption permitted.SFAS 157 defines fair value, establishes a framework for measuring fairvalue, and expands disclosures about assets and liabilities measured at fairvalue. The new standard provides a consistent definition of fair value whichfocuses on exit price and prioritizes, within a measurement of fair value, theuse of market-based inputs over entity-specific inputs. The standard alsoestablishes a three-level hierarchy for fair value measurements based on thetransparency of inputs to the valuation of an asset or liability as of themeasurement date. SFAS 157 nullifies the guidance in EITF 02-3 whichrequired the deferral of profit at inception of a transaction involving a deriv-ative financial instrument in the absence of observable data supporting thevaluation technique. The standard also eliminates large position discountsfor financial instruments quoted in active markets and requires considera-tion of nonperformance risk when valuing liabilities. Currently, the fair valueof the Firm’s derivative payables does not incorporate a valuation adjust-ment to reflect JPMorgan Chase’s credit quality.
The Firm intends to early adopt SFAS 157 effective January 1, 2007, andexpects to record a cumulative effect after-tax increase to retained earningsof approximately $250 million related to the release of profit previouslydeferred in accordance with EITF 02-3. In order to determine the amount ofthis transition adjustment and to confirm that the Firm’s valuation policiesare consistent with exit price as prescribed by SFAS 157, the Firm reviewedits derivative valuations in consideration of all available evidence includingrecent transactions in the marketplace, indicative pricing services and theresults of back-testing similar transaction types. In addition, the Firm expectsto record adjustments to earnings related to the incorporation of the Firm’snonperformance risk in the valuation of liabilities recorded at fair value andfor private equity investments where there is significant market evidence tosupport an increase in value but there has been no third-party market trans-action related to the capital structure of the investment. The application ofSFAS 157 involves judgement and interpretation. The Firm continues tomonitor and evaluate the developing interpretations.
Fair value option for financial assets and financial liabilitiesIn February 2007, the FASB issued SFAS 159, which is effective for fiscalyears beginning after November 15, 2007, with early adoption permitted.SFAS 159 provides an option for companies to elect fair value as an alterna-tive measurement for selected financial assets, financial liabilities, unrecog-nized firm commitments, and written loan commitments. Under SFAS 159,fair value would be used for both the initial and subsequent measurementof the designated assets, liabilities and commitments, with the changes invalue recognized in earnings. The Firm is reviewing the recently releasedstandard and assessing what elections it may make as part of an earlyadoption effective January 1, 2007.
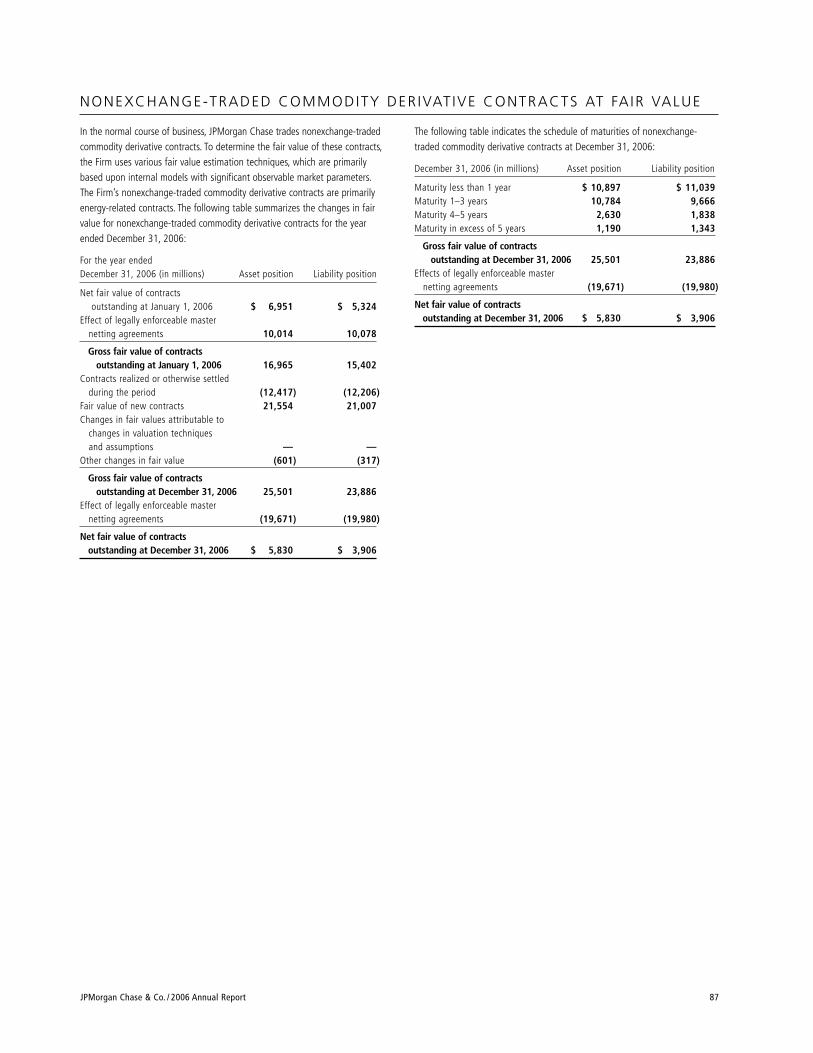
JPMorgan Chase & Co. / 2006 Annual Report 87
In the normal course of business, JPMorgan Chase trades nonexchange-tradedcommodity derivative contracts. To determine the fair value of these contracts,the Firm uses various fair value estimation techniques, which are primarilybased upon internal models with significant observable market parameters.The Firm’s nonexchange-traded commodity derivative contracts are primarilyenergy-related contracts. The following table summarizes the changes in fairvalue for nonexchange-traded commodity derivative contracts for the yearended December 31, 2006:
For the year ended December 31, 2006 (in millions) Asset position Liability position
Net fair value of contracts outstanding at January 1, 2006 $ 6,951 $ 5,324
Effect of legally enforceable master netting agreements 10,014 10,078
Gross fair value of contracts outstanding at January 1, 2006 16,965 15,402
Contracts realized or otherwise settled during the period (12,417) (12,206)
Fair value of new contracts 21,554 21,007Changes in fair values attributable to
changes in valuation techniques and assumptions — —
Other changes in fair value (601) (317)
Gross fair value of contracts outstanding at December 31, 2006 25,501 23,886
Effect of legally enforceable master netting agreements (19,671) (19,980)
Net fair value of contracts outstanding at December 31, 2006 $ 5,830 $ 3,906
The following table indicates the schedule of maturities of nonexchange-traded commodity derivative contracts at December 31, 2006:
December 31, 2006 (in millions) Asset position Liability position
Maturity less than 1 year $ 10,897 $ 11,039Maturity 1–3 years 10,784 9,666Maturity 4–5 years 2,630 1,838Maturity in excess of 5 years 1,190 1,343
Gross fair value of contracts outstanding at December 31, 2006 25,501 23,886
Effects of legally enforceable master netting agreements (19,671) (19,980)
Net fair value of contracts outstanding at December 31, 2006 $ 5,830 $ 3,906
NONEXCHANGE-TRADED COMMODITY DER IVAT IVE CONTRACTS AT FA IR VALUE