Embed Size (px)
Citation preview
Management’s discussion and analysis
JPMorgan Chase & Co. / 2008 Annual Report 39
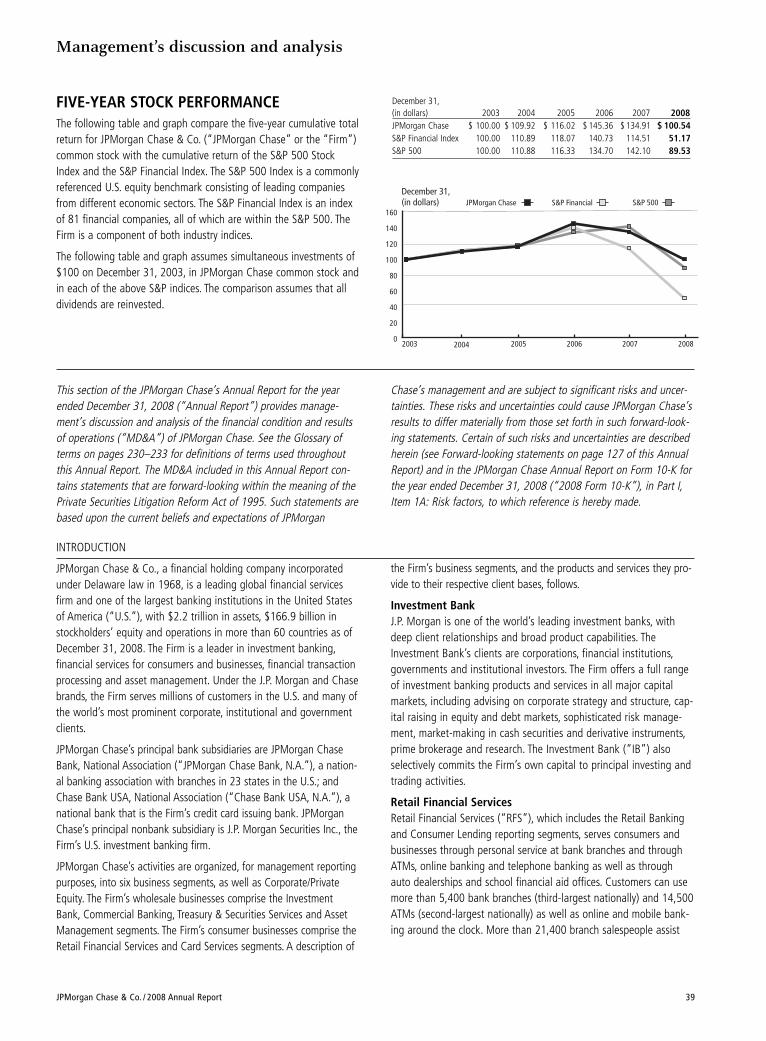
FIVE-YEAR STOCK PERFORMANCE The following table and graph compare the five-year cumulative totalreturn for JPMorgan Chase & Co. (“JPMorgan Chase” or the “Firm”)common stock with the cumulative return of the S&P 500 StockIndex and the S&P Financial Index. The S&P 500 Index is a commonlyreferenced U.S. equity benchmark consisting of leading companiesfrom different economic sectors. The S&P Financial Index is an indexof 81 financial companies, all of which are within the S&P 500. TheFirm is a component of both industry indices.
The following table and graph assumes simultaneous investments of$100 on December 31, 2003, in JPMorgan Chase common stock andin each of the above S&P indices. The comparison assumes that alldividends are reinvested.
This section of the JPMorgan Chase’s Annual Report for the yearended December 31, 2008 (“Annual Report”) provides manage-ment’s discussion and analysis of the financial condition and resultsof operations (“MD&A”) of JPMorgan Chase. See the Glossary ofterms on pages 230–233 for definitions of terms used throughoutthis Annual Report. The MD&A included in this Annual Report con-tains statements that are forward-looking within the meaning of thePrivate Securities Litigation Reform Act of 1995. Such statements arebased upon the current beliefs and expectations of JPMorgan
December 31,(in dollars) 2003 2004 2005 2006 2007 2008JPMorgan Chase $ 100.00 $ 109.92 $ 116.02 $ 145.36 $ 134.91 $ 100.54S&P Financial Index 100.00 110.89 118.07 140.73 114.51 51.17S&P 500 100.00 110.88 116.33 134.70 142.10 89.53
0
20
40
60
80
100
120
140
160
December 31,(in dollars)
2003 2004 2005 2006 2007 2008
S&P Financial S&P 500JPMorgan Chase
Chase’s management and are subject to significant risks and uncer-tainties. These risks and uncertainties could cause JPMorgan Chase’sresults to differ materially from those set forth in such forward-look-ing statements. Certain of such risks and uncertainties are describedherein (see Forward-looking statements on page 127 of this AnnualReport) and in the JPMorgan Chase Annual Report on Form 10-K forthe year ended December 31, 2008 (“2008 Form 10-K”), in Part I,Item 1A: Risk factors, to which reference is hereby made.
INTRODUCTION
JPMorgan Chase & Co., a financial holding company incorporatedunder Delaware law in 1968, is a leading global financial servicesfirm and one of the largest banking institutions in the United Statesof America (“U.S.”), with $2.2 trillion in assets, $166.9 billion instockholders’ equity and operations in more than 60 countries as ofDecember 31, 2008. The Firm is a leader in investment banking,financial services for consumers and businesses, financial transactionprocessing and asset management. Under the J.P. Morgan and Chasebrands, the Firm serves millions of customers in the U.S. and many ofthe world’s most prominent corporate, institutional and governmentclients.
JPMorgan Chase’s principal bank subsidiaries are JPMorgan ChaseBank, National Association (“JPMorgan Chase Bank, N.A.”), a nation-al banking association with branches in 23 states in the U.S.; andChase Bank USA, National Association (“Chase Bank USA, N.A.”), anational bank that is the Firm’s credit card issuing bank. JPMorganChase’s principal nonbank subsidiary is J.P. Morgan Securities Inc., theFirm’s U.S. investment banking firm.
JPMorgan Chase’s activities are organized, for management reportingpurposes, into six business segments, as well as Corporate/PrivateEquity. The Firm’s wholesale businesses comprise the InvestmentBank, Commercial Banking, Treasury & Securities Services and AssetManagement segments. The Firm’s consumer businesses comprise theRetail Financial Services and Card Services segments. A description of
the Firm’s business segments, and the products and services they pro-vide to their respective client bases, follows.
Investment Bank J.P. Morgan is one of the world’s leading investment banks, withdeep client relationships and broad product capabilities. TheInvestment Bank’s clients are corporations, financial institutions,governments and institutional investors. The Firm offers a full rangeof investment banking products and services in all major capitalmarkets, including advising on corporate strategy and structure, cap-ital raising in equity and debt markets, sophisticated risk manage-ment, market-making in cash securities and derivative instruments,prime brokerage and research. The Investment Bank (“IB”) alsoselectively commits the Firm’s own capital to principal investing andtrading activities.
Retail Financial Services Retail Financial Services (“RFS”), which includes the Retail Bankingand Consumer Lending reporting segments, serves consumers andbusinesses through personal service at bank branches and throughATMs, online banking and telephone banking as well as throughauto dealerships and school financial aid offices. Customers can usemore than 5,400 bank branches (third-largest nationally) and 14,500ATMs (second-largest nationally) as well as online and mobile bank-ing around the clock. More than 21,400 branch salespeople assist
Management’s discussion and analysis
40 JPMorgan Chase & Co. / 2008 Annual Report
customers with checking and savings accounts, mortgages, homeequity and business loans, and investments across the 23-state foot-print from New York and Florida to California. Consumers also canobtain loans through more than 16,000 auto dealerships and 4,800schools and universities nationwide.
Card Services Chase Card Services (“CS”) is one of the nation’s largest credit cardissuers with more than 168 million cards in circulation and morethan $190 billion in managed loans. Customers used Chase cards tomeet more than $368 billion worth of their spending needs in 2008.Chase has a market leadership position in building loyalty andrewards programs with many of the world’s most respected brandsand through its proprietary products, which include the ChaseFreedom program.
Through its merchant acquiring business, Chase PaymentechSolutions, Chase is one of the leading processors of MasterCard andVisa payments.
Commercial Banking Commercial Banking (“CB”) serves more than 26,000 clients nation-ally, including corporations, municipalities, financial institutions andnot-for-profit entities with annual revenue generally ranging from$10 million to $2 billion, and nearly 30,000 real estateinvestors/owners. Delivering extensive industry knowledge, localexpertise and dedicated service, CB partners with the Firm’s otherbusinesses to provide comprehensive solutions, including lending,treasury services, investment banking and asset management tomeet its clients’ domestic and international financial needs.
Treasury & Securities Services Treasury & Securities Services (“TSS”) is a global leader in transac-tion, investment and information services. TSS is one of the world’slargest cash management providers and a leading global custodian.Treasury Services (“TS”) provides cash management, trade, wholesalecard and liquidity products and services to small and mid-sized com-panies, multinational corporations, financial institutions and govern-ment entities. TS partners with the Commercial Banking, RetailFinancial Services and Asset Management businesses to serve clientsfirmwide. As a result, certain TS revenue is included in other seg-ments’ results. Worldwide Securities Services (“WSS”) holds, values,clears and services securities, cash and alternative investments forinvestors and broker-dealers, and manages depositary receipt pro-grams globally.
Asset Management Asset Management (“AM”), with assets under supervision of $1.5trillion, is a global leader in investment and wealth management. AMclients include institutions, retail investors and high-net-worth indi-viduals in every major market throughout the world. AM offers globalinvestment management in equities, fixed income, real estate, hedgefunds, private equity and liquidity, including money market instru-ments and bank deposits. AM also provides trust and estate, bankingand brokerage services to high-net-worth clients, and retirementservices for corporations and individuals. The majority of AM’s clientassets are in actively managed portfolios.
JPMorgan Chase & Co. / 2008 Annual Report 41
EXECUTIVE OVERVIEW
This overview of management’s discussion and analysis highlightsselected information and may not contain all of the information thatis important to readers of this Annual Report. For a completedescription of events, trends and uncertainties, as well as the capital,liquidity, credit and market risks, and the critical accounting esti-mates affecting the Firm and its various lines of business, thisAnnual Report should be read in its entirety.
Business overviewJPMorgan Chase reported 2008 net income of $5.6 billion, or $1.37per share, and total net revenue of $67.3 billion, compared withrecord net income of $15.4 billion, or $4.38 per share, and recordtotal net revenue of $71.4 billion, for 2007. Return on common equi-ty was 4% in 2008, compared with 13% in 2007. Results in 2008include the acquisition of The Bear Stearns Companies Inc. (“BearStearns”) on May 30, 2008, and the acquisition of the banking oper-ations of Washington Mutual Bank (“Washington Mutual”) onSeptember 25, 2008.
The decline in net income for the year was the result of a significant-ly higher provision for credit losses, reflecting the addition of $13.7billion to the Firm’s allowance for credit losses in 2008; a decline intotal net revenue driven by over $10 billion of markdowns on mort-gage-related positions and leveraged lending exposures in theInvestment Bank; and an increase in total noninterest expense due
to the impact of the Washington Mutual transaction and the BearStearns merger.
The business environment for financial services firms was extremelychallenging in 2008. The global economy slowed, with many coun-tries, including the U.S., slipping into recession. Financial conditionsworsened throughout the year amid a number of unprecedenteddevelopments that undermined the economic outlook and erodedconfidence in global financial markets. JPMorgan Chase acquiredBear Stearns through a merger consummated in May and acquiredthe banking operations of Washington Mutual from the FederalDeposit Insurance Corporation (“FDIC”) in September. The U.S. feder-al government placed the Federal Home Loan Mortgage Corporation(“Freddie Mac”) and the Federal National Mortgage Association(“Fannie Mae”) under its control. Lehman Brothers Holdings Inc.declared bankruptcy. The Bank of America Corporation acquiredMerrill Lynch & Co., Inc. and Wells Fargo & Company acquiredWachovia Corporation. The government provided a loan to AmericanInternational Group, Inc. (“AIG”) in exchange for an equity interest inAIG to prevent the insurer’s failure. Morgan Stanley, The GoldmanSachs Group, Inc., GMAC, American Express, Discover FinancialServices and CIT Group received approval from the Board ofGovernors of the Federal Reserve System (the “Federal Reserve”) tobecome federal bank holding companies. In other industries, the U.S.government provided temporary loans to General MotorsCorporation and Chrysler LLC.
These events accompanied severe strains in term funding markets,reflecting heightened concerns about counterparty risk. As a result,LIBOR rates rose significantly in the fall, despite a round of coordinat-ed rate cuts by a number of central banks. By year-end, LIBOR rateseased in response to proposals to insure deposits and selected debtof financial institutions. The turmoil in financial markets during 2008led to tighter credit conditions and diminished liquidity, causing con-sumers and businesses around the world to become more cautiousand curtail spending and investment activity. As a result, the U.S.economy contracted sharply, 2.8 million jobs were lost in 2008, andthe U.S. unemployment rate rose significantly, to 7.2% by year-end.
The continued economic and financial disruption led the FederalReserve to reduce its target overnight interest rates to near zero inthe fourth quarter of 2008, capping off a year of near-continuous ratereductions. In addition, the U.S. Department of the Treasury (the “U.S.Treasury”), the Federal Reserve and the FDIC, working in cooperationwith foreign governments and other central banks, including the Bankof England, the European Central Bank and the Swiss National Bank,began, in the fourth quarter of 2008, to take a variety of extraordi-nary measures designed to restore confidence in the financial marketsand strengthen financial institutions, including capital injections, guar-antees of bank liabilities and the acquisition of illiquid assets frombanks. In particular, on October 3, 2008, the Emergency EconomicStabilization Act of 2008 (the “EESA”) was signed into law. Pursuantto the EESA, the U.S. Treasury has the authority to take a range of
Financial performance of JPMorgan ChaseYear ended December 31,(in millions, except per share and ratio data) 2008
(c)2007 Change
Selected income statement dataTotal net revenue $ 67,252 $ 71,372 (6)%Provision for credit losses(a) 20,979 6,864 206Total noninterest expense 43,500 41,703 4Income before extraordinary gain 3,699 15,365 (76)Extraordinary gain(b) 1,906 — NMNet income 5,605 15,365 (64)
Diluted earnings per share Income before extraordinary gain $ 0.84 $ 4.38 (81)Net income 1.37 4.38 (69)Return on common equityIncome before extraordinary gain 2% 13%Net income 4% 13%
(a) Includes an accounting conformity provision for credit losses of $1.5 billion related tothe acquisition of Washington Mutual Bank’s banking operations in 2008.
(b) JPMorgan Chase acquired the banking operations of Washington Mutual Bank from theFederal Deposit Insurance Corporation (“FDIC”) for $1.9 billion. The fair value of the netassets acquired from the FDIC exceeded the purchase price which resulted in negativegoodwill. In accordance with SFAS 141, nonfinancial assets that are not held-for-salewere written down against that negative goodwill. The negative goodwill that remainedafter writing down nonfinancial assets was recognized as an extraordinary gain in 2008.The allocation of the purchase price to the net assets acquired (based on their respectivefair values at September 25, 2008) and the resulting negative goodwill may be modifiedthrough September 25, 2009, as more information is obtained about the fair value ofassets acquired and liabilities assumed.
(c) On September 25, 2008, JPMorgan Chase acquired the banking operations ofWashington Mutual Bank. On May 30, 2008, the merger with The Bear StearnsCompanies, Inc. was consummated. Each of these transactions was accounted for as apurchase and their respective results of operations are included in the Firm’s results fromeach respective transaction date. For additional information on these transactions, seeNote 2 on pages 135–140 of this Annual Report.
Management’s discussion and analysis
42 JPMorgan Chase & Co. / 2008 Annual Report
actions to stabilize and provide liquidity to the U.S. financial markets,including the purchase by the U.S. Treasury of certain troubled assetsfrom financial institutions (the “Troubled Asset Relief Program”) andthe direct purchase by the U.S. Treasury of equity of financial institu-tions (the “Capital Purchase Program”).
The efforts to restore confidence in the financial markets and promoteeconomic growth continue in 2009, with initiatives including a fiscalstimulus bill, the American Reinvestment and Recovery Act of 2009,which was signed into law by President Barack Obama on February17, 2009. Also in February, the U.S. Treasury outlined a plan to restorestability to the financial system and President Obama proposed a planto help distressed homeowners. The Federal Reserve, working withother government and regulatory agencies, has also implemented anumber of new programs to promote the proper functioning of thecredit markets and reintroduce liquidity to the financial system. Suchactions taken by U.S. regulatory agencies include the introduction ofprograms to restore liquidity to money market mutual funds, the com-mercial paper market, and other fixed-income securities markets. Inaddition, the FDIC issued a temporary liquidity guarantee program(the “TLG Program”) for the senior debt of all FDIC-insured institu-tions, as well as deposits in noninterest-bearing transaction depositaccounts.
Despite the difficult operating environment and overall drop in earn-ings, JPMorgan Chase maintained a strong balance sheet and pro-duced underlying growth in many business areas. The Tier 1 capitalratio was 10.9% at year-end; Treasury & Securities Services andCommercial Banking each reported record revenue and net incomefor the second straight year; the consumer businesses opened millionsof new checking and credit card accounts; Asset Management experi-enced record net inflows in assets under management; and theInvestment Bank gained market share in all major fee categories. Thediversified nature of the Firm’s businesses and its strong capital posi-tion enabled it to weather the recessionary environment during 2008.
JPMorgan Chase has taken a leadership role in helping to stabilizethe financial markets. It assumed the risk and expended the necessaryresources to acquire Bear Stearns and the banking operations ofWashington Mutual. In October 2008, the Firm agreed to accept a$25 billion capital investment by the U.S. Treasury under the CapitalPurchase Program. JPMorgan Chase has continued to lend to clientsin a safe and sound manner and to provide liquidity to multiple finan-cial markets. The Firm has implemented programs that have preventedmore than 300,000 foreclosures, with plans to help more than400,000 more families keep their homes through Chase-owned mort-gage modifications over the next two years. The Firm has expandedthis effort to include over $1.1 trillion of investor-owned mortgages.
The discussion that follows highlights the performance of each busi-ness segment compared with the prior year, and discusses results on amanaged basis unless otherwise noted. For more information aboutmanaged basis, see Explanation and reconciliation of the Firm’s use ofnon-GAAP financial measures on pages 50–51 of this Annual Report.
Investment Bank reported a net loss for the year, compared withnet income in 2007. The significant decline in results reflected lowertotal net revenue, a higher provision for credit losses and higher totalnoninterest expense. Markdowns of over $10 billion on mortgage-related positions and leveraged lending funded and unfunded com-mitments drove fixed income trading revenue lower; investmentbanking fees and equity trading revenue declined as well. Thesedecreases were offset by record performance in rates and currencies,credit trading, commodities and emerging markets, as well as strongequity client revenue, and gains from the widening of the Firm’scredit spread on certain structured liabilities and derivatives. The pro-vision for credit losses rose from the 2007 level, predominantlyreflecting a higher allowance for credit losses, driven by a weakeningcredit environment, as well as the effect of the transfer of $4.9 bil-lion of funded and unfunded leveraged lending commitments toretained loans from held-for-sale in the first quarter of 2008. Theincrease in total noninterest expense was largely driven by additionalexpense relating to the Bear Stearns merger, offset partially by lowerperformance-based compensation expense. In addition, IB benefitedfrom a reduction in deferred tax liabilities on overseas earnings.
Retail Financial Services net income declined, reflecting a signifi-cant increase in the provision for credit losses, predominantly offset bypositive mortgage servicing rights (“MSR”) risk management resultsand the positive impact of the Washington Mutual transaction.Additional drivers of revenue growth included wider loan and depositspreads and higher loan and deposit balances. The provision for creditlosses increased as housing price declines have continued to result insignificant increases in estimated losses, particularly for high loan-to-value home equity and mortgage loans. The provision was also affect-ed by an increase in estimated losses for the auto, student and busi-ness banking loan portfolios. Total noninterest expense rose from the2007 level, reflecting the impact of the Washington Mutual transac-tion, higher mortgage reinsurance losses, increased mortgage servic-ing expense and investments in the retail distribution network.
Card Services net income declined, driven by a higher provision forcredit losses partially offset by higher managed total net revenue. Thegrowth in managed total net revenue was driven by the impact ofthe Washington Mutual transaction, higher average managed loanbalances, wider loan spreads and increased interchange income, off-set predominantly by increased rewards expense and higher volume-driven payments to partners, as well as the effect of higher revenuereversals associated with higher charge-offs. The managed provisionfor credit losses increased from the prior year due to an increase inthe allowance for loan losses and a higher level of charge-offs. Totalnoninterest expense rose from last year, largely due to the impact ofthe Washington Mutual transaction.
Commercial Banking net income increased, surpassing the recordlevel posted in 2007. The results were driven by record total net rev-enue, partially offset by an increase in the provision for credit losses.The increase in revenue was driven by double-digit growth in liabilityand loan balances, the impact of the Washington Mutual transaction,higher deposit and lending-related fees, and increases in other fee
JPMorgan Chase & Co. / 2008 Annual Report 43
income. These were partially offset by spread compression in the lia-bility and loan portfolios. The increase in the provision for credit loss-es reflected a weakening credit environment and growth in loan bal-ances. Total noninterest expense decreased from the prior year, dueto lower performance-based incentive compensation and volume-based charges from service providers, predominantly offset by theimpact of the Washington Mutual transaction.
Treasury & Securities Services net income increased over therecord level set in 2007, driven by record total net revenue, partiallyoffset by higher noninterest expense. Worldwide Securities Servicesposted record net revenue, driven by wider spreads in securities lend-ing, foreign exchange and liability products, increased product usageby new and existing clients, and higher liability balances. These bene-fits were partially offset by market depreciation. Treasury Servicesposted record net revenue, reflecting higher liability balances andvolume growth in electronic funds transfer products and trade loans.Total noninterest expense increased, reflecting higher expense relat-ed to business and volume growth, as well as continued investmentin new product platforms.
Asset Management net income decreased, driven by lower total netrevenue, offset partially by lower total noninterest expense. The declinein revenue was due to lower performance fees and the effect of lowermarkets, including the impact of lower market valuations of seed capi-tal investments. Partially offsetting these revenue declines were higherdeposit and loan balances, the benefit of the Bear Stearns merger,increased revenue from net asset inflows and wider deposit spreads.The provision for credit losses rose from the prior year, reflecting anincrease in loan balances, higher net charge-offs and a weakeningcredit environment. Total noninterest expense declined compared with2007, driven by lower performance-based compensation, largely offsetby the effect of the Bear Stearns merger and higher compensationexpense resulting from increased average headcount.
Corporate/Private Equity net income declined from the 2007level and included an extraordinary gain related to the WashingtonMutual transaction and a conforming loan loss provision. Excludingthese items, the decrease in net income from the prior year was driv-en by private equity losses in 2008, compared with gains in 2007,losses on preferred securities of Fannie Mae and Freddie Mac, and acharge related to the offer to repurchase auction-rate securities.These declines were partially offset by the proceeds from the sale ofVisa shares in its initial public offering and a gain on the dissolutionof the Chase Paymentech Solutions joint venture and the gain fromthe sale of MasterCard shares. The decrease in total noninterestexpense reflected a reduction of credit card-related litigationexpense, partially offset by higher merger costs.
The Firm’s managed provision for credit losses was $24.6 billion for2008, compared with $9.2 billion for 2007. The total consumer-man-aged provision for credit losses was $21.3 billion, compared with$8.3 billion in the prior year, reflecting increases in the allowance forcredit losses related to home equity, mortgage and credit card loans,as well as higher net charge-offs. Consumer-managed net charge-offs were $13.0 billion, compared with $6.8 billion in the prior year,resulting in managed net charge-off rates of 3.06% and 1.97%,respectively. The wholesale provision for credit losses was $3.3 bil-
lion, compared with $934 million in the prior year, due to anincrease in the allowance for credit losses reflecting the effect of aweakening credit environment and loan growth. Wholesale netcharge-offs were $402 million, compared with net charge-offs of$72 million in the prior year, resulting in net charge-off rates of0.18% and 0.04%, respectively. The Firm had total nonperformingassets of $12.7 billion at December 31, 2008, up from the prior-yearlevel of $3.9 billion.
Total stockholders’ equity at December 31, 2008, was $166.9 bil-lion, and the Tier 1 capital ratio was 10.9%. During 2008, the Firmraised $11.5 billion of common equity and $32.8 billion of preferredequity, including a warrant issued to the U.S. Treasury.
2009 Business outlookThe following forward-looking statements are based upon the cur-rent beliefs and expectations of JPMorgan Chase’s management andare subject to significant risks and uncertainties. These risks anduncertainties could cause JPMorgan Chase’s actual results to differmaterially from those set forth in such forward-looking statements.
JPMorgan Chase’s outlook for 2009 should be viewed against thebackdrop of the global and U.S. economies, financial markets activity,the geopolitical environment, the competitive environment and clientactivity levels. Each of these linked factors will affect the performanceof the Firm and its lines of business. In addition, as a result of recentmarket conditions and events, Congress and regulators have increasedtheir focus on the regulation of financial institutions. The Firm’s currentexpectations are for the global and U.S. economic environments toweaken further and potentially faster, capital markets to remain understress, for there to be continued decline in U.S. housing prices, and forCongress and regulators to continue to adopt legislation and regula-tions that could limit or restrict the Firm’s operations, or impose addi-tional costs upon the Firm in order to comply with such new laws orrules. These factors are likely to continue to adversely impact the Firm’srevenue, credit costs, overall business volumes and earnings.
Given the potential stress on the consumer from rising unemploy-ment, the continued downward pressure on housing prices and theelevated national inventory of unsold homes, management remainsextremely cautious with respect to the credit outlook for home equity,mortgage and credit card portfolios. Management expects continueddeterioration in credit trends for the home equity, mortgage and creditcard portfolios, which will likely require additions to the consumerloan loss allowance in 2009 or beyond. Economic data released inearly 2009 indicated that housing prices and the labor market haveweakened further since year-end, and that deterioration could continueinto late 2009. Based on management’s current economic outlook,quarterly net charge-offs could, over the next several quarters,reach $1.0 billion to $1.4 billion for the home equity portfolio,$375 million to $475 million for the prime mortgage portfolio, and$375 million to $475 million for the subprime mortgage portfolio.Management expects the managed net charge-off rate for CardServices (excluding the impact resulting from the acquisition ofWashington Mutual’s banking operations) to approach 7% in the firstquarter of 2009 and likely higher by the end of the year dependingon unemployment levels. These charge-off rates could increase evenfurther if the economic environment continues to deteriorate
Management’s discussion and analysis
44 JPMorgan Chase & Co. / 2008 Annual Report
further than management’s current expectations. The wholesale provi-sion for credit losses and nonperforming assets are likely to increaseover time as a result of the deterioration in underlying credit condi-tions. Wholesale net charge-offs in 2008 increased from historic lowsin 2007 and are likely to increase materially in 2009 as a result ofincreasing weakness in the credit environment.
The Investment Bank continues to be negatively affected by the dis-ruption in the credit and mortgage markets, as well as by overalllower levels of liquidity. The continuation of these factors couldpotentially lead to reduced levels of client activity, lower investmentbanking fees and lower trading revenue. In addition, if the Firm’sown credit spreads tighten, as they did in the fourth quarter of 2008,the change in the fair value of certain trading liabilities would alsonegatively affect trading results. The Firm held $12.6 billion (grossnotional) of legacy leveraged loans and unfunded commitments asheld-for-sale as of December 31, 2008. Markdowns averaging 45%of the gross notional value have been taken on these legacy posi-tions as of December 31, 2008, resulting in a net carrying value of$6.9 billion. Leveraged loans and unfunded commitments are difficultto hedge effectively, and if market conditions further deteriorate,additional markdowns may be necessary on this asset class. TheInvestment Bank also held, at December 31, 2008, an aggregate $6.1billion of prime and Alt-A mortgage exposure, which is also difficult tohedge effectively, and $875 million of subprime mortgage exposure.In addition, the Investment Bank had $7.7 billion of commercial mort-gage exposure. In spite of active hedging, mortgage exposures couldbe adversely affected by worsening market conditions and furtherdeterioration in the housing market. The combination of credit costsand additional markdowns on the various exposures noted abovecould reach or exceed $2.0 billion for the first quarter of 2009.
Earnings in Commercial Banking and Treasury & Securities Servicescould decline due to the impact of tighter spreads in the low interestrate environment or a decline in the level of liability balances. Earningsin Treasury & Securities Services and Asset Management will likelydeteriorate if market levels continue to decline, due to reduced levelsof assets under management, supervision and custody. Earnings in theCorporate/Private Equity segment could be more volatile due toincreases in the size of the Firm’s investment portfolio, which is largelycomprised of investment-grade securities. Private Equity results aredependent upon the capital markets and at current market levels, man-agement believes additional write-downs of $400 million or more arelikely in the first quarter of 2009.
Assuming economic conditions do not worsen beyond management’scurrent expectations, management continues to believe that the netincome impact of the acquisition of Washington Mutual’s bankingoperations could be approximately $0.50 per share in 2009; the BearStearns merger could contribute $1 billion (after-tax) annualized after2009; and merger-related items, which include both the WashingtonMutual transaction and the Bear Stearns merger, could be approxi-mately $600 million (after-tax) in 2009.
Recent developmentsOn February 23, 2009, the Board of Directors reduced the Firm's quar-terly common stock dividend from $0.38 to $0.05 per share, effectivefor the dividend payable April 30, 2009, to shareholders of record onApril 6, 2009. The action taken will enable the Firm to retain an addi-tional $5.0 billion in common equity per year. The Firm expects tomaintain the dividend at this level for the time being. The action wastaken in order to help ensure that the Firm’s balance sheet retainedthe capital strength necessary to weather a further decline in economicconditions. The Firm intends to return to a more normalized dividendpayout ratio as soon as feasible after the environment has stabilized.
JPMorgan Chase & Co. / 2008 Annual Report 45
CONSOL IDATED RESULTS OF OPERAT IONS
The following section provides a comparative discussion of JPMorganChase’s Consolidated Results of Operations on a reported basis forthe three-year period ended December 31, 2008. Factors that relatedprimarily to a single business segment are discussed in more detailwithin that business segment. For a discussion of the CriticalAccounting Estimates Used by the Firm that affect the ConsolidatedResults of Operations, see pages 119–123 of this Annual Report.
RevenueYear ended December 31, (in millions) 2008(a) 2007 2006
Investment banking fees $ 5,526 $ 6,635 $ 5,520Principal transactions (10,699) 9,015 10,778Lending & deposit-related fees 5,088 3,938 3,468Asset management, administration
and commissions 13,943 14,356 11,855Securities gains (losses) 1,560 164 (543)Mortgage fees and related income 3,467 2,118 591Credit card income 7,419 6,911 6,913Other income 2,169 1,829 2,175
Noninterest revenue 28,473 44,966 40,757Net interest income 38,779 26,406 21,242
Total net revenue $67,252 $ 71,372 $ 61,999
(a) On September 25, 2008, JPMorgan Chase acquired the banking operations of WashingtonMutual Bank. On May 30, 2008, the Bear Stearns merger was consummated. Each of thesetransactions was accounted for as a purchase and their respective results of operations areincluded in the Firm’s results from each respective transaction date. For additional informationon these transactions, see Note 2 on pages 135–140 of this Annual Report.
2008 compared with 2007 Total net revenue of $67.3 billion was down $4.1 billion, or 6%, fromthe prior year. The decline resulted from the extremely challengingbusiness environment for financial services firms in 2008. Principaltransactions revenue decreased significantly and included net mark-downs on mortgage-related positions and leveraged lending fundedand unfunded commitments, losses on preferred securities of FannieMae and Freddie Mac, and losses on private equity investments. Alsocontributing to the decline in total net revenue were other losses andmarkdowns recorded in other income, including the Firm’s share ofBear Stearns’ losses from April 8 to May 30, 2008. These declineswere largely offset by higher net interest income, proceeds from thesale of Visa shares in its initial public offering, and the gain on thedissolution of the Chase Paymentech Solutions joint venture.
Investment banking fees were down from the record level of theprior year due to lower debt underwriting fees, as well as lower advi-sory and equity underwriting fees, both of which were at record lev-els in 2007. These declines were attributable to reduced marketactivity. For a further discussion of investment banking fees, whichare primarily recorded in IB, see IB segment results on pages 54–56of this Annual Report.
In 2008, principal transactions revenue, which consists of revenuefrom the Firm’s trading and private equity investing activities,declined by $19.7 billion from the prior year. Trading revenuedecreased $14.5 billion to a negative $9.8 billion compared with apositive $4.7 billion in 2007. The decline in trading revenue waslargely driven by higher net markdowns of $5.9 billion on mortgage-
related exposures compared with $1.4 billion in the prior year; high-er net markdowns of $4.7 billion on leveraged lending funded andunfunded commitments compared with $1.3 billion in the prior year;losses of $1.1 billion on preferred securities of Fannie Mae andFreddie Mac; and weaker equity trading results compared with arecord level in 2007. In addition, trading revenue was adverselyimpacted by the Bear Stearns merger. Partially offsetting the declinein trading revenue were record results in rates and currencies, credittrading, commodities and emerging markets, as well as strong equityclient revenue across products and total gains of $2.0 billion fromthe widening of the Firm’s credit spread on certain structured liabili-ties and derivatives, compared with $1.3 billion in 2007. Privateequity results also declined substantially from the prior year, swing-ing to losses of $908 million in 2008 from gains of $4.3 billion in2007. In addition, the first quarter of 2007 included a fair valueadjustment related to the adoption of SFAS 157. For a further discus-sion of principal transactions revenue, see IB and Corporate/PrivateEquity segment results on pages 54–56 and 73–75, respectively, andNote 6 on pages 158–160 of this Annual Report.
Lending & deposit-related fees rose from the prior year, predomi-nantly resulting from higher deposit-related fees and the impact ofthe Washington Mutual transaction. For a further discussion of lend-ing & deposit-related fees, which are mostly recorded in RFS, TSS andCB, see the RFS segment results on pages 57–62, the TSS segmentresults on pages 68–69, and the CB segment results on pages66–67 of this Annual Report.
The decline in asset management, administration and commissionsrevenue compared with 2007 was driven by lower asset manage-ment fees in AM due to lower performance fees and the effect oflower markets on assets under management. This decline was par-tially offset by an increase in commissions revenue related predomi-nantly to higher brokerage transaction volume within IB’s equity mar-kets revenue, which included additions from Bear Stearns’ PrimeServices business; and higher administration fees in TSS driven bywider spreads in securities lending and increased product usage bynew and existing clients. For additional information on these feesand commissions, see the segment discussions for IB on pages54–56, RFS on pages 57–62, TSS on pages 68–69, and AM onpages 70–72 of this Annual Report.
The increase in securities gains compared with the prior year wasdue to the repositioning of the Corporate investment securities port-folio as a result of lower interest rates as part of managing the struc-tural interest rate risk of the Firm, and higher gains from the sale ofMasterCard shares. For a further discussion of securities gains, whichare mostly recorded in the Firm’s Corporate business, see theCorporate/Private Equity segment discussion on pages 73–75 of thisAnnual Report.
Mortgage fees and related income increased from the prior year,driven by higher net mortgage servicing revenue, which benefitedfrom an improvement in MSR risk management results and increasedloan servicing revenue. Mortgage production revenue increasedslightly, as the impact of growth in originations was predominantly
Principal transactions revenue consists of trading revenue and privateequity gains. Trading revenue declined significantly from the 2006level, primarily due to net markdowns in IB of $1.4 billion on sub-prime positions, including subprime collateralized debt obligations(“CDOs”), and $1.3 billion on leveraged lending funded loans andunfunded commitments. Also in IB, markdowns of securitized prod-ucts related to nonsubprime mortgages and weak credit trading per-formance more than offset record revenue in currencies and strongrevenue in both rates and equities. Equities benefited from strongclient activity and record trading results across all products. IB’sCredit Portfolio results increased compared with the prior year, pri-marily driven by higher revenue from risk management activities. Theincrease in private equity gains from 2006 reflected a significantlyhigher level of gains, the classification of certain private equity car-ried interest as compensation expense and a fair value adjustment inthe first quarter of 2007 on nonpublic private equity investmentsresulting from the adoption of SFAS 157 (“Fair ValueMeasurements”). For a further discussion of principal transactionsrevenue, see IB and Corporate/Private Equity segment results onpages 54–56 and 73–75, respectively, and Note 6 on pages158–160 of this Annual Report.
Lending & deposit-related fees rose from the 2006 level, driven pri-marily by higher deposit-related fees and the Bank of New York trans-action. For a further discussion of lending & deposit-related fees,which are mostly recorded in RFS, TSS and CB, see the RFS segmentresults on pages 57–62, the TSS segment results on pages 68–69,and the CB segment results on pages 66–67 of this Annual Report.
Asset management, administration and commissions revenuereached a level higher than the previous record set in 2006.Increased assets under management and higher performance andplacement fees in AM drove the record results. The 18% growth inassets under management from year-end 2006 came from net assetinflows and market appreciation across all segments: Institutional,Retail, Private Bank and Private Wealth Management. TSS also con-tributed to the rise in asset management, administration and com-missions revenue, driven by increased product usage by new andexisting clients and market appreciation on assets under custody.Finally, commissions revenue increased, due mainly to higher broker-age transaction volume (primarily included within Fixed Income andEquity Markets revenue of IB), which more than offset the sale of theinsurance business by RFS in the third quarter of 2006 and a chargein the first quarter of 2007 resulting from accelerated surrenders ofcustomer annuities. For additional information on these fees andcommissions, see the segment discussions for IB on pages 54–56,RFS on pages 57–62, TSS on pages 68–69, and AM on pages 70–72of this Annual Report.
The favorable variance resulting from securities gains in 2007 com-pared with securities losses in 2006 was primarily driven by improve-ments in the results of repositioning of the Corporate investmentsecurities portfolio. Also contributing to the positive variance was a$234 million gain from the sale of MasterCard shares. For a furtherdiscussion of securities gains (losses), which are mostly recorded inthe Firm’s Corporate business, see the Corporate/Private Equity seg-ment discussion on pages 73–75 of this Annual Report.
offset by markdowns on the mortgage warehouse and increasedreserves related to the repurchase of previously sold loans. For a dis-cussion of mortgage fees and related income, which is recorded pri-marily in RFS’s Consumer Lending business, see the ConsumerLending discussion on pages 59–62 of this Annual Report.
Credit card income rose compared with the prior year, driven byincreased interchange income due to higher customer charge volumein CS and higher debit card transaction volume in RFS, the impact ofthe Washington Mutual transaction, and increased servicing feesresulting from a higher level of securitized receivables. These resultswere partially offset by increases in volume-driven payments to part-ners and expense related to rewards programs. For a further discus-sion of credit card income, see CS’ segment results on pages 63–65of this Annual Report.
Other income increased compared with the prior year, due predomi-nantly to the proceeds from the sale of Visa shares in its initial publicoffering of $1.5 billion, the gain on the dissolution of the ChasePaymentech Solutions joint venture of $1.0 billion, and gains onsales of certain other assets. These proceeds and gains were partiallyoffset by markdowns on certain investments, including seed capitalin AM; a $464 million charge related to the offer to repurchase auc-tion-rate securities at par; losses of $423 million reflecting the Firm’s49.4% ownership in Bear Stearns’ losses from April 8 to May 30,2008; and lower securitization income at CS.
Net interest income rose from the prior year, due predominantly tothe following: higher trading-related net interest income in IB, theimpact of the Washington Mutual transaction, wider net interestspread in Corporate/Private Equity, growth in liability and depositbalances in the wholesale and RFS businesses, higher consumer andwholesale loan balances, and wider spreads on consumer loans inRFS. The Firm’s total average interest-earning assets for 2008 were$1.4 trillion, up 23% from the prior year, driven by higher loans,available-for-sale (“AFS”) securities, securities borrowed, brokeragereceivables and other interest-earning assets balances. The Firm’stotal average interest-bearing liabilities for 2008 were $1.3 trillion,up 24% from the prior year, driven by higher deposits, long-termdebt, brokerage payables and other borrowings balances. The netinterest yield on the Firm’s interest-earning assets, on a fully taxableequivalent basis, was 2.87%, an increase of 48 basis points from theprior year.
2007 compared with 2006 Total net revenue of $71.4 billion was up $9.4 billion, or 15%, fromthe prior year. Higher net interest income, very strong private equitygains, record asset management, administration and commissionsrevenue, higher mortgage fees and related income, and recordinvestment banking fees contributed to the revenue growth. Theseincreases were offset partially by lower trading revenue.
Investment banking fees grew in 2007 to a level higher than the pre-vious record set in 2006. Record advisory and equity underwritingfees drove the results, partially offset by lower debt underwritingfees. For a further discussion of investment banking fees, which areprimarily recorded in IB, see IB segment results on pages 54–56 ofthis Annual Report.
JPMorgan Chase & Co. / 2008 Annual Report46
Management’s discussion and analysis
JPMorgan Chase & Co. / 2008 Annual Report 47
Mortgage fees and related income increased from the prior year asMSRs asset valuation adjustments and growth in third-party mort-gage loans serviced drove an increase in net mortgage servicing rev-enue. Production revenue also grew, as an increase in mortgage loanoriginations and the classification of certain loan origination costs asexpense (loan origination costs previously netted against revenuecommenced being recorded as an expense in the first quarter of2007 due to the adoption of SFAS 159) more than offset markdownson the mortgage warehouse and pipeline. For a discussion of mort-gage fees and related income, which is recorded primarily in RFS’Consumer Lending business, see the Consumer Lending discussionon pages 59–62 of this Annual Report.
Credit card income remained relatively unchanged from the 2006level, as lower servicing fees earned in connection with securitizationactivities, which were affected unfavorably by higher net credit lossesand narrower loan margins, were offset by increases in net inter-change income earned on the Firm’s credit and debit cards. For fur-ther discussion of credit card income, see CS’ segment results onpages 63–65 of this Annual Report.
Other income declined compared with the prior year, driven by lowergains from loan sales and workouts, and the absence of a $103 mil-lion gain in the second quarter of 2006 related to the sale ofMasterCard shares in its initial public offering. (The 2007 gain on thesale of MasterCard shares was recorded in securities gains (losses) asthe shares were transferred to the AFS portfolio subsequent to theIPO.) Increased income from automobile operating leases and highergains on the sale of leveraged leases and student loans partially off-set the decline.
Net interest income rose from the prior year, primarily due to the fol-lowing: higher trading-related net interest income, due to a shift ofInterest expense to principal transactions revenue (related to certainIB structured notes to which fair value accounting was elected inconnection with the adoption of SFAS 159); growth in liability anddeposit balances in the wholesale and consumer businesses; a higherlevel of credit card loans; the impact of the Bank of New York trans-action; and an improvement in Corporate’s net interest spread. TheFirm’s total average interest-earning assets for 2007 were $1.1 tril-lion, up 12% from the prior year. The increase was primarily drivenby higher trading assets – debt instruments, loans, and AFS securi-ties, partially offset by a decline in interests in purchased receivablesas a result of the restructuring and deconsolidation during the sec-ond quarter of 2006 of certain multi-seller conduits that the Firmadministered. The net interest yield on these assets, on a fully taxableequivalent basis, was 2.39%, an increase of 23 basis points from theprior year, due in part to the adoption of SFAS 159.
Provision for credit losses Year ended December 31,(in millions) 2008(b) 2007 2006
Wholesale:Provision for credit losses $ 2,681 $ 934 $ 321Provision for credit losses –
accounting conformity(a) 646 — —
Total wholesale provision forcredit losses 3,327 934 321
Consumer:Provision for credit losses 16,764 5,930 2,949Provision for credit losses –
accounting conformity(a) 888 — —
Total consumer provision forcredit losses 17,652 5,930 2,949
Total provision for credit losses $ 20,979 $ 6,864 $ 3,270
(a) 2008 included adjustments to the provision for credit losses to conform theWashington Mutual loan loss reserve methodologies to the Firm’s methodologies inconnection with the Washington Mutual transaction.
(b) On September 25, 2008, JPMorgan Chase acquired the banking operations ofWashington Mutual Bank. On May 30, 2008, the Bear Stearns merger was consum-mated. Each of these transactions was accounted for as a purchase and their respectiveresults of operations are included in the Firm’s results from each respective transactiondate. For additional information on these transactions, see Note 2 on pages 135–140of this Annual Report.
2008 compared with 2007 The provision for credit losses in 2008 rose by $14.1 billion com-pared with the prior year due to increases in both the consumer andwholesale provisions. The increase in the consumer provision reflect-ed higher estimated losses for home equity and mortgages resultingfrom declining housing prices; an increase in estimated losses for theauto, student and business banking loan portfolios; and an increasein the allowance for loan losses and higher charge-offs of credit cardloans. The increase in the wholesale provision was driven by a higherallowance resulting from a weakening credit environment andgrowth in retained loans. The wholesale provision in the first quarterof 2008 also included the effect of the transfer of $4.9 billion offunded and unfunded leveraged lending commitments to retainedloans from held-for-sale. In addition, in 2008 both the consumer andwholesale provisions were affected by a $1.5 billion charge to con-form assets acquired from Washington Mutual to the Firm’s loan lossmethodologies. For a more detailed discussion of the loan portfolioand the allowance for loan losses, see the segment discussions forRFS on pages 57–62, CS on pages 63–65, IB on pages 54–56 andCB on pages 66–67, and the Credit Risk Management section onpages 92–111 of this Annual Report.
2007 compared with 2006 The provision for credit losses in 2007 rose $3.6 billion from the prioryear due to increases in both the consumer and wholesale provisions.The increase in the consumer provision from the prior year was largelydue to an increase in estimated losses related to home equity, creditcard and subprime mortgage loans. Credit card net charge-offs in2006 benefited following the change in bankruptcy legislation in thefourth quarter of 2005. The increase in the wholesale provision fromthe prior year primarily reflected an increase in the allowance for
Management’s discussion and analysis
48 JPMorgan Chase & Co. / 2008 Annual Report
defaults in RFS; an increase in technology, communications andequipment expense reflecting higher depreciation expense on ownedautomobiles subject to operating leases in RFS, and other technolo-gy-related investments across the businesses; and, an increase inoccupancy expense partly for the expansion of RFS’ retail distributionnetwork. For a further discussion of amortization of intangibles, referto Note 18 on pages 198–201 of this Annual Report.
For information on merger costs, refer to Note 11 on page 170 ofthis Annual Report.
2007 compared with 2006 Total noninterest expense for 2007 was $41.7 billion, up $2.9 bil-lion, or 7%, from the prior year. The increase was driven by highercompensation expense, as well as investments across the businesssegments and acquisitions.
The increase in compensation expense from 2006 was primarily theresult of investments and acquisitions in the businesses, includingadditional headcount from the Bank of New York transaction; theclassification of certain private equity carried interest from principaltransactions revenue; the classification of certain loan originationcosts (loan origination costs previously netted against revenue com-menced being recorded as an expense in the first quarter of 2007due to the adoption of SFAS 159); and higher performance-basedincentives. Partially offsetting these increases were business divesti-tures and continuing business efficiencies.
Noncompensation expense increased from 2006 due to higher profes-sional & outside services primarily reflecting higher brokerage expenseand credit card processing costs resulting from growth in transactionvolume, as well as investments in the businesses and acquisitions.Also contributing to the increase was higher other expense due toincreased net legal-related costs, reflecting a lower level of insurancerecoveries and increased costs of credit card-related litigation, andother increases driven by business growth and investments in thebusinesses. Other noncompensation expense increases also includedhigher occupancy expense driven by ongoing investments in the busi-nesses, in particular, the retail distribution network and the Bank ofNew York transaction; and higher technology, communications andequipment expense due primarily to higher depreciation expense onowned automobiles subject to operating leases in RFS, and othertechnology-related investments in the businesses to support businessgrowth. These increases were offset partially by lower credit card mar-keting expense; decreases due to the sale of the insurance business atthe beginning of the third quarter of 2006 and lower credit cardfraud-related losses, both in other expense. In addition, expense ingeneral was reduced by the effect of continuing business efficiencies.For a discussion of amortization of intangibles, refer to Note 18 onpages 198–201 of this Annual Report.
For information on merger costs, refer to Note 11 on page 170 ofthis Annual Report.
credit losses due to portfolio activity, which included the effect of aweakening credit environment and portfolio growth. For a moredetailed discussion of the loan portfolio and the allowance for loanlosses, see the segment discussions for RFS on pages 57–62, CS onpages 63–65, IB on pages 54–56, CB on pages 66–67 and CreditRisk Management on pages 92–111 of this Annual Report.
Noninterest expenseYear ended December 31,(in millions) 2008(a) 2007 2006
Compensation expense $ 22,746 $ 22,689 $21,191Noncompensation expense:
Occupancy expense 3,038 2,608 2,335Technology, communications
and equipment expense 4,315 3,779 3,653Professional & outside services 6,053 5,140 4,450Marketing 1,913 2,070 2,209Other expense 3,740 3,814 3,272Amortization of intangibles 1,263 1,394 1,428
Total noncompensation expense 20,322 18,805 17,347Merger costs 432 209 305
Total noninterest expense $ 43,500 $ 41,703 $38,843
(a) On September 25, 2008, JPMorgan Chase acquired the banking operations of WashingtonMutual Bank. On May 30, 2008, the Bear Stearns merger was consummated. Each of thesetransactions was accounted for as a purchase and their respective results of operations areincluded in the Firm’s results from each respective transaction date. For additional informationon these transactions, see Note 2 on pages 135–140 of this Annual Report.
2008 compared with 2007 Total noninterest expense for 2008 was $43.5 billion, up $1.8 bil-lion, or 4%, from the prior year. The increase was driven by the addi-tional operating costs related to the Washington Mutual transactionand Bear Stearns merger, and investments in the businesses, partiallyoffset by lower performance-based incentives.
Compensation expense increased slightly from the prior year pre-dominantly driven by investments in the businesses, including head-count additions associated with the Bear Stearns merger andWashington Mutual transaction, largely offset by lower performance-based incentives.
Noncompensation expense increased from the prior year as a resultof the Bear Stearns merger and Washington Mutual transaction.Excluding the effect of these transactions, noncompensation expensedecreased due to a net reduction in other expense related to litiga-tion; lower credit card and consumer lending marketing expense; anda decrease in the amortization of intangibles as certain purchasedcredit card relationships were fully amortized in 2007 and the amor-tization rate for core deposit intangibles declined in accordance withthe amortization schedule. These decreases were offset partially byincreases in professional & outside services, driven by investments innew product platforms in TSS, business and volume growth in CScredit card processing and IB brokerage, clearing and exchangetransaction processing. Also contributing to the increases were anincrease in other expense due to higher mortgage reinsurance lossesand mortgage servicing expense due to increased delinquencies and
JPMorgan Chase & Co. / 2008 Annual Report 49
Income tax expense The Firm’s income from continuing operations before income taxexpense (benefit), income tax expense (benefit) and effective tax ratewere as follows for each of the periods indicated.
Year ended December 31,(in millions, except rate) 2008(a) 2007 2006
Income from continuing operationsbefore income tax expense (benefit) $ 2,773 $ 22,805 $ 19,886
Income tax expense (benefit) (926) 7,440 6,237Effective tax rate (33.4)% 32.6% 31.4%
(a) On September 25, 2008, JPMorgan Chase acquired the banking operations of WashingtonMutual Bank. On May 30, 2008, the Bear Stearns merger was consummated. Each of thesetransactions was accounted for as a purchase and their respective results of operations areincluded in the Firm’s results from each respective transaction date. For additional informationon these transactions, see Note 2 on pages 135–140 of this Annual Report.
2008 compared with 2007 The decrease in the effective tax rate in 2008 compared with theprior year was the result of significantly lower reported pretaxincome combined with changes in the proportion of income subjectto U.S. federal taxes. Also contributing to the decrease in the effec-tive tax rate was increased business tax credits and the realization of a $1.1 billion benefit from the release of deferred tax liabilities.These deferred tax liabilities were associated with the undistributedearnings of certain non-U.S. subsidiaries that were deemed to bereinvested indefinitely. These decreases were partially offset bychanges in state and local taxes, and equity losses representing theFirm’s 49.4% ownership interest in Bear Stearns’ losses from April 8to May 30, 2008, for which no income tax benefit was recorded.For a further discussion of income taxes, see Critical AccountingEstimates Used by the Firm on pages 119–123 and Note 28 onpages 209–211 of this Annual Report.
2007 compared with 2006 The increase in the effective tax rate for 2007, as compared with theprior year, was primarily the result of higher reported pretax incomecombined with changes in the proportion of income subject to feder-al, state and local taxes. Also contributing to the increase in theeffective tax rate was the recognition in 2006 of $367 million ofbenefits related to the resolution of tax audits.
Income from discontinued operations As a result of the transaction with The Bank of New York on October1, 2006, the results of operations of the selected corporate trust busi-nesses (i.e., trustee, paying agent, loan agency and document manage-ment services) were reported as discontinued operations.
Income from discontinued operations in 2006 was due predominantlyto a gain of $622 million from exiting selected corporate trust busi-nesses in the fourth quarter of 2006. No income from discontinuedoperations was recorded in 2008 or 2007.
Extraordinary gain The Firm recorded an extraordinary gain of $1.9 billion in 2008 asso-ciated with the acquisition of the banking operations of WashingtonMutual. The transaction is being accounted for under the purchasemethod of accounting in accordance with SFAS 141. The adjusted fairvalue of net assets of the banking operations, after purchase account-ing adjustments, was higher than JPMorgan Chase’s purchase price.There were no extraordinary gains recorded in 2007 or 2006.
sheet and presents revenue on a fully taxable-equivalent (“FTE”)basis. These adjustments do not have any impact on net income asreported by the lines of business or by the Firm as a whole.
The presentation of CS results on a managed basis assumes thatcredit card loans that have been securitized and sold in accordancewith SFAS 140 remain on the Consolidated Balance Sheets and thatthe earnings on the securitized loans are classified in the same man-ner as the earnings on retained loans recorded on the ConsolidatedBalance Sheets. JPMorgan Chase uses the concept of managed basisto evaluate the credit performance and overall financial performanceof the entire managed credit card portfolio. Operations are fundedand decisions are made about allocating resources, such as employ-ees and capital, based upon managed financial information. In addi-tion, the same underwriting standards and ongoing risk monitoring
The Firm prepares its consolidated financial statements usingaccounting principles generally accepted in the United States ofAmerica (“U.S. GAAP”); these financial statements appear on pages130–133 of this Annual Report. That presentation, which is referredto as “reported basis,” provides the reader with an understanding ofthe Firm’s results that can be tracked consistently from year to yearand enables a comparison of the Firm’s performance with other com-panies’ U.S. GAAP financial statements.
In addition to analyzing the Firm’s results on a reported basis, man-agement reviews the Firm’s results and the results of the lines ofbusiness on a “managed” basis, which is a non-GAAP financialmeasure. The Firm’s definition of managed basis starts with thereported U.S. GAAP results and includes certain reclassifications thatassume credit card loans securitized by CS remain on the balance
JPMorgan Chase & Co. / 2008 Annual Report50
Management’s discussion and analysis
EXPLANATION AND RECONCIL IAT ION OF THE F IRM’S USE OF NON-GAAP F INANCIAL MEASURES
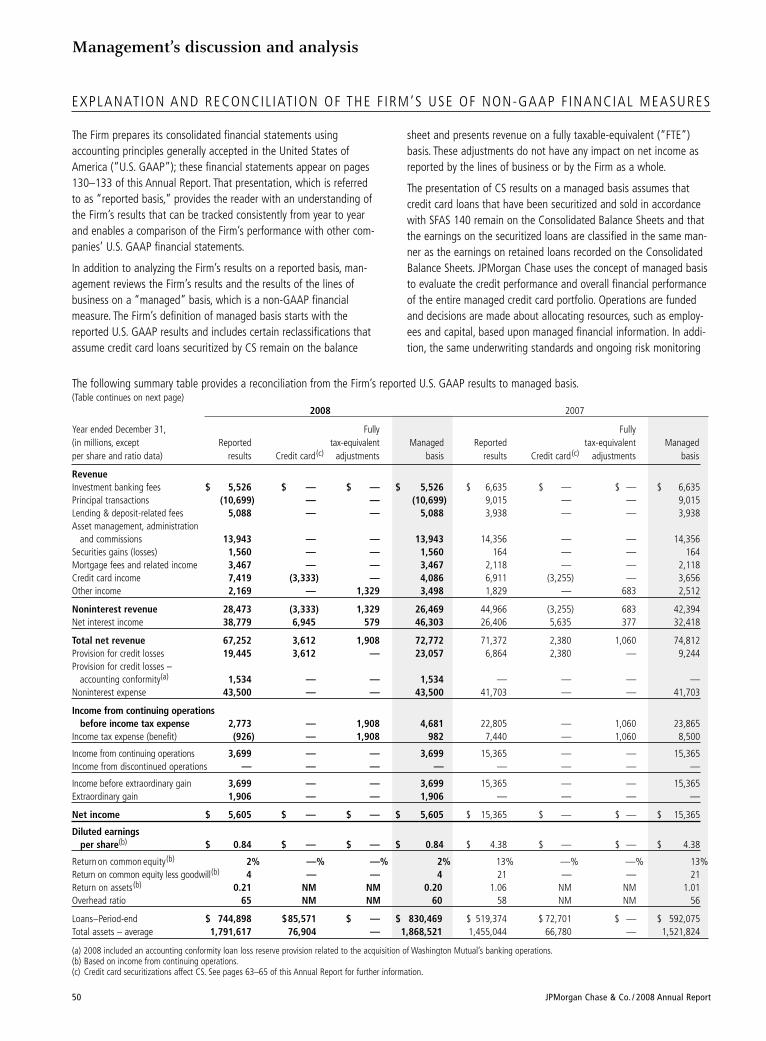
The following summary table provides a reconciliation from the Firm’s reported U.S. GAAP results to managed basis.(Table continues on next page)
2008 2007
Year ended December 31, Fully Fully(in millions, except Reported tax-equivalent Managed Reported tax-equivalent Managedper share and ratio data) results Credit card(c) adjustments basis results Credit card(c) adjustments basis
RevenueInvestment banking fees $ 5,526 $ — $ — $ 5,526 $ 6,635 $ — $ — $ 6,635Principal transactions (10,699) — — (10,699) 9,015 — — 9,015Lending & deposit-related fees 5,088 — — 5,088 3,938 — — 3,938Asset management, administration
and commissions 13,943 — — 13,943 14,356 — — 14,356Securities gains (losses) 1,560 — — 1,560 164 — — 164Mortgage fees and related income 3,467 — — 3,467 2,118 — — 2,118Credit card income 7,419 (3,333) — 4,086 6,911 (3,255) — 3,656Other income 2,169 — 1,329 3,498 1,829 — 683 2,512
Noninterest revenue 28,473 (3,333) 1,329 26,469 44,966 (3,255) 683 42,394Net interest income 38,779 6,945 579 46,303 26,406 5,635 377 32,418
Total net revenue 67,252 3,612 1,908 72,772 71,372 2,380 1,060 74,812Provision for credit losses 19,445 3,612 — 23,057 6,864 2,380 — 9,244Provision for credit losses –
accounting conformity(a) 1,534 — — 1,534 — — — —Noninterest expense 43,500 — — 43,500 41,703 — — 41,703
Income from continuing operationsbefore income tax expense 2,773 — 1,908 4,681 22,805 — 1,060 23,865
Income tax expense (benefit) (926) — 1,908 982 7,440 — 1,060 8,500
Income from continuing operations 3,699 — — 3,699 15,365 — — 15,365Income from discontinued operations — — — — — — — —
Income before extraordinary gain 3,699 — — 3,699 15,365 — — 15,365Extraordinary gain 1,906 — — 1,906 — — — —
Net income $ 5,605 $ — $ — $ 5,605 $ 15,365 $ — $ — $ 15,365
Diluted earningsper share(b) $ 0.84 $ — $ — $ 0.84 $ 4.38 $ — $ — $ 4.38
Return on common equity(b) 2% —% —% 2% 13% —% —% 13%Return on common equity less goodwill(b) 4 — — 4 21 — — 21Return on assets(b) 0.21 NM NM 0.20 1.06 NM NM 1.01Overhead ratio 65 NM NM 60 58 NM NM 56
Loans–Period-end $ 744,898 $85,571 $ — $ 830,469 $ 519,374 $ 72,701 $ — $ 592,075Total assets – average 1,791,617 76,904 — 1,868,521 1,455,044 66,780 — 1,521,824
(a) 2008 included an accounting conformity loan loss reserve provision related to the acquisition of Washington Mutual’s banking operations.(b) Based on income from continuing operations.(c) Credit card securitizations affect CS. See pages 63–65 of this Annual Report for further information.
JPMorgan Chase & Co. / 2008 Annual Report 51
are used for both loans on the Consolidated Balance Sheets andsecuritized loans. Although securitizations result in the sale of creditcard receivables to a trust, JPMorgan Chase retains the ongoing cus-tomer relationships, as the customers may continue to use their cred-it cards; accordingly, the customer’s credit performance will affectboth the securitized loans and the loans retained on theConsolidated Balance Sheets. JPMorgan Chase believes managedbasis information is useful to investors, enabling them to understandboth the credit risks associated with the loans reported on theConsolidated Balance Sheets and the Firm’s retained interests insecuritized loans. For a reconciliation of reported to managed basisresults for CS, see CS segment results on pages 63–65 of this AnnualReport. For information regarding the securitization process, andloans and residual interests sold and securitized, see Note 16 onpages 180–188 of this Annual Report.
Total net revenue for each of the business segments and the Firm ispresented on a FTE basis. Accordingly, revenue from tax-exemptsecurities and investments that receive tax credits is presented in themanaged results on a basis comparable to taxable securities andinvestments. This non-GAAP financial measure allows managementto assess the comparability of revenue arising from both taxable andtax-exempt sources. The corresponding income tax impact related tothese items is recorded within income tax expense.
Management also uses certain non-GAAP financial measures at thebusiness segment level because it believes these other non-GAAPfinancial measures provide information to investors about the under-lying operational performance and trends of the particular businesssegment and therefore facilitate a comparison of the business seg-ment with the performance of its competitors.
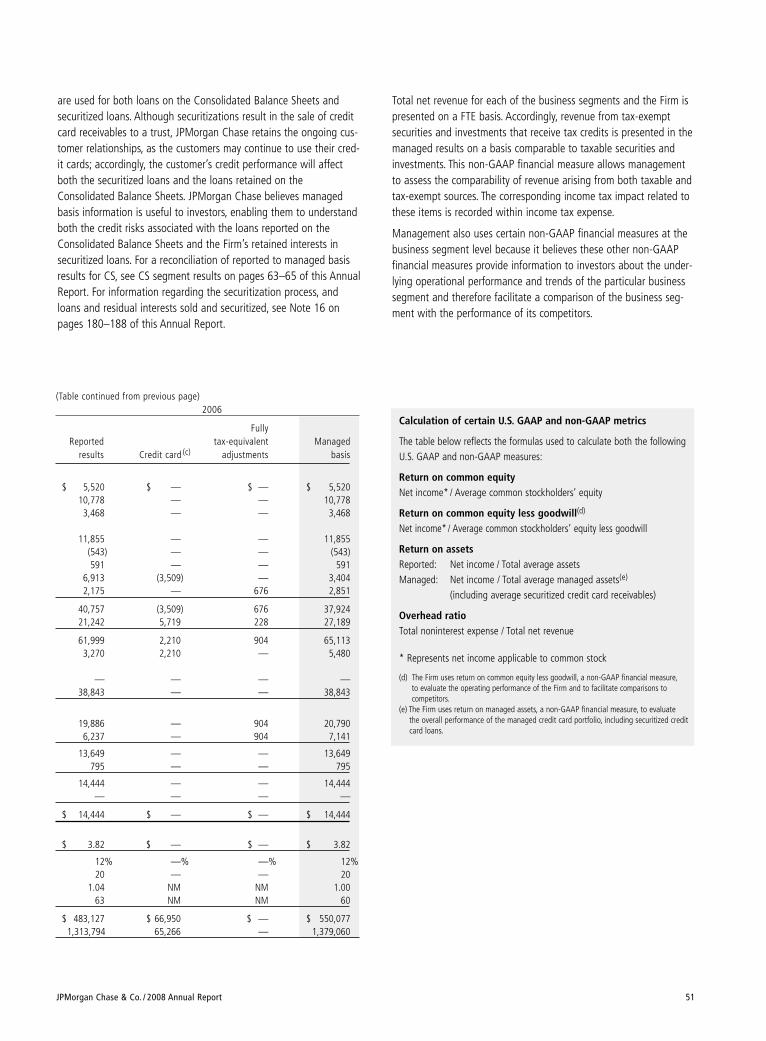
Calculation of certain U.S. GAAP and non-GAAP metrics
The table below reflects the formulas used to calculate both the followingU.S. GAAP and non-GAAP measures:
Return on common equityNet income* / Average common stockholders’ equity
Return on common equity less goodwill(d)
Net income* / Average common stockholders’ equity less goodwill
Return on assetsReported: Net income / Total average assetsManaged: Net income / Total average managed assets(e)
(including average securitized credit card receivables)
Overhead ratioTotal noninterest expense / Total net revenue
* Represents net income applicable to common stock
(d) The Firm uses return on common equity less goodwill, a non-GAAP financial measure,to evaluate the operating performance of the Firm and to facilitate comparisons to competitors.
(e) The Firm uses return on managed assets, a non-GAAP financial measure, to evaluate the overall performance of the managed credit card portfolio, including securitized creditcard loans.
(Table continued from previous page)2006
FullyReported tax-equivalent Managed
results Credit card (c) adjustments basis
$ 5,520 $ — $ — $ 5,52010,778 — — 10,7783,468 — — 3,468
11,855 — — 11,855(543) — — (543)591 — — 591
6,913 (3,509) — 3,4042,175 — 676 2,851
40,757 (3,509) 676 37,92421,242 5,719 228 27,189
61,999 2,210 904 65,1133,270 2,210 — 5,480
— — — —38,843 — — 38,843
19,886 — 904 20,7906,237 — 904 7,141
13,649 — — 13,649795 — — 795
14,444 — — 14,444— — — —
$ 14,444 $ — $ — $ 14,444
$ 3.82 $ — $ — $ 3.82
12% —% —% 12%20 — — 20
1.04 NM NM 1.0063 NM NM 60
$ 483,127 $ 66,950 $ — $ 550,0771,313,794 65,266 — 1,379,060
Management’s discussion and analysis
52 JPMorgan Chase & Co. / 2008 Annual Report
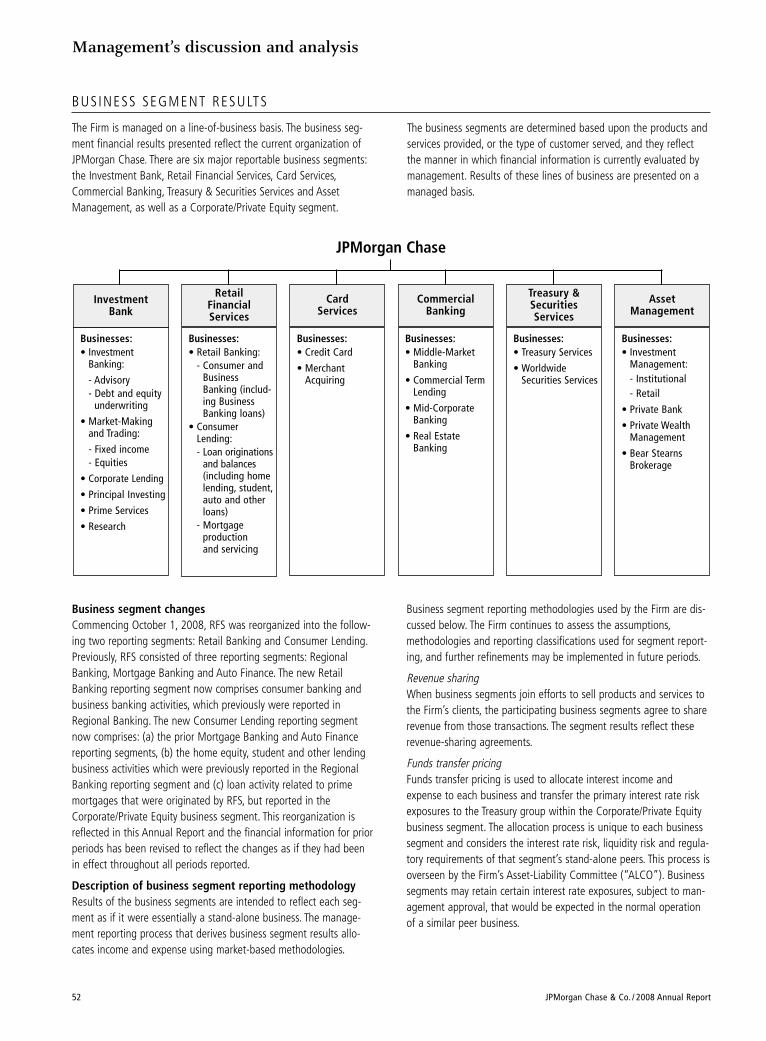
BUSINESS SEGMENT RESULTS
The Firm is managed on a line-of-business basis. The business seg-ment financial results presented reflect the current organization ofJPMorgan Chase. There are six major reportable business segments:the Investment Bank, Retail Financial Services, Card Services,Commercial Banking, Treasury & Securities Services and AssetManagement, as well as a Corporate/Private Equity segment.
The business segments are determined based upon the products andservices provided, or the type of customer served, and they reflectthe manner in which financial information is currently evaluated bymanagement. Results of these lines of business are presented on amanaged basis.
AssetManagement
Businesses:• Treasury Services
• WorldwideSecurities Services
JPMorgan Chase
Businesses:• Middle-Market
Banking
• Commercial TermLending
• Mid-CorporateBanking
• Real EstateBanking
CommercialBanking
Businesses:• Investment
Banking:
- Advisory- Debt and equity
underwriting
• Market-Makingand Trading:
- Fixed income - Equities
• Corporate Lending
• Principal Investing
• Prime Services
• Research
Investment Bank
Retail FinancialServices
CardServices
Businesses:• Investment
Management:- Institutional- Retail
• Private Bank
• Private WealthManagement
• Bear StearnsBrokerage
Businesses:• Credit Card
• MerchantAcquiring
Businesses:• Retail Banking:
- Consumer andBusinessBanking (includ-ing BusinessBanking loans)
• ConsumerLending:- Loan originations
and balances(including homelending, student,auto and otherloans)
- Mortgage production and servicing
Treasury &Securities Services
Business segment changes Commencing October 1, 2008, RFS was reorganized into the follow-ing two reporting segments: Retail Banking and Consumer Lending.Previously, RFS consisted of three reporting segments: RegionalBanking, Mortgage Banking and Auto Finance. The new RetailBanking reporting segment now comprises consumer banking andbusiness banking activities, which previously were reported inRegional Banking. The new Consumer Lending reporting segmentnow comprises: (a) the prior Mortgage Banking and Auto Financereporting segments, (b) the home equity, student and other lendingbusiness activities which were previously reported in the RegionalBanking reporting segment and (c) loan activity related to primemortgages that were originated by RFS, but reported in theCorporate/Private Equity business segment. This reorganization isreflected in this Annual Report and the financial information for priorperiods has been revised to reflect the changes as if they had beenin effect throughout all periods reported.
Description of business segment reporting methodology Results of the business segments are intended to reflect each seg-ment as if it were essentially a stand-alone business. The manage-ment reporting process that derives business segment results allo-cates income and expense using market-based methodologies.
Business segment reporting methodologies used by the Firm are dis-cussed below. The Firm continues to assess the assumptions,methodologies and reporting classifications used for segment report-ing, and further refinements may be implemented in future periods.
Revenue sharing When business segments join efforts to sell products and services tothe Firm’s clients, the participating business segments agree to sharerevenue from those transactions. The segment results reflect theserevenue-sharing agreements.
Funds transfer pricing Funds transfer pricing is used to allocate interest income andexpense to each business and transfer the primary interest rate riskexposures to the Treasury group within the Corporate/Private Equitybusiness segment. The allocation process is unique to each businesssegment and considers the interest rate risk, liquidity risk and regula-tory requirements of that segment’s stand-alone peers. This process isoverseen by the Firm’s Asset-Liability Committee (“ALCO”). Businesssegments may retain certain interest rate exposures, subject to man-agement approval, that would be expected in the normal operationof a similar peer business.
JPMorgan Chase & Co. / 2008 Annual Report 53
Capital allocation Each business segment is allocated capital by taking into considera-tion stand-alone peer comparisons, economic risk measures and reg-ulatory capital requirements. The amount of capital assigned to eachbusiness is referred to as equity. Line of business equity increasedduring the second quarter of 2008 in IB and AM due to the BearStearns merger and, for AM, the purchase of the additional equityinterest in Highbridge. At the end of the third quarter of 2008, equitywas increased for each line of business with a view toward thefuture implementation of the new Basel II capital rules. For furtherdetails on these rules, see Basel II on page 84 of this Annual Report.In addition, equity allocated to RFS, CS and CB was increased as aresult of the Washington Mutual transaction. For a further discussion,see Capital management–Line of business equity on page 82 of thisAnnual Report.
Expense allocation Where business segments use services provided by support unitswithin the Firm, the costs of those support units are allocated to thebusiness segments. The expense is allocated based upon their actualcost or the lower of actual cost or market, as well as upon usage ofthe services provided. In contrast, certain other expense related tocertain corporate functions, or to certain technology and operations,are not allocated to the business segments and are retained inCorporate. Retained expense includes: parent company costs thatwould not be incurred if the segments were stand-alone businesses;adjustments to align certain corporate staff, technology and opera-tions allocations with market prices; and other one-time items notaligned with the business segments.
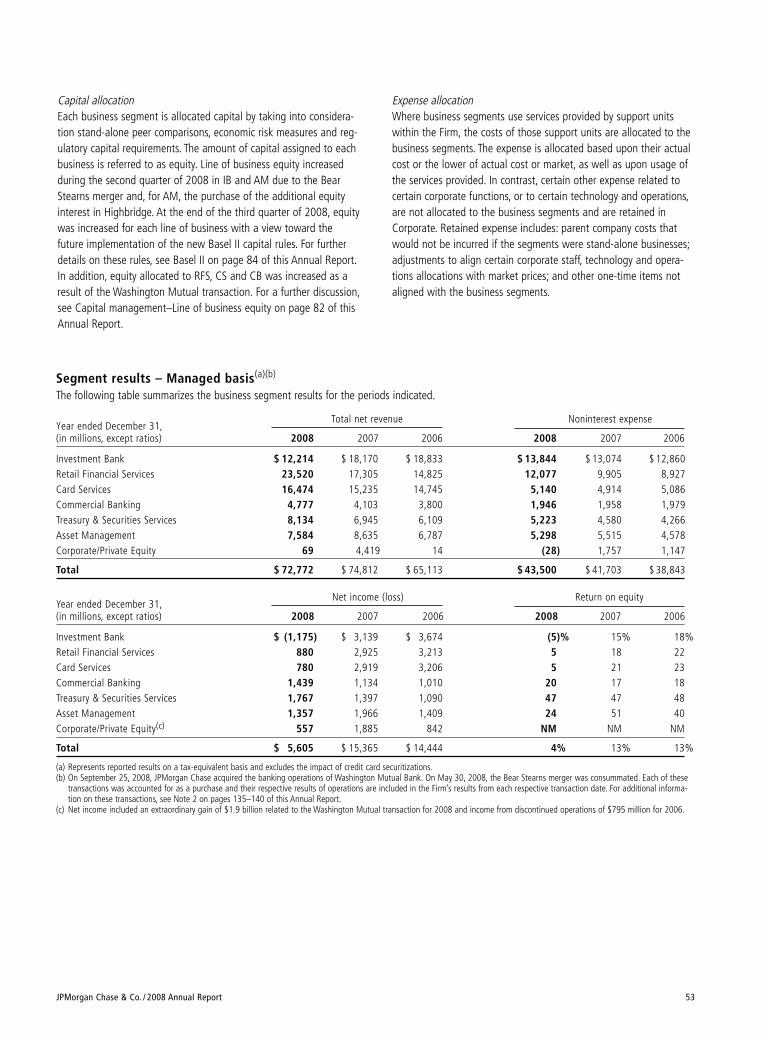
Segment results – Managed basis(a)(b)
The following table summarizes the business segment results for the periods indicated.
Year ended December 31,Total net revenue Noninterest expense
(in millions, except ratios) 2008 2007 2006 2008 2007 2006
Investment Bank $ 12,214 $ 18,170 $ 18,833 $ 13,844 $ 13,074 $ 12,860Retail Financial Services 23,520 17,305 14,825 12,077 9,905 8,927Card Services 16,474 15,235 14,745 5,140 4,914 5,086Commercial Banking 4,777 4,103 3,800 1,946 1,958 1,979Treasury & Securities Services 8,134 6,945 6,109 5,223 4,580 4,266Asset Management 7,584 8,635 6,787 5,298 5,515 4,578Corporate/Private Equity 69 4,419 14 (28) 1,757 1,147
Total $ 72,772 $ 74,812 $ 65,113 $ 43,500 $ 41,703 $ 38,843
Year ended December 31,Net income (loss) Return on equity
(in millions, except ratios) 2008 2007 2006 2008 2007 2006
Investment Bank $ (1,175) $ 3,139 $ 3,674 (5)% 15% 18%Retail Financial Services 880 2,925 3,213 5 18 22Card Services 780 2,919 3,206 5 21 23Commercial Banking 1,439 1,134 1,010 20 17 18Treasury & Securities Services 1,767 1,397 1,090 47 47 48Asset Management 1,357 1,966 1,409 24 51 40Corporate/Private Equity(c) 557 1,885 842 NM NM NM
Total $ 5,605 $ 15,365 $ 14,444 4% 13% 13%
(a) Represents reported results on a tax-equivalent basis and excludes the impact of credit card securitizations.(b) On September 25, 2008, JPMorgan Chase acquired the banking operations of Washington Mutual Bank. On May 30, 2008, the Bear Stearns merger was consummated. Each of these
transactions was accounted for as a purchase and their respective results of operations are included in the Firm’s results from each respective transaction date. For additional informa-tion on these transactions, see Note 2 on pages 135–140 of this Annual Report.
(c) Net income included an extraordinary gain of $1.9 billion related to the Washington Mutual transaction for 2008 and income from discontinued operations of $795 million for 2006.
INVESTMENT BANK
On May 30, 2008, JPMorgan Chase merged with The Bear StearnsCompanies, Inc. The merger provided IB with a leading global primebrokerage business and expanded the existing energy platform. Italso strengthened IB’s franchise in Equity and Fixed Income Markets,as well as client coverage.
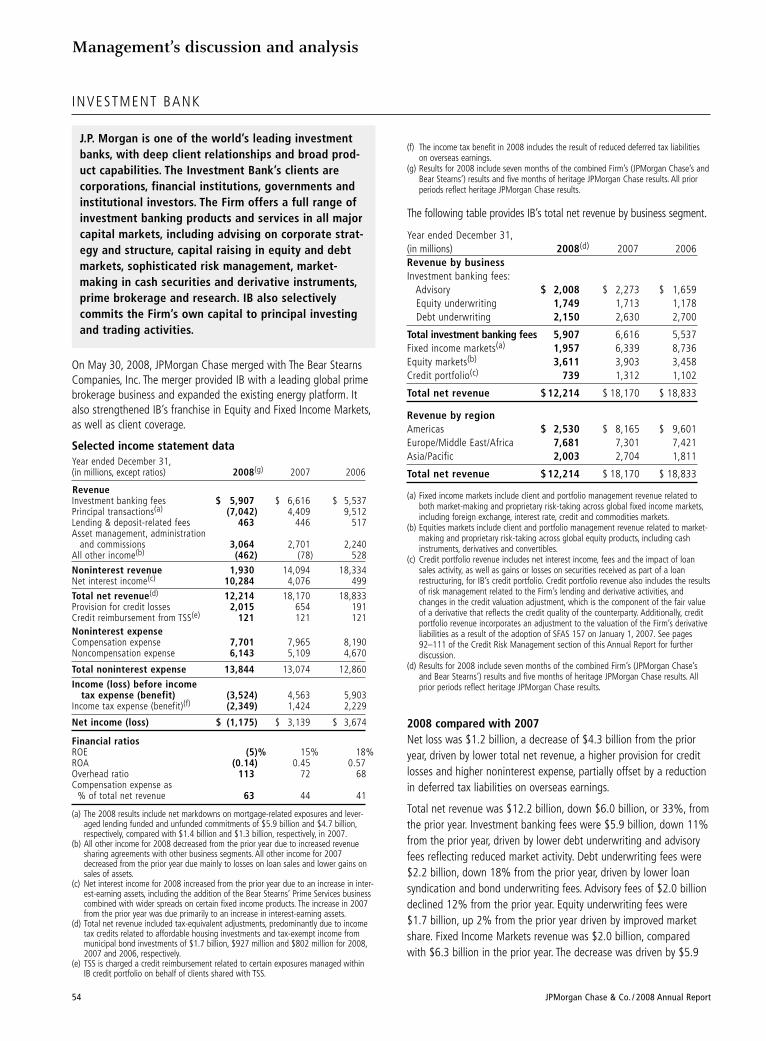
Selected income statement data Year ended December 31,(in millions, except ratios) 2008(g) 2007 2006
RevenueInvestment banking fees $ 5,907 $ 6,616 $ 5,537Principal transactions(a) (7,042) 4,409 9,512Lending & deposit-related fees 463 446 517Asset management, administration
and commissions 3,064 2,701 2,240All other income(b) (462) (78) 528
Noninterest revenue 1,930 14,094 18,334Net interest income(c) 10,284 4,076 499
Total net revenue(d) 12,214 18,170 18,833Provision for credit losses 2,015 654 191Credit reimbursement from TSS(e) 121 121 121Noninterest expenseCompensation expense 7,701 7,965 8,190Noncompensation expense 6,143 5,109 4,670
Total noninterest expense 13,844 13,074 12,860
Income (loss) before income tax expense (benefit) (3,524) 4,563 5,903
Income tax expense (benefit)(f) (2,349) 1,424 2,229
Net income (loss) $ (1,175) $ 3,139 $ 3,674
Financial ratiosROE (5)% 15% 18%ROA (0.14) 0.45 0.57Overhead ratio 113 72 68Compensation expense as
% of total net revenue 63 44 41
(a) The 2008 results include net markdowns on mortgage-related exposures and lever-aged lending funded and unfunded commitments of $5.9 billion and $4.7 billion,respectively, compared with $1.4 billion and $1.3 billion, respectively, in 2007.
(b) All other income for 2008 decreased from the prior year due to increased revenuesharing agreements with other business segments. All other income for 2007decreased from the prior year due mainly to losses on loan sales and lower gains onsales of assets.
(c) Net interest income for 2008 increased from the prior year due to an increase in inter-est-earning assets, including the addition of the Bear Stearns’ Prime Services businesscombined with wider spreads on certain fixed income products. The increase in 2007from the prior year was due primarily to an increase in interest-earning assets.
(d) Total net revenue included tax-equivalent adjustments, predominantly due to incometax credits related to affordable housing investments and tax-exempt income frommunicipal bond investments of $1.7 billion, $927 million and $802 million for 2008,2007 and 2006, respectively.
(e) TSS is charged a credit reimbursement related to certain exposures managed within IB credit portfolio on behalf of clients shared with TSS.
Management’s discussion and analysis
54 JPMorgan Chase & Co. / 2008 Annual Report
(f) The income tax benefit in 2008 includes the result of reduced deferred tax liabilitieson overseas earnings.
(g) Results for 2008 include seven months of the combined Firm’s (JPMorgan Chase’s andBear Stearns’) results and five months of heritage JPMorgan Chase results. All priorperiods reflect heritage JPMorgan Chase results.
The following table provides IB’s total net revenue by business segment.
Year ended December 31,(in millions) 2008(d) 2007 2006Revenue by businessInvestment banking fees:
Advisory $ 2,008 $ 2,273 $ 1,659Equity underwriting 1,749 1,713 1,178Debt underwriting 2,150 2,630 2,700
Total investment banking fees 5,907 6,616 5,537Fixed income markets(a) 1,957 6,339 8,736Equity markets(b) 3,611 3,903 3,458Credit portfolio(c) 739 1,312 1,102
Total net revenue $ 12,214 $ 18,170 $ 18,833
Revenue by regionAmericas $ 2,530 $ 8,165 $ 9,601Europe/Middle East/Africa 7,681 7,301 7,421Asia/Pacific 2,003 2,704 1,811
Total net revenue $ 12,214 $ 18,170 $ 18,833
(a) Fixed income markets include client and portfolio management revenue related toboth market-making and proprietary risk-taking across global fixed income markets,including foreign exchange, interest rate, credit and commodities markets.
(b) Equities markets include client and portfolio management revenue related to market-making and proprietary risk-taking across global equity products, including cashinstruments, derivatives and convertibles.
(c) Credit portfolio revenue includes net interest income, fees and the impact of loansales activity, as well as gains or losses on securities received as part of a loanrestructuring, for IB’s credit portfolio. Credit portfolio revenue also includes the resultsof risk management related to the Firm’s lending and derivative activities, andchanges in the credit valuation adjustment, which is the component of the fair valueof a derivative that reflects the credit quality of the counterparty. Additionally, creditportfolio revenue incorporates an adjustment to the valuation of the Firm’s derivativeliabilities as a result of the adoption of SFAS 157 on January 1, 2007. See pages92–111 of the Credit Risk Management section of this Annual Report for further discussion.
(d) Results for 2008 include seven months of the combined Firm’s (JPMorgan Chase’sand Bear Stearns’) results and five months of heritage JPMorgan Chase results. Allprior periods reflect heritage JPMorgan Chase results.
2008 compared with 2007 Net loss was $1.2 billion, a decrease of $4.3 billion from the prioryear, driven by lower total net revenue, a higher provision for creditlosses and higher noninterest expense, partially offset by a reductionin deferred tax liabilities on overseas earnings.
Total net revenue was $12.2 billion, down $6.0 billion, or 33%, fromthe prior year. Investment banking fees were $5.9 billion, down 11%from the prior year, driven by lower debt underwriting and advisoryfees reflecting reduced market activity. Debt underwriting fees were$2.2 billion, down 18% from the prior year, driven by lower loansyndication and bond underwriting fees. Advisory fees of $2.0 billiondeclined 12% from the prior year. Equity underwriting fees were$1.7 billion, up 2% from the prior year driven by improved marketshare. Fixed Income Markets revenue was $2.0 billion, comparedwith $6.3 billion in the prior year. The decrease was driven by $5.9
J.P. Morgan is one of the world’s leading investmentbanks, with deep client relationships and broad prod-uct capabilities. The Investment Bank’s clients are corporations, financial institutions, governments andinstitutional investors. The Firm offers a full range ofinvestment banking products and services in all majorcapital markets, including advising on corporate strat-egy and structure, capital raising in equity and debtmarkets, sophisticated risk management, market-making in cash securities and derivative instruments,prime brokerage and research. IB also selectively commits the Firm’s own capital to principal investingand trading activities.
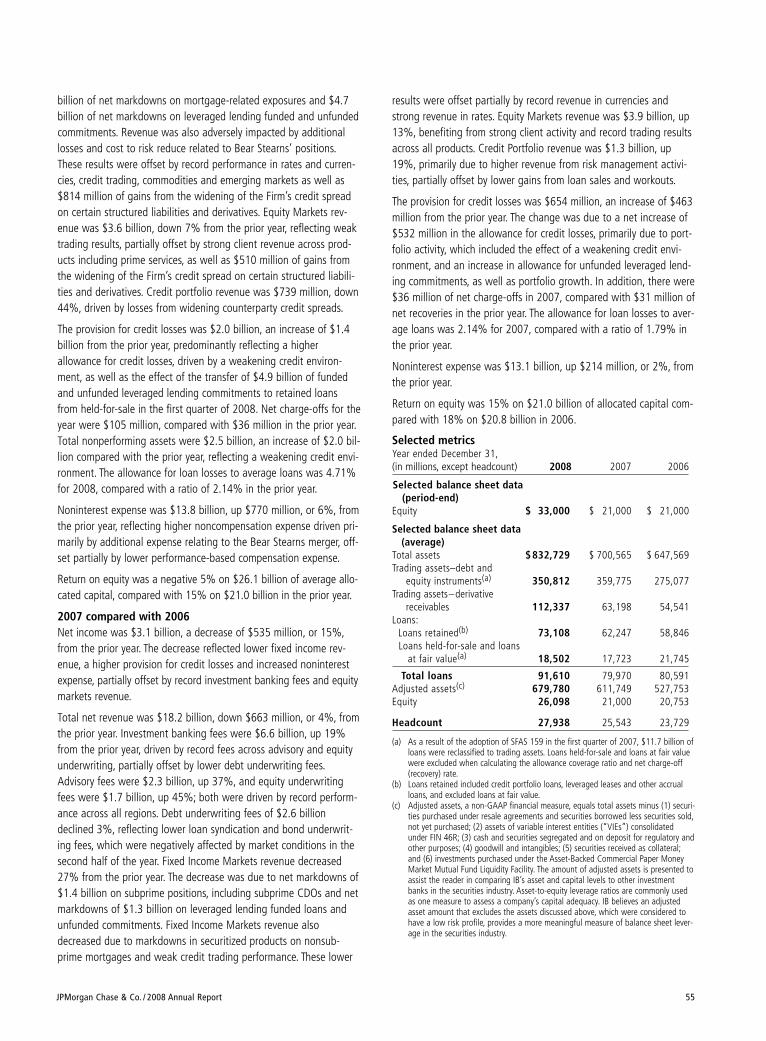
JPMorgan Chase & Co. / 2008 Annual Report 55
billion of net markdowns on mortgage-related exposures and $4.7billion of net markdowns on leveraged lending funded and unfundedcommitments. Revenue was also adversely impacted by additionallosses and cost to risk reduce related to Bear Stearns’ positions.These results were offset by record performance in rates and curren-cies, credit trading, commodities and emerging markets as well as$814 million of gains from the widening of the Firm’s credit spreadon certain structured liabilities and derivatives. Equity Markets rev-enue was $3.6 billion, down 7% from the prior year, reflecting weaktrading results, partially offset by strong client revenue across prod-ucts including prime services, as well as $510 million of gains fromthe widening of the Firm’s credit spread on certain structured liabili-ties and derivatives. Credit portfolio revenue was $739 million, down44%, driven by losses from widening counterparty credit spreads.
The provision for credit losses was $2.0 billion, an increase of $1.4billion from the prior year, predominantly reflecting a higherallowance for credit losses, driven by a weakening credit environ-ment, as well as the effect of the transfer of $4.9 billion of fundedand unfunded leveraged lending commitments to retained loansfrom held-for-sale in the first quarter of 2008. Net charge-offs for theyear were $105 million, compared with $36 million in the prior year.Total nonperforming assets were $2.5 billion, an increase of $2.0 bil-lion compared with the prior year, reflecting a weakening credit envi-ronment. The allowance for loan losses to average loans was 4.71%for 2008, compared with a ratio of 2.14% in the prior year.
Noninterest expense was $13.8 billion, up $770 million, or 6%, fromthe prior year, reflecting higher noncompensation expense driven pri-marily by additional expense relating to the Bear Stearns merger, off-set partially by lower performance-based compensation expense.
Return on equity was a negative 5% on $26.1 billion of average allo-cated capital, compared with 15% on $21.0 billion in the prior year.
2007 compared with 2006 Net income was $3.1 billion, a decrease of $535 million, or 15%,from the prior year. The decrease reflected lower fixed income rev-enue, a higher provision for credit losses and increased noninterestexpense, partially offset by record investment banking fees and equitymarkets revenue.
Total net revenue was $18.2 billion, down $663 million, or 4%, fromthe prior year. Investment banking fees were $6.6 billion, up 19%from the prior year, driven by record fees across advisory and equityunderwriting, partially offset by lower debt underwriting fees.Advisory fees were $2.3 billion, up 37%, and equity underwritingfees were $1.7 billion, up 45%; both were driven by record perform-ance across all regions. Debt underwriting fees of $2.6 billiondeclined 3%, reflecting lower loan syndication and bond underwrit-ing fees, which were negatively affected by market conditions in thesecond half of the year. Fixed Income Markets revenue decreased27% from the prior year. The decrease was due to net markdowns of$1.4 billion on subprime positions, including subprime CDOs and netmarkdowns of $1.3 billion on leveraged lending funded loans andunfunded commitments. Fixed Income Markets revenue alsodecreased due to markdowns in securitized products on nonsub-prime mortgages and weak credit trading performance. These lower
results were offset partially by record revenue in currencies andstrong revenue in rates. Equity Markets revenue was $3.9 billion, up13%, benefiting from strong client activity and record trading resultsacross all products. Credit Portfolio revenue was $1.3 billion, up19%, primarily due to higher revenue from risk management activi-ties, partially offset by lower gains from loan sales and workouts.
The provision for credit losses was $654 million, an increase of $463million from the prior year. The change was due to a net increase of$532 million in the allowance for credit losses, primarily due to port-folio activity, which included the effect of a weakening credit envi-ronment, and an increase in allowance for unfunded leveraged lend-ing commitments, as well as portfolio growth. In addition, there were$36 million of net charge-offs in 2007, compared with $31 million ofnet recoveries in the prior year. The allowance for loan losses to aver-age loans was 2.14% for 2007, compared with a ratio of 1.79% inthe prior year.
Noninterest expense was $13.1 billion, up $214 million, or 2%, fromthe prior year.
Return on equity was 15% on $21.0 billion of allocated capital com-pared with 18% on $20.8 billion in 2006.
Selected metricsYear ended December 31,(in millions, except headcount) 2008 2007 2006
Selected balance sheet data(period-end)
Equity $ 33,000 $ 21,000 $ 21,000
Selected balance sheet data(average)
Total assets $832,729 $ 700,565 $ 647,569Trading assets–debt and
equity instruments(a) 350,812 359,775 275,077Trading assets–derivative
receivables 112,337 63,198 54,541Loans:
Loans retained(b) 73,108 62,247 58,846Loans held-for-sale and loans
at fair value(a) 18,502 17,723 21,745
Total loans 91,610 79,970 80,591Adjusted assets(c) 679,780 611,749 527,753Equity 26,098 21,000 20,753
Headcount 27,938 25,543 23,729
(a) As a result of the adoption of SFAS 159 in the first quarter of 2007, $11.7 billion ofloans were reclassified to trading assets. Loans held-for-sale and loans at fair valuewere excluded when calculating the allowance coverage ratio and net charge-off(recovery) rate.
(b) Loans retained included credit portfolio loans, leveraged leases and other accrualloans, and excluded loans at fair value.
(c) Adjusted assets, a non-GAAP financial measure, equals total assets minus (1) securi-ties purchased under resale agreements and securities borrowed less securities sold,not yet purchased; (2) assets of variable interest entities (“VIEs”) consolidatedunder FIN 46R; (3) cash and securities segregated and on deposit for regulatory andother purposes; (4) goodwill and intangibles; (5) securities received as collateral;and (6) investments purchased under the Asset-Backed Commercial Paper MoneyMarket Mutual Fund Liquidity Facility. The amount of adjusted assets is presented toassist the reader in comparing IB’s asset and capital levels to other investmentbanks in the securities industry. Asset-to-equity leverage ratios are commonly usedas one measure to assess a company’s capital adequacy. IB believes an adjustedasset amount that excludes the assets discussed above, which were considered tohave a low risk profile, provides a more meaningful measure of balance sheet lever-age in the securities industry.
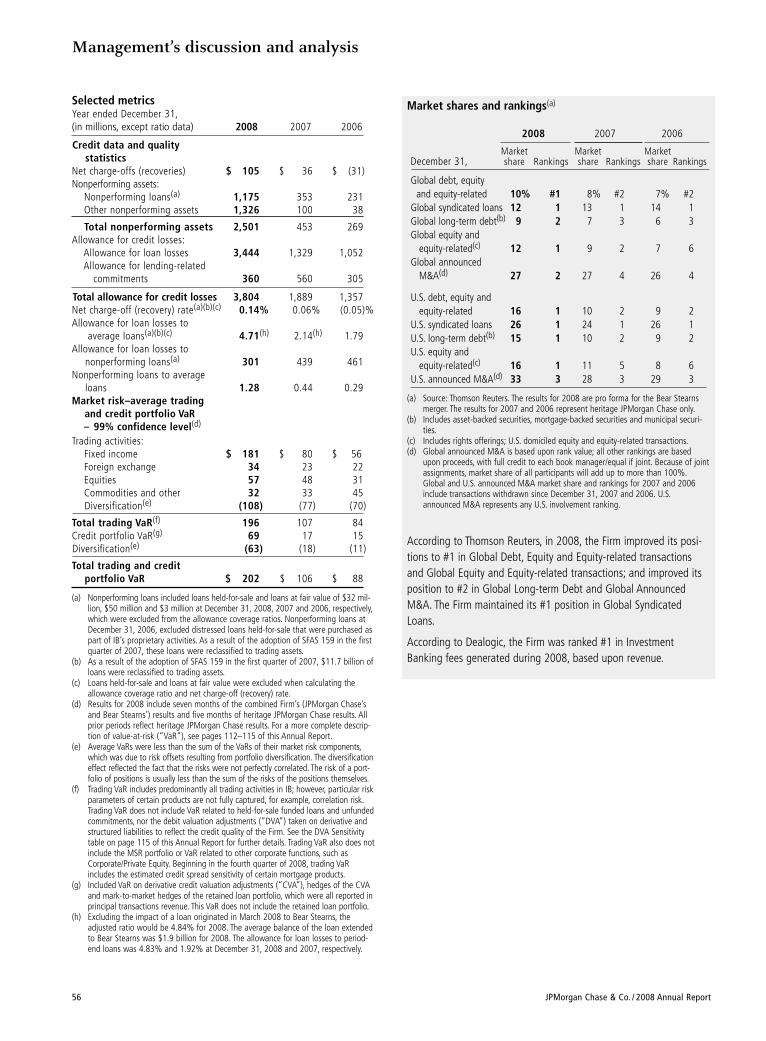
Management’s discussion and analysis
56 JPMorgan Chase & Co. / 2008 Annual Report
Selected metricsYear ended December 31,(in millions, except ratio data) 2008 2007 2006
Credit data and quality statistics
Net charge-offs (recoveries) $ 105 $ 36 $ (31)Nonperforming assets:
Nonperforming loans(a) 1,175 353 231Other nonperforming assets 1,326 100 38
Total nonperforming assets 2,501 453 269Allowance for credit losses:
Allowance for loan losses 3,444 1,329 1,052Allowance for lending-related
commitments 360 560 305
Total allowance for credit losses 3,804 1,889 1,357Net charge-off (recovery) rate(a)(b)(c) 0.14% 0.06% (0.05)%Allowance for loan losses to
average loans(a)(b)(c) 4.71(h) 2.14(h) 1.79Allowance for loan losses to
nonperforming loans(a) 301 439 461Nonperforming loans to average
loans 1.28 0.44 0.29Market risk–average trading
and credit portfolio VaR– 99% confidence level(d)
Trading activities:Fixed income $ 181 $ 80 $ 56Foreign exchange 34 23 22Equities 57 48 31Commodities and other 32 33 45Diversification(e) (108) (77) (70)
Total trading VaR(f) 196 107 84Credit portfolio VaR(g) 69 17 15Diversification(e) (63) (18) (11)
Total trading and credit portfolio VaR $ 202 $ 106 $ 88
(a) Nonperforming loans included loans held-for-sale and loans at fair value of $32 mil-lion, $50 million and $3 million at December 31, 2008, 2007 and 2006, respectively,which were excluded from the allowance coverage ratios. Nonperforming loans atDecember 31, 2006, excluded distressed loans held-for-sale that were purchased aspart of IB’s proprietary activities. As a result of the adoption of SFAS 159 in the firstquarter of 2007, these loans were reclassified to trading assets.
(b) As a result of the adoption of SFAS 159 in the first quarter of 2007, $11.7 billion ofloans were reclassified to trading assets.
(c) Loans held-for-sale and loans at fair value were excluded when calculating theallowance coverage ratio and net charge-off (recovery) rate.
(d) Results for 2008 include seven months of the combined Firm’s (JPMorgan Chase’sand Bear Stearns’) results and five months of heritage JPMorgan Chase results. Allprior periods reflect heritage JPMorgan Chase results. For a more complete descrip-tion of value-at-risk (“VaR”), see pages 112–115 of this Annual Report.
(e) Average VaRs were less than the sum of the VaRs of their market risk components,which was due to risk offsets resulting from portfolio diversification. The diversificationeffect reflected the fact that the risks were not perfectly correlated. The risk of a port-folio of positions is usually less than the sum of the risks of the positions themselves.
(f) Trading VaR includes predominantly all trading activities in IB; however, particular riskparameters of certain products are not fully captured, for example, correlation risk.Trading VaR does not include VaR related to held-for-sale funded loans and unfundedcommitments, nor the debit valuation adjustments (“DVA”) taken on derivative andstructured liabilities to reflect the credit quality of the Firm. See the DVA Sensitivitytable on page 115 of this Annual Report for further details. Trading VaR also does notinclude the MSR portfolio or VaR related to other corporate functions, such asCorporate/Private Equity. Beginning in the fourth quarter of 2008, trading VaRincludes the estimated credit spread sensitivity of certain mortgage products.
(g) Included VaR on derivative credit valuation adjustments (“CVA”), hedges of the CVAand mark-to-market hedges of the retained loan portfolio, which were all reported inprincipal transactions revenue. This VaR does not include the retained loan portfolio.
(h) Excluding the impact of a loan originated in March 2008 to Bear Stearns, theadjusted ratio would be 4.84% for 2008. The average balance of the loan extendedto Bear Stearns was $1.9 billion for 2008. The allowance for loan losses to period-end loans was 4.83% and 1.92% at December 31, 2008 and 2007, respectively.
Market shares and rankings(a)
2008 2007 2006
Market Market MarketDecember 31, share Rankings share Rankings share Rankings
Global debt, equity and equity-related 10% #1 8% #2 7% #2
Global syndicated loans 12 1 13 1 14 1Global long-term debt(b) 9 2 7 3 6 3Global equity and
equity-related(c) 12 1 9 2 7 6Global announced
M&A(d) 27 2 27 4 26 4
U.S. debt, equity and equity-related 16 1 10 2 9 2
U.S. syndicated loans 26 1 24 1 26 1U.S. long-term debt(b) 15 1 10 2 9 2U.S. equity and
equity-related(c) 16 1 11 5 8 6U.S. announced M&A(d) 33 3 28 3 29 3
(a) Source: Thomson Reuters. The results for 2008 are pro forma for the Bear Stearnsmerger. The results for 2007 and 2006 represent heritage JPMorgan Chase only.
(b) Includes asset-backed securities, mortgage-backed securities and municipal securi-ties.
(c) Includes rights offerings; U.S. domiciled equity and equity-related transactions.(d) Global announced M&A is based upon rank value; all other rankings are based
upon proceeds, with full credit to each book manager/equal if joint. Because of jointassignments, market share of all participants will add up to more than 100%.Global and U.S. announced M&A market share and rankings for 2007 and 2006include transactions withdrawn since December 31, 2007 and 2006. U.S.announced M&A represents any U.S. involvement ranking.
According to Thomson Reuters, in 2008, the Firm improved its posi-tions to #1 in Global Debt, Equity and Equity-related transactionsand Global Equity and Equity-related transactions; and improved itsposition to #2 in Global Long-term Debt and Global AnnouncedM&A. The Firm maintained its #1 position in Global SyndicatedLoans.
According to Dealogic, the Firm was ranked #1 in InvestmentBanking fees generated during 2008, based upon revenue.
JPMorgan Chase & Co. / 2008 Annual Report 57
RETAIL F INANCIAL SERVICES
On September 25, 2008, JPMorgan Chase acquired the bankingoperations of Washington Mutual from the FDIC for $1.9 billionthrough a purchase of substantially all of the assets and assumptionof specified liabilities of Washington Mutual. Washington Mutual’sbanking operations consisted of a retail bank network of 2,244branches, a nationwide credit card lending business, a multi-familyand commercial real estate lending business, and nationwide mort-gage banking activities. The transaction expanded the Firm’s U.S.consumer branch network in California, Florida, Washington,Georgia, Idaho, Nevada and Oregon and created the nation’s third-largest branch network.
During the first quarter of 2006, RFS completed the purchase ofCollegiate Funding Services, which contributed a student loan servic-ing capability and provided an entry into the Federal FamilyEducation Loan Program consolidation market. On July 1, 2006, RFSsold its life insurance and annuity underwriting businesses toProtective Life Corporation. On October 1, 2006, JPMorgan Chasecompleted the Bank of New York transaction, significantly strength-ening RFS’ distribution network in the New York tri-state area.
Selected income statement data Year ended December 31,(in millions) 2008 2007 2006
RevenueLending & deposit-related fees $ 2,546 $ 1,881 $ 1,597Asset management, administration
and commissions 1,510 1,275 1,422Securities gains (losses) — 1 (57)Mortgage fees and related income(a) 3,621 2,094 618Credit card income 939 646 523Other income 739 882 557
Noninterest revenue 9,355 6,779 4,660Net interest income 14,165 10,526 10,165
Total net revenue 23,520 17,305 14,825
Provision for credit losses 9,905 2,610 561
Noninterest expenseCompensation expense(a) 5,068 4,369 3,657Noncompensation expense(a) 6,612 5,071 4,806Amortization of intangibles 397 465 464
Total noninterest expense 12,077 9,905 8,927
Year ended December 31,(in millions, except ratios) 2008 2007 2006
Income before income tax expense 1,538 4,790 5,337
Income tax expense 658 1,865 2,124
Net income $ 880 $ 2,925 $ 3,213
Financial ratiosROE 5% 18% 22%Overhead ratio 51 57 60Overhead ratio excluding core
deposit intangibles(b) 50 55 57
(a) The Firm adopted SFAS 159 in the first quarter of 2007. As a result, beginning inthe first quarter of 2007, certain loan-origination costs have been classified asexpense.
(b) Retail Financial Services uses the overhead ratio (excluding the amortization of coredeposit intangibles (“CDI”)), a non-GAAP financial measure, to evaluate the under-lying expense trends of the business. Including CDI amortization expense in theoverhead ratio calculation results in a higher overhead ratio in the earlier years anda lower overhead ratio in later years; this method would result in an improvingoverhead ratio over time, all things remaining equal. This non-GAAP ratio excludesRetail Banking’s core deposit intangible amortization expense related to the Bank ofNew York transaction and the Bank One merger of $394 million, $460 million and$458 million for the years ended December 31, 2008, 2007 and 2006, respectively.
2008 compared with 2007 Net income was $880 million, a decrease of $2.0 billion, or 70%,from the prior year, as a significant increase in the provision for cred-it losses was partially offset by positive MSR risk management resultsand the positive impact of the Washington Mutual transaction.
Total net revenue was $23.5 billion, an increase of $6.2 billion, or36%, from the prior year. Net interest income was $14.2 billion, up$3.6 billion, or 35%, benefiting from the Washington Mutual trans-action, wider loan and deposit spreads, and higher loan and depositbalances. Noninterest revenue was $9.4 billion, up $2.6 billion, or38%, as positive MSR risk management results, the impact of theWashington Mutual transaction, higher mortgage origination volumeand higher deposit-related fees were partially offset by an increase inreserves related to the repurchase of previously sold loans and mark-downs on the mortgage warehouse.
The provision for credit losses was $9.9 billion, an increase of $7.3billion from the prior year. Delinquency rates have increased due tooverall weak economic conditions, while housing price declines havecontinued to drive increased loss severities, particularly for high loan-to-value home equity and mortgage loans. The provision includes $4.7billion in additions to the allowance for loan losses for the heritageChase home equity and mortgage portfolios. Home equity net charge-offs were $2.4 billion (2.23% net charge-off rate; 2.39% excludingpurchased credit-impaired loans), compared with $564 million(0.62% net charge-off rate) in the prior year. Subprime mortgage netcharge-offs were $933 million (5.49% net charge-off rate; 6.10%excluding purchased credit-impaired loans), compared with $157 mil-lion (1.55% net charge-off rate) in the prior year. Prime mortgage netcharge-offs were $526 million (1.05% net charge-off rate; 1.18%excluding purchased credit-impaired loans), compared with $33 mil-lion (0.13% net charge-off rate) in the prior year. The provision forcredit losses was also affected by an increase in estimated losses forthe auto, student and business banking loan portfolios.
Retail Financial Services, which includes the Retail Bankingand Consumer Lending reporting segments, serves con-sumers and businesses through multiple channels.Customers can use more than 5,400 bank branches (third-largest nationally), 14,500 ATMs (second-largest nationally)as well as online and mobile banking. More than 21,400branch salespeople assist customers with checking andsavings accounts, mortgages, home equity and businessloans, and investments across the 23-state footprint fromNew York and Florida to California. Consumers also canobtain loans through more than 16,000 auto dealershipsand 4,800 schools and universities nationwide.
Management’s discussion and analysis
58 JPMorgan Chase & Co. / 2008 Annual Report
Selected metricsYear ended December 31,(in millions, except headcount and ratios) 2008 2007 2006
Selected balance sheet data –period-end
Assets $419,831 $256,351 $237,887Loans:
Loans retained 368,786 211,324 180,760Loans held-for-sale and loans
at fair value(a) 9,996 16,541 32,744
Total loans 378,782 227,865 213,504Deposits 360,451 221,129 214,081Equity 25,000 16,000 16,000
Selected balance sheet data(average)
Assets $304,442 $241,112 $231,566Loans:
Loans retained 257,083 191,645 187,753Loans held-for-sale and loans
at fair value(a) 17,056 22,587 16,129
Total loans 274,139 214,232 203,882Deposits 258,362 218,062 201,127Equity 19,011 16,000 14,629
Headcount 102,007 69,465 65,570
Credit data and quality statistics
Net charge-offs $ 4,877 $ 1,350 $ 576Nonperforming loans(b)(c)(d)(e) 6,784 2,828 1,677Nonperforming assets(b)(c)(d)(e) 9,077 3,378 1,902Allowance for loan losses 8,918 2,668 1,392Net charge-off rate(f) 1.90% 0.70% 0.31%Net charge-off rate excluding
credit-impaired loans(f)(g) 2.08 0.70 0.31Allowance for loan losses to
ending loans(f) 2.42 1.26 0.77Allowance for loan losses to ending
loans excluding purchasedcredit-impaired loans(f)(g) 3.19 1.26 0.77
Allowance for loan losses to nonperforming loans(f) 136 97 89
Nonperforming loans to total loans 1.79 1.24 0.79
(a) Loans included prime mortgage loans originated with the intent to sell, which, fornew originations on or after January 1, 2007, were accounted for at fair value underSFAS 159. These loans, classified as trading assets on the Consolidated BalanceSheets, totaled $8.0 billion and $12.6 billion at December 31, 2008 and 2007,respectively. Average loans included prime mortgage loans, classified as tradingassets on the Consolidated Balance Sheets, of $14.2 billion and $11.9 billion for theyears ended December 31, 2008 and 2007, respectively.
(b) Excludes purchased credit-impaired loans accounted for under SOP 03-3 that wereacquired as part of the Washington Mutual transaction. These loans were accountedfor on a pool basis and the pools are considered to be performing under SOP 03-3.
(c) Nonperforming loans and assets included loans held-for-sale and loans accountedfor at fair value of $236 million, $69 million and $116 million at December 31,2008, 2007 and 2006, respectively. Certain of these loans are classified as tradingassets on the Consolidated Balance Sheets.
(d) Nonperforming loans and assets excluded (1) loans eligible for repurchase as wellas loans repurchased from Government National Mortgage Association (“GNMA”)pools that are insured by U.S. government agencies of $3.3 billion, $1.5 billion and$1.2 billion at December 31, 2008, 2007 and 2006, respectively, and (2) studentloans that are 90 days past due and still accruing, which are insured by U.S. govern-ment agencies under the Federal Family Education Loan Program of $437 million,$417 million and $387 million at December 31, 2008, 2007 and 2006, respectively.These amounts were excluded, as reimbursement is proceeding normally.
Total noninterest expense was $12.1 billion, an increase of $2.2 bil-lion, or 22%, from the prior year, reflecting the impact of theWashington Mutual transaction, higher mortgage reinsurance losses,higher mortgage servicing expense and investments in the retail dis-tribution network.
2007 compared with 2006 Net income was $2.9 billion, a decrease of $288 million, or 9%,from the prior year, as a decline in Consumer Lending was offset par-tially by improved results in Retail Banking.
Total net revenue was $17.3 billion, an increase of $2.5 billion, or17%, from the prior year. Net interest income was $10.5 billion, up$361 million, or 4%, due to the Bank of New York transaction, widerloan spreads and higher deposit balances. These benefits were offsetpartially by the sale of the insurance business and a shift to narrow-er–spread deposit products. Noninterest revenue was $6.8 billion, up$2.1 billion, benefiting from positive MSR risk management results;an increase in deposit-related fees; and the absence of a prior-year$233 million loss related to $13.3 billion of mortgage loans trans-ferred to held-for-sale. Noninterest revenue also benefited from theclassification of certain mortgage loan origination costs as expense(loan origination costs previously netted against revenue commencedbeing recorded as an expense in the first quarter of 2007 due to theadoption of SFAS 159).
The provision for credit losses was $2.6 billion, compared with $561million in the prior year. The current year provision includes a netincrease of $1.0 billion in the allowance for loan losses related tohome equity loans as continued weak housing prices have resultedin an increase in estimated losses for high loan-to-value loans. Homeequity net charge-offs were $564 million (0.62% net charge-offrate), compared with $143 million (0.18% net charge-off rate) in theprior year. In addition, the current-year provision includes a $166 mil-lion increase in the allowance for loan losses related to subprimemortgage loans, reflecting an increase in estimated losses andgrowth in the portfolio. Subprime mortgage net charge-offs were$157 million (1.55% net charge-off rate), compared with $47 million(0.34% net charge-off rate) in the prior year.
Total noninterest expense was $9.9 billion, an increase of $978 mil-lion, or 11%, from the prior year due to the Bank of New York trans-action; the classification of certain loan origination costs as expensedue to the adoption of SFAS 159; investments in the retail distribu-tion network; and higher mortgage production and servicingexpense. These increases were offset partially by the sale of theinsurance business.
JPMorgan Chase & Co. / 2008 Annual Report 59
(e) During the second quarter of 2008, the policy for classifying subprime mortgageand home equity loans as nonperforming was changed to conform to all otherhome lending products. Amounts for 2007 have been revised to reflect this change.Amounts for 2006 have not been revised as the impact was not material.
(f) Loans held-for-sale and loans accounted for at fair value were excluded when calcu-lating the allowance coverage ratio and the net charge-off rate.
(g) Excludes the impact of purchased credit-impaired loans accounted for under SOP03-3 that were acquired as part of the Washington Mutual transaction at December31, 2008. These loans were accounted for at fair value on the acquisition date,which included the impact of credit losses over the remaining life of the portfolio.Accordingly, no allowance for loan losses has been recorded for these loans.
Retail Banking Selected income statement data Year ended December 31,(in millions, except ratios) 2008 2007 2006
Noninterest revenue $ 4,951 $ 3,763 $ 3,259Net interest income 7,659 6,193 5,698
Total net revenue 12,610 9,956 8,957Provision for credit losses 449 79 114Noninterest expense 7,232 6,166 5,667
Income before income tax expense 4,929 3,711 3,176
Net income $ 2,982 $ 2,245 $ 1,922
Overhead ratio 57% 62% 63%Overhead ratio excluding core
deposit intangibles(a) 54 57 58
(a) Retail Banking uses the overhead ratio (excluding the amortization of core depositintangibles (“CDI”)), a non-GAAP financial measure, to evaluate the underlyingexpense trends of the business. Including CDI amortization expense in the overheadratio calculation results in a higher overhead ratio in the earlier years and a loweroverhead ratio in later years; this method would result in an improving overheadratio over time, all things remaining equal. This ratio excludes Retail Banking’s coredeposit intangible amortization expense related to the Bank of New York transac-tion and the Bank One merger of $394 million, $460 million and $458 million forthe years ended December 31, 2008, 2007 and 2006, respectively.
2008 compared with 2007 Retail Banking net income was $3.0 billion, up $737 million, or33%, from the prior year. Total net revenue was $12.6 billion, up$2.7 billion, or 27%, reflecting the impact of the Washington Mutualtransaction, wider deposit spreads, higher deposit-related fees, andhigher deposit balances. The provision for credit losses was $449 mil-lion, compared with $79 million in the prior year, reflecting anincrease in the allowance for loan losses for Business Banking loansdue to higher estimated losses on the portfolio. Noninterest expensewas $7.2 billion, up $1.1 billion, or 17%, from the prior year, due tothe Washington Mutual transaction and investments in the retail dis-tribution network.
2007 compared with 2006 Retail Banking net income was $2.2 billion, an increase of $323 mil-lion, or 17%, from the prior year. Total net revenue was $10.0 bil-lion, up $1.0 billion, or 11%, benefiting from the following: the Bankof New York transaction; increased deposit-related fees; and growthin deposits. These benefits were offset partially by a shift to narrow-er-spread deposit products. The provision for credit losses was $79million, compared with $114 million in the prior year. Noninterestexpense was $6.2 billion, up $499 million, or 9%, from the prioryear, driven by the Bank of New York transaction and investments inthe retail distribution network.
Selected metrics Year ended December 31,(in billions, except ratios and where otherwise noted) 2008 2007 2006
Business metrics Selected ending balancesBusiness banking origination
volume $ 5.5 $ 6.9 $ 5.7End-of-period loans owned 18.4 15.6 14.0End-of-period depositsChecking $ 109.2 $ 66.9 $ 67.1Savings 144.0 96.0 91.5Time and other 89.1 48.6 43.2
Total end-of-period deposits 342.3 211.5 201.8
Average loans owned $ 16.7 $ 14.9 $ 13.4Average depositsChecking $ 77.1 $ 65.8 $ 62.7Savings 114.3 97.1 89.7Time and other 53.2 43.8 37.5
Total average deposits 244.6 206.7 189.9Deposit margin 2.89% 2.72% 2.74%Average assets $ 26.3 $ 25.0 $ 20.5
Credit data and quality statistics (in millions, except ratio)
Net charge-offs $ 346 $ 163 $ 114Net charge-off rate 2.07% 1.09% 0.85%Nonperforming assets $ 424 $ 294 $ 244
Retail branch business metricsYear ended december 31, 2008 2007 2006
Investment sales volume(in millions) $ 17,640 $ 18,360 $ 14,882
Number of:Branches 5,474 3,152 3,079ATMs 14,568 9,186 8,506Personal bankers(a) 15,825 9,650 7,573Sales specialists(a) 5,661 4,105 3,614Active online customers
(in thousands) 11,710 5,918 4,909Checking accounts
(in thousands) 24,499 10,839 9,995
(a) Employees acquired as part of the Bank of New York transaction are included begin-ning in 2007.
Consumer Lending Selected income statement dataYear ended December 31,(in millions, except ratio) 2008 2007 2006
Noninterest revenue $ 4,404 $ 3,016 $ 1,401Net interest income 6,506 4,333 4,467
Total net revenue 10,910 7,349 5,868Provision for credit losses 9,456 2,531 447Noninterest expense 4,845 3,739 3,260
Income (loss) before income tax expense (3,391) 1,079 2,161
Net income (loss) $ (2,102) $ 680 $ 1,291Overhead ratio 44% 51% 56%
Management’s discussion and analysis
60 JPMorgan Chase & Co. / 2008 Annual Report
2008 compared with 2007 Consumer Lending net loss was $2.1 billion, compared with netincome of $680 million in the prior year. Total net revenue was $10.9billion, up $3.6 billion, or 48%, driven by higher mortgage fees andrelated income (due primarily to positive MSR risk managementresults), the impact of the Washington Mutual transaction, higherloan balances and wider loan spreads.
The increase in mortgage fees and related income was primarily driv-en by higher net mortgage servicing revenue. Mortgage productionrevenue of $898 million was up $18 million, as higher mortgageorigination volume was predominantly offset by an increase inreserves related to the repurchase of previously sold loans and mark-downs of the mortgage warehouse. Net mortgage servicing revenue(which includes loan servicing revenue, MSR risk management resultsand other changes in fair value) was $2.7 billion, an increase of $1.5billion, or 124%, from the prior year. Loan servicing revenue was$3.3 billion, an increase of $924 million. Third-party loans servicedincreased 91%, primarily due to the Washington Mutual transaction.MSR risk management results were $1.5 billion, compared with$411 million in the prior year. Other changes in fair value of the MSRasset were negative $2.1 billion, compared with negative $1.5 bil-lion in the prior year.
The provision for credit losses was $9.5 billion, compared with $2.5billion in the prior year. The provision reflected weakness in the homeequity and mortgage portfolios (see Retail Financial Services discus-sion of the provision for credit losses for further detail).
Noninterest expense was $4.8 billion, up $1.1 billion, or 30%, fromthe prior year, reflecting higher mortgage reinsurance losses, theimpact of the Washington Mutual transaction and higher servicingexpense due to increased delinquencies and defaults.
2007 compared with 2006 Consumer Lending net income was $680 million, a decrease of $611million, or 47%, from the prior year. Total net revenue was $7.3 bil-lion, up $1.5 billion, or 25%, benefiting from positive MSR risk man-agement results, increased mortgage production revenue, wider loanspreads and the absence of a prior-year $233 million loss related to$13.3 billion of mortgage loans transferred to held-for-sale. Thesebenefits were offset partially by the sale of the insurance business.
Mortgage production revenue was $880 million, up $576 million,reflecting the impact of an increase in mortgage loan originationsand the classification of certain loan origination costs as expense(loan origination costs previously netted against revenue commencedbeing recorded as an expense in the first quarter of 2007 due to theadoption of SFAS 159). These benefits were offset partially by mark-downs of $241 million on the mortgage warehouse and pipeline. Netmortgage servicing revenue, which includes loan servicing revenue,MSR risk management results and other changes in fair value, was$1.2 billion, compared with $314 million in the prior year. Loan serv-icing revenue of $2.3 billion increased $195 million on 17% growthin third-party loans serviced. MSR risk management results were pos-itive $411 million compared with negative $385 million in the prioryear. Other changes in fair value of the MSR asset were negative$1.5 billion, compared with negative $1.4 billion in the prior year.
The provision for credit losses was $2.5 billion, compared with $447million in the prior year. The increase in the provision was due to thehome equity and subprime mortgage portfolios (see Retail FinancialServices discussion of the provision for credit losses for further detail).
Noninterest expense was $3.7 billion, an increase of $479 million, or15%. The increase reflected the classification of certain loan origina-tion costs due to the adoption of SFAS 159; higher servicing costsdue to increased delinquencies and defaults; higher productionexpense due to growth in originations; and increased depreciationexpense on owned automobiles subject to operating leases. Theseincreases were offset partially by the sale of the insurance business.
Selected metrics Year ended December 31,(in billions) 2008 2007 2006
Business metrics Selected ending balancesLoans excluding purchased credit-impaired End-of-period loans owned
Home equity $ 114.3 $ 94.8 $ 85.7Prime mortgage 65.2 34.0 46.5Subprime mortgage 15.3 15.5 13.2Option ARMs 9.0 — —Student loans 15.9 11.0 10.3Auto 42.6 42.3 41.0Other 1.3 2.1 2.8
Total end-of-period loans $ 263.6 $ 199.7 $199.5
Average loans ownedHome equity $ 99.9 $ 90.4 $ 78.3Prime mortgage 45.0 30.4 43.3Subprime mortgage 15.3 12.7 15.4Option ARMs 2.3 — —Student loans 13.6 10.5 8.3Auto 43.8 41.1 42.7Other loans 1.1 2.3 2.4
Total average loans $ 221.0 $ 187.4 $190.4
Year ended December 31,(in billions) 2008 2007 2006
Purchased credit-impaired loans(a)
End-of-period loans ownedHome equity $ 28.6 $ — $ —Prime mortgage 21.8 — —Subprime mortgage 6.8 — —Option ARMs 31.6 — —
Total end-of-period loans $ 88.8 $ — $ —
Average loans ownedHome equity $ 7.1 $ — $ —Prime mortgage 5.4 — —Subprime mortgage 1.7 — —Option ARMs 8.0 — —
Total average loans $ 22.2 $ — $ —
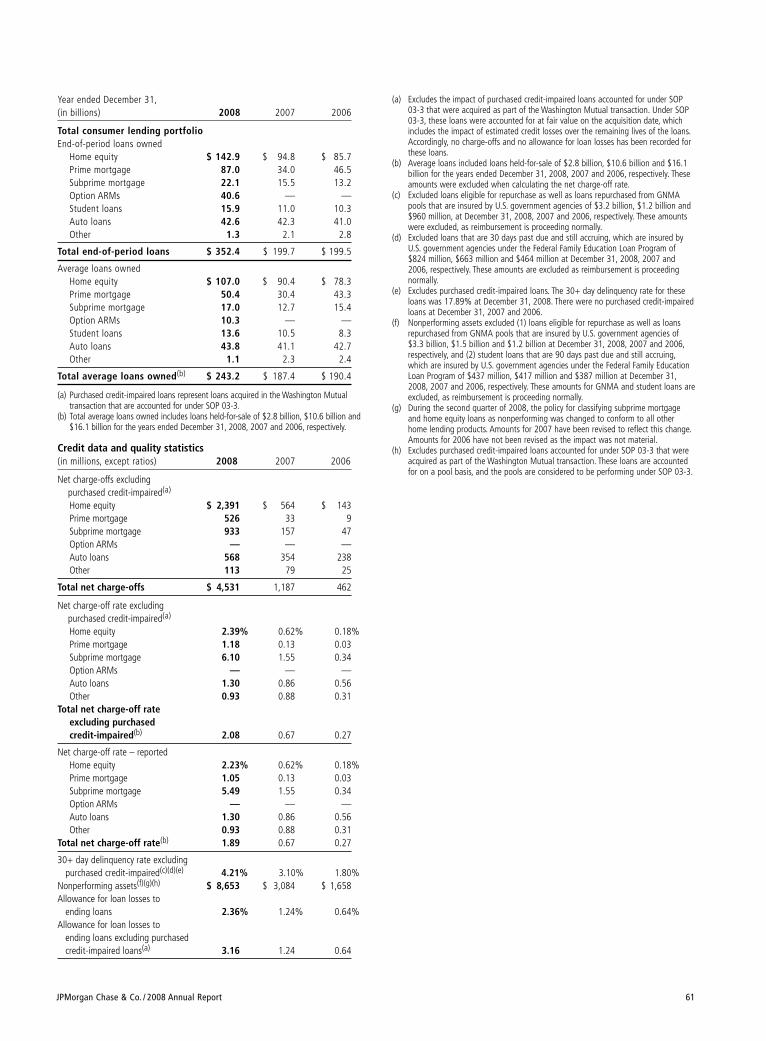
JPMorgan Chase & Co. / 2008 Annual Report 61
Year ended December 31,(in billions) 2008 2007 2006
Total consumer lending portfolioEnd-of-period loans owned
Home equity $ 142.9 $ 94.8 $ 85.7Prime mortgage 87.0 34.0 46.5Subprime mortgage 22.1 15.5 13.2Option ARMs 40.6 — —Student loans 15.9 11.0 10.3Auto loans 42.6 42.3 41.0Other 1.3 2.1 2.8
Total end-of-period loans $ 352.4 $ 199.7 $ 199.5
Average loans ownedHome equity $ 107.0 $ 90.4 $ 78.3Prime mortgage 50.4 30.4 43.3Subprime mortgage 17.0 12.7 15.4Option ARMs 10.3 — —Student loans 13.6 10.5 8.3Auto loans 43.8 41.1 42.7Other 1.1 2.3 2.4
Total average loans owned(b) $ 243.2 $ 187.4 $ 190.4
(a) Purchased credit-impaired loans represent loans acquired in the Washington Mutualtransaction that are accounted for under SOP 03-3.
(b) Total average loans owned includes loans held-for-sale of $2.8 billion, $10.6 billion and$16.1 billion for the years ended December 31, 2008, 2007 and 2006, respectively.
Credit data and quality statistics(in millions, except ratios) 2008 2007 2006
Net charge-offs excluding purchased credit-impaired(a)
Home equity $ 2,391 $ 564 $ 143Prime mortgage 526 33 9Subprime mortgage 933 157 47Option ARMs — — —Auto loans 568 354 238Other 113 79 25
Total net charge-offs $ 4,531 1,187 462
Net charge-off rate excluding purchased credit-impaired(a)
Home equity 2.39% 0.62% 0.18%Prime mortgage 1.18 0.13 0.03Subprime mortgage 6.10 1.55 0.34Option ARMs — — —Auto loans 1.30 0.86 0.56Other 0.93 0.88 0.31
Total net charge-off rate excluding purchased credit-impaired(b) 2.08 0.67 0.27
Net charge-off rate – reportedHome equity 2.23% 0.62% 0.18%Prime mortgage 1.05 0.13 0.03Subprime mortgage 5.49 1.55 0.34Option ARMs — — —Auto loans 1.30 0.86 0.56Other 0.93 0.88 0.31
Total net charge-off rate(b) 1.89 0.67 0.27
30+ day delinquency rate excludingpurchased credit-impaired(c)(d)(e) 4.21% 3.10% 1.80%
Nonperforming assets(f)(g)(h) $ 8,653 $ 3,084 $ 1,658Allowance for loan losses to
ending loans 2.36% 1.24% 0.64%Allowance for loan losses to
ending loans excluding purchasedcredit-impaired loans(a) 3.16 1.24 0.64
(a) Excludes the impact of purchased credit-impaired loans accounted for under SOP03-3 that were acquired as part of the Washington Mutual transaction. Under SOP03-3, these loans were accounted for at fair value on the acquisition date, whichincludes the impact of estimated credit losses over the remaining lives of the loans.Accordingly, no charge-offs and no allowance for loan losses has been recorded forthese loans.
(b) Average loans included loans held-for-sale of $2.8 billion, $10.6 billion and $16.1billion for the years ended December 31, 2008, 2007 and 2006, respectively. Theseamounts were excluded when calculating the net charge-off rate.
(c) Excluded loans eligible for repurchase as well as loans repurchased from GNMApools that are insured by U.S. government agencies of $3.2 billion, $1.2 billion and$960 million, at December 31, 2008, 2007 and 2006, respectively. These amountswere excluded, as reimbursement is proceeding normally.
(d) Excluded loans that are 30 days past due and still accruing, which are insured byU.S. government agencies under the Federal Family Education Loan Program of$824 million, $663 million and $464 million at December 31, 2008, 2007 and2006, respectively. These amounts are excluded as reimbursement is proceedingnormally.
(e) Excludes purchased credit-impaired loans. The 30+ day delinquency rate for theseloans was 17.89% at December 31, 2008. There were no purchased credit-impairedloans at December 31, 2007 and 2006.
(f) Nonperforming assets excluded (1) loans eligible for repurchase as well as loansrepurchased from GNMA pools that are insured by U.S. government agencies of$3.3 billion, $1.5 billion and $1.2 billion at December 31, 2008, 2007 and 2006,respectively, and (2) student loans that are 90 days past due and still accruing,which are insured by U.S. government agencies under the Federal Family EducationLoan Program of $437 million, $417 million and $387 million at December 31,2008, 2007 and 2006, respectively. These amounts for GNMA and student loans areexcluded, as reimbursement is proceeding normally.
(g) During the second quarter of 2008, the policy for classifying subprime mortgageand home equity loans as nonperforming was changed to conform to all otherhome lending products. Amounts for 2007 have been revised to reflect this change.Amounts for 2006 have not been revised as the impact was not material.
(h) Excludes purchased credit-impaired loans accounted for under SOP 03-3 that wereacquired as part of the Washington Mutual transaction. These loans are accountedfor on a pool basis, and the pools are considered to be performing under SOP 03-3.
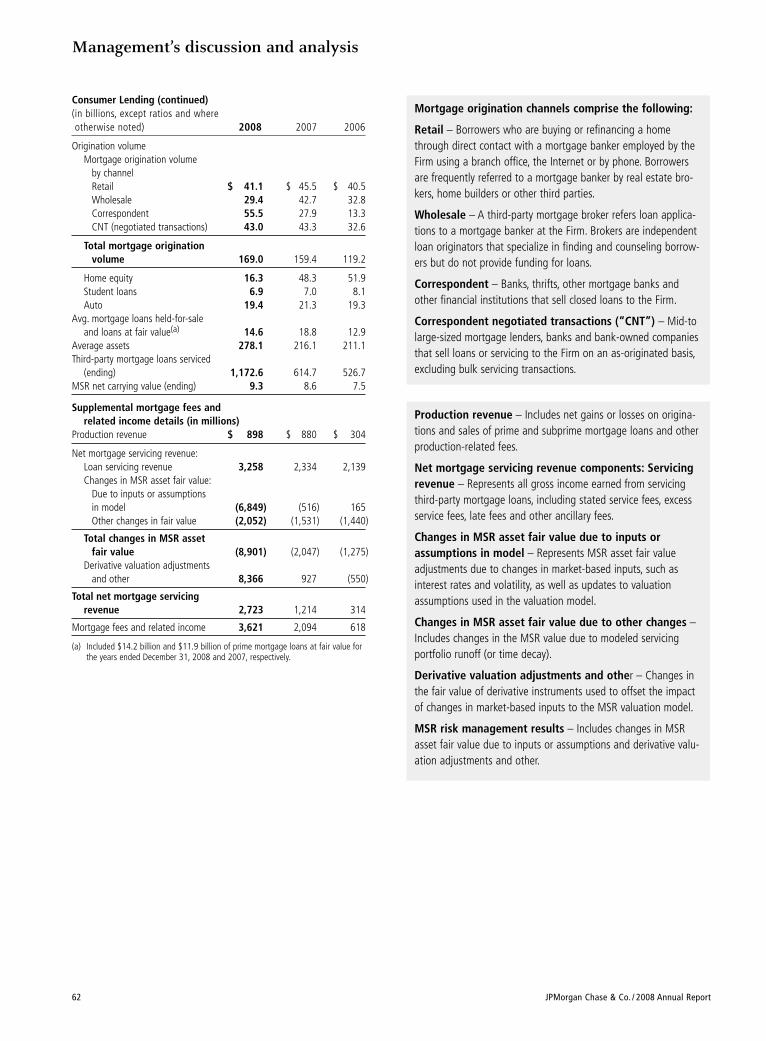
Management’s discussion and analysis
62 JPMorgan Chase & Co. / 2008 Annual Report
Consumer Lending (continued)(in billions, except ratios and whereotherwise noted) 2008 2007 2006
Origination volumeMortgage origination volume
by channelRetail $ 41.1 $ 45.5 $ 40.5Wholesale 29.4 42.7 32.8Correspondent 55.5 27.9 13.3CNT (negotiated transactions) 43.0 43.3 32.6
Total mortgage origination volume 169.0 159.4 119.2
Home equity 16.3 48.3 51.9Student loans 6.9 7.0 8.1Auto 19.4 21.3 19.3
Avg. mortgage loans held-for-sale and loans at fair value(a) 14.6 18.8 12.9
Average assets 278.1 216.1 211.1Third-party mortgage loans serviced
(ending) 1,172.6 614.7 526.7MSR net carrying value (ending) 9.3 8.6 7.5
Supplemental mortgage fees andrelated income details (in millions)
Production revenue $ 898 $ 880 $ 304
Net mortgage servicing revenue:Loan servicing revenue 3,258 2,334 2,139Changes in MSR asset fair value:
Due to inputs or assumptionsin model (6,849) (516) 165Other changes in fair value (2,052) (1,531) (1,440)
Total changes in MSR asset fair value (8,901) (2,047) (1,275)
Derivative valuation adjustmentsand other 8,366 927 (550)
Total net mortgage servicing revenue 2,723 1,214 314
Mortgage fees and related income 3,621 2,094 618
(a) Included $14.2 billion and $11.9 billion of prime mortgage loans at fair value forthe years ended December 31, 2008 and 2007, respectively.
Mortgage origination channels comprise the following:
Retail – Borrowers who are buying or refinancing a homethrough direct contact with a mortgage banker employed by theFirm using a branch office, the Internet or by phone. Borrowersare frequently referred to a mortgage banker by real estate bro-kers, home builders or other third parties.
Wholesale – A third-party mortgage broker refers loan applica-tions to a mortgage banker at the Firm. Brokers are independentloan originators that specialize in finding and counseling borrow-ers but do not provide funding for loans.
Correspondent – Banks, thrifts, other mortgage banks andother financial institutions that sell closed loans to the Firm.
Correspondent negotiated transactions (“CNT”) – Mid-tolarge-sized mortgage lenders, banks and bank-owned companiesthat sell loans or servicing to the Firm on an as-originated basis,excluding bulk servicing transactions.
Production revenue – Includes net gains or losses on origina-tions and sales of prime and subprime mortgage loans and otherproduction-related fees.
Net mortgage servicing revenue components: Servicingrevenue – Represents all gross income earned from servicingthird-party mortgage loans, including stated service fees, excessservice fees, late fees and other ancillary fees.
Changes in MSR asset fair value due to inputs orassumptions in model – Represents MSR asset fair valueadjustments due to changes in market-based inputs, such asinterest rates and volatility, as well as updates to valuationassumptions used in the valuation model.
Changes in MSR asset fair value due to other changes –Includes changes in the MSR value due to modeled servicingportfolio runoff (or time decay).
Derivative valuation adjustments and other – Changes inthe fair value of derivative instruments used to offset the impactof changes in market-based inputs to the MSR valuation model.
MSR risk management results – Includes changes in MSRasset fair value due to inputs or assumptions and derivative valu-ation adjustments and other.
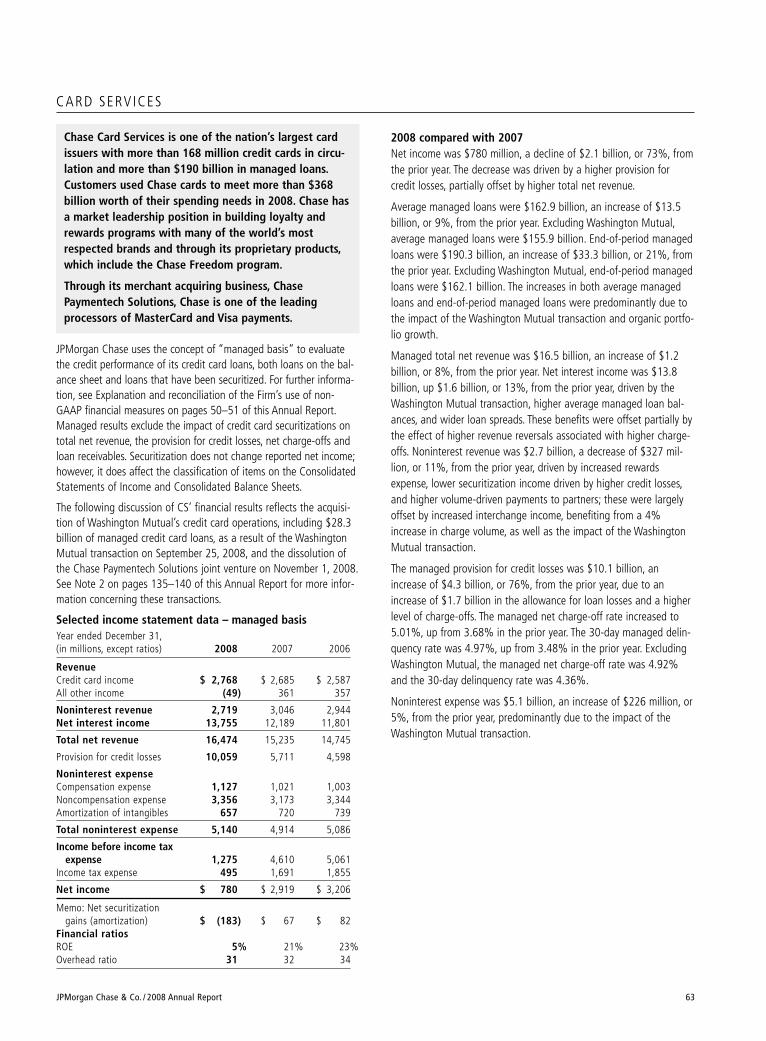
JPMorgan Chase & Co. / 2008 Annual Report 63
CARD SERVICES
JPMorgan Chase uses the concept of “managed basis” to evaluatethe credit performance of its credit card loans, both loans on the bal-ance sheet and loans that have been securitized. For further informa-tion, see Explanation and reconciliation of the Firm’s use of non-GAAP financial measures on pages 50–51 of this Annual Report.Managed results exclude the impact of credit card securitizations ontotal net revenue, the provision for credit losses, net charge-offs andloan receivables. Securitization does not change reported net income;however, it does affect the classification of items on the ConsolidatedStatements of Income and Consolidated Balance Sheets.
The following discussion of CS’ financial results reflects the acquisi-tion of Washington Mutual’s credit card operations, including $28.3billion of managed credit card loans, as a result of the WashingtonMutual transaction on September 25, 2008, and the dissolution ofthe Chase Paymentech Solutions joint venture on November 1, 2008.See Note 2 on pages 135–140 of this Annual Report for more infor-mation concerning these transactions.
Selected income statement data – managed basisYear ended December 31,(in millions, except ratios) 2008 2007 2006
RevenueCredit card income $ 2,768 $ 2,685 $ 2,587All other income (49) 361 357
Noninterest revenue 2,719 3,046 2,944Net interest income 13,755 12,189 11,801
Total net revenue 16,474 15,235 14,745
Provision for credit losses 10,059 5,711 4,598
Noninterest expenseCompensation expense 1,127 1,021 1,003Noncompensation expense 3,356 3,173 3,344Amortization of intangibles 657 720 739
Total noninterest expense 5,140 4,914 5,086
Income before income tax expense 1,275 4,610 5,061
Income tax expense 495 1,691 1,855
Net income $ 780 $ 2,919 $ 3,206
Memo: Net securitization gains (amortization) $ (183) $ 67 $ 82
Financial ratiosROE 5% 21% 23%Overhead ratio 31 32 34
2008 compared with 2007 Net income was $780 million, a decline of $2.1 billion, or 73%, fromthe prior year. The decrease was driven by a higher provision forcredit losses, partially offset by higher total net revenue.
Average managed loans were $162.9 billion, an increase of $13.5billion, or 9%, from the prior year. Excluding Washington Mutual,average managed loans were $155.9 billion. End-of-period managedloans were $190.3 billion, an increase of $33.3 billion, or 21%, fromthe prior year. Excluding Washington Mutual, end-of-period managedloans were $162.1 billion. The increases in both average managedloans and end-of-period managed loans were predominantly due tothe impact of the Washington Mutual transaction and organic portfo-lio growth.
Managed total net revenue was $16.5 billion, an increase of $1.2billion, or 8%, from the prior year. Net interest income was $13.8billion, up $1.6 billion, or 13%, from the prior year, driven by theWashington Mutual transaction, higher average managed loan bal-ances, and wider loan spreads. These benefits were offset partially bythe effect of higher revenue reversals associated with higher charge-offs. Noninterest revenue was $2.7 billion, a decrease of $327 mil-lion, or 11%, from the prior year, driven by increased rewardsexpense, lower securitization income driven by higher credit losses,and higher volume-driven payments to partners; these were largelyoffset by increased interchange income, benefiting from a 4%increase in charge volume, as well as the impact of the WashingtonMutual transaction.
The managed provision for credit losses was $10.1 billion, anincrease of $4.3 billion, or 76%, from the prior year, due to anincrease of $1.7 billion in the allowance for loan losses and a higherlevel of charge-offs. The managed net charge-off rate increased to5.01%, up from 3.68% in the prior year. The 30-day managed delin-quency rate was 4.97%, up from 3.48% in the prior year. ExcludingWashington Mutual, the managed net charge-off rate was 4.92%and the 30-day delinquency rate was 4.36%.
Noninterest expense was $5.1 billion, an increase of $226 million, or5%, from the prior year, predominantly due to the impact of theWashington Mutual transaction.
Chase Card Services is one of the nation’s largest cardissuers with more than 168 million credit cards in circu-lation and more than $190 billion in managed loans.Customers used Chase cards to meet more than $368billion worth of their spending needs in 2008. Chase hasa market leadership position in building loyalty andrewards programs with many of the world’s mostrespected brands and through its proprietary products,which include the Chase Freedom program.
Through its merchant acquiring business, ChasePaymentech Solutions, Chase is one of the leadingprocessors of MasterCard and Visa payments.

Management’s discussion and analysis
64 JPMorgan Chase & Co. / 2008 Annual Report
2007 compared with 2006 Net income of $2.9 billion was down $287 million, or 9%, from theprior year. Prior-year results benefited from significantly lower netcharge-offs following the change in bankruptcy legislation in thefourth quarter of 2005. The increase in net charge-offs was offsetpartially by higher revenue.
End-of-period managed loans of $157.1 billion increased $4.2 bil-lion, or 3%, from the prior year. Average managed loans of $149.3billion increased $8.2 billion, or 6%, from the prior year. The increas-es in both end-of-period and average managed loans resulted fromorganic growth.
Managed total net revenue was $15.2 billion, an increase of $490million, or 3%, from the prior year. Net interest income was $12.2billion, up $388 million, or 3%, from the prior year. The increase innet interest income was driven by a higher level of fees and higheraverage loan balances. These benefits were offset partially by nar-rower loan spreads, the discontinuation of certain billing practices(including the elimination of certain over-limit fees and the two-cyclebilling method for calculating finance charges beginning in the sec-ond quarter of 2007) and the effect of higher revenue reversals asso-
ciated with higher charge-offs. Noninterest revenue was $3.0 billion,an increase of $102 million, or 3%, from the prior year. The increasereflected a higher level of fee-based revenue and increased net inter-change income, which benefited from higher charge volume. Chargevolume growth was 4%, reflecting a 9% increase in sales volume,offset primarily by a lower level of balance transfers, the result ofmore targeted marketing efforts.
The managed provision for credit losses was $5.7 billion, an increaseof $1.1 billion, or 24%, from the prior year. The increase was primari-ly due to a higher level of net charge-offs (the prior year benefitedfrom the change in bankruptcy legislation in the fourth quarter of2005) and an increase in the allowance for loan losses, driven byhigher estimated net charge-offs in the portfolio. The managed netcharge-off rate was 3.68%, up from 3.33% in the prior year. The 30-day managed delinquency rate was 3.48%, up from 3.13% in theprior year.
Noninterest expense was $4.9 billion, a decrease of $172 million, or3%, compared with the prior year, primarily due to lower marketingexpense and lower fraud-related expense, partially offset by highervolume-related expense.
The following are brief descriptions of selected business metrics within Card Services.
• Charge volume – Represents the dollar amount of cardmember purchases, balance transfers and cash advance activity.
• Net accounts opened – Includes originations, purchases and sales.
• Merchant acquiring business – Represents a business that processes bank card transactions for merchants.
–Bank card volume – Represents the dollar amount of transactions processed for merchants.
–Total transactions – Represents the number of transactions and authorizations processed for merchants.
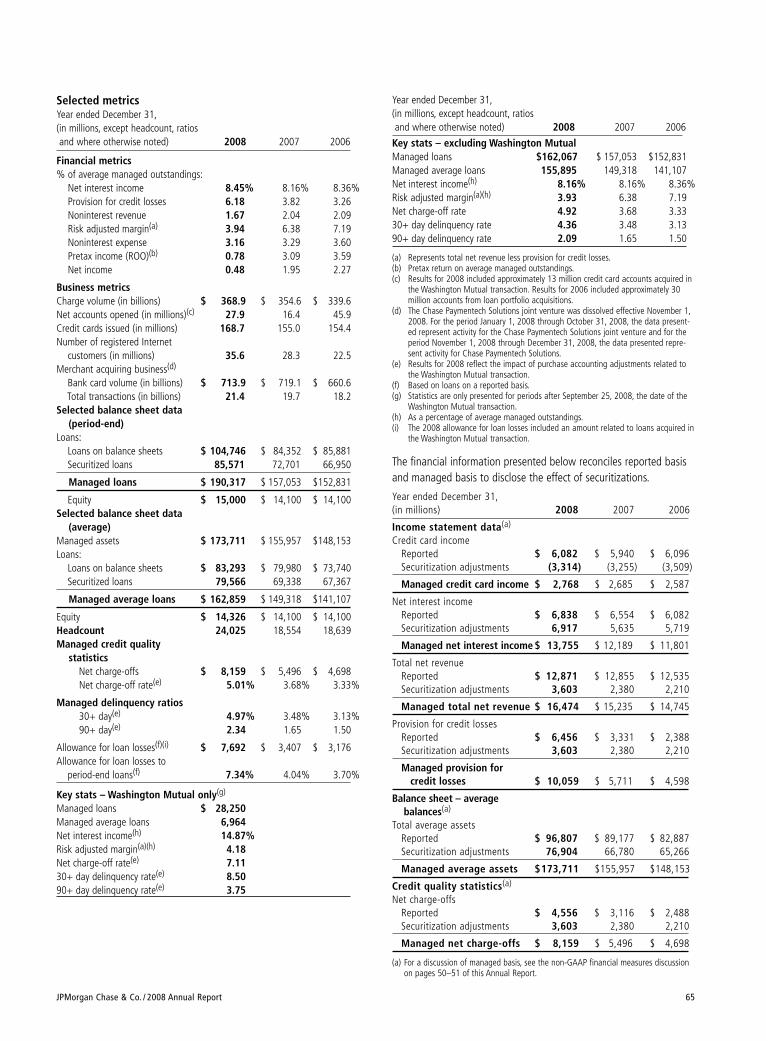
JPMorgan Chase & Co. / 2008 Annual Report 65
Selected metricsYear ended December 31,(in millions, except headcount, ratiosand where otherwise noted) 2008 2007 2006
Financial metrics% of average managed outstandings:
Net interest income 8.45% 8.16% 8.36%Provision for credit losses 6.18 3.82 3.26Noninterest revenue 1.67 2.04 2.09Risk adjusted margin(a) 3.94 6.38 7.19Noninterest expense 3.16 3.29 3.60Pretax income (ROO)(b) 0.78 3.09 3.59Net income 0.48 1.95 2.27
Business metricsCharge volume (in billions) $ 368.9 $ 354.6 $ 339.6Net accounts opened (in millions)(c) 27.9 16.4 45.9Credit cards issued (in millions) 168.7 155.0 154.4Number of registered Internet
customers (in millions) 35.6 28.3 22.5Merchant acquiring business(d)
Bank card volume (in billions) $ 713.9 $ 719.1 $ 660.6Total transactions (in billions) 21.4 19.7 18.2
Selected balance sheet data(period-end)
Loans:Loans on balance sheets $ 104,746 $ 84,352 $ 85,881Securitized loans 85,571 72,701 66,950
Managed loans $ 190,317 $ 157,053 $152,831
Equity $ 15,000 $ 14,100 $ 14,100Selected balance sheet data
(average)Managed assets $ 173,711 $ 155,957 $148,153Loans:
Loans on balance sheets $ 83,293 $ 79,980 $ 73,740Securitized loans 79,566 69,338 67,367
Managed average loans $ 162,859 $ 149,318 $141,107
Equity $ 14,326 $ 14,100 $ 14,100Headcount 24,025 18,554 18,639Managed credit quality
statistics Net charge-offs $ 8,159 $ 5,496 $ 4,698Net charge-off rate(e) 5.01% 3.68% 3.33%
Managed delinquency ratios 30+ day(e) 4.97% 3.48% 3.13%90+ day(e) 2.34 1.65 1.50
Allowance for loan losses(f)(i) $ 7,692 $ 3,407 $ 3,176Allowance for loan losses to
period-end loans(f) 7.34% 4.04% 3.70%
Key stats – Washington Mutual only(g)
Managed loans $ 28,250Managed average loans 6,964Net interest income(h) 14.87%Risk adjusted margin(a)(h) 4.18Net charge-off rate(e) 7.1130+ day delinquency rate(e) 8.5090+ day delinquency rate(e) 3.75
Year ended December 31,(in millions, except headcount, ratiosand where otherwise noted) 2008 2007 2006
Key stats – excluding Washington Mutual Managed loans $162,067 $ 157,053 $152,831Managed average loans 155,895 149,318 141,107Net interest income(h) 8.16% 8.16% 8.36%Risk adjusted margin(a)(h) 3.93 6.38 7.19Net charge-off rate 4.92 3.68 3.3330+ day delinquency rate 4.36 3.48 3.1390+ day delinquency rate 2.09 1.65 1.50
(a) Represents total net revenue less provision for credit losses.(b) Pretax return on average managed outstandings.(c) Results for 2008 included approximately 13 million credit card accounts acquired in
the Washington Mutual transaction. Results for 2006 included approximately 30million accounts from loan portfolio acquisitions.
(d) The Chase Paymentech Solutions joint venture was dissolved effective November 1,2008. For the period January 1, 2008 through October 31, 2008, the data present-ed represent activity for the Chase Paymentech Solutions joint venture and for theperiod November 1, 2008 through December 31, 2008, the data presented repre-sent activity for Chase Paymentech Solutions.
(e) Results for 2008 reflect the impact of purchase accounting adjustments related tothe Washington Mutual transaction.
(f) Based on loans on a reported basis.(g) Statistics are only presented for periods after September 25, 2008, the date of the
Washington Mutual transaction.(h) As a percentage of average managed outstandings.(i) The 2008 allowance for loan losses included an amount related to loans acquired in
the Washington Mutual transaction.
The financial information presented below reconciles reported basisand managed basis to disclose the effect of securitizations.
Year ended December 31,(in millions) 2008 2007 2006
Income statement data(a)
Credit card incomeReported $ 6,082 $ 5,940 $ 6,096Securitization adjustments (3,314) (3,255) (3,509)
Managed credit card income $ 2,768 $ 2,685 $ 2,587
Net interest incomeReported $ 6,838 $ 6,554 $ 6,082Securitization adjustments 6,917 5,635 5,719
Managed net interest income $ 13,755 $ 12,189 $ 11,801
Total net revenueReported $ 12,871 $ 12,855 $ 12,535Securitization adjustments 3,603 2,380 2,210
Managed total net revenue $ 16,474 $ 15,235 $ 14,745
Provision for credit lossesReported $ 6,456 $ 3,331 $ 2,388Securitization adjustments 3,603 2,380 2,210
Managed provision for credit losses $ 10,059 $ 5,711 $ 4,598
Balance sheet – average balances(a)
Total average assetsReported $ 96,807 $ 89,177 $ 82,887Securitization adjustments 76,904 66,780 65,266
Managed average assets $173,711 $155,957 $148,153
Credit quality statistics(a)
Net charge-offsReported $ 4,556 $ 3,116 $ 2,488Securitization adjustments 3,603 2,380 2,210
Managed net charge-offs $ 8,159 $ 5,496 $ 4,698
(a) For a discussion of managed basis, see the non-GAAP financial measures discussionon pages 50–51 of this Annual Report.
Management’s discussion and analysis
66 JPMorgan Chase & Co. / 2008 Annual Report
COMMERCIAL BANKING
On September 25, 2008, JPMorgan Chase acquired the bankingoperations of Washington Mutual from the FDIC, adding approxi-mately $44.5 billion in loans to the Commercial Term Lending, RealEstate Banking and Other businesses in Commercial Banking. OnOctober 1, 2006, JPMorgan Chase completed the acquisition of TheBank of New York’s consumer, business banking and middle-marketbanking businesses, adding approximately $2.3 billion in loans and$1.2 billion in deposits in Commercial Banking.
Selected income statement data Year ended December 31,(in millions, except ratios) 2008 2007 2006
RevenueLending & deposit-related fees $ 854 $ 647 $ 589Asset management, administration
and commissions 113 92 67All other income(a) 514 524 417
Noninterest revenue 1,481 1,263 1,073Net interest income 3,296 2,840 2,727
Total net revenue 4,777 4,103 3,800
Provision for credit losses 464 279 160
Noninterest expenseCompensation expense 692 706 740Noncompensation expense 1,206 1,197 1,179Amortization of intangibles 48 55 60
Total noninterest expense 1,946 1,958 1,979
Income before income tax expense 2,367 1,866 1,661
Income tax expense 928 732 651
Net income $1,439 $1,134 $1,010
Financial ratiosROE 20% 17% 18%Overhead ratio 41 48 52
(a) Revenue from investment banking products sold to CB clients and commercial cardrevenue is included in all other income.
2008 compared with 2007 Net income was $1.4 billion, an increase of $305 million, or 27%,from the prior year, due to growth in total net revenue including theimpact of the Washington Mutual transaction, partially offset by ahigher provision for credit losses.
Record total net revenue of $4.8 billion increased $674 million, or16%. Net interest income of $3.3 billion increased $456 million, or16%, driven by double-digit growth in liability and loan balancesand the impact of the Washington Mutual transaction, partially offsetby spread compression in the liability and loan portfolios. Noninterestrevenue was $1.5 billion, up $218 million, or 17%, due to higherdeposit and lending-related fees.
On a client segment basis, Middle Market Banking revenue was $2.9billion, an increase of $250 million, or 9%, from the prior year duepredominantly to higher deposit-related fees and growth in liabilityand loan balances. Revenue from Commercial Term Lending, a newclient segment established as a result of the Washington Mutualtransaction encompassing multi-family and commercial mortgageloans, was $243 million. Mid-Corporate Banking revenue was $921million, an increase of $106 million, or 13%, reflecting higher loanbalances, investment banking revenue, and deposit-related fees. RealEstate Banking revenue of $413 million decreased $8 million, or 2%.
Provision for credit losses was $464 million, an increase of $185 mil-lion, or 66%, compared with the prior year, reflecting a weakeningcredit environment and loan growth. Net charge-offs were $288 mil-lion (0.35% net charge-off rate), compared with $44 million (0.07%net charge-off rate) in the prior year, predominantly related to anincrease in real estate charge-offs. The allowance for loan lossesincreased $1.1 billion, which primarily reflected the impact of theWashington Mutual transaction. Nonperforming assets were $1.1 bil-lion, an increase of $1.0 billion compared with the prior year, pre-dominantly reflecting the Washington Mutual transaction and higherreal estate-related balances.
Noninterest expense was $1.9 billion, a decrease of $12 million, or1%, from the prior year, due to lower performance-based incentivecompensation and volume-based charges from service providers, pre-dominantly offset by the impact of the Washington Mutual transaction.
2007 compared with 2006 Net income was $1.1 billion, an increase of $124 million, or 12%,from the prior year due primarily to growth in total net revenue, par-tially offset by higher provision for credit losses.
Record total net revenue of $4.1 billion increased $303 million, or8%. Net interest income of $2.8 billion increased $113 million, or4%, driven by double-digit growth in liability balances and loans,which reflected organic growth and the Bank of New York transac-tion, largely offset by the continued shift to narrower-spread liabilityproducts and spread compression in the loan and liability portfolios.Noninterest revenue was $1.3 billion, up $190 million, or 18%, dueto increased deposit-related fees, higher investment banking revenue,and gains on sales of securities acquired in the satisfaction of debt.
On a segment basis, Middle Market Banking revenue was $2.7 bil-lion, an increase of $154 million, or 6%, primarily due to the Bank ofNew York transaction, higher deposit-related fees and growth ininvestment banking revenue. Mid-Corporate Banking revenue was$815 million, an increase of $159 million, or 24%, reflecting higher
Commercial Banking serves more than 26,000 clientsnationally, including corporations, municipalities, finan-cial institutions and not-for-profit entities with annualrevenue generally ranging from $10 million to $2 billion,and nearly 30,000 real estate investors/owners.Delivering extensive industry knowledge, local expertiseand dedicated service, CB partners with the Firm’s otherbusinesses to provide comprehensive solutions, includ-ing lending, treasury services, investment banking andasset management, to meet its clients’ domestic andinternational financial needs.
JPMorgan Chase & Co. / 2008 Annual Report 67
lending revenue, investment banking revenue, and gains on sales ofsecurities acquired in the satisfaction of debt. Real Estate Bankingrevenue of $421 million decreased $37 million, or 8%.
Provision for credit losses was $279 million, compared with $160 mil-lion in the prior year. The increase in the allowance for credit lossesreflected portfolio activity including slightly lower credit quality aswell as growth in loan balances. The allowance for loan losses toaverage loans retained was 2.81%, compared with 2.86% in theprior year.
Noninterest expense was $2.0 billion, a decrease of $21 million, or1%, largely due to lower compensation expense driven by theabsence of prior-year expense from the adoption of SFAS 123R, par-tially offset by expense growth related to the Bank of New Yorktransaction.
Selected metricsYear ended December 31,(in millions) 2008 2007 2006
Revenue by product:Lending $ 1,743 $ 1,419 $ 1,344Treasury services 2,648 2,350 2,243Investment banking 334 292 253Other 52 42 (40)
Total Commercial Banking revenue $ 4,777 $ 4,103 $ 3,800
IB revenue, gross(a) $ 966 $ 888 $ 716
Revenue by business:Middle Market Banking $ 2,939 $ 2,689 $ 2,535Commercial Term Lending(b) 243 — —Mid-Corporate Banking 921 815 656Real Estate Banking(b) 413 421 458Other(b) 261 178 151
Total Commercial Banking revenue $ 4,777 $ 4,103 $ 3,800
Selected balance sheet data(period-end)
Equity $ 8,000 $ 6,700 $ 6,300
Selected balance sheet data(average)
Total assets $114,299 $ 87,140 $ 57,754Loans:
Loans retained 81,931 60,231 53,154Loans held-for-sale and loans at
fair value 406 863 442
Total loans $ 82,337 $ 61,094 $ 53,596Liability balances(c) 103,121 87,726 73,613Equity 7,251 6,502 5,702
Year ended December 31,(in millions, except headcount and ratios) 2008 2007 2006
Average loans by business:Middle Market Banking $ 42,193 $ 37,333 $ 33,225Commercial Term Lending(b) 9,310 — —Mid-Corporate Banking 16,297 12,481 8,632Real Estate Banking(b) 9,008 7,116 7,566Other(b) 5,529 4,164 4,173
Total Commercial Banking loans $ 82,337 $ 61,094 $ 53,596
Headcount 5,206 4,125 4,459
Credit data and quality statistics:
Net charge-offs $ 288 $ 44 $ 27Nonperforming loans(d) 1,026 146 121Nonperforming assets 1,142 148 122Allowance for credit losses:Allowance for loan losses(e) $ 2,826 $ 1,695 $ 1,519Allowance for lending-related
commitments 206 236 187
Total allowance for credit losses $ 3,032 $ 1,931 $ 1,706Net charge-off rate(f) 0.35% 0.07% 0.05%Allowance for loan losses to
average loans(d)(f) 3.04(g) 2.81 2.86Allowance for loan losses to
nonperforming loans(d) 275 1,161 1,255Nonperforming loans to average loans(d) 1.10(g) 0.24 0.23
(a) Represents the total revenue related to investment banking products sold to CBclients.
(b) Results for 2008 include total net revenue and average loans acquired in theWashington Mutual transaction.
(c) Liability balances include deposits and deposits swept to on-balance sheet liabilitiessuch as commercial paper, federal funds purchased and securities loaned or soldunder repurchase agreements.
(d) Purchased credit-impaired wholesale loans accounted for under SOP 03-3 that wereacquired in the Washington Mutual transaction are considered nonperforming loansbecause the timing and amount of expected cash flows are not reasonablyestimable. These nonperforming loans were included when calculating the allowancecoverage ratio, the allowance for loan losses to nonperforming loans ratio, and thenonperforming loans to average loans ratio. The carrying amount of these purchasedcredit-impaired loans was $224 million at December 31, 2008.
(e) Beginning in 2008, the allowance for loan losses included an amount related toloans acquired in the Washington Mutual transaction and the Bear Stearns merger.
(f) Loans held-for-sale and loans accounted for at fair value were excluded when calcu-lating the allowance coverage ratio and the net charge-off rate.
(g) The September 30, 2008, ending loan balance of $44.5 billion acquired in theWashington Mutual transaction is treated as if it had been part of the loan balancefor the entire third quarter of 2008.
Management’s discussion and analysis
68 JPMorgan Chase & Co. / 2008 Annual Report
TREASURY & SECURIT IES SERVICES
As a result of the transaction with the Bank of New York on October 1,2006, selected corporate trust businesses were transferred from TSSto the Corporate/Private Equity segment and are reported in discon-tinued operations.
Selected income statement data Year ended December 31,(in millions, except ratio data) 2008 2007 2006
RevenueLending & deposit-related fees $ 1,146 $ 923 $ 735
Asset management, administration and commissions 3,133 3,050 2,692
All other income 917 708 612
Noninterest revenue 5,196 4,681 4,039Net interest income 2,938 2,264 2,070
Total net revenue 8,134 6,945 6,109
Provision for credit losses 82 19 (1)Credit reimbursement to IB(a) (121) (121) (121)
Noninterest expenseCompensation expense 2,602 2,353 2,198Noncompensation expense 2,556 2,161 1,995Amortization of intangibles 65 66 73
Total noninterest expense 5,223 4,580 4,266
Income before income tax expense 2,708 2,225 1,723
Income tax expense 941 828 633
Net income $ 1,767 $ 1,397 $ 1,090
Revenue by businessTreasury Services $ 3,555 $ 3,013 $ 2,792Worldwide Securities Services 4,579 3,932 3,317
Total net revenue $ 8,134 $ 6,945 $ 6,109
Financial ratiosROE 47% 47% 48%Overhead ratio 64 66 70Pretax margin ratio(b) 33 32 28
Year ended December 31,(in millions, except headcount) 2008 2007 2006
Selected balance sheet data (period-end)
Equity $ 4,500 $ 3,000 $ 2,200
Selected balance sheet data (average)
Total assets $ 54,563 $ 53,350 $ 31,760Loans(c) 26,226 20,821 15,564Liability balances(d) 279,833 228,925 189,540Equity 3,751 3,000 2,285
Headcount 27,070 25,669 25,423
(a) TSS is charged a credit reimbursement related to certain exposures managed withinIB credit portfolio on behalf of clients shared with TSS. Beginning in first quarter2009, income statement and balance sheet items for credit portfolio activity relatedto joint IB/TSS clients will be reflected proportionally in the respective IB and TSSfinancials. This will replace the previous approach whereby a credit reimbursementwas charged to TSS by IB.
(b) Pretax margin represents income before income tax expense divided by total netrevenue, which is a measure of pretax performance and another basis by whichmanagement evaluates its performance and that of its competitors.
(c) Loan balances include wholesale overdrafts, commercial card and trade finance loans.(d) Liability balances include deposits and deposits swept to on-balance sheet liabilities
such as commercial paper, federal funds purchased and securities loaned or soldunder repurchase agreements.
2008 compared with 2007 Net income was a record $1.8 billion, an increase of $370 million, or26%, from the prior year, driven by higher total net revenue. Thisincrease was largely offset by higher noninterest expense.
Total net revenue was a record $8.1 billion, an increase of $1.2 bil-lion, or 17%, from the prior year. Worldwide Securities Services post-ed record net revenue of $4.6 billion, an increase of $647 million, or16%, from the prior year. The growth was driven by wider spreads insecurities lending, foreign exchange and liability products, increasedproduct usage by new and existing clients (largely in custody, fundservices, alternative investment services and depositary receipts) andhigher liability balances, reflecting increased client deposit activityresulting from recent market conditions. These benefits were offsetpartially by market depreciation. Treasury Services posted record netrevenue of $3.6 billion, an increase of $542 million, or 18%, reflect-ing higher liability balances and volume growth in electronic fundstransfer products and trade loans. Revenue growth from higher liabil-ity balances reflects increased client deposit activity resulting fromrecent market conditions as well as organic growth. TSS firmwide netrevenue, which includes Treasury Services net revenue recorded inother lines of business, grew to $11.1 billion, an increase of $1.5 bil-lion, or 16%. Treasury Services firmwide net revenue grew to $6.5billion, an increase of $869 million, or 15%.
Noninterest expense was $5.2 billion, an increase of $643 million, or14%, from the prior year, reflecting higher expense related to busi-ness and volume growth as well as continued investment in newproduct platforms.
2007 compared with 2006 Net income was a record $1.4 billion, an increase of $307 million, or28%, from the prior year, driven by record total net revenue, partiallyoffset by higher noninterest expense.
68 JPMorgan Chase & Co. / 2008 Annual Report
TSS is a global leader in transaction, investment andinformation services. TSS is one of the world’s largestcash management providers and a leading global custo-dian. TS provides cash management, trade, wholesalecard and liquidity products and services to small andmid-sized companies, multinational corporations, finan-cial institutions and government entities. TS partnerswith the Commercial Banking, Retail Financial Servicesand Asset Management businesses to serve clientsfirmwide. As a result, certain TS revenue is included inother segments’ results. WSS holds, values, clears andservices securities, cash and alternative investments forinvestors and broker-dealers, and manages depositaryreceipt programs globally.
JPMorgan Chase & Co. / 2008 Annual Report 69
Total net revenue was $6.9 billion, an increase of $836 million, or14%, from the prior year. Worldwide Securities Services net revenueof $3.9 billion was up $615 million, or 19%. The growth was drivenby increased product usage by new and existing clients (primarily cus-tody, securities lending, depositary receipts and fund services), marketappreciation on assets under custody, and wider spreads on securitieslending. These gains were offset partially by spread compression onliability products. Treasury Services net revenue was $3.0 billion, anincrease of $221 million, or 8%, from the prior year. The results weredriven by growth in electronic transaction volumes and higher liabilitybalances, offset partially by a shift to narrower-spread liability prod-ucts. TSS firmwide net revenue, which includes Treasury Services netrevenue recorded in other lines of business, grew to $9.6 billion, up$1.0 billion, or 12%. Treasury Services firmwide net revenue grew to$5.6 billion, up $391 million, or 7%.
Noninterest expense was $4.6 billion, an increase of $314 million, or7%, from the prior year, reflecting higher expense related to businessand volume growth, as well as investment in new product platforms.
Treasury & Securities Services firmwide metrics include revenuerecorded in the CB, Retail Banking and AM lines of business andexcludes foreign exchange (“FX”) revenue recorded in IB for TSS-related FX activity. In order to capture the firmwide impact of TS andTSS products and revenue, management reviews firmwide metricssuch as liability balances, revenue and overhead ratios in assessingfinancial performance for TSS. Firmwide metrics are necessary in orderto understand the aggregate TSS business.
Selected metrics Year ended December 31,(in millions, except ratio data) 2008 2007 2006
TSS firmwide disclosuresTreasury Services revenue –
reported $ 3,555 $ 3,013 $ 2,792Treasury Services revenue
reported in Commercial Banking 2,648 2,350 2,243Treasury Services revenue
reported in other lines of business 299 270 207
Treasury Services firmwide revenue(a) 6,502 5,633 5,242
Worldwide Securities Services revenue 4,579 3,932 3,317
Treasury & Securities Services firmwide revenue(a) $ 11,081 $ 9,565 $ 8,559
Treasury Services firmwide liability balances (average)(b) $242,706 $199,077 $162,020
Treasury & Securities Services firmwide liability balances(average)(b) 382,947 316,651 262,678
TSS firmwide financial ratiosTreasury Services firmwide overhead
ratio(c) 51% 56% 56%Treasury & Securities Services
firmwide overhead ratio(c) 57 60 62
Year ended December 31,(in millions, except ratio data and where otherwise noted) 2008 2007 2006
Firmwide business metricsAssets under custody (in billions) $ 13,205 $ 15,946 $ 13,903
Number of:U.S.$ ACH transactions originated
(in millions) 4,000 3,870 3,503Total U.S.$ clearing volume
(in thousands) 115,742 111,036 104,846International electronic funds transfer
volume (in thousands)(d) 171,036 168,605 145,325Wholesale check volume
(in millions) 2,408 2,925 3,409Wholesale cards issued
(in thousands)(e) 22,784 18,722 17,228
Credit data and quality statistics
Net charge-offs (recoveries) $ (2) $ — $ 1Nonperforming loans 30 — —Allowance for loan losses 74 18 7Allowance for lending-related
commitments 63 32 1
Net charge-off (recovery) rate (0.01)% —% 0.01%Allowance for loan losses to
average loans 0.28 0.09 0.04Allowance for loan losses to
nonperforming loans 247 NM NMNonperforming loans to average
loans 0.11 — —
(a) TSS firmwide FX revenue, which includes FX revenue recorded in TSS and FX rev-enue associated with TSS customers who are FX customers of IB, was $880 million,$552 million and $445 million for the years ended December 31, 2008, 2007 and2006, respectively.
(b) Firmwide liability balances include TS’ liability balances recorded in the CommercialBanking line of business.
(c) Overhead ratios have been calculated based upon firmwide revenue and TSS and TSexpense, respectively, including those allocated to certain other lines of business. FXrevenue and expense recorded in IB for TSS-related FX activity are not included inthis ratio.
(d) International electronic funds transfer includes non-U.S. dollar ACH and clearing vol-ume.
(e) Wholesale cards issued include domestic commercial card, stored value card, pre-paid card and government electronic benefit card products.
Management’s discussion and analysis
70 JPMorgan Chase & Co. / 2008 Annual Report
ASSET MANAGEMENT
On May 30, 2008, JPMorgan Chase merged with The Bear StearnsCompanies, Inc. The merger resulted in the addition of a new clientsegment, Bear Stearns Brokerage, but did not materially affect bal-ances or business metrics.
Selected income statement dataYear ended December 31,(in millions, except ratios) 2008 2007 2006
RevenueAsset management, administration
and commissions $6,004 $ 6,821 $5,295All other income 62 654 521
Noninterest revenue 6,066 7,475 5,816Net interest income 1,518 1,160 971
Total net revenue 7,584 8,635 6,787
Provision for credit losses 85 (18) (28)
Noninterest expenseCompensation expense 3,216 3,521 2,777Noncompensation expense 2,000 1,915 1,713Amortization of intangibles 82 79 88
Total noninterest expense 5,298 5,515 4,578
Income before income tax expense 2,201 3,138 2,237
Income tax expense 844 1,172 828
Net income $1,357 $ 1,966 $1,409
Revenue by client segmentPrivate Bank(a) $ 2,565 $2,362 $1,686Institutional 1,775 2,525 1,972Retail 1,620 2,408 1,885Private Wealth Management(a) 1,387 1,340 1,244Bear Stearns Brokerage 237 — —
Total net revenue $ 7,584 $ 8,635 $ 6,787
Financial ratiosROE 24% 51% 40%Overhead ratio 70 64 67Pretax margin ratio(b) 29 36 33
(a) In 2008, certain clients were transferred from Private Bank to Private WealthManagement. Prior periods have been revised to conform to this change.
(b) Pretax margin represents income before income tax expense divided by total netrevenue, which is a measure of pretax performance and another basis by whichmanagement evaluates its performance and that of its competitors.
2008 compared with 2007 Net income was $1.4 billion, a decline of $609 million, or 31%, fromthe prior year, driven by lower total net revenue offset partially bylower noninterest expense.
Total net revenue was $7.6 billion, a decrease of $1.1 billion, or12%, from the prior year. Noninterest revenue was $6.1 billion, adecline of $1.4 billion, or 19%, due to lower performance fees andthe effect of lower markets, including the impact of lower market val-uations of seed capital investments. The lower results were offsetpartially by the benefit of the Bear Stearns merger and increased rev-enue from net asset inflows. Net interest income was $1.5 billion, up$358 million, or 31%, from the prior year, due to higher deposit andloan balances and wider deposit spreads.
Private Bank revenue grew 9% to $2.6 billion, due to increaseddeposit and loan balances and net asset inflows, partially offset bythe effect of lower markets and lower performance fees. Institutionalrevenue declined 30% to $1.8 billion due to lower performance fees,partially offset by net liquidity inflows. Retail revenue declined 33%to $1.6 billion due to the effect of lower markets, including theimpact of lower market valuations of seed capital investments andnet equity outflows. Private Wealth Management revenue grew 4%to $1.4 billion due to higher deposit and loan balances. Bear StearnsBrokerage contributed $237 million to revenue.
The provision for credit losses was $85 million, compared with a ben-efit of $18 million in the prior year, reflecting an increase in loan bal-ances, higher net charge-offs and a weakening credit environment.
Noninterest expense was $5.3 billion, down $217 million, or 4%, com-pared with the prior year due to lower performance-based compensa-tion, largely offset by the effect of the Bear Stearns merger and highercompensation expense resulting from increased average headcount.
2007 compared with 2006 Net income was a record $2.0 billion, an increase of $557 million, or40%, from the prior year. Results benefited from record total net rev-enue, partially offset by higher noninterest expense.
Total net revenue was $8.6 billion, an increase of $1.8 billion, or27%, from the prior year. Noninterest revenue, primarily fees andcommissions, was $7.5 billion, up $1.7 billion, or 29%, largely dueto increased assets under management and higher performance andplacement fees. Net interest income was $1.2 billion, up $189 mil-lion, or 19%, from the prior year, largely due to higher deposit andloan balances.
Institutional revenue grew 28% to $2.5 billion, due to net assetinflows and performance fees. Private Bank revenue grew 40% to$2.4 billion, due to higher assets under management, performanceand placement fees, and increased loan and deposit balances. Retailrevenue grew 28%, to $2.4 billion, primarily due to market apprecia-tion and net asset inflows. Private Wealth Management revenuegrew 8% to $1.3 billion, reflecting higher assets under managementand higher deposit balances.
70 JPMorgan Chase & Co. / 2008 Annual Report
AM, with assets under supervision of $1.5 trillion, is aglobal leader in investment and wealth management.AM clients include institutions, retail investors and high-net-worth individuals in every major market throughoutthe world. AM offers global investment management inequities, fixed income, real estate, hedge funds, privateequity and liquidity, including money market instru-ments and bank deposits. AM also provides trust andestate, banking and brokerage services to high-net-worth clients, and retirement services for corporationsand individuals. The majority of AM’s client assets are inactively managed portfolios.
JPMorgan Chase & Co. / 2008 Annual Report 71
The provision for credit losses was a benefit of $18 million, com-pared with a benefit of $28 million in the prior year.
Noninterest expense was $5.5 billion, an increase of $937 million, or20%, from the prior year. The increase was due primarily to higherperformance-based compensation expense and investments in allbusiness segments.
Selected metrics Year ended December 31,(in millions, except headcount, ranking data, and where otherwise noted) 2008 2007 2006
Business metricsNumber of:
Client advisors 1,705 1,729 1,506Retirement planning services
participants 1,531,000 1,501,000 1,362,000Bear Stearns brokers 324 — —
% of customer assets in 4 & 5 Star Funds(a) 42% 55% 58%
% of AUM in 1st and 2nd quartiles:(b)
1 year 54% 57% 83%3 years 65% 75% 77%5 years 76% 76% 79%
Selected balance sheet data (period-end)
Equity $ 7,000 $ 4,000 $ 3,500
Selected balance sheet data (average)
Total assets $ 65,550 $ 51,882 $ 43,635Loans(c) 38,124 29,496 26,507Deposits 70,179 58,863 50,607Equity 5,645 3,876 3,500
Headcount 15,339 14,799 13,298
Credit data and quality statistics
Net charge-offs (recoveries) $ 11 $ (8) $ (19)Nonperforming loans 147 12 39Allowance for loan losses 191 112 121Allowance for lending-related
commitments 5 7 6
Net charge-off (recovery) rate 0.03% (0.03)% (0.07)%Allowance for loan losses to
average loans 0.50 0.38 0.46Allowance for loan losses to
nonperforming loans 130 933 310Nonperforming loans to average loans 0.39 0.04 0.15
(a) Derived from following rating services: Morningstar for the United States; Micropalfor the United Kingdom, Luxembourg, Hong Kong and Taiwan; and Nomura forJapan.
(b) Derived from following rating services: Lipper for the United States and Taiwan;Micropal for the United Kingdom, Luxembourg and Hong Kong; and Nomura forJapan.
(c) Reflects the transfer in 2007 of held-for-investment prime mortgage loans trans-ferred from AM to Corporate within the Corporate/Private Equity segment.
AM’s client segments comprise the following:
Institutional brings comprehensive global investment services –including asset management, pension analytics, asset-liabilitymanagement and active risk budgeting strategies – to corporateand public institutions, endowments, foundations, not-for-profitorganizations and governments worldwide.
Retail provides worldwide investment management services andretirement planning and administration through third-party anddirect distribution of a full range of investment vehicles.
The Private Bank addresses every facet of wealth managementfor ultra-high-net-worth individuals and families worldwide,including investment management, capital markets and risk man-agement, tax and estate planning, banking, capital raising andspecialty-wealth advisory services.
Private Wealth Management offers high-net-worth individu-als, families and business owners in the United States compre-hensive wealth management solutions, including investmentmanagement, capital markets and risk management, tax andestate planning, banking and specialty-wealth advisory services.
Bear Stearns Brokerage provides investment advice andwealth management services to high-net-worth individuals,money managers, and small corporations.
J.P. Morgan Asset Management has established twomeasures of its overall performance.
• Percentage of assets under management in funds rated 4 and5 stars (3 year). Mutual fund rating services rank funds basedon their risk-adjusted performance over various periods. A 5star rating is the best and represents the top 10% of industrywide ranked funds. A 4 star rating represents the next 22% ofindustry wide ranked funds. The worst rating is a 1 star rating.
• Percentage of assets under management in first- or second-quartile funds (one, three and five years). Mutual fund ratingservices rank funds according to a peer-based performancesystem, which measures returns according to specific timeand fund classification (small, mid, multi and large cap).
Management’s discussion and analysis
72 JPMorgan Chase & Co. / 2008 Annual Report
Assets under supervision2008 compared with 2007Assets under supervision (“AUS”) were $1.5 trillion, a decrease of$76 billion, or 5%, from the prior year. Assets under management(“AUM”) were $1.1 trillion, down $60 billion, or 5%, from the prioryear. The decrease was due to the effect of lower markets and non-liquidity outflows, predominantly offset by liquidity product inflowsacross all segments and the addition of Bear Stearns assets undermanagement. Custody, brokerage, administration and deposit bal-ances were $363 billion, down $16 billion due to the effect of lowermarkets on brokerage and custody balances, offset by the addition ofBear Stearns Brokerage. The Firm also has a 43% interest inAmerican Century Companies, Inc., whose AUM totaled $70 billionand $102 billion at December 31, 2008 and 2007, respectively,which are excluded from the AUM above.
2007 compared with 2006AUS were $1.6 trillion, an increase of $225 billion, or 17%, from theprior year. AUM were $1.2 trillion, up 18%, or $180 billion, from theprior year. The increase in AUM was the result of net asset inflowsinto liquidity and alternative products and market appreciation acrossall segments. Custody, brokerage, administration and deposit bal-ances were $379 billion, up $45 billion. The Firm also has a 44%interest in American Century Companies, Inc., whose AUM totaled$102 billion and $103 billion at December 31, 2007 and 2006,respectively, which are excluded from the AUM above.
Assets under supervision(a)
As of or for the year ended December 31, (in billions) 2008 2007 2006
Assets by asset classLiquidity $ 613 $ 400 $ 311Fixed income 180 200 175Equities & balanced 240 472 427Alternatives 100 121 100
Total assets under management 1,133 1,193 1,013
Custody/brokerage/administration/deposits 363 379 334
Total assets under supervision $ 1,496 $ 1,572 $1,347
Assets by client segment Institutional $ 681 $ 632 $ 538Private Bank(b) 181 183 142Retail 194 300 259Private Wealth Management(b) 71 78 74Bear Stearns Brokerage 6 — —
Total assets under management $ 1,133 $ 1,193 $1,013
Institutional $ 682 $ 633 $ 539Private Bank(b) 378 403 328Retail 262 394 343Private Wealth Management(b) 124 142 137Bear Stearns Brokerage 50 — —
Total assets under supervision $ 1,496 $ 1,572 $1,347
Assets by geographic regionAs of or for the year ended December 31, (in billions) 2008 2007 2006
U.S./Canada $ 798 $ 760 $ 630International 335 433 383
Total assets under management $ 1,133 $ 1,193 $1,013
U.S./Canada $ 1,084 $ 1,032 $ 889International 412 540 458
Total assets under supervision $ 1,496 $ 1,572 $1,347
Mutual fund assets by asset classLiquidity $ 553 $ 339 $ 255Fixed income 41 46 46Equities 99 224 206
Total mutual fund assets $ 693 $ 609 $ 507
Assets under management rollforward
Beginning balance, January 1 $ 1,193 $ 1,013 $ 847Net asset flows:
Liquidity 210 78 44Fixed income (12) 9 11Equities, balanced and alternative (47) 28 34
Market/performance/other impacts(c) (211) 65 77
Ending balance, December 31 $ 1,133 $ 1,193 $1,013
Assets under supervision rollforward
Beginning balance, January 1 $ 1,572 $ 1,347 $1,149Net asset flows 181 143 102Market/performance/other impacts(c) (257) 82 96
Ending balance, December 31 $ 1,496 $ 1,572 $1,347
(a) Excludes assets under management of American Century Companies, Inc., in whichthe Firm had a 43%, 44% and 43% ownership at December 31, 2008, 2007 and2006, respectively.
(b) In 2008, certain clients were transferred from Private Bank to Private WealthManagement. Prior periods have been revised to conform to this change.
(c) Includes $15 billion for assets under management and $68 billion for assets undersupervision from the Bear Stearns merger in the second quarter of 2008.
72 JPMorgan Chase & Co. / 2008 Annual ReportJPMorgan Chase & Co. / 2008 Annual Report72
JPMorgan Chase & Co. / 2008 Annual Report 73
CORPORATE/PR IVATE EQUITY
Selected income statement data Year ended December 31,(in millions) 2008 2007 2006
RevenuePrincipal transactions(a)(b) $ (3,588) $ 4,552 $ 1,181Securities gains (losses)(c) 1,637 39 (608)All other income(d) 1,673 465 485
Noninterest revenue (278) 5,056 1,058Net interest income (expense) 347 (637) (1,044)
Total net revenue 69 4,419 14
Provision for credit losses 447(j)(k) (11) (1)
Provision for credit losses – accounting conformity(e) 1,534 — —
Noninterest expenseCompensation expense 2,340 2,754 2,626Noncompensation expense(f) 1,841 3,025 2,357Merger costs 432 209 305
Subtotal 4,613 5,988 5,288
Net expense allocated to other businesses (4,641) (4,231) (4,141)
Total noninterest expense (28) 1,757 1,147
Income (loss) from continuing operations before income tax expense (benefit) (1,884) 2,673 (1,132)
Income tax expense (benefit)(g) (535) 788 (1,179)
Income (loss) from continuing operations (1,349) 1,885 47
Income from discontinued operations(h) — — 795
Income before extraordinary gain (1,349) 1,885 842Extraordinary gain(i) 1,906 — —
Net income $ 557 $ 1,885 $ 842
(a) Included losses on preferred equity interests in Fannie Mae and Freddie Mac in2008.
(b) The Firm adopted SFAS 157 in the first quarter of 2007. See Note 4 on pages141–155 of this Annual Report for additional information.
(c) Included gain on sale of MasterCard shares in 2008.(d) Included a gain from the dissolution of the Chase Paymentech Solutions joint ven-
ture and proceeds from the sale of Visa shares in its initial public offering in 2008.(e) Represents an accounting conformity loan loss reserve provision related to the
acquisition of Washington Mutual Bank’s banking operations. For a further discus-sion, see Consumer Credit Portfolio on page 104 of this Annual Report.
(f) Included a release of credit card litigation reserves in 2008 and insurance recoveriesrelated to settlement of the Enron and WorldCom class action litigations and forcertain other material legal proceedings of $512 million for full year 2006.
(g) Includes tax benefits recognized upon resolution of tax audits.(h) Included a $622 million gain from the sale of selected corporate trust businesses in
2006.(i) Effective September 25, 2008, JPMorgan Chase acquired Washington Mutual’s
banking operations from the FDIC for $1.9 billion. The fair value of the WashingtonMutual net assets acquired exceeded the purchase price, which resulted in negativegoodwill. In accordance with SFAS 141, nonfinancial assets that are not held-for-sale were written down against that negative goodwill. The negative goodwill thatremained after writing down nonfinancial assets was recognized as an extraordinarygain in 2008.
(j) In November 2008, the Firm transferred $5.8 billion of higher quality credit cardloans from the legacy Chase portfolio to a securitization trust previously establishedby Washington Mutual (“the Trust”). As a result of converting higher credit qualityChase-originated on-book receivables to the Trust's seller's interest which has ahigher overall loss rate reflective of the total assets within the Trust, approximately$400 million of incremental provision expense was recorded during the fourth quar-ter. This incremental provision expense was recorded in the Corporate segment asthe action related to the acquisition of Washington Mutual's banking operations. Forfurther discussion of credit card securitizations, see Note 16 on page 182 of thisAnnual Report.
(k) Includes $9 million for credit card securitizations related to the Washington Mutualtransaction.
2008 compared with 2007 Net income for Corporate/Private Equity was $557 million, comparedwith net income of $1.9 billion in the prior year. This segmentincludes the results of Private Equity and Corporate business seg-ments, as well as merger-related items.
Net loss for Private Equity was $690 million, compared with netincome of $2.2 billion in the prior year. Net revenue was negative$963 million, a decrease of $4.9 billion, reflecting Private Equitylosses of $894 million, compared with gains of $4.1 billion in theprior year. Noninterest expense was negative $120 million, adecrease of $469 million from the prior year, reflecting lower com-pensation expense.
Net income for Corporate was $1.5 billion, compared with a net lossof $150 million in the prior year. Net revenue was $1.0 billion, anincrease of $580 million. Excluding merger-related items, net revenuewas $1.7 billion, an increase of $1.2 billion. Net revenue included again of $1.5 billion on the proceeds from the sale of Visa shares in itsinitial public offering, $1.0 billion on the dissolution of the ChasePaymentech Solutions joint venture, and $668 million from the sale ofMasterCard shares, partially offset by losses of $1.1 billion on pre-ferred securities of Fannie Mae and Freddie Mac and $464 millionrelated to the offer to repurchase auction-rate securities. 2007 includ-ed a gain of $234 million on the sale of MasterCard shares.Noninterest expense was negative $736 million, compared with $959million in the prior year, driven mainly by lower litigation expense.
Merger-related items were a net loss of $2.1 billion compared with anet loss of $130 million in the prior year. Washington Mutual merger-related items included conforming loan loss reserve of $1.5 billion,credit card related loan loss reserves of $403 million and net merger-related costs of $138 million. Bear Stearns merger-related included anet loss of $423 million, which represented JPMorgan Chase’s49.4% ownership in Bear Stearns losses from April 8 to May 30,2008, and net merger-related costs of $665 million. 2007 includedmerger costs of $209 million related to the Bank One and Bank ofNew York transactions.
The Corporate/Private Equity sector comprises PrivateEquity, Treasury, corporate staff units and expense thatis centrally managed. Treasury manages capital, liquidity,interest rate and foreign exchange risk and the invest-ment portfolio for the Firm. The corporate staff unitsinclude Central Technology and Operations, InternalAudit, Executive Office, Finance, Human Resources,Marketing & Communications, Legal & Compliance,Corporate Real Estate and General Services, RiskManagement, Corporate Responsibility and Strategy &Development. Other centrally managed expense includesthe Firm’s occupancy and pension-related expense, netof allocations to the business.
Management’s discussion and analysis
74 JPMorgan Chase & Co. / 2008 Annual Report
2007 compared with 2006Net income was $1.9 billion, compared with $842 million in the prioryear, benefiting from strong Private Equity gains, partially offset byhigher expense. Prior-year results also included Income from discon-tinued operations of $795 million, which included a one-time gain of$622 million from the sale of selected corporate trust businesses.
Net income for Private Equity was $2.2 billion, compared with $627million in the prior year. Total net revenue was $4.0 billion, anincrease of $2.8 billion. The increase was driven by Private Equitygains of $4.1 billion, compared with $1.3 billion, reflecting a higherlevel of gains and the change in classification of carried interest tocompensation expense. Total noninterest expense was $589 million,an increase of $422 million from the prior year. The increase wasdriven by higher compensation expense, reflecting the change in theclassification of carried interest.
Net loss for Corporate was $150 million, compared with a net loss of$391 million in the prior year. Corporate total net revenue was $452million, an increase of $1.6 billion. Revenue benefited from net securitygains compared with net security losses in the prior year and improvednet interest spread. Total noninterest expense was $959 million, anincrease of $284 million from the prior year. The increase reflected high-er net litigation expense, driven by credit card-related litigation and theabsence of prior-year insurance recoveries related to certain material liti-gation, partially offset by lower compensation expense.
Net loss for merger costs related to the Bank One and the Bank ofNew York transactions were $130 million, compared with a loss of$189 million in the prior year. Merger costs were $209 million, com-pared with $305 million in the prior year.
Selected metrics Year ended December 31,(in millions, except headcount) 2008 2007 2006
Total net revenuePrivate equity(a) $ (963) $ 3,967 $ 1,142Corporate 1,032 452 (1,128)
Total net revenue $ 69 $ 4,419 $ 14
Net income (loss)Private equity(a) $ (690) $ 2,165 $ 627Corporate(b)(c) 1,458 (150) (391)Merger-related items(d) (2,117) (130) (189)
Income (loss) from continuing operations (1,349) 1,885 47
Income from discontinued operations (after-tax)(e) — — 795
Income before extraordinary gain (1,349) 1,885 842Extraordinary gain 1,906 — —
Total net income $ 557 $ 1,885 $ 842
Headcount 23,376 22,512 23,242
(a) The Firm adopted SFAS 157 in the first quarter of 2007. See Note 4 on pages141–155 of this Annual Report for additional information.
(b) Included a release of credit card litigation reserves in 2008 and insurance recoveriesrelated to settlement of the Enron and WorldCom class action litigations and for cer-tain other material legal proceedings of $512 million for full year 2006.
(c) Includes tax benefits recognized upon resolution of tax audits.(d) Includes an accounting conformity loan loss reserve provision related to the
Washington Mutual transaction in 2008. 2008 also reflects items related to the BearStearns merger, which included Bear Stearns’ losses, merger costs, Bear Stearns assetmanagement liquidation costs and Bear Stearns private client services broker reten-tion expense. Prior periods represent costs related to the Bank One transaction in2004 and the Bank of New York transaction in 2006.
(e) Included a $622 million gain from the sale of selected corporate trust business in2006.
JPMorgan Chase & Co. / 2008 Annual Report 75
Private equity portfolio2008 compared with 2007 The carrying value of the private equity portfolio at December 31,2008, was $6.9 billion, down from $7.2 billion at December 31,2007. The portfolio decrease was primarily driven by unfavorable valu-ation adjustments on existing investments, partially offset by newinvestments, and the addition of the Bear Stearns portfolios. The port-folio represented 5.8% of the Firm’s stockholders’ equity less good-will at December 31, 2008, down from 9.2% at December 31, 2007.
2007 compared with 2006The carrying value of the private equity portfolio at December 31,2007, was $7.2 billion, up from $6.1 billion at December 31, 2006.The portfolio increase was due primarily to favorable valuationadjustments on nonpublic investments and new investments, partiallyoffset by sales activity. The portfolio represented 9.2% of the Firm’sstockholders’ equity less goodwill at December 31, 2007, up from8.6% at December 31, 2006.
Selected income statement and balance sheet data Year ended December 31,(in millions) 2008 2007 2006
CorporateSecurities gains (losses)(a) $ 1,652 $ 37 $ (619)Investment securities portfolio
(average)(b) 106,801 85,517 63,361Investment securities portfolio
(ending)(b) 166,662 76,200 82,091Mortgage loans (average)(c) 7,059 5,639 —Mortgage loans (ending)(c) 7,292 6,635 —
Private equity Realized gains $ 1,717 $ 2,312 $ 1,223Unrealized gains (losses)(d)(e) (2,480) 1,607 (1)
Total direct investments (763) 3,919 1,222Third-party fund investments (131) 165 77
Total private equity gains (losses)(f) $ (894) $ 4,084 $ 1,299
Private equity portfolio information(g)
Direct investmentsPublicly held securitiesCarrying value $ 483 $ 390 $ 587Cost 792 288 451Quoted public value 543 536 831
Privately held direct securitiesCarrying value 5,564 5,914 4,692Cost 6,296 4,867 5,795Third-party fund investments(h)
Carrying value 805 849 802Cost 1,169 1,076 1,080
Total private equity portfolio – Carrying value $ 6,852 $ 7,153 $ 6,081
Total private equity portfolio – Cost $ 8,257 $ 6,231 $ 7,326
(a) Results for 2008 included a gain on the sale of MasterCard shares. All periodsreflect repositioning of the Corporate investment securities portfolio and excludegains/losses on securities used to manage risk associated with MSRs.
(b) Includes Chief Investment Office investment securities only.(c) Held-for-investment prime mortgage loans were transferred from AM to the
Corporate/Private Equity segment for risk management and reporting purposes. Theinitial transfer in 2007 had no material impact on the financial results ofCorporate/Private Equity.
(d) Unrealized gains (losses) contain reversals of unrealized gains and losses that wererecognized in prior periods and have now been realized.
(e) The Firm adopted SFAS 157 in the first quarter of 2007. For additional information,see Note 4 on pages 141–155 of this Annual Report.
(f) Included in principal transactions revenue in the Consolidated Statements ofIncome.
(g) For more information on the Firm’s policies regarding the valuation of the privateequity portfolio, see Note 4 on pages 141–155 of this Annual Report.
(h) Unfunded commitments to third-party equity funds were $1.4 billion, $881 millionand $589 million at December 31, 2008, 2007 and 2006, respectively.
Management’s discussion and analysis
76 JPMorgan Chase & Co. / 2008 Annual Report
BALANCE SHEET ANALYS IS
Selected balance sheet dataDecember 31, (in millions) 2008 2007
AssetsCash and due from banks $ 26,895 $ 40,144Deposits with banks 138,139 11,466Federal funds sold and securities purchased
under resale agreements 203,115 170,897Securities borrowed 124,000 84,184Trading assets:
Debt and equity instruments 347,357 414,273Derivative receivables 162,626 77,136
Securities 205,943 85,450Loans 744,898 519,374Allowance for loan losses (23,164) (9,234)
Loans, net of allowance for loan losses 721,734 510,140Accrued interest and accounts receivable 60,987 24,823Goodwill 48,027 45,270Other intangible assets 14,984 14,731Other assets 121,245 83,633
Total assets $ 2,175,052 $1,562,147
LiabilitiesDeposits $ 1,009,277 $ 740,728Federal funds purchased and securities loaned
or sold under repurchase agreements 192,546 154,398Commercial paper and other borrowed funds 170,245 78,431Trading liabilities:
Debt and equity instruments 45,274 89,162Derivative payables 121,604 68,705
Accounts payable and other liabilities 187,978 94,476Beneficial interests issued by consolidated VIEs 10,561 14,016Long-term debt and trust preferred capital
debt securities 270,683 199,010
Total liabilities 2,008,168 1,438,926Stockholders’ equity 166,884 123,221
Total liabilities and stockholders’ equity $ 2,175,052 $1,562,147
Consolidated Balance Sheets overviewThe following is a discussion of the significant changes in theConsolidated Balance Sheets from December 31, 2007.
Deposits with banks; federal funds sold and securities pur-chased under resale agreements; securities borrowed; fed-eral funds purchased and securities loaned or sold underrepurchase agreementsThe Firm utilizes deposits with banks, federal funds sold and securi-ties purchased under resale agreements, securities borrowed, andfederal funds purchased and securities loaned or sold under repur-chase agreements as part of its liquidity management activities tomanage the Firm’s cash positions and risk-based capital require-ments and to support the Firm’s trading and risk management activi-ties. In particular, the Firm uses securities purchased under resaleagreements and securities borrowed to provide funding or liquidityto clients by purchasing and borrowing clients’ securities for theshort-term. Federal funds purchased and securities loaned or sold
under repurchase agreements are used as short-term funding sourcesfor the Firm and to make securities available to clients for their short-term purposes. The increase from December 31, 2007, in depositswith banks reflected a higher level of interbank lending; a reclassifi-cation of deposits with the Federal Reserve Bank from cash and duefrom banks to deposits with banks reflecting a policy change of theFederal Reserve Bank to pay interest to depository institutions onreserve balances, and assets acquired as a result of the Bear Stearnsmerger. The increase in securities borrowed and securities purchasedunder resale agreements was related to assets acquired as a result ofthe Bear Stearns merger and growth in demand from clients for liq-uidity. The increase in securities sold under repurchase agreementsreflected higher short-term funding requirements to fulfill clients’demand for liquidity and finance the Firm’s AFS securities inventory,and the effect of the liabilities assumed in connection with the BearStearns merger. For additional information on the Firm’s LiquidityRisk Management, see pages 88–92 of this Annual Report.
Trading assets and liabilities – debt and equity instrumentsThe Firm uses debt and equity trading instruments for both market-making and proprietary risk-taking activities. These instruments con-sist predominantly of fixed income securities, including governmentand corporate debt; equity, including convertible securities; loans,including certain prime mortgage and other loans warehoused byRFS and IB for sale or securitization purposes and accounted for atfair value under SFAS 159; and physical commodities inventories. Thedecreases in trading assets and liabilities – debt and equity instru-ments from December 31, 2007, reflected the effect of the challeng-ing capital markets environment, particularly for debt securities, par-tially offset by positions acquired as a result of the Bear Stearnsmerger. For additional information, refer to Note 4 and Note 6 onpages 141–155 and 158–160, respectively, of this Annual Report.
Trading assets and liabilities – derivative receivables andpayablesDerivative instruments enable end-users to increase, reduce or alterexposure to credit or market risks. The value of a derivative is derivedfrom its reference to an underlying variable or combination of variablessuch as interest rate, credit, foreign exchange, equity or commodityprices or indices. JPMorgan Chase makes markets in derivatives forcustomers, is an end-user of derivatives for its principal risk-takingactivities, and is also an end-user of derivatives to hedge or managerisks of market and credit exposures, modify the interest rate character-istics of related balance sheet instruments or meet longer-term invest-ment objectives. The majority of the Firm’s derivatives are entered intofor market-making purposes. The increase in derivative receivables andpayables from December 31, 2007, was primarily related to the declinein interest rates, widening credit spreads and volatile foreign exchangerates reflected in interest rate, credit and foreign exchange derivatives,respectively. The increase also included positions acquired in the BearStearns merger. For additional information, refer to derivative contracts,Note 4, Note 6 and Note 32 on pages 141–155, 158–160, and214–217, respectively, of this Annual Report.

JPMorgan Chase & Co. / 2008 Annual Report 77
SecuritiesAlmost all of the Firm’s securities portfolio is classified as AFS and isused predominantly to manage the Firm’s exposure to interest ratemovements, as well as to make strategic longer-term investments.The AFS portfolio increased from December 31, 2007, predominantlyas a result of purchases, partially offset by sales and maturities. Foradditional information related to securities, refer to the Corporate/PrivateEquity segment discussion, Note 4 and Note 12 on pages 73–75,141–155 and 170–174, respectively, of this Annual Report.
Loans and allowance for loan lossesThe Firm provides loans to a variety of customers, from large corpo-rate and institutional clients to individual consumers. Loans increasedfrom December 31, 2007, largely due to loans acquired in theWashington Mutual transaction, organic growth in lending in thewholesale businesses, particularly CB, and growth in the consumerprime mortgage portfolio driven by the decision to retain, rather thansell, new originations of nonconforming mortgage loans.
Both the consumer and wholesale components of the allowance forloan losses increased from the prior year reflecting the addition ofnoncredit-impaired loans acquired in the Washington Mutual transac-tion, including an increase to conform the allowance applicable toassets acquired from Washington Mutual to the Firm’s loan lossmethodologies. Excluding the Washington Mutual transaction the con-sumer allowance rose due to an increase in estimated losses for homeequity, subprime mortgage, prime mortgage and credit card loans dueto the effects of continued housing price declines, rising unemploy-ment and a weakening economic environment. Excluding theWashington Mutual transaction, the increase in the wholesaleallowance was due to the impact of the transfer of $4.9 billion offunded and unfunded leveraged lending loans in IB to the retainedloan portfolio from the held-for-sale loan portfolio, the effect of aweakening credit environment and loan growth. For a more detaileddiscussion of the loan portfolio and the allowance for loan losses,refer to Credit Risk Management on pages 92–111, and Notes 4, 5,14 and 15 on pages 141–155, 156–158, 175–178 and 178–180,respectively, of this Annual Report.
Accrued interest and accounts receivable; accounts payableand other liabilitiesThe Firm’s accrued interest and accounts receivable consist of accruedinterest receivable from interest-earning assets; receivables from cus-tomers (primarily from activities related to IB’s Prime Services busi-ness); receivables from brokers, dealers and clearing organizations;and receivables from failed securities sales. The Firm’s accountspayable and other liabilities consist of accounts payable to customers(primarily from activities related to IB’s Prime Services business),payables to brokers, dealers and clearing organizations; payables fromfailed securities purchases; accrued expense, including for interest-bearing liabilities; and all other liabilities, including obligations toreturn securities received as collateral. The increase in accrued interestand accounts receivable from December 31, 2007, was due largely tothe Bear Stearns merger, reflecting higher customer receivables in IB’sPrime Services business and the Washington Mutual transaction. The
increase in accounts payable and other liabilities was predominantlydue to the Bear Stearns merger, reflecting higher customer payables(primarily related to IB’s Prime Services business), as well as higherobligations to return securities received as collateral. For additionalinformation, see Note 22 on page 202 of this Annual Report.
GoodwillGoodwill arises from business combinations and represents theexcess of the cost of an acquired entity over the net fair valueamounts assigned to assets acquired and liabilities assumed. Theincrease in goodwill was due predominantly to the dissolution ofChase Paymentech Solutions joint venture, the merger with BearStearns, the purchase of an additional equity interest in Highbridgeand tax-related purchase accounting adjustments associated with theBank One merger, which increased goodwill attributed to IB. Theseitems were offset partially by a decrease in goodwill attributed to TSSpredominantly resulting from the sale of a previously consolidatedsubsidiary. For additional information, see Note 18 on pages198–201 of this Annual Report.
Other intangible assetsThe Firm’s other intangible assets consist of MSRs, purchased creditcard relationships, other credit card-related intangibles, core depositintangibles, and other intangibles. MSRs increased due to theWashington Mutual transaction and the Bear Stearns merger; salesin RFS of originated loans; and purchases of MSRs. These increases inMSRs were partially offset by markdowns of the fair value of theMSR asset due to changes to inputs and assumptions in the MSRvaluation model, including updates to prepayment assumptions toreflect current expectations, and to servicing portfolio run-offs. Thedecrease in other intangible assets reflects amortization expenseassociated with credit card-related and core deposit intangibles, par-tially offset by increases due to the dissolution of the ChasePaymentech Solutions joint venture, the purchase of an additionalequity interest in Highbridge, and the acquisition of an institutionalglobal custody portfolio. For additional information on MSRs andother intangible assets, see Note 18 on pages 198–201 of thisAnnual Report.
Other assetsThe Firm’s other assets consist of private equity and other invest-ments, collateral received, corporate and bank-owned life insurancepolicies, premises and equipment, assets acquired in loan satisfaction(including real estate owned), and all other assets. The increase inother assets from December 31, 2007, was due to the Bear Stearnsmerger, which partly resulted in a higher volume of collateral receivedfrom customers, the Washington Mutual transaction, and the pur-chase of asset-backed commercial paper from money market mutualfunds in connection with the Federal Reserve’s Asset-BackedCommercial Paper Money Market Mutual Fund Liquidity Facility(“AML Facility”), which was established by the Federal Reserve onSeptember 19, 2008, as a temporary lending facility to provide liquidityto eligible U.S. money market mutual funds. For additional informationregarding the AML Facility, see Executive Overview and Note 21 onpages 41–44 and 202 respectively, of this Annual Report.
Management’s discussion and analysis
78 JPMorgan Chase & Co. / 2008 Annual Report
DepositsThe Firm’s deposits represent a liability to customers, both retail andwholesale, related to non-brokerage funds held on their behalf.Deposits are generally classified by location (U.S. and non-U.S.),whether they are interest or noninterest-bearing, and by type (i.e.,demand, money market deposit, savings, time or negotiable order ofwithdrawal accounts). Deposits help provide a stable and consistentsource of funding for the Firm. Deposits were at a higher level com-pared with the level at December 31, 2007, predominantly from thedeposits assumed in the Washington Mutual transaction, net increas-es in wholesale interest- and noninterest-bearing deposits in TSS, AMand CB. The increase in TSS was driven by both new and existingclients, and due to the deposit inflows related to the heightenedvolatility and credit concerns affecting the markets. For more infor-mation on deposits, refer to the TSS and RFS segment discussions onpages 68–69 and 57–62, respectively, and the Liquidity RiskManagement discussion on pages 88–92 of this Annual Report. Formore information on wholesale liability balances, including deposits,refer to the CB and TSS segment discussions on pages 66–67 and68–69 of this Annual Report.
Commercial paper and other borrowed fundsThe Firm utilizes commercial paper and other borrowed funds as partof its liquidity management activities to meet short-term fundingneeds, and in connection with a TSS liquidity management productwhereby excess client funds, are transferred into commercial paperovernight sweep accounts. The increase in other borrowed funds waspredominantly due to advances from Federal Home Loan Banks of$70.2 billion (net of maturities of $10.4 billion) that were assumedas part of the Washington Mutual transaction and nonrecourseadvances from the Federal Reserve Bank of Boston (“FRBB”) to fundpurchases of asset-backed commercial paper from money marketmutual funds, and other borrowings from the Federal Reserve underthe Term Auction Facility program. For additional information on theFirm’s Liquidity Risk Management and other borrowed funds, seepages 88–92 and Note 21 on page 202 of this Annual Report.
Long-term debt and trust preferred capital debt securitiesThe Firm utilizes long-term debt and trust preferred capital debtsecurities to provide cost-effective and diversified sources of fundsand as critical components of the Firm’s liquidity and capital man-agement. Long-term debt and trust preferred capital debt securitiesincreased from December 31, 2007, predominantly due to debtassumed in both the Bear Stearns merger and the WashingtonMutual transaction, and debt issuances of $20.8 billion, which areguaranteed by the FDIC under its TLG Program. These increases werepartially offset by net maturities and redemptions, including IB struc-tured notes, the issuances of which are generally client-driven. Foradditional information on the Firm’s long-term debt activities, see theLiquidity Risk Management discussion on pages 88–92 and Note 23on pages 203–204 of this Annual Report.
Stockholders’ equityThe increase in total stockholders’ equity from December 31, 2007,was predominantly due to the issuance of preferred and common equity securities during 2008. In the fourth quarter of 2008, JPMorganChase participated in the Capital Purchase Program and issued pre-ferred stock and a warrant to purchase common stock to the U.S.Treasury, resulting in a $25.0 billion increase to stockholders’ equity.Additional preferred stock issuances and a common stock issuanceduring 2008 increased equity by $19.3 billion. Equity from issuances ofstock awards under the Firm’s employee stock-based compensationplans, the Bear Stearns merger, and net income for 2008 was morethan offset by the declaration of cash dividends and net losses recordedwithin accumulated other comprehensive income related to AFS securi-ties and defined benefit pension and other postretirement employeebenefit plans. For a further discussion, see the Capital Managementsection that follows, and Note 24 and Note 27 on pages 205–206 and 208, respectively, of this Annual Report.

JPMorgan Chase & Co. / 2008 Annual Report 79
in the SPE in order to provide liquidity. These commitments areincluded in other unfunded commitments to extend credit and assetpurchase agreements, as shown in the Off-balance sheet lending-related financial instruments and guarantees table on page 81 ofthis Annual Report.
As noted above, the Firm is involved with three types of SPEs. A sum-mary of each type of SPE follows.
Multi-seller conduitsThe Firm helps customers meet their financing needs by providingaccess to the commercial paper markets through variable interestentities (“VIEs”) known as multi-seller conduits. Multi-seller conduitentities are separate bankruptcy-remote entities that purchase inter-ests in, and make loans secured by, pools of receivables and otherfinancial assets pursuant to agreements with customers of the Firm.The conduits fund their purchases and loans through the issuance ofhighly rated commercial paper to third-party investors. The primarysource of repayment of the commercial paper is the cash flow fromthe pools of assets. JPMorgan Chase receives fees related to thestructuring of multi-seller conduit transactions and receives compen-sation from the multi-seller conduits for its role as administrativeagent, liquidity provider, and provider of program-wide creditenhancement.
Investor intermediationAs a financial intermediary, the Firm creates certain types of VIEs andalso structures transactions, typically derivative structures, with theseVIEs to meet investor needs. The Firm may also provide liquidity andother support. The risks inherent in derivative instruments or liquiditycommitments are managed similarly to other credit, market and liquidi-ty risks to which the Firm is exposed. The principal types of VIEs theFirm uses in these structuring activities are municipal bond vehicles,credit-linked note vehicles and collateralized debt obligation vehicles.
Loan securitizationsJPMorgan Chase securitizes and sells a variety of loans, includingresidential mortgages, credit cards, automobile, student, and com-mercial loans (primarily related to real estate). JPMorgan Chase-sponsored securitizations utilize SPEs as part of the securitizationprocess. These SPEs are structured to meet the definition of a QSPE(as discussed in Note 1 on page 134 of this Annual Report); accord-ingly, the assets and liabilities of securitization-related QSPEs are notreflected on the Firm’s Consolidated Balance Sheets (except forretained interests, as described below). The primary purpose of thesevehicles is to meet investor needs and generate liquidity for the Firmthrough the sale of loans to the QSPEs. These QSPEs are financedthrough the issuance of fixed or floating-rate asset-backed securitiesthat are sold to third-party investors or held by the Firm.
Consolidation and consolidation sensitivity analysis on capitalFor more information regarding these programs and the Firm’s otherSPEs, as well as the Firm’s consolidation analysis for these programs,see Note 16 and Note 17 on pages 180–188 and 189–198, respec-tively, of this Annual Report.
JPMorgan Chase is involved with several types of off-balance sheetarrangements, including special purpose entities (“SPEs”) and lend-ing-related financial instruments (e.g., commitments and guarantees).
Special-purpose entitiesThe basic SPE structure involves a company selling assets to the SPE.The SPE funds the purchase of those assets by issuing securities toinvestors in the form of commercial paper, short-term asset-backednotes, medium-term notes and other forms of interest. SPEs are gen-erally structured to insulate investors from claims on the SPE’s assetsby creditors of other entities, including the creditors of the seller ofthe assets.
SPEs are an important part of the financial markets, providing marketliquidity by facilitating investors’ access to specific portfolios ofassets and risks. These arrangements are integral to the markets formortgage-backed securities, commercial paper and other asset-backed securities.
JPMorgan Chase uses SPEs as a source of liquidity for itself and itsclients by securitizing financial assets, and by creating investmentproducts for clients. The Firm is involved with SPEs through multi-seller conduits and investor intermediation activities, and as a resultof its loan securitizations, through qualifying special purpose entities(“QSPEs”). This discussion focuses mostly on multi-seller conduitsand investor intermediation. For a detailed discussion of all SPEs withwhich the Firm is involved, and the related accounting, see Note 1,Note 16 and Note 17 on pages 134–145, 180–188 and 189–198,respectively of this Annual Report.
The Firm holds capital, as deemed appropriate, against all SPE-relat-ed transactions and related exposures, such as derivative transactionsand lending-related commitments and guarantees.
The Firm has no commitments to issue its own stock to support anySPE transaction, and its policies require that transactions with SPEsbe conducted at arm’s length and reflect market pricing. Consistentwith this policy, no JPMorgan Chase employee is permitted to investin SPEs with which the Firm is involved where such investmentwould violate the Firm’s Code of Conduct. These rules prohibitemployees from self-dealing and acting on behalf of the Firm intransactions with which they or their family have any significantfinancial interest.
Implications of a credit rating downgrade to JPMorgan Chase Bank, N.A.For certain liquidity commitments to SPEs, the Firm could be requiredto provide funding if the short-term credit rating of JPMorgan ChaseBank, N.A., was downgraded below specific levels, primarily “P-1”,“A-1” and “F1” for Moody’s, Standard & Poor’s and Fitch, respec-tively. The amount of these liquidity commitments was $61.0 billionand $94.0 billion at December 31, 2008 and 2007, respectively.Alternatively, if JPMorgan Chase Bank, N.A., were downgraded, theFirm could be replaced by another liquidity provider in lieu of provid-ing funding under the liquidity commitment, or in certain circum-stances, the Firm could facilitate the sale or refinancing of the assets
OFF-BALANCE SHEET ARRANGEMENTS AND CONTRACTUAL CASH OBL IGAT IONS
Management’s discussion and analysis
80 JPMorgan Chase & Co. / 2008 Annual Report
Special-purpose entities revenueThe following table summarizes certain revenue information relatedto consolidated and nonconsolidated VIEs and QSPEs with which theFirm has significant involvement. The revenue reported in the tablebelow primarily represents contractual servicing and credit feeincome (i.e., for income from acting as administrator, structurer, liq-uidity provider). It does not include mark-to-market gains and lossesfrom changes in the fair value of trading positions (such as derivativetransactions) entered into with VIEs. Those gains and losses arerecorded in principal transactions revenue.
Revenue from VIEs and QSPEsYear ended December 31,(in millions) 2008 2007 2006
VIEs:(a)
Multi-seller conduits $ 314 $ 187(b) $ 160Investor intermediation 18 33 49
Total VIEs 332 220 209QSPEs(c) 1,746 1,420 1,131
Total $ 2,078 $ 1,640 $ 1,340
(a) Includes revenue associated with consolidated VIEs and significant nonconsolidatedVIEs.
(b) Excludes the markdown on subprime CDO assets that was recorded in principaltransactions revenue in 2007.
(c) Excludes servicing revenue from loans sold to and securitized by third parties. Priorperiod amounts have been revised to conform to the current period presentation.
American Securitization Forum subprime adjustable ratemortgage loans modificationsIn December 2007, the American Securitization Forum (“ASF”) issuedthe “Streamlined Foreclosure and Loss Avoidance Framework forSecuritized Subprime Adjustable Rate Mortgage Loans” (“theFramework”). The Framework provides guidance for servicers tostreamline evaluation procedures of borrowers with certain subprimeadjustable rate mortgage (“ARM”) loans to more efficiently providemodification of such loans with terms that are more appropriate forthe individual needs of such borrowers. The Framework applies to allfirst-lien subprime ARM loans that have a fixed rate of interest for aninitial period of 36 months or less; are included in securitized pools;were originated between January 1, 2005, and July 31, 2007; andhave an initial interest rate reset date between January 1, 2008, andJuly 31, 2010. The Framework categorizes the population of ASFFramework Loans into three segments. Segment 1 includes loanswhere the borrower is current and likely to be able to refinance intoany available mortgage product. Segment 2 includes loans where theborrower is current, unlikely to be able to refinance into any readilyavailable mortgage industry product and meets certain defined crite-ria. Segment 3 includes loans where the borrower is not current, asdefined, and does not meet the criteria for Segments 1 or 2.JPMorgan Chase adopted the Framework during the first quarter of2008. For those AFS Framework Loans serviced by the Firm andowned by Firm-sponsored QSPEs, the Firm modified principal amountsof $1.7 billion of Segment 2 subprime mortgages during the yearended December 31, 2008. The following table presents selectedinformation relating to the principal amount of Segment 3 loans forthe year ended December 31, 2008, including those that have beenmodified, subjected to other loss mitigation activities or have beenprepaid by the borrower.
Year ended December 31, 2008 (in millions)
Loan modifications $ 2,384Other loss mitigation activities 865Prepayments 219
For additional discussion of the Framework, see Note 16 on page188 of this Annual Report.
Off-balance sheet lending-related financialinstruments and guaranteesJPMorgan Chase utilizes lending-related financial instruments (e.g.,commitments and guarantees) to meet the financing needs of itscustomers. The contractual amount of these financial instrumentsrepresents the maximum possible credit risk should the counterpartydraw upon the commitment or the Firm be required to fulfill its obli-gation under the guarantee, and the counterparty subsequently failto perform according to the terms of the contract. These commit-ments and guarantees historically expire without being drawn andeven higher proportions expire without a default. As a result, thetotal contractual amount of these instruments is not, in the Firm’sview, representative of its actual future credit exposure or fundingrequirements. Further, certain commitments, primarily related to con-sumer financings, are cancelable, upon notice, at the option of theFirm. For further discussion of lending-related commitments andguarantees and the Firm’s accounting for them, see lending-relatedcommitments in Credit Risk Management on page 102 and Note 33on pages 218–222 of this Annual Report.
Contractual cash obligationsIn the normal course of business, the Firm enters into various con-tractual obligations that may require future cash payments.Commitments for future cash expenditures primarily include contractsto purchase future services and capital expenditures related to realestate–related obligations and equipment.
The accompanying table summarizes, by remaining maturity,JPMorgan Chase’s off-balance sheet lending-related financial instru-ments and significant contractual cash obligations at December 31,2008. Contractual purchases and capital expenditures in the tablebelow reflect the minimum contractual obligation under legallyenforceable contracts with terms that are both fixed and deter-minable. Excluded from the following table are a number of obliga-tions to be settled in cash, primarily in under one year. These obliga-tions are reflected on the Firm’s Consolidated Balance Sheets andinclude federal funds purchased and securities loaned or sold underrepurchase agreements; commercial paper; other borrowed funds;purchases of debt and equity instruments; derivative payables; andcertain purchases of instruments that resulted in settlement failures.Also excluded are contingent payments associated with certainacquisitions that could not be estimated. For discussion regardinglong-term debt and trust preferred capital debt securities, see Note23 on pages 203–204 of this Annual Report. For discussion regard-ing operating leases, see Note 31 on page 213 of this AnnualReport.
JPMorgan Chase & Co. / 2008 Annual Report 81
The following table presents maturity information for off-balance sheet lending-related financial instruments, guarantees and commitments.
Off-balance sheet lending-related financial instruments and guarantees
By remaining maturity at December 31, 2008 2007(in millions) 2009 2010-2011 2012-2013 After 2013 Total Total
Lending-relatedConsumer(a) $ 642,978 $ 4,098 $ 9,916 $ 84,515 $ 741,507 $ 815,936Wholesale:
Other unfunded commitments to extend credit(b)(c)(d)(e) 93,307 69,479 53,567 9,510 225,863 250,954Asset purchase agreements(f) 16,467 25,574 9,983 1,705 53,729 90,105Standby letters of credit and guarantees(c)(g)(h) 25,998 35,288 30,650 3,416 95,352 100,222Other letters of credit(c) 3,889 718 240 80 4,927 5,371
Total wholesale 139,661 131,059 94,440 14,711 379,871 446,652
Total lending-related $ 782,639 $135,157 $ 104,356 $ 99,226 $ 1,121,378 $1,262,588
Other guaranteesSecurities lending guarantees(i) $ 169,281 $ — $ — $ — $ 169,281 $ 385,758Residual value guarantees — 670 — — 670 NADerivatives qualifying as guarantees(j) 9,537 28,970 15,452 29,876 83,835 85,262
Contractual cash obligationsBy remaining maturity at December 31,(in millions)
Time deposits $ 278,520 $ 11,414 $ 8,139 $ 1,028 $ 299,101 $ 249,877Advances from the Federal Home Loan Banks 47,406 21,089 738 954 70,187 450Long-term debt 36,026 78,199 51,275 86,594 252,094 183,862Trust preferred capital debt securities — — — 18,589 18,589 15,148FIN 46R long-term beneficial interests(k) 67 199 1,289 3,450 5,005 7,209Operating leases(l) 1,676 3,215 2,843 9,134 16,868 10,908Contractual purchases and capital expenditures 1,356 878 219 234 2,687 2,434Obligations under affinity and co-brand programs 1,174 2,086 1,999 2,879 8,138 5,477Other liabilities(m) 666 809 865 2,665 5,005 5,656
Total $ 366,891 $117,889 $ 67,367 $125,527 $ 677,674 $ 481,021
(a) Includes credit card and home equity lending-related commitments of $623.7 billion and $95.7 billion, respectively, at December 31, 2008; and $714.8 billion and $74.2 billion,respectively, at December 31, 2007. These amounts for credit card and home equity lending-related commitments represent the total available credit for these products. The Firm hasnot experienced, and does not anticipate, that all available lines of credit for these products will be utilized at the same time. The Firm can reduce or cancel these lines of credit byproviding the borrower prior notice or, in some cases, without notice as permitted by law.
(b) Includes unused advised lines of credit totaling $36.3 billion and $38.4 billion at December 31, 2008 and 2007, respectively, which are not legally binding. In regulatory filings withthe Federal Reserve, unused advised lines are not reportable. See the Glossary of terms, on page 230 of this Annual Report, for the Firm’s definition of advised lines of credit.
(c) Represents contractual amount net of risk participations totaling $28.3 billion at both December 31, 2008 and 2007.(d) Excludes unfunded commitments to third-party private equity funds of $1.4 billion and $881 million at December 31, 2008 and 2007, respectively. Also excluded unfunded commit-
ments for other equity investments of $1.0 billion and $903 million at December 31, 2008 and 2007, respectively.(e) Includes commitments to investment and noninvestment grade counterparties in connection with leveraged acquisitions of $3.6 billion and $8.2 billion at December 31, 2008 and
2007, respectively.(f) Largely represents asset purchase agreements to the Firm’s administered multi-seller, asset-backed commercial paper conduits. The maturity is based upon the weighted-average life of
the underlying assets in the SPE, which are based upon the remainder of each conduit transaction’s committed liquidity plus either the expected weighted average life of the assetsshould the committed liquidity expire without renewal, or the expected time to sell the underlying assets in the securitization market. It also includes $96 million and $1.1 billion ofasset purchase agreements to other third-party entities at December 31, 2008 and 2007, respectively.
(g) JPMorgan Chase held collateral relating to $31.0 billion and $31.5 billion of these arrangements at December 31, 2008 and 2007, respectively. Prior periods have been revised toconform to the current presentation.
(h) Includes unissued standby letters of credit commitments of $39.5 billion and $50.7 billion at December 31, 2008 and 2007, respectively.(i) Collateral held by the Firm in support of securities lending indemnification agreements was $170.1 billion and $390.5 billion at December 31, 2008 and 2007, respectively. Securities
lending collateral comprises primarily cash, securities issued by governments that are members of the Organisation for Economic Co-operation and Development and U.S. governmentagencies.
(j) Represents notional amounts of derivatives qualifying as guarantees. For further discussion of guarantees, see Note 33 on pages 218–222 of this Annual Report.(k) Included on the Consolidated Balance Sheets in beneficial interests issued by consolidated variable interest entities.(l) Includes noncancelable operating leases for premises and equipment used primarily for banking purposes and for energy-related tolling service agreements. Excludes the benefit of
noncancelable sublease rentals of $2.3 billion and $1.3 billion at December 31, 2008 and 2007, respectively.(m) Includes deferred annuity contracts. Excludes the $1.3 billion discretionary contribution to the Firm’s U.S. defined benefit pension plan that was made on January 15, 2009 (for further
discussion, see Note 9 on pages 161–167), and contributions to the U.S. and non-U.S. other postretirement benefits plans, if any, as these contributions are not reasonably estimableat this time. Also excluded are unrecognized tax benefits of $5.9 billion and $4.8 billion at December 31, 2008 and 2007, respectively, as the timing and amount of future cash pay-ments are not determinable at this time.
Management’s discussion and analysis
82 JPMorgan Chase & Co. / 2008 Annual Report
Line of business equity
December 31, (in billions) 2008 2007
Investment Bank $ 33.0 $ 21.0Retail Financial Services 25.0 16.0Card Services 15.0 14.1Commercial Banking 8.0 6.7Treasury & Securities Services 4.5 3.0Asset Management 7.0 4.0Corporate/Private Equity 42.4 58.4
Total common stockholders’ equity $134.9 $ 123.2
Line of business equity Yearly Average(in billions) 2008 2007
Investment Bank $ 26.1 $ 21.0Retail Financial Services 19.0 16.0Card Services 14.3 14.1Commercial Banking 7.3 6.5Treasury & Securities Services 3.8 3.0Asset Management 5.6 3.9Corporate/Private Equity(a) 53.0 54.2
Total common stockholders’ equity $129.1 $ 118.7
(a) 2008 and 2007 include $41.9 billion and $41.7 billion, respectively, of equity to offset goodwill, and $11.1 billion and $12.5 billion, respectively, of equity, primarilyrelated to Treasury, Private Equity and the Corporate pension plan.
Economic risk capitalJPMorgan Chase assesses its capital adequacy relative to the risksunderlying the Firm’s business activities, utilizing internal risk-assess-ment methodologies. The Firm assigns economic capital primarilybased upon four risk factors: credit risk, market risk, operational riskand private equity risk. In 2008, the growth in economic risk capitalwas driven by higher credit risk capital, which was increased primarilydue to a combination of higher derivative exposure, a weakeningcredit environment, and asset growth related to the Bear Stearns andWashington Mutual transactions.
Economic risk capital Yearly Average(in billions) 2008 2007
Credit risk $ 37.8 $ 30.0Market risk 10.5 9.5Operational risk 6.3 5.6Private equity risk 5.3 3.7
Economic risk capital 59.9 48.8Goodwill 46.1 45.2Other(a) 23.1 24.7
Total common stockholders’ equity $129.1 $ 118.7
(a) Reflects additional capital required, in the Firm’s view, to meet its regulatory anddebt rating objectives.
CAP ITAL MANAGEMENT
The Firm’s capital management framework is intended to ensure thatthere is capital sufficient to support the underlying risks of the Firm’sbusiness activities and to maintain “well-capitalized” status underregulatory requirements. In addition, the Firm holds capital abovethese requirements in amounts deemed appropriate to achieve theFirm’s regulatory and debt rating objectives. The process of assigningequity to the lines of business is integrated into the Firm’s capitalframework and is overseen by the ALCO.
Line of business equity The Firm’s framework for allocating capital is based upon the follow-ing objectives:
• integrate firmwide capital management activities with capitalmanagement activities within each of the lines of business
• measure performance consistently across all lines of business • provide comparability with peer firms for each of the lines of
business
Equity for a line of business represents the amount the Firm believesthe business would require if it were operating independently, incor-porating sufficient capital to address economic risk measures, regula-tory capital requirements and capital levels for similarly rated peers.Capital is also allocated to each line of business for, among otherthings, goodwill and other intangibles associated with acquisitionseffected by the line of business. Return on common equity is meas-ured and internal targets for expected returns are established as akey measure of a business segment’s performance.
Relative to 2007, line of business equity increased during 2008,reflecting growth across the businesses. In addition, at the end of thethird quarter of 2008, equity was increased for each line of businessin anticipation of the future implementation of the new Basel II capi-tal rules. For further details on these rules, see Basel II on page 84 ofthis Annual Report. Finally, during 2008, capital allocated to RFS, CS,and CB was increased as a result of the Washington Mutual transac-tion; capital allocated to AM was increased due to the Bear Stearnsmerger and the purchase of the additional equity interest inHighbridge; and capital allocated to IB was increased due to theBear Stearns merger.
In accordance with SFAS 142, the lines of business perform therequired goodwill impairment testing. For a further discussion ofgoodwill and impairment testing, see Critical Accounting EstimatesUsed by the Firm and Note 18 on pages 119–123 and 198–201,respectively, of this Annual Report.
JPMorgan Chase & Co. / 2008 Annual Report 83
Credit risk capital Credit risk capital is estimated separately for the wholesale business-es (IB, CB, TSS and AM) and consumer businesses (RFS and CS).
Credit risk capital for the overall wholesale credit portfolio is definedin terms of unexpected credit losses, both from defaults and declinesin the portfolio value due to credit deterioration, measured over aone-year period at a confidence level consistent with an “AA” creditrating standard. Unexpected losses are losses in excess of those forwhich provisions for credit losses are maintained. The capitalmethodology is based upon several principal drivers of credit risk:exposure at default (or loan-equivalent amount), default likelihood,credit spreads, loss severity and portfolio correlation.
Credit risk capital for the consumer portfolio is based upon productand other relevant risk segmentation. Actual segment level defaultand severity experience are used to estimate unexpected losses for aone-year horizon at a confidence level consistent with an “AA” creditrating standard. Statistical results for certain segments or portfoliosare adjusted to ensure that capital is consistent with external bench-marks, such as subordination levels on market transactions or capitalheld at representative monoline competitors, where appropriate.
Market risk capitalThe Firm calculates market risk capital guided by the principle thatcapital should reflect the risk of loss in the value of portfolios andfinancial instruments caused by adverse movements in market vari-ables, such as interest and foreign exchange rates, credit spreads,securities prices and commodities prices. Daily Value-at-Risk (“VaR”),biweekly stress-test results and other factors are used to determineappropriate capital levels. The Firm allocates market risk capital toeach business segment according to a formula that weights that seg-ment’s VaR and stress-test exposures. See Market Risk Managementon pages 111–116 of this Annual Report for more information aboutthese market risk measures.
Operational risk capitalCapital is allocated to the lines of business for operational risk usinga risk-based capital allocation methodology which estimates opera-tional risk on a bottom-up basis. The operational risk capital model isbased upon actual losses and potential scenario-based stress losses,with adjustments to the capital calculation to reflect changes in thequality of the control environment or the use of risk-transfer prod-ucts. The Firm believes its model is consistent with the new Basel IIFramework.
Private equity risk capitalCapital is allocated to privately and publicly held securities, third-partyfund investments and commitments in the private equity portfolio tocover the potential loss associated with a decline in equity marketsand related asset devaluations. In addition to negative market fluctua-tions, potential losses in private equity investment portfolios can bemagnified by liquidity risk. The capital allocation for the private equityportfolio is based upon measurement of the loss experience sufferedby the Firm and other market participants over a prolonged period ofadverse equity market conditions.
Regulatory capital The Board of Governors of the Federal Reserve System (the “FederalReserve”) establishes capital requirements, including well-capitalizedstandards for the consolidated financial holding company. The Officeof the Comptroller of the Currency (“OCC”) establishes similar capitalrequirements and standards for the Firm’s national banks, includingJPMorgan Chase Bank, N.A., and Chase Bank USA, N.A.
The Federal Reserve granted the Firm, for a period of 18 months fol-lowing the Bear Stearns merger, relief up to a certain specifiedamount and subject to certain conditions from the Federal Reserve’srisk-based capital and leverage requirements with respect to BearStearns’ risk-weighted assets and other exposures acquired. Theamount of such relief is subject to reduction by one-sixth each quartersubsequent to the merger and expires on October 1, 2009. The OCCgranted JPMorgan Chase Bank, N.A. similar relief from its risk-basedcapital and leverage requirements.
JPMorgan Chase maintained a well-capitalized position, based uponTier 1 and Total capital ratios at December 31, 2008 and 2007, asindicated in the tables below. For more information, see Note 30 onpages 212–213 of this Annual Report.
Risk-based capital components and assetsDecember 31, (in millions) 2008 2007
Total Tier 1 capital(a) $ 136,104 $ 88,746Total Tier 2 capital 48,616 43,496
Total capital $ 184,720 $ 132,242
Risk-weighted assets $ 1,244,659 $1,051,879Total adjusted average assets 1,966,895 1,473,541
(a) The FASB has been deliberating certain amendments to both SFAS 140 and FIN 46Rthat may impact the accounting for transactions that involve QSPEs and VIEs. Basedon the provisions of the current proposal and the Firm’s interpretation of the propos-al, the Firm estimates that the impact of consolidation could be up to $70 billion ofcredit card receivables, $40 billion of assets related to Firm-sponsored multi-sellerconduits, and $50 billion of other loans (including residential mortgages); thedecrease in the Tier 1 capital ratio could be approximately 80 basis points. The ulti-mate impact could differ significantly due to the FASB’s continuing deliberations onthe final requirements of the rule and market conditions.
Management’s discussion and analysis
84 JPMorgan Chase & Co. / 2008 Annual Report
Tier 1 capital was $136.1 billion at December 31, 2008, comparedwith $88.7 billion at December 31, 2007, an increase of $47.4 billion.
The following table presents the changes in Tier 1 capital for the yearended December 31, 2008.
Tier 1 capital, December 31, 2007 (in millions) $ 88,746
Net income 5,605Issuance of cumulative perpetual preferred stock to
U.S. Treasury 23,750Warrant issued to U.S. Treasury in connection with
issuance of preferred stock 1,250Issuance of noncumulative perpetual preferred stock 7,800Issuance of preferred stock – conversion of Bear Stearns
preferred stock 352Net issuance of common stock 11,485Net issuance of common stock under employee stock-based
compensation plans 3,317Net issuance of common stock in connection with the
Bear Stearns merger 1,198Dividends declared (6,307)Net issuance of qualifying trust preferred capital debt
securities 2,619DVA on structured debt and derivative liabilities (1,475)Goodwill and other nonqualifying intangibles (net of
deferred tax liabilities) (1,357)Other (879)
Increase in Tier 1 capital 47,358
Tier 1 capital, December 31, 2008 $136,104
Additional information regarding the Firm’s capital ratios and thefederal regulatory capital standards to which it is subject, and thecapital ratios for the Firm’s significant banking subsidiaries atDecember 31, 2008 and 2007, are presented in Note 30 on pages212–213 of this Annual Report.
Capital Purchase ProgramPursuant to the Capital Purchase Program, on October 28, 2008, theFirm issued to the U.S. Treasury, for total proceeds of $25.0 billion, (i)2.5 million shares of Series K Preferred Stock, and (ii) a warrant to pur-chase up to 88,401,697 shares of the Firm’s common stock, at an exer-cise price of $42.42 per share, subject to certain antidilution and otheradjustments. The Series K Preferred Stock qualifies as Tier 1 capital.
The Series K Preferred Stock bears cumulative dividends at a rate of5% per year for the first five years and 9% per year thereafter. TheSeries K Preferred Stock ranks equally with the Firm’s existing 6.15%Cumulative Preferred Stock, Series E; 5.72% Cumulative PreferredStock, Series F; 5.49% Cumulative Preferred Stock, Series G; Fixed-to-Floating Rate Noncumulative Perpetual Preferred Stock, Series I;and 8.63% Noncumulative Perpetual Preferred Stock, Series J, interms of dividend payments and upon liquidation of the Firm.
Any accrued and unpaid dividends on the Series K Preferred Stockmust be fully paid before dividends may be declared or paid on stockranking junior or equally with the Series K Preferred Stock. Pursuantto the Capital Purchase Program, until October 28, 2011, the U.S.Treasury’s consent is required for any increase in dividends on theFirm’s common stock from the amount of the last quarterly stock div-idend declared by the Firm prior to October 14, 2008, unless the
Series K Preferred Stock is redeemed in whole before then, or theU.S. Treasury has transferred all of the Series K Preferred Stock itowns to third parties.
The Firm may not repurchase or redeem any common stock or otherequity securities of the Firm, or any trust preferred securities issuedby the Firm or any of its affiliates, without the prior consent of theU.S. Treasury (other than (i) repurchases of the Series K PreferredStock and (ii) repurchases of junior preferred shares or commonstock in connection with any employee benefit plan in the ordinarycourse of business consistent with past practice).
Basel II The minimum risk-based capital requirements adopted by the U.S.federal banking agencies follow the Capital Accord of the BaselCommittee on Banking Supervision. In 2004, the Basel Committeepublished a revision to the Accord (“Basel II”). The goal of the newBasel II Framework is to provide more risk-sensitive regulatory capitalcalculations and promote enhanced risk management practicesamong large, internationally active banking organizations. U.S. bank-ing regulators published a final Basel II rule in December 2007, whichwill require JPMorgan Chase to implement Basel II at the holdingcompany level, as well as at certain of its key U.S. bank subsidiaries.
Prior to full implementation of the new Basel II Framework,JPMorgan Chase will be required to complete a qualification periodof four consecutive quarters during which it will need to demonstratethat it meets the requirements of the new rule to the satisfaction ofits primary U.S. banking regulators. The U.S. implementationtimetable consists of the qualification period, starting any timebetween April 1, 2008, and April 1, 2010, followed by a minimumtransition period of three years. During the transition period, Basel IIrisk-based capital requirements cannot fall below certain floorsbased on current (“Basel l”) regulations. JPMorgan Chase expects tobe in compliance with all relevant Basel II rules within the estab-lished timelines. In addition, the Firm has adopted, and will continueto adopt, based upon various established timelines, Basel II in certainnon-U.S. jurisdictions, as required.
Broker-dealer regulatory capital JPMorgan Chase’s principal U.S. broker-dealer subsidiaries are J.P.Morgan Securities Inc. (“JPMorgan Securities”) and J.P. MorganClearing Corp. (formerly known as Bear Stearns Securities Corp.).JPMorgan Securities and J.P. Morgan Clearing Corp. are each subject toRule 15c3-1 under the Securities Exchange Act of 1934 (“Net CapitalRule”). JPMorgan Securities and J.P. Morgan Clearing Corp. are alsoregistered as futures commission merchants and subject to Rule 1.17under the Commodity Futures Trading Commission (“CFTC”).
JPMorgan Securities and J.P. Morgan Clearing Corp. have elected tocompute their minimum net capital requirements in accordance withthe “Alternative Net Capital Requirement” of the Net Capital Rule. AtDecember 31, 2008, JPMorgan Securities’ net capital, as defined bythe Net Capital Rule, of $7.2 billion exceeded the minimum require-ment by $6.6 billion. In addition to its net capital requirements,JPMorgan Securities is required to hold tentative net capital in excess
JPMorgan Chase & Co. / 2008 Annual Report84
JPMorgan Chase & Co. / 2008 Annual Report 85
of $1.0 billion and is also required to notify the Securities andExchange Commission (“SEC”) in the event that tentative net capital isless than $5.0 billion in accordance with the market and credit riskstandards of Appendix E of the Net Capital Rule. As of December 31,2008, JPMorgan Securities had tentative net capital in excess of theminimum and the notification requirements. On October 1, 2008, J.P.Morgan Securities Inc. merged with and into Bear, Stearns & Co. Inc.,and the surviving entity changed its name to J.P. Morgan Securities Inc.
J.P. Morgan Clearing Corp., a subsidiary of JPMorgan Securities providesclearing and settlement services. At December 31, 2008, J.P. MorganClearing Corp.’s net capital, as defined by the Net Capital Rule, of $4.7billion exceeded the minimum requirement by $3.3 billion.
DividendsOn February 23, 2009, the Board of Directors reduced the Firm's quar-terly common stock dividend from $0.38 to $0.05 per share, effectivefor the dividend payable April 30, 2009, to shareholders of record onApril 6, 2009. JPMorgan Chase declared quarterly cash dividends onits common stock in the amount of $0.38 for each quarter of 2008and the second, third and fourth quarters of 2007, and $0.34 pershare for the first quarter of 2007 and for each quarter of 2006.
The Firm’s common stock dividend policy reflects JPMorgan Chase’searnings outlook, desired dividend payout ratios, need to maintain anadequate capital level and alternative investment opportunities. TheFirm’s ability to pay dividends is subject to restrictions. For informationregarding such restrictions, see page 84 and Note 24 and Note 29 onpages 205–206 and 211, respectively, of this Annual Report and foradditional information regarding the reduction of the dividend, seepage 44.
The following table shows the common dividend payout ratio basedupon reported net income.
Common dividend payout ratioYear ended December 31, 2008 2007 2006
Common dividend payout ratio 114% 34% 34%
IssuanceThe Firm issued $6.0 billion and $1.8 billion of noncumulative per-petual preferred stock on April 23, 2008, and August 21, 2008,respectively. Pursuant to the Capital Purchase Program, on October28, 2008, the Firm issued to the U.S. Treasury $25.0 billion of cumu-lative preferred stock and a warrant to purchase up to 88,401,697shares of the Firm’s common stock. For additional informationregarding preferred stock, see Note 24 on pages 205–206 of thisAnnual Report.
On September 30, 2008, the Firm issued $11.5 billion, or 284 millionshares, of common stock at $40.50 per share. For additional infor-mation regarding common stock, see Note 25 on pages 206–207 ofthis Annual Report.
Stock repurchasesDuring the year ended December 31, 2008, the Firm did not repur-chase any shares of its common stock. During 2007, under therespective stock repurchase programs then in effect, the Firm repur-chased 168 million shares for $8.2 billion at an average price pershare of $48.60.
The Board of Directors approved in April 2007, a stock repurchaseprogram that authorizes the repurchase of up to $10.0 billion of theFirm’s common shares, which superseded an $8.0 billion stock repur-chase program approved in 2006. The $10.0 billion authorizationincludes shares to be repurchased to offset issuances under theFirm’s employee stock-based plans. The actual number of shares thatmay be repurchased is subject to various factors, including marketconditions; legal considerations affecting the amount and timing ofrepurchase activity; the Firm’s capital position (taking into accountgoodwill and intangibles); internal capital generation; and alternativepotential investment opportunities. The repurchase program does notinclude specific price targets or timetables; may be executed throughopen market purchases or privately negotiated transactions, or utiliz-ing Rule 10b5-1 programs; and may be suspended at any time. ARule 10b5-1 repurchase plan allows the Firm to repurchase sharesduring periods when it would not otherwise be repurchasing com-mon stock – for example, during internal trading “black-out peri-ods.” All purchases under a Rule 10b5-1 plan must be made accord-ing to a predefined plan that is established when the Firm is notaware of material nonpublic information.
As of December 31, 2008, $6.2 billion of authorized repurchasecapacity remained under the current stock repurchase program.
For a discussion of restrictions on stock repurchases, see CapitalPurchase Program on page 84 and Note 24 on pages 205–206 ofthis Annual Report.
For additional information regarding repurchases of the Firm’s equitysecurities, see Part II, Item 5, Market for registrant’s common equity,related stockholder matters and issuer purchases of equity securities,on page 17 of JPMorgan Chase’s 2008 Form 10-K.
Management’s discussion and analysis
86 JPMorgan Chase & Co. / 2008 Annual Report
RISK MANAGEMENT
Risk is an inherent part of JPMorgan Chase’s business activities. TheFirm’s risk management framework and governance structure areintended to provide comprehensive controls and ongoing manage-ment of the major risks inherent in its business activities. The Firm’sability to properly identify, measure, monitor and report risk is criticalto both its soundness and profitability.
• Risk identification: The Firm’s exposure to risk through its dailybusiness dealings, including lending, trading and capital marketsactivities, is identified and aggregated through the Firm’s riskmanagement infrastructure. In addition, individuals who managerisk positions, particularly those positions that are complex, areresponsible for identifying and estimating potential losses thatcould arise from specific or unusual events, that may not be cap-tured in other models, and those risks are communicated to sen-ior management.
• Risk measurement: The Firm measures risk using a variety ofmethodologies, including calculating probable loss, unexpectedloss and value-at-risk, and by conducting stress tests and makingcomparisons to external benchmarks. Measurement models andrelated assumptions are routinely reviewed with the goal ofensuring that the Firm’s risk estimates are reasonable and reflectunderlying positions.
• Risk monitoring/control: The Firm’s risk management policies andprocedures incorporate risk mitigation strategies and includeapproval limits by customer, product, industry, country and busi-ness. These limits are monitored on a daily, weekly and monthlybasis, as appropriate.
• Risk reporting: Risk reporting is executed on a line of businessand consolidated basis. This information is reported to manage-ment on a daily, weekly and monthly basis, as appropriate. Thereare eight major risk types identified in the business activities ofthe Firm: liquidity risk, credit risk, market risk, interest rate risk,private equity risk, operational risk, legal and fiduciary risk, andreputation risk.
Risk governance The Firm’s risk governance structure starts with each line of businessbeing responsible for managing its own risks. Each line of businessworks closely with Risk Management through its own risk committeeand, in most cases, its own chief risk officer to manage risk. Eachline of business risk committee is responsible for decisions regardingthe business’ risk strategy, policies and controls.
Overlaying the line of business risk management are four corporatefunctions with risk management–related responsibilities: Treasury, theChief Investment Office, Legal and Compliance and RiskManagement.
Risk Management is headed by the Firm’s Chief Risk Officer, who is amember of the Firm’s Operating Committee and who reports to theChief Executive Officer and the Board of Directors, primarily throughthe Board’s Risk Policy Committee. Risk Management is responsiblefor providing a firmwide function of risk management and controls.Within Risk Management are units responsible for credit risk, marketrisk, operational risk and private equity risk, as well as RiskManagement Services and Risk Technology and Operations. RiskManagement Services is responsible for risk policy and methodology,risk reporting and risk education; and Risk Technology andOperations is responsible for building the information technologyinfrastructure used to monitor and manage risk.
Treasury and the Chief Investment Office are responsible for measur-ing, monitoring, reporting and managing the Firm’s liquidity, interestrate and foreign exchange risk.
Legal and Compliance has oversight for legal and fiduciary risk.
In addition to the risk committees of the lines of business and theabove-referenced corporate functions, the Firm also has anInvestment Committee, ALCO and two other risk-related committees,namely, the Risk Working Group and the Markets Committee. Themembers of these committees are composed of senior managementof the Firm, including representatives of line of business, RiskManagement, Finance and other senior executives. Members of theserisk committees meet frequently to discuss a broad range of topicsincluding, for example, current market conditions and other externalevents, current risk exposures and concentrations to ensure that theimpact of current risk factors are considered broadly across the Firm’sbusinesses.
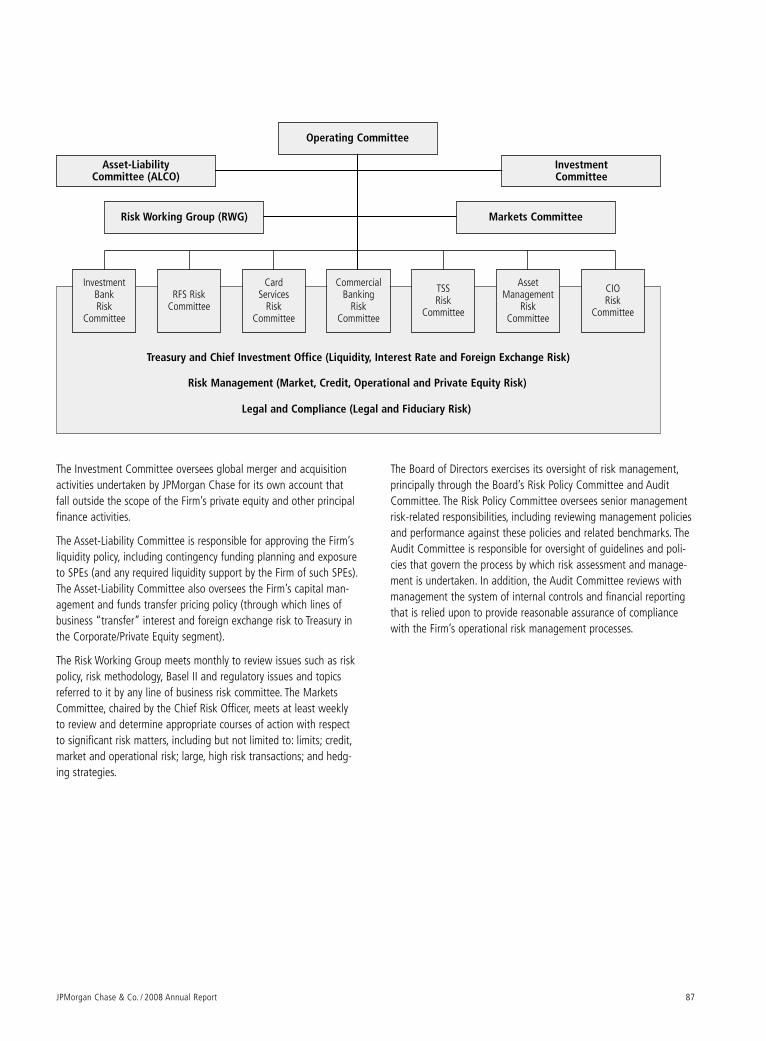
JPMorgan Chase & Co. / 2008 Annual Report 87
The Investment Committee oversees global merger and acquisitionactivities undertaken by JPMorgan Chase for its own account thatfall outside the scope of the Firm’s private equity and other principalfinance activities.
The Asset-Liability Committee is responsible for approving the Firm’sliquidity policy, including contingency funding planning and exposureto SPEs (and any required liquidity support by the Firm of such SPEs).The Asset-Liability Committee also oversees the Firm’s capital man-agement and funds transfer pricing policy (through which lines ofbusiness “transfer” interest and foreign exchange risk to Treasury inthe Corporate/Private Equity segment).
The Risk Working Group meets monthly to review issues such as riskpolicy, risk methodology, Basel II and regulatory issues and topicsreferred to it by any line of business risk committee. The MarketsCommittee, chaired by the Chief Risk Officer, meets at least weeklyto review and determine appropriate courses of action with respectto significant risk matters, including but not limited to: limits; credit,market and operational risk; large, high risk transactions; and hedg-ing strategies.
The Board of Directors exercises its oversight of risk management,principally through the Board’s Risk Policy Committee and AuditCommittee. The Risk Policy Committee oversees senior managementrisk-related responsibilities, including reviewing management policiesand performance against these policies and related benchmarks. TheAudit Committee is responsible for oversight of guidelines and poli-cies that govern the process by which risk assessment and manage-ment is undertaken. In addition, the Audit Committee reviews withmanagement the system of internal controls and financial reportingthat is relied upon to provide reasonable assurance of compliancewith the Firm’s operational risk management processes.
Investment Committee
Asset-Liability Committee (ALCO)
Markets CommitteeRisk Working Group (RWG)
Operating Committee
Treasury and Chief Investment Office (Liquidity, Interest Rate and Foreign Exchange Risk)
RFS Risk Committee
Card Services
Risk Committee
TSSRisk
Committee
AssetManagement
Risk Committee
CommercialBanking
Risk Committee
InvestmentBank Risk
Committee
CIORisk
Committee
Risk Management (Market, Credit, Operational and Private Equity Risk)
Legal and Compliance (Legal and Fiduciary Risk)
Management’s discussion and analysis
88 JPMorgan Chase & Co. / 2008 Annual Report
L IQUID ITY R ISK MANAGEMENT
The ability to maintain a sufficient level of liquidity is crucial to finan-cial services companies, particularly maintaining appropriate levels ofliquidity during periods of adverse conditions. The Firm’s fundingstrategy is to ensure liquidity and diversity of funding sources tomeet actual and contingent liabilities through both stable andadverse conditions.
JPMorgan Chase uses a centralized approach for liquidity risk man-agement. Global funding is managed by Corporate Treasury, usingregional expertise as appropriate. Management believes that a cen-tralized framework maximizes liquidity access, minimizes funding costsand permits identification and coordination of global liquidity risk.
Recent events During the second half of 2008, global markets exhibited extraordi-nary levels of volatility and increasing signs of stress. Throughout thisperiod, access by market participants to the debt, equity, and con-sumer loan securitization markets was constrained and fundingspreads widened sharply. In response to strains in financial markets,U.S. government and regulatory agencies introduced various programsto inject liquidity into the financial system. JPMorgan Chase partici-pated in a number of these programs, two of which were the CapitalPurchase Program and the FDIC’s TLG Program. On October 28, 2008,JPMorgan Chase issued $25.0 billion of preferred stock as well as awarrant to purchase up to 88,401,697 shares of the Firm’s commonstock to the U.S. Treasury under the Capital Purchase Program, whichenhanced the Firm’s capital and liquidity positions. In addition, onDecember 4, 2008, JPMorgan Chase elected to continue to partici-pate in the FDIC’s TLG Program, which facilitated long-term debtissuances at rates (including the guarantee fee charged by the FDIC)more favorable than those for non-FDIC guaranteed debt issuances.Under the TLG Program, the FDIC guarantees certain senior unsecureddebt of JPMorgan Chase, and in return for the guarantees, the FDIC ispaid a fee based on the amount and maturity of the debt. Under theTLG Program, the FDIC will pay the unpaid principal and interest onan FDIC-guaranteed debt instrument upon the uncured failure of theparticipating entity to make a timely payment of principal or interestin accordance with the terms of the instrument. During the fourthquarter of 2008, pursuant to the TLG Program, the Firm issued $20.8billion of bonds guaranteed by the FDIC, further enhancing the Firm’sliquidity position. At December 31, 2008, all of the FDIC-guaranteeddebt was outstanding and had a carrying value of $21.0 billion, netof hedges. In the interest of promoting deposit stability, during thefourth quarter, the FDIC also (i) temporarily increased, through 2009,insurance coverage on bank deposits to $250,000 per customer from$100,000 per customer, and (ii) for qualified institutions who partici-pated in the TLG Program (such as the Firm), provided full depositinsurance coverage for noninterest-bearing transaction accounts.
During the second half of 2008, the Firm’s deposits (excluding thoseassumed in connection with the Washington Mutual transaction)increased substantially, as the Firm benefited from the heightenedvolatility and credit concerns affecting the markets.
On May 30, 2008, JPMorgan Chase completed the merger with BearStearns. Due to the structure of the transaction and the de-risking ofpositions over time, the merger with Bear Stearns had no materialimpact on the Firm’s liquidity. On September 25, 2008, JPMorganChase acquired the banking operations of Washington Mutual fromthe FDIC. As part of the Washington Mutual transaction, JPMorganChase assumed Washington Mutual’s deposits as well as its obliga-tions to its credit card securitization-related master trusts, coveredbonds, and liabilities to certain Federal Home Loan Banks. TheWashington Mutual transaction had an insignificant impact on theFirm’s overall liquidity position.
Both S&P and Moody’s lowered the Firm’s ratings one notch onDecember 19, 2008 and January 15, 2009, respectively. These ratingactions did not have a material impact on the cost or availability offunding to the Firm. For a further discussion of credit ratings, see theCredit Ratings caption of this Liquidity Risk Management section onpages 91–92 of this Annual Report.
Notwithstanding the market events during the latter half of 2008, theFirm’s liquidity position remained strong based on its liquidity metricsas of December 31, 2008. The Firm believes that its unsecured andsecured funding capacity is sufficient to meet on- and off- balancesheet obligations. JPMorgan Chase’s long-dated funding, includingcore liabilities, exceeded illiquid assets. In addition, during the courseof 2008, the Firm raised funds at the parent holding company inexcess of its minimum threshold to cover its obligations and those ofits nonbank subsidiaries that mature over the next 12 months.
Governance The Asset-Liability Committee approves and oversees the executionof the Firm’s liquidity policy and contingency funding plan. CorporateTreasury formulates the Firm’s liquidity and contingency planningstrategies and is responsible for measuring, monitoring, reportingand managing the Firm’s liquidity risk profile.
Liquidity monitoring The Firm monitors liquidity trends, tracks historical and prospectiveon- and off-balance sheet liquidity obligations, identifies and meas-ures internal and external liquidity warning signals to permit earlydetection of liquidity issues, and manages contingency planning(including identification and testing of various company-specific andmarket-driven stress scenarios). Various tools, which together con-tribute to an overall firmwide liquidity perspective, are used to moni-tor and manage liquidity. Among others, these include: (i) analysis ofthe timing of liquidity sources versus liquidity uses (i.e., fundinggaps) over periods ranging from overnight to one year; (ii) manage-ment of debt and capital issuances to ensure that the illiquid portionof the balance sheet can be funded by equity, long-term debt, trustpreferred capital debt securities and deposits the Firm believes to bestable; and (iii) assessment of the Firm’s capacity to raise incrementalunsecured and secured funding.
JPMorgan Chase & Co. / 2008 Annual Report 89
Liquidity of the parent holding company and its nonbank subsidiariesis monitored independently as well as in conjunction with the liquidityof the Firm’s bank subsidiaries. At the parent holding company level,long-term funding is managed to ensure that the parent holdingcompany has, at a minimum, sufficient liquidity to cover its obliga-tions and those of its nonbank subsidiaries within the next 12months. For bank subsidiaries, the focus of liquidity risk managementis on maintenance of unsecured and secured funding capacity suffi-cient to meet on- and off-balance sheet obligations.
A component of liquidity management is the Firm’s contingencyfunding plan. The goal of the plan is to ensure appropriate liquidityduring normal and stress periods. The plan considers various tempo-rary and long-term stress scenarios where access to unsecured fund-ing is severely limited or nonexistent, taking into account both on-and off-balance sheet exposures, and separately evaluates access tofunds by the parent holding company and the Firm’s banks.
Funding Sources of funds The deposits held by the RFS, CB, TSS and AM lines of business are agenerally consistent source of funding for JPMorgan Chase Bank,N.A. As of December 31, 2008, total deposits for the Firm were $1.0trillion, compared with $740.7 billion at December 31, 2007. A sig-nificant portion of the Firm’s deposits are retail deposits, which areless sensitive to interest rate changes or market volatility and there-fore are considered more stable than market-based (i.e., wholesale)liability balances. The Washington Mutual transaction added approxi-mately $159.9 billion of deposits to the Firm, a significant majorityof which are retail deposits. In addition, through the normal courseof business, the Firm benefits from substantial liability balances origi-nated by RFS, CB, TSS and AM. These franchise-generated liabilitybalances include deposits and funds that are swept to on-balancesheet liabilities (e.g., commercial paper, federal funds purchased andsecurities loaned or sold under repurchase agreements), a significantportion of which are considered to be stable and consistent sourcesof funding due to the nature of the businesses from which they aregenerated. For further discussions of deposit and liability balancetrends, see the discussion of the results for the Firm’s business seg-ments and the Balance sheet analysis on pages 54–72 and 76–78,respectively, of this Annual Report.
Additional sources of funding include a variety of unsecured short-and long-term instruments, including federal funds purchased, certifi-cates of deposits, time deposits, bank notes, commercial paper, long-term debt, trust preferred capital debt securities, preferred stock andcommon stock. Secured sources of funding include securities loanedor sold under repurchase agreements, asset securitizations, borrow-ings from the Federal Reserve (including discount window borrow-ings, the Primary Dealer Credit Facility and the Term Auction Facility)and borrowings from the Chicago, Pittsburgh and, as a result of theWashington Mutual transaction, the San Francisco Federal HomeLoan Banks. However, the Firm does not view borrowings from theFederal Reserve as a primary means of funding the Firm.
Issuance Funding markets are evaluated on an ongoing basis to achieve anappropriate global balance of unsecured and secured funding atfavorable rates. Generating funding from a broad range of sources ina variety of geographic locations enhances financial flexibility andlimits dependence on any one source.
During 2008, JPMorgan Chase issued approximately $42.6 billion oflong-term debt for funding or capital management purposes, including$20.8 billion of FDIC-guaranteed notes issued under the TLG Program.The Firm also issued $28.0 billion of IB structured notes, the issuancesof which are generally client-driven and not for funding or capitalmanagement purposes, as the proceeds from such transactions aregenerally used to purchase securities to mitigate the risk associatedwith structured note exposure. In addition, during the year, the Firmissued $1.8 billion of trust preferred capital debt securities. During thesame period, the Firm redeemed or had maturities of $62.7 billion ofsecurities, including $35.8 billion of IB structured notes.
Preferred stock issuances included $6.0 billion and $1.8 billion ofnoncumulative perpetual preferred stock issued on April 23 andAugust 21, 2008, respectively, as well as preferred stock issued tothe U.S. Treasury on October 28, 2008, under the Capital PurchaseProgram. In connection with preferred stock issuance under theCapital Purchase Program, the Firm also issued to the U.S. Treasuryon October 28, 2008, a warrant to purchase up to 88,401,697shares of the Firm’s common stock, at an exercise price of $42.42per share, subject to certain antidilution and other adjustments. TheFirm has in the past, and may continue in the future, to repurchasefrom time to time its debt or trust preferred capital debt securities inopen market purchases or privately negotiated transactions subjectto regulatory and contractual restrictions.
Finally, during 2008, the Firm securitized $21.4 billion of credit cardloans. The ability to securitize loans, and the associated gains on thosesecuritizations, are principally dependent upon the credit quality andother characteristics of the assets securitized as well as upon prevailingmarket conditions. Given the volatility and stress in the financial mar-kets in the second half of 2008, the Firm did not securitize any resi-dential mortgage loans, auto loans or student loans during 2008.
Replacement Capital CovenantsIn connection with the issuance of certain of its trust preferred capi-tal debt securities and noncumulative perpetual preferred stock, theFirm entered into Replacement Capital Covenants (“RCCs”) grantingcertain rights to the holders of “covered debt,” as defined in theRCCs, that prohibit the repayment, redemption or purchase of thetrust preferred capital debt securities and noncumulative perpetualpreferred stock except, with limited exceptions, to the extent thatJPMorgan Chase has received, in each such case, specified amountsof proceeds from the sale of certain qualifying securities. Currentlythe Firm’s covered debt is its 5.875% Junior Subordinated DeferrableInterest Debentures, Series O, due in 2035. For more informationregarding these covenants, reference is made to the respective RCCsentered into by the Firm in connection with the issuances of suchtrust preferred capital debt securities and noncumulative perpetual

Management’s discussion and analysis
90 JPMorgan Chase & Co. / 2008 Annual Report
preferred stock, which are filed with the U.S. Securities and ExchangeCommission under cover of Forms 8-K.
Cash flows For the years ended December 31, 2008, 2007 and 2006, cash anddue from banks decreased $13.2 billion, $268 million, and increased$3.7 billion, respectively. The following discussion highlights themajor activities and transactions that affected JPMorgan Chase’scash flows during 2008, 2007 and 2006.
Cash Flows from Operating Activities JPMorgan Chase’s operating assets and liabilities support the Firm’scapital markets and lending activities, including the origination orpurchase of loans initially designated as held-for-sale. The operatingassets and liabilities can vary significantly in the normal course ofbusiness due to the amount and timing of cash flows, which areaffected by client-driven activities, market conditions and tradingstrategies. Management believes cash flows from operations, avail-able cash balances and the Firm’s ability to generate cash throughshort-and long-term borrowings are sufficient to fund the Firm’soperating liquidity needs.
For the year ended December 31, 2008, net cash provided by operat-ing activities was $23.1 billion, while for the years ended December31, 2007 and 2006, net cash used in operating activities was $110.6billion and $49.6 billion, respectively. In 2008, net cash generatedfrom operating activities was higher than net income, largely as aresult of adjustments for operating items such as the provision forcredit losses, depreciation and amortization, stock-based compensa-tion, and certain other expense. During 2006, 2007 and 2008, cashwas used to fund loans held-for-sale, primarily in IB and RFS. During2008, proceeds from sales of loans originated or purchased with aninitial intent to sell were slightly higher than cash used to acquiresuch loans; but the cash flows from these activities were at a signifi-cantly lower level than for the same periods in 2007 and 2006 as aresult of current market conditions. In 2007 and 2006, cash used toacquire such loans was slightly higher than proceeds from sales.
For the years ended December 31, 2007 and 2006, the net cashused in operating activities supported growth in the Firm’s lendingand capital markets activities. In 2007, when compared with 2006,there was a significant decline in cash flows from IB loan origina-tions/purchases and sale/securitization activities as a result of thedifficult wholesale securitization market and capital markets forleveraged financings, which were affected by a significant deteriora-tion in liquidity in the second half of 2007. Cash flows in 2007 asso-ciated with RFS residential mortgage activities grew, reflecting anincrease in originations.
Cash Flows from Investing Activities The Firm’s investing activities predominantly include originating loansto be held for investment, other receivables, the available-for-saleinvestment portfolio and other short-term investment vehicles. Forthe year ended December 31, 2008, net cash of $286.3 billion wasused in investing activities, primarily for: purchases of investmentsecurities in Corporate’s AFS portfolio to manage the Firm’s exposureto interest rate movements, as well as to make strategic longer-term
investments; increased deposits with banks as the result of the avail-ability of excess cash for short-term investment opportunitiesthrough interbank lending, and from deposits with the FederalReserve (which is now an investing activity, reflecting a policy changeof the Federal Reserve to pay interest to depository institutions onreserve balances); net additions to the wholesale loan portfolio, fromorganic growth in CB; additions to the consumer prime mortgageportfolio as a result of the decision to retain, rather than sell, neworiginations of nonconforming prime mortgage loans; an increase insecurities purchased under resale agreements reflecting growth indemand from clients for liquidity; and net purchases of asset-backedcommercial paper from money market mutual funds in connectionwith a temporary Federal Reserve Bank of Boston lending facility.Partially offsetting these uses of cash were proceeds from sales andmaturities of AFS securities; loan sales and credit card securitizationactivities, which were at a lower level than for the same periods in2007 as a result of the adverse market conditions that have contin-ued since the last half of 2007; and net cash received from acquisi-tions and the sale of an investment. Additionally, in June 2008, inconnection with the merger with Bear Stearns, the Firm sold assetsacquired from Bear Stearns to the FRBNY and received cash pro-ceeds of $28.85 billion (for additional information see Note 2 onpages 135–140 of this Annual Report).
For the year ended December 31, 2007, net cash of $73.1 billionwas used in investing activities, primarily to fund purchases in theAFS securities portfolio to manage the Firm’s exposure to interestrate movements; net additions to the wholesale retained loan portfo-lios in IB, CB and AM, mainly as a result of business growth; a netincrease in the consumer retained loan portfolio, primarily reflectinggrowth in RFS in home equity loans and net additions to RFS’ sub-prime mortgage loans portfolio (which was affected by manage-ment’s decision in the third quarter to retain (rather than sell) newsubprime mortgages), and growth in prime mortgage loans originat-ed by RFS and AM that cannot be sold to U.S. government agenciesor U.S. government-sponsored enterprises; and increases in securitiespurchased under resale agreements as a result of a higher level ofcash that was available for short-term investment opportunities inconnection with the Firm’s efforts to build liquidity. These net uses ofcash were partially offset by cash proceeds received from sales andmaturities of AFS securities; and credit card, residential mortgage,student and wholesale loan sales and securitization activities, whichgrew in 2007 despite the difficult conditions in the credit markets.
For the year ended December 31, 2006, net cash of $99.6 billionwas used in investing activities. Net cash was invested to fund netadditions to the retained wholesale loan portfolio, mainly resultingfrom capital markets activity in IB leveraged financings; increases inCS loans reflecting strong organic growth; net additions in retailhome equity loans; the acquisition of private-label credit card portfo-lios from Kohl’s, BP and Pier 1 Imports, Inc.; the acquisition ofCollegiate Funding Services; and purchases of AFS securities in con-nection with repositioning the portfolio in response to changes ininterest rates. These uses of cash were partially offset by cash pro-ceeds provided from credit card, residential mortgage, auto and
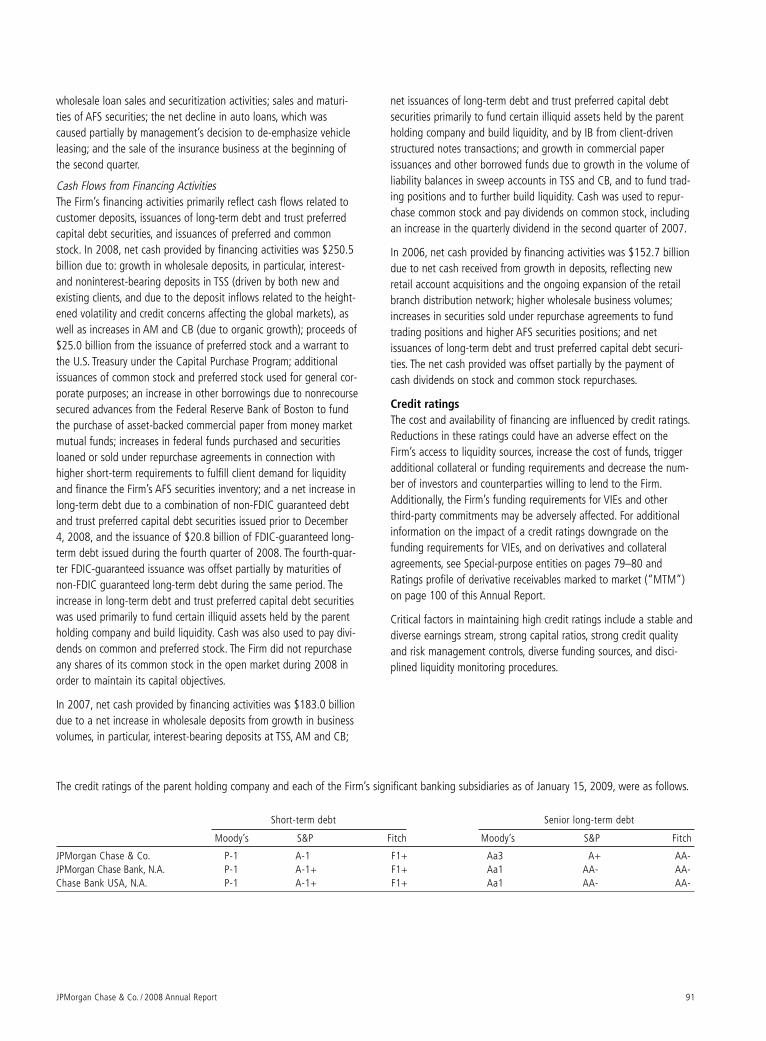
JPMorgan Chase & Co. / 2008 Annual Report 91
wholesale loan sales and securitization activities; sales and maturi-ties of AFS securities; the net decline in auto loans, which wascaused partially by management’s decision to de-emphasize vehicleleasing; and the sale of the insurance business at the beginning ofthe second quarter.
Cash Flows from Financing ActivitiesThe Firm’s financing activities primarily reflect cash flows related tocustomer deposits, issuances of long-term debt and trust preferredcapital debt securities, and issuances of preferred and commonstock. In 2008, net cash provided by financing activities was $250.5billion due to: growth in wholesale deposits, in particular, interest-and noninterest-bearing deposits in TSS (driven by both new andexisting clients, and due to the deposit inflows related to the height-ened volatility and credit concerns affecting the global markets), aswell as increases in AM and CB (due to organic growth); proceeds of$25.0 billion from the issuance of preferred stock and a warrant tothe U.S. Treasury under the Capital Purchase Program; additionalissuances of common stock and preferred stock used for general cor-porate purposes; an increase in other borrowings due to nonrecoursesecured advances from the Federal Reserve Bank of Boston to fundthe purchase of asset-backed commercial paper from money marketmutual funds; increases in federal funds purchased and securitiesloaned or sold under repurchase agreements in connection withhigher short-term requirements to fulfill client demand for liquidityand finance the Firm’s AFS securities inventory; and a net increase inlong-term debt due to a combination of non-FDIC guaranteed debtand trust preferred capital debt securities issued prior to December4, 2008, and the issuance of $20.8 billion of FDIC-guaranteed long-term debt issued during the fourth quarter of 2008. The fourth-quar-ter FDIC-guaranteed issuance was offset partially by maturities ofnon-FDIC guaranteed long-term debt during the same period. Theincrease in long-term debt and trust preferred capital debt securitieswas used primarily to fund certain illiquid assets held by the parentholding company and build liquidity. Cash was also used to pay divi-dends on common and preferred stock. The Firm did not repurchaseany shares of its common stock in the open market during 2008 inorder to maintain its capital objectives.
In 2007, net cash provided by financing activities was $183.0 billiondue to a net increase in wholesale deposits from growth in businessvolumes, in particular, interest-bearing deposits at TSS, AM and CB;
net issuances of long-term debt and trust preferred capital debtsecurities primarily to fund certain illiquid assets held by the parentholding company and build liquidity, and by IB from client-drivenstructured notes transactions; and growth in commercial paperissuances and other borrowed funds due to growth in the volume ofliability balances in sweep accounts in TSS and CB, and to fund trad-ing positions and to further build liquidity. Cash was used to repur-chase common stock and pay dividends on common stock, includingan increase in the quarterly dividend in the second quarter of 2007.
In 2006, net cash provided by financing activities was $152.7 billiondue to net cash received from growth in deposits, reflecting newretail account acquisitions and the ongoing expansion of the retailbranch distribution network; higher wholesale business volumes;increases in securities sold under repurchase agreements to fundtrading positions and higher AFS securities positions; and netissuances of long-term debt and trust preferred capital debt securi-ties. The net cash provided was offset partially by the payment ofcash dividends on stock and common stock repurchases.
Credit ratings The cost and availability of financing are influenced by credit ratings.Reductions in these ratings could have an adverse effect on theFirm’s access to liquidity sources, increase the cost of funds, triggeradditional collateral or funding requirements and decrease the num-ber of investors and counterparties willing to lend to the Firm.Additionally, the Firm’s funding requirements for VIEs and otherthird-party commitments may be adversely affected. For additionalinformation on the impact of a credit ratings downgrade on thefunding requirements for VIEs, and on derivatives and collateralagreements, see Special-purpose entities on pages 79–80 andRatings profile of derivative receivables marked to market (“MTM”)on page 100 of this Annual Report.
Critical factors in maintaining high credit ratings include a stable anddiverse earnings stream, strong capital ratios, strong credit qualityand risk management controls, diverse funding sources, and disci-plined liquidity monitoring procedures.
The credit ratings of the parent holding company and each of the Firm’s significant banking subsidiaries as of January 15, 2009, were as follows.
Short-term debt Senior long-term debt
Moody’s S&P Fitch Moody’s S&P Fitch
JPMorgan Chase & Co. P-1 A-1 F1+ Aa3 A+ AA-JPMorgan Chase Bank, N.A. P-1 A-1+ F1+ Aa1 AA- AA-Chase Bank USA, N.A. P-1 A-1+ F1+ Aa1 AA- AA-
Management’s discussion and analysis
92 JPMorgan Chase & Co. / 2008 Annual Report
On December 19, 2008, S&P lowered the senior long-term debt ratings on JPMorgan Chase & Co. and its principal bank subsidiariesone notch from “AA-” and “AA”, respectively; lowered the short-termdebt rating of JPMorgan Chase & Co. from “A-1+”; and affirmed theshort-term debt ratings of its principal bank subsidiaries. These actionswere primarily the result of S&P’s belief that the Firm’s earnings arelikely to decline over the next couple of years in response to increas-ing loan losses associated with the Firm’s exposure to consumerlending, as well as declining business volumes. S&P’s current outlookis negative. On January 15, 2009, Moody’s lowered the senior long-term debt ratings on JPMorgan Chase & Co. and its principal banksubsidiaries from “Aa2” and “Aaa”, respectively. These actions wereprimarily the result of Moody’s view that, in the current economicenvironment, the Firm may experience difficulties generating capitaland could face significant earnings pressure. Moody’s affirmed theshort-term debt ratings of JPMorgan Chase & Co. and its principalbank subsidiaries at “P-1”. Moody’s also revised the outlook to stable from negative due to the Firm’s strong capital ratios, signifi-cant loan loss reserves, and strong franchise. Ratings from Fitch on
JPMorgan Chase & Co. and its principal bank subsidiaries remainedunchanged from December 31, 2007, and Fitch’s outlook remainedstable. The recent rating actions by S&P and Moody’s did not have amaterial impact on the cost or availability of the Firm’s funding. If theFirm’s senior long-term debt ratings were downgraded by one addi-tional notch, the Firm believes the incremental cost of funds or lossof funding would be manageable within the context of current mar-ket conditions and the Firm’s liquidity resources. JPMorgan Chase’sunsecured debt, other than in certain cases IB structured notes, doesnot contain requirements that would call for an acceleration of pay-ments, maturities or changes in the structure of the existing debt, norcontain collateral provisions or the creation of an additional financialobligation, based on unfavorable changes in the Firm’s credit ratings,financial ratios, earnings, cash flows or stock price. To the extent anyIB structured notes do contain such provisions, the Firm believesthat, in the event of an acceleration of payments or maturities orprovision of collateral, the securities used by the Firm to risk managesuch structured notes, together with other liquidity resources, areexpected to generate funds sufficient to satisfy the Firm’s obligations.
CREDIT R ISK MANAGEMENT
Credit risk is the risk of loss from obligor or counterparty default. TheFirm provides credit (for example, through loans, lending-relatedcommitments and derivatives) to a variety of customers, from largecorporate and institutional clients to the individual consumer. For thewholesale business, credit risk management includes the distributionof syndicated loans originated by the Firm into the marketplace (pri-marily to IB clients), with exposure held in the retained portfolioaveraging less than 10% of the total originated loans. Wholesaleloans generated by CB and AM are generally retained on the balancesheet. With regard to the consumer credit market, the Firm focuseson creating a portfolio that is diversified from both a product and ageographic perspective. Loss mitigation strategies are beingemployed for all home lending portfolios. These strategies includerate reductions, principal forgiveness, forbearance and other actionsintended to minimize the economic loss and avoid foreclosure. In themortgage business, originated loans are either retained in the mort-gage portfolio or securitized and sold to U.S. government agenciesand U.S. government-sponsored enterprises.
Credit risk organization Credit risk management is overseen by the Chief Risk Officer andimplemented within the lines of business. The Firm’s credit risk man-agement governance consists of the following functions:
• establishing a comprehensive credit risk policy framework • monitoring and managing credit risk across all portfolio seg-
ments, including transaction and line approval• assigning and managing credit authorities in connection with the
approval of all credit exposure • managing criticized exposures • calculating the allowance for credit losses and ensuring appropri-
ate credit risk-based capital management
Risk identification The Firm is exposed to credit risk through lending and capital mar-kets activities. The credit risk management organization works inpartnership with the business segments in identifying and aggregat-ing exposures across all lines of business.
Risk measurement To measure credit risk, the Firm employs several methodologies forestimating the likelihood of obligor or counterparty default.Methodologies for measuring credit risk vary depending on severalfactors, including type of asset (e.g., consumer installment versuswholesale loan), risk measurement parameters (e.g., delinquency sta-tus and credit bureau score versus wholesale risk rating) and riskmanagement and collection processes (e.g., retail collection centerversus centrally managed workout groups). Credit risk measurementis based upon the amount of exposure should the obligor or thecounterparty default, the probability of default and the loss severitygiven a default event. Based upon these factors and related market-based inputs, the Firm estimates both probable and unexpected loss-es for the wholesale and consumer portfolios. Probable losses,reflected in the provision for credit losses, are based primarily uponstatistical estimates of credit losses as a result of obligor or counter-party default. However, probable losses are not the sole indicators ofrisk. If losses were entirely predictable, the probable loss rate couldbe factored into pricing and covered as a normal and recurring costof doing business. Unexpected losses, reflected in the allocation ofcredit risk capital, represent the potential volatility of actual lossesrelative to the probable level of losses. Risk measurement for thewholesale portfolio is assessed primarily on a risk-rated basis; for theconsumer portfolio, it is assessed primarily on a credit-scored basis.
JPMorgan Chase & Co. / 2008 Annual Report 93
Risk-rated exposure For portfolios that are risk-rated (generally held in IB, CB, TSS andAM), probable and unexpected loss calculations are based upon esti-mates of probability of default and loss given default. Probability ofdefault is the expected default calculated on an obligor basis. Lossgiven default is an estimate of losses given a default event and takesinto consideration collateral and structural support for each creditfacility. Calculations and assumptions are based upon managementinformation systems and methodologies which are under continualreview. Risk ratings are assigned to differentiate risk within the port-folio and are reviewed on an ongoing basis by credit risk manage-ment and revised, if needed, to reflect the borrowers’ current riskprofiles and the related collateral and structural positions.
Credit-scored exposure For credit-scored portfolios (generally held in RFS and CS), probableloss is based upon a statistical analysis of inherent losses over dis-crete periods of time. Probable losses are estimated using sophisti-cated portfolio modeling, credit scoring and decision-support tools toproject credit risks and establish underwriting standards. In addition,common measures of credit quality derived from historical loss expe-rience are used to predict consumer losses. Other risk characteristicsevaluated include recent loss experience in the portfolios, changes inorigination sources, portfolio seasoning, loss severity and underlyingcredit practices, including charge-off policies. These analyses areapplied to the Firm’s current portfolios in order to estimate delin-quencies and severity of losses, which determine the amount ofprobable losses. These factors and analyses are updated at least on aquarterly basis or more frequently as market conditions dictate.
Risk monitoring The Firm has developed policies and practices that are designed topreserve the independence and integrity of the approval and decisionmaking of extending credit and are intended to ensure credit risksare assessed accurately, approved properly, monitored regularly andmanaged actively at both the transaction and portfolio levels. Thepolicy framework establishes credit approval authorities, concentra-tion limits, risk-rating methodologies, portfolio review parametersand guidelines for management of distressed exposure. Wholesalecredit risk is monitored regularly on both an aggregate portfolio leveland on an individual customer basis. Management of the Firm’swholesale exposure is accomplished through a number of meansincluding loan syndication and participations, loan sales, securitiza-tions, credit derivatives, use of master netting agreements and collat-eral and other risk-reduction techniques, which are further discussedin the following risk sections. For consumer credit risk, the key focusitems are trends and concentrations at the portfolio level, wherebypotential problems can be remedied through changes in underwrit-ing policies and portfolio guidelines. Consumer Credit RiskManagement monitors trends against business expectations andindustry benchmarks.
Risk reporting To enable monitoring of credit risk and decision-making, aggregatecredit exposure, credit quality forecasts, concentrations levels and riskprofile changes are reported regularly to senior credit risk manage-ment. Detailed portfolio reporting of industry, customer and geo-graphic concentrations occurs monthly, and the appropriateness ofthe allowance for credit losses is reviewed by senior management atleast on a quarterly basis. Through the risk reporting and governancestructure, credit risk trends and limit exceptions are provided regular-ly to, and discussed with, senior management, for further informa-tion, see page 86 of this Annual Report.
2008 Credit risk overview During 2008, credit markets experienced deterioration and increaseddefaults and downgrades reflecting, among other things, reduced liq-uidity. The liquidity and credit crisis has adversely affected manyfinancial institutions, resulting in the failure of some in both the U.S.and Europe, and has impacted the functioning of credit markets, par-ticularly, the loan syndication and asset-backed securitization mar-kets. The Firm’s credit portfolio was affected by these market condi-tions and experienced deteriorating credit quality, especially in thelatter part of the year, generally consistent with the market. In 2008,for the wholesale portfolio, criticized assets and NPAs increased,from historical lows, 301% and 525%, respectively, from the previ-ous year. Charge-offs, which typically lag other portfolio deteriora-tion, have increased from historical lows by 458% over 2007. TheFirm has remained focused on aggressively managing the portfolio,including ongoing, in-depth reviews of credit quality, as well as ofrevisions of industry, product and client concentrations. Risk levelsare adjusted as needed to reflect the Firm’s risk tolerance.Underwriting standards across all areas of lending have beenstrengthened, consistent with evolving market conditions in order topermit the Firm to lend in a safe and prudent manner. In light of thecurrent market conditions, the wholesale allowance for loan loss cov-erage ratio has been strengthened to 2.64%, from 1.67% at the endof 2007.
Consumer portfolio credit performance continues to be negativelyaffected by the economic environment, particularly the weak labormarket and the decline in housing prices which occurred nationally.As a result, the Firm took actions throughout the year to reduce riskexposure by tightening underwriting and loan qualification standardsin those markets most affected by the housing downturn. In thefourth quarter of 2008, the Firm announced plans to significantlyexpand loss mitigation efforts related to its mortgage and homeequity portfolios. During the implementation period of these expand-ed loss mitigation efforts, which was substantially in place in early2009, the Firm did not place loans into foreclosure. These loss miti-gation efforts are expected to result in additional increases in thebalance of modified loans carried on the Firm’s balance sheet,including loans accounted for as troubled debt restructurings, whileminimizing the economic loss to the Firm and assisting homeownersto remain in their homes.
More detailed discussion of the domestic consumer credit environ-ment can be found on pages 103–108 of this Annual Report.
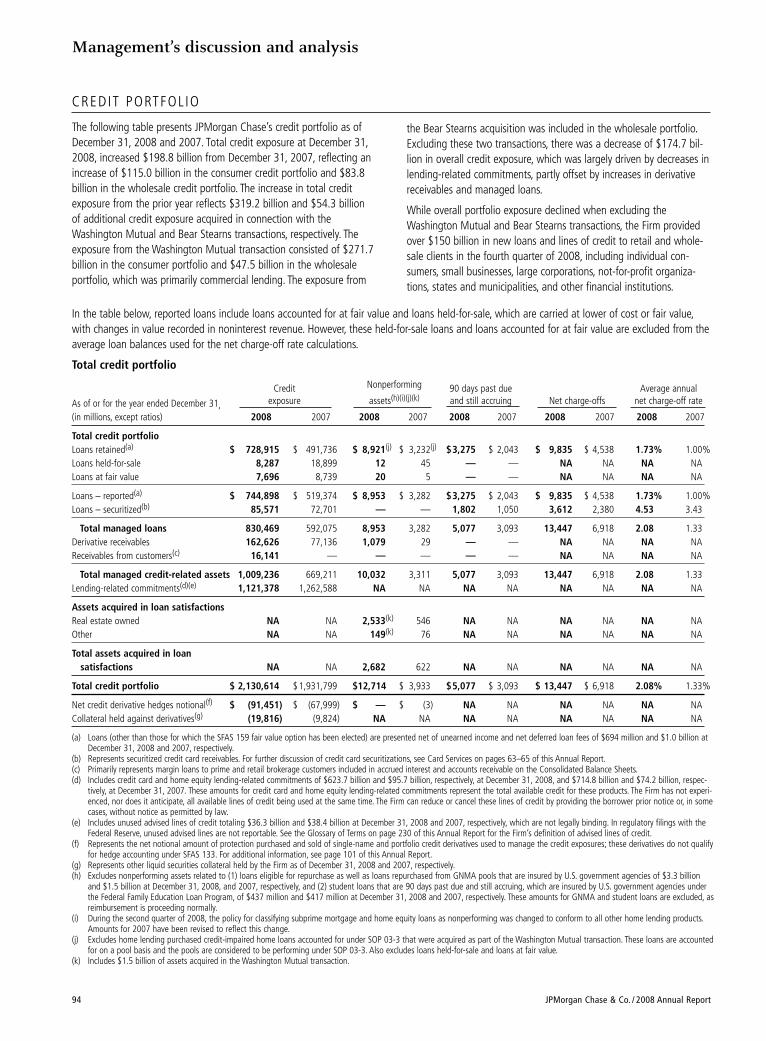
Management’s discussion and analysis
94 JPMorgan Chase & Co. / 2008 Annual Report
CREDIT PORTFOL IO
The following table presents JPMorgan Chase’s credit portfolio as ofDecember 31, 2008 and 2007. Total credit exposure at December 31,2008, increased $198.8 billion from December 31, 2007, reflecting anincrease of $115.0 billion in the consumer credit portfolio and $83.8billion in the wholesale credit portfolio. The increase in total creditexposure from the prior year reflects $319.2 billion and $54.3 billionof additional credit exposure acquired in connection with theWashington Mutual and Bear Stearns transactions, respectively. Theexposure from the Washington Mutual transaction consisted of $271.7billion in the consumer portfolio and $47.5 billion in the wholesaleportfolio, which was primarily commercial lending. The exposure from
the Bear Stearns acquisition was included in the wholesale portfolio.Excluding these two transactions, there was a decrease of $174.7 bil-lion in overall credit exposure, which was largely driven by decreases inlending-related commitments, partly offset by increases in derivativereceivables and managed loans.
While overall portfolio exposure declined when excluding theWashington Mutual and Bear Stearns transactions, the Firm providedover $150 billion in new loans and lines of credit to retail and whole-sale clients in the fourth quarter of 2008, including individual con-sumers, small businesses, large corporations, not-for-profit organiza-tions, states and municipalities, and other financial institutions.
In the table below, reported loans include loans accounted for at fair value and loans held-for-sale, which are carried at lower of cost or fair value,with changes in value recorded in noninterest revenue. However, these held-for-sale loans and loans accounted for at fair value are excluded from theaverage loan balances used for the net charge-off rate calculations.
Total credit portfolio
Credit Nonperforming 90 days past due Average annual
As of or for the year ended December 31, exposure assets(h)(i)(j)(k) and still accruing Net charge-offs net charge-off rate
(in millions, except ratios) 2008 2007 2008 2007 2008 2007 2008 2007 2008 2007
Total credit portfolioLoans retained(a) $ 728,915 $ 491,736 $ 8,921(j) $ 3,232(j) $3,275 $ 2,043 $ 9,835 $ 4,538 1.73% 1.00%Loans held-for-sale 8,287 18,899 12 45 — — NA NA NA NALoans at fair value 7,696 8,739 20 5 — — NA NA NA NA
Loans – reported(a) $ 744,898 $ 519,374 $ 8,953 $ 3,282 $3,275 $ 2,043 $ 9,835 $ 4,538 1.73% 1.00%Loans – securitized(b) 85,571 72,701 — — 1,802 1,050 3,612 2,380 4.53 3.43
Total managed loans 830,469 592,075 8,953 3,282 5,077 3,093 13,447 6,918 2.08 1.33Derivative receivables 162,626 77,136 1,079 29 — — NA NA NA NAReceivables from customers(c) 16,141 — — — — — NA NA NA NA
Total managed credit-related assets 1,009,236 669,211 10,032 3,311 5,077 3,093 13,447 6,918 2.08 1.33Lending-related commitments(d)(e) 1,121,378 1,262,588 NA NA NA NA NA NA NA NA
Assets acquired in loan satisfactionsReal estate owned NA NA 2,533(k) 546 NA NA NA NA NA NAOther NA NA 149(k) 76 NA NA NA NA NA NA
Total assets acquired in loansatisfactions NA NA 2,682 622 NA NA NA NA NA NA
Total credit portfolio $ 2,130,614 $1,931,799 $12,714 $ 3,933 $5,077 $ 3,093 $ 13,447 $ 6,918 2.08% 1.33%
Net credit derivative hedges notional(f) $ (91,451) $ (67,999) $ — $ (3) NA NA NA NA NA NACollateral held against derivatives(g) (19,816) (9,824) NA NA NA NA NA NA NA NA
(a) Loans (other than those for which the SFAS 159 fair value option has been elected) are presented net of unearned income and net deferred loan fees of $694 million and $1.0 billion atDecember 31, 2008 and 2007, respectively.
(b) Represents securitized credit card receivables. For further discussion of credit card securitizations, see Card Services on pages 63–65 of this Annual Report.(c) Primarily represents margin loans to prime and retail brokerage customers included in accrued interest and accounts receivable on the Consolidated Balance Sheets.(d) Includes credit card and home equity lending-related commitments of $623.7 billion and $95.7 billion, respectively, at December 31, 2008, and $714.8 billion and $74.2 billion, respec-
tively, at December 31, 2007. These amounts for credit card and home equity lending-related commitments represent the total available credit for these products. The Firm has not experi-enced, nor does it anticipate, all available lines of credit being used at the same time. The Firm can reduce or cancel these lines of credit by providing the borrower prior notice or, in somecases, without notice as permitted by law.
(e) Includes unused advised lines of credit totaling $36.3 billion and $38.4 billion at December 31, 2008 and 2007, respectively, which are not legally binding. In regulatory filings with theFederal Reserve, unused advised lines are not reportable. See the Glossary of Terms on page 230 of this Annual Report for the Firm’s definition of advised lines of credit.
(f) Represents the net notional amount of protection purchased and sold of single-name and portfolio credit derivatives used to manage the credit exposures; these derivatives do not qualifyfor hedge accounting under SFAS 133. For additional information, see page 101 of this Annual Report.
(g) Represents other liquid securities collateral held by the Firm as of December 31, 2008 and 2007, respectively.(h) Excludes nonperforming assets related to (1) loans eligible for repurchase as well as loans repurchased from GNMA pools that are insured by U.S. government agencies of $3.3 billion
and $1.5 billion at December 31, 2008, and 2007, respectively, and (2) student loans that are 90 days past due and still accruing, which are insured by U.S. government agencies underthe Federal Family Education Loan Program, of $437 million and $417 million at December 31, 2008 and 2007, respectively. These amounts for GNMA and student loans are excluded, asreimbursement is proceeding normally.
(i) During the second quarter of 2008, the policy for classifying subprime mortgage and home equity loans as nonperforming was changed to conform to all other home lending products.Amounts for 2007 have been revised to reflect this change.
(j) Excludes home lending purchased credit-impaired home loans accounted for under SOP 03-3 that were acquired as part of the Washington Mutual transaction. These loans are accountedfor on a pool basis and the pools are considered to be performing under SOP 03-3. Also excludes loans held-for-sale and loans at fair value.
(k) Includes $1.5 billion of assets acquired in the Washington Mutual transaction.
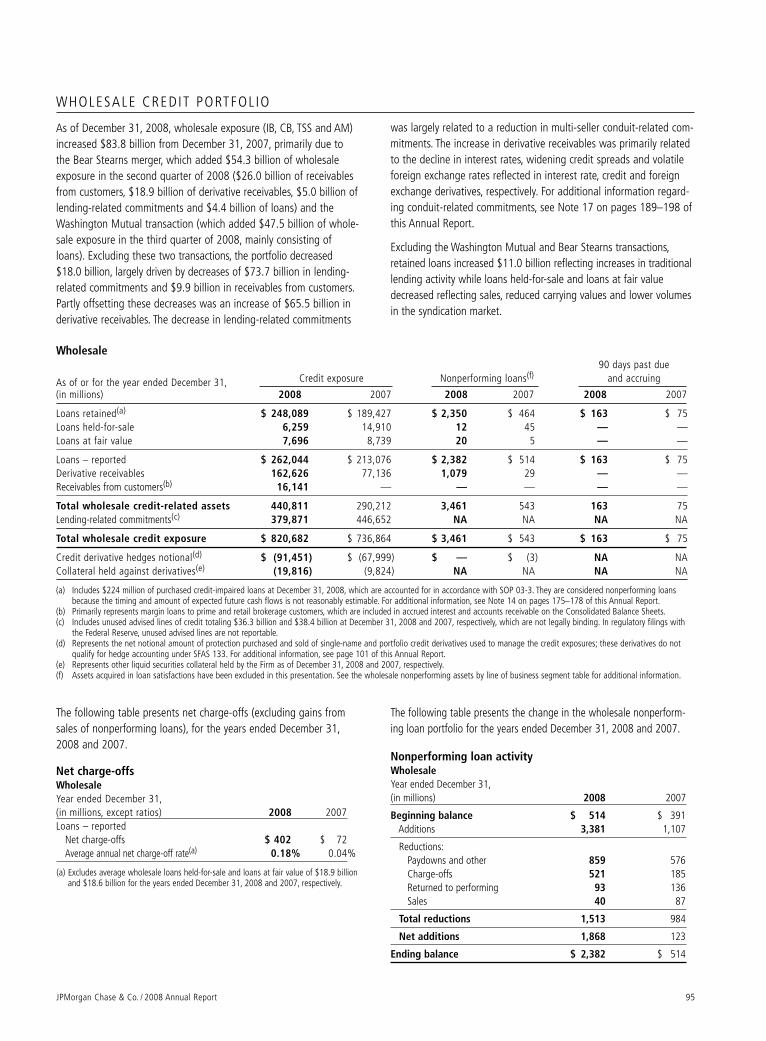
JPMorgan Chase & Co. / 2008 Annual Report 95
WHOLESALE CREDIT PORTFOL IO
As of December 31, 2008, wholesale exposure (IB, CB, TSS and AM)increased $83.8 billion from December 31, 2007, primarily due tothe Bear Stearns merger, which added $54.3 billion of wholesaleexposure in the second quarter of 2008 ($26.0 billion of receivablesfrom customers, $18.9 billion of derivative receivables, $5.0 billion oflending-related commitments and $4.4 billion of loans) and theWashington Mutual transaction (which added $47.5 billion of whole-sale exposure in the third quarter of 2008, mainly consisting ofloans). Excluding these two transactions, the portfolio decreased$18.0 billion, largely driven by decreases of $73.7 billion in lending-related commitments and $9.9 billion in receivables from customers.Partly offsetting these decreases was an increase of $65.5 billion inderivative receivables. The decrease in lending-related commitments
was largely related to a reduction in multi-seller conduit-related com-mitments. The increase in derivative receivables was primarily relatedto the decline in interest rates, widening credit spreads and volatileforeign exchange rates reflected in interest rate, credit and foreignexchange derivatives, respectively. For additional information regard-ing conduit-related commitments, see Note 17 on pages 189–198 ofthis Annual Report.
Excluding the Washington Mutual and Bear Stearns transactions,retained loans increased $11.0 billion reflecting increases in traditionallending activity while loans held-for-sale and loans at fair valuedecreased reflecting sales, reduced carrying values and lower volumesin the syndication market.
Wholesale90 days past due
As of or for the year ended December 31, Credit exposure Nonperforming loans(f) and accruing
(in millions) 2008 2007 2008 2007 2008 2007
Loans retained(a) $ 248,089 $ 189,427 $ 2,350 $ 464 $ 163 $ 75Loans held-for-sale 6,259 14,910 12 45 — —Loans at fair value 7,696 8,739 20 5 — —
Loans – reported $ 262,044 $ 213,076 $ 2,382 $ 514 $ 163 $ 75Derivative receivables 162,626 77,136 1,079 29 — —Receivables from customers(b) 16,141 — — — — —
Total wholesale credit-related assets 440,811 290,212 3,461 543 163 75Lending-related commitments(c) 379,871 446,652 NA NA NA NA
Total wholesale credit exposure $ 820,682 $ 736,864 $ 3,461 $ 543 $ 163 $ 75
Credit derivative hedges notional(d) $ (91,451) $ (67,999) $ — $ (3) NA NACollateral held against derivatives(e) (19,816) (9,824) NA NA NA NA
(a) Includes $224 million of purchased credit-impaired loans at December 31, 2008, which are accounted for in accordance with SOP 03-3. They are considered nonperforming loansbecause the timing and amount of expected future cash flows is not reasonably estimable. For additional information, see Note 14 on pages 175–178 of this Annual Report.
(b) Primarily represents margin loans to prime and retail brokerage customers, which are included in accrued interest and accounts receivable on the Consolidated Balance Sheets.(c) Includes unused advised lines of credit totaling $36.3 billion and $38.4 billion at December 31, 2008 and 2007, respectively, which are not legally binding. In regulatory filings with
the Federal Reserve, unused advised lines are not reportable.(d) Represents the net notional amount of protection purchased and sold of single-name and portfolio credit derivatives used to manage the credit exposures; these derivatives do not
qualify for hedge accounting under SFAS 133. For additional information, see page 101 of this Annual Report.(e) Represents other liquid securities collateral held by the Firm as of December 31, 2008 and 2007, respectively.(f) Assets acquired in loan satisfactions have been excluded in this presentation. See the wholesale nonperforming assets by line of business segment table for additional information.
The following table presents net charge-offs (excluding gains fromsales of nonperforming loans), for the years ended December 31,2008 and 2007.
Net charge-offs WholesaleYear ended December 31,(in millions, except ratios) 2008 2007Loans – reported
Net charge-offs $ 402 $ 72Average annual net charge-off rate(a) 0.18% 0.04%
(a) Excludes average wholesale loans held-for-sale and loans at fair value of $18.9 billionand $18.6 billion for the years ended December 31, 2008 and 2007, respectively.
The following table presents the change in the wholesale nonperform-ing loan portfolio for the years ended December 31, 2008 and 2007.
Nonperforming loan activityWholesaleYear ended December 31,(in millions) 2008 2007
Beginning balance $ 514 $ 391Additions 3,381 1,107
Reductions:Paydowns and other 859 576Charge-offs 521 185Returned to performing 93 136Sales 40 87
Total reductions 1,513 984
Net additions 1,868 123
Ending balance $ 2,382 $ 514
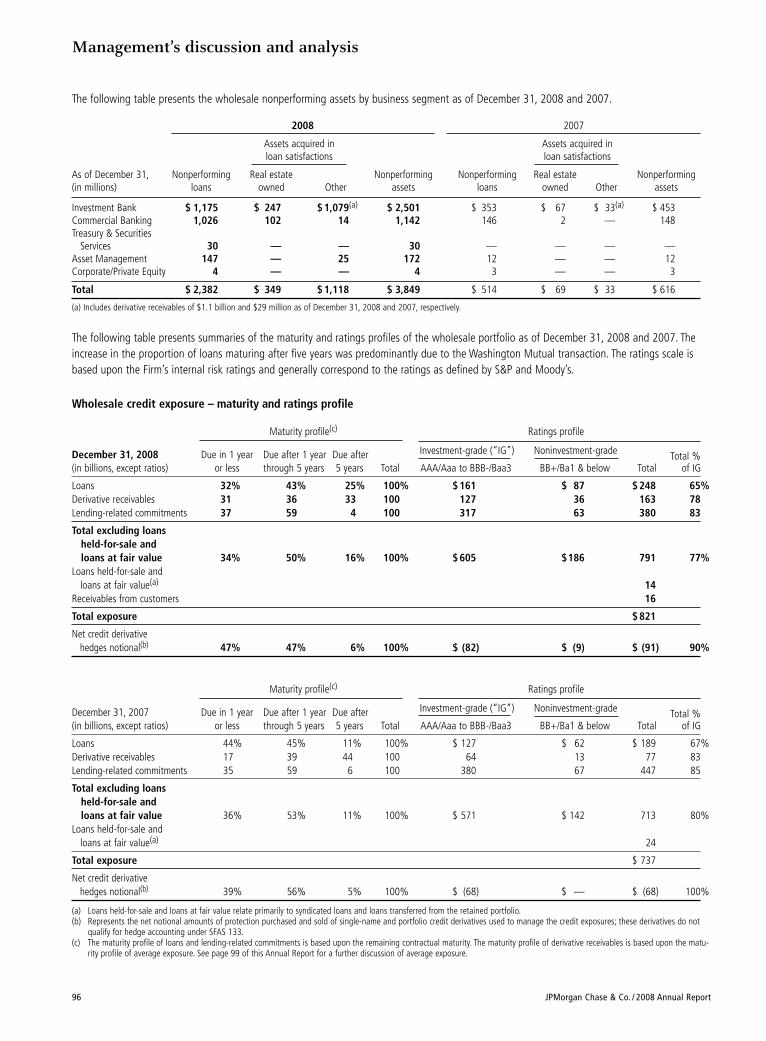
Management’s discussion and analysis
96 JPMorgan Chase & Co. / 2008 Annual Report
The following table presents the wholesale nonperforming assets by business segment as of December 31, 2008 and 2007.
2008 2007
Assets acquired in Assets acquired inloan satisfactions loan satisfactions
As of December 31, Nonperforming Real estate Nonperforming Nonperforming Real estate Nonperforming (in millions) loans owned Other assets loans owned Other assets
Investment Bank $ 1,175 $ 247 $ 1,079(a) $ 2,501 $ 353 $ 67 $ 33(a) $ 453Commercial Banking 1,026 102 14 1,142 146 2 — 148Treasury & Securities
Services 30 — — 30 — — — —Asset Management 147 — 25 172 12 — — 12Corporate/Private Equity 4 — — 4 3 — — 3
Total $ 2,382 $ 349 $ 1,118 $ 3,849 $ 514 $ 69 $ 33 $ 616
(a) Includes derivative receivables of $1.1 billion and $29 million as of December 31, 2008 and 2007, respectively.
Wholesale credit exposure – maturity and ratings profile
Maturity profile(c) Ratings profile
December 31, 2008 Due in 1 year Due after 1 year Due after Investment-grade (“IG”) Noninvestment-grade Total %(in billions, except ratios) or less through 5 years 5 years Total AAA/Aaa to BBB-/Baa3 BB+/Ba1 & below Total of IG
Loans 32% 43% 25% 100% $ 161 $ 87 $ 248 65%Derivative receivables 31 36 33 100 127 36 163 78Lending-related commitments 37 59 4 100 317 63 380 83
Total excluding loans held-for-sale andloans at fair value 34% 50% 16% 100% $ 605 $186 791 77%
Loans held-for-sale and loans at fair value(a) 14
Receivables from customers 16
Total exposure $ 821
Net credit derivative hedges notional(b) 47% 47% 6% 100% $ (82) $ (9) $ (91) 90%
Maturity profile(c) Ratings profile
December 31, 2007 Due in 1 year Due after 1 year Due after Investment-grade (“IG”) Noninvestment-grade Total %(in billions, except ratios) or less through 5 years 5 years Total AAA/Aaa to BBB-/Baa3 BB+/Ba1 & below Total of IG
Loans 44% 45% 11% 100% $ 127 $ 62 $ 189 67%Derivative receivables 17 39 44 100 64 13 77 83Lending-related commitments 35 59 6 100 380 67 447 85
Total excluding loans held-for-sale andloans at fair value 36% 53% 11% 100% $ 571 $ 142 713 80%
Loans held-for-sale and loans at fair value(a) 24
Total exposure $ 737
Net credit derivative hedges notional(b) 39% 56% 5% 100% $ (68) $ — $ (68) 100%
(a) Loans held-for-sale and loans at fair value relate primarily to syndicated loans and loans transferred from the retained portfolio.(b) Represents the net notional amounts of protection purchased and sold of single-name and portfolio credit derivatives used to manage the credit exposures; these derivatives do not
qualify for hedge accounting under SFAS 133.(c) The maturity profile of loans and lending-related commitments is based upon the remaining contractual maturity. The maturity profile of derivative receivables is based upon the matu-
rity profile of average exposure. See page 99 of this Annual Report for a further discussion of average exposure.
The following table presents summaries of the maturity and ratings profiles of the wholesale portfolio as of December 31, 2008 and 2007. Theincrease in the proportion of loans maturing after five years was predominantly due to the Washington Mutual transaction. The ratings scale isbased upon the Firm’s internal risk ratings and generally correspond to the ratings as defined by S&P and Moody’s.
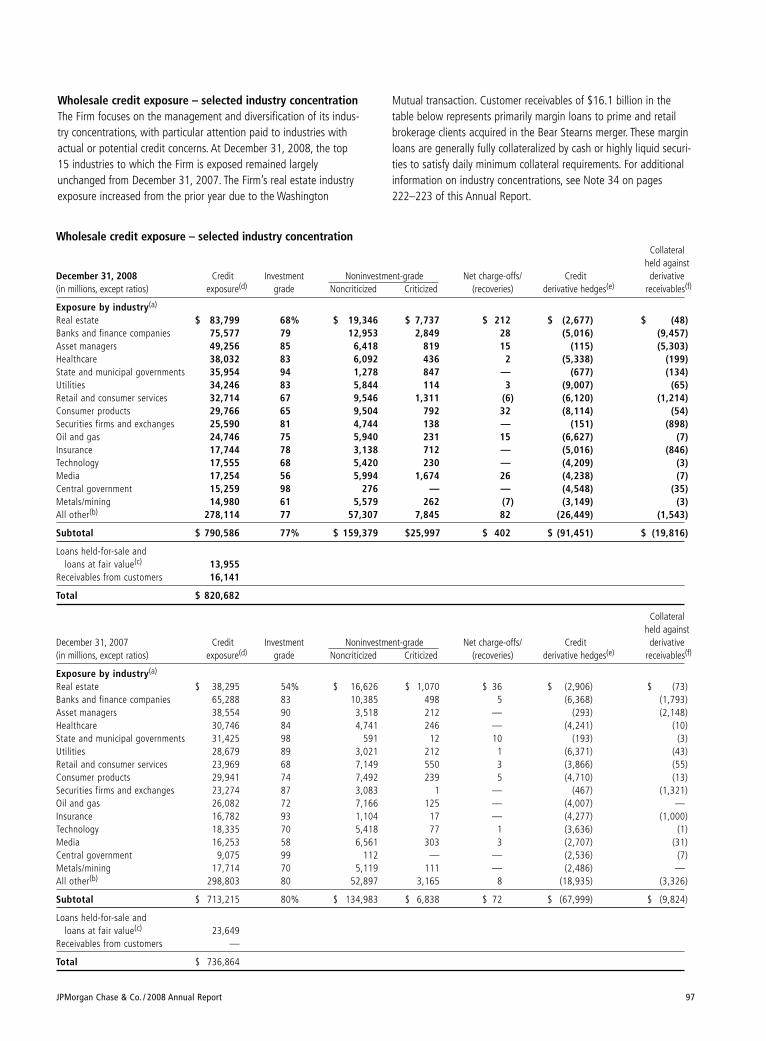
Wholesale credit exposure – selected industry concentrationCollateral
held againstDecember 31, 2008 Credit Investment Noninvestment-grade Net charge-offs/ Credit derivative(in millions, except ratios) exposure(d) grade Noncriticized Criticized (recoveries) derivative hedges(e) receivables(f)
Exposure by industry(a)
Real estate $ 83,799 68% $ 19,346 $ 7,737 $ 212 $ (2,677) $ (48)Banks and finance companies 75,577 79 12,953 2,849 28 (5,016) (9,457)Asset managers 49,256 85 6,418 819 15 (115) (5,303)Healthcare 38,032 83 6,092 436 2 (5,338) (199)State and municipal governments 35,954 94 1,278 847 — (677) (134)Utilities 34,246 83 5,844 114 3 (9,007) (65)Retail and consumer services 32,714 67 9,546 1,311 (6) (6,120) (1,214)Consumer products 29,766 65 9,504 792 32 (8,114) (54)Securities firms and exchanges 25,590 81 4,744 138 — (151) (898)Oil and gas 24,746 75 5,940 231 15 (6,627) (7)Insurance 17,744 78 3,138 712 — (5,016) (846)Technology 17,555 68 5,420 230 — (4,209) (3)Media 17,254 56 5,994 1,674 26 (4,238) (7)Central government 15,259 98 276 — — (4,548) (35)Metals/mining 14,980 61 5,579 262 (7) (3,149) (3)All other(b) 278,114 77 57,307 7,845 82 (26,449) (1,543)
Subtotal $ 790,586 77% $ 159,379 $25,997 $ 402 $ (91,451) $ (19,816)
Loans held-for-sale and loans at fair value(c) 13,955
Receivables from customers 16,141
Total $ 820,682
Collateralheld against
December 31, 2007 Credit Investment Noninvestment-grade Net charge-offs/ Credit derivative(in millions, except ratios) exposure(d) grade Noncriticized Criticized (recoveries) derivative hedges(e) receivables(f)
Exposure by industry(a)
Real estate $ 38,295 54% $ 16,626 $ 1,070 $ 36 $ (2,906) $ (73)Banks and finance companies 65,288 83 10,385 498 5 (6,368) (1,793)Asset managers 38,554 90 3,518 212 — (293) (2,148)Healthcare 30,746 84 4,741 246 — (4,241) (10)State and municipal governments 31,425 98 591 12 10 (193) (3)Utilities 28,679 89 3,021 212 1 (6,371) (43)Retail and consumer services 23,969 68 7,149 550 3 (3,866) (55)Consumer products 29,941 74 7,492 239 5 (4,710) (13)Securities firms and exchanges 23,274 87 3,083 1 — (467) (1,321)Oil and gas 26,082 72 7,166 125 — (4,007) —Insurance 16,782 93 1,104 17 — (4,277) (1,000)Technology 18,335 70 5,418 77 1 (3,636) (1)Media 16,253 58 6,561 303 3 (2,707) (31)Central government 9,075 99 112 — — (2,536) (7)Metals/mining 17,714 70 5,119 111 — (2,486) —All other(b) 298,803 80 52,897 3,165 8 (18,935) (3,326)
Subtotal $ 713,215 80% $ 134,983 $ 6,838 $ 72 $ (67,999) $ (9,824)
Loans held-for-sale and loans at fair value(c) 23,649
Receivables from customers —
Total $ 736,864
JPMorgan Chase & Co. / 2008 Annual Report 97
Wholesale credit exposure – selected industry concentrationThe Firm focuses on the management and diversification of its indus-try concentrations, with particular attention paid to industries withactual or potential credit concerns. At December 31, 2008, the top15 industries to which the Firm is exposed remained largelyunchanged from December 31, 2007. The Firm’s real estate industryexposure increased from the prior year due to the Washington
Mutual transaction. Customer receivables of $16.1 billion in thetable below represents primarily margin loans to prime and retailbrokerage clients acquired in the Bear Stearns merger. These marginloans are generally fully collateralized by cash or highly liquid securi-ties to satisfy daily minimum collateral requirements. For additionalinformation on industry concentrations, see Note 34 on pages222–223 of this Annual Report.
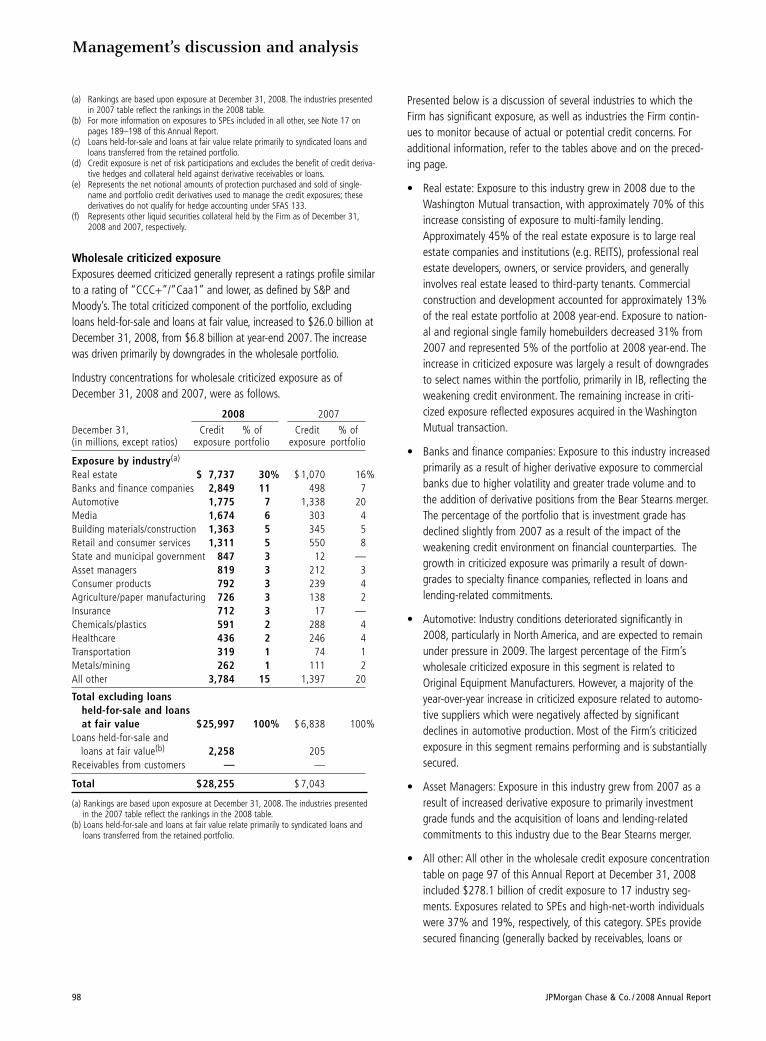
Management’s discussion and analysis
98 JPMorgan Chase & Co. / 2008 Annual Report
(a) Rankings are based upon exposure at December 31, 2008. The industries presentedin 2007 table reflect the rankings in the 2008 table.
(b) For more information on exposures to SPEs included in all other, see Note 17 onpages 189–198 of this Annual Report.
(c) Loans held-for-sale and loans at fair value relate primarily to syndicated loans andloans transferred from the retained portfolio.
(d) Credit exposure is net of risk participations and excludes the benefit of credit deriva-tive hedges and collateral held against derivative receivables or loans.
(e) Represents the net notional amounts of protection purchased and sold of single-name and portfolio credit derivatives used to manage the credit exposures; thesederivatives do not qualify for hedge accounting under SFAS 133.
(f) Represents other liquid securities collateral held by the Firm as of December 31,2008 and 2007, respectively.
Wholesale criticized exposureExposures deemed criticized generally represent a ratings profile similarto a rating of “CCC+”/”Caa1” and lower, as defined by S&P andMoody’s. The total criticized component of the portfolio, excludingloans held-for-sale and loans at fair value, increased to $26.0 billion atDecember 31, 2008, from $6.8 billion at year-end 2007. The increasewas driven primarily by downgrades in the wholesale portfolio.
Industry concentrations for wholesale criticized exposure as ofDecember 31, 2008 and 2007, were as follows.
2008 2007
December 31, Credit % of Credit % of(in millions, except ratios) exposure portfolio exposure portfolio
Exposure by industry(a)
Real estate $ 7,737 30% $ 1,070 16%Banks and finance companies 2,849 11 498 7Automotive 1,775 7 1,338 20Media 1,674 6 303 4Building materials/construction 1,363 5 345 5Retail and consumer services 1,311 5 550 8State and municipal government 847 3 12 —Asset managers 819 3 212 3Consumer products 792 3 239 4Agriculture/paper manufacturing 726 3 138 2Insurance 712 3 17 —Chemicals/plastics 591 2 288 4Healthcare 436 2 246 4Transportation 319 1 74 1Metals/mining 262 1 111 2All other 3,784 15 1,397 20
Total excluding loansheld-for-sale and loansat fair value $25,997 100% $ 6,838 100%
Loans held-for-sale and loans at fair value(b) 2,258 205
Receivables from customers — —
Total $28,255 $ 7,043
(a) Rankings are based upon exposure at December 31, 2008. The industries presentedin the 2007 table reflect the rankings in the 2008 table.
(b) Loans held-for-sale and loans at fair value relate primarily to syndicated loans andloans transferred from the retained portfolio.
Presented below is a discussion of several industries to which theFirm has significant exposure, as well as industries the Firm contin-ues to monitor because of actual or potential credit concerns. Foradditional information, refer to the tables above and on the preced-ing page.
• Real estate: Exposure to this industry grew in 2008 due to theWashington Mutual transaction, with approximately 70% of thisincrease consisting of exposure to multi-family lending.Approximately 45% of the real estate exposure is to large realestate companies and institutions (e.g. REITS), professional realestate developers, owners, or service providers, and generallyinvolves real estate leased to third-party tenants. Commercialconstruction and development accounted for approximately 13%of the real estate portfolio at 2008 year-end. Exposure to nation-al and regional single family homebuilders decreased 31% from2007 and represented 5% of the portfolio at 2008 year-end. Theincrease in criticized exposure was largely a result of downgradesto select names within the portfolio, primarily in IB, reflecting theweakening credit environment. The remaining increase in criti-cized exposure reflected exposures acquired in the WashingtonMutual transaction.
• Banks and finance companies: Exposure to this industry increasedprimarily as a result of higher derivative exposure to commercialbanks due to higher volatility and greater trade volume and tothe addition of derivative positions from the Bear Stearns merger.The percentage of the portfolio that is investment grade hasdeclined slightly from 2007 as a result of the impact of theweakening credit environment on financial counterparties. Thegrowth in criticized exposure was primarily a result of down-grades to specialty finance companies, reflected in loans andlending-related commitments.
• Automotive: Industry conditions deteriorated significantly in2008, particularly in North America, and are expected to remainunder pressure in 2009. The largest percentage of the Firm’swholesale criticized exposure in this segment is related toOriginal Equipment Manufacturers. However, a majority of theyear-over-year increase in criticized exposure related to automo-tive suppliers which were negatively affected by significantdeclines in automotive production. Most of the Firm’s criticizedexposure in this segment remains performing and is substantiallysecured.
• Asset Managers: Exposure in this industry grew from 2007 as aresult of increased derivative exposure to primarily investmentgrade funds and the acquisition of loans and lending-relatedcommitments to this industry due to the Bear Stearns merger.
• All other: All other in the wholesale credit exposure concentrationtable on page 97 of this Annual Report at December 31, 2008included $278.1 billion of credit exposure to 17 industry seg-ments. Exposures related to SPEs and high-net-worth individualswere 37% and 19%, respectively, of this category. SPEs providesecured financing (generally backed by receivables, loans or
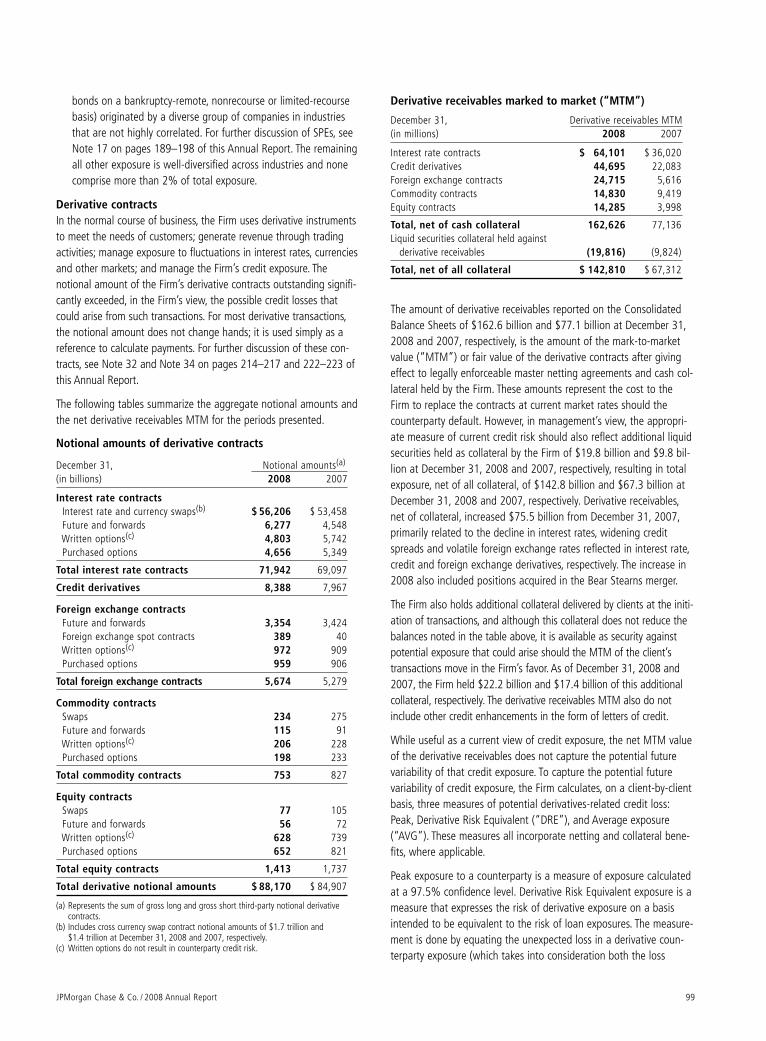
JPMorgan Chase & Co. / 2008 Annual Report 99
bonds on a bankruptcy-remote, nonrecourse or limited-recoursebasis) originated by a diverse group of companies in industriesthat are not highly correlated. For further discussion of SPEs, seeNote 17 on pages 189–198 of this Annual Report. The remainingall other exposure is well-diversified across industries and nonecomprise more than 2% of total exposure.
Derivative contractsIn the normal course of business, the Firm uses derivative instrumentsto meet the needs of customers; generate revenue through tradingactivities; manage exposure to fluctuations in interest rates, currenciesand other markets; and manage the Firm’s credit exposure. Thenotional amount of the Firm’s derivative contracts outstanding signifi-cantly exceeded, in the Firm’s view, the possible credit losses thatcould arise from such transactions. For most derivative transactions,the notional amount does not change hands; it is used simply as areference to calculate payments. For further discussion of these con-tracts, see Note 32 and Note 34 on pages 214–217 and 222–223 ofthis Annual Report.
The following tables summarize the aggregate notional amounts andthe net derivative receivables MTM for the periods presented.
Notional amounts of derivative contracts
December 31, Notional amounts(a)
(in billions) 2008 2007
Interest rate contractsInterest rate and currency swaps(b) $ 56,206 $ 53,458Future and forwards 6,277 4,548Written options(c) 4,803 5,742Purchased options 4,656 5,349
Total interest rate contracts 71,942 69,097
Credit derivatives 8,388 7,967
Foreign exchange contractsFuture and forwards 3,354 3,424Foreign exchange spot contracts 389 40Written options(c) 972 909Purchased options 959 906
Total foreign exchange contracts 5,674 5,279
Commodity contractsSwaps 234 275Future and forwards 115 91Written options(c) 206 228Purchased options 198 233
Total commodity contracts 753 827
Equity contractsSwaps 77 105Future and forwards 56 72Written options(c) 628 739Purchased options 652 821
Total equity contracts 1,413 1,737
Total derivative notional amounts $ 88,170 $ 84,907
(a) Represents the sum of gross long and gross short third-party notional derivative contracts.
(b) Includes cross currency swap contract notional amounts of $1.7 trillion and $1.4 trillion at December 31, 2008 and 2007, respectively.
(c) Written options do not result in counterparty credit risk.
Derivative receivables marked to market (“MTM”)
December 31, Derivative receivables MTM(in millions) 2008 2007
Interest rate contracts $ 64,101 $ 36,020Credit derivatives 44,695 22,083Foreign exchange contracts 24,715 5,616Commodity contracts 14,830 9,419Equity contracts 14,285 3,998
Total, net of cash collateral 162,626 77,136Liquid securities collateral held against
derivative receivables (19,816) (9,824)
Total, net of all collateral $ 142,810 $ 67,312
The amount of derivative receivables reported on the ConsolidatedBalance Sheets of $162.6 billion and $77.1 billion at December 31,2008 and 2007, respectively, is the amount of the mark-to-marketvalue (“MTM”) or fair value of the derivative contracts after givingeffect to legally enforceable master netting agreements and cash col-lateral held by the Firm. These amounts represent the cost to theFirm to replace the contracts at current market rates should thecounterparty default. However, in management’s view, the appropri-ate measure of current credit risk should also reflect additional liquidsecurities held as collateral by the Firm of $19.8 billion and $9.8 bil-lion at December 31, 2008 and 2007, respectively, resulting in totalexposure, net of all collateral, of $142.8 billion and $67.3 billion atDecember 31, 2008 and 2007, respectively. Derivative receivables,net of collateral, increased $75.5 billion from December 31, 2007,primarily related to the decline in interest rates, widening creditspreads and volatile foreign exchange rates reflected in interest rate,credit and foreign exchange derivatives, respectively. The increase in2008 also included positions acquired in the Bear Stearns merger.
The Firm also holds additional collateral delivered by clients at the initi-ation of transactions, and although this collateral does not reduce thebalances noted in the table above, it is available as security againstpotential exposure that could arise should the MTM of the client’stransactions move in the Firm’s favor. As of December 31, 2008 and2007, the Firm held $22.2 billion and $17.4 billion of this additionalcollateral, respectively. The derivative receivables MTM also do notinclude other credit enhancements in the form of letters of credit.
While useful as a current view of credit exposure, the net MTM valueof the derivative receivables does not capture the potential futurevariability of that credit exposure. To capture the potential futurevariability of credit exposure, the Firm calculates, on a client-by-clientbasis, three measures of potential derivatives-related credit loss:Peak, Derivative Risk Equivalent (“DRE”), and Average exposure(“AVG”). These measures all incorporate netting and collateral bene-fits, where applicable.
Peak exposure to a counterparty is a measure of exposure calculatedat a 97.5% confidence level. Derivative Risk Equivalent exposure is ameasure that expresses the risk of derivative exposure on a basisintended to be equivalent to the risk of loan exposures. The measure-ment is done by equating the unexpected loss in a derivative coun-terparty exposure (which takes into consideration both the loss
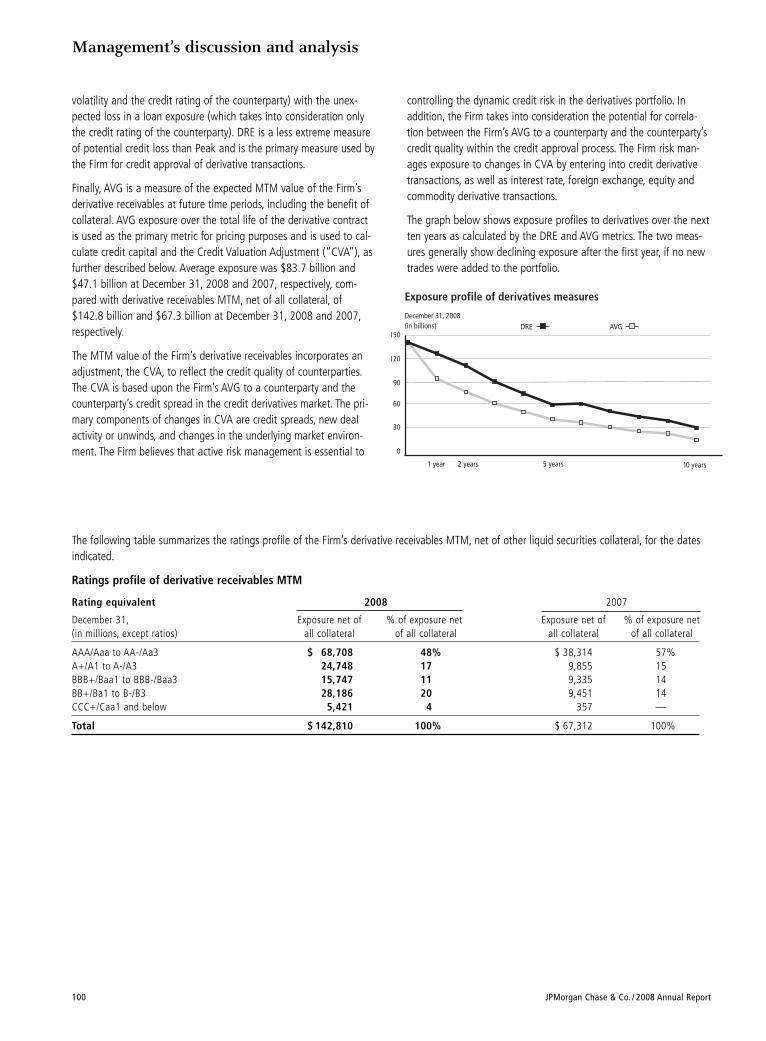
Management’s discussion and analysis
100 JPMorgan Chase & Co. / 2008 Annual Report
volatility and the credit rating of the counterparty) with the unex-pected loss in a loan exposure (which takes into consideration onlythe credit rating of the counterparty). DRE is a less extreme measureof potential credit loss than Peak and is the primary measure used bythe Firm for credit approval of derivative transactions.
Finally, AVG is a measure of the expected MTM value of the Firm’sderivative receivables at future time periods, including the benefit ofcollateral. AVG exposure over the total life of the derivative contractis used as the primary metric for pricing purposes and is used to cal-culate credit capital and the Credit Valuation Adjustment (“CVA”), asfurther described below. Average exposure was $83.7 billion and$47.1 billion at December 31, 2008 and 2007, respectively, com-pared with derivative receivables MTM, net of all collateral, of$142.8 billion and $67.3 billion at December 31, 2008 and 2007,respectively.
The MTM value of the Firm’s derivative receivables incorporates anadjustment, the CVA, to reflect the credit quality of counterparties.The CVA is based upon the Firm’s AVG to a counterparty and thecounterparty’s credit spread in the credit derivatives market. The pri-mary components of changes in CVA are credit spreads, new dealactivity or unwinds, and changes in the underlying market environ-ment. The Firm believes that active risk management is essential to
controlling the dynamic credit risk in the derivatives portfolio. Inaddition, the Firm takes into consideration the potential for correla-tion between the Firm’s AVG to a counterparty and the counterparty’scredit quality within the credit approval process. The Firm risk man-ages exposure to changes in CVA by entering into credit derivativetransactions, as well as interest rate, foreign exchange, equity andcommodity derivative transactions.
The graph below shows exposure profiles to derivatives over the nextten years as calculated by the DRE and AVG metrics. The two meas-ures generally show declining exposure after the first year, if no newtrades were added to the portfolio.
0
30
60
90
120
150
Exposure profile of derivatives measures
December 31, 2008(in billions) DRE AVG
1 year 2 years 5 years 10 years
The following table summarizes the ratings profile of the Firm’s derivative receivables MTM, net of other liquid securities collateral, for the datesindicated.
Ratings profile of derivative receivables MTM
Rating equivalent 2008 2007
December 31, Exposure net of % of exposure net Exposure net of % of exposure net (in millions, except ratios) all collateral of all collateral all collateral of all collateral
AAA/Aaa to AA-/Aa3 $ 68,708 48% $ 38,314 57%A+/A1 to A-/A3 24,748 17 9,855 15BBB+/Baa1 to BBB-/Baa3 15,747 11 9,335 14BB+/Ba1 to B-/B3 28,186 20 9,451 14CCC+/Caa1 and below 5,421 4 357 —
Total $ 142,810 100% $ 67,312 100%
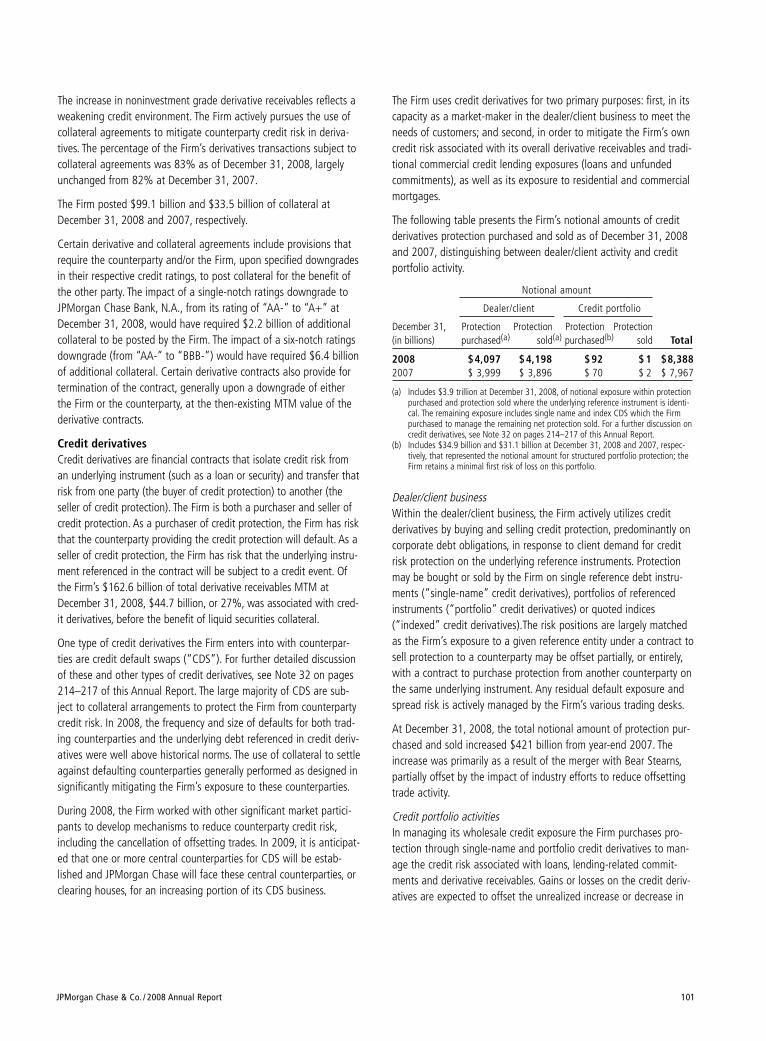
JPMorgan Chase & Co. / 2008 Annual Report 101
The increase in noninvestment grade derivative receivables reflects aweakening credit environment. The Firm actively pursues the use ofcollateral agreements to mitigate counterparty credit risk in deriva-tives. The percentage of the Firm’s derivatives transactions subject tocollateral agreements was 83% as of December 31, 2008, largelyunchanged from 82% at December 31, 2007.
The Firm posted $99.1 billion and $33.5 billion of collateral atDecember 31, 2008 and 2007, respectively.
Certain derivative and collateral agreements include provisions thatrequire the counterparty and/or the Firm, upon specified downgradesin their respective credit ratings, to post collateral for the benefit ofthe other party. The impact of a single-notch ratings downgrade toJPMorgan Chase Bank, N.A., from its rating of “AA-” to “A+” atDecember 31, 2008, would have required $2.2 billion of additionalcollateral to be posted by the Firm. The impact of a six-notch ratingsdowngrade (from “AA-” to “BBB-”) would have required $6.4 billionof additional collateral. Certain derivative contracts also provide fortermination of the contract, generally upon a downgrade of eitherthe Firm or the counterparty, at the then-existing MTM value of thederivative contracts.
Credit derivatives Credit derivatives are financial contracts that isolate credit risk froman underlying instrument (such as a loan or security) and transfer thatrisk from one party (the buyer of credit protection) to another (theseller of credit protection). The Firm is both a purchaser and seller ofcredit protection. As a purchaser of credit protection, the Firm has riskthat the counterparty providing the credit protection will default. As aseller of credit protection, the Firm has risk that the underlying instru-ment referenced in the contract will be subject to a credit event. Ofthe Firm’s $162.6 billion of total derivative receivables MTM atDecember 31, 2008, $44.7 billion, or 27%, was associated with cred-it derivatives, before the benefit of liquid securities collateral.
One type of credit derivatives the Firm enters into with counterpar-ties are credit default swaps (“CDS”). For further detailed discussionof these and other types of credit derivatives, see Note 32 on pages214–217 of this Annual Report. The large majority of CDS are sub-ject to collateral arrangements to protect the Firm from counterpartycredit risk. In 2008, the frequency and size of defaults for both trad-ing counterparties and the underlying debt referenced in credit deriv-atives were well above historical norms. The use of collateral to settleagainst defaulting counterparties generally performed as designed insignificantly mitigating the Firm’s exposure to these counterparties.
During 2008, the Firm worked with other significant market partici-pants to develop mechanisms to reduce counterparty credit risk,including the cancellation of offsetting trades. In 2009, it is anticipat-ed that one or more central counterparties for CDS will be estab-lished and JPMorgan Chase will face these central counterparties, orclearing houses, for an increasing portion of its CDS business.
The Firm uses credit derivatives for two primary purposes: first, in itscapacity as a market-maker in the dealer/client business to meet theneeds of customers; and second, in order to mitigate the Firm’s owncredit risk associated with its overall derivative receivables and tradi-tional commercial credit lending exposures (loans and unfundedcommitments), as well as its exposure to residential and commercialmortgages.
The following table presents the Firm’s notional amounts of creditderivatives protection purchased and sold as of December 31, 2008and 2007, distinguishing between dealer/client activity and creditportfolio activity.
Notional amount
Dealer/client Credit portfolio
December 31, Protection Protection Protection Protection(in billions) purchased(a) sold(a) purchased(b) sold Total
2008 $4,097 $4,198 $ 92 $ 1 $8,3882007 $ 3,999 $ 3,896 $ 70 $ 2 $ 7,967
(a) Includes $3.9 trillion at December 31, 2008, of notional exposure within protectionpurchased and protection sold where the underlying reference instrument is identi-cal. The remaining exposure includes single name and index CDS which the Firmpurchased to manage the remaining net protection sold. For a further discussion oncredit derivatives, see Note 32 on pages 214–217 of this Annual Report.
(b) Includes $34.9 billion and $31.1 billion at December 31, 2008 and 2007, respec-tively, that represented the notional amount for structured portfolio protection; theFirm retains a minimal first risk of loss on this portfolio.
Dealer/client businessWithin the dealer/client business, the Firm actively utilizes creditderivatives by buying and selling credit protection, predominantly oncorporate debt obligations, in response to client demand for creditrisk protection on the underlying reference instruments. Protectionmay be bought or sold by the Firm on single reference debt instru-ments (“single-name” credit derivatives), portfolios of referencedinstruments (“portfolio” credit derivatives) or quoted indices(“indexed” credit derivatives).The risk positions are largely matchedas the Firm’s exposure to a given reference entity under a contract tosell protection to a counterparty may be offset partially, or entirely,with a contract to purchase protection from another counterparty onthe same underlying instrument. Any residual default exposure andspread risk is actively managed by the Firm’s various trading desks.
At December 31, 2008, the total notional amount of protection pur-chased and sold increased $421 billion from year-end 2007. Theincrease was primarily as a result of the merger with Bear Stearns,partially offset by the impact of industry efforts to reduce offsettingtrade activity.
Credit portfolio activitiesIn managing its wholesale credit exposure the Firm purchases pro-tection through single-name and portfolio credit derivatives to man-age the credit risk associated with loans, lending-related commit-ments and derivative receivables. Gains or losses on the credit deriv-atives are expected to offset the unrealized increase or decrease in
Management’s discussion and analysis
102 JPMorgan Chase & Co. / 2008 Annual Report
credit risk on the loans, lending-related commitments or derivativereceivables. This activity does not reduce the reported level of assetson the balance sheet or the level of reported off-balance sheet com-mitments, though it does provide the Firm with credit risk protection.The Firm also diversifies its exposures by selling credit protection,which increases exposure to industries or clients where the Firm haslittle or no client-related exposure, however, this activity is not mate-rial to the Firm’s overall credit exposure.
Use of single-name and portfolio credit derivatives
December 31, Notional amount of protection purchased
(in millions) 2008 2007
Credit derivatives used to manage:Loans and lending-related commitments $ 81,227 $ 63,645Derivative receivables 10,861 6,462
Total(a) $ 92,088 $ 70,107
(a) Included $34.9 billion and $31.1 billion at December 31, 2008 and 2007, respective-ly, that represented the notional amount for structured portfolio protection; the Firmretains a first risk of loss on this portfolio.
The credit derivatives used by JPMorgan Chase for credit portfoliomanagement activities do not qualify for hedge accounting underSFAS 133, and therefore, effectiveness testing under SFAS 133 is notperformed. Loan interest and fees are generally recognized in netinterest income, and impairment is recognized in the provision forcredit losses. This asymmetry in accounting treatment between loansand lending-related commitments and the credit derivatives utilizedin credit portfolio management activities causes earnings volatilitythat is not representative, in the Firm’s view, of the true changes invalue of the Firm’s overall credit exposure. The MTM related to theFirm’s credit derivatives used for managing credit exposure, as wellas the MTM related to the CVA, which reflects the credit quality ofderivatives counterparty exposure, are included in the table below.These results can vary from period to period due to market condi-tions that impact specific positions in the portfolio. For a further dis-cussion of credit derivatives, see Note 32 on pages 214–217 of thisAnnual Report.
Year ended December 31,(in millions) 2008 2007 2006
Hedges of lending-related commitments(a) $ 2,216 $ 350 $ (246)CVA and hedges of CVA(a) (2,359) (363) 133
Net gains (losses)(b) $ (143) $ (13) $ (113)
(a) These hedges do not qualify for hedge accounting under SFAS 133.(b) Excludes gains of $530 million, $373 million and $56 million for the years ended
December 31, 2008, 2007 and 2006, respectively, of other principal transactions rev-enue that are not associated with hedging activities. The amount for 2008 and 2007incorporates an adjustment to the valuation of the Firm’s derivative liabilities as aresult of the adoption of SFAS 157 on January 1, 2007.
The Firm also actively manages wholesale credit exposure through IBand CB loan and commitment sales. During 2008, 2007 and 2006,these sales of $3.9 billion, $4.9 billion and $4.0 billion of loans andcommitments, respectively, resulted in losses of $41 million and $7million in 2008 and 2007 and gains of $83 million in 2006, respec-
tively. These results include gains on sales of nonperforming loans, asdiscussed on page 95 of this Annual Report. These activities are notrelated to the Firm’s securitization activities, which are undertakenfor liquidity and balance sheet management purposes. For a furtherdiscussion of securitization activity, see Liquidity Risk Managementand Note 16 on pages 88–92 and 180–188, respectively, of thisAnnual Report.
Lending-related commitmentsWholesale lending-related commitments were $379.9 billion atDecember 31, 2008, compared with $446.7 billion at December 31,2007. The decrease was largely related to a reduction in multi-sellerconduit-related commitments. In the Firm’s view, the total contractualamount of these instruments is not representative of the Firm’s actualcredit risk exposure or funding requirements. In determining theamount of credit risk exposure the Firm has to wholesale lending-related commitments, which is used as the basis for allocating creditrisk capital to these instruments, the Firm has established a “loan-equivalent” amount for each commitment; this amount representsthe portion of the unused commitment or other contingent exposurethat is expected, based upon average portfolio historical experience,to become outstanding in the event of a default by an obligor. Theloan-equivalent amount of the Firm’s lending-related commitmentswas $204.3 billion and $238.7 billion as of December 31, 2008 and2007, respectively.
Emerging markets country exposureThe Firm has a comprehensive internal process for measuring andmanaging exposures to emerging markets countries. There is no com-mon definition of emerging markets but the Firm generally, thoughnot exclusively, includes in its definition those countries whose sover-eign debt ratings are equivalent to “A+” or lower. Exposures to acountry include all credit-related lending, trading and investmentactivities, whether cross-border or locally funded. In addition to mon-itoring country exposures, the Firm uses stress tests to measure andmanage the risk of extreme loss associated with sovereign crises.
The following table presents the Firm’s exposure to the top fiveemerging markets countries. The selection of countries is based solelyon the Firm’s largest total exposures by country and not the Firm’sview of any actual or potentially adverse credit conditions. Exposureis reported based upon the country where the assets of the obligor,counterparty or guarantor are located. Exposure amounts are adjust-ed for collateral and for credit enhancements (e.g., guarantees andletters of credit) provided by third parties; outstandings supported bya guarantor outside the country or backed by collateral held outsidethe country are assigned to the country of the enhancement provider.In addition, the effects of credit derivative hedges and other shortcredit or equity trading positions are reflected in the following table.Total exposure includes exposure to both government and privatesector entities in a country.
JPMorgan Chase & Co. / 2008 Annual Report 103
CONSUMER CREDIT PORTFOL IO
JPMorgan Chase’s consumer portfolio consists primarily of residentialmortgages, home equity loans, credit cards, auto loans, student loansand business banking loans, with a primary focus on serving theprime consumer credit market. The consumer credit portfolio alsoincludes certain loans acquired in the Washington Mutual transaction,primarily mortgage, home equity and credit card loans. The RFS port-folio includes home equity lines of credit and mortgage loans withinterest-only payment options to predominantly prime borrowers, aswell as certain payment option loans acquired from WashingtonMutual that may result in negative amortization.
A substantial portion of the consumer loans acquired in theWashington Mutual transaction were identified as credit-impaired inthe third quarter of 2008 based on a preliminary analysis of theacquired portfolio. In addition, as of the acquisition date, a $1.4 billionaccounting conformity provision was recorded to reflect the Firm’s preliminary estimate of incurred losses related to the portion of theacquired consumer loans that were not considered to be credit-impaired. During the fourth quarter of 2008, the analysis of acquiredloans was substantially completed, resulting in a $12.4 billion increasein the credit-impaired loan balances and a corresponding decrease inthe non-credit-impaired loan balances. In addition, the estimate ofincurred losses related to the non-credit-impaired portfolio was final-ized, resulting in a $476 million decrease in the accounting conformityprovision for these loans. The purchased credit-impaired loans, whichwere identified as impaired based on an analysis of risk characteristics,including product type, loan-to-value ratios, FICO scores and delin-quency status, are accounted for under SOP 03-3 and were recordedat fair value under SOP 03-3 as of the acquisition date. The fair valueof these loans includes an estimate of losses that are expected to beincurred over the estimated remaining lives of the loans, and thereforeno allowance for loan losses was recorded for these loans as of thetransaction date.
The credit performance of the consumer portfolio across the entireconsumer credit product spectrum continues to be negatively affectedby the economic environment. High unemployment and weaker over-all economic conditions have resulted in increased delinquencies, andcontinued weak housing prices have driven a significant increase inloss severity. Nonperforming loans and assets continued to increasethrough year-end 2008, a key indicator that charge-offs will continueto rise in 2009. Additional deterioration in the overall economic envi-ronment, including continued deterioration in the labor market, couldcause delinquencies to increase beyond the Firm’s current expecta-tions, resulting in significant increases in losses in 2009.
Over the past year, the Firm has taken actions to reduce risk exposureby tightening both underwriting and loan qualification standards forreal estate lending, as well as for consumer lending for non-realestate products. Tighter income verification, more conservative collat-eral valuation, reduced loan-to-value maximums and higher FICO andcustom risk score requirements are just some of the actions taken todate to mitigate risk. These actions have resulted in significant reduc-tions in new originations of “risk layered” loans (e.g., loans with highloan-to-value ratios to borrowers with low FICO scores) and improvedalignment of loan pricing. New originations of subprime mortgageloans, option ARMs and broker originated-mortgage and home equityloans have been eliminated entirely.
In the fourth quarter of 2008, the Firm announced plans to signifi-cantly expand loss mitigation efforts related to its mortgage andhome equity portfolios, including a systematic review of the realestate portfolio to identify homeowners most in need of assistance. Inaddition, the Firm announced plans to open regional counseling cen-ters, hire additional loan counselors, introduce new financing alterna-tives, proactively reach out to borrowers to offer pre-qualified modifi-cations, and commence a new process to independently review each
Top 5 emerging markets country exposure
At December 31, 2008 Cross-border Total(in billions) Lending(a) Trading(b) Other(c) Total Local(d) exposure
South Korea $2.9 $1.6 $ 0.9 $ 5.4 $2.3 $ 7.7India 2.2 2.8 0.9 5.9 0.6 6.5China 1.8 1.6 0.3 3.7 0.8 4.5Brazil 1.8 — 0.5 2.3 1.3 3.6Taiwan 0.1 0.2 0.3 0.6 2.5 3.1
At December 31, 2007 Cross-border Total(in billions) Lending(a) Trading(b) Other(c) Total Local(d) exposure
South Korea $ 3.2 $ 2.6 $ 0.7 $ 6.5 $ 3.4 $ 9.9Brazil 1.1 (0.7) 1.2 1.6 5.0 6.6Russia 2.9 1.0 0.2 4.1 0.4 4.5India 1.9 0.8 0.8 3.5 0.6 4.1China 2.2 0.3 0.4 2.9 0.3 3.2
(a) Lending includes loans and accrued interest receivable, interest-bearing deposits with banks, acceptances, other monetary assets, issued letters of credit net of participations, andundrawn commitments to extend credit.
(b) Trading includes: (1) issuer exposure on cross-border debt and equity instruments, held both in trading and investment accounts, adjusted for the impact of issuer hedges, includingcredit derivatives; and (2) counterparty exposure on derivative and foreign exchange contracts as well as security financing trades (resale agreements and securities borrowed).
(c) Other represents mainly local exposure funded cross-border.(d) Local exposure is defined as exposure to a country denominated in local currency, booked and funded locally. Any exposure not meeting these criteria is defined as cross-border exposure.
Management’s discussion and analysis
104 JPMorgan Chase & Co. / 2008 Annual Report
loan before moving it into the foreclosure process. During the imple-mentation period of these loss mitigation efforts, which were substan-tially complete in early 2009, the Firm did not place loans into fore-closure. These loss mitigation efforts, which generally represent vari-ous forms of term extensions, rate reductions and forbearances, are
expected to result in additional increases in the balances of modifiedloans carried on the Firm’s balance sheet, including loans accountedfor as troubled debt restructurings, while minimizing the economicloss to the Firm and assisting homeowners to remain in their homes.
The following table presents managed consumer credit–related information for the dates indicated.
Consumer portfolioCredit Nonperforming 90 days past due Average annual
As of or for the year ended December 31, exposure loans(g)(h)(i) and still accruing Net charge-offs net charge-off rate(j)
(in millions, except ratios) 2008 2007 2008 2007 2008 2007 2008 2007 2008 2007
Consumer loans – excluding purchased credit-impaired(a)
Home equity $ 114,335 $ 94,832 $1,394 $ 786 $ — $ — $ 2,391 $ 564 2.39% 0.62%Prime mortgage 72,266 39,988 1,895 501 — — 526 33 1.02 0.10Subprime mortgage 15,330 15,473 2,690 1,017 — — 933 157 6.10 1.55Option ARMs 9,018 — 10 — — — — — — —Auto loans(b) 42,603 42,350 148 116 — — 568 354 1.30 0.86Credit card – reported 104,746 84,352 4 7 2,649 1,547 4,556 3,116 5.47 3.90All other loans 33,715 25,314 430 341 463 421 459 242 1.58 1.01Loans held-for-sale(c) 2,028 3,989 — — — — NA NA NA NA
Total consumer loans – excluding purchased credit-impaired(d) 394,041 306,298 6,571 2,768 3,112 1,968 9,433 4,466 2.90 1.61
Consumer loans – purchased credit impaired(d)
Home equity 28,555 NA NA NA — — NA NA NA NAPrime mortgage 21,855 NA NA NA — — NA NA NA NASubprime mortgage 6,760 NA NA NA — — NA NA NA NAOption ARMs 31,643 NA NA NA — — NA NA NA NA
Total purchased credit-impaired 88,813 NA NA NA — — NA NA NA NA
Total consumer loans – reported 482,854 306,298 6,571 2,768 3,112 1,968 9,433 4,466 2.71 1.61
Credit card – securitized(e) 85,571 72,701 — — 1,802 1,050 3,612 2,380 4.53 3.43
Total consumer loans – managed 568,425 378,999 6,571 2,768 4,914 3,018 13,045 6,846 3.06 1.97
Consumer lending-related commitments:Home equity(f) 95,743 74,191Prime mortgage 5,079 7,394Subprime mortgage — 16Option ARMs — —Auto loans 4,726 8,058Credit card(f) 623,702 714,848All other loans 12,257 11,429
Total lending-related commitments 741,507 815,936
Total consumer credit portfolio $ 1,309,932 $1,194,935
Memo: Credit card – managed $ 190,317 $ 157,053 $ 4 $ 7 $ 4,451 $ 2,597 $ 8,168 $ 5,496 5.01% 3.68%
(a) Includes RFS, CS and residential mortgage loans reported in the Corporate/Private Equity segment, as well as approximately $80.0 billion in non-credit-impaired consumer loansacquired in the Washington Mutual transaction.
(b) Excludes operating lease-related assets of $2.2 billion and $1.9 billion for December 31, 2008 and 2007, respectively.(c) Includes loans for prime mortgage and other (largely student loans) of $206 million and $1.8 billion at December 31, 2008, respectively, and $570 million and $3.4 billion at
December 31, 2007, respectively.(d) Purchased credit-impaired loans represent loans acquired in the Washington Mutual transaction that were considered credit-impaired under SOP 03-3, and include $6.4 billion of
loans that were considered nonperforming by Washington Mutual prior to the transaction closing. Under SOP 03-3, these loans are considered to be performing loans as of the trans-action date and accrete interest income over the estimated life of the loan when cash flows are reasonably estimable, even if the underlying loans are contractually past due. For addi-tional information, see Note 14 on pages 175–178 of this Annual Report.
(e) Represents securitized credit card receivables. For a further discussion of credit card securitizations, see CS on pages 63–65 of this Annual Report.(f) The credit card and home equity lending-related commitments represent the total available lines of credit for these products. The Firm has not experienced, and does not anticipate,
that all available lines of credit will be utilized at the same time. For credit card commitments and home equity commitments (if certain conditions are met), the Firm can reduce orcancel these lines of credit by providing the borrower prior notice or, in some cases, without notice as permitted by law.
(g) Excludes purchased credit-impaired loans accounted for under SOP 03-3 that were acquired as part of the Washington Mutual transaction. These loans are accounted for on a poolbasis and the pools are considered to be performing under SOP 03-3.
(h) Excludes nonperforming assets related to: (1) loans eligible for repurchase, as well as loans repurchased from GNMA pools that are insured by U.S. government agencies of $3.3 billionfor December 31, 2008 and $1.5 billion for December 31, 2007; and (2) student loans that are 90 days past due and still accruing, which are insured by U.S. government agenciesunder the Federal Family Education Loan Program of $437 million and $417 million as of December 31, 2008 and 2007, respectively. These amounts for GNMA and student loans areexcluded, as reimbursement is proceeding normally.
(i) During the second quarter of 2008, the Firm’s policy for classifying subprime mortgage and home equity loans as nonperforming was changed to conform to all the other home lend-ing products. Amounts for 2007 have been revised to reflect this change.
(j) Net charge-off rates exclude average loans held-for-sale of $2.8 billion and $10.6 billion for 2008 and 2007, respectively.
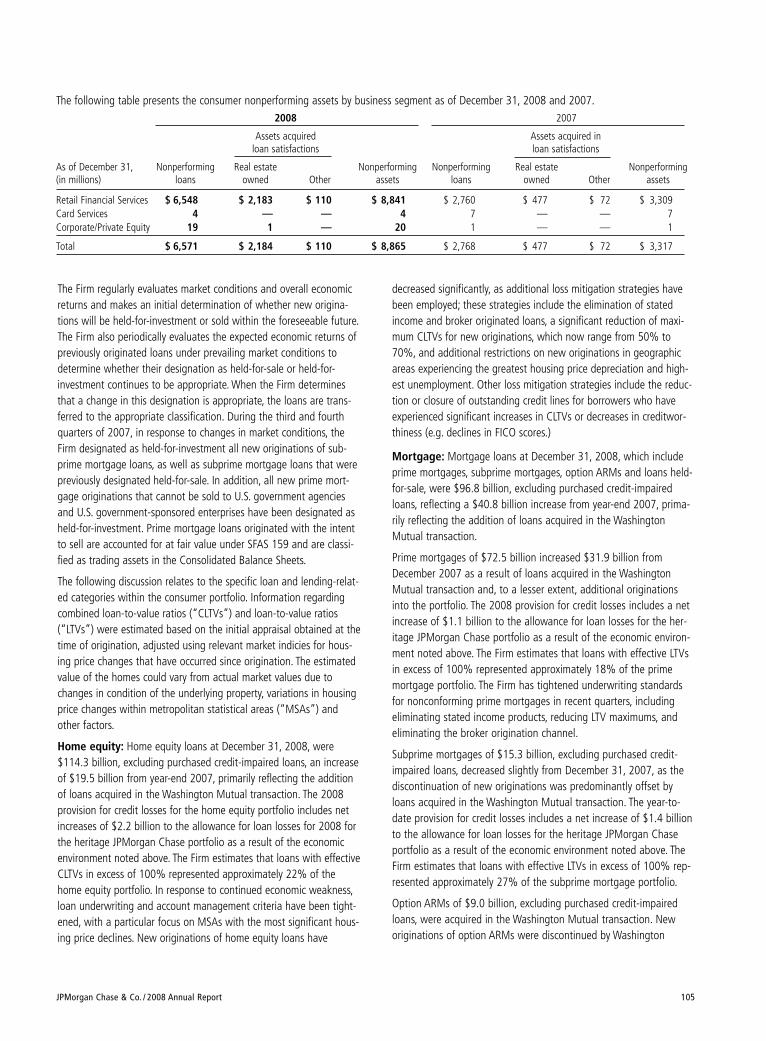
JPMorgan Chase & Co. / 2008 Annual Report 105
The Firm regularly evaluates market conditions and overall economicreturns and makes an initial determination of whether new origina-tions will be held-for-investment or sold within the foreseeable future.The Firm also periodically evaluates the expected economic returns ofpreviously originated loans under prevailing market conditions todetermine whether their designation as held-for-sale or held-for-investment continues to be appropriate. When the Firm determinesthat a change in this designation is appropriate, the loans are trans-ferred to the appropriate classification. During the third and fourthquarters of 2007, in response to changes in market conditions, theFirm designated as held-for-investment all new originations of sub-prime mortgage loans, as well as subprime mortgage loans that werepreviously designated held-for-sale. In addition, all new prime mort-gage originations that cannot be sold to U.S. government agenciesand U.S. government-sponsored enterprises have been designated asheld-for-investment. Prime mortgage loans originated with the intentto sell are accounted for at fair value under SFAS 159 and are classi-fied as trading assets in the Consolidated Balance Sheets.
The following discussion relates to the specific loan and lending-relat-ed categories within the consumer portfolio. Information regardingcombined loan-to-value ratios (“CLTVs”) and loan-to-value ratios(“LTVs”) were estimated based on the initial appraisal obtained at thetime of origination, adjusted using relevant market indicies for hous-ing price changes that have occurred since origination. The estimatedvalue of the homes could vary from actual market values due tochanges in condition of the underlying property, variations in housingprice changes within metropolitan statistical areas (“MSAs”) andother factors.
Home equity: Home equity loans at December 31, 2008, were$114.3 billion, excluding purchased credit-impaired loans, an increaseof $19.5 billion from year-end 2007, primarily reflecting the additionof loans acquired in the Washington Mutual transaction. The 2008provision for credit losses for the home equity portfolio includes netincreases of $2.2 billion to the allowance for loan losses for 2008 forthe heritage JPMorgan Chase portfolio as a result of the economicenvironment noted above. The Firm estimates that loans with effectiveCLTVs in excess of 100% represented approximately 22% of thehome equity portfolio. In response to continued economic weakness,loan underwriting and account management criteria have been tight-ened, with a particular focus on MSAs with the most significant hous-ing price declines. New originations of home equity loans have
decreased significantly, as additional loss mitigation strategies havebeen employed; these strategies include the elimination of statedincome and broker originated loans, a significant reduction of maxi-mum CLTVs for new originations, which now range from 50% to70%, and additional restrictions on new originations in geographicareas experiencing the greatest housing price depreciation and high-est unemployment. Other loss mitigation strategies include the reduc-tion or closure of outstanding credit lines for borrowers who haveexperienced significant increases in CLTVs or decreases in creditwor-thiness (e.g. declines in FICO scores.)
Mortgage: Mortgage loans at December 31, 2008, which includeprime mortgages, subprime mortgages, option ARMs and loans held-for-sale, were $96.8 billion, excluding purchased credit-impairedloans, reflecting a $40.8 billion increase from year-end 2007, prima-rily reflecting the addition of loans acquired in the WashingtonMutual transaction.
Prime mortgages of $72.5 billion increased $31.9 billion fromDecember 2007 as a result of loans acquired in the WashingtonMutual transaction and, to a lesser extent, additional originationsinto the portfolio. The 2008 provision for credit losses includes a netincrease of $1.1 billion to the allowance for loan losses for the her-itage JPMorgan Chase portfolio as a result of the economic environ-ment noted above. The Firm estimates that loans with effective LTVsin excess of 100% represented approximately 18% of the primemortgage portfolio. The Firm has tightened underwriting standardsfor nonconforming prime mortgages in recent quarters, includingeliminating stated income products, reducing LTV maximums, andeliminating the broker origination channel.
Subprime mortgages of $15.3 billion, excluding purchased credit-impaired loans, decreased slightly from December 31, 2007, as thediscontinuation of new originations was predominantly offset byloans acquired in the Washington Mutual transaction. The year-to-date provision for credit losses includes a net increase of $1.4 billionto the allowance for loan losses for the heritage JPMorgan Chaseportfolio as a result of the economic environment noted above. TheFirm estimates that loans with effective LTVs in excess of 100% rep-resented approximately 27% of the subprime mortgage portfolio.
Option ARMs of $9.0 billion, excluding purchased credit-impairedloans, were acquired in the Washington Mutual transaction. Neworiginations of option ARMs were discontinued by Washington
The following table presents the consumer nonperforming assets by business segment as of December 31, 2008 and 2007.2008 2007
Assets acquired Assets acquired inloan satisfactions loan satisfactions
As of December 31, Nonperforming Real estate Nonperforming Nonperforming Real estate Nonperforming (in millions) loans owned Other assets loans owned Other assets
Retail Financial Services $ 6,548 $ 2,183 $ 110 $ 8,841 $ 2,760 $ 477 $ 72 $ 3,309Card Services 4 — — 4 7 — — 7Corporate/Private Equity 19 1 — 20 1 — — 1
Total $ 6,571 $ 2,184 $ 110 $ 8,865 $ 2,768 $ 477 $ 72 $ 3,317
Management’s discussion and analysis
106 JPMorgan Chase & Co. / 2008 Annual Report
Mutual prior to the date of the Washington Mutual transaction. Thisportfolio is primarily comprised of loans with low LTVs and high bor-rower FICOs and for which the Firm currently expects substantiallylower losses in comparison with the purchased credit-impaired port-folio. The Firm has not, and does not, originate option ARMs.
Option ARMs are adjustable-rate mortgage products that provide theborrower with the option to make a fully amortizing, interest-only, orminimum payment. The minimum payment is based upon the interestrate charged during the introductory period. This introductory rate istypically well below the fully indexed rate. The fully indexed rate iscalculated using an index rate plus a margin. Once the introductoryperiod ends, the contractual interest rate charged on the loanincreases to the fully indexed rate. If the borrower continues to makethe minimum monthly payment after the introductory period ends,the payment may not be sufficient to cover interest accrued in theprevious month. In this case, the loan will “negatively amortize” asunpaid interest is deferred and added to the principal balance of theloan. Option ARMs typically become fully amortizing loans uponreaching a negative amortization cap or on dates specified in theborrowing agreement, at which time the required monthly paymentgenerally increases substantially.
Auto loans: As of December 31, 2008, auto loans of $42.6 billionincreased slightly from year-end 2007. The allowance for loan lossesfor the auto loan portfolio was increased during 2008, reflecting anincrease in estimated losses due to an increase in loss severity andfurther deterioration of older vintage loans as a result of the worsen-ing credit environment and declines in auto resale values. The autoloan portfolio reflects a high concentration of prime quality credits. Inresponse to recent increases in loan delinquencies and credit losses,particularly in MSAs experiencing the greatest housing price depreci-ation and highest unemployment, credit underwriting criteria havebeen tightened, which has resulted in the reduction of both extend-ed-term and high loan-to-value financing.
Credit card: JPMorgan Chase analyzes its credit card portfolio on a managed basis, which includes credit card receivables on theConsolidated Balance Sheets and those receivables sold to investorsthrough securitization. Managed credit card receivables were$190.3 billion at December 31, 2008, an increase of $33.3 billionfrom year-end 2007, reflecting the acquisition of credit card loansas part of the Washington Mutual transaction, as well as organicgrowth in the portfolio.
The managed credit card net charge-off rate increased to 5.01% for2008 from 3.68% in 2007. This increase was due primarily to highercharge-offs as a result of the current economic environment, espe-cially in areas experiencing the greatest housing price depreciationand highest unemployment. The 30-day managed delinquency rateincreased to 4.97% at December 31, 2008, from 3.48% at
December 31, 2007, partially as a result of the addition of credit cardloans acquired in the Washington Mutual transaction. Excluding theWashington Mutual portfolio, the 30-day managed delinquency ratewas 4.36%. The Allowance for loan losses was increased due to high-er estimated net charge-offs in the portfolio. As a result of continuedweakness in housing markets, account acquisition credit criteria andaccount management credit practices have been tightened, particular-ly in MSAs experiencing significant home price declines. The managedcredit card portfolio continues to reflect a well-seasoned, largelyrewards-based portfolio that has good U.S. geographic diversification.
All other loans: All other loans primarily include business bankingloans (which are highly collateralized loans, often with personal loanguarantees), student loans, and other secured and unsecured con-sumer loans. As of December 31, 2008, other loans, including loansheld-for-sale, of $35.5 billion were up $6.8 billion from year-end2007, primarily as a result of organic growth in business bankingloans and student loans, as well as an increase in business bankingloans as a result of the Washington Mutual transaction.
Purchased credit-impaired loans: Purchased credit-impairedloans of $88.8 billion in the home lending portfolio represent loansacquired in the Washington Mutual transaction that were recorded atfair value at the time of acquisition under SOP 03-3. The fair value ofthese loans includes an estimate of losses that are expected to beincurred over the estimated remaining lives of the loans, and there-fore no allowance for loan losses was recorded for these loans as ofthe transaction date. Through year-end 2008, the credit performanceof these loans has generally been consistent with the assumptionsused in determining the initial fair value of these loans, and theFirm’s original expectations regarding the amounts and timing offuture cash flows has not changed. A probable decrease in manage-ment’s expectation of future cash collections related to these loanscould result in the need to record an allowance for credit lossesrelated to these loans in the future. A significant and probableincrease in expected cash flows would generally result in an increasein interest income recognized over the remaining life of the underly-ing pool of loans.
Other real estate owned: As part of the residential real estateforeclosure process, loans are written down to net realizable valueless a cost to sell the asset. In those instances where the Firm gainstitle, ownership and possession of individual properties at the com-pletion of the foreclosure process, these Other Real Estate Owned(OREO) assets are managed for prompt sale and disposition at thebest possible economic value. Any further gain or loss on sale of thedisposition of OREO assets are recorded as part of other income.
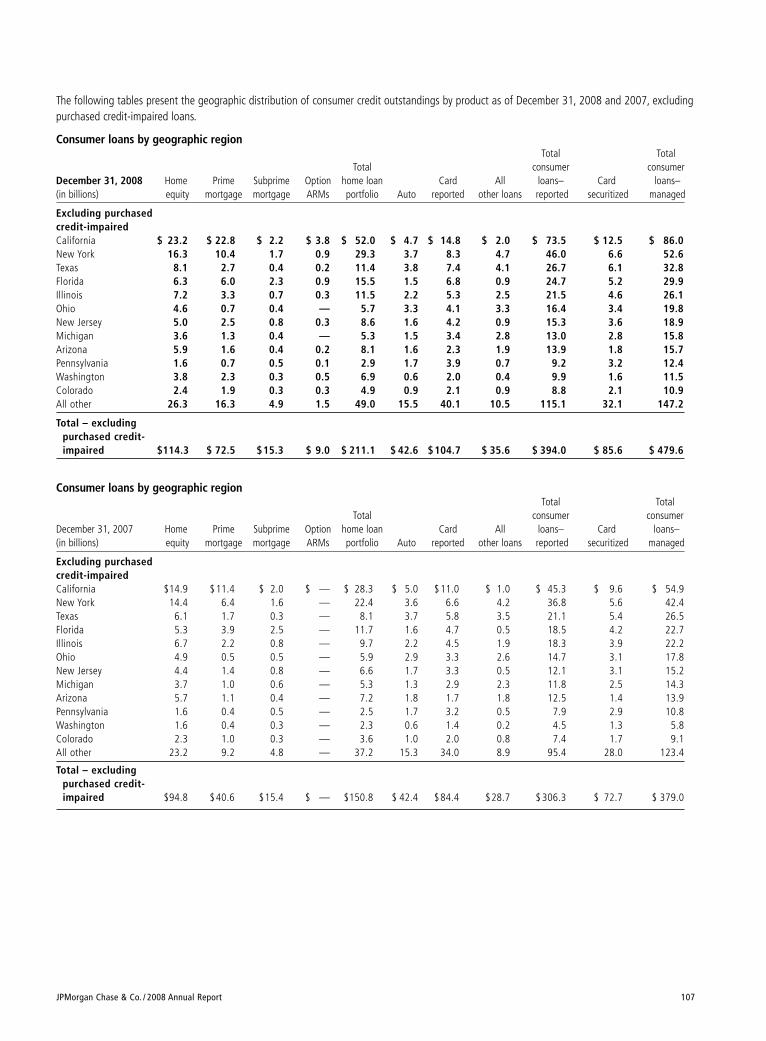
JPMorgan Chase & Co. / 2008 Annual Report 107
The following tables present the geographic distribution of consumer credit outstandings by product as of December 31, 2008 and 2007, excludingpurchased credit-impaired loans.
Consumer loans by geographic regionTotal Total
Total consumer consumer December 31, 2008 Home Prime Subprime Option home loan Card All loans– Card loans–(in billions) equity mortgage mortgage ARMs portfolio Auto reported other loans reported securitized managed
Excluding purchasedcredit-impairedCalifornia $ 23.2 $ 22.8 $ 2.2 $ 3.8 $ 52.0 $ 4.7 $ 14.8 $ 2.0 $ 73.5 $ 12.5 $ 86.0New York 16.3 10.4 1.7 0.9 29.3 3.7 8.3 4.7 46.0 6.6 52.6Texas 8.1 2.7 0.4 0.2 11.4 3.8 7.4 4.1 26.7 6.1 32.8Florida 6.3 6.0 2.3 0.9 15.5 1.5 6.8 0.9 24.7 5.2 29.9Illinois 7.2 3.3 0.7 0.3 11.5 2.2 5.3 2.5 21.5 4.6 26.1Ohio 4.6 0.7 0.4 — 5.7 3.3 4.1 3.3 16.4 3.4 19.8New Jersey 5.0 2.5 0.8 0.3 8.6 1.6 4.2 0.9 15.3 3.6 18.9Michigan 3.6 1.3 0.4 — 5.3 1.5 3.4 2.8 13.0 2.8 15.8Arizona 5.9 1.6 0.4 0.2 8.1 1.6 2.3 1.9 13.9 1.8 15.7Pennsylvania 1.6 0.7 0.5 0.1 2.9 1.7 3.9 0.7 9.2 3.2 12.4Washington 3.8 2.3 0.3 0.5 6.9 0.6 2.0 0.4 9.9 1.6 11.5Colorado 2.4 1.9 0.3 0.3 4.9 0.9 2.1 0.9 8.8 2.1 10.9All other 26.3 16.3 4.9 1.5 49.0 15.5 40.1 10.5 115.1 32.1 147.2
Total – excludingpurchased credit-impaired $114.3 $ 72.5 $15.3 $ 9.0 $ 211.1 $ 42.6 $104.7 $ 35.6 $ 394.0 $ 85.6 $ 479.6
Consumer loans by geographic regionTotal Total
Total consumer consumer December 31, 2007 Home Prime Subprime Option home loan Card All loans– Card loans–(in billions) equity mortgage mortgage ARMs portfolio Auto reported other loans reported securitized managed
Excluding purchasedcredit-impairedCalifornia $14.9 $11.4 $ 2.0 $ — $ 28.3 $ 5.0 $11.0 $ 1.0 $ 45.3 $ 9.6 $ 54.9New York 14.4 6.4 1.6 — 22.4 3.6 6.6 4.2 36.8 5.6 42.4Texas 6.1 1.7 0.3 — 8.1 3.7 5.8 3.5 21.1 5.4 26.5Florida 5.3 3.9 2.5 — 11.7 1.6 4.7 0.5 18.5 4.2 22.7Illinois 6.7 2.2 0.8 — 9.7 2.2 4.5 1.9 18.3 3.9 22.2Ohio 4.9 0.5 0.5 — 5.9 2.9 3.3 2.6 14.7 3.1 17.8New Jersey 4.4 1.4 0.8 — 6.6 1.7 3.3 0.5 12.1 3.1 15.2Michigan 3.7 1.0 0.6 — 5.3 1.3 2.9 2.3 11.8 2.5 14.3Arizona 5.7 1.1 0.4 — 7.2 1.8 1.7 1.8 12.5 1.4 13.9Pennsylvania 1.6 0.4 0.5 — 2.5 1.7 3.2 0.5 7.9 2.9 10.8Washington 1.6 0.4 0.3 — 2.3 0.6 1.4 0.2 4.5 1.3 5.8Colorado 2.3 1.0 0.3 — 3.6 1.0 2.0 0.8 7.4 1.7 9.1All other 23.2 9.2 4.8 — 37.2 15.3 34.0 8.9 95.4 28.0 123.4
Total – excludingpurchased credit-impaired $94.8 $40.6 $15.4 $ — $150.8 $ 42.4 $84.4 $28.7 $ 306.3 $ 72.7 $ 379.0
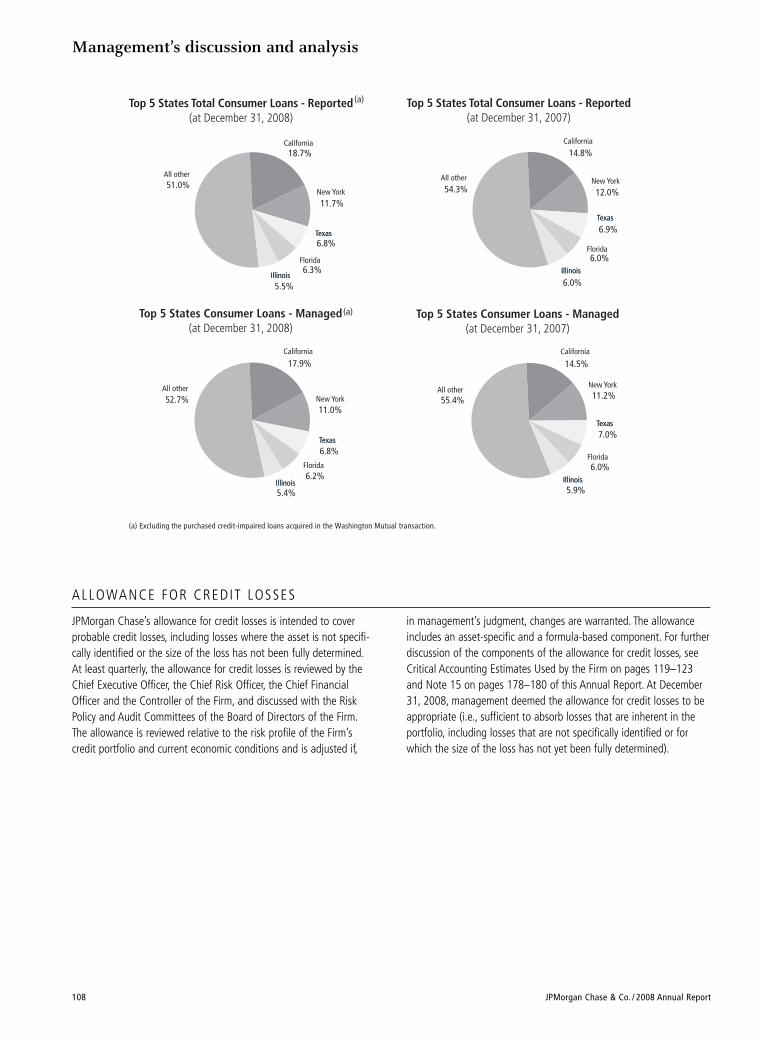
Management’s discussion and analysis
108 JPMorgan Chase & Co. / 2008 Annual Report
Top 5 States Total Consumer Loans - Reported(at December 31, 2008)
California
TexasTexas
New York51.0%
18.7%
6.8%
Florida
11.7%
6.3%
5.5%IllinoisIllinois
All other
Top 5 States Consumer Loans - Managed(at December 31, 2008)
California
TexasTexas
New York52.7%
17.9%
6.8%
Florida
11.0%
6.2%
5.4%IllinoisIllinois
All other
Top 5 States Total Consumer Loans - Reported(at December 31, 2007)
California
TexasTexas
New York54.3%
14.8%
6.9%
Florida
12.0%
6.0%
6.0%IllinoisIllinois
All other
Top 5 States Consumer Loans - Managed(at December 31, 2007)
California
TexasTexas
New York
55.4%
14.5%
7.0%
Florida
11.2%
6.0%
5.9%IllinoisIllinois
All other
(a)
(a)
(a) Excluding the purchased credit-impaired loans acquired in the Washington Mutual transaction.
ALLOWANCE FOR CREDIT LOSSES
JPMorgan Chase’s allowance for credit losses is intended to coverprobable credit losses, including losses where the asset is not specifi-cally identified or the size of the loss has not been fully determined.At least quarterly, the allowance for credit losses is reviewed by theChief Executive Officer, the Chief Risk Officer, the Chief FinancialOfficer and the Controller of the Firm, and discussed with the RiskPolicy and Audit Committees of the Board of Directors of the Firm.The allowance is reviewed relative to the risk profile of the Firm’scredit portfolio and current economic conditions and is adjusted if,
in management’s judgment, changes are warranted. The allowanceincludes an asset-specific and a formula-based component. For furtherdiscussion of the components of the allowance for credit losses, seeCritical Accounting Estimates Used by the Firm on pages 119–123and Note 15 on pages 178–180 of this Annual Report. At December31, 2008, management deemed the allowance for credit losses to beappropriate (i.e., sufficient to absorb losses that are inherent in theportfolio, including losses that are not specifically identified or forwhich the size of the loss has not yet been fully determined).
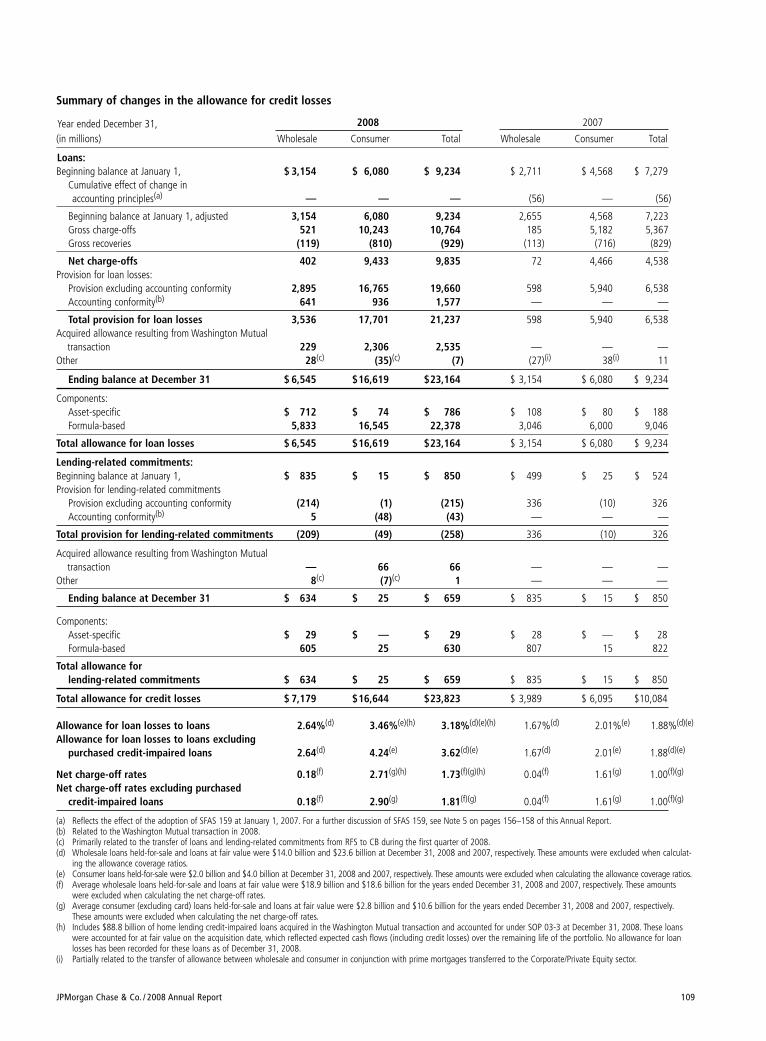
JPMorgan Chase & Co. / 2008 Annual Report 109
Summary of changes in the allowance for credit losses
Year ended December 31, 2008 2007
(in millions) Wholesale Consumer Total Wholesale Consumer Total
Loans:Beginning balance at January 1, $ 3,154 $ 6,080 $ 9,234 $ 2,711 $ 4,568 $ 7,279
Cumulative effect of change in accounting principles(a) — — — (56) — (56)
Beginning balance at January 1, adjusted 3,154 6,080 9,234 2,655 4,568 7,223Gross charge-offs 521 10,243 10,764 185 5,182 5,367Gross recoveries (119) (810) (929) (113) (716) (829)
Net charge-offs 402 9,433 9,835 72 4,466 4,538Provision for loan losses:
Provision excluding accounting conformity 2,895 16,765 19,660 598 5,940 6,538Accounting conformity(b) 641 936 1,577 — — —
Total provision for loan losses 3,536 17,701 21,237 598 5,940 6,538Acquired allowance resulting from Washington Mutual
transaction 229 2,306 2,535 — — —Other 28(c) (35)(c) (7) (27)(i) 38(i) 11
Ending balance at December 31 $ 6,545 $16,619 $23,164 $ 3,154 $ 6,080 $ 9,234
Components:Asset-specific $ 712 $ 74 $ 786 $ 108 $ 80 $ 188Formula-based 5,833 16,545 22,378 3,046 6,000 9,046
Total allowance for loan losses $ 6,545 $16,619 $23,164 $ 3,154 $ 6,080 $ 9,234
Lending-related commitments:Beginning balance at January 1, $ 835 $ 15 $ 850 $ 499 $ 25 $ 524Provision for lending-related commitments
Provision excluding accounting conformity (214) (1) (215) 336 (10) 326Accounting conformity(b) 5 (48) (43) — — —
Total provision for lending-related commitments (209) (49) (258) 336 (10) 326
Acquired allowance resulting from Washington Mutual transaction — 66 66 — — —
Other 8(c) (7)(c) 1 — — —
Ending balance at December 31 $ 634 $ 25 $ 659 $ 835 $ 15 $ 850
Components:Asset-specific $ 29 $ — $ 29 $ 28 $ — $ 28Formula-based 605 25 630 807 15 822
Total allowance for lending-related commitments $ 634 $ 25 $ 659 $ 835 $ 15 $ 850
Total allowance for credit losses $ 7,179 $16,644 $23,823 $ 3,989 $ 6,095 $10,084
Allowance for loan losses to loans 2.64%(d) 3.46%(e)(h) 3.18%(d)(e)(h) 1.67%(d) 2.01%(e) 1.88%(d)(e)
Allowance for loan losses to loans excludingpurchased credit-impaired loans 2.64(d) 4.24(e) 3.62(d)(e) 1.67(d) 2.01(e) 1.88(d)(e)
Net charge-off rates 0.18(f) 2.71(g)(h) 1.73(f)(g)(h) 0.04(f) 1.61(g) 1.00(f)(g)
Net charge-off rates excluding purchasedcredit-impaired loans 0.18(f) 2.90(g) 1.81(f)(g) 0.04(f) 1.61(g) 1.00(f)(g)
(a) Reflects the effect of the adoption of SFAS 159 at January 1, 2007. For a further discussion of SFAS 159, see Note 5 on pages 156–158 of this Annual Report.(b) Related to the Washington Mutual transaction in 2008.(c) Primarily related to the transfer of loans and lending-related commitments from RFS to CB during the first quarter of 2008.(d) Wholesale loans held-for-sale and loans at fair value were $14.0 billion and $23.6 billion at December 31, 2008 and 2007, respectively. These amounts were excluded when calculat-
ing the allowance coverage ratios.(e) Consumer loans held-for-sale were $2.0 billion and $4.0 billion at December 31, 2008 and 2007, respectively. These amounts were excluded when calculating the allowance coverage ratios.(f) Average wholesale loans held-for-sale and loans at fair value were $18.9 billion and $18.6 billion for the years ended December 31, 2008 and 2007, respectively. These amounts
were excluded when calculating the net charge-off rates.(g) Average consumer (excluding card) loans held-for-sale and loans at fair value were $2.8 billion and $10.6 billion for the years ended December 31, 2008 and 2007, respectively.
These amounts were excluded when calculating the net charge-off rates.(h) Includes $88.8 billion of home lending credit-impaired loans acquired in the Washington Mutual transaction and accounted for under SOP 03-3 at December 31, 2008. These loans
were accounted for at fair value on the acquisition date, which reflected expected cash flows (including credit losses) over the remaining life of the portfolio. No allowance for loanlosses has been recorded for these loans as of December 31, 2008.
(i) Partially related to the transfer of allowance between wholesale and consumer in conjunction with prime mortgages transferred to the Corporate/Private Equity sector.
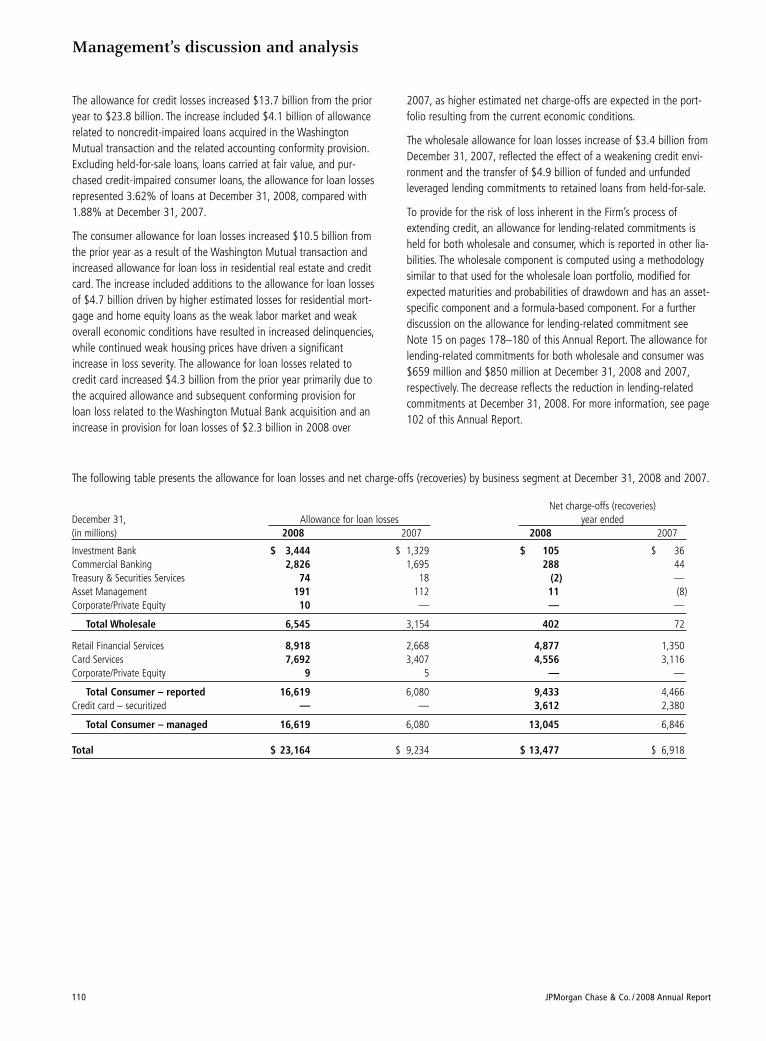
Management’s discussion and analysis
110 JPMorgan Chase & Co. / 2008 Annual Report
The allowance for credit losses increased $13.7 billion from the prioryear to $23.8 billion. The increase included $4.1 billion of allowancerelated to noncredit-impaired loans acquired in the WashingtonMutual transaction and the related accounting conformity provision.Excluding held-for-sale loans, loans carried at fair value, and pur-chased credit-impaired consumer loans, the allowance for loan lossesrepresented 3.62% of loans at December 31, 2008, compared with1.88% at December 31, 2007.
The consumer allowance for loan losses increased $10.5 billion fromthe prior year as a result of the Washington Mutual transaction andincreased allowance for loan loss in residential real estate and creditcard. The increase included additions to the allowance for loan lossesof $4.7 billion driven by higher estimated losses for residential mort-gage and home equity loans as the weak labor market and weakoverall economic conditions have resulted in increased delinquencies,while continued weak housing prices have driven a significantincrease in loss severity. The allowance for loan losses related tocredit card increased $4.3 billion from the prior year primarily due tothe acquired allowance and subsequent conforming provision forloan loss related to the Washington Mutual Bank acquisition and anincrease in provision for loan losses of $2.3 billion in 2008 over
2007, as higher estimated net charge-offs are expected in the port-folio resulting from the current economic conditions.
The wholesale allowance for loan losses increase of $3.4 billion fromDecember 31, 2007, reflected the effect of a weakening credit envi-ronment and the transfer of $4.9 billion of funded and unfundedleveraged lending commitments to retained loans from held-for-sale.
To provide for the risk of loss inherent in the Firm’s process ofextending credit, an allowance for lending-related commitments isheld for both wholesale and consumer, which is reported in other lia-bilities. The wholesale component is computed using a methodologysimilar to that used for the wholesale loan portfolio, modified forexpected maturities and probabilities of drawdown and has an asset-specific component and a formula-based component. For a furtherdiscussion on the allowance for lending-related commitment seeNote 15 on pages 178–180 of this Annual Report. The allowance forlending-related commitments for both wholesale and consumer was$659 million and $850 million at December 31, 2008 and 2007,respectively. The decrease reflects the reduction in lending-relatedcommitments at December 31, 2008. For more information, see page102 of this Annual Report.
The following table presents the allowance for loan losses and net charge-offs (recoveries) by business segment at December 31, 2008 and 2007.
Net charge-offs (recoveries) December 31, Allowance for loan losses year ended(in millions) 2008 2007 2008 2007
Investment Bank $ 3,444 $ 1,329 $ 105 $ 36Commercial Banking 2,826 1,695 288 44Treasury & Securities Services 74 18 (2) —Asset Management 191 112 11 (8)Corporate/Private Equity 10 — — —
Total Wholesale 6,545 3,154 402 72
Retail Financial Services 8,918 2,668 4,877 1,350Card Services 7,692 3,407 4,556 3,116Corporate/Private Equity 9 5 — —
Total Consumer – reported 16,619 6,080 9,433 4,466Credit card – securitized — — 3,612 2,380
Total Consumer – managed 16,619 6,080 13,045 6,846
Total $ 23,164 $ 9,234 $ 13,477 $ 6,918
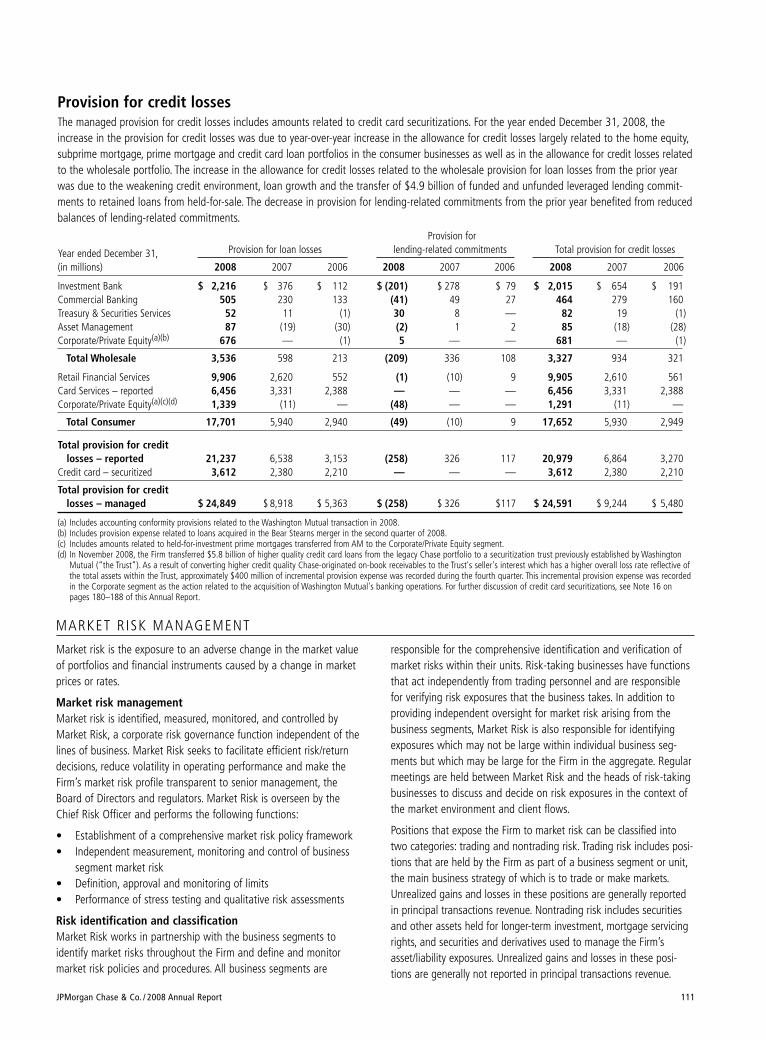
JPMorgan Chase & Co. / 2008 Annual Report 111
MARKET R ISK MANAGEMENT
Market risk is the exposure to an adverse change in the market valueof portfolios and financial instruments caused by a change in marketprices or rates.
Market risk management Market risk is identified, measured, monitored, and controlled byMarket Risk, a corporate risk governance function independent of thelines of business. Market Risk seeks to facilitate efficient risk/returndecisions, reduce volatility in operating performance and make theFirm’s market risk profile transparent to senior management, theBoard of Directors and regulators. Market Risk is overseen by theChief Risk Officer and performs the following functions:
• Establishment of a comprehensive market risk policy framework • Independent measurement, monitoring and control of business
segment market risk • Definition, approval and monitoring of limits • Performance of stress testing and qualitative risk assessments
Risk identification and classification Market Risk works in partnership with the business segments toidentify market risks throughout the Firm and define and monitormarket risk policies and procedures. All business segments are
responsible for the comprehensive identification and verification ofmarket risks within their units. Risk-taking businesses have functionsthat act independently from trading personnel and are responsiblefor verifying risk exposures that the business takes. In addition toproviding independent oversight for market risk arising from thebusiness segments, Market Risk is also responsible for identifyingexposures which may not be large within individual business seg-ments but which may be large for the Firm in the aggregate. Regularmeetings are held between Market Risk and the heads of risk-takingbusinesses to discuss and decide on risk exposures in the context ofthe market environment and client flows.
Positions that expose the Firm to market risk can be classified intotwo categories: trading and nontrading risk. Trading risk includes posi-tions that are held by the Firm as part of a business segment or unit,the main business strategy of which is to trade or make markets.Unrealized gains and losses in these positions are generally reportedin principal transactions revenue. Nontrading risk includes securitiesand other assets held for longer-term investment, mortgage servicingrights, and securities and derivatives used to manage the Firm’sasset/liability exposures. Unrealized gains and losses in these posi-tions are generally not reported in principal transactions revenue.
Provision for credit lossesThe managed provision for credit losses includes amounts related to credit card securitizations. For the year ended December 31, 2008, theincrease in the provision for credit losses was due to year-over-year increase in the allowance for credit losses largely related to the home equity,subprime mortgage, prime mortgage and credit card loan portfolios in the consumer businesses as well as in the allowance for credit losses relatedto the wholesale portfolio. The increase in the allowance for credit losses related to the wholesale provision for loan losses from the prior yearwas due to the weakening credit environment, loan growth and the transfer of $4.9 billion of funded and unfunded leveraged lending commit-ments to retained loans from held-for-sale. The decrease in provision for lending-related commitments from the prior year benefited from reducedbalances of lending-related commitments.
Provision for
Year ended December 31, Provision for loan losses lending-related commitments Total provision for credit losses
(in millions) 2008 2007 2006 2008 2007 2006 2008 2007 2006
Investment Bank $ 2,216 $ 376 $ 112 $ (201) $ 278 $ 79 $ 2,015 $ 654 $ 191Commercial Banking 505 230 133 (41) 49 27 464 279 160Treasury & Securities Services 52 11 (1) 30 8 — 82 19 (1)Asset Management 87 (19) (30) (2) 1 2 85 (18) (28)Corporate/Private Equity(a)(b) 676 — (1) 5 — — 681 — (1)
Total Wholesale 3,536 598 213 (209) 336 108 3,327 934 321
Retail Financial Services 9,906 2,620 552 (1) (10) 9 9,905 2,610 561Card Services – reported 6,456 3,331 2,388 — — — 6,456 3,331 2,388Corporate/Private Equity(a)(c)(d) 1,339 (11) — (48) — — 1,291 (11) —
Total Consumer 17,701 5,940 2,940 (49) (10) 9 17,652 5,930 2,949
Total provision for creditlosses – reported 21,237 6,538 3,153 (258) 326 117 20,979 6,864 3,270
Credit card – securitized 3,612 2,380 2,210 — — — 3,612 2,380 2,210
Total provision for creditlosses – managed $ 24,849 $ 8,918 $ 5,363 $ (258) $ 326 $117 $ 24,591 $ 9,244 $ 5,480
(a) Includes accounting conformity provisions related to the Washington Mutual transaction in 2008.(b) Includes provision expense related to loans acquired in the Bear Stearns merger in the second quarter of 2008.(c) Includes amounts related to held-for-investment prime mortgages transferred from AM to the Corporate/Private Equity segment.(d) In November 2008, the Firm transferred $5.8 billion of higher quality credit card loans from the legacy Chase portfolio to a securitization trust previously established by Washington
Mutual (“the Trust”). As a result of converting higher credit quality Chase-originated on-book receivables to the Trust's seller's interest which has a higher overall loss rate reflective ofthe total assets within the Trust, approximately $400 million of incremental provision expense was recorded during the fourth quarter. This incremental provision expense was recordedin the Corporate segment as the action related to the acquisition of Washington Mutual's banking operations. For further discussion of credit card securitizations, see Note 16 onpages 180–188 of this Annual Report.
Management’s discussion and analysis
112 JPMorgan Chase & Co. / 2008 Annual Report
Trading risk The Firm makes markets and trades its products across several differ-ent asset classes. These asset classes include primarily fixed income(which includes interest rate risk and credit spread risk), foreignexchange, equities and commodities. Trading risk arises from posi-tions in these asset classes and may lead to the potential decline innet income (i.e., economic sensitivity) due to adverse changes inmarket rates, whether arising from client activities or proprietarypositions taken by the Firm.
Nontrading risk Nontrading risk arises from execution of the Firm’s core businessstrategies, the delivery of products and services to its customers, andthe positions the Firm undertakes to risk-manage its exposures.
These exposures can result from a variety of factors, including differ-ences in the timing among the maturity or repricing of assets, liabili-ties and off-balance sheet instruments. Changes in the level andshape of market interest rate curves also may create interest raterisk, since the repricing characteristics of the Firm’s assets do notnecessarily match those of its liabilities. The Firm is also exposed tobasis risk, which is the difference in the repricing characteristics oftwo floating-rate indices, such as the prime rate and 3-month LIBOR.In addition, some of the Firm’s products have embedded optionalitythat impact pricing and balances.
The Firm’s mortgage banking activities give rise to complex interestrate risks, as well as option and basis risk. Option risk arises primarilyfrom prepayment options embedded in mortgages and changes inthe probability of newly originated mortgage commitments actuallyclosing. Basis risk results from different relative movements betweenmortgage rates and other interest rates.
Risk measurement Tools used to measure risk Because no single measure can reflect all aspects of market risk, theFirm uses various metrics, both statistical and nonstatistical, including:
• Nonstatistical risk measures • Value-at-risk (“VaR”) • Loss advisories • Drawdowns • Economic value stress testing • Earnings-at-risk stress testing • Risk identification for large exposures (“RIFLE”)
Nonstatistical risk measuresNonstatistical risk measures other than stress testing include netopen positions, basis point values, option sensitivities, market values,position concentrations and position turnover. These measures pro-vide granular information on the Firm’s market risk exposure. Theyare aggregated by line of business and by risk type, and are used formonitoring limits, one-off approvals and tactical control.
Value-at-risk (“VaR”)JPMorgan Chase’s primary statistical risk measure, VaR, estimates thepotential loss from adverse market moves in an ordinary market envi-ronment and provides a consistent cross-business measure of riskprofiles and levels of diversification. VaR is used for comparing risksacross businesses, monitoring limits, and as an input to economic cap-ital calculations. VaR provides risk transparency in a normal tradingenvironment. Each business day the Firm undertakes a comprehensiveVaR calculation that includes both its trading and its nontrading risks.VaR for nontrading risk measures the amount of potential change inthe fair values of the exposures related to these risks; however, forsuch risks, VaR is not a measure of reported revenue since nontradingactivities are generally not marked to market through net income.Hedges of nontrading activities may be included in trading VaR sincethey are marked to market.
To calculate VaR, the Firm uses historical simulation, based on a one-day time horizon and an expected tail-loss methodology, whichmeasures risk across instruments and portfolios in a consistent andcomparable way. The simulation is based upon data for the previous12 months. This approach assumes that historical changes in marketvalues are representative of future changes; this is an assumptionthat may not always be accurate, particularly given the volatility inthe current market environment. For certain products, an actual pricetime series is not available. In such cases, the historical simulation isdone using a proxy time series to estimate the risk. It is likely thatusing an actual price time series for these products, if available,would impact the VaR results presented. In addition, certain riskparameters, such as correlation risk among certain IB trading instru-ments, are not fully captured in VaR.
In the third quarter of 2008, the Firm revised its VaR measurement toinclude additional risk positions previously excluded from VaR, thuscreating, in the Firm’s view, a more comprehensive view of its marketrisks. In addition, the Firm moved to calculating VaR using a 95%confidence level to provide a more stable measure of the VaR forday-to-day risk management. The following sections describeJPMorgan Chase’s VaR measures under both the legacy 99% confi-dence level as well as the new 95% confidence level. The Firmintends to solely present the VaR at the 95% confidence level onceinformation for two complete year-to-date periods is available.
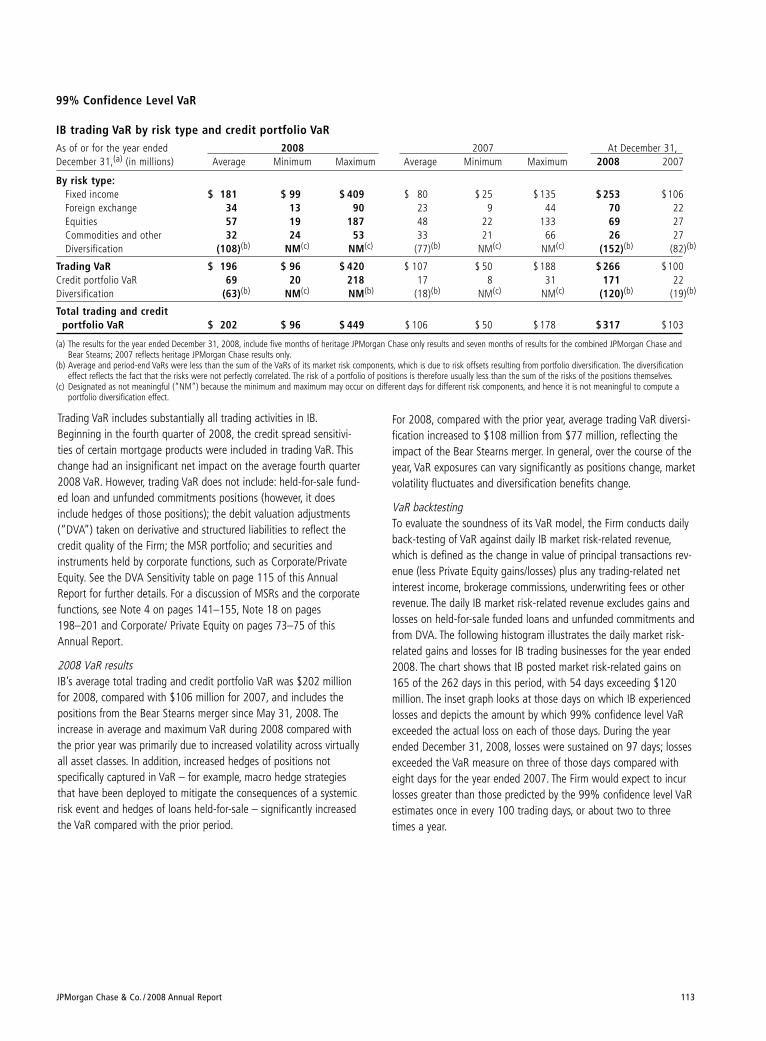
JPMorgan Chase & Co. / 2008 Annual Report 113
Trading VaR includes substantially all trading activities in IB.Beginning in the fourth quarter of 2008, the credit spread sensitivi-ties of certain mortgage products were included in trading VaR. Thischange had an insignificant net impact on the average fourth quarter2008 VaR. However, trading VaR does not include: held-for-sale fund-ed loan and unfunded commitments positions (however, it doesinclude hedges of those positions); the debit valuation adjustments(“DVA”) taken on derivative and structured liabilities to reflect thecredit quality of the Firm; the MSR portfolio; and securities andinstruments held by corporate functions, such as Corporate/PrivateEquity. See the DVA Sensitivity table on page 115 of this AnnualReport for further details. For a discussion of MSRs and the corporatefunctions, see Note 4 on pages 141–155, Note 18 on pages198–201 and Corporate/ Private Equity on pages 73–75 of thisAnnual Report.
2008 VaR resultsIB’s average total trading and credit portfolio VaR was $202 millionfor 2008, compared with $106 million for 2007, and includes thepositions from the Bear Stearns merger since May 31, 2008. Theincrease in average and maximum VaR during 2008 compared withthe prior year was primarily due to increased volatility across virtuallyall asset classes. In addition, increased hedges of positions notspecifically captured in VaR – for example, macro hedge strategiesthat have been deployed to mitigate the consequences of a systemicrisk event and hedges of loans held-for-sale – significantly increasedthe VaR compared with the prior period.
For 2008, compared with the prior year, average trading VaR diversi-fication increased to $108 million from $77 million, reflecting theimpact of the Bear Stearns merger. In general, over the course of theyear, VaR exposures can vary significantly as positions change, marketvolatility fluctuates and diversification benefits change.
VaR backtestingTo evaluate the soundness of its VaR model, the Firm conducts dailyback-testing of VaR against daily IB market risk-related revenue,which is defined as the change in value of principal transactions rev-enue (less Private Equity gains/losses) plus any trading-related netinterest income, brokerage commissions, underwriting fees or otherrevenue. The daily IB market risk-related revenue excludes gains andlosses on held-for-sale funded loans and unfunded commitments andfrom DVA. The following histogram illustrates the daily market risk-related gains and losses for IB trading businesses for the year ended2008. The chart shows that IB posted market risk-related gains on165 of the 262 days in this period, with 54 days exceeding $120million. The inset graph looks at those days on which IB experiencedlosses and depicts the amount by which 99% confidence level VaRexceeded the actual loss on each of those days. During the yearended December 31, 2008, losses were sustained on 97 days; lossesexceeded the VaR measure on three of those days compared witheight days for the year ended 2007. The Firm would expect to incurlosses greater than those predicted by the 99% confidence level VaRestimates once in every 100 trading days, or about two to threetimes a year.
99% Confidence Level VaR
IB trading VaR by risk type and credit portfolio VaRAs of or for the year ended 2008 2007 At December 31,December 31,(a) (in millions) Average Minimum Maximum Average Minimum Maximum 2008 2007
By risk type:Fixed income $ 181 $ 99 $ 409 $ 80 $ 25 $ 135 $ 253 $106Foreign exchange 34 13 90 23 9 44 70 22Equities 57 19 187 48 22 133 69 27Commodities and other 32 24 53 33 21 66 26 27Diversification (108)(b) NM(c) NM(c) (77)(b) NM(c) NM(c) (152)(b) (82)(b)
Trading VaR $ 196 $ 96 $ 420 $ 107 $ 50 $ 188 $ 266 $100Credit portfolio VaR 69 20 218 17 8 31 171 22Diversification (63)(b) NM(c) NM(b) (18)(b) NM(c) NM(c) (120)(b) (19)(b)
Total trading and creditportfolio VaR $ 202 $ 96 $ 449 $ 106 $ 50 $ 178 $ 317 $103
(a) The results for the year ended December 31, 2008, include five months of heritage JPMorgan Chase only results and seven months of results for the combined JPMorgan Chase andBear Stearns; 2007 reflects heritage JPMorgan Chase results only.
(b) Average and period-end VaRs were less than the sum of the VaRs of its market risk components, which is due to risk offsets resulting from portfolio diversification. The diversificationeffect reflects the fact that the risks were not perfectly correlated. The risk of a portfolio of positions is therefore usually less than the sum of the risks of the positions themselves.
(c) Designated as not meaningful (“NM”) because the minimum and maximum may occur on different days for different risk components, and hence it is not meaningful to compute aportfolio diversification effect.
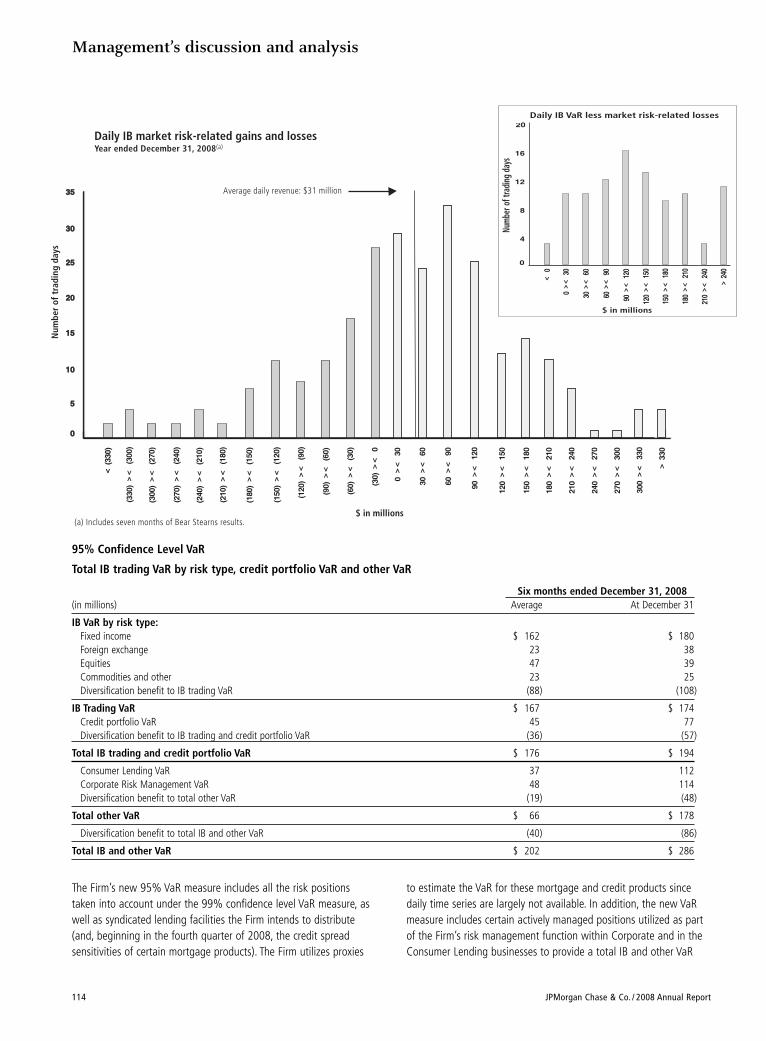
Management’s discussion and analysis
114 JPMorgan Chase & Co. / 2008 Annual Report
95% Confidence Level VaR
Total IB trading VaR by risk type, credit portfolio VaR and other VaR
Six months ended December 31, 2008(in millions) Average At December 31
IB VaR by risk type:Fixed income $ 162 $ 180Foreign exchange 23 38Equities 47 39Commodities and other 23 25Diversification benefit to IB trading VaR (88) (108)
IB Trading VaR $ 167 $ 174Credit portfolio VaR 45 77Diversification benefit to IB trading and credit portfolio VaR (36) (57)
Total IB trading and credit portfolio VaR $ 176 $ 194
Consumer Lending VaR 37 112Corporate Risk Management VaR 48 114Diversification benefit to total other VaR (19) (48)
Total other VaR $ 66 $ 178
Diversification benefit to total IB and other VaR (40) (86)
Total IB and other VaR $ 202 $ 286
< (3
30)
< (3
30)
30 >
< 6
0
60 >
< 9
0
90 >
< 1
20
120
> <
150
150
> <
180
(150
) >
< (
120)
(240
) >
< (
210)
Daily IB market risk-related gains and lossesYear ended December 31, 2008(a)
Num
ber
of t
radi
ng d
ays
Average daily revenue: $31 million
0
5
10
15
20
25
30
35
0
5
10
15
20
25
30
35
0
5
10
15
20
25
30
35
$ in millions
4
8
12
16
20
< 0
0 >
< 3
0
30 >
< 6
0
60 >
< 9
060
> <
90
120
> <
150
> 2
40
$ in millions
Num
ber o
f tra
ding
day
s
Daily IB VaR less market risk-related losses
180
> <
210
240
> <
270
210
> <
240
(210
) >
< (
180)
270
> <
300
300
> <
330
0 >
< 3
0
(330
) >
< (
300)
(300
) >
< (
270)
(270
) >
< (
240)
0
> 33
0
(a) Includes seven months of Bear Stearns results.
(180
) >
< (
150)
(120
) >
< (
90)
(90)
> <
(60
)
(60)
> <
(30
)
(30)
> <
0
180
> <
210
90 >
< 1
20
150
> <
180
210
> <
240
The Firm’s new 95% VaR measure includes all the risk positionstaken into account under the 99% confidence level VaR measure, aswell as syndicated lending facilities the Firm intends to distribute(and, beginning in the fourth quarter of 2008, the credit spread sensitivities of certain mortgage products). The Firm utilizes proxies
to estimate the VaR for these mortgage and credit products sincedaily time series are largely not available. In addition, the new VaRmeasure includes certain actively managed positions utilized as partof the Firm’s risk management function within Corporate and in theConsumer Lending businesses to provide a total IB and other VaR
JPMorgan Chase & Co. / 2008 Annual Report 115
measure. In the Firm’s view, including these items in VaR produces amore complete perspective of the Firm’s risk profile for items withmarket risk that can impact the income statement. The ConsumerLending VaR includes the Firm’s mortgage pipeline and warehouseloans, MSRs and all related hedges.
The revised VaR measure continues to exclude the DVA taken onderivative and structured liabilities to reflect the credit quality of theFirm. It also excludes certain nontrading activity such as PrivateEquity, principal investing (e.g., mezzanine financing, tax-orientedinvestments, etc.) and Corporate balance sheet and capital manage-ment positions, as well as longer-term corporate investments.Corporate positions are managed through the Firm’s earnings-at-riskand other cash flow monitoring processes rather than by using a VaRmeasure. Nontrading principal investing activities and Private Equitypositions are managed using stress and scenario analyses.
Changing to the 95% confidence interval caused the average VaR todrop by $85 million in the third quarter when the new measure wasimplemented. Under the 95% confidence interval, the Firm wouldexpect to incur daily losses greater than those predicted by VaR esti-mates about twelve times a year.
The following table provides information about the sensitivity of DVAto a one basis point increase in JPMorgan Chase’s credit spreads. Thesensitivity of DVA at December 31, 2008, represents the Firm (includ-ing Bear Stearns), while the sensitivity of DVA for December 31,2007, represents heritage JPMorgan Chase only.
Debit Valuation Adjustment Sensitivity
1 Basis Point Increase in(in millions) JPMorgan Chase Credit Spread
December 31, 2008 $ 32December 31, 2007 $ 38
Loss advisories and drawdownsLoss advisories and drawdowns are tools used to highlight to seniormanagement trading losses above certain levels and initiate discus-sion of remedies.
Economic value stress testing While VaR reflects the risk of loss due to adverse changes in normalmarkets, stress testing captures the Firm’s exposure to unlikely butplausible events in abnormal markets. The Firm conducts economicvalue stress tests for both its trading and nontrading activities atleast every two weeks using multiple scenarios that assume creditspreads widen significantly, equity prices decline and interest ratesrise in the major currencies. Additional scenarios focus on the riskspredominant in individual business segments and include scenariosthat focus on the potential for adverse moves in complex portfolios.Periodically, scenarios are reviewed and updated to reflect changes inthe Firm’s risk profile and economic events. Along with VaR, stresstesting is important in measuring and controlling risk. Stress testingenhances the understanding of the Firm’s risk profile and loss poten-tial, and stress losses are monitored against limits. Stress testing isalso utilized in one-off approvals and cross-business risk measure-ment, as well as an input to economic capital allocation. Stress-test
results, trends and explanations are provided at least every twoweeks to the Firm’s senior management and to the lines of businessto help them better measure and manage risks and understandevent risk-sensitive positions.
Earnings-at-risk stress testingThe VaR and stress-test measures described above illustrate the totaleconomic sensitivity of the Firm’s balance sheet to changes in marketvariables. The effect of interest rate exposure on reported net incomeis also important. Interest rate risk exposure in the Firm’s core non-trading business activities (i.e., asset/liability management positions)results from on- and off-balance sheet positions and can occur dueto a variety of factors, including:
• Differences in the timing among the maturity or repricing ofassets, liabilities and off-balance sheet instruments. For example,if liabilities reprice quicker than assets and funding interest ratesare declining, earnings will increase initially.
• Differences in the amounts of assets, liabilities and off-balancesheet instruments that are repricing at the same time. For exam-ple, if more deposit liabilities are repricing than assets when gen-eral interest rates are declining, earnings will increase initially.
• Differences in the amounts by which short-term and long-termmarket interest rates change. For example, changes in the slopeof the yield curve because the Firm has the ability to lend atlong-term fixed rates and borrow at variable or short-term fixedrates. Based upon these scenarios, the Firm’s earnings would beaffected negatively by a sudden and unanticipated increase inshort-term rates paid on its liabilities (e.g., deposits) without acorresponding increase in long-term rates received on its assets(e.g., loans). Conversely, higher long-term rates received onassets generally are beneficial to earnings, particularly when theincrease is not accompanied by rising short-term rates paid onliabilities.
• The impact of changes in the maturity of various assets, liabilitiesor off-balance sheet instruments as interest rates change. Forexample, if more borrowers than forecasted pay down higher rateloan balances when general interest rates are declining, earningsmay decrease initially.
The Firm manages interest rate exposure related to its assets and lia-bilities on a consolidated, corporate-wide basis. Business units trans-fer their interest rate risk to Treasury through a transfer-pricing sys-tem, which takes into account the elements of interest rate exposurethat can be risk-managed in financial markets. These elementsinclude asset and liability balances and contractual rates of interest,contractual principal payment schedules, expected prepayment expe-rience, interest rate reset dates and maturities, rate indices used forre-pricing, and any interest rate ceilings or floors for adjustable rateproducts. All transfer-pricing assumptions are dynamically reviewed.
The Firm conducts simulations of changes in net interest incomefrom its nontrading activities under a variety of interest rate scenar-ios. Earnings-at-risk tests measure the potential change in the Firm’snet interest income, and the corresponding impact to the Firm’s pre-
Management’s discussion and analysis
116 JPMorgan Chase & Co. / 2008 Annual Report
tax earnings, over the following 12 months. These tests highlightexposures to various rate-sensitive factors, such as the rates them-selves (e.g., the prime lending rate), pricing strategies on deposits,optionality and changes in product mix. The tests include forecastedbalance sheet changes, such as asset sales and securitizations, aswell as prepayment and reinvestment behavior.
Immediate changes in interest rates present a limited view of risk,and so a number of alternative scenarios are also reviewed. Thesescenarios include the implied forward curve, nonparallel rate shiftsand severe interest rate shocks on selected key rates. These scenariosare intended to provide a comprehensive view of JPMorgan Chase’searnings-at-risk over a wide range of outcomes.
JPMorgan Chase’s 12-month pretax earnings sensitivity profile as ofDecember 31, 2008 and 2007, is as follows.
Immediate change in rates
(in millions) +200bp +100bp -100bp -200bp
December 31, 2008 $ 336 $ 672 $ NM(a) $ NM(a)
December 31, 2007 $ (26) $ 55 $ (308) $ (664)
(a) Down 100 and 200 basis point parallel shocks result in a Fed Funds target rate ofzero, and negative three- and six-month Treasury rates. The earnings-at-risk results ofsuch a low probability scenario are not meaningful (“NM”).
The change in earnings-at-risk from December 31, 2007, results froma higher level of AFS securities and lower market interest rates. Thebenefit to the Firm of an increase in rates results from a widening ofdeposit margins which are currently compressed due to very lowshort-term interest rates. This benefit would be partially offset by theeffect of reduced mortgage prepayments. The impact to the Firm’spretax earnings of reduced mortgage prepayments would becomemore pronounced under a +200 bp parallel shock.
Additionally, another sensitivity involving a steeper yield curve, withlong-term rates rising 100 basis points and short-term rates stayingat current levels, results in a 12-month pretax earnings benefit of$740 million. The increase in earnings is due to reinvestment ofmaturing assets at the higher long-term rates with funding costsremaining unchanged.
Risk identification for large exposures (“RIFLE”)Individuals who manage risk positions, particularly those that arecomplex, are responsible for identifying potential losses that couldarise from specific, unusual events, such as a potential tax change,and estimating the probabilities of losses arising from such events.This information is entered into the Firm’s RIFLE database.Management of trading businesses control RIFLE entries, thereby per-mitting the Firm to monitor further earnings vulnerability not ade-quately covered by standard risk measures.
Risk monitoring and controlLimitsMarket risk is controlled primarily through a series of limits. Limitsreflect the Firm’s risk appetite in the context of the market environ-ment and business strategy. In setting limits, the Firm takes into con-sideration factors such as market volatility, product liquidity, businesstrends and management experience.
Market risk management regularly reviews and updates risk limits.Senior management, including the Firm’s Chief Executive Officer andChief Risk Officer, is responsible for reviewing and approving risk lim-its at least once a year.
The Firm maintains different levels of limits. Corporate-level limitsinclude VaR and stress limits. Similarly, line-of-business limits includeVaR and stress limits and may be supplemented by loss advisories,nonstatistical measurements and instrument authorities. Businessesare responsible for adhering to established limits, against whichexposures are monitored and reported. Limit breaches are reportedin a timely manner to senior management, and the affected businesssegment is required to reduce trading positions or consult with sen-ior management on the appropriate action.
Qualitative reviewThe Market Risk Management group also performs periodic reviewsas necessary of both businesses and products with exposure to mar-ket risk to assess the ability of the businesses to control their marketrisk. Strategies, market conditions, product details and risk controlsare reviewed, and specific recommendations for improvements aremade to management.
Model reviewSome of the Firm’s financial instruments cannot be valued basedupon quoted market prices but are instead valued using pricing mod-els. Such models are used for management of risk positions, such asreporting against limits, as well as for valuation. The Model RiskGroup, independent of the businesses and market risk management,reviews the models the Firm uses and assesses model appropriate-ness and consistency. The model reviews consider a number of fac-tors about the model’s suitability for valuation and risk managementof a particular product, including whether it accurately reflects thecharacteristics of the transaction and its significant risks, the suitabili-ty and convergence properties of numerical algorithms, reliability ofdata sources, consistency of the treatment with models for similarproducts, and sensitivity to input parameters and assumptions thatcannot be priced from the market.
Reviews are conducted of new or changed models, as well as previ-ously accepted models, to assess whether there have been anychanges in the product or market that may impact the model’s validityand whether there are theoretical or competitive developments thatmay require reassessment of the model’s adequacy. For a summary ofvaluations based upon models, see Critical Accounting Estimates Usedby the Firm on pages 119–123 of this Annual Report.
Risk reportingNonstatistical exposures, value-at-risk, loss advisories and limitexcesses are reported daily for each trading and nontrading business.Market risk exposure trends, value-at-risk trends, profit and losschanges, and portfolio concentrations are reported weekly. Stress-test results are reported at least every two weeks to business andsenior management.
JPMorgan Chase & Co. / 2008 Annual Report 117
Risk managementThe Firm makes direct principal investments in private equity. Theilliquid nature and long-term holding period associated with theseinvestments differentiates private equity risk from the risk of posi-tions held in the trading portfolios. The Firm’s approach to managingprivate equity risk is consistent with the Firm’s general risk gover-nance structure. Controls are in place establishing expected levels fortotal and annual investment in order to control the overall size of theportfolio. Industry and geographic concentration limits are in placeand intended to ensure diversification of the portfolio. All invest-
ments are approved by an investment committee that includes exec-utives who are not part of the investing businesses. An independentvaluation function is responsible for reviewing the appropriateness ofthe carrying values of private equity investments in accordance withrelevant accounting policies. At December 31, 2008 and 2007, thecarrying value of the private equity businesses was $6.9 billion and$7.2 billion, respectively, of which $483 million and $390 million,respectively, represented publicly traded positions. For further infor-mation on the Private equity portfolio, see page 75 of this AnnualReport.
PR IVATE EQUITY R ISK MANAGEMENT
OPERAT IONAL R ISK MANAGEMENT
Operational risk is the risk of loss resulting from inadequate or failedprocesses or systems, human factors or external events.
OverviewOperational risk is inherent in each of the Firm’s businesses and sup-port activities. Operational risk can manifest itself in various ways,including errors, fraudulent acts, business interruptions, inappropriatebehavior of employees, or vendors that do not perform in accordancewith their arrangements. These events could result in financial lossesand other damage to the Firm, including reputational harm.
To monitor and control operational risk, the Firm maintains a systemof comprehensive policies and a control framework designed to pro-vide a sound and well-controlled operational environment. The goalis to keep operational risk at appropriate levels, in light of the Firm’sfinancial strength, the characteristics of its businesses, the markets inwhich it operates, and the competitive and regulatory environment towhich it is subject. Notwithstanding these control measures, the Firmincurs operational losses.
The Firm’s approach to operational risk management is intended tomitigate such losses by supplementing traditional control-basedapproaches to operational risk with risk measures, tools and disci-plines that are risk-specific, consistently applied and utilizedfirmwide. Key themes are transparency of information, escalation ofkey issues and accountability for issue resolution.
The Firm’s operational risk framework is supported by Phoenix, aninternally designed operational risk software tool. Phoenix integratesthe individual components of the operational risk managementframework into a unified, web-based tool. Phoenix enhances thecapture, reporting and analysis of operational risk data by enablingrisk identification, measurement, monitoring, reporting and analysisto be done in an integrated manner, thereby enabling efficiencies inthe Firm’s monitoring and management of its operational risk.
For purposes of identification, monitoring, reporting and analysis, theFirm categorizes operational risk events as follows:
• Client service and selection• Business practices• Fraud, theft and malice• Execution, delivery and process management• Employee disputes• Disasters and public safety• Technology and infrastructure failures
Risk identification and measurementRisk identification is the recognition of the operational risk eventsthat management believes may give rise to operational losses. Allbusinesses utilize the Firm’s standard self-assessment process andsupporting architecture as a dynamic risk management tool. The goalof the self-assessment process is for each business to identify the keyoperational risks specific to its environment and assess the degree towhich it maintains appropriate controls. Action plans are developedfor control issues identified, and businesses are held accountable fortracking and resolving these issues on a timely basis.
Risk monitoringThe Firm has a process for monitoring operational risk-event data,permitting analysis of errors and losses as well as trends. Such analy-sis, performed both at a line-of-business level and by risk-event type,enables identification of the causes associated with risk events facedby the businesses. Where available, the internal data can be supple-mented with external data for comparative analysis with industrypatterns. The data reported enables the Firm to back-test againstself-assessment results. The Firm is a founding member of theOperational Riskdata eXchange Association, a not-for-profit industryassociation formed for the purpose of collecting operational lossdata, sharing data in an anonymous form and benchmarking resultsback to members. Such information supplements the Firm’s ongoingoperational risk measurement and analysis.
Management’s discussion and analysis
118 JPMorgan Chase & Co. / 2008 Annual Report
Risk reporting and analysisOperational risk management reports provide timely and accurateinformation, including information about actual operational loss lev-els and self-assessment results, to the lines of business and seniormanagement. The purpose of these reports is to enable managementto maintain operational risk at appropriate levels within each line ofbusiness, to escalate issues and to provide consistent data aggrega-tion across the Firm’s businesses and support areas.
Audit alignment Internal Audit utilizes a risk-based program of audit coverage to pro-vide an independent assessment of the design and effectiveness ofkey controls over the Firm’s operations, regulatory compliance andreporting. This includes reviewing the operational risk framework, theeffectiveness and accuracy of the business self-assessment processand the loss data collection and reporting activities.
REPUTAT ION AND F IDUCIARY R ISK MANAGEMENT
A firm’s success depends not only on its prudent management of theliquidity, credit, market and operational risks that are part of its busi-ness risks, but equally on the maintenance among many constituents– clients, investors, regulators, as well as the general public – of areputation for business practices of the highest quality. Attention toreputation always has been a key aspect of the Firm’s practices, andmaintenance of the Firm’s reputation is the responsibility of everyoneat the Firm. JPMorgan Chase bolsters this individual responsibility inmany ways, including through the Firm’s Code of Conduct, training,maintaining adherence to policies and procedures, and oversightfunctions that approve transactions. These oversight functions includea Conflicts Office, which examines wholesale transactions with thepotential to create conflicts of interest for the Firm, and regional rep-utation risk review committees, which review certain transactionswith clients, especially complex derivatives and structured financetransactions, that have the potential to affect adversely the Firm’sreputation. These regional committees, whose members are seniorrepresentatives of businesses and control functions in the region,focus on the purpose and effect of the transactions from the client’spoint of view, with the goal that these transactions are not used tomislead investors or others.
Fiduciary risk managementThe risk management committees within each line of businessinclude in their mandate the oversight of the legal, reputational and,where appropriate, fiduciary risks in their businesses that may pro-duce significant losses or reputational damage. The Fiduciary RiskManagement function works with the relevant line-of-business riskcommittees with the goal of ensuring that businesses providinginvestment or risk management products or services that give rise tofiduciary duties to clients perform at the appropriate standard rela-tive to their fiduciary relationship with a client. Of particular focusare the policies and practices that address a business’ responsibilitiesto a client, including client suitability determination; disclosure obli-gations and communications; and performance expectations withrespect to risk management products or services being provided. Inthis way, the relevant line-of-business risk committees, together withthe Fiduciary Risk Management function, provide oversight of theFirm’s efforts to monitor, measure and control the risks that mayarise in the delivery of the products or services to clients that giverise to such fiduciary duties, as well as those stemming from any ofthe Firm’s fiduciary responsibilities to employees under the Firm’s var-ious employee benefit plans.
JPMorgan Chase & Co. / 2008 Annual Report 119
JPMorgan Chase’s accounting policies and use of estimates are inte-gral to understanding its reported results. The Firm’s most complexaccounting estimates require management’s judgment to ascertainthe value of assets and liabilities. The Firm has established detailedpolicies and control procedures intended to ensure that valuationmethods, including any judgments made as part of such methods,are well-controlled, independently reviewed and applied consistentlyfrom period to period. In addition, the policies and procedures areintended to ensure that the process for changing methodologiesoccurs in an appropriate manner. The Firm believes its estimates fordetermining the value of its assets and liabilities are appropriate. Thefollowing is a brief description of the Firm’s critical accounting esti-mates involving significant valuation judgments.
Allowance for credit losses JPMorgan Chase’s allowance for credit losses covers the wholesaleand consumer loan portfolios, as well as the Firm’s portfolio of lend-ing-related commitments. The allowance for credit losses is intendedto adjust the value of the Firm’s loan assets for probable credit lossesas of the balance sheet date. For further discussion of the method-ologies used in establishing the Firm’s allowance for credit losses,see Note 15 on pages 178–180 of this Annual Report.
Wholesale loans and lending-related commitments The methodology for calculating both the allowance for loan lossesand the allowance for lending-related commitments involves signifi-cant judgment. First and foremost, it involves the early identificationof credits that are deteriorating. Second, it involves judgment inestablishing the inputs used to estimate the allowances. Third, itinvolves management judgment to evaluate certain macroeconomicfactors, underwriting standards, and other relevant internal andexternal factors affecting the credit quality of the current portfolioand to refine loss factors to better reflect these conditions.
The Firm uses a risk-rating system to determine the credit quality ofits wholesale loans. Wholesale loans are reviewed for informationaffecting the obligor’s ability to fulfill its obligations. In assessing therisk rating of a particular loan, among the factors considered are theobligor’s debt capacity and financial flexibility, the level of the oblig-or’s earnings, the amount and sources for repayment, the level andnature of contingencies, management strength and the industry andgeography in which the obligor operates. These factors are basedupon an evaluation of historical and current information, and involvesubjective assessment and interpretation. Emphasizing one factorover another or considering additional factors could impact the riskrating assigned by the Firm to that loan.
The Firm applies its judgment to establish loss factors used in calcu-lating the allowances. Wherever possible, the Firm uses independent,verifiable data or the Firm’s own historical loss experience in its mod-els for estimating the allowances. Many factors can affect estimatesof loss, including volatility of loss given default, probability of defaultand rating migrations. Consideration is given as to whether the lossestimates should be calculated as an average over the entire credit
cycle or at a particular point in the credit cycle, as well as to whichexternal data should be used and when they should be used.Choosing data that are not reflective of the Firm’s specific loan port-folio characteristics could also affect loss estimates. The applicationof different inputs would change the amount of the allowance forcredit losses determined appropriate by the Firm.
Management also applies its judgment to adjust the loss factorsderived, taking into consideration model imprecision, external factorsand economic events that have occurred but are not yet reflected inthe loss factors by establishing ranges using historical experience ofboth loss given default and probability of default. Factors related toconcentrated and deteriorating industries also are incorporatedwhere relevant. These estimates are based upon management’s viewof uncertainties that relate to current macroeconomic and politicalconditions, quality of underwriting standards and other relevantinternal and external factors affecting the credit quality of the currentportfolio.
As noted on page 96 of this Annual Report, the Firm’s wholesaleallowance is sensitive to the risk rating assigned to a loan. Assuminga one-notch downgrade in the Firm’s internal risk ratings for itsentire wholesale portfolio, the allowance for loan losses for thewholesale portfolio would increase by approximately $1.8 billion asof December 31, 2008. This sensitivity analysis is hypothetical. In theFirm’s view, the likelihood of a one-notch downgrade for all whole-sale loans within a short timeframe is remote. The purpose of thisanalysis is to provide an indication of the impact of risk ratings onthe estimate of the allowance for loan losses for wholesale loans. Itis not intended to imply management’s expectation of future deterio-ration in risk ratings. Given the process the Firm follows in determin-ing the risk ratings of its loans, management believes the risk ratingscurrently assigned to wholesale loans are appropriate.
Consumer loans and lending-related commitmentsThe allowance for credit losses for the consumer portfolio is sensitiveto changes in the economic environment, delinquency status, creditbureau scores, the realizable value of collateral, borrower behaviorand other risk factors, and is intended to represent management'sbest estimate of incurred losses as of the balance sheet date. Thecredit performance of the consumer portfolio across the entire con-sumer credit product spectrum continues to be negatively affected bythe economic environment, as the weak labor market and weak over-all economic conditions have resulted in increased delinquencies,while continued weak housing prices have driven a significantincrease in loss severity. Significant judgment is required to estimatethe duration and severity of the current economic downturn, as wellas its potential impact on housing prices and the labor market. Whilethe allowance for credit losses is highly sensitive to both home pricesand unemployment rates, in the current market it is difficult to esti-mate how potential changes in one or both of these factors mightimpact the allowance for credit losses. For example, while both factorsare important determinants of overall allowance levels, changes inone factor or the other may not occur at the same rate, or changesmay be directionally inconsistent such that improvement in one factor
CRITICAL ACCOUNTING ESTIMATES USED BY THE FIRM
Management’s discussion and analysis
120 JPMorgan Chase & Co. / 2008 Annual Report
may offset deterioration in the other. In addition, changes in thesefactors would not necessarily be consistent across geographies orproduct types. Finally, it is difficult to predict the extent to whichchanges in both or either of these factors will ultimately impact thefrequency of losses, the severity of losses, or both, and overall lossrates are a function of both the frequency and severity of individualloan losses.
The allowance is calculated by applying statistical loss factors andother risk indicators to pools of loans with similar risk characteristicsto arrive at an estimate of incurred losses in the portfolio.Management applies judgment to the statistical loss estimates foreach loan portfolio category using delinquency trends and other riskcharacteristics to estimate charge-offs. Management utilizes addi-tional statistical methods and considers portfolio and collateral valu-ation trends to review the appropriateness of the primary statisticalloss estimate.
The statistical calculation is adjusted to take into considerationmodel imprecision, external factors and current economic events thathave occurred but are not yet reflected in the factors used to derivethe statistical calculation, and is accomplished in part by analyzingthe historical loss experience for each major product segment. In thecurrent economic environment, it is difficult to predict whether his-torical loss experience is indicative of future loss levels. Managementapplies judgment within estimated ranges in determining this adjust-ment, taking into account the numerous uncertainties inherent in thecurrent economic environment. The estimated ranges and the deter-mination of the appropriate point within the range are based uponmanagement’s judgment related to uncertainties associated with cur-rent macroeconomic and political conditions, quality of underwritingstandards, and other relevant internal and external factors affectingthe credit quality of the portfolio.
Fair value of financial instruments, MSRs and commoditiesinventory JPMorgan Chase carries a portion of it assets and liabilities at fairvalue. The majority of such assets and liabilities are carried at fairvalue on a recurring basis. In addition, certain assets are carried atfair value on a nonrecurring basis, including loans accounted for atthe lower of cost or fair value that are only subject to fair valueadjustments under certain circumstances.
On January 1, 2007, the Firm adopted SFAS 157, which established athree-level valuation hierarchy for disclosure of fair value measure-ments. An instrument’s categorization within the hierarchy is basedupon the lowest level of input that is significant to the fair valuemeasurement. Therefore, for instruments classified in levels 1 and 2of the hierarchy, where inputs are principally based on observablemarket data, there is less judgment applied in arriving at a fair valuemeasurement. For instruments classified within level 3 of the hierar-chy, judgments are more significant. The Firm reviews and updatesthe fair value hierarchy classifications on a quarterly basis. Changesfrom one quarter to the next related to the observability of inputs toa fair value measurement may result in a reclassification betweenhierarchy levels.
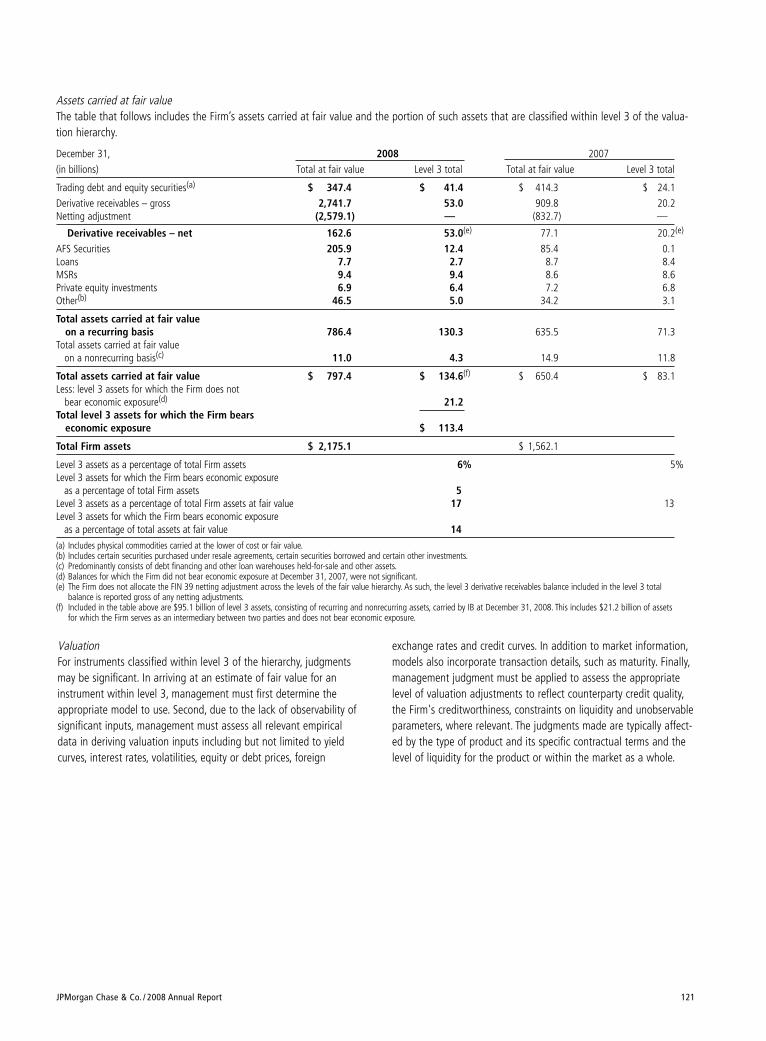
JPMorgan Chase & Co. / 2008 Annual Report 121
exchange rates and credit curves. In addition to market information,models also incorporate transaction details, such as maturity. Finally,management judgment must be applied to assess the appropriatelevel of valuation adjustments to reflect counterparty credit quality,the Firm's creditworthiness, constraints on liquidity and unobservableparameters, where relevant. The judgments made are typically affect-ed by the type of product and its specific contractual terms and thelevel of liquidity for the product or within the market as a whole.
Assets carried at fair valueThe table that follows includes the Firm’s assets carried at fair value and the portion of such assets that are classified within level 3 of the valua-tion hierarchy.
December 31, 2008 2007
(in billions) Total at fair value Level 3 total Total at fair value Level 3 total
Trading debt and equity securities(a) $ 347.4 $ 41.4 $ 414.3 $ 24.1
Derivative receivables – gross 2,741.7 53.0 909.8 20.2Netting adjustment (2,579.1) — (832.7) —
Derivative receivables – net 162.6 53.0(e) 77.1 20.2(e)
AFS Securities 205.9 12.4 85.4 0.1Loans 7.7 2.7 8.7 8.4MSRs 9.4 9.4 8.6 8.6Private equity investments 6.9 6.4 7.2 6.8Other(b) 46.5 5.0 34.2 3.1
Total assets carried at fair value on a recurring basis 786.4 130.3 635.5 71.3
Total assets carried at fair value on a nonrecurring basis(c) 11.0 4.3 14.9 11.8
Total assets carried at fair value $ 797.4 $ 134.6(f) $ 650.4 $ 83.1Less: level 3 assets for which the Firm does not
bear economic exposure(d) 21.2Total level 3 assets for which the Firm bears
economic exposure $ 113.4
Total Firm assets $ 2,175.1 $ 1,562.1
Level 3 assets as a percentage of total Firm assets 6% 5%Level 3 assets for which the Firm bears economic exposure
as a percentage of total Firm assets 5Level 3 assets as a percentage of total Firm assets at fair value 17 13Level 3 assets for which the Firm bears economic exposure
as a percentage of total assets at fair value 14(a) Includes physical commodities carried at the lower of cost or fair value.(b) Includes certain securities purchased under resale agreements, certain securities borrowed and certain other investments.(c) Predominantly consists of debt financing and other loan warehouses held-for-sale and other assets.(d) Balances for which the Firm did not bear economic exposure at December 31, 2007, were not significant.(e) The Firm does not allocate the FIN 39 netting adjustment across the levels of the fair value hierarchy. As such, the level 3 derivative receivables balance included in the level 3 total
balance is reported gross of any netting adjustments.(f) Included in the table above are $95.1 billion of level 3 assets, consisting of recurring and nonrecurring assets, carried by IB at December 31, 2008. This includes $21.2 billion of assets
for which the Firm serves as an intermediary between two parties and does not bear economic exposure.
ValuationFor instruments classified within level 3 of the hierarchy, judgmentsmay be significant. In arriving at an estimate of fair value for aninstrument within level 3, management must first determine theappropriate model to use. Second, due to the lack of observability ofsignificant inputs, management must assess all relevant empiricaldata in deriving valuation inputs including but not limited to yieldcurves, interest rates, volatilities, equity or debt prices, foreign
Management’s discussion and analysis
122 JPMorgan Chase & Co. / 2008 Annual Report
Imprecision in estimating unobservable market inputs can impact theamount of revenue or loss recorded for a particular position.Furthermore, while the Firm believes its valuation methods areappropriate and consistent with those of other market participants,the use of different methodologies or assumptions to determine thefair value of certain financial instruments could result in a differentestimate of fair value at the reporting date. For a detailed discussionof the determination of fair value for individual financial instruments,see Note 4 on pages 141–145 of this Annual Report. In addition, fora further discussion of the significant judgments and estimatesinvolved in the determination of the Firm’s mortgage-related expo-sures, see “Mortgage-related exposures carried at fair value” in Note4 on pages 151–153 of this Annual Report.
Purchased credit-impaired loansJPMorgan Chase acquired, in connection with the Washington Mutualtransaction, certain loans with evidence of deterioration of creditquality since origination and for which it was probable, at acquisition,that the Firm would be unable to collect all contractually requiredpayments receivable. These purchased credit-impaired loans areaccounted for in accordance with SOP 03-3. Many of the assumptionsand estimates underlying the application of SOP 03-3 are both signifi-cant and judgmental, particularly considering the current economicenvironment. The level of future home price declines, the duration andseverity of the current economic downturn and the lack of market liq-uidity and transparency are factors that have impacted and may con-tinue to impact these assumptions and estimates.
Determining which loans are included in the scope of SOP 03-3 ishighly subjective and requires the application of significant judgment.In the Washington Mutual transaction, consumer loans with certainattributes (e.g., higher loan-to-value ratios, borrowers with lower FICOscores, delinquencies) were determined to be credit-impaired, provid-ed that those attributes arose subsequent to loan origination.Wholesale loans were determined to be credit-impaired if they metthe definition of an impaired loan under SFAS 114 at the acquisitiondate. Applying SOP 03-3 to the appropriate population of loans isimportant because loans that are not within the scope of SOP 03-3are subject to different accounting standards. Choosing differentattributes in making the management assessment of which loanswere credit-impaired and within the scope of SOP 03-3 could haveresulted in a different (i.e., larger or smaller) population of loansdeemed credit-impaired at the transaction date.
Loans determined to be within the scope of SOP 03-3 are initiallyrecorded at fair value. The Firm has estimated the fair value of theseloans by discounting the cash flows expected to be collected at amarket observable discount rate, when available, adjusted for factorsthat a market participant would consider in determining fair value.The initial estimate of cash flows expected to be collected entails sig-nificant management judgment, as such cash flows were derived fromassumptions such as default rates, loss severities and the amount andtiming of prepayments. Particularly in the current economic environ-ment, estimating the initial fair value of these loans was highly sub-jective. The application of different assumptions by managementwould have resulted in different initial fair values.
The Firm has elected to aggregate the purchased credit-impaired con-sumer loans into pools of loans with common risk characteristics.Significant judgment is required in evaluating whether individualloans have common risk characteristics for purposes of establishingthese pools. Each resulting pool is considered one loan with a com-posite interest rate and estimation of cash flows expected to be col-lected for purposes of applying SOP 03-3 subsequent to acquisition.The process of estimating cash flows expected to be collected subse-quent to acquisition is both subjective and judgmental and may havean impact on the recognition and measurement of impairment lossesand/or interest income. In addition, the decision to pool these loansand the manner in which they were pooled may have an impact onthe recognition, measurement and/or classification of interest incomeand/or impairment losses.
Goodwill impairment Under SFAS 142, goodwill must be allocated to reporting units andtested for impairment. SFAS 142 defines reporting units of an entityas either SFAS 131 operating segments (i.e., one level below theSFAS 131 reportable segments as disclosed in Note 37 of this AnnualReport) or one level below the SFAS 131 operating segments.JPMorgan Chase generally determined its reporting units to be onelevel below the six major business segments identified in Note 37 onpages 226–227 of this Annual Report, plus Private Equity which isincluded in Corporate. This determination was based on how theFirm’s operating segments are managed and how they are reviewedby the Firm’s Operating Committee.
The Firm tests goodwill for impairment at least annually or more fre-quently if events or circumstances, such as adverse changes in thebusiness climate, indicate that there may be justification for conduct-ing an interim test. The first part of the test is a comparison, at thereporting unit level, of the fair value of each reporting unit to its car-rying amount, including goodwill. If the fair value is less than thecarrying value, then the second part of the test is needed to measurethe amount of potential goodwill impairment. The implied fair valueof the reporting unit goodwill is calculated and compared with thecarrying amount of goodwill recorded in the Firm’s financial records.If the carrying value of the reporting unit goodwill exceeds theimplied fair value of that goodwill, then the Firm would recognize animpairment loss in the amount of the difference, which would berecorded as a charge against net income.
If the fair value of the reporting unit in the first part of the test isdetermined to be greater than the carrying amount of the reportingunit including goodwill, then and in accordance with SFAS 142goodwill is deemed not to be impaired. During the fourth quarter of2008, the Firm performed its annual goodwill impairment testingand concluded that the fair value of each of its reporting units wasin excess of their respective carrying values including goodwill.Accordingly, the Firm concluded that its goodwill was not impairedat December 31, 2008.
JPMorgan Chase & Co. / 2008 Annual Report 123
The Firm considers discounted cash flow models to be its primarymethod of determining the fair value of its reporting units. The mod-els project levered cash flows for five years and use the perpetuitygrowth method to calculate terminal values. The first year’s projectedcash flows are based on the reporting units’ internal budget fore-casts for the upcoming calendar year (which are reviewed with theOperating Committee of the Firm). To assess the reasonableness ofthe valuations derived from the discounted cash flow models, theFirm also analyzes market-based trading and transaction multiples,where available. These trading and transaction comparables are usedto assess the reasonableness of the estimated fair values, as observ-able market information is generally not available.
JPMorgan Chase’s stock price, consistent with stock prices in thebroader financial services sector, declined significantly during the lasthalf of 2008. JPMorgan Chase’s market capitalization fell below itsrecorded book value, principally during the fourth quarter of 2008.Although the Firm believes it is reasonable to conclude that marketcapitalization could be an indicator of fair value over time, the Firmis of the view that short-term fluctuations in market capitalization donot reflect the long-term fair value of its reporting units.
Management applies significant judgment when determining the fairvalue of its reporting units. Imprecision in estimating the future cashflows of the Firm’s reporting units as well as the appropriate cost ofequity used to discount those cash flows can impact their estimatedfair values. If JPMorgan Chase’s common stock were to trade at thelevel it was at the end of 2008 over a sustained period and weakeconomic market conditions persist, these factors could indicate that
the long-term earnings potential of the Firm’s reporting units couldbe adversely affected – which could result in supplemental impair-ment testing during interim reporting periods and possible impair-ment of goodwill in the future.
Income taxesJPMorgan Chase is subject to the income tax laws of the various juris-dictions in which it operates, including U.S. federal, state and non-U.S.jurisdictions. These laws are often complex and may be subject to dif-ferent interpretations. To determine the financial statement impact ofits accounting for income taxes, including the provision for income taxexpense and its unrecognized tax benefits, JPMorgan Chase mustmake assumptions and judgments about how to interpret and applythese complex tax laws to numerous transactions and businessevents. Disputes over interpretations with the various taxing authori-ties may be settled upon audit or administrative appeals. In somecases, the Firm’s interpretations of tax laws may be subject to adjudi-cation by the court systems of the tax jurisdictions in which it oper-ates. JPMorgan Chase regularly reviews whether the Firm may beassessed additional income taxes as a result of the resolution of thesematters, and the Firm records additional reserves as appropriate.
The Firm does not anticipate that current market events will adverselyimpact the realizability of its deferred tax assets.
The Firm adjusts its unrecognized tax benefits as necessary whenadditional information becomes available. The reassessment ofJPMorgan Chase’s unrecognized tax benefits may have a materialimpact on its effective tax rate in the period in which it occurs.
ACCOUNTING AND REPORT ING DEVELOPMENTS
Derivatives netting – amendment of FASB InterpretationNo. 39 In April 2007, the FASB issued FSP FIN 39-1, which permits offset-ting of cash collateral receivables or payables with net derivativepositions under certain circumstances. The Firm adopted FSP FIN 39-1 effective January 1, 2008. The FSP did not have a material impacton the Firm’s Consolidated Balance Sheets.
Accounting for income tax benefits of dividends on share-based payment awards In June 2007, the FASB ratified EITF 06-11, which must be appliedprospectively for dividends declared in fiscal years beginning afterDecember 15, 2007. EITF 06-11 requires that realized tax benefitsfrom dividends or dividend equivalents paid on equity-classifiedshare-based payment awards that are charged to retained earningsbe recorded as an increase to additional paid-in capital and includedin the pool of excess tax benefits available to absorb tax deficiencieson share-based payment awards. Prior to the issuance of EITF 06-11,the Firm did not include these tax benefits as part of this pool ofexcess tax benefits. The Firm adopted EITF 06-11 on January 1,2008. The adoption of this consensus did not have an impact on theFirm’s Consolidated Balance Sheets or results of operations.
Fair value measurements – written loan commitments In November 2007, the SEC issued SAB 109, which revises andrescinds portions of SAB 105. Specifically, SAB 109 states that theexpected net future cash flows related to the associated servicing ofthe loan should be included in the measurement of all written loancommitments that are accounted for at fair value through earnings.The provisions of SAB 109 are applicable to written loan commit-ments issued or modified beginning on January 1, 2008. The Firmadopted SAB 109 on January 1, 2008. The adoption of this pro-nouncement did not have a material impact on the Firm’sConsolidated Balance Sheets or results of operations.
Business combinations/noncontrolling interests in consoli-dated financial statements In December 2007, the FASB issued SFAS 141R and SFAS 160, whichamend the accounting and reporting of business combinations, aswell as noncontrolling (i.e., minority) interests. For JPMorgan Chase,SFAS 141R is effective for business combinations that close on orafter January 1, 2009. SFAS 160 is effective for JPMorgan Chase forfiscal years beginning on or after December 15, 2008.
Management’s discussion and analysis
124 JPMorgan Chase & Co. / 2008 Annual Report
SFAS 141R will generally only impact the accounting for future busi-ness combinations and will impact certain aspects of business combi-nation accounting, such as transaction costs and certain merger-related restructuring reserves, as well as the accounting for partialacquisitions where control is obtained by JPMorgan Chase. Oneexception to the prospective application of SFAS 141R relates toaccounting for income taxes associated with business combinationsthat closed prior to January 1, 2009. Once the purchase accountingmeasurement period closes for these acquisitions, any further adjust-ments to income taxes recorded as part of these business combina-tions will impact income tax expense. Previously, further adjustmentswere predominately recorded as adjustments to Goodwill. JPMorganChase will continue to evaluate the impact that SFAS 141R will haveon its consolidated financial statements.
SFAS 160 requires that noncontrolling interests be accounted for andpresented as equity, rather than as a liability or mezzanine equity.Changes to how the income statement is presented will also result.SFAS 160 presentation and disclosure requirements are to be appliedretrospectively. The adoption of this pronouncement is not expectedto have a material impact on the Firm’s Consolidated Balance Sheets,results of operations or ratios.
Accounting for transfers of financial assets and repurchasefinancing transactionsIn February 2008, the FASB issued FSP FAS 140-3, which requires aninitial transfer of a financial asset and a repurchase financing thatwas entered into contemporaneously with, or in contemplation of,the initial transfer to be evaluated together as a linked transactionunder SFAS 140, unless certain criteria are met. The Firm adoptedFSP FAS 140-3 on January 1, 2009, for new transactions entered intoafter the date of adoption. The adoption of FSP FAS 140-3 is notexpected to have a material impact on the Consolidated BalanceSheets or results of operations.
Disclosures about derivative instruments and hedging activ-ities – FASB Statement No. 161In March 2008, the FASB issued SFAS 161, which amends the disclo-sure requirements of SFAS 133. SFAS 161 requires increased disclo-sures about derivative instruments and hedging activities and theireffects on an entity’s financial position, financial performance andcash flows. SFAS 161 is effective for fiscal years beginning afterNovember 15, 2008, with early adoption permitted. SFAS 161 willonly affect JPMorgan Chase’s disclosures of derivative instrumentsand related hedging activities, and not its Consolidated BalanceSheets, Consolidated Statements of Income or ConsolidatedStatements of Cash Flows.
Determining whether instruments granted in share-basedpayment transactions are participating securitiesIn June 2008, the FASB issued FSP EITF 03-6-1, which addresseswhether instruments granted in share-based payment transactionsare participating securities prior to vesting and, therefore, need to beincluded in the earnings allocation in computing earnings per shareunder the two-class method. FSP EITF 03-6-1 is effective for financialstatements issued for fiscal years beginning after December 15,2008, and interim periods within those years. Adoption of FSP EITF03-6-1 does not affect net income or results of operations but mayresult in a reduction of basic and/or diluted earnings per share incertain periods.
Disclosures about credit derivatives and certain guaranteesIn September 2008, the FASB issued FSP FAS 133-1 and FIN 45-4. TheFSP requires enhanced disclosures about credit derivatives and guar-antees to address the potential adverse effects of changes in creditrisk on the financial position, financial performance and cash flowsof the sellers of these instruments. The FSP is effective for reportingperiods ending after November 15, 2008, with earlier applicationpermitted. The disclosures required by this FSP are incorporated inthis Annual Report. FSP FAS 133-1 and FIN 45-4 only affectsJPMorgan Chase’s disclosures of credit derivatives and guaranteesand not its Consolidated Balance Sheets, Consolidated Statements ofIncome or Consolidated Statements of Cash Flows.
Determining whether an instrument (or embedded feature)is indexed to an entity’s own stockIn September 2008, the EITF issued EITF 07-5, which establishes atwo-step process for evaluating whether equity-linked financialinstruments and embedded features are indexed to a company’s ownstock for purposes of determining whether the derivative scopeexception in SFAS 133 should be applied. EITF 07-5 is effective forfiscal years beginning after December 2008. The adoption of thisEITF is not expected to have a material impact on the Firm’sConsolidated Balance Sheets or results of operations.
Accounting for transfers of financial assets and consolida-tion of variable interest entitiesThe FASB has been deliberating certain amendments to both SFAS140 and FIN 46R that may impact the accounting for transactionsthat involve QSPEs and VIEs. Among other things, the FASB is pro-posing to eliminate the concept of QSPEs from both SFAS 140 andFIN 46R and make key changes to the consolidation model of FIN46R that will change the method of determining which party to a VIEshould consolidate the VIE. A final standard is expected to be issuedin the second quarter of 2009, with an
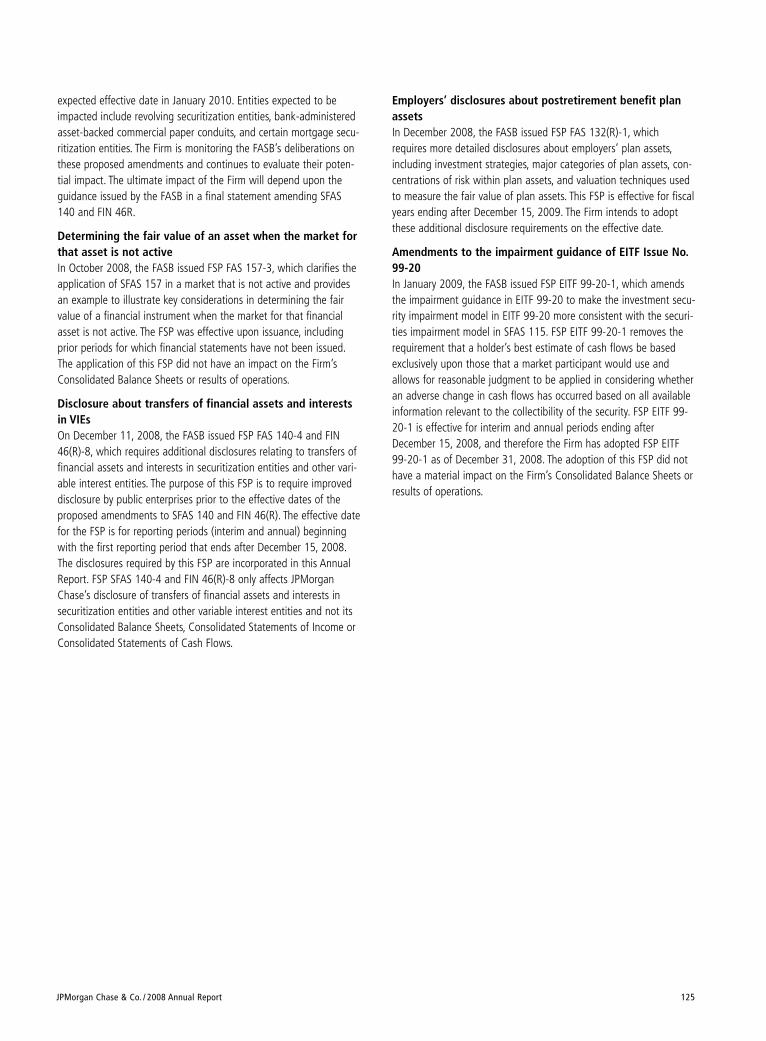
JPMorgan Chase & Co. / 2008 Annual Report 125
expected effective date in January 2010. Entities expected to beimpacted include revolving securitization entities, bank-administeredasset-backed commercial paper conduits, and certain mortgage secu-ritization entities. The Firm is monitoring the FASB’s deliberations onthese proposed amendments and continues to evaluate their poten-tial impact. The ultimate impact of the Firm will depend upon theguidance issued by the FASB in a final statement amending SFAS140 and FIN 46R.
Determining the fair value of an asset when the market forthat asset is not active In October 2008, the FASB issued FSP FAS 157-3, which clarifies theapplication of SFAS 157 in a market that is not active and providesan example to illustrate key considerations in determining the fairvalue of a financial instrument when the market for that financialasset is not active. The FSP was effective upon issuance, includingprior periods for which financial statements have not been issued.The application of this FSP did not have an impact on the Firm’sConsolidated Balance Sheets or results of operations.
Disclosure about transfers of financial assets and interestsin VIEsOn December 11, 2008, the FASB issued FSP FAS 140-4 and FIN46(R)-8, which requires additional disclosures relating to transfers offinancial assets and interests in securitization entities and other vari-able interest entities. The purpose of this FSP is to require improveddisclosure by public enterprises prior to the effective dates of theproposed amendments to SFAS 140 and FIN 46(R). The effective datefor the FSP is for reporting periods (interim and annual) beginningwith the first reporting period that ends after December 15, 2008.The disclosures required by this FSP are incorporated in this AnnualReport. FSP SFAS 140-4 and FIN 46(R)-8 only affects JPMorganChase’s disclosure of transfers of financial assets and interests insecuritization entities and other variable interest entities and not itsConsolidated Balance Sheets, Consolidated Statements of Income orConsolidated Statements of Cash Flows.
Employers’ disclosures about postretirement benefit planassetsIn December 2008, the FASB issued FSP FAS 132(R)-1, whichrequires more detailed disclosures about employers’ plan assets,including investment strategies, major categories of plan assets, con-centrations of risk within plan assets, and valuation techniques usedto measure the fair value of plan assets. This FSP is effective for fiscalyears ending after December 15, 2009. The Firm intends to adoptthese additional disclosure requirements on the effective date.
Amendments to the impairment guidance of EITF Issue No.99-20In January 2009, the FASB issued FSP EITF 99-20-1, which amendsthe impairment guidance in EITF 99-20 to make the investment secu-rity impairment model in EITF 99-20 more consistent with the securi-ties impairment model in SFAS 115. FSP EITF 99-20-1 removes therequirement that a holder’s best estimate of cash flows be basedexclusively upon those that a market participant would use andallows for reasonable judgment to be applied in considering whetheran adverse change in cash flows has occurred based on all availableinformation relevant to the collectibility of the security. FSP EITF 99-20-1 is effective for interim and annual periods ending afterDecember 15, 2008, and therefore the Firm has adopted FSP EITF99-20-1 as of December 31, 2008. The adoption of this FSP did nothave a material impact on the Firm’s Consolidated Balance Sheets orresults of operations.
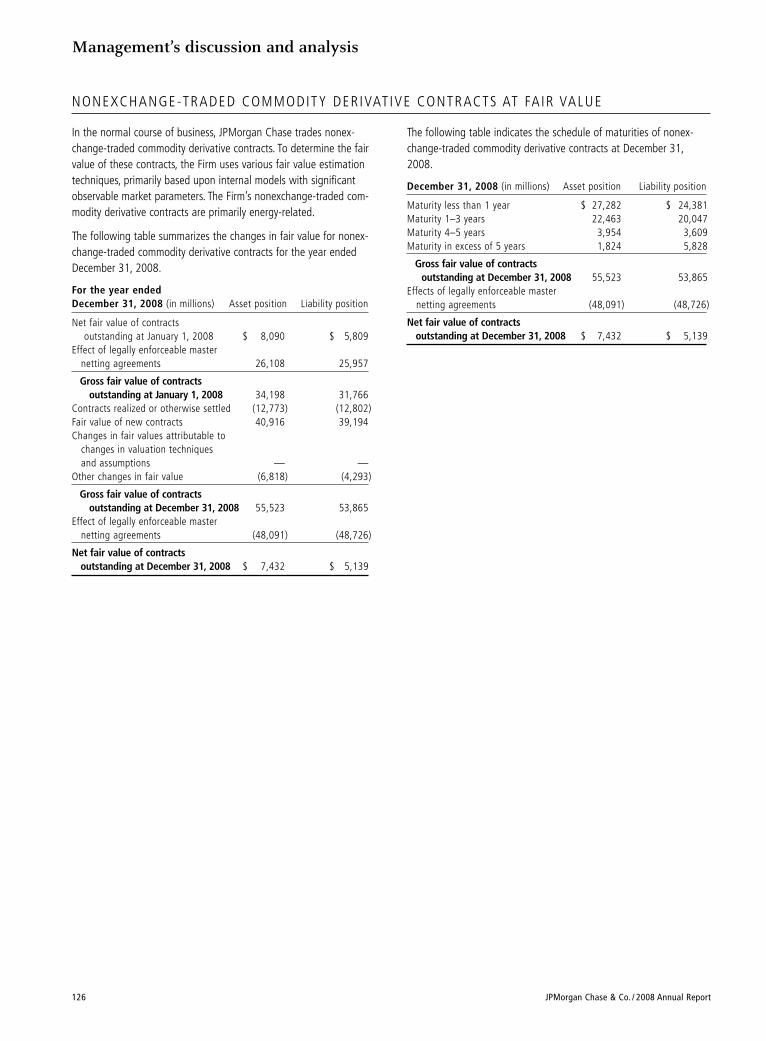
Management’s discussion and analysis
126 JPMorgan Chase & Co. / 2008 Annual Report
In the normal course of business, JPMorgan Chase trades nonex-change-traded commodity derivative contracts. To determine the fairvalue of these contracts, the Firm uses various fair value estimationtechniques, primarily based upon internal models with significantobservable market parameters. The Firm’s nonexchange-traded com-modity derivative contracts are primarily energy-related.
The following table summarizes the changes in fair value for nonex-change-traded commodity derivative contracts for the year endedDecember 31, 2008.
For the year ended December 31, 2008 (in millions) Asset position Liability position
Net fair value of contracts outstanding at January 1, 2008 $ 8,090 $ 5,809
Effect of legally enforceable masternetting agreements 26,108 25,957
Gross fair value of contracts outstanding at January 1, 2008 34,198 31,766
Contracts realized or otherwise settled (12,773) (12,802)Fair value of new contracts 40,916 39,194Changes in fair values attributable to
changes in valuation techniques and assumptions — —
Other changes in fair value (6,818) (4,293)
Gross fair value of contracts outstanding at December 31, 2008 55,523 53,865
Effect of legally enforceable masternetting agreements (48,091) (48,726)
Net fair value of contracts outstanding at December 31, 2008 $ 7,432 $ 5,139
The following table indicates the schedule of maturities of nonex-change-traded commodity derivative contracts at December 31,2008.
December 31, 2008 (in millions) Asset position Liability position
Maturity less than 1 year $ 27,282 $ 24,381Maturity 1–3 years 22,463 20,047Maturity 4–5 years 3,954 3,609Maturity in excess of 5 years 1,824 5,828
Gross fair value of contracts outstanding at December 31, 2008 55,523 53,865
Effects of legally enforceable master netting agreements (48,091) (48,726)
Net fair value of contracts outstanding at December 31, 2008 $ 7,432 $ 5,139
NONEXCHANGE-TRADED COMMODITY DER IVAT IVE CONTRACTS AT FA IR VALUE

JPMorgan Chase & Co. / 2008 Annual Report 127
From time to time, the Firm has made and will make forward-lookingstatements. These statements can be identified by the fact that theydo not relate strictly to historical or current facts. Forward-lookingstatements often use words such as “anticipate,” “target,” “expect,”“estimate,” “intend,” “plan,” “goal,” “believe,” or other words ofsimilar meaning. Forward-looking statements provide JPMorganChase’s current expectations or forecasts of future events, circum-stances, results or aspirations. JPMorgan Chase’s disclosures in thisAnnual Report contain forward-looking statements within the mean-ing of the Private Securities Litigation Reform Act of 1995. The Firmalso may make forward-looking statements in its other documentsfiled or furnished with the SEC. In addition, the Firm’s senior man-agement may make forward-looking statements orally to analysts,investors, representatives of the media and others.
All forward-looking statements are, by their nature, subject to risksand uncertainties, many of which are beyond the Firm’s control.JPMorgan Chase’s actual future results may differ materially fromthose set forth in its forward-looking statements. While there is noassurance that any list of risks and uncertainties or risk factors iscomplete, below are certain factors which could cause actual resultsto differ from those in the forward-looking statements.
• local, regional and international business, economic and politicalconditions and geopolitical events;
• changes in trade, monetary and fiscal policies and laws;
• securities and capital markets behavior, including changes in mar-ket liquidity and volatility;
• changes in investor sentiment or consumer spending or savingbehavior;
• ability of the Firm to manage effectively its liquidity;
• credit ratings assigned to the Firm or its subsidiaries;
• the Firm’s reputation;
• ability of the Firm to deal effectively with an economic slowdownor other economic or market difficulty;
• technology changes instituted by the Firm, its counterparties orcompetitors;
• mergers and acquisitions, including the Firm’s ability to integrateacquisitions;
• ability of the Firm to develop new products and services;
• acceptance of the Firm’s new and existing products and servicesby the marketplace and the ability of the Firm to increase marketshare;
• ability of the Firm to attract and retain employees;
• ability of the Firm to control expense;
• competitive pressures;
• changes in the credit quality of the Firm’s customers and counter-parties;
• adequacy of the Firm’s risk management framework;
• changes in laws and regulatory requirements or adverse judicialproceedings;
• changes in applicable accounting policies;
• ability of the Firm to determine accurate values of certain assetsand liabilities;
• occurrence of natural or man-made disasters or calamities orconflicts, including any effect of any such disasters, calamities orconflicts on the Firm’s power generation facilities and the Firm’sother commodity-related activities;
• the other risks and uncertainties detailed in Part 1, Item 1A: RiskFactors in the Firm’s Annual Report on Form 10-K for the yearended December 31, 2008.
Any forward-looking statements made by or on behalf of the Firmspeak only as of the date they are made, and JPMorgan Chase doesnot undertake to update forward-looking statements to reflect theimpact of circumstances or events that arise after the date the for-ward-looking statement was made. The reader should, however, con-sult any further disclosures of a forward-looking nature the Firm maymake in any subsequent Annual Reports on Form 10-K, QuarterlyReports on Form 10-Q, or Current Reports on Form 8-K.
FORWARD-LOOKING STATEMENTS