Embed Size (px)
Citation preview
Management’s Discussion and Analysis
1 | P a g e
MOGO FINANCE TECHNOLOGY INC.
MANAGEMENT’S DISCUSSION AND ANALYSIS
FOR THE YEAR ENDED DECEMBER 31, 2015
DATED: MARCH 15, 2016
Management’s Discussion and Analysis
2 | P a g e
Table of Contents
Non-IFRS Financial Measures 3
Caution Regarding Forward-looking Statements 3
Company Overview 5
Vision and Strategy 5
Recent Corporate Event 6
Full-Year 2015 Financial Highlights 6
Fourth Quarter Financial Highlights 7
Fourth-Quarter and Full-Year Business Highlights 8
Outlook 9
Financial Performance Review 10
Liquidity and Capital Resources 28
Risk Management 31
Reconciliation of Non IFRS Measures 32
Critical Accounting Policies and Estimates 36
Controls and Procedures 39
Risk Factors 39
Management’s Discussion and Analysis
3 | P a g e
MANAGEMENT’S DISCUSSION AND ANALYSIS
The Management’s Discussion and Analysis (“MD&A”) presents an analysis of the financial condition of Mogo Finance
Technology Inc. and its subsidiaries (collectively referred to as “Mogo” or the “Company”) as at December 31, 2015
compared to December 31, 2014. This MD&A should be read in conjunction with the Company’s audited annual
consolidated financial statements and the related notes for the year ended December 31, 2015. The financial information
presented in this MD&A is derived from our annual financial statements prepared in accordance with International
Financial Reporting Standards (“IFRS”) as issued by the International Accounting Standards Board (“IASB”).
This MD&A is the responsibility of management. Prior to its release, the Board of Directors has approved this MD&A on the
Audit Committee’s recommendation.
Unless otherwise noted or the context indicates otherwise “we”, “us”, “our”, the “Company” or “Mogo” refer to Mogo
Finance Technology Inc. and its direct and indirect subsidiaries. The Company presents its consolidated financial
statements in Canadian dollars. Amounts in this MD&A are stated in Canadian dollars unless otherwise indicated.
This MD&A may refer to trade-marks, trade names and material which is subject to copyright, such as “Mogo” and “Mogo
Finance Technology”, which are protected under applicable intellectual property laws and are the property of Mogo. Solely
for convenience, our trade-marks, trade names and copyrighted material referred to in this MD&A may appear without the ®
or © symbol, but such references are not intended to indicate, in any way, that we will not assert, to the fullest extent under
applicable law, our rights to these trade-marks, trade names and copyrights. All other trade-marks used in this MD&A are the
property of their respective owners.
The Company’s continuous disclosure materials, including interim filings, audited consolidated financial statements, Annual
Information Form and additional information relating to Mogo Finance Technology Inc. can be found on SEDAR at
www.sedar.com and on the Company’s website at www.mogo.ca.
This MD&A is dated March 15, 2016. Except where otherwise indicated, the information contained in this MD&A is stated
as of December 31, 2015.
Non-IFRS Financial Measures
This MD&A makes reference to certain non-IFRS financial measures. These measures are not recognized measures under
IFRS, do not have a standardized meaning prescribed by IFRS and are therefore unlikely to be comparable to similar
measures presented by other companies. Rather, these measures are provided as additional information to complement those
IFRS measures by providing further understanding of the Company’s results of operations from management’s perspective.
Accordingly, they should not be considered in isolation nor as a substitute for analysis of our financial information reported
under IFRS. We use non-IFRS financial measures, including loan originations, gross loans receivable (short-term and long-
term), contribution, contribution margin, adjusted EBITDA and provision rate, and cash provided by (used in) operating
activities before investment in loans receivable, to provide investors with supplemental measures of our operating
performance and thus highlight trends in our core business that may not otherwise be apparent when relying solely on IFRS
financial measures. We believe that securities analysts, investors and other interested parties frequently use non-IFRS
financial measures in the evaluation of issuers. Our management also uses non-IFRS financial measures in order to facilitate
operating performance comparisons from period to period, prepare annual operating budgets and assess our ability to meet
our capital expenditure and working capital requirements. See “Key Performance Indicators” and “Reconciliation of
Non-IFRS Financial Measures”.
Caution Regarding Forward-Looking Statements
This MD&A contains forward-looking statements that relate to the Company’s current expectations and views of future
events. In some cases, these forward-looking statements can be identified by words or phrases such as “may”, “might”,
“will”, “expect”, “anticipate”, “estimate”, “intend”, “plan”, “indicate”, “seek”, “believe”, “predict” or “likely”, or the
negative of these terms, or other similar expressions intended to identify forward-looking statements. The Company has
Management’s Discussion and Analysis
4 | P a g e
based these forward-looking statements on its current expectations and projections about future events and financial trends
that it believes might affect its financial condition, results of operations, business strategy and financial needs. These
forward-looking statements include, among other things, statements relating to the Company’s expectations regarding its
revenue (including loan interest), expenses and operations, key performance indicators, provision for loan losses (net of
recoveries), delinquencies ratios, anticipated cash needs and its needs for additional financing, funding costs, ability to extend
or refinance any outstanding amounts under the Company’s credit facilities, ability to protect, maintain and enforce its
intellectual property, plans for and timing of expansion of its solution and services, future growth plans, ability to attract new
customers and develop and maintain existing customers, ability to attract and retain personnel, expectations with respect to
advancement of its product offering, competitive position and the regulatory environment in which the Company operates,
anticipated trends and challenges in the Company’s business and the markets in which it operates, third-party claims of
infringement or violation of, or other conflicts with, intellectual property rights, the resolution of any legal matters, and the
acceptance by the Company’s customers and the marketplace of new technologies and solutions.
Forward-looking statements are based on certain assumptions and analyses made by the Company in light of the experience
and perception of historical trends, current conditions and expected future developments and other factors it believes are
appropriate. By their very nature, these statements require the Company to make assumptions and are subject to inherent risks
and uncertainties, general and specific, which may cause actual results to differ materially from the expectations expressed in
the forward-looking statements. Given these risks, uncertainties and assumptions, any investors or users of this document
should not place undue reliance on these forward-looking statements.
Whether actual results, performance or achievements will conform to the Company’s expectations and predictions is subject
to a number of known and unknown risks, uncertainties, assumptions and other factors that are discussed in greater detail in
the “Risk Factors” section in this MD&A, including but not limited to risks related to: our limited operating history in an
evolving industry; our recent, rapid growth; our history of losses; our efforts to expand our market reach and product
portfolio; changes in the regulatory environment; risks related to privacy; economic conditions; material changes to the
interest rate charged to our customers and paid to our lenders; disruptions in the credit markets; an increase in customer
default rates; our negative operating cash flow; our ability to access additional capital through issuances of equity and
debt securities; the concentration of our debt funding sources and our ability to access additional capital from those sources;
the financial covenants under our credit facilities; security breaches of customers’ confidential information; our ability to
collect payment on our loans and maintain accurate accounts; a decline in demand for our loans; our loan products achieving
sufficient market acceptance; protecting our intellectual property rights; claims by third parties for alleged infringement of
their intellectual property rights; the use of open source software and any failure to comply with the terms of open
source licenses; serious errors or defects in our software and attacks or security breaches; the reliability of our credit scoring
model; access to reliable third-party data; our risk management efforts; our levels of indebtedness; the adequacy of our
allowance for loan losses; our marketing efforts and ability to increase brand awareness; customer complaints and negative
publicity; misconduct and/or errors by our employees and third-party service providers; our ability to collect payment on and
service the loans we make to our customers; our reliance on data centres to deliver our services and any disruption thereof;
competition in our industry; the reliability of information provided by customers; competition for employees; preserving our
corporate culture; our ability to utilize a significant portion of our net operating loss carryforwards; risks related to litigation;
earthquakes, fire, power outages, flood, and other catastrophic events, and interruption by man-made problems such
as terrorism.
Although the forward-looking statements contained in this MD&A are based upon what our management believes are
reasonable assumptions, these risks, uncertainties, assumptions and other factors could cause our actual results, performance,
achievements and experience to differ materially from our expectations, future results, performances or achievements
expressed or implied by the forward-looking statements.
The forward-looking statements made in this MD&A relate only to events or information as of the date on which the
statements are made in this MD&A and are expressly qualified in their entirety by this cautionary statement. Except as
required by law, we do not assume any obligation to update or revise any forward-looking statements, whether as a result of
new information, future event or otherwise, after the date on which the statements are made or to reflect the occurrence of
unanticipated events.
Management’s Discussion and Analysis
5 | P a g e
An investor should read this MD&A with the understanding that our actual future results may be materially different from
what we expect.
This MD&A may contain Future Oriented Financial Information (“FOFI”) within the meaning of applicable securities laws.
The FOFI has been prepared by our management to provide an outlook of our activities and results and may not be
appropriate for other purposes. The FOFI has been prepared based on a number of assumptions including the assumptions
discussed under the heading “Forward-Looking Statements”. The actual results of our operations and the resulting financial
results may vary from the amounts set forth herein, and such variation may be material. Our management believes that the
FOFI has been prepared on a reasonable basis, reflecting management’s best estimates and judgments.
Company Overview
Mogo is a financial technology company building a digital financial brand for the next generation of Canadians by leveraging
technology and design to bring a new level of convenience, simplicity and value to consumer financial services. With over
186 thousand Mogo Members and over 1.2 million loans originated, we are leading the shift in Canada as consumers begin to
move away from traditional banking services towards a frictionless digital experience. We are transforming financial
services by building the first digital platform designed to give Canadians convenient and controlled access to a range of
financial products that make it easier stay in control of their financial health. Our initial target market is consumer credit. Our
technology platform provides consumers with quick and efficient access to responsible credit solutions. We leverage big data
algorithms and the latest technologies to greatly simplify and enhance the customer experience. We believe that a
technology-powered online lender has many advantages over current financial services providers, providing a more efficient
and effective delivery of credit solutions. With personal loans that help you get out of debt, and a free prepaid Visa card that
helps Canadians control their spending, we’re building digital financial brand that empowers a whole new generation of
Canadians.
Vision and Strategy
Our vision is to continue to build out our financial technology platform and product offering bringing consumers a new level
of convenience, simplicity and transparency as the standard for a completely digital financial experience and to become one
of the top consumer financial brands in Canada.
The top 6 Canadian banks made a combined profit of approximately $35 billion in 2015 and as noted in a recent Mckinsey
report are at risk of losing up to 60% of their retail profits by 2025 to new FinTech companies. Ernst and Young’s recent
FinTech adoption survey(1) also noted that consumers adoption of more convenient financial solutions offered by new
technology companies continues to grow globally and believe the adoption rate in Canada could double within the next 12
months.
We believe we have the lead in building out a digital financial technology platform and brand that offers consumers an
attractive digital alternative to banks. Our strategy is guided by three main pillars: Product, Platform and Brand. As such,
we will continue to focus on investing and building out each of these elements which we believe will optimize both long-term
profitability and shareholder value.
________________________________________
(1) Refer to EY FinTech Adoption Index, http://www.ey.com/GL/en/Industries/Financial-Services/ey-fintech-adoption-index
Management’s Discussion and Analysis
6 | P a g e
Recent Corporate Events
Marketing Collaboration Agreement with Postmedia Network Inc.
The Company and Postmedia Network Inc. (“Postmedia”) have entered into a three-year Marketing Collaboration Agreement
(the “Agreement”) effective January 25, 2016, where Postmedia will provide Mogo with a minimum value of $50 million of
promotional commitments in exchange for revenue sharing and equity participation through warrants in Mogo. The
Agreement can be terminated under certain circumstances by either party after the first anniversary. The initial term may be
extended a further two years by mutual consent.
Mogo will be able to use the promotional commitments to market and advertise its products and services across more than
200 of Postmedia’s print, media, and online properties across Canada. The Agreement provides that Mogo will pay
Postmedia a performance-based revenue share equal to 4% of its existing revenues and 11% of its incremental revenues
subject to certain adjustments in accordance with the terms and conditions of the Agreement. Mogo has also issued
Postmedia five-year warrants to acquire 1,196,120 common shares of Mogo at an exercise price of $2.96. One half, 50%, of
the warrants vest in equal instalments over three years while the remaining 50% vest in three equal instalments based on
Mogo achieving certain quarterly revenue targets. Postmedia will pay Mogo a subscription price of $1.2 million for the
warrants. Mogo will pay a set-up fee as soon as is practical following the effective date of the Agreement in the amount of
$1.17 million.
Full-Year 2015 Financial Highlights
• Revenue for 2015 increased 86% to $43.5 million, driven by the success of the Company’s line-of-credit and
installment loan products.
• Gross profit grew to $27.1 million (62% of revenue) in 2015 from $14.8 million (63% of revenue) in 2014.
• Reported positive Contribution(1) of $14.9 million for 2015, up by 95% from 2014.
• Adjusted EBITDA(1) of ($7.7) million in 2015, compared with ($3.4) million for 2014.
• Loan Loss Provision rate (1) decreased to 4.5% for 2015, from 4.6% in 2014.
• Completed initial public offering, raising gross proceeds of $50 million.
• Finalized new expandable credit facility of up to $200 million under certain conditions, to finance the continued
expansion of our consumer installment loans.
• Net losses for 2015 increased to $21.3 million from $13.1 million in 2014 due largely to the increase of
operating expenses and funding interest expenses reflecting the significant investment in our technology
platform, brand and loan portfolio.
_______________________________________
(1) Contribution, adjusted EBITDA, loan loss provision rate and loan origination are non IFRS financial measures. For more information regarding our use of these
measures and, where applicable, a reconciliation to the most comparable IFRS measure, see “Non-IFRS Financial Measures” and “Reconciliation of Non IFRS
Financial Measures”.
Management’s Discussion and Analysis
7 | P a g e
($000s, except percentages and per share amounts)
2015 2014 2013
Percentage change
2015 vs 2014
Percentage change
2014 vs 2013
Income Statement Highlights
Revenue 43,532$ 23,400$ 17,383$ 86% 35%
Cost of revenue 16,406 8,575 6,167 91% 39%
Gross Profit 27,126 14,825 11,217 83% 32%
Operating expenses 37,699 19,298 10,096 95% 91%
Income (loss) from operations (10,573) (4,473) 1,121 136% -499%
Net loss (21,351) (13,073) (5,593) 63% 134%
Per Share Highlights
Income (loss) from Operations per common share (0.81) (0.58) 0.17 38% -447%
(Basic and fully diluted)
Net Loss per common share (1.63) (1.70) (0.84) -4% 103%
(Basic and fully diluted)
Years Ended December 31,
($000s, except percentages) As at
December 31, 2015 December 31, 2014 December 31, 2013
Percentage change
2015 vs 2014
Percentage change
2014 vs 2013
Balance Sheet Highlights
Cash and cash equivalents 31,724$ 23,599$ 1,451$ 34% 1526%
Gross loans receivable 68,335 22,262 11,218 207% 98%
Total assets 107,342 49,410 13,646 117% 262%
Credit facility 40,384 12,819 - 215%
Debentures 40,326 39,185 13,196 3% 197%
Total liabilities 87,317 55,630 46,092 57% 21%
Shareholders' equity (deficit) 20,026 (6,220) (32,446) -422% -81%
Fourth Quarter Financial Highlights
• Revenue for the fourth quarter of 2015 was $12.5 million, a 48% increase from the fourth quarter of 2014. Loan
interest revenue grew 454% to $3.2 million, driven by the success of the Company’s range of installment loan
products.
• Gross profit grew 46% to $7.8 million (62% of revenue) from $5.3 million (63% of revenue) in the fourth
quarter of 2014.
• Reported positive Contribution(1) of $4.2 million, up by 56% compared with the fourth quarter of 2014.
• 50% sequential improvement of Adjusted EBITDA(1) at ($1.5) million, compared with ($3.2) million in the
third quarter of 2015 and $0.2 million in the fourth quarter of 2014.
_______________________________________
(1) Contribution, adjusted EBITDA, loan loss provision rate and loan origination are non IFRS financial measures. For more information regarding our use of these
measures and, where applicable, a reconciliation to the most comparable IFRS measure, see “Non-IFRS Financial Measures” and “Reconciliation of Non IFRS
Financial Measures”.
Management’s Discussion and Analysis
8 | P a g e
• Gross loans receivable increased by 207% to $68.3 million at the end of 2015, compared to $22.3 million at the
end of 2014. Within this, Gross loans receivable – long-term(1) represented 75% of the total Gross loans
receivable, driven by the successful ramp of the Company’s installment loan product as well as continued
growth of our line of credit product.
• Loan Loss Provision Rate(1) decreased from 4.7% in fourth quarter of 2014 to 4.5% in fourth quarter of 2015.
• Loan originations (1) were $85.5 million, compared to $55.6 million in the same quarter of 2014, an increase of
54%.
• At December 31, 2015, Mogo had $31.7 million in cash and cash equivalents.
Fourth-Quarter and Full-Year Business Highlights
Strong Member Growth
• Mogo’s strategy is to continue to build its member base and, over time, introduce new products and services to
these members.
• The Company added approximately 28,000 new members in Q4 and 110,000 for the full year of 2015, ending
the year with over 186,000 members.
• Management sets a three-year goal of 1 million members.
Ground-Breaking $50 Million Marketing Partnership
• In February 2016, Mogo and Postmedia announced a ground-breaking strategic collaboration providing Mogo
with a minimum of $50 million of media value over the next three years. Leveraging the power of Postmedia's
more than 200 trusted brands, audience reach of 12.8 million average monthly unique visitors to its digital
properties and 8.3 million weekly print readership, Mogo has a unique opportunity to accelerate brand
awareness.
• The agreement allows Mogo to expand marketing scale and reach while significantly reducing and de-risking
marketing spend.
Increasing Brand Awareness
• Launched new Mogo brand identity in 2015 highlighting Mogo as Canada’s leading digital financial brand for
the next-generation of consumers.
• Started work on new Mogo Lounge in Toronto.
• Selected as a finalist for the 2016 Fintech Innovation Awards.
Financial Technology Platform & Innovative Products
• More than doubled Technology & Development headcount to 78 team members by year-end 2015 compared to
only 36 at year-end 2014.
• Launched Canada’s first and only full-spectrum loan offering with introduction of Mogo’s Liquid installment
loan with amounts up to $35,000 and rates as low as 5.9%.
_______________________________________
(1) Contribution, adjusted EBITDA, loan loss provision rate, gross loans receivable – long-term and loan origination are non IFRS financial measures. For more
information regarding our use of these measures and, where applicable, a reconciliation to the most comparable IFRS measure, see “Non-IFRS Financial Measures”
and “Reconciliation of Non IFRS Financial Measures”.
Management’s Discussion and Analysis
9 | P a g e
• Launched new soft credit check account sign-up allowing new Mogo members to sign up for a Mogo account in
about 3 minutes without impacting their credit score
• We continue to make progress towards our mid-year launch of our new Mogo Platinum Prepaid Visa Card with
over 4,000 cards in our pilot program.
• Continued enhancements to our account function, user experience and development of new products including
our mobile app which we are planning to launch later this year.
Outlook
Fiscal 2015 was an important year to demonstrate our ability to acquire new customers and members as well as launch and
scale new products, particularly our Mogo Liquid installment loan. As we look to 2016, our priorities are to continue to grow
our member base, invest heavily in our technology platform, increase Mogo brand awareness through optimization of new
Postmedia partnership, launch new non-capital-intensive/fee-based products and enter into new strategic partnerships that
further our strategy to deliver a full suite of digital financial solutions to Canadians. We will continue to balance these
initiatives with the prudent growth of our existing loan products and our goal of achieving positive Adjusted EBITDA(1). We
believe that optimizing these priorities will allow us to accelerate revenue growth in 2017 and maximize long-term
shareholder value. See “Caution Regarding Forward-Looking Statements”.
Mogo is providing the following outlook regarding 2016:
• The Company expects 2016 revenue growth to be driven mainly by a strong increase in Interest Revenue as our
long-term loan products continue to gain traction in the marketplace, as well as the introduction of new fee-
based products.
• Management expects Q1 2016 revenue to be similar to Q4 2015, with revenue growth expected to accelerate in
the second half of 2016 as the Company transitions its marketing programs under the Postmedia agreement and
introduces new products.
• Management is targeting positive quarterly Adjusted EBITDA(1) beginning in the second half of 2016.
_________________________________
(1) Adjusted EBITDA is non IFRS financial measures. For more information regarding our use of these measures and, where applicable, a reconciliation to the most
comparable IFRS measure, see “Non-IFRS Financial Measures” and “Reconciliation of Non IFRS Financial Measures”.
Management’s Discussion and Analysis
10 | P a g e
Financial Performance Review
The following provides insight on the Company’s financial performance by illustrating and providing commentary on its key
performance indicators and operating results
Key Performance Indicators
The key performance indicators that we use to manage our business and evaluate our financial results and operating
performance include: Mogo Members, gross loans receivable (short-term and long-term), loan originations, revenue, gross
profit, contribution, contribution margin, adjusted EBITDA, funding interest expense, and provision rate. We evaluate our
performance by comparing our actual results to prior year results.
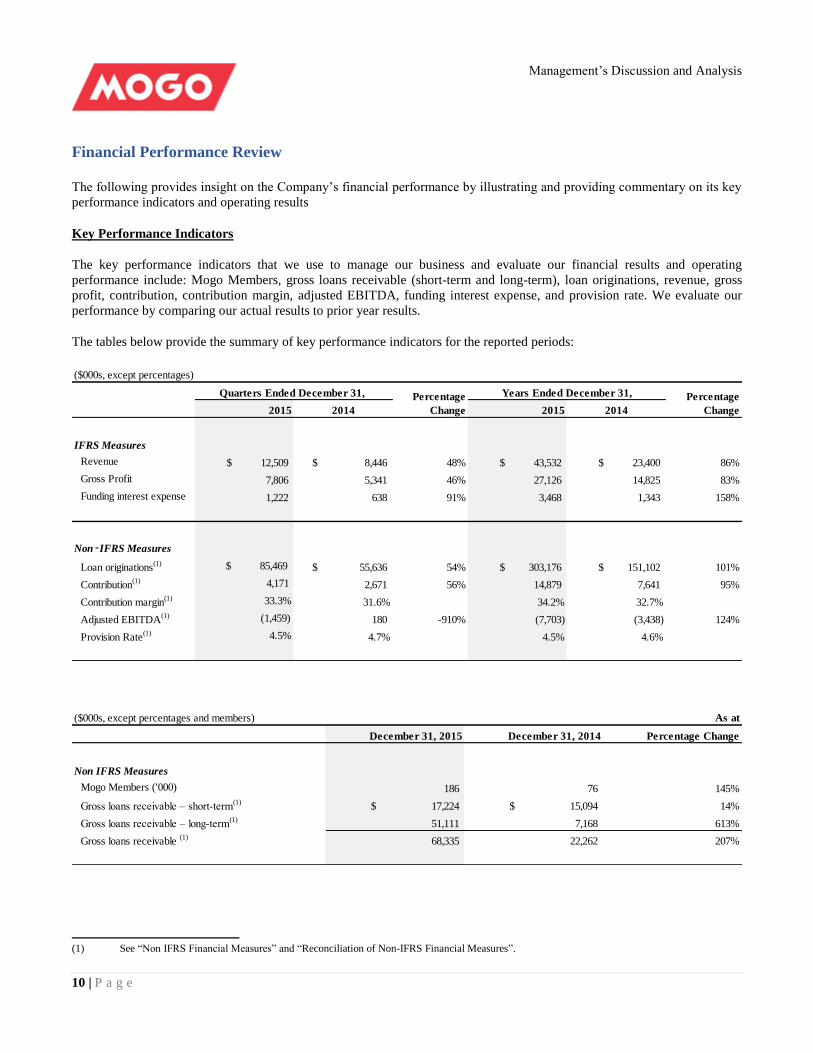
The tables below provide the summary of key performance indicators for the reported periods:
($000s, except percentages)
2015 2014 2015 2014
IFRS Measures
Revenue 12,509$ 8,446$ 48% 43,532$ 23,400$ 86%
Gross Profit 7,806 5,341 46% 27,126 14,825 83%
Funding interest expense 1,222 638 91% 3,468 1,343 158%
Non‑IFRS Measures
Loan originations(1) $ 85,469 55,636$ 54% 303,176$ 151,102$ 101%
Contribution(1) 4,171 2,671 56% 14,879 7,641 95%
Contribution margin(1) 33.3% 31.6% 34.2% 32.7%
Adjusted EBITDA(1) (1,459) 180 -910% (7,703) (3,438) 124%
Provision Rate(1) 4.5% 4.7% 4.5% 4.6%
Quarters Ended December 31, Percentage
Change
Years Ended December 31,Percentage
Change
($000s, except percentages and members) As at
December 31, 2015 December 31, 2014 Percentage Change
Non IFRS Measures
Mogo Members ('000) 186 76 145%
Gross loans receivable – short-term(1)
17,224$ 15,094$ 14%
Gross loans receivable – long-term(1)
51,111 7,168 613%
Gross loans receivable (1)
68,335 22,262 207%
(1) See “Non IFRS Financial Measures” and “Reconciliation of Non-IFRS Financial Measures”.
Management’s Discussion and Analysis
11 | P a g e
Mogo Members
Mogo Members represents the number of individuals who have signed up to for one or more of our products and services
including: consumer loans, prepaid visa card, free credit score, unique content, events and other Mogo Perks. Customers are
Mogo Members who have accessed one of our loan products or the Mogo Card. Management believes that the size of our
Mogo Member base is one of the key drivers of the Company’s future performance. Our goal is to continue to grow and
monetize our member base as we build our digital financial platform, launch new products and strive to build the largest
digital financial brand in Canada. We no longer consider someone a Mogo Member if they have not used or engaged with
any of our products or services in the last 12 months. We anticipate that our Mogo Members will continue to grow over time.
Mogo Members is not a financial measure.
Gross Loans Receivable and Loan Originations
Management considers the growth in gross loans receivable to be a key element of the Company’s performance as it
increases its revenue generating assets and represents a growing customer base to market additional products to thereby
leveraging its digital platform. One of management’s strategies is to grow its longer-term loan portfolio as it not only drives
interest revenue in the current period, but more importantly builds a longer-term revenue stream as these loans remain
outstanding longer. As more long term loans are originated, the marginal costs of operations and customer acquisitions are
expected to decrease. See “Caution Regarding Forward-Looking Statements”.
Gross loans receivable is an IFRS measure the Company uses to assess its asset growth and capital efficiency. Gross loans
receivable represents the total amount of principal and fees outstanding to our customers at the end of the period before any
provision for potential future charge-offs. Growth in gross consumer loans receivable is driven by several factors including
an increased number of customers and increase in average loan amount. We segregate gross loans receivable between gross
loans receivable – short-term and gross loans receivable – long-term.
Gross loans receivable (short-term and long-term) are non-IFRS measures which refer to loans receivable relating to the
initial term of our loans receivable. We use the term “gross loans receivable – short-term” to refer to loans receivable relating
to our loan products having terms of less than one year, which we refer to as “short-term loan products”. The only short term
loan products currently offered are Mogo’s Zip products which generally have terms of between 14 and 30 days. We use the
term “gross loans receivable – long-term” to refer to loans receivable relating to our loan products having terms of one year
or more, which we refer to as “long-term loan products”. The only long-term loan products currently offered are Mogo’s
Mini and Liquid loan products. Mini lines of credit have a term of one year and our Liquid instalment loan products have
terms of up to five years. We consider it important to highlight our increased focus on growing our long-term loan portfolio
as we execute on our strategy of being a full credit spectrum lender with a loan portfolio which is becoming longer term in
nature. Under IFRS, receivables are classified as ‘current’ or ‘non-current’ having maturities from the balance sheet date of
12 months or less and greater than 12 months, respectively. For more information regarding the limitations of gross loans
receivable (short-term and long-term) see “Non-IFRS Financial Measures” and for a reconciliation of gross loans receivable
(short-term and long-term) see “Reconciliation of Non-IFRS Financial Measures.”
Loan Originations
Management considers the growth in loan originations to be a key element of the Company’s performance as it represents a
growing customer base to market additional products to thereby leveraging its digital platform.
Loan originations is a non-IFRS measure representing the total principal amount of the loans we made during the period to
both new and existing customers, including loans to existing customers where a portion of the loan may be applied to
eliminate the customer’s prior borrowings with us. Loan originations do not represent revenue earned by us and, due to the
fact that capital may be loaned out and repaid multiple times during a period, loan originations are not equivalent to
investment in loans receivable. Although not tied directly to revenues, we derive our revenues primarily from loan fees and
interest on loans outstanding, so we believe loan originations are a key driver of our revenue growth and indicator of the scale
of our business, competitiveness of our products, the success of our marketing initiatives and the strength of our platform.
Management’s Discussion and Analysis
12 | P a g e
Loan originations have grown significantly over time due to the effectiveness of our customer acquisition channels,
expansion of our loan products and increase in available capital resources.
Factors that could affect loan originations include product mix, the success of our marketing initiatives, including customer
acquisition and retention, the competitiveness of our products, our ability to develop new products or enhance existing
products, any limitations on our capital resources, and the interest rate and economic environment.
Originations represent principal only and exclude any fees paid to us by the customer in connection with the origination of a
loan. Some of our repeat customers get new loans, including through our Level Up Program, before their existing loan is
fully repaid. Under the Level Up Program short-term loans must be paid in full before a new short-term loan can be
originated to the same customer. For originations, such loans are calculated as the full new loan principal, rather than the net
funded amount, which is the renewal loan’s principal net of the unpaid principal balance on the existing loan.
Loan originations is not a defined measure under IFRS and does not have a standardized meaning which ensures consistency
and comparability between companies using such term. Our definition of loan originations may not be the same as the
definition used by other companies in their reporting. Loan originations has limitations as an analytical tool and should not be
considered in isolation or as a substitute for an analysis of our results under IFRS. For more information regarding the
limitations of loan originations see “Non-IFRS Financial Measures” and “Reconciliation of Non-IFRS Financial Measures”.
Revenue
Our revenue is based on the loan products and services we offer and includes; interest on loans outstanding, fees related to
loan originations and other revenue. Other revenue is comprised of loan protection fees, nonsufficient funds fees, fees related
to our prepaid Visa card and other fees or charges permitted by applicable laws and pursuant to the agreement with our
customers. Revenue is an IFRS measure.
Gross Profit
Gross profit is an IFRS measure that we calculate as total revenue less our provision for loan losses, net of recoveries and
transaction costs incurred during the period. Gross profit has grown over time, and significantly in recent quarters due to our
success in growing our revenue through increased loan originations while maintaining strong underwriting performance.
Factors that could affect gross profit include changes in i) our revenue growth and revenue mix; ii) expected loan losses; iii)
our transaction related expenses; and, iv) the overall economic environment.
Contribution and Contribution Margin
Contribution is a non-IFRS financial measure that we calculate as revenue, less transaction expenses, bad debt expense,
funding interest expense and customer service and operations expenses. Contribution margin is a non-IFRS financial measure
calculated by dividing contribution by total revenue. Contribution and contribution margin are measures used by our
management and board of directors to understand and evaluate our core operating performance and trends. We measure
contribution as a way to evaluate the core profitability of our product revenue which accounts for the direct expenses related
to this revenue including transaction expenses, loan loss provisions, customer service and operations and funding interest
expenses. Contribution excludes the impact of other expenses related to our investment in our platform, business and brand
including technology, marketing and general and administrative expenses. Contribution and contribution margin have varied
from period to period and have generally increased over time. Factors that affect our contribution and contribution margin
include revenue mix, transaction and bad debt expenses, origination and servicing expenses.
For more information regarding the limitations of contribution and contribution margin see “Non-IFRS Financial Measures”
and for a reconciliation of net income (loss) before income taxes to contribution see “Reconciliation of Non-IFRS Financial
Measures.”
Management’s Discussion and Analysis
13 | P a g e
Adjusted EBITDA
Adjusted EBITDA is a non-IFRS financial measure that we calculate as loss before income taxes excluding depreciation and
amortization, stock-based compensation expense, non-recurring non-operating expenses, funding interest expense, corporate
interest expense, and unrealized gain or loss on financial instruments and foreign exchange. Adjusted EBITDA is a measure
used by our management and Board of Directors to understand and evaluate our core operating performance and trends. This
measure differs from contribution in that EBITDA includes additional operating costs, such as general and administrative
expenses and marketing, but excludes funding interest costs. For more information regarding the limitations of adjusted
EBITDA see “Non-IFRS Financial Measures” and for a reconciliation of net loss to adjusted EBITDA see “Reconciliation of
Non-IFRS Financial Measures.”
Funding Interest Expense
Funding interest expense is an IFRS measure representing interest expense related to funding gross loans receivable. The
Company’s funding interest expense occurred in the reporting period was associated with the Company’s two credit facilities:
1) The “Credit Facility - ST” was made available to the Company by the lenders pursuant to the revolving credit and
guarantee agreements (the “Credit Facility - ST Agreements”) between, among others, Fortress Credit Co LLC and the
Company dated February 25, 2014 as amended. The Credit Facility - ST is our primary source of funding for our Zip
and Mini loan products. The Corporate Credit Facility - ST includes interest expense, fees, and amortization of deferred
financing costs. The Credit Facility - ST authorizes an operating line up to a maximum of $30 million. The Credit
Facility - ST can be expanded to $50 million with the consent of the lender. The Credit Facility - ST bears interest at a
variable rate of LIBOR plus 13.00%, with a LIBOR floor of 2.00% and with an additional 0.50% charged on the unused
portion of the facility.
2) The “Credit Facility - Liquid” was entered into by the Company through a special purpose entity called Mogo Finance
Trust. The Credit Facility - Liquid has been established pursuant to the revolving credit and guarantee agreements (the
“Liquid Credit Agreements” and together with the Credit Facility - ST Agreements, the “Credit Facility Agreements”)
between, among others, Fortress Credit Co LLC and Mogo Finance Trust dated September 1, 2015. The Credit Facility -
Liquid is secured by the Liquid installment loans and therefore has no recourse to the Company other than with respect
to certain limited and narrow ‘bad boy’ acts. The Credit Facility - Liquid is authorized with an initial commitment of $50
million. At the Company’s request and subject to certain conditions, the Credit Facility - Liquid can be expanded for up
to $200 million. The Credit Facility - Liquid is being used to finance the continued expansion of the Company’s
consumer installment loans of up to $35,000 per loan. The Company paid effective annual interest rate of 9.5% as of
September 30, 2015 on outstanding principal amount under this facility (based on interest rate of LIBOR plus 8% with a
LIBOR floor of 1.5%). The applicable interest rate on the credit facility is tiered at three levels. When the utilization of
the credit facility reaches to the higher level, the applicable interest rate will decrease to lower tier of interest rate for the
incremental portion of outstanding principal amount. The term of the Credit Facility - Liquid is five years, with a two-
year origination period and a three-year amortization period. For more information regarding the Credit Facility - Liquid
and the Credit Facility - ST (together, the “Credit Facilities”), see “Key Balance Sheet Items – Credit Facilities” and
“Liquidity and Capital Resources” below.
The Credit Facilities are based on an advance rate depending on the respective underlying eligible receivables. The Company
funds the difference between the advance rate and the loan amount from its balance sheet. The Company did not have credit
facilities prior to February 2014 and instead funded loans through internally generated cash flow and proceeds from the sale
of debentures.
Provision Rate
Provision rate is a non-IFRS measure which equals the provision for loan losses, net of recoveries divided by loan
originations in the period. We consider our provision rate in a period to be an important metric and indication of the health of
our loans originated. This ratio is significantly impacted by the period’s originations volume and changes in loss expectations
Management’s Discussion and Analysis
14 | P a g e
for loans originated in prior periods. For more information regarding the limitations of provision rate see “Non-IFRS
Financial Measures” and for a reconciliation of provision rate see “Reconciliation of Non-IFRS Financial Measures.”
Results of Operations
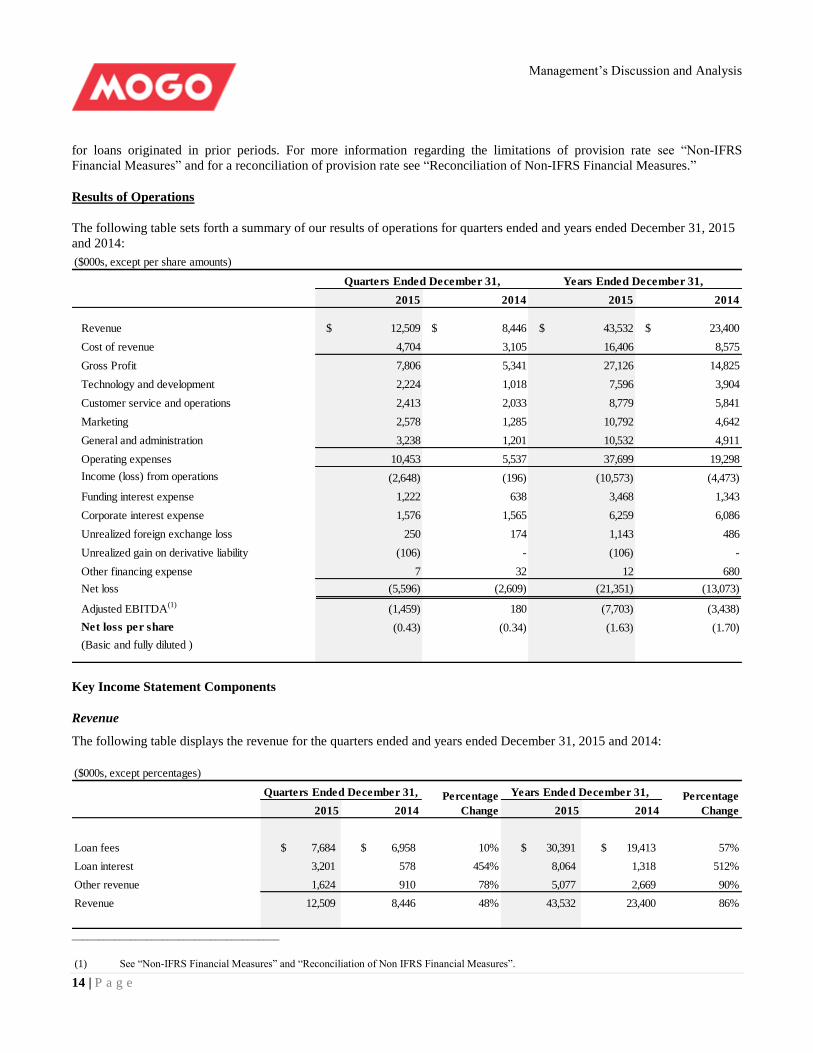
The following table sets forth a summary of our results of operations for quarters ended and years ended December 31, 2015
and 2014:
($000s, except per share amounts)
2015 2014 2015 2014
Revenue $ 12,509 $ 8,446 $ 43,532 $ 23,400
Cost of revenue 4,704 3,105 16,406 8,575
Gross Profit 7,806 5,341 27,126 14,825
Technology and development 2,224 1,018 7,596 3,904
Customer service and operations 2,413 2,033 8,779 5,841
Marketing 2,578 1,285 10,792 4,642
General and administration 3,238 1,201 10,532 4,911
Operating expenses 10,453 5,537 37,699 19,298
Income (loss) from operations (2,648) (196) (10,573) (4,473)
Funding interest expense 1,222 638 3,468 1,343
Corporate interest expense 1,576 1,565 6,259 6,086
Unrealized foreign exchange loss 250 174 1,143 486
Unrealized gain on derivative liability (106) - (106) -
Other financing expense 7 32 12 680
Net loss (5,596) (2,609) (21,351) (13,073)
Adjusted EBITDA(1)
(1,459) 180 (7,703) (3,438)
Net loss per share (0.43) (0.34) (1.63) (1.70)
(Basic and fully diluted )
Quarters Ended December 31, Years Ended December 31,
Key Income Statement Components
Revenue
The following table displays the revenue for the quarters ended and years ended December 31, 2015 and 2014:
($000s, except percentages)
2015 2014 2015 2014
Loan fees 7,684$ 6,958$ 10% 30,391$ 19,413$ 57%
Loan interest 3,201 578 454% 8,064 1,318 512%
Other revenue 1,624 910 78% 5,077 2,669 90%
Revenue 12,509 8,446 48% 43,532 23,400 86%
Percentage
Change
Years Ended December 31, Percentage
Change
Quarters Ended December 31,
_______________________________________
(1) See “Non-IFRS Financial Measures” and “Reconciliation of Non IFRS Financial Measures”.
Management’s Discussion and Analysis
15 | P a g e
Revenue for the quarter ended December 31, 2015 increased $4.1 million to $12.5 million compared to $8.4 million for the
quarter ended December 31, 2014, an increase of 48%. Revenue for the year ended December 31, 2015 was $12.5 million, an
increase of $20.0 million or 86% compared to $23.4 million for 2014.
Loan fees for the quarter ended December 31, 2015 increased $0.7 million to $7.7 million compared to $7.0 million for the
same period of 2014, an increase of 10%. Loan fees for the year ended December 31, 2015 increased $11.0 million to
$30.4 million compared to $19.4 million during 2014, an increase of 57%. The increase in loan fees in the fourth quarter and
year 2015 was primarily driven by the addition of new customers and increased loan originations for our short term loan
products. This increase was enabled by the availability of the Credit Facilities to fund loan originations along with the
increased availability of equity capital which allowed the Company to increase its customer acquisition efforts.
Loan interest for the quarter ended December 31, 2015 increased by 454%, or $2.6 million to $3.2 million, compared to
$0.6 million for the quarter ended December 31, 2014. Loan interest for 2015 increased $6.8 million to $8.1 million
compared to $1.3 million for 2014, an increase of 512%. The increase in loan interest was driven by a continued ramp in
originations of our long-term loans and a corresponding increase in our gross loans receivable – long-term outstanding at the
end of the period. In the Company’s current product portfolio, management sees the most significant growth potential in
installment loans, which were introduced in November 2014. The Company anticipates loan interest will continue to be the
fastest-growing revenue segment and will represent an increasing percentage of total revenue.
Other revenue for the quarter ended December 31, 2015 increased $0.7 million to $1.6 million compared to $0.9 million for
the same quarter of 2014, an increase of 78%. Other revenue for 2015 increased $2.4 million to $5.1 million compared to
$2.7 million for 2014, an increase of 90%. The increase in other revenue resulted from ancillary revenue driven by the
increase in loan originations and the increase in outstanding gross loans receivable such as loan protection fees, non-
sufficient funds fees and interest, as well as revenues from our prepaid Visa card program.
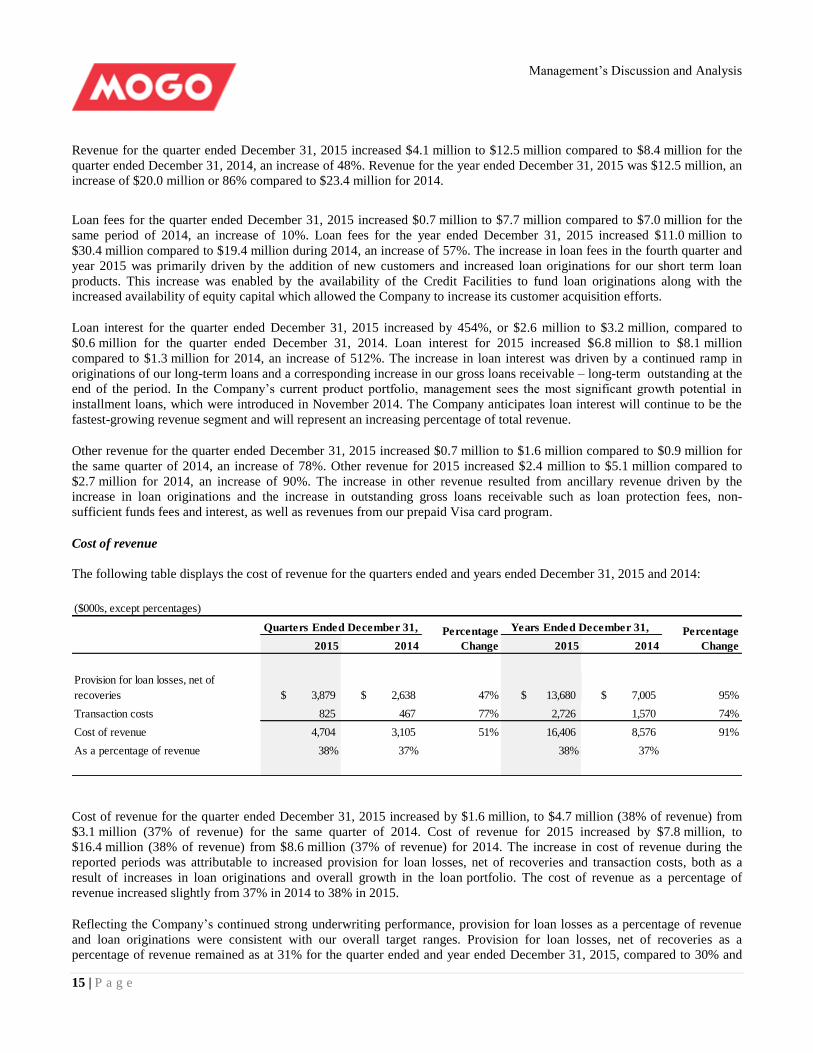
Cost of revenue
The following table displays the cost of revenue for the quarters ended and years ended December 31, 2015 and 2014:
($000s, except percentages)
2015 2014 2015 2014
Provision for loan losses, net of
recoveries 3,879$ 2,638$ 47% 13,680$ 7,005$ 95%
Transaction costs 825 467 77% 2,726 1,570 74%
Cost of revenue 4,704 3,105 51% 16,406 8,576 91%
As a percentage of revenue 38% 37% 38% 37%
Quarters Ended December 31, Percentage
Change
Years Ended December 31, Percentage
Change
Cost of revenue for the quarter ended December 31, 2015 increased by $1.6 million, to $4.7 million (38% of revenue) from
$3.1 million (37% of revenue) for the same quarter of 2014. Cost of revenue for 2015 increased by $7.8 million, to
$16.4 million (38% of revenue) from $8.6 million (37% of revenue) for 2014. The increase in cost of revenue during the
reported periods was attributable to increased provision for loan losses, net of recoveries and transaction costs, both as a
result of increases in loan originations and overall growth in the loan portfolio. The cost of revenue as a percentage of
revenue increased slightly from 37% in 2014 to 38% in 2015.
Reflecting the Company’s continued strong underwriting performance, provision for loan losses as a percentage of revenue
and loan originations were consistent with our overall target ranges. Provision for loan losses, net of recoveries as a
percentage of revenue remained as at 31% for the quarter ended and year ended December 31, 2015, compared to 30% and
Management’s Discussion and Analysis
16 | P a g e
31% for the same period of 2014 respectively. The provision rate (Loan losses as a percentage of loan originations) was 4.5%
for the quarter ended and year ended December 31, 2015, decreased from 4.7% and 4.6% for the same periods of 2014
respectively.
Transaction costs are a variable cost and are a function of loan originations and other transaction related activities.
Components include: payment processing and banking fees, underwriting and credit scoring, costs of our loan protection
program and the transactional costs related to our Mogo prepaid Visa card program. Transaction costs increased from 6% to
7% as a percentage of revenue from the quarter ended December 31, 2014 to the quarter ended December 31, 2015.
However, transaction costs fell from 7% to 6% from 2014 to 2015 as we achieved some increased efficiencies due to benefits
from the increased scale in our operation.
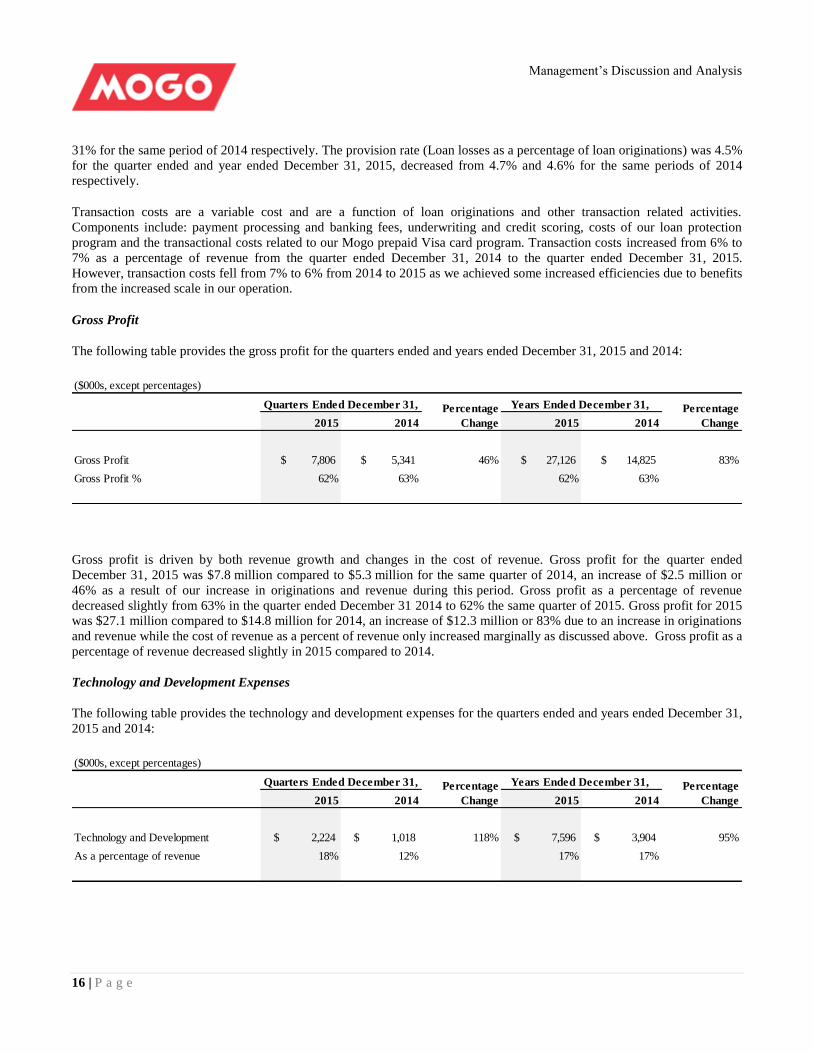
Gross Profit
The following table provides the gross profit for the quarters ended and years ended December 31, 2015 and 2014:
($000s, except percentages)
2015 2014 2015 2014
Gross Profit 7,806$ 5,341$ 46% 27,126$ 14,825$ 83%
Gross Profit % 62% 63% 62% 63%
Quarters Ended December 31, Percentage
Change
Years Ended December 31, Percentage
Change
Gross profit is driven by both revenue growth and changes in the cost of revenue. Gross profit for the quarter ended
December 31, 2015 was $7.8 million compared to $5.3 million for the same quarter of 2014, an increase of $2.5 million or
46% as a result of our increase in originations and revenue during this period. Gross profit as a percentage of revenue
decreased slightly from 63% in the quarter ended December 31 2014 to 62% the same quarter of 2015. Gross profit for 2015
was $27.1 million compared to $14.8 million for 2014, an increase of $12.3 million or 83% due to an increase in originations
and revenue while the cost of revenue as a percent of revenue only increased marginally as discussed above. Gross profit as a
percentage of revenue decreased slightly in 2015 compared to 2014.
Technology and Development Expenses
The following table provides the technology and development expenses for the quarters ended and years ended December 31,
2015 and 2014:
($000s, except percentages)
2015 2014 2015 2014
Technology and Development 2,224$ 1,018$ 118% 7,596$ 3,904$ 95%
As a percentage of revenue 18% 12% 17% 17%
Quarters Ended December 31, Percentage
Change
Years Ended December 31, Percentage
Change
Management’s Discussion and Analysis
17 | P a g e
Technology and development expenses in the quarter ended December 31, 2015 were $2.2 million, an increase of
$1.2 million or 118% from the same quarter of 2014. Technology and development expenses for the year ended December
31, 2015 were $7.6 million, an increase of $3.7 million or 95% from 2014. The increase was primarily attributable to an
increase in headcount and other technology related expenses as we increased the number of technology personnel in order to
invest in the continued development of our fully digital financial services platform and further improve our customer
experience, self-service capabilities and operational efficiencies. Specific initiatives include: improvements to our account
opening experience, enhanced customer account functionality, development of our mobile app, increased automation of our
loan experience, enhancements to our credit decisioning platform, and development of our new prepaid Visa card program.
Technology and development headcount increased from 36 at December 31, 2014 to 78 at December 31, 2015. As a
percentage of revenue, technology and development expenses grew from 12% during the quarter ended December 31, 2014
to 18% during the same quarter of 2015. However the Company managed to keep the technology and development expenses
as a percentage of revenue the same ratio of 17% in 2015 comparing to 2014.
The capitalization of technology and development expenses for the quarter ended and year end December 31, 2015 was
$1.6 million and $4.4 million, compared to $0.6 million and $1.7 million in the same periods of 2014, an increase of $1
million and $2.7 million respectively. The significant spending in technology highlights the Company’s commitment to
investing in its technology platform for future product and service improvement.
Customer Service and Operations Expenses
The following table provides the customer service and operations expenses for the quarters ended and years ended December
31, 2015 and 2014:
($000s, except percentages)
2015 2014 2015 2014
Customer Service and Operations 2,413$ 2,033$ 19% 8,779$ 5,841$ 50%
As a percentage of revenue 19% 24% 20% 25%
Quarters Ended December 31, Percentage
Change
Years Ended December 31, Percentage
Change
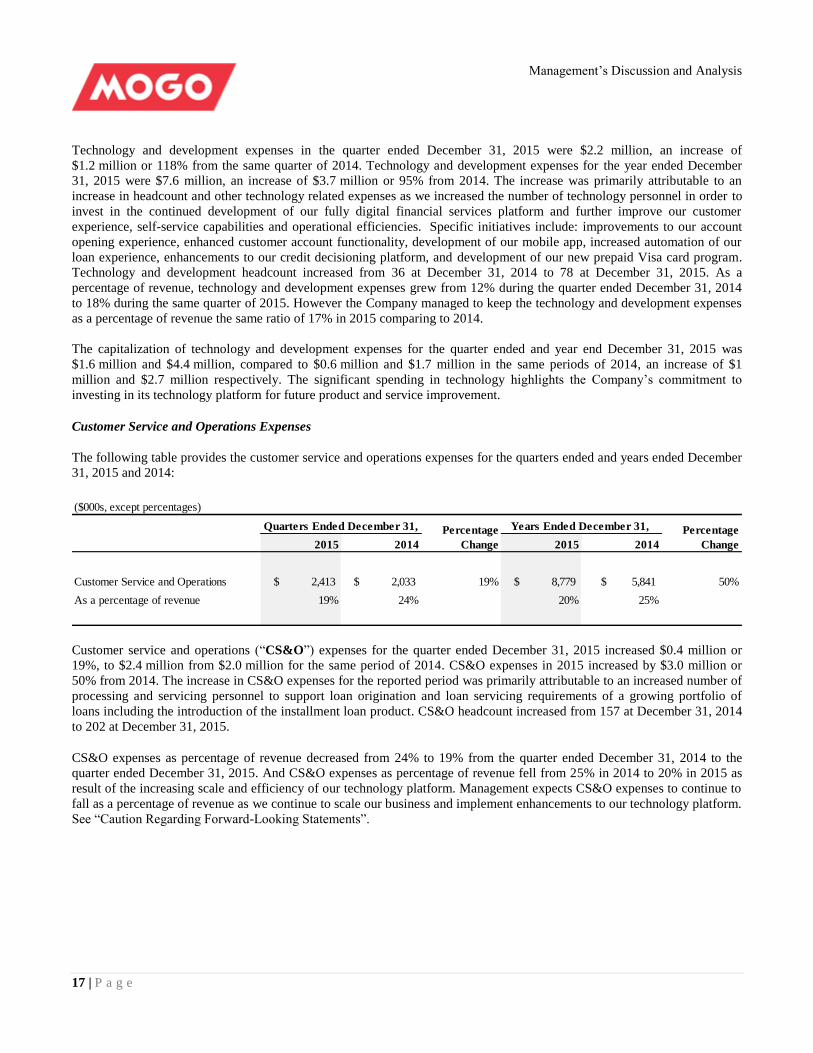
Customer service and operations (“CS&O”) expenses for the quarter ended December 31, 2015 increased $0.4 million or
19%, to $2.4 million from $2.0 million for the same period of 2014. CS&O expenses in 2015 increased by $3.0 million or
50% from 2014. The increase in CS&O expenses for the reported period was primarily attributable to an increased number of
processing and servicing personnel to support loan origination and loan servicing requirements of a growing portfolio of
loans including the introduction of the installment loan product. CS&O headcount increased from 157 at December 31, 2014
to 202 at December 31, 2015.
CS&O expenses as percentage of revenue decreased from 24% to 19% from the quarter ended December 31, 2014 to the
quarter ended December 31, 2015. And CS&O expenses as percentage of revenue fell from 25% in 2014 to 20% in 2015 as
result of the increasing scale and efficiency of our technology platform. Management expects CS&O expenses to continue to
fall as a percentage of revenue as we continue to scale our business and implement enhancements to our technology platform.
See “Caution Regarding Forward-Looking Statements”.
Management’s Discussion and Analysis
18 | P a g e
Marketing Expenses
The following table provides the marketing expenses for the quarters ended and years ended December 31, 2015 and 2014:
($000s, except percentages)
2015 2014 2015 2014
Marketing Expenses 2,578$ 1,285$ 101% 10,792$ 4,642$ 132%
As a percentage of revenue 21% 15% 25% 20%
Quarters Ended December 31, Percentage
Change
Years Ended December 31, Percentage
Change
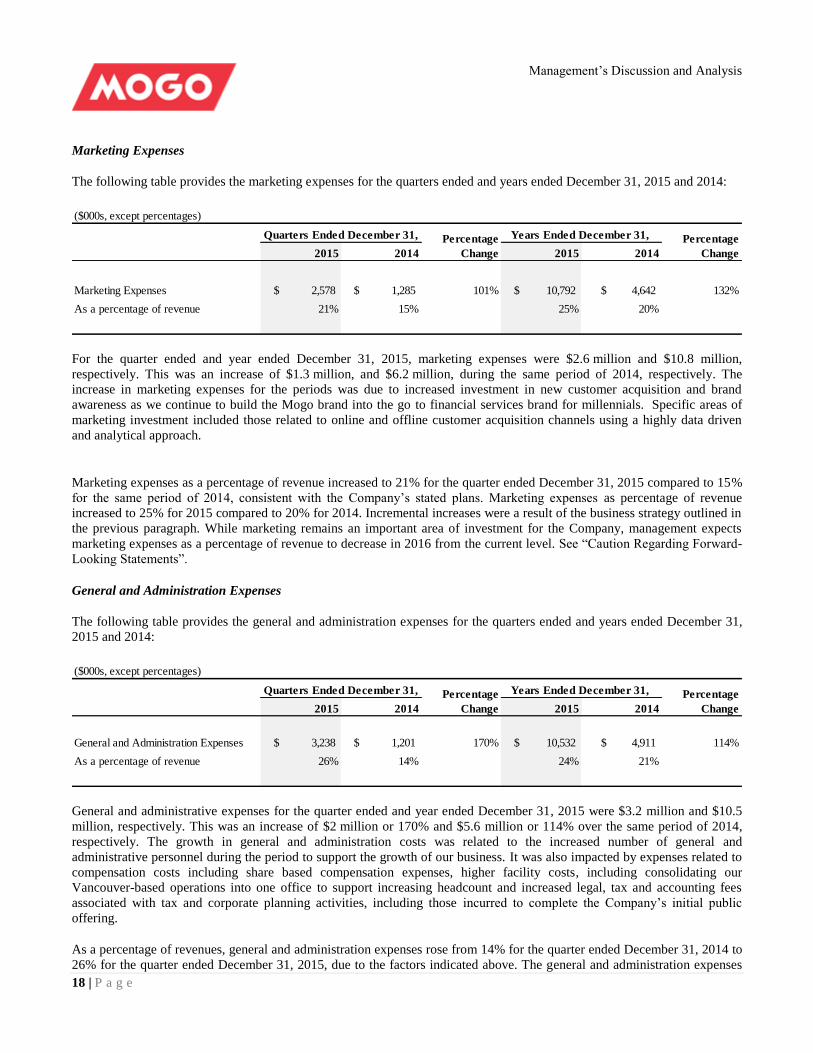
For the quarter ended and year ended December 31, 2015, marketing expenses were $2.6 million and $10.8 million,
respectively. This was an increase of $1.3 million, and $6.2 million, during the same period of 2014, respectively. The
increase in marketing expenses for the periods was due to increased investment in new customer acquisition and brand
awareness as we continue to build the Mogo brand into the go to financial services brand for millennials. Specific areas of
marketing investment included those related to online and offline customer acquisition channels using a highly data driven
and analytical approach.
Marketing expenses as a percentage of revenue increased to 21% for the quarter ended December 31, 2015 compared to 15%
for the same period of 2014, consistent with the Company’s stated plans. Marketing expenses as percentage of revenue
increased to 25% for 2015 compared to 20% for 2014. Incremental increases were a result of the business strategy outlined in
the previous paragraph. While marketing remains an important area of investment for the Company, management expects
marketing expenses as a percentage of revenue to decrease in 2016 from the current level. See “Caution Regarding Forward-
Looking Statements”.
General and Administration Expenses
The following table provides the general and administration expenses for the quarters ended and years ended December 31,
2015 and 2014:
($000s, except percentages)
2015 2014 2015 2014
General and Administration Expenses 3,238$ 1,201$ 170% 10,532$ 4,911$ 114%
As a percentage of revenue 26% 14% 24% 21%
Quarters Ended December 31, Percentage
Change
Years Ended December 31, Percentage
Change
General and administrative expenses for the quarter ended and year ended December 31, 2015 were $3.2 million and $10.5
million, respectively. This was an increase of $2 million or 170% and $5.6 million or 114% over the same period of 2014,
respectively. The growth in general and administration costs was related to the increased number of general and
administrative personnel during the period to support the growth of our business. It was also impacted by expenses related to
compensation costs including share based compensation expenses, higher facility costs, including consolidating our
Vancouver-based operations into one office to support increasing headcount and increased legal, tax and accounting fees
associated with tax and corporate planning activities, including those incurred to complete the Company’s initial public
offering.
As a percentage of revenues, general and administration expenses rose from 14% for the quarter ended December 31, 2014 to
26% for the quarter ended December 31, 2015, due to the factors indicated above. The general and administration expenses
Management’s Discussion and Analysis
19 | P a g e
as a percentage of revenues in 2015 increased slightly by 3% to 24% compared to 21% in 2014. Management expects the
general and administration expenses as a percentage of revenue will stay flat or decrease in the future as result of the revenue
growth. See “Caution Regarding Forward-Looking Statements”.
Funding Interest Expense
The following table provides a breakdown of funding interest expense:
($000s, except percentages)
2015 2014 2015 2014
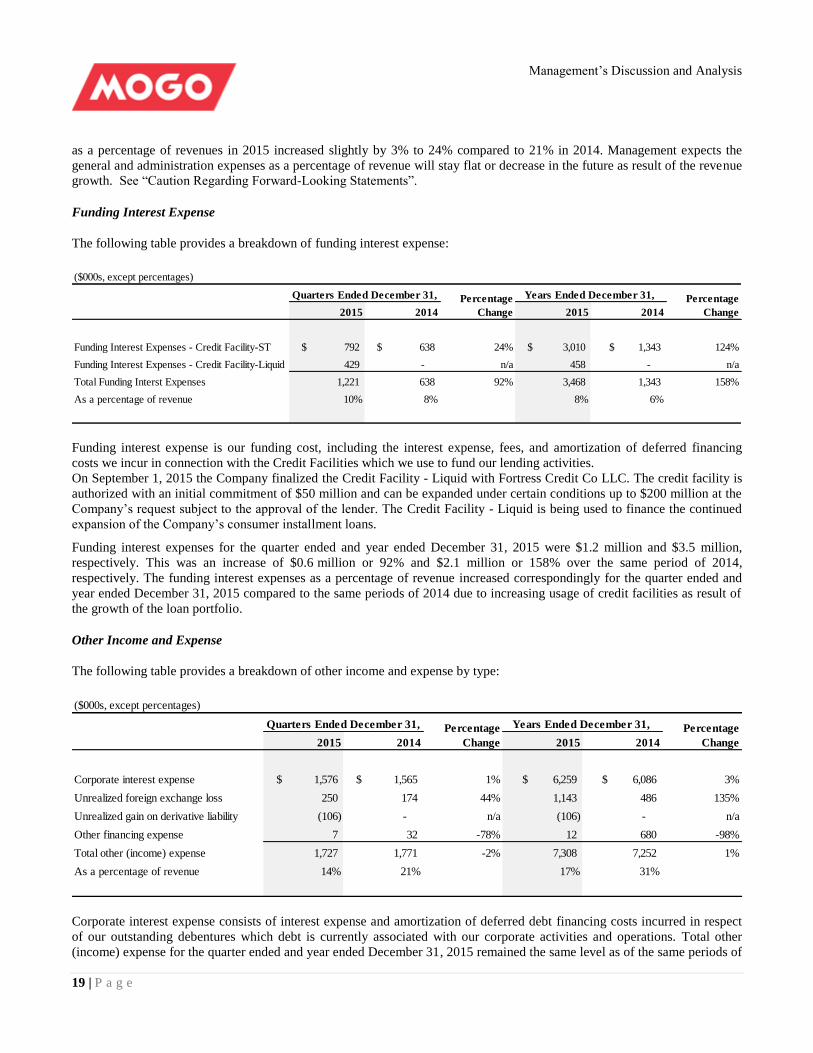
Funding Interest Expenses - Credit Facility-ST 792$ 638$ 24% 3,010$ 1,343$ 124%
Funding Interest Expenses - Credit Facility-Liquid 429 - n/a 458 - n/a
Total Funding Interst Expenses 1,221 638 92% 3,468 1,343 158%
As a percentage of revenue 10% 8% 8% 6%
Quarters Ended December 31, Percentage
Change
Years Ended December 31, Percentage
Change
Funding interest expense is our funding cost, including the interest expense, fees, and amortization of deferred financing
costs we incur in connection with the Credit Facilities which we use to fund our lending activities.
On September 1, 2015 the Company finalized the Credit Facility - Liquid with Fortress Credit Co LLC. The credit facility is
authorized with an initial commitment of $50 million and can be expanded under certain conditions up to $200 million at the
Company’s request subject to the approval of the lender. The Credit Facility - Liquid is being used to finance the continued
expansion of the Company’s consumer installment loans.
Funding interest expenses for the quarter ended and year ended December 31, 2015 were $1.2 million and $3.5 million,
respectively. This was an increase of $0.6 million or 92% and $2.1 million or 158% over the same period of 2014,
respectively. The funding interest expenses as a percentage of revenue increased correspondingly for the quarter ended and
year ended December 31, 2015 compared to the same periods of 2014 due to increasing usage of credit facilities as result of
the growth of the loan portfolio.
Other Income and Expense
The following table provides a breakdown of other income and expense by type:
($000s, except percentages)
2015 2014 2015 2014
Corporate interest expense 1,576$ 1,565$ 1% 6,259$ 6,086$ 3%
Unrealized foreign exchange loss 250 174 44% 1,143 486 135%
Unrealized gain on derivative liability (106) - n/a (106) - n/a
Other financing expense 7 32 -78% 12 680 -98%
Total other (income) expense 1,727 1,771 -2% 7,308 7,252 1%
As a percentage of revenue 14% 21% 17% 31%
Quarters Ended December 31, Percentage
Change
Years Ended December 31, Percentage
Change
Corporate interest expense consists of interest expense and amortization of deferred debt financing costs incurred in respect
of our outstanding debentures which debt is currently associated with our corporate activities and operations. Total other
(income) expense for the quarter ended and year ended December 31, 2015 remained the same level as of the same periods of
Management’s Discussion and Analysis
20 | P a g e
2014. With the growth of total revenue in the reported period, the total other (income) expense as a percentage of revenue
decreased from 21% and 31% for the quarter and year ended December 31, 2014 to 14% and 17% for the same periods of
2015.
Net Loss, Adjusted EBITDA, Basic and Fully Diluted loss per share
The following table provides the summary of net loss, adjusted EBITDA, and loss per share:
($000s, except percentages and per share amounts)
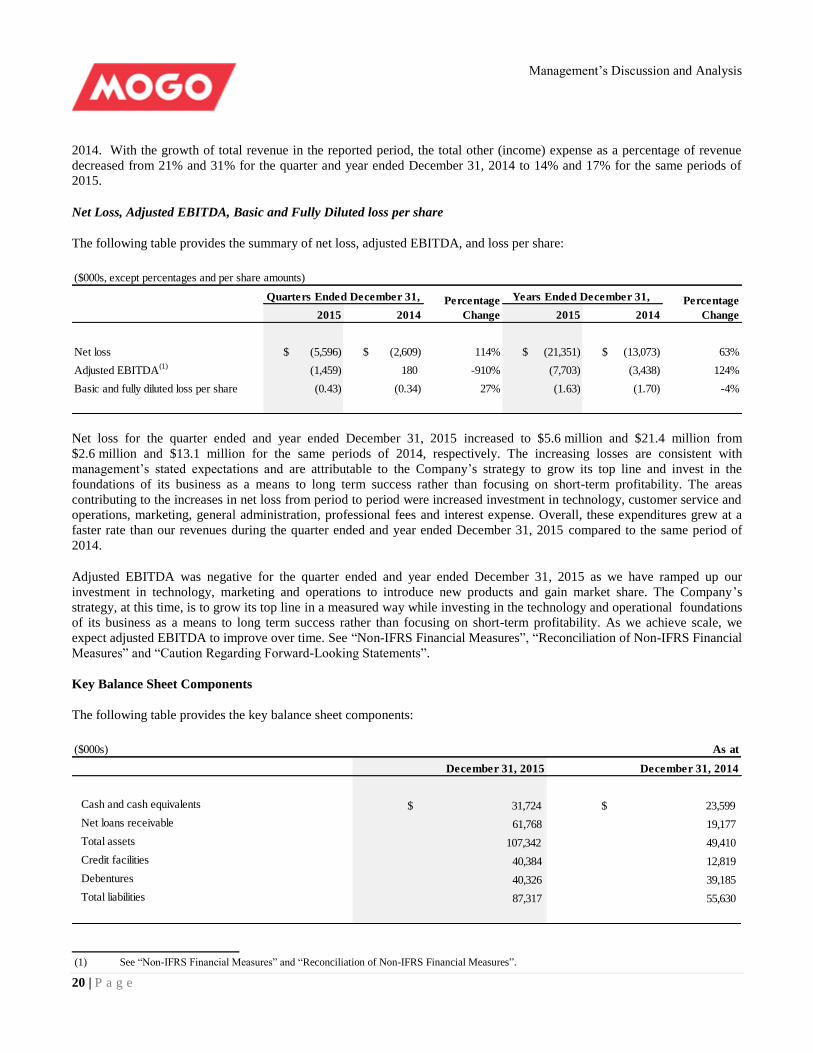
2015 2014 2015 2014
Net loss (5,596)$ (2,609)$ 114% (21,351)$ (13,073)$ 63%
Adjusted EBITDA(1)
(1,459) 180 -910% (7,703) (3,438) 124%
Basic and fully diluted loss per share (0.43) (0.34) 27% (1.63) (1.70) -4%
Years Ended December 31, Percentage
Change
Quarters Ended December 31, Percentage
Change
Net loss for the quarter ended and year ended December 31, 2015 increased to $5.6 million and $21.4 million from
$2.6 million and $13.1 million for the same periods of 2014, respectively. The increasing losses are consistent with
management’s stated expectations and are attributable to the Company’s strategy to grow its top line and invest in the
foundations of its business as a means to long term success rather than focusing on short-term profitability. The areas
contributing to the increases in net loss from period to period were increased investment in technology, customer service and
operations, marketing, general administration, professional fees and interest expense. Overall, these expenditures grew at a
faster rate than our revenues during the quarter ended and year ended December 31, 2015 compared to the same period of
2014.
Adjusted EBITDA was negative for the quarter ended and year ended December 31, 2015 as we have ramped up our
investment in technology, marketing and operations to introduce new products and gain market share. The Company’s
strategy, at this time, is to grow its top line in a measured way while investing in the technology and operational foundations
of its business as a means to long term success rather than focusing on short-term profitability. As we achieve scale, we
expect adjusted EBITDA to improve over time. See “Non-IFRS Financial Measures”, “Reconciliation of Non-IFRS Financial
Measures” and “Caution Regarding Forward-Looking Statements”.
Key Balance Sheet Components
The following table provides the key balance sheet components:
($000s) As at
December 31, 2015 December 31, 2014
Cash and cash equivalents 31,724$ 23,599$
Net loans receivable 61,768 19,177
Total assets 107,342 49,410
Credit facilities 40,384 12,819
Debentures 40,326 39,185
Total liabilities 87,317 55,630
(1) See “Non-IFRS Financial Measures” and “Reconciliation of Non-IFRS Financial Measures”.
Management’s Discussion and Analysis
21 | P a g e
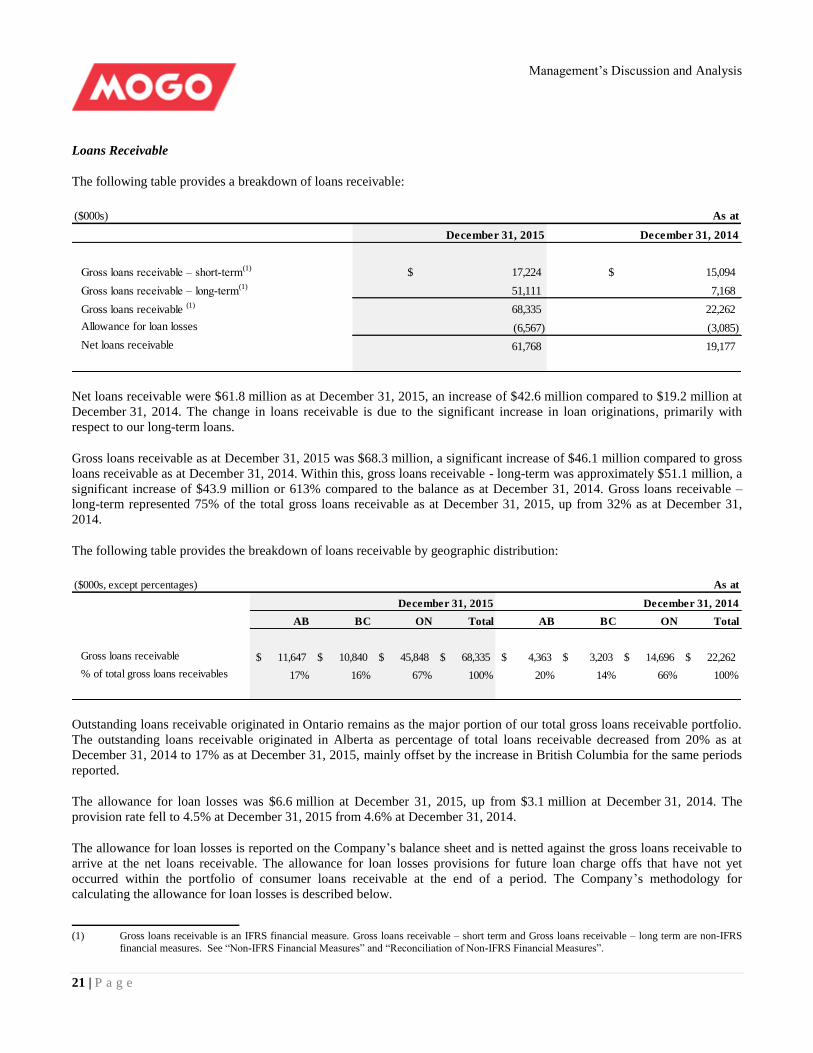
Loans Receivable
The following table provides a breakdown of loans receivable:
($000s) As at
December 31, 2015 December 31, 2014
Gross loans receivable – short-term(1)
17,224$ 15,094$
Gross loans receivable – long-term(1)
51,111 7,168
Gross loans receivable (1)
68,335 22,262
Allowance for loan losses (6,567) (3,085)
Net loans receivable 61,768 19,177
Net loans receivable were $61.8 million as at December 31, 2015, an increase of $42.6 million compared to $19.2 million at
December 31, 2014. The change in loans receivable is due to the significant increase in loan originations, primarily with
respect to our long-term loans.
Gross loans receivable as at December 31, 2015 was $68.3 million, a significant increase of $46.1 million compared to gross
loans receivable as at December 31, 2014. Within this, gross loans receivable - long-term was approximately $51.1 million, a
significant increase of $43.9 million or 613% compared to the balance as at December 31, 2014. Gross loans receivable –
long-term represented 75% of the total gross loans receivable as at December 31, 2015, up from 32% as at December 31,
2014.
The following table provides the breakdown of loans receivable by geographic distribution:
($000s, except percentages) As at
AB BC ON Total AB BC ON Total
Gross loans receivable 11,647$ 10,840$ 45,848$ 68,335$ 4,363$ 3,203$ 14,696$ 22,262$
% of total gross loans receivables 17% 16% 67% 100% 20% 14% 66% 100%
December 31, 2015 December 31, 2014
Outstanding loans receivable originated in Ontario remains as the major portion of our total gross loans receivable portfolio.
The outstanding loans receivable originated in Alberta as percentage of total loans receivable decreased from 20% as at
December 31, 2014 to 17% as at December 31, 2015, mainly offset by the increase in British Columbia for the same periods
reported.
The allowance for loan losses was $6.6 million at December 31, 2015, up from $3.1 million at December 31, 2014. The
provision rate fell to 4.5% at December 31, 2015 from 4.6% at December 31, 2014.
The allowance for loan losses is reported on the Company’s balance sheet and is netted against the gross loans receivable to
arrive at the net loans receivable. The allowance for loan losses provisions for future loan charge offs that have not yet
occurred within the portfolio of consumer loans receivable at the end of a period. The Company’s methodology for
calculating the allowance for loan losses is described below.
(1) Gross loans receivable is an IFRS financial measure. Gross loans receivable – short term and Gross loans receivable – long term are non-IFRS
financial measures. See “Non-IFRS Financial Measures” and “Reconciliation of Non-IFRS Financial Measures”.
Management’s Discussion and Analysis
22 | P a g e
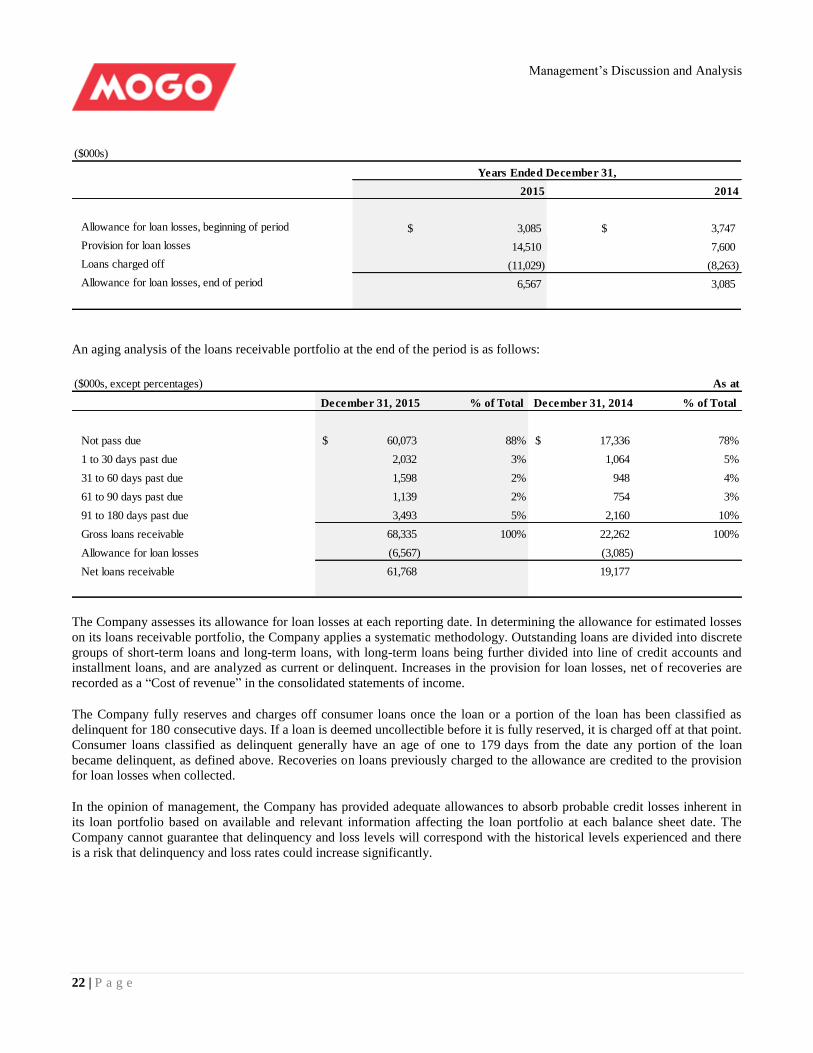
($000s)
2015 2014
Allowance for loan losses, beginning of period 3,085$ 3,747$
Provision for loan losses 14,510 7,600
Loans charged off (11,029) (8,263)
Allowance for loan losses, end of period 6,567 3,085
Years Ended December 31,
An aging analysis of the loans receivable portfolio at the end of the period is as follows:
($000s, except percentages) As at
December 31, 2015 % of Total December 31, 2014 % of Total
Not pass due 60,073$ 88% 17,336$ 78%
1 to 30 days past due 2,032 3% 1,064 5%
31 to 60 days past due 1,598 2% 948 4%
61 to 90 days past due 1,139 2% 754 3%
91 to 180 days past due 3,493 5% 2,160 10%
Gross loans receivable 68,335 100% 22,262 100%
Allowance for loan losses (6,567) (3,085)
Net loans receivable 61,768 19,177
The Company assesses its allowance for loan losses at each reporting date. In determining the allowance for estimated losses
on its loans receivable portfolio, the Company applies a systematic methodology. Outstanding loans are divided into discrete
groups of short-term loans and long-term loans, with long-term loans being further divided into line of credit accounts and
installment loans, and are analyzed as current or delinquent. Increases in the provision for loan losses, net of recoveries are
recorded as a “Cost of revenue” in the consolidated statements of income.
The Company fully reserves and charges off consumer loans once the loan or a portion of the loan has been classified as
delinquent for 180 consecutive days. If a loan is deemed uncollectible before it is fully reserved, it is charged off at that point.
Consumer loans classified as delinquent generally have an age of one to 179 days from the date any portion of the loan
became delinquent, as defined above. Recoveries on loans previously charged to the allowance are credited to the provision
for loan losses when collected.
In the opinion of management, the Company has provided adequate allowances to absorb probable credit losses inherent in
its loan portfolio based on available and relevant information affecting the loan portfolio at each balance sheet date. The
Company cannot guarantee that delinquency and loss levels will correspond with the historical levels experienced and there
is a risk that delinquency and loss rates could increase significantly.
Management’s Discussion and Analysis
23 | P a g e
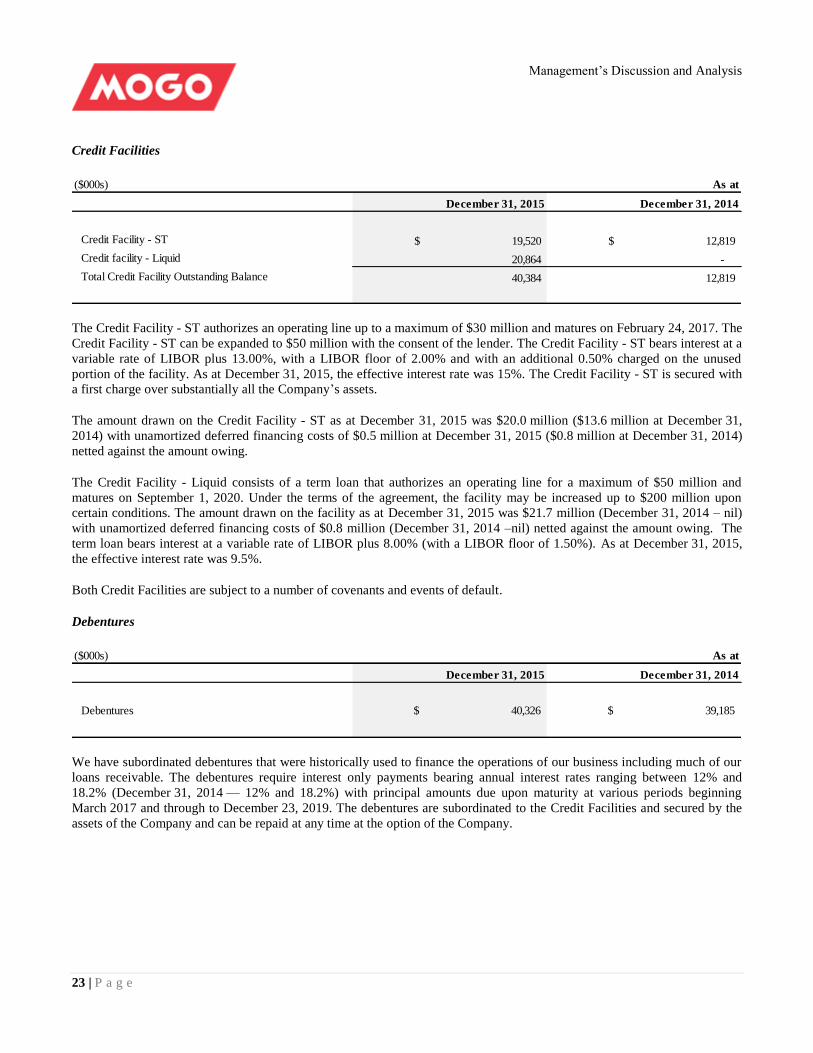
Credit Facilities
($000s) As at
December 31, 2015 December 31, 2014
Credit Facility - ST 19,520$ 12,819$
Credit facility - Liquid 20,864 -
Total Credit Facility Outstanding Balance 40,384 12,819
The Credit Facility - ST authorizes an operating line up to a maximum of $30 million and matures on February 24, 2017. The
Credit Facility - ST can be expanded to $50 million with the consent of the lender. The Credit Facility - ST bears interest at a
variable rate of LIBOR plus 13.00%, with a LIBOR floor of 2.00% and with an additional 0.50% charged on the unused
portion of the facility. As at December 31, 2015, the effective interest rate was 15%. The Credit Facility - ST is secured with
a first charge over substantially all the Company’s assets.
The amount drawn on the Credit Facility - ST as at December 31, 2015 was $20.0 million ($13.6 million at December 31,
2014) with unamortized deferred financing costs of $0.5 million at December 31, 2015 ($0.8 million at December 31, 2014)
netted against the amount owing.
The Credit Facility - Liquid consists of a term loan that authorizes an operating line for a maximum of $50 million and
matures on September 1, 2020. Under the terms of the agreement, the facility may be increased up to $200 million upon
certain conditions. The amount drawn on the facility as at December 31, 2015 was $21.7 million (December 31, 2014 – nil)
with unamortized deferred financing costs of $0.8 million (December 31, 2014 –nil) netted against the amount owing. The
term loan bears interest at a variable rate of LIBOR plus 8.00% (with a LIBOR floor of 1.50%). As at December 31, 2015,
the effective interest rate was 9.5%.
Both Credit Facilities are subject to a number of covenants and events of default.
Debentures
($000s) As at
December 31, 2015 December 31, 2014
Debentures $ 40,326 $ 39,185
We have subordinated debentures that were historically used to finance the operations of our business including much of our
loans receivable. The debentures require interest only payments bearing annual interest rates ranging between 12% and
18.2% (December 31, 2014 — 12% and 18.2%) with principal amounts due upon maturity at various periods beginning
March 2017 and through to December 23, 2019. The debentures are subordinated to the Credit Facilities and secured by the
assets of the Company and can be repaid at any time at the option of the Company.
Management’s Discussion and Analysis
24 | P a g e
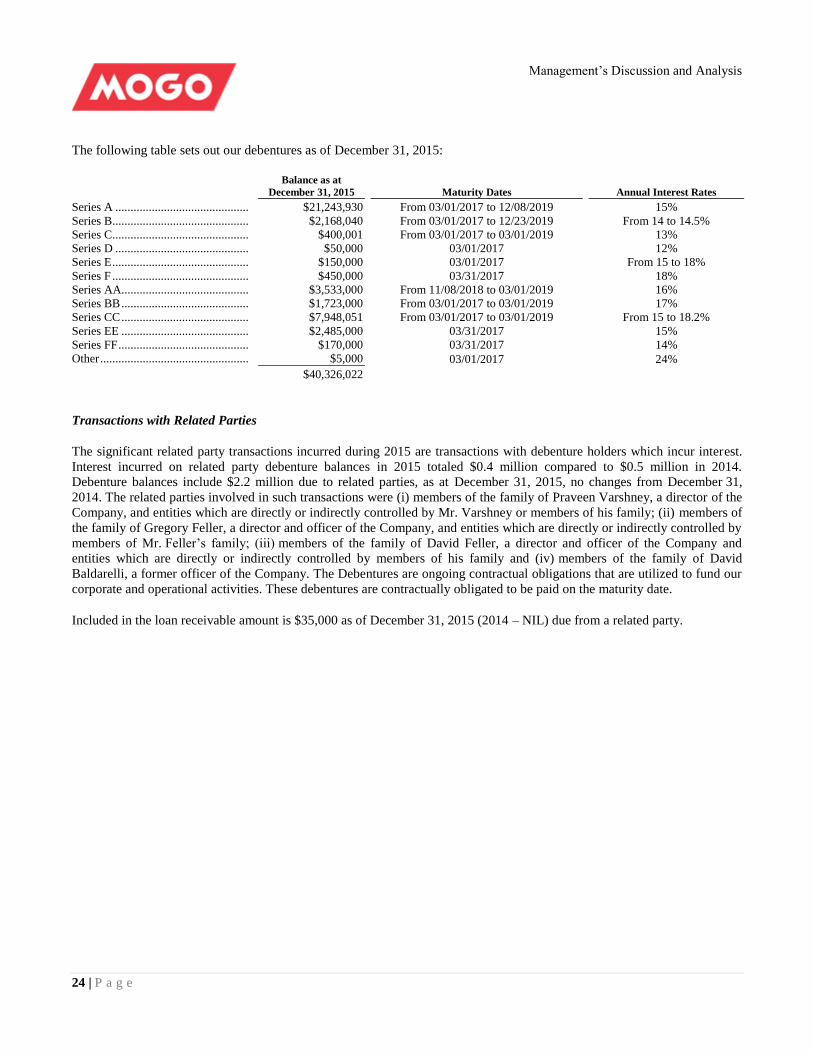
The following table sets out our debentures as of December 31, 2015:
Balance as at
December 31, 2015 Maturity Dates Annual Interest Rates
Series A ............................................ $21,243,930 From 03/01/2017 to 12/08/2019 15%
Series B ............................................. $2,168,040 From 03/01/2017 to 12/23/2019 From 14 to 14.5%
Series C ............................................. $400,001 From 03/01/2017 to 03/01/2019 13%
Series D ............................................ $50,000 03/01/2017 12%
Series E ............................................. $150,000 03/01/2017 From 15 to 18%
Series F ............................................. $450,000 03/31/2017 18%
Series AA.......................................... $3,533,000 From 11/08/2018 to 03/01/2019 16%
Series BB .......................................... $1,723,000 From 03/01/2017 to 03/01/2019 17%
Series CC .......................................... $7,948,051 From 03/01/2017 to 03/01/2019 From 15 to 18.2%
Series EE .......................................... $2,485,000 03/31/2017 15%
Series FF ........................................... $170,000 03/31/2017 14%
Other ................................................. $5,000 03/01/2017 24%
$40,326,022
Transactions with Related Parties
The significant related party transactions incurred during 2015 are transactions with debenture holders which incur interest.
Interest incurred on related party debenture balances in 2015 totaled $0.4 million compared to $0.5 million in 2014.
Debenture balances include $2.2 million due to related parties, as at December 31, 2015, no changes from December 31,
2014. The related parties involved in such transactions were (i) members of the family of Praveen Varshney, a director of the
Company, and entities which are directly or indirectly controlled by Mr. Varshney or members of his family; (ii) members of
the family of Gregory Feller, a director and officer of the Company, and entities which are directly or indirectly controlled by
members of Mr. Feller’s family; (iii) members of the family of David Feller, a director and officer of the Company and
entities which are directly or indirectly controlled by members of his family and (iv) members of the family of David
Baldarelli, a former officer of the Company. The Debentures are ongoing contractual obligations that are utilized to fund our
corporate and operational activities. These debentures are contractually obligated to be paid on the maturity date.
Included in the loan receivable amount is $35,000 as of December 31, 2015 (2014 – NIL) due from a related party.
Management’s Discussion and Analysis
25 | P a g e
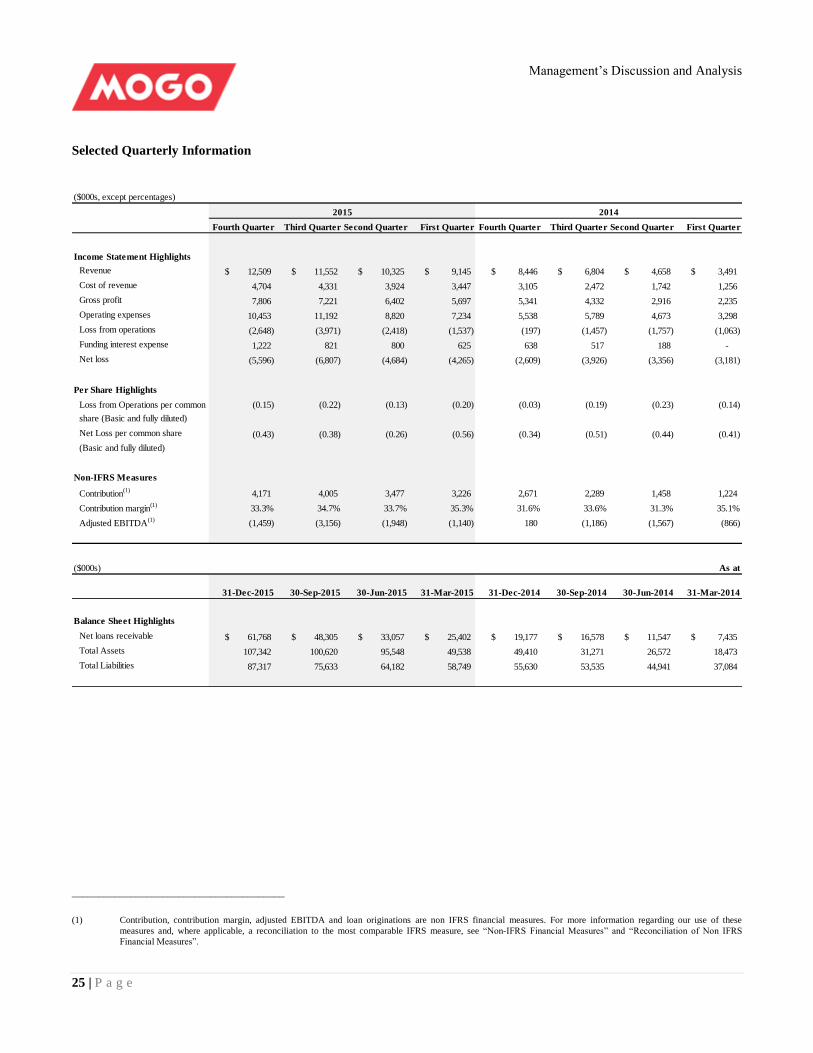
Selected Quarterly Information
($000s, except percentages)
Fourth Quarter Third Quarter Second Quarter First Quarter Fourth Quarter Third Quarter Second Quarter First Quarter
Income Statement Highlights
Revenue 12,509$ 11,552$ 10,325$ 9,145$ 8,446$ 6,804$ 4,658$ 3,491$
Cost of revenue 4,704 4,331 3,924 3,447 3,105 2,472 1,742 1,256
Gross profit 7,806 7,221 6,402 5,697 5,341 4,332 2,916 2,235
Operating expenses 10,453 11,192 8,820 7,234 5,538 5,789 4,673 3,298
Loss from operations (2,648) (3,971) (2,418) (1,537) (197) (1,457) (1,757) (1,063)
Funding interest expense 1,222 821 800 625 638 517 188 -
Net loss (5,596) (6,807) (4,684) (4,265) (2,609) (3,926) (3,356) (3,181)
Per Share Highlights
Loss from Operations per common (0.15) (0.22) (0.13) (0.20) (0.03) (0.19) (0.23) (0.14)
share (Basic and fully diluted)
Net Loss per common share (0.43) (0.38) (0.26) (0.56) (0.34) (0.51) (0.44) (0.41)
(Basic and fully diluted)
Non-IFRS Measures
Contribution(1)
4,171 4,005 3,477 3,226 2,671 2,289 1,458 1,224
Contribution margin(1)
33.3% 34.7% 33.7% 35.3% 31.6% 33.6% 31.3% 35.1%
Adjusted EBITDA(1)
(1,459) (3,156) (1,948) (1,140) 180 (1,186) (1,567) (866)
2015 2014
($000s) As at
31-Dec-2015 30-Sep-2015 30-Jun-2015 31-Mar-2015 31-Dec-2014 30-Sep-2014 30-Jun-2014 31-Mar-2014
Balance Sheet Highlights
Net loans receivable 61,768$ 48,305$ 33,057$ 25,402$ 19,177$ 16,578$ 11,547$ 7,435$
Total Assets 107,342 100,620 95,548 49,538 49,410 31,271 26,572 18,473
Total Liabilities 87,317 75,633 64,182 58,749 55,630 53,535 44,941 37,084
________________________________________
(1) Contribution, contribution margin, adjusted EBITDA and loan originations are non IFRS financial measures. For more information regarding our use of these
measures and, where applicable, a reconciliation to the most comparable IFRS measure, see “Non-IFRS Financial Measures” and “Reconciliation of Non IFRS
Financial Measures”.
Management’s Discussion and Analysis
26 | P a g e
Significant Factors Affecting Results of Operations
Our results of operations are influenced by a variety of factors including revenue, cost of revenue, technology and
development expenses, customer service and operations, marketing expenses, general and administration expenses, interest
expense, foreign exchange rates and economic conditions.
Revenue
We recognize revenue based on the loan products we offer and pursuant to the agreement with our customers. For our
short-term loan products, which generally have terms ranging from fourteen to thirty days, we recognize loan fees when
assessed to the customer.
Our long-term loans fall into two categories: line of credit accounts and installment loans. For our line of credit accounts,
interest is recognized over the reporting period based upon the balance outstanding and the contractual interest rate, and fees
are recognized when assessed to the customer. For our installment loans, interest is recognized on an effective interest rate
method basis over the term of the loan and fees are recognized when assessed to the customer. The Company is highly
focused on growing its long-term loan products, in particular the installment loans, and expects loan interest to be the fastest-
growing revenue segment and to represent an increasing percentage of total revenue. See “Caution Regarding Forward-
Looking Statements”.
Other revenue includes loan protection fees, nonsufficient funds fees, fees related to our prepaid Visa card and other fees or
charges permitted by applicable laws and pursuant to the agreement with our customers. Unpaid and accrued interest and fees
are included in “net loans receivable” in the consolidated statement of financial position.
Cost of Revenue
Cost of revenue consists of provision for loan losses, net of recoveries and transaction costs. Provision for loan losses, net of
recoveries consists of amounts charged to income during the period to maintain an allowance for loan losses estimated to be
adequate to provide for probable credit losses inherent in our existing loan portfolio. Our allowance for loan losses represents
our estimate of the expected credit losses inherent in our portfolio and is based on a variety of factors, including the
composition and quality of the portfolio, loan-specific information gathered through our collection efforts, delinquency
levels, our historical charge-off and loss experience, and general economic conditions. We expect our aggregate provision for
loan losses, net of recoveries to decrease as a percentage of revenue as our loan portfolio continues to transition to be more
long-term in nature. We expect the provision for loan losses, net of recoveries to increase in absolute dollars as the amount of
loans we originate increases. See “Caution Regarding Forward-Looking Statements”.
Transaction costs are expenses that relate directly to the acquisition and processing of new customers (excluding marketing)
and include such expenses as payment processing fees, credit scoring fees, loan system transaction fees, insurance
commission expense and issuance costs and fees related to our Visa card program.
Technology and Development Expenses
Technology and development expenses consist primarily of personnel and related costs of our development, business
intelligence, product development and IT infrastructure employees. Additional expenses include third-party data acquisition
expenses, professional services, consulting costs, expenses related to the development of new products and technologies and
maintenance of existing technology assets, amortization of capitalized software costs related to our technology platform and
allocated overhead. The number of employees in the technology and analytics functions increased from 36 at December 31,
2014 to 78 at December 31, 2015. We believe that continuing to invest in technology is core to our strategy of building a
fully digital financial services platform and customer experience and expect these costs to rise in the near term on an absolute
basis. See “Caution Regarding Forward-Looking Statements”.
Management’s Discussion and Analysis
27 | P a g e
Customer Service and Operations Expenses
Customer service and operations expense consists primarily of salaries and personnel-related costs related to customer
support and collections employees. Additional expenses include third party expenses related to credit data sources,
collections and allocated overhead.
We plan to continue to invest in service and operations as we grow our originations. The number of employees in processing
and servicing functions increased from 157 at December 31, 2014 to 202 at December 31, 2015. We anticipate that our
customer service and operations expense will rise in absolute dollars, but longer term will decrease as a percentage of
revenue as we continue to enhance our technology platform and improve operational efficiencies.
Marketing Expenses
Marketing expense consists of salaries and personnel-related costs of our marketing employees, as well as direct marketing
and advertising costs related to online and offline customer acquisition costs (paid search advertising, search engine
optimization costs, and direct mail), public relations, promotional event programs, corporate communications and allocated
overhead. The number of employees in our marketing functions remained at 9 from December 31, 2014 to December 31,
2015. We transitioned some services to outside agencies to utilize specialized skills not available internally. We expect to
increase the number of marketing professionals and increase our marketing activities in order to continue to expand our direct
customer acquisition efforts and build our brand. While marketing remains an important area of investment for the Company,
management expects marketing expenses as a percentage of revenue to decrease in 2016 from current levels. See “2016
Outlook” and “Caution Regarding Forward-Looking Statements”.
General and Administration Expenses
General and administrative expense consists primarily of salary and personnel related costs for our executive, finance and
accounting, credit analysis, underwriting, legal and compliance, funding, fraud detection and human resources employees.
Additional expenses include consulting and professional fees, insurance, legal, occupancy, other corporate expenses and
travel. The number of employees in general and administrative functions increased from 29 at December 31, 2014 to 43 at
December 31, 2015, and we expect our general and administrative expenses to increase in absolute dollars now that we are
operating as a public company. These expenses will include costs of regulatory reporting and requirements governing public
companies, increased directors’ and officers’ liability insurance, increased accounting, legal and other professional services
fees and an enhanced investor relations function. See “Caution Regarding Forward-Looking Statements”.
Interest Expense
Interest expense is comprised of funding interest and corporate interest. Funding interest expense costs consist of the interest
expense related to the debts which we use to fund our on-balance sheet lending activities. Management expects funding costs
to continue to increase in absolute dollars in the future as the growth of loan portfolio. See “Caution Regarding Forward-
Looking Statements”. Corporate interest expense consists of interest expense and amortization of deferred debt financing
costs incurred on our subordinated debentures.
Changes in macroeconomic conditions may affect generally prevailing interest rates, and such effects may be amplified or
reduced by other factors such as fiscal and monetary policies, economic conditions in other markets and other factors. Interest
rates may also change for reasons unrelated to economic conditions. To the extent that interest rates rise, our funding costs
may increase and the spread between our effective interest yield and our funding costs may narrow to the extent we cannot
correspondingly increase the rates we charge our customers.
Foreign Exchange
Our presentation and functional currency is in Canadian (CAD) dollars. Our operations are based in Canada and we derive all
of our revenue in CAD dollars.
Management’s Discussion and Analysis
28 | P a g e
Unrealized Foreign Exchange Loss
The Company recognized unrealized foreign exchange loss of $0.25 million and $0.20 million for the three months ended
December 31, 2015 and 2014 respectively. The Company recognized unrealized foreign exchange losses of $1.1 million and
$0.5 million for 2015 and 2014 respectively. Unrealized foreign exchange losses are associated with the translation of our
$5.095 million in USD denominated debentures.
Economic Conditions
Changes in the overall economy may impact our business in several ways, including demand for our products, credit
performance and funding costs.
• Demand for Our Products. In a strong economic climate, demand for our products may increase as consumer
spending increases. In addition, more potential customers may meet our underwriting requirements to qualify
for a loan. Traditional lenders may also approve loans for a higher percentage of our potential customers. In a
weakening economic climate or recession, the opposite may occur.
• Credit Performance. In a strong economic climate, our customers may experience improved cash flow and
liquidity, which may result in lower loan losses. In a weakening economic climate or recession, the opposite
may occur. We factor economic conditions into our loan underwriting analysis and allowance for loan losses,
but changes in economic conditions, particularly sudden changes, may affect our actual loan losses.
• Loan Losses. Our underwriting process is designed to limit our loan losses to levels compatible with our
business strategy and financial model. Our aggregate loan losses since 2012 have been consistent with our
financial targets. Our overall loan losses are affected by a variety of factors, including external factors such as
prevailing economic conditions and unusual events such as natural disasters, as well as internal factors such as
the accuracy of our internal credit scoring process, the effectiveness of our underwriting process and the
introduction of new products with which we have less experience to draw upon when forecasting their loss
rates. Our loan losses may vary in the future.
Liquidity and Capital Resources
To date the Company has funded our lending activities, expenses and losses primarily through an initial public offering of an
aggregate of $50 million in 2015 and private placements of preferred shares, private placement of debentures, credit facilities
and cash from operating activities. Our approach to managing liquidity is to ensure, to the extent possible, that we always
have sufficient liquidity to meet our liabilities as they come due. The management does so by continuously monitoring
revenues, expenses and cash flow compared to budget.
To maintain adequate liquidity, the long term business goal of the Company is to enhance diversifying funding sources. The
purpose of diversification by source, geographic location, maturity it to mitigate liquidity and funding risk by ensuring that
the Company has in place alternative sources of funds that strengthen its capacity to withstand a variety of market condition
and support its long term growth. In the near term, management expects to extend or refinance any outstanding amounts
owing under the Credit Facilities or our long term debentures discussed below when they become due and payable. See
“Caution Regarding Forward-Looking Statements”.

Management’s Discussion and Analysis
29 | P a g e
Cash Flows Summary
The following table provides a summary of cash inflows and outflows by activity:
($000s)
2015 2014 2015 2014
Cash provided by (used in) operating activities
before investment in loans receivable (17)$ 1,166$ 134$ (3,754)$
Cash invested in loans receivable (17,586) (5,387) (57,102) (19,307)
Cash used in operating activities (17,603) (4,221) (56,968) (23,061)
Cash used in investing activities (2,669) (782) (8,729) (2,309)
Cash provided by financing activities 12,105 19,758 73,823 47,518
Net increase (decrease) in cash for the period (8,167) 14,755 8,125 22,148
Quarters Ended December 31, Years Ended December 31,
Cash provided by (used in) operating activities
Our operating activities have consisted primarily of funding our short and long-term loan originations, including payment of
associated direct costs and receipt of associated fees, offset by customer repayments of these short and long-term loans.
Cash flows used in operating activities for the quarter ended and year ended December 31, 2015 were $17.6 million and
$57.0 million, respectively. Included in these amounts were net investments of $17.6 million and $57.1 million to increase
the loans receivable portfolio. If these net investments in the loans receivable portfolio were treated as cash flows from
investing activities, the cash flows used in operating activities would be $0.02 million in the fourth quarter of 2015, up $1.2
million compared to the same period of 2014; and the cash flow provided in operating activities would be $0.1 million for
2015, significantly improved by $3.9 million compared to the same period of 2014. The increase was driven primarily by the
record revenues growth and improving operational efficiency. See “Caution Regarding Forward-Looking Statements”.
Cash provided by (used in) investing activities
Our investing activities have consisted primarily of purchases of property, equipment and software and capitalized software
development costs. Purchases of property, equipment and software and capitalized software development costs may vary
from period to period due to the timing of the expansion of our operations, the addition of employee headcount and the
development cycles of our internal-use technology.
For the quarter and year ended December 31, 2015 Cash used for the purchase of property and equipment and investment in
software was $2.7 million and $8.7 million compared to $0.8 million and $2.3 million for the same periods of 2014,
respectively. We expect to continue to invest in additional property and equipment and invest in additional internal use
software to support the growth in our customer base and the continued build out of our digital technology platform and new
products.
Cash provided by (used in) financing activities
Our financing activities have consisted primarily of the issuance of our Common Shares (the “Common Shares”),
convertible preferred shares, debentures and borrowings from the Credit Facilities.
Cash generated from financing activities for the quarter ended and year ended December 31, 2015 was $12.1 million and
$73.8 million, respectively. The increase during 2015 was primarily due to proceeds from our initial public offering as well
as borrowings from our Credit Facilities.
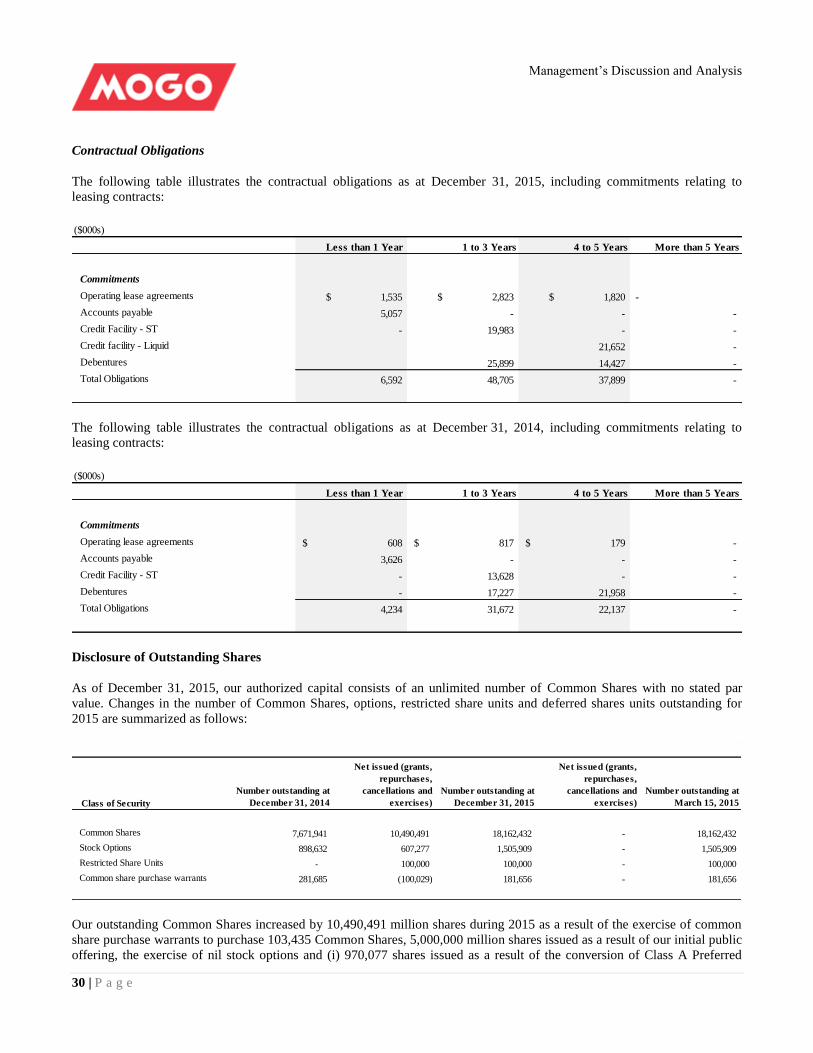
Management’s Discussion and Analysis
30 | P a g e
Contractual Obligations
The following table illustrates the contractual obligations as at December 31, 2015, including commitments relating to
leasing contracts:
($000s)
Less than 1 Year 1 to 3 Years 4 to 5 Years More than 5 Years
Commitments
Operating lease agreements 1,535$ 2,823$ 1,820$ -
Accounts payable 5,057 - - -
Credit Facility - ST - 19,983 - -
Credit facility - Liquid 21,652 -
Debentures 25,899 14,427 -
Total Obligations 6,592 48,705 37,899 -
The following table illustrates the contractual obligations as at December 31, 2014, including commitments relating to
leasing contracts:
($000s)
Less than 1 Year 1 to 3 Years 4 to 5 Years More than 5 Years
Commitments
Operating lease agreements 608$ 817$ 179$ -
Accounts payable 3,626 - - -
Credit Facility - ST - 13,628 - -
Debentures - 17,227 21,958 -
Total Obligations 4,234 31,672 22,137 -
Disclosure of Outstanding Shares
As of December 31, 2015, our authorized capital consists of an unlimited number of Common Shares with no stated par
value. Changes in the number of Common Shares, options, restricted share units and deferred shares units outstanding for
2015 are summarized as follows:
Class of Security
Number outstanding at
December 31, 2014
Net issued (grants,
repurchases,
cancellations and
exercises)
Number outstanding at
December 31, 2015
Net issued (grants,
repurchases,
cancellations and
exercises)
Number outstanding at
March 15, 2015
Common Shares 7,671,941 10,490,491 18,162,432 - 18,162,432
Stock Options 898,632 607,277 1,505,909 - 1,505,909
Restricted Share Units - 100,000 100,000 - 100,000
Common share purchase warrants 281,685 (100,029) 181,656 - 181,656
Our outstanding Common Shares increased by 10,490,491 million shares during 2015 as a result of the exercise of common
share purchase warrants to purchase 103,435 Common Shares, 5,000,000 million shares issued as a result of our initial public
offering, the exercise of nil stock options and (i) 970,077 shares issued as a result of the conversion of Class A Preferred
Management’s Discussion and Analysis
31 | P a g e
Shares, Series 1, (ii) 2,022,358 shares issued as a result of the conversion of Class B Preferred Shares, Series 1, and (iii)
2,394,621 shares issued as a result of the conversion of Class B Preferred Shares, Series 2, each into our Common Shares.
In connection with the initial public offering, outstanding common share purchase warrants were exercised to purchase
103,435 Common Shares on a net settled basis, which decreased the number of outstanding common share purchase warrants
by 183,362. In conjunction with the signing of the Liquid Credit Facility, the Company issued 83,333 common share
purchase warrants.
Our outstanding stock options increased by 607,277 during the year ended December 31, 2015 as a result of 629,610 options
being granted less nil options that were exercised and 22,333 options that were forfeited. Our outstanding restricted share
units increased by 100,000 restricted share units during the year ended December 31, 2015 as a result of 100,000 restricted
share units being granted less nil restricted share units that were exercised.
Risk Management
Credit risk
Credit risk is the risk of financial loss to the Company if a customer or counter-party to a financial instrument fails to meet its
contractual obligations and arises principally from the Company’s loans receivable. The maximum amount of credit risk
exposure is limited to the gross carrying amount of the loans receivable disclosed in these financial statements.
The Company acts as a lender and has little concentration of credit risk with any particular individual, company or other
entity, relating to these services, however the Company is subject to a higher level of credit risk due to the credit constrained
nature of many of the Company’s customers and in circumstances in which they do not comply with its policies and
procedures. The credit risk relates to the possibility of default of payment on the Company’s loans receivable. The Company
performs on-going credit evaluations, aging of loans receivable, payment history and allows for uncollectible amounts when
determinable.
The credit risk decisions on the Company’s loans receivable are made in accordance with policies and procedures and are
impacted by both the Company’s credit policies and the lending practices, which are overseen by the Company’s senior
management. Credit quality of the customer is assessed based on a credit rating scorecard and individual credit limits are
defined in accordance with this assessment. The consumer loans receivable are unsecured. The Company evaluates the
concentration of risk with respect to customer loans receivable as low, as its customers are located in several jurisdictions and
operate independently. The Company develops underwriting models based on the historical performance of groups of
customer loans which guide its lending decisions. To the extent that such historical data used to develop its underwriting
models is not representative or predictive of current loan book performance, the Company could suffer increased loan losses.
The Company cannot guarantee that delinquency and loss levels will correspond with the historical levels experienced and
there is a risk that delinquency and loss rates could increase significantly.
Currency risk
Currency risk is the risk that changes in foreign exchange rates may have an effect on future cash flows associated with
financial instruments. The Company currently does not actively hedge foreign currency risk and transacts in foreign
currencies on a spot basis. The Company is exposed to foreign currency risk on the following financial instruments
denominated in United States dollars.
Cash as at December 31, 2015 - $49,448 (2014 - $46,732)
Debentures as at December 31, 2015 – $5,095,000 (2014- $5,095,000)
Management’s Discussion and Analysis
32 | P a g e
Interest rate risk
Changes in market interest rates may have an effect on the cash flows associated with some financial assets and liabilities,
known as cash flow risk, and on their fair value of other financial assets or liabilities, known as price risk. The Company is
exposed to interest rate risk primarily relating to its Credit Facilities that bears interest that fluctuates with LIBOR. As at
December 31, As at December 31 2015, LIBOR was 0.430% (December 31, 2014 – 0.171%). The Credit Facility - ST has a
LIBOR floor of 2% and the Credit Facility - Liquid has a LIBOR floor of 1.5%, a 0.50% change in LIBOR would not
increase or decrease interest expense. The debentures have fixed rates of interest.
Capital management
Our objective in managing our capital is financial stability and sufficient liquidity to increase shareholder value through
organic growth and investment in technology, marketing and product development. Our senior management team is
responsible for managing the capital through regular review of financial information to ensure sufficient resources are
available to meet operating requirements and investments to support our growth strategy. The Board of Directors is
responsible for overseeing this process. In order to maintain or adjust our capital structure, we may issue new shares,
repurchase shares, approve special dividends or issue debt.
Reconciliation of Non-IFRS Measures
This MD&A makes reference to certain non-IFRS financial measures. Loan originations, gross loans receivable (short-term
and long-term), contribution, contribution margin, adjusted EBITDA and provision rate and Cash provided by (used in)
operating activities before investment in loans receivable are all non-IFRS financial measures. These measures are not
recognized measures under IFRS, do not have a standardized meaning prescribed by IFRS and are therefore unlikely to be
comparable to similar measures presented by other companies. Rather, these measures are provided as additional information
to complement those IFRS measures by providing further understanding of the Company’s results of operations from
management’s perspective. Accordingly, they should not be considered in isolation nor as a substitute for analysis of our
financial information reported under IFRS.
We use non-IFRS financial measures, to provide investors with supplemental measures of our operating performance and
thus highlight trends in our core business that may not otherwise be apparent when relying solely on IFRS financial
measures. We believe that securities analysts, investors and other interested parties frequently use non-IFRS financial
measures in the evaluation of issuers. Our management also uses non-IFRS financial measures in order to facilitate operating
performance comparisons from period to period, prepare annual operating budgets and assess our ability to meet our capital
expenditure and working capital requirements. These Non-IFRS measures have limitations as analytical tools and should not
be considered in isolation or as a substitute for an analysis of our results under IFRS. There are a number of limitations
related to the use of non-IFRS financial measures versus their nearest IFRS equivalents. Investors are encouraged to review
our financial statements and disclosures in their entirety and are cautioned not to put undue reliance on any non-IFRS
measure and view it in conjunction with the most comparable IFRS financial measures. In evaluating these non-IFRS
measures, you should be aware that in the future we will incur expenses similar to the adjustments in this presentation.
Gross loans receivable (short-term and long-term)
Gross loans receivable is an IFRS measure. Gross loans receivable represents the total amount of principal and fees
outstanding to our customers at the end of the period before any provision for potential future charge-offs. We segregate
gross loans receivable between loans receivable – short term and gross loans receivable – long-term, both of which are non-
IFRS measures.
We use the term “gross loans receivable – short term” to refer to loans receivable relating to our loan products having terms
of less than one year, which we refer to as “short-term loan products”. The only short-term loan products offered are Mogo’s
Zip products which generally have terms of between 14 and 30 days. We use the term “gross loans receivable – long term” to
refer to loans receivable relating to our loan products having terms of one year or more, which we refer to as “long-term loan
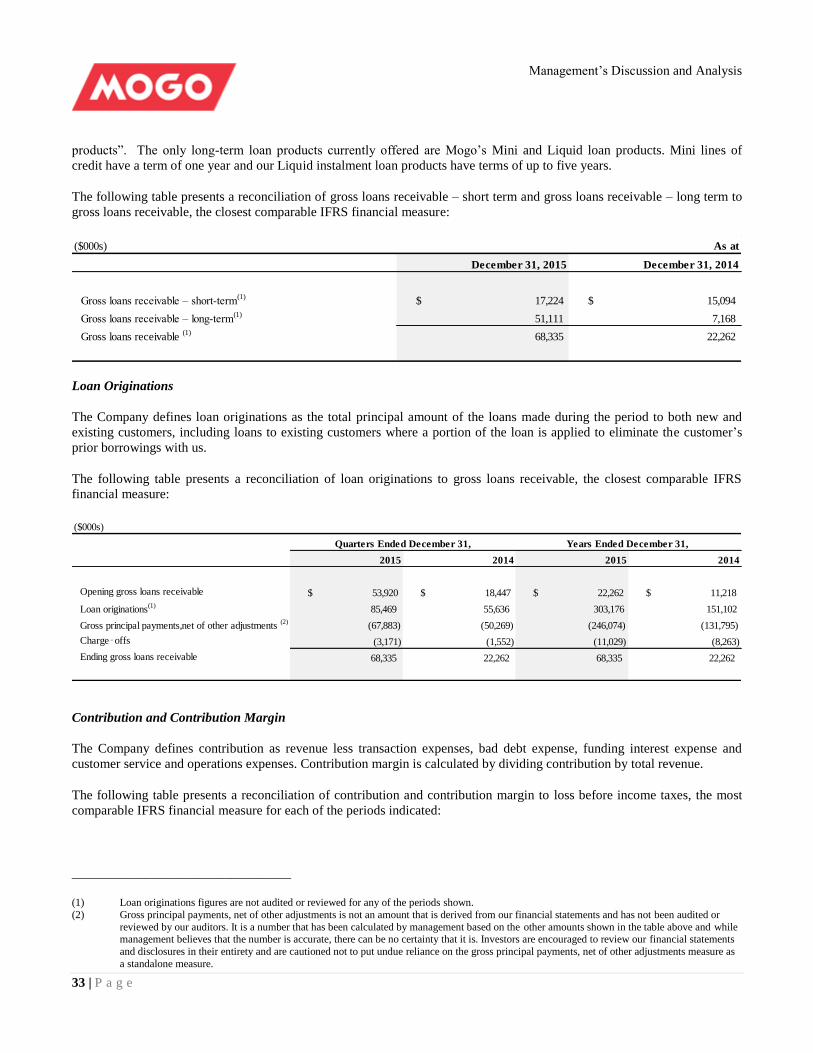
Management’s Discussion and Analysis
33 | P a g e
products”. The only long-term loan products currently offered are Mogo’s Mini and Liquid loan products. Mini lines of
credit have a term of one year and our Liquid instalment loan products have terms of up to five years.
The following table presents a reconciliation of gross loans receivable – short term and gross loans receivable – long term to
gross loans receivable, the closest comparable IFRS financial measure:
($000s) As at
December 31, 2015 December 31, 2014
Gross loans receivable – short-term(1)
17,224$ 15,094$
Gross loans receivable – long-term(1)
51,111 7,168
Gross loans receivable (1)
68,335 22,262
Loan Originations
The Company defines loan originations as the total principal amount of the loans made during the period to both new and
existing customers, including loans to existing customers where a portion of the loan is applied to eliminate the customer’s
prior borrowings with us.
The following table presents a reconciliation of loan originations to gross loans receivable, the closest comparable IFRS
financial measure:
($000s)
2015 2014 2015 2014
Opening gross loans receivable 53,920$ 18,447$ 22,262$ 11,218$
Loan originations(1)
85,469 55,636 303,176 151,102
Gross principal payments,net of other adjustments (2)
(67,883) (50,269) (246,074) (131,795)
Charge‑offs (3,171) (1,552) (11,029) (8,263)
Ending gross loans receivable 68,335 22,262 68,335 22,262
Quarters Ended December 31, Years Ended December 31,
Contribution and Contribution Margin
The Company defines contribution as revenue less transaction expenses, bad debt expense, funding interest expense and
customer service and operations expenses. Contribution margin is calculated by dividing contribution by total revenue.
The following table presents a reconciliation of contribution and contribution margin to loss before income taxes, the most
comparable IFRS financial measure for each of the periods indicated:
_________________________________
(1) Loan originations figures are not audited or reviewed for any of the periods shown.
(2) Gross principal payments, net of other adjustments is not an amount that is derived from our financial statements and has not been audited or
reviewed by our auditors. It is a number that has been calculated by management based on the other amounts shown in the table above and while management believes that the number is accurate, there can be no certainty that it is. Investors are encouraged to review our financial statements
and disclosures in their entirety and are cautioned not to put undue reliance on the gross principal payments, net of other adjustments measure as
a standalone measure.
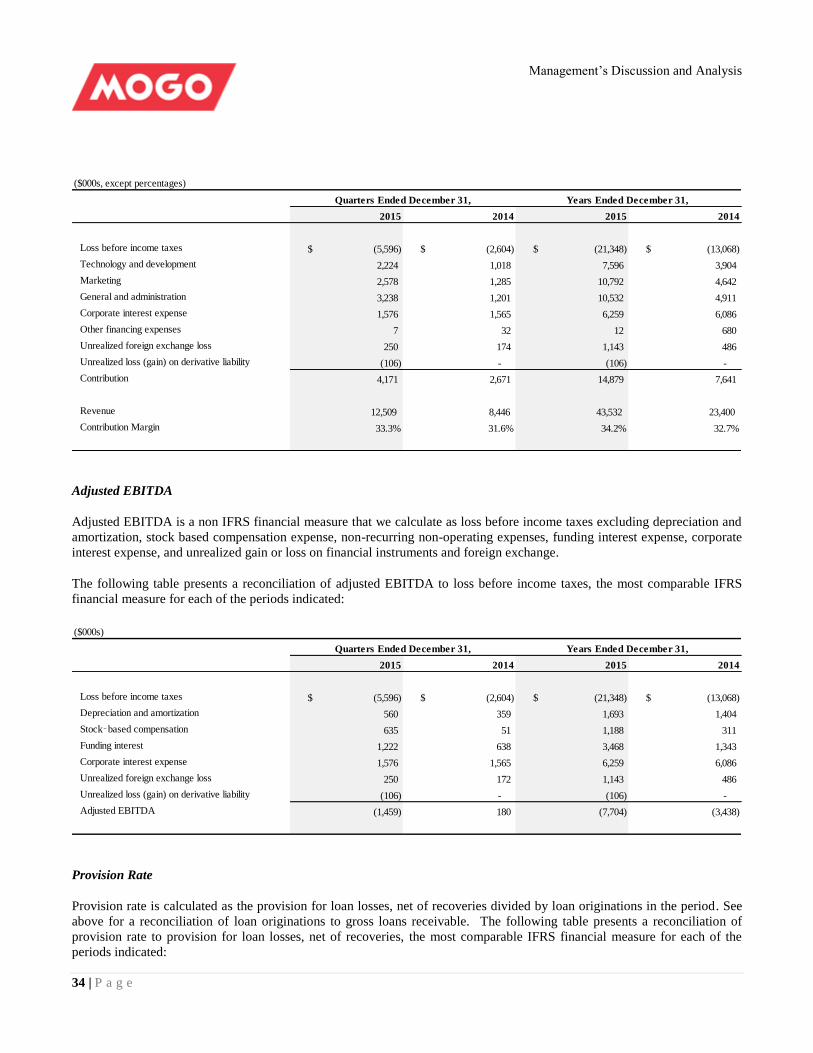
Management’s Discussion and Analysis
34 | P a g e
($000s, except percentages)
2015 2014 2015 2014
Loss before income taxes (5,596)$ (2,604)$ (21,348)$ (13,068)$
Technology and development 2,224 1,018 7,596 3,904
Marketing 2,578 1,285 10,792 4,642
General and administration 3,238 1,201 10,532 4,911
Corporate interest expense 1,576 1,565 6,259 6,086
Other financing expenses 7 32 12 680
Unrealized foreign exchange loss 250 174 1,143 486
Unrealized loss (gain) on derivative liability (106) - (106) -
Contribution 4,171 2,671 14,879 7,641
Revenue 12,509 8,446 43,532 23,400
Contribution Margin 33.3% 31.6% 34.2% 32.7%
Quarters Ended December 31, Years Ended December 31,
Adjusted EBITDA
Adjusted EBITDA is a non IFRS financial measure that we calculate as loss before income taxes excluding depreciation and
amortization, stock based compensation expense, non-recurring non-operating expenses, funding interest expense, corporate
interest expense, and unrealized gain or loss on financial instruments and foreign exchange.
The following table presents a reconciliation of adjusted EBITDA to loss before income taxes, the most comparable IFRS
financial measure for each of the periods indicated:
($000s)
2015 2014 2015 2014
Loss before income taxes (5,596)$ (2,604)$ (21,348)$ (13,068)$
Depreciation and amortization 560 359 1,693 1,404
Stock‑based compensation 635 51 1,188 311
Funding interest 1,222 638 3,468 1,343
Corporate interest expense 1,576 1,565 6,259 6,086
Unrealized foreign exchange loss 250 172 1,143 486
Unrealized loss (gain) on derivative liability (106) - (106) -
Adjusted EBITDA (1,459) 180 (7,704) (3,438)
Quarters Ended December 31, Years Ended December 31,
Provision Rate
Provision rate is calculated as the provision for loan losses, net of recoveries divided by loan originations in the period. See
above for a reconciliation of loan originations to gross loans receivable. The following table presents a reconciliation of
provision rate to provision for loan losses, net of recoveries, the most comparable IFRS financial measure for each of the
periods indicated:
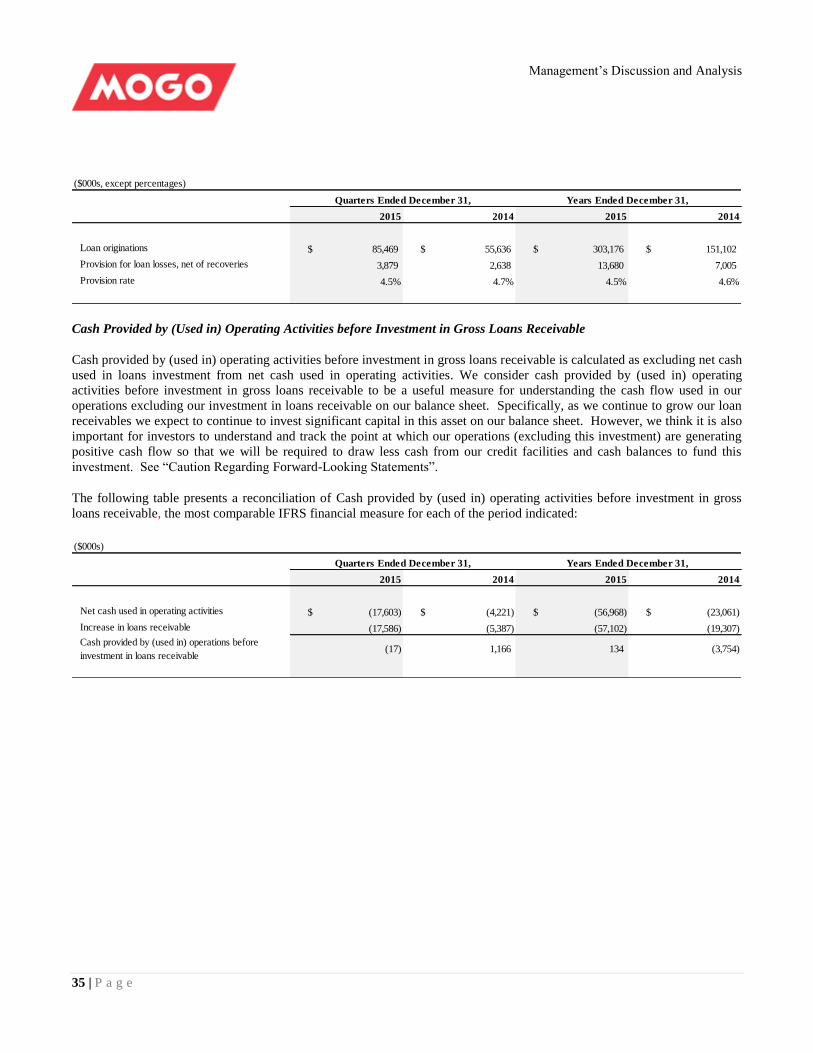
Management’s Discussion and Analysis
35 | P a g e
($000s, except percentages)
2015 2014 2015 2014
Loan originations 85,469$ 55,636$ 303,176$ 151,102$
Provision for loan losses, net of recoveries 3,879 2,638 13,680 7,005
Provision rate 4.5% 4.7% 4.5% 4.6%
Quarters Ended December 31, Years Ended December 31,
Cash Provided by (Used in) Operating Activities before Investment in Gross Loans Receivable
Cash provided by (used in) operating activities before investment in gross loans receivable is calculated as excluding net cash
used in loans investment from net cash used in operating activities. We consider cash provided by (used in) operating
activities before investment in gross loans receivable to be a useful measure for understanding the cash flow used in our
operations excluding our investment in loans receivable on our balance sheet. Specifically, as we continue to grow our loan
receivables we expect to continue to invest significant capital in this asset on our balance sheet. However, we think it is also
important for investors to understand and track the point at which our operations (excluding this investment) are generating
positive cash flow so that we will be required to draw less cash from our credit facilities and cash balances to fund this
investment. See “Caution Regarding Forward-Looking Statements”.
The following table presents a reconciliation of Cash provided by (used in) operating activities before investment in gross
loans receivable, the most comparable IFRS financial measure for each of the period indicated:
($000s)
2015 2014 2015 2014
Net cash used in operating activities (17,603)$ (4,221)$ (56,968)$ (23,061)$
Increase in loans receivable (17,586) (5,387) (57,102) (19,307)
Cash provided by (used in) operations before
investment in loans receivable(17) 1,166 134 (3,754)
Years Ended December 31, Quarters Ended December 31,
Management’s Discussion and Analysis
36 | P a g e
Critical Accounting Policies and Estimates
The preparation of financial statements in conformity with IFRS requires management to make judgments, estimates and
assumptions that affect the reported amounts and disclosures in the consolidated financial statements and notes. These
estimates and assumptions are based on management’s historical experience, best knowledge of current events, conditions
and actions that the Company may undertake in the future and other factors that management believes are reasonable under
the circumstances.
These estimates and assumptions are reviewed periodically and the effect of a change in accounting estimate or assumption is
recognized prospectively by including it in the Consolidated Statement of Comprehensive Loss in the period of the change
and in any future periods affected.
The areas where judgments, estimates and assumptions have the most significant effect on the amounts recognized in the
consolidated financial statements include share- based payments, as described above, and the following:
Loans receivable
Loans receivable are stated after evaluation as to their collectability and an appropriate allowance for loan losses is provided
where considered necessary. The Company has determined the likely impairment loss on loans receivable which have not
maintained the loan repayments in accordance with the loan contract or where there is other evidence of potential
impairment. The methodology and assumptions used in setting the loan allowance are reviewed regularly to reduce any
difference between loss estimates and actual loss experience.
Our provision for loan losses included in the allowance consists of amounts charged to income during the period to maintain
an allowance for loan losses estimated to be adequate to provide for probable credit losses inherent in our existing loan
portfolio. Our allowance for loan losses represents our estimate of the expected credit losses inherent in our portfolio and is
based on a variety of factors, including the composition and quality of the portfolio, loan-specific information gathered
through our collection efforts, delinquency levels, our historical charge-off and loss experience, and general economic
conditions.
Capitalization of intangible assets
In applying its accounting policy for costs incurred during the development phase for new software, the Company must
determine whether the criteria for capitalization have been met. The most difficult and subjective estimate is whether a
project will generate probable future economic benefits. Management considers all appropriate facts and circumstances in
making this assessment including historical experience, costs and anticipated future economic conditions.
Income taxes
Current income tax assets and liabilities for the current and prior periods are measured at the amount expected to be
recovered from, or paid to, the taxation authorities. The tax rates and tax laws used to compute the amount are those that are
enacted or substantively enacted, by the reporting date, in the countries where we operate and generate taxable income.
Deferred income tax assets and liabilities are recorded for the temporary differences between transactions that have been
included in the financial statements or income tax returns. Deferred income taxes are provided for using the liability method.
Under the liability method, deferred income taxes are recognized for all significant temporary differences between the tax
and financial statement bases of assets and liabilities and for certain carry-forward items.
Deferred income tax assets are recognized only to the extent that, in the opinion of management, it is probable that the
deferred income tax assets will be realized.
The recognition of deferred tax assets requires that we assess future taxable income available to utilize deferred tax assets
related to deductible or taxable temporary differences. We consider the nature and carry-forward period of deferred tax
Management’s Discussion and Analysis
37 | P a g e
assets, our recent earnings history and forecast of future earnings in performing this assessment. The actual deferred tax
assets realized may differ from the amount recorded due to factors having a negative impact on our operating results and
lower future taxable income.
Investment tax credits recoverable
The recognition of investment tax credits recoverable requires that we assess future tax payable available to utilize the
investment tax credits. We consider the carry-forward period of the investment tax credits, our recent earnings history and
forecast of future earnings in performing this assessment. We determine the value of effort expended towards research and
development projects that qualify for investment tax credits and calculate the estimated recoverable to be recognized. The
allocation of direct salaries to qualifying projects is derived from time records and assessment by management. The actual
investment tax credits claimed and realized may differ from the estimate based on the final tax returns and review by tax
authorities.
Fair value of share-based payments
We use the Black-Scholes valuation model to determine the fair value of equity settled stock options and warrants that are
treated as derivative liabilities. Estimates are required for inputs to this model including the fair value of the underlying
shares, the expected life of the option, volatility, expected dividend yield and the risk-free interest rate. Variation in actual
results for any of these inputs will result in a different value of the stock option realized from the original estimate.
Financial Instruments and Other Instruments
We recognize financial assets and liabilities when we become party to the contractual provisions of the instrument. On initial
recognition, financial assets and liabilities are measured at fair value plus transaction costs directly attributable to the
financial assets and liabilities, except for financial assets or liabilities at fair value through profit and loss, whereby the
transactions costs are expensed as incurred.
Contingencies
The Company is involved in various legal matters arising in the ordinary course of business. The resolution of these matters
is not expected to have a material adverse effect on the Company’s financial position, financial performance or cash flows.
See “Caution Regarding Forward-Looking Statements”.
The Company has indemnified its directors and officers and particular employees in accordance with the Company’s policies.
The Company maintains insurance policies that may provide coverage against certain claims.
Off-Balance Sheet Arrangements
We have no off-balance sheet arrangements, other than operating leases that have, or are likely to have, a current or future
material effect on our consolidated financial position, financial performance, liquidity, capital expenditures or capital
resources.
New IFRS standards and interpretations not yet applied
Certain new standards have been published that are mandatory for the Company’s accounting periods beginning on or after
January 1, 2015 or later periods that the Company has decided not to early adopt, and which management has not yet
assessed the impact. The new IFRS standards not yet applied include:
IFRS 9, Financial Instruments, is part of the IASB's wider project to replace IAS 39 ‘Financial Instruments: Recognition and
Measurement’. IFRS 9 retains but simplifies the mixed measurement model and establishes two primary measurement
categories for financial assets, amortized cost and fair value. The basis of classification depends on the entity's business
model and the contractual cash flow characteristics of the financial asset. IFRS 9 is effective for reporting periods beginning
Management’s Discussion and Analysis
38 | P a g e
on or after January 1, 2018. The Company is currently assessing the impact of the amendment on its financial statements.
In May 2014, the IASB issued IFRS 15, Revenue from Contracts with Customers, a new standard that specifies the steps and
timing for entities to recognize revenue as well as requiring them to provide more informative, relevant disclosures. IFRS 15
supersedes IAS 11, Construction Contracts, and IAS 18, Revenue, as well as various IFRIC and SIC interpretations regarding
revenue. Adoption of IFRS 15 is mandatory and will be effective for the Company beginning on January 1, 2018, with earlier
adoption permitted. The Company is assessing the impact of adopting this standard on its financial statements.
IFRS 16 - Leases replaces IAS 17 - Leases and requires lessees to account for leases on balance sheet by recognizing a right
of use asset and a lease liability. The standard is effective for annual periods beginning on or after January 1, 2019, with
earlier adoption permitted.
Accounting standards and amendments adopted
IFRS 2, Share-Based Payments has amended the definitions of market and vesting conditions and added definitions for
performance and service conditions. Vesting conditions are now defined as either service conditions or performance
conditions. The amendments also clarify certain other requirements for performance, service market and non-vesting
conditions. This amendment did not impact the Company’s financial statements for 2015.
IFRS 13, Fair Value Measurement, is part of the Annual Improvements to the 2010 - 2012 cycle, the amendments to the basis
of conclusions of IFRS 13, issued by the IASB in December 2013, clarify that amendments to IFRS 9 Financial Instruments
and IAS 39 Financial Instruments: Recognition and Measurement do not remove the ability to measure certain short-term
receivables and payables on an undiscounted basis. The amendment did not significantly impact the Company’s financial
statements for 2015.
IAS 24, Related Party Transactions clarifies that a management entity providing key management personnel services to a
reporting entity is also considered a related party of the reporting entity. Therefore the amounts paid by the reporting entity
in relation to those services must also be included in the amounts disclosed in the related party transactions note. Disclosures
of the components of the services provided are not required. This amendment did not impact the Company’s financial
statements for 2015.
Management’s Discussion and Analysis
39 | P a g e
Controls and Procedures
Disclosure Controls and Procedures
The Company’s Chief Executive Officer (“CEO”) and Chief Financial Officer (“CFO”) are responsible for establishing and
maintaining disclosure controls and procedures for the Company. The Company maintains a set of disclosure controls and
procedures designed to provide reasonable assurance that information required to be publicly disclosed is recorded,
processed, summarized and reported on a timely basis. The CEO and CFO have evaluated the design of the Company’s
disclosure controls and procedures at the end of the quarter and based on the evaluation, the CEO and CFO have concluded
that the disclosure controls and procedures are effectively designed.
Internal Controls over Financial Reporting
The Company’s internal controls over financial reporting (“ICFR”) are designed to provide reasonable assurance regarding
the reliability of financial reporting and the preparation of financial statements for external purposes in accordance with
IFRS. The Company’s management is responsible for establishing and maintaining adequate ICFR for the Company.
Management, including the CEO and CFO, does not expect that the Company’s ICFR will prevent or detect all errors and all
fraud or will be effective under all future conditions. A control system is subject to inherent limitations and even those
systems determined to be effective can provide only reasonable, but not absolute, assurance that the control objectives will be
met with respect to financial statement preparation and presentation. National Instrument 52-109 of the Canadian Securities
Administrators requires the CEO and CFO to certify that they are responsible for establishing and maintaining ICFR for the
Company and that those internal controls have been designed and are effective in providing reasonable assurance regarding
the reliability of financial reporting and the preparation of financial statements in accordance with IFRS. The CEO and CFO
are also responsible for disclosing any changes to the Company’s internal controls during the most recent period that have
materially affected, or are reasonably likely to materially affect, its internal control over financial reporting. The Company’s
management under the supervision of the CEO and CFO has evaluated the design of the Company’s ICFR based on the
Internal Control – Integrated Framework issued in 2013 by the Committee of Sponsoring Organizations of the Treadway
Commission. As at December 31, 2015, management assessed the design of the Company’s ICFR and concluded that such
ICFR is appropriately designed and that there are no material weaknesses in the Company’s ICFR that have been identified
by management. There have been no changes in the Company's internal control over financial reporting during the period that
have materially affected, or are likely to materially affect, the Company's internal control over financial reporting.
Risk Factors
Investing in our Common Shares involves significant risks. You should carefully consider the risks described below, which
are qualified in their entirety by reference to, and must be read in conjunction with, the information appearing elsewhere in
this MD&A, and all other information contained in the Company’s annual filings, including the Annual Information Form
and consolidated financial statements and accompanying notes. The risks and uncertainties described below are those we
currently believe to be material, but they are not the only ones we face. If any of the following risks, or any other risks and
uncertainties that we have not yet identified or that we currently consider not to be material, actually occur or become
material risks, our business, prospects, financial condition, results of operations and cash flows could be materially and
adversely affected. In that event, the trading price of our Common Shares could decline and you could lose part or even all of
your investment.
Risks Related to Our Business and Industry
We have a limited operating history in an evolving industry, which makes it difficult to evaluate our future prospects and
may increase the risk that we will not be successful.
We have a limited operating history in an evolving industry that may not develop as expected. Assessing our business and
future prospects is challenging in light of the risks and difficulties we may encounter. These risks and difficulties include our
ability to:
Management’s Discussion and Analysis
40 | P a g e
• navigate complex and evolving regulatory and competitive environments;
• increase the number and total volume of loans we extend to our customers;
• successfully maintain and evolve our internal controls to manage compliance within an evolving and complex
regulatory environment;
• improve the terms on which we lend to our customers as our business becomes more efficient;
• increase the effectiveness of our direct marketing and ability to identify the trends relevant to our targeted
demographics;
• increase retention of existing customers;
• successfully develop and deploy new loan products;
• successfully maintain our funding strategy;
• favourably compete with other companies that are currently in, or may in the future enter, the business of
lending to our targeted demographics;
• successfully navigate economic conditions and fluctuations in the credit market
• effectively manage the growth of our business;
• successfully expand our business;
• continue to revise our platform’s proprietary credit model;
• continue to develop, maintain and scale our platform;
• effectively use limited personnel and technology resources;
• effectively maintain and scale our financial and risk management controls and procedures;
• maintain the security of our platform and the confidentiality of the information provided and utilized across our
platform; and
• attract, integrate and retain an appropriate number of qualified employees.
We may not be able to successfully address these risks and difficulties, which could harm our business and cause our
operating results to suffer.
Our recent, rapid growth may not be indicative of our future growth and, if we continue to grow rapidly, we may not be
able to manage our growth effectively.
Our total revenue grew from $23.4 million in 2014 to $43.5 million in 2015. We expect that, in the future, even if our
revenue continues to increase our rate of revenue growth may not continue at the same pace or may decline in the future.
In addition, we expect to continue to expend substantial financial and other resources on:
• personnel, including significant increases to the total compensation we pay our employees as we grow our
employee headcount;
Management’s Discussion and Analysis
41 | P a g e
• marketing, including expenses relating to increased direct marketing efforts;
• product development, including the continued development of our platform;
• office space, as we increase the space we need for our growing employee base; and
• general administration, including legal, accounting and other compliance expenses related to being a
public company.
In addition, our historical rapid growth has placed, and may continue to place, significant demands on our management and
our operational and financial resources. Finally, our organizational structure is becoming more complex as we add additional
staff, and we will need to improve our operational, financial, management and compliance controls as well as our reporting
systems and procedures. If we cannot manage our growth effectively our financial results will suffer.
We have a history of losses and may not achieve consistent profitability in the future.
We generated net losses of $21.4 million in 2015 and of $13.1 million in 2014. As of December 31, 2015, we had an
accumulated deficit of $26.8 million. We will need to generate and sustain increased revenue levels in future periods in order
to become profitable, and, even if we do, we may not be able to maintain or increase our level of profitability. We intend to
continue to expend significant funds to expand our marketing and sales operations, increase our customer service and general
loan servicing capabilities, meet the increased compliance requirements associated with our transition to and operation as a
public company, lease additional space for our growing employee base and expand into new markets. In addition, we
provision for loan losses, net of recoveries based on our expectation of future loan losses related to our loans receivable. As
we continue to grow our customers and loans receivable we expect the aggregate amount of this expense will also continue
to grow.
Our efforts to grow our business may be more costly than we expect, and we may not be able to increase our revenue enough
to offset our higher operating expenses. We may incur significant losses in the future for a number of reasons, including the
other risks described in this MD&A, and unforeseen expenses, difficulties, complications and delays, and other unknown
events. If we are unable to achieve and sustain profitability, the market price of our common stock may significantly
decrease.
To date, we have derived our revenue from a limited number of products and markets. Our efforts to expand our market
reach and product portfolio may not succeed and may reduce our revenue growth.
We offer loans to our customers in Alberta, British Columbia and Ontario. Many of our competitors offer a more diverse set
of products to individuals and in additional markets. While we intend to eventually broaden the scope of products that we
offer to our customers, there can be no assurance that we will be successful in such efforts. Failure to broaden the scope of
products we offer to potential customers may inhibit the growth of repeat business from our customers and harm our
operating results. In addition, failure to broaden the scope of our offerings to include loans to small businesses may inhibit
our growth.
There also can be no guarantee that we will be successful with respect to our current efforts in Alberta, British Columbia and
Ontario, as well as any further expansion beyond these provinces or Canada, if we decide to attempt such expansion at all,
which may also inhibit the growth of our business. Expanding our operations into new markets would subject our business to
new challenges, regulations and risks.
The financial services industry is highly regulated. Changes in regulations or in the way regulations are interpreted or
applied to our business could adversely affect our business.
Our business is subject to numerous federal, provincial and other local laws, ordinances and regulations in each of the
jurisdictions in which we operate, which are subject to change and which may impose significant costs or limitations on the
way we conduct or expand our business. These regulations govern, or affect, among other things:
Management’s Discussion and Analysis
42 | P a g e
• lending and collection practices, such as truth in lending and short- term and installment lending and continuous
payment authority;
• interest rates and usury;
• loan amount and fee limitations;
• pre-paid cards;
• licensing and posting of fees;
• currency reporting; and
• privacy of personal consumer information.
As we develop and introduce new products and services, we may become subject to additional laws and regulations. Future
legislation or regulations may restrict our ability to continue our current methods of operation or expand our operations and
may have a negative effect on our business, results of operations and financial condition. In addition, future legislation or
regulations, or amendments to the existing regulatory regime, could require us to modify our platform and processes, which
may cause us to incur additional costs.
Governments at the national, provincial and local levels may seek to impose new licensing requirements or interpret or
enforce existing requirements in new ways. We and other participants in our industry are currently, and may in the future be,
subject to litigation and regulatory proceedings which could generate adverse publicity or cause us to incur substantial
expenditures or modify the way we conduct our business. Changes in laws or regulations, new precedents or interpretation of
existing laws, changes in regulatory bodies with oversight for our business, or our failure to comply with applicable laws and
regulations, may have a material adverse effect on our business, prospects, results of operations, and financial condition. In
addition, a proceeding relating to one or more allegations or findings of our violation of such laws could result in
modifications in our methods of doing business that could impair our ability to collect payments on our loans or to acquire
additional loans or could result in the requirement that we pay damages and/or cancel the balance or other amounts owing
under loans associated with such violation.
Our short-term loan products in particular are subject to regulations in each of the markets in which we operate that
significantly impact the manner in which we conduct our business. The Canadian Parliament amended the federal usury law
in 2007 to permit each province to assume jurisdiction over and the development of laws and regulations regarding our
industry. To date, Alberta, British Columbia, Manitoba, New Brunswick, Nova Scotia, Ontario and Saskatchewan have
passed legislation regulating unsecured short-term consumer lenders and each has, or is in the process of adopting,
regulations and rates consistent with those laws. A material failure to comply with any such laws or regulations could result
in regulatory actions, lawsuits and damage to our reputation, which could have a material adverse effect on our business and
financial condition and our ability to originate and service loans and perform our obligations to other constituents.
Our consumer loans are governed by the various consumer protection legislation and regulations that exist in each province
and territory and by federal laws which set a maximum rate of interest. As we do not accept customer deposits, we are not
subject to the rules set out for banks by the Office of the Superintendent of Financial Institutions.
Section 347 of the Criminal Code, prohibits the charging of an effective annual rate of interest that exceeds sixty percent for
an agreement or arrangement for credit advanced. For the purposes of section 347, “interest” is broadly defined to include the
aggregate of all charges and expenses, whether in the form of a fee, fine, penalty, commission or other similar charge or
expense or in any other form, paid or payable for the advancing of credit under the agreement or arrangement. The Company
believes that it is subject to section 347 of the Criminal Code.
Consumer protection laws in the provinces in which we operate specify that if our business involves the provision of credit,
as defined therein, we may be required to comply with various disclosure requirements, including in some instances
Management’s Discussion and Analysis
43 | P a g e
disclosure requirements concerning the costs of credit. We have reviewed and revised our business model to ensure it is in
compliance with the applicable provincial laws. However, the application of certain provincial legislation to our business
model remains uncertain.
We have reviewed and revised our business model to ensure it is in compliance with the applicable provincial and federal
laws, the application of certain legislation to our business model remains uncertain. There is a risk that regulatory bodies or
consumers could assert that certain federal or provincial laws are applicable where we have determined that they are not, and
that we are not in compliance with such applicable requirements. If it is determined that we have not complied with the
requirements of applicable laws, we could be subject to either or both (1) civil actions for nullification of contracts, rebate of
some or all payments made by customers, and damages, and (2) prosecution for violation of the laws, any of which outcomes
could have a material adverse effect on the Company.
On July 1, 2014, new anti-spam legislation came into effect in Canada for the purpose of helping to protect Canadians from
unwanted electronic messages. The legislation imposes new requirements on organizations when sending “commercial
electronic messages” such as email, SMS and instant messaging, such that organizations must have the express or implied
consent of the recipient to send those messages. The legislation establishes requirements for sending marketing messages that
may prevent the Company or its advertising agency partners from initiating certain types of marketing campaigns or
engaging in select marketing practices. This may reduce demand for our products and limit the amount of revenue that the
Company is able to generate from its business.
Our transactions may be subject to sophisticated schemes or collusion to defraud, launder money or other illegal activities.
There is a risk that our products may be used for those purposes by our customers. There is also a risk that we will be subject
to fraudulent activities by our employees. Any exposure to fraud and/or money laundering could subject us to financial
losses, business disruption and damage to our reputation. In addition, there is a risk that we may be subject to investigation
and sanctions by a regulator and/or to civil and criminal liability if we have failed to comply with our legal obligations
relating to the reporting of money laundering or other offences. We have implemented policies and procedures designed to
minimize the risk of fraud and money laundering, including conducting anti-money laundering checks on our customers.
However, there can be no guarantee that these policies and procedures will be effective in all cases.
The collection, processing, storage, use and disclosure of personal data could give rise to liabilities as a result of
governmental regulation, conflicting legal requirements or differing views of personal privacy rights.
We receive, transmit and store a large volume of personally identifiable information and other sensitive data from customers
and potential customers. There are federal, provincial and foreign laws regarding privacy and the storing, sharing, use,
disclosure and protection of personally identifiable information and sensitive data. Specifically, personally identifiable
information is increasingly subject to legislation and regulations to protect the privacy of personal information that is
collected, processed and transmitted. Any violations of these laws and regulations may require us to change our business
practices or operational structure, address legal claims and sustain monetary penalties and/or other harms to our business.
The regulatory framework for privacy issues in Canada is constantly evolving and is likely to remain uncertain for the
foreseeable future. The interpretation and application of such laws is often uncertain, and such laws may be interpreted and
applied in a manner inconsistent with our current policies and practices or require changes to the features of our platform. If
either we or our third-party service providers are unable to address any privacy concerns, even if unfounded, or to comply
with applicable laws and regulations, it could result in additional costs and liability, damage our reputation and harm
our business.
Worsening economic conditions may result in decreased demand for our loans, cause our customers’ default rates to
increase and harm our operating results.
Uncertainty and negative trends in general economic conditions in Canada and abroad, including significant tightening of
credit markets, historically have created a difficult environment for companies in the lending industry. Many factors,
including factors that are beyond our control, may have a detrimental impact on our operating performance. These factors
Management’s Discussion and Analysis
44 | P a g e
include general economic conditions, unemployment levels, energy costs and interest rates, as well as events such as natural
disasters, acts of war, terrorism and catastrophes.
Many of our customers are millennials. Accordingly, our customers may be more likely to be affected or more severely
affected than more established individuals by adverse economic conditions. These conditions may result in a decline in the
demand for our loans by potential customers or higher default rates by our existing customers.
There can be no assurance that economic conditions will remain favorable for our business or that demand for our loans or
default rates by our customers will remain at current levels. Reduced demand for our loans would negatively impact our
growth and revenue, while increased default rates by our customers may inhibit our access to capital and negatively impact
our profitability. If delinquency or uncollectable rates on our consumer loans exceed certain levels defined in our Credit
Facility Agreements, it could constitute a default under the Credit Facilities or other credit facilities, reducing or terminating
such facilities. Furthermore, we receive a number of applications from potential customers who do not satisfy the
requirements for our loans. If an insufficient number of qualified individuals apply for our loans, our growth and revenue
could decline.
Our business may be adversely affected by material changes to the interest rate charged to our customers and paid to
our lenders.
We earn a substantial portion of our revenues from interest payments on the loans we make to our customers. Various
financial institutions and other funding sources provide and may in the future provide us with the capital to fund these term
loans and lines of credit and charge us interest on funds that we draw down. In the event that the spread between the rate at
which we lend to our customers and the rate at which we borrow from our lenders decreases, our financial results and
operating performance will be harmed.
There are a variety of factors that could affect the interest rates we charge to our customers and which we pay to our lenders,
such as access to capital based on our business performance, the volume of loans we make to our customers, competition
with other lenders and regulatory requirements. These interest rates may also be affected by variations to the types of
products we sell to our customers and investors over time and a shift among our channels of customer acquisition. Interest
rate changes may adversely affect our business forecasts and expectations and are highly sensitive to many macroeconomic
factors beyond our control, such as inflation, recession, the state of the credit markets, changes in market interest rates, global
economic disruptions, unemployment and the fiscal and monetary policies of the federal government and its agencies. Any
material reduction in our interest rate spread could have a material adverse effect on our business, results of operations and
financial condition.
Our business may be adversely affected by disruptions in the credit markets, including reduced access to credit.
We depend on the Credit Facilities and other forms of debt in order to finance most of the loans we make to our customers.
However, we cannot guarantee that these financing sources will continue to be available beyond the current maturity date of
each arrangement, on reasonable terms or at all. As the volume of loans that we make to customers on our platform increases,
we may require the expansion of our borrowing capacity on our existing debt facility and other debt arrangements or the
addition of new sources of capital. The availability of these financing sources depends on many factors, some of which are
outside of our control. We may also experience the occurrence of events of default or breaches of financial or performance
covenants under our debt agreements, which could reduce or terminate our access to institutional funding. If we are unable to
meet the financial covenants and other conditions under the Credit Facilities or other credit facilities it could reduce or
terminate our access to those facilities. In the event of a sudden or unexpected shortage of funds in the banking system, we
cannot be sure that we will be able to maintain necessary levels of funding without incurring high funding costs, a reduction
in the term of funding instruments or the liquidation of certain assets. If we were to be unable to arrange new or alternative
methods of financing on favorable terms, we may have to curtail our origination of loans, which could have a material
adverse effect on our business, financial condition, operating results and cash flow.
Management’s Discussion and Analysis
45 | P a g e
An increase in customer default rates may reduce our overall profitability and could also affect our ability to attract
institutional funding. Further, historical default rates may not be indicative of future results.
Customer default rates may be significantly affected by economic downturns or general economic conditions beyond our
control and beyond the control of individual customers. In particular, loss rates on customer loans may increase due to factors
such as prevailing interest rates, the rate of unemployment, the level of consumer and business confidence, commercial real
estate values, the value of the Canadian dollar, energy prices, changes in consumer and business spending, the number of
personal bankruptcies, disruptions in the credit markets and other factors. Furthermore, as a full credit spectrum lender, we
operate in broad range of the credit market, and our customers’ default rates may be higher than expected. In addition, as of
December 31, 2015, approximately 22% of our customers had fewer than five years of credit history. While our credit score
is designed to establish that, notwithstanding such limited financial history, customers would be a reasonable credit risk, our
loans may nevertheless be expected to have a higher default rate than loans made to customers with more established
financial histories. In addition, if delinquency or uncollectable rates on our consumer loans exceed certain levels defined in
our Credit Facility Agreements, it could constitute a default under the Credit Facilities or other credit facilities, reducing or
terminating such facilities.
We have negative operating cash flow and continued negative operating cash flow may restrict our ability to pursue our
business objectives
The Company had negative operating cash flow for the year ended December 31, 2015. The Company may require additional
financing to fund its operations to the point where it is generating positive operating cash flows. Continued negative
operating cash flow may restrict the Company’s ability to pursue its business objectives.
We may require additional capital to pursue our business objectives and respond to business opportunities, challenges or
unforeseen circumstances. If capital is not available to us, our business, operating results and financial condition may
be harmed.
Since our founding, we have raised substantial equity and debt financing to support the growth of our business. Because we
intend to continue to make investments to support the growth of our business, we may require additional capital to pursue our
business objectives and respond to business opportunities, challenges or unforeseen circumstances, including increasing our
marketing expenditures to improve our brand awareness, developing new products or services or further improving existing
products and services, enhancing our operating infrastructure and acquiring complementary businesses and technologies.
Accordingly, we may need to engage in equity or debt financings to secure additional funds. However, additional funds may
not be available when we need them, on terms that are acceptable to us, or at all. In addition, our agreements with our lenders
contain restrictive covenants relating to our capital raising activities and other financial and operational matters, and any debt
financing that we secure in the future could involve further restrictive covenants which may make it more difficult for us to
obtain additional capital and to pursue business opportunities. Volatility in the credit markets may also have an adverse effect
on our ability to obtain debt financing.
If we raise additional funds through further issuances of equity or convertible debt securities, our existing shareholders could
suffer significant dilution, and any new equity securities we issue could have rights, preferences and privileges superior to
those of holders of our common stock. If we are unable to obtain adequate financing or financing on terms satisfactory to us,
when we require it, our ability to continue to pursue our business objectives and to respond to business opportunities,
challenges or unforeseen circumstances could be significantly limited, and our business, operating results, financial condition
and prospects could be adversely affected.
Our debt financing sources are highly concentrated, and we may not be able to access additional sources of funding at all
or on reasonable terms.
We have obtained debt financing from a limited number of lenders. We currently depend on the Credit Facilities and other
forms of debt in order to finance most of the loans we make to our customers. Our reliance on the Credit Facilities for a
significant amount of our funding exposes us to funding concentration risks. If the lender decides to terminate the Credit
Facilities, our business, operating results, financial condition and prospects could be adversely affected.
Management’s Discussion and Analysis
46 | P a g e
In addition, our debt facilities must be renewed on a periodic basis. If we were unable to renew these facilities on acceptable
terms when they became due there could be a material adverse effect on our financial condition, liquidity and results
of operations.
Our agreements with our lenders contain a number of early payment triggers and covenants. A breach of such triggers or
covenants or other terms of such agreements could result in an early amortization, default, and/or acceleration of the
related funding facilities which could materially impact our operations.
The Company manages its capital to maintain its ability to continue as a going concern and to provide adequate value to
shareholders. The capital structure of the Company consists of external debt and shareholders’ equity, which comprises
issued capital, contributed surplus and retained earnings. The Company manages its capital structure and makes adjustments
to it in light of economic conditions. The Company, upon approval from its Board of Directors, will balance its overall
capital structure through new share issuances, share repurchases, the payment of dividends, increasing or decreasing debt or
by undertaking other activities as deemed appropriate under the specific circumstances. The Company’s strategy, objectives,
measures, definitions and targets have not changed significantly from the prior period.
Primary funding sources available to support the maintenance and growth of our business include, among others, the Credit
Facilities. These facilities contain restrictions on the Company’s ability to, among other things, pay dividends, sell or transfer
assets, incur additional debt, repay other debt, make certain investments or acquisitions, repurchase or redeem shares and
engage in alternate business activities. The facilities also contain a number of covenants that require the Company to
maintain certain specified financial ratios. For a description of these covenants, requirements and events as set out in the
Credit Facilities.
During the occurrence of an event of default under the Credit Facilities, for example, principal collections from our consumer
loans would be applied to repay principal under the Credit Facilities rather than being available on a revolving basis to fund
newly originated loans. During the occurrence of an event of default under any of our debt including debt owing under the
Credit Facilities, debt owing to the holders of debentures issued by the Company or debt owing to future facilities we may
enter into the applicable lender could accelerate the repayment of our debt and the lender’s commitments to extend further
credit would terminate. If we were unable to repay the amounts due and payable under our debt when due, the applicable
lender could seek remedies, including against the collateral pledged as security for such debt. A default under one credit
facility could also lead to default under other facilities due to cross-acceleration or cross-default provisions.
An event of default or other event requiring early repayment of our Credit Facilities would negatively impact our liquidity,
including our ability to originate new loans, and require us to rely on alternative funding sources, which might increase our
funding costs or which might not be available when needed. If we were unable to arrange new or alternative methods of
financing on favorable terms, we might have to curtail the origination of loans, which could have a material adverse effect on
our business, financial condition, operating results and cash flow, which in turn could have a material adverse effect on our
ability to meet our obligations under our facilities.
Security breaches of customers’ confidential information that we store may harm our reputation and expose us to liability.
We store our customers’ personal and credit information and other sensitive data. Any accidental or willful security breaches
or other unauthorized access could cause the theft and criminal use of this data. Security breaches or unauthorized access to
confidential information could also expose us to liability related to the loss of the information, time-consuming and expensive
litigation and negative publicity. If security measures are breached because of third-party action, employee error, malfeasance
or otherwise, or if design flaws in our software are exposed and exploited, and, as a result, a third party obtains unauthorized
access to any of our customers’ data, our relationships with our customers will be severely damaged, and we could incur
significant liability.
Because techniques used to obtain unauthorized access or to sabotage systems change frequently and generally are not
recognized until they are launched against a target, we and our third-party hosting facilities may be unable to anticipate these
techniques or to implement adequate preventative measures. In addition, certain provinces have enacted laws requiring
companies to notify individuals of data security breaches involving their personal data. These mandatory disclosures
Management’s Discussion and Analysis
47 | P a g e
regarding a security breach are costly to implement and often lead to widespread negative publicity, which may cause our
customers to lose confidence in the effectiveness of our data security measures. Any security breach, whether actual or
perceived, would harm our reputation and we could lose customers.
Our ability to collect payment on loans and maintain accurate accounts may be adversely affected by computer viruses,
physical or electronic break-ins, technical errors and similar disruptions.
The automated nature of our platform may make it an attractive target for hacking and potentially vulnerable to computer
viruses, physical or electronic break-ins and similar disruptions. Despite efforts to ensure the integrity of our platform, it is
possible that we may not be able to anticipate or to implement effective preventive measures against all security breaches of
these types, in which case there would be an increased risk of fraud or identity theft, and we may experience losses on, or
delays in the collection of amounts owed on, a fraudulently induced loan. In addition, the software that we have developed to
use in our daily operations is highly complex and may contain undetected technical errors that could cause our computer
systems to fail. Because each loan that we make involves our proprietary automated lending process, any failure of our
computer systems involving our automated loan approval process and any technical or other errors contained in the software
pertaining to our automated lending process could compromise our ability to accurately evaluate potential customers, which
would negatively impact our results of operations. Furthermore, any failure of our computer systems could cause an
interruption in operations and result in disruptions in, or reductions in the amount of, collections from the loans we make to
our customers.
Additionally, if a hacker were able to access our secure files, he or she might be able to gain access to the personal
information of our customers. While we have taken steps to prevent such activity from affecting our platform, if we are
unable to prevent such activity, we may be subject to significant liability, negative publicity and a material loss of customers,
all of which may negatively affect our business.
Demand for our loans may decline if we do not continue to innovate or respond to evolving technological changes.
We operate in a nascent industry characterized by rapidly evolving technology and frequent product introductions. We rely
on our proprietary technology to make our platform available to customers, determine the creditworthiness of loan applicants
and service the loans we make to customers. In addition, we may increasingly rely on technological innovation as we
introduce new products, expand our current products into new markets and continue to streamline the lending process. The
process of developing new technologies and products is complex, and if we are unable to successfully innovate and continue
to deliver a superior customer experience, customers’ demand for our loans may decrease and our growth and operations may
be harmed.
If new loan products and platform enhancements do not achieve sufficient market acceptance, our financial results and
competitive position will be harmed.
We incur expenses and expend resources upfront to develop, acquire and market new loan products and platform
enhancements to incorporate additional features, improve functionality or otherwise make our platform more desirable to our
customers. New loan products or platform enhancements must achieve high levels of market acceptance in order for us to
recoup our investment in developing and bringing them to market.
Any new loan products and changes to our platform could fail to attain sufficient market acceptance for many reasons,
including, without limitation, the following:
• our failure to predict market demand accurately and supply loan products that meet this demand in a
timely fashion;
• borrowers using our platform may not like, find useful or agree with any changes;
• defects, errors or failures in our platform;
Management’s Discussion and Analysis
48 | P a g e
• negative publicity about our loan products or our platform’s performance or effectiveness;
• delays in releasing to the market new loan products or platform enhancements; and
• the introduction or anticipated introduction of competing products by our competitors.
If our new loan products or platform enhancements do not achieve adequate acceptance in the market, our competitive
position, revenue and operating results could be harmed. The adverse effect on our financial results may be particularly acute
because of the significant development, marketing, sales and other expenses we will have incurred in connection with the
new loan products or enhancements.
It may be difficult and costly to protect our intellectual property rights, and we may not be able to ensure their protection.
Our ability to lend to our customers depends, in part, upon our intellectual property. We primarily rely on copyright, trade
secret and trade-mark laws, trade secret protection and confidentiality or license agreements with our employees, customers
and others to protect our intellectual property rights. However, the steps we take to protect our intellectual property rights
may be inadequate. We currently do not have any issued patents.
In order to protect our intellectual property rights, we may be required to spend significant resources to monitor and protect
these rights. Litigation brought to protect and enforce our intellectual property rights could be costly, time-consuming and
distracting to management and could result in the impairment or loss of portions of our intellectual property. Furthermore,
our efforts to enforce our intellectual property rights may be met with defences, counterclaims and countersuits attacking the
validity and enforceability of our intellectual property rights. Our failure to secure, protect and enforce our intellectual
property rights could seriously harm our brand and adversely affect our business.
We may face claims by third parties for alleged infringement of their intellectual property rights, which could harm
our business.
Our competitors, as well as a number of other entities and individuals, may claim that we infringe their intellectual property
rights. Claims of infringement are becoming increasingly common as the software industry develops and third parties may
assert infringement claims against us in the future. Although we have developed most of our platform, we do include
third-party software in our platform. In these cases, this software is licensed from the entity holding the intellectual property
rights. Although we believe that we have secured proper licenses for all third-party software that is integrated into our
platform, third parties may assert infringement claims against us in the future. Any such assertion may result in litigation or
may require us to obtain a license for the intellectual property rights of third parties. Such licenses may not be available, or
they may not be available on reasonable terms. In addition, such litigation could be disruptive to our ability to generate
revenue or enter into new market opportunities and may result in significantly increased costs as a result of our defence
against those claims or our attempt to license the intellectual property rights or rework our platform to ensure they comply
with judicial decisions. Even if we were to prevail, any litigation regarding our intellectual property could be costly and
time-consuming and divert the attention of our management and key personnel from our business operations. Any of the
foregoing could have a significant adverse effect on our business and operating results as well as our ability to generate
future revenue.
Some aspects of our platform include open source software, and any failure to comply with the terms of one or more of
these open source licenses could negatively affect our business.
We incorporate open source software into our proprietary platform and into other processes supporting our business. Such
open source software may include software covered by licenses like the GNU General Public License and the Apache
License. The terms of various open source licenses have not been interpreted by courts, and there is a risk that such licenses
could be construed in a manner that limits our use of the software, inhibits certain aspects of the platform and negatively
affects our business operations.
Management’s Discussion and Analysis
49 | P a g e
Some open source licenses contain requirements that we make available source code for modifications or derivative works
we create based upon the type of open source software we use. If portions of our proprietary platform are determined to be
subject to an open source license, or if the license terms for the open source software that we incorporate change, we could be
required to publicly release the affected portions of our source code, re-engineer all or a portion of our platform or change our
business activities. In addition to risks related to license requirements, the use of open source software can lead to greater
risks than the use of third-party commercial software, as open source licensors generally do not provide warranties or
controls on the origin of the software. Many of the risks associated with the use of open source software cannot be
eliminated, and could adversely affect our business.
If our software contains serious errors or defects, we may lose revenue and market acceptance.
Software developed for our proprietary platform often contains errors, defects, security vulnerabilities or software bugs that
are difficult to detect and correct, particularly when first introduced. Despite internal testing, our platform may contain
serious errors or defects, security vulnerabilities or software bugs that we may be unable to successfully correct in a timely
manner or at all, which could result in lost revenue, significant expenditures of capital and damage to our reputation and
brand, any of which could have an adverse effect on our business, financial condition and results of operations. Since the
software we use is a critical component to our proprietary platform, errors, defects, security vulnerabilities, service
interruptions or software bugs in our platform could result in inappropriate loan decisioning and corresponding credit scores
and/or interest rates.
A denial of service attack or security breach could delay or interrupt service to our customers, harm our reputation or
subject us to significant liability.
Our platform may be subject to distributed denial of service, or DDoS, attacks in the future, a technique used by hackers to
take an internet service offline by overloading its servers. We cannot guarantee that applicable recovery systems, security
protocols, network protection mechanisms and other procedures are or will be adequate to prevent network and service
interruption, system failure or data loss. Moreover, our platform and our third-party apps could be breached if vulnerabilities
in our platform are exploited by unauthorized third parties. Since techniques used to obtain unauthorized access change
frequently and the size of DDoS attacks is increasing, we may be unable to implement adequate preventative measures or
stop the attacks while they are occurring. A DDoS attack or security breach could delay or interrupt service to our customers.
In addition, any actual or perceived DDoS attack or security breach could damage our reputation and brand, expose us to a
risk of litigation and possible liability and require us to expend significant capital and other resources to alleviate problems
caused by the DDoS attack or security breach. Some jurisdictions have enacted laws requiring companies to notify
individuals of data security breaches involving certain types of personal data and our agreements with certain merchants
require us to notify them in the event of a security incident. Such mandatory disclosures could lead to negative publicity and
may cause our merchants to lose confidence in the effectiveness of our data security measures. Moreover, if a high profile
security breach occurs with respect to one of our competitors, customers may lose trust in the security of our platform and
business model generally, which could adversely impact our ability to conduct business.
We rely on our proprietary credit scoring model in the forecasting of loss rates. If we are unable to effectively forecast loss
rates, it may negatively impact our operating results.
In making a decision whether to extend credit to prospective customers, we rely heavily on our credit score generated by our
proprietary credit scoring model and decisioning system, an empirically derived suite of statistical models built using
third-party data, data from our customers and our credit experience gained through monitoring the performance of our
customers over time. If our proprietary credit scoring model and decisioning system fails to adequately predict the
creditworthiness of our customers, or if our proprietary cash flow analytics system fails to assess prospective customers’
financial ability to repay their loans, or if any portion of the information pertaining to the prospective customer is false,
inaccurate or incomplete, and our systems did not detect such falsities, inaccuracies or incompleteness, or any or all of the
other components of the credit decision process described herein fails, we may experience higher than forecasted losses.
Furthermore, if we are unable to access the third-party data used in our credit scores, our access to such data is limited or
such information is outdated or incorrect, our ability to accurately evaluate potential customers will be compromised, and we
may be unable to effectively predict probable credit losses inherent in our loan portfolio, which would negatively impact our
results of operations.
Management’s Discussion and Analysis
50 | P a g e
We rely on data from third parties for the successful operation of our platform.
Our ability to review and select qualified borrowers depends on credit, identification, employment and other relevant
information that we receive from third parties, including credit bureaus. If this information becomes unavailable or becomes
more expensive to access, it could increase our costs as we seek alternative sources of information. If this third-party data is
incorrect, our ability to identify qualified borrowers or approve and price loans may suffer and our business may be harmed.
Our risk management efforts may not be effective.
We could incur substantial losses and our business operations could be disrupted if we are unable to effectively identify,
manage, monitor and mitigate financial risks, such as credit risk, interest rate risk, liquidity risk, and other market- related
risk, as well as operational risks related to our business, assets and liabilities. To the extent our models used to assess the
creditworthiness of potential customers do not adequately identify potential risks, the credit scores we produce would not
adequately represent the risk profile of such customers and could result in higher risk than anticipated. Our risk management
policies, procedures, and techniques, including our use of our proprietary credit scoring technology, may not be sufficient to
identify all of the risks we are exposed to, mitigate the risks that we have identified or identify concentrations of risk or
additional risks to which we may become subject in the future.
Our levels of indebtedness can have negative implications for our Shareholders
We have, and anticipate having a significant amount of indebtedness. Our ability to make payments of principal and interest
on our funding debt will depend on our future operating performance and our ability to enter into additional debt and equity
financings, which to a certain extent, is subject to economic, financial, competitive and other factors beyond our control. If,
in the future, we are unable to generate sufficient cash flow to service our debt, we may be required to refinance all or a
portion of our existing debt or obtain additional financing. There can be no assurance that any such refinancing would be
possible or that any additional financing could be obtained on terms acceptable to us. The inability to obtain additional
financing could have a material adverse effect on our operating performance and any additional equity financing would result
in the dilution of Shareholders.
Our substantial indebtedness could have significant consequences to Shareholders, such as the inability to satisfy our
obligations under the Credit Facilities and increased vulnerability to adverse general economic and industry conditions. We
may find it more difficult to fund future working capital, capital expenditures, general corporate purposes or other purposes
and we would have to allocate a substantial portion of our cash resources to the payment on our indebtedness, which would
reduce the funds available for operations and for distribution to Shareholders.
Our allowance for loan losses is determined based upon both objective and subjective factors and may not be adequate to
absorb loan losses.
We face the risk that our customers will fail to repay their loans in full. We reserve for such losses by establishing an
allowance for loan losses, the increase of which results in a charge to our earnings as a provision for loan losses. We have
established an evaluation process designed to determine the adequacy of our allowance for loan losses. While this evaluation
process uses historical and other objective information, the classification of loans and the forecasts and establishment of loan
losses are also dependent on our subjective assessment based upon our experience and judgment. Actual losses are difficult to
forecast, especially if such losses stem from factors beyond our historical experience, and unlike traditional banks, we are not
subject to periodic review by bank regulatory agencies of our allowance for loan losses. As a result, there can be no assurance
that our allowance for loan losses will be comparable to that of traditional banks subject to regulatory oversight or sufficient
to absorb losses or prevent a material adverse effect on our business, financial condition and results of operations.
Exchange rate fluctuations may adversely affect our results.
While we generate our revenues in Canadian dollars, a portion of our debentures are denominated in US dollars. As a result,
our reported results of operations are vulnerable to currency exchange fluctuations between the Canadian dollar and the US
Management’s Discussion and Analysis
51 | P a g e
dollar. Exchange rate fluctuations are beyond our control, and there can be no assurance that such fluctuations will not have a
material adverse effect on our business, operating results, financial condition or profitability.
Our success and future growth depend in part on our successful marketing efforts and increased brand awareness.
Failure to effectively use our brand to convert sales may negatively affect our growth and our financial performance.
We believe that an important component of our growth will be continued market penetration through our direct marketing
channel. To achieve this growth, we anticipate relying heavily on marketing and advertising to increase the visibility of the
Mogo brand with potential customers. The goal of this marketing and advertising is to increase the strength, recognition and
trust in the Mogo brand, drive more unique visitors to submit loan applications on our website, and ultimately increase the
number of loans made to our customers. We incurred expenses of $10.8 million and $4.6 million on sales and marketing in
the years ended December 31, 2015 and 2014, respectively.
Our business model relies on our ability to scale rapidly and to decrease incremental customer acquisition costs as we grow.
If we are unable to recover our marketing costs through increases in website traffic and in the number of loans made by
visitors to our platform, or if we discontinue our broad marketing campaigns, it could have a material adverse effect on our
growth, results of operations and financial condition.
Customer complaints or negative publicity could result in a decline in our customer growth and our business could suffer.
Our reputation is very important to attracting new customers to our platform as well as securing repeat lending to existing
customers. While we believe that we have a good reputation and that we provide our customers with a superior experience,
there can be no assurance that we will continue to maintain a good relationship with our customers or avoid negative
publicity. Any damage to our reputation, whether arising from our conduct of business, negative publicity, regulatory,
supervisory or enforcement actions, matters affecting our financial reporting or compliance with British Columbia Securities
Commission and TSX listing requirements, security breaches or otherwise could have a material adverse effect on
our business.
Any misconduct and/or errors by our employees and third-party service providers could harm our business
and reputation.
We are exposed to many types of operational risk, including the risk of misconduct and errors by our employees and
third-party service providers. Our business depends on our employees and third-party service providers to process a large
number of increasingly complex transactions, including transactions that involve significant dollar amounts and loan
transactions that involve the use and disclosure of personal and business information. We could be materially adversely
affected if transactions are redirected, misappropriated or otherwise improperly executed, if personal and business
information is disclosed to unintended recipients or if an operational breakdown or failure in the processing of other
transactions occurs, whether as a result of human error, a purposeful sabotage or by means of a fraudulent manipulation of
our operations or systems. In addition, the manner in which we store and use certain personal information and interact with
customers is governed by various federal and provincial laws. If any of our employees or third-party service providers take,
convert or misuse funds, documents or data or fail to follow our protocol when interacting with customers, we could be liable
for damages and subject to regulatory actions and penalties. As a result, we could also be perceived to have facilitated or
participated in illegal misappropriation of funds, documents or data, or failed to have followed protocol, and therefore be
subject to civil or criminal liability. It is not always possible to identify and deter misconduct or errors by employees or third-
party service providers, and the precautions we take to detect and prevent such activities may not be effective in controlling
unknown or unmanaged risks or losses. Any of these occurrences could result in our diminished ability to operate our
business, potential liability to our customers, inability to attract future customers, reputational damage, regulatory
intervention and financial harm, which could negatively impact our business, financial condition and results of operations.
Our business depends on our ability to collect payments on and service the loans we make to our customers.
We rely on a bank for the ACH transaction process used to disburse the proceeds of newly originated loans to our customers.
As we are not a bank, we do not have the ability to directly access the ACH payment network, and must therefore rely on a
Management’s Discussion and Analysis
52 | P a g e
service provider to process our loan payment transactions. If we cannot continue to obtain such services from our current
institution, service provider or elsewhere, or if we cannot transition to another processor quickly, our ability to process
payments will suffer. If we fail to adequately collect amounts owing in respect of the loans, as a result of the loss of direct
debiting or otherwise, then payments to us may be delayed or reduced and our revenue and operating results will be harmed.
We rely on data centers to deliver our services. Any disruption of service at these data centers could interrupt or delay our
ability to deliver our service to our customers.
We currently serve our customers from third-party cloud-based and traditional data center facilities. The continuous
availability of our service depends on the operations of these facilities, on a variety of network service providers, on
third-party vendors and on data center and cloud operations staff. In addition, we depend on the ability of our third-party
facility provider to protect the facilities against damage or interruption from natural disasters, power or telecommunications
failures, criminal acts and similar events. If there are any lapses of service or damage to the facilities, we could experience
lengthy interruptions in our service as well as delays and additional expenses in arranging new facilities and services. Even
with current and planned disaster recovery arrangements, our business could be harmed.
We designed our system infrastructure and procure and own or lease the computer hardware used for our services. Design
and mechanical errors, failure to follow operations protocols and procedures could cause our systems to fail, resulting in
interruptions in our platform. Any such interruptions or delays, whether as a result of third-party error, our own error, natural
disasters or security breaches, whether accidental or willful, could harm our relationships with customers and cause our
revenue to decrease and/or our expenses to increase. Also, in the event of damage or interruption, our insurance policies may
not adequately compensate us for any losses that we may incur. These factors in turn could further reduce our revenue and
subject us to liability, which could materially adversely affect our business.
We face increasing competition and, if we do not compete effectively, our operating results could be harmed.
We compete with other companies that lend to individuals. These traditional financial institutions include banks, credit
unions, credit card issuers and other consumer finance companies. In addition, other technology companies that primarily
lend to individual consumers may begin to focus, or may in the future focus, their efforts on lending to millennials.
In some cases, some competitors may offer a broader range of financial products to our clients, and some competitors may
offer a specialized set of specific products or services. Many of these competitors have significantly more resources and
greater brand recognition than we do and may be able to attract customers more effectively than we do.
When new competitors seek to enter one of our markets, or when existing market participants seek to increase their market
share, they sometimes undercut the pricing and/or credit terms prevalent in that market, which could adversely affect our
market share or ability to exploit new market opportunities. Our pricing and credit terms could deteriorate if we act to meet
these competitive challenges. All of the foregoing could adversely affect our business, results of operations, financial
condition and future growth.
If the information provided by customers to us is incorrect or fraudulent, we may misjudge a customer’s qualification to
receive a loan and our operating results may be harmed.
Our lending decisions are based partly on information provided to us by loan applicants. To the extent that these applicants
provide information to us in a manner that we are unable to verify, our credit model may not accurately reflect the associated
risk. In addition, data provided by third-party sources is a significant component of our credit model, and this data may
contain inaccuracies. Inaccurate analysis of credit data that could result from false loan application information could harm
our reputation, business and operating results.
In addition, we use identity and fraud check analyzing data provided by external databases to authenticate each customer’s
identity. There is a risk, however, that these checks could fail, and fraud may occur. We may not be able to recoup funds
underlying loans made in connection with inaccurate statements, omissions of fact or fraud, in which case our revenue,
operating results and profitability will be harmed. Fraudulent activity or significant increases in fraudulent activity could also
Management’s Discussion and Analysis
53 | P a g e
lead to regulatory intervention, negatively impact our operating results, brand and reputation and require us to take steps to
reduce fraud risk, which could increase our costs.
We rely on our management team and need additional key personnel to grow our business, and the loss of key employees
or inability to hire key personnel could harm our business.
We believe our success has depended, and continues to depend, on the efforts and talents of our executives and employees,
including David Feller, our Chief Executive Officer, and Gregory Feller, our President and Chief Financial Officer. Our
future success depends on our continuing ability to attract, develop, motivate and retain highly qualified and skilled
employees. Qualified individuals are in high demand and we may incur significant costs to attract and retain them. In
addition, the loss of any of our senior management or key employees could materially adversely affect our ability to execute
our business plan and strategy, and we may not be able to find adequate replacements on a timely basis, or at all. We do not
maintain key person life insurance policies on any of our employees.
Competition for our employees is intense, and we may not be able to attract and retain the highly skilled employees whom
we need to support our business.
Competition for highly skilled engineering and data analytics personnel is extremely intense, and we continue to face
difficulty identifying and hiring qualified personnel in many areas of our business. We may not be able to hire and retain such
personnel at compensation levels consistent with our existing compensation and salary structure. Many of the companies with
which we compete for experienced employees have greater resources than we have and may be able to offer more attractive
terms of employment. In particular, candidates making employment decisions, specifically in high-technology industries,
often consider the value of any equity they may receive in connection with their employment. Any significant volatility in the
price of our stock may adversely affect our ability to attract or retain highly skilled technical, financial and marketing
personnel.
In addition, we invest significant time and expense in training our employees, which increases their value to competitors who
may seek to recruit them. If we fail to retain our employees, we could incur significant expenses in hiring and training their
replacements and the quality of our services and our ability to serve our customers could diminish, resulting in a material
adverse effect on our business.
If we cannot maintain our corporate culture, we could lose valuable qualities from our workforce.
We believe that our corporate culture is a critical component of our success, which we believe fosters innovation, encourages
teamwork and cultivates creativity. As we develop the infrastructure of a public company and continue to grow, we may find
it difficult to maintain these valuable aspects of our corporate culture. Failure to preserve our corporate culture could
negatively impact our future success, including our ability to attract and retain employees, encourage innovation and
teamwork and effectively focus on and pursue our corporate objectives.
We may not be able to utilize a significant portion of our net operating loss carryforwards, which could harm our results
of operations.
We had net operating loss carryforwards of approximately $50.7 million as of December 31, 2015. These net operating loss
carryforwards will begin to expire at various dates beginning in 2024. As of December 31, 2015, we recorded a full valuation
allowance against our net deferred tax asset.
The Income Tax Act (Canada) imposes substantial restrictions on the utilization of net operating losses and other
tax attributes.
Litigation may adversely affect our business and financial condition.
Our business is subject to the risk of litigation by employees, customers, consumers, suppliers, competitors, shareholders,
government agencies, or others through private actions, class actions, administrative proceedings, regulatory actions or other
Management’s Discussion and Analysis
54 | P a g e
litigation. The outcome of litigation, particularly class action lawsuits, regulatory actions and intellectual property claims, is
difficult to assess or quantify. Plaintiffs in these types of law suits may seek recovery of very large or indeterminate amounts,
and the magnitude of the potential loss relating to these lawsuits may remain unknown for substantial periods of time. In
addition, certain of these lawsuits, if decided adversely to us or settled by us, may result in liability material to our financial
statements as a whole or may negatively affect our operating results if changes to our business operations are required. The
cost to defend future litigation may be significant. There also may be adverse publicity associated with litigation that could
negatively affect customer perception of our business, regardless of whether the allegations are valid or whether we are
ultimately found liable. As a result, litigation may adversely affect our business and financial condition.
Our business is subject to the risks of earthquakes, fire, power outages, flood, and other catastrophic events, and to
interruption by man-made problems such as terrorism.
Events beyond our control may damage our ability to accept our customers’ applications, provide loans, receive payments,
maintain our platform or perform our servicing obligations. In addition, these catastrophic events may negatively affect
customers’ demand for our loans. Such events include, but are not limited to, fires, earthquakes, terrorist attacks, natural
disasters, computer viruses and telecommunications failures. Despite any precautions we may take, system interruptions and
delays could occur if there is a natural disaster, if a third- party provider closes a facility we use without adequate notice for
financial or other reasons, or if there are other unanticipated problems at our leased facilities. As we rely heavily on our
servers, computer and communications systems and the Internet to conduct our business and provide high-quality customer
service, such disruptions could harm our ability to run our business and cause lengthy delays which could harm our business,
results of operations and financial condition. We currently are not able to switch instantly to our backup center in the event of
failure of the main server site. This means that an outage at one facility could result in our system being unavailable for a
significant period of time. Our business interruption insurance may not be sufficient to compensate us for losses that may
result from interruptions in our service as a result of system failures. A system outage or data loss could harm our business,
financial condition and results of operations.