Embed Size (px)
Citation preview
Management’s Discussion and Analysis of Financial Results
For the three and six months ended June 30, 2010

Advisories
The following Management’s Discussion and Analysis of Financial Results (MD&A), dated August 4, 2010, should be read in
conjunction with the cautionary statement regarding forward-looking statements below, as well as the unaudited interim
consolidated financial statements and notes thereto as at and for the three and six months ended June 30, 2010 and 2009, and the
consolidated financial statements, notes thereto and MD&A included in the annual report as at and for the years ended December
31, 2009 and 2008. For a detailed description of risks and uncertainties, financial instruments and risk management and critical
accounting estimates, please refer to these respective sections within the 2009 MD&A dated February 16, 2010. The consolidated
financial statements have been prepared in accordance with Canadian generally accepted accounting principles (GAAP). All amounts
in the following MD&A are in Canadian dollars unless otherwise stated. Certain prior-period balances in the consolidated financial
statements have been reclassified to conform to current period’s presentation and policies. References to “WestJet,” “the
Company,” “we,” “us” or “our” mean WestJet Airlines Ltd., its subsidiaries, partnership and special-purpose entities, unless the
context otherwise requires. Additional information relating to WestJet filed with Canadian securities commissions, including periodic
quarterly and annual reports and Annual Information Forms (AIF), is available on SEDAR at www.sedar.com and our website at
www.westjet.com. An additional advisory with respect to the use of non-GAAP measures is set out on page 34 of this MD&A under
the heading “Non-GAAP Measures.”
Cautionary statement regarding forward-looking statements
This MD&A offers our assessment of WestJet’s future plans and operations and contains forward-looking statements as defined
under applicable Canadian securities legislation, including our expectation that WestJet Vacations has the capacity and capabilities
in place to continue to expand, referred to under the heading “Results of Operations – Revenue” on page 10; our expectation that
our commission structure and the added functionalities of WestJet Vacations’ reservation system will allow us to grow the WestJet
Vacations business, referred to under the heading “Results of Operations – Revenue” on page 10; our future destination launches of
seasonal, non-stop service to new destinations, referred to under the heading “Results of Operations – Revenue” on page 10; our
hedging expectations and the intent to hedge anticipated jet fuel purchases, referred to under the heading “Results of Operations –
Aircraft Fuel” on page 13; our sensitivity to changes in crude oil and fuel pricing, referred to under the heading “Results of
Operations – Aircraft Fuel” on page 13; our expectation that our incremental maintenance expense will grow for the remainder of
the year, referred to under the heading “Results of Operations – Maintenance” on page 17; our sensitivity to the change in the
value of the Canadian dollar versus the US dollar, referred to under the heading “Results of Operations – Foreign Exchange” on
page 20; our expected effective tax rate for 2010, referred to under the heading “Results of Operations – Income Taxes” on page
21; our future aircraft deliveries, referred to under the headings “Capital Resources” on page 24 and “Outlook” on page 33; our
assessment that the outcome of legal proceedings in the normal course of business will not have a material effect upon our financial
position, results of operations or cash flows, referred to under the heading “Liquidity and Capital Resources – Contingencies” on
page 25; our assessment of the impact of the transition to international financial reporting standards (IFRS), referred to under the
heading “Accounting – Recent Accounting Pronouncements and Changes” on page 27; our belief that we remain cautiously
optimistic about the second half of 2010, referred to under the heading “Outlook” on page 33; our expectation to see continued
pressure on yield, referred to under the heading “Outlook” on page 33; our anticipation that third quarter RASM will be positive on a
year-over-year basis, referred to under the heading “Outlook” on page 33; our expectation that we will end the year with 91
aircraft, referred to under the heading “Outlook” on page 33; our belief that the Canadian economy needs to rebound further before
it can support more new domestic capacity growth, referred to under the heading “Outlook” on page 33; our plan to deploy most of
the new capacity outside of Canada in the third quarter in order to better match demand with supply, referred to under the heading
“Outlook” on page 33; our expected third quarter and full year capacity increases for 2010, referred to under the heading “Outlook”
on page 33; our expected fuel costs per litre excluding hedging, referred to under the heading “Outlook” on page 33; our
expectation of the impact that settlements of fuel hedging contracts will have on our fuel costs per litre, referred to under the
heading “Outlook” on page 33; our expectation that third quarter CASM excluding fuel and employee profit share will increase,
referred to under the heading “Outlook” on page 33; our expectation of total capital expenditures for 2010, with the majority of the
WestJet Second Quarter 2010│2

spending related to aircraft deposits and rotables, referred to under the heading “Outlook” on page 33; our belief that our enviable
balance sheet and healthy underlying fundamentals will help us control costs and remain profitable during the lingering uncertainty
present in the airline industry, referred to under the heading “Outlook” on page 33; and our expectation about the future success
and profitability of our airline, referred to under the heading “Outlook” on page 33. These forward-looking statements typically
contain the words “anticipate,” “believe,” “estimate,” “intend,” “expect,” “may,” “will,” “should,” “potential,” “plan” or other similar
terms.
Readers are cautioned that our expectations, estimates, projections and assumptions used in the preparation of such information,
although considered reasonable at the time of preparation, may prove to be imprecise and, as such, undue reliance should not be
placed on forward-looking statements. With respect to forward-looking statements contained within this MD&A, we have made the
following key assumptions:
• our expectation that WestJet Vacations has the capacity and capabilities in place to continue to expand, was based on our
current strategic plan;
• our expectation that our commission structure and the added functionalities of WestJet Vacations’ reservation system will
allow us to grow the WestJet Vacations business was based on our current strategic plan;
• our future destination launches of seasonal, non-stop service to new destinations was based on our current and
forecasted commercial schedule;
• our hedging expectations and intent to hedge anticipated jet fuel purchases was based on our current approved hedging
strategy;
• our sensitivity to changes in crude oil and fuel pricing was based on our fuel consumption for our existing schedule and
historical fuel burn, as well as a Canadian-US dollar exchange rate similar to the current market rate;
• our expectation that our incremental maintenance expense will grow for the remainder of the year was based on
regulatory maintenance requirements, forecasts and budgets;
• our sensitivity to the change in the value of the Canadian dollar versus the US dollar was based on forecasted US-dollar
spend for 2010, excluding a percentage of aircraft leasing expense hedged under foreign exchange forward contracts, as
well as the exchange rate for the Canadian dollar similar to the current market rate;
• our expected effective tax rate for 2010 was based on forecasted financial information, tax rates based on current
legislation and expectations about the timing of when temporary differences between accounting and tax bases will
occur;
• our expectation of future aircraft deliveries was based on an aircraft delivery schedule from Boeing;
• our assessment that the outcome of legal proceedings in the normal course of business will not have a material effect
upon our financial position, results of operations or cash flows was based on a review of current legal proceedings by
management and legal counsel;
• our assessment of the impact of transition to IFRS was based on standards adopted by the International Accounting
Standards Board (IASB) thus far and our initial assessment of Canadian GAAP and IFRS differences;
• our belief that we remain cautiously optimistic about the second half of 2010 was based on actual and forecasted
bookings;
• our expectation to see continued pressure on yield was based on actual and forecasted bookings;
• our anticipation that third quarter RASM will be positive on a year-over-year basis was based on actual and forecasted
bookings;
• our expectation that we will end the year with 91 aircraft was based on our aircraft delivery schedule from Boeing;
• our belief that the Canadian economy needs to rebound further before it can support more new domestic capacity growth
was based on recent Canadian GDP forecasts and market commentaries;
• our plan to deploy most of the new capacity outside of Canada in the third quarter in order to better match demand with
supply was based on current forecasts and budgets, financial analysis and strategic plan;
WestJet Second Quarter 2010│3

• our expected third quarter and full year capacity increases for 2010 were based on our actual and forecasted commercial
schedules, as well as additional aircraft to be delivered throughout 2010, as per our revised aircraft delivery schedule
from Boeing;
• our expected fuel costs per litre excluding hedging for the third quarter of 2010 and our expectation of the impact that
settlements of fuel hedging contracts will have on our fuel costs per litre were based on realized jet fuel prices for July
2010 and forward curve prices for August and September 2010, as well as the exchange rate for the Canadian dollar in
the third quarter similar to the current market rate;
• expectation that third quarter CASM excluding fuel and employee profit share will increase was based on current costs
and forecasts;
• our expectation of total capital expenditures for 2010, with the majority of the spending related to aircraft deposits and
rotables, was based on our current budget and forecasts;
• our belief that our enviable balance sheet and healthy underlying fundamentals will help us control costs and remain
profitable during the lingering uncertainty present in the airline industry was based on our preliminary financial analysis
and 2009 financial results; and
• our expectation about the future success and profitability of our airline was based on our past financial results and
experience, as well as our current budget and forecasts.
Our actual results, performance or achievements could differ materially from those expressed in, or implied by, these forward-
looking statements. We can give no assurance that any of the events anticipated will transpire or occur or, if any of them do, what
benefits or costs we will derive from them. By their nature, forward-looking statements are subject to numerous risks and
uncertainties including, but not limited to, the impact of general economic conditions, changing domestic and international industry
conditions, volatility of fuel prices, terrorism, pandemics, currency fluctuations, interest rates, competition from other industry
participants (including new entrants and generally as to capacity fluctuations and the pricing environment), labour matters,
government regulation, stock-market volatility, the ability to access sufficient capital from internal and external sources and
additional risk factors discussed in our AIF and other documents we file from time to time with securities regulatory authorities,
which are available through the Internet on SEDAR at www.sedar.com or our website at www.westjet.com or, upon request,
without charge from us. Additionally, risks and uncertainties are discussed in detail within the 2009 MD&A dated February 16, 2010.
The forward-looking information contained in this MD&A is expressly qualified by this cautionary statement. Our assumptions
relating to the forward-looking statements referred to above are updated quarterly and, except as required by law, we do not
undertake to update any other forward-looking statements.
WestJet Second Quarter 2010│4

Definition of key operating indicators
Our key operating indicators are airline industry metrics, which are useful in assessing the operating performance of an airline.
Flight leg: A segment of a flight involving a stopover, change of aircraft or change of airline from one landing site to another.
Segment guest: Any person who has been booked to occupy a seat on a flight leg and is not a member of the crew assigned to the
flight.
Average stage length: The average distance of a non-stop flight leg between take-off and landing as defined by International Air
Transport Association (IATA) guidelines.
Available seat miles (ASM): A measure of total guest capacity, calculated by multiplying the number of seats available for guest use
in an aircraft by stage length.
Revenue passenger miles (RPM): A measure of guest traffic, calculated by multiplying the number of segment guests by stage
length.
Load factor: A measure of total capacity utilization, calculated by dividing revenue passenger miles by total available seat miles.
Yield (revenue per revenue passenger mile): A measure of unit revenue, calculated as the gross revenue generated per revenue
passenger mile.
Revenue per available seat mile (RASM): Total revenues divided by available seat miles.
Cost per available seat mile (CASM): Operating expenses divided by available seat miles.
Cycle: One flight, counted by the aircraft leaving the ground and landing.
Utilization: Operating hours per day per operating aircraft.
WestJet Second Quarter 2010│5

OVERVIEW
The second quarter of 2010 was once again a profitable quarter for WestJet. We reported our 21st consecutive
quarter of positive net earnings and maintained our strong financial position, as evidenced by one of the healthiest
balance sheets in the North American airline industry. During the period, we increased our revenue by 15.2 per cent
as compared to the second quarter of 2009, and we continued to see improved RASM trends, up four per cent year
over year. The increases in revenue and RASM were primarily a result of strong traffic and load factor, on capacity
growth of nearly 11 per cent from the second quarter of 2009. This marks the first time in eight quarters we have
reported positive year-over-year RASM growth. In particular, we were encouraged by the improvement in yield and
RASM domestically, both positive for the quarter. Additionally, we were pleased with our CASM excluding fuel and
employee profit share performance, which was flat as compared to the second quarter of 2009. Our continued
profitability and delivery of a world-class guest experience were both a direct result of the dedication and effort of
over 7,800 WestJetters.
Quarterly highlights
• Recognized total revenues of $612.1 million for the three months ended June 30, 2010, an increase of 15.2
per cent over the same period of 2009.
• Recorded RASM of 12.80 cents in the second quarter of 2010, up 4.0 per cent from the comparable period
of 2009.
• Increased capacity by 10.9 per cent in the second quarter of 2010, as compared to the same period of
2009.
• Realized CASM of 11.96 cents for the three months ended June 30, 2010, from 11.46 cents in the second
quarter of 2009, an increase of 4.4 per cent.
• Realized CASM excluding fuel and employee profit share of 8.44 cents for the second quarter of 2010, down
0.1 per cent over the same quarter of 2009.
• Recorded an earnings before tax (EBT) margin of 5.4 per cent for the quarter ended June 30, 2010, up 2.8
points from the same quarter in 2009.
• Realized net earnings of $21.0 million in the second quarter of 2010, an increase of 129.7 per cent from the
same period of 2009.
• Realized diluted earnings per share of $0.14 for the three months ended June 30, 2010, an increase of
100.0 per cent compared to the second quarter of 2009.
• Excluding special items, net earnings for the second quarter of 2010 were $23.4 million, or 16 cents per
diluted share, compared to reported net earnings of $9.2 million, or seven cents per diluted share, in the
second quarter of 2009.
• Generated cash flows from operations of $84.8 million for the quarter ended June 30, 2010, an increase
from $25.8 million for the three months ended June 30, 2009.
• Ended the quarter with a cash and cash equivalents balance of $1,108.2 million.
WestJet Second Quarter 2010│6

Please refer to page 34 of this MD&A for a reconciliation of non-GAAP measures, including net earnings and diluted
earnings per share excluding special items and CASM excluding fuel and employee profit share, to the nearest
measure under Canadian GAAP.
Operational highlights2010 2009 Change 2010 2009 Change
ASMs 4,783,649,533 4,314,869,886 10.9% 9,483,168,878 8,671,675,025 9.4%RPMs 3,824,847,258 3,284,898,568 16.4% 7,664,794,818 6,786,827,711 12.9%Load factor 80.0% 76.1% 3.9 pts. 80.8% 78.3% 2.5 pts.Yield (cents) 16.00 16.17 (1.1%) 16.07 16.36 (1.8%)RASM (cents) 12.80 12.31 4.0% 12.99 12.81 1.4%CASM (cents) 11.96 11.46 4.4% 12.16 11.68 4.1%CASM excluding fuel and employee profit share (cents) 8.44 8.45 (0.1%) 8.67 8.48 2.2%Fuel consumption (litres) 232,129,892 207,532,865 11.9% 462,598,271 423,293,745 9.3%Fuel costs per litre (dollars) 0.71 0.62 14.5% 0.70 0.64 9.4%Segment guests 3,752,818 3,417,877 9.8% 7,441,308 6,869,562 8.3%Average stage length (miles) 962 908 5.9% 963 923 4.3%Utilization (hours) 11.5 11.5 - 11.6 11.9 (2.5%)Number of full-time equivalent employees at period end 6,388 6,140 4.0% 6,388 6,140 4.0%Fleet size at period end 89 79 12.7% 89 79 12.7%
Three months ended June 30 Six months ended June 30
We are pleased with our improvements in net earnings and diluted earnings per share as compared to the second
quarter of 2009. For the three months ended June 30, 2010, our RASM increase of 4.0 per cent was more than offset
by a 4.4 per cent increase in CASM, resulting in a slight decline in operating margin. This variance was almost
entirely due to higher year-over-year fuel costs, as the prior period was the lowest point for fuel in 2009. Excluding
fuel and employee profit share, our per unit costs remained relatively flat due to a prudent focus on cost control,
favourable foreign exchange and increase in average stage length, as compared to the second quarter of 2009 and
the first quarter of 2010.
As at June 30, 2010, our cash and cash equivalents balance was $1,108.2 million, an increase of almost $103 million
from December 31, 2009. For the second quarter of 2010, our key ratios remain among the best in the North
American airline industry and continue to improve. Our current ratio, defined as current assets over current liabilities,
remained healthy at 1.46 as compared to 1.48 as at December 31, 2009, and our adjusted debt-to-equity ratio
improved to 1.41 as compared to 1.43 at December 31, 2009. Similarly, our adjusted net debt to earnings before
interest, taxes, depreciation, aircraft rent and other items (EBITDAR) ratio improved by 5.9 per cent to 2.07 as
compared to 2.20 as at December 31, 2009. Please refer to page 34 of this MD&A for a reconciliation of the non-
GAAP measures listed above, including our adjusted debt-to-equity and adjusted net debt to EBITDAR ratios, to the
nearest measure under Canadian GAAP.
During the three months ended June 30, 2010, we increased our fleet size by one aircraft, ending the quarter with
89. With an average age of 4.8 years, we continue to operate one of the youngest fleets of any large North American
commercial airline.
WestJet Second Quarter 2010│7

Subsequent to the second quarter of 2010, we negotiated changes to our future owned aircraft delivery schedule.
These changes have allowed us to defer scheduled delivery of one 700-series owned aircraft from 2011 to 2017, and
two 700-series aircraft from 2012 to 2017 to continue more effectively managing capacity and future growth.
Our second quarter capacity increase, directly attributable to the addition of 10 aircraft since June 30, 2009, was
matched with a corresponding increase in demand for our service. This was evidenced by a load factor of 80.0 per
cent, up 3.9 points from 76.1 per cent in the same quarter of 2009. We are encouraged with our strong load factor,
particularly with our significant quarter-over-quarter capacity growth. Our quarterly load factors for the past eight
quarters are depicted in the following graph.
Quarterly load factor
70%
75%
80%
85%
2008 Q3 2008 Q4 2009 Q1 2009 Q2 2009 Q3 2009 Q4 2010 Q1 2010 Q2
During the first quarter 2010, Delta Air Lines and US Airways requested United States Department of Transportation
(DOT) and Federal Aviation Administration (FAA) approval to complete a slot exchange at New York’s LaGuardia and
Washington’s Reagan National airports. DOT’s response was that Delta and US Airways would be required to dispose
of slots at these airports to new entrant airlines. Of the 20 LaGuardia takeoff and landing slot pairs that Delta was
required to dispose of, WestJet was one of four airlines that secured the option to purchase up to five LaGuardia
airport slot pairs. The transfers were contingent upon regulatory approval and subsequent closing of the separate
transaction between Delta and US Airways. During the second quarter of 2010, the DOT and FAA subsequently
rejected the proposed Delta / US Airways slot transaction with the four new entrant airlines and stipulated that the
slots be made available by auction. As a result, Delta and US Airways do not currently plan to trade slots at
LaGuardia or Reagan National airports. The option was contingent upon the Delta / US Airways transaction being
completed and as such, we no longer have the option to purchase five LaGuardia slot pairs, which differs from our
previously-disclosed statement.
WestJet Second Quarter 2010│8

We continue to evaluate other potential interline and code-sharing partnerships to increase our presence in the U.S.
and international markets. Recently, we reached a major milestone in making our inbound interline agreement with
Cathay Pacific Airways operational. In July we implemented interline capability with Cathay’s wholly-owned subsidiary
Dragon Air, which provides feed from China. We have also recently implemented electronic thru check-in
functionality, which allows guests to check in and receive boarding passes and bag tags for all flight segments from
origin to destination.
SELECTED QUARTERLY UNAUDITED FINANCIAL INFORMATION
Three months endedJun. 30 Mar. 31 Dec. 31 Sept. 30
2010 2010 2009 2009($ in thousands, except per share data)
Total revenues 612,117$ 619,765$ 570,042$ 600,630$ Net earnings 21,029$ 13,800$ 20,175$ 31,418$
Basic earnings per share 0.14$ 0.10$ 0.14$ 0.24$ Diluted earnings per share 0.14$ 0.10$ 0.14$ 0.24$
Three months endedJun. 30 Mar. 31 Dec. 31 Sept. 30
2009 2009 2008 2008($ in thousands, except per share data) Restated Restated
Total revenues 531,163$ 579,285$ 615,783$ 718,375$ Net earnings 9,153$ 37,432$ 42,026$ 57,876$
Basic earnings per share 0.07$ 0.29$ 0.33$ 0.45$ Diluted earnings per share 0.07$ 0.29$ 0.33$ 0.45$
Our business is seasonal in nature with varying levels of activity throughout the year. We experience increased
demand for domestic travel in the summer months (second and third quarters) and more demand for sun
destinations over the winter period (fourth and first quarters). By growing our transborder and international
destinations, we have been able to partially alleviate the effects of seasonality on our net earnings.
Excluding special items, net earnings were $23.4 million for the second quarter of 2010, or 16 cents per diluted
share. Year-to-date net earnings were $40.9 million or 28 cents per diluted share excluding special items, as
compared to $44.3 million or 35 cents per diluted share in the same period of 2009, also excluding special items.
Please refer to page 34 of this MD&A for a reconciliation of non-GAAP measures, including net earnings and diluted
earnings per share excluding special items, to the nearest measure under Canadian GAAP.
WestJet Second Quarter 2010│9
RESULTS OF OPERATIONS
Revenue
($ in thousands) 2010 2009 Change 2010 2009 Change
Guest revenues 562,791$ 485,248$ 16.0% 1,127,194$ 982,343$ 14.7%Other revenues 49,326 45,915 7.4% 104,688 128,105 (18.3%)
612,117$ 531,163$ 15.2% 1,231,882$ 1,110,448$ 10.9%RASM (cents) 12.80 12.31 4.0% 12.99 12.81 1.4%
Three months ended June 30 Six months ended June 30
During the quarter ended June 30, 2010, total revenues increased by 15.2 per cent to $612.1 million from $531.2
million in the same quarter of 2009. Similarly, total revenues grew to $1,231.9 million for the six months ended June
30, 2010, from $1,110.4 million for the comparable period in 2009, representing an increase of 10.9 per cent. These
improvements were largely attributable to growth in guest revenues associated with our increase in capacity.
Notwithstanding our significant increase in ASMs, our system load factor increased by 3.9 points to 80.0 per cent.
One of our key revenue measurements is RASM, as it takes into consideration load factor and yield. Our RASM
increased by 4.0 per cent and 1.4 per cent for the three and six months ended June 30, 2010 to 12.80 cents and
12.99 cents, respectively, compared to the same periods in 2009. We are encouraged by the progress made in
improving RASM, considering our increased capacity of 10.9 per cent and 9.4 per cent for the second quarter and
first half of 2010, respectively. Additionally, average stage length growth of 5.9 per cent and 4.3 per cent for the
same periods put downward pressure on yield and RASM. As average stage length increases, our revenue per
available seat mile decreases. Significant traffic increases of 9.8 per cent and 8.3 per cent for the three and six
months ended June 30, 2010 pushed up yield for both periods; however, lower yields on international routes and a
higher percentage of capacity in the longer-haul international markets also contributed to the yield declines.
Domestically, which remains our most significant market, we lowered capacity, as the Canadian travel demand
remains fragile. However, we were pleased that this resulted in positive yield and RASM and was the driving force
behind the overall RASM growth in the quarter. Similarly, we experienced continued strong yields and RASM on our
transborder routes during the second quarter and first six months of 2010.
During 2009, we reduced our aircraft utilization to better match the weakened demand environment we experienced.
As demand for air travel moves toward recovery, the flexibility of our fleet-deployment strategy has allowed us to
make tactical adjustments to our schedule and the number of operating hours we fly each aircraft. Our aircraft
utilization remained flat for the second quarter of 2010 at 11.5 operating hours per day as compared to the second
quarter of 2009, which is an upward trend from the reductions in utilization seen during the first part of 2009. For
the first six months of 2010, we reduced our aircraft utilization 18 minutes to 11.6 operating hours per day,
compared to 11.9 operating hours per day in the same period of 2009. As we increase aircraft utilization, both CASM
and revenue are positively impacted. Additionally, our fleet-deployment strategy allows us to adjust our schedule for
more profitable flying and partially alleviate the effects of seasonality. The second quarter is a transitional period
WestJet Second Quarter 2010│10

where a large portion of our transborder and international capacity is shifted back into our domestic markets, as
depicted in the following graph.
Charter & scheduled transborder and international as a percentage of total ASMs
0%
5%
10%15%
20%
25%
30%
35%40%
45%
50%
Feb-09
Mar-09
Apr-09
May-09
Jun-09
Jul-09
Aug-09
Sep-09
Oct-09
Nov-09
Dec-09
Jan-10
Feb-10
Mar-10
Apr-10
May-10
Jun-10
During the second quarter of 2010, we adjusted our fare structure with two primary implications: 1) introduction of
lower-value fares that will be available to book across the entire published schedule and 2) the reduction of our full-
price fares at an average of 25 per cent for all flights. The objectives of this restructure were to encourage guests to
purchase flights when they are ready to book, rather than waiting for a seat sale, as well as to provide full-fare
pricing that is better aligned with our brand and increases value to our guests. We have also implemented our first
business traveller segmented-fare product by requiring a seven day advance purchase on deeply-discounted fares.
Less price-sensitive business travellers usually book close to departure and this will preclude them from being able to
book our deeply-discounted fares during the peak business travel booking window. A future addition to our business
fare product will be offering refundability on the highest fares. The full impact of these changes will take time, as
they will require a change in our guest purchase behaviour. We believe this provides most of our guests with value,
while at the same time, allows us to save advertising costs and enhance our inventory management capability.
For the three months ended June 30, 2010, other revenues increased by 7.4 per cent to $49.3 million, versus the
comparable period of 2009. This improvement was driven mainly by a large increase in WestJet Vacations non-air
revenue, offset partially by the termination of our charter agreement with Air Transat, effective May 10, 2009. During
the six months ended June 30, 2010, other revenues were $104.7 million as compared to $128.1 million in the same
period of 2009, representing a decrease of 18.3 per cent. This decline was due to decreased charter revenues as a
result of the Air Transat contract termination. Despite the absence of this charter agreement during the second
quarter and first half of 2010, our strong load factor and traffic growth indicate that our increased capacity is being
profitably absorbed by the market.
WestJet Vacations continued to provide incremental profit in the second quarter and first half of 2010. The launch of
our new WestJet Vacations reservation system in the third quarter of 2009 has contributed to WestJet Vacations’
growth. As the travel agent community uses this system as a distribution arm, WestJet Vacations has the capacity
and capabilities in place to continue to expand. WestJet Vacations’ commission structure continues to receive strong
support from the travel agent trade, and we believe our competitive commission structure contributes to our strong
financial results. This, coupled with the added functionalities of WestJet Vacations’ reservation system, will allow us
WestJet Second Quarter 2010│11

to continue to grow the WestJet Vacations business. As part of our winter schedule, we recently announced future
service to three new destinations. Beginning in November, WestJet and WestJet Vacations will launch seasonal, non-
stop service to New Orleans, Santa Clara (Cuba) and Grand Cayman Island. We now serve a total of 71 destinations
in 13 countries.
Ancillary revenues, which include service fees, onboard sales and partner and program revenue, provide an
opportunity to maximize our profits through the sale of significantly higher-margin goods and services, while also
enhancing our overall guest experience. For the second quarter of 2010, ancillary revenues were $23.2 million,
representing a decrease of 1.1 per cent from the same period of 2009. Ancillary revenue per guest decreased by 10.4
per cent to $6.22 per guest in the second quarter of 2010, from $6.94 in the comparable period of 2009. This decline
was attributable to lower revenue from fees, primarily as a result of lower pre-reserved seating and change and
cancellation fees. The variance in pre-reserved seating fees is mainly due to a shift in distribution methods to more
indirect channels, such as the use of travel agents, with the implementation of our new reservation system. As the
global distribution system (GDS) channel, which is widely used by travel agents, is limited in its ability to sell pre-
reserved seating, this ancillary revenue stream is down year over year. Change and cancellation fees, although down,
are beginning to improve versus the declines seen in the first quarter of 2010.
Ancillary revenues also declined by 8.9 per cent in the six months ended June 30, 2010 to $44.0 million, from $48.3
million in the same period of 2009. As such, ancillary revenue per guest for the year-to-date period in 2010
decreased by 18.2 per cent, to $5.95 versus $7.28 in the comparable period of 2009. The declines for the year-to-
date period was also due to lower fees revenue related to pre-reserved seating, as well as change and cancellation
fees. Subsequent to the cutover to our new reservation system, certain fees, such as change and cancellation, were
temporarily waived in order to accommodate guests during the adjustment to the new system. This was prevalent
during the first quarter of 2010. Now that the reservation system has stabilized, we are returning to normal with
respect to charging fees, and we have seen our ancillary revenue improve over the first quarter of 2010. We have
seen strong year-over-year growth in the sales of onboard food and beverages, driven mainly by our unique
approach to regional food offerings, as well as our improved onboard point-of-sale system.
WestJet Second Quarter 2010│12

Expenses
CASM (cents) 2010 2009 Change 2010 2009 Change
Aircraft fuel 3.44 2.98 15.4% 3.42 3.13 9.3%Airport operations 1.94 1.92 1.0% 2.04 2.03 0.5%Flight operations and navigational charges 1.72 1.75 (1.7%) 1.70 1.70 -Marketing, general and administration 1.01 1.13 (10.6%) 1.03 1.17 (12.0%)Sales and distribution 1.20 0.91 31.9% 1.31 0.93 40.9%Depreciation and amortization 0.70 0.80 (12.5%) 0.70 0.79 (11.4%)Inflight 0.66 0.70 (5.7%) 0.65 0.68 (4.4%)Aircraft leasing 0.73 0.63 15.9% 0.73 0.60 21.7%Maintenance 0.48 0.61 (21.3%) 0.51 0.58 (12.1%)Employee profit share 0.08 0.03 166.7% 0.07 0.07 -
11.96 11.46 4.4% 12.16 11.68 4.1%CASM, excluding fuel and employee profit share 8.44 8.45 (0.1%) 8.67 8.48 2.2%
Three months ended June 30 Six months ended June 30
During the second quarter and first half of 2010, our per unit costs increased, due largely to higher aircraft fuel costs
per ASM, as well as sales and distribution and aircraft leasing expense per ASM, as compared to the same periods in
2009. These variances were offset somewhat by declines in marketing, general and administration, maintenance and
depreciation and amortization expense per ASM. Our CASM excluding fuel and employee profit share declined to 8.44
cents in the second quarter of 2010, representing a decrease of 0.1 per cent over the second quarter of 2009. For
the year-to-date period ended June 30, 2010, our CASM excluding fuel and employee profit share increased by 2.2
per cent. Our focus remains on operating one of the most cost-effective airlines in North America.
Aircraft fuel
Fuel is our most significant cost, representing approximately 29 per cent and 28 per cent of our total operating costs
for the three and six months ended June 30, 2010, respectively. This is an increase from approximately 26 per cent
and 27 per cent for the same periods of 2009. During the second quarter of 2010, our fuel costs per ASM increased
by 15.4 per cent to 3.44 cents, as compared to 2.98 cents in the second quarter of 2009. Similarly, our fuel costs per
ASM increased to 3.42 cents from 3.13 cents for the six months ended June 30, 2010, representing an increase of
9.3 per cent. For both periods in 2010, these unfavourable changes were primarily due to a run-up in US-dollar West
Texas Intermediate (WTI) crude oil prices, offset partially by a stronger Canadian dollar.
Under our fuel price risk management policy, we are permitted to hedge a portion of our future anticipated jet fuel
purchases for up to 36 months, as approved by our board of directors. The policy establishes hedging limits based on
time horizon. Management continuously reviews and adjusts its strategy based on market conditions and
competitors’ positions. Jet fuel is not traded on an organized North American futures exchange, and there are limited
opportunities to hedge directly in jet fuel through the over-the-counter market. Financial derivatives in other crude-
oil-based commodities that are traded directly on organized exchanges, such as crude oil and heating oil, are also
useful in decreasing the risk of volatile fuel prices. During the three and six months ended June 30, 2010, we
purchased Canadian-dollar WTI and jet fuel swaps, call options and collars. The cash premium paid during the three
WestJet Second Quarter 2010│13

and six months ended June 30, 2010 related to the call options and collars was $1.7 million and $2.1 million,
respectively.
As at July 31, 2010, we had a mixture of Canadian-dollar WTI and jet fuel swaps, call options and collars to hedge
approximately 19 per cent (December 31, 2009 – 14 per cent) of our anticipated jet fuel requirements for 2010. The
following tables outline, per type, as at July 30, 2010, the notional volumes per barrel (bbl.) or per gallon (gal.),
along with the weighted average contracted prices.
Notional volumes WTI average strike price WTI average call price Type Year Instrument (bbl.) (CAD$/bbl.) (CAD$/bbl.)WTI 2010 Swaps 185,000 102 -
Call options 130,000 - 92WTI 2011 Call options 330,000 - 97
Notional volumes Jet average strike price Jet average call price Jet average put priceType Year Instrument (gal.) (CAD$/gal.) (CAD$/gal.) (CAD$/gal.)Jet 2010 Swaps 10,850,000 2.27 - -
Call options 1,250,000 - 2.50 -Collars 7,100,000 - 2.47 2.05
Jet 2011 Collars 1,260,000 - 2.50 2.00
As at July 30, 2010, for the period that we are hedged, the closing forward curve for crude oil ranged from
approximately US $79 to US $84 (December 31, 2009 – US $79 to US $84) with the average forward foreign
exchange rate being 1.0334 Canadian dollars to US dollars (December 31, 2009 – 1.0536).
Upon proper qualification, we account for our fuel derivatives as cash flow hedges. Under cash flow hedge
accounting, the effective portion of the change in the fair value of the hedging instrument is recognized in
accumulated other comprehensive loss (AOCL), while the ineffective portion is recognized in non-operating income
(expense). Upon maturity of the derivative instrument, the effective gains and losses previously recognized in AOCL
are recorded in net earnings as a component of aircraft fuel expense.
The following table displays our fuel costs per litre including and excluding fuel hedging for the three and six months
ended June 30, 2010. Please refer to page 34 of this MD&A for a discussion on the use of non-GAAP measures,
including aircraft fuel expense excluding hedging, which is reconciled to GAAP in the table below.
($ in thousands, except per litre data) 2010 2009 Change 2010 2009 Change
Aircraft fuel expense – GAAP 164,450$ 128,677$ 27.8% 324,504$ 271,068$ 19.7%Realized loss on designated fuel derivatives – effective portion (2,460) (7,060) (65.2%) (4,644) (19,034) (75.6%)Aircraft fuel expense, excluding hedging – Non-GAAP 161,990$ 121,617$ 33.2% 319,860$ 252,034$ 26.9%
Fuel consumption (thousands of litres) 232,130 207,533 11.9% 462,598 423,294 9.3%
Fuel costs per litre (dollars) – including hedging 0.71 0.62 14.5% 0.70 0.64 9.4%Fuel costs per litre (dollars) – excluding hedging 0.70 0.59 18.6% 0.69 0.60 15.0%
Three months ended June 30 Six months ended June 30
WestJet Second Quarter 2010│14

Our fuel costs per litre including fuel hedging increased by 14.5 per cent to $0.71 per litre during the second quarter
of 2010, from $0.62 per litre in the same period of 2009. Excluding the effects of the realized loss on fuel derivatives
designated in an effective hedging relationship, our fuel costs per litre were $0.70 for the second quarter of 2010, an
increase of 18.6 per cent from the second quarter of 2009. Similarly, we saw fuel costs per litre including fuel
hedging increase for the six months ended June 30, 2010 by 9.4 per cent compared to the same period in 2009.
Excluding the effects of the realized loss on fuel derivatives designated in an effective hedging relationship, our fuel
costs per litre were $0.69 for the six months ended June 30, 2009.
The following table presents the financial impact and statement presentation of our fuel derivatives on the
consolidated balance sheet as at June 30, 2010 and December 31, 2009:
($ in thousands) Statement presentationJune 30,
2010December 31,
2009
Fair value of fuel derivatives Prepaid expenses, deposits and other 1,664$ -$ Receivable from counterparties for settled fuel contracts Prepaid expenses, deposits and other - 96 Fair value of fuel derivatives Accounts payable and accrued liabilities (4,747) (7,521) Payable to counterparties for settled fuel contracts Accounts payable and accrued liabilities (876) (1,242) Unrealized loss from fuel derivatives AOCL – before tax impact 4,614 6,713
The following table presents the financial impact and statement presentation of our fuel derivatives on the
consolidated statement of earnings for the three and six months ended June 30, 2010 and 2009:
($ in thousands) Statement presentation 2010 2009Realized loss on designated fuel derivatives – effective portion Aircraft fuel (2,460)$ (7,060)$
Gain (loss) on designated fuel derivatives – ineffective portion Gain (loss) on derivatives (558) 4,760
($ in thousands) Statement presentation 2010 2009
Realized loss on designated fuel derivatives – effective portion Aircraft fuel (4,644)$ (19,034)$
Gain on designated fuel derivatives – ineffective portion Gain (loss) on derivatives 152 4,843
Three months ended June 30
Six months ended June 30
During the three and six months ended June 30, 2010, we cash-settled fuel derivatives in favour of the
counterparties of $2.4 million and $4.7 million, respectively (three and six months ended June 30, 2009 – $7.2 million
and $21.3 million, respectively).
The estimated amount reported in AOCL that is expected to be reclassified to net earnings as a component of aircraft
fuel expense when the underlying jet fuel is consumed during the next 12 months is a loss before tax of $4.6 million.
For 2010, excluding the impact of fuel hedging, we estimate our sensitivity to changes in crude oil to be
approximately $6 million annually to our fuel costs for every one US-dollar change per barrel of WTI crude oil.
Additionally, we estimate our sensitivity to changes in fuel pricing to be approximately $9 million for every one-cent
change per litre of fuel.
WestJet Second Quarter 2010│15

Sales and distribution
Sales and distribution encompasses a wide variety of expenses, including travel agency commissions and incentives,
credit card settlement fees, GDS fees, transaction fees related to our new reservation system, costs of our call
centres, as well as sales and distribution costs associated with WestJet Vacations. During the second quarter of 2010,
our sales and distribution expenses per ASM increased to 1.20 cents, up 31.9 per cent from 0.91 cents in the same
quarter of 2009. Approximately 40 per cent of this increase relates to the growth of WestJet Vacations. The nature of
this product generates higher sales and distribution expenses, as sales are predominantly sourced through indirect
channels, such as the use of travel agents. The balance of the increase relates to costs associated with our new
reservation system, such as reservation system transaction fees and higher GDS fees due to an increased use of
indirect sales channels. We saw a similar increase for the first half of 2010 to 1.31 cents from 0.93 cents in the
comparable period of 2009, representing a change of 40.9 per cent. The year-to-date variance was also driven by
certain transition costs associated with the reservation system implementation, including incremental staffing in the
call centre and certain one-time costs, such as the outsourcing of our call centre operations due to higher-than-
normal call volumes and wait times.
Aircraft leasing
Our most significant infrastructure cost is aircraft. During the second quarter of 2010, we assumed delivery of one
leased 737-800 aircraft. This brings our total leased aircraft to 36 as at June 30, 2010, and represents approximately
40 per cent of our total fleet. At the end of the second quarter of 2009, we had a total of 26 aircraft under operating
leases, representing approximately 33 per cent of our total registered fleet.
Our aircraft leasing costs per ASM increased by 15.9 per cent in the second quarter of 2010 to 0.73 cents, from 0.63
cents in the same period of 2009. This variance related primarily to incremental leasing costs on 10 additional leased
aircraft delivered since the end of the second quarter of 2009. For the six months ended June 30, 2010, our aircraft
leasing costs per ASM were 0.73 cents, an increase of 21.7 per cent from the first half of 2009. This increase was
comprised primarily of incremental leasing costs on 10 additional leased aircraft since the end of the second quarter
of 2009, and a full period of aircraft leasing costs for three leased aircraft delivered in the first half of 2009.
We consider aircraft ownership costs to include aircraft leasing, depreciation and amortization and interest expense,
and when combined, our per-unit expenses associated with aircraft ownership declined for the three and six months
ended June 30, 2010 as compared to the same periods in the prior year.
As our aircraft leasing payments are denominated in US dollars, favourable foreign exchange movements partially
offset the increases in aircraft leasing costs for both periods. Additionally, we have an active foreign exchange
hedging program to offset our US-dollar-denominated aircraft lease payments on the majority of our leased aircraft.
Please refer to Results of Operations – Foreign Exchange on page 20 of this MD&A for further information.
WestJet Second Quarter 2010│16

Marketing, general and administration
Marketing largely consists of expenses such as advertising and promotions and live satellite television licensing fees.
General and administration costs consist of our corporate office departments, professional fees, insurance costs and
transaction costs related to aircraft acquisitions. During the second quarter of 2010, our marketing, general and
administration charge per ASM decreased by 10.6 per cent to 1.01 cents, compared to 1.13 cents in the same period
of 2009. This decrease was attributable to lower consulting costs incurred during the second quarter of 2010 as
compared to the same period in 2009, primarily associated with the implementation of our new reservation system.
This was partially offset by revisions to the calculation of capital taxes, based on the estimated impacts of changes to
our provincial income allocation, resulting in an increase of $1.2 million. Similarly, our year-to-date per unit
marketing, general and administration charge declined to 1.03 cents from 1.17 cents in the comparable period of
2009, a decrease of 12.0 per cent. In addition to lower information technology consulting costs, this variance was
also driven by lower year-over-year costs associated with future travel credits awarded to each of our WestJetters.
This was partially offset by costs of $4.1 million relating to our former CEO’s departure during the first quarter of
2010. Although relatively comparable on a total dollar basis for both second quarter and first half of 2010, marketing,
general and administration expense benefited from ASM dilution for both periods.
Maintenance
Our maintenance costs per ASM were 0.48 cents in the second quarter of 2010, representing a decrease of 21.3 per
cent from 0.61 cents in the second quarter of 2009. For the three months ended June 30, 2010, approximately 40
per cent of the decrease was attributable to the stronger Canadian dollar, as approximately 45 per cent of our
maintenance costs were denominated in US dollars. Additionally, we received proceeds from an insurance claim
resulting from a damaged engine during the second quarter of 2010, for which the maintenance expense was
recorded in the first quarter of 2010, also contributing to the favourable variance for the quarter. Our year-to-date
maintenance costs per ASM decreased by 12.1 per cent to 0.51 cents from 0.58 cents in the first half of 2009, largely
driven by the dilutive impact of our increased capacity. We expect our incremental scheduled maintenance expense
to grow for the remainder of the year, as three aircraft are scheduled to undergo their first major overhauls in 2010.
WestJet Second Quarter 2010│17

Compensation
Our compensation philosophy is designed to align corporate and personal success. We have designed a
compensation plan whereby a portion of our expenses are variable and are tied to our financial results. Our
compensation strategy encourages employees to become owners in WestJet, which inherently creates a personal
vested interest in our financial results and accomplishments.
($ in thousands) 2010 2009 Change 2010 2009 Change
Salaries and benefits 110,677$ 97,980$ 13.0% 223,576$ 196,804$ 13.6%Employee share purchase plan 13,039 11,600 12.4% 25,388 22,691 11.9%Employee profit share 3,898 1,185 228.9% 6,213 6,902 (10.0%)Stock option plan 3,437 2,872 19.7% 5,971 5,318 12.3%Key employee and pilot plan 509 - N/A 509 - N/AExecutive share unit plan 200 277 (27.8%) 2,951 466 533.3%
131,760$ 113,914$ 15.7% 264,608$ 232,181$ 14.0%
Three months ended June 30 Six months ended June 30
Salaries and benefits
Salaries and benefits are determined via a framework of job levels based on internal experience and external market
data. During the second quarter of 2010, salaries and benefits increased by 13.0 per cent to $110.7 million from
$98.0 million in the same period of 2009, due primarily to higher pilot salaries and benefits resulting from the new
pilot agreement effective July 1, 2009 and annual market and merit increases. For the six months ended June 30,
2010, salaries and benefits were $223.6 million as compared to $196.8 million in the comparable period of the prior
year, representing an increase of 13.6 per cent. The increase for the year-to-date period was due primarily to higher
pilot salaries and benefits as discussed previously; a cash payout of $1.5 million relating to our former CEO’s
departure from the Company in the first quarter of 2010; incremental salary costs associated with the challenges
posed by the reservation system implementation; and annual market and merit increases. Salaries and benefits
expense for each department is included in the respective department’s operating expense line item.
Employee share purchase plan (ESPP)
Our ESPP encourages employees to become owners of WestJet shares. Under the terms of the ESPP, WestJetters
may acquire voting shares of WestJet at the current fair market value, and these acquisitions will be matched by us
up to a maximum of 20 per cent of their gross pay. As at June 30, 2010, 84 per cent of our eligible active employees
participated in the ESPP, contributing an average of 13 per cent. During the quarter ended June 30, 2010, we
matched contributions for every dollar contributed by our employees. For the quarter ended June 30, 2010, our
matching expense was $13.0 million, a 12.4 per cent increase from the same period of 2009. Similarly, our matching
expense grew by 11.9 per cent for the six months ended June 30, 2010, compared to the same period of 2009, to
$25.4 million from $22.7 million, respectively. The additional expense for both periods was driven primarily by an
increase in salary expense, as well as a greater number of participating WestJetters in the ESPP versus last year.
WestJet Second Quarter 2010│18

Employee profit share
All employees are eligible to participate in the employee profit sharing plan. As the profit share system is a variable
cost, employees receive larger awards when we are more profitable. Conversely, the amount distributed to
employees is reduced and adjusted in less profitable periods. Our profit share expense for the quarter ended June
30, 2010 was $3.9 million, a 228.9 per cent increase from the same quarter of 2009. This increase was directly
attributable to higher earnings eligible for profit share. For the six months ended June 30, 2010, our profit share
expense decreased by 10.0 per cent to $6.2 million, as compared to the first half of 2009. This decline was due to
lower earnings eligible for profit share during this period.
Stock option plan
Stock-based compensation expense related to stock options for the quarter ended June 30, 2010, was $3.4 million,
representing an increase of 19.7 per cent over the second quarter of 2009, due primarily to additional grants over
the prior year, as well as the effect of a new retirement policy, effective July 3, 2009, which resulted in a greater
number of employees being eligible for retirement than under our previous policy. Under our accounting policy for
stock-based compensation, for any employees eligible to retire during the vesting period of the award, the
compensation expense is recognized over the period from the grant date to the retirement eligibility date. In
instances where an employee is eligible to retire on the grant date of the stock-based award, compensation expense
is recognized immediately. For the six months ended June 30, 2010, stock-based compensation expense related to
stock options was $6.0 million, an increase of 12.3 per cent from the comparable period of 2009. This increase in
stock option expense for the year-to-date period related primarily to the accelerated expense of $0.3 million resulting
from our former CEO’s departure from the Company, as well as the effect of the new retirement policy. Stock-based
compensation expense related to pilots’ options is included in flight operations and navigational charges, while the
expense related to senior executives’ and certain non-executive employees’ options is included in marketing, general
and administration expense.
Key employee and pilot (KEP) restricted share unit plan
During the second quarter of 2010, a new stock-based compensation plan was approved by our shareholders, the
key employee and pilot restricted share unit plan, whereby restricted share units (RSUs) are issued to key employees
and pilots. The fair market value of the RSUs at the time of grant is equal to the weighted average trading price of
our voting shares for the five trading days immediately preceding the grant date. Each RSU entitles the employee to
receive payment upon vesting in the form of voting shares. The RSUs time vest at the end of a two or three-year
period, with compensation expense being recognized in net earnings on a straight-line basis over the vesting period.
The Corporation has the option to settle the RSUs through the purchase of voting shares on the open market or to
issue new shares from treasury up to a maximum of 1,000,000. For both the second quarter and first half of 2010,
$0.5 million in compensation expense was recognized in relation to the KEP plan.
WestJet Second Quarter 2010│19

Executive share unit (ESU) plan
We have an equity-based ESU plan, whereby RSUs and performance share units (PSUs) may be issued to our senior
executive officers. For the three months ended June 30, 2010, $0.2 million in compensation expense was recognized
in relation to the ESU plan, a decrease from $0.3 million in compensation expense recognized in the same quarter of
2009. This decrease was primarily attributable to revised probabilities for attaining growth rate targets for the PSUs.
For the first half of 2010, compensation expense for the ESU plan was $3.0 million, an increase of 533.3 per cent
from the comparable period of 2009. This increase mainly resulted from the acceleration of expense of $2.3 million
due to our former CEO leaving the Company, as well as revised probabilities for the PSUs. Stock-based compensation
expense related to the ESU plan is included in marketing, general and administration expense.
Foreign exchange
The gain or loss on foreign exchange included in our consolidated statement of earnings is mainly attributable to the
effect of the changes in the value of our US-dollar-denominated net monetary assets. As at June 30, 2010, US-dollar-
denominated net monetary assets totalled approximately US $73.7 million (December 31, 2009 – US $19.9 million)
and consist mainly of US-dollar cash and cash equivalents and security deposits on various leased and financed
aircraft, US-dollar accounts payable and accrued liabilities and our US-dollar long-term debt facility signed in the
fourth quarter of 2009. We hold US-denominated cash and short-term investments to reduce the foreign currency
risk inherent in our US-dollar expenditures. We reported foreign exchange gains of $6.0 million and $2.1 million for
the three and six months of 2010, respectively, on the revaluation of our US-dollar net monetary assets. This
compares to foreign exchange losses of $9.0 million and $4.4 million during the same three and six month periods,
respectively, in the prior year.
We periodically use financial derivatives to manage our exposure to foreign exchange risk. As at June 30, 2010, we
are entered into foreign exchange forward contracts for US $10.4 million per month for the period of July 2010 to
April 2011, for a total of US $103.7 million at a weighted average contract price of 1.0323 per US dollar to offset a
portion of our future US-dollar-denominated aircraft lease payments. Upon proper qualification, we designated the
forward contracts as effective cash flow hedges for accounting purposes. Upon maturity of the derivative instrument,
the effective gains and losses previously recognized in AOCL are recorded in net earnings as a component of aircraft
leasing expense. As at June 30, 2010, no portion of the forward contracts was considered ineffective.
As at June 30, 2010, the fair value of the forward contracts was $3.4 million, included in prepaid expenses, deposits
and other, and $0.005 million recorded in accounts payable and accrued liabilities (December 31, 2009 – $1.0
million). For the three and six months ended June 30, 2010, we realized a loss before tax on forward contracts of
$1.1 million and $1.5 million, respectively, (three and six months ended June 30, 2009 – gain of $2.3 million and
$5.6 million, respectively) included in net earnings as an increase to aircraft leasing expense. The estimated amount
reported in AOCL that is expected to be reclassified to net earnings as a component of aircraft leasing expense in the
next 12 months is a gain before tax of $3.4 million. The fair value of the foreign exchange forward contracts is
measured based on the difference between the contracted rate and the current forward price obtained from the
counterparty, which can be observed and corroborated in the marketplace.
WestJet Second Quarter 2010│20

For 2010, including the impact of foreign exchange hedging, we estimate that every one-cent change in the value of
the Canadian dollar versus the US dollar will have an approximate $8 million impact on our annual operating costs
(approximately $6 million for fuel and $2 million related to other US-dollar-denominated expenses).
Income taxes
Our operations span several Canadian tax jurisdictions, subjecting our income to various rates of taxation. As such,
the computation of the provision for income taxes involves judgments based on the analysis of several different
pieces of legislation and regulation.
Our effective consolidated income tax rates for the three and six months ended June 30, 2010 were 36.1 per cent
and 35.4 per cent, respectively, as compared to 33.3 per cent and 27.4 per cent for the same periods in 2009. The
increase in our effective tax rate for the three-month period ended June 30, 2010 was primarily due to revisions to
the valuation of our future income tax liability based on the estimated impacts of changes to our provincial income
allocation, resulting in an increase of future income tax expense of $1.5 million. The year-to-date variance was driven
primarily by the same issue, in addition to the acceleration of non-deductible stock-based compensation expense,
resulting mainly from the departure of our former CEO, which resulted in future income tax expense being greater
than expected by an additional $0.7 million.
Excluding these non-recurring items, the effective consolidated income tax rate for the first half of 2010 would have
been 31.2 per cent, which is more in line with expectations of 29 to 31 per cent previously set for the year.
Guest experience
As an airline, we are focused on meeting the needs of our guests while maintaining the highest safety standards. We
are committed to delivering a positive guest experience during every aspect of our service, from the time the flight is
booked to completion of the flight. During the second quarter of 2010, we expanded our self-service options to
include self-serve baggage tagging, to be rolled out to many Canadian airports within the next year.
Key operating performance indicators
On-time performance and completion rates are calculated based on the U.S. Department of Transportation’s
standards of measurement for the North American airline industry. Our bag ratio represents the number of delayed
or lost baggage claims made per 1,000 guests.
2010 2009 Change 2010 2009 Change
On-time performance 81.1% 89.5% (8.4 pts.) 77.0% 80.7% (3.7 pts.)Completion rate 99.3% 99.4% (0.1 pts.) 98.9% 98.5% 0.4 pts.Bag ratio 3.02 2.54 (18.9%) 3.59 3.47 (3.5%)
Three months ended June 30 Six months ended June 30
WestJet Second Quarter 2010│21

On-time performance, indicating the percentage of flights that arrived within 15 minutes of their scheduled time, is a
key factor in measuring our guest experience. During the second quarter of 2010, our on-time performance declined
by 8.4 points, due to several factors, such as more significant operational-impacting weather instances versus 2009
in our largest four airports, as well as our mid-range to small operation cities; a NAV CANADA inbound traffic control
program initiated in the second quarter; higher aircraft servicing delay minutes; and a network continually growing in
complexity. For the six months ended June 30, 2010, our on-time performance declined by 3.7 points due mainly to
harsher weather events versus the same period of the prior year.
Our completion rates remained relatively flat for both the second quarter and first half of 2010 at 99.3 per cent and
98.9 per cent, respectively, as compared to the same periods in 2009. This indicator represents the percentage of
flights completed from flights originally scheduled.
We also saw declines in our bag ratio for the second quarter and first half of 2010, as compared to the same periods
in the prior year.
LIQUIDITY AND CAPITAL RESOURCES
The airline industry is highly sensitive to unpredictable circumstances, and as such, maintaining a strong financial
position is imperative to an airline’s success. We continued to maintain one of the most favourable balance sheets in
the airline industry in 2010, and we produced our 21st consecutive quarter of profitability in the second quarter of
2010.
We ended the quarter with a significant cash and cash equivalents balance of $1,108.2 million, compared to $1,005.2
million as at December 31, 2009. Part of our cash and cash equivalents balance relates to cash collected with respect
to advance ticket sales, for which the balance at June 30, 2010, was $325.7 million, as compared to $286.4 million at
December 31, 2009. Typically, we have cash and cash equivalents on hand to have sufficient liquidity to meet our
liabilities when due, under both normal and stressed conditions. As at June 30, 2010, we had cash on hand of 3.40
(December 31, 2009 – 3.51) times the advance ticket sales balance. Our cash and cash equivalents balance as at
June 30, 2010 was approximately 46 per cent of our trailing 12 months of revenues, and our current ratio was 1.46
at the end of the quarter. These ratios are indicative of our healthy balance sheet and liquidity.
Credit risk associated with cash and cash equivalents is minimized substantially by ensuring that these financial
assets are invested primarily in debt instruments with highly-rated financial institutions. As at June 30, 2010, we have
not been required to post collateral with respect to any of our outstanding derivative contracts.
We monitor capital on a number of measures, including adjusted debt-to-equity and adjusted net debt to EBITDAR
ratios. These ratios are among the best in the North American airline industry and continue to improve. Our adjusted
debt-to-equity ratio improved by 1.4 per cent to 1.41 as at June 30, which included $906.4 million in off-balance-
sheet aircraft operating leases. This compared favourably to our adjusted debt-to-equity ratio of 1.43 at December
31, 2009, mainly attributable to the increase in adjusted shareholders’ equity proportionately offsetting the increase
in our off-balance-sheet aircraft lease financing. As at June 30, 2010, our adjusted net debt to EBITDAR ratio
WestJet Second Quarter 2010│22

improved by 5.9 per cent to 2.07, compared to 2.20 as at December 31, 2009, due primarily to the increase in our
cash and cash equivalents more than offsetting the slight decrease in EBITDAR. Both of these ratios met our internal
targets for June 30, 2010 and December 31, 2009, of an adjusted debt-to-equity measure and an adjusted net debt
to EBITDAR ratio of no more than 3.00.
Operating cash flow
We continued to generate positive cash flows from operations to fund our working capital requirements. In the
second quarter of 2010, cash flow from operations increased to $84.8 million, from $25.8 million for the same period
of 2009, representing an increase of 228.7 per cent. Increased cash flow from operations for the second quarter of
2010 related primarily to increases in net earnings and non-cash working capital due to a higher advance ticket sales
balance, offset somewhat by decreases in accounts payable and accrued liabilities and non-refundable guest credits
balances, versus the amounts as at March 31, 2010. Similarly, cash flow from operations increased by 73.1 per cent
for the six months ended June 30, 2010, to $210.0 million, from $121.3 million in the comparable period of 2009.
Cash flow from operations for the year-to-date period of 2010 related mainly to non-cash working capital due to
higher advance ticket sales and accounts payable and accrued liabilities balances, versus the amounts as at
December 31, 2009.
Financing cash flow
For the second quarter of 2010, our total cash flow used in financing activities was $44.1 million, primarily used
toward repayments of long-term debt. During the same quarter of 2009, our cash flow used in financing activities
was $42.7 million, consisting substantially of long-term debt repayments. Our financing cash outflows of $88.9 million
in the first half of 2010 consisted primarily of $85.5 million in long-term debt repayments, as well as deposits relating
to future leased aircraft. In the comparable period of 2009, our financing cash outflows of $84.3 million consisted
primarily of $83.1 million in long-term debt repayments, largely relating to our aircraft.
We have grown through aircraft acquisitions financed by low-interest-rate debt supported by the Export-Import Bank
of the United States (Ex-Im Bank). The loan guarantees from the U.S. government represent approximately 85 per
cent of the purchase price of these aircraft. The cumulative number of aircraft financed with Ex-Im Bank loan
guarantees is 52, with an outstanding debt balance of $1.1 billion associated with those aircraft. All of this debt has
been financed in Canadian dollars at fixed interest rates, thus eliminating all future foreign exchange and interest-
rate exposure on these US-dollar aircraft purchases.
To facilitate the financing of our Ex-Im Bank supported aircraft, we utilize five special-purpose entities (SPEs). We
have no equity ownership in the SPEs; however, we are the beneficiary of their operations. The accounts of the SPEs
have been consolidated in the financial statements.
WestJet Second Quarter 2010│23

Investing cash flow
Cash used in investing activities for the second quarter and first six months of 2010 totalled $12.5 million and $20.0
million, respectively, compared to $75.6 million and $120.7 million in the comparable periods of 2009. During the
three months ended June 30, 2010, our investing activities consisted of $10.0 million in aircraft additions, largely
comprised of deposits paid to Boeing on future owned aircraft deliveries. Additionally, we incurred $2.5 million in
other property and equipment and intangible asset additions. Cash used in investing activities for the second quarter
of 2009 included $57.2 million in aircraft additions, related primarily to the addition of a leased 737-800 aircraft
subsequently purchased from the lessor, as well as deposits on future owned aircraft deliveries. Additionally, we
incurred $18.4 million in other property and equipment additions, mainly related to our new Campus office space. For
the six months ended June 30, 2010, investing activities consisted of $14.8 million in aircraft additions, largely due to
deposits on future owned aircraft. We also incurred $5.2 million in other property and equipment and intangible asset
additions. In the comparable period of 2009, investing activities consisted of $84.2 million in aircraft additions, largely
resulting from the leased aircraft purchase and the conversion to an accelerated deposit schedule with Boeing during
the first quarter of 2009 to mitigate carrying costs. We also incurred $36.5 million in capital spending, mainly
associated with the Campus facility in the same period.
Contractual obligations and commitments
We currently have 36 aircraft under operating leases. We have entered into agreements with independent third
parties to lease five additional 737-700 aircraft and three 737-800 aircraft for terms ranging between eight and 10
years, to be delivered throughout 2010 to 2012. Although the current obligations related to our aircraft operating
lease agreements are not recognized on our balance sheet, we include these commitments in assessing our overall
leverage through our adjusted debt-to-equity and adjusted net debt to EBITDAR ratios. In addition to aircraft, we
have entered into operating leases and commitments for land, buildings, equipment, computer hardware, software
licenses and satellite programming. As at June 30, 2010, our future payments to 2015 and thereafter relating to
operating leases and commitments were $1,520.3 million (US $1,331.9 million), to be funded through our operating
cash flow.
Capital resources
During the second quarter of 2010, we took delivery of one leased 737-800 aircraft, increasing our total registered
fleet to 89 as at June 30, 2010. Subsequent to the second quarter of 2010, we negotiated changes to our fleet plan
with Boeing, as summarized in the revised delivery schedule on the following page. These changes have allowed us
to defer one 700-series owned aircraft from 2011 to 2017, and two 700-series aircraft from 2012 to 2017.
Additionally, under our current fleet plan, we have 32 aircraft leases expiring between 2013 and 2017, each with the
option to renew. This provides us with the flexibility to end 2017 with a fleet size between 103 and 135 aircraft,
dependent on the exercise of the lease renewal options. As at July 31, 2010, we had existing commitments to take
delivery of an additional 45 aircraft, as depicted in the delivery schedule on the following page.
WestJet Second Quarter 2010│24

Leased Owned Total Leased Owned Total Leased Owned Total Leased Owned TotalFleet at December 31, 2009 - 13 13 25 38 63 8 2 10 33 53 86 Fleet at July 31, 2010 - 13 13 27 38 65 10 2 12 37 53 90 Commitments:
2010 - - - - - - 1 - 1 1 - 1 2011 - - - 4 1* 5 1 - 1 5 1 6 2012 - - - - 4* 4 1 - 1 1 4 5 2013 - - - - 6* 6 - - - - 6 6 2014 - - - - 6* 6 - - - - 6 6 2015 - - - - 10* 10 - - - - 10 10 2016 - - - - 8* 8 - - - - 8 8 2017 - - - - 3* 3 - - - - 3 3
Total commitments - - - 4 38 42 3 - 3 7 38 45 Committed fleet as of 2017 - 13 13 31 76 107 13 2 15 44 91 135 *We have an option to convert any of these future aircraft to 737-800s.
Series600s 800s Total fleet700s
As at July 27, 2010, our total purchased aircraft commitment, including amounts to be paid for live satellite television
systems on purchased and leased aircraft, was $1,727.6 million (US $1,667.3 million).
We have a revolving operating line of credit with a syndicate of three Canadian banks available to us. The line of
credit is available for up to a maximum of $80.8 million (December 31, 2009 – $85.0 million), is secured by our
Campus facility and expires in May 2012. The line of credit bears interest at prime plus 0.50 per cent per annum, or a
bankers acceptance rate at a 2.0 per cent annual stamping fee, and is available for general corporate expenditures
and working capital purposes. We are required to pay a standby fee of 15 basis points, based on the average unused
portion of the line of credit for the previous quarter, payable quarterly. As at June 30, 2010, no amounts were drawn
on this facility.
Contingencies
We are party to certain legal proceedings that arise during the ordinary course of business. It is the opinion of
management that the ultimate outcome of these matters will not have a material effect upon our financial position,
results of operations or cash flows.
WestJet Second Quarter 2010│25

Share capital
Our issued and outstanding voting shares, along with voting shares potentially issuable, are as follows:
July 31, 2010 June 30, 2010
Issued and outstanding: Common voting shares 139,717,973 139,677,79 Variable voting shares 5,576,585 5,616,4Total voting shares issued and outstanding 145,294,558 145,294,209
Voting shares potentially issuable: Stock options 8,204,292 8,345,8 RSUs – KEP plan 166,316 166,316 RSUs – ESU plan 147,060 147,060 PSUs – ESU plan 196,074 196,074Total voting shares potentially issuable 8,713,742 8,855,263
Total outstanding and potentially issuable voting shares 154,008,300 154,149,472
0 19
13
Number of shares
Related-party transactions
We have debt financing and investments in short-term deposits with a financial institution that is related through two
common directors, one of whom is also the President and CEO of the financial institution. As at June 30, 2010, total
long-term debt includes an amount of $6.0 million (December 31, 2009 – $6.4 million) due to the financial institution.
Included in cash and cash equivalents, as at June 30, 2010, are short-term investments of $129.6 million (December
31, 2009 – $143.3 million) owing from the financial institution. Our previously-discussed revolving operating line of
credit is with a banking syndicate, of which one of the members is the related-party financial institution. These
transactions occurred in the normal course of operations on terms consistent with those offered to arm’s-length
parties and are measured at the exchange amount.
WestJet Second Quarter 2010│26

ACCOUNTING
Recent accounting pronouncements and changes
IFRS
On February 13, 2008, the Accounting Standards Board (AcSB) confirmed that the changeover to IFRS from
Canadian GAAP will be required for publicly accountable enterprises for interim and annual financial statements
effective for fiscal years beginning on or after January 1, 2011, including comparatives for 2010. The objective is to
improve financial reporting by having one single set of accounting standards that are comparable with other entities
on an international basis.
We commenced our IFRS conversion project during 2008 and established a formal project governance structure,
including an IFRS Steering Committee, to monitor the progress and critical decisions in the transition to IFRS. The
Steering Committee consists of senior levels of management from Finance, Treasury and Investor Relations, among
others. An external advisor has been engaged to work with our conversion project team to complete the conversion.
Additionally, we have engaged our external auditors to review accounting policy determinations as they are assessed
by the project team. Regular reporting is provided by the project team to senior management, the Steering
Committee and the Audit Committee of the Board of Directors.
We have an IFRS transition plan that includes a timetable for assessing the impact on systems, internal controls over
financial reporting (ICFR) and business activities. Our IFRS conversion project consists of three phases: Diagnostic,
Solution Development, and Implementation and Execution. We have completed the Diagnostic phase, which involved
a high-level preliminary assessment of the differences between Canadian GAAP and IFRS and the potential effects of
IFRS to accounting and reporting processes, information systems, business processes and external disclosures. This
assessment provided insight as to the most significant areas of difference applicable to us.
The second phase, Solution Development, is substantially complete. It involved an in-depth analysis and evaluation
of the financial impacts of various alternatives provided for under IFRS; identification of effects on operational and
business processes, analysis of disclosure requirements, an analysis of the optional exemptions and mandatory
exceptions of First-Time Adoption of International Financial Reporting Standards (IFRS 1) for full retrospective
application upon transition to IFRS; and development of solutions to address the issues identified.
Phase three, Implementation and Execution, has commenced. It involves the design and execution to changes to
information systems and business processes; completion of formal authorization processes to approve recommended
accounting policy changes; training programs across the Finance Department and other affected areas of the
business; and addressing opening IFRS balances for January 1, 2010. This phase also involves the collection of
financial information necessary to prepare comparative IFRS financial statements and reconciliations for 2011 for
approval by the Audit Committee and embedding IFRS into day-to-day business processes.
WestJet Second Quarter 2010│27

Please see the table below for certain elements of our IFRS transition plan and an assessment of progress towards
achieving these milestones. Given the progress of the project and outcomes identified, we could change our
intentions between the time of communicating these key milestones and the changeover date. Further, changes in
regulation or economic conditions at the date of the changeover or throughout the project could result in changes to
the transition plan being communicated here.
Key activity Key milestones Status
Financial statement preparation
Identify differences in Canadian GAAP/IFRS accounting policies
Select ongoing IFRS policies
Select IFRS 1 choices Develop financial
statement format Quantify effects of change
in initial IFRS disclosure and 2010 comparative financial statements
Senior management and Steering Committee sign-off for all key IFRS accounting policy choices occurred in the first half of 2010. Development of draft financial statement format to occur throughout 2010.
Completed the IFRS Diagnostic phase during 2008, which involved a high-level review of the major differences between Canadian GAAP and IFRS. The Solution Development phase is substantially complete, and we have commenced the Implementation and Execution phase as previously discussed.
Training
Define and introduce appropriate level of IFRS expertise for each of the following:
Finance Department Audit Committee Business units
Training for the Finance Department to occur throughout 2010. Regular Audit Committee updates are provided once per quarter, and Audit Committee information session was provided in the second quarter of 2010.
Project team expert resources and our external advisor have been identified to provide insights and training. Training for project team members is occurring throughout the project, and a detailed training plan is being created for the Finance Department and other departments as needed.
Information technology (IT) infrastructure
Confirm that business processes and systems are IFRS compliant, including:
Program upgrades (including any interfaces) and changes
Gathering data for disclosures
Confirm that systems can address 2010 dual reporting requirements throughout 2010. Confirm that business processes and systems are IFRS compliant throughout the project.
IT proof of concept for dual reporting during 2010 has been completed, with testing and implementation occurring throughout 2010. Based on the work to date, there does not appear to be any significant IT issues that cannot be addressed by our current systems. Currently working with affected business units to address business process and IT changes required to embed IFRS into day-to-day processes.
Control environment
For all accounting policy changes identified, assess control design and effectiveness implications
Implement appropriate changes
All key IFRS control design and effectiveness implications are being assessed as part of the key IFRS differences and accounting policy choices through to the end of 2010.
Controls requirements are currently being developed for the opening balance sheet, dual reporting period and the maintenance of IFRS after the changeover date.
WestJet Second Quarter 2010│28

External and internal communications
Assess the effects of key IFRS-related accounting policy and financial statement changes on external and internal communications, in particular:
Confirm 2011 investor communications are IFRS compliant regarding guidance and financial impact
Monitor external communications package
Confirm investor relations process can respond to IFRS-related queries
Analyze effects on management and employee compensation arrangements and plans
Analyze and publish the effect of IFRS on the financial statements throughout the project.
IFRS disclosure will be updated throughout the project. Investor Relations is represented on the IFRS Steering Committee. An investor relations communications strategy is currently being formulated. This also includes a strategy to analyze effects on management and employee compensation arrangements and plans, and the related communications necessary if changes are required.
The transition from Canadian GAAP to IFRS is a significant undertaking that may materially affect our reported
financial position and results of operations. We continue to monitor standards development as issued by the IASB
and the AcSB, as well as regulatory developments as issued by the Canadian Securities Administrators (CSA), which
may affect the timing, nature or disclosure of our adoption of IFRS.
We are still determining the full effects of adopting IFRS. Our preliminary assessment of the impact of adopting IFRS
based on the current standards has identified the following areas as having the most significant potential impact to
our consolidated financial statements. This should not be regarded as a complete list of changes that will result from
the transition to IFRS, but rather, is intended to highlight the areas we believe to be the most significant. As we
move through the Implementation and Execution phase, we will confirm additional changes. These assessments are
based on available information and our expectations as of the date of this MD&A and thus, are subject to change
based on new facts and circumstances. Additionally, an analysis of changes is still in progress and not all decisions
have been made where choices of accounting policies are available. At this stage, we have not completed
quantification of the impact expected on our consolidated financial statements for these differences.
IFRS 1 provides entities adopting IFRS for the first time with a number of optional exemptions and mandatory
exceptions, in certain areas, to the general requirement of full retrospective application of IFRS. Most adjustments
required on transition to IFRS will be made retrospectively against opening retained earnings in the first comparative
balance sheet.
(a) Property and equipment: IFRS and Canadian GAAP contain the same basic principles; however, there are certain
differences in application. Under our current policy, maintenance and repairs, including major overhauls, are
charged to maintenance expense as they are incurred. Under International Accounting Standard (IAS) 16,
Property, Plant and Equipment, the costs of activities that restore the service potential of airframes, engines and
landing gear will be considered components of the aircraft and will be added to the carrying amount of the asset
WestJet Second Quarter 2010│29
and amortized over the period until the next overhaul. Further, IFRS requires that each item of property and
equipment with a significant cost in relation to the total cost be depreciated separately. This change of
identifying the built-in overhaul in the original purchase price of the aircraft, spare engines and landing gear, as
well as accelerating the depreciation of the major overhaul component over the period to the next overhaul, is
expected to reduce the carrying value of property and equipment and opening retained earnings on transition.
IFRS 1 contains an elective exemption in which an entity may elect fair market value as the new cost basis for
property and equipment at the date of transition. We do not expect to adopt this exemption and will continue to
measure property and equipment at historical cost.
(b) Provisions, contingent liabilities and contingent assets: IAS 37, Provisions, Contingent Liabilities and Contingent
Assets requires a provision to be recognized when: (1) there is a present obligation as a result of a past
transaction or event; (2) it is probable that an outflow of resources will be required to settle the obligation; and
(3) a reliable estimate can be made of the obligation. The threshold for recognition of a provision under
Canadian GAAP is higher than under IFRS. Therefore, it is possible that some contingent liabilities not recognized
under Canadian GAAP may meet the recognition criteria under IFRS.
Maintenance costs for lease return conditions are not currently booked as a provision under Canadian GAAP.
Under IFRS, it is expected that a provision will be made during the lease term for the obligation to return the
aircraft at or better than specified maintenance levels. We anticipate that this will reduce opening retained
earnings upon transition and increase total liabilities.
A number of leases also require WestJet to pay maintenance reserves to the lessor. The purpose of these
payments is to provide the lessor with collateral should an aircraft be returned in a condition that does not meet
the maintenance requirements of the lease. Under Canadian GAAP, these payments are expensed as incurred.
As maintenance reserves are either refunded when qualifying maintenance is performed, or are offset against
end of lease liabilities, under IFRS, these payments will be accounted for as an asset. Where the amount of
maintenance reserves paid exceeds the estimated amount recoverable from the lessor, the non-recoverable
amount is expensed. The obligating event in booking this asset and the corresponding maintenance provision
liability is usage, as opposed to the occurrence of the maintenance event under Canadian GAAP. We anticipate
that this adjustment will increase opening retained earnings upon transition, with a corresponding increase in
total assets.
Soft dollar credit files are credits provided to a guest as a sign of goodwill to be used towards future travel. The
issuance of discretionary credit files does not require a performance obligation to be fulfilled by us, nor is the
issuance part of a sales transaction, and therefore no present obligation exists. As such, soft dollar credit files
will no longer be recognized as a liability upon issuance under IFRS, but rather recognized as a reduction to
revenue upon redemption. This adjustment is expected to increase opening retained earnings and reduce non-
refundable guest credits.
WestJet Second Quarter 2010│30

(c) Leases: Under IAS 17, Leases, the quantitative measures used to determine the classification of a lease, as in
Canadian GAAP, do not exist. Rather, classification depends solely on the substance of the transaction. From a
detailed review of our leasing agreements, it does not appear that we will be required to reclassify any operating
leases to finance leases on adoption of IAS 17.
With respect to other lessee accounting issues, it is likely that the remaining unrecognized profit from sale and
operating leaseback transactions that occurred in 2005, currently being recognized over the lease term, will be
credited to retained earnings and recognized immediately as a reduction to a liability.
(d) Financial instruments – recognition and measurement: In general, there are many similarities between IFRS and
Canadian GAAP for the recognition and measurement of financial instruments. A convergence project is
underway with the Financial Accounting Standards Board (FASB) to replace IAS 39, Financial Instruments:
Recognition and Measurement. This project is divided into three phases: (1) Classification and measurement; (2)
Amortized cost and impairment; and (3) Hedging. As each phase is completed, the IASB will delete the relevant
portions of IAS 39 and create an IFRS that will eventually replace IAS 39.
A key difference between the two standards is the treatment of transaction costs on instruments not classified
and measured at fair value. Transaction costs are defined in IAS 39 as incremental costs that are directly
attributable to the acquisition, issue or disposal of a financial asset or liability. Under Canadian GAAP, we elected
to expense these costs as incurred. Under IFRS, these costs are to be added to the initial measurement and
recognition of the instrument. From an initial review of our instruments, it is estimated that the impact on
transition date would be an increase to retained earnings, with the offset to long-term debt. This amount would
then be recognized as a deduction to net earnings over the remaining terms of the long-term debt using the
effective interest method.
(e) Income taxes: IAS 12, Income Taxes, prescribes that an entity account for the tax consequences of transactions
and other events in the same way that it accounts for the transactions and other events themselves. Therefore,
where transactions and other events are recognized in earnings, the recognition of deferred tax assets or
liabilities which arise from those transactions should also be recorded in earnings. For transactions that are
recognized outside of the statement of earnings, either in other comprehensive income or directly in equity, any
related tax effects should also be recognized outside the statement of earnings.
The most significant impact of IAS 12 on WestJet will be derived directly from the accounting policy decisions
made under other standards.
(f) Share-based payments: Under IFRS 2, Share-Based Payments, awards will continue to be measured at fair
value, with compensation expense under our plans recognized over the service period. For our equity-settled
plans, we will continue to recognize a corresponding increase in equity, and for our cash-settled plans, we will
recognize a corresponding increase in the liability. Unlike Canadian GAAP, the service period under IFRS may
commence prior to the date of grant and end on the vesting date. This represents a difference in timing and
WestJet Second Quarter 2010│31

ultimately does not impact the overall expense. It is estimated that the impact on transition would be a decrease
to retained earnings, with the offset to an equity reserve.
DISCLOSURE CONTROLS AND PROCEDURES AND INTERNAL CONTROLS OVER FINANCIAL REPORTING
Disclosure controls and procedures
Disclosure controls and procedures (DC&P) are designed to provide reasonable assurance that all relevant
information is gathered and reported to management, including the CEO and the Chief Financial Officer (CFO), on a
timely basis so that appropriate decisions can be made regarding public disclosure.
An evaluation of the design of our DC&P was conducted, as at June 30, 2010, by management under the supervision
of the CEO and the CFO. Based on this evaluation, the CEO and the CFO have concluded that, as at June 30, 2010,
our DC&P, as defined by the CSA in National Instrument 52-109, Certification of Disclosure in Issuers’ Annual and
Interim Filings, are designed to provide reasonable assurance that information required to be disclosed in reports
that we file or submit under Canadian securities legislation is recorded, processed, summarized and reported within
the time periods specified therein.
Internal controls over financial reporting
ICFR is designed to provide reasonable assurance regarding the reliability of financial reporting and the preparation
of financial statements in accordance with Canadian GAAP. Management is responsible for establishing and
maintaining adequate ICFR.
Our ICFR includes policies and procedures that pertain to the maintenance of records that provide reasonable
assurance that transactions are recorded as necessary to permit preparation of the financial statements in
accordance with Canadian GAAP, and that receipts and expenditures are being made only in accordance with
authorizations of management and directors; pertain to the maintenance of records that in reasonable detail
accurately and fairly reflect our transactions and dispositions of our assets; and are designed to provide reasonable
assurance regarding prevention or timely detection of unauthorized acquisition, use or disposition of our assets that
could have a material effect on our annual and interim consolidated financial statements.
Because of its inherent limitations, ICFR can provide only reasonable assurance and may not prevent or detect
misstatements. Furthermore, projections of an evaluation of effectiveness to future periods are subject to the risk
that controls may become inadequate because of changes in conditions, or that the degree of compliance with the
policies and procedures may deteriorate.
Management, under the supervision of the CEO and the CFO, has evaluated the design of our ICFR using the
framework and criteria established in Internal Controls – Integrated Framework, issued by the Committee of
Sponsoring Organizations of the Treadway Commission (COSO). Based on this evaluation, management has
concluded that as at June 30, 2010, ICFR were designed to provide reasonable assurance regarding the reliability of
WestJet Second Quarter 2010│32

financial reporting and its preparation of financial statements for external purposes in accordance with Canadian
GAAP. There were no changes in our ICFR during the quarter ended June 30, 2010, that have materially affected, or
are reasonably likely to affect, our ICFR.
OUTLOOK
We are encouraged by what we have seen in the second quarter of 2010, and we remain cautiously optimistic about
the second half of 2010. Although we expect to see continued pressure on yield, we anticipate third quarter RASM to
be positive on a year-over-year basis.
We recently took delivery of an additional leased aircraft at the end of July, and our next aircraft delivery is not
scheduled until the fourth quarter of 2010. Thus, we expect to end the year with 91 aircraft. As previously discussed,
we are deferring the delivery of one aircraft from 2011 and two from 2012, out to 2017. We will now be taking
delivery of six aircraft in 2011 and five aircraft in 2012. As we look to the second half of 2010, we believe that the
Canadian economy needs to rebound further before it can support more new domestic capacity growth. As such, we
have reduced our domestic capacity during the second quarter and directed new capacity into our southern markets.
We plan to deploy most of the new capacity outside of Canada in the third quarter as well in order to better match
demand with supply. Accordingly, we expect our third quarter capacity to increase between 11 and 12 per cent from
the third quarter of 2009. Our full-year capacity is expected to increase between nine and 10 per cent over 2009.
We expect fuel costs for the third quarter of 2010, excluding hedging, to range between $0.70 and $0.72 per litre.
The settlements of our hedging contracts are anticipated to add up to $0.01 per litre to our cost of fuel. For the third
quarter of 2010, we anticipate an increase of one to three per cent, year over year, in CASM excluding fuel and
employee profit share.
For 2010, we anticipate total capital expenditures of $50 to $60 million, with the majority of the spending related to
aircraft deposits and rotables. This has been revised from our previously-disclosed estimate based on an updated
forecast.
We believe that our enviable balance sheet and healthy underlying fundamentals will help us control costs and
remain profitable during the lingering uncertainty present in the airline industry. Our WestJet brand remains strong
as we continue focusing on gaining market share by capitalizing on our lower-cost structure, maintaining a solid
financial position and delivering high-value service to our guests. We remain confident about the future success and
profitability of our airline, driven by the commitment of each and every WestJetter.
WestJet Second Quarter 2010│33
NON-GAAP MEASURES
To supplement our consolidated financial statements presented in accordance with Canadian GAAP, we use various
non-GAAP performance measures as discussed below. These measures are provided to enhance the reader’s overall
understanding of our current financial performance and are included to provide investors and management with an
alternative method for assessing our operating results in a manner that is focused on the performance of our
ongoing operations and to provide a more consistent basis for comparison between quarters. These measures are
not in accordance with, or an alternative to, Canadian GAAP and do not have standardized meanings. Therefore, they
are not likely to be comparable to similar measures presented by other entities.
The following non-GAAP measures are used to monitor our financial performance:
Adjusted debt: The sum of long-term debt, obligations under capital leases and off-balance-sheet aircraft operating
leases. Our practice, consistent with common industry practice, is to multiply the trailing twelve months of aircraft
leasing expense by 7.5 to derive a present value debt equivalent. This measure is used in the calculation of adjusted
debt-to-equity and adjusted net debt to EBITDAR, as defined below.
Adjusted equity: The sum of share capital, contributed surplus and retained earnings, excluding accumulated other
comprehensive loss (AOCL). This measure is used in the calculation of adjusted debt-to-equity.
Adjusted net debt: Adjusted debt less cash and cash equivalents. This measure is used in the calculation of adjusted
net debt to EBITDAR, as defined below.
EBITDAR: Earnings before interest, taxes, depreciation, aircraft rent and other items, such as asset impairments,
gains and losses on derivatives and foreign exchange gains or losses. EBITDAR is a non-GAAP measure commonly
used in the airline industry to evaluate results by excluding differences in the method in which an airline finances its
aircraft.
Net earnings and diluted earnings per share excluding special items: We believe excluding special items is useful for
investors to evaluate our recurring operational performance.
CASM excluding fuel and employee profit share: We exclude the effects of aircraft fuel expense and employee profit
share expense to assess the operating performance of our business. Fuel expense is excluded from our operating
results due to the fact that fuel prices are impacted by a host of factors outside our control, such as significant
weather events, geopolitical tensions, refinery capacity, and global demand and supply. Excluding this expense allows
us to analyze our operating results on a comparable basis. Employee profit share expense is excluded from our
operating results due to its variable nature and excluding this expense allows greater comparability.
WestJet Second Quarter 2010│34

Aircraft fuel expense excluding hedging: As presented in the non-GAAP measures to GAAP reconciliation on page 14
of this MD&A under the heading Results of Operations – Aircraft Fuel, we believe it is useful to reflect aircraft fuel
expense excluding hedging, which excludes the effective portion of realized losses on fuel derivatives and
ineffectiveness. Since fuel expense is highly volatile, we believe presenting the cost of fuel, both including and
excluding the effects of hedging, is useful to a reader. This reconciliation table has not been repeated in this section.
Reconciliation of non-GAAP measures to GAAP
($ in thousands, except ratio amounts) June 30, 2010 December 31, 2009 Change
Adjusted debt-to-equity: Long-term debt (i) $ 1,134,691 $ 1,219,777 (85,086)$ Obligations under capital leases (ii) 3,684 4,102 (418) Off-balance-sheet aircraft leases (iii) 906,435 779,655 126,780 Adjusted debt $ 2,044,810 $ 2,003,534 $ 41,276 Total shareholders ’ equity 1,439,216 1,388,928 50,288 Add: AOCL 9,344 14,852 (5,508)Adjusted equity $ 1,448,560 $ 1,403,780 $ 44,780 Adjusted debt-to-equity 1.41 1.43 (1.4%)
Adjusted net debt to EBITDAR (iv): Net earnings $ 86,422 $ 98,178 $ (11,756)Add: Net interest (v) 57,773 62,105 (4,332) Taxes 40,148 38,618 1,530 Depreciation and amortization 139,095 141,303 (2,208) Aircraft leasing 120,858 103,954 16,904 Other (vi) 7,202 10,478 (3,276)EBITDAR $ 451,498 $ 454,636 $ (3,138)Adjusted debt (as above) 2,044,810 2,003,534 41,276 Less: Cash and cash equivalents (1,108,163) (1,005,181) (102,982)Adjusted net debt $ 936,647 $ 998,353 $ (61,706)Adjusted net debt to EBITDAR 2.07 2.20 (5.9%)
(i) As at June 30, 2010, long-term debt includes the current portion of $179,759 (December 31, 2009 – $171,223) and long-term portion of $954,932(December 31, 2009 – $1,048,554).
(ii) As at June 30, 2010, obligations under capital leases includes the current portion of $398 (December 31, 2009 – $744) and long-term portion of $3,286 (December 31, 2009 – $3,358).
(iii) As at June 30, 2010, the trailing twelve months of aircraft leasing costs totalled $120,858 (December 31, 2009 – $103,954). (iv) The trailing twelve months are used in the calculation of EBITDAR. (v) As at June 30, 2010, net interest includes the trailing twelve months of interest income of $6,291 (December 31, 2009 – $5,601) and the trailing
twelve months of interest expense of $64,064 (December 31, 2009 – $67,706). (vi) As at June 30, 2010, other includes the trailing twelve months foreign exchange loss of $5,764 (December 31, 2009 – $12,306) and the trailing twelve
months non-operating loss on derivatives of $1,438 (December 31, 2009 – gain of $1,828).
WestJet Second Quarter 2010│35

Reconciliation of non-GAAP measures to GAAP (cont’d)
($ in thousands, except per unit data) 2010 2009 2010 2009
Net earnings and diluted earnings per shareNet earnings – GAAP 21,029$ 9,153$ 34,829$ 46,585$ Adjusted for: CEO departure (net of tax) - - 3,700 - Income tax rate reductions and estimate change 2,372 - 2,372 (2,273) Net earnings excluding special items 23,401$ 9,153$ 40,901$ 44,312$
Diluted weighted average number of shares outstanding 145,341,526 127,969,182 145,237,594 128,129,540 Diluted earnings per share excluding special items 0.16$ 0.07$ 0.28$ 0.35$
CASM excluding fuel and employee profit shareOperating expenses – GAAP 571,950$ 494,348$ 1,153,351$ 1,012,972$ Adjusted for: Aircraft fuel expense (164,450) (128,677) (324,504) (271,068) Employee profit share expense (3,898) (1,185) (6,213) (6,902) Operating expenses excluding above items 403,602$ 364,486$ 822,634$ 735,002$ ASMs (in thousands) 4,783,650 4,314,870 9,483,169 8,671,675
CASM excluding fuel and employee profit share (cents) 8.44 8.45 8.67 8.48
Three months ended June 30 Six months ended June 30
WestJet Second Quarter 2010│36

Consolidated Financial Statements and Notes
For the three and six months ended June 30, 2010 and 2009

WestJet Second Quarter 2010 │ 1
Consolidated Statement of Earnings (Stated in thousands of Canadian dollars, except per share amounts) (Unaudited)
Three months ended June 30 Six months ended June 30
2010 2009 2010 2009 Revenues: Guest revenues $ 562,791 $ 485,248 $ 1,127,194 $ 982,343
Other revenues 49,326 45,915 104,688 128,105 612,117 531,163 1,231,882 1,110,448 Expenses:
Aircraft fuel 164,450 128,677 324,504 271,068 Airport operations 92,799 82,644 193,902 176,301 Flight operations and navigational charges 82,403 75,415 161,139 147,122 Sales and distribution 57,340 39,308 123,791 80,222 Marketing, general and administration 48,338 48,757 98,416 101,623 Aircraft leasing 35,113 27,106 69,086 52,182 Depreciation and amortization 33,308 34,502 66,187 68,395 Inflight 31,404 30,299 61,734 59,183 Maintenance 22,897 26,455 48,379 49,974 Employee profit share 3,898 1,185 6,213 6,902
571,950 494,348 1,153,351 1,012,972 Earnings from operations 40,167 36,815 78,531 97,476 Non-operating income (expense):
Interest income 2,065 964 3,772 3,082 Interest expense (15,279) (17,126) (30,969) (34,611) Gain (loss) on foreign exchange 5,950 (9,033) 2,130 (4,412) Gain (loss) on disposal of property and equipment 542 (607) 398 (713) Gain (loss) on derivatives (note 11) (558) 2,706 74 3,340
(7,280) (23,096) (24,595) (33,314)
Earnings before income taxes 32,887 13,719 53,936 64,162 Income tax expense:
Current 370 686 732 1,392 Future 11,488 3,880 18,375 16,185
11,858 4,566 19,107 17,577 Net earnings $ 21,029 $ 9,153 $ 34,829 $ 46,585
Earnings per share: (note 8) Basic $ 0.14 $ 0.07 $ 0.24 $ 0.36 Diluted $ 0.14 $ 0.07 $ 0.24 $ 0.36
The accompanying notes are an integral part of the consolidated financial statements.

WestJet Second Quarter 2010 │ 2
Consolidated Balance Sheet (Stated in thousands of Canadian dollars) (Unaudited)
June 30, 2010
December 31, 2009
Assets Current assets:
Cash and cash equivalents (note 4) $ 1,108,163 $ 1,005,181 Accounts receivable 29,987 27,654 Prepaid expenses, deposits and other 40,959 56,239 Inventory 15,402 26,048 Future income tax 1,171 2,560
1,195,682 1,117,682 Property and equipment (note 5) 2,262,161 2,307,566 Intangible assets (note 6) 13,622 14,087 Other assets 60,505 54,367 $ 3,531,970 $ 3,493,702 Liabilities and shareholders’ equity Current liabilities:
Accounts payable and accrued liabilities $ 267,128 $ 231,401 Advance ticket sales 325,675 286,361 Non-refundable guest credits 44,517 64,506 Current portion of long-term debt (note 7) 179,759 171,223 Current portion of obligations under capital leases 398 744
817,477 754,235 Long-term debt (note 7) 954,932 1,048,554 Obligations under capital leases 3,286 3,358 Other liabilities 19,306 19,628 Future income tax 297,753 278,999 2,092,754 2,104,774 Shareholders’ equity:
Share capital (note 8) 658,120 633,075 Contributed surplus 56,409 71,503 Accumulated other comprehensive loss (note 12) (9,344) (14,852) Retained earnings 734,031 699,202
1,439,216 1,388,928 Commitments and contingencies (note 10) $ 3,531,970 $ 3,493,702
The accompanying notes are an integral part of the consolidated financial statements.

WestJet Second Quarter 2010 │ 3
Consolidated Statement of Shareholders’ Equity (Stated in thousands of Canadian dollars) (Unaudited)
Three months ended June 30 Six months ended June 30
2010 2009 2010 2009 Share capital: (note 8)
Balance, beginning of period $ 649,024 $ 453,638 $ 633,075 $ 452,885 Transfer of stock-based compensation expense 8,576 224 24,525 977 Issuance of shares pursuant to stock option plans 520 – 520 –
658,120 453,862 658,120 453,862 Contributed surplus: (note 8)
Balance, beginning of period 60,839 62,075 71,503 60,193 Stock-based compensation expense 4,146 3,149 9,431 5,784 Transfer of stock-based compensation expense (8,576) (224) (24,525) (977)
56,409 65,000 56,409 65,000 Accumulated other comprehensive loss: (note 12)
Balance, beginning of period (14,279) (31,060) (14,852) (38,112) Other comprehensive income 4,935 12,526 5,508 19,578
(9,344) (18,534) (9,344) (18,534) Retained earnings:
Balance, beginning of period 713,002 648,603 699,202 611,171 Change in accounting policy – (10,147) – (10,147) Net earnings 21,029 9,153 34,829 46,585
734,031 647,609 734,031 647,609 Total accumulated other comprehensive loss and retained
earnings 724,687 629,075
724,687 629,075
Total shareholders’ equity $ 1,439,216 $ 1,147,937 $ 1,439,216 $ 1,147,937
The accompanying notes are an integral part of the consolidated financial statements.

WestJet Second Quarter 2010 │ 4
Consolidated Statement of Comprehensive Income (Stated in thousands of Canadian dollars) (Unaudited)
Three months ended June 30 Six months ended June 30
2010 2009 2010 2009
Net earnings $ 21,029 $ 9,153 $ 34,829 $ 46,585
Other comprehensive income:
Amortization of hedge settlements to aircraft leasing 350 350 699 700 Net unrealized gain (loss) on foreign exchange
derivatives under cash flow hedge accounting (i) 3,873 (1,066) 2,183 (156) Reclassification of net realized (gain) loss on foreign
exchange derivatives to net earnings (ii) 818 (1,601) 1,101 (3,977) Net unrealized gain (loss) on fuel derivatives under cash
flow hedge accounting (iii) (1,893) 9,866 (1,849) 9,583 Reclassification of net realized loss on fuel derivatives to
net earnings (iv) 1,787 4,977 3,374 13,428 4,935 12,526 5,508 19,578 Total comprehensive income $ 25,964 $ 21,679 $ 40,337 $ 66,163
(i) Net of income taxes of $(1,413) and $(780) (2009 – $447 and $164). (ii) Net of income taxes of $(308) and $(414) (2009 – $669 and $1,576). (iii) Net of income taxes of $713 and $696 (2009 – $(4,050) and $(4,018)). (iv) Net of income taxes of $(673) and $(1,270) (2009 – $(2,083) and $(5,606)).
The accompanying notes are an integral part of the consolidated financial statements.

WestJet Second Quarter 2010 │ 5
Consolidated Statement of Cash Flows (Stated in thousands of Canadian dollars) (Unaudited)
Three months ended June 30 Six months ended June 30
2010 2009 2010 2009 Operating activities: Net earnings $ 21,029 $ 9,153 $ 34,829 $ 46,585 Items not involving cash:
Depreciation and amortization 33,308 34,502 66,187 68,395 Amortization of other liabilities (493) (654) (984) (889) Amortization of hedge settlements 350 350 699 700 (Gain) loss on derivatives 558 (2,328) (74) (3,226) (Gain) loss on disposal of property and equipment (537) 867 (377) 1,072 Stock-based compensation expense 4,146 3,149 9,431 5,784 Income tax credit 149 – (1,667) (1,952) Future income tax expense 11,488 3,880 18,375 16,185 Unrealized foreign exchange (gain) loss (4,933) 8,577 (667) (864) Change in non-cash working capital 19,699 (31,745) 84,254 (10,513)
84,764 25,751 210,006 121,277 Financing activities:
Repayment of long-term debt (42,706) (41,493) (85,503) (83,083) Decrease in obligations under capital leases (299) (98) (418) (195) Issuance of common shares 520 – 520 – Change in other assets (17) 700 (4,488) – Change in non-cash working capital (1,587) (1,849) 942 (1,019)
(44,089) (42,740) (88,947) (84,297) Investing activities:
Aircraft additions (9,994) (57,202) (14,789) (84,196) Other property and equipment and intangible additions (2,499) (18,408) (5,247) (36,456)
(12,493) (75,610) (20,036) (120,652) Cash flow from operating, financing and investing
activities 28,182 (92,599) 101,023 (83,672) Effect of foreign exchange on cash and cash equivalents 3,342 (3,561) 1,959 3,089 Net change in cash and cash equivalents 31,524 (96,160) 102,982 (80,583) Cash and cash equivalents, beginning of period 1,076,639 835,791 1,005,181 820,214 Cash and cash equivalents, end of period $ 1,108,163 $ 739,631 $ 1,108,163 $ 739,631 Cash interest paid $ 15,445 $ 17,200 $ 31,683 $ 35,206 Cash taxes paid $ 932 $ 845 $ 1,655 $ 2,085
The accompanying notes are an integral part of the consolidated financial statements.

Notes to Consolidated Financial Statements For the three and six months ended June 30, 2010 and 2009 (Stated in thousands of Canadian dollars, except share and per share data) (Unaudited)
WestJet Second Quarter 2010 │ 6
1. Basis of presentation
The interim consolidated financial statements of WestJet Airlines Ltd. (the Corporation) have been prepared by management in accordance with Canadian generally accepted accounting principles (GAAP). The interim consolidated financial statements have been prepared following the same accounting policies and methods of computation as the consolidated financial statements for the year ended December 31, 2009, except as described below. The disclosures provided below are incremental to those included with the annual consolidated financial statements. The interim consolidated financial statements should be read in conjunction with the consolidated financial statements and the notes thereto in the Corporation’s Annual Report for the year ended December 31, 2009.
The Corporation’s business is seasonal in nature with varying levels of activity throughout the year. The Corporation experiences increased domestic travel in the summer months and more demand for transborder and sun destinations over the winter period.
Amounts presented in the Corporation’s interim consolidated financial statements and the notes thereto are in Canadian dollars unless otherwise stated.
Certain prior-period balances have been reclassified to conform to current period’s presentation.
2. Recent accounting pronouncements and changes
(a) International financial reporting standards (IFRS)
On February 13, 2008, the Accounting Standards Board (AcSB) confirmed that the changeover to IFRS from Canadian GAAP will be required for publicly accountable enterprises for interim and annual financial statements, effective for fiscal years beginning on or after January 1, 2011, including comparatives for 2010. The objective is to improve financial reporting by having a single set of accounting standards that are comparable with other entities on an international basis. The transition from current Canadian GAAP to IFRS is a significant undertaking that will materially affect the Corporation’s reported financial position and results of operations. The Corporation continues to monitor standards developments as issued by the International Accounting Standards Board and the AcSB, as well as regulatory developments as issued by the Canadian Securities Administrators which may affect the timing, nature or disclosure of its adoption of IFRS.
(b) Frequent guest program (FGP)
During the six months ended June 30, 2010, the Corporation implemented a frequent guest program which allows guests to accumulate credits that entitle them to a choice of various rewards, primarily discounted travel. Revenue received in relation to credits issued is deferred as a liability at fair value until a reward is ultimately utilized at which time it is recognized in guest revenue. Fair value is management’s estimate of the expected awards for which the credit will be redeemed and is reduced by the proportion of credits that have been redeemed relative to the total number expected to be redeemed.
The Corporation also launched a co-branded MasterCard with the Royal Bank of Canada (RBC). RBC issues FGP credits to cardholders as a percentage of their total retail spend. The fair value of these credits is deferred and recognized on redemption as described above. Ancillary revenue from the issuance of FGP credits on the credit card is measured as the difference between the cash received and the fair value of the credit and is recognized in other revenue on their issuance. Revenue related to new cards issued is recognized immediately upon activation.

Notes to Consolidated Financial Statements For the three and six months ended June 30, 2010 and 2009 (Stated in thousands of Canadian dollars, except share and per share data) (Unaudited)
WestJet Second Quarter 2010 │ 7
3. Capital management
The Corporation’s policy is to maintain a strong capital base so as to maintain investor, creditor and market confidence and to sustain the future development of the airline. The Corporation manages its capital structure and makes adjustments to it in light of changes in economic conditions and the risk characteristics of the underlying assets.
In order to maintain or adjust the capital structure, the Corporation may from time to time purchase shares for cancellation pursuant to normal course issuer bids, issue new shares and adjust current and projected debt levels.
In the management of capital, the Corporation includes shareholders’ equity (excluding accumulated other comprehensive loss (AOCL)), long-term debt, capital leases, cash and cash equivalents and the Corporation’s off-balance-sheet obligations related to its aircraft operating leases, all of which are presented in detail below.
The Corporation monitors capital on a number of bases, including adjusted debt-to-equity and adjusted net debt to earnings before interest, taxes, depreciation and aircraft rent (EBITDAR). EBITDAR is a non-GAAP financial measure commonly used in the airline industry to evaluate results by excluding differences in the method by which an airline finances its aircraft. In addition, the Corporation will adjust EBITDAR for one-time special items, for non-operating gains and losses on derivatives and for gains and losses on foreign exchange. The calculation of EBITDAR is a measure that does not have a standardized meaning prescribed under GAAP and is therefore not likely to be comparable to similar measures presented by other issuers. The Corporation adjusts debt to include its off-balance-sheet aircraft operating leases. Common industry practice is to multiply the trailing twelve months of aircraft leasing expense by 7.5 to derive a present-value debt equivalent. The Corporation defines adjusted net debt as adjusted debt less cash and cash equivalents. The Corporation defines equity as the sum of share capital, contributed surplus and retained earnings, and excludes AOCL.
June 30, 2010 December 31, 2009 Change Adjusted debt-to-equity
Long-term debt (i) $ 1,134,691 $ 1,219,777 $ (85,086) Obligations under capital leases (ii) 3,684 4,102 (418) Off-balance-sheet aircraft leases (iii) 906,435 779,655 126,780
Adjusted debt $ 2,044,810 $ 2,003,534 $ 41,276 Total shareholders’ equity 1,439,216 1,388,928 50,288 Add: AOCL 9,344 14,852 (5,508)
Adjusted equity $ 1,448,560 $ 1,403,780 $ 44,780 Adjusted debt-to-equity 1.41 1.43 (1.4%) Adjusted net debt to EBITDAR (iv) Net earnings $ 86,422 $ 98,178 $ (11,756) Add:
Net interest (v) 57,773 62,105 (4,332) Income taxes 40,148 38,618 1,530 Depreciation and amortization 139,095 141,303 (2,208) Aircraft leasing 120,858 103,954 16,904 Other (vi) 7,202 10,478 (3,276)
EBITDAR $ 451,498 $ 454,636 $ (3,138) Adjusted debt (as above) 2,044,810 2,003,534 41,276 Less: Cash and cash equivalents (1,108,163) (1,005,181) (102,982) Adjusted net debt $ 936,647 $ 998,353 $ (61,706) Adjusted net debt to EBITDAR 2.07 2.20 (5.9%)
(i) As at June 30, 2010, long-term debt includes the current portion of $179,759 (December 31, 2009 – $171,223) and long-term portion of $954,932 (December 31, 2009 – $1,048,554).
(ii) As at June 30, 2010, obligations under capital leases includes the current portion of $398 (December 31, 2009 – $744) and long-term portion of $3,286 (December 31, 2009 – $3,358).
(iii) As at June 30, 2010, the trailing twelve months of aircraft leasing costs totalled $120,858 (December 31, 2009 – $103,954). (iv) The trailing twelve months are used in the calculation of EBITDAR. (v) As at June 30, 2010, net interest includes the trailing twelve months of interest income of $6,291 (December 31, 2009 – $5,601) and the trailing
twelve months of interest expense of $64,064 (December 31, 2009 – $67,706). (vi) As at June 30, 2010, other includes the trailing twelve months foreign exchange loss of $5,764 (December 31, 2009 – $12,306) and the trailing twelve
months non-operating loss on derivatives of $1,438 (December 31, 2009 – gain of $1,828).

Notes to Consolidated Financial Statements For the three and six months ended June 30, 2010 and 2009 (Stated in thousands of Canadian dollars, except share and per share data) (Unaudited)
WestJet Second Quarter 2010 │ 8
3. Capital management (continued)
As at June 30, 2010 and December 31, 2009, the Corporation’s internal targets were an adjusted debt-to-equity measure of no more than 3.00 and an adjusted net debt to EBITDAR of no more than 3.00. As at June 30, 2010, the Corporation’s adjusted debt-to-equity ratio improved by 1.4% when compared to December 31, 2009, mainly attributable to the increase in adjusted shareholders’ equity proportionately offsetting the increase in the Corporation’s off-balance-sheet aircraft lease financing. As at June 30, 2010, the Corporation’s adjusted net debt to EBITDAR improved by 5.9% when compared to December 31, 2009, mainly attributable to the increase in cash and cash equivalents more than offsetting the slight decrease in EBITDAR.
4. Cash and cash equivalents
As at June 30, 2010, cash and cash equivalents includes bank balances of $249,130 (December 31, 2009 – $191,966) and short-term investments of $859,033 (December 31, 2009 – $813,215). Included in these balances, as at June 30, 2010, the Corporation had US-dollar cash and cash equivalents totalling US $68,883 (December 31, 2009 – US $32,858).
5. Property and equipment
June 30, 2010 Cost Accumulated depreciation Net book value
Aircraft $ 2,465,820 $ 567,921 $ 1,897,899 Ground property and equipment 117,824 55,588 62,236 Spare engines and parts 102,116 26,292 75,824 Buildings 135,699 11,438 124,261 Leasehold improvements 10,044 3,109 6,935 Assets under capital leases 5,882 2,496 3,386 2,837,385 666,844 2,170,541 Deposits on aircraft 91,620 – 91,620
$ 2,929,005 $ 666,844 $ 2,262,161
December 31, 2009 Cost Accumulated depreciation Net book value
Aircraft $ 2,456,988 $ 513,521 $ 1,943,467 Ground property and equipment 120,031 52,804 67,227 Spare engines and parts 100,567 24,360 76,207 Buildings 136,228 9,843 126,385 Leasehold improvements 9,910 2,877 7,033 Assets under capital leases 5,882 2,210 3,672 2,829,606 605,615 2,223,991 Deposits on aircraft 83,489 – 83,489 Assets under development 86 – 86
$ 2,913,181 $ 605,615 $ 2,307,566
6. Intangible assets
Cost Accumulated amortization Net book value
June 30, 2010 Software $ 42,340 $ 28,718 $ 13,622
December 31, 2009
Software $ 40,392 $ 26,305 $ 14,087
All of the Corporation’s intangible assets relate to purchased software. During the three and six months ended June 30, 2010, the Corporation began amortization on $178 and $4,363, respectively, (three and six months ended June 30, 2009 – $91 and $171, respectively) for new systems that were previously not being amortized. Included in the total for software at June 30, 2010 is $1,334 (December 31, 2009 – $5,403) that is being developed and is not yet being amortized. For the three and six months ended June 30, 2010, the Corporation recognized $1,239 and $2,375, respectively, (three and six months ended June 30, 2009 – $1,392 and $2,822, respectively) of amortization expense.

Notes to Consolidated Financial Statements For the three and six months ended June 30, 2010 and 2009 (Stated in thousands of Canadian dollars, except share and per share data) (Unaudited)
WestJet Second Quarter 2010 │ 9
7. Long-term debt
June 30, 2010 December 31, 2009Term loans – purchased aircraft (i) $ 1,087,030 $ 1,168,381 Term loan – purchased aircraft (ii) 30,984 33,631 Term loan – flight simulator (iii) 6,019 6,392 Term loans – live satellite television equipment (iv) 246 493 Term loan – Calgary Hangar facility (v) 8,953 9,202 Term loan – Calgary Hangar facility (vi) 1,459 1,678 1,134,691 1,219,777 Current portion 179,759 171,223 $ 954,932 $ 1,048,554
(i) 52 individual term loans, amortized on a straight-line basis over a 12-year term, each repayable in quarterly principal instalments ranging from $668 to $955, including fixed interest at a weighted average rate of 5.30%, maturing between 2014 and 2020. These facilities are guaranteed by Ex-Im Bank and secured by one 800-series aircraft, 38 700-series aircraft and 13 600-series aircraft.
(ii) Term loan of US $29,103 repayable in quarterly instalments of US $1,788, including fixed interest at a rate of 4.315%, maturing in 2014. This facility is secured by one 800-series aircraft.
(iii) Term loan repayable in monthly instalments of $91, including floating interest at the bank’s prime rate plus 0.875%, with an effective interest rate of 3.375% as at June 30, 2010, maturing in 2011, secured by one flight simulator.
(iv) Three individual term loans, amortized over a five-year term, repayable in quarterly principal instalments of $41, including floating interest at the Canadian LIBOR rate plus 0.08%, with a weighted average effective interest rate of 0.56% as at June 30, 2010, maturing in 2010 and 2011. These facilities are for the purchase of live satellite television equipment, are guaranteed by the Ex-Im Bank and are secured by certain 700-series and 600-series aircraft.
(v) Term loan repayable in monthly instalments of $108, including fixed interest at 9.03%, maturing April 2011, secured by the Calgary Hangar facility.
(vi) Term loan repayable in monthly instalments of $50, including floating interest at the bank’s prime rate plus 0.50%, with an effective interest rate of 3.00% as at June 30, 2010, maturing April 2013, secured by the Calgary Hangar facility.
The net book value of the property and equipment pledged as collateral for the Corporation’s secured borrowings was $1,869,978 as at June 30, 2010 (December 31, 2009 – $1,925,672).
Future scheduled repayments of long-term debt are as follows:
2010 $ 85,694 2011 184,100 2012 170,090 2013 169,825 2014 170,113 2015 and thereafter 354,869 $ 1,134,691

Notes to Consolidated Financial Statements For the three and six months ended June 30, 2010 and 2009 (Stated in thousands of Canadian dollars, except share and per share data) (Unaudited)
WestJet Second Quarter 2010 │ 10
8. Share capital
(a) Issued and outstanding
Three months ended Six months ended June 30, 2010 June 30, 2010
Number Amount Number Amount Common and variable voting shares: Balance, beginning of period 144,871,072 $ 649,024 144,359,383 $ 633,075 Issuance of shares pursuant to stock option
plan 227,567 520 739,256 520 Transfer of stock-based compensation for
stock options exercised – 5,815 – 21,764 Issuance of shares pursuant to key
employee and pilot plan 1,121 – 1,121 – Transfer of stock-based compensation for
key employee and pilot units settled – 14 – 14 Issuance of shares pursuant to executive
share unit plan 194,449 – 194,449 – Transfer of stock-based compensation for
executive share units exercised – 2,747 – 2,747 Balance, end of period 145,294,209 $ 658,120 145,294,209 $ 658,120
Three months ended Six months ended June 30, 2009 June 30, 2009
Number Amount Number Amount Common and variable voting shares: Balance, beginning of period 127,928,979 $ 453,638 127,913,580 $ 452,885 Issuance of shares pursuant to stock option
plans 6,027 – 21,426 – Transfer of stock-based compensation for
stock options exercised – 224 – 977 Balance, end of period 127,935,006 $ 453,862 127,935,006 $ 453,862
As at June 30, 2010, the number of common voting shares outstanding was 139,677,790 (June 30, 2009 – 124,346,363) and the number of variable voting shares outstanding was 5,616,419 (June 30, 2009 – 3,588,643).
(b) Per share amounts
The following table summarizes the shares used in calculating net earnings per share:
Three months ended June 30 Six months ended June 30 2010 2009 2010 2009 Weighted average number of shares
outstanding – basic 145,191,666 127,932,712 144,912,473 127,928,389 Effect of dilutive employee stock options and
share units 149,860 36,470 325,121 201,151 Weighted average number of shares
outstanding – diluted 145,341,526 127,969,182 145,237,594 128,129,540
For the three and six months ended June 30, 2010, 7,452,265 and 6,649,062 employee stock options, respectively, (three and six months ended June 30, 2009 – 11,922,227 and 9,231,874 employee stock options, respectively) were not included in the calculation of dilutive potential shares as the result would be anti-dilutive.
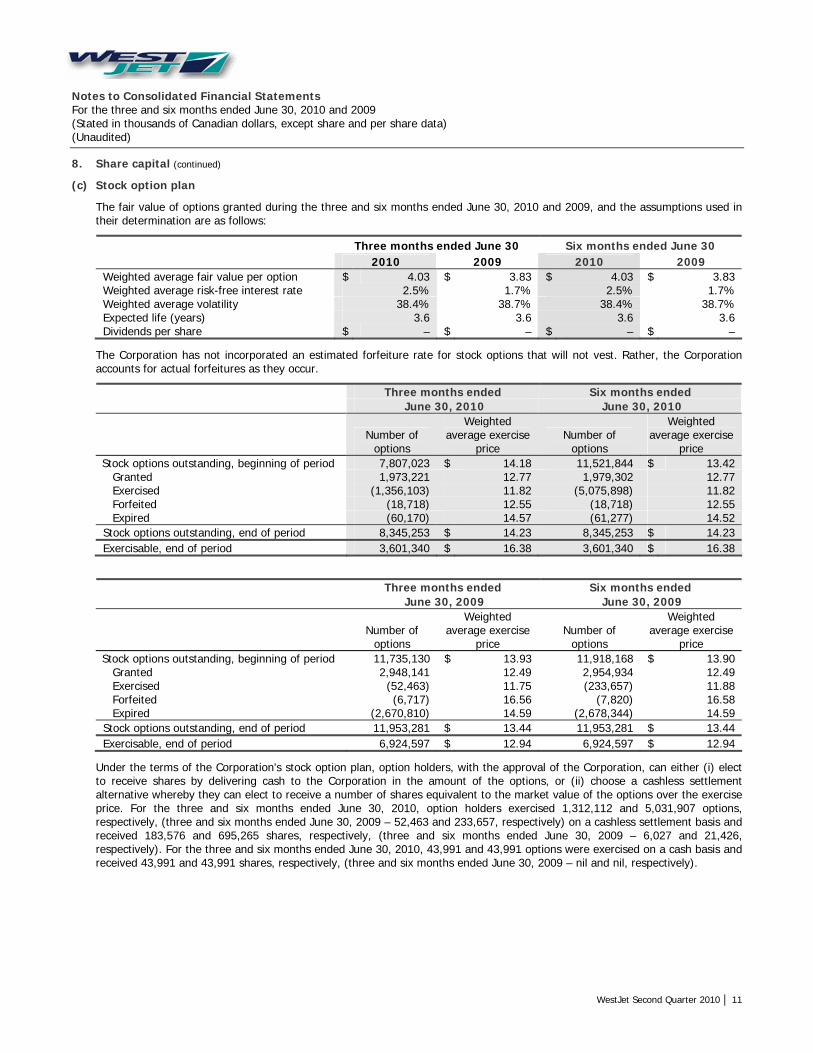
Notes to Consolidated Financial Statements For the three and six months ended June 30, 2010 and 2009 (Stated in thousands of Canadian dollars, except share and per share data) (Unaudited)
WestJet Second Quarter 2010 │ 11
8. Share capital (continued)
(c) Stock option plan
The fair value of options granted during the three and six months ended June 30, 2010 and 2009, and the assumptions used in their determination are as follows:
Three months ended June 30 Six months ended June 30 2010 2009 2010 2009 Weighted average fair value per option $ 4.03 $ 3.83 $ 4.03 $ 3.83 Weighted average risk-free interest rate 2.5% 1.7% 2.5% 1.7% Weighted average volatility 38.4% 38.7% 38.4% 38.7% Expected life (years) 3.6 3.6 3.6 3.6 Dividends per share $ – $ – $ – $ –
The Corporation has not incorporated an estimated forfeiture rate for stock options that will not vest. Rather, the Corporation accounts for actual forfeitures as they occur.
Three months ended Six months ended June 30, 2010 June 30, 2010
Number of
options
Weighted average exercise
price Number of
options
Weighted average exercise
price Stock options outstanding, beginning of period 7,807,023 $ 14.18 11,521,844 $ 13.42
Granted 1,973,221 12.77 1,979,302 12.77 Exercised (1,356,103) 11.82 (5,075,898) 11.82 Forfeited (18,718) 12.55 (18,718) 12.55 Expired (60,170) 14.57 (61,277) 14.52
Stock options outstanding, end of period 8,345,253 $ 14.23 8,345,253 $ 14.23 Exercisable, end of period 3,601,340 $ 16.38 3,601,340 $ 16.38
Three months ended Six months ended June 30, 2009 June 30, 2009
Number of
options
Weighted average exercise
price Number of
options
Weighted average exercise
price Stock options outstanding, beginning of period 11,735,130 $ 13.93 11,918,168 $ 13.90
Granted 2,948,141 12.49 2,954,934 12.49 Exercised (52,463) 11.75 (233,657) 11.88 Forfeited (6,717) 16.56 (7,820) 16.58 Expired (2,670,810) 14.59 (2,678,344) 14.59
Stock options outstanding, end of period 11,953,281 $ 13.44 11,953,281 $ 13.44 Exercisable, end of period 6,924,597 $ 12.94 6,924,597 $ 12.94
Under the terms of the Corporation's stock option plan, option holders, with the approval of the Corporation, can either (i) elect to receive shares by delivering cash to the Corporation in the amount of the options, or (ii) choose a cashless settlement alternative whereby they can elect to receive a number of shares equivalent to the market value of the options over the exercise price. For the three and six months ended June 30, 2010, option holders exercised 1,312,112 and 5,031,907 options, respectively, (three and six months ended June 30, 2009 – 52,463 and 233,657, respectively) on a cashless settlement basis and received 183,576 and 695,265 shares, respectively, (three and six months ended June 30, 2009 – 6,027 and 21,426, respectively). For the three and six months ended June 30, 2010, 43,991 and 43,991 options were exercised on a cash basis and received 43,991 and 43,991 shares, respectively, (three and six months ended June 30, 2009 – nil and nil, respectively).

Notes to Consolidated Financial Statements For the three and six months ended June 30, 2010 and 2009 (Stated in thousands of Canadian dollars, except share and per share data) (Unaudited)
WestJet Second Quarter 2010 │ 12
8. Share capital (continued)
(d) Key employee and pilot plan
During the three months ended June 30, 2010, shareholders of the Corporation approved a new stock-based compensation plan, the key employee and pilot (KEP) plan whereby restricted share units (RSUs) are issued to key employees and pilots of the Corporation. The fair market value of the RSUs at the time of grant is equal to the weighted average trading price of the Corporation’s voting shares for the five trading days immediately preceding the grant date. Each RSU entitles the employee to receive payment upon vesting in the form of voting shares of the Corporation. The RSUs time vest at the end of a two or three-year period, with compensation expense being recognized in net earnings on a straight-line basis over the vesting period. The Corporation has the option to settle the RSUs through the purchase of voting shares on the open market or to issue new shares from treasury up to a maximum of 1,000,000.
Three months ended Six months ended June 30, 2010 June 30, 2010
Number of RSUs
Weighted average grant date fair value
Number of RSUs
Weighted average grant date fair value
RSUs outstanding, beginning of period – $ – – $ – Granted 169,095 12.77 169,095 12.77 Settled (1,121) 12.77 (1,121) 12.77 Forfeited (1,658) 12.77 (1,658) 12.77
RSUs outstanding, end of period 166,316 $ 12.77 166,316 $ 12.77 Vested, end of period – $ – – $ –
(e) Executive share unit plan
The Corporation has an equity-based executive share unit (ESU) plan, whereby RSUs and performance share units (PSUs) may be issued to senior executive officers. Up to a maximum of 1,000,000 voting shares of the Corporation may be issued under the ESU plan.
Three months ended June 30, 2010 RSUs PSUs
Number of units
Weighted average grant date fair value
Number of units
Weighted average grant date fair value
Units outstanding, beginning of period 217,768 $ 14.06 290,350 $ 14.06 Granted 12,628 12.77 16,837 12.77 Exercised (83,336) 14.13 (111,113) 14.13
Units outstanding, end of period 147,060 $ 13.91 196,074 $ 13.91 Vested, end of period 17,211 $ 14.16 22,948 $ 14.16
Six months ended June 30, 2010 RSUs PSUs
Number of units
Weighted average grant date fair value
Number of units
Weighted average grant date fair value
Units outstanding, beginning of period 143,461 $ 14.10 191,276 $ 14.10 Granted 86,935 13.80 115,911 13.80 Exercised (83,336) 14.13 (111,113) 14.13
Units outstanding, end of period 147,060 $ 13.91 196,074 $ 13.91 Vested, end of period 17,211 $ 14.16 22,948 $ 14.16
During the three and six months ended June 30, 2009, the Corporation granted nil, and 102,757, respectively, RSUs at a weighted average fair market value of $11.35 per unit and granted nil and 137,005, respectively, PSUs at a weighted average fair market value of $11.35 per unit.

Notes to Consolidated Financial Statements For the three and six months ended June 30, 2010 and 2009 (Stated in thousands of Canadian dollars, except share and per share data) (Unaudited)
WestJet Second Quarter 2010 │ 13
8. Share capital (continued)
(f) Stock-based compensation expense
The following table summarizes stock-based compensation expense for the Corporation’s equity-based plans:
Three months ended June 30 Six months ended June 30 2010 2009 2010 2009 Stock option plan $ 3,437 $ 2,872 $ 5,971 $ 5,318 Key employee and pilot plan 509 – 509 – Executive share unit plan 200 277 2,951 466 Total stock-based compensation expense $ 4,146 $ 3,149 $ 9,431 $ 5,784 Presented on the consolidated statement of
earnings as follows:
Flight operations and navigational charges $ 2,867 $ 1,974 $ 4,504 $ 3,638 Marketing, general and administration 1,279 1,175 4,927 2,146 Total stock-based compensation expense $ 4,146 $ 3,149 $ 9,431 $ 5,784
9. Related-party transactions
The Corporation has debt financing and investments in short-term deposits with a financial institution that is related through two common directors, one of whom is also the president of the financial institution. As at June 30, 2010, total long-term debt includes an amount of $6,019 (December 31, 2009 – $6,392) due to the financial institution. See note 7, long-term debt, for further disclosure. Included in cash and cash equivalents, as at June 30, 2010, are short-term investments of $129,563 (December 31, 2009 – $143,332) owing from the financial institution. The Corporation has available a three-year revolving operating line of credit agreement with a banking syndicate, of which one of the members is the related-party financial institution. These transactions occurred in the normal course of operations on terms consistent with those offered to arm’s-length parties and are measured at the exchange amount.
10. Commitments and contingencies
(a) Purchased aircraft and live satellite television systems
As at June 30, 2010, the Corporation is committed to purchase 38 737-700 aircraft for delivery between 2011 and 2016. The remaining estimated amounts to be paid in deposits and purchase prices for the aircraft, as well as amounts to be paid for live satellite television systems on purchased and leased aircraft in US dollars and the Canadian-dollar equivalents are as follows:
USD CAD 2010 $ 15,143 $ 16,122 2011 109,528 116,606 2012 256,730 273,320 2013 271,896 289,467 2014 289,150 307,836 2015 and thereafter 710,762 756,693 $ 1,653,209 1,760,044
The Corporation has yet to pursue financing agreements for the remaining 38 purchased aircraft included in the above totals. The next purchased aircraft delivery is not expected until January 2011.

Notes to Consolidated Financial Statements For the three and six months ended June 30, 2010 and 2009 (Stated in thousands of Canadian dollars, except share and per share data) (Unaudited)
WestJet Second Quarter 2010 │ 14
10. Commitments and contingencies (continued)
(b) Operating leases and commitments
The Corporation has entered into operating leases and commitments for aircraft, land, buildings, equipment, computer hardware, software licences and satellite programming. As at June 30, 2010, the future payments in Canadian dollars, and when applicable the US-dollar equivalents, under operating leases and commitments are as follows:
USD CAD 2010 $ 82,825 $ 100,528 2011 180,639 206,669 2012 188,816 213,181 2013 189,206 210,708 2014 184,738 202,531 2015 and thereafter 505,657 586,685 $ 1,331,881 $ 1,520,302
As at June 30, 2010, the Corporation is committed to lease an additional five 737-700 aircraft and three 737-800 aircraft for terms ranging between eight and 10 years in US dollars. These aircraft have been included in the above totals.
(c) Letters of guarantee
The Corporation has available two revolving loan credit facilities totalling $38,000 (December 31, 2009 - $38,000) with a Canadian charter bank for letters of guarantee. A cumulative balance greater than $8,000 requires funds to be assigned and held as cash security. As at June 30, 2010, $7,899 (December 31, 2009 – $12,491) of letters of guarantee were issued under these facilities.
(d) Operating line of credit
The Corporation has available a revolving operating line of credit with a syndicate of three Canadian banks. The line of credit is available for up to a maximum of $80,750 (December 31, 2009 - $85,000) is secured by the Corporation’s Campus facility and expires in May 2012. The line of credit bears interest at prime plus 0.50% per annum, or a bankers acceptance rate at 2.0% annual stamping fee or equivalent, and is available for general corporate expenditures and working capital purposes. The Corporation is required to pay a standby fee of 15 basis points, based on the average unused portion of the line of credit for the previous quarter, payable quarterly. As at June 30, 2010, no amounts were drawn.
(e) Contingencies
The Corporation is party to legal proceedings and claims that arise during the ordinary course of business. It is the opinion of management that the ultimate outcome of these and any outstanding matters will not have a material effect upon the Corporation’s financial position, results of operations or cash flows.

Notes to Consolidated Financial Statements For the three and six months ended June 30, 2010 and 2009 (Stated in thousands of Canadian dollars, except share and per share data) (Unaudited)
WestJet Second Quarter 2010 │ 15
11. Financial instruments and risk management
(a) Fair value of financial assets and financial liabilities
The Corporation’s financial assets and liabilities consist primarily of cash and cash equivalents, accounts receivable, derivatives both designated and not designated in an effective hedging relationship, deposits, accounts payable and accrued liabilities, long-term debt and obligations under capital leases. The following tables set out the Corporation’s classification and the carrying amount, together with the fair value, for each type of its financial assets and liabilities as at June 30, 2010 and December 31, 2009:
Fair value Amortized cost Totals
June 30, 2010 Held-for- trading Derivatives
Loans and receivables
Other financial liabilities
Carrying amount
Fair value
Asset (liability) Cash and cash equivalents $ 1,108,163 $ – $ – $ – $ 1,108,163 $ 1,108,163Accounts receivable – – 29,987 – 29,987 29,987Foreign exchange derivatives (i) – 3,439 – – 3,439 3,439Fuel derivatives (ii) – (3,959) – – (3,959) (3,959)Deposits (iii) 27,476 – – – 27,476 27,476Accounts payable and accrued
liabilities (iv) – – – (261,500) (261,500) (261,500)Long-term debt (v) – – – (1,134,691) (1,134,691) (1,239,261)Obligations under capital leases (vi) – – – (3,684) (3,684) (3,684)
$ 1,135,639 $ (520) $ 29,987 $ (1,399,875) $ (234,769) $ (339,339)
Fair value Amortized cost Totals
December 31, 2009 Held-for- trading Derivatives
Loans and receivables
Other financial liabilities
Carrying amount
Fair value
Asset (liability) Cash and cash equivalents $ 1,005,181 $ – $ – $ – $ 1,005,181 $ 1,005,181Accounts receivable – – 27,654 – 27,654 27,654Foreign exchange derivatives (i) – (1,249) – – (1,249) (1,249)Fuel derivatives (ii) – (8,667) – – (8,667) (8,667)Deposits (iii) 27,264 – – – 27,264 27,264Accounts payable and accrued
liabilities (iv) – – – (221,208) (221,208) (221,208)Long-term debt (v) – – – (1,219,777) (1,219,777) (1,323,120)Obligations under capital leases (vi) – – – (4,102) (4,102) (4,102)
$ 1,032,445 $ (9,916) $ 27,654 $ (1,445,087) $ (394,904) $ (498,247)
(i) Includes $5 (December 31, 2009 - $1,430) classified in accounts payable and accrued liabilities and $3,444 (December 31, 2009 – $181) classified in prepaid expenses, deposits and other. As at June 30, 2010, the average contracted rate on the foreign exchange forward contracts was 1.0323 (December 31, 2009 – 1.0671) Canadian dollars to US dollars, and the average forward rate used in determining the fair value was 1.0650 (December 31, 2009 – 1.0512) Canadian dollars to US dollars.
(ii) Includes $1,664 (December 31, 2009 – $96) classified in prepaid expenses, deposits and other and $5,623 (December 31, 2009 – $8,763) classified in accounts payable and accrued liabilities. As at June 30, 2010, for the period that the Corporation is hedged, the closing forward curve for crude oil ranged from approximately US $76 to US $80 per barrel (December 31, 2009 – US $79 to US $84) with the average forward foreign exchange rate being 1.0660 Canadian dollars to US dollars (December 31, 2009 – 1.0536).
(iii) Includes $11,249 (December 31, 2009 – $11,249) classified in prepaid expenses, deposits and other and $16,227 (December 31, 2009 – $16,015) classified in other assets.
(iv) Excludes fuel derivative liabilities of $5,623 (December 31, 2009 – $8,763) and foreign exchange derivative liabilities of $5 (December 31, 2009 – $1,430).
(v) Includes current portion of long-term debt of $179,759 (December 31, 2009 – $171,223) and long-term portion of $954,932 (December 31, 2009 – $1,048,554). As at June 30, 2010, rates used in determining the fair value of the Corporations fixed rate long term debt relating to purchased aircraft ranged from 2.02% to 2.86% (December 31, 2009 – 2.28% to 3.27%).
(vi) Includes current portion of obligations under capital leases of $398 (December 31, 2009 – $744) and long-term portion of $3,286 (December 31, 2009 – $3,358).

Notes to Consolidated Financial Statements For the three and six months ended June 30, 2010 and 2009 (Stated in thousands of Canadian dollars, except share and per share data) (Unaudited)
WestJet Second Quarter 2010 │ 16
11. Financial instruments and risk management (continued)
(b) Gain (loss) on derivatives recorded at fair value
The following table presents the components of gain (loss) on derivatives included on the consolidated statement of earnings for the three and six months ended June 30, 2010 and 2009:
Three months ended June 30 Six months ended June 30 2010 2009 2010 2009 Gain (loss) on designated fuel derivatives –
ineffective portion $ (558) $ 4,740 $ 152 $ 4,843 Loss on foreign exchange options – (2,034) (78) (1,503) $ (558) $ 2,706 $ 74 $ 3,340
(c) Risk management
Fuel risk
The airline industry is inherently dependent upon jet fuel to operate and, therefore, the Corporation is exposed to the risk of volatile fuel prices. Fuel prices are impacted by a host of factors outside the Corporation’s control, such as significant weather events, geopolitical tensions, refinery capacity, and global demand and supply. For the three and six months ended June 30, 2010, aircraft fuel expense represented approximately 29% and 28%, respectively, (three and six months ended June 30, 2009 – 26% and 27%, respectively) of the Corporation’s total operating expenses.
Under the Corporation’s fuel price risk management policy, the Corporation is permitted to hedge a portion of its future anticipated jet fuel purchases for up to 36 months, as approved by the Board of Directors. The policy establishes maximum hedging limits based on time horizon, but does not include a minimum hedging requirement. Management continuously reviews and adjusts its strategy based on market conditions and competitors’ positions. Although jet fuel is not traded on an organized North American futures exchange, there are limited opportunities to hedge directly in jet fuel through the over-the-counter market. Financial derivatives in other crude-oil-based commodities that are traded directly on organized exchanges, such as crude oil and heating oil, are also useful in decreasing the risk of volatile fuel prices.
As at June 30, 2010, the Corporation had a mixture of Canadian-dollar West Texas Intermediate (WTI) and jet fuel swaps, call options and collars to hedge approximately 20% (December 31, 2009 - 14%) of its anticipated jet fuel requirements for the next 12 months. The following tables outline, per type, as at June 30, 2010, the notional volumes per barrel (bbl.) or per gallon (gal.) along with the weighted average contract prices.
Type Year Instrument Notional volumes
(bbl.) WTI average strike price
(CAD$/bbl.) WTI average call price
(CAD$/bbl.) WTI 2010 Swaps 222,000 102 – Call options 150,000 – 92 2011 Call options 270,000 – 97
Type Year Instrument Notional volumes
(gal.) Jet average strike price (CAD$/gal.)
Jet average call price (CAD$/gal.)
Jet average put price (CAD$/gal.)
Jet 2010 Swaps 13,020,000 2.27 – – Call options 1,500,000 – 2.50 – Collars 8,520,000 – 2.47 2.05 2011 Collars 1,260,000 – 2.50 2.00
Upon proper qualification, the Corporation accounts for its fuel derivatives as cash flow hedges. Under cash flow hedge accounting, the effective portion of the change in the fair value of the hedging instrument is recognized in AOCL, while the ineffective portion is recognized in non-operating income (expense). Upon maturity of the derivative instrument, the effective gains and losses previously recognized in AOCL are recorded in net earnings as a component of aircraft fuel expense.

Notes to Consolidated Financial Statements For the three and six months ended June 30, 2010 and 2009 (Stated in thousands of Canadian dollars, except share and per share data) (Unaudited)
WestJet Second Quarter 2010 │ 17
11. Financial instruments and risk management (continued)
(c) Risk management (continued)
Fuel risk (continued)
The following table presents the financial impact and statement presentation of the Corporation’s fuel derivatives on the consolidated balance sheet as at June 30, 2010 and December 31, 2009:
Statement presentation
June 30, 2010
December 31, 2009
Fair value of fuel derivatives Prepaid expenses, deposits and other $ 1,664 $ —
Receivable from counterparties for settled fuel contracts
Prepaid expenses, deposits and other – 96
Fair value of fuel derivatives Accounts payable and accrued liabilities (4,747) (7,521)
Payable to counterparties for settled fuel contracts Accounts payable and accrued liabilities (876) (1,242)
Unrealized loss from fuel derivatives AOCL – before tax impact 4,614 6,713
The following table presents the financial impact and statement presentation of the Corporation’s fuel derivatives on the consolidated statement of earnings for the three and six months ended June 30, 2010 and 2009:
Three months ended June 30 Statement presentation 2010 2009
Realized loss on designated fuel derivatives – effective portion Aircraft fuel $ (2,460) $ (7,060)
Gain (loss) on designated fuel derivatives – ineffective portion Gain (loss) on derivatives (558) 4,740
Six months ended June 30 Statement presentation 2010 2009
Realized loss on designated fuel derivatives – effective portion Aircraft fuel $ (4,644) $ (19,034)
Gain on designated fuel derivatives – ineffective portion Gain (loss) on derivatives 152 4,843
During the three and six months ended June 30, 2010, the Corporation cash settled fuel derivatives in favour of the counterparties of $2,436 and $4,655, respectively, (three and six months ended June 30, 2009 – $7,186 and $21,329, respectively). During the three and six months ended June 30, 2010, the Corporation purchased option style contracts. The cash premiums paid during the period related to these contracts were $1,735 and $2,177, respectively.
The estimated amount reported in AOCL that is expected to be reclassified to net earnings as a component of aircraft fuel expense when the underlying jet fuel is consumed during the next 12 months is a loss before tax of $4,614.
Foreign exchange risk
The gain or loss on foreign exchange included in the Corporation’s consolidated statement of earnings is mainly attributable to the effect of the changes in the value of the Corporation’s US-dollar-denominated net monetary assets. As at June 30, 2010, US-dollar-denominated net monetary assets totalled approximately US $73,700 (December 31, 2009 – US $19,858).
As at June 30, 2010, the Corporation is entered into foreign exchange forward contracts for US $10,368 per month for the period of July 2010 to April 2011 for a total of US $103,680 at a weighted average contract price of 1.0323 per US dollar to offset a portion of its future US-dollar-denominated aircraft lease payments. Upon proper qualification, the Corporation designated the forward contracts as effective cash flow hedges for accounting purposes. Upon maturity of the derivative instrument, the effective gains and losses previously recognized in AOCL are recorded in net earnings as a component of aircraft leasing expense. As at June 30, 2010, no portion of the forward contracts was considered ineffective.

Notes to Consolidated Financial Statements For the three and six months ended June 30, 2010 and 2009 (Stated in thousands of Canadian dollars, except share and per share data) (Unaudited)
WestJet Second Quarter 2010 │ 18
11. Financial instruments and risk management (continued)
(c) Risk management (continued)
Foreign exchange risk (continued)
As at June 30, 2010, the fair value of the forward contracts was $3,444 included in prepaid expenses deposits and other and $5 recorded in accounts payable and accrued liabilities (December 31, 2009 – net $1,038). For the three and six months ended June 30, 2010, the Corporation realized a loss before tax on forward contracts of $1,125 and $1,515, respectively, (three and six months ended June 30, 2009 – gain of $2,270 and gain of $5,553, respectively), included in net earnings as an increase to aircraft leasing expense. The estimated amount reported in AOCL that is expected to be reclassified to net earnings as a component of aircraft leasing expense in the next 12 months is a gain before tax of $3,439.
Credit risk
(i) Cash and cash equivalents
Cash and cash equivalents consist of bank balances and short-term investments with terms of up to one year with the majority less than 91 days. Credit risk associated with cash and cash equivalents is minimized substantially by ensuring that these financial assets are invested primarily in debt instruments with highly rated financial institutions. The Corporation manages its exposure risk by assessing the financial strength of its counterparties and by limiting the total exposure to any one individual counterparty. As at June 30, 2010, the Corporation had a total principal amount invested of $837,740 (December 31, 2009 – $813,215) in Canadian-dollar short-term investments with terms up to 365 days and a total of US $20,000 (December 31, 2009 – US $nil) invested in US-dollar short term investments.
The Corporation performs an ongoing review to evaluate its risk associated with its cash and cash equivalent counterparties. As at June 30, 2010, the Corporation does not expect any counterparties to fail to meet their obligations.
(ii) Accounts receivable
Generally, the Corporation’s accounts receivable are the result of tickets sold to individual guests through the use of travel agents and other airlines. Purchase limits are established for certain agents and in some cases, when deemed necessary, a letter of credit is obtained. As at June 30, 2010, $8,243 (December 31, 2009 – $10,374) is receivable from travel agents and other airlines. These receivables are short term in nature, generally being settled within four weeks from the date of booking. As at June 30, 2010, $184 (December 31, 2009 – $603) of the balance receivable is covered by letters of credit.
(iii) Derivative financial instruments
The Corporation recognizes that it is subject to credit risk arising from derivative transactions that are in an asset position at the balance sheet date. The Corporation carefully monitors this risk by closely considering the size, credit rating and diversification of the counterparty. As at June 30, 2010, fuel derivatives of $1,664 (December 31, 2009 - $96) and foreign exchange derivatives of $3,444 (December 31, 2009 - $181) outstanding with the Corporation’s counterparties were in an asset position. The Corporation does not expect the counterparties to fail to meet their obligations.
Liquidity risk
The table below presents a maturity analysis of the Corporation’s undiscounted contractual cash flows for its non-derivative and derivative financial liabilities as at June 30, 2010. The analysis is based on foreign exchange and interest rates in effect at the balance sheet date, and includes both principal and interest cash flows for long-term debt and obligations under capital leases.
Total
Within 1 year 1–3 years 4–5 years
Over 5 years
Accounts payable and accrued liabilities (i) $ (261,500) $ (261,500) $ — $ — $ — Foreign exchange forwards (5) (5) — — — Fuel derivatives (5,623) (5,623) — — — Long-term debt (1,349,386) (236,100) (429,564) (374,996) (308,726) Obligations under capital leases (6,299) (580) (490) (490) (4,739) Total $ (1,622,813) $ (503,808) $ (430,054) $ (375,486) $ (313,465)
(i) Excludes fuel derivative liabilities of $5,623 and foreign exchange derivative liabilities of $5.

Notes to Consolidated Financial Statements For the three and six months ended June 30, 2010 and 2009 (Stated in thousands of Canadian dollars, except share and per share data) (Unaudited)
WestJet Second Quarter 2010 │ 19
11. Financial instruments and risk management (continued)
(c) Risk management (continued)
Liquidity risk (continued)
A portion of the Corporation’s cash and cash equivalents balance relates to cash collected with respect to advance ticket sales, for which the balance at June 30, 2010, was $325,675 (December 31, 2009 – $286,361). Typically, the Corporation has cash and cash equivalents on hand to have sufficient liquidity to meet its liabilities when due, under both normal and stressed conditions. As at June 30, 2010, the Corporation had cash and cash equivalents on hand of 3.40 (December 31, 2009 – 3.51) times the advance ticket sales balance.
The Corporation aims to maintain a current ratio, defined as current assets over current liabilities, of at least 1.00. As at June 30, 2010, the Corporation’s current ratio was 1.46 (December 31, 2009 – 1.48).
As at June 30, 2010, the Corporation has not been required to post collateral with respect to any of its outstanding derivative contracts.
12. Accumulated other comprehensive loss
Amortization of hedge
settlements
Cash flow hedges – foreign exchange
derivatives Cash flow hedges –
fuel derivatives Total Balance as at December 31, 2008 $ (10,620) $ 4,133 $ (31,625) $ (38,112)
Amortization of settlements 1,400 – – 1,400 Unrealized gain (loss) on derivatives – (1,358) 9,587 8,229 Tax on unrealized portion – 447 (2,878) (2,431) Realized (gain) loss on derivatives – (5,553) 28,411 22,858 Tax on realized portion – 1,576 (8,372) (6,796)
Balance as at December 31, 2009 (9,220) (755) (4,877) (14,852) Amortization of settlements 699 – – 699 Unrealized gain (loss) on derivatives – 2,963 (2,545) 418 Tax on unrealized portion – (780) 696 (84) Realized loss on derivatives – 1,515 4,644 6,159 Tax on realized portion – (414) (1,270) (1,684)
Balance as at June 30, 2010 $ (8,521) $ 2,529 $ (3,352) $ (9,344)