Embed Size (px)
Citation preview

MANAGEMENT’S DISCUSSION AND ANALYSIS OF FINANCIAL CONDITION AND RESULTS OF
OPERATIONS
Unless otherwise noted, the section references to (i) “us”, “our”, “we”, “the Company” and “YUM” refer to YUM
Brands, Inc. and its consolidated subsidiaries, (ii) “the Parent” refers to YUM Brands, Inc., on a stand-alone basis, (iii) “the
Issuers” refers to KFC Holding Co., Pizza Hut Holdings, LLC and Taco Bell of America, LLC, which are direct wholly-owned
subsidiaries of the Parent and co-issuers of $1.05 billion of 5.00% Senior Notes due 2024 and $1.05 billion of 5.25% Senior
Notes due 2016 (collectively, the “Subsidiary Senior Unsecured Notes”) and co-borrowers under the Credit Agreement (as
defined herein); (iii) “the Specified Guarantors” refers to collectively Yum Restaurant Services Group, LLC, Restaurant
Concepts LLC and Taco Bell Corp., which are directly wholly-owned subsidiaries of the Parent and guarantors of the Notes
and under the Credit Agreement; (iv) “the Companies” refers to collectively the Issuers and the Specified Guarantors, (v) “the
Taco Bell Securitization Entities” refers to collectively Taco Bell Funding, LLC, a Delaware special purpose limited liability
company and wholly owned subsidiary of Taco Bell Corp, and its subsidiaries, (vi) “the YUM China Entities” refers to all of
YUM’s subsidiaries and other entities that will be spun-off from YUM in connection with the China spin-off (as defined below)
and (vii) the “Restricted Group” refers collectively to the Companies and their subsidiaries, other than (a) the Taco Bell
Securitization Entities which will not be subject to the covenants under the Indenture governing the Subsidiary Senior
Unsecured Notes and the Credit Agreement and (b) the YUM China Entities, most of which will be not be subject to the
covenants under the Indenture governing the Subsidiary Senior Unsecured Notes and the Credit Agreement and none of which
will be owned by YUM following the China spin-off, and also excludes the Parent and ABR Insurance Company which will not
be subject to such covenants as well.
This discussion is supplemental to the section “Management’s Discussion and Analysis of Financial Condition and Results of
Operations” contained in our our quarterly report on Form 10-Q for the quarter ended June 11, 2016 filed with the SEC (the
“Second Quarter 10-Q”) and contains additional information related to the pro forma results of operations and financial
condition of the Restricted Group. None of the financial information in this discussion has been audited or reviewed by our
auditors. This discussion has been prepared and posted to our website in accordance with our reporting obligations under
the Indenture governing the Subsidiary Senior Unsecured Notes and the Credit Agreement. You should read the following
discussion of our results of operations and financial condition and the Restricted Group’s pro forma results of operation and
financial condition together with the information included in our annual report on Form 10-K for the year ended December
26, 2015 (the “2015 10-K”), especially the information under the heading “Risk Factors” and our unaudited consolidated
financial statements and related notes included in our Second Quarter 10-Q.
This discussion contains forward-looking statements and involves numerous risks and uncertainties, including, but not limited
to, those described in the “Risks Factors” section of our 2015 10-K. Actual results may differ materially from those contained
in any forward-looking statements. See “Cautionary Statements Regarding Forward-Looking Statements” below.
Introduction and Overview
Yum operates, franchises or licenses a worldwide system of nearly 43,000 restaurants in more than 130 countries and territories,
primarily through the concepts of KFC, Pizza Hut and Taco Bell. These three concepts are the global leaders in the chicken,
pizza and Mexican-style food categories, respectively. Of the nearly 43,000 restaurants, 21% are operated by the Company and
79% are operated by franchisees, licensees or unconsolidated affiliates.
YUM currently consists of four reporting segments:
• YUM China (“China” or “China Division”) which includes all operations in mainland China
• The KFC Division which includes all operations of the KFC concept outside of China Division
• The Pizza Hut Division which includes all operations of the Pizza Hut concept outside of China Division
• The Taco Bell Division which includes all operations of the Taco Bell concept
Effective January 2016 our India business was segmented by brand, integrated into the global KFC, Pizza Hut and Taco Bell
Divisions, and is no longer a separate operating segment. While our consolidated results were not impacted, we have restated

our historical segment information for consistent presentation.
In October 2015 we announced our intent to separate the YUM China Entities from YUM into an independent, publicly-traded
company. This transaction, which we refer to as the “China spin-off”, is expected to be a tax-free spin-off of our China business
and will create two powerful, independent, focused growth companies with distinct strategies, financial profiles and investment
characteristics. The new China entity will become a licensee of YUM in mainland China, with exclusive rights to the KFC,
Pizza Hut and Taco Bell concepts. Upon completion of the planned spin-off, which currently has a targeted completion date
around October 31, 2016, YUM will become more of a "pure play" franchisor with more stable earnings, higher profit margins,
lower capital requirements and stronger cash flow conversion. Consistent with this strategy YUM is targeting at least 96%
franchisee ownership of its restaurants by the end of 2017.
We are returning substantial capital to shareholders as part of the planned China spin-off, the majority of which is being funded
by incremental borrowings. As a result of this recapitalization, which was completed in June 2016 subsequent to our second
quarter end, the Company has transitioned to a non-investment grade credit rating with a balance sheet more consistent with
highly-levered peer restaurant franchise companies. Moreover, this allows for an ongoing return-of-capital framework that will
seek to optimize the Company's long-term growth rate on a per-share basis.
Completion of the China spin-off will be subject to certain conditions, including receiving final approval from the YUM Board
of Directors, receipt of various regulatory approvals, receipt of an opinion of counsel with respect to certain tax matters, the
effectiveness of filings related to public listing and applicable securities laws, and other terms and conditions as may be
determined by the Board of Directors. There can be no assurance regarding the ultimate timing of the proposed transaction or
that the transaction will be completed.
We intend for this discussion to provide the reader with information that will assist in understanding our and the Restricted
Group’s results of operations, including performance metrics that management uses to assess the Company's performance.
Throughout this discussion, we commonly discuss the following performance metrics:
• The Company provides certain percentage changes excluding the impact of foreign currency translation (“FX” or
“Forex”). These amounts are derived by translating current year results at prior year average exchange rates. We believe
the elimination of the foreign currency translation impact provides better year-to-year comparability without the distortion
of foreign currency fluctuations.
• System sales growth includes the results of all restaurants regardless of ownership, including company-owned, franchise,
unconsolidated affiliate and license restaurants that operate our Concepts, except for non-company-owned restaurants for
which we do not receive a sales-based royalty. Sales of franchise, unconsolidated affiliate and license restaurants typically
generate ongoing franchise and license fees for the Company (typically at a rate of 4% to 6% of sales). Franchise,
unconsolidated affiliate and license restaurant sales are not included in Company sales on the Condensed Consolidated
Statements of Income; however, the franchise and license fees are included in the Company’s revenues. We believe system
sales growth is useful to investors as a significant indicator of the overall strength of our business as it incorporates all of
our revenue drivers, Company and franchise same-store sales as well as net unit growth.
• Same-store sales growth is the estimated percentage change in sales of all restaurants that have been open and in the YUM
system one year or more.
• Company Restaurant profit ("Restaurant profit") is defined as Company sales less expenses incurred directly by our
Company-owned restaurants in generating Company sales. Company restaurant margin as a percentage of sales is defined
as Restaurant profit divided by Company sales. Within the Company Sales and Restaurant Profit analyses, Store Portfolio
Actions represent the net impact of new unit openings, acquisitions, refranchising and store closures, and Other primarily
represents the impact of same-store sales as well as the impact of changes in costs such as inflation/deflation.
• Operating Margin is Operating Profit divided by Total revenues.
• In addition to the results provided in accordance with U.S. Generally Accepted Accounting Principles ("GAAP") , the
Company has provided non-GAAP measurements which present Diluted Earnings Per Share before Special Items and
Core Operating Profit. Core Operating Profit excludes Special Items and foreign currency translation and we use Core
Operating Profit for the purposes of evaluating performance internally. Special Items are not included in any of our
externally reported segment results, and we believe the elimination of the foreign currency translation impact provides
better year-to-year comparability without the distortion of foreign currency fluctuations. These non-GAAP measurements
are not intended to replace the presentation of our financial results in accordance with GAAP. Rather, the Company
believes that the presentation of Diluted Earnings Per Share before Special Items and Core Operating Profit provide
additional information to investors to facilitate the comparison of past and present operations, excluding items that the
Company does not believe are indicative of our ongoing operations due to their size and/or nature.
All Note references herein refer to the Notes to YUM’s consolidated financial statements. Tabular amounts are displayed in
millions of U.S. dollars except per share and unit count amounts, or as otherwise specifically identified. Percentages may not
recompute due to rounding.
2016 Growth Model
As communicated in December 2015 (see specific guidance at www.yum.com/investors/financial-information/guidance) we
expected Core Operating Profit growth of 10% in 2016, which includes the impact of 2016 having a 53 rd week for certain of
our businesses (our subsidiaries that report on a monthly basis, including our China Division, do not have a 53 rd week). While
we currently expect to spin off our China business around October 31, 2016, our targets assume our China business will remain
part of YUM through the end of 2016. Full year GAAP Operating profit growth guidance is not provided due to our inability
to forecast when gains and losses related to refranchising transactions classified as Special Items will occur, as the timing of
these transactions is often outside of our control and the resulting gains and losses are dependent upon future market conditions.
Results of Operations
Summary
For the quarter ended June 11, 2016 GAAP diluted EPS increased 54% to $0.81 per share, and diluted EPS, excluding Special
Items, increased 9% to $0.75 per share.
For the year to date ended June 11, 2016 GAAP diluted EPS increased 30% to $1.74 per share, and diluted EPS, excluding
Special Items, increased 14% to $1.71 per share.
Quarterly Division highlights:

% Change
System Sales(a) Same-Store Sales Units GAAP Operating
Profit Core Operating Profit
China Division +3 Even +6 +1 +6
KFC Division +6 +2 +3 Even +6
Pizza Hut Division +1 Even +1 +6 +7
Taco Bell Division +2 (1) +3 (1) (1)
Worldwide +3 Even +3 +32 +7
Year to date Division highlights:
% Change
System Sales(a) Same-Store Sales Units GAAP Operating
Profit Core Operating Profit
China Division +7 +2 +6 +20 +26
KFC Division +5 +1 +3 (2) +5
Pizza Hut Division +3 +1 +1 +7 +8
Taco Bell Division +3 Even +3 +1 +1
Worldwide +4 +1 +3 +20 +14
(a) System Sales percentages as shown in tables exclude the impact of foreign currency translation.
Additionally:
• Foreign currency translation negatively impacted our reported quarterly and year to date Operating Profit by $16
million and $44 million, respectively, which included $7 million and $20 million, respectively, from our China
Division.
• Our effective tax rate for the quarter, excluding Special Items, decreased to 24.6% from 25.6%. Our year to date
effective tax rate, excluding Special Items, increased to 24.8% from 24.4%.
Given our strong first-half results and current trends in China, we are raising our 2016 Core Operating Profit growth forecast
for YUM to at least 14% versus our original target of 10%. This increase is due to upside versus our original forecast in
China, including strong year to date KFC sales, margin and profit growth and a balance of year that will be aided by a change
in China's retail tax structure, partially offset by a return to commodity inflation and higher labor costs. Outside of China our
three brand divisions remain on track to deliver results consistent with our initial 2016 targets.
Effective May 1, 2016 the Chinese government implemented reform of its retail tax structure, which is intended to be a
progressive and positive shift to more closely align with a more modern service-based economy. Under this reform a 6% output
value added tax ("VAT") replaces a 5% Business Tax currently applied to certain restaurant sales. Input VAT is creditable to
the aforementioned 6% output VAT. We believe this change will have a material benefit to Yum China restaurant margins
balance of year. However, the scale and nature of the reform, along with implementation and transition challenges, make it
very difficult to pinpoint the exact magnitude of the impact. For the balance of the year we expect labor and commodity
inflation to partially offset this benefit. Given this and our first half outperformance, our current guidance for full-year China
restaurant margins is now at least 17% versus 16% previously.

Worldwide
The Consolidated Results of Operations for the quarters ended June 11, 2016 and June 13, 2015 are presented below:
Quarter ended Year to date
2016 2015 % B/(W) 2016 2015 % B/(W)
Company sales $ 2,554 $ 2,659 (4 ) $ 4,719 $ 4,838 (2 )
Franchise and license fees and income 454 446 2 908 889 2
Total revenues $ 3,008 $ 3,105 (3 ) $ 5,627 $ 5,727 (2 )
Restaurant profit $ 408 $ 411 (1 ) $ 841 $ 793 6
Restaurant margin % 16.0 % 15.5 % 0.5 ppts. 17.8 % 16.4 % 1.4 ppts.
General and administrative ("G&A")
expenses
$ 365 $ 353
(3 )
$ 651
$ 648
(1 )
Franchise and license expenses 50 47 (8 ) 98 81 (20 )
Closures and impairment (income) expenses 37 24 (60 ) 40 27 (52 )
Refranchising (gain) loss (53 ) 68 NM (60 ) 58 NM
Other (income) expense (28 ) (6 ) NM (35 ) (9 ) NM
Operating Profit $ 491 $ 371 32 $ 1,055 $ 877 20
Operating margin % 16.3 % 12.0 % 4.3 ppts. 18.8 % 15.3 % 3.5 ppts.
Interest expense, net $ 40 $ 33 (22 ) 77 67 (15 )
Income tax provision 116
102
(13 ) 248
213
(16 )
Effective Tax Rate 25.8 % 30.4 % 4.6 ppts. 25.4 % 26.3 % 0.9 ppts.
Net Income – including noncontrolling
interests $ 335
$ 236
42
$ 730
$ 597
22
Net Income (loss) – noncontrolling interests (4 ) 1 NM — — NM
Net Income – YUM! Brands, Inc. $ 339 $ 235 44 $ 730 $ 597 22
Diluted earnings per share (a) $ 0.81 $ 0.53 54 $ 1.74 $ 1.34 30
Diluted earnings per share before Special
Items (a) $ 0.75
$ 0.69
9
$ 1.71
$ 1.50
14
(a) See Note 2 for the number of shares used in this calculation.
Quarter ended Year to date
2016 2015 2016 2015
System Sales Growth, reported — % (2 )% 1 % (1 )%
System Sales Growth, excluding FX 3 % 3 % 4 % 4 %
Unit Count 6/11/2016 6/13/2015 % Increase
(Decrease)
Franchise & License 33,186 32,190 3
Company-owned 8,896 8,785 1
Unconsolidated Affiliates 811 773 5
42,893 41,748 3

Reconciliation of Non-GAAP Measurements to GAAP Results
Quarter ended Year to date
Detail of Special Items 2016 2015 2016 2015
Costs associated with the planned spin-off of the China business and
YUM recapitalization (See Note 4)
$ (10 ) $ —
$ (19 ) $ —
Costs associated with KFC U.S. Acceleration Agreement (See Note 4) (8 ) (8 ) (17 ) (10 )
Refranchising initiatives(a) 53 (72 ) 56 (65 )
Other Special Items Income (Expense) (6 ) 2 (6 ) 2
Total Special Items Income (Expense) 29 (78 ) 14 (73 )
Tax Benefit (Expense) on Special Items(b) $ (13 ) $ 3 $ (9 ) $ 1
Special Items Income (Expense), net of tax - including noncontrolling
interests $ 16
$ (75 ) 5
(72 )
Special Items Income (Expense), net of tax - noncontrolling interests
(See Note 6) (8 ) —
(8 ) —
Special Items Income (Expense), net of tax - YUM! Brands, Inc. $ 24 $ (75 ) $ 13 $ (72 )
Average diluted shares outstanding 417 445 420 446
Special Items diluted EPS $ 0.06 $ (0.16 ) $ 0.03 $ (0.16 )
Reconciliation of Core Operating Profit to GAAP Operating Profit
Core Operating Profit $ 478 $ 449 $ 1,085 $ 950
Special Items Income (Expense) 29 (78 ) 14 (73 )
Foreign Currency Impact on Operating Profit (16 ) N/A (44 ) N/A
GAAP Operating Profit $ 491 $ 371 $ 1,055 $ 877
Reconciliation of EPS Before Special Items to GAAP EPS
Diluted EPS before Special Items $ 0.75 $ 0.69 $ 1.71 $ 1.50
Special Items EPS 0.06 (0.16 ) 0.03 (0.16 )
GAAP EPS $ 0.81 $ 0.53 $ 1.74 $ 1.34
Reconciliation of Effective Tax Rate Before Special Items to GAAP
Effective Tax Rate
Effective Tax Rate before Special Items 24.6 % 25.6 % 24.8 % 24.4 %
Impact on Tax Rate as a result of Special Items(b) 1.2 % 4.8 % 0.6 % 1.9 %
GAAP Effective Tax Rate 25.8 % 30.4 % 25.4 % 26.3 %

(a) We have historically recorded refranchising gains and losses in the U.S. as Special Items due to the scope of our
refranchising program and the volatility in associated gains and losses. Beginning in 2016, we are also including all
international refranchising gains and losses, excluding China, in Special Items. The inclusion in Special Items of
these additional international refranchising gains and losses is the result of the anticipated size and volatility of
refranchising initiatives outside the U.S. that will take place in connection with our previously announced plans to
increase franchise ownership of our global restaurants to at least 96% by the end of 2017. International refranchising
gains and losses in the year to date ended June 13, 2015 previously not included in Special Items were not significant
and have not been reclassified into Special Items.
(b) The tax benefit (expense) was determined based upon the impact of the nature, as well as the jurisdiction of the
respective individual components within Special Items.
Pro Forma Results of Operations for the Restricted Group
The following table sets forth certain unaudited financial and operating data of the Restricted Group as of the dates and for the
periods indicated after giving pro forma effect to the China spin-off and the Securitization Transaction as if they had occurred
on the first day of fiscal year 2015.
Quarter ended Year to date
% B/(W) % B/(W)
2016 2015 Reported Ex FX 2016 2015 Reported Ex FX
Company sales $ 996 $ 1,051 (5) (2) $ 1,883 $ 1,995 (6) (1)
Franchise and license
fees and income 377
374
1
4
758
749
1
5
Total revenues $ 1,373 $ 1,425 (4) - $ 2,641 $ 2,744 (4) -
G&A expenses $ 229 $ 230 (1) 2 $ 418 $ 435 (1) (1)
Operating Profit $ 311 $ 183 70 76 $ 581 $ 454 28 34
Quarter ended Year to date
2016 2015 2016 2015
System Sales Growth, reported - % (3) % - % (2) %
System Sales Growth, excluding FX 4 % 3 % 4 % 3 %
Same-Store Sales Growth % 1 % (1) % 2 % - %
% Increase
(Decrease)
Unit Count 6/11/2016 6/13/2015
Franchise & License 34,265 33,116 3
Company-owned 3,096 3,265 (5)
37,361 36,381 3

The China spin-off had the following pro forma impact on the financial and operating data of the Restricted Group in
comparison to the corresponding data of YUM:
Units
• 5,747 and 5,426 Company-owned restaurants in China as of the end of the second quarters of 2016 and 2015,
respectively, became licensed restaurants; and 258 and 300 Company-owned and franchised Little Sheep and East
Dawning restaurants as of the end of the second quarters of 2016 and 2015, respectively, were excluded from the
Restricted Group’s restaurant count because we will no longer own, and we will not receive a license fee from,
the Little Sheep and East Dawning restaurants after the completion of the China spin-off;
Company Sales
• Company sales decreased $1,542 million and $1,582 million for the second quarters of 2016 and 2015,
respectively, due to the impact of our Company-owned KFC and Pizza Hut restaurants in China becoming
licensed restaurants; and Company sales decreased $16 million and $26 million for the second quarters of 2016
and 2015, respectively due to the exclusion of Little Sheep and East Dawning restaurants as a result of the China
spin-off;
• Company sales decreased $2,807 million and $2,792 million for the years to date 2016 and 2015, respectively,
due to the impact of our Company-owned KFC and Pizza Hut restaurants in China becoming licensed restaurants;
and Company sales decreased $29 million and $51 million for the years to date 2016 and 2015, respectively due
to the exclusion of Little Sheep and East Dawning restaurants as a result of the China spin-off;
Company Restaurant Expenses
• Company restaurant expenses decreased $1,315 million and $1,374 million for the second quarters of 2016 and
2015, respectively, due to the exclusion of such expenses related to all Company-owned restaurants in China
which we will no longer own following the China spin-off;
• Company restaurant expenses decreased $2,307 million and $2,376 million for the years to date 2016 and 2015,
respectively, due to the exclusion of such expenses related to all Company-owned restaurants in China which we
will no longer own following the China spin-off;
G&A Expenses
• G&A expenses decreased $113 million and $100 million for the second quarters of 2016 and 2015, respectively,
due to the exclusion of such expenses related to China entities which we will no longer own following the China
spin-off, partially offset by an increase in G&A expenses of $3 million for each of the second quarters of 2016
and 2015 related to incremental value added tax on the license fees paid by the China Entities to our Restricted
Group;
• G&A expenses decreased $188 million and $168 million for the years to date 2016 and 2015, respectively, due
to the exclusion of such expenses related to China entities which we will no longer own following the China
spin-off, partially offset by an increase in G&A expenses of $6 million for each of the second quarters of 2016
and 2015 related to incremental value added tax on the licese fees paid by the China Entities to our Restricted
Group;
Franchise and License Fees and Income
• Franchise and license fees and income increased $57 million for each of the second quarters of 2016 and 2015,
respectively, due to YUM China paying a license fee to the Restricted Group equal to 3% of its Company and
franchise sales for KFC and Pizza Hut restaurants in China, offset by $30 million and $28 million related to
existing franchise fees and income for the second quarters ended 2016 and 2015, respectively, already included
in China Division results.
• Franchise and license fees and income increased $104 million and $101 million for the years to date 2016 and
2015, respectively, due to YUM China paying a license fee to the Restricted Group equal to 3% of its Company
and franchise sales from KFC and Pizza Hut restaurants in China, offset by $55 million and $49 million related
to existing franchise fees and income for the years to date 2016 and 2015, respectively, already included in China
Division results.

The Securitization Transaction and the exclusion of the Taco Bell Securitization Entities from the Restricted Group had the
following pro forma impact on the financial and operating data of the Restricted Group in comparison to the corresponding
data of YUM:
Units
• 5,274 and 5,067 U.S. Taco Bell franchised and licensed restaurants were excluded from the Restricted Group as
of the end of the second quarters of 2016 and 2015, respectively, as the Restricted Group will no longer receive
franchise fees from these restaurants;
Franchise and License Fees and Income
• Franchise and license fees and income decreased $104 million and $101 million for the second quarters of 2016
and 2015, respectively, due to the exclusion of the franchise fees paid by all U.S. Taco Bell franchised and licensed
restaurants as a result of the Securitization Transaction;
• Franchise and license fees and income decreased $199 million and $192 million for the years to date 2016 and
2015, respectively, due to the exclusion of the franchise fees paid by all U.S. Taco Bell franchised and licensed
restaurants as a result of the Securitization Transaction;
Company Restaurant Expenses
• Company restaurant expenses increased $19 million and $21 million for the second quarters of 2016 and 2015,
respectively, due to the payment of royalty fees of 5.5% of annual sales to the Taco Bell Securitization Entities
by all U.S. Company-owned Taco Bell restaurants (which are part of the Restricted Group);
• Company restaurant expenses increased $37 million and $39 million for the years to date 2016 and 2015,
respectively, due to the payment of royalty fees of 5.5% of annual sales to the Taco Bell Securitization Entities
by all U.S. Company-owned Taco Bell restaurants (which are part of the Restricted Group);
G&A Expenses
• G&A expenses decreased $26 million for each of the second quarters of 2016 and 2015 due to the management
fees payable by the Taco Bell Securitization Entities to Taco Bell Corp. as manager of the Taco Bell Securitization
Entities, which fees are recorded as a reduction of G&A expenses and on an annual basis are equal to the sum of
a base fee of $35 million plus 15.1% of total securitization cash revenue paid to the Taco Bell Securitization
Entities by franchisees for the year;
• G&A expenses decreased $51 million for each of the years to date 2016 and 2015 due to the management fees
payable by the Taco Bell Securitization Entities to Taco Bell Corp. as manager of the Taco Bell Securitization
Entities, which fees are recorded as a reduction of G&A expenses and on an annual basis are equal to the sum of
a base fee of $35 million plus 15.1% of total securitization cash revenue paid to the Taco Bell Securitization
Entities by franchisees for the year; and
• Consequently, the overall margins of the Restricted Group were negatively impacted due to the loss of substantial
franchise and license fees from U.S. franchised restaurants and our obligation to pay franchise fees on U.S.
Company-owned restaurants to the Taco Bell Securitization Entities, while maintaining the same level of
expenses (other than the reimbursement of a portion of G&A expenses).
China Division
The China Division has 7,246 units, predominately KFC and Pizza Hut Casual Dining restaurants which are the leading quick
service and casual dining restaurant brands, respectively, in mainland China. Given our strong competitive position, a
growing economy and a population of approximately 1.4 billion in mainland China, the Company has rapidly added KFC and
Pizza Hut Casual Dining restaurants and accelerated the development of Pizza Hut Home Service (home delivery). Our
original 2016 targets for the China Division included same-store sales growth of 2%-3%, at least 425 net new units and
Operating Profit growth of 10%, excluding the impact of foreign currency translation. Given our strong year to date KFC sales,
margin and profit growth and a balance of year that will be aided by the change in China's retail tax structure effective May 1,

2016, partially offset by a return to commodity inflation and higher labor costs, we believe 2016 operating profit growth will
be greater than originally expected. Additionally, we are reallocating our capital to increase our pace of remodels in China to
nearly 800 in 2016, up from our previous target of 550. At the same time we are reducing both our gross and net new unit
forecasts for the year by around 50 to 100 openings versus our original expectations. This is primarily due to fewer new Pizza
Hut Casual Dining unit openings this year.
Quarter ended Year to date
% B/(W) % B/(W)
2016 2015 Reported Ex FX 2016 2015 Reported Ex FX
Company sales $ 1,558 $ 1,608 (3 ) 1 $ 2,836 $ 2,843 — 5
Franchise and license
fees and income 30
28
7
12
55
49
12
18
Total revenues $ 1,588 $ 1,636 (3 ) 2 $ 2,891 $ 2,892 — 5
Restaurant profit $ 243 $ 234 4 9 $ 529 $ 467 13 19
Restaurant margin % 15.7 % 14.6 % 1.1 ppts. 1.1 ppts. 18.7 % 16.4 % 2.3 ppts. 2.3 ppts.
G&A expenses $ 102 $ 100 (2 ) (6 ) $ 168 $ 168 — (4 )
Operating Profit $ 147 $ 144 1 6 $ 403 $ 334 20 26
Operating margin % 9.2 % 8.8 % 0.4 ppts. 0.4 ppts. 13.9 % 11.6 % 2.3 ppts. 2.3 ppts.
Quarter ended Year to date
2016 2015 2016 2015
System Sales Growth, reported (1 )% (4 )% 2 % (6 )%
System Sales Growth, excluding FX 3 % (4 )% 7 % (5 )%
Same-Store Sales Growth % — % (10 )% 2 % (11 )%
% Increase
(Decrease)
Unit Count 6/11/2016 6/13/2015
Company-owned 5,800 5,520 5
Unconsolidated Affiliates 811 773 5
Franchise & License 635 560 13
7,246 6,853 6

Company Sales and Restaurant Profit
The changes in Company sales and Restaurant profit were as follows:
Quarter ended
Income / (Expense) 2015
Store
Portfolio
Actions Other FX 2016
Company sales $ 1,608 $ 45 $ (22 ) $ (73 ) $ 1,558
Cost of sales (515 ) (10 ) 42 21 (462 )
Cost of labor (333 ) (12 ) (13 ) 16 (342 )
Occupancy and other (526 ) (14 ) 5 24 (511 )
Company restaurant expenses $ (1,374 ) $ (36 ) $ 34 $ 61 $ (1,315 )
Restaurant profit $ 234 $ 9 $ 12 $ (12 ) $ 243
Year to date
Income / (Expense) 2015
Store
Portfolio
Actions Other FX 2016
Company sales $ 2,843 $ 93 $ 38 $ (138 ) $ 2,836
Cost of sales (907 ) (22 ) 41 41 (847 )
Cost of labor (577 ) (22 ) (17 ) 29 (587 )
Occupancy and other (892 ) (27 ) 3 43 (873 )
Company restaurant expenses $ (2,376 ) $ (71 ) $ 27 $ 113 $ (2,307 )
Restaurant profit $ 467 $ 22 $ 65 $ (25 ) $ 529
The increase in Company sales and Restaurant profit for the quarter associated with store portfolio actions was driven by net
new unit growth, partially offset by refranchising. Company same-store sales declined 1% for the quarter. Significant other
factors impacting Restaurant profit were the favorable impact of pricing and promotional mix, favorability due to retail tax
structure reform (primarily in cost of sales) and commodity deflation of 2%, partially offset by transaction declines and wage
inflation of 8%.
The year to date increase in Company sales and Restaurant profit associated with store portfolio actions was driven by net new
unit growth, partially offset by refranchising. Significant other factors impacting Company sales and/or Restaurant profit were
company same-store sales growth of 1%, commodity deflation of 2% and the impact of retail tax structure reform (primarily
in cost of sales) partially offset by wage inflation of 7%.
Franchise and License Fees and Income
The quarterly and year to date increases in Franchise and license fees and income, excluding the impact of foreign currency
translation, were driven by refranchising, franchise same-store sales growth of 4% and 8% for the quarter and year to date,
respectively, and net new unit growth.
G&A Expenses
The quarterly and year to date increases in G&A expenses, excluding the impact of foreign currency translation, were driven
by wage inflation, increased headcount and higher incentive compensation.

Operating Profit
The increase in Operating Profit for the quarter, excluding the impact of foreign currency translation, was driven by net new
unit growth and lower restaurant operating costs, including the favorable impact of the retail tax structure reform, partially
offset by higher restaurant impairment charges.
The year to date increase in Operating Profit, excluding the impact of foreign currency translation, was driven by the impact of
same-store sales growth, net new unit growth and lower restaurant operating costs, including the favorable impact of the retail
tax structure reform, partially offset by higher restaurant impairment charges. Additionally leap year added an extra day in
2016 and resulted in incremental Operating Profit of $6 million.
Restricted Group — Pro Forma
The China Division is not part of the Restricted Group and will become part of a separate independent publicly traded company,
upon completion of the China spin-off which is expected to occur around October 31, 2016. It is anticipated that the YUM
China entities will pay a license fee to the Restricted Group that equals 3% of its Company and franchise sales from our KFC,
Pizza Hut and Taco Bell brands in China which, on a pro forma basis, would have equaled $57 million for each of the quarters
ended 2016 and 2015, and $104 million and $101 million for the years to date 2016 and 2015, respectively. These license
fees have been allocated among our KFC and Pizza Hut Divisions, as applicable, as described below. These license fees
declined 0.8% for the second quarter 2016 and increased 2.4% for the year to date 2016, compared to the prior year period, as
a result of the growth in system sales in China as described above. Other than the license fees, the China Division would not
have had any impact on the Restricted Group.
KFC Division
The KFC Division has 15,003 units, approximately 70% of which are located outside the U.S. The KFC Division has
experienced significant unit growth in emerging markets, which comprised approximately 40% of both the Division’s units
and profits, respectively, as of the end of 2015. Additionally, 90% of the KFC Division units were operated by franchisees
and licensees as of the end of 2015. Our 2016 targets for the KFC Division include same-store sales growth of 3%, at least
475 net new international units and Operating Profit growth of 11%, excluding the impact of foreign currency translation and
including the impact of a 53rd week.
Quarter ended Year to date
% B/(W) % B/(W)
2016 2015 Reported Ex FX 2016 2015 Reported Ex FX
Company sales $ 518 $ 535 (3 ) 3 $ 948 $ 999 (5 ) 3
Franchise and license
fees and income 194
191
1
5
389
389
—
6
Total revenues $ 712 $ 726 (2 ) 4 $ 1,337 $ 1,388 (4 ) 3
Restaurant profit $ 75 $ 78 (3 ) 3 $ 139 $ 145 (4 ) 4
Restaurant margin % 14.5 % 14.5 % — ppts. — ppts. 14.7 % 14.5 % 0.2 ppts. 0.1 ppts.
G&A expenses $ 94 $ 97 4 — $ 170 $ 179 5 —
Operating Profit $ 149 $ 149 — 6 $ 309 $ 315 (2 ) 5
Operating margin % 21.0 % 20.5 % 0.5 ppts. 0.5 ppts. 23.1 % 22.7 % 0.4 ppts. 0.3 ppts.

Quarter ended Year to date
2016 2015 2016 2015
System Sales Growth, reported 1 % (4 )% (1 )% (2 )%
System Sales Growth, excluding FX 6 % 6 % 5 % 7 %
Same-Store Sales Growth % 2 % 2 % 1 % 3 %
% Increase
(Decrease)
Unit Count 6/11/2016 6/13/2015
Franchise & License 13,502 13,088 3
Company-owned 1,501 1,531 (2 )
15,003 14,619 3
Company Sales and Restaurant Profit
The changes in Company sales and Restaurant profit were as follows:
Quarter ended
Income / (Expense) 2015
Store
Portfolio
Actions Other FX 2016
Company sales $ 535 $ 7 $ 9 $ (33 ) $ 518
Cost of sales (183 ) (3 ) (3 ) 13 (176 )
Cost of labor (123 ) (1 ) (4 ) 6 (122 )
Occupancy and other (151 ) — (3 ) 9 (145 )
Company restaurant expenses $ (457 ) $ (4 ) $ (10 ) $ 28 $ (443 )
Restaurant profit $ 78 $ 3 $ (1 ) $ (5 ) $ 75
Year to date
Income / (Expense) 2015
Store
Portfolio
Actions Other FX 2016
Company sales $ 999 $ 15 $ 12 $ (78 ) $ 948
Cost of sales (344 ) (6 ) — 29 (321 )
Cost of labor (230 ) (4 ) (7 ) 16 (225 )
Occupancy and other (280 ) (1 ) (4 ) 22 (263 )
Company restaurant expenses $ (854 ) $ (11 ) $ (11 ) $ 67 $ (809 )
Restaurant profit $ 145 $ 4 $ 1 $ (11 ) $ 139
The increase in Company sales and Restaurant profit for the quarter associated with store portfolio actions was driven by net
new unit growth partially offset by refranchising. Significant other factors impacting Company sales and/or Restaurant profit
were higher commodity costs and wage inflation, partially offset by company same-store sales growth of 1%.
The year to date increase in Company sales and Restaurant profit associated with store portfolio actions was driven by net new
unit growth partially offset by refranchising. Significant other factors impacting Company sales and/or Restaurant profit were
company same-store sales growth of 1%, partially offset by wage inflation.
Franchise and License Fees and Income

The quarterly and year to date increases in Franchise and license fees and income, excluding the impact of foreign currency
translation, were driven by net new unit growth, franchise and license same-store sales growth of 2% and 1% for the quarter
and year to date, respectively, and refranchising.
G&A Expenses
G&A expenses, excluding the impact of foreign currency translation, were even with prior year for both the quarter and year
to date. Higher compensation costs due to increased headcount and wage inflation in international markets were offset by
lower pension costs in the U.S.
Operating Profit
The quarterly and year to date increases in Operating Profit, excluding the impact of foreign currency translation, were driven
by net new unit and same-store sales growth, partially offset by higher restaurant operating costs and advertising contributions
associated with the KFC U.S. Acceleration Agreement.
Restricted Group KFC Division — Pro Forma
Quarter ended Year to date
% B/(W) % B/(W)
2016 2015 Reported Ex FX 2016 2015 Reported Ex FX
Company sales $ 518 $ 535 (3) 3 $ 948 $ 999 (5) 3
Franchise and license
fees and income 237
234
1
5
468
464
1
6
Total revenues $ 755 $ 769 (2) 4 $ 1,416 $ 1,463 (3) 4
Restaurant profit $ 75 $ 78 (3) 3 $ 139 $ 145 (4) 4
Restaurant margin % 14.5 % 14.5 % 0 ppts. 0 ppts. 14.7 % 14.5 % 0.2 ppts. 0.1 ppts.
G&A expenses $ 96 $ 99 3 - $ 174 $ 183 4 -
Operating Profit $ 190 $ 190 - 5 $ 384 $ 386 (1) 6
Quarter ended Year to date
2016 2015 2016 2015
System Sales Growth, reported 1 % (6) % 1 % (4) %
System Sales Growth, excluding FX 6 % 2 % 6 % 3 %
Same-Store Sales Growth % 2 % (2) % 3 % (1) %
% Increase
(Decrease)
Unit Count 6/11/2016 6/13/2015
Franchise & License 18,541 17,977 3
Company-owned 1,501 1,531 (2)
20,042 19,508 3
The China spin-off had the following pro forma impact on the financial and operating data of the KFC Division of the Restricted
Group in comparison to the corresponding data for the KFC Division of YUM:

Units
• The number of franchised and licensed KFC restaurants increased by 5,039 and 4,889 for the second quarters of
2016 and 2015, respectively, due to all Company-owned and licensed KFC restaurants in China (previously
included within YUM’s China Division) becoming licensed KFC restaurants of the Restricted Group;
Franchise and License Fees and Income
• Franchise and license fees and income increased $43 million for each of the second quarters of 2016 and 2015,
due to YUM China paying a license fee to the Restricted Group equal to 3% of its KFC Company and franchise
sales in China;
• Franchise and license fees and income increased $79 million and $75 million for the years to date 2016 and 2015,
respectively, due to YUM China paying a license fee to the Restricted Group equal to 3% of its KFC Company
and franchise sales in China;
G&A Expenses
• G&A expenses increased $2 million for each of the second quarters of 2016 and 2015, related to the value added
tax on the license fees paid by the China Entities to our Restricted Group for its KFC Company and franchise
sales; and
• G&A expenses increased $4 million for each of the years to date 2016 and 2015, related to the value added tax
on the license fees paid by the China Entities to our Restricted Group for its KFC Company and franchise sales.
Except as described in the bullet points above, the China spin-off would not have had any other impact on the results of
operations of the KFC Division of the Restricted Group. The Securitization Transaction would not have had any impact on the
KFC Division of the Restricted Group.
Pizza Hut Division
The Pizza Hut Division has 14,176 units, approximately 55% of which are located in the U.S. The Pizza Hut Division operates
as one brand that uses multiple distribution channels including delivery, dine-in and express (e.g. airports). Emerging markets
comprised approximately 20% of both units and profits for the Division as of the end of 2015. Additionally, 95% of the Pizza
Hut Division units were operated by franchisees and licensees as of the end of 2015. Our 2016 targets for the Pizza Hut
Division include same-store sales growth of 3%, at least 325 net new international units and Operating Profit growth of 7%,
excluding the impact of foreign currency translation and including the impact of a 53rd week.
Quarter ended Year to date
% B/(W) % B/(W)
2016 2015 Reported Ex FX 2016 2015 Reported Ex FX
Company sales $ 125 $ 145 (14 ) (12 ) $ 257 $ 289 (11 ) (9 )
Franchise and license
fees and income 121
121
1
3
254
249
2
4
Total revenues $ 246 $ 266 (7 ) (5 ) $ 511 $ 538 (5 ) (3 )
Restaurant profit $ 11 $ 14 (19 ) (20 ) $ 26 $ 31 (15 ) (16 )
Restaurant margin % 9.4 % 9.9 % (0.5 ) ppts. (0.9 ) ppts. 10.3 % 10.8 % (0.5 ) ppts. (0.9 ) ppts.
G&A expenses $ 56 $ 63 9 7 $ 106 $ 120 11 8
Operating Profit $ 64 $ 60 6 7 $ 151 $ 141 7 8
Operating margin % 25.8 % 22.5 % 3.3 ppts. 3.0 ppts. 29.5 % 26.2 % 3.3 ppts. 2.9 ppts.

Quarter ended Year to date
2016 2015 2016 2015
System Sales Growth, reported — % (3 )% — % (2 )%
System Sales Growth, excluding FX 1 % 2 % 3 % 2 %
Same-Store Sales Growth % — % — % 1 % — %
% Increase
(Decrease)
Unit Count 6/11/2016 6/13/2015
Franchise & License 13,490 13,212 2
Company-owned 686 801 (14 )
14,176 14,013 1
Company Sales and Restaurant Profit
The changes in Company sales and Restaurant profit were as follows:
Quarter ended
Income / (Expense) 2015
Store
Portfolio
Actions Other FX 2016
Company sales $ 145 $ (22 ) $ 5 $ (3 ) $ 125
Cost of sales (40 ) 6 (2 ) 1 (35 )
Cost of labor (45 ) 7 (2 ) 1 (39 )
Occupancy and other (46 ) 6 (1 ) 1 (40 )
Company restaurant expenses $ (131 ) $ 19 $ (5 ) $ 3 $ (114 )
Restaurant profit $ 14 $ (3 ) $ — $ — $ 11
Year to date
Income / (Expense) 2015
Store
Portfolio
Actions Other FX 2016
Company sales $ 289 $ (35 ) $ 9 $ (6 ) $ 257
Cost of sales (80 ) 10 (3 ) 2 (71 )
Cost of labor (89 ) 11 (4 ) 2 (80 )
Occupancy and other (89 ) 10 (3 ) 2 (80 )
Company restaurant expenses $ (258 ) $ 31 $ (10 ) $ 6 $ (231 )
Restaurant profit $ 31 $ (4 ) $ (1 ) $ — $ 26
The quarterly and year to date decreases in Company sales and Restaurant profit associated with store portfolio actions were
driven by refranchising. Significant other factors impacting Company sales and/or Restaurant profit were wage rate inflation,
partially offset by both quarterly and year to date company same-stores sales growth of 4%.
Franchise and License Fees and Income
The quarterly increase in Franchise and license fees and income, excluding the impact of foreign currency translation, was
driven by refranchising. Franchise and license same-store sales were even for the quarter and increased 1% for the year to date.

G&A Expenses
The decrease in G&A expenses for the quarter, excluding the impact of foreign currency translation, was driven by lower U.S.
pension costs.
The year to date decrease in G&A expenses, excluding the impact of foreign currency translation, was driven by lower U.S.
pension costs and lapping prior year litigation costs.
Operating Profit
The increase in Operating Profit for the quarter, excluding the impact of foreign currency translation, was driven by lower
G&A expenses, partially offset by higher restaurant operating costs.
The year to date increase in Operating Profit, excluding the impact of foreign currency translation, was driven by lower G&A
expenses and same-store sales growth, partially offset by higher restaurant operating costs.
Restricted Group Pizza Hut Division — Pro Forma
Quarter ended Year to date
% B/(W) % B/(W)
2016 2015 Reported Ex FX 2016 2015 Reported Ex FX
Company sales $ 125 $ 145 (14) (12) $ 257 $ 289 (11) (9)
Franchise and license
fees and income 135
135
-
2
279
275
1
4
Total revenues $ 260 $ 280 (7) (5) $ 536 $ 564 (5) (3)
Restaurant profit $ 11 $ 14 (19) (20) $ 26 $ 31 (15) (16)
Restaurant margin % 9.4 % 9.9 % (0.5) ppts. (0.9) ppts. 10.3 % 10.8 % (0.5) ppts. (0.9) ppts.
G&A expenses $ 57 $ 64 9 7 $ 108 $ 122 11 8
Operating Profit $ 77 $ 73 4 5 $ 174 $ 165 5 7
Quarter ended Year to date
2016 2015 2016 2015
System Sales Growth, reported (1) % (1) % (1) % - %
System Sales Growth, excluding FX 1 % 3 % 2 % 3 %
Same-Store Sales Growth % (2) % (1) % (1) % (1) %
% Increase
(Decrease)
Unit Count 6/11/2016 6/13/2015
Franchise & License 15,439 14,876 4
Company-owned 686 801 (14)
16,125 15,677 3
The China spin-off had the following pro forma impact on the financial and operating data of the Pizza Hut Division of the
Restricted Group in comparison to the corresponding data for the Pizza Hut Division of YUM:

Units
• The number of franchised and licensed Pizza Hut restaurants increased by 1,949 and 1,664 for the second quarters
of 2016 and 2015, respectively, due to all Company-owned and licensed Pizza Hut restaurants in China
(previously included within YUM’s China Division) becoming licensed Pizza Hut restaurants of the Restricted
Group;
Franchise and License Fees and Income
• Franchise and license fees and income increased $14 million for each of the second quarters of 2016 and 2015,
due to YUM China paying a license fee to the Restricted Group equal to 3% of its Pizza Hut Company and
franchise sales in China;
• Franchise and license fees and income increased $25 million and $26 million for the years to date 2016 and 2015,
respectively, due to YUM China paying a license fee to the Restricted Group equal to 3% of its Pizza Hut
Company and franchise sales in China;
G&A Expenses
• G&A expenses increased $1 million for each of the second quarters of 2016 and 2015, related to value added tax
on the license fees paid by the China Entities to our Restricted Group for its Pizza Hut Company and franchise
sales; and
• G&A expenses increased $2 million for each of the years to date 2016 and 2015, related to value added tax on
the license fees paid by the China Entities to our Restricted Group for its Pizza Hut Company and franchise sales.
Except as described in the bullet points above, the China spin-off would not have had any other impact on the results of
operations of the Pizza Hut Division of the Restricted Group. The Securitization Transaction would not have had any impact
on the Pizza Hut Division of the Restricted Group.
Taco Bell Division
The Taco Bell Division has 6,468 units, the vast majority of which are in the U.S. The Company owns 15% of the Taco Bell
units in the U.S., where the brand has historically achieved high restaurant margins and returns. Our 2016 targets for the Taco
Bell Division include same-store sales growth of 3%, at least 225 net new units and Operating Profit growth of 9%, including
the impact of a 53rd week.
Quarter ended Year to date
% B/(W) % B/(W)
2016 2015 Reported Ex FX 2016 2015 Reported Ex FX
Company sales $ 353 $ 371 (5 ) (5 ) $ 678 $ 707 (4 ) (4 )
Franchise and license
fees and income 110
106
4
4
211
202
5
5
Total revenues $ 463 $ 477 (3 ) (3 ) $ 889 $ 909 (2 ) (2 )
Restaurant profit $ 79 $ 85 (7 ) (7 ) $ 147 $ 150 (3 ) (3 )
Restaurant margin % 22.3 % 22.9 % (0.6 ) ppts. (0.7 ) ppts. 21.6 % 21.3 % 0.3 ppts. 0.3 ppts.
G&A expenses $ 45 $ 47 5 5 $ 91 $ 91 — (1 )
Operating Profit $ 139 $ 140 (1 ) (1 ) $ 258 $ 254 1 1
Operating margin % 29.9 % 29.3 % 0.6 ppts. 0.6 ppts. 29.0 % 28.0 % 1.0 ppts. 1.0 ppts.
Quarter ended Year to date
2016 2015 2016 2015
System Sales Growth, reported 2 % 9 % 3 % 9 %
System Sales Growth, excluding FX 2 % 9 % 3 % 9 %
Same-Store Sales Growth % (1 )% 6 % — % 6 %

% Increase
(Decrease)
Unit Count 6/11/2016 6/13/2015
Franchise & License 5,559 5,330 4
Company-owned 909 933 (3)
6,468 6,263 3
Company Sales and Restaurant Profit
The changes in Company sales and Restaurant profit were as follows:
Quarter ended
Income / (Expense) 2015
Store Portfolio
Actions Other 2016
Company sales $ 371 $ (10 ) $ (8 ) $ 353
Cost of sales (103 ) 3 9 (91 )
Cost of labor (101 ) 3 (2 ) (100 )
Occupancy and other (82 ) 2 (3 ) (83 )
Company restaurant expense $ (286 ) $ 8 $ 4 $ (274 )
Restaurant profit $ 85 $ (2 ) $ (4 ) $ 79
Year to date
Income / (Expense) 2015
Store Portfolio
Actions Other 2016
Company sales $ 707 $ (20 ) $ (9 ) $ 678
Cost of sales (198 ) 6 18 (174 )
Cost of labor (199 ) 6 (4 ) (197 )
Occupancy and other (160 ) 5 (5 ) (160 )
Company restaurant expense $ (557 ) $ 17 $ 9 $ (531 )
Restaurant profit $ 150 $ (3 ) $ — $ 147
The decrease in Company sales and Restaurant profit for the quarter associated with store portfolio actions was driven by
refranchising, partially offset by net new unit growth. Company same-store sales decreased 2% for the quarter. Significant
other factors impacting Restaurant profit were higher labor costs and store-level investments, partially offset by favorable
commodity costs.
The year to date decrease in Company sales and Restaurant profit associated with store portfolio actions was driven by
refranchising, partially offset by net new unit growth. Year to date Company same-store sales decreased 1%. Significant
other factors impacting Restaurant profit were favorable commodity costs and the favorable impact of pricing, offset by
transaction declines and higher labor costs.
Franchise and License Fees and Income
The quarterly and year to date increases in Franchise and license fees and income were driven by net new unit growth and
refranchising. Franchise and license same-store sales decreased 1% for the quarter and were flat for the year to date.

G&A Expenses
The decrease in G&A expenses for the quarter was driven by lower U.S. pension costs.
The year to date increase in G&A expenses, excluding the impact of foreign currency translation, was driven by wage inflation,
higher headcount and higher legal fees, partially offset by lower U.S. pension costs.
Operating Profit
The decrease in Operating Profit for the quarter was driven by higher restaurant operating costs and refranchising, partially
offset by net new unit growth.
The year to date increase in Operating Profit was driven by net new unit growth, partially offset by refranchising.
Restricted Group Taco Bell Division — Pro Forma
Quarter ended Year to date
% B/(W) % B/(W)
2016 2015 Reported Ex FX 2016 2015 Reported Ex FX
Company sales $ 353 $ 371 (5) (5) $ 678 $ 707 (4) (4)
Franchise and license
fees and income 6
5
23
25
12
10
23
26
Total revenues $ 359 $ 376 (4) (4) $ 690 $ 717 (4) (4)
Restaurant profit $ 60 $ 64 (8) (8) $ 110 $ 111 (2) (2)
Restaurant margin % 16.8 % 17.4 % (0.6) ppts. (0.6)
_
ppts. 16.2 % 15.8 % 0.4 ppts. 0.4 ppts.
G&A expenses $ 19 $ 21 9 9 $ 40 $ 40 (1) (1)
Operating Profit $ 42 $ 44 (7) (8) $ 73 $ 74 (2) (2)
Quarter ended Year to date
2016 2015 2016 2015
System Sales Growth, reported (3) % 5 % (3)
% 5 %
System Sales Growth, excluding FX (3) % 6 % (2) % 6 %
Same-Store Sales Growth % (2) % 5 % (1) % 5 %
% Increase
(Decrease)
Unit Count 6/11/2016 6/13/2015
Franchise & License 285 263 8
Company-owned 909 933 (3)
1,194 1,196 -
The Securitization Transaction and the exclusion of the Taco Bell Securitization Entities from the Restricted Group had the
following pro forma impact on the financial and operating data of the Taco Bell Division of the Restricted Group in comparison
to the corresponding data of the Taco Bell Division of YUM:

Units
• 5,274 and 5,067 U.S. Taco Bell franchised restaurants were excluded from our Restricted Group as of the end of
the second quarters of 2016 and 2015, respectively, as the Restricted Group will no longer receive franchise fees
from these restaurants;
Franchise and License Fees and Income
• Franchise and license fees and income decreased $104 million and $101 million for the second quarters of 2016
and 2015, respectively, due to the exclusion of the franchise fees paid by all U.S. Taco Bell franchised restaurants
as a result of the Securitization Transaction;
• Franchise and license fees and income decreased $199 million and $192 million for the years to date 2016 and
2015, respectively, due to the exclusion of the franchise fees paid by all U.S. Taco Bell franchised restaurants as
a result of the Securitization Transaction;
Company Occupancy and Other Expenses
• Company occupancy and other expenses increased $19 million and $21 million for the second quarters of 2016
and 2015, respectively, due to the payment of royalty fees of 5.5% of annual sales to the Taco Bell Securitization
Entities by all U.S. Company-owned Taco Bell restaurants (which are part of the Restricted Group);
• Company occupancy and other expenses increased $37 million and $39 million for the years to date 2016 and
2015, respectively, due to the payment of royalty fees of 5.5% of annual sales to the Taco Bell Securitization
Entities by all U.S. Company-owned Taco Bell restaurants (which are part of the Restricted Group);
G&A Expenses
• G&A expenses decreased $26 million for each of the second quarters of 2016 and 2015, respectively, due to the
management fee payable by the Taco Bell Securitization Entities to the Taco Bell Corp. as manager of the Taco
Bell Securitization Entities, which fees are recorded as a reduction of G&A expenses and on an annual basis are
equal to the sum of a base fee of $35 million plus 15.1% of total securitization cash revenue paid to the Taco Bell
Securitization Entities by franchisees for the year;
• G&A expenses decreased $51 million for each of the years to date 2016 and 2015, respectively, due to the
management fee payable by the Taco Bell Securitization Entities to the Taco Bell Corp. as manager of the Taco
Bell Securitization Entities, which fees are recorded as a reduction of G&A expenses and on an annual basis are
equal to the sum of a base fee of $35 million plus 15.1% of total securitization cash revenue paid to the Taco Bell
Securitization Entities by franchisees for the year; and
• Consequently, the overall margins of the Restricted Group were negatively impacted due to the loss of substantial
franchise and license fees from U.S. franchised Taco Bell restaurants and our obligation to pay 5.5% franchise
fees on U.S. Company-owned restaurants to the Taco Bell Securitization Entities, while maintaining the same
level of expenses (other than the reimbursement of a portion of G&A expenses through receipt of the management
fee).
The China spin-off would not have had any impact on the Taco Bell Division of the Restricted Group since there were no Taco
Bell restaurants in China.
Revenues and Restaurant Profit. The quarterly and year to date Revenues and Restaurant profit were negatively impacted by
refranchising activities resulting in Company-owned restaurants becoming part of the Taco Bell Securitization Entities and
excluded from the Restricted Group, partially offset by net-new unit growth. Company same-store sales decreased 2% for the
quarter and 1% for the year to date. Significant other factors impacting Restaurant profit for the quarter were higher labor costs
and store-level imvestments, partially offset by favorable commodity costs. Significant other factors impacting the year to date
Restaurant profit were favorable commodity costs and the favorable impact of pricing, partially offset by transaction declines
and higher labor costs.
Franchise and License Fees and Income. The quarterly and year to date increases in Franchise and license fees and income
was driven primarily by international franchise net-new unit growth.

G&A Expenses. The decrease in G&A expenses for the quarter was driven by lower U.S. pension costs. The year to date
increase in G&A expenses was driven by higher legal fees and higher salaries, partially offset by lower U.S. pension costs.
Operating Profit. The quarterly decrease in Operating Profit was driven by refranchising, partially offset by lower commodity
costs and lower G&A expense. The year to date decrease in Operating Profit was driven by refranchising, partially offset by
lower commodity costs and net new unit growth.
Corporate & Unallocated
Quarter ended Year to date
(Expense) / Income 2016 2015 % B/(W) 2016 2015 % B/(W)
Corporate G&A expenses $ (68 ) $ (46 ) (46 ) $ (116 ) $ (90 ) (28 )
Unallocated franchise and license fees and income (1 ) — NM (1 ) — NM
Unallocated franchise and license expenses (7 ) (8 ) 17 (16 ) (10 ) (55 )
Unallocated refranchising gain (loss) (See Note 4) 53 (68 ) NM 60 (58 ) NM
Other unallocated 15 — NM 7 (9 ) NM
Interest expense, net (40 ) (33 ) (22 ) (77 ) (67 ) (15 )
Income tax provision (See Note 7) (116 ) (102 ) (13 ) (248 ) (213 ) (16 )
Effective tax rate (See Note 7) 25.8 % 30.4 % 4.6 ppts. 25.4 % 26.3 % 0.9 ppts.
Corporate G&A Expenses
The quarterly and year to date increases in Corporate G&A expenses were driven by costs associated with the planned spin-off
of the China business and YUM recapitalization (See Note 4) and higher other professional fees, partially offset by lower
pension costs.
Unallocated Franchise and License Fees and Income
Unallocated Franchise and License fees and income reflects charges related to the KFC U.S. acceleration agreement. See
Note 4.
Unallocated Franchise and License Expenses
Unallocated Franchise and License expenses reflect charges related to the KFC U.S. acceleration agreement. See Note 4.
Other Unallocated
Other unallocated primarily includes foreign exchange gains and losses.
Interest Expense, Net
The quarterly and year to date increases in Interest expense, net were driven by increased outstanding borrowings. (See Note
10).
Restricted Group — Pro Forma
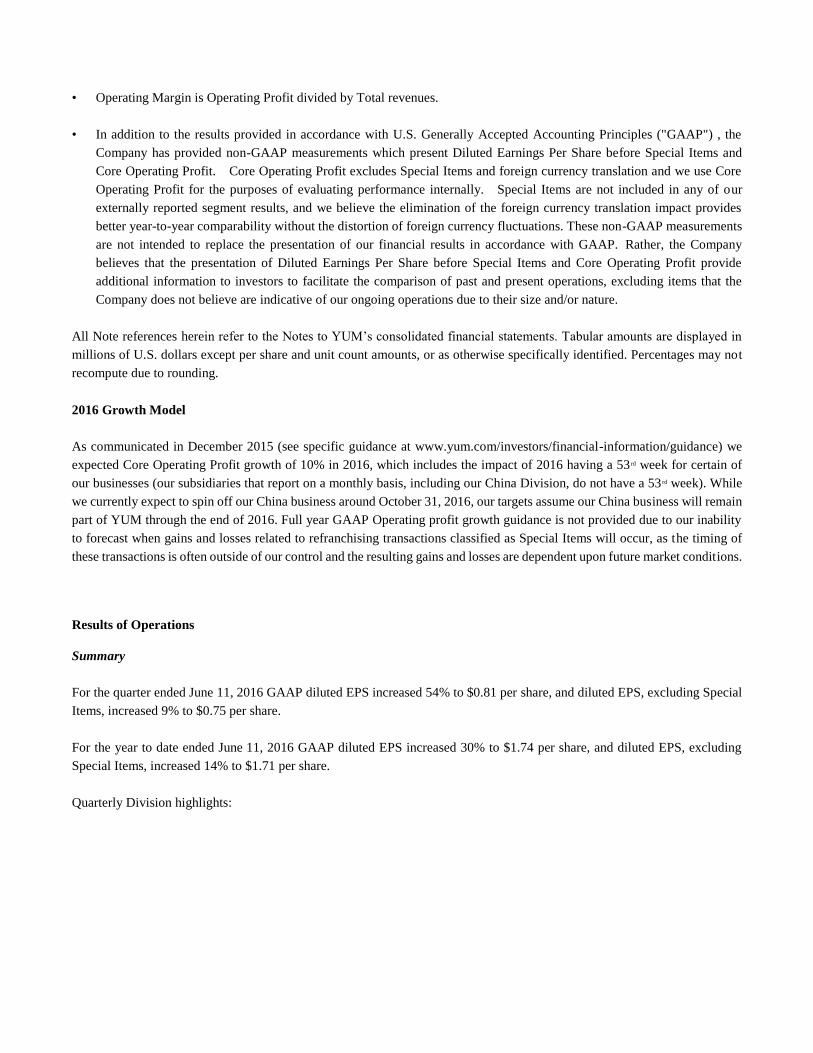
The following table sets forth certain unaudited pro forma financial data of the corporate and unallocated expenses of the
Restricted Group as of the dates and for the periods indicated after giving pro forma effect to the China spin-off and the
Financing Transactions as if they had occurred on the first day of fiscal year 2015.
Quarter ended
2016 2015 % B/(W)
Corporate G&A Expense ............................................................ $(57) $(46) (21)
Unallocated franchise and license fees and income (1) - NM
Unallocated franchise and license expense ................................ (7) (8) 17
Refranchising gain (loss) (See Note 4) ....................................... 52 (70) NM
Other unallocated ....................................................................... 15 - NM
Year to date
2016 2015 % B/(W)
Corporate G&A Expense ............................................................ $(96) $(90) (6)
Unallocated franchise and license fees and income (1) - NM
Unallocated franchise and license expense ................................ (16) (10) (55)
Refranchising gain (loss) (See Note 4) ....................................... 56 (62) NM
Other unallocated ....................................................................... 7 (9) NM
YUM’s Consolidated Cash Flows
Year to date 2016 vs. Year to date 2015
Net cash provided by operating activities was $896 million in 2016 versus $947 million in 2015. The decrease was largely
driven by an increase in restricted cash primarily due to requirements related to the Securitization Notes. See Note 10.
Net cash used in investing activities was $288 million in 2016 versus $352 million in 2015. The decrease was primarily
driven by higher refranchising proceeds.
Net cash used in financing activities was $538 million in 2016 versus $576 million in 2015. The decrease was primarily
driven by higher proceeds from net borrowings, partially offset by higher share repurchases.
YUM’s Consolidated Financial Condition
During the quarter ended June 11, 2016 we issued $2.3 billion in Securitization Notes. Also during the quarter we repaid
$300 million in Existing Senior Unsecured Notes and we repaid and terminated the Bridge Facility, which had $600 million of
outstanding borrowings as of December 26, 2015. See Note 10.
Liquidity and Capital Resources
Operating in the retail food industry allows us to generate substantial cash flows from the operations of our company-owned
stores and from our extensive franchise operations which require a limited YUM investment. These operating cash flows have
largely funded our historical capital spending and returns to shareholders in the form of cash dividends and share repurchases.
To the extent operating cash flows plus other sources of cash such as refranchising proceeds have not covered our desired levels
of capital spending and returns to shareholders, we have had borrowing capacity to fund shortfalls.
Our balance sheet often reflects a working capital deficit, which is not uncommon in our industry and is also historically
common for YUM. Company sales are paid for in cash or by credit card (which is quickly converted into cash) and our royalty

receivables from franchisees and licensees are generally due within 30 days of the period in which the related sales occur.
Substantial amounts of cash received are invested in new restaurant assets which are non-current in nature or returned to
shareholders. As part of our working capital strategy, we negotiate favorable credit terms with vendors and our on-hand
inventory turns faster than the related short-term liabilities as a result. Accordingly, it is not unusual for current liabilities to
exceed current assets. We believe such a deficit has no significant impact on our liquidity or operations.
We generate a significant amount of cash from operating activities outside the U.S. that we have used historically to fund our
international development. To the extent we have needed to repatriate international cash to fund our U.S. discretionary cash
spending, including share repurchases, dividends and debt repayments, we have historically been able to do so in a tax efficient
manner. If we experience an unforeseen decrease in our cash flows from our U.S. operations or are unable to refinance future
U.S. debt maturities, we may be required to repatriate future international earnings at tax rates higher than we have historically
experienced.
We intend to spin-off our China business from YUM into an independent, publicly-traded company around October 31, 2016.
Upon completion of the planned spin-off, YUM will become more of a “pure play” franchisor with more stable earnings, higher
profit margins, lower capital requirements and stronger cash flow conversion. As part of this transition we are returning $6.2
billion in capital to our shareholders in connection with the separation of our China business. Since we announced our
intention to separate the China business we have repurchased 34 million shares for $2.5 billion through June 11, 2016, of which
22 million shares were repurchased for $1.7 billion during the year to date ended June 11, 2016. As of the date of filing we
have repurchased 33 million shares for $2.5 billion during 2016.
This return of capital is being funded primarily through incremental borrowings as we optimize our capital structure. We
anticipate having a total company-wide leverage of approximately five times earnings before interest, taxes, depreciation and
amortization subsequent to the spin-off of our China business.
We began returning this capital by increasing our rate of share repurchases in October 2015. In December 2015, we entered
into a $1.5 billion Bridge Facility to help fund these share repurchases. In March 2016, we amended the Bridge Facility to
increase the total amount available for borrowing to $2.0 billion, of which the full amount was drawn down and outstanding as
of March 19, 2016.
Borrowing Capacity
Securitization Notes. In May 2016, Taco Bell Funding, LLC, a newly formed special purpose subsidiary of the Company,
issued an aggregate of $2.3 billion of fixed rate senior secured notes (“Class A-2 Notes”). In connection with the issuance of
the Class A-2 Notes, Taco Bell Funding, LLC also issued variable rate notes (the “Variable Funding Notes” and, together with
the Class A-2 Notes, the “Securitization Notes”) pursuant to a new revolving financing facility, which allows for the borrowing
of up to $100 million and the issuance of letters of credit.
The Company used certain of the proceeds from the sale of the Class A-2 Notes to pay down the entire outstanding balance of
$2.0 billion of its Bridge Facility, at which time the Bridge Facility was terminated, as well as to pay related fees and expenses
and fund certain accounts related to the Securitization Notes. The remaining proceeds of the Securitization Notes were used
to return capital to shareholders through share repurchases and for general corporate purposes.
Subsidiary Senior Unsecured Notes. Subsequent to the end of our second quarter, on June 16, 2016, three wholly-owned
subsidiaries of the Company, KFC Holding Co., Pizza Hut Holdings, LLC and Taco Bell of America, LLC (collectively, the
“Issuers”), issued an aggregate of $1.05 billion Senior Unsecured Notes due 2024 and an aggregate of $1.05 billion Senior
Unsecured Notes due 2026 (together, the “Subsidiary Senior Unsecured Notes”).
Credit Agreement. On June 16, 2016, each of the Issuers, as co-borrowers entered into a new credit agreement (the “Credit
Agreement”) providing for (i) a $2.0 billion Term Loan B facility (the “Term Loan B Facility”), (ii) a $500 million Term Loan
A facility (the “Term Loan A Facility”) and (iii) a $1.0 billion revolving facility (undrawn at close) (the “Revolving Facility”),
each of which may be increased subject to certain conditions.
We used certain of the proceeds from the Subsidiary Senior Unsecured Notes and the Term Loan A Facility and the Term Loan
B Facility to repay all outstanding amounts under our senior unsecured revolving credit facility (the “Existing Senior Unsecured
Credit Facility”) which had outstanding borrowings of $738 million as of June 11, 2016. Concurrent with this repayment the
Existing Senior Unsecured Credit Facility was terminated. The remaining proceeds will be used to return capital to
shareholders through share repurchases and/or a special dividend and for general corporate purposes.
The majority of our remaining long-term debt primarily comprises Existing Senior Unsecured Notes with varying maturity
dates from 2018 through 2043 and stated interest rates ranging from 3.75% to 6.88%. The notes represent senior, unsecured
obligations and rank equally in right of payment with all of our existing and future unsecured unsubordinated indebtedness.
Amounts outstanding under Existing Senior Unsecured Notes were $2.2 billion at June 11, 2016. Our Existing Senior
Unsecured Notes contain cross-default provisions whereby the acceleration of the maturity of any of our indebtedness in a
principal amount in excess of $50 million will constitute a default under the Existing Senior Unsecured Notes unless such
indebtedness is discharged, or the acceleration of the maturity of that indebtedness is annulled, within 30 days after notice.
We were in compliance with all of our debt covenant requirements at June 11, 2016.
As a result of issuing the Securitization Notes and the Subsidiary Senior Unsecured Notes as well as executing the Credit
Agreement we have completed our recapitalization plan. While we are still determining how much of the new borrowings
will ultimately pay fixed versus variable rate interest, we currently expect annualized interest expense between $425 million
and $440 million.
See Note 10 for details on the issuance of the Securitization Notes, Subsidiary Senior Unsecured Notes and the Credit
Agreement.
During the year to date ended June 11, 2016 we invested $343 million in capital spending, including $171 million in China,
$77 million in the KFC Division, $35 million in the Pizza Hut Division and $55 million in the Taco Bell Division.
During the year to date ended June 11, 2016 we paid cash dividends of $379 million in addition to the returns of capital to
shareholders noted above. Additionally, on May 20, 2016 our Board of Directors approved a cash dividend of $0.46 per share
of Common Stock, to be distributed on August 5, 2016 to shareholders of record at the close of business on July 15, 2016.
New Accounting Pronouncements Not Yet Adopted
In May 2014, the Financial Accounting Standards Board ("FASB") issued ASU No. 2014-09, Revenue from Contracts with
Customers (Topic 606) (ASU 2014-09), to provide principles within a single framework for revenue recognition of transactions
involving contracts with customers across all industries. In July 2015, the FASB approved a one-year deferral of the effective
date of the new revenue standard. ASU 2014-09 is now effective for the Company in our first quarter of fiscal 2018 with early
adoption permitted in the first quarter of 2017. The standard allows for either a full retrospective or modified retrospective
transition method. In March and April 2016, the FASB issued the following amendments to clarify the implementation
guidance: ASU No. 2016-08, Revenue from Contracts with Customers (Topic 606): Principal versus Agent Considerations
(Reporting Revenue Gross versus Net) and ASU No. 2016-10 Revenue from Contracts with Customers (Topic 606): Identifying
Performance Obligations and Licensing. We do not believe these standards will impact our recognition of revenue from
company-owned restaurants or our recognition of continuing fees from franchisees or licensees, which are based on a
percentage of franchise and license sales. We are continuing to evaluate the impact the adoption of these standards will have
on the recognition of other less significant revenue transactions such as initial fees from franchisees and refranchising of
company-owned restaurants.

In February 2016, the FASB issued ASU No. 2016-02, Leases (Topic 842), which increases transparency and comparability
among organizations by recognizing lease assets and lease liabilities on the balance sheet and disclosing key information about
leasing arrangements. ASU 2016-02 is effective for the Company in our first quarter of fiscal 2019 with early adoption
permitted. The standard must be adopted using a modified retrospective transition approach for leases existing at, or entered
into after, the beginning of the earliest comparative period presented in the financial statements. We are currently evaluating
the impact the adoption of this standard will have on our consolidated financial statements.
In March 2016, the FASB issued ASU No. 2016-09, Compensation - Stock Compensation (Topic 718): Improvements to
Employee Share-Based Payment Accounting, which is intended to simplify several aspects of the accounting for employee
share-based payment transactions, including the income tax consequences, classification of awards as either equity or liabilities,
and classification on the statement of cash flows. ASU 2016-09 is effective for the Company in our first quarter of fiscal 2017
with early adoption permitted. Upon adoption of this standard, excess tax benefits associated with share-based compensation,
which are currently recognized within Common Stock, will be reflected within the income tax provision in our Condensed
Consolidated Statements of Income. Additionally, our Condensed Consolidated Statements of Cash Flows will present such
excess tax benefits, which are currently presented as a financing activity, as an operating activity. The impact of adopting
this standard on our consolidated financial statements will be dependent on the timing and intrinsic value of future share-based
compensation award exercises.
In June 2016, the FASB issued ASU 2016-13, Financial Instruments-Credit Losses (Topic 326): Measurement of Credit Losses
on Financial Instruments, which requires measurement and recognition of expected versus incurred credit losses for financial
assets held. ASU 2016-13 is effective for the Company in our first quarter of fiscal 2020 with early adoption permitted
beginning in the first quarter of fiscal 2019. We are currently evaluating the impact the adoption of this standard will have on
our consolidated financial statements.
Cautionary Note Regarding Forward-Looking Statements
Forward-looking statements can be identified by the fact that they do not relate strictly to historical or current facts. These
statements often include words such as “may,” “will,” “estimate,” “intend,” “seek,” “expect,” “project,” “anticipate,” “believe,”
“plan,” “could,” “target,” “predict,” “likely,” “should,” “forecast,” “outlook,” “model,” “ongoing” or other similar terminology.
Forward-looking statements are based on our current expectations, estimates, assumptions or projections concerning future
results or events, including, without limitation, statements regarding the intended capital return to shareholders as well as the
related borrowing required to fund such capital return, the planned separation of Yum China from Yum, the timing of any such
separation, the future earnings and performance as well as capital structure of Yum! Brands, Inc. or any of its businesses,
including the Yum! Brands and Yum! China businesses on a standalone basis if the separation is completed. Forward-looking
statements are neither predictions nor guarantees of future events, circumstances or performance and are inherently subject to
known and unknown risks, uncertainties and assumptions that could cause our actual results to differ materially from those
indicated by those statements. We cannot assure you that any of our expectations, estimates or projections will be achieved.
Factors that could cause actual results and events to differ materially from our expectations and forward-looking statements
include (i) the risks and uncertainties described above under Management's Discussion and Analysis of Financial Condition
and Results of Operations, (ii) the risks and uncertainties described in the Risk Factors included in Part I, Item 1A of our 2015
10-K and Part II, Item 1A of our Second Quarter 10-Q and (iii) the factors described in the Management's Discussion and
Analysis of Financial Condition and Results of Operations included in Part II, Item 7 of our 2015 10-K. You should not place
undue reliance on forward-looking statements, which speak only as of the date hereof. We are not undertaking to update any
of these statements.