Embed Size (px)
Citation preview
Management’s Discussion and Analysis Q2 - 11
On the TSX: AX.UN AX.DB.C AX.DB.E AX.DB.F AX.DB.U
ARTIS REAL ESTATE INVESTMENT TRUSTManagement's Discussion and Analysis - Q2-11(In thousands of Canadian dollars, unless otherwise noted)
MANAGEMENT’S DISCUSSION AND ANALYSIS
The following management's discussion and analysis (“MD&A”) of the financial condition and results of operations ofArtis Real Estate Investment Trust (“Artis" or the "REIT”) should be read in conjunction with the REIT’s unauditedinterim consolidated financial statements for the three month period ended June 30, 2011, and the notes thereto.This MD&A has been prepared taking into account material transactions and events up to and includingAugust 10, 2011. Additional information about Artis, including the REIT’s most recent Annual Information Form, hasbeen filed with applicable Canadian securities regulatory authorities and is available at www.sedar.com or on ourweb site at www.artisreit.com.
FORWARD-LOOKING DISCLAIMER
This MD&A contains forward-looking statements. For this purpose, any statements contained herein that are notstatements of historical fact may be deemed to be forward-looking statements. Particularly, statements regardingthe REIT's future operating results, performance and achievements are forward-looking statements. Without limitingthe foregoing, the words “expects”, “anticipates”, “intends”, “estimates”, “projects”, and similar expressions areintended to identify forward-looking statements.
Artis is subject to significant risks and uncertainties which may cause the actual results, performance orachievements of the REIT to be materially different from any future results, performance or achievements expressedor implied in these forward-looking statements. Such risk factors include, but are not limited to, risks associated withreal property ownership, availability of cash flow, general uninsured losses, future property acquisitions,environmental matters, tax related matters, debt financing, unitholder liability, potential conflicts of interest, potentialdilution, reliance on key personnel, changes in legislation and changes in the tax treatment of trusts. Artis cannotassure investors that actual results will be consistent with any forward-looking statements and Artis assumes noobligation to update or revise such forward-looking statements to reflect actual events or new circumstances. Allforward-looking statements contained in this MD&A are qualified by this cautionary statement.
NOTICE RESPECTING NON-GAAP MEASURES
Property Net Operating Income (“Property NOI”) and Funds from Operations (“FFO”) are non-GAAP measurescommonly used by Canadian real estate investment trusts as an indicator of financial performance. "GAAP" meansthe generally accepted accounting principles described by the Canadian Institute of Chartered Accountants ("CICA")Handbook - Accounting, which are applicable as at the date on which any calculation using GAAP is to be made. Asa publicly accountable enterprise, Artis applies the International Financial Reporting Standards (“IFRS”) described inPart I of the CICA Handbook - Accounting.
Artis calculates Property NOI as revenues, prepared in accordance with IFRS, less property operating expensessuch as taxes, utilities, repairs and maintenance. Property NOI does not include charges for interest andamortization. Management considers Property NOI to be a valuable measure for evaluating the operatingperformance of the REIT's properties.
Artis calculates FFO substantially in accordance with the guidelines set out by the Real Property Association ofCanada (“REALpac”), as issued in June 2010 for entities adopting IFRS. These guidelines include certain additionaladjustments to FFO under IFRS from the previous definition of FFO. Management considers FFO to be a valuablemeasure for evaluating the REIT’s operating performance in achieving its objectives.
Property NOI and FFO are not measures defined under IFRS. Property NOI and FFO are not intended to representoperating profits for the period, or from a property, nor should any of these measures be viewed as an alternative tonet income, cash flow from operating activities or other measures of financial performance calculated in accordancewith IFRS. Readers should be further cautioned that Property NOI and FFO as calculated by Artis may not becomparable to similar measures presented by other issuers.
Page 1
ARTIS REAL ESTATE INVESTMENT TRUSTManagement's Discussion and Analysis - Q2-11(In thousands of Canadian dollars, unless otherwise noted)
TABLE OF CONTENTS
OVERVIEW 3 Primary Objectives 3 U.S. Investment Strategy 3 Portfolio Summary 4
2011 - SECOND QUARTER HIGHLIGHTS 6 Portfolio Growth 6 Financing Activities 7 Internalization of Asset Management 7 Distributions 7
SELECTED FINANCIAL INFORMATION 8
INTERNATIONAL FINANCIAL REPORTING STANDARDS 8
ANALYSIS OF OPERATING RESULTS 13 Revenue and Property NOI 13 Same Property NOI Growth 13 Property NOI by Asset Class 14 Property NOI by Geographical Region 15 Portfolio Occupancy 16 Portfolio Leasing Activity and Lease Expiries 17 Interest Expense 22 Corporate Expense 22 Foreign Currency Translation Gain 22 Income Tax Expense 23
Transaction Costs 23(Loss) Gain on Financial Instruments 23
Unrealized Fair Value Gain on Investment Properties 24 Other Comprehensive Loss 24 Distributable Income 24 Distributions 24 Funds from Operations 25
ANALYSIS OF FINANCIAL POSITION 28 Assets 28 Liabilities 30 Unitholders' Equity 32
LIQUIDITY AND CAPITAL RESOURCES 32 Contractual Obligations 32
SUMMARIZED QUARTERLY INFORMATION 33
RELATED PARTY TRANSACTIONS 35
OUTSTANDING UNIT DATA 36
2011 OUTLOOK 36
RISKS AND UNCERTAINTIES 37 Real Estate Ownership 37 Interest Rate and Debt Financing 37 Credit Risk and Tenant Concentration 38 Lease Rollover Risk 39 Tax Risk 39 Foreign Currency Risk 40 Other Risks 40
CRITICAL ACCOUNTING ESTIMATES 40 Valuation of Investment Properties 40 Valuation of Convertible Debentures 40 Valuation of Deferred Tax Assets and Liabilities 41
CHANGES IN ACCOUNTING POLICIES 41
CONTROLS AND PROCEDURES 42 Internal Controls over Financial Reporting 42 Disclosure Controls and Procedures 42
Page 2
ARTIS REAL ESTATE INVESTMENT TRUSTManagement's Discussion and Analysis - Q2-11(In thousands of Canadian dollars, unless otherwise noted)
OVERVIEW
Artis is an unincorporated open-end real estate investment trust created under, and governed by, the laws of theprovince of Manitoba. On February 15, 2007, Artis underwent a name change from “Westfield Real EstateInvestment Trust” to “Artis Real Estate Investment Trust”. On May 14, 2009, unitholders authorized the trustees ofArtis to implement certain amendments to Artis' Declaration of Trust which, if implemented, would have the effect ofconverting Artis to a closed-end trust. As at August 10, 2011, the trustees of Artis have not yet implemented suchamendments. On May 19, 2011, the Declaration of Trust was further amended at the Annual and Special Meeting ofUnitholders.
Certain of the REIT’s securities are listed on the Toronto Stock Exchange (the "TSX”). The REIT's trust units("units") trade under the symbol AX.UN, and the REIT’s Series C, Series E, Series F and Series G convertibledebentures trade under the symbols AX.DB.C, AX.DB.E, AX.DB.F, and AX.DB.U respectively. As atAugust 10, 2011, there were 83,338,666 units, and 2,238,000 options of Artis outstanding (refer to the OutstandingUnit Data section for further details).
PRIMARY OBJECTIVES
Artis REIT’s primary objective is to maximize total returns to our unitholders. Returns include a stable, reliable andtax efficient monthly cash distribution as well as long-term appreciation in the value of Artis REIT’s units.
Artis REIT’s management employs several key strategies to meet our primary objective:
Portfolio Diversification. We build stability into our cash flows through a strategy of diversification. Ourcommercial properties are well diversified across the industrial, retail and office asset classes. We are alsogeographically diversified with properties owned across western Canada, as well as Ontario and in selectmarkets in the United States ("U.S.").
Portfolio Expansion. We build growth into our cash flows through the efficient sourcing and deployment ofcapital into high-quality and accretive acquisition opportunities in our target markets, or into high-yieldintensification or (re)development opportunities that exist within our property portfolio.
Managing for Value Creation. We build value through the active management of our portfolio, leveraging offthe experience and expertise of our management team. We focus on maximizing property value and cash flowsover the long-term, creating additional value through the selective disposition of assets at premium prices, andreinvesting and repositioning the portfolio on an on-going basis in higher growth markets.
The Declaration of Trust provides that Artis may make monthly cash distributions to its unitholders. The amountdistributed annually (currently $1.08 per unit on an annualized basis effective May 31, 2008) will be set by theTrustees.
U.S. INVESTMENT STRATEGY
At June 30, 2011, approximately 13.6% of Artis' portfolio weighting by run-rate Property NOI is in the United States.Historically, commercial real estate in the U.S. has been more expensive and offered lower unlevered yields thansimilar property in Canada. This has now changed, and Canadian investors are able to acquire quality U.S.properties at relatively higher yields than in Canada. Artis’ management believes that this window of opportunity willnot be open for long and has adopted a disciplined approach in pursuing U.S. acquisitions while the opportunityexists, as follows:
total weighting of U.S. properties in Artis’ portfolio will not exceed 20% by pro-forma Property NOI. unlevered yield will be accretive, and higher than that available for a comparable property in Canada. low interest, conventional mortgage financing will be available. quality local third party property management will be available. property will be “new generation”, thus reducing the average age of Artis’ overall portfolio. the tenant credit and lease expiry profile for the property will be more conservative than that of a comparable
property in Canada, thus improving the credit profile of Artis’ overall portfolio.
Page 3
ARTIS REAL ESTATE INVESTMENT TRUSTManagement's Discussion and Analysis - Q2-11(In thousands of Canadian dollars, unless otherwise noted)
PORTFOLIO SUMMARY
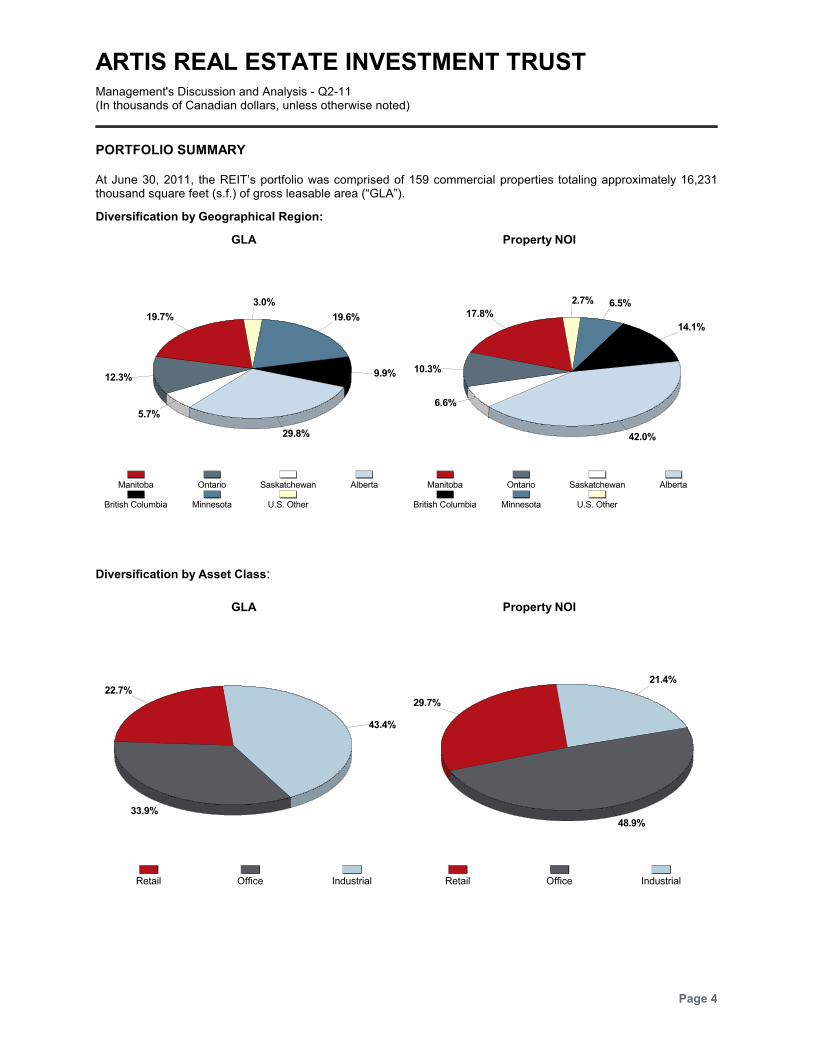
At June 30, 2011, the REIT’s portfolio was comprised of 159 commercial properties totaling approximately 16,231thousand square feet (s.f.) of gross leasable area (“GLA”).
Diversification by Geographical Region:
GLA Property NOI
19.7%
12.3%
5.7%
29.8%
9.9%
19.6%
3.0%
Manitoba Ontario Saskatchewan Alberta
British Columbia Minnesota U.S. Other
17.8%
10.3%
6.6%
42.0%
14.1%
6.5%2.7%
Manitoba Ontario Saskatchewan Alberta
British Columbia Minnesota U.S. Other
Diversification by Asset Class:
GLA Property NOI
22.7%
33.9%
43.4%
Retail Office Industrial
29.7%
48.9%
21.4%
Retail Office Industrial
Page 4
ARTIS REAL ESTATE INVESTMENT TRUSTManagement's Discussion and Analysis - Q2-11(In thousands of Canadian dollars, unless otherwise noted)
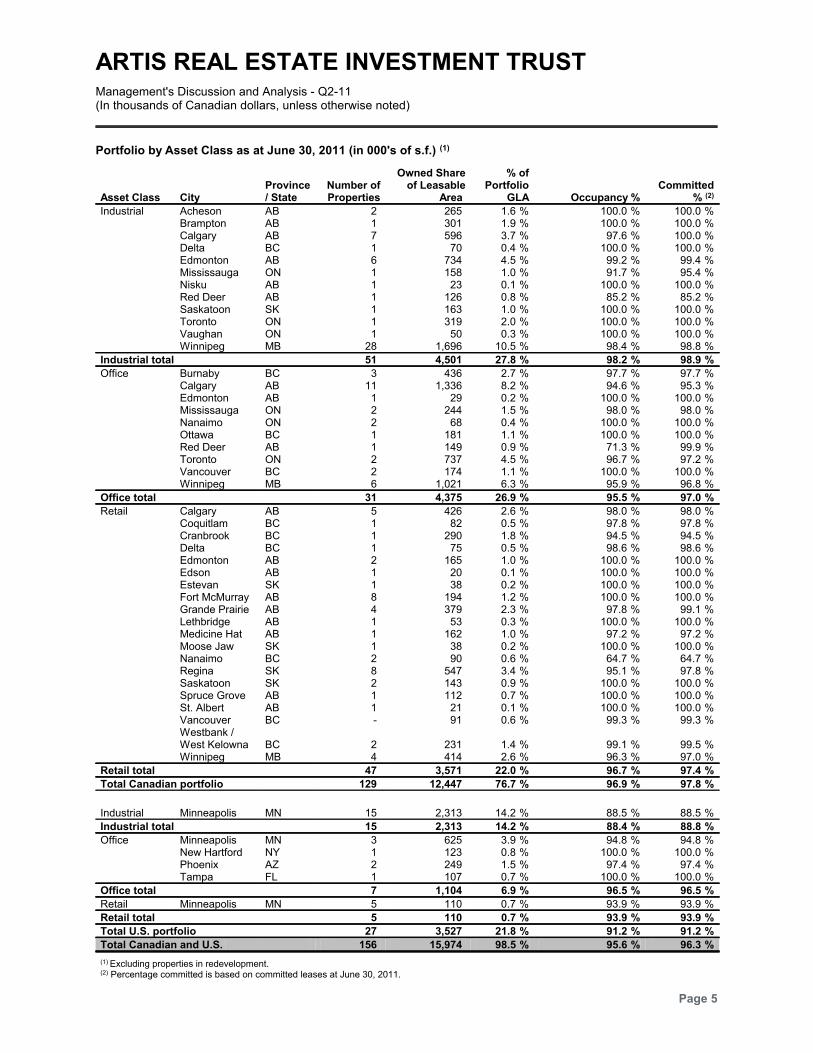
Portfolio by Asset Class as at June 30, 2011 (in 000's of s.f.) (1)
Asset Class CityProvince/ State
Number ofProperties
Owned Shareof Leasable
Area
% ofPortfolio
GLA Occupancy %Committed
% (2)
Industrial Acheson AB 2 265 %1.6 %100.0 %100.0Brampton AB 1 301 %1.9 %100.0 %100.0Calgary AB 7 596 %3.7 %97.6 %100.0Delta BC 1 70 %0.4 %100.0 %100.0Edmonton AB 6 734 %4.5 %99.2 %99.4Mississauga ON 1 158 %1.0 %91.7 %95.4Nisku AB 1 23 %0.1 %100.0 %100.0Red Deer AB 1 126 %0.8 %85.2 %85.2Saskatoon SK 1 163 %1.0 %100.0 %100.0Toronto ON 1 319 %2.0 %100.0 %100.0Vaughan ON 1 50 %0.3 %100.0 %100.0Winnipeg MB 28 1,696 %10.5 %98.4 %98.8
Industrial total 51 4,501 %27.8 %98.2 %98.9
Office Burnaby BC 3 436 %2.7 %97.7 %97.7Calgary AB 11 1,336 %8.2 %94.6 %95.3Edmonton AB 1 29 %0.2 %100.0 %100.0Mississauga ON 2 244 %1.5 %98.0 %98.0Nanaimo ON 2 68 %0.4 %100.0 %100.0Ottawa BC 1 181 %1.1 %100.0 %100.0Red Deer AB 1 149 %0.9 %71.3 %99.9Toronto ON 2 737 %4.5 %96.7 %97.2Vancouver BC 2 174 %1.1 %100.0 %100.0Winnipeg MB 6 1,021 %6.3 %95.9 %96.8
Office total 31 4,375 %26.9 %95.5 %97.0
Retail Calgary AB 5 426 %2.6 %98.0 %98.0Coquitlam BC 1 82 %0.5 %97.8 %97.8Cranbrook BC 1 290 %1.8 %94.5 %94.5Delta BC 1 75 %0.5 %98.6 %98.6Edmonton AB 2 165 %1.0 %100.0 %100.0Edson AB 1 20 %0.1 %100.0 %100.0Estevan SK 1 38 %0.2 %100.0 %100.0Fort McMurray AB 8 194 %1.2 %100.0 %100.0Grande Prairie AB 4 379 %2.3 %97.8 %99.1Lethbridge AB 1 53 %0.3 %100.0 %100.0Medicine Hat AB 1 162 %1.0 %97.2 %97.2Moose Jaw SK 1 38 %0.2 %100.0 %100.0Nanaimo BC 2 90 %0.6 %64.7 %64.7Regina SK 8 547 %3.4 %95.1 %97.8Saskatoon SK 2 143 %0.9 %100.0 %100.0Spruce Grove AB 1 112 %0.7 %100.0 %100.0St. Albert AB 1 21 %0.1 %100.0 %100.0Vancouver BC - 91 %0.6 %99.3 %99.3Westbank /West Kelowna BC 2 231 %1.4 %99.1 %99.5Winnipeg MB 4 414 %2.6 %96.3 %97.0
Retail total 47 3,571 %22.0 %96.7 %97.4
Total Canadian portfolio 129 12,447 %76.7 %96.9 %97.8
Industrial Minneapolis MN 15 2,313 %14.2 %88.5 %88.5
Industrial total 15 2,313 %14.2 %88.4 %88.8
Office Minneapolis MN 3 625 %3.9 %94.8 %94.8New Hartford NY 1 123 %0.8 %100.0 %100.0Phoenix AZ 2 249 %1.5 %97.4 %97.4Tampa FL 1 107 %0.7 %100.0 %100.0
Office total 7 1,104 %6.9 %96.5 %96.5
Retail Minneapolis MN 5 110 %0.7 %93.9 %93.9
Retail total 5 110 %0.7 %93.9 %93.9
Total U.S. portfolio 27 3,527 %21.8 %91.2 %91.2
Total Canadian and U.S. 156 15,974 %98.5 %95.6 %96.3
(1) Excluding properties in redevelopment.(2) Percentage committed is based on committed leases at June 30, 2011.
Page 5
ARTIS REAL ESTATE INVESTMENT TRUSTManagement's Discussion and Analysis - Q2-11(In thousands of Canadian dollars, unless otherwise noted)
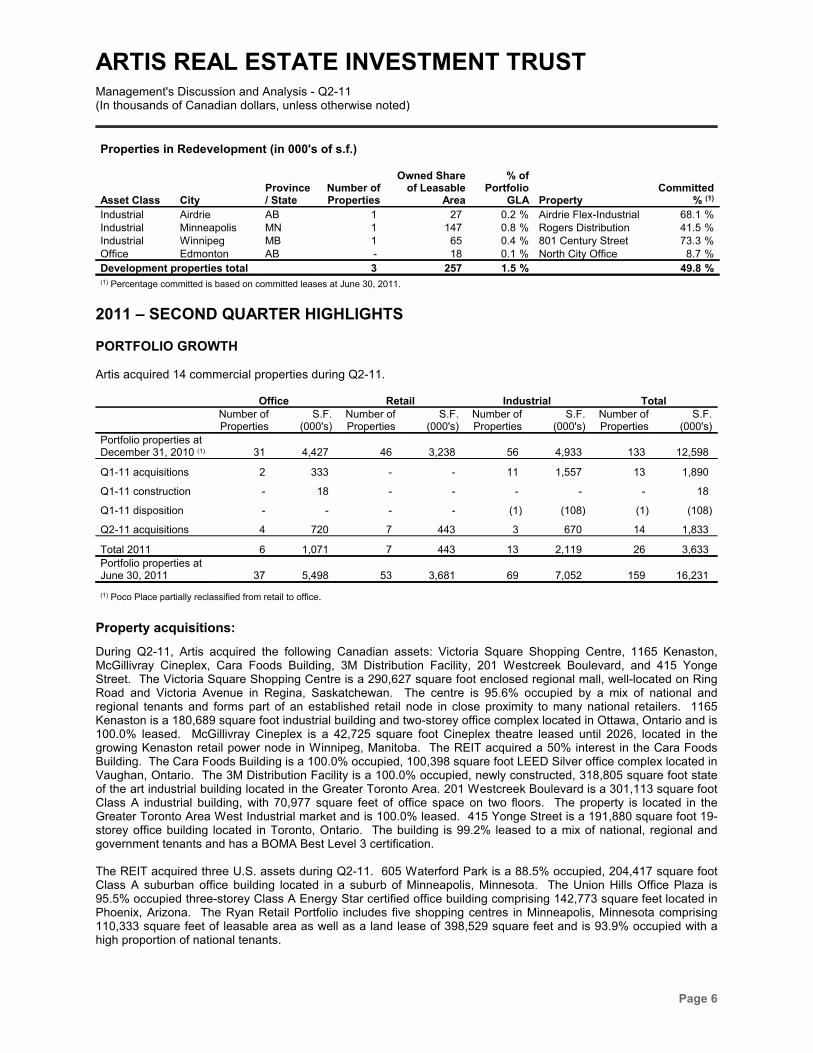
Properties in Redevelopment (in 000's of s.f.)
Asset Class CityProvince/ State
Number ofProperties
Owned Shareof Leasable
Area
% ofPortfolio
GLA PropertyCommitted
% (1)
Industrial Airdrie AB 1 27 %0.2 Airdrie Flex-Industrial %68.1Industrial Minneapolis MN 1 147 %0.8 Rogers Distribution %41.5Industrial Winnipeg MB 1 65 %0.4 801 Century Street %73.3Office Edmonton AB - 18 %0.1 North City Office %8.7
Development properties total 3 257 %1.5 %49.8(1) Percentage committed is based on committed leases at June 30, 2011.
2011 – SECOND QUARTER HIGHLIGHTS
PORTFOLIO GROWTH
Artis acquired 14 commercial properties during Q2-11.
Office Retail Industrial TotalNumber ofProperties
S.F.(000's)
Number ofProperties
S.F.(000's)
Number ofProperties
S.F.(000's)
Number ofProperties
S.F.(000's)
Portfolio properties atDecember 31, 2010 (1) 31 4,427 46 3,238 56 4,933 133 12,598
Q1-11 acquisitions 2 333 - - 11 1,557 13 1,890
Q1-11 construction - 18 - - - - - 18
Q1-11 disposition - - - - (1) (108) (1) (108)
Q2-11 acquisitions 4 720 7 443 3 670 14 1,833
Total 2011 6 1,071 7 443 13 2,119 26 3,633
Portfolio properties atJune 30, 2011 37 5,498 53 3,681 69 7,052 159 16,231
(1) Poco Place partially reclassified from retail to office.
Property acquisitions:
During Q2-11, Artis acquired the following Canadian assets: Victoria Square Shopping Centre, 1165 Kenaston,McGillivray Cineplex, Cara Foods Building, 3M Distribution Facility, 201 Westcreek Boulevard, and 415 YongeStreet. The Victoria Square Shopping Centre is a 290,627 square foot enclosed regional mall, well-located on RingRoad and Victoria Avenue in Regina, Saskatchewan. The centre is 95.6% occupied by a mix of national andregional tenants and forms part of an established retail node in close proximity to many national retailers. 1165Kenaston is a 180,689 square foot industrial building and two-storey office complex located in Ottawa, Ontario and is100.0% leased. McGillivray Cineplex is a 42,725 square foot Cineplex theatre leased until 2026, located in thegrowing Kenaston retail power node in Winnipeg, Manitoba. The REIT acquired a 50% interest in the Cara FoodsBuilding. The Cara Foods Building is a 100.0% occupied, 100,398 square foot LEED Silver office complex located inVaughan, Ontario. The 3M Distribution Facility is a 100.0% occupied, newly constructed, 318,805 square foot stateof the art industrial building located in the Greater Toronto Area. 201 Westcreek Boulevard is a 301,113 square footClass A industrial building, with 70,977 square feet of office space on two floors. The property is located in theGreater Toronto Area West Industrial market and is 100.0% leased. 415 Yonge Street is a 191,880 square foot 19-storey office building located in Toronto, Ontario. The building is 99.2% leased to a mix of national, regional andgovernment tenants and has a BOMA Best Level 3 certification.
The REIT acquired three U.S. assets during Q2-11. 605 Waterford Park is a 88.5% occupied, 204,417 square footClass A suburban office building located in a suburb of Minneapolis, Minnesota. The Union Hills Office Plaza is95.5% occupied three-storey Class A Energy Star certified office building comprising 142,773 square feet located inPhoenix, Arizona. The Ryan Retail Portfolio includes five shopping centres in Minneapolis, Minnesota comprising110,333 square feet of leasable area as well as a land lease of 398,529 square feet and is 93.9% occupied with ahigh proportion of national tenants.
Page 6

ARTIS REAL ESTATE INVESTMENT TRUSTManagement's Discussion and Analysis - Q2-11(In thousands of Canadian dollars, unless otherwise noted)
FINANCING ACTIVITIES
Series G convertible debenture offering:
On April 21, 2011, Artis issued a US$88,000 public offering of 7-year convertible redeemable unsecuredsubordinated debentures (the “Series G Debentures”). This includes US$8,000 of the Series G convertibledebentures issued pursuant to the exercise of the underwriters’ over-allotment option. The Series G convertibledebentures pay interest at a rate of 5.75% per annum and are listed on the Toronto Stock Exchange under thetrading symbol AX.DB.U.
Equity offering:
On June 28, 2011, Artis issued 7,100,000 units at a price of $14.10 per unit for aggregate gross proceeds of$100,110. This includes 700,000 units issued pursuant to the exercise of the underwriters' over-allotment option.
Short-form base shelf prospectus:
On July 28, 2010, the REIT issued a base shelf prospectus. The REIT may from time to time during the 25-monthperiod that this short-form base shelf prospectus is valid, offer and issue the following securities up to a maximum of$750,000 of initial offering price: (i) trust units of the REIT; (ii) preferred trust units, which may be issuable in series;(iii) debt securities, which may consist of debentures, notes or other types of debt and may be issuable in series; (iv)unit purchase warrants; and (v) subscription receipts to purchase trust securities.
At-the-market equity financing program:
On September 17, 2010, Artis entered into an Equity Distribution Agreement with an exclusive agent for the issuanceand sale, from time to time, until September 19, 2012 of up to 5,300,000 units of the REIT by way of "at-the-marketdistributions". The timing of any sale of units and the number of units actually sold during such period are at thediscretion of the REIT. Sales of units, if any, pursuant to the Equity Distribution Agreement will be made intransactions that are deemed to be "at-the-market distributions", including sales made directly by the Toronto StockExchange. No units have been issued pursuant to this arrangement in Q2-11.
INTERNALIZATION OF ASSET MANAGEMENT
On November 9, 2010, Artis announced that the REIT and Marwest Realty Advisors Inc. have agreed to negotiate ingood faith the terms and conditions upon which Artis will internalize its asset management, with a view to completingsuch internalization by no later than December 31, 2011. Negotiations with the board are ongoing and the processis on track for completion at December 31, 2011.
DISTRIBUTIONS
Artis distributed a total of $21,161 (YTD - $41,594) to unitholders in Q2-11, of which $2,409 (YTD - $4,060) was paidby way of distribution reinvestment, pursuant to Artis' Distribution Reinvestment and Unit Purchase Plan ("DRIP").
Page 7
ARTIS REAL ESTATE INVESTMENT TRUSTManagement's Discussion and Analysis - Q2-11(In thousands of Canadian dollars, unless otherwise noted)
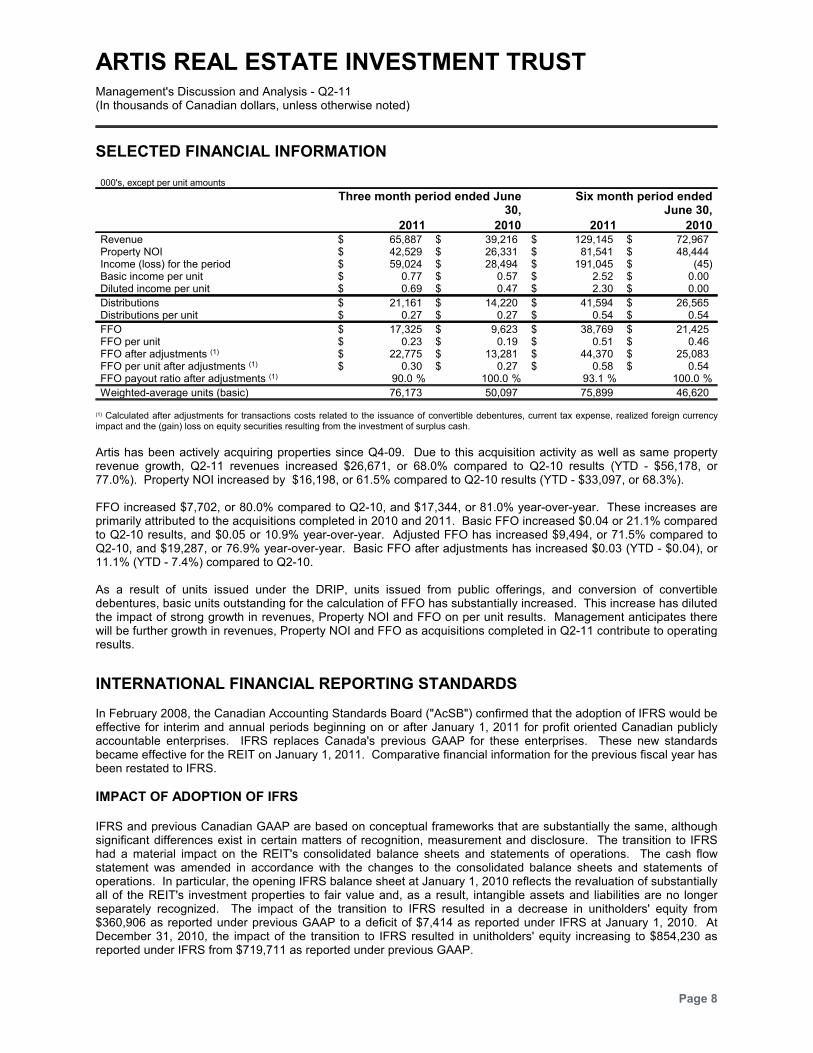
SELECTED FINANCIAL INFORMATION
000's, except per unit amounts
Three month period ended June30,
Six month period endedJune 30,
2011 2010 2011 2010Revenue $ 65,887 $ 39,216 $ 129,145 $ 72,967Property NOI $ 42,529 $ 26,331 $ 81,541 $ 48,444Income (loss) for the period $ 59,024 $ 28,494 $ 191,045 $ (45)Basic income per unit $ 0.77 $ 0.57 $ 2.52 $ 0.00Diluted income per unit $ 0.69 $ 0.47 $ 2.30 $ 0.00
Distributions $ 21,161 $ 14,220 $ 41,594 $ 26,565Distributions per unit $ 0.27 $ 0.27 $ 0.54 $ 0.54
FFO $ 17,325 $ 9,623 $ 38,769 $ 21,425FFO per unit $ 0.23 $ 0.19 $ 0.51 $ 0.46FFO after adjustments (1) $ 22,775 $ 13,281 $ 44,370 $ 25,083FFO per unit after adjustments (1) $ 0.30 $ 0.27 $ 0.58 $ 0.54FFO payout ratio after adjustments (1) %90.0 %100.0 %93.1 %100.0
Weighted-average units (basic) 76,173 50,097 75,899 46,620
(1) Calculated after adjustments for transactions costs related to the issuance of convertible debentures, current tax expense, realized foreign currencyimpact and the (gain) loss on equity securities resulting from the investment of surplus cash.
Artis has been actively acquiring properties since Q4-09. Due to this acquisition activity as well as same propertyrevenue growth, Q2-11 revenues increased $26,671, or 68.0% compared to Q2-10 results (YTD - $56,178, or77.0%). Property NOI increased by $16,198, or 61.5% compared to Q2-10 results (YTD - $33,097, or 68.3%).
FFO increased $7,702, or 80.0% compared to Q2-10, and $17,344, or 81.0% year-over-year. These increases areprimarily attributed to the acquisitions completed in 2010 and 2011. Basic FFO increased $0.04 or 21.1% comparedto Q2-10 results, and $0.05 or 10.9% year-over-year. Adjusted FFO has increased $9,494, or 71.5% compared toQ2-10, and $19,287, or 76.9% year-over-year. Basic FFO after adjustments has increased $0.03 (YTD - $0.04), or11.1% (YTD - 7.4%) compared to Q2-10.
As a result of units issued under the DRIP, units issued from public offerings, and conversion of convertibledebentures, basic units outstanding for the calculation of FFO has substantially increased. This increase has dilutedthe impact of strong growth in revenues, Property NOI and FFO on per unit results. Management anticipates therewill be further growth in revenues, Property NOI and FFO as acquisitions completed in Q2-11 contribute to operatingresults.
INTERNATIONAL FINANCIAL REPORTING STANDARDS
In February 2008, the Canadian Accounting Standards Board ("AcSB") confirmed that the adoption of IFRS would beeffective for interim and annual periods beginning on or after January 1, 2011 for profit oriented Canadian publiclyaccountable enterprises. IFRS replaces Canada's previous GAAP for these enterprises. These new standardsbecame effective for the REIT on January 1, 2011. Comparative financial information for the previous fiscal year hasbeen restated to IFRS.
IMPACT OF ADOPTION OF IFRS
IFRS and previous Canadian GAAP are based on conceptual frameworks that are substantially the same, althoughsignificant differences exist in certain matters of recognition, measurement and disclosure. The transition to IFRShad a material impact on the REIT's consolidated balance sheets and statements of operations. The cash flowstatement was amended in accordance with the changes to the consolidated balance sheets and statements ofoperations. In particular, the opening IFRS balance sheet at January 1, 2010 reflects the revaluation of substantiallyall of the REIT's investment properties to fair value and, as a result, intangible assets and liabilities are no longerseparately recognized. The impact of the transition to IFRS resulted in a decrease in unitholders' equity from$360,906 as reported under previous GAAP to a deficit of $7,414 as reported under IFRS at January 1, 2010. AtDecember 31, 2010, the impact of the transition to IFRS resulted in unitholders' equity increasing to $854,230 asreported under IFRS from $719,711 as reported under previous GAAP.
Page 8
ARTIS REAL ESTATE INVESTMENT TRUSTManagement's Discussion and Analysis - Q2-11(In thousands of Canadian dollars, unless otherwise noted)
FIRST-TIME ADOPTION OF IFRS
IFRS 1 - First Time Adoption of International Financial Reporting Standards ("IFRS 1") contains all the transitionalrecognition, measurement, presentation and disclosure requirements applicable for an entity's initial adoption ofIFRS. Included in IFRS 1 is a requirement for retrospective application of each IFRS, with certain mandatoryexceptions and limited optional exceptions available. In accordance with IFRS 1, the REIT elected to apply IFRSprospectively to all business combinations that occurred on or after the January 1, 2010 transition date. Theremaining optional exemptions are either not applicable to Artis or not utilized in the transition to IFRS. Inaccordance with IFRS 1, the REIT has applied the mandatory exception from full retrospective application of IFRSwith respect to estimates. Hindsight was not used to create or revise estimates and accordingly the estimatespreviously made by the REIT under previous GAAP are consistent with their application under IFRS at January 1,2010. The remaining mandatory exceptions are not applicable to the REIT.
IMPACT OF IFRS ON 2010 FINANCIAL POSITION
Investment properties and investment properties under construction:
The REIT considers its commercial properties to be investment properties under IAS 40 - Investment Property.Investment property is property held to earn rental income or for capital appreciation or both, rather than for use inthe production or supply of goods or services, for administrative purposes or for sale in the ordinary course ofbusiness. Under IFRS, investment properties are recognized initially at cost. Subsequent to initial recognition, anentity chooses as its accounting policy either the fair value model or the cost model and should apply that policy toall of its investment properties.
The REIT has elected to measure its investment properties at fair value. The fair value of the REIT's investmentproperties at January 1, 2010 is $1,111,586, which is $76,055 greater than the carrying value under previous GAAP,inclusive of related intangible assets, leasing costs, intangible liabilities, straight-line rent receivables, tenantincentives and tenant improvements which were recorded separately under previous GAAP. There was acorresponding $76,055 decrease to deficit at January 1, 2010. At December 31, 2010, the fair value of investmentproperties is $2,052,780 and the carrying value of investment properties under construction is $5,405, which is$153,523 greater than the carrying value under previous GAAP. There was a corresponding $153,523 decrease todeficit at December 31, 2010.
The REIT determined the fair value of investment properties based upon a combination of generally acceptedappraisal methodologies: the discounted cash flow method and the overall capitalization method. Under thediscounted cash flow method, expected future cash flows for each investment property were discounted, generallyover a term of 10 years, using weighted-average rates of approximately 8.79% at January 1, 2010 and 8.60% atDecember 31, 2010. Expected future cash flows for each investment property have been based upon, but notlimited to, rental income from current leases, budgeted and actual expenses, and assumptions about rental incomefrom future leases. Under the overall capitalization method, year one income was stabilized and capped atweighted-average capitalization rates of approximately 7.69% at January 1, 2010 and 7.74% at December 31, 2010.
Investment properties under construction have been measured at cost, which approximates fair value.
Other assets:
Tenant inducements reflected in other assets under previous GAAP are included in the carrying amount ofinvestment properties under IFRS. Additionally, intangible assets and leasing costs have been derecognized underIFRS as these amounts are inherently reflected in the fair value of investment properties. This resulted in adecrease to other assets of $119,440 at January 1, 2010 and $266,707 at December 31, 2010.
Deferred taxes:
As a result of the accounting policy decision to measure investment properties at fair value under IFRS, the deferredtax asset decreased from $297 under previous GAAP to a liability of $201 under IFRS at December 31, 2010. Thiswas due to the change in the measurement of the carrying value of investment properties from amortized cost underprevious GAAP to fair value under IFRS.
Page 9
ARTIS REAL ESTATE INVESTMENT TRUSTManagement's Discussion and Analysis - Q2-11(In thousands of Canadian dollars, unless otherwise noted)
Notes receivable:
Under previous GAAP, Artis did not present a classified balance sheet. Under IFRS, the REIT has presented thecurrent and non-current portion of notes receivable as separate classifications in its balance sheets.
Accounts receivable and other receivables:
Straight-line rent receivables reflected in other receivables under previous GAAP are included in the carrying amountof investment properties under IFRS. This resulted in a decrease to accounts receivable and other receivables of$5,914 at January 1, 2010 and $8,752 at December 31, 2010.
Mortgages and loans payable:
Under previous GAAP, Artis did not present a classified balance sheet. Under IFRS, the REIT has presented thecurrent and non-current portion of mortgages and loans payable as separate classifications in its balance sheets.
Convertible debentures:
The REIT's convertible debentures are to be settled by redeemable trust units. Accordingly, under IFRS, an entitychooses as its accounting policy to either fair value the debentures in their entirety with the value recorded as aliability or separate the debentures into their components with the value ascribed to the conversion option recordedas a derivative liability at fair value. Under previous GAAP, convertible debentures were recorded as compoundfinancial instruments and allocated between a liability and equity component at the time of issue. The REIT haselected to fair value its convertible debentures in their entirety. This resulted in an increase to the liability componentof convertible debentures of $17,193, a decrease to the equity component of convertible debentures of $9,926 andan increase to deficit of $7,267 at January 1, 2010. At December 31, 2010, the liability component of convertibledebentures increased by $18,198, the equity component of convertible debentures decreased by $11,442, capitalcontributions increased by $4,531, contributed surplus decreased by $566 and deficit increased by $10,721.Convertible debentures are further allocated between their current and non-current portions and separately classifiedin the balance sheets.
Intangible liabilities:
Intangible liabilities have been derecognized under IFRS as these amounts are inherently reflected in the fair valueof investment properties. This resulted in a decrease to intangible liabilities of $81,523 at January 1, 2010 and$91,568 at December 31, 2010.
Trust units liability:
Under previous GAAP, the REIT classified its trust units as equity. IAS 32 – Financial Instruments, has a morerigorous definition of what constitutes a financial liability which includes financial instruments if they have acontractual obligation to deliver cash or other financial assets to another entity. On May 14, 2010, the REITamended its Declaration of Trust in order to make distributions non-mandatory. Prior to May 14, 2010, the REIT hada contractual obligation to make cash distributions to its unitholders, therefore under IFRS, trust units are classifiedas a financial liability measured at fair value at January 1, 2010. This resulted in the REIT recording a trust unitsliability of $427,005, a decrease to capital contributions of $485,000 and a decrease to deficit of $59,758 at January1, 2010. Units acquired and cancelled through the normal course issuer bid and recorded to contributed surplusunder previous GAAP were derecognized, resulting in a decrease to contributed surplus of $1,763 at January 1,2010. Under IFRS, the REIT has presented the current and non-current portion of the trust units liability as separateclassifications in its balance sheet.
On May 14, 2010, trust units under IFRS were reclassified from liability to equity at the fair value of the liability at thatdate, being $575,885.
Page 10
ARTIS REAL ESTATE INVESTMENT TRUSTManagement's Discussion and Analysis - Q2-11(In thousands of Canadian dollars, unless otherwise noted)
Accounts payable and other liabilities:
Under previous GAAP, Artis accounted for unit options issued under its unit option plan using the fair value method.Under this method, compensation expense was measured at fair value at the grant date using the Black-Scholesoption pricing model and recognized over the vesting period. The REIT’s unit options are to be settled byredeemable trust units. In accordance with IFRS, these unit-based payments are considered to be cash-settled andare therefore recorded as a liability at fair value at each reporting date. This resulted in an increase to accountspayable and other liabilities of $177, a decrease to contributed surplus of $1,714 and a decrease to deficit of $1,537at January 1, 2010. At December 31, 2010, this resulted in an increase to accounts payable and other payables of$308, a decrease to contributed surplus of $1,486, an increase to capital contributions of $7 and a decrease todeficit of $1,171 from previous GAAP.
IMPACT OF IFRS ON 2010 OPERATING RESULTS
Revenue:
Under the fair value model of accounting for investment properties, historic intangible assets and liabilitiesestablished under previous GAAP are no longer separately recognized and accordingly not amortized under IFRS.The impact of no longer amortizing historic intangible assets and liabilities resulted in a decrease to revenue of$2,877 for the three months ended June 30, 2010, $5,638 for the six months ended June 30, 2010, and $11,633 forthe year ended December 31, 2010.
Previous GAAP required the REIT to record tenant inducements as a reduction of rental revenue. IFRS requires thesame treatment, however, the definition of tenant inducements differs from the REIT’s previous application of GAAP.All of the REIT’s tenant inducements under IFRS are amortized as a reduction of rental revenue, with the exceptionof certain tenant improvements determined to benefit the REIT. This resulted in a decrease to revenue of $422 forthe three months ended June 30, 2010, $808 for the six months ended June 30, 2010, and $2,500 for the yearended December 31, 2010.
Under IFRS, tenant improvements are not amortized, which resulted in an increase to revenue of $47 for the threemonths ended June 30, 2010, $89 for the six months ended June 30, 2010 and $196 for the year ended December31, 2010.
Under IFRS, the REIT has presented interest income as a separate classification in its statements of operations.
Interest expense:
Under the fair value approach of accounting for convertible debentures, no accretion adjustment to the liability isrequired. The impact of no longer recording accretion on convertible debentures resulted in a decrease to interestexpense of $562 for the three months ended June 30, 2010, $1,058 for the six months ended June 30, 2010 and$2,223 for the year ended December 31, 2010.
Additionally, distributions paid to unitholders during the period from January 1, 2010 to May 13, 2010 werereclassified from equity to interest expense as a result of the mandatory distribution requirement, resulting in anincrease to interest expense of $4,484 for the three months ended June 30, 2010, $16,828 for the six months endedJune 30, 2010 and $16,828 for the period from January 1, 2010 to May 13, 2010.
Corporate expense:
As described above, unit options are measured on a different basis under IFRS than under previous GAAP, andresulted in an decrease to corporate expense of $127 for the three months ended June 30, 2010, $94 for the sixmonths ended June 30, 2010 and $368 for the year ended December 31, 2010.
Under the fair value model, amortization of investment properties is not recorded. The impact of no longeramortizing historic intangible assets and liabilities as described above, along with no longer recording amortizationexpense on investment properties resulted in a decrease to amortization expense of $15,489 for the three monthsended June 30, 2010, $28,540 for the six months ended June 30, 2010 and $68,372 for the year ended December31, 2010.
The REIT's accounting treatment for tenant inducements as described above resulted in a decrease to amortizationexpense of $422 for the three months ended June 30, 2010, $808 for the six months ended June 30, 2010 and$2,500 for the year ended December 31, 2010.
Page 11
ARTIS REAL ESTATE INVESTMENT TRUSTManagement's Discussion and Analysis - Q2-11(In thousands of Canadian dollars, unless otherwise noted)
Transaction costs:
During the year ended December 31, 2010, $3,754 of transaction costs attributable to the issuance of convertibledebentures were expensed in accordance with IFRS. Under previous GAAP, transaction costs were included in thecarrying value of the liability at inception and amortized over the expected life of the debentures.
For the three and six months ended June 30, 2010 and the year ended December 31, 2010, $3,505, $4,834 and$15,792, respectively, of transaction costs attributable to the acquisition of properties were expensed under IFRS, asthese acquisitions were considered to be business combinations. Under previous GAAP, transactions costsassociated with property acquisitions were capitalized.
Unrealized fair value changes on financial instruments:
As described above, trust units are measured on a different basis under IFRS than under previous GAAP, andresulted in fair value gains and losses being recorded under IFRS. For the three months ended June 30, 2010, anunrealized fair value gain on trust units of $7,504 was recorded and a loss of $19,361 was recorded for the periodfrom January 1, 2010 to May 13, 2010.
As described above, convertible debentures are measured on a different basis under IFRS than under previousGAAP, and resulted in fair value gains and losses being recorded under IFRS. For the three months ended June 30,2010, an unrealized fair value gain on convertible debentures of $8,585 was recorded, $9,781 for the six monthsended June 30, 2010 and $5,676 for the year ended December 31, 2010.
Income tax expense:
As described above, the change in the measurement of the carrying value of investment properties from amortizedcost under previous GAAP to fair value under IFRS resulted in the REIT's income tax recovery decreasing from $200to an expense of $298 for the year ended December 31, 2010.
Unrealized fair value changes on investment properties:
As a result of electing to use the fair value model to account for investment properties, net income during any givenperiod may be greater or less than as determined under previous GAAP depending on whether an increase ordecrease in fair value occurs during the period. The impact of fair value changes resulted in a increase to netincome of $11,188 for the three months ended June 30, 2010, $10,717 for the six months ended June 30, 2010 and$36,365 for the year ended December 31, 2010.
Other comprehensive loss:
As a result of the accounting policy decision to measure investment properties at fair value under IFRS, theunrealized foreign currency translation loss included in other comprehensive loss increased from $273 underprevious GAAP to $310 under IFRS for the year ended December 31, 2010. This was due to the change in themeasurement of the carrying value of investment properties from amortized cost under previous GAAP to fair valueunder IFRS.
Page 12

ARTIS REAL ESTATE INVESTMENT TRUSTManagement's Discussion and Analysis - Q2-11(In thousands of Canadian dollars, unless otherwise noted)
ANALYSIS OF OPERATING RESULTS
REVENUE AND PROPERTY NOI
Revenue includes all amounts earned from tenants related to lease agreements, including basic rent, parking,operating cost and realty tax recoveries, as well as adjustments for the straight-lining of rents recorded inaccordance with IFRS.
In accordance with IFRS, Artis accounts for rent step-ups by straight-lining the incremental increases over the entirenon-cancelable lease term. In Q2-11, straight-line rent adjustments of $1,379 (YTD - $2,527) were recordedcompared to $669 in Q2-10 (YTD - $1,112).
In Q2-11, the REIT recorded amortization of $1,094 (YTD - $2,114) as a reduction in revenue from tenant incentivescompared to $483 (YTD - $930) in Q2-10.
Property operating expenses include realty taxes as well as other costs related to interior and exterior maintenance,HVAC, elevator, insurance, utilities and management fees.
SAME PROPERTY NOI GROWTH
Same property comparison includes only investment properties owned on January 1, 2010, and excludes propertiesconsidered to be in redevelopment.
Three month period endedJune 30,
Six month period endedJune 30,
2011 2010 2011 2010
Revenue (1) $ 31,849 $ 32,213 $ 65,906 $ 64,781Property operating expenses 11,249 11,280 24,744 22,773
Property NOI 20,600 20,933 41,162 42,008
Add (deduct) non-cash revenue adjustments:Straight-line rent adjustment (202) (326) (385) (686)Amortization of tenant inducements 909 478 1,784 921
Property NOI less non-cash revenue adjustments $ 21,307 $ 21,085 $ 42,561 $ 42,243
(1) Revenue in Q1-10 was adjusted for a lease termination fee received for a Winnipeg office property and income received for a post-closing
adjustment.
Artis achieved an increase of $222 (YTD - $318), or 1.1% (YTD - 0.8%) of Property NOI less non-cash revenueadjustments over Q2-10.
Same Property NOI less Non-Cash Revenue Adjustments by Asset Class:
Three month period ended June 30, Six month period ended June 30,
2011 2010 Change%
Change 2011 2010 Change%
ChangeRetail $ 7,752 $ 7,519 $ 233 %3.1 $ 15,423 $ 15,149 $ 274 %1.8Office 10,095 10,163 (68) %(0.7) 20,223 20,370 (147) %(0.7)Industrial 3,460 3,403 57 %1.7 6,915 6,724 191 %2.8
Total $ 21,307 $ 21,085 $ 222 %1.1 $ 42,561 $ 42,243 $ 318 %0.8
Page 13
ARTIS REAL ESTATE INVESTMENT TRUSTManagement's Discussion and Analysis - Q2-11(In thousands of Canadian dollars, unless otherwise noted)
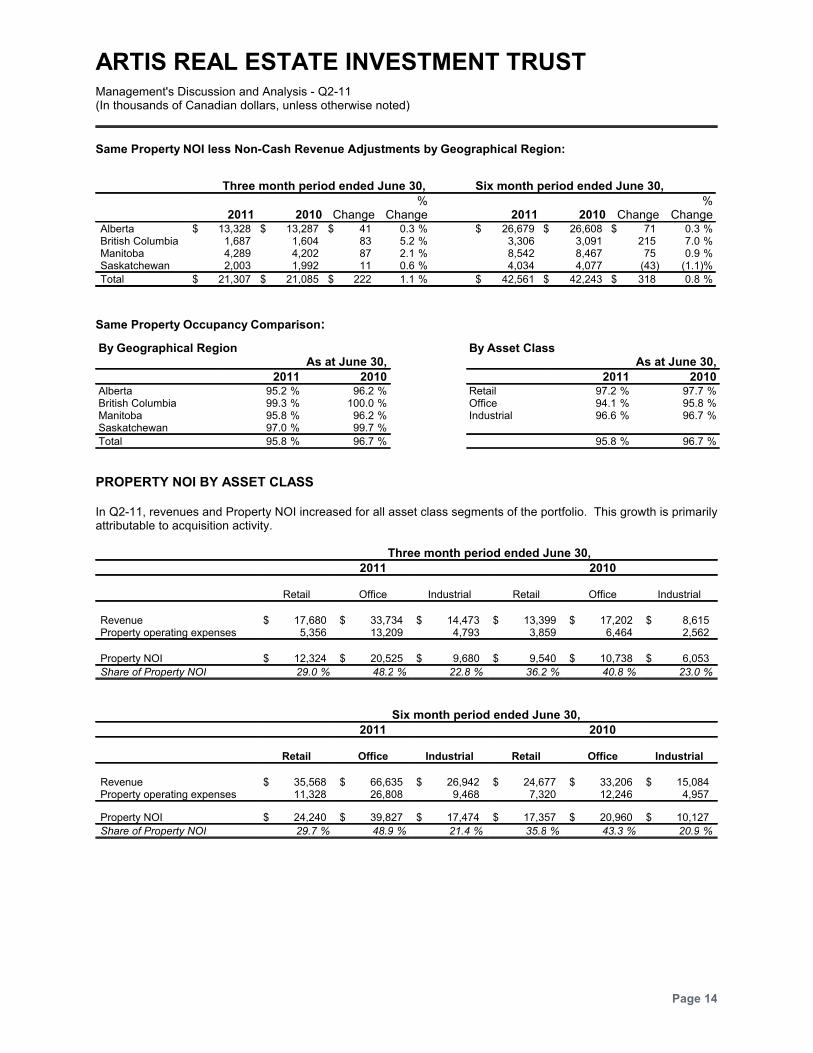
Same Property NOI less Non-Cash Revenue Adjustments by Geographical Region:
Three month period ended June 30, Six month period ended June 30,
2011 2010 Change%
Change 2011 2010 Change%
ChangeAlberta $ 13,328 $ 13,287 $ 41 %0.3 $ 26,679 $ 26,608 $ 71 %0.3British Columbia 1,687 1,604 83 %5.2 3,306 3,091 215 %7.0Manitoba 4,289 4,202 87 %2.1 8,542 8,467 75 %0.9Saskatchewan 2,003 1,992 11 %0.6 4,034 4,077 (43) %(1.1)
Total $ 21,307 $ 21,085 $ 222 %1.1 $ 42,561 $ 42,243 $ 318 %0.8
Same Property Occupancy Comparison:
By Geographical Region By Asset ClassAs at June 30, As at June 30,
2011 2010 2011 2010Alberta %95.2 %96.2 Retail %97.2 %97.7British Columbia %99.3 %100.0 Office %94.1 %95.8Manitoba %95.8 %96.2 Industrial %96.6 %96.7Saskatchewan %97.0 %99.7
Total %95.8 %96.7 %95.8 %96.7
PROPERTY NOI BY ASSET CLASS
In Q2-11, revenues and Property NOI increased for all asset class segments of the portfolio. This growth is primarilyattributable to acquisition activity.
Three month period ended June 30,
2011 2010
Retail Office Industrial Retail Office Industrial
Revenue $ 17,680 $ 33,734 $ 14,473 $ 13,399 $ 17,202 $ 8,615Property operating expenses 5,356 13,209 4,793 3,859 6,464 2,562
Property NOI $ 12,324 $ 20,525 $ 9,680 $ 9,540 $ 10,738 $ 6,053
Share of Property NOI %29.0 %48.2 %22.8 %36.2 %40.8 %23.0
Six month period ended June 30,
2011 2010
Retail Office Industrial Retail Office Industrial
Revenue $ 35,568 $ 66,635 $ 26,942 $ 24,677 $ 33,206 $ 15,084Property operating expenses 11,328 26,808 9,468 7,320 12,246 4,957
Property NOI $ 24,240 $ 39,827 $ 17,474 $ 17,357 $ 20,960 $ 10,127
Share of Property NOI %29.7 %48.9 %21.4 %35.8 %43.3 %20.9
Page 14
ARTIS REAL ESTATE INVESTMENT TRUSTManagement's Discussion and Analysis - Q2-11(In thousands of Canadian dollars, unless otherwise noted)
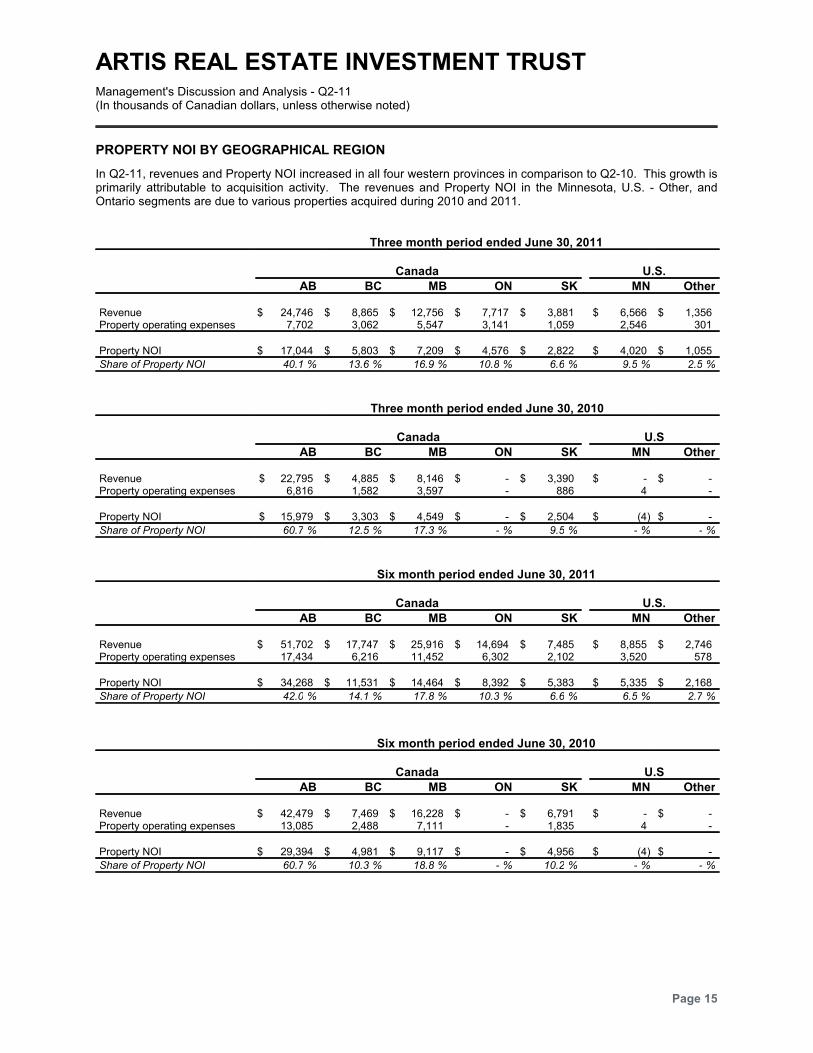
PROPERTY NOI BY GEOGRAPHICAL REGION
In Q2-11, revenues and Property NOI increased in all four western provinces in comparison to Q2-10. This growth isprimarily attributable to acquisition activity. The revenues and Property NOI in the Minnesota, U.S. - Other, andOntario segments are due to various properties acquired during 2010 and 2011.
Three month period ended June 30, 2011
Canada U.S.
AB BC MB ON SK MN Other
Revenue $ 24,746 $ 8,865 $ 12,756 $ 7,717 $ 3,881 $ 6,566 $ 1,356Property operating expenses 7,702 3,062 5,547 3,141 1,059 2,546 301
Property NOI $ 17,044 $ 5,803 $ 7,209 $ 4,576 $ 2,822 $ 4,020 $ 1,055
Share of Property NOI %40.1 %13.6 %16.9 %10.8 %6.6 %9.5 %2.5
Three month period ended June 30, 2010
Canada U.S
AB BC MB ON SK MN Other
Revenue $ 22,795 $ 4,885 $ 8,146 $ - $ 3,390 $ - $ -Property operating expenses 6,816 1,582 3,597 - 886 4 -
Property NOI $ 15,979 $ 3,303 $ 4,549 $ - $ 2,504 $ (4) $ -
Share of Property NOI %60.7 %12.5 %17.3 %- %9.5 %- %-
Six month period ended June 30, 2011
Canada U.S.
AB BC MB ON SK MN Other
Revenue $ 51,702 $ 17,747 $ 25,916 $ 14,694 $ 7,485 $ 8,855 $ 2,746Property operating expenses 17,434 6,216 11,452 6,302 2,102 3,520 578
Property NOI $ 34,268 $ 11,531 $ 14,464 $ 8,392 $ 5,383 $ 5,335 $ 2,168
Share of Property NOI %42.0 %14.1 %17.8 %10.3 %6.6 %6.5 %2.7
Six month period ended June 30, 2010
Canada U.S
AB BC MB ON SK MN Other
Revenue $ 42,479 $ 7,469 $ 16,228 $ - $ 6,791 $ - $ -Property operating expenses 13,085 2,488 7,111 - 1,835 4 -
Property NOI $ 29,394 $ 4,981 $ 9,117 $ - $ 4,956 $ (4) $ -
Share of Property NOI %60.7 %10.3 %18.8 %- %10.2 %- %-
Page 15
ARTIS REAL ESTATE INVESTMENT TRUSTManagement's Discussion and Analysis - Q2-11(In thousands of Canadian dollars, unless otherwise noted)
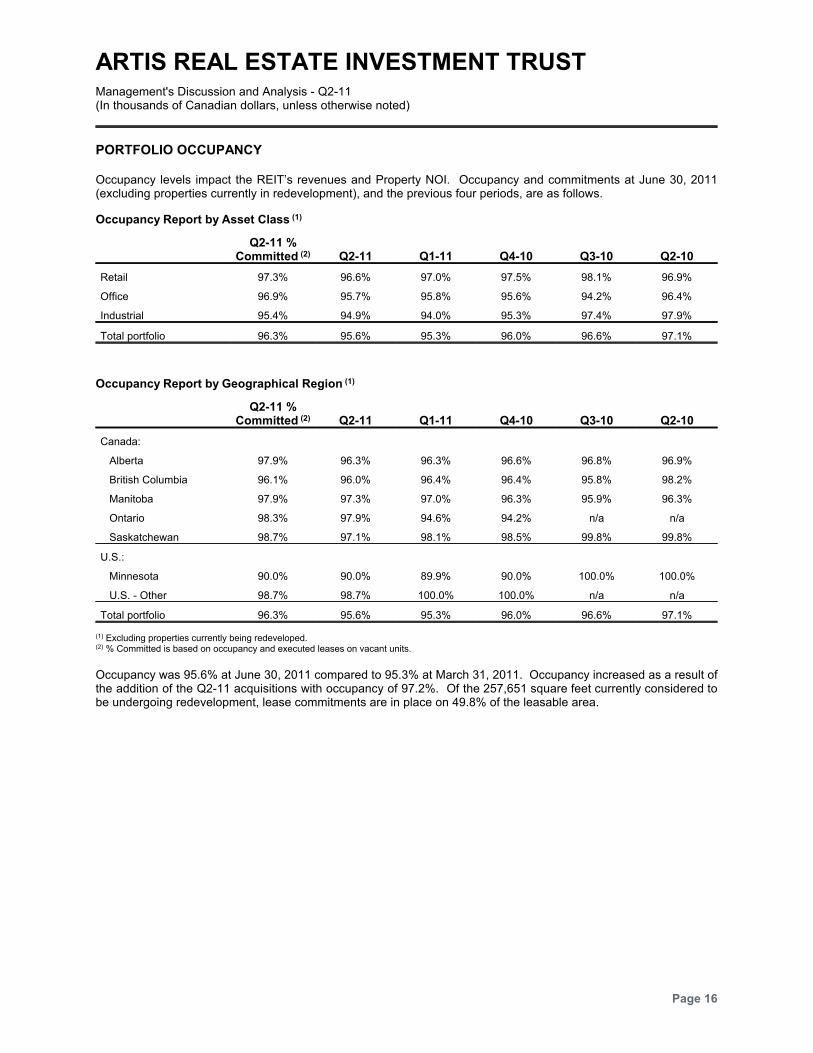
PORTFOLIO OCCUPANCY
Occupancy levels impact the REIT’s revenues and Property NOI. Occupancy and commitments at June 30, 2011(excluding properties currently in redevelopment), and the previous four periods, are as follows.
Occupancy Report by Asset Class (1)
Q2-11 %Committed (2) Q2-11 Q1-11 Q4-10 Q3-10 Q2-10
Retail 97.3% 96.6% 97.0% 97.5% 98.1% 96.9%
Office 96.9% 95.7% 95.8% 95.6% 94.2% 96.4%
Industrial 95.4% 94.9% 94.0% 95.3% 97.4% 97.9%
Total portfolio 96.3% 95.6% 95.3% 96.0% 96.6% 97.1%
Occupancy Report by Geographical Region (1)
Q2-11 %Committed (2) Q2-11 Q1-11 Q4-10 Q3-10 Q2-10
Canada:
Alberta 97.9% 96.3% 96.3% 96.6% 96.8% 96.9%
British Columbia 96.1% 96.0% 96.4% 96.4% 95.8% 98.2%
Manitoba 97.9% 97.3% 97.0% 96.3% 95.9% 96.3%
Ontario 98.3% 97.9% 94.6% 94.2% n/a n/a
Saskatchewan 98.7% 97.1% 98.1% 98.5% 99.8% 99.8%
U.S.:
Minnesota 90.0% 90.0% 89.9% 90.0% 100.0% 100.0%
U.S. - Other 98.7% 98.7% 100.0% 100.0% n/a n/a
Total portfolio 96.3% 95.6% 95.3% 96.0% 96.6% 97.1%
(1) Excluding properties currently being redeveloped.(2) % Committed is based on occupancy and executed leases on vacant units.
Occupancy was 95.6% at June 30, 2011 compared to 95.3% at March 31, 2011. Occupancy increased as a result ofthe addition of the Q2-11 acquisitions with occupancy of 97.2%. Of the 257,651 square feet currently considered tobe undergoing redevelopment, lease commitments are in place on 49.8% of the leasable area.
Page 16
ARTIS REAL ESTATE INVESTMENT TRUSTManagement's Discussion and Analysis - Q2-11(In thousands of Canadian dollars, unless otherwise noted)
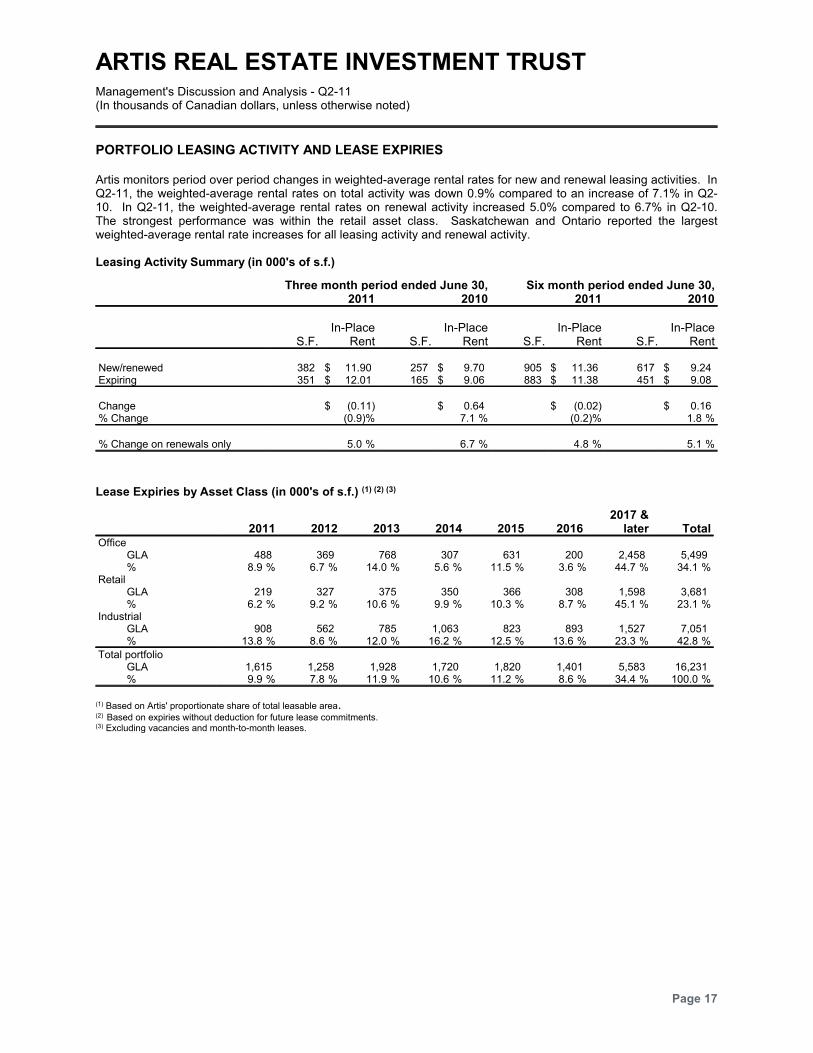
PORTFOLIO LEASING ACTIVITY AND LEASE EXPIRIES
Artis monitors period over period changes in weighted-average rental rates for new and renewal leasing activities. InQ2-11, the weighted-average rental rates on total activity was down 0.9% compared to an increase of 7.1% in Q2-10. In Q2-11, the weighted-average rental rates on renewal activity increased 5.0% compared to 6.7% in Q2-10.The strongest performance was within the retail asset class. Saskatchewan and Ontario reported the largestweighted-average rental rate increases for all leasing activity and renewal activity.
Leasing Activity Summary (in 000's of s.f.)
Three month period ended June 30, Six month period ended June 30,2011 2010 2011 2010
S.F.In-Place
Rent S.F.In-Place
Rent S.F.In-Place
Rent S.F.In-Place
Rent
New/renewed 382 $ 11.90 257 $ 9.70 905 $ 11.36 617 $ 9.24Expiring 351 $ 12.01 165 $ 9.06 883 $ 11.38 451 $ 9.08
Change $ (0.11) $ 0.64 $ (0.02) $ 0.16% Change %(0.9) %7.1 %(0.2) %1.8
% Change on renewals only %5.0 %6.7 %4.8 %5.1
Lease Expiries by Asset Class (in 000's of s.f.) (1) (2) (3)
2011 2012 2013 2014 2015 2016 2017 &
later TotalOffice
GLA 488 369 768 307 631 200 2,458 5,499% %8.9 %6.7 %14.0 %5.6 %11.5 %3.6 %44.7 %34.1
RetailGLA 219 327 375 350 366 308 1,598 3,681% %6.2 %9.2 %10.6 %9.9 %10.3 %8.7 %45.1 %23.1
IndustrialGLA 908 562 785 1,063 823 893 1,527 7,051% %13.8 %8.6 %12.0 %16.2 %12.5 %13.6 %23.3 %42.8
Total portfolioGLA 1,615 1,258 1,928 1,720 1,820 1,401 5,583 16,231% %9.9 %7.8 %11.9 %10.6 %11.2 %8.6 %34.4 %100.0
(1) Based on Artis' proportionate share of total leasable area.(2) Based on expiries without deduction for future lease commitments.(3) Excluding vacancies and month-to-month leases.
Page 17
ARTIS REAL ESTATE INVESTMENT TRUSTManagement's Discussion and Analysis - Q2-11(In thousands of Canadian dollars, unless otherwise noted)
Market Rents
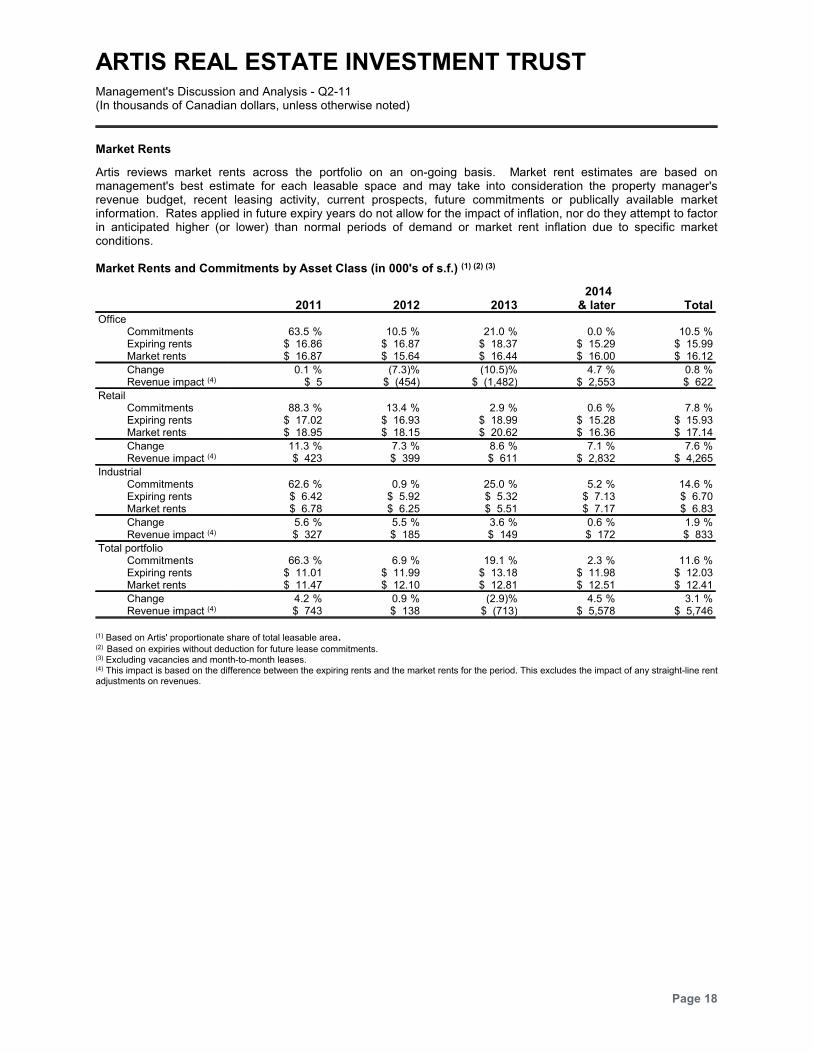
Artis reviews market rents across the portfolio on an on-going basis. Market rent estimates are based onmanagement's best estimate for each leasable space and may take into consideration the property manager'srevenue budget, recent leasing activity, current prospects, future commitments or publically available marketinformation. Rates applied in future expiry years do not allow for the impact of inflation, nor do they attempt to factorin anticipated higher (or lower) than normal periods of demand or market rent inflation due to specific marketconditions.
Market Rents and Commitments by Asset Class (in 000's of s.f.) (1) (2) (3)
2011 2012 20132014
& later TotalOffice
Commitments %63.5 %10.5 %21.0 %0.0 %10.5Expiring rents $ 16.86 $ 16.87 $ 18.37 $ 15.29 $ 15.99Market rents $ 16.87 $ 15.64 $ 16.44 $ 16.00 $ 16.12
Change %0.1 %(7.3) %(10.5) %4.7 %0.8Revenue impact (4) $ 5 $ (454) $ (1,482) $ 2,553 $ 622
RetailCommitments %88.3 %13.4 %2.9 %0.6 %7.8Expiring rents $ 17.02 $ 16.93 $ 18.99 $ 15.28 $ 15.93Market rents $ 18.95 $ 18.15 $ 20.62 $ 16.36 $ 17.14
Change %11.3 %7.3 %8.6 %7.1 %7.6Revenue impact (4) $ 423 $ 399 $ 611 $ 2,832 $ 4,265
IndustrialCommitments %62.6 %0.9 %25.0 %5.2 %14.6Expiring rents $ 6.42 $ 5.92 $ 5.32 $ 7.13 $ 6.70Market rents $ 6.78 $ 6.25 $ 5.51 $ 7.17 $ 6.83
Change %5.6 %5.5 %3.6 %0.6 %1.9Revenue impact (4) $ 327 $ 185 $ 149 $ 172 $ 833
Total portfolioCommitments %66.3 %6.9 %19.1 %2.3 %11.6Expiring rents $ 11.01 $ 11.99 $ 13.18 $ 11.98 $ 12.03Market rents $ 11.47 $ 12.10 $ 12.81 $ 12.51 $ 12.41
Change %4.2 %0.9 %(2.9) %4.5 %3.1Revenue impact (4) $ 743 $ 138 $ (713) $ 5,578 $ 5,746
(1) Based on Artis' proportionate share of total leasable area.(2) Based on expiries without deduction for future lease commitments.(3) Excluding vacancies and month-to-month leases.(4) This impact is based on the difference between the expiring rents and the market rents for the period. This excludes the impact of any straight-line rentadjustments on revenues.
Page 18
ARTIS REAL ESTATE INVESTMENT TRUSTManagement's Discussion and Analysis - Q2-11(In thousands of Canadian dollars, unless otherwise noted)
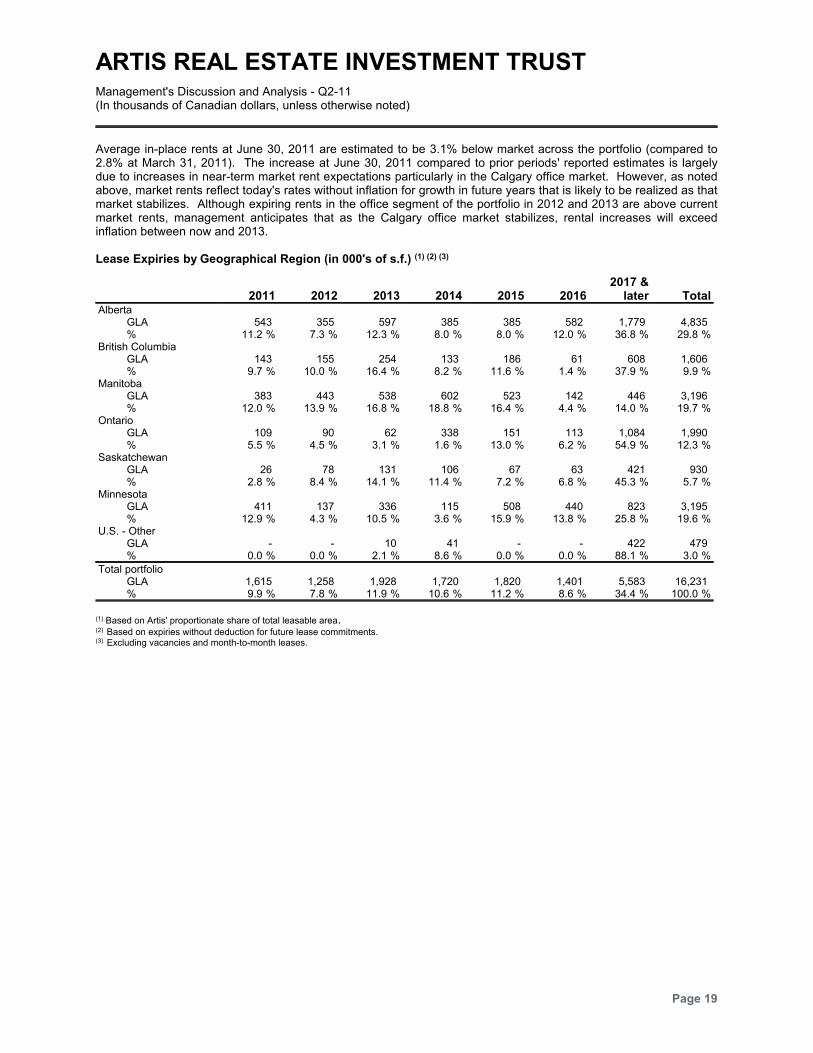
Average in-place rents at June 30, 2011 are estimated to be 3.1% below market across the portfolio (compared to2.8% at March 31, 2011). The increase at June 30, 2011 compared to prior periods' reported estimates is largelydue to increases in near-term market rent expectations particularly in the Calgary office market. However, as notedabove, market rents reflect today's rates without inflation for growth in future years that is likely to be realized as thatmarket stabilizes. Although expiring rents in the office segment of the portfolio in 2012 and 2013 are above currentmarket rents, management anticipates that as the Calgary office market stabilizes, rental increases will exceedinflation between now and 2013.
Lease Expiries by Geographical Region (in 000's of s.f.) (1) (2) (3)
2011 2012 2013 2014 2015 20162017 &
later TotalAlberta
GLA 543 355 597 385 385 582 1,779 4,835% %11.2 %7.3 %12.3 %8.0 %8.0 %12.0 %36.8 %29.8
British ColumbiaGLA 143 155 254 133 186 61 608 1,606% %9.7 %10.0 %16.4 %8.2 %11.6 %1.4 %37.9 %9.9
ManitobaGLA 383 443 538 602 523 142 446 3,196% %12.0 %13.9 %16.8 %18.8 %16.4 %4.4 %14.0 %19.7
OntarioGLA 109 90 62 338 151 113 1,084 1,990% %5.5 %4.5 %3.1 %1.6 %13.0 %6.2 %54.9 %12.3
SaskatchewanGLA 26 78 131 106 67 63 421 930% %2.8 %8.4 %14.1 %11.4 %7.2 %6.8 %45.3 %5.7
MinnesotaGLA 411 137 336 115 508 440 823 3,195% %12.9 %4.3 %10.5 %3.6 %15.9 %13.8 %25.8 %19.6
U.S. - OtherGLA - - 10 41 - - 422 479% %0.0 %0.0 %2.1 %8.6 %0.0 %0.0 %88.1 %3.0
Total portfolioGLA 1,615 1,258 1,928 1,720 1,820 1,401 5,583 16,231% %9.9 %7.8 %11.9 %10.6 %11.2 %8.6 %34.4 %100.0
(1) Based on Artis' proportionate share of total leasable area.(2) Based on expiries without deduction for future lease commitments.(3) Excluding vacancies and month-to-month leases.
Page 19
ARTIS REAL ESTATE INVESTMENT TRUSTManagement's Discussion and Analysis - Q2-11(In thousands of Canadian dollars, unless otherwise noted)
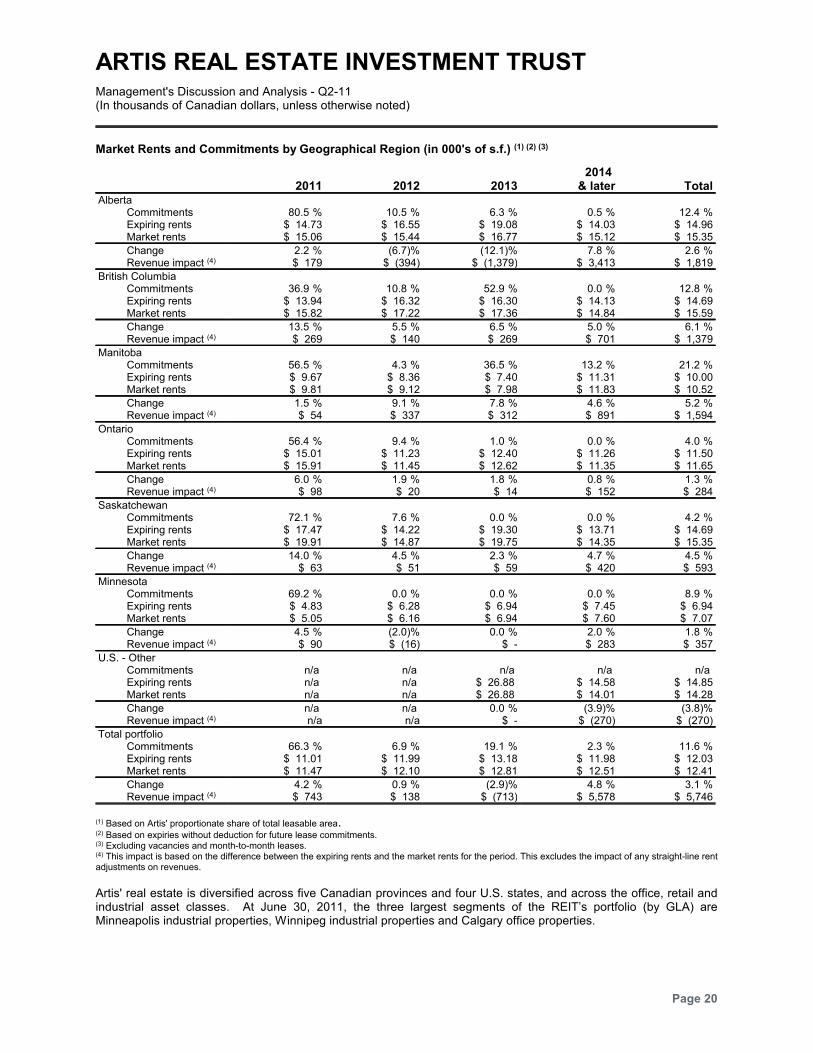
Market Rents and Commitments by Geographical Region (in 000's of s.f.) (1) (2) (3)
2011 2012 20132014
& later TotalAlberta
Commitments %80.5 %10.5 %6.3 %0.5 %12.4Expiring rents $ 14.73 $ 16.55 $ 19.08 $ 14.03 $ 14.96Market rents $ 15.06 $ 15.44 $ 16.77 $ 15.12 $ 15.35
Change %2.2 %(6.7) %(12.1) %7.8 %2.6Revenue impact (4) $ 179 $ (394) $ (1,379) $ 3,413 $ 1,819
British ColumbiaCommitments %36.9 %10.8 %52.9 %0.0 %12.8Expiring rents $ 13.94 $ 16.32 $ 16.30 $ 14.13 $ 14.69Market rents $ 15.82 $ 17.22 $ 17.36 $ 14.84 $ 15.59
Change %13.5 %5.5 %6.5 %5.0 %6.1Revenue impact (4) $ 269 $ 140 $ 269 $ 701 $ 1,379
ManitobaCommitments %56.5 %4.3 %36.5 %13.2 %21.2Expiring rents $ 9.67 $ 8.36 $ 7.40 $ 11.31 $ 10.00Market rents $ 9.81 $ 9.12 $ 7.98 $ 11.83 $ 10.52
Change %1.5 %9.1 %7.8 %4.6 %5.2Revenue impact (4) $ 54 $ 337 $ 312 $ 891 $ 1,594
OntarioCommitments %56.4 %9.4 %1.0 %0.0 %4.0Expiring rents $ 15.01 $ 11.23 $ 12.40 $ 11.26 $ 11.50Market rents $ 15.91 $ 11.45 $ 12.62 $ 11.35 $ 11.65
Change %6.0 %1.9 %1.8 %0.8 %1.3Revenue impact (4) $ 98 $ 20 $ 14 $ 152 $ 284
SaskatchewanCommitments %72.1 %7.6 %0.0 %0.0 %4.2Expiring rents $ 17.47 $ 14.22 $ 19.30 $ 13.71 $ 14.69Market rents $ 19.91 $ 14.87 $ 19.75 $ 14.35 $ 15.35
Change %14.0 %4.5 %2.3 %4.7 %4.5Revenue impact (4) $ 63 $ 51 $ 59 $ 420 $ 593
MinnesotaCommitments %69.2 %0.0 %0.0 %0.0 %8.9Expiring rents $ 4.83 $ 6.28 $ 6.94 $ 7.45 $ 6.94Market rents $ 5.05 $ 6.16 $ 6.94 $ 7.60 $ 7.07
Change %4.5 %(2.0) %0.0 %2.0 %1.8Revenue impact (4) $ 90 $ (16) $ - $ 283 $ 357
U.S. - OtherCommitments n/a n/a n/a n/a n/a Expiring rents n/a n/a $ 26.88 $ 14.58 $ 14.85Market rents n/a n/a $ 26.88 $ 14.01 $ 14.28
Change n/a n/a %0.0 %(3.9) %(3.8)Revenue impact (4) n/a n/a $ - $ (270) $ (270)
Total portfolioCommitments %66.3 %6.9 %19.1 %2.3 %11.6Expiring rents $ 11.01 $ 11.99 $ 13.18 $ 11.98 $ 12.03Market rents $ 11.47 $ 12.10 $ 12.81 $ 12.51 $ 12.41
Change %4.2 %0.9 %(2.9) %4.8 %3.1Revenue impact (4) $ 743 $ 138 $ (713) $ 5,578 $ 5,746
(1) Based on Artis' proportionate share of total leasable area.(2) Based on expiries without deduction for future lease commitments.(3) Excluding vacancies and month-to-month leases.(4) This impact is based on the difference between the expiring rents and the market rents for the period. This excludes the impact of any straight-line rentadjustments on revenues.
Artis' real estate is diversified across five Canadian provinces and four U.S. states, and across the office, retail andindustrial asset classes. At June 30, 2011, the three largest segments of the REIT’s portfolio (by GLA) areMinneapolis industrial properties, Winnipeg industrial properties and Calgary office properties.
Page 20
ARTIS REAL ESTATE INVESTMENT TRUSTManagement's Discussion and Analysis - Q2-11(In thousands of Canadian dollars, unless otherwise noted)
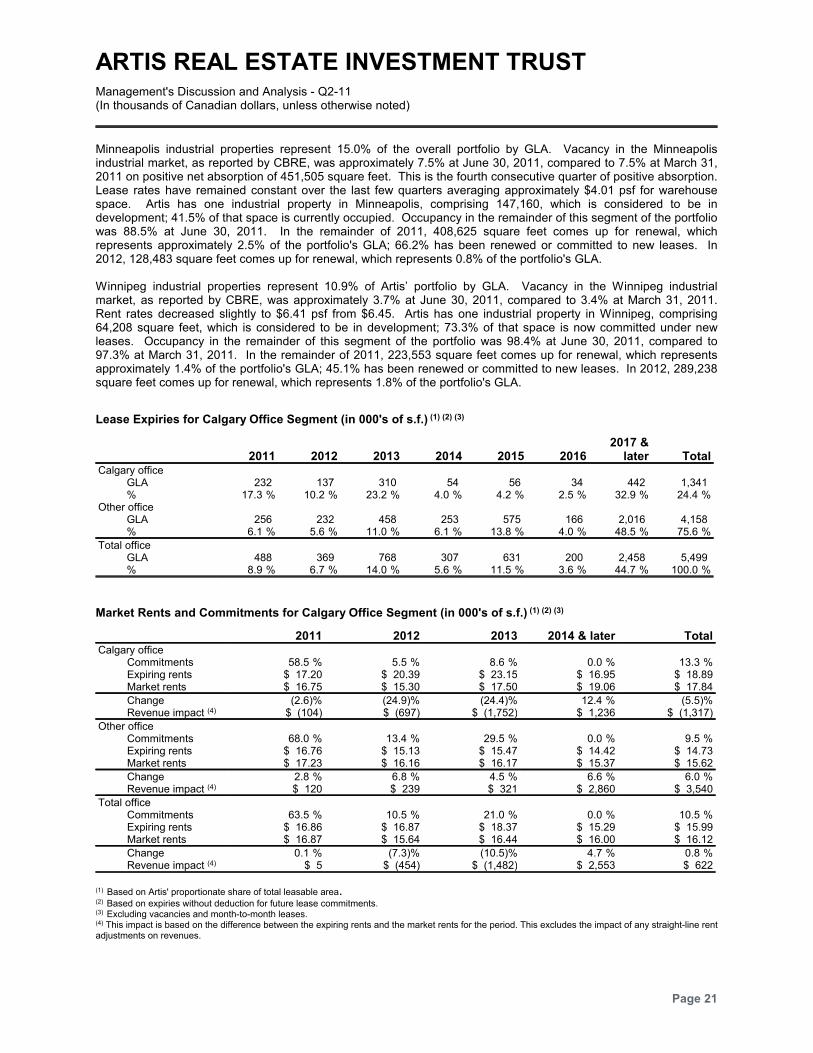
Minneapolis industrial properties represent 15.0% of the overall portfolio by GLA. Vacancy in the Minneapolisindustrial market, as reported by CBRE, was approximately 7.5% at June 30, 2011, compared to 7.5% at March 31,2011 on positive net absorption of 451,505 square feet. This is the fourth consecutive quarter of positive absorption.Lease rates have remained constant over the last few quarters averaging approximately $4.01 psf for warehousespace. Artis has one industrial property in Minneapolis, comprising 147,160, which is considered to be indevelopment; 41.5% of that space is currently occupied. Occupancy in the remainder of this segment of the portfoliowas 88.5% at June 30, 2011. In the remainder of 2011, 408,625 square feet comes up for renewal, whichrepresents approximately 2.5% of the portfolio's GLA; 66.2% has been renewed or committed to new leases. In2012, 128,483 square feet comes up for renewal, which represents 0.8% of the portfolio's GLA.
Winnipeg industrial properties represent 10.9% of Artis’ portfolio by GLA. Vacancy in the Winnipeg industrialmarket, as reported by CBRE, was approximately 3.7% at June 30, 2011, compared to 3.4% at March 31, 2011.Rent rates decreased slightly to $6.41 psf from $6.45. Artis has one industrial property in Winnipeg, comprising64,208 square feet, which is considered to be in development; 73.3% of that space is now committed under newleases. Occupancy in the remainder of this segment of the portfolio was 98.4% at June 30, 2011, compared to97.3% at March 31, 2011. In the remainder of 2011, 223,553 square feet comes up for renewal, which representsapproximately 1.4% of the portfolio's GLA; 45.1% has been renewed or committed to new leases. In 2012, 289,238square feet comes up for renewal, which represents 1.8% of the portfolio's GLA.
Lease Expiries for Calgary Office Segment (in 000's of s.f.) (1) (2) (3)
2011 2012 2013 2014 2015 20162017 &
later TotalCalgary office
GLA 232 137 310 54 56 34 442 1,341% %17.3 %10.2 %23.2 %4.0 %4.2 %2.5 %32.9 %24.4
Other officeGLA 256 232 458 253 575 166 2,016 4,158% %6.1 %5.6 %11.0 %6.1 %13.8 %4.0 %48.5 %75.6
Total officeGLA 488 369 768 307 631 200 2,458 5,499% %8.9 %6.7 %14.0 %5.6 %11.5 %3.6 %44.7 %100.0
Market Rents and Commitments for Calgary Office Segment (in 000's of s.f.) (1) (2) (3)
2011 2012 2013 2014 & later TotalCalgary office
Commitments %58.5 %5.5 %8.6 %0.0 %13.3Expiring rents $ 17.20 $ 20.39 $ 23.15 $ 16.95 $ 18.89Market rents $ 16.75 $ 15.30 $ 17.50 $ 19.06 $ 17.84
Change %(2.6) %(24.9) %(24.4) %12.4 %(5.5)Revenue impact (4) $ (104) $ (697) $ (1,752) $ 1,236 $ (1,317)
Other officeCommitments %68.0 %13.4 %29.5 %0.0 %9.5Expiring rents $ 16.76 $ 15.13 $ 15.47 $ 14.42 $ 14.73Market rents $ 17.23 $ 16.16 $ 16.17 $ 15.37 $ 15.62
Change %2.8 %6.8 %4.5 %6.6 %6.0Revenue impact (4) $ 120 $ 239 $ 321 $ 2,860 $ 3,540
Total officeCommitments %63.5 %10.5 %21.0 %0.0 %10.5Expiring rents $ 16.86 $ 16.87 $ 18.37 $ 15.29 $ 15.99Market rents $ 16.87 $ 15.64 $ 16.44 $ 16.00 $ 16.12
Change %0.1 %(7.3) %(10.5) %4.7 %0.8Revenue impact (4) $ 5 $ (454) $ (1,482) $ 2,553 $ 622
(1) Based on Artis' proportionate share of total leasable area.(2) Based on expiries without deduction for future lease commitments.(3) Excluding vacancies and month-to-month leases. (4) This impact is based on the difference between the expiring rents and the market rents for the period. This excludes the impact of any straight-line rentadjustments on revenues.
Page 21
ARTIS REAL ESTATE INVESTMENT TRUSTManagement's Discussion and Analysis - Q2-11(In thousands of Canadian dollars, unless otherwise noted)
Calgary office properties represent 8.2% of the overall portfolio by GLA. Artis' office properties are Class A, B and Cbuildings, in downtown, beltline and suburban locations. Overall vacancy in the Calgary office market, as reportedby CBRE, was 7.6% at June 30, 2011, compared to 9.6% at March 31, 2011. Tenant demand has been strongerthan forecast in both the suburban and downtown markets due largely to the positive impacts of continued capitalinvestment in oil and gas in Alberta. Recent research from CRESA, Avison Young, Colliers and CBRE reflectincreased optimism based on positive absorption in both suburban and downtown markets. Management believesthat as the vacancy continues to stabilize in these markets, rental rates will start to inflate again in 2012. At June 30,2011, the Calgary office segment of Artis’ portfolio was 94.6% occupied, compared to 94.8% occupancy at March31, 2011. Artis has commitments in place for 8.8% of the unoccupied space. In the remainder of 2011, 232,071square feet comes up for renewal, which represents 1.4% of the portfolio’s GLA; 58.5% has been renewed. In 2012,136,871 square feet comes up for renewal, which represents 0.8% of the portfolio’s GLA; 5.5% has been renewed.Approximately 32.9% of the Calgary office GLA expires in 2017 or later.
INTEREST EXPENSE
The current period’s interest expense is attributable to mortgages and other loans secured against the investmentproperties, as well as convertible debentures outstanding and the balance drawn on the credit facility. Interestexpense in Q2-10 includes distributions paid to unitholders during the period. When compared to Q2-10 withoutthese distributions, interest expense in Q2-11 has increased due to additional mortgage financing obtained inconnection with acquisitions completed in 2010 and 2011, and the issuance of additional convertible debenturessince Q2-10. In accordance with IFRS, financing costs on mortgages and other loans are netted against the relateddebt, and amortized on an effective interest basis over the expected life of the debt.
The REIT’s weighted-average effective rate at June 30, 2011 on mortgages and other debt secured by propertieswas 4.91% compared to 5.12% at December 31, 2010. The weighted-average nominal interest rate at June 30,2011 was 4.73% compared to 4.97% at December 31, 2010.
In accordance with IFRS, convertible debentures are recorded as a financial liability at fair value. Artis recordedinterest expense of $3,119 (YTD - $5,305) on the face value of debentures outstanding in Q2-11, compared to$2,186 (YTD - 3,560) in Q2-10.
The REIT's interest coverage ratio, defined as total revenues less property operating expenses and corporateexpenses divided by interest expense, is 2.14 times for the quarter ended June 30, 2011 (YTD - 2.18 times).
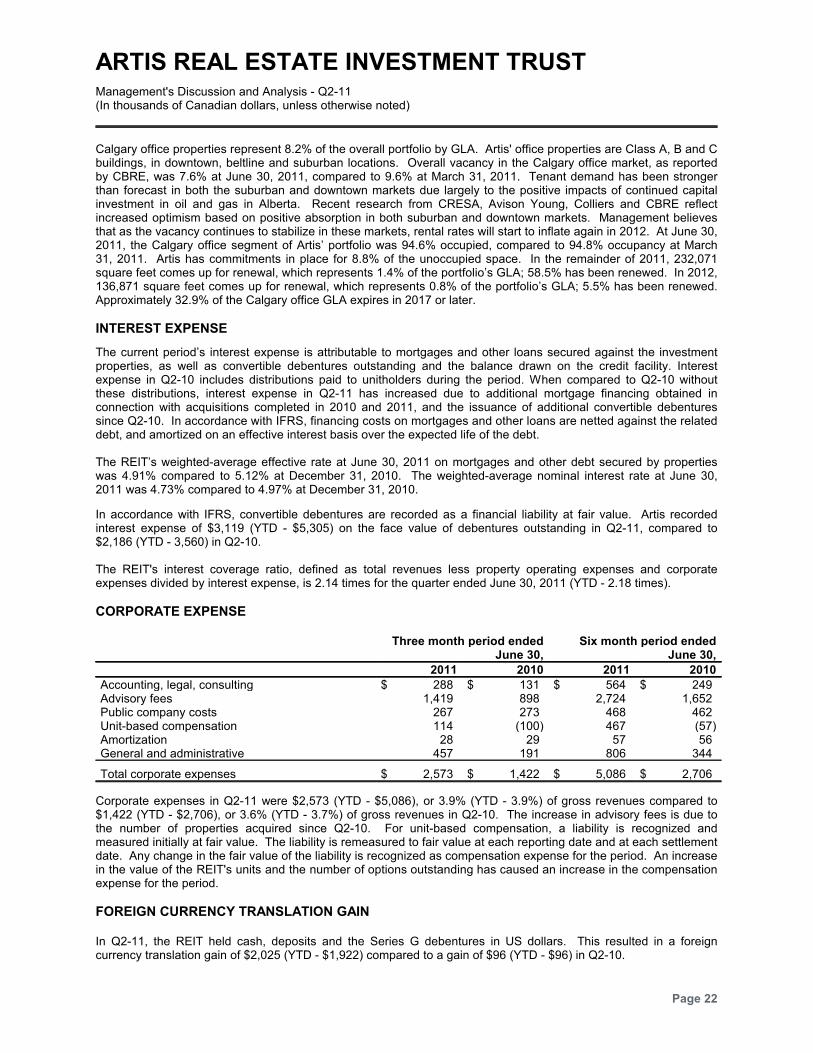
CORPORATE EXPENSE
Three month period endedJune 30,
Six month period endedJune 30,
2011 2010 2011 2010
Accounting, legal, consulting $ 288 $ 131 $ 564 $ 249Advisory fees 1,419 898 2,724 1,652Public company costs 267 273 468 462Unit-based compensation 114 (100) 467 (57)Amortization 28 29 57 56General and administrative 457 191 806 344
Total corporate expenses $ 2,573 $ 1,422 $ 5,086 $ 2,706
Corporate expenses in Q2-11 were $2,573 (YTD - $5,086), or 3.9% (YTD - 3.9%) of gross revenues compared to$1,422 (YTD - $2,706), or 3.6% (YTD - 3.7%) of gross revenues in Q2-10. The increase in advisory fees is due tothe number of properties acquired since Q2-10. For unit-based compensation, a liability is recognized andmeasured initially at fair value. The liability is remeasured to fair value at each reporting date and at each settlementdate. Any change in the fair value of the liability is recognized as compensation expense for the period. An increasein the value of the REIT's units and the number of options outstanding has caused an increase in the compensationexpense for the period.
FOREIGN CURRENCY TRANSLATION GAIN
In Q2-11, the REIT held cash, deposits and the Series G debentures in US dollars. This resulted in a foreigncurrency translation gain of $2,025 (YTD - $1,922) compared to a gain of $96 (YTD - $96) in Q2-10.
Page 22
ARTIS REAL ESTATE INVESTMENT TRUSTManagement's Discussion and Analysis - Q2-11(In thousands of Canadian dollars, unless otherwise noted)
INCOME TAX EXPENSE
The REIT is subject to taxation in the U.S. on the taxable income earned by its U.S. properties at a combined federaland state tax rate of 40.10% (YTD - 40.47%). For Q2-11, the REIT recorded a current income tax expense of $871(YTD - $797).
A deferred tax liability arises from the temporary differences between the carrying value and the tax basis of the netassets of the U.S. properties. For Q2-11, the REIT recorded a deferred tax expense of $1,790 (YTD - $1,741).
The REIT currently qualifies as a mutual fund trust for Canadian income tax purposes. Prior to new legislationrelating to the federal income taxation of publicly listed or traded trusts, as discussed below, income earned by theREIT and distributed annually to unitholders was not, and would not be, subject to taxation in the REIT, but wastaxed at the individual unitholder level. For financial statement reporting purposes, the tax deductibility of the REIT'sdistributions was treated as an exception from taxation as the REIT distributed, and was committed to continuedistributing, all of its taxable income to its unitholders.
On June 22, 2007, new legislation relating to, among other things, the federal income taxation of a specifiedinvestment flow-through trust or partnership (a "SIFT") was enacted (such legislation, as amended, referred to as the“SIFT Rules”). A SIFT includes a publicly-listed or traded partnership or trust, such as an income trust. Under theSIFT Rules, following a transition period for qualifying SIFTs, certain distributions from a SIFT will no longer bedeductible in computing a SIFT's taxable income, and a SIFT will be subject to tax on such distributions at a rate thatis substantially equivalent to the general tax rate applicable to a Canadian corporation. However, distributions paidby a SIFT as returns of capital should generally not be subject to the tax. A qualifying SIFT is a trust which was aSIFT on October 31, 2006. The application of the SIFT Rules to a qualifying trust is delayed until the earlier of thetrust’s 2011 taxation year and the first taxation year in which it exceeds certain specified growth guidelines. In thecase of the REIT, its subsequent offerings have exceeded the specified growth guidelines. Therefore, commencingon January 1, 2007, subject to the REIT’s ability to meet the REIT Conditions, the REIT is subject to tax on certainincome which may adversely impact the level of cash otherwise available for distribution. Please refer to the REIT’sAnnual Information Form for a more detailed discussion of the SIFT Rules and their application to the REIT.
The SIFT Rules do not apply to a “real estate investment trust" that meets prescribed conditions relating to thenature of its assets and revenue (the "REIT Conditions"). The REIT has reviewed the SIFT Rules and has assessedtheir interpretation and application to the REIT's assets and revenues. While there are uncertainties in theinterpretation and application of the SIFT Rules, the REIT believes that it has met the REIT Conditions throughoutthe three months and six months ended June 30, 2011 and the year ended December 31, 2010.
TRANSACTION COSTS
During Q2-11, $9,122 (YTD - $10,328) of transaction costs were expensed in accordance with IFRS compared to$7,259 (YTD - $8,588) in Q2-10. During Q2-11, the REIT issued new Series G debentures and expensed $3,633 oftransaction costs related to the issuance compared to $3,754 of transaction costs related to Series F debentures inQ2-10. The remainder of the transaction costs are attributable to the acquisition of properties.
(LOSS) GAIN ON FINANCIAL INSTRUMENTS
Prior to May 14, 2010, the REIT had a contractual obligation to make cash distributions to its unitholders. Therefore,the REIT's trust units were classified as a financial liability measured at fair value. On May 14, 2010, the Declarationof Trust was amended to make distributions non-mandatory and the trust units were reclassified from liabilities toequity at the fair value of the liability at that date. During Q2-10, the REIT recorded an unrealized gain on the liabilityof $7,504 (YTD - loss of $19,361).
The REIT holds a number of interest rate swaps to effectively lock the interest rate on a portion of floating rate debt.In accordance with IFRS, the REIT recorded an unrealized loss on the fair value adjustment of the interest rateswaps outstanding of $1,576 in Q2-11 (YTD - $421). The REIT anticipates holding the mortgages and interest rateswap contracts until maturity.
In Q2-11, the REIT recorded an unrealized gain on convertible debentures of $772 (YTD - loss of $4,201) comparedto a gain of $8,585 in Q2-10 (YTD - $9,781).
Page 23
ARTIS REAL ESTATE INVESTMENT TRUSTManagement's Discussion and Analysis - Q2-11(In thousands of Canadian dollars, unless otherwise noted)
UNREALIZED FAIR VALUE GAIN ON INVESTMENT PROPERTIES
The changes in fair value of investment properties, period over period, are recognized as fair value gains and lossesin the statement of operations. Fair values of the investment properties are determined through a combination of thediscounted cash flow method and the overall capitalization method which are generally accepted appraisalmethodologies. External valuations are performed on a rotational basis over a four year cycle. In Q2-11, the fairvalue gain on investment properties is $47,975 (YTD - $164,135) compared to $11,188 (YTD - $10,717) in Q2-10.The increase in the fair value change is the result of two factors. The first factor is that the size and mix of the Q2-11portfolio is significantly different than the size and mix of the portfolio in Q2-10. Also in Q1-11, significantcapitalization rate compression was noted in several markets with further compression in Q2-11.
OTHER COMPREHENSIVE LOSS
Other comprehensive loss includes the unrealized foreign currency translation loss in Q2-11 of $2,278 (YTD -$4,347). Foreign currency translation gains and losses related to the REIT's net investment in foreign operations inthe U.S. are recorded in other comprehensive loss according to IFRS.
DISTRIBUTABLE INCOME ("DI")
Artis will no longer be presenting DI as approved at the Annual and Special Meeting of Unitholders on May 19, 2011.
DISTRIBUTIONS
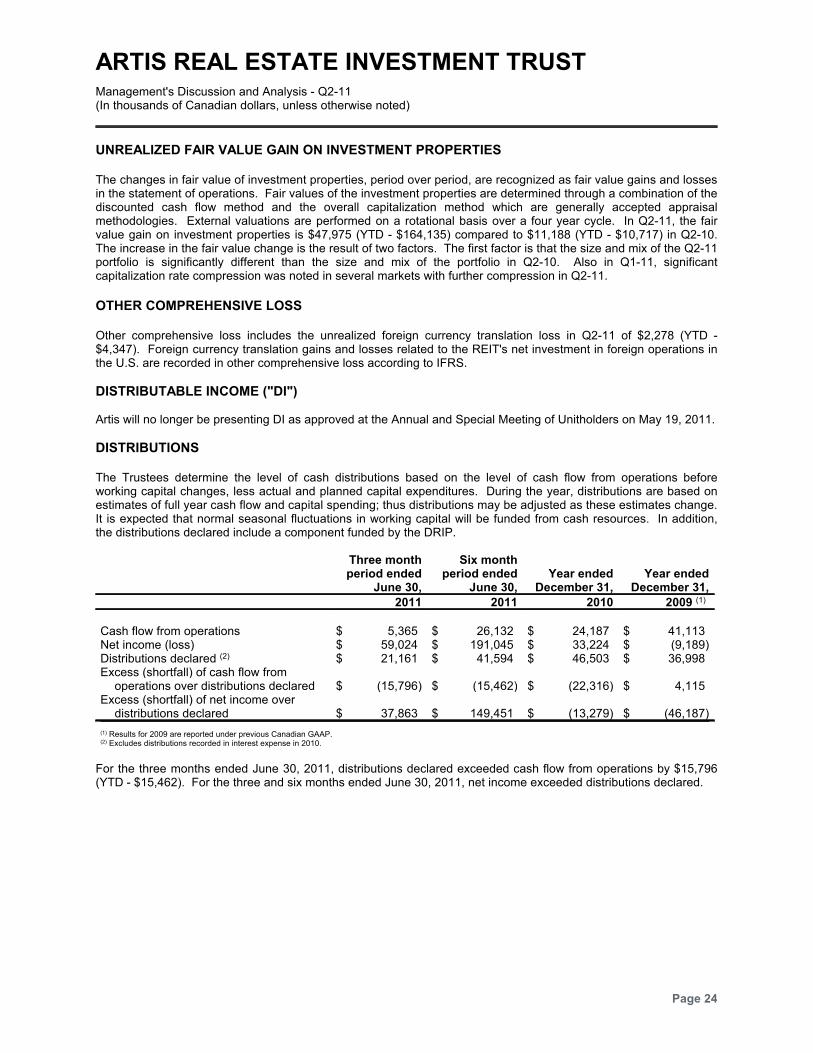
The Trustees determine the level of cash distributions based on the level of cash flow from operations beforeworking capital changes, less actual and planned capital expenditures. During the year, distributions are based onestimates of full year cash flow and capital spending; thus distributions may be adjusted as these estimates change.It is expected that normal seasonal fluctuations in working capital will be funded from cash resources. In addition,the distributions declared include a component funded by the DRIP.
Three monthperiod ended
June 30,
Six monthperiod ended
June 30,Year ended
December 31,Year ended
December 31,
2011 2011 2010 2009 (1)
Cash flow from operations $ 5,365 $ 26,132 $ 24,187 $ 41,113Net income (loss) $ 59,024 $ 191,045 $ 33,224 $ (9,189)Distributions declared (2) $ 21,161 $ 41,594 $ 46,503 $ 36,998Excess (shortfall) of cash flow from
operations over distributions declared $ (15,796) $ (15,462) $ (22,316) $ 4,115Excess (shortfall) of net income over
distributions declared $ 37,863 $ 149,451 $ (13,279) $ (46,187)
(1) Results for 2009 are reported under previous Canadian GAAP.(2) Excludes distributions recorded in interest expense in 2010.
For the three months ended June 30, 2011, distributions declared exceeded cash flow from operations by $15,796(YTD - $15,462). For the three and six months ended June 30, 2011, net income exceeded distributions declared.
Page 24
ARTIS REAL ESTATE INVESTMENT TRUSTManagement's Discussion and Analysis - Q2-11(In thousands of Canadian dollars, unless otherwise noted)
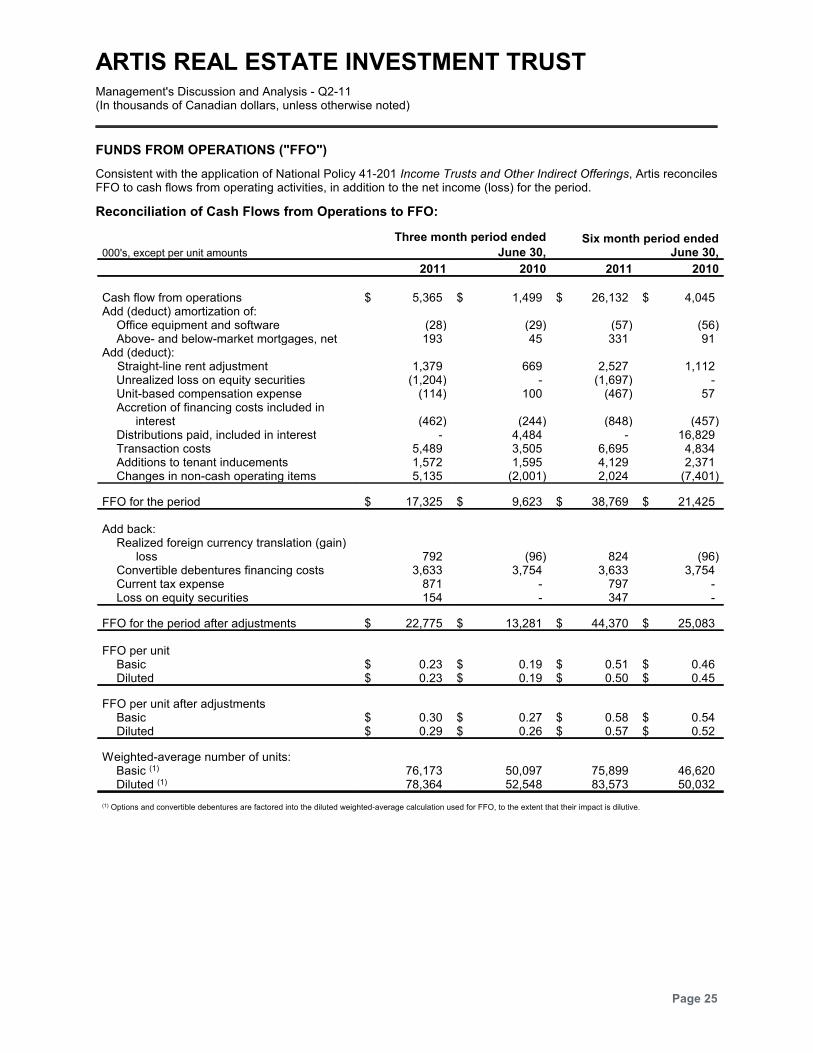
FUNDS FROM OPERATIONS ("FFO")
Consistent with the application of National Policy 41-201 Income Trusts and Other Indirect Offerings, Artis reconcilesFFO to cash flows from operating activities, in addition to the net income (loss) for the period.
Reconciliation of Cash Flows from Operations to FFO:
000's, except per unit amounts
Three month period ended
June 30,Six month period ended
June 30,
2011 2010 2011 2010
Cash flow from operations $ 5,365 $ 1,499 $ 26,132 $ 4,045Add (deduct) amortization of:
Office equipment and software (28) (29) (57) (56)Above- and below-market mortgages, net 193 45 331 91
Add (deduct):Straight-line rent adjustment 1,379 669 2,527 1,112Unrealized loss on equity securities (1,204) - (1,697) -Unit-based compensation expense (114) 100 (467) 57Accretion of financing costs included in
interest (462) (244) (848) (457)Distributions paid, included in interest - 4,484 - 16,829Transaction costs 5,489 3,505 6,695 4,834Additions to tenant inducements 1,572 1,595 4,129 2,371Changes in non-cash operating items 5,135 (2,001) 2,024 (7,401)
FFO for the period $ 17,325 $ 9,623 $ 38,769 $ 21,425
Add back:Realized foreign currency translation (gain)
loss 792 (96) 824 (96)Convertible debentures financing costs 3,633 3,754 3,633 3,754Current tax expense 871 - 797 -Loss on equity securities 154 - 347 -
FFO for the period after adjustments $ 22,775 $ 13,281 $ 44,370 $ 25,083
FFO per unitBasic $ 0.23 $ 0.19 $ 0.51 $ 0.46Diluted $ 0.23 $ 0.19 $ 0.50 $ 0.45
FFO per unit after adjustmentsBasic $ 0.30 $ 0.27 $ 0.58 $ 0.54Diluted $ 0.29 $ 0.26 $ 0.57 $ 0.52
Weighted-average number of units:Basic (1) 76,173 50,097 75,899 46,620Diluted (1) 78,364 52,548 83,573 50,032
(1) Options and convertible debentures are factored into the diluted weighted-average calculation used for FFO, to the extent that their impact is dilutive.
Page 25
ARTIS REAL ESTATE INVESTMENT TRUSTManagement's Discussion and Analysis - Q2-11(In thousands of Canadian dollars, unless otherwise noted)
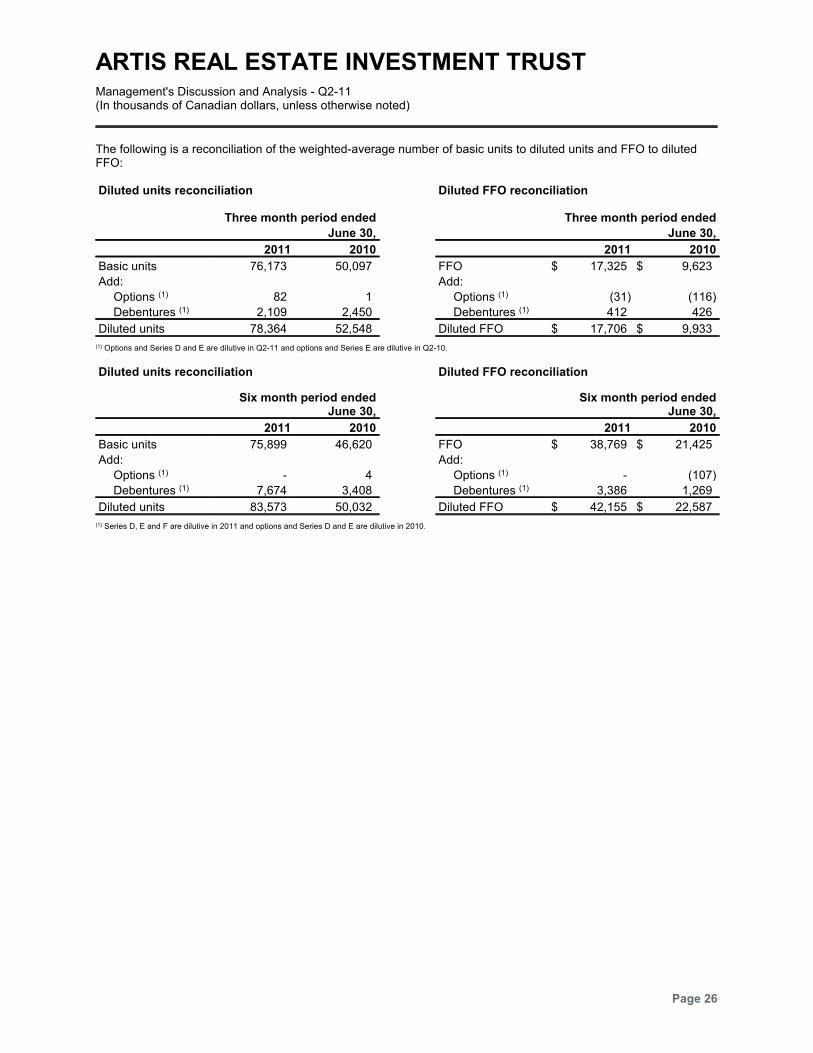
The following is a reconciliation of the weighted-average number of basic units to diluted units and FFO to dilutedFFO:
Diluted units reconciliation Diluted FFO reconciliation
Three month period ended
June 30,
Three month period ended
June 30,
2011 2010 2011 2010
Basic units 76,173 50,097 FFO $ 17,325 $ 9,623
Add: Add:
Options (1) 82 1 Options (1) (31) (116)
Debentures (1) 2,109 2,450 Debentures (1) 412 426
Diluted units 78,364 52,548 Diluted FFO $ 17,706 $ 9,933
(1) Options and Series D and E are dilutive in Q2-11 and options and Series E are dilutive in Q2-10.
Diluted units reconciliation Diluted FFO reconciliation
Six month period endedJune 30,
Six month period endedJune 30,
2011 2010 2011 2010
Basic units 75,899 46,620 FFO $ 38,769 $ 21,425
Add: Add:
Options (1) - 4 Options (1) - (107)
Debentures (1) 7,674 3,408 Debentures (1) 3,386 1,269
Diluted units 83,573 50,032 Diluted FFO $ 42,155 $ 22,587
(1) Series D, E and F are dilutive in 2011 and options and Series D and E are dilutive in 2010.
Page 26
ARTIS REAL ESTATE INVESTMENT TRUSTManagement's Discussion and Analysis - Q2-11(In thousands of Canadian dollars, unless otherwise noted)
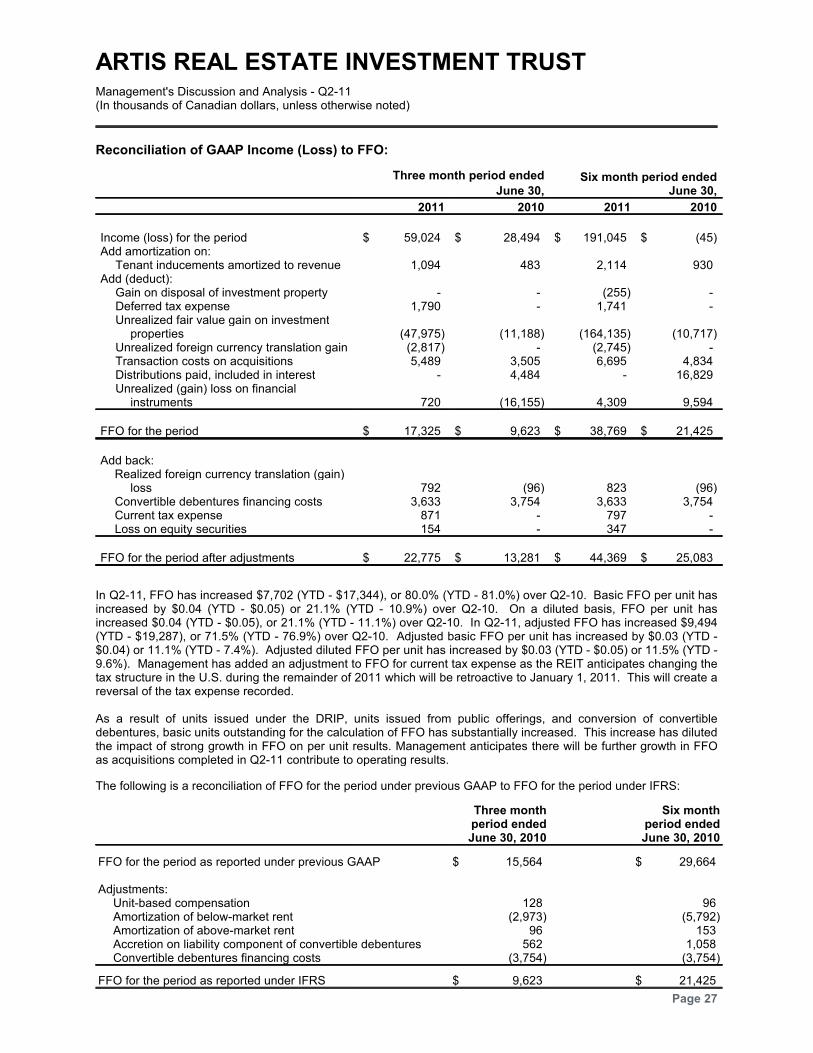
Reconciliation of GAAP Income (Loss) to FFO:
Three month period ended
June 30,Six month period ended
June 30,
2011 2010 2011 2010
Income (loss) for the period $ 59,024 $ 28,494 $ 191,045 $ (45)Add amortization on:
Tenant inducements amortized to revenue 1,094 483 2,114 930Add (deduct):
Gain on disposal of investment property - - (255) -Deferred tax expense 1,790 - 1,741 -Unrealized fair value gain on investment
properties (47,975) (11,188) (164,135) (10,717)Unrealized foreign currency translation gain (2,817) - (2,745) -Transaction costs on acquisitions 5,489 3,505 6,695 4,834Distributions paid, included in interest - 4,484 - 16,829Unrealized (gain) loss on financial
instruments 720 (16,155) 4,309 9,594
FFO for the period $ 17,325 $ 9,623 $ 38,769 $ 21,425
Add back:Realized foreign currency translation (gain)
loss 792 (96) 823 (96)Convertible debentures financing costs 3,633 3,754 3,633 3,754Current tax expense 871 - 797 -Loss on equity securities 154 - 347 -
FFO for the period after adjustments $ 22,775 $ 13,281 $ 44,369 $ 25,083
In Q2-11, FFO has increased $7,702 (YTD - $17,344), or 80.0% (YTD - 81.0%) over Q2-10. Basic FFO per unit hasincreased by $0.04 (YTD - $0.05) or 21.1% (YTD - 10.9%) over Q2-10. On a diluted basis, FFO per unit hasincreased $0.04 (YTD - $0.05), or 21.1% (YTD - 11.1%) over Q2-10. In Q2-11, adjusted FFO has increased $9,494(YTD - $19,287), or 71.5% (YTD - 76.9%) over Q2-10. Adjusted basic FFO per unit has increased by $0.03 (YTD -$0.04) or 11.1% (YTD - 7.4%). Adjusted diluted FFO per unit has increased by $0.03 (YTD - $0.05) or 11.5% (YTD -9.6%). Management has added an adjustment to FFO for current tax expense as the REIT anticipates changing thetax structure in the U.S. during the remainder of 2011 which will be retroactive to January 1, 2011. This will create areversal of the tax expense recorded.
As a result of units issued under the DRIP, units issued from public offerings, and conversion of convertibledebentures, basic units outstanding for the calculation of FFO has substantially increased. This increase has dilutedthe impact of strong growth in FFO on per unit results. Management anticipates there will be further growth in FFOas acquisitions completed in Q2-11 contribute to operating results.
The following is a reconciliation of FFO for the period under previous GAAP to FFO for the period under IFRS:
Three monthperiod endedJune 30, 2010
Six monthperiod endedJune 30, 2010
FFO for the period as reported under previous GAAP $ 15,564 $ 29,664
Adjustments:Unit-based compensation 128 96Amortization of below-market rent (2,973) (5,792)Amortization of above-market rent 96 153Accretion on liability component of convertible debentures 562 1,058Convertible debentures financing costs (3,754) (3,754)
FFO for the period as reported under IFRS $ 9,623 $ 21,425
Page 27
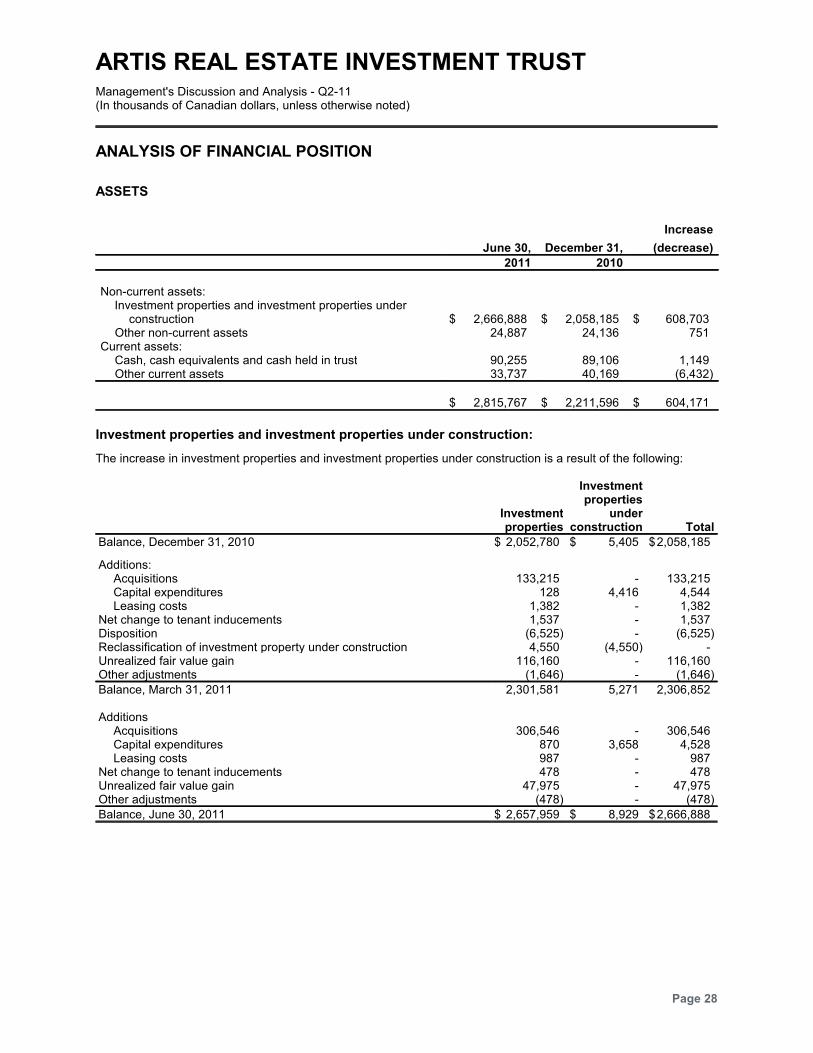
ARTIS REAL ESTATE INVESTMENT TRUSTManagement's Discussion and Analysis - Q2-11(In thousands of Canadian dollars, unless otherwise noted)
ANALYSIS OF FINANCIAL POSITION
ASSETS
June 30, December 31,
Increase
(decrease)
2011 2010
Non-current assets:Investment properties and investment properties under
construction $ 2,666,888 $ 2,058,185 $ 608,703Other non-current assets 24,887 24,136 751
Current assets:Cash, cash equivalents and cash held in trust 90,255 89,106 1,149Other current assets 33,737 40,169 (6,432)
$ 2,815,767 $ 2,211,596 $ 604,171
Investment properties and investment properties under construction:
The increase in investment properties and investment properties under construction is a result of the following:
Investmentproperties
Investmentproperties
underconstruction Total
Balance, December 31, 2010 $ 2,052,780 $ 5,405 $2,058,185
Additions:Acquisitions 133,215 - 133,215Capital expenditures 128 4,416 4,544Leasing costs 1,382 - 1,382
Net change to tenant inducements 1,537 - 1,537Disposition (6,525) - (6,525)Reclassification of investment property under construction 4,550 (4,550) -Unrealized fair value gain 116,160 - 116,160Other adjustments (1,646) - (1,646)
Balance, March 31, 2011 2,301,581 5,271 2,306,852
AdditionsAcquisitions 306,546 - 306,546Capital expenditures 870 3,658 4,528Leasing costs 987 - 987
Net change to tenant inducements 478 - 478Unrealized fair value gain 47,975 - 47,975Other adjustments (478) - (478)
Balance, June 30, 2011 $ 2,657,959 $ 8,929 $2,666,888
Page 28
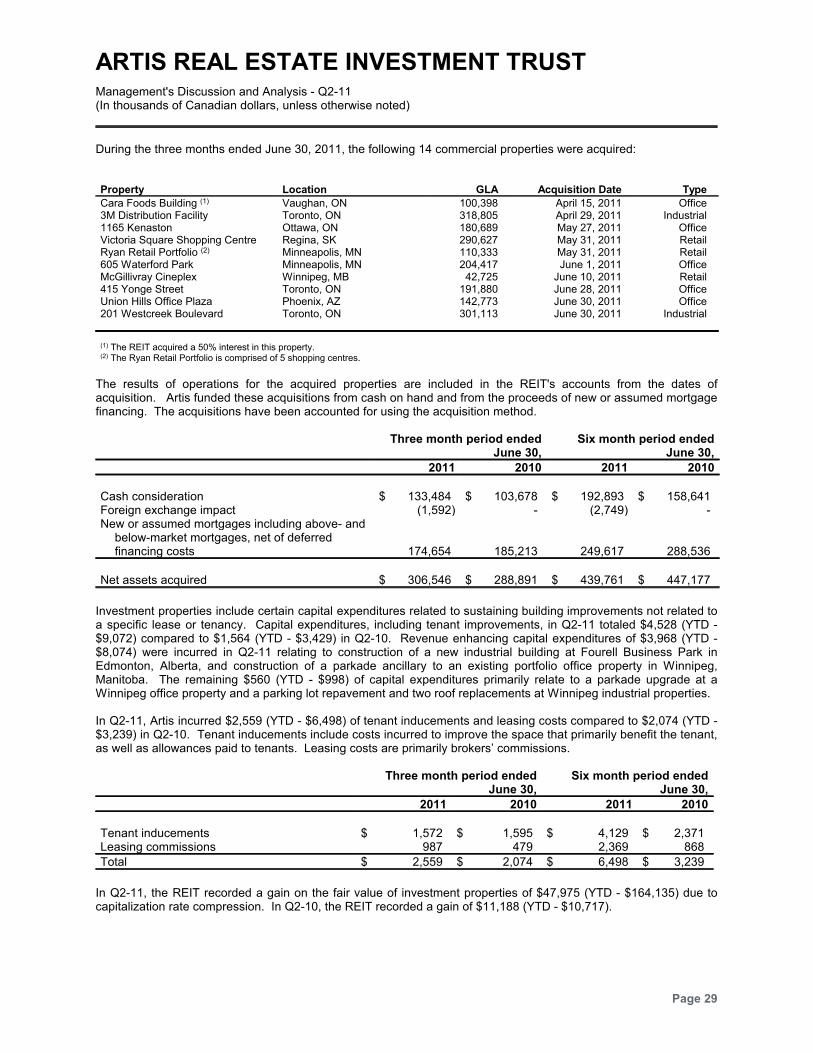
ARTIS REAL ESTATE INVESTMENT TRUSTManagement's Discussion and Analysis - Q2-11(In thousands of Canadian dollars, unless otherwise noted)
During the three months ended June 30, 2011, the following 14 commercial properties were acquired:
Property Location GLA Acquisition Date Type
Cara Foods Building (1) Vaughan, ON 100,398 April 15, 2011 Office3M Distribution Facility Toronto, ON 318,805 April 29, 2011 Industrial1165 Kenaston Ottawa, ON 180,689 May 27, 2011 OfficeVictoria Square Shopping Centre Regina, SK 290,627 May 31, 2011 RetailRyan Retail Portfolio (2) Minneapolis, MN 110,333 May 31, 2011 Retail605 Waterford Park Minneapolis, MN 204,417 June 1, 2011 OfficeMcGillivray Cineplex Winnipeg, MB 42,725 June 10, 2011 Retail415 Yonge Street Toronto, ON 191,880 June 28, 2011 OfficeUnion Hills Office Plaza Phoenix, AZ 142,773 June 30, 2011 Office201 Westcreek Boulevard Toronto, ON 301,113 June 30, 2011 Industrial
(1) The REIT acquired a 50% interest in this property.(2) The Ryan Retail Portfolio is comprised of 5 shopping centres.
The results of operations for the acquired properties are included in the REIT's accounts from the dates ofacquisition. Artis funded these acquisitions from cash on hand and from the proceeds of new or assumed mortgagefinancing. The acquisitions have been accounted for using the acquisition method.
Three month period endedJune 30,
Six month period endedJune 30,
2011 2010 2011 2010
Cash consideration $ 133,484 $ 103,678 $ 192,893 $ 158,641Foreign exchange impact (1,592) - (2,749) -New or assumed mortgages including above- and
below-market mortgages, net of deferredfinancing costs 174,654 185,213 249,617 288,536
Net assets acquired $ 306,546 $ 288,891 $ 439,761 $ 447,177
Investment properties include certain capital expenditures related to sustaining building improvements not related toa specific lease or tenancy. Capital expenditures, including tenant improvements, in Q2-11 totaled $4,528 (YTD -$9,072) compared to $1,564 (YTD - $3,429) in Q2-10. Revenue enhancing capital expenditures of $3,968 (YTD -$8,074) were incurred in Q2-11 relating to construction of a new industrial building at Fourell Business Park inEdmonton, Alberta, and construction of a parkade ancillary to an existing portfolio office property in Winnipeg,Manitoba. The remaining $560 (YTD - $998) of capital expenditures primarily relate to a parkade upgrade at aWinnipeg office property and a parking lot repavement and two roof replacements at Winnipeg industrial properties.
In Q2-11, Artis incurred $2,559 (YTD - $6,498) of tenant inducements and leasing costs compared to $2,074 (YTD -$3,239) in Q2-10. Tenant inducements include costs incurred to improve the space that primarily benefit the tenant,as well as allowances paid to tenants. Leasing costs are primarily brokers’ commissions.
Three month period endedJune 30,
Six month period endedJune 30,
2011 2010 2011 2010
Tenant inducements $ 1,572 $ 1,595 $ 4,129 $ 2,371Leasing commissions 987 479 2,369 868
Total $ 2,559 $ 2,074 $ 6,498 $ 3,239
In Q2-11, the REIT recorded a gain on the fair value of investment properties of $47,975 (YTD - $164,135) due tocapitalization rate compression. In Q2-10, the REIT recorded a gain of $11,188 (YTD - $10,717).
Page 29
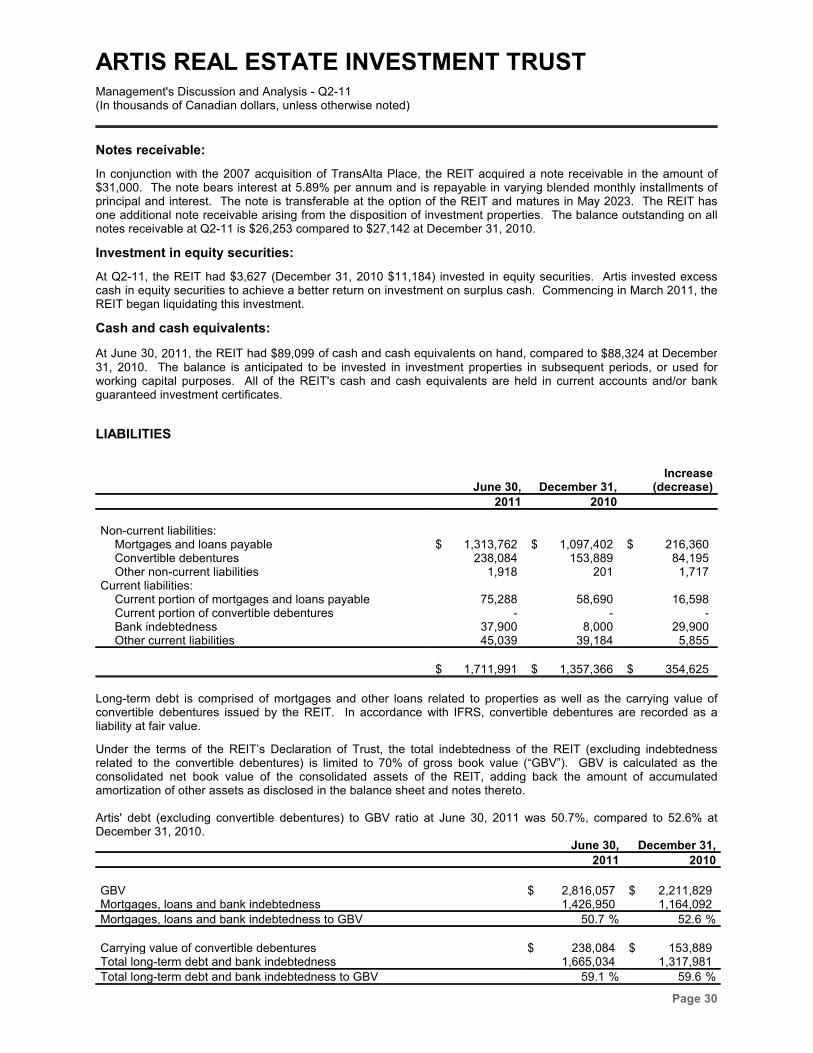
ARTIS REAL ESTATE INVESTMENT TRUSTManagement's Discussion and Analysis - Q2-11(In thousands of Canadian dollars, unless otherwise noted)
Notes receivable:
In conjunction with the 2007 acquisition of TransAlta Place, the REIT acquired a note receivable in the amount of$31,000. The note bears interest at 5.89% per annum and is repayable in varying blended monthly installments ofprincipal and interest. The note is transferable at the option of the REIT and matures in May 2023. The REIT hasone additional note receivable arising from the disposition of investment properties. The balance outstanding on allnotes receivable at Q2-11 is $26,253 compared to $27,142 at December 31, 2010.
Investment in equity securities:
At Q2-11, the REIT had $3,627 (December 31, 2010 $11,184) invested in equity securities. Artis invested excesscash in equity securities to achieve a better return on investment on surplus cash. Commencing in March 2011, theREIT began liquidating this investment.
Cash and cash equivalents:
At June 30, 2011, the REIT had $89,099 of cash and cash equivalents on hand, compared to $88,324 at December31, 2010. The balance is anticipated to be invested in investment properties in subsequent periods, or used forworking capital purposes. All of the REIT's cash and cash equivalents are held in current accounts and/or bankguaranteed investment certificates.
LIABILITIES
June 30, December 31,Increase
(decrease)
2011 2010
Non-current liabilities:Mortgages and loans payable $ 1,313,762 $ 1,097,402 $ 216,360Convertible debentures 238,084 153,889 84,195Other non-current liabilities 1,918 201 1,717
Current liabilities:Current portion of mortgages and loans payable 75,288 58,690 16,598Current portion of convertible debentures - - -Bank indebtedness 37,900 8,000 29,900Other current liabilities 45,039 39,184 5,855
$ 1,711,991 $ 1,357,366 $ 354,625
Long-term debt is comprised of mortgages and other loans related to properties as well as the carrying value ofconvertible debentures issued by the REIT. In accordance with IFRS, convertible debentures are recorded as aliability at fair value.
Under the terms of the REIT’s Declaration of Trust, the total indebtedness of the REIT (excluding indebtednessrelated to the convertible debentures) is limited to 70% of gross book value (“GBV”). GBV is calculated as theconsolidated net book value of the consolidated assets of the REIT, adding back the amount of accumulatedamortization of other assets as disclosed in the balance sheet and notes thereto.
Artis' debt (excluding convertible debentures) to GBV ratio at June 30, 2011 was 50.7%, compared to 52.6% atDecember 31, 2010.
June 30, December 31,
2011 2010
GBV $ 2,816,057 $ 2,211,829Mortgages, loans and bank indebtedness 1,426,950 1,164,092
Mortgages, loans and bank indebtedness to GBV %50.7 %52.6
Carrying value of convertible debentures $ 238,084 $ 153,889Total long-term debt and bank indebtedness 1,665,034 1,317,981
Total long-term debt and bank indebtedness to GBV %59.1 %59.6
Page 30
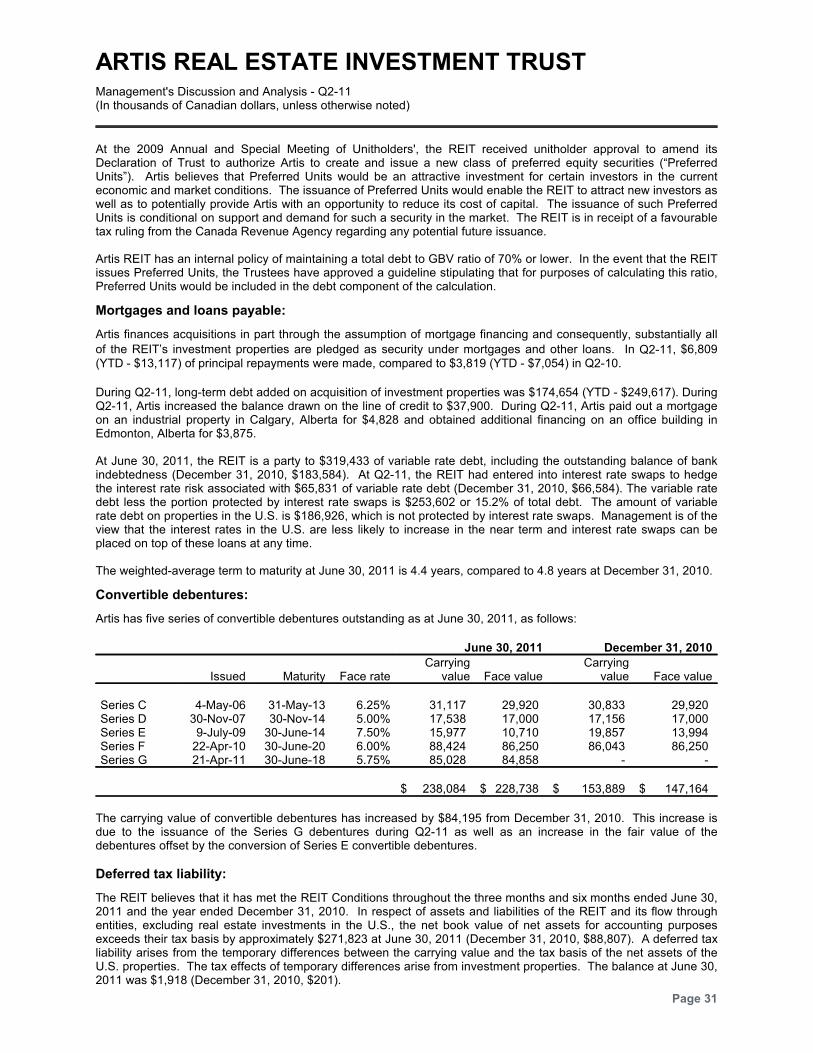
ARTIS REAL ESTATE INVESTMENT TRUSTManagement's Discussion and Analysis - Q2-11(In thousands of Canadian dollars, unless otherwise noted)
At the 2009 Annual and Special Meeting of Unitholders', the REIT received unitholder approval to amend itsDeclaration of Trust to authorize Artis to create and issue a new class of preferred equity securities (“PreferredUnits”). Artis believes that Preferred Units would be an attractive investment for certain investors in the currenteconomic and market conditions. The issuance of Preferred Units would enable the REIT to attract new investors aswell as to potentially provide Artis with an opportunity to reduce its cost of capital. The issuance of such PreferredUnits is conditional on support and demand for such a security in the market. The REIT is in receipt of a favourabletax ruling from the Canada Revenue Agency regarding any potential future issuance.
Artis REIT has an internal policy of maintaining a total debt to GBV ratio of 70% or lower. In the event that the REITissues Preferred Units, the Trustees have approved a guideline stipulating that for purposes of calculating this ratio,Preferred Units would be included in the debt component of the calculation.
Mortgages and loans payable:
Artis finances acquisitions in part through the assumption of mortgage financing and consequently, substantially all
of the REIT’s investment properties are pledged as security under mortgages and other loans. In Q2-11, $6,809(YTD - $13,117) of principal repayments were made, compared to $3,819 (YTD - $7,054) in Q2-10.
During Q2-11, long-term debt added on acquisition of investment properties was $174,654 (YTD - $249,617). DuringQ2-11, Artis increased the balance drawn on the line of credit to $37,900. During Q2-11, Artis paid out a mortgageon an industrial property in Calgary, Alberta for $4,828 and obtained additional financing on an office building inEdmonton, Alberta for $3,875.
At June 30, 2011, the REIT is a party to $319,433 of variable rate debt, including the outstanding balance of bankindebtedness (December 31, 2010, $183,584). At Q2-11, the REIT had entered into interest rate swaps to hedgethe interest rate risk associated with $65,831 of variable rate debt (December 31, 2010, $66,584). The variable ratedebt less the portion protected by interest rate swaps is $253,602 or 15.2% of total debt. The amount of variablerate debt on properties in the U.S. is $186,926, which is not protected by interest rate swaps. Management is of theview that the interest rates in the U.S. are less likely to increase in the near term and interest rate swaps can beplaced on top of these loans at any time.
The weighted-average term to maturity at June 30, 2011 is 4.4 years, compared to 4.8 years at December 31, 2010.
Convertible debentures:
Artis has five series of convertible debentures outstanding as at June 30, 2011, as follows:
June 30, 2011 December 31, 2010
Issued Maturity Face rateCarrying
value Face valueCarrying
value Face value
Series C 4-May-06 31-May-13 6.25% 31,117 29,920 30,833 29,920Series D 30-Nov-07 30-Nov-14 5.00% 17,538 17,000 17,156 17,000Series E 9-July-09 30-June-14 7.50% 15,977 10,710 19,857 13,994Series F 22-Apr-10 30-June-20 6.00% 88,424 86,250 86,043 86,250Series G 21-Apr-11 30-June-18 5.75% 85,028 84,858 - -
$ 238,084 $ 228,738 $ 153,889 $ 147,164
The carrying value of convertible debentures has increased by $84,195 from December 31, 2010. This increase isdue to the issuance of the Series G debentures during Q2-11 as well as an increase in the fair value of thedebentures offset by the conversion of Series E convertible debentures.
Deferred tax liability:
The REIT believes that it has met the REIT Conditions throughout the three months and six months ended June 30,2011 and the year ended December 31, 2010. In respect of assets and liabilities of the REIT and its flow throughentities, excluding real estate investments in the U.S., the net book value of net assets for accounting purposesexceeds their tax basis by approximately $271,823 at June 30, 2011 (December 31, 2010, $88,807). A deferred taxliability arises from the temporary differences between the carrying value and the tax basis of the net assets of theU.S. properties. The tax effects of temporary differences arise from investment properties. The balance at June 30,2011 was $1,918 (December 31, 2010, $201).
Page 31
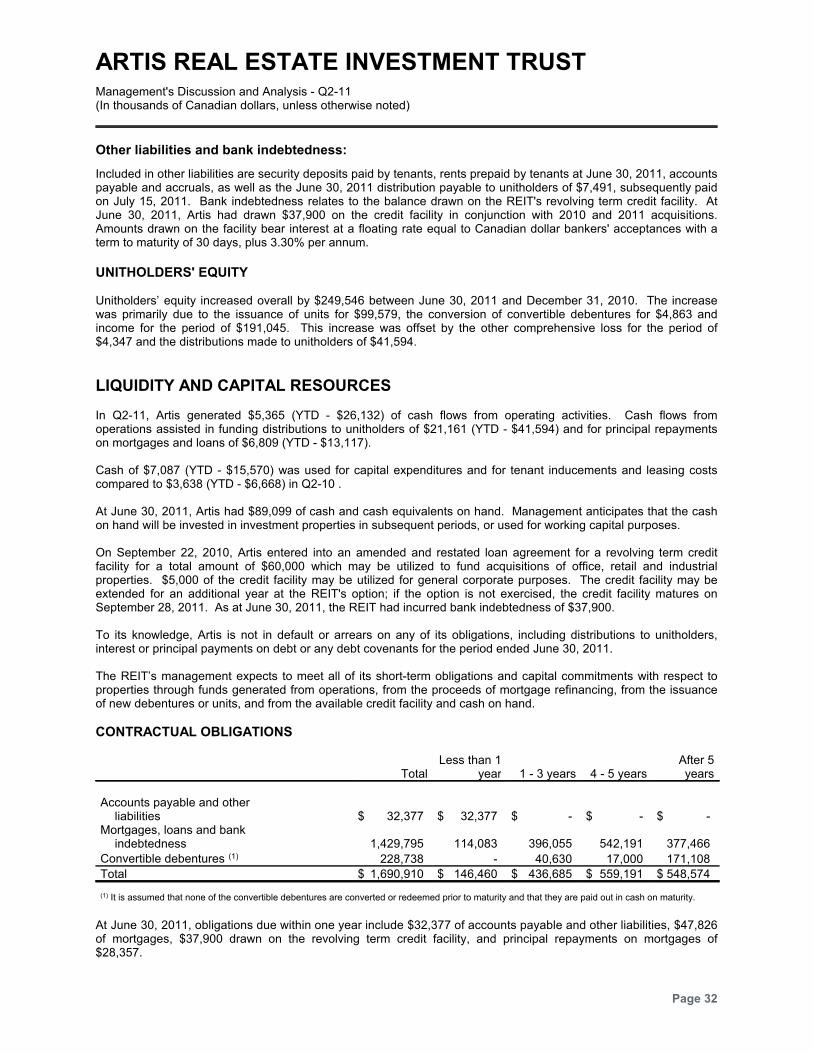
ARTIS REAL ESTATE INVESTMENT TRUSTManagement's Discussion and Analysis - Q2-11(In thousands of Canadian dollars, unless otherwise noted)
Other liabilities and bank indebtedness:
Included in other liabilities are security deposits paid by tenants, rents prepaid by tenants at June 30, 2011, accountspayable and accruals, as well as the June 30, 2011 distribution payable to unitholders of $7,491, subsequently paidon July 15, 2011. Bank indebtedness relates to the balance drawn on the REIT's revolving term credit facility. AtJune 30, 2011, Artis had drawn $37,900 on the credit facility in conjunction with 2010 and 2011 acquisitions.Amounts drawn on the facility bear interest at a floating rate equal to Canadian dollar bankers' acceptances with aterm to maturity of 30 days, plus 3.30% per annum.
UNITHOLDERS' EQUITY
Unitholders’ equity increased overall by $249,546 between June 30, 2011 and December 31, 2010. The increasewas primarily due to the issuance of units for $99,579, the conversion of convertible debentures for $4,863 andincome for the period of $191,045. This increase was offset by the other comprehensive loss for the period of$4,347 and the distributions made to unitholders of $41,594.
LIQUIDITY AND CAPITAL RESOURCES
In Q2-11, Artis generated $5,365 (YTD - $26,132) of cash flows from operating activities. Cash flows fromoperations assisted in funding distributions to unitholders of $21,161 (YTD - $41,594) and for principal repaymentson mortgages and loans of $6,809 (YTD - $13,117).
Cash of $7,087 (YTD - $15,570) was used for capital expenditures and for tenant inducements and leasing costscompared to $3,638 (YTD - $6,668) in Q2-10 .
At June 30, 2011, Artis had $89,099 of cash and cash equivalents on hand. Management anticipates that the cashon hand will be invested in investment properties in subsequent periods, or used for working capital purposes.
On September 22, 2010, Artis entered into an amended and restated loan agreement for a revolving term creditfacility for a total amount of $60,000 which may be utilized to fund acquisitions of office, retail and industrialproperties. $5,000 of the credit facility may be utilized for general corporate purposes. The credit facility may beextended for an additional year at the REIT's option; if the option is not exercised, the credit facility matures onSeptember 28, 2011. As at June 30, 2011, the REIT had incurred bank indebtedness of $37,900.
To its knowledge, Artis is not in default or arrears on any of its obligations, including distributions to unitholders,interest or principal payments on debt or any debt covenants for the period ended June 30, 2011.
The REIT’s management expects to meet all of its short-term obligations and capital commitments with respect toproperties through funds generated from operations, from the proceeds of mortgage refinancing, from the issuanceof new debentures or units, and from the available credit facility and cash on hand.
CONTRACTUAL OBLIGATIONS
TotalLess than 1
year 1 - 3 years 4 - 5 yearsAfter 5years
Accounts payable and otherliabilities $ 32,377 $ 32,377 $ - $ - $ -
Mortgages, loans and bankindebtedness 1,429,795 114,083 396,055 542,191 377,466
Convertible debentures (1) 228,738 - 40,630 17,000 171,108
Total $ 1,690,910 $ 146,460 $ 436,685 $ 559,191 $ 548,574
(1) It is assumed that none of the convertible debentures are converted or redeemed prior to maturity and that they are paid out in cash on maturity.
At June 30, 2011, obligations due within one year include $32,377 of accounts payable and other liabilities, $47,826of mortgages, $37,900 drawn on the revolving term credit facility, and principal repayments on mortgages of$28,357.
Page 32
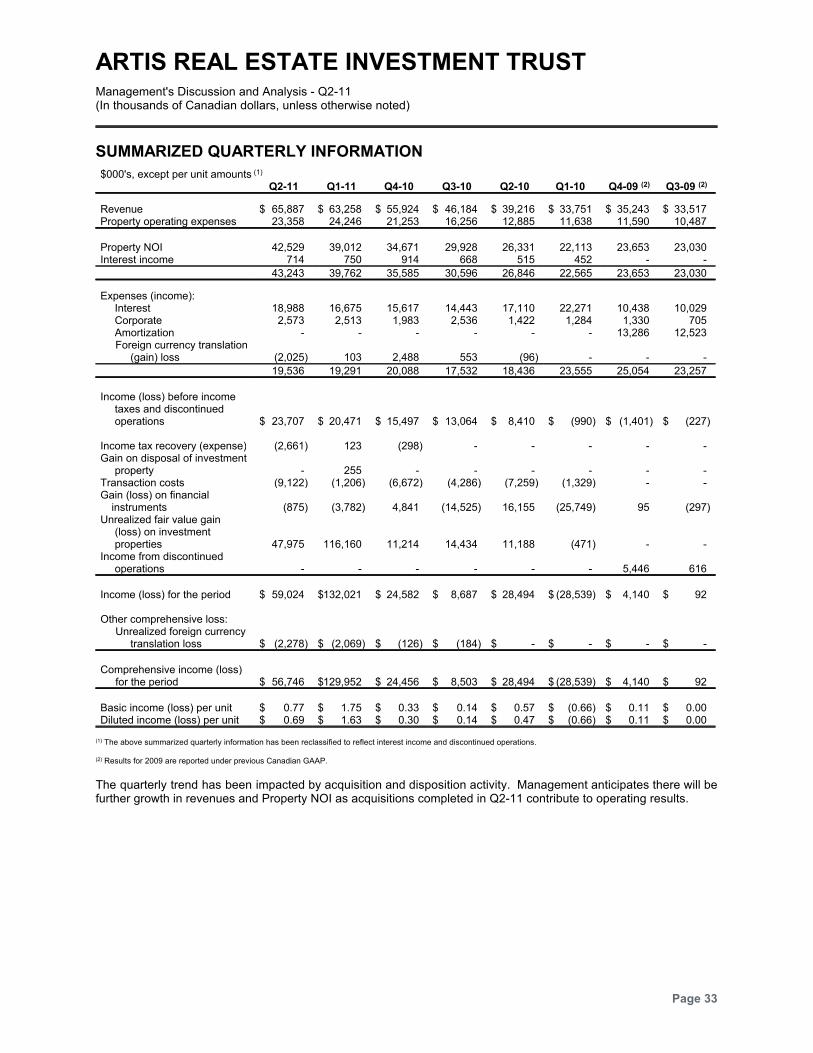
ARTIS REAL ESTATE INVESTMENT TRUSTManagement's Discussion and Analysis - Q2-11(In thousands of Canadian dollars, unless otherwise noted)
SUMMARIZED QUARTERLY INFORMATION
$000's, except per unit amounts (1)
Q2-11 Q1-11 Q4-10 Q3-10 Q2-10 Q1-10 Q4-09 (2) Q3-09 (2)
Revenue $ 65,887 $ 63,258 $ 55,924 $ 46,184 $ 39,216 $ 33,751 $ 35,243 $ 33,517Property operating expenses 23,358 24,246 21,253 16,256 12,885 11,638 11,590 10,487
Property NOI 42,529 39,012 34,671 29,928 26,331 22,113 23,653 23,030Interest income 714 750 914 668 515 452 - -
43,243 39,762 35,585 30,596 26,846 22,565 23,653 23,030
Expenses (income):Interest 18,988 16,675 15,617 14,443 17,110 22,271 10,438 10,029Corporate 2,573 2,513 1,983 2,536 1,422 1,284 1,330 705Amortization - - - - - - 13,286 12,523Foreign currency translation
(gain) loss (2,025) 103 2,488 553 (96) - - -
19,536 19,291 20,088 17,532 18,436 23,555 25,054 23,257
Income (loss) before incometaxes and discontinuedoperations $ 23,707 $ 20,471 $ 15,497 $ 13,064 $ 8,410 $ (990) $ (1,401) $ (227)
Income tax recovery (expense) (2,661) 123 (298) - - - - -Gain on disposal of investment
property - 255 - - - - - -Transaction costs (9,122) (1,206) (6,672) (4,286) (7,259) (1,329) - -Gain (loss) on financial
instruments (875) (3,782) 4,841 (14,525) 16,155 (25,749) 95 (297)Unrealized fair value gain
(loss) on investmentproperties 47,975 116,160 11,214 14,434 11,188 (471) - -
Income from discontinuedoperations - - - - - - 5,446 616
Income (loss) for the period $ 59,024 $132,021 $ 24,582 $ 8,687 $ 28,494 $ (28,539) $ 4,140 $ 92
Other comprehensive loss:Unrealized foreign currency
translation loss $ (2,278) $ (2,069) $ (126) $ (184) $ - $ - $ - $ -
Comprehensive income (loss)for the period $ 56,746 $129,952 $ 24,456 $ 8,503 $ 28,494 $ (28,539) $ 4,140 $ 92
Basic income (loss) per unit $ 0.77 $ 1.75 $ 0.33 $ 0.14 $ 0.57 $ (0.66) $ 0.11 $ 0.00Diluted income (loss) per unit $ 0.69 $ 1.63 $ 0.30 $ 0.14 $ 0.47 $ (0.66) $ 0.11 $ 0.00
(1) The above summarized quarterly information has been reclassified to reflect interest income and discontinued operations.
(2) Results for 2009 are reported under previous Canadian GAAP.
The quarterly trend has been impacted by acquisition and disposition activity. Management anticipates there will befurther growth in revenues and Property NOI as acquisitions completed in Q2-11 contribute to operating results.
Page 33
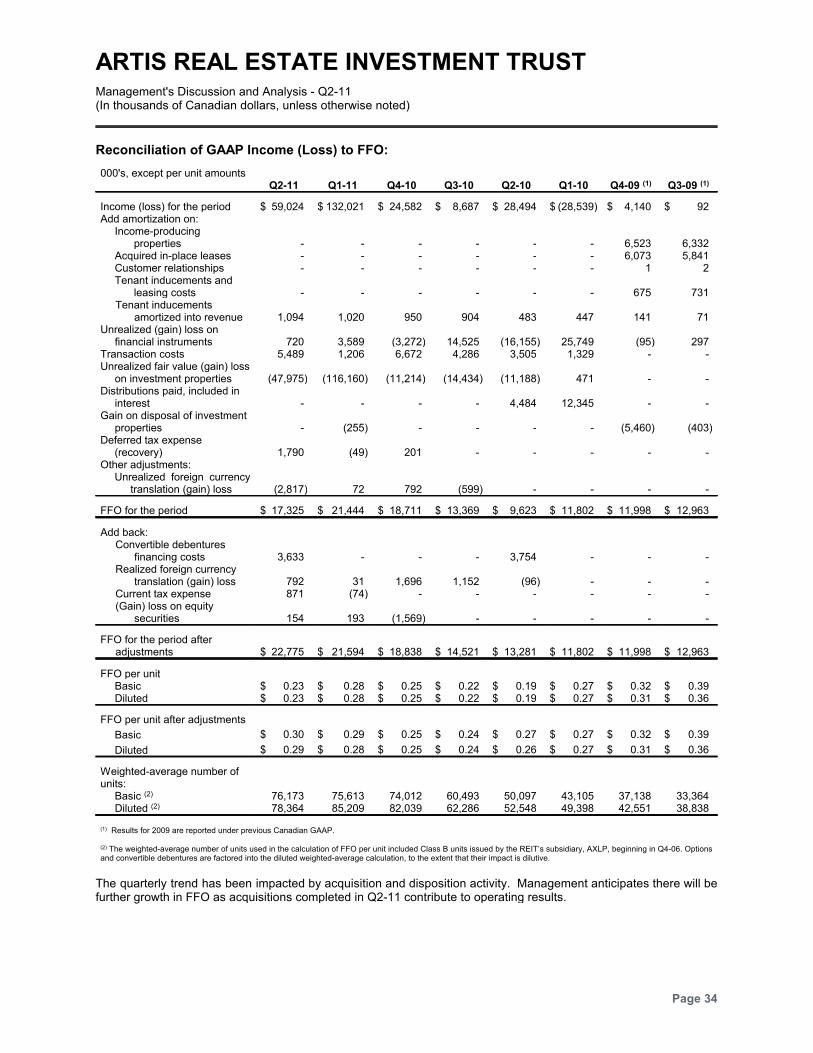
ARTIS REAL ESTATE INVESTMENT TRUSTManagement's Discussion and Analysis - Q2-11(In thousands of Canadian dollars, unless otherwise noted)
Reconciliation of GAAP Income (Loss) to FFO:
000's, except per unit amountsQ2-11 Q1-11 Q4-10 Q3-10 Q2-10 Q1-10 Q4-09 (1) Q3-09 (1)
Income (loss) for the period $ 59,024 $ 132,021 $ 24,582 $ 8,687 $ 28,494 $ (28,539) $ 4,140 $ 92Add amortization on:
Income-producingproperties - - - - - - 6,523 6,332
Acquired in-place leases - - - - - - 6,073 5,841Customer relationships - - - - - - 1 2Tenant inducements and
leasing costs - - - - - - 675 731Tenant inducements
amortized into revenue 1,094 1,020 950 904 483 447 141 71Unrealized (gain) loss on
financial instruments 720 3,589 (3,272) 14,525 (16,155) 25,749 (95) 297Transaction costs 5,489 1,206 6,672 4,286 3,505 1,329 - -Unrealized fair value (gain) loss
on investment properties (47,975) (116,160) (11,214) (14,434) (11,188) 471 - -Distributions paid, included in
interest - - - - 4,484 12,345 - -Gain on disposal of investment
properties - (255) - - - - (5,460) (403)Deferred tax expense
(recovery) 1,790 (49) 201 - - - - -Other adjustments:
Unrealized foreign currencytranslation (gain) loss (2,817) 72 792 (599) - - - -
FFO for the period $ 17,325 $ 21,444 $ 18,711 $ 13,369 $ 9,623 $ 11,802 $ 11,998 $ 12,963
Add back:Convertible debentures
financing costs 3,633 - - - 3,754 - - -Realized foreign currency
translation (gain) loss 792 31 1,696 1,152 (96) - - -Current tax expense 871 (74) - - - - - -(Gain) loss on equity
securities 154 193 (1,569) - - - - -
FFO for the period afteradjustments $ 22,775 $ 21,594 $ 18,838 $ 14,521 $ 13,281 $ 11,802 $ 11,998 $ 12,963
FFO per unitBasic $ 0.23 $ 0.28 $ 0.25 $ 0.22 $ 0.19 $ 0.27 $ 0.32 $ 0.39Diluted $ 0.23 $ 0.28 $ 0.25 $ 0.22 $ 0.19 $ 0.27 $ 0.31 $ 0.36
FFO per unit after adjustments
Basic $ 0.30 $ 0.29 $ 0.25 $ 0.24 $ 0.27 $ 0.27 $ 0.32 $ 0.39
Diluted $ 0.29 $ 0.28 $ 0.25 $ 0.24 $ 0.26 $ 0.27 $ 0.31 $ 0.36
Weighted-average number ofunits:
Basic (2) 76,173 75,613 74,012 60,493 50,097 43,105 37,138 33,364Diluted (2) 78,364 85,209 82,039 62,286 52,548 49,398 42,551 38,838
(1) Results for 2009 are reported under previous Canadian GAAP.
(2) The weighted-average number of units used in the calculation of FFO per unit included Class B units issued by the REIT’s subsidiary, AXLP, beginning in Q4-06. Optionsand convertible debentures are factored into the diluted weighted-average calculation, to the extent that their impact is dilutive.
The quarterly trend has been impacted by acquisition and disposition activity. Management anticipates there will befurther growth in FFO as acquisitions completed in Q2-11 contribute to operating results.
Page 34
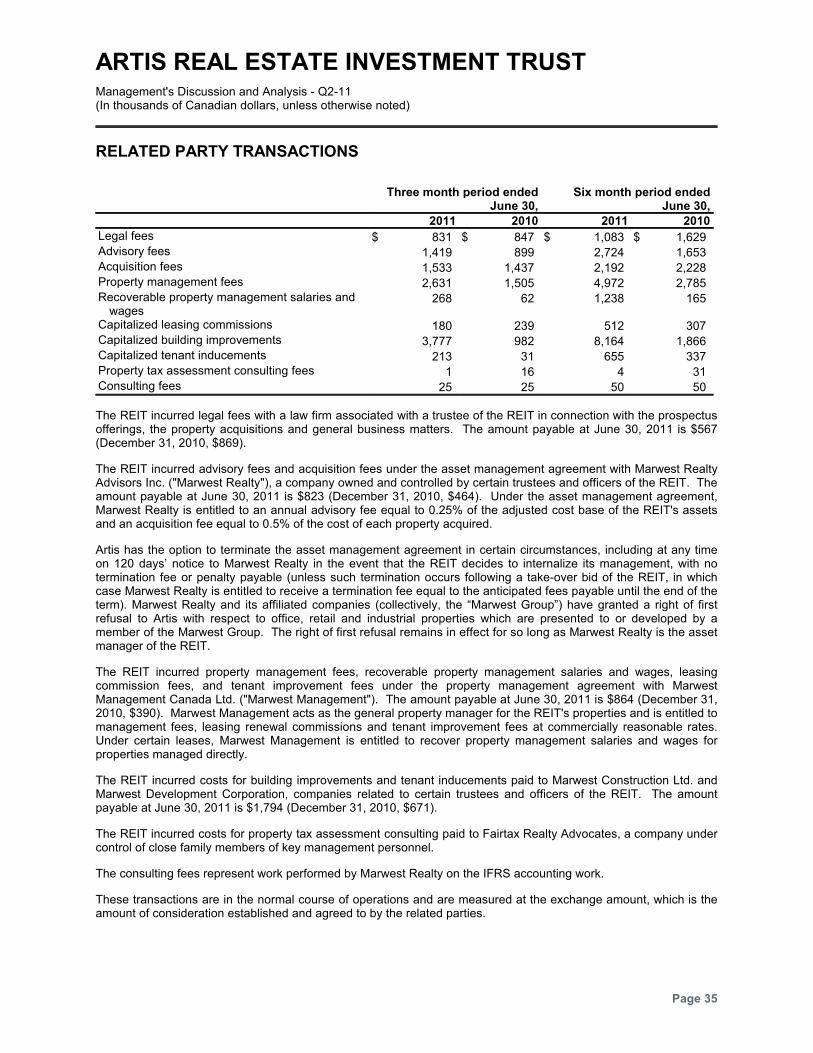
ARTIS REAL ESTATE INVESTMENT TRUSTManagement's Discussion and Analysis - Q2-11(In thousands of Canadian dollars, unless otherwise noted)
RELATED PARTY TRANSACTIONS
Three month period endedJune 30,
Six month period endedJune 30,
2011 2010 2011 2010
Legal fees $ 831 $ 847 $ 1,083 $ 1,629Advisory fees 1,419 899 2,724 1,653Acquisition fees 1,533 1,437 2,192 2,228Property management fees 2,631 1,505 4,972 2,785Recoverable property management salaries and
wages268 62 1,238 165
Capitalized leasing commissions 180 239 512 307Capitalized building improvements 3,777 982 8,164 1,866Capitalized tenant inducements 213 31 655 337Property tax assessment consulting fees 1 16 4 31Consulting fees 25 25 50 50
The REIT incurred legal fees with a law firm associated with a trustee of the REIT in connection with the prospectusofferings, the property acquisitions and general business matters. The amount payable at June 30, 2011 is $567(December 31, 2010, $869).
The REIT incurred advisory fees and acquisition fees under the asset management agreement with Marwest RealtyAdvisors Inc. ("Marwest Realty"), a company owned and controlled by certain trustees and officers of the REIT. Theamount payable at June 30, 2011 is $823 (December 31, 2010, $464). Under the asset management agreement,Marwest Realty is entitled to an annual advisory fee equal to 0.25% of the adjusted cost base of the REIT's assetsand an acquisition fee equal to 0.5% of the cost of each property acquired.
Artis has the option to terminate the asset management agreement in certain circumstances, including at any timeon 120 days’ notice to Marwest Realty in the event that the REIT decides to internalize its management, with notermination fee or penalty payable (unless such termination occurs following a take-over bid of the REIT, in whichcase Marwest Realty is entitled to receive a termination fee equal to the anticipated fees payable until the end of theterm). Marwest Realty and its affiliated companies (collectively, the “Marwest Group”) have granted a right of firstrefusal to Artis with respect to office, retail and industrial properties which are presented to or developed by amember of the Marwest Group. The right of first refusal remains in effect for so long as Marwest Realty is the assetmanager of the REIT.
The REIT incurred property management fees, recoverable property management salaries and wages, leasingcommission fees, and tenant improvement fees under the property management agreement with MarwestManagement Canada Ltd. ("Marwest Management"). The amount payable at June 30, 2011 is $864 (December 31,2010, $390). Marwest Management acts as the general property manager for the REIT's properties and is entitled tomanagement fees, leasing renewal commissions and tenant improvement fees at commercially reasonable rates.Under certain leases, Marwest Management is entitled to recover property management salaries and wages forproperties managed directly.
The REIT incurred costs for building improvements and tenant inducements paid to Marwest Construction Ltd. andMarwest Development Corporation, companies related to certain trustees and officers of the REIT. The amountpayable at June 30, 2011 is $1,794 (December 31, 2010, $671).
The REIT incurred costs for property tax assessment consulting paid to Fairtax Realty Advocates, a company undercontrol of close family members of key management personnel.
The consulting fees represent work performed by Marwest Realty on the IFRS accounting work.
These transactions are in the normal course of operations and are measured at the exchange amount, which is theamount of consideration established and agreed to by the related parties.
Page 35
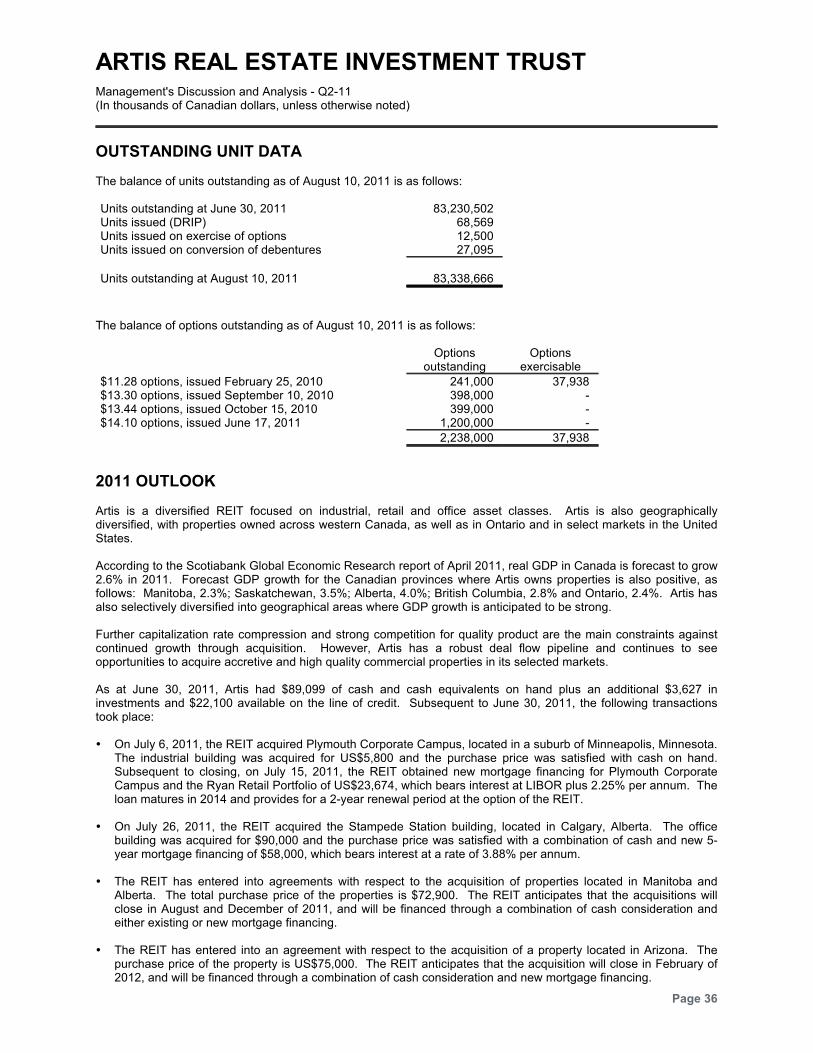
ARTIS REAL ESTATE INVESTMENT TRUSTManagement's Discussion and Analysis - Q2-11(In thousands of Canadian dollars, unless otherwise noted)
OUTSTANDING UNIT DATA
The balance of units outstanding as of August 10, 2011 is as follows:
Units outstanding at June 30, 2011 83,230,502Units issued (DRIP) 68,569Units issued on exercise of options 12,500Units issued on conversion of debentures 27,095
Units outstanding at August 10, 2011 83,338,666
The balance of options outstanding as of August 10, 2011 is as follows:
Optionsoutstanding
Optionsexercisable
$11.28 options, issued February 25, 2010 241,000 37,938$13.30 options, issued September 10, 2010 398,000 -$13.44 options, issued October 15, 2010 399,000 -$14.10 options, issued June 17, 2011 1,200,000 -
2,238,000 37,938
2011 OUTLOOK
Artis is a diversified REIT focused on industrial, retail and office asset classes. Artis is also geographicallydiversified, with properties owned across western Canada, as well as in Ontario and in select markets in the UnitedStates.
According to the Scotiabank Global Economic Research report of April 2011, real GDP in Canada is forecast to grow2.6% in 2011. Forecast GDP growth for the Canadian provinces where Artis owns properties is also positive, asfollows: Manitoba, 2.3%; Saskatchewan, 3.5%; Alberta, 4.0%; British Columbia, 2.8% and Ontario, 2.4%. Artis hasalso selectively diversified into geographical areas where GDP growth is anticipated to be strong.
Further capitalization rate compression and strong competition for quality product are the main constraints againstcontinued growth through acquisition. However, Artis has a robust deal flow pipeline and continues to seeopportunities to acquire accretive and high quality commercial properties in its selected markets.
As at June 30, 2011, Artis had $89,099 of cash and cash equivalents on hand plus an additional $3,627 ininvestments and $22,100 available on the line of credit. Subsequent to June 30, 2011, the following transactionstook place:
On July 6, 2011, the REIT acquired Plymouth Corporate Campus, located in a suburb of Minneapolis, Minnesota.The industrial building was acquired for US$5,800 and the purchase price was satisfied with cash on hand.Subsequent to closing, on July 15, 2011, the REIT obtained new mortgage financing for Plymouth CorporateCampus and the Ryan Retail Portfolio of US$23,674, which bears interest at LIBOR plus 2.25% per annum. Theloan matures in 2014 and provides for a 2-year renewal period at the option of the REIT.
On July 26, 2011, the REIT acquired the Stampede Station building, located in Calgary, Alberta. The officebuilding was acquired for $90,000 and the purchase price was satisfied with a combination of cash and new 5-year mortgage financing of $58,000, which bears interest at a rate of 3.88% per annum.
The REIT has entered into agreements with respect to the acquisition of properties located in Manitoba andAlberta. The total purchase price of the properties is $72,900. The REIT anticipates that the acquisitions willclose in August and December of 2011, and will be financed through a combination of cash consideration andeither existing or new mortgage financing.
The REIT has entered into an agreement with respect to the acquisition of a property located in Arizona. Thepurchase price of the property is US$75,000. The REIT anticipates that the acquisition will close in February of2012, and will be financed through a combination of cash consideration and new mortgage financing.
Page 36
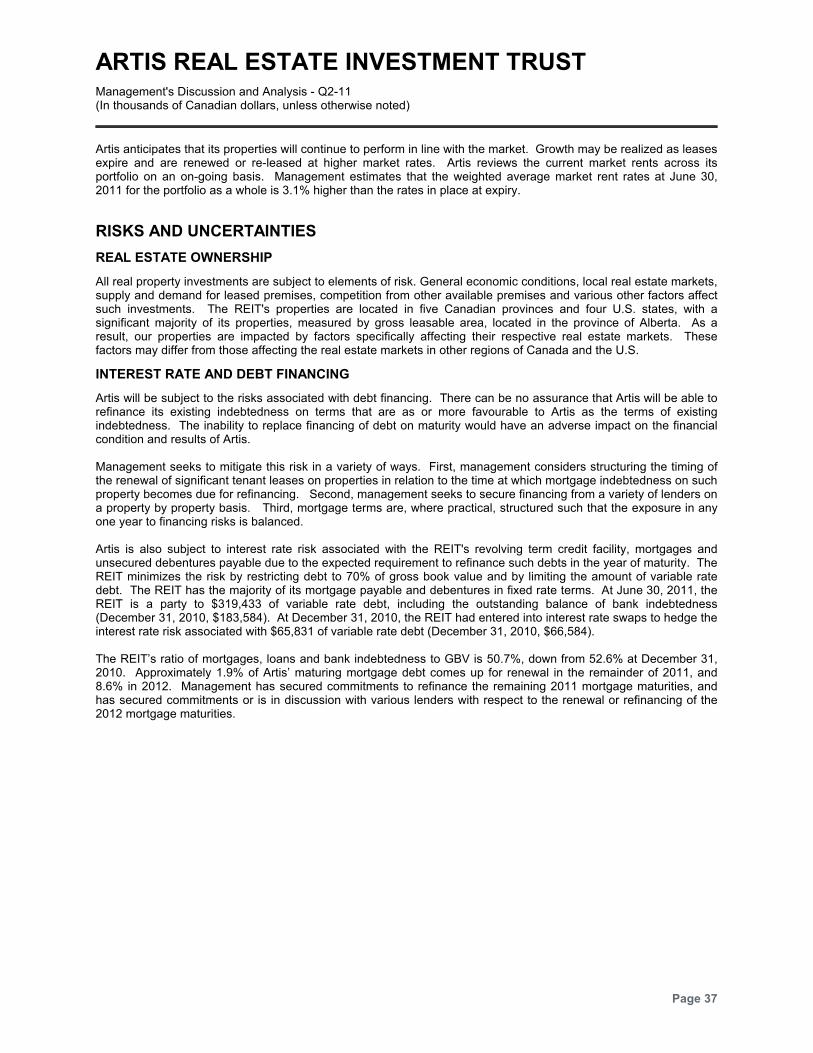
ARTIS REAL ESTATE INVESTMENT TRUSTManagement's Discussion and Analysis - Q2-11(In thousands of Canadian dollars, unless otherwise noted)
Artis anticipates that its properties will continue to perform in line with the market. Growth may be realized as leasesexpire and are renewed or re-leased at higher market rates. Artis reviews the current market rents across itsportfolio on an on-going basis. Management estimates that the weighted average market rent rates at June 30,2011 for the portfolio as a whole is 3.1% higher than the rates in place at expiry.
RISKS AND UNCERTAINTIES
REAL ESTATE OWNERSHIP
All real property investments are subject to elements of risk. General economic conditions, local real estate markets,supply and demand for leased premises, competition from other available premises and various other factors affectsuch investments. The REIT's properties are located in five Canadian provinces and four U.S. states, with asignificant majority of its properties, measured by gross leasable area, located in the province of Alberta. As aresult, our properties are impacted by factors specifically affecting their respective real estate markets. Thesefactors may differ from those affecting the real estate markets in other regions of Canada and the U.S.
INTEREST RATE AND DEBT FINANCING
Artis will be subject to the risks associated with debt financing. There can be no assurance that Artis will be able torefinance its existing indebtedness on terms that are as or more favourable to Artis as the terms of existingindebtedness. The inability to replace financing of debt on maturity would have an adverse impact on the financialcondition and results of Artis.
Management seeks to mitigate this risk in a variety of ways. First, management considers structuring the timing ofthe renewal of significant tenant leases on properties in relation to the time at which mortgage indebtedness on suchproperty becomes due for refinancing. Second, management seeks to secure financing from a variety of lenders ona property by property basis. Third, mortgage terms are, where practical, structured such that the exposure in anyone year to financing risks is balanced.
Artis is also subject to interest rate risk associated with the REIT's revolving term credit facility, mortgages andunsecured debentures payable due to the expected requirement to refinance such debts in the year of maturity. TheREIT minimizes the risk by restricting debt to 70% of gross book value and by limiting the amount of variable ratedebt. The REIT has the majority of its mortgage payable and debentures in fixed rate terms. At June 30, 2011, theREIT is a party to $319,433 of variable rate debt, including the outstanding balance of bank indebtedness(December 31, 2010, $183,584). At December 31, 2010, the REIT had entered into interest rate swaps to hedge theinterest rate risk associated with $65,831 of variable rate debt (December 31, 2010, $66,584).
The REIT’s ratio of mortgages, loans and bank indebtedness to GBV is 50.7%, down from 52.6% at December 31,2010. Approximately 1.9% of Artis’ maturing mortgage debt comes up for renewal in the remainder of 2011, and8.6% in 2012. Management has secured commitments to refinance the remaining 2011 mortgage maturities, andhas secured commitments or is in discussion with various lenders with respect to the renewal or refinancing of the2012 mortgage maturities.
Page 37
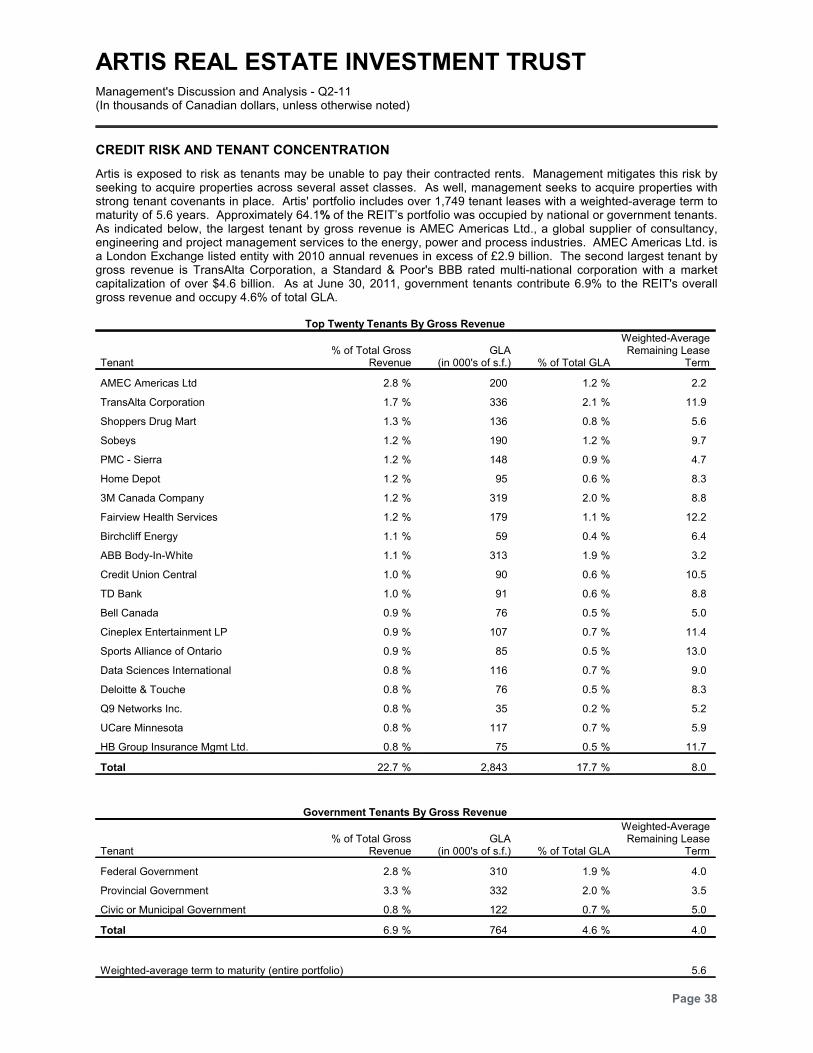
ARTIS REAL ESTATE INVESTMENT TRUSTManagement's Discussion and Analysis - Q2-11(In thousands of Canadian dollars, unless otherwise noted)
CREDIT RISK AND TENANT CONCENTRATION
Artis is exposed to risk as tenants may be unable to pay their contracted rents. Management mitigates this risk byseeking to acquire properties across several asset classes. As well, management seeks to acquire properties withstrong tenant covenants in place. Artis' portfolio includes over 1,749 tenant leases with a weighted-average term tomaturity of 5.6 years. Approximately 64.1% of the REIT’s portfolio was occupied by national or government tenants.As indicated below, the largest tenant by gross revenue is AMEC Americas Ltd., a global supplier of consultancy,engineering and project management services to the energy, power and process industries. AMEC Americas Ltd. isa London Exchange listed entity with 2010 annual revenues in excess of £2.9 billion. The second largest tenant bygross revenue is TransAlta Corporation, a Standard & Poor's BBB rated multi-national corporation with a marketcapitalization of over $4.6 billion. As at June 30, 2011, government tenants contribute 6.9% to the REIT's overallgross revenue and occupy 4.6% of total GLA.
Top Twenty Tenants By Gross Revenue
Tenant% of Total Gross
RevenueGLA
(in 000's of s.f.) % of Total GLA
Weighted-AverageRemaining Lease
Term
AMEC Americas Ltd %2.8 200 %1.2 2.2
TransAlta Corporation %1.7 336 %2.1 11.9
Shoppers Drug Mart %1.3 136 %0.8 5.6
Sobeys %1.2 190 %1.2 9.7
PMC - Sierra %1.2 148 %0.9 4.7
Home Depot %1.2 95 %0.6 8.3
3M Canada Company %1.2 319 %2.0 8.8
Fairview Health Services %1.2 179 %1.1 12.2
Birchcliff Energy %1.1 59 %0.4 6.4
ABB Body-In-White %1.1 313 %1.9 3.2
Credit Union Central %1.0 90 %0.6 10.5
TD Bank %1.0 91 %0.6 8.8
Bell Canada %0.9 76 %0.5 5.0
Cineplex Entertainment LP %0.9 107 %0.7 11.4
Sports Alliance of Ontario %0.9 85 %0.5 13.0
Data Sciences International %0.8 116 %0.7 9.0
Deloitte & Touche %0.8 76 %0.5 8.3
Q9 Networks Inc. %0.8 35 %0.2 5.2
UCare Minnesota %0.8 117 %0.7 5.9
HB Group Insurance Mgmt Ltd. %0.8 75 %0.5 11.7
Total %22.7 2,843 %17.7 8.0
Government Tenants By Gross Revenue
Tenant% of Total Gross
RevenueGLA
(in 000's of s.f.) % of Total GLA
Weighted-AverageRemaining Lease
Term
Federal Government %2.8 310 %1.9 4.0
Provincial Government %3.3 332 %2.0 3.5
Civic or Municipal Government %0.8 122 %0.7 5.0
Total %6.9 764 %4.6 4.0
Weighted-average term to maturity (entire portfolio) 5.6
Page 38
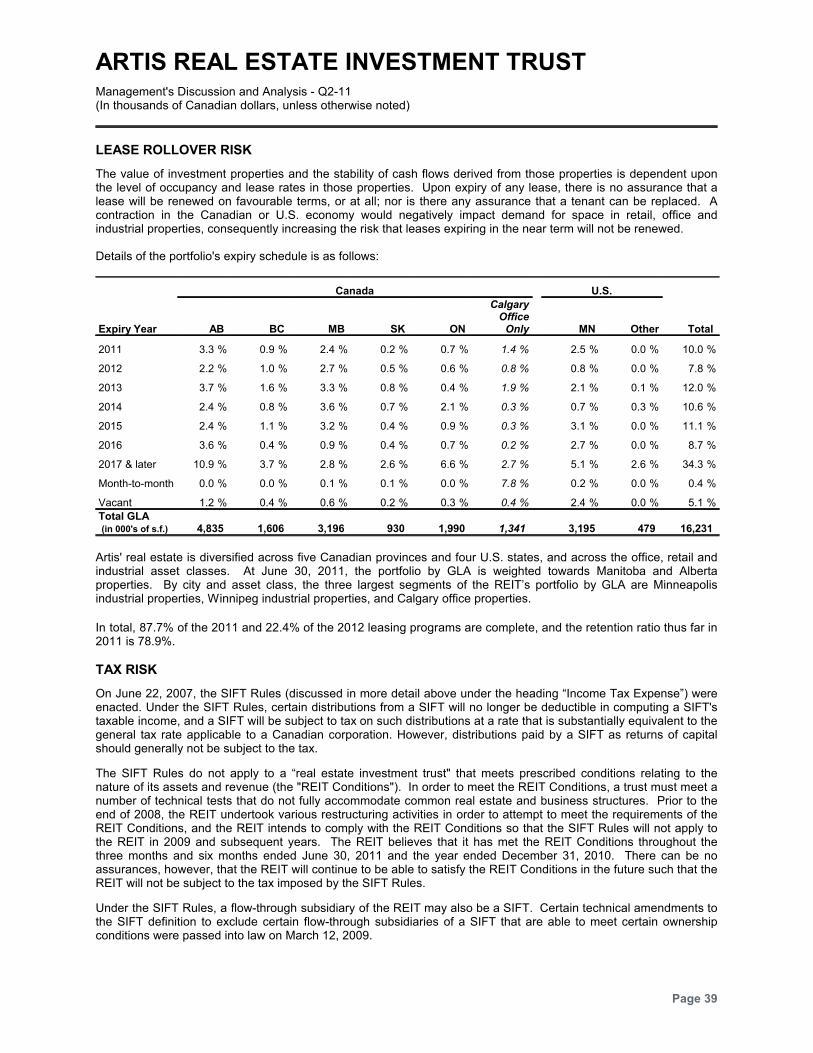
ARTIS REAL ESTATE INVESTMENT TRUSTManagement's Discussion and Analysis - Q2-11(In thousands of Canadian dollars, unless otherwise noted)
LEASE ROLLOVER RISK
The value of investment properties and the stability of cash flows derived from those properties is dependent uponthe level of occupancy and lease rates in those properties. Upon expiry of any lease, there is no assurance that alease will be renewed on favourable terms, or at all; nor is there any assurance that a tenant can be replaced. Acontraction in the Canadian or U.S. economy would negatively impact demand for space in retail, office andindustrial properties, consequently increasing the risk that leases expiring in the near term will not be renewed.
Details of the portfolio's expiry schedule is as follows:
Canada U.S.
Expiry Year AB BC MB SK ON
CalgaryOffice
Only MN Other Total
2011 %3.3 %0.9 %2.4 %0.2 %0.7 %1.4 %2.5 %0.0 %10.0
2012 %2.2 %1.0 %2.7 %0.5 %0.6 %0.8 %0.8 %0.0 %7.8
2013 %3.7 %1.6 %3.3 %0.8 %0.4 %1.9 %2.1 %0.1 %12.0
2014 %2.4 %0.8 %3.6 %0.7 %2.1 %0.3 %0.7 %0.3 %10.6
2015 %2.4 %1.1 %3.2 %0.4 %0.9 %0.3 %3.1 %0.0 %11.1
2016 %3.6 %0.4 %0.9 %0.4 %0.7 %0.2 %2.7 %0.0 %8.7
2017 & later %10.9 %3.7 %2.8 %2.6 %6.6 %2.7 %5.1 %2.6 %34.3
Month-to-month %0.0 %0.0 %0.1 %0.1 %0.0 %7.8 %0.2 %0.0 %0.4
Vacant %1.2 %0.4 %0.6 %0.2 %0.3 %0.4 %2.4 %0.0 %5.1
Total GLA(in 000's of s.f.) 4,835 1,606 3,196 930 1,990 1,341 3,195 479 16,231
Artis' real estate is diversified across five Canadian provinces and four U.S. states, and across the office, retail andindustrial asset classes. At June 30, 2011, the portfolio by GLA is weighted towards Manitoba and Albertaproperties. By city and asset class, the three largest segments of the REIT’s portfolio by GLA are Minneapolisindustrial properties, Winnipeg industrial properties, and Calgary office properties.
In total, 87.7% of the 2011 and 22.4% of the 2012 leasing programs are complete, and the retention ratio thus far in2011 is 78.9%.
TAX RISK
On June 22, 2007, the SIFT Rules (discussed in more detail above under the heading “Income Tax Expense”) wereenacted. Under the SIFT Rules, certain distributions from a SIFT will no longer be deductible in computing a SIFT'staxable income, and a SIFT will be subject to tax on such distributions at a rate that is substantially equivalent to thegeneral tax rate applicable to a Canadian corporation. However, distributions paid by a SIFT as returns of capitalshould generally not be subject to the tax.
The SIFT Rules do not apply to a “real estate investment trust" that meets prescribed conditions relating to thenature of its assets and revenue (the "REIT Conditions"). In order to meet the REIT Conditions, a trust must meet anumber of technical tests that do not fully accommodate common real estate and business structures. Prior to theend of 2008, the REIT undertook various restructuring activities in order to attempt to meet the requirements of theREIT Conditions, and the REIT intends to comply with the REIT Conditions so that the SIFT Rules will not apply tothe REIT in 2009 and subsequent years. The REIT believes that it has met the REIT Conditions throughout thethree months and six months ended June 30, 2011 and the year ended December 31, 2010. There can be noassurances, however, that the REIT will continue to be able to satisfy the REIT Conditions in the future such that theREIT will not be subject to the tax imposed by the SIFT Rules.
Under the SIFT Rules, a flow-through subsidiary of the REIT may also be a SIFT. Certain technical amendments tothe SIFT definition to exclude certain flow-through subsidiaries of a SIFT that are able to meet certain ownershipconditions were passed into law on March 12, 2009.
Page 39
ARTIS REAL ESTATE INVESTMENT TRUSTManagement's Discussion and Analysis - Q2-11(In thousands of Canadian dollars, unless otherwise noted)
The REIT operates in the United States through a U.S. holding company (Artis US Holdings Inc.) which is capitalizedwith equity provided by the REIT and debt in the form of notes owed to the REIT. As at June 30, 2011, Artis USHoldings Inc. owes $26.0 million to the REIT which is eliminated on consolidation of the financial statements.
The notes have been recorded as a liability for U.S. federal income tax purposes. If the Internal Revenue Service("IRS") or a court were to determine that the notes should be treated as equity rather than debt for tax purposes, theinterest on the notes would become taxable as a dividend, and therefore would not be deductible for U.S. federalincome tax purposes. In addition, if the IRS were to determine that the interest rate on the notes did not represent anarm's length rate, any excess amount over arm's length would not be deductible and would be taxed as a dividendpayment instead of an interest payment. This would increase the U.S. federal income tax liability of the REIT. Inaddition, the REIT could be subject to penalties. The increase in the tax liability could adversely affect Artis USHoldings Inc.'s ability to make payments on the notes or the REIT's ability to make distribution on its units.
FOREIGN CURRENCY RISK
The REIT owns properties located in the United States, and therefore, the REIT is subject to foreign currencyfluctuations that may impact its financial position and results. In order to mitigate a portion of this risk, the REIT'sdebt on U.S. properties as well as the Series G debentures are held in US dollars to act as a natural hedge.
OTHER RISKS
In addition to the specific risks identified above, Artis REIT is subject to a variety of other risks, including, but notlimited to, risks posed by the illiquidity of real property investments, risk of general uninsured losses as well aspotential risks arising from environmental matters.
The REIT may also be subject to risks arising from land leases for properties in which the REIT has an interest,public market risks, unitholder liability risks, risks pertaining to the availability of cash flow, risks related tofluctuations in cash distributions, changes in legislation, and risks relating to the REIT's reliance on key personneland Marwest Realty as asset manager.
CRITICAL ACCOUNTING ESTIMATES
Artis REIT’s management believes that the policies below are those most subject to estimation and judgment bymanagement.
VALUATION OF INVESTMENT PROPERTIES
Investment properties include properties held to earn rental income and properties that are being constructed ordeveloped for future use as investment properties. Investment properties are measured at fair value with anychanges therein recognized in income or loss for the period. Artis determines the fair value of investment propertiesbased upon a combination of generally accepted appraisal methodologies: the discounted cash flow method and theoverall capitalization method. Under the discounted cash flow method, expected future cash flows for eachinvestment property were discounted, generally over a term of 10 years, using weighted-average rates ofapproximately 8.79% at January 1, 2010, 8.60% at December 31, 2010 and 8.23% at June 30, 2011. Expectedfuture cash flows for each investment property have been based upon, but not limited to, rental income from currentleases, budgeted and actual expenses, and assumptions about rental income from future leases. Under the overallcapitalization method, year one income was stabilized and capped at weighted-average capitalization rates ofapproximately 7.69% at January 1, 2010, 7.74% at December 31, 2010 and 7.31% at June 30, 2011.
Investment properties under construction include initial acquisition costs, other direct costs and borrowing costsduring the period of development. The REIT considers practical completion to have occurred when the property iscapable of being operated in the manner intended by management.
VALUATION OF CONVERTIBLE DEBENTURES
Under IFRS, the REIT records convertible debentures as a liability at fair value. Fair value is based on the marketprice of the debentures, or if no market price exists, fair value is determined by discounting the cash flows of thesefinancial obligations using period end market rates for debt of similar terms and credit risks. The discount rateapplied to the cash flows is determined by management.
Page 40
ARTIS REAL ESTATE INVESTMENT TRUSTManagement's Discussion and Analysis - Q2-11(In thousands of Canadian dollars, unless otherwise noted)
VALUATION OF DEFERRED TAX ASSETS AND LIABILITIES
The REIT currently qualifies as a mutual fund trust for Canadian income tax purposes. On June 22, 2007, newlegislation relating to, among other things, the federal income taxation of a specified investment flow-through trust orpartnership (a "SIFT") was enacted (the "SIFT Rules"). The REIT has reviewed the SIFT Rules and has assessedtheir interpretation and application to the REIT's assets and revenues. While there are uncertainties in theinterpretation and application of the SIFT Rules, the REIT believes that it has met the REIT Conditions throughoutthe three months and six months ended June 30, 2011 and the year ended December 31, 2010.
CHANGES IN ACCOUNTING POLICIES
IFRS 9 - Financial Instruments ("IFRS 9") was issued by the IASB in November 2009 and will replace IAS 39 -Financial Instruments: Recognition and Measurement ("IAS 39"). IFRS 9 uses a single approach to determinewhether a financial asset is measured at amortized cost or fair value, replacing the multiple classification options inIAS 39. The approach in IFRS 9 is based on how an entity manages its financial instruments and the contractualcash flow characteristics of the financial assets. IFRS 9 was amended by the IASB in October 2010 to provideguidance on the classification and reclassification of financial liabilities, their measurement, and the presentation ofgains and losses on financial liabilities designated as at fair value through profit and loss. When an entity elects tomeasure a financial liability at fair value, gains or losses due to changes in the credit risk of the instrument must berecognized in other comprehensive income. IFRS 9 is effective for annual periods beginning on or after January 1,2013.
In May 2011, the IASB issued IFRS 10 - Consolidated Financial Statements ("IFRS 10"), IFRS 11 - JointArrangements ("IFRS 11") and IFRS 12 - Disclosure of Interests in Other Entities ("IFRS 12"). IFRS 10 provides asingle consolidation model that identifies control as the basis for consolidation for all types of entities. IFRS 10replaces IAS 27 - Consolidated and Separate Financial Statements and SIC-12 - Consolidation - Special PurposeEntities. IFRS 11 establishes principles for the financial reporting by parties to a joint arrangement. IFRS 11supersedes IAS 31 - Interests in Joint Ventures and SIC-13 - Jointly Controlled Entities - Non-monetaryContributions by Venturers. IFRS 12 combines, enhances and replaces the disclosure requirements forsubsidiaries, joint arrangements, associates and unconsolidated structured entities. As a consequence of these newstandards, the IASB also issued amended and retitled IAS 27 - Separate Financial Statements and IAS 28 -Investments in Associates and Joint Ventures. The new requirements are effective for annual periods beginning onor after January 1, 2013.
IFRS 13 - Fair Value Measurement ("IFRS 13") defines fair value, sets out in a single standard a framework formeasuring fair value and requires disclosures about fair value measurements. IFRS 13 applies when otherstandards require or permit fair value measurements. It does not introduce any new requirements to measure anasset or a liability at fair value, change what is measured at fair value or address how to present changes in fairvalue. The new requirements are effective for annual periods beginning on or after January 1, 2013.
IAS 12 - Income Taxes ("IAS 12") was amended by the IASB in December 2010. The amendment provides apractical approach for measuring deferred tax liabilities and deferred tax assets when investment property ismeasured using the fair value model, based on a rebuttable presumption that the carrying amount of the investmentproperty will be recovered entirely through sale. The amendment is effective for annual periods beginning on or afterJanuary 1, 2012.
The REIT is currently evaluating the impact of these new and amended standards on its financial statements.
Page 41
ARTIS REAL ESTATE INVESTMENT TRUSTManagement's Discussion and Analysis - Q2-11(In thousands of Canadian dollars, unless otherwise noted)
CONTROLS AND PROCEDURES
On October 1, 2010, the Canadian Securities Administrators implemented amendments to National Instrument 52-109, Certification of Disclosure in Issuers' Annual and Interim Filings ("NI 52-109") effective January 1, 2011, withthe primary purpose of accommodating the transition to IFRS. The amendments replaced previous GAAP terms andphrases with IFRS terms and phrases.
INTERNAL CONTROLS OVER FINANCIAL REPORTING
Management is responsible for establishing and maintaining adequate internal controls over financial reporting toprovide reasonable assurance regarding the reliability of financial reporting and the preparation of financialstatements for external purposes in accordance with IFRS. The Chief Executive Officer and Chief Financial Officerevaluated, or caused to be evaluated, the design of the REIT’s internal controls over financial reporting (as definedin NI 52-109) as at June 30, 2011.
The conversion to IFRS from previous GAAP impacts the REIT's presentation of financial results and theaccompanying disclosure. Artis has assessed its internal controls over financial reporting, and has determined thatthe most significant change to the REIT's internal control environment relates to its IFRS accounting policy electionto measure investment properties at fair value. This change required Artis to design and implement new processesand internal controls surrounding the development of fair values for investment properties.
All control systems have inherent limitations, and evaluation of a control system cannot provide absolute assurancethat all control issues have been detected, including risks of misstatement due to error or fraud. As a growingenterprise, management anticipates that the REIT will be continually evolving and enhancing its systems of controlsand procedures.
DISCLOSURE CONTROLS AND PROCEDURES
The REIT's disclosure controls and procedures are designed to provide reasonable assurance that informationrequired to be disclosed by the REIT is recorded, processed, summarized and reported within the time periodsspecified under Canadian securities laws, and include controls and procedures that are designed to ensure thatinformation is accumulated and communicated to management, including the Chief Executive Officer and ChiefFinancial Officer, to allow timely decisions regarding required disclosure.
As of June 30, 2011, an evaluation was carried out, under the supervision of and with the participation ofmanagement, including the Chief Executive Officer and Chief Financial Officer, of the effectiveness of the REIT'sdisclosure controls and procedures (as defined in NI 52-109). Based on the evaluation, the Chief Executive Officerand Chief Financial Officer concluded that the design and operation of the REIT's disclosure controls andprocedures were effective as at June 30, 2011.
Page 42