Embed Size (px)
Citation preview

The accompanying financial statements have been prepared by RBC Global Asset Management Inc. (“RBC GAM”) as manager of the
RBC GAM Investment Funds (the “Funds”) and approved by the Board of Directors of RBC GAM. We are responsible for the information contained
within the financial statements.
We have maintained appropriate procedures and controls to ensure that timely and reliable financial information is produced. The financial
statements have been prepared in compliance with International Financial Reporting Standards (“IFRS”) (and they include certain amounts that are
based on estimates and judgments). The significant accounting policies, which we believe are appropriate for the Funds, are described in Note 3
to the financial statements.
PricewaterhouseCoopers LLP, Chartered Professional Accountants, Licensed Public Accountants, have performed an independent audit of the
financial statements in accordance with IFRS. Their report is set out on the next page.
Damon G. Williams, FSA, FCIA, CFA Heidi Johnston, CPA, CAChief Executive Officer Chief Financial OfficerRBC Global Asset Management Inc. RBC GAM Funds
March 8, 2018
MANAGEMENT’S RESPONSIBILITY FOR FINANCIAL REPORTING

INDEPENDENT AUDITOR’S REPORT
To the Unitholders of:
RBC FUNDS & RBC PRIVATE POOLSRBC Canadian T-Bill FundRBC Canadian Money Market FundRBC Premium Money Market FundRBC $U.S. Money Market FundRBC Premium $U.S. Money Market FundRBC Canadian Short-Term Income FundRBC Monthly Income Bond FundRBC Canadian Bond Index Fund (formerly, RBC Advisor Canadian Bond Fund)RBC Canadian Government Bond Index FundRBC Bond FundRBC Vision Bond Fund (formerly, Phillips, Hager & North Community Values Bond Fund)RBC Global Bond FundRBC $U.S. Investment Grade Corporate Bond FundRBC Global Corporate Bond FundRBC High Yield Bond FundRBC $U.S. High Yield Bond FundRBC Global High Yield Bond FundRBC Strategic Income Bond FundRBC Emerging Markets Foreign Exchange FundRBC Emerging Markets Bond FundRBC Emerging Markets Bond Fund (CAD Hedged)BlueBay Global Monthly Income Bond FundBlueBay Global Sovereign Bond Fund (Canada)BlueBay Global Investment Grade Corporate Bond Fund (Canada)BlueBay European High Yield Bond Fund (Canada)BlueBay Emerging Markets Corporate Bond FundBlueBay Global Convertible Bond Fund (Canada)BlueBay $U.S. Global Convertible Bond Fund (Canada)RBC Managed Payout SolutionRBC Managed Payout Solution – EnhancedRBC Managed Payout Solution – Enhanced PlusRBC Monthly Income FundRBC U.S. Monthly Income Fund RBC Balanced FundRBC Global Balanced FundRBC Vision Balanced Fund (formerly, RBC Jantzi Balanced Fund)RBC Conservative Growth & Income FundRBC Balanced Growth & Income FundRBC Global Growth & Income FundRBC Retirement Income SolutionRBC Retirement 2020 PortfolioRBC Retirement 2025 PortfolioRBC Retirement 2030 PortfolioRBC Retirement 2035 PortfolioRBC Retirement 2040 PortfolioRBC Retirement 2045 PortfolioRBC Retirement 2050 PortfolioRBC Select Very Conservative PortfolioRBC Select Conservative PortfolioRBC Select Balanced Portfolio RBC Select Growth PortfolioRBC Select Aggressive Growth PortfolioRBC Select Choices Conservative PortfolioRBC Select Choices Balanced PortfolioRBC Select Choices Growth PortfolioRBC Select Choices Aggressive Growth PortfolioRBC Target 2020 Education FundRBC Target 2025 Education Fund
RBC Target 2030 Education FundRBC Target 2035 Education FundRBC Canadian Dividend FundRBC Canadian Equity FundRBC QUBE Canadian Equity FundRBC QUBE Low Volatility Canadian Equity FundRBC Trend Canadian Equity FundRBC Vision Canadian Equity Fund (formerly, RBC Jantzi Canadian Equity Fund)RBC Canadian Index FundRBC O’Shaughnessy Canadian Equity FundRBC O’Shaughnessy All-Canadian Equity FundRBC Canadian Equity Income FundRBC Canadian Small & Mid-Cap Resources FundRBC North American Value FundRBC North American Growth FundRBC U.S. Dividend FundRBC U.S. Dividend Currency Neutral FundRBC U.S. Equity Fund RBC U.S. Equity Currency Neutral FundRBC QUBE U.S. Equity FundRBC QUBE Low Volatility U.S. Equity FundRBC QUBE Low Volatility U.S. Equity Currency Neutral FundRBC U.S. Equity Value FundRBC U.S. Index FundRBC U.S. Index Currency Neutral FundRBC O’Shaughnessy U.S. Value FundRBC U.S. Mid-Cap Growth Equity FundRBC U.S. Mid-Cap Growth Equity Currency Neutral Fund RBC U.S. Mid-Cap Value Equity FundRBC U.S. Small-Cap Core Equity FundRBC U.S. Small-Cap Value Equity FundRBC O’Shaughnessy U.S. Growth FundRBC O’Shaughnessy U.S. Growth Fund IIRBC Life Science and Technology FundRBC International Dividend Growth FundRBC International Equity FundRBC International Equity Currency Neutral FundRBC International Index Currency Neutral FundRBC O’Shaughnessy International Equity FundRBC European Dividend FundRBC European Equity FundRBC European Mid-Cap Equity FundRBC Asian Equity FundRBC Asia Pacific ex-Japan Equity FundRBC Japanese Equity FundRBC Emerging Markets Multi-Strategy Equity FundRBC Emerging Markets Dividend FundRBC Emerging Markets Equity FundRBC Emerging Markets Small-Cap Equity FundRBC Global Dividend Growth FundRBC Global Dividend Growth Currency Neutral FundRBC Global Equity FundRBC Global Equity Focus FundRBC QUBE Global Equity FundRBC QUBE Low Volatility Global Equity FundRBC Vision Global Equity Fund (formerly, RBC Jantzi Global Equity Fund)RBC Vision Fossil Fuel Free Global Equity Fund RBC O’Shaughnessy Global Equity FundRBC QUBE All Country World Equity FundRBC QUBE Low Volatility All Country World Equity FundRBC Global Energy FundRBC Global Precious Metals Fund
RBC Global Resources FundRBC Global Technology FundRBC Private Short-Term Income PoolRBC Private Canadian Corporate Bond PoolRBC Private Income PoolRBC Private Canadian Dividend PoolRBC Private Canadian Growth and Income Equity PoolRBC Private Canadian Equity PoolRBC Private Canadian Growth Equity PoolRBC Private Canadian Mid-Cap Equity PoolRBC Private U.S. Large-Cap Value Equity Pool RBC Private U.S. Large-Cap Value Equity Currency Neutral PoolRBC Private U.S. Growth Equity PoolRBC Private U.S. Large-Cap Core Equity Pool RBC Private U.S. Large-Cap Core Equity Currency Neutral PoolRBC Private U.S. Small-Cap Equity PoolRBC Private EAFE Equity PoolRBC Private Overseas Equity PoolRBC Private World Equity Pool
PHILLIPS, HAGER & NORTH INVESTMENT FUNDSPhillips, Hager & North Canadian Money Market FundPhillips, Hager & North $U.S. Money Market FundPhillips, Hager & North Short Term Bond & Mortgage FundPhillips, Hager & North Bond FundPhillips, Hager & North Total Return Bond FundPhillips, Hager & North Inflation-Linked Bond FundPhillips, Hager & North High Yield Bond FundPhillips, Hager & North Long Inflation-linked Bond FundPhillips, Hager & North Monthly Income FundPhillips, Hager & North Balanced FundPhillips, Hager & North Dividend Income FundPhillips, Hager & North Canadian Equity FundPhillips, Hager & North Canadian Equity Value FundPhillips, Hager & North Canadian Equity Underlying FundPhillips, Hager & North Canadian Equity Underlying Fund IIPhillips, Hager & North Canadian Growth Fund Phillips, Hager & North Canadian Income FundPhillips, Hager & North Vintage FundPhillips, Hager & North U.S. Dividend Income FundPhillips, Hager & North U.S. Multi-Style All-Cap Equity FundPhillips, Hager & North U.S. Equity FundPhillips, Hager & North Currency-Hedged U.S. Equity FundPhillips, Hager & North U.S. Growth Fund Phillips, Hager & North Overseas Equity FundPhillips, Hager & North Currency-Hedged Overseas Equity FundPhillips, Hager & North Global Equity FundPhillips, Hager & North LifeTime 2015 Fund Phillips, Hager & North LifeTime 2020 FundPhillips, Hager & North LifeTime 2025 FundPhillips, Hager & North LifeTime 2030 FundPhillips, Hager & North LifeTime 2035 FundPhillips, Hager & North LifeTime 2040 FundPhillips, Hager & North LifeTime 2045 FundPhillips, Hager & North LifeTime 2050 Fund
(collectively referred to as the “Funds”)

INDEPENDENT AUDITOR’S REPORT
We have audited the accompanying financial statements of each of the Funds, which comprise the statements of financial position,
comprehensive income, cash flows and changes in net assets attributable to holders of redeemable units as at and for the periods indicated in
note 2, and the related notes, which comprise a summary of significant accounting policies and other explanatory information.
Management’s responsibility for the financial statementsManagement is responsible for the preparation and fair presentation of the financial statements of each of the Funds in accordance with
International Financial Reporting Standards, and for such internal control as management determines is necessary to enable the preparation
of financial statements that are free from material misstatement, whether due to fraud or error.
Auditor’s responsibilityOur responsibility is to express an opinion on the financial statements of each of the Funds based on our audits. We conducted our audits in
accordance with Canadian generally accepted auditing standards. Those standards require that we comply with ethical requirements and plan
and perform the audits to obtain reasonable assurance about whether the financial statements are free from material misstatement.
An audit involves performing procedures to obtain audit evidence about the amounts and disclosures in the financial statements. The procedures
selected depend on the auditor’s judgment, including the assessment of the risks of material misstatement of the financial statements, whether due
to fraud or error. In making those risk assessments, the auditor considers internal control relevant to the entity’s preparation and fair presentation
of the financial statements in order to design audit procedures that are appropriate in the circumstances, but not for the purpose of expressing an
opinion on the effectiveness of the entity’s internal control. An audit also includes evaluating the appropriateness of accounting policies used and
the reasonableness of accounting estimates made by management, as well as evaluating the overall presentation of the financial statements.
We believe that the audit evidence we have obtained in each of our audits is sufficient and appropriate to provide a basis for our audit opinion.
OpinionIn our opinion, the financial statements of each of the Funds present fairly, in all material respects, the financial position, financial performance
and cash flows of each of the Funds as at and for the periods indicated in note 2, in accordance with International Financial Reporting Standards.
Chartered Professional Accountants, Licensed Public Accountants
Toronto, OntarioMarch 8, 2018

SCHEDULE OF INVESTMENT PORTFOLIO (in $000s)
2017 ANNUAL FINANCIAL STATEMENTS
December 31, 2017
The accompanying notes are an integral part of the financial statements.
RBC CANADIAN EQUITY INCOME FUND
Fair % of Net Holdings Security Cost Value Assets
EQUITIESConsumer Discretionary 200 000 Comcast Corp., Class A $ 9 855 $ 10 075 171 500 Magna International Inc., Class A 9 144 12 218 366 329 Shaw Communications Inc., Class B 9 284 10 510
28 283 32 803 0.9Consumer Staples 542 500 Alimentation Couche-Tard Inc. 33 748 35 583 410 614 Loblaw Companies Ltd. 26 455 28 012 497 888 Maple Leaf Foods Inc. 8 008 17 834
68 211 81 429 2.3Energy 170 000 AltaGas Ltd. 4 974 4 865 100 000 AltaGas Ltd., Subscription Receipts 2 775 2 838 544 400 Bonterra Energy Corp. 10 940 8 329 2 134 198 Canadian Natural Resources Ltd. 73 671 95 868 3 635 877 Enbridge Inc. 189 766 178 740 232 737 Enbridge Inc., Restricted April 7, 2018 10 436 11 278 1 805 000 Enbridge Income Fund Holdings Inc. 53 927 53 807 1 204 400 Enerflex Ltd. 17 455 18 475 930 935 Gibson Energy Inc. 20 249 16 924 2 939 700 Granite Oil Corp. 21 302 9 172 83 600 Inter Pipeline Ltd. 2 306 2 176 1 359 286 Keyera Corp. 50 541 48 146 405 882 Kinder Morgan Canada Ltd. 6 900 6 904 711 200 Parkland Fuel Corp. 18 877 19 096 788 421 Pembina Pipeline Corp. 32 122 35 881 840 618 PrairieSky Royalty Ltd. 26 218 26 950 452 000 Royal Dutch Shell Plc., A Shares 17 750 18 967 537 651 StatoilHydro ASA 12 624 14 468 2 623 300 Suncor Energy Inc. 95 071 121 065 153 441 Total S.A. 10 083 10 647 1 368 300 TransCanada Corp. 71 719 83 713 1 644 824 Whitecap Resources Inc. 18 867 14 721
768 573 803 030 22.8Financials 625 500 Bank of Montreal 49 476 62 919 1 671 748 Bank of Nova Scotia 105 364 135 612 1 865 058 Brookfield Asset Management Inc., Class A 70 021 102 056 694 100 Canadian Imperial Bank of Commerce 69 072 85 055 32 450 Fairfax Financial Holdings Ltd. 20 829 21 720 620 800 Fiera Capital Corp. 7 822 8 070 258 900 Intact Financial Corp. 24 544 27 182
Fair % of Net Holdings Security Cost Value Assets
Financials (cont.) 4 607 429 Manulife Financial Corporation $ 89 428 $ 120 807 284 200 National Bank of Canada 14 236 17 825 2 084 300 Royal Bank of Canada* 151 097 213 953 1 760 900 Sun Life Financial Inc. 75 070 91 355 428 000 Thomson Corp. 23 690 23 450 2 587 100 Toronto-Dominion Bank 146 457 190 540 11 852 Trisura Group Ltd. 267 310
847 373 1 100 854 31.2Health Care 1 641 215 Chartwell Retirement Residences Real Estate Investment Trust 21 932 26 686 100 000 Johnson & Johnson 15 958 17 579 90 000 Medtronic Plc. 8 778 9 139 205 000 Merck & Co. Inc. 17 094 14 518 400 000 Pfizer Inc. 17 363 18 229
81 125 86 151 2.4Industrials 400 000 Brookfield Business Partners LP 14 477 17 316 446 000 Canadian National Railway Co. 45 969 46 228 317 000 Canadian Pacific Railway Ltd. 60 108 72 802 250 000 Fluor Corp. 17 726 16 231 425 000 Johnson Controls International Plc. 24 042 20 367 210 000 Quanta Services Inc. 8 956 10 328 437 023 Russel Metals Inc. 12 092 12 748 933 400 SNC-Lavalin Group Inc. 51 682 53 250 160 700 WSP Global Inc. 7 030 9 628
242 082 258 898 7.3Information Technology 100 000 Microsoft Corp. 9 311 10 759 325 000 Open Text Corp. 13 234 14 531 65 000 Visa Inc., Class A 7 025 9 336
29 570 34 626 1.0Materials 387 800 Agnico Eagle Mines Ltd. 24 094 22 508 214 832 Agrium Inc. 23 681 31 060 152 200 Avery Dennison Corp. 17 611 21 977 667 200 Chemtrade Logistics Income Fund 14 181 12 944 100 100 Ecolab Inc. 17 492 16 886 222 905 Methanex Corp. 11 805 16 976 3 077 932 Mountain Province Diamonds Inc. 19 065 10 496 648 800 Newmont Mining Corporation 28 043 30 599 112 600 Norbord Inc. 3 605 4 791 928 572 Potash Corporation of Saskatchewan Inc. 29 228 23 939 38 900 Sherwin-Williams Co. 17 451 20 048 904 900 Teck Resources Ltd., Class B 22 999 29 744 156 700 West Fraser Timber Co. Ltd. 8 086 12 155
237 341 254 123 7.2

December 31, 2017
The accompanying notes are an integral part of the financial statements.
SCHEDULE OF INVESTMENT PORTFOLIO (in $000s)
Fair % of Net Holdings Security Cost Value Assets
Real Estate 1 247 933 Agellan Commercial Real Estate Investment Trust $ 10 876 $ 14 900 412 802 Allied Properties Real Estate Investment Trust 14 408 17 371 2 538 299 Brookfield Property Partners LP 43 933 70 692 508 516 Canadian Real Estate Investment Trust 23 166 23 544 490 000 Choice Properties Real Estate Investment Trust 6 608 6 542 544 287 Cominar Real Estate Investment Trust 8 180 7 838 275 628 Dream Office Real Estate Investment Trust 5 702 6 108 2 390 200 Dream Unlimited Corp. 15 841 18 548 1 427 700 First Capital Realty Inc. 27 372 29 582 763 000 GGP Inc. Real Estate Investment Trust 23 970 22 433 1 138 300 H&R Real Estate Investment Trust 25 612 24 314 1 101 100 Killam Apartment Real Estate Investment Trust 12 236 15 658 655 584 Morguard Real Estate Investment Trust 8 749 9 047 3 092 900 Pure Industrial Real Estate Investment Trust 16 964 20 939 1 392 400 RioCan Real Estate Investment Trust 33 981 33 919 845 000 SmartCentres Real Estate Investment Trust 26 359 26 119 1 522 400 Tricon Capital Group Inc. 14 272 17 584 1 547 100 WPT Industrial Real Estate Investment Trust 22 551 24 737
340 780 389 875 11.0
RBC CANADIAN EQUITY INCOME FUND
Fair % of Net Holdings Security Cost Value Assets
Telecommunication Services 200 000 AT&T Inc. $ 10 930 $ 9 781 1 130 100 BCE Inc. 63 339 68 235 140 000 Rogers Communications Inc., Class B 9 005 8 967 541 000 TELUS Corp. 22 306 25 762
105 580 112 745 3.2Utilities 2 069 419 Algonquin Power & Utilities Corp. 22 755 29 096 391 800 Atco Ltd., Class I, Non-Voting 18 042 17 631 918 300 Boralex Inc., Class A 12 848 21 580 497 086 Brookfield Infrastructure Partners LP 19 826 28 026 349 820 Brookfield Renewable Partners LP 12 037 15 326 435 950 Canadian Utilities Ltd., Class A 15 664 16 309 794 400 Capital Power Corp. 20 139 19 455 556 749 Emera Inc. 23 620 26 156 570 765 Fortis Inc. 21 591 26 318 400 000 Hydro One Ltd. 8 800 8 960 1 134 000 Innergex Renewable Energy Inc. 16 030 16 330 399 900 Northland Power Inc. 9 414 9 338 906 061 Pattern Energy Group Inc. 26 210 24 475 1 876 300 TransAlta Corp. 15 603 13 978 1 637 400 TransAlta Renewables Inc. 21 091 21 925
263 670 294 903 8.4TOTAL EQUITIES 3 012 588 3 449 437 97.7
Par Value Coupon Fair % of Net (000s) Security Rate % Maturity Cost Value Assets
BONDS 10 000 Canaccord Genuity Group Inc., Convertible 6.500 31-Dec-2021 $ 10 000 $ 10 000 11 250 DHX Media Ltd., Convertible 5.875 30-Sep-2024 11 250 10 856
TOTAL BONDS 21 250 20 856 0.6SHORT-TERM INVESTMENTS† 46 909 46 909 1.3TOTAL INVESTMENTS 3 080 747 3 517 202 99.6UNREALIZED GAIN ON FOREIGN EXCHANGE CONTRACTS (SCHEDULE A) – 3 903 0.1UNREALIZED LOSS ON FOREIGN EXCHANGE CONTRACTS (SCHEDULE A) – (1 203) –TOTAL PORTFOLIO $ 3 080 747 3 519 902 99.7OTHER NET ASSETS ATTRIBUTABLE TO HOLDERS OF REDEEMABLE UNITS 9 601 0.3NET ASSETS ATTRIBUTABLE TO HOLDERS OF REDEEMABLE UNITS $ 3 529 503 100.0
December 31, 2017
The accompanying notes are an integral part of the financial statements.
SCHEDULE OF INVESTMENT PORTFOLIO (in $000s)
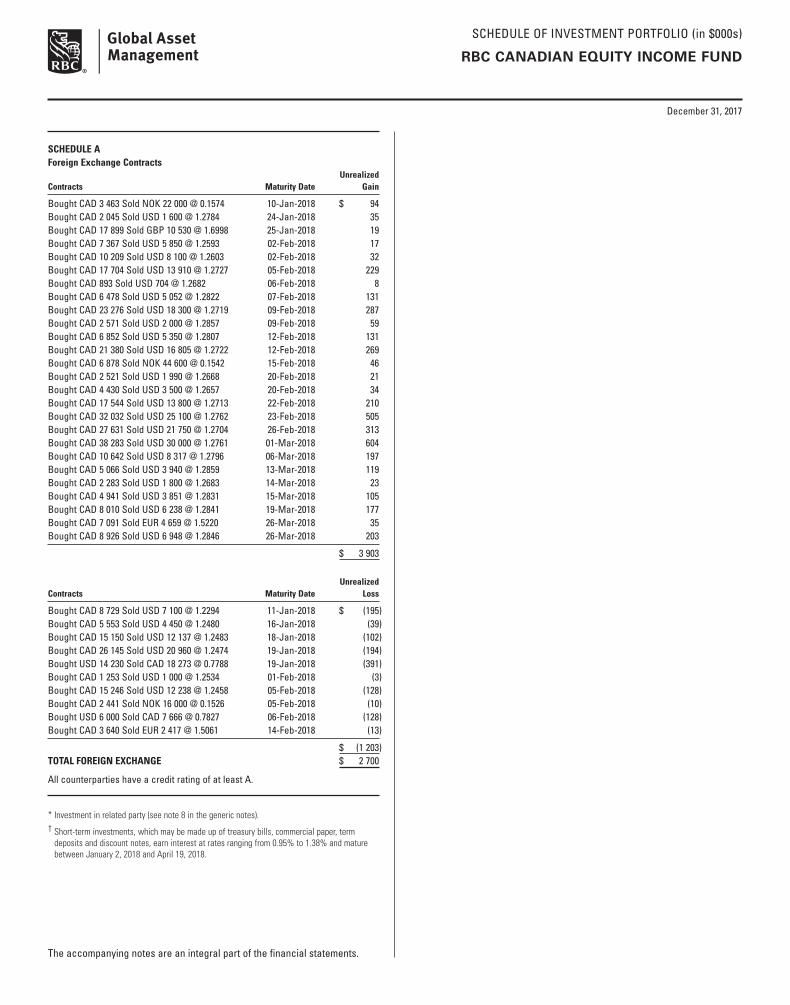
SCHEDULE AForeign Exchange Contracts Unrealized Contracts Maturity Date Gain
Bought CAD 3 463 Sold NOK 22 000 @ 0.1574 10-Jan-2018 $ 94Bought CAD 2 045 Sold USD 1 600 @ 1.2784 24-Jan-2018 35Bought CAD 17 899 Sold GBP 10 530 @ 1.6998 25-Jan-2018 19Bought CAD 7 367 Sold USD 5 850 @ 1.2593 02-Feb-2018 17Bought CAD 10 209 Sold USD 8 100 @ 1.2603 02-Feb-2018 32Bought CAD 17 704 Sold USD 13 910 @ 1.2727 05-Feb-2018 229Bought CAD 893 Sold USD 704 @ 1.2682 06-Feb-2018 8Bought CAD 6 478 Sold USD 5 052 @ 1.2822 07-Feb-2018 131Bought CAD 23 276 Sold USD 18 300 @ 1.2719 09-Feb-2018 287Bought CAD 2 571 Sold USD 2 000 @ 1.2857 09-Feb-2018 59Bought CAD 6 852 Sold USD 5 350 @ 1.2807 12-Feb-2018 131Bought CAD 21 380 Sold USD 16 805 @ 1.2722 12-Feb-2018 269Bought CAD 6 878 Sold NOK 44 600 @ 0.1542 15-Feb-2018 46Bought CAD 2 521 Sold USD 1 990 @ 1.2668 20-Feb-2018 21Bought CAD 4 430 Sold USD 3 500 @ 1.2657 20-Feb-2018 34Bought CAD 17 544 Sold USD 13 800 @ 1.2713 22-Feb-2018 210Bought CAD 32 032 Sold USD 25 100 @ 1.2762 23-Feb-2018 505Bought CAD 27 631 Sold USD 21 750 @ 1.2704 26-Feb-2018 313Bought CAD 38 283 Sold USD 30 000 @ 1.2761 01-Mar-2018 604Bought CAD 10 642 Sold USD 8 317 @ 1.2796 06-Mar-2018 197Bought CAD 5 066 Sold USD 3 940 @ 1.2859 13-Mar-2018 119Bought CAD 2 283 Sold USD 1 800 @ 1.2683 14-Mar-2018 23Bought CAD 4 941 Sold USD 3 851 @ 1.2831 15-Mar-2018 105Bought CAD 8 010 Sold USD 6 238 @ 1.2841 19-Mar-2018 177Bought CAD 7 091 Sold EUR 4 659 @ 1.5220 26-Mar-2018 35Bought CAD 8 926 Sold USD 6 948 @ 1.2846 26-Mar-2018 203
$ 3 903
Unrealized Contracts Maturity Date Loss
Bought CAD 8 729 Sold USD 7 100 @ 1.2294 11-Jan-2018 $ (195)Bought CAD 5 553 Sold USD 4 450 @ 1.2480 16-Jan-2018 (39)Bought CAD 15 150 Sold USD 12 137 @ 1.2483 18-Jan-2018 (102)Bought CAD 26 145 Sold USD 20 960 @ 1.2474 19-Jan-2018 (194)Bought USD 14 230 Sold CAD 18 273 @ 0.7788 19-Jan-2018 (391)Bought CAD 1 253 Sold USD 1 000 @ 1.2534 01-Feb-2018 (3)Bought CAD 15 246 Sold USD 12 238 @ 1.2458 05-Feb-2018 (128)Bought CAD 2 441 Sold NOK 16 000 @ 0.1526 05-Feb-2018 (10)Bought USD 6 000 Sold CAD 7 666 @ 0.7827 06-Feb-2018 (128)Bought CAD 3 640 Sold EUR 2 417 @ 1.5061 14-Feb-2018 (13)
$ (1 203)TOTAL FOREIGN EXCHANGE $ 2 700
All counterparties have a credit rating of at least A.
* Investment in related party (see note 8 in the generic notes).† Short-term investments, which may be made up of treasury bills, commercial paper, term
deposits and discount notes, earn interest at rates ranging from 0.95% to 1.38% and mature between January 2, 2018 and April 19, 2018.
RBC CANADIAN EQUITY INCOME FUND

FINANCIAL STATEMENTS
The accompanying notes are an integral part of these financial statements.
RBC CANADIAN EQUITY INCOME FUND
Statements of Financial Position (in $000s except per unit amounts)
(see note 2 in the generic notes)December 31
2017December 31
2016
ASSETSInvestments at fair value $ 3 517 202 $ 3 419 359Cash 2 909 3 434Due from investment dealers 3 835 6 640Subscriptions receivable 1 831 2 526Unrealized gain on foreign exchange contracts 3 903 1 873Dividends receivable, interest accrued and other assets 10 620 9 957TOTAL ASSETS 3 540 300 3 443 789LIABILITIESRedemptions payable 4 098 3 544Unrealized loss on foreign exchange contracts 1 203 2 547Distributions payable 1 425 1 550Accounts payable and accrued expenses 4 071 4 113TOTAL LIABILITIES EXCLUDING NET ASSETS ATTRIBUTABLE TO HOLDERS OF REDEEMABLE UNITS 10 797 11 754NET ASSETS ATTRIBUTABLE TO HOLDERS OF REDEEMABLE UNITS (“NAV”) $ 3 529 503 $ 3 432 035
Investments at cost $ 3 080 747 $ 3 039 299
NAV SERIES A $ 1 491 912 $ 1 537 729 ADVISOR SERIES $ 663 164 $ 724 915 SERIES H $ – $ – SERIES D $ 265 600 $ 257 876 SERIES F $ 548 114 $ 376 706 SERIES I $ – $ – SERIES O $ 560 713 $ 534 809NAV PER UNIT SERIES A $ 27.20 $ 26.20 ADVISOR SERIES $ 27.45 $ 26.42 SERIES H $ – $ – SERIES D $ 30.47 $ 28.98 SERIES F $ 31.91 $ 30.24 SERIES I $ – $ – SERIES O $ 31.64 $ 29.74
Statements of Comprehensive Income (in $000s except per unit amounts)
For the periods ended December 31 (see note 2 in the generic notes) 2017 2016
INCOME (see note 3 in the generic notes)Dividends $ 107 667 $ 109 458Interest for distribution purposes 1 803 1 424Other income (loss) 8 513 15 495Securities lending revenue (see note 7 in the generic notes) 577 382Net realized gain (loss) on investments 149 811 (18 727)Net gain (loss) on foreign currencies and other net assets 13 481 152Change in unrealized gain (loss) on investments 59 769 599 206TOTAL INCOME (LOSS) 341 621 707 390EXPENSES (see notes – Fund Specific Information)Management fees 40 113 41 198Administration fees 3 786 3 602Independent Review Committee costs 3 2GST/HST 4 143 4 253Transaction costs 3 171 4 420Withholding tax 940 1 399TOTAL EXPENSES 52 156 54 874INCREASE (DECREASE) IN NAV $ 289 465 $ 652 516INCREASE (DECREASE) IN NAV SERIES A $ 117 655 $ 290 935 ADVISOR SERIES $ 53 582 $ 136 785 SERIES H $ – $ 2 525 SERIES D $ 22 544 $ 49 880 SERIES F $ 42 798 $ 60 958 SERIES I $ – $ 1 213 SERIES O $ 52 886 $ 110 220INCREASE (DECREASE) IN NAV PER UNIT SERIES A $ 2.06 $ 4.69 ADVISOR SERIES $ 2.08 $ 4.72 SERIES H $ – $ 2.31 SERIES D $ 2.57 $ 5.42 SERIES F $ 2.83 $ 5.77 SERIES I $ – $ 2.61 SERIES O $ 2.97 $ 5.80

FINANCIAL STATEMENTS
The accompanying notes are an integral part of these financial statements.
RBC CANADIAN EQUITY INCOME FUND
Statements of Cash Flow (in $000s)
For the periods ended December 31 (see note 2 in the generic notes) 2017 2016
CASH FLOWS FROM OPERATING ACTIVITIESIncrease (decrease) in NAV $ 289 465 $ 652 516 ADJUSTMENTS TO RECONCILE NET CASH PROVIDED BY (USED IN) OPERATIONSInterest for distribution purposes – – Non-cash distributions from underlying funds – – Net realized loss (gain) on investments (146 464) 23 528 Change in unrealized loss (gain) on investments (59 769) (599 206)(Increase) decrease in accrued receivables (663) 4 116 Increase (decrease) in accrued payables (42) (341)(Increase) decrease in margin accounts – – Cost of investments purchased (3 408 592) (3 874 757)Proceeds from sale and maturity of investments 3 516 413 4 288 012 NET CASH PROVIDED BY (USED IN) OPERATING ACTIVITIES 190 348 493 868 CASH FLOWS FROM FINANCING ACTIVITIESProceeds from issue of redeemable units 424 815 514 808 Cash paid on redemption of redeemable units (597 111) (987 692)Distributions paid to holders of redeemable units (18 577) (19 182)NET CASH PROVIDED BY (USED IN) FINANCING ACTIVITIES $ (190 873) $ (492 066)Net increase (decrease) in cash for the period (525) 1 802 Cash (bank overdraft), beginning of period 3 434 1 632 CASH (BANK OVERDRAFT), END OF PERIOD $ 2 909 $ 3 434
Interest received (paid) $ 1 638 $ 1 422 Dividends received, net of withholding taxes $ 114 742 $ 127 672

FINANCIAL STATEMENTS
The accompanying notes are an integral part of these financial statements.
RBC CANADIAN EQUITY INCOME FUND
For the periods ended December 31 (see note 2 in the generic notes)
Series F Series I Series O Total2017 2016 2017 2016 2017 2016 2017 2016
NAV AT BEGINNING OF PERIOD $ 376 706 $ 252 483 $ – $ 12 838 $ 534 809 $ 530 183 $ 3 432 035 $ 3 267 073INCREASE (DECREASE) IN NAV 42 798 60 958 – 1 213 52 886 110 220 289 465 652 516Early redemption fees – – – – – – 4 8Proceeds from redeemable units issued 245 611 171 599 – 408 33 033 50 158 584 665 515 747Reinvestments of distributions to holders of redeemable units 10 459 6 891 – 116 17 642 18 499 116 286 121 599Redemption of redeemable units (110 486) (103 406) – (14 319) (58 450) (153 901) (758 214) (984 255)NET INCREASE (DECREASE) FROM REDEEMABLE UNIT TRANSACTIONS 145 584 75 084 – (13 795) (7 775) (85 244) (57 259) (346 901)Distributions from net income (8 789) (6 237) – (135) (9 945) (10 739) (69 767) (74 222)Distributions from net gains (5 844) – – – (6 613) – (46 390) –Distributions from capital (2 341) (5 582) – (121) (2 649) (9 611) (18 581) (66 431)TOTAL DISTRIBUTIONS TO HOLDERS OF REDEEMABLE UNITS (16 974) (11 819) – (256) (19 207) (20 350) (134 738) (140 653)NET INCREASE (DECREASE) IN NAV 171 408 124 223 – (12 838) 25 904 4 626 97 468 164 962NAV AT END OF PERIOD $ 548 114 $ 376 706 $ – $ – $ 560 713 $ 534 809 $ 3 529 503 $ 3 432 035
Statements of Changes in NAV (in $000s)
For the periods ended December 31 (see note 2 in the generic notes)
Series A Advisor Series Series H Series D2017 2016 2017 2016 2017 2016 2017 2016
NAV AT BEGINNING OF PERIOD $ 1 537 729 $ 1 504 191 $ 724 915 $ 710 826 $ – $ 25 423 $ 257 876 $ 231 129INCREASE (DECREASE) IN NAV 117 655 290 935 53 582 136 785 – 2 525 22 544 49 880Early redemption fees 1 – – 5 – – 3 3Proceeds from redeemable units issued 190 213 162 466 68 855 76 993 – 1 242 46 953 52 881Reinvestments of distributions to holders of redeemable units 56 927 61 376 22 468 25 258 – 414 8 790 9 045Redemption of redeemable units (349 265) (414 686) (179 012) (193 879) – (29 018) (61 001) (75 046)NET INCREASE (DECREASE) FROM REDEEMABLE UNIT TRANSACTIONS (102 124) (190 844) (87 689) (91 623) – (27 362) (5 255) (13 117)Distributions from net income (31 766) (35 120) (14 314) (16 397) – (309) (4 953) (5 285)Distributions from net gains (21 122) – (9 518) – – – (3 293) –Distributions from capital (8 460) (31 433) (3 812) (14 676) – (277) (1 319) (4 731)TOTAL DISTRIBUTIONS TO HOLDERS OF REDEEMABLE UNITS (61 348) (66 553) (27 644) (31 073) – (586) (9 565) (10 016)NET INCREASE (DECREASE) IN NAV (45 817) 33 538 (61 751) 14 089 – (25 423) 7 724 26 747NAV AT END OF PERIOD $ 1 491 912 $ 1 537 729 $ 663 164 $ 724 915 $ – $ – $ 265 600 $ 257 876

NOTES TO FINANCIAL STATEMENTS – FUND SPECIFIC INFORMATION
Please see the generic notes at the back of the financial statements.
December 31, 2017
RBC CANADIAN EQUITY INCOME FUND
General information (see note 1 in the generic notes)
The investment objective of the Fund is to provide a
high level of monthly cash flow, relatively tax-efficient
distributions consisting primarily of returns of capital,
capital gains and interest income, as well as the potential
for modest capital growth.
All outstanding Series H units were re-designated as Series A
units effective June 30, 2016. All outstanding Series I units
were re-designated as Series F units effective June 30, 2016.
Financial instrument risk and capital management (see note 5 in the generic notes)
Concentration risk (%)
The table below summarizes the Fund’s investment portfolio
(after consideration of derivative products, if any) as at:
Investment mixDecember 31
2017December 31
2016
Financials 31.2 31.3Energy 22.8 24.3Real Estate 11.0 11.6Utilities 8.4 10.0Industrials 7.3 4.5Materials 7.2 7.0Telecommunication Services 3.2 2.1Health Care 2.4 1.4Consumer Staples 2.3 2.7Information Technology 1.0 0.5Consumer Discretionary 0.9 1.6Cash/Other 2.3 3.0Total 100.0 100.0
Other price risk (% impact on NAV)
The table below shows the impact of a 1% change in the
broad-based index (noted below) on the Fund’s NAV, using a
36-month historical correlation of data of the Fund’s return
and the index, with all other factors kept constant, as at:
December 31 2017
December 31 2016
S&P/TSX Capped Composite Total Return Index + or - 1.0 + or - 1.0
Since historical correlation may not be representative of
future correlation, actual results could differ from this
sensitivity analysis and the difference could be material.
Fair value hierarchy ($000s except % amounts) (see note 3 in the generic notes)
The following is a summary of the inputs used as of
December 31, 2017 and 2016.
December 31, 2017 Level 1 Level 2 Level 3 Total
Equities 3 394 077 55 360 – 3 449 437Mutual fund units – – – –Fixed-income and debt securities – 20 856 – 20 856Short-term investments – 46 909 – 46 909Derivatives – assets – 3 903 – 3 903Derivatives – liabilities – (1 203) – (1 203)Total financial instruments 3 394 077 125 825 – 3 519 902% of total portfolio 96.4 3.6 – 100.0
December 31, 2016 Level 1 Level 2 Level 3 Total
Equities 3 302 436 37 263 – 3 339 699Mutual fund units – – – –Fixed-income and debt securities – 13 965 – 13 965Short-term investments – 65 695 – 65 695Derivatives – assets – 1 873 – 1 873Derivatives – liabilities – (2 547) – (2 547)Total financial instruments 3 302 436 116 249 – 3 418 685% of total portfolio 96.6 3.4 – 100.0
For the periods ended December 31, 2017 and 2016, there
were no transfers of financial instruments between Level 1,
Level 2 and Level 3.
Management fees and operating expenses (see note 8 in the generic notes)
Management fees and administration fees of each series
of the Fund are payable to RBC GAM and calculated at the
following annual percentages, before GST/HST, of the daily
NAV of each series of the Fund.
Management fees* Operating expenses
Series A 1.60% 0.15%Advisor Series 1.60% 0.10%Series H 1.65% 0.10%Series D 0.85% 0.10%Series F 0.60% 0.10%Series I 0.60% 0.10%Series O n/a† 0.02%
* Effective June 30, 2016, the management fees for Series A and Advisor Series units were reduced to 1.60% from 1.75%; for Series D units were reduced to 0.85% from 1.00%; and for Series F units were reduced to 0.60% from 0.75%.
† Series O unitholders pay a negotiated management fee directly to RBC GAM for investment-counselling services.

NOTES TO FINANCIAL STATEMENTS – FUND SPECIFIC INFORMATION
Please see the generic notes at the back of the financial statements.
December 31, 2017
Investments by related parties ($000s except unit amounts)
Royal Bank of Canada, or one of its subsidiaries, held the
following investments in the Fund as at:
December 31 2017
December 31 2016
Units held Series O 30 29Value of all units 1 1
Unconsolidated structured entities (%) (see note 3 in the generic notes)The table below summarizes the Fund’s interest in the unsponsored funds as a percentage of NAV, and the Fund’s ownership interest as a percentage of NAV of the unsponsored funds (“Ownership”).
December 31 2017
December 31 2016
NAV Ownership NAV Ownership
iShares S&P/TSX Capped Financials Index Fund – – 0.3 0.8
Taxes ($000s) (see note 6 in the generic notes)
The Fund had no capital or non-capital losses as at
December 31, 2017.
Redeemable units (000s)
There is no limitation on the number of units available for
issue. Units are purchased and redeemed at the NAV per unit.
For the periods ended December 31 (see note 2 in the generic notes) 2017 2016
Series AOpening units 58 694 66 832Issued number of units 7 186 6 742Reinvested number of units 2 155 2 529Redeemed number of units (13 188) (17 409)Ending number of units 54 847 58 694
Advisor SeriesOpening units 27 443 31 354Issued number of units 2 579 3 189Reinvested number of units 843 1 033Redeemed number of units (6 708) (8 133)Ending number of units 24 157 27 443
Series HOpening units – 1 117Issued number of units – 56Reinvested number of units – 18Redeemed number of units – (1 191)Ending number of units – –
RBC CANADIAN EQUITY INCOME FUND
For the periods ended December 31 (see note 2 in the generic notes) 2017 2016
Series DOpening units 8 899 9 398Issued number of units 1 592 1 999Reinvested number of units 299 339Redeemed number of units (2 072) (2 837)Ending number of units 8 718 8 899
Series FOpening units 12 459 9 876Issued number of units 7 974 6 114Reinvested number of units 340 246Redeemed number of units (3 594) (3 777)Ending number of units 17 179 12 459
Series IOpening units – 502Issued number of units – 16Reinvested number of units – 4Redeemed number of units – (522)Ending number of units – –
Series OOpening units 17 982 21 260Issued number of units 1 090 1 932Reinvested number of units 580 680Redeemed number of units (1 927) (5 890)Ending number of units 17 725 17 982
Transaction costs ($000s except %)
Transaction costs, including brokerage commissions, in
consideration of portfolio transactions for the periods ended:
December 31 2017
December 31 2016
$ % $ %
Total transaction costs 3 171 100 4 420 100Related-party brokerage commissions* 429 14 435 10Commission arrangements† 169 5 153 3
* See note 8 in the generic notes.† Commission arrangements are part of commission amounts paid to dealers. The Fund uses
commission arrangements (formerly known as “soft dollars”) for research and/or order execution goods and services.
Securities lending revenue ($000s except %) (see note 7 in the generic notes)
Fair value of securities on loan and collateral received as at:
December 31 2017
December 31 2016
Fair value of securities loaned 392 988 289 772Fair value of collateral received 400 847 295 568

NOTES TO FINANCIAL STATEMENTS – FUND SPECIFIC INFORMATION
Please see the generic notes at the back of the financial statements.
December 31, 2017
RBC CANADIAN EQUITY INCOME FUND
The table below provides a reconciliation of the gross revenue
generated from the securities lending transactions of the Fund
to the securities lending revenue disclosed in the Statements of
Comprehensive Income.
December 31 2017
December 31 2016
$ % $ %
Gross revenue 799 100 620 100 RBC IS (paid) (217) (27) (217) (35)Tax withheld (5) (1) (21) (3)Fund revenue 577 72 382 62
Investments by other related investment funds (%) (see note 8 in the generic notes)
The table below summarizes, as a percentage, the NAV of the
Fund owned by other related investment funds as at:
December 31 2017
December 31 2016
RBC Balanced Growth & Income Class 1.4 1.0RBC Canadian Equity Income Class 5.5 5.7RBC Conservative Growth & Income Fund 0.4 0.3RBC Managed Payout Solution – Enhanced 4.1 4.0RBC Managed Payout Solution – Enhanced Plus 4.2 3.2Total 15.6 14.2

GENERIC NOTES TO FINANCIAL STATEMENTS
December 31, 2017
(also see Fund Specific Information)
1. The Funds
The Funds (“Fund” or “Funds”) are open-ended mutual
fund trusts governed by the laws of the Province of Ontario
or British Columbia. RBC GAM is the manager and portfolio
manager of the Funds and its head office is located at
155 Wellington Street West, 22nd Floor, Toronto, Ontario.
RBC GAM is also the trustee of those Funds governed by the
laws of the Province of Ontario. These financial statements
were approved for issuance by the Board of Directors of
RBC GAM on March 8, 2018.
The Funds may issue an unlimited number of units in some
or all of Series A, Advisor Series, Advisor T5 Series, Series T5,
Series T8, Series H, Series D, Series DZ, Series F, Series FT5,
Series FT8, Series I and Series O.
Series A units have no sales charges and are available to all
investors through authorized dealers.
Advisor Series units and Advisor T5 Series units are available
to all investors through authorized dealers with an initial
sales charge or low-load sales charge option. For certain of
the Funds, Advisor Series units and Advisor T5 Series units are
available with a deferred sales charge option. Under the initial
sales charge option, investors pay a sales charge ranging from
0% to 5% of the amount invested. Under the deferred sales
charge or low-load sales charge option, sales charges may be
applicable, as described in the Simplified Prospectus.
Series T5 units and Series T8 units have no sales charges and
are available to all investors through authorized dealers.
Series H units have no sales charges, have lower fees than
Series A units and are only available to investors who invest
and maintain the required minimum balance through
authorized dealers.
Series D units and Series DZ units have no sales charges
and have lower fees than Series A units. Series D units and
Series DZ units may be available to investors who have
accounts with RBC Direct Investing Inc., Phillips, Hager &
North Investment Funds Ltd. (“PH&N IF”) or certain other
authorized dealers (primarily discount brokers).
Series F units, Series FT5 units and Series FT8 units have no
sales charges and have lower fees than Series A units. Series F
units, Series FT5 units and Series FT8 units are only available
to investors who have fee-based accounts with their dealer.
Series I units have no sales charges, have lower fees than
Series F units, Series FT5 units and Series FT8 units and
are only available to investors who invest and maintain
the required minimum balance and who have accounts
with dealers who have signed a fee-based agreement with
RBC GAM.
Series O units are only available to large private or
institutional investors or dealers. No management fees
are payable by the Funds in respect to Series O units.
Unitholders pay a negotiated fee directly to RBC GAM for
investment-counselling services.
2. Financial year/period
The information provided in these financial statements
and notes thereto is for the 12-month periods ended or as
at December 31, 2017 and 2016, as applicable. In the year a
Fund or series is established, “period” represents the period
from inception to December 31 of that fiscal year.
3. Summary of significant accounting policies
These financial statements have been prepared in
compliance with International Financial Reporting Standards
(“IFRS”). The significant accounting policies of the Funds,
which are investment entities, are as follows:
Classification of Financial Assets and Liabilities The
Funds’ financial assets and financial liabilities, other than
derivatives, are designated at fair value through profit or
loss at inception, as those financial assets and liabilities are
managed together and their performance evaluated on a
fair value basis in accordance with the Funds’ documented
investment strategy. Derivatives are classified as held
for trading and measured at fair value through profit or
loss. Redemption units are measured at their respective
redemption values. All other assets and liabilities are
measured at amortized cost. Realized gains arising on
derivatives during a period are included in the Statements
of Comprehensive Income in “Net gain (loss) from futures
contracts,” “Other derivatives” and “Net gain (loss) on foreign
currencies and other net assets,” where applicable.
Classification of Redeemable Units The Funds have multiple
features across the different series of the Funds. Consequently,
the Funds’ outstanding redeemable units are classified as
financial liabilities in accordance with the requirements of
IAS 32 Financial Instruments: Presentation.

GENERIC NOTES TO FINANCIAL STATEMENTS
December 31, 2017
(also see Fund Specific Information)
Unconsolidated Structured Entities The Funds may invest in
other Funds and exchange-traded funds (“ETFs”) managed
by the manager or an affiliate of the manager (“sponsored
funds”) and may invest in other funds and ETFs managed
by unaffiliated entities (“unsponsored funds”); collectively,
“underlying funds.” The underlying funds are determined to
be unconsolidated structured entities, as decision making
in the underlying fund is not governed by the voting rights
or other similar rights held by the Fund. The investments
in underlying funds are subject to the terms and conditions
of the offering documents of the respective underlying
funds and are susceptible to market price risk arising from
uncertainties about future values of those underlying funds.
The underlying funds’ objectives are generally to achieve
long-term capital appreciation and/or current income by
investing in a portfolio of securities and other funds in line
with each of their documented investment strategies. The
underlying funds apply various investment strategies to
accomplish their respective investment objectives.
The underlying funds finance their operations by issuing
redeemable units which are puttable at the unitholder’s
option, and entitle the unitholder to a proportional stake in
the respective underlying funds’ NAV.
The Funds do not consolidate their investment in underlying
funds but account for these investments at fair value. The
manager has determined that the Funds are investment
entities in accordance with IFRS 10 Consolidated Financial
Statements, since the Funds meet the following criteria:
(i) The Funds obtain capital from one or more investors for
the purpose of providing those investors with investment
management services,
(ii) The Funds commit to their investors that their business
purpose is to invest funds solely for the returns from
capital appreciation, investment income or both, and
(iii) The Funds measure and evaluate the performance of
substantially all of their investments on a fair value basis.
Therefore, the fair value of investments in the underlying
funds is included in the Schedule of Investment Portfolio
and included in “Investments at fair value” in the Funds’
Statements of Financial Position. The change in fair value
of the investment held in the underlying funds is included
in “Change in unrealized gain (loss) on investments” in the
Statements of Comprehensive Income.
Certain Funds may invest in mortgage-related or other
asset-backed securities. These securities include commercial
mortgage-backed securities, asset-backed securities,
collateralized debt obligations and other securities that
directly or indirectly represent a participation in, or are
securitized by and payable from, mortgage loans on real
property. Mortgage-related securities are created from
pools of residential or commercial mortgage loans while
asset-backed securities are created from many types of
assets, including auto loans, credit card receivables, home
equity loans and student loans. The Funds account for these
investments at fair value. The fair value of such securities, as
disclosed in the Schedule of Investment Portfolio, represents
the maximum exposure to losses at that date.
Determination of Fair Value The fair value of a financial
instrument is the amount at which the financial instrument
could be exchanged in an arm’s-length transaction between
knowledgeable and willing parties under no compulsion to
act. In determining fair value, a three-tier hierarchy based on
inputs is used to value the Funds’ financial instruments.
The hierarchy of inputs is summarized below:
Level 1 – quoted prices (unadjusted) in active markets for
identical assets or liabilities;
Level 2 – inputs other than quoted prices included in
Level 1 that are observable for the asset or liability, either
directly (i.e., as prices) or indirectly (i.e., derived from prices),
including broker quotes, vendor prices and vendor fair value
factors; and
Level 3 – inputs for the asset or liability that are not based on
observable market data (unobservable inputs).
Changes in valuation methods may result in transfers into or
out of an investment’s assigned level.
The three-tier hierarchy of investments and derivatives is
included in “Notes to Financial Statements – Fund Specific
Information.”
Investments and derivatives are recorded at fair value, which
is determined as follows:
Equities – Common shares, preferred shares and exchange-
traded funds are valued at the closing price recorded by the
security exchange on which the security is principally traded. In
circumstances where the closing price is not within the bid-ask
spread, management will determine the points within the
bid-ask spread that are most representative of the fair value.
GENERIC NOTES TO FINANCIAL STATEMENTS
December 31, 2017
(also see Fund Specific Information)
Fixed-Income and Debt Securities – Bonds, mortgage-backed
securities, loans and debentures are valued at the closing
price quoted by major dealers or independent pricing vendors
in such securities.
NHA-approved mortgages are valued at an amount, which produces a yield equivalent to the prevailing rate of return on mortgages of similar type and term.
Short-Term Investments – Short-term investments are valued at fair value, which is approximated at cost plus accrued interest.
Options – Listed options are valued at the closing price on the recognized exchange on which the option is traded. In circumstances where the closing price is not within the bid-ask spread, management will determine the points within the bid-ask spread that are most representative of the fair value.
The premium received for written options is recorded as a liability in the Schedule of Investment Portfolio and adjusted daily to the fair value of the written option.
Warrants – Warrants are valued using a recognized option pricing model, which includes factors such as the terms of the warrant, time value of money and volatility inputs that are significant to such valuation.
Forward Contracts – Forward contracts are valued at the gain or loss that would arise as a result of closing the position at the valuation date. Any unrealized gain or loss at the close of business on each valuation date is recorded as “Change in unrealized gain (loss) on investments” in the Statements of Comprehensive Income. The receivable/payable on forward contracts is recorded separately in the Statements of Financial Position. Realized gain (loss) on foreign exchange contracts is included in “Net gain (loss) on foreign currencies and other net assets” in the Statements of Comprehensive Income.
Total Return Swaps – A total return swap is an agreement by which one party makes payments based on a set rate, either fixed or variable, while the other party makes payments based on the return of an underlying asset, which includes both the income it generates and any capital gains. Total return swap contracts are marked to market daily based upon quotations from the market makers and the change in value, if any, is recorded in “Change in unrealized gain (loss) on investments” in the Statements of Comprehensive Income. When the swap contract is terminated early, the Fund records a realized gain or loss equal to the difference between the current net present value and the executed net present value in “Other
derivatives” in the Statements of Comprehensive Income. Unrealized gains and losses are recorded as “Receivable on open swap contracts” or “Payable on open swap contracts” in the Statements of Financial Position. The risks of total return swap contracts include changes in market conditions and the possible inability of the counterparty to fulfill its obligations under the agreement.
Futures Contracts – Futures contracts entered into by the
Funds are financial agreements to purchase or sell a financial
instrument at a contracted price on a specified future date.
However, the Funds do not intend to purchase or sell the
financial instrument on the settlement date; rather, they
intend to close out each futures contract before settlement
by entering into equal, but offsetting, futures contracts.
Futures contracts are valued at the gain or loss that would
arise as a result of closing the position at the valuation date.
Any gain or loss at the close of business on each valuation
date is recorded as “Net gain (loss) from futures contracts” in
the Statements of Comprehensive Income. The receivable/
payable on futures contracts is recorded separately in the
Statements of Financial Position.
Mutual Fund Unit Valuation – Units of Funds are valued at their
respective NAV per unit from fund companies on the relevant
valuation dates.
Fair Valuation of Investments – The Funds have procedures
to determine the fair value of securities and other financial
instruments for which market prices are not readily available
or which may not be reliably priced. Under these fair valuation
procedures, the Funds primarily employ a market-based
approach, which may use related or comparable assets or
liabilities, NAV per unit (for exchange-traded funds), recent
transactions, market multiples, book values and other relevant
information for the investment to determine its fair value.
Management also has procedures in place to determine the
fair value of foreign securities traded in countries outside
of North America daily to avoid stale prices and to take into
account, among other things, any significant events occurring
after the close of a foreign market.
The Funds may also use an income-based valuation
approach in which the anticipated future cash flows of the
investment are discounted to calculate fair value. Discounts
may also be applied due to the nature or duration of any
restrictions on the disposition of the investments, but only

GENERIC NOTES TO FINANCIAL STATEMENTS
December 31, 2017
(also see Fund Specific Information)
if they arise as a feature of the instrument itself. Due to the
inherent uncertainty of valuations of such investments, the
fair values may differ significantly from the values that would
have been used had an active market existed.
All security valuation techniques are periodically reviewed
by the Valuation Committee (“VC”) of the manager and are
approved by the manager. The VC provides oversight of the
Funds’ valuation policies and procedures.
Cash Cash is comprised of cash and deposits with banks
and is recorded at fair value. The carrying amount of cash
approximates its fair value because it is short-term in nature.
Foreign Exchange The value of investments and other
assets and liabilities in foreign currencies is translated into
Canadian dollars (U.S. dollars in the case of the Phillips,
Hager & North $U.S. Money Market Fund, RBC $U.S. Money
Market Fund, RBC Premium $U.S. Money Market Fund,
RBC $U.S. Investment Grade Corporate Bond Fund,
RBC $U.S. High Yield Bond Fund, BlueBay Emerging Markets
Corporate Bond Fund, BlueBay $U.S. Global Convertible
Bond Fund (Canada) and RBC U.S. Monthly Income Fund) at
the rate of exchange on each valuation date. Purchases and
sales of investments, income and expenses are translated
at the rate of exchange prevailing on the respective dates of
such transactions. Realized foreign exchange gains/losses are
included in “Net gain (loss) on foreign currencies and other
net assets” in the Statements of Comprehensive Income.
Functional Currency The Funds, with the exceptions below,
have their subscriptions, redemptions and performance
denominated in Canadian dollars and, consequently, the
Canadian dollar is the functional currency for the Funds.
Phillips, Hager & North $U.S. Money Market Fund,
RBC $U.S. Money Market Fund, RBC Premium $U.S. Money
Market Fund, RBC $U.S. Investment Grade Corporate Bond
Fund, RBC $U.S. High Yield Bond Fund, BlueBay Emerging
Markets Corporate Bond Fund, BlueBay $U.S. Global
Convertible Bond Fund (Canada) and RBC U.S. Monthly
Income Fund have their subscriptions, redemptions and
performance denominated in U.S. dollars and, consequently,
the U.S. dollar is the functional currency for these Funds.
Valuation of Series A different NAV is calculated for each
series of units of a Fund. The NAV of a particular series of
units is computed by calculating the value of the series’
proportionate share of the assets and liabilities of the Fund
common to all series less the liabilities of the Fund attributable
only to that series. Expenses directly attributable to a series
are charged to that series. Other expenses are allocated
proportionately to each series based upon the relative NAV of
each series. Expenses are accrued daily.
Investment Transactions Investment transactions are
accounted for as of the trade date. Transaction costs, such as
brokerage commissions, incurred by the Funds are recorded
in the Statements of Comprehensive Income for the period.
The unrealized gain and loss on investments is the difference
between fair value and average cost for the period. The basis
of determining the cost of portfolio assets, and realized
and unrealized gains and losses on investments, is average
cost which does not include amortization of premiums or
discounts on fixed-income and debt securities with the
exception of zero coupon bonds.
Income Recognition Dividend income is recognized on
the ex-dividend date and interest for distribution purposes
is coupon interest recognized on an accrual basis and/or
imputed interest on zero coupon bonds. “Other income (loss)”
includes income from income trusts. Distributions received
from income trusts are recognized based on the nature of the
underlying components, such as income, capital gains and
return of capital. “Other income received from underlying
funds” includes income earned by a Fund from investments in
underlying funds. Any premiums paid or discounts received on
the purchase of zero coupon bonds are amortized.
Increase (Decrease) in NAV per Unit Increase (decrease) in
NAV per unit in the Statements of Comprehensive Income
represents the increase (decrease) in net assets attributable to
holders of redeemable units by series, divided by the average
units outstanding per series during the period.
Early Redemption Fees Early redemption fees (short-term
trading fees) are paid directly to a Fund and are designed
to deter excessive trading and its associated costs. With the
exception of money market funds, a Fund may apply a fee
of 2% of the current value of units if the unitholder redeems
or switches out units within seven days of purchasing
or previously switching into a Fund. These amounts are
included in the Statements of Changes in NAV.

GENERIC NOTES TO FINANCIAL STATEMENTS
December 31, 2017
(also see Fund Specific Information)
Foreign Currencies The following is a list of abbreviations
used in the Schedule of Investment Portfolio:
ARS – Argentinian peso KRW – South Korean wonAUD – Australian dollar MXN – Mexican pesoBRL – Brazilian real MYR – Malaysian ringgitCAD – Canadian dollar NOK – Norwegian kroneCHF – Swiss franc NZD – New Zealand dollarCLP – Chilean peso PEN – Peruvian nuevo solCNY – Chinese renminbi PHP – Philippine pesoCOP – Colombian peso PLN – Polish zlotyCZK – Czech koruna RON – Romanian leuDKK – Danish krone RUB – Russian rubleEUR – Euro SEK – Swedish kronaGBP – Pound sterling SGD – Singapore dollarHKD – Hong Kong dollar THB – Thailand bahtHUF – Hungarian forint TRY – Turkish new liraIDR – Indonesian rupiah TWD – New Taiwan dollarILS – Israeli new shekel USD – United States dollarINR – Indian rupee ZAR – South African randJPY – Japanese yen
4. Critical accounting judgments and estimates
The preparation of financial statements requires the use
of judgment in applying the Funds’ accounting policies
and making estimates and assumptions about the future.
The following discusses the most significant accounting
judgments and estimates that management has made in
preparing the financial statements.
Classification and measurement of financial instruments and application of fair value option
In classifying and measuring financial instruments held
by the Funds, the manager is required to make significant
judgments about whether or not the business of the Funds is
to invest on a total return basis for the purpose of applying
the fair value option for financial assets.
Fair value measurement of securities not quoted in an active market
The Funds have established policies and control procedures
that are intended to ensure these estimates are well
controlled, independently reviewed and consistently applied
from period to period. The estimates of the value of the
Funds’ assets and liabilities are believed to be appropriate as
at the reporting date.
The Funds may hold financial instruments that are not quoted
in active markets. Note 3 discusses the policies used by
management for the estimates used in determining fair value.
5. Financial instrument risk and capital management
RBC GAM is responsible for managing each Fund’s
capital, which is its NAV and consists primarily of
its financial instruments.
A Fund’s investment activities expose it to a variety of
financial risks. RBC GAM seeks to minimize potential adverse
effects of these risks on a Fund’s performance by employing
professional, experienced portfolio managers, daily monitoring
of the Fund’s holdings and market events, diversifying its
investment portfolio within the constraints of its investment
objectives and, in some cases, periodically hedging certain risk
exposures through the use of derivatives. To assist in managing
risks, RBC GAM also uses internal guidelines, maintains a
governance structure that oversees each Fund’s investment
activities and monitors compliance with the Fund’s investment
strategies, internal guidelines and securities regulations.
Financial instrument risk, as applicable to a Fund, is disclosed in
its “Notes to Financial Statements – Fund Specific Information.”
These risks include a Fund’s direct risks and pro rata exposure to
the risks of underlying funds, as applicable.
Liquidity risk
Liquidity risk is the possibility that investments in a Fund
cannot be readily converted into cash when required. A Fund
is exposed to daily cash redemptions of redeemable units.
Liquidity risk is managed by investing the majority of a Fund’s
assets in investments that are traded in an active market and
that can be readily disposed. In accordance with securities
regulations, a Fund must maintain at least 90% of its assets in
liquid investments. In addition, a Fund aims to retain sufficient
cash and cash equivalent positions to maintain liquidity, and
has the ability to borrow up to 5% of its NAV for the purpose
of funding redemptions. All non-derivative financial liabilities,
other than redeemable units, are due within 90 days.
Credit risk
Credit risk is the risk that a loss could arise from a security
issuer or counterparty not being able to meet its financial
obligations. The carrying amount of investments and other
assets represents the maximum credit risk exposure as
disclosed in a Fund’s Statements of Financial Position. The
fair value of fixed-income and debt securities includes a
consideration of the creditworthiness of the debt issuer.
Credit risk exposure to over-the-counter derivative
instruments is based on a Fund’s unrealized gain on the

GENERIC NOTES TO FINANCIAL STATEMENTS
December 31, 2017
(also see Fund Specific Information)
contractual obligations with the counterparty. Credit risk
exposure is mitigated for those Funds participating in a
securities lending program (see note 7). RBC GAM monitors
each Fund’s credit exposure and counterparty ratings daily.
Concentration risk
Concentration risk arises as a result of net financial
instrument exposures to the same category, such as
geographical region, asset type, industry sector or market
segment. Financial instruments in the same category have
similar characteristics and may be affected similarly by
changes in economic or other conditions.
Interest rate risk
Interest rate risk is the risk that the fair value of a Fund’s
interest-bearing investments will fluctuate due to changes
in market interest rates. The value of fixed-income and debt
securities, such as bonds, debentures, mortgages or other
income-producing securities, is affected by interest rates.
Generally, the value of these securities increases if interest
rates fall and decreases if interest rates rise.
Currency risk
Currency risk is the risk that the value of investments
denominated in currencies, other than the functional
currency of a Fund, will fluctuate due to changes in foreign
exchange rates. The value of investments denominated in a
currency other than the functional currency is affected by
changes in the value of the functional currency in relation
to the value of the currency in which the investment is
denominated. When the value of the functional currency falls
in relation to foreign currencies, then the value of the foreign
investments rises. When the value of the functional currency
rises, the value of the foreign investments falls.
Other price risk
Other price risk is the risk that the value of financial
instruments will fluctuate as a result of changes in market
prices (other than those arising from interest rate or currency
risk), whether caused by factors specific to an individual
investment, its issuer, or all factors affecting all instruments
traded in a market or market segment.
6. Taxes
The Funds qualify as open-ended mutual fund trusts or unit
trusts under the Income Tax Act (Canada). In general, the
Funds are subject to income tax; however, no income tax
is payable on net income and/or net realized capital gains
which are distributed to unitholders. Since the Funds do
not record income taxes, the tax benefit of capital and
non-capital losses has not been reflected in the Statements
of Financial Position as a deferred income tax asset. In
addition, for mutual fund trusts, income taxes payable on net
realized capital gains are refundable on a formula basis when
units of the Funds are redeemed.
Capital losses are available to be carried forward indefinitely
and applied against future capital gains. Non-capital losses
may be carried forward to reduce future taxable income for
up to 20 years.
7. Securities lending revenueCertain of the Funds lend portfolio securities from time to time in order to earn additional income. Income from securities lending is included in the Statements of Comprehensive Income of a Fund. Each such Fund will have entered into a securities lending program with its custodian, RBC Investor Services Trust (“RBC IS”). The aggregate market value of all securities loaned by a Fund cannot exceed 50% of the assets of a Fund. The Fund receives collateral, with an approved credit rating of at least A, of at least 102% of the value of securities on loan. The Fund is indemnified by RBC IS for any collateral credit or market loss. As such, the credit risk associated with securities lending is considered minimal.
8. Administrative and other related-party transactions
Manager and Portfolio Manager
RBC GAM is an indirect wholly owned subsidiary of
Royal Bank of Canada (“Royal Bank”). RBC GAM is the
manager and portfolio manager of the Funds. RBC GAM is
responsible for the Funds’ day-to-day operations, provides
investment advice and portfolio management services to the
Funds and appoints distributors for the Funds. RBC GAM
is paid a management fee by the Funds as compensation
for its services. The management fee is calculated and
accrued daily as a percentage of the NAV of each series
of units of the Funds. No management fees are paid by
the Funds with respect to Series O units. Unitholders of
Series O units pay a negotiated fee directly to RBC GAM for
investment-counselling services.
The Funds pay a fixed administration fee to RBC GAM. The
fixed administration fee is calculated and accrued daily as a
percentage of the NAV of each series of units of the Funds.
RBC GAM in turn pays certain operating expenses of the
Funds. These expenses include regulatory filing fees and
other day-to-day operating expenses including, but not

GENERIC NOTES TO FINANCIAL STATEMENTS
December 31, 2017
(also see Fund Specific Information)
limited to, recordkeeping, accounting and fund valuation
costs, custody fees, audit and legal fees and the costs of
preparing and distributing annual and interim reports,
prospectuses, statements and investor communications.
Notwithstanding the fixed administration fee, the Funds
also pay certain operating expenses directly, including
the costs related to the Independent Review Committee
of the Funds, and the cost of any new government or
regulatory requirements introduced and any borrowing costs
(collectively, “other fund costs”), and taxes (including, but
not limited to, GST/HST). Other fund costs will be allocated
proportionately to each series based upon the relative NAV
of each series. RBC GAM may, in some years and in certain
cases, absorb a portion of operating expenses. The decision
to absorb the operating expenses is reviewed annually
and determined at the discretion of RBC GAM, without
notice to unitholders.
Certain Funds may invest in units of other Funds managed by
RBC GAM or its affiliates (“underlying mutual funds”). A Fund
will not invest in units of an underlying mutual fund if the
Fund would be required to pay any management or incentive
fees in respect of that investment that a reasonable person
would believe duplicates a fee payable by the underlying
mutual fund for the same service. The Fund’s ownership
interest in underlying mutual funds is disclosed in the Notes
to Financial Statements – Fund Specific Information.
RBC GAM or its affiliates may earn fees and spreads in connection with various services provided to, or transactions with, the Funds, such as banking, brokerage, securities lending, foreign exchange and derivatives transactions. RBC GAM or its affiliates may earn a foreign exchange spread when unitholders switch between series of funds denominated in different currencies. The Funds also maintain bank accounts and overdraft provisions with Royal Bank for which Royal Bank may earn a fee. Affiliates of RBC GAM that provide services to the Funds in the course of their normal business, all of which are wholly owned subsidiaries of Royal Bank of Canada, are discussed below.
Sub-Advisors
RBC Global Asset Management (U.S.) Inc. is the sub-advisor
for the RBC $U.S. Investment Grade Corporate Bond Fund,
RBC U.S. Mid-Cap Growth Equity Fund, RBC U.S. Mid-Cap
Growth Equity Currency Neutral Fund, RBC U.S. Mid-Cap
Value Equity Fund, RBC U.S. Small-Cap Core Equity Fund,
RBC U.S. Small-Cap Value Equity Fund and Phillips,
Hager & North U.S. Multi-Style All-Cap Equity Fund (for a
portion of the Fund). RBC Global Asset Management (UK)
Limited is the sub-advisor for the RBC Bond Fund (for a
portion of the Fund), RBC Global Bond Fund (for a portion
of the Fund), RBC Global Corporate Bond Fund (for a
portion of the Fund), RBC Global High Yield Bond Fund (for
a portion of the Fund), RBC Emerging Markets Bond Fund,
RBC U.S. Monthly Income Fund (for a portion of the Fund),
RBC Balanced Fund (for the European equity portion of the
Fund), RBC Global Balanced Fund (for the European equity
portion of the Fund), RBC Vision Balanced Fund (formerly,
RBC Jantzi Balanced Fund) (for the European equity portion
of the Fund), RBC International Dividend Growth Fund,
RBC International Equity Fund (for the European equity
portion of the Fund), RBC European Dividend Fund,
RBC European Equity Fund, RBC European Mid-Cap Equity
Fund, RBC Emerging Markets Dividend Fund, RBC Emerging
Markets Equity Fund, RBC Emerging Markets Small-Cap
Equity Fund, RBC Global Dividend Growth Fund, RBC Global
Dividend Growth Currency Neutral Fund, RBC Global Equity
Fund, RBC Global Equity Focus Fund, RBC Vision Global
Equity Fund (formerly, RBC Jantzi Global Equity Fund),
RBC Vision Fossil Fuel Free Global Equity Fund, Phillips,
Hager & North Overseas Equity Fund and Phillips, Hager &
North Global Equity Fund. RBC Investment Management
(Asia) Limited is the sub-advisor for the RBC Balanced
Fund (for the Asian equity portion of the Fund), RBC Global
Balanced Fund (for the Asian equity portion of the Fund),
RBC Vision Balanced Fund (formerly, RBC Jantzi Balanced
Fund) (for the Asian equity portion of the Fund), RBC
International Dividend Growth Fund (for the Asian equity
portion of the Fund), RBC International Equity Fund (for the
Asian equity portion of the Fund), RBC Asian Equity Fund,
RBC Asia Pacific Ex-Japan Equity Fund and RBC Japanese
Equity Fund. BlueBay Asset Management LLP is the sub-
advisor of the BlueBay Global Monthly Income Bond Fund,
BlueBay Global Sovereign Bond Fund (Canada), BlueBay
Global Investment Grade Corporate Bond Fund (Canada),
BlueBay European High Yield Bond Fund (Canada), BlueBay
Emerging Markets Corporate Bond Fund, BlueBay Global
Convertible Bond Fund (Canada) and BlueBay $U.S. Global
Convertible Bond Fund (Canada).
The sub-advisors earn a fee which is calculated and accrued
daily as a percentage of the NAV of each series of units of the
Funds. The sub-advisors are paid by the manager from the
management fee paid by the Funds.
GENERIC NOTES TO FINANCIAL STATEMENTS
December 31, 2017
(also see Fund Specific Information)
Trustee
RBC GAM is the trustee for the Funds governed by the laws of the Province of Ontario. RBC IS is the trustee for the Funds governed by the laws of the Province of British Columbia. The trustee holds title to the Funds’ property on behalf of the unitholders. The trustee earns a fee, which is paid by the manager from the fixed administration fee paid by the Funds.
Distributors
RBC GAM, Royal Mutual Funds Inc., RBC Direct Investing Inc., RBC Dominion Securities Inc. and PH&N IF are principal distributors of, or distribute certain series of units of, the Funds. Dealers receive an ongoing commission based on the total value of their clients’ Series A, Advisor Series, Advisor T5 Series, Series T5, Series T8, Series H and Series D units.
Custodian
RBC IS is the custodian and holds the assets of the Funds.
RBC IS earns a fee as the custodian, which is paid by the
manager from the fixed administration fee paid by the Funds.
Registrars
Royal Bank, RBC IS and RBC GAM are the registrars of
the Funds and keep records of who owns the units of the
Funds. The registrars also process orders and issue account
statements. The registrars earn a fee, which is paid by the
manager from the fixed administration fee paid by the Funds.
Brokers and Dealers
The Funds have established or may establish standard
brokerage agreements and dealing agreements at
market rates with related parties such as RBC Dominion
Securities Inc., RBC Capital Markets, LLC, RBC Europe
Limited, NBC Securities Inc. and Royal Bank of Canada.
Other Related-Party Transactions
Pursuant to applicable securities legislation, the Funds
relied on the standing instructions from the Independent
Review Committee with respect to one or more of the
following transactions:
Related-Party Trading Activities(a) trades in securities of Royal Bank;
(b) investments in the securities of issuers for which
a related-party dealer acted as an underwriter during
the distribution of such securities and the 60-day period
following the conclusion of such distribution of the
underwritten securities to the public;
(c) purchases of equity and debt securities from or sales of
equity or debt securities to a related-party dealer, where it
acted as principal; and
Inter-Fund Trading(d) purchases or sales of securities of an issuer from or to
another investment fund or managed account managed
by RBC GAM.
The applicable standing instructions require that Related-Party
Trading Activities and Inter-Fund Trading be conducted in
accordance with RBC GAM policy and that RBC GAM advise
the Independent Review Committee of a material breach
of any standing instruction. RBC GAM policy requires that
an investment decision in respect of Related-Party Trading
Activities (i) is made free from any influence of Royal Bank
or its associates or affiliates and without taking into account
any consideration relevant to Royal Bank or its affiliates
or associates, (ii) represents the business judgment of the
portfolio manager, uninfluenced by considerations other
than the best interests of the Funds, (iii) is in compliance with
RBC GAM policies and procedures, and (iv) achieves a fair and
reasonable result for the Funds. RBC GAM policy requires that
an investment decision in respect of Inter-Fund Trading is in
the best interests of each Fund.
9. Revision of comparative information
Where applicable, certain comparative figures on the
Statements of Cash Flow have been revised.
Amounts reclassified to “Non‐-cash distributions from
underlying funds” have been presented separately from
amounts related to “Cost of investments purchased”
to appropriately reflect the non-‐cash components of
investments purchased. The impact on the “Net cash
provided by (used in) operating activities” is nil.
Comparative figures on the Statements of Cash Flow have
been revised for the following funds:
RBC Monthly Income Bond Fund, RBC Emerging Markets
Bond Fund (CAD Hedged), BlueBay $U.S. Global Convertible
Bond Fund (Canada), RBC Managed Payout Solution,
RBC Managed Payout Solution – Enhanced, RBC Managed
Payout Solution – Enhanced Plus, RBC Conservative
Growth & Income Fund, RBC Balanced Growth & Income
Fund, RBC Global Growth & Income Fund, RBC Retirement
2020 Portfolio, RBC Retirement 2025 Portfolio, RBC Retirement
2030 Portfolio, RBC Retirement 2035 Portfolio, RBC Retirement
2040 Portfolio, RBC Retirement 2045 Portfolio, RBC Retirement

GENERIC NOTES TO FINANCIAL STATEMENTS
December 31, 2017
(also see Fund Specific Information)
2050 Portfolio, RBC Select Very Conservative Portfolio,
RBC Select Conservative Portfolio, RBC Select Balanced
Portfolio, RBC Select Growth Portfolio, RBC Select Aggressive
Growth Portfolio, RBC Select Choices Conservative Portfolio,
RBC Select Choices Balanced Portfolio, RBC Select Choices
Growth Portfolio, RBC Select Choices Aggressive Growth
Portfolio, RBC Target 2020 Education Fund, RBC Target
2025 Education Fund, RBC Target 2030 Education Fund,
RBC International Equity Currency Neutral Fund, RBC
International Index Currency Neutral Fund, RBC Asian Equity
Fund, RBC Emerging Markets Multi-Strategy Equity Fund,
RBC Private U.S. Large-Cap Value Equity Currency Neutral
Pool, RBC Private U.S. Large-Cap Core Equity Currency
Neutral Pool, Phillips, Hager & North Balanced Fund, Phillips,
Hager & North Currency-Hedged U.S. Equity Fund, Phillips,
Hager & North Currency-Hedged Overseas Equity Fund,
Phillips, Hager & North LifeTime 2015 Fund, Phillips, Hager &
North LifeTime 2020 Fund, Phillips, Hager & North LifeTime
2025 Fund, Phillips, Hager & North LifeTime 2030 Fund,
Phillips, Hager & North LifeTime 2035 Fund, Phillips, Hager &
North LifeTime 2040 Fund, Phillips, Hager & North LifeTime
2045 Fund and Phillips, Hager & North LifeTime 2050 Fund.
Amounts reclassified to “(Increase) decrease in margin
accounts” have been presented separately from amounts
related to “Cash (bank overdraft), beginning of period,”
to appropriately separate changes in margin accounts.
Comparative figures on the Statements of Cash Flow have
been revised for the following funds:
BlueBay $U.S. Global Convertible Bond Fund (Canada) and
RBC International Index Currency Neutral Fund.
10. Future accounting changes
The following IFRS standard has been issued, but is not yet
in effect:
IFRS 9 Financial Instruments addresses the classification,
measurement and derecognition of financial assets and
liabilities. It replaces the multiple classifications and
measurement models in IAS 39 and is effective for reporting
periods beginning on or after January 1, 2018. Classification
and measurement of debt assets will be driven by an entity’s
business model for managing the financial assets and the
contractual cash flow characteristics of the financial assets.
Derivative and equity instruments are measured at fair value
through profit or loss unless, for equity instruments not held
for trading, an irrevocable option is taken to measure at fair
value through other comprehensive income.
On adoption of IFRS 9, the Funds’ investment portfolios
will continue to be classified at fair value through profit or
loss. Other financial assets which are held for collection will
continue to be measured at amortized cost with no material
impact expected from application of the new impairment
model introduced in IFRS 9. As a result, the adoption of
IFRS 9 is not expected to have a material impact on the
Funds’ financial statements.