Embed Size (px)
Citation preview
The accompanying financial statements have been prepared by RBC Global Asset Management Inc. (“RBC GAM”) as manager of the
RBC GAM Investment Funds (the “Funds”) and approved by the Board of Directors of RBC GAM. We are responsible for the information contained
within the financial statements.
We have maintained appropriate procedures and controls to ensure that timely and reliable financial information is produced. The financial
statements have been prepared in compliance with International Financial Reporting Standards (“IFRS”) (and they include certain amounts that are
based on estimates and judgments). The significant accounting policies, which we believe are appropriate for the Funds, are described in Note 3
to the financial statements.
PricewaterhouseCoopers LLP, Chartered Professional Accountants, Licensed Public Accountants, have performed an independent audit of the
financial statements in accordance with IFRS. Their report is set out on the next page.
Damon G. Williams, FSA, FCIA, CFA Heidi Johnston, CPA, CAChief Executive Officer Chief Financial OfficerRBC Global Asset Management Inc. RBC GAM Funds
March 8, 2018
MANAGEMENT’S RESPONSIBILITY FOR FINANCIAL REPORTING

INDEPENDENT AUDITOR’S REPORT
To the Unitholders of:
RBC FUNDS & RBC PRIVATE POOLSRBC Canadian T-Bill FundRBC Canadian Money Market FundRBC Premium Money Market FundRBC $U.S. Money Market FundRBC Premium $U.S. Money Market FundRBC Canadian Short-Term Income FundRBC Monthly Income Bond FundRBC Canadian Bond Index Fund (formerly, RBC Advisor Canadian Bond Fund)RBC Canadian Government Bond Index FundRBC Bond FundRBC Vision Bond Fund (formerly, Phillips, Hager & North Community Values Bond Fund)RBC Global Bond FundRBC $U.S. Investment Grade Corporate Bond FundRBC Global Corporate Bond FundRBC High Yield Bond FundRBC $U.S. High Yield Bond FundRBC Global High Yield Bond FundRBC Strategic Income Bond FundRBC Emerging Markets Foreign Exchange FundRBC Emerging Markets Bond FundRBC Emerging Markets Bond Fund (CAD Hedged)BlueBay Global Monthly Income Bond FundBlueBay Global Sovereign Bond Fund (Canada)BlueBay Global Investment Grade Corporate Bond Fund (Canada)BlueBay European High Yield Bond Fund (Canada)BlueBay Emerging Markets Corporate Bond FundBlueBay Global Convertible Bond Fund (Canada)BlueBay $U.S. Global Convertible Bond Fund (Canada)RBC Managed Payout SolutionRBC Managed Payout Solution – EnhancedRBC Managed Payout Solution – Enhanced PlusRBC Monthly Income FundRBC U.S. Monthly Income Fund RBC Balanced FundRBC Global Balanced FundRBC Vision Balanced Fund (formerly, RBC Jantzi Balanced Fund)RBC Conservative Growth & Income FundRBC Balanced Growth & Income FundRBC Global Growth & Income FundRBC Retirement Income SolutionRBC Retirement 2020 PortfolioRBC Retirement 2025 PortfolioRBC Retirement 2030 PortfolioRBC Retirement 2035 PortfolioRBC Retirement 2040 PortfolioRBC Retirement 2045 PortfolioRBC Retirement 2050 PortfolioRBC Select Very Conservative PortfolioRBC Select Conservative PortfolioRBC Select Balanced Portfolio RBC Select Growth PortfolioRBC Select Aggressive Growth PortfolioRBC Select Choices Conservative PortfolioRBC Select Choices Balanced PortfolioRBC Select Choices Growth PortfolioRBC Select Choices Aggressive Growth PortfolioRBC Target 2020 Education FundRBC Target 2025 Education Fund
RBC Target 2030 Education FundRBC Target 2035 Education FundRBC Canadian Dividend FundRBC Canadian Equity FundRBC QUBE Canadian Equity FundRBC QUBE Low Volatility Canadian Equity FundRBC Trend Canadian Equity FundRBC Vision Canadian Equity Fund (formerly, RBC Jantzi Canadian Equity Fund)RBC Canadian Index FundRBC O’Shaughnessy Canadian Equity FundRBC O’Shaughnessy All-Canadian Equity FundRBC Canadian Equity Income FundRBC Canadian Small & Mid-Cap Resources FundRBC North American Value FundRBC North American Growth FundRBC U.S. Dividend FundRBC U.S. Dividend Currency Neutral FundRBC U.S. Equity Fund RBC U.S. Equity Currency Neutral FundRBC QUBE U.S. Equity FundRBC QUBE Low Volatility U.S. Equity FundRBC QUBE Low Volatility U.S. Equity Currency Neutral FundRBC U.S. Equity Value FundRBC U.S. Index FundRBC U.S. Index Currency Neutral FundRBC O’Shaughnessy U.S. Value FundRBC U.S. Mid-Cap Growth Equity FundRBC U.S. Mid-Cap Growth Equity Currency Neutral Fund RBC U.S. Mid-Cap Value Equity FundRBC U.S. Small-Cap Core Equity FundRBC U.S. Small-Cap Value Equity FundRBC O’Shaughnessy U.S. Growth FundRBC O’Shaughnessy U.S. Growth Fund IIRBC Life Science and Technology FundRBC International Dividend Growth FundRBC International Equity FundRBC International Equity Currency Neutral FundRBC International Index Currency Neutral FundRBC O’Shaughnessy International Equity FundRBC European Dividend FundRBC European Equity FundRBC European Mid-Cap Equity FundRBC Asian Equity FundRBC Asia Pacific ex-Japan Equity FundRBC Japanese Equity FundRBC Emerging Markets Multi-Strategy Equity FundRBC Emerging Markets Dividend FundRBC Emerging Markets Equity FundRBC Emerging Markets Small-Cap Equity FundRBC Global Dividend Growth FundRBC Global Dividend Growth Currency Neutral FundRBC Global Equity FundRBC Global Equity Focus FundRBC QUBE Global Equity FundRBC QUBE Low Volatility Global Equity FundRBC Vision Global Equity Fund (formerly, RBC Jantzi Global Equity Fund)RBC Vision Fossil Fuel Free Global Equity Fund RBC O’Shaughnessy Global Equity FundRBC QUBE All Country World Equity FundRBC QUBE Low Volatility All Country World Equity FundRBC Global Energy FundRBC Global Precious Metals Fund
RBC Global Resources FundRBC Global Technology FundRBC Private Short-Term Income PoolRBC Private Canadian Corporate Bond PoolRBC Private Income PoolRBC Private Canadian Dividend PoolRBC Private Canadian Growth and Income Equity PoolRBC Private Canadian Equity PoolRBC Private Canadian Growth Equity PoolRBC Private Canadian Mid-Cap Equity PoolRBC Private U.S. Large-Cap Value Equity Pool RBC Private U.S. Large-Cap Value Equity Currency Neutral PoolRBC Private U.S. Growth Equity PoolRBC Private U.S. Large-Cap Core Equity Pool RBC Private U.S. Large-Cap Core Equity Currency Neutral PoolRBC Private U.S. Small-Cap Equity PoolRBC Private EAFE Equity PoolRBC Private Overseas Equity PoolRBC Private World Equity Pool
PHILLIPS, HAGER & NORTH INVESTMENT FUNDSPhillips, Hager & North Canadian Money Market FundPhillips, Hager & North $U.S. Money Market FundPhillips, Hager & North Short Term Bond & Mortgage FundPhillips, Hager & North Bond FundPhillips, Hager & North Total Return Bond FundPhillips, Hager & North Inflation-Linked Bond FundPhillips, Hager & North High Yield Bond FundPhillips, Hager & North Long Inflation-linked Bond FundPhillips, Hager & North Monthly Income FundPhillips, Hager & North Balanced FundPhillips, Hager & North Dividend Income FundPhillips, Hager & North Canadian Equity FundPhillips, Hager & North Canadian Equity Value FundPhillips, Hager & North Canadian Equity Underlying FundPhillips, Hager & North Canadian Equity Underlying Fund IIPhillips, Hager & North Canadian Growth Fund Phillips, Hager & North Canadian Income FundPhillips, Hager & North Vintage FundPhillips, Hager & North U.S. Dividend Income FundPhillips, Hager & North U.S. Multi-Style All-Cap Equity FundPhillips, Hager & North U.S. Equity FundPhillips, Hager & North Currency-Hedged U.S. Equity FundPhillips, Hager & North U.S. Growth Fund Phillips, Hager & North Overseas Equity FundPhillips, Hager & North Currency-Hedged Overseas Equity FundPhillips, Hager & North Global Equity FundPhillips, Hager & North LifeTime 2015 Fund Phillips, Hager & North LifeTime 2020 FundPhillips, Hager & North LifeTime 2025 FundPhillips, Hager & North LifeTime 2030 FundPhillips, Hager & North LifeTime 2035 FundPhillips, Hager & North LifeTime 2040 FundPhillips, Hager & North LifeTime 2045 FundPhillips, Hager & North LifeTime 2050 Fund
(collectively referred to as the “Funds”)

INDEPENDENT AUDITOR’S REPORT
We have audited the accompanying financial statements of each of the Funds, which comprise the statements of financial position,
comprehensive income, cash flows and changes in net assets attributable to holders of redeemable units as at and for the periods indicated in
note 2, and the related notes, which comprise a summary of significant accounting policies and other explanatory information.
Management’s responsibility for the financial statementsManagement is responsible for the preparation and fair presentation of the financial statements of each of the Funds in accordance with
International Financial Reporting Standards, and for such internal control as management determines is necessary to enable the preparation
of financial statements that are free from material misstatement, whether due to fraud or error.
Auditor’s responsibilityOur responsibility is to express an opinion on the financial statements of each of the Funds based on our audits. We conducted our audits in
accordance with Canadian generally accepted auditing standards. Those standards require that we comply with ethical requirements and plan
and perform the audits to obtain reasonable assurance about whether the financial statements are free from material misstatement.
An audit involves performing procedures to obtain audit evidence about the amounts and disclosures in the financial statements. The procedures
selected depend on the auditor’s judgment, including the assessment of the risks of material misstatement of the financial statements, whether due
to fraud or error. In making those risk assessments, the auditor considers internal control relevant to the entity’s preparation and fair presentation
of the financial statements in order to design audit procedures that are appropriate in the circumstances, but not for the purpose of expressing an
opinion on the effectiveness of the entity’s internal control. An audit also includes evaluating the appropriateness of accounting policies used and
the reasonableness of accounting estimates made by management, as well as evaluating the overall presentation of the financial statements.
We believe that the audit evidence we have obtained in each of our audits is sufficient and appropriate to provide a basis for our audit opinion.
OpinionIn our opinion, the financial statements of each of the Funds present fairly, in all material respects, the financial position, financial performance
and cash flows of each of the Funds as at and for the periods indicated in note 2, in accordance with International Financial Reporting Standards.
Chartered Professional Accountants, Licensed Public Accountants
Toronto, OntarioMarch 8, 2018
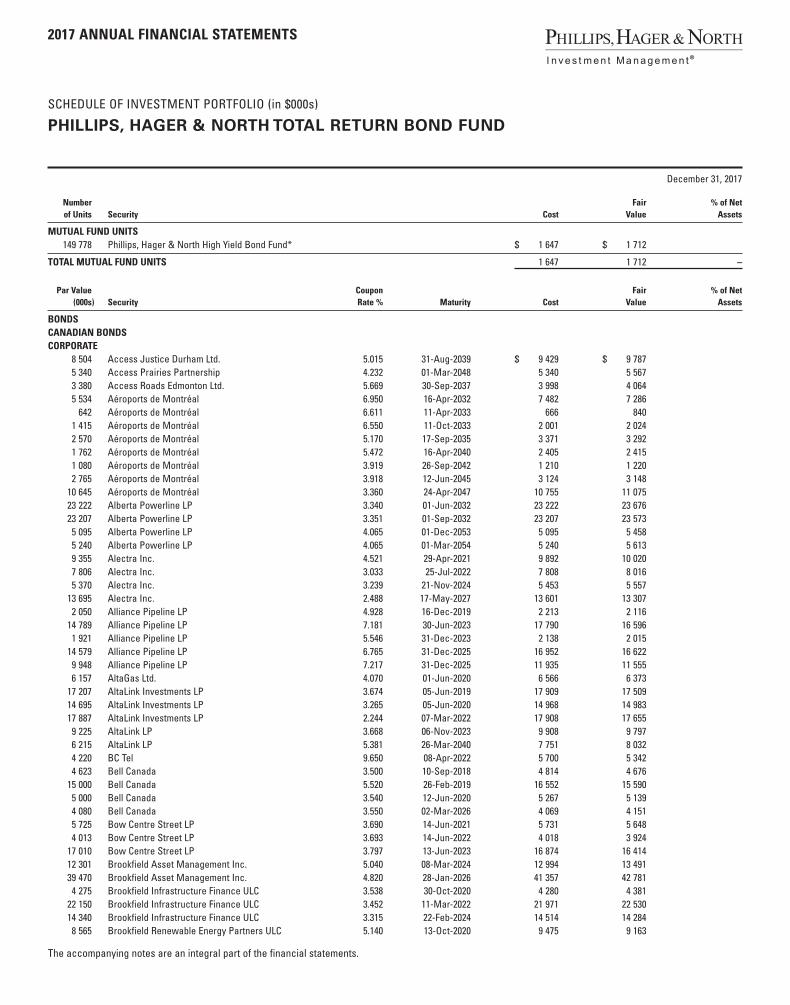
SCHEDULE OF INVESTMENT PORTFOLIO (in $000s)
2017 ANNUAL FINANCIAL STATEMENTS
December 31, 2017
The accompanying notes are an integral part of the financial statements.
PHILLIPS, HAGER & NORTH TOTAL RETURN BOND FUND
Number Fair % of Net of Units Security Cost Value Assets
MUTUAL FUND UNITS 149 778 Phillips, Hager & North High Yield Bond Fund* $ 1 647 $ 1 712
TOTAL MUTUAL FUND UNITS 1 647 1 712 –
Par Value Coupon Fair % of Net (000s) Security Rate % Maturity Cost Value Assets
BONDSCANADIAN BONDSCORPORATE 8 504 Access Justice Durham Ltd. 5.015 31-Aug-2039 $ 9 429 $ 9 787 5 340 Access Prairies Partnership 4.232 01-Mar-2048 5 340 5 567 3 380 Access Roads Edmonton Ltd. 5.669 30-Sep-2037 3 998 4 064 5 534 Aéroports de Montréal 6.950 16-Apr-2032 7 482 7 286 642 Aéroports de Montréal 6.611 11-Apr-2033 666 840 1 415 Aéroports de Montréal 6.550 11-Oct-2033 2 001 2 024 2 570 Aéroports de Montréal 5.170 17-Sep-2035 3 371 3 292 1 762 Aéroports de Montréal 5.472 16-Apr-2040 2 405 2 415 1 080 Aéroports de Montréal 3.919 26-Sep-2042 1 210 1 220 2 765 Aéroports de Montréal 3.918 12-Jun-2045 3 124 3 148 10 645 Aéroports de Montréal 3.360 24-Apr-2047 10 755 11 075 23 222 Alberta Powerline LP 3.340 01-Jun-2032 23 222 23 676 23 207 Alberta Powerline LP 3.351 01-Sep-2032 23 207 23 573 5 095 Alberta Powerline LP 4.065 01-Dec-2053 5 095 5 458 5 240 Alberta Powerline LP 4.065 01-Mar-2054 5 240 5 613 9 355 Alectra Inc. 4.521 29-Apr-2021 9 892 10 020 7 806 Alectra Inc. 3.033 25-Jul-2022 7 808 8 016 5 370 Alectra Inc. 3.239 21-Nov-2024 5 453 5 557 13 695 Alectra Inc. 2.488 17-May-2027 13 601 13 307 2 050 Alliance Pipeline LP 4.928 16-Dec-2019 2 213 2 116 14 789 Alliance Pipeline LP 7.181 30-Jun-2023 17 790 16 596 1 921 Alliance Pipeline LP 5.546 31-Dec-2023 2 138 2 015 14 579 Alliance Pipeline LP 6.765 31-Dec-2025 16 952 16 622 9 948 Alliance Pipeline LP 7.217 31-Dec-2025 11 935 11 555 6 157 AltaGas Ltd. 4.070 01-Jun-2020 6 566 6 373 17 207 AltaLink Investments LP 3.674 05-Jun-2019 17 909 17 509 14 695 AltaLink Investments LP 3.265 05-Jun-2020 14 968 14 983 17 887 AltaLink Investments LP 2.244 07-Mar-2022 17 908 17 655 9 225 AltaLink LP 3.668 06-Nov-2023 9 908 9 797 6 215 AltaLink LP 5.381 26-Mar-2040 7 751 8 032 4 220 BC Tel 9.650 08-Apr-2022 5 700 5 342 4 623 Bell Canada 3.500 10-Sep-2018 4 814 4 676 15 000 Bell Canada 5.520 26-Feb-2019 16 552 15 590 5 000 Bell Canada 3.540 12-Jun-2020 5 267 5 139 4 080 Bell Canada 3.550 02-Mar-2026 4 069 4 151 5 725 Bow Centre Street LP 3.690 14-Jun-2021 5 731 5 648 4 013 Bow Centre Street LP 3.693 14-Jun-2022 4 018 3 924 17 010 Bow Centre Street LP 3.797 13-Jun-2023 16 874 16 414 12 301 Brookfield Asset Management Inc. 5.040 08-Mar-2024 12 994 13 491 39 470 Brookfield Asset Management Inc. 4.820 28-Jan-2026 41 357 42 781 4 275 Brookfield Infrastructure Finance ULC 3.538 30-Oct-2020 4 280 4 381 22 150 Brookfield Infrastructure Finance ULC 3.452 11-Mar-2022 21 971 22 530 14 340 Brookfield Infrastructure Finance ULC 3.315 22-Feb-2024 14 514 14 284 8 565 Brookfield Renewable Energy Partners ULC 5.140 13-Oct-2020 9 475 9 163
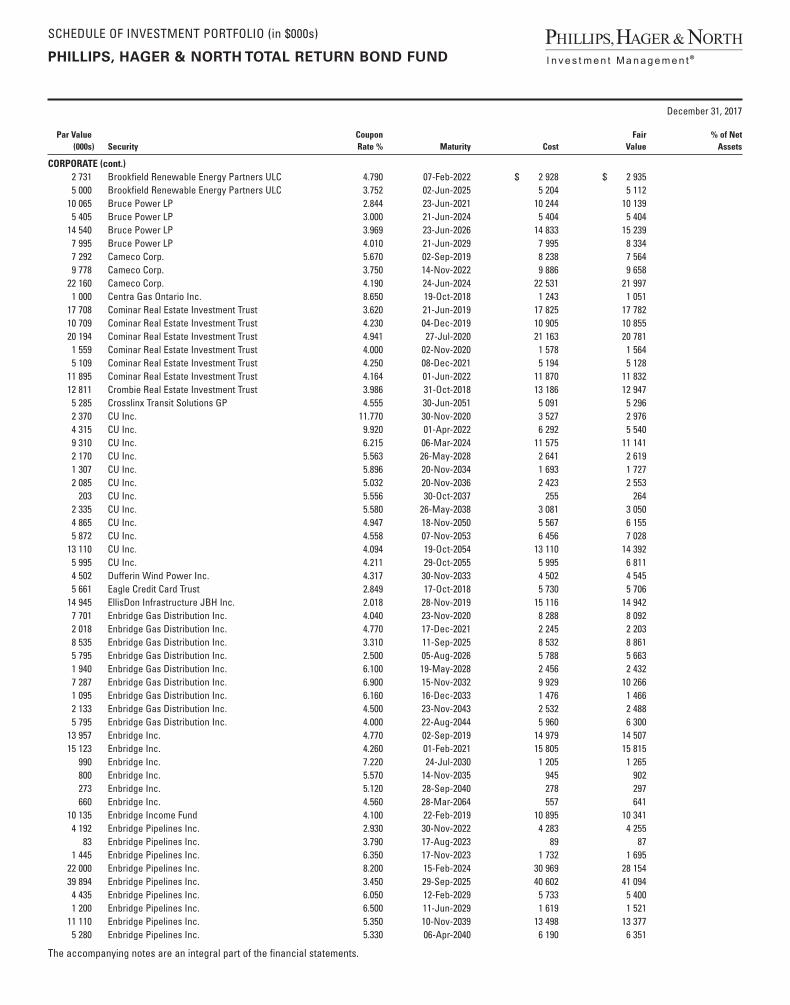
SCHEDULE OF INVESTMENT PORTFOLIO (in $000s)
December 31, 2017
The accompanying notes are an integral part of the financial statements.
PHILLIPS, HAGER & NORTH TOTAL RETURN BOND FUND
Par Value Coupon Fair % of Net (000s) Security Rate % Maturity Cost Value Assets
CORPORATE (cont.) 2 731 Brookfield Renewable Energy Partners ULC 4.790 07-Feb-2022 $ 2 928 $ 2 935 5 000 Brookfield Renewable Energy Partners ULC 3.752 02-Jun-2025 5 204 5 112 10 065 Bruce Power LP 2.844 23-Jun-2021 10 244 10 139 5 405 Bruce Power LP 3.000 21-Jun-2024 5 404 5 404 14 540 Bruce Power LP 3.969 23-Jun-2026 14 833 15 239 7 995 Bruce Power LP 4.010 21-Jun-2029 7 995 8 334 7 292 Cameco Corp. 5.670 02-Sep-2019 8 238 7 564 9 778 Cameco Corp. 3.750 14-Nov-2022 9 886 9 658 22 160 Cameco Corp. 4.190 24-Jun-2024 22 531 21 997 1 000 Centra Gas Ontario Inc. 8.650 19-Oct-2018 1 243 1 051 17 708 Cominar Real Estate Investment Trust 3.620 21-Jun-2019 17 825 17 782 10 709 Cominar Real Estate Investment Trust 4.230 04-Dec-2019 10 905 10 855 20 194 Cominar Real Estate Investment Trust 4.941 27-Jul-2020 21 163 20 781 1 559 Cominar Real Estate Investment Trust 4.000 02-Nov-2020 1 578 1 564 5 109 Cominar Real Estate Investment Trust 4.250 08-Dec-2021 5 194 5 128 11 895 Cominar Real Estate Investment Trust 4.164 01-Jun-2022 11 870 11 832 12 811 Crombie Real Estate Investment Trust 3.986 31-Oct-2018 13 186 12 947 5 285 Crosslinx Transit Solutions GP 4.555 30-Jun-2051 5 091 5 296 2 370 CU Inc. 11.770 30-Nov-2020 3 527 2 976 4 315 CU Inc. 9.920 01-Apr-2022 6 292 5 540 9 310 CU Inc. 6.215 06-Mar-2024 11 575 11 141 2 170 CU Inc. 5.563 26-May-2028 2 641 2 619 1 307 CU Inc. 5.896 20-Nov-2034 1 693 1 727 2 085 CU Inc. 5.032 20-Nov-2036 2 423 2 553 203 CU Inc. 5.556 30-Oct-2037 255 264 2 335 CU Inc. 5.580 26-May-2038 3 081 3 050 4 865 CU Inc. 4.947 18-Nov-2050 5 567 6 155 5 872 CU Inc. 4.558 07-Nov-2053 6 456 7 028 13 110 CU Inc. 4.094 19-Oct-2054 13 110 14 392 5 995 CU Inc. 4.211 29-Oct-2055 5 995 6 811 4 502 Dufferin Wind Power Inc. 4.317 30-Nov-2033 4 502 4 545 5 661 Eagle Credit Card Trust 2.849 17-Oct-2018 5 730 5 706 14 945 EllisDon Infrastructure JBH Inc. 2.018 28-Nov-2019 15 116 14 942 7 701 Enbridge Gas Distribution Inc. 4.040 23-Nov-2020 8 288 8 092 2 018 Enbridge Gas Distribution Inc. 4.770 17-Dec-2021 2 245 2 203 8 535 Enbridge Gas Distribution Inc. 3.310 11-Sep-2025 8 532 8 861 5 795 Enbridge Gas Distribution Inc. 2.500 05-Aug-2026 5 788 5 663 1 940 Enbridge Gas Distribution Inc. 6.100 19-May-2028 2 456 2 432 7 287 Enbridge Gas Distribution Inc. 6.900 15-Nov-2032 9 929 10 266 1 095 Enbridge Gas Distribution Inc. 6.160 16-Dec-2033 1 476 1 466 2 133 Enbridge Gas Distribution Inc. 4.500 23-Nov-2043 2 532 2 488 5 795 Enbridge Gas Distribution Inc. 4.000 22-Aug-2044 5 960 6 300 13 957 Enbridge Inc. 4.770 02-Sep-2019 14 979 14 507 15 123 Enbridge Inc. 4.260 01-Feb-2021 15 805 15 815 990 Enbridge Inc. 7.220 24-Jul-2030 1 205 1 265 800 Enbridge Inc. 5.570 14-Nov-2035 945 902 273 Enbridge Inc. 5.120 28-Sep-2040 278 297 660 Enbridge Inc. 4.560 28-Mar-2064 557 641 10 135 Enbridge Income Fund 4.100 22-Feb-2019 10 895 10 341 4 192 Enbridge Pipelines Inc. 2.930 30-Nov-2022 4 283 4 255 83 Enbridge Pipelines Inc. 3.790 17-Aug-2023 89 87 1 445 Enbridge Pipelines Inc. 6.350 17-Nov-2023 1 732 1 695 22 000 Enbridge Pipelines Inc. 8.200 15-Feb-2024 30 969 28 154 39 894 Enbridge Pipelines Inc. 3.450 29-Sep-2025 40 602 41 094 4 435 Enbridge Pipelines Inc. 6.050 12-Feb-2029 5 733 5 400 1 200 Enbridge Pipelines Inc. 6.500 11-Jun-2029 1 619 1 521 11 110 Enbridge Pipelines Inc. 5.350 10-Nov-2039 13 498 13 377 5 280 Enbridge Pipelines Inc. 5.330 06-Apr-2040 6 190 6 351
SCHEDULE OF INVESTMENT PORTFOLIO (in $000s)
December 31, 2017
The accompanying notes are an integral part of the financial statements.
PHILLIPS, HAGER & NORTH TOTAL RETURN BOND FUND
Par Value Coupon Fair % of Net (000s) Security Rate % Maturity Cost Value Assets
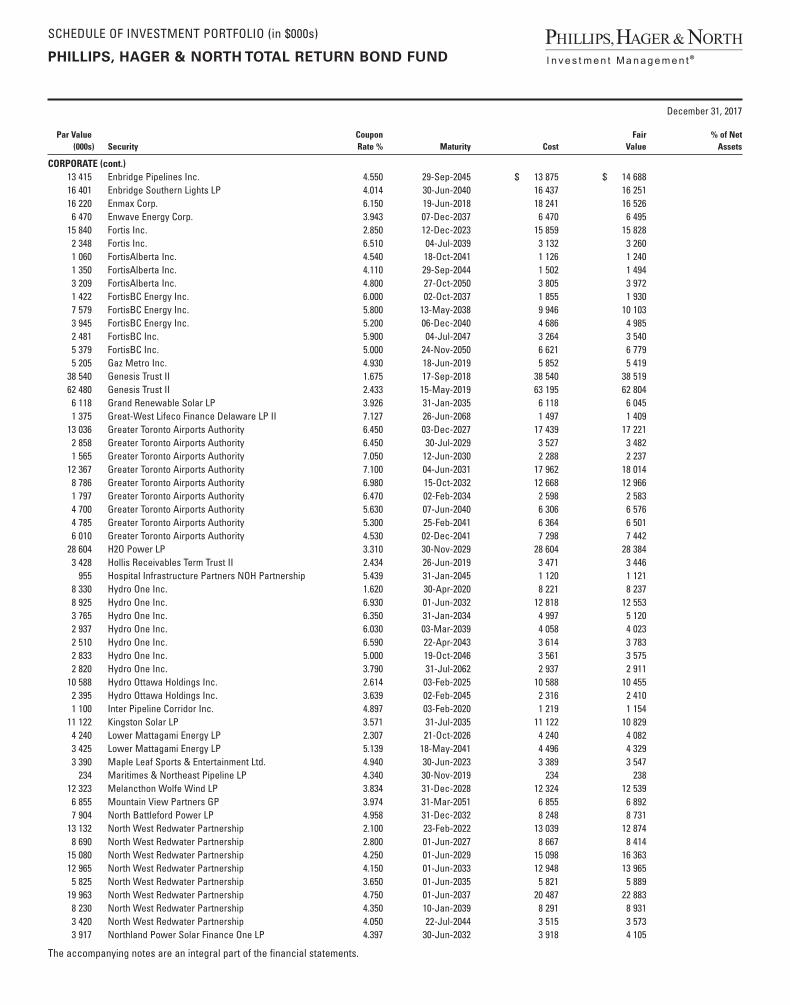
CORPORATE (cont.) 13 415 Enbridge Pipelines Inc. 4.550 29-Sep-2045 $ 13 875 $ 14 688 16 401 Enbridge Southern Lights LP 4.014 30-Jun-2040 16 437 16 251 16 220 Enmax Corp. 6.150 19-Jun-2018 18 241 16 526 6 470 Enwave Energy Corp. 3.943 07-Dec-2037 6 470 6 495 15 840 Fortis Inc. 2.850 12-Dec-2023 15 859 15 828 2 348 Fortis Inc. 6.510 04-Jul-2039 3 132 3 260 1 060 FortisAlberta Inc. 4.540 18-Oct-2041 1 126 1 240 1 350 FortisAlberta Inc. 4.110 29-Sep-2044 1 502 1 494 3 209 FortisAlberta Inc. 4.800 27-Oct-2050 3 805 3 972 1 422 FortisBC Energy Inc. 6.000 02-Oct-2037 1 855 1 930 7 579 FortisBC Energy Inc. 5.800 13-May-2038 9 946 10 103 3 945 FortisBC Energy Inc. 5.200 06-Dec-2040 4 686 4 985 2 481 FortisBC Inc. 5.900 04-Jul-2047 3 264 3 540 5 379 FortisBC Inc. 5.000 24-Nov-2050 6 621 6 779 5 205 Gaz Metro Inc. 4.930 18-Jun-2019 5 852 5 419 38 540 Genesis Trust II 1.675 17-Sep-2018 38 540 38 519 62 480 Genesis Trust II 2.433 15-May-2019 63 195 62 804 6 118 Grand Renewable Solar LP 3.926 31-Jan-2035 6 118 6 045 1 375 Great-West Lifeco Finance Delaware LP II 7.127 26-Jun-2068 1 497 1 409 13 036 Greater Toronto Airports Authority 6.450 03-Dec-2027 17 439 17 221 2 858 Greater Toronto Airports Authority 6.450 30-Jul-2029 3 527 3 482 1 565 Greater Toronto Airports Authority 7.050 12-Jun-2030 2 288 2 237 12 367 Greater Toronto Airports Authority 7.100 04-Jun-2031 17 962 18 014 8 786 Greater Toronto Airports Authority 6.980 15-Oct-2032 12 668 12 966 1 797 Greater Toronto Airports Authority 6.470 02-Feb-2034 2 598 2 583 4 700 Greater Toronto Airports Authority 5.630 07-Jun-2040 6 306 6 576 4 785 Greater Toronto Airports Authority 5.300 25-Feb-2041 6 364 6 501 6 010 Greater Toronto Airports Authority 4.530 02-Dec-2041 7 298 7 442 28 604 H2O Power LP 3.310 30-Nov-2029 28 604 28 384 3 428 Hollis Receivables Term Trust II 2.434 26-Jun-2019 3 471 3 446 955 Hospital Infrastructure Partners NOH Partnership 5.439 31-Jan-2045 1 120 1 121 8 330 Hydro One Inc. 1.620 30-Apr-2020 8 221 8 237 8 925 Hydro One Inc. 6.930 01-Jun-2032 12 818 12 553 3 765 Hydro One Inc. 6.350 31-Jan-2034 4 997 5 120 2 937 Hydro One Inc. 6.030 03-Mar-2039 4 058 4 023 2 510 Hydro One Inc. 6.590 22-Apr-2043 3 614 3 783 2 833 Hydro One Inc. 5.000 19-Oct-2046 3 561 3 575 2 820 Hydro One Inc. 3.790 31-Jul-2062 2 937 2 911 10 588 Hydro Ottawa Holdings Inc. 2.614 03-Feb-2025 10 588 10 455 2 395 Hydro Ottawa Holdings Inc. 3.639 02-Feb-2045 2 316 2 410 1 100 Inter Pipeline Corridor Inc. 4.897 03-Feb-2020 1 219 1 154 11 122 Kingston Solar LP 3.571 31-Jul-2035 11 122 10 829 4 240 Lower Mattagami Energy LP 2.307 21-Oct-2026 4 240 4 082 3 425 Lower Mattagami Energy LP 5.139 18-May-2041 4 496 4 329 3 390 Maple Leaf Sports & Entertainment Ltd. 4.940 30-Jun-2023 3 389 3 547 234 Maritimes & Northeast Pipeline LP 4.340 30-Nov-2019 234 238 12 323 Melancthon Wolfe Wind LP 3.834 31-Dec-2028 12 324 12 539 6 855 Mountain View Partners GP 3.974 31-Mar-2051 6 855 6 892 7 904 North Battleford Power LP 4.958 31-Dec-2032 8 248 8 731 13 132 North West Redwater Partnership 2.100 23-Feb-2022 13 039 12 874 8 690 North West Redwater Partnership 2.800 01-Jun-2027 8 667 8 414 15 080 North West Redwater Partnership 4.250 01-Jun-2029 15 098 16 363 12 965 North West Redwater Partnership 4.150 01-Jun-2033 12 948 13 965 5 825 North West Redwater Partnership 3.650 01-Jun-2035 5 821 5 889 19 963 North West Redwater Partnership 4.750 01-Jun-2037 20 487 22 883 8 230 North West Redwater Partnership 4.350 10-Jan-2039 8 291 8 931 3 420 North West Redwater Partnership 4.050 22-Jul-2044 3 515 3 573 3 917 Northland Power Solar Finance One LP 4.397 30-Jun-2032 3 918 4 105

SCHEDULE OF INVESTMENT PORTFOLIO (in $000s)
December 31, 2017
The accompanying notes are an integral part of the financial statements.
PHILLIPS, HAGER & NORTH TOTAL RETURN BOND FUND
Par Value Coupon Fair % of Net (000s) Security Rate % Maturity Cost Value Assets
CORPORATE (cont.) 2 375 Nova Gas Transmission Ltd. 8.875 27-May-2026 $ 3 388 $ 3 321 3 030 Nova Scotia Power Inc. 9.750 02-Aug-2019 4 014 3 358 9 812 Nova Scotia Power Inc. 8.850 19-May-2025 14 356 13 419 3 645 Nova Scotia Power Inc. 5.950 27-Jul-2039 4 761 4 925 2 010 OMERS Realty Corp. 2.473 12-Nov-2019 2 010 2 023 17 955 Ontario Power Generation Inc. 3.315 04-Oct-2027 17 993 18 259 1 036 Pembina Pipeline Corp. 3.770 24-Oct-2022 1 071 1 071 24 667 Pembina Pipeline Corp. 3.540 03-Feb-2025 24 713 24 862 1 828 Plenary Health Hamilton LP 5.796 31-May-2043 2 195 2 290 8 637 Plenary Health North Bay Finco Inc. 5.182 13-Mar-2040 9 344 9 402 7 120 PSS Generating Station LP 4.795 24-Oct-2067 7 120 7 824 3 680 Ridley Grain Ltd. 5.227 01-Aug-2024 3 680 3 956 16 205 Royal Bank of Canada* 2.820 12-Jul-2018 16 624 16 302 2 789 Royal Bank of Canada* 2.770 11-Dec-2018 2 866 2 813 86 150 Royal Bank of Canada* 1.400 26-Apr-2019 86 176 85 608 14 465 Royal Bank of Canada* 1.590 23-Mar-2020 14 572 14 297 3 325 Royal Bank of Canada* 2.860 04-Mar-2021 3 381 3 375 8 673 Royal Bank of Canada* 1.650 15-Jul-2021 8 626 8 455 7 113 SEC LP and Arci Ltd. 5.188 29-Aug-2033 7 423 7 485 7 435 SGTP Highway Bypass LP 4.105 31-Jan-2045 7 435 7 817 4 150 Sun Life Financial Inc. 2.770 13-May-2024 4 198 4 170 6 695 TELUS Corp. 4.850 05-Apr-2044 6 709 7 135 28 605 Teranet Holdings LP 4.807 16-Dec-2020 31 083 29 937 15 640 TMX Group Ltd. 3.253 03-Oct-2018 16 043 15 810 4 730 Toromont Industries Ltd. 3.710 30-Sep-2025 4 730 4 842 2 450 TransCanada PipeLines Ltd. 8.200 15-Aug-2031 3 718 3 529 8 407 TransCanada PipeLines Ltd. 4.550 15-Nov-2041 8 741 9 292 9 493 TransCanada PipeLines Ltd. 4.350 06-Jun-2046 9 518 10 202 16 390 TransCanada PipeLines Ltd. 4.330 16-Sep-2047 16 403 17 547 18 760 TransEd Partners GP 3.951 30-Sep-2050 17 351 18 442 6 257 Trillium Windpower LP 5.803 15-Feb-2033 7 298 7 123 1 000 Union Gas Ltd. 5.350 27-Apr-2018 1 162 1 012 6 405 Union Gas Ltd. 8.750 03-Aug-2018 7 959 6 659 3 940 Union Gas Ltd. 8.650 10-Nov-2025 5 548 5 473 6 410 Union Gas Ltd. 2.810 01-Jun-2026 6 410 6 412 5 065 Union Gas Ltd. 5.460 11-Sep-2036 6 446 6 471 8 315 Union Gas Ltd. 4.880 21-Jun-2041 9 867 10 104 6 062 Union Gas Ltd. 4.200 02-Jun-2044 6 632 6 789 405 Union Gas Ltd. 3.800 01-Jun-2046 425 426 2 135 Vancouver Airport Authority 3.857 10-Nov-2045 2 383 2 417 1 530 Vancouver Fraser Port Authority 4.630 20-Apr-2020 1 703 1 595 3 700 Vancouver International Airport Authority 7.425 07-Dec-2026 5 157 5 070 3 059 Westcoast Energy Inc. 5.600 16-Jan-2019 3 376 3 167 2 767 Westcoast Energy Inc. 9.900 10-Jan-2020 4 019 3 152 1 473 Westcoast Energy Inc. 4.570 02-Jul-2020 1 564 1 550 1 000 Westcoast Energy Inc. 3.883 28-Oct-2021 1 020 1 048 2 975 Westcoast Energy Inc. 6.750 15-Dec-2027 3 831 3 716 7 200 Westcoast Energy Inc. 4.791 28-Oct-2041 7 907 7 976 2 855 Winnipeg Airport Authority Inc. 4.569 20-Nov-2019 3 169 2 974 1 740 Winnipeg Airport Authority Inc. 3.039 14-Apr-2023 1 737 1 774 4 695 Winnipeg Airport Authority Inc. 5.205 28-Sep-2040 5 615 5 605 6 717 Winnipeg Airport Authority Inc. 6.102 20-Nov-2040 7 541 8 667 3 945 Winnipeg Airport Authority Inc. 3.659 30-Sep-2047 3 945 4 188
1 890 462 1 892 046 22.4
SCHEDULE OF INVESTMENT PORTFOLIO (in $000s)
December 31, 2017
The accompanying notes are an integral part of the financial statements.
PHILLIPS, HAGER & NORTH TOTAL RETURN BOND FUND
Par Value Coupon Fair % of Net (000s) Security Rate % Maturity Cost Value Assets
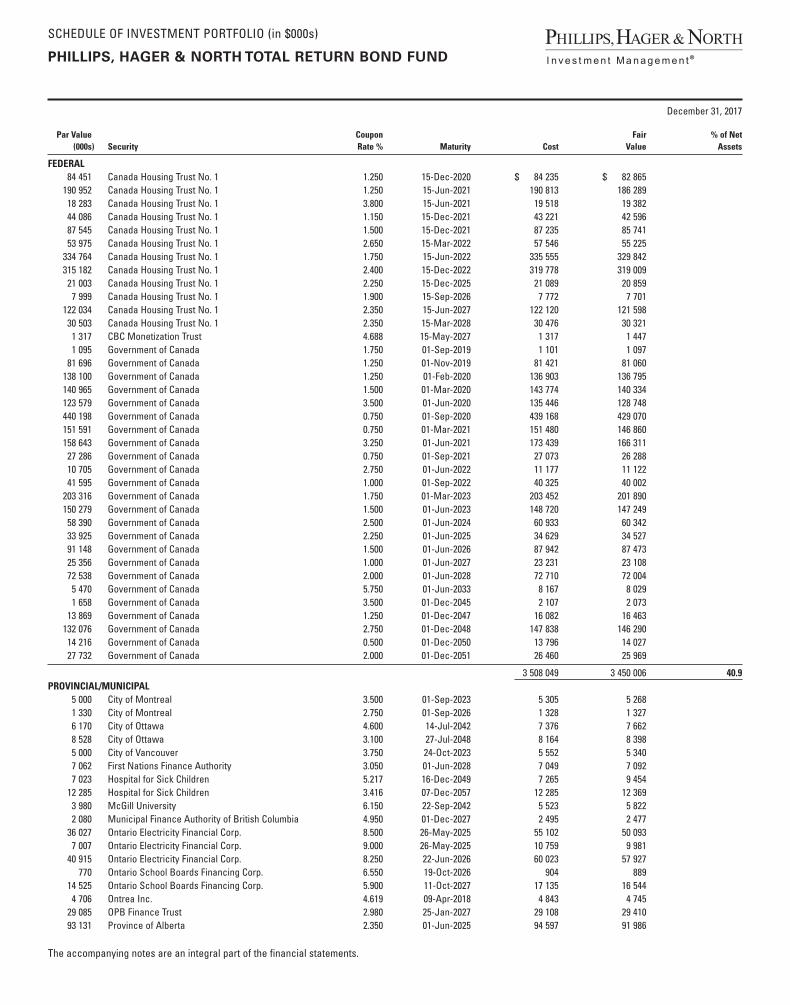
FEDERAL 84 451 Canada Housing Trust No. 1 1.250 15-Dec-2020 $ 84 235 $ 82 865 190 952 Canada Housing Trust No. 1 1.250 15-Jun-2021 190 813 186 289 18 283 Canada Housing Trust No. 1 3.800 15-Jun-2021 19 518 19 382 44 086 Canada Housing Trust No. 1 1.150 15-Dec-2021 43 221 42 596 87 545 Canada Housing Trust No. 1 1.500 15-Dec-2021 87 235 85 741 53 975 Canada Housing Trust No. 1 2.650 15-Mar-2022 57 546 55 225 334 764 Canada Housing Trust No. 1 1.750 15-Jun-2022 335 555 329 842 315 182 Canada Housing Trust No. 1 2.400 15-Dec-2022 319 778 319 009 21 003 Canada Housing Trust No. 1 2.250 15-Dec-2025 21 089 20 859 7 999 Canada Housing Trust No. 1 1.900 15-Sep-2026 7 772 7 701 122 034 Canada Housing Trust No. 1 2.350 15-Jun-2027 122 120 121 598 30 503 Canada Housing Trust No. 1 2.350 15-Mar-2028 30 476 30 321 1 317 CBC Monetization Trust 4.688 15-May-2027 1 317 1 447 1 095 Government of Canada 1.750 01-Sep-2019 1 101 1 097 81 696 Government of Canada 1.250 01-Nov-2019 81 421 81 060 138 100 Government of Canada 1.250 01-Feb-2020 136 903 136 795 140 965 Government of Canada 1.500 01-Mar-2020 143 774 140 334 123 579 Government of Canada 3.500 01-Jun-2020 135 446 128 748 440 198 Government of Canada 0.750 01-Sep-2020 439 168 429 070 151 591 Government of Canada 0.750 01-Mar-2021 151 480 146 860 158 643 Government of Canada 3.250 01-Jun-2021 173 439 166 311 27 286 Government of Canada 0.750 01-Sep-2021 27 073 26 288 10 705 Government of Canada 2.750 01-Jun-2022 11 177 11 122 41 595 Government of Canada 1.000 01-Sep-2022 40 325 40 002 203 316 Government of Canada 1.750 01-Mar-2023 203 452 201 890 150 279 Government of Canada 1.500 01-Jun-2023 148 720 147 249 58 390 Government of Canada 2.500 01-Jun-2024 60 933 60 342 33 925 Government of Canada 2.250 01-Jun-2025 34 629 34 527 91 148 Government of Canada 1.500 01-Jun-2026 87 942 87 473 25 356 Government of Canada 1.000 01-Jun-2027 23 231 23 108 72 538 Government of Canada 2.000 01-Jun-2028 72 710 72 004 5 470 Government of Canada 5.750 01-Jun-2033 8 167 8 029 1 658 Government of Canada 3.500 01-Dec-2045 2 107 2 073 13 869 Government of Canada 1.250 01-Dec-2047 16 082 16 463 132 076 Government of Canada 2.750 01-Dec-2048 147 838 146 290 14 216 Government of Canada 0.500 01-Dec-2050 13 796 14 027 27 732 Government of Canada 2.000 01-Dec-2051 26 460 25 969
3 508 049 3 450 006 40.9PROVINCIAL/MUNICIPAL 5 000 City of Montreal 3.500 01-Sep-2023 5 305 5 268 1 330 City of Montreal 2.750 01-Sep-2026 1 328 1 327 6 170 City of Ottawa 4.600 14-Jul-2042 7 376 7 662 8 528 City of Ottawa 3.100 27-Jul-2048 8 164 8 398 5 000 City of Vancouver 3.750 24-Oct-2023 5 552 5 340 7 062 First Nations Finance Authority 3.050 01-Jun-2028 7 049 7 092 7 023 Hospital for Sick Children 5.217 16-Dec-2049 7 265 9 454 12 285 Hospital for Sick Children 3.416 07-Dec-2057 12 285 12 369 3 980 McGill University 6.150 22-Sep-2042 5 523 5 822 2 080 Municipal Finance Authority of British Columbia 4.950 01-Dec-2027 2 495 2 477 36 027 Ontario Electricity Financial Corp. 8.500 26-May-2025 55 102 50 093 7 007 Ontario Electricity Financial Corp. 9.000 26-May-2025 10 759 9 981 40 915 Ontario Electricity Financial Corp. 8.250 22-Jun-2026 60 023 57 927 770 Ontario School Boards Financing Corp. 6.550 19-Oct-2026 904 889 14 525 Ontario School Boards Financing Corp. 5.900 11-Oct-2027 17 135 16 544 4 706 Ontrea Inc. 4.619 09-Apr-2018 4 843 4 745 29 085 OPB Finance Trust 2.980 25-Jan-2027 29 108 29 410 93 131 Province of Alberta 2.350 01-Jun-2025 94 597 91 986
SCHEDULE OF INVESTMENT PORTFOLIO (in $000s)
December 31, 2017
The accompanying notes are an integral part of the financial statements.
PHILLIPS, HAGER & NORTH TOTAL RETURN BOND FUND
Par Value Coupon Fair % of Net (000s) Security Rate % Maturity Cost Value Assets
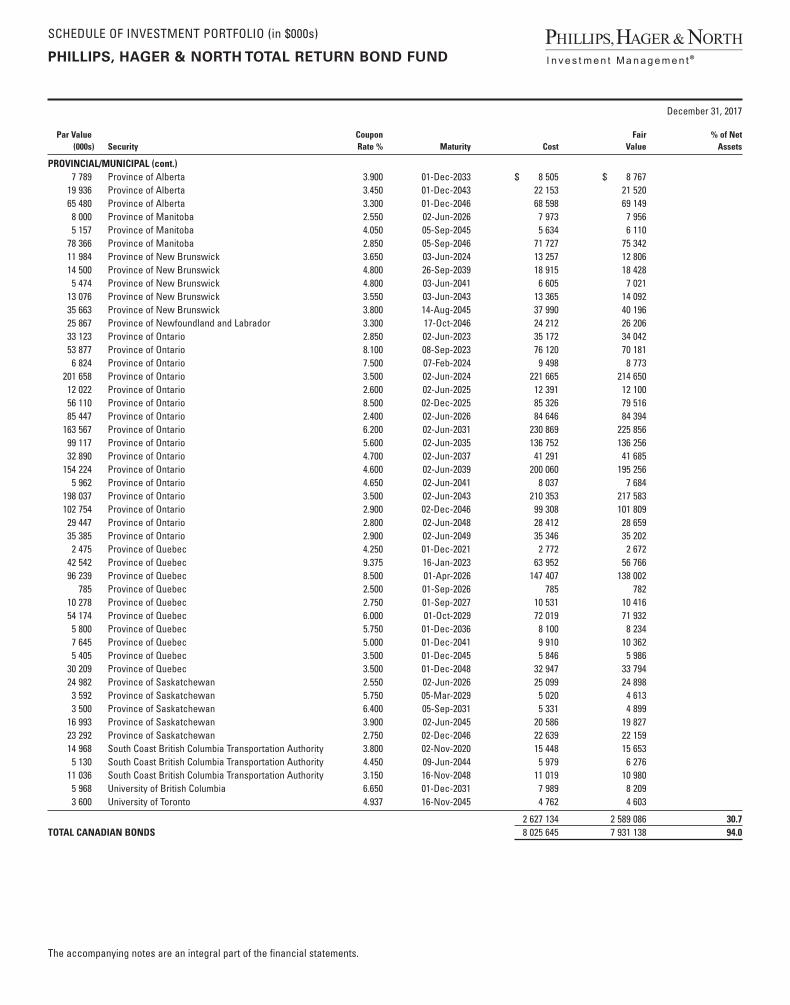
PROVINCIAL/MUNICIPAL (cont.) 7 789 Province of Alberta 3.900 01-Dec-2033 $ 8 505 $ 8 767 19 936 Province of Alberta 3.450 01-Dec-2043 22 153 21 520 65 480 Province of Alberta 3.300 01-Dec-2046 68 598 69 149 8 000 Province of Manitoba 2.550 02-Jun-2026 7 973 7 956 5 157 Province of Manitoba 4.050 05-Sep-2045 5 634 6 110 78 366 Province of Manitoba 2.850 05-Sep-2046 71 727 75 342 11 984 Province of New Brunswick 3.650 03-Jun-2024 13 257 12 806 14 500 Province of New Brunswick 4.800 26-Sep-2039 18 915 18 428 5 474 Province of New Brunswick 4.800 03-Jun-2041 6 605 7 021 13 076 Province of New Brunswick 3.550 03-Jun-2043 13 365 14 092 35 663 Province of New Brunswick 3.800 14-Aug-2045 37 990 40 196 25 867 Province of Newfoundland and Labrador 3.300 17-Oct-2046 24 212 26 206 33 123 Province of Ontario 2.850 02-Jun-2023 35 172 34 042 53 877 Province of Ontario 8.100 08-Sep-2023 76 120 70 181 6 824 Province of Ontario 7.500 07-Feb-2024 9 498 8 773 201 658 Province of Ontario 3.500 02-Jun-2024 221 665 214 650 12 022 Province of Ontario 2.600 02-Jun-2025 12 391 12 100 56 110 Province of Ontario 8.500 02-Dec-2025 85 326 79 516 85 447 Province of Ontario 2.400 02-Jun-2026 84 646 84 394 163 567 Province of Ontario 6.200 02-Jun-2031 230 869 225 856 99 117 Province of Ontario 5.600 02-Jun-2035 136 752 136 256 32 890 Province of Ontario 4.700 02-Jun-2037 41 291 41 685 154 224 Province of Ontario 4.600 02-Jun-2039 200 060 195 256 5 962 Province of Ontario 4.650 02-Jun-2041 8 037 7 684 198 037 Province of Ontario 3.500 02-Jun-2043 210 353 217 583 102 754 Province of Ontario 2.900 02-Dec-2046 99 308 101 809 29 447 Province of Ontario 2.800 02-Jun-2048 28 412 28 659 35 385 Province of Ontario 2.900 02-Jun-2049 35 346 35 202 2 475 Province of Quebec 4.250 01-Dec-2021 2 772 2 672 42 542 Province of Quebec 9.375 16-Jan-2023 63 952 56 766 96 239 Province of Quebec 8.500 01-Apr-2026 147 407 138 002 785 Province of Quebec 2.500 01-Sep-2026 785 782 10 278 Province of Quebec 2.750 01-Sep-2027 10 531 10 416 54 174 Province of Quebec 6.000 01-Oct-2029 72 019 71 932 5 800 Province of Quebec 5.750 01-Dec-2036 8 100 8 234 7 645 Province of Quebec 5.000 01-Dec-2041 9 910 10 362 5 405 Province of Quebec 3.500 01-Dec-2045 5 846 5 986 30 209 Province of Quebec 3.500 01-Dec-2048 32 947 33 794 24 982 Province of Saskatchewan 2.550 02-Jun-2026 25 099 24 898 3 592 Province of Saskatchewan 5.750 05-Mar-2029 5 020 4 613 3 500 Province of Saskatchewan 6.400 05-Sep-2031 5 331 4 899 16 993 Province of Saskatchewan 3.900 02-Jun-2045 20 586 19 827 23 292 Province of Saskatchewan 2.750 02-Dec-2046 22 639 22 159 14 968 South Coast British Columbia Transportation Authority 3.800 02-Nov-2020 15 448 15 653 5 130 South Coast British Columbia Transportation Authority 4.450 09-Jun-2044 5 979 6 276 11 036 South Coast British Columbia Transportation Authority 3.150 16-Nov-2048 11 019 10 980 5 968 University of British Columbia 6.650 01-Dec-2031 7 989 8 209 3 600 University of Toronto 4.937 16-Nov-2045 4 762 4 603
2 627 134 2 589 086 30.7TOTAL CANADIAN BONDS 8 025 645 7 931 138 94.0
SCHEDULE OF INVESTMENT PORTFOLIO (in $000s)
December 31, 2017
The accompanying notes are an integral part of the financial statements.
PHILLIPS, HAGER & NORTH TOTAL RETURN BOND FUND
Par Value Coupon Fair % of Net (000s) Security Rate % Maturity Cost Value Assets
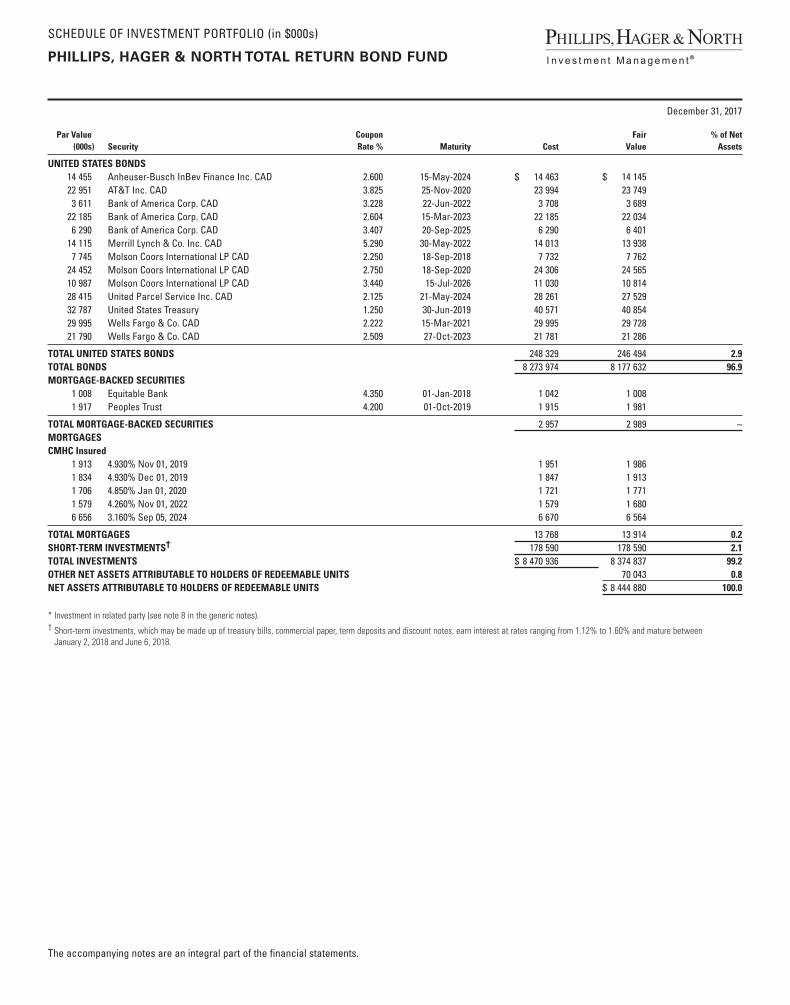
UNITED STATES BONDS 14 455 Anheuser-Busch InBev Finance Inc. CAD 2.600 15-May-2024 $ 14 463 $ 14 145 22 951 AT&T Inc. CAD 3.825 25-Nov-2020 23 994 23 749 3 611 Bank of America Corp. CAD 3.228 22-Jun-2022 3 708 3 689 22 185 Bank of America Corp. CAD 2.604 15-Mar-2023 22 185 22 034 6 290 Bank of America Corp. CAD 3.407 20-Sep-2025 6 290 6 401 14 115 Merrill Lynch & Co. Inc. CAD 5.290 30-May-2022 14 013 13 938 7 745 Molson Coors International LP CAD 2.250 18-Sep-2018 7 732 7 762 24 452 Molson Coors International LP CAD 2.750 18-Sep-2020 24 306 24 565 10 987 Molson Coors International LP CAD 3.440 15-Jul-2026 11 030 10 814 28 415 United Parcel Service Inc. CAD 2.125 21-May-2024 28 261 27 529 32 787 United States Treasury 1.250 30-Jun-2019 40 571 40 854 29 995 Wells Fargo & Co. CAD 2.222 15-Mar-2021 29 995 29 728 21 790 Wells Fargo & Co. CAD 2.509 27-Oct-2023 21 781 21 286
TOTAL UNITED STATES BONDS 248 329 246 494 2.9TOTAL BONDS 8 273 974 8 177 632 96.9MORTGAGE-BACKED SECURITIES 1 008 Equitable Bank 4.350 01-Jan-2018 1 042 1 008 1 917 Peoples Trust 4.200 01-Oct-2019 1 915 1 981
TOTAL MORTGAGE-BACKED SECURITIES 2 957 2 989 –MORTGAGES CMHC Insured 1 913 4.930% Nov 01, 2019 1 951 1 986 1 834 4.930% Dec 01, 2019 1 847 1 913 1 706 4.850% Jan 01, 2020 1 721 1 771 1 579 4.260% Nov 01, 2022 1 579 1 680 6 656 3.160% Sep 05, 2024 6 670 6 564
TOTAL MORTGAGES 13 768 13 914 0.2SHORT-TERM INVESTMENTS† 178 590 178 590 2.1TOTAL INVESTMENTS $ 8 470 936 8 374 837 99.2OTHER NET ASSETS ATTRIBUTABLE TO HOLDERS OF REDEEMABLE UNITS 70 043 0.8NET ASSETS ATTRIBUTABLE TO HOLDERS OF REDEEMABLE UNITS $ 8 444 880 100.0
* Investment in related party (see note 8 in the generic notes).† Short-term investments, which may be made up of treasury bills, commercial paper, term deposits and discount notes, earn interest at rates ranging from 1.12% to 1.60% and mature between
January 2, 2018 and June 6, 2018.

FINANCIAL STATEMENTS
The accompanying notes are an integral part of these financial statements.
PHILLIPS, HAGER & NORTH TOTAL RETURN BOND FUND
Statements of Financial Position (in $000s except per unit amounts)
(see note 2 in the generic notes)December 31
2017December 31
2016
ASSETSInvestments at fair value $ 8 374 837 $ 7 920 393Cash 10 814 9 422Due from investment dealers – 77Subscriptions receivable 9 619 6 931Futures contracts margin receivable 14 725 10 163Dividends receivable, interest accrued and other assets 37 841 41 633TOTAL ASSETS 8 447 836 7 988 619LIABILITIESRedemptions payable 1 920 4 839Distributions payable (1) –Accounts payable and accrued expenses 1 037 998TOTAL LIABILITIES EXCLUDING NET ASSETS ATTRIBUTABLE TO HOLDERS OF REDEEMABLE UNITS 2 956 5 837NET ASSETS ATTRIBUTABLE TO HOLDERS OF REDEEMABLE UNITS (“NAV”) $ 8 444 880 $ 7 982 782
Investments at cost $ 8 470 936 $ 8 032 076
NAV SERIES A $ 146 640 $ 169 245 ADVISOR SERIES $ 108 975 $ 111 224 SERIES H $ – $ – SERIES D $ 575 829 $ 583 467 SERIES F $ 921 153 $ 801 893 SERIES I $ – $ – SERIES O $ 6 692 283 $ 6 316 953NAV PER UNIT SERIES A $ 11.30 $ 11.34 ADVISOR SERIES $ 11.31 $ 11.35 SERIES H $ – $ – SERIES D $ 11.31 $ 11.34 SERIES F $ 11.32 $ 11.36 SERIES I $ – $ – SERIES O $ 11.25 $ 11.29
Statements of Comprehensive Income (in $000s except per unit amounts)
For the periods ended December 31 (see note 2 in the generic notes) 2017 2016
INCOME (see note 3 in the generic notes)Interest for distribution purposes $ 243 508 $ 252 192Net gain (loss) from futures contracts 4 817 (4 029)Other income received from underlying funds 1 328 10 345Capital gains received from underlying funds 42 594Net realized gain (loss) on investments (46 552) 79 538Net gain (loss) on foreign currencies and other net assets 120 879Change in unrealized gain (loss) on investments 15 584 (122 353)TOTAL INCOME (LOSS) 218 847 217 166EXPENSES (see notes – Fund Specific Information)Management fees 8 929 8 573Administration fees 2 104 2 022Independent Review Committee costs 3 2GST/HST 1 112 1 060TOTAL EXPENSES 12 148 11 657INCREASE (DECREASE) IN NAV $ 206 699 $ 205 509INCREASE (DECREASE) IN NAV SERIES A $ 2 711 $ 2 131 ADVISOR SERIES $ 1 817 $ 1 347 SERIES H $ – $ 944 SERIES D $ 12 413 $ 11 708 SERIES F $ 18 075 $ 5 914 SERIES I $ – $ 4 739 SERIES O $ 171 683 $ 178 726INCREASE (DECREASE) IN NAV PER UNIT SERIES A $ 0.19 $ 0.15 ADVISOR SERIES $ 0.18 $ 0.15 SERIES H $ – $ 0.48 SERIES D $ 0.24 $ 0.24 SERIES F $ 0.23 $ 0.11 SERIES I $ – $ 0.51 SERIES O $ 0.30 $ 0.32

FINANCIAL STATEMENTS
The accompanying notes are an integral part of these financial statements.
PHILLIPS, HAGER & NORTH TOTAL RETURN BOND FUND
Statements of Cash Flow (in $000s)
For the periods ended December 31 (see note 2 in the generic notes) 2017 2016
CASH FLOWS FROM OPERATING ACTIVITIESIncrease (decrease) in NAV $ 206 699 $ 205 509 ADJUSTMENTS TO RECONCILE NET CASH PROVIDED BY (USED IN) OPERATIONSInterest for distribution purposes (325) (535)Non-cash distributions from underlying funds (1 370) (10 939)Net realized loss (gain) on investments 46 552 (79 538)Change in unrealized loss (gain) on investments (15 584) 122 353 (Increase) decrease in accrued receivables 3 792 2 984 Increase (decrease) in accrued payables 39 72 (Increase) decrease in margin accounts (4 562) (10 140)Cost of investments purchased (12 613 209) (16 257 653)Proceeds from sale and maturity of investments 12 129 569 15 715 274 NET CASH PROVIDED BY (USED IN) OPERATING ACTIVITIES (248 399) (312 613)CASH FLOWS FROM FINANCING ACTIVITIESProceeds from issue of redeemable units 1 878 147 1 812 932 Cash paid on redemption of redeemable units (1 573 982) (1 415 848)Distributions paid to holders of redeemable units (54 374) (75 350)NET CASH PROVIDED BY (USED IN) FINANCING ACTIVITIES $ 249 791 $ 321 734 Net increase (decrease) in cash for the period 1 392 9 121 Cash (bank overdraft), beginning of period 9 422 301 CASH (BANK OVERDRAFT), END OF PERIOD $ 10 814 $ 9 422
Interest received (paid) $ 246 975 $ 254 641 Dividends received, net of withholding taxes $ – $ –

FINANCIAL STATEMENTS
The accompanying notes are an integral part of these financial statements.
PHILLIPS, HAGER & NORTH TOTAL RETURN BOND FUND
Statements of Changes in NAV (in $000s)
For the periods ended December 31 (see note 2 in the generic notes)
Series A Advisor Series Series H Series D2017 2016 2017 2016 2017 2016 2017 2016
NAV AT BEGINNING OF PERIOD $ 169 245 $ 153 976 $ 111 224 $ 94 165 $ – $ 23 200 $ 583 467 $ 543 855INCREASE (DECREASE) IN NAV 2 711 2 131 1 817 1 347 – 944 12 413 11 708Early redemption fees – – – – – – 2 –Proceeds from redeemable units issued 25 557 52 789 34 952 45 253 – 2 567 61 765 126 051Reinvestments of distributions to holders of redeemable units 2 859 4 873 1 880 2 843 – 221 12 815 19 831Redemption of redeemable units (50 565) (39 113) (38 647) (28 856) – (26 676) (80 364) (95 964)NET INCREASE (DECREASE) FROM REDEEMABLE UNIT TRANSACTIONS (22 149) 18 549 (1 815) 19 240 – (23 888) (5 782) 49 918Distributions from net income (3 167) (3 332) (2 251) (2 162) – (256) (14 269) (14 879)Distributions from net gains – (2 079) – (1 366) – – – (7 135)Distributions from capital – – – – – – – –TOTAL DISTRIBUTIONS TO HOLDERS OF REDEEMABLE UNITS (3 167) (5 411) (2 251) (3 528) – (256) (14 269) (22 014)NET INCREASE (DECREASE) IN NAV (22 605) 15 269 (2 249) 17 059 – (23 200) (7 638) 39 612NAV AT END OF PERIOD $ 146 640 $ 169 245 $ 108 975 $ 111 224 $ – $ – $ 575 829 $ 583 467
For the periods ended December 31 (see note 2 in the generic notes)
Series F Series I Series O Total2017 2016 2017 2016 2017 2016 2017 2016
NAV AT BEGINNING OF PERIOD $ 801 893 $ 462 345 $ – $ 82 908 $ 6 316 953 $ 6 103 380 $ 7 982 782 $ 7 463 829INCREASE (DECREASE) IN NAV 18 075 5 914 – 4 739 171 683 178 726 206 699 205 509Early redemption fees 11 (4) – – – – 13 (4)Proceeds from redeemable units issued 418 075 486 791 – 46 081 1 362 688 1 048 155 1 903 037 1 807 687Reinvestments of distributions to holders of redeemable units 13 826 15 860 – 1 270 151 560 226 750 182 940 271 648Redemption of redeemable units (307 907) (142 088) – (133 393) (1 115 795) (952 799) (1 593 278) (1 418 889)NET INCREASE (DECREASE) FROM REDEEMABLE UNIT TRANSACTIONS 124 005 360 559 – (86 042) 398 453 322 106 492 712 660 442Distributions from net income (22 820) (17 104) – (1 605) (194 806) (207 313) (237 313) (246 651)Distributions from net gains – (9 821) – – – (79 946) – (100 347)Distributions from capital – – – – – – – –TOTAL DISTRIBUTIONS TO HOLDERS OF REDEEMABLE UNITS (22 820) (26 925) – (1 605) (194 806) (287 259) (237 313) (346 998)NET INCREASE (DECREASE) IN NAV 119 260 339 548 – (82 908) 375 330 213 573 462 098 518 953NAV AT END OF PERIOD $ 921 153 $ 801 893 $ – $ – $ 6 692 283 $ 6 316 953 $ 8 444 880 $ 7 982 782
NOTES TO FINANCIAL STATEMENTS – FUND SPECIFIC INFORMATION
Please see the generic notes at the back of the financial statements.
December 31, 2017
PHILLIPS, HAGER & NORTH TOTAL RETURN BOND FUND
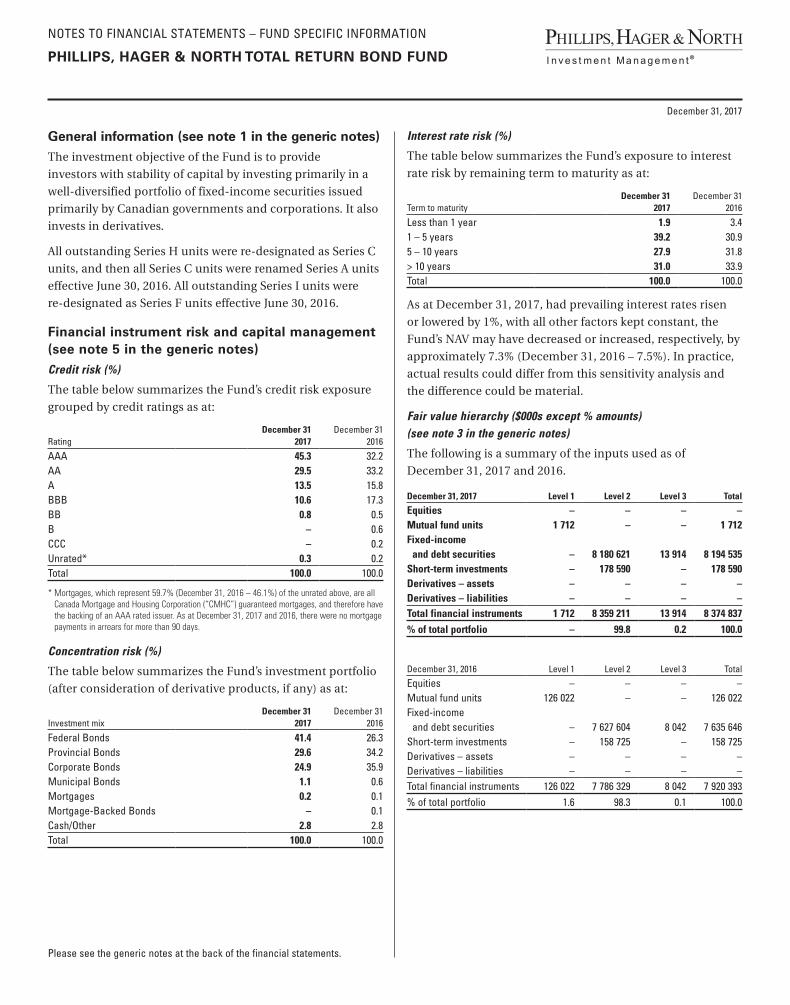
General information (see note 1 in the generic notes)
The investment objective of the Fund is to provide
investors with stability of capital by investing primarily in a
well-diversified portfolio of fixed-income securities issued
primarily by Canadian governments and corporations. It also
invests in derivatives.
All outstanding Series H units were re-designated as Series C
units, and then all Series C units were renamed Series A units
effective June 30, 2016. All outstanding Series I units were
re-designated as Series F units effective June 30, 2016.
Financial instrument risk and capital management (see note 5 in the generic notes)
Credit risk (%)
The table below summarizes the Fund’s credit risk exposure
grouped by credit ratings as at:
RatingDecember 31
2017December 31
2016
AAA 45.3 32.2AA 29.5 33.2A 13.5 15.8BBB 10.6 17.3BB 0.8 0.5B – 0.6CCC – 0.2Unrated* 0.3 0.2Total 100.0 100.0
* Mortgages, which represent 59.7% (December 31, 2016 – 46.1%) of the unrated above, are all Canada Mortgage and Housing Corporation (“CMHC”) guaranteed mortgages, and therefore have the backing of an AAA rated issuer. As at December 31, 2017 and 2016, there were no mortgage payments in arrears for more than 90 days.
Concentration risk (%)
The table below summarizes the Fund’s investment portfolio
(after consideration of derivative products, if any) as at:
Investment mixDecember 31
2017December 31
2016
Federal Bonds 41.4 26.3Provincial Bonds 29.6 34.2Corporate Bonds 24.9 35.9Municipal Bonds 1.1 0.6Mortgages 0.2 0.1Mortgage-Backed Bonds – 0.1Cash/Other 2.8 2.8Total 100.0 100.0
Interest rate risk (%)
The table below summarizes the Fund’s exposure to interest
rate risk by remaining term to maturity as at:
Term to maturityDecember 31
2017December 31
2016
Less than 1 year 1.9 3.41 – 5 years 39.2 30.95 – 10 years 27.9 31.8> 10 years 31.0 33.9Total 100.0 100.0
As at December 31, 2017, had prevailing interest rates risen
or lowered by 1%, with all other factors kept constant, the
Fund’s NAV may have decreased or increased, respectively, by
approximately 7.3% (December 31, 2016 – 7.5%). In practice,
actual results could differ from this sensitivity analysis and
the difference could be material.
Fair value hierarchy ($000s except % amounts) (see note 3 in the generic notes)
The following is a summary of the inputs used as of
December 31, 2017 and 2016.
December 31, 2017 Level 1 Level 2 Level 3 Total
Equities – – – –Mutual fund units 1 712 – – 1 712Fixed-income and debt securities – 8 180 621 13 914 8 194 535Short-term investments – 178 590 – 178 590Derivatives – assets – – – –Derivatives – liabilities – – – –Total financial instruments 1 712 8 359 211 13 914 8 374 837% of total portfolio – 99.8 0.2 100.0
December 31, 2016 Level 1 Level 2 Level 3 Total
Equities – – – –Mutual fund units 126 022 – – 126 022Fixed-income and debt securities – 7 627 604 8 042 7 635 646Short-term investments – 158 725 – 158 725Derivatives – assets – – – –Derivatives – liabilities – – – –Total financial instruments 126 022 7 786 329 8 042 7 920 393% of total portfolio 1.6 98.3 0.1 100.0

NOTES TO FINANCIAL STATEMENTS – FUND SPECIFIC INFORMATION
Please see the generic notes at the back of the financial statements.
December 31, 2017
PHILLIPS, HAGER & NORTH TOTAL RETURN BOND FUND
During the periods ended December 31, 2017 and 2016, the
reconciliation of financial instruments measured at fair value
using unobservable inputs (Level 3) is presented as follows:
December 31 2017
December 31 2016
Balance at beginning of period 8 042 –Net purchases 6 696 4 Net sales (436) (395)Net transfers in – 8 721 Net transfers out – – Realized gains (losses) (6) (5)Unrealized gains (losses) (382) (283)Balance at end of period 13 914 8 042
During the year ended December 31, 2016, investments in
mortgages of $8,721 were transferred into Level 3 from Level 2
following management’s assessment of the significance of
the unobservable inputs used to value those investments.
The Level 3 assets are mortgages which are valued by a
third-party vendor using industry-accepted methodologies
which include unobservable inputs. Mortgages are valued by
discounting future cash flows using a discount rate equal to
the risk-free rate plus an appropriate risk spread premium.
The spread premium is derived by the vendor from their
risk rating program and a monthly spread matrix. This
quantitative rules-based approach reviews seven risk factors
to assess the market risk, credit risk and liquidity premiums
to arrive at a total credit score for each mortgage. Among the
inputs are the borrowers’ financial statements, rent roll and
operating statements, the most recent property inspection
report and the terms of the mortgage itself.
As at December 31, 2017, a 10% increase or decrease
in the weighted average spread premium of 1.19%
(December 31, 2016 – 1.07%), an unobservable input, would
have increased or decreased the Fund’s NAV respectively by
approximately 0.0% (December 31, 2016 – 0.0%).
Management fees and operating expenses (see note 8 in the generic notes)
Management fees and administration fees of each series
of the Fund are payable to RBC GAM and calculated at the
following annual percentages, before GST/HST, of the daily
NAV of each series of the Fund.
Management fees* Operating expenses
Series A 0.90% 0.05%Advisor Series 0.90% 0.05%Series H 0.90% 0.05%Series D 0.50% 0.04%Series F 0.40% 0.05%Series I 0.40% 0.05%Series O n/a† 0.02%
* Effective June 30, 2016, the management fees for Series A and Advisor Series units were reduced to 0.90% from 1.00%; and for Series F units were reduced to 0.40% from 0.50%.
† Series O unitholders pay a negotiated management fee directly to RBC GAM for investment-counselling services
Investments by related parties ($000s except unit amounts)
Royal Bank of Canada, or one of its subsidiaries, held the
following investments in the Fund as at:
December 31 2017
December 31 2016
Units held Series A 55 54 Advisor Series 110 108 Series D 57 56 Series F 57 56Value of all units 3 3
Unconsolidated structured entities (%) (see note 3 in the generic notes)
The table below summarizes the Fund’s interest in the
sponsored funds as a percentage of NAV, and the Fund’s
ownership interest as a percentage of NAV of the sponsored
funds (“Ownership”). All sponsored funds are established and
conduct business in Canada.
December 31 2017
December 31 2016
NAV Ownership NAV Ownership
Phillips, Hager & North High Yield Bond Fund – – 1.0 1.9RBC High Yield Bond Fund – – 0.6 2.3
Taxes ($000s) (see note 6 in the generic notes)
The non-capital and capital losses as at December 31, 2017
for the Fund were approximately:
Capital losses 30 680Non-capital losses –

NOTES TO FINANCIAL STATEMENTS – FUND SPECIFIC INFORMATION
Please see the generic notes at the back of the financial statements.
December 31, 2017
PHILLIPS, HAGER & NORTH TOTAL RETURN BOND FUND
Redeemable units (000s)
There is no limitation on the number of units available for
issue. Units are purchased and redeemed at the NAV per unit.
For the periods ended December 31 (see note 2 in the generic notes) 2017 2016
Series AOpening units 14 922 13 367Issued number of units 2 242 4 473Reinvested number of units 252 423Redeemed number of units (4 442) (3 341)Ending number of units 12 974 14 922
Advisor SeriesOpening units 9 796 8 167Issued number of units 3 061 3 853Reinvested number of units 166 247Redeemed number of units (3 392) (2 471)Ending number of units 9 631 9 796
Series H Opening units – 2 009Issued number of units – 220Reinvested number of units – 19Redeemed number of units – (2 248)Ending number of units – –
Series D Opening units 51 440 47 207Issued number of units 5 422 10 716Reinvested number of units 1 131 1 719Redeemed number of units (7 064) (8 202)Ending number of units 50 929 51 440
Series F Opening units 70 615 40 085Issued number of units 36 582 41 301Reinvested number of units 1 219 1 377Redeemed number of units (27 041) (12 148)Ending number of units 81 375 70 615
Series I Opening units – 7 176Issued number of units – 3 957Reinvested number of units – 108Redeemed number of units – (11 241)Ending number of units – –
Series O Opening units 559 740 532 024Issued number of units 120 282 90 068Reinvested number of units 13 449 19 721Redeemed number of units (98 484) (82 073)Ending number of units 594 987 559 740
Investments by other related investment funds (%) (see note 8 in the generic notes)
The table below summarizes, as a percentage, the NAV of the
Fund owned by other related investment funds as at:
December 31 2017
December 31 2016
RBC Balanced Growth & Income Class 0.3 0.2RBC Balanced Growth & Income Fund 2.4 1.6RBC Conservative Growth & Income Fund 0.5 0.3RBC Monthly Income Bond Fund 2.9 3.1RBC Retirement 2020 Portfolio – –RBC Retirement 2025 Portfolio – –RBC Retirement 2030 Portfolio – –RBC Retirement 2035 Portfolio – –RBC Retirement 2040 Portfolio – –RBC Retirement 2045 Portfolio – –RBC Retirement 2050 Portfolio – –RBC Retirement Income Solution – –RBC Select Balanced Portfolio 2.4 9.0RBC Select Choices Balanced Portfolio 0.5 0.5RBC Select Choices Conservative Portfolio 0.3 0.3RBC Select Choices Growth Portfolio 0.2 0.1RBC Select Conservative Portfolio 28.3 24.1RBC Select Growth Portfolio 1.0 1.8RBC Select Very Conservative Portfolio 15.0 13.3RBC Target 2020 Education Fund 0.3 0.5RBC Target 2025 Education Fund 1.4 0.9RBC Target 2030 Education Fund 0.4 –Total 55.9 55.7

GENERIC NOTES TO FINANCIAL STATEMENTS
December 31, 2017
(also see Fund Specific Information)
1. The Funds
The Funds (“Fund” or “Funds”) are open-ended mutual
fund trusts governed by the laws of the Province of Ontario
or British Columbia. RBC GAM is the manager and portfolio
manager of the Funds and its head office is located at
155 Wellington Street West, 22nd Floor, Toronto, Ontario.
RBC GAM is also the trustee of those Funds governed by the
laws of the Province of Ontario. These financial statements
were approved for issuance by the Board of Directors of
RBC GAM on March 8, 2018.
The Funds may issue an unlimited number of units in some
or all of Series A, Advisor Series, Advisor T5 Series, Series T5,
Series T8, Series H, Series D, Series DZ, Series F, Series FT5,
Series FT8, Series I and Series O.
Series A units have no sales charges and are available to all
investors through authorized dealers.
Advisor Series units and Advisor T5 Series units are available
to all investors through authorized dealers with an initial
sales charge or low-load sales charge option. For certain of
the Funds, Advisor Series units and Advisor T5 Series units are
available with a deferred sales charge option. Under the initial
sales charge option, investors pay a sales charge ranging from
0% to 5% of the amount invested. Under the deferred sales
charge or low-load sales charge option, sales charges may be
applicable, as described in the Simplified Prospectus.
Series T5 units and Series T8 units have no sales charges and
are available to all investors through authorized dealers.
Series H units have no sales charges, have lower fees than
Series A units and are only available to investors who invest
and maintain the required minimum balance through
authorized dealers.
Series D units and Series DZ units have no sales charges
and have lower fees than Series A units. Series D units and
Series DZ units may be available to investors who have
accounts with RBC Direct Investing Inc., Phillips, Hager &
North Investment Funds Ltd. (“PH&N IF”) or certain other
authorized dealers (primarily discount brokers).
Series F units, Series FT5 units and Series FT8 units have no
sales charges and have lower fees than Series A units. Series F
units, Series FT5 units and Series FT8 units are only available
to investors who have fee-based accounts with their dealer.
Series I units have no sales charges, have lower fees than
Series F units, Series FT5 units and Series FT8 units and
are only available to investors who invest and maintain
the required minimum balance and who have accounts
with dealers who have signed a fee-based agreement with
RBC GAM.
Series O units are only available to large private or
institutional investors or dealers. No management fees
are payable by the Funds in respect to Series O units.
Unitholders pay a negotiated fee directly to RBC GAM for
investment-counselling services.
2. Financial year/period
The information provided in these financial statements
and notes thereto is for the 12-month periods ended or as
at December 31, 2017 and 2016, as applicable. In the year a
Fund or series is established, “period” represents the period
from inception to December 31 of that fiscal year.
3. Summary of significant accounting policies
These financial statements have been prepared in
compliance with International Financial Reporting Standards
(“IFRS”). The significant accounting policies of the Funds,
which are investment entities, are as follows:
Classification of Financial Assets and Liabilities The
Funds’ financial assets and financial liabilities, other than
derivatives, are designated at fair value through profit or
loss at inception, as those financial assets and liabilities are
managed together and their performance evaluated on a
fair value basis in accordance with the Funds’ documented
investment strategy. Derivatives are classified as held
for trading and measured at fair value through profit or
loss. Redemption units are measured at their respective
redemption values. All other assets and liabilities are
measured at amortized cost. Realized gains arising on
derivatives during a period are included in the Statements
of Comprehensive Income in “Net gain (loss) from futures
contracts,” “Other derivatives” and “Net gain (loss) on foreign
currencies and other net assets,” where applicable.
Classification of Redeemable Units The Funds have multiple
features across the different series of the Funds. Consequently,
the Funds’ outstanding redeemable units are classified as
financial liabilities in accordance with the requirements of
IAS 32 Financial Instruments: Presentation.

GENERIC NOTES TO FINANCIAL STATEMENTS
December 31, 2017
(also see Fund Specific Information)
Unconsolidated Structured Entities The Funds may invest in
other Funds and exchange-traded funds (“ETFs”) managed
by the manager or an affiliate of the manager (“sponsored
funds”) and may invest in other funds and ETFs managed
by unaffiliated entities (“unsponsored funds”); collectively,
“underlying funds.” The underlying funds are determined to
be unconsolidated structured entities, as decision making
in the underlying fund is not governed by the voting rights
or other similar rights held by the Fund. The investments
in underlying funds are subject to the terms and conditions
of the offering documents of the respective underlying
funds and are susceptible to market price risk arising from
uncertainties about future values of those underlying funds.
The underlying funds’ objectives are generally to achieve
long-term capital appreciation and/or current income by
investing in a portfolio of securities and other funds in line
with each of their documented investment strategies. The
underlying funds apply various investment strategies to
accomplish their respective investment objectives.
The underlying funds finance their operations by issuing
redeemable units which are puttable at the unitholder’s
option, and entitle the unitholder to a proportional stake in
the respective underlying funds’ NAV.
The Funds do not consolidate their investment in underlying
funds but account for these investments at fair value. The
manager has determined that the Funds are investment
entities in accordance with IFRS 10 Consolidated Financial
Statements, since the Funds meet the following criteria:
(i) The Funds obtain capital from one or more investors for
the purpose of providing those investors with investment
management services,
(ii) The Funds commit to their investors that their business
purpose is to invest funds solely for the returns from
capital appreciation, investment income or both, and
(iii) The Funds measure and evaluate the performance of
substantially all of their investments on a fair value basis.
Therefore, the fair value of investments in the underlying
funds is included in the Schedule of Investment Portfolio
and included in “Investments at fair value” in the Funds’
Statements of Financial Position. The change in fair value
of the investment held in the underlying funds is included
in “Change in unrealized gain (loss) on investments” in the
Statements of Comprehensive Income.
Certain Funds may invest in mortgage-related or other
asset-backed securities. These securities include commercial
mortgage-backed securities, asset-backed securities,
collateralized debt obligations and other securities that
directly or indirectly represent a participation in, or are
securitized by and payable from, mortgage loans on real
property. Mortgage-related securities are created from
pools of residential or commercial mortgage loans while
asset-backed securities are created from many types of
assets, including auto loans, credit card receivables, home
equity loans and student loans. The Funds account for these
investments at fair value. The fair value of such securities, as
disclosed in the Schedule of Investment Portfolio, represents
the maximum exposure to losses at that date.
Determination of Fair Value The fair value of a financial
instrument is the amount at which the financial instrument
could be exchanged in an arm’s-length transaction between
knowledgeable and willing parties under no compulsion to
act. In determining fair value, a three-tier hierarchy based on
inputs is used to value the Funds’ financial instruments.
The hierarchy of inputs is summarized below:
Level 1 – quoted prices (unadjusted) in active markets for
identical assets or liabilities;
Level 2 – inputs other than quoted prices included in
Level 1 that are observable for the asset or liability, either
directly (i.e., as prices) or indirectly (i.e., derived from prices),
including broker quotes, vendor prices and vendor fair value
factors; and
Level 3 – inputs for the asset or liability that are not based on
observable market data (unobservable inputs).
Changes in valuation methods may result in transfers into or
out of an investment’s assigned level.
The three-tier hierarchy of investments and derivatives is
included in “Notes to Financial Statements – Fund Specific
Information.”
Investments and derivatives are recorded at fair value, which
is determined as follows:
Equities – Common shares, preferred shares and exchange-
traded funds are valued at the closing price recorded by the
security exchange on which the security is principally traded. In
circumstances where the closing price is not within the bid-ask
spread, management will determine the points within the
bid-ask spread that are most representative of the fair value.

GENERIC NOTES TO FINANCIAL STATEMENTS
December 31, 2017
(also see Fund Specific Information)
Fixed-Income and Debt Securities – Bonds, mortgage-backed
securities, loans and debentures are valued at the closing
price quoted by major dealers or independent pricing vendors
in such securities.
NHA-approved mortgages are valued at an amount, which produces a yield equivalent to the prevailing rate of return on mortgages of similar type and term.
Short-Term Investments – Short-term investments are valued at fair value, which is approximated at cost plus accrued interest.
Options – Listed options are valued at the closing price on the recognized exchange on which the option is traded. In circumstances where the closing price is not within the bid-ask spread, management will determine the points within the bid-ask spread that are most representative of the fair value.
The premium received for written options is recorded as a liability in the Schedule of Investment Portfolio and adjusted daily to the fair value of the written option.
Warrants – Warrants are valued using a recognized option pricing model, which includes factors such as the terms of the warrant, time value of money and volatility inputs that are significant to such valuation.
Forward Contracts – Forward contracts are valued at the gain or loss that would arise as a result of closing the position at the valuation date. Any unrealized gain or loss at the close of business on each valuation date is recorded as “Change in unrealized gain (loss) on investments” in the Statements of Comprehensive Income. The receivable/payable on forward contracts is recorded separately in the Statements of Financial Position. Realized gain (loss) on foreign exchange contracts is included in “Net gain (loss) on foreign currencies and other net assets” in the Statements of Comprehensive Income.
Total Return Swaps – A total return swap is an agreement by which one party makes payments based on a set rate, either fixed or variable, while the other party makes payments based on the return of an underlying asset, which includes both the income it generates and any capital gains. Total return swap contracts are marked to market daily based upon quotations from the market makers and the change in value, if any, is recorded in “Change in unrealized gain (loss) on investments” in the Statements of Comprehensive Income. When the swap contract is terminated early, the Fund records a realized gain or loss equal to the difference between the current net present value and the executed net present value in “Other
derivatives” in the Statements of Comprehensive Income. Unrealized gains and losses are recorded as “Receivable on open swap contracts” or “Payable on open swap contracts” in the Statements of Financial Position. The risks of total return swap contracts include changes in market conditions and the possible inability of the counterparty to fulfill its obligations under the agreement.
Futures Contracts – Futures contracts entered into by the
Funds are financial agreements to purchase or sell a financial
instrument at a contracted price on a specified future date.
However, the Funds do not intend to purchase or sell the
financial instrument on the settlement date; rather, they
intend to close out each futures contract before settlement
by entering into equal, but offsetting, futures contracts.
Futures contracts are valued at the gain or loss that would
arise as a result of closing the position at the valuation date.
Any gain or loss at the close of business on each valuation
date is recorded as “Net gain (loss) from futures contracts” in
the Statements of Comprehensive Income. The receivable/
payable on futures contracts is recorded separately in the
Statements of Financial Position.
Mutual Fund Unit Valuation – Units of Funds are valued at their
respective NAV per unit from fund companies on the relevant
valuation dates.
Fair Valuation of Investments – The Funds have procedures
to determine the fair value of securities and other financial
instruments for which market prices are not readily available
or which may not be reliably priced. Under these fair valuation
procedures, the Funds primarily employ a market-based
approach, which may use related or comparable assets or
liabilities, NAV per unit (for exchange-traded funds), recent
transactions, market multiples, book values and other relevant
information for the investment to determine its fair value.
Management also has procedures in place to determine the
fair value of foreign securities traded in countries outside
of North America daily to avoid stale prices and to take into
account, among other things, any significant events occurring
after the close of a foreign market.
The Funds may also use an income-based valuation
approach in which the anticipated future cash flows of the
investment are discounted to calculate fair value. Discounts
may also be applied due to the nature or duration of any
restrictions on the disposition of the investments, but only

GENERIC NOTES TO FINANCIAL STATEMENTS
December 31, 2017
(also see Fund Specific Information)
if they arise as a feature of the instrument itself. Due to the
inherent uncertainty of valuations of such investments, the
fair values may differ significantly from the values that would
have been used had an active market existed.
All security valuation techniques are periodically reviewed
by the Valuation Committee (“VC”) of the manager and are
approved by the manager. The VC provides oversight of the
Funds’ valuation policies and procedures.
Cash Cash is comprised of cash and deposits with banks
and is recorded at fair value. The carrying amount of cash
approximates its fair value because it is short-term in nature.
Foreign Exchange The value of investments and other
assets and liabilities in foreign currencies is translated into
Canadian dollars (U.S. dollars in the case of the Phillips,
Hager & North $U.S. Money Market Fund, RBC $U.S. Money
Market Fund, RBC Premium $U.S. Money Market Fund,
RBC $U.S. Investment Grade Corporate Bond Fund,
RBC $U.S. High Yield Bond Fund, BlueBay Emerging Markets
Corporate Bond Fund, BlueBay $U.S. Global Convertible
Bond Fund (Canada) and RBC U.S. Monthly Income Fund) at
the rate of exchange on each valuation date. Purchases and
sales of investments, income and expenses are translated
at the rate of exchange prevailing on the respective dates of
such transactions. Realized foreign exchange gains/losses are
included in “Net gain (loss) on foreign currencies and other
net assets” in the Statements of Comprehensive Income.
Functional Currency The Funds, with the exceptions below,
have their subscriptions, redemptions and performance
denominated in Canadian dollars and, consequently, the
Canadian dollar is the functional currency for the Funds.
Phillips, Hager & North $U.S. Money Market Fund,
RBC $U.S. Money Market Fund, RBC Premium $U.S. Money
Market Fund, RBC $U.S. Investment Grade Corporate Bond
Fund, RBC $U.S. High Yield Bond Fund, BlueBay Emerging
Markets Corporate Bond Fund, BlueBay $U.S. Global
Convertible Bond Fund (Canada) and RBC U.S. Monthly
Income Fund have their subscriptions, redemptions and
performance denominated in U.S. dollars and, consequently,
the U.S. dollar is the functional currency for these Funds.
Valuation of Series A different NAV is calculated for each
series of units of a Fund. The NAV of a particular series of
units is computed by calculating the value of the series’
proportionate share of the assets and liabilities of the Fund
common to all series less the liabilities of the Fund attributable
only to that series. Expenses directly attributable to a series
are charged to that series. Other expenses are allocated
proportionately to each series based upon the relative NAV of
each series. Expenses are accrued daily.
Investment Transactions Investment transactions are
accounted for as of the trade date. Transaction costs, such as
brokerage commissions, incurred by the Funds are recorded
in the Statements of Comprehensive Income for the period.
The unrealized gain and loss on investments is the difference
between fair value and average cost for the period. The basis
of determining the cost of portfolio assets, and realized
and unrealized gains and losses on investments, is average
cost which does not include amortization of premiums or
discounts on fixed-income and debt securities with the
exception of zero coupon bonds.
Income Recognition Dividend income is recognized on
the ex-dividend date and interest for distribution purposes
is coupon interest recognized on an accrual basis and/or
imputed interest on zero coupon bonds. “Other income (loss)”
includes income from income trusts. Distributions received
from income trusts are recognized based on the nature of the
underlying components, such as income, capital gains and
return of capital. “Other income received from underlying
funds” includes income earned by a Fund from investments in
underlying funds. Any premiums paid or discounts received on
the purchase of zero coupon bonds are amortized.
Increase (Decrease) in NAV per Unit Increase (decrease) in
NAV per unit in the Statements of Comprehensive Income
represents the increase (decrease) in net assets attributable to
holders of redeemable units by series, divided by the average
units outstanding per series during the period.
Early Redemption Fees Early redemption fees (short-term
trading fees) are paid directly to a Fund and are designed
to deter excessive trading and its associated costs. With the
exception of money market funds, a Fund may apply a fee
of 2% of the current value of units if the unitholder redeems
or switches out units within seven days of purchasing
or previously switching into a Fund. These amounts are
included in the Statements of Changes in NAV.

GENERIC NOTES TO FINANCIAL STATEMENTS
December 31, 2017
(also see Fund Specific Information)
Foreign Currencies The following is a list of abbreviations
used in the Schedule of Investment Portfolio:
ARS – Argentinian peso KRW – South Korean wonAUD – Australian dollar MXN – Mexican pesoBRL – Brazilian real MYR – Malaysian ringgitCAD – Canadian dollar NOK – Norwegian kroneCHF – Swiss franc NZD – New Zealand dollarCLP – Chilean peso PEN – Peruvian nuevo solCNY – Chinese renminbi PHP – Philippine pesoCOP – Colombian peso PLN – Polish zlotyCZK – Czech koruna RON – Romanian leuDKK – Danish krone RUB – Russian rubleEUR – Euro SEK – Swedish kronaGBP – Pound sterling SGD – Singapore dollarHKD – Hong Kong dollar THB – Thailand bahtHUF – Hungarian forint TRY – Turkish new liraIDR – Indonesian rupiah TWD – New Taiwan dollarILS – Israeli new shekel USD – United States dollarINR – Indian rupee ZAR – South African randJPY – Japanese yen
4. Critical accounting judgments and estimates
The preparation of financial statements requires the use
of judgment in applying the Funds’ accounting policies
and making estimates and assumptions about the future.
The following discusses the most significant accounting
judgments and estimates that management has made in
preparing the financial statements.
Classification and measurement of financial instruments and application of fair value option
In classifying and measuring financial instruments held
by the Funds, the manager is required to make significant
judgments about whether or not the business of the Funds is
to invest on a total return basis for the purpose of applying
the fair value option for financial assets.
Fair value measurement of securities not quoted in an active market
The Funds have established policies and control procedures
that are intended to ensure these estimates are well
controlled, independently reviewed and consistently applied
from period to period. The estimates of the value of the
Funds’ assets and liabilities are believed to be appropriate as
at the reporting date.
The Funds may hold financial instruments that are not quoted
in active markets. Note 3 discusses the policies used by
management for the estimates used in determining fair value.
5. Financial instrument risk and capital management
RBC GAM is responsible for managing each Fund’s
capital, which is its NAV and consists primarily of
its financial instruments.
A Fund’s investment activities expose it to a variety of
financial risks. RBC GAM seeks to minimize potential adverse
effects of these risks on a Fund’s performance by employing
professional, experienced portfolio managers, daily monitoring
of the Fund’s holdings and market events, diversifying its
investment portfolio within the constraints of its investment
objectives and, in some cases, periodically hedging certain risk
exposures through the use of derivatives. To assist in managing
risks, RBC GAM also uses internal guidelines, maintains a
governance structure that oversees each Fund’s investment
activities and monitors compliance with the Fund’s investment
strategies, internal guidelines and securities regulations.
Financial instrument risk, as applicable to a Fund, is disclosed in
its “Notes to Financial Statements – Fund Specific Information.”
These risks include a Fund’s direct risks and pro rata exposure to
the risks of underlying funds, as applicable.
Liquidity risk
Liquidity risk is the possibility that investments in a Fund
cannot be readily converted into cash when required. A Fund
is exposed to daily cash redemptions of redeemable units.
Liquidity risk is managed by investing the majority of a Fund’s
assets in investments that are traded in an active market and
that can be readily disposed. In accordance with securities
regulations, a Fund must maintain at least 90% of its assets in
liquid investments. In addition, a Fund aims to retain sufficient
cash and cash equivalent positions to maintain liquidity, and
has the ability to borrow up to 5% of its NAV for the purpose
of funding redemptions. All non-derivative financial liabilities,
other than redeemable units, are due within 90 days.
Credit risk
Credit risk is the risk that a loss could arise from a security
issuer or counterparty not being able to meet its financial
obligations. The carrying amount of investments and other
assets represents the maximum credit risk exposure as
disclosed in a Fund’s Statements of Financial Position. The
fair value of fixed-income and debt securities includes a
consideration of the creditworthiness of the debt issuer.
Credit risk exposure to over-the-counter derivative
instruments is based on a Fund’s unrealized gain on the
GENERIC NOTES TO FINANCIAL STATEMENTS
December 31, 2017
(also see Fund Specific Information)
contractual obligations with the counterparty. Credit risk
exposure is mitigated for those Funds participating in a
securities lending program (see note 7). RBC GAM monitors
each Fund’s credit exposure and counterparty ratings daily.
Concentration risk
Concentration risk arises as a result of net financial
instrument exposures to the same category, such as
geographical region, asset type, industry sector or market
segment. Financial instruments in the same category have
similar characteristics and may be affected similarly by
changes in economic or other conditions.
Interest rate risk
Interest rate risk is the risk that the fair value of a Fund’s
interest-bearing investments will fluctuate due to changes
in market interest rates. The value of fixed-income and debt
securities, such as bonds, debentures, mortgages or other
income-producing securities, is affected by interest rates.
Generally, the value of these securities increases if interest
rates fall and decreases if interest rates rise.
Currency risk
Currency risk is the risk that the value of investments
denominated in currencies, other than the functional
currency of a Fund, will fluctuate due to changes in foreign
exchange rates. The value of investments denominated in a
currency other than the functional currency is affected by
changes in the value of the functional currency in relation
to the value of the currency in which the investment is
denominated. When the value of the functional currency falls
in relation to foreign currencies, then the value of the foreign
investments rises. When the value of the functional currency
rises, the value of the foreign investments falls.
Other price risk
Other price risk is the risk that the value of financial
instruments will fluctuate as a result of changes in market
prices (other than those arising from interest rate or currency
risk), whether caused by factors specific to an individual
investment, its issuer, or all factors affecting all instruments
traded in a market or market segment.
6. Taxes
The Funds qualify as open-ended mutual fund trusts or unit
trusts under the Income Tax Act (Canada). In general, the
Funds are subject to income tax; however, no income tax
is payable on net income and/or net realized capital gains
which are distributed to unitholders. Since the Funds do
not record income taxes, the tax benefit of capital and
non-capital losses has not been reflected in the Statements
of Financial Position as a deferred income tax asset. In
addition, for mutual fund trusts, income taxes payable on net
realized capital gains are refundable on a formula basis when
units of the Funds are redeemed.
Capital losses are available to be carried forward indefinitely
and applied against future capital gains. Non-capital losses
may be carried forward to reduce future taxable income for
up to 20 years.
7. Securities lending revenueCertain of the Funds lend portfolio securities from time to time in order to earn additional income. Income from securities lending is included in the Statements of Comprehensive Income of a Fund. Each such Fund will have entered into a securities lending program with its custodian, RBC Investor Services Trust (“RBC IS”). The aggregate market value of all securities loaned by a Fund cannot exceed 50% of the assets of a Fund. The Fund receives collateral, with an approved credit rating of at least A, of at least 102% of the value of securities on loan. The Fund is indemnified by RBC IS for any collateral credit or market loss. As such, the credit risk associated with securities lending is considered minimal.
8. Administrative and other related-party transactions
Manager and Portfolio Manager
RBC GAM is an indirect wholly owned subsidiary of
Royal Bank of Canada (“Royal Bank”). RBC GAM is the
manager and portfolio manager of the Funds. RBC GAM is
responsible for the Funds’ day-to-day operations, provides
investment advice and portfolio management services to the
Funds and appoints distributors for the Funds. RBC GAM
is paid a management fee by the Funds as compensation
for its services. The management fee is calculated and
accrued daily as a percentage of the NAV of each series
of units of the Funds. No management fees are paid by
the Funds with respect to Series O units. Unitholders of
Series O units pay a negotiated fee directly to RBC GAM for
investment-counselling services.
The Funds pay a fixed administration fee to RBC GAM. The
fixed administration fee is calculated and accrued daily as a
percentage of the NAV of each series of units of the Funds.
RBC GAM in turn pays certain operating expenses of the
Funds. These expenses include regulatory filing fees and
other day-to-day operating expenses including, but not

GENERIC NOTES TO FINANCIAL STATEMENTS
December 31, 2017
(also see Fund Specific Information)
limited to, recordkeeping, accounting and fund valuation
costs, custody fees, audit and legal fees and the costs of
preparing and distributing annual and interim reports,
prospectuses, statements and investor communications.
Notwithstanding the fixed administration fee, the Funds
also pay certain operating expenses directly, including
the costs related to the Independent Review Committee
of the Funds, and the cost of any new government or
regulatory requirements introduced and any borrowing costs
(collectively, “other fund costs”), and taxes (including, but
not limited to, GST/HST). Other fund costs will be allocated
proportionately to each series based upon the relative NAV
of each series. RBC GAM may, in some years and in certain
cases, absorb a portion of operating expenses. The decision
to absorb the operating expenses is reviewed annually
and determined at the discretion of RBC GAM, without
notice to unitholders.
Certain Funds may invest in units of other Funds managed by
RBC GAM or its affiliates (“underlying mutual funds”). A Fund
will not invest in units of an underlying mutual fund if the
Fund would be required to pay any management or incentive
fees in respect of that investment that a reasonable person
would believe duplicates a fee payable by the underlying
mutual fund for the same service. The Fund’s ownership
interest in underlying mutual funds is disclosed in the Notes
to Financial Statements – Fund Specific Information.
RBC GAM or its affiliates may earn fees and spreads in connection with various services provided to, or transactions with, the Funds, such as banking, brokerage, securities lending, foreign exchange and derivatives transactions. RBC GAM or its affiliates may earn a foreign exchange spread when unitholders switch between series of funds denominated in different currencies. The Funds also maintain bank accounts and overdraft provisions with Royal Bank for which Royal Bank may earn a fee. Affiliates of RBC GAM that provide services to the Funds in the course of their normal business, all of which are wholly owned subsidiaries of Royal Bank of Canada, are discussed below.
Sub-Advisors
RBC Global Asset Management (U.S.) Inc. is the sub-advisor
for the RBC $U.S. Investment Grade Corporate Bond Fund,
RBC U.S. Mid-Cap Growth Equity Fund, RBC U.S. Mid-Cap
Growth Equity Currency Neutral Fund, RBC U.S. Mid-Cap
Value Equity Fund, RBC U.S. Small-Cap Core Equity Fund,
RBC U.S. Small-Cap Value Equity Fund and Phillips,
Hager & North U.S. Multi-Style All-Cap Equity Fund (for a
portion of the Fund). RBC Global Asset Management (UK)
Limited is the sub-advisor for the RBC Bond Fund (for a
portion of the Fund), RBC Global Bond Fund (for a portion
of the Fund), RBC Global Corporate Bond Fund (for a
portion of the Fund), RBC Global High Yield Bond Fund (for
a portion of the Fund), RBC Emerging Markets Bond Fund,
RBC U.S. Monthly Income Fund (for a portion of the Fund),
RBC Balanced Fund (for the European equity portion of the
Fund), RBC Global Balanced Fund (for the European equity
portion of the Fund), RBC Vision Balanced Fund (formerly,
RBC Jantzi Balanced Fund) (for the European equity portion
of the Fund), RBC International Dividend Growth Fund,
RBC International Equity Fund (for the European equity
portion of the Fund), RBC European Dividend Fund,
RBC European Equity Fund, RBC European Mid-Cap Equity
Fund, RBC Emerging Markets Dividend Fund, RBC Emerging
Markets Equity Fund, RBC Emerging Markets Small-Cap
Equity Fund, RBC Global Dividend Growth Fund, RBC Global
Dividend Growth Currency Neutral Fund, RBC Global Equity
Fund, RBC Global Equity Focus Fund, RBC Vision Global
Equity Fund (formerly, RBC Jantzi Global Equity Fund),
RBC Vision Fossil Fuel Free Global Equity Fund, Phillips,
Hager & North Overseas Equity Fund and Phillips, Hager &
North Global Equity Fund. RBC Investment Management
(Asia) Limited is the sub-advisor for the RBC Balanced
Fund (for the Asian equity portion of the Fund), RBC Global
Balanced Fund (for the Asian equity portion of the Fund),
RBC Vision Balanced Fund (formerly, RBC Jantzi Balanced
Fund) (for the Asian equity portion of the Fund), RBC
International Dividend Growth Fund (for the Asian equity
portion of the Fund), RBC International Equity Fund (for the
Asian equity portion of the Fund), RBC Asian Equity Fund,
RBC Asia Pacific Ex-Japan Equity Fund and RBC Japanese
Equity Fund. BlueBay Asset Management LLP is the sub-
advisor of the BlueBay Global Monthly Income Bond Fund,
BlueBay Global Sovereign Bond Fund (Canada), BlueBay
Global Investment Grade Corporate Bond Fund (Canada),
BlueBay European High Yield Bond Fund (Canada), BlueBay
Emerging Markets Corporate Bond Fund, BlueBay Global
Convertible Bond Fund (Canada) and BlueBay $U.S. Global
Convertible Bond Fund (Canada).
The sub-advisors earn a fee which is calculated and accrued
daily as a percentage of the NAV of each series of units of the
Funds. The sub-advisors are paid by the manager from the
management fee paid by the Funds.

GENERIC NOTES TO FINANCIAL STATEMENTS
December 31, 2017
(also see Fund Specific Information)
Trustee
RBC GAM is the trustee for the Funds governed by the laws of the Province of Ontario. RBC IS is the trustee for the Funds governed by the laws of the Province of British Columbia. The trustee holds title to the Funds’ property on behalf of the unitholders. The trustee earns a fee, which is paid by the manager from the fixed administration fee paid by the Funds.
Distributors
RBC GAM, Royal Mutual Funds Inc., RBC Direct Investing Inc., RBC Dominion Securities Inc. and PH&N IF are principal distributors of, or distribute certain series of units of, the Funds. Dealers receive an ongoing commission based on the total value of their clients’ Series A, Advisor Series, Advisor T5 Series, Series T5, Series T8, Series H and Series D units.
Custodian
RBC IS is the custodian and holds the assets of the Funds.
RBC IS earns a fee as the custodian, which is paid by the
manager from the fixed administration fee paid by the Funds.
Registrars
Royal Bank, RBC IS and RBC GAM are the registrars of
the Funds and keep records of who owns the units of the
Funds. The registrars also process orders and issue account
statements. The registrars earn a fee, which is paid by the
manager from the fixed administration fee paid by the Funds.
Brokers and Dealers
The Funds have established or may establish standard
brokerage agreements and dealing agreements at
market rates with related parties such as RBC Dominion
Securities Inc., RBC Capital Markets, LLC, RBC Europe
Limited, NBC Securities Inc. and Royal Bank of Canada.
Other Related-Party Transactions
Pursuant to applicable securities legislation, the Funds
relied on the standing instructions from the Independent
Review Committee with respect to one or more of the
following transactions:
Related-Party Trading Activities(a) trades in securities of Royal Bank;
(b) investments in the securities of issuers for which
a related-party dealer acted as an underwriter during
the distribution of such securities and the 60-day period
following the conclusion of such distribution of the
underwritten securities to the public;
(c) purchases of equity and debt securities from or sales of
equity or debt securities to a related-party dealer, where it
acted as principal; and
Inter-Fund Trading(d) purchases or sales of securities of an issuer from or to
another investment fund or managed account managed
by RBC GAM.
The applicable standing instructions require that Related-Party
Trading Activities and Inter-Fund Trading be conducted in
accordance with RBC GAM policy and that RBC GAM advise
the Independent Review Committee of a material breach
of any standing instruction. RBC GAM policy requires that
an investment decision in respect of Related-Party Trading
Activities (i) is made free from any influence of Royal Bank
or its associates or affiliates and without taking into account
any consideration relevant to Royal Bank or its affiliates
or associates, (ii) represents the business judgment of the
portfolio manager, uninfluenced by considerations other
than the best interests of the Funds, (iii) is in compliance with
RBC GAM policies and procedures, and (iv) achieves a fair and
reasonable result for the Funds. RBC GAM policy requires that
an investment decision in respect of Inter-Fund Trading is in
the best interests of each Fund.
9. Revision of comparative information
Where applicable, certain comparative figures on the
Statements of Cash Flow have been revised.
Amounts reclassified to “Non‐-cash distributions from
underlying funds” have been presented separately from
amounts related to “Cost of investments purchased”
to appropriately reflect the non-‐cash components of
investments purchased. The impact on the “Net cash
provided by (used in) operating activities” is nil.
Comparative figures on the Statements of Cash Flow have
been revised for the following funds:
RBC Monthly Income Bond Fund, RBC Emerging Markets
Bond Fund (CAD Hedged), BlueBay $U.S. Global Convertible
Bond Fund (Canada), RBC Managed Payout Solution,
RBC Managed Payout Solution – Enhanced, RBC Managed
Payout Solution – Enhanced Plus, RBC Conservative
Growth & Income Fund, RBC Balanced Growth & Income
Fund, RBC Global Growth & Income Fund, RBC Retirement
2020 Portfolio, RBC Retirement 2025 Portfolio, RBC Retirement
2030 Portfolio, RBC Retirement 2035 Portfolio, RBC Retirement
2040 Portfolio, RBC Retirement 2045 Portfolio, RBC Retirement

GENERIC NOTES TO FINANCIAL STATEMENTS
December 31, 2017
(also see Fund Specific Information)
2050 Portfolio, RBC Select Very Conservative Portfolio,
RBC Select Conservative Portfolio, RBC Select Balanced
Portfolio, RBC Select Growth Portfolio, RBC Select Aggressive
Growth Portfolio, RBC Select Choices Conservative Portfolio,
RBC Select Choices Balanced Portfolio, RBC Select Choices
Growth Portfolio, RBC Select Choices Aggressive Growth
Portfolio, RBC Target 2020 Education Fund, RBC Target
2025 Education Fund, RBC Target 2030 Education Fund,
RBC International Equity Currency Neutral Fund, RBC
International Index Currency Neutral Fund, RBC Asian Equity
Fund, RBC Emerging Markets Multi-Strategy Equity Fund,
RBC Private U.S. Large-Cap Value Equity Currency Neutral
Pool, RBC Private U.S. Large-Cap Core Equity Currency
Neutral Pool, Phillips, Hager & North Balanced Fund, Phillips,
Hager & North Currency-Hedged U.S. Equity Fund, Phillips,
Hager & North Currency-Hedged Overseas Equity Fund,
Phillips, Hager & North LifeTime 2015 Fund, Phillips, Hager &
North LifeTime 2020 Fund, Phillips, Hager & North LifeTime
2025 Fund, Phillips, Hager & North LifeTime 2030 Fund,
Phillips, Hager & North LifeTime 2035 Fund, Phillips, Hager &
North LifeTime 2040 Fund, Phillips, Hager & North LifeTime
2045 Fund and Phillips, Hager & North LifeTime 2050 Fund.
Amounts reclassified to “(Increase) decrease in margin
accounts” have been presented separately from amounts
related to “Cash (bank overdraft), beginning of period,”
to appropriately separate changes in margin accounts.
Comparative figures on the Statements of Cash Flow have
been revised for the following funds:
BlueBay $U.S. Global Convertible Bond Fund (Canada) and
RBC International Index Currency Neutral Fund.
10. Future accounting changes
The following IFRS standard has been issued, but is not yet
in effect:
IFRS 9 Financial Instruments addresses the classification,
measurement and derecognition of financial assets and
liabilities. It replaces the multiple classifications and
measurement models in IAS 39 and is effective for reporting
periods beginning on or after January 1, 2018. Classification
and measurement of debt assets will be driven by an entity’s
business model for managing the financial assets and the
contractual cash flow characteristics of the financial assets.
Derivative and equity instruments are measured at fair value
through profit or loss unless, for equity instruments not held
for trading, an irrevocable option is taken to measure at fair
value through other comprehensive income.
On adoption of IFRS 9, the Funds’ investment portfolios
will continue to be classified at fair value through profit or
loss. Other financial assets which are held for collection will
continue to be measured at amortized cost with no material
impact expected from application of the new impairment
model introduced in IFRS 9. As a result, the adoption of
IFRS 9 is not expected to have a material impact on the
Funds’ financial statements.