Embed Size (px)
Citation preview
MANAGERIAL INCENTIVES AND VALUE CREATION:
EVIDENCE FROM PRIVATE EQUITY∗
Phillip Leslie Paul OyerGraduate School of Business Graduate School of Business
Stanford University Stanford University
and NBER and NBER
[email protected] [email protected]
Abstract
We analyze the differences between companies owned by private equity (PE) investors and similarpublic companies. We document that PE-owned companies provide higher managerial incentives to theirtop management: CEOs have almost twice as much equity, 10% lower salary, and more cash compensationthan their counterparts at comparable public corporations. We also find some evidence that PE ownershipis related to improvements in operational efficiency and profitability. However, any differences betweenPE-owned companies and public companies disappear over a very short period (one to two years) afterthe PE-owned firm goes public.
August, 2009
∗We thank Ben Beder, Marco Beltran, Christopher Jung, William Vijverberg, and Alex Wong for researchassistance, and thanks to Billy Butcher, Bengt Holmstrom, Steve Kaplan, Per Stromberg, and an anonymousreferee for helpful feedback. We are also very grateful to a number of executives at private equity firms for givingus insights into their business practices.
1 Introduction
Ostensibly, private equity (PE) firms buy companies, fix them, and then sell them. How is it
that PE firms are able to do this and why were the companies unable to fix themselves in the first
place? The mantra in the literature is that PE firms mitigate managerial agency problems—
they create value by improving management.1 Three mechanisms are emphasized: (i) greater
debt disciplines managers, (ii) enhanced governance, and (iii) increased managerial incentives.
In this study we examine the changes in managerial incentives caused by PE firms.
Managers as owners is a pillar of the PE approach. But how does the ownership of managers
differ between public companies and PE portfolio companies, where managers in both cases have
stock options and incentive plans of some kind? Kaplan (1989a) first documented differences in
the share of CEO equity ownership between publicly traded firms and firms that had undergone
a management buyout. Muscarella and Vetsuypens (1990) provide a similar analysis and Baker
and Wruck (1989) provide a detailed case study, but no prior study has examined managerial
ownership in post-1990 buyouts, as we do here.2 It is important to examine more recent data for
a couple of reasons. First, it is reasonable to expect that public companies have adopted some
of the practices of PE firms from the 1980s. Holmstrom and Kaplan (2001) and Kaplan (1997)
explicitly argue this point.3 The failure of Jensen’s (1989) well-known prediction that PE would
lead to the demise of public corporations is also consistent with public companies’ adoption of
PE practices. More concretely, Hall and Liebman (1998) find that equity-based incentives for
CEOs of public companies have risen dramatically during the 1980s and 1990s. Others are more
skeptical of changing managerial incentives, such as Bebchuk and Fried (2004) who argue that
managerial power continues to drive executive compensation in most public corporations to the
detriment of shareholders.
A second reason why it is important to study more recent data on managerial incentives
in PE-owned companies is that the approach of PE firms has been evolving. As Cao and1See Jensen (1986 and 1989).2In contemporaneous work, Jackson (2008) also looks at executive compensation in PE-backed firms (using a
data gathering strategy similar to ours). However, he focuses on the potential conflict of interests between publicshareholders and top managers when a firm is initially approached by a PE investor. Some of his analysis issimilar to some of ours and, in those cases, we generally draw similar concusions.
3As Kaplan (1997) remarks: “Corporations have applied the three primary LBO insights without actuallydoing LBOs ... [c]orporations (and consulting firms) now implement this insight through innovative performancemeasurement and compensation programs,” (p. 8). See also Hermalin (2005).
1
Lerner (2007) explain, the buyout industry is significantly more competitive in the late 1990s
compared to the 1980s. Perhaps relatedly, PE firms are said to be getting larger and more
operationally focused over time.4 Also, as low-hanging fruit diminishes, the characteristics
of acquired companies may also be changing. For instance, public companies with relatively
low managerial incentives may be attractive targets for PE firms because of the potential for
significant increases in incentives (and the potential improvements in profitability that may
result). But such companies may be less common over time.
We compare managerial incentives at public companies with PE-owned companies, using
data for U.S. firms during the period 1996 to 2006. A key challenge in this research is obtaining
data on managerial incentives at PE portfolio companies, which are not required to disclose such
information. Our approach is to collect data on companies that have PE owners and undergo an
IPO (sometimes referred to as a reverse LBO). In such cases the PE-owned firms are required
to disclose the same information as a public company for the two years prior to the IPO. The
dataset covers 144 such companies. There are some important selection issues which we address,
as discussed in Section 3.
While most prior work focuses on the fraction of equity owned by the CEO, we analyze
broader evidence on managerial incentives. We also study salaries and bonuses, and we go
beyond the CEO to examine compensation for up to three executives at any given firm. We
also analyze whether certain factors may explain variation in managerial incentives among PE-
owned firms, such as firm size effects and CEO turnover. In doing so, our study helps to shed
light inside the black box of PE. In the same spirit, see Acharya, Hahn, and Kehoe (2008) for
evidence concerning the importance of active governance by PE firms.
We find that, as conventional wisdom and economic theory suggest, top executive incentives
are much stronger at PE-owned companies than at comparable publicly traded companies. More
specifically, relative to his counterpart at a publicly traded company in the same industry with
similar observable characteristics, the CEO of a PE-owned firm owns approximately twice as
large a share of the firm, earns about 10% less in base pay, and receives a substantially larger
share of his cash compensation through variable pay. These differences do not exist at companies
before they are bought by PE firms, suggesting that they are the result of PE ownership. Hence,4This argument was made by David Rubenstein (Co-founder and Managing Director of the Carlyle Group) in
a presentation to the NBER in April 2008.
2
we conclude that the difference in managerial incentives that existed in the 1980s, between public
companies and PE-owned firms, is still present during the period 1996 to 2006. Furthermore,
these differences are robust to the inclusion of controls for selection and other factors that affect
incentives.
As noted above, prior work has suggested that stronger incentives at PE-backed firms mit-
igate agency problems and improve performance. Therefore, we go on to measure whether
PE-backed firms outperform their public counterparts in profitability and operational efficiency.
Empirical studies of PE investment returns show that returns are high (see, for example, Kaplan
and Schoar, 2005), but it remains unclear whether this is due to value creation or value capture
by investors and employees.5 We find some suggestive evidence that PE-owned firms are more
profitable and have higher sales-per-employee than comparable public firms.6 We also find that
all differences between PE-owned firms and public firms quickly disappear after PE-owned firms
execute an IPO.
In the next section we describe anecdotal evidence about the range of managerial incentives
implemented by PE firms in their portfolio companies. In Section 3 we summarize the data
used in our study, and explain our approach to addressing selection concerns. Section 4 then
contains our analysis of the differences in managerial incentives between public corporations
and PE-owned companies. In Section 5 we examine evidence concerning operational differences,
and in Section 6 we explore the longevity of high managerial incentives once a PE-owned firm
undergoes an IPO. Section 7 concludes.
2 Institutional Background on PE Firms
In this section we provide an overview of some of the key changes that PE firms implement
in managerial compensation at their portfolio companies. The information in this section is
based on interviews we performed with a half dozen experienced executives at several leading
PE firms.7 The purpose of including this information is to expand our understanding beyond5See, for example: Davis, et al, (2008), and Guo, Hotchkiss and Song (2008).6An additional source of value creation may relate to tax advantages of debt (see Kaplan, 1989b).7Specifically, we interviewed six managers of varying levels of seniority (including general partners) at three
PE firms (two of which are “top-tier” PE businesses).
3
the limited set of facts we are able to study in the formal empirical analysis. It is common in the
literature on private equity to propose that enhanced managerial incentives are a major driver
of value creation. However, we are unaware of any paper that provides a description of what
“enhanced managerial incentives” entail, other than the evidence provided by Kaplan (1989a)
and Muscarella and Vetsuypens (1990), showing that the fraction of equity owned by the CEO
tends to increase. While this is an important feature (which we also examine), the interviews
we summarize below clearly indicate that increasing CEO equity is one piece of a more complex
set of changes.
Enhanced equity participation is not limited to the CEO. Not surprisingly, all members of
the senior management team (Chief Financial Officer, Chief Operations Officer, Chief Technical
Officer, and so forth) also obtain significant equity stakes in almost every instance. However,
PE firms tend to seek even broader participation. Typically, the top 20 to 80 managers in
an acquired company obtain significant equity. The number may vary according to the kind
of business: manufacturing firms tend to involve fewer managers in equity participation, while
service firms tend to involve more managers. It is not unusual to have 150 or more participating
managers. One PE executive told us of a deal that included 500 managers in the equity program.
A very important aspect of the equity programs is that managers are required to contribute
capital—managers purchase the equity with their own funds. One interviewee explained that
equity sharing is less about compensation of managers than it is about investment by managers.
Arguably, this feature is why managerial equity programs are the cornerstone of the PE model
which transforms managers as agents into managers as owners.
Exposing managers to downside risk may be as important for motivating managers as the
potential upside. However, the interviewees also emphasized that requiring managers to invest
themselves helps to reveal information (as in Lazear, 2005). If any manager is unwilling to make
a significant investment (often described as an investment on par with their home) then it is
crucial to understand why. Is it because of personal financial limitations? If so, the PE firm
will find creative ways to help the manager invest. Or is it because the manager has private
information about the business that brings into question future profitability? Hence, increased
equity participation of managers may be as important for mitigating adverse selection as it is
for overcoming moral hazard.
4
Alongside equity investments by managers are stock options which are granted in proportion
to the initial investment by managers (although not necessarily the same proportion for all
managers in a firm). It is typical for CEOs to obtain two to three times their initial equity
in options. Options vest uniformly, often over five years. There may be some controversy
surrounding CEO options in particular, since other managers may obtain lower multiples than
the CEO, which can be interpreted as a form of kick-back for CEOs to push the deal. A simple
example of a CEO equity package is as follows. Suppose the PE firm acquires the target company
for $8 billion, with 50% leverage (i.e., $4 billion in equity, and $4 billion in debt). Suppose the
PE firm expects to sell the business for $16 billion, yielding a 200% return on equity invested.
The CEO may invest $5 million of his personal wealth (which is often a rollover of the equity
previously owned in the company) and obtain three times that in options for a total stake of $20
million. With 200% return on equity invested, the CEO obtains $60 million upon exit. CEO
ownership may increase when competition among PE firms for deals is intensified.8
PE firms also expend significant effort redesigning cash bonus structures for managers. The
changes are customized to specific businesses, but are generally said to involve an increase in
the performance weighting and amended performance criteria. It is unclear if the overall level
of cash bonuses is increased, but it is probably not decreased. Some interviewees at PE firms
asserted the changes they implement should have already been done by the firms.9 Other
interviewees said that such changes reflected strategic redirection. Others again emphasized
that the changes in bonus structures were not necessarily better, and indeed might be worse
in some dimensions. This could be because PE firms are not expert in utilizing non-financial
measures that encourage leadership development, for example. According to the interviewees,
salaries are largely unchanged.
There is an interesting question concerning the role of exit: does the fact that PE firms intend
to exit (after five years, say) enhance or diminish the effectiveness of managerial incentives? On
the one hand, managers and investors both obtain a liquidity event at the same time, providing8In fact, Jackson (2008) specifically analyzes the potential for PE firms to, in essence, bribe CEOs to push their
deal. He refers to this phenomenon as “deal bounties,” arguing that this issue would be particularly commonwhen PE firms buy publicly traded companies whose directors may be especially susceptible to moral hazardproblems. This seems unlikely to be a major determinant of CEO pay at PE-backed firms more broadly, however,as less than 7% of PE acquisitions are public-to-private transactions (Stromberg, 2008).
9Consistent with this view, prior research has noted the difficulty of changing compensation structures, and thatsuch changes are more likely in the face of bankruptcy or other dramatic changes in ownership structure—peopleare more willing to accept change when they feel less secure in their jobs. See, for example, Schaefer (1998).
5
alignment around timing. In contrast, with public companies managers may divest sooner than
investors would prefer. On the other hand, there can be disagreement between managers and
the PE firm concerning the details of exit. For example, managers may prefer not to exit via
an IPO, since they are required to hold stock for a minimum period, delaying their liquidity
event. Several interviewees made the compelling point that PE firms tend to favor managers
when discord arises, since it is essential to maintain a reputation for treating managers well.
In some PE buyouts there will be significant turnover in management, including senior
managers and sometimes the CEO. Some PE firms are known for their tendency to replace senior
management in their acquired companies. Other PE firms tend to view a strong management
team as a desirable characteristic of a targeted acquisition, preferring instead to rely on enhanced
incentives for aligning these managers with their own interests. We are unaware of any study
documenting the degree of managerial turnover in PE acquisitions. When there is management
turnover, an important task of the PE owner is identifying and recruiting talented managers.
See Kaplan, Klebanov and Sorensen (2007) for an analysis of which CEO characteristics and
abilities matter for hiring decisions in PE buyouts.
It would be ideal to obtain data on all managers’ equity investments, option grants, bonus
structures and firing/hiring of managers, in order to formally analyze/verify the generality of
the anecdotal evidence discussed here. By its very nature, it is difficult to obtain information
on the practices of private equity firms for a broad sample, let alone such confidential details
of managerial incentives.10 In the next section we describe the data utilized in our formal
analysis, which has some obvious limitations that we shall discuss. However, the advantage of
our dataset is that we have information about 144 PE-owned companies with clear selection
criterion, allowing readers to evaluate the generality of our findings.
3 Data and Identification
A challenge for all empirical research into the causal effects of PE ownership is the fact that
acquired firms are not randomly chosen.11 Hence, cross-sectional differences in managerial in-
centives, say, between PE-owned firms and public companies would not necessarily reflect a10Indeed, even for public companies this level of detail is not usually available.11See Bharath and Dittmar (2006) and Mehran and Peristiani (2006).
6
causal effect of PE ownership. Instead, Kaplan (1989a) relies on panel data covering periods be-
fore (when the firm is publicly traded) and during PE-ownership, documenting the within-firm
changes in managerial incentives over time. Post-buyout information is only available for firms
with publicly traded debt, outstanding preferred stock or publicly traded equity, leading to a
small sample size (48 firms) and possible selection concerns. Muscarella and Vetsuypens (1990)
utilize panel data covering periods during and after PE ownership, relying on reverse-LBOs, in
their analysis of differences in managerial incentives between the PE-owned period and post-
IPO. There are 72 firms in their sample. Neither of these prior studies utilize a comparison
sample (to control for time effects), or regression analysis (to control for size effects and other
covariates), as we do here.
We study 144 reverse-LBOs that took place between 1996 and 2005. We compare managerial
incentives during the PE-ownership phase (the “before-period”) with the publicly traded phase
(the “after-period”). We also rely on a comparison sample of publicly traded firms, utilizing
regressions to control for time-effects, firm-size effects (which turn out to be important), and
other observable differences. Finally, we also include a sample of firms that were publicly
traded and then acquired by a PE owner. For these firms, we observe only the pre-acquisition
incentives (and other observables), but this is sufficient to provide a straightforward test of
an important selection concern: do PE firms tend to acquire companies with already high
managerial incentives? A priori, identification of a causal effect is more compelling in this
anaylsis than in the prior research.
Specifically, we used CapitalIQ to generate lists of two types of firms that have time periods
when they are owned by a PE firm and other periods when they are publicly traded (and therefore
must disclose financial and compensation data). First, we looked at all firms that, according
to CapitalIQ, underwent a leveraged buyout (LBO) between 1996 and 2004, and completed an
IPO after the LBO but before the end of 2005. It is important that we condition our sample
on firms that underwent a buyout after 1996 so that we can be certain of including firms that
are PE-owned.12 We dropped firms that we determined to be venture capital-backed (rather
than PE-backed). This is our PE-owned sample of companies. In the analysis below, we clarify
when we use information about these firms during the private ownership phase and when we
use information about these firms after they have gone public.12CapitalIQ does not record the ownership status of firms each period, forcing us to rely on (infrequent)
transactions to infer ownership status.
7
Of the 144 firms in the PE-owned sample, 62 are cases where a PE firm acquired a division
of a larger (often public) company, 47 are buyouts from a private (non-PE) owner (often the
founder and/or their family), 19 are public-to-private transactions, and 16 were sales from one
PE firm to another. This distribution of sources is quite similar to that of PE investments more
generally (see Stromberg, 2008.) Table 1 shows the number of LBOs and IPOs by year for the
PE-owned companies in our dataset. Most LBOs are early in the sample period, which is to be
expected given that the firm must go public by 2005. The IPOs build over the sample years, with
a distinct drop during the weak stock market of 2001–2003. Our sample size is large compared
to the earlier studies by Kaplan (1989a) and Muscarella and Vetsuypens (1990). More recently
Guo, Hotchkiss, and Song (2008) study a sample of 192 LBOs from the period 1990 and 2006,
which is more observations than our study, but covering a longer period of time.13
The second type of firm in our dataset, which we refer to as the going-private group, comprises
firms that CapitalIQ lists as having a “going-private transaction” between the beginning of 1998
and October 2007, and for which there is some compensation data available in Standard and
Poors’ ExecuComp database. There are 89 firms in this group. The annual rate at which firms
enter this group went up dramatically in 2004–2006 because of the wave of large PE-backed
purchases. These larger firms were more likely to be included in ExecuComp. Table 1 shows
the annual rate of going private for firms in this group.
The fact that we do not observe pre-acquisition incentives for our sample of PE-owned com-
panies raises the question that PE acquirers may target companies with already high managerial
incentives, as noted above. Hence, a finding that PE-owned companies have high managerial
incentives may be due to selection, rather than a causal effect due to changes that are imple-
mented by the new owners. Our second group of firms—the going-private sample—allows us to
control for selection because we see the characteristics of firms that are attractive to PE firms
but are not yet owned by them.
We also generated a comparison sample that includes all firm-years in ExecuComp that are
not in one of the other two samples. ExecuComp oversamples large firms (it includes the entire
Standard and Poors’ 500), so the comparison sample firms are larger, on average, than the
two PE samples. We limit the comparison sample to a subset of smaller firms that more closely13Other recent studies include Cressy et al (2007) with a sample of 122 LBOs, Desbrieres and Schatt (2002)
sample of 161 LBOs, and Vinten (2007) with a sample of 73 LBOs.
8
match those in the other samples for some of our analysis. The inclusion of a comparison sample
allows us to control for year effects, as well as other firm-specific observables that may explain
differences in managerial incentives. As we show in the next section, this feature of the analysis
turns out to matter.
We had hoped to focus our analysis on a sample of firms that went from public to private
and back to public during the time frame of our analysis. However, we were only able to
identify five such companies, which we refer to as the public-PE-public group.14 This sample
is too small for formal analysis, but we use one company in this group (Petco) for illustrative
purposes. There are so few firms in this group because, as Stromberg (2008) shows, only 6%
of PE-owned companies were stand-alone public firms before a PE firm bought them, and only
13% of PE-owned firms leave PE-ownership through IPO. As a result, we focus on differences
between firms in their private phase and those that are public as our estimate of differences
between PE-owned firms and public firms. Then we look at differences between public firms
and firms that are about to go private, to see if there are systematic differences between public
firms and firms that have a PE-owned stage when both groups are publicly held.
Table 2 shows summary statistics for all four groups of firms in our dataset. As expected,
the comparison sample is noticeably larger by most measures (assets, sales, and so forth) than
any of the other groups. The difference is not as large in the medians, however, because PE
firms make fewer investments in the largest corporations that drive up the average size of public
firms. For compensation information, we rely on CapitalIQ to generate a list of executives at the
PE-owned companies in our sample. However, we gathered all compensation data directly from
the IPO prospectuses. As a result, our stock ownership data includes shares owned, exercisable
options, and unexercisable options. This compensation data is matched to accounting and stock
return data from Compustat and CRSP, respectively.
In the analysis below we examine the effect of PE ownership on three measures of managerial
incentives. These measures are also included in Table 2. The first measure is CEO Ownership,
which is the conventional metric studied by prior authors (such as Kaplan, 1989a). It is the
most obvious gauge of incentives because it ties the wealth of the executive to the value of the14A total of nineteen firms in our sample were public-to-private transactions that later had an IPO. However,
only five of these could be used to construct a public-PE-public sample because most underwent dramatic changesduring the PE stage so that they were not comparable during their two public stages.
9
firm. To compute the measure, we aggregate the number of shares that the CEO either owns
outright or holds options to buy and divide by the number of shares outstanding. We treat
options as if they are fully vested which overstates their incentive effect—each option creates
somewhat less incentive and has less value than a share because the price may be below the
strike price when the executive wants to exercise the option. We do so out of necessity because,
for the PE-owned sample, we are limited by the detail of the compensation and ownership data
in the IPO prospectus. We know how many options the CEO holds but we do not have details
on the date of expiration, strike price, etc. Our approach is conservative because options make
up a larger part of ownership for the comparison group than for the PE-owned group, leading
us to overstate CEO ownership in public corporations relative to PE-owned firms.15
An alternative approach to measuring the magnitude of equity-based incentive is to compute
the dollar value of the equity owned by the CEO. However, the value of the equity during the
PE ownership phase is unknown.16 It is also worth noting that the incentive effect of executive
ownership may also depend on leverage due to the well-known stockholder-bondholder conflict.
Simply put, in a highly leveraged firm the equity holders obtain the benefits from upside risk,
while debt holders bear the downside risk. Hence, holding the fraction of equity owned by the
CEO fixed, as the debt-equity ratio increases the CEO may be more likely to implement risky
investments, even at the expense of lowering the expected value of the company. In response,
debtholders have implemented covenants in their contracts with PE firms that mitigate these
effects (see Lehn and Poulsen, 1991). Of course these contracts are confidential and we have
no information on them. It is difficult to assess how big an issue the stockholder-bondholder
conflict is for the purpose of our analysis. Regardless, the motivation for this study stems from
the agency conflict between managers and equity owners.
Salary is the second measure of managerial incentives. We expect firms that want to provide
stronger incentives would pay lower salaries to their CEO for at least two reasons. First, when
expected payouts from incentives are high, then (assuming the risk premium is not too great)
the firm will want to lower base pay so as to keep compensation costs down. Second, lower
salaries increase incentives of risk-averse workers by increasing the likelihood of low pay (where15Kaplan (1989a) and Muscarella and Vetsuypens (1990) do not include options in their analysis of CEO equity
ownership in LBOs. Options were less common in compensation packages in the 1980s than in recent times, sothis was a less important issue for their samples.
16Our approach is consistent with Kaplan (1989a) and Muscarella and Vetsuypens (1990) who also use thefraction of equity as the measure of managerial incentives.
10
marginal utility with respect to income is particularly high).
The third measure is Non-Salary Cash Pay, defined as cash pay that is not the CEO’s base
salary divided by total cash compensation (i.e. CEO’s variable pay share). Firms that provide
higher incentives will utilize more bonuses, because bonuses are a contingent payoff. In Table 2
we show summary statistics for these three measures of managerial incentives, for each sample
of firms in our dataset.
4 Managerial Incentives in PE-Owned Businesses
As noted in the introduction, one view of PE firms is that they create value in the businesses they
acquire as a result of improved management. Some of the improvement may stem from man-
agement turnover, but the literature tends to emphasize the role of reduced agency costs. That
is, PE mitigates the principal-agent problem between managers and owners via a combination
of higher debt levels, enhanced monitoring, and increased incentives.
To illustrate the changes in managerial incentives that take place when a PE firm acquires a
public company, consider the example of Petco and the equity ownership of CEO Brian Devine,
as depicted in Figure 1. This example is one of the few firms in the public-PE-public group
discussed above. Between 1995 and 1999, during the initial public phase, Devine owned about
2% of the equity. After Petco was taken private in 2000, Devine’s ownership share sharply
increased to about 10%. Petco undertook an IPO in 2002 and Devine’s share was immediately
reduced to about 7%, and then continued to fall after that. Devine stepped down as CEO in
2004 but continued as Petco’s Chairman. By 2006, he owned about 4% of Petco. PE ownership
is associated with higher top management ownership in the case of Petco. We will show below
that this example is representative of PE-owned firms.
To examine these effects more generally, we estimate the following specification:
Yit = α + X ′itβ + θ1PrivateEquityit + θ2GoingPrivateit + εit (1)
in which Yit is one of the three measures for managerial incentives (discussed in Section 3) at
firm i in year t, and X is a vector of control variables that includes observed firm characteristics
(assets, sales, market capitalization, employees, cash/assets), 2-digit SIC dummies, and year
11
dummies. There are two key variables of interest. First, PrivateEquityit is a dummy equal to
one for companies that are owned by a PE firm. We only include these firms in the last year
before they go public (that is, while they are still owned by PE firms). Second, GoingPrivateit
is a dummy equal to one for public companies in their last year before being acquired by a PE
firm. Lastly, α, β, θ1 and θ2 are coefficients to be estimated, and ε is an error term that contains
unobserved factors which also affect incentives.
In principle, the panel structure of the data allows for firm fixed effects to be included, but
in that case θ1 would be identified by within-firm differences in managerial incentives before
and after their IPO.17 On the one hand, this source of identification is based on a comparison
of compensation under PE ownership versus public ownership.18 On the other hand, it is
conceivable the changes implemented by PE firms will be long-lasting, or last for at least several
years after the IPO. Supposing PE firms do in fact increase managerial incentives following the
LBO, and supposing these higher incentives are long-lasting following the subsequent IPO exit of
the PE owners, then the inclusion of firm fixed effects in equation (1) will lead us to incorrectly
infer that PE firms do not increase managerial incentives. Hence, we do not include firm fixed
effects in the analysis in this section. In any event, how long-lasting are the changes in incentives
implemented by PE firms is a separate and interesting question, which we examine in Section 6.
In the absence of firm fixed effects, θ1 is identified by cross-sectional variation. This is why
it is essential to include firm characteristics that may explain variation in managerial incentives
and are correlated with PE ownership. It is therefore important to control for factors favoring PE
acquisition: cash reserves, industry factors (such as availability of profitable investments), and
macroeconomic factors (such as interest rates).19 The above specification includes controls for
cash, industry dummies, and time dummies, which control for these three factors, respectively.
Hence, θ1 is identified from within-industry and within-year variation.
Furthermore, the inclusion of GoingPrivateit in equation (1) provides us with a diagnostic
for whether the estimate of θ1 is picking up a causal effect of PE, or if θ1 is due to selection—PE
firms choosing to acquire public companies with already high managerial incentives. Specifically,
if θ1 = θ2 then public companies that are acquired by PE firms tend to have the same level of17Firm fixed effects are of no use for the GoingPrivateit sample because we only observe these firms when they
are public.18Indeed, this is the variation exploited by Muscarella and Vetsuypens (1990).19See Jensen (1989).
12
incentives, in the year before going private, as do PE-owned firms (prior to IPO). And if θ2 = 0
then public companies that are acquired by PE firms tend to have the same level of incentives,
in the year before going private, as do public firms that do not go private.
Another concern is that the choice of which PE-owned firms undergo an IPO may induce a
bias due to endogeneity. One story may be that IPOs are more likely in certain periods (e.g. IPO
waves, hot markets or other time-related factors). However, these kinds of year effects do not bias
our analysis because the inclusion of year dummies flexibly controls for these factors. Of more
concern is the possibility that PE firms are more likely to undertake an IPO for high performing
firms in their portfolio than the under-performers. It is also conceivable that high performers
tend to have relatively higher managerial incentives. Hence, a finding that PE ownership is
associated with higher managerial incentives and performance improvements may be driven by
this kind of selection bias rather than a causal effect. However, we actually find that managerial
incentives and firm performance are not significantly correlated in our sample of PE-owned firms,
leading us to be less concerned about this source of potential bias.
The estimates for variations on the above specification are reported in Tables 3, 4 and 5.
Each of these tables corresponds to one of the three measures of managerial incentives that were
explained in the prior section. For all specifications in these three tables, an observation is an
executive-year combination. Also, every specification in these tables includes year dummies.
4.1 Fraction of Ownership by the CEO
The dependent variable in Table 3 is the Fraction of Stock Owned by the CEO, which we described
in Section 3. Controlling only for year effects, in column (1) we report that the CEO in a
PE-owned business tends to have 3.8 percentage points more equity than the CEO in public
companies. Adding industry dummies in column (2) reduces this difference by a small amount, to
3.2 percentage points. Including controls for observed firm characteristics in column (3) further
reduces the difference—with the full set of controls and industry dummies, we estimate the
CEO in a PE-owned business has 2.3 percentage points more equity (on average) than his/her
counterpart in public companies.20
20The estimate is significantly different from zero with 99% confidence.
13
Recall from Table 2 that the mean level of CEO ownership in the comparison sample of public
corporations is 3.6%. Hence, the estimate of 2.3 percentage points more ownership associated
with PE represents a dramatically higher level of managerial incentives—64% higher. As a
reality check on the data, note that the coefficient on Log(Assets) in column (3) is negative
and significant, picking up the expected size effect (managers tend to have a smaller fraction of
ownership in larger firms). In an unreported regression we re-estimated the specification shown
in column (3), dropping all firm/years (from each group) where the firm employs more people
than the 75th-percentile of PE-owned firm employment. The results are basically unchanged,
which indicates that the findings are robust to the exclusion of large firms.
In column (4) we report the estimates from a median regression of the same specification
in column (3). This addresses a concern over outliers and allows us to compare results with
Kaplan (1989a), who focuses on medians. In this case, we find the predicted median equity
ownership is 2.5 percentage points higher for CEOs of PE-owned businesses than their public
company counterparts. Hence, while there is skewness in the distribution of equity ownership,
the tendency for (economically and statistically) higher levels of equity ownerhip in PE compa-
nies is not driven by outliers.
Though we believe the going-private group is a valid comparison group to correct for the
endogeneity of private equity ownership, we did a robustness check on this assumption by redoing
the analysis in Table 3 (using the specification in column 3) with propensity score matching.
That is, we estimated the PrivateEquity “average treatment effect,” using nearest neighbor
propensity score matching so that the estimate of this coefficient would be more closely based
on comparisons with observations in the control sample that are most similar to those in the
PE-owned group. See Dehejia and Waba (2002) for details on this application of the original idea
in Rosenbaum and Rubin (1983). This resulted in a highly significant estimated PrivateEquity
effect of 0.028, which is similar to our regression results, providing additional support for our
identification strategy.21
These matching results, as well as the results in the first four columns of Table 3, are based
on the fraction of stock owned by the CEO. However, as noted in Section 2, equity programs
implemented by PE firms are likely to include many managers. Column (5) of Table 3 expands21We did similar propensity score matching analyses for the other incentive measures in the next two sections
and, again, the results mirrored those in the regressions we present.
14
the sample to include the three highest-paid managers, as a basic indication of whether equity
ownership is in fact higher among managers outside of the CEO. 22 In this case, the estimated
coefficient on the PE dummy is 1.7%, down from the comparable estimate for the CEO of 2.3%.
Hence, not only does the CEO in PE-owned firms tend to have higher equity than the CEO in
comparable public companies, but this is also true of the top three managers (as a group).
As detailed above, the coefficient on GoingPrivate (θ2) indicates whether PE firms choose
targets that already have relatively strong incentives. In the results of the full specification
presented in column (3) of Table 3, we report that θ2 is insignificantly different from zero. This
indicates that public companies that are acquired by PE firms tend to have the same level of
incentives, in the year before going private, as do public firms that do not go private. We also
find that θ2 is significantly different from θ1 with 79% confidence in column (3), and with over
97% confidence in all the other specifications in Table 3. This indicates the public companies
that are acquired by PE firms tend to have a significantly lower level of incentives in the year
before going private than their PE-owned counterparts, providing support for our identification
strategy.
To examine the differences between the distribution of management ownership in PE and
public companies in more detail, Figures 2 and 3 show kernel density estimates of distributions
of executive ownership. Figure 2 shows the empirical distributions for each type of firm without
conditioning on any other variables. Figure 3 shows the distributions of executive ownership for
each type of company, conditional on the full set of controls. Specifically, Figure 3 graphs the
distributions of the residuals from a regression identical to the one in column 3 of Table 3, except
that the regression excludes PrivateEquity and GoingPrivate from the set of explanatory
variables. Comparing the distributions in both figures leads to the same qualitative conclusion:
compared to public companies, the distribution of equity owned by the CEO in PE-owned
businesses has greater variance, and puts more weight on high levels of ownership. In more
quantitative terms, in Figure 3 (with controls) the interquartile range of equity ownership is 8.3%
for PE-owned firms, and 3.7% for public corporations. Also, in Figure 3, the 75th-percentile is
4.1 percentage points higher for PE-owned firms than public firms.
Our estimates may understate the differences between PE-owned firms and other firms be-22We have information for up to five executives per firm. CapitalIQ often lists fewer, which would leave a very
small sample of fourth and fifth highest paid managers.
15
cause we treat shares and options the same in our analysis (as discussed in Section 3). When
we exclude options and look at only shares, the results are very similar (the estimated effect of
PE-ownership is even slightly larger). Overall, the regression results in Table 3, as well as Fig-
ures 2 and 3, make it clear that top executive ownership is significantly larger (both statistically
and economically) in PE-owned firms than at typical publicly held corporations.
4.2 Salary of CEO
We now examine a second measure of managerial incentives — salary. We again estimate versions
of equation (1), but now with the dependent variable: Log(Salary of CEO). Table 4 contains
the results. The number of observations is reduced by 168 from the above analysis, because of
observations with zero salary (dependent variable is in logs).
The estimates in columns (1) and (2) imply that salaries are 34-36% lower at PE-owned
companies than public corporations, conditional only on year and industry dummies. Much of
this difference is simply because the PE-owned firms are smaller, however. The results for the
complete set of controls are given in column (3): we estimate that, on average, the salary of
the CEO at PE-owned companies is 9.6% lower than for similar public companies (based on the
estimated coefficient of -.10). As with equity ownership, this finding is robust to the exclusion
of large firms (unreported estimates).
Median regression shows a slightly magnified estimate (column 4) for θ1. Interestingly, the
inclusion of the top-three managers exacerbates the difference in salaries between PE-owned and
public companies: from 9.6% (column 3) to 16.3% (column 5). Hence, the salary gap between
senior managers (other than the CEO) at PE-owned firms compared to public companies is even
larger than it is for the CEO.
The estimated coefficient on the GoingPrivate dummy is insignificantly different from zero
in all specifications in Table 4. Moreover, the estimated coefficient on PrivateEquity is signifi-
cantly different from the estimated coefficient on GoingPrivate with over 99% confidence in all
specifications. This provides further verification that the differences in incentives we are finding
at PE firms compared to public firms is a causal effect, rather than a selection effect.
16
4.3 Variable Pay Share of CEO’s Cash Compensation
The third measure of managerial incentives we examine is the Variable Pay Share of Cash
Compensation, defined as: (total cash compensation – salary) / (total cash compensation).
Cash compensation primarily includes salary and bonuses. Hence, the measure is essentially
bonuses. Firms that provide higher incentives will utilize more bonuses, because bonuses are
a contingent payoff. We again estimate versions of equation (1), but now with the dependent
variable: Variable Pay Share of Cash Compensation. Table 5 contains the results. The number
of observations is reduced by 142 from the analysis of equity ownership because of executive-year
combinations with zero total cash compensation.
As shown in Table 5, the difference in variable pay share between PE firms and public
companies is significant (with 95% confidence) in all columns. In the full specification reported
in column (3), we find that PE-owned businesses tend to provide 12.7% higher variable pay
shares than public companies. Recall from the discussion of anecdotal evidence in Section 2
that our interviewees did not have a strong sense of whether bonuses would be higher at PE-
owned companies.
The estimate for θ1 based on median regression in column (4) is an attentuation of the
estimate from the mean regression of the same specification. When we include the top-three
managers (column 5) there is a small reduction in the estimated coefficient on PrivateEquity
compared to column (3). The estimated coefficient on the GoingPrivate dummy is insignificantly
different from zero in all specifications in Table 5, and the coefficients on PrivateEquity and
GoingPrivate are significantly different from each other with 90%, 75%, 99%, 98% and 99%
confidence in columns (1) to (5), respectively. This again verifies the absence of a selection
effect.
4.4 Heterogeneous Effects
The above analysis focuses on mean differences in managerial incentives between PE-owned
and public companies. However, these differences may also depend on other interesting factors.
For instance, there is reason to expect that the differences between public corporations and
PE-owned businesses have decreased over time, as public companies learn to mimic the prac-
17
tices of PE firms. Or as Holmstrom and Kaplan (2001) argue, public firms have been catching
up with PE practices during the 1990s, due to: (i) innovation in information and communica-
tions technology which made capital markets more efficient (i.e., enhanced disciplining); and
(ii) deregulation which increased the rewards to restructuring. We therefore ask whether the
gap in managerial incentives between PE companies and public companies has been shrinking
over time?
To examine this possibility, we generalize the specification in equation (1) to allow θ1 and θ2
to have different values in the years 1996–2001 and 2002–2005. In Table 6 we report the results
for two different measures of managerial incentives: fraction of equity owned by the CEO, and
salary of the CEO (the first two measures examined above). In each case we report the estimates
for the coefficient on PrivateEquity interacted with a group dummy. In column (1) it is apparent
that the difference between PE and public companies in terms of equity ownership has decreased
over time, consistent with the prediction of Holmstrom and Kaplan (2001).23 The estimate
for the post-2001 group is significantly different from zero, indicating sustained differences in
managerial incentives between PE-owned firms and public corporations. Column (2) shows that
the difference in average salaries has increased over time, contrary to expectations. Hence, the
evidence is mixed as to whether there is convergence over time in managerial incentives between
public and PE-owned companies.
A second form of heterogeneity we explore is size effects: is the gap in managerial incentives
between PE companies and public companies different for big versus small companies? This is of
interest because agency costs are likely to be higher in larger companies (e.g., harder to monitor)
and incentives may create more risk for a CEO in a larger company. Also, there is a trend towards
bigger PE acquisitions. In columns (3) and (4) of Table 6 we report estimates for the equity
ownership and salary measures, for the largest 25% of PE-owned firms, and the smallest 25% of
PE-owned firms. The measure of size is based on the number of employees (of the PE-owned
company). We find that the difference between PE-owned firms and public corporations, with
respect to equity ownership of CEOs, is bigger in the smallest 25% of firms than in the largest
25%. The difference is statistically different with only 88% confidence, however. We also find
that the difference in salaries between PE-owned and public companies is greater in the top 25%
than in the bottom 25% (but the difference is not statistically significant). These point estimates23The estimates reported in column (1) are statistically different with 91% confidence.
18
suggest that large public companies tend to provide more similar managerial incentives to their
PE counterparts than do small public companies.
A third form of heterogeneity relates to differences across PE firms, which may differ in the
degree to which they emphasize managerial incentives versus other mechanisms such as replacing
management, enhanced oversight, and the importance of debt.24 In other words, how homoge-
neous are the practices of PE firms, and how substitutable are they? As a basic test of such
differences, we ask whether top-tier PE firms tend to implement different managerial incentives
than other PE firms? To identify the top-tier PE firms, we adopt the “power list” in the March
5, 2007, issue of Fortune: Blackstone, KKR, Carlyle, TPG, Bain Capital, Providence Equity
Partners, Apollo Advisors, Warburg Pincus, Cerberus, and Thomas H. Lee. In column (5) of
Table 6 we report that in the case of top-10 PE firms, the equity ownership of the CEO is
no different, on average, from their public counterparts. In contrast, for non-top-10 PE firms,
CEO ownership in PE-owned companies tends to be significantly greater than in their public
counterparts. In column (6) we find no difference in CEO salaries between these two groups of
PE firms. This is far from conclusive, but it suggests there may be important differences across
PE firms in their approach to modifying managerial incentives in the companies they acquire.
Lastly, a fourth form of heterogeneity concerns managerial turnover: do incentives in PE-
owned businesses tend to differ for CEOs that join the firm following the buyout (i.e., there is
CEO turnover) compared to CEOs that are present before and after the buyout? It is conceivable
that management turnover is an important driver of value creation (see Kaplan, Klebanov and
Sorensen, 2007), and may be a substitute for increased managerial incentives. In columns (7)
and (8) of Table 6 we distinguish firms where the CEO joined before the LBO with firms
where the CEO joined after. We find significantly higher equity-based incentives for those
CEOs that were present before the buyout, consistent with the view that management turnover
and increased incentives may be substitute drivers of value creation.25 The estimates for salary
differences suggest a different story, however. In column (8) we report that salaries for new CEOs
tend to be significantly lower than salaries for old CEOs (relative to their public counterparts),
suggesting weaker incentives for CEOs that were present before the buyout. The fact that
incentives and salary are positively related to CEO tenure could be due to executives becoming24See Cressy, Munari and Malipiero (2007) for a related analysis of differences in PE performance based on the
degree of specialization.25The difference between the two groups is statistically significant with 98% confidence.
19
more valuable with experience or tenure, to the fact that pre-PE CEOs may have been founders,
or it could indicate that the PE firms had to make more attractive offers to CEOs in place at
the time of the transaction in order to get them to help get the deal approved by employees and
other stakeholders.
4.5 Summary
To summarize the key results in this section, we find that, relative to public corporations, on
average, PE-owned firms: (i) provide the CEO with 2.3 percentage points more equity (that
is, nearly twice as much); (ii) 9.6% lower salary; and (iii) 12.7% higher variable pay share.
These estimates are all based on a specification in which we control for year dummies, industry
dummies, and various observed firm characteristics. Our analysis also indicates these estimates
are not driven by selection effects and can plausibly be interpreted as the causal impact of PE
ownership.
How do these results compare to prior research? In Table 7 we summarize the findings
from the two prior papers that also study CEO equity ownership in public versus private (via
LBO) businesses—Kaplan (1989a) and Muscarella and Vetsuypens (1990). We also include the
results from our analysis in the table. As noted above, both prior studies examine pre-1990
buyouts. Note also that Muscarella and Vetsuypens’ (1990) findings are based on a comparison
of incentives before and after an IPO, which confounds the issue of the longevity of higher
incentives introduced by PE firms (as discussed in Section 3).
Generally we find lower levels of CEO equity ownership than the prior papers, though the
difference between our findings and Kaplan (1989a) are fairly small with respect to the medians.
The proportional difference between public and private is more similar across studies. In terms
of means, Kaplan finds a 107% increase, Muscarella and Vetsuypens find a 39% increase, and
we find a 64% increase. In terms of medians, Kaplan finds a 357% increase, Muscarella and
Vetsuypens find a 42% increase, and we find a 147% increase.26
26Another interesting comparison is with CEO ownership in private firms more generally (not just firms thathave undergone an LBO). Cole and Mehran (2008) find that CEO’s typically own in excess of 75% of the equityin private corporations in 2003. These firms tend to be significantly smaller than those that underwent an LBO.
20
5 Operational Differences Between PE-Owned Businesses and
Public Corporations
Having shown that PE firms significantly (statistically and economically) increase managerial
incentives relative to public companies, based on U.S. data for the period 1996 to 2004, the
question naturally arises as to whether there are corresponding improvements in operational
performance? This question has actually received much more attention in the literature than
the changes in managerial incentives by PE firms. Indeed, there are numerous papers, with a
wide range of results, looking for evidence of value creation by PE firms. In Table 8 we present a
summary of this literature. Conclusions depend on what measure, time period, and geographic
location of the sample is used and how the sample is constructed (type of acquisition and type
of exit). In this section we also examine this kind of evidence for our sample.
Although not a measure of performance, as a reality check on the data, we first analyze
the changes in the importance of debt. We analyze the debt-assets ratio instead of the more
conventional debt-equity ratio, because negative equity is not uncommon in the data. Again,
using Petco as an example, Figure 4 shows that PE ownership is associated with a dramatic
increase in debt. Petco’s debt returned to its pre-PE level slowly over a few years after it went
public again. We will again show that Petco is reasonably typical of other PE-owned firms.
To examine changes in debt for the broader sample, we regress the debt-assets ratio on the
same controls as column (4) in Tables 3 to 5. There are conspicuous outliers in the distribution
of debt-asset ratios, so we trim the top and bottom 1 percent of observations (there is no impact
on the qualitative findings). The results are provided in column (1) of Table 9. As expected,
we find that PE ownership causes an average increase of 51.3% in the debt-assets ratio. We
also find that the debt-assets ratio in going-private companies is insignificantly different (at the
1% significance level) from the public company control sample, indicating that this effect is not
driven by selection.
We now turn to measures of profitability and operational efficiency. First, Figure 5 shows
the EBITDA to assets ratio at Petco over its different forms of ownership. The graph indicates
that there is an underlying time trend of improving performance that existed before the PE
ownership phase and was also present after. Hence, on the face of it, the figure does not provide
21
compelling evidence that the PE owners caused an increase in profitability (by this measure).
The example highlights the importance of controlling for time effects.
Using the same regression framework and controls we used for the debt-assets ratio and the
incentive measures, we examine the following performance measures: EBITDA / (Total Assets),
Sales Per Employee, and Employees / (Total Assets). The results for each of these dependent
variables are reported in columns 2 to 4 of Table 9. We find that the estimated effect of PE
ownership on EBITDA / (Total Assets) is marginally statistically significant (90% confidence
level), and the effect on Sales Per Employee is positive and significant (95% confidence level). In
both cases there is also no significant difference between the going-private firms and the public
controls. The estimated effect on Employees / (Total Assets) is insignificant. We also looked at
the correlation between the level of incentives and the above performance measures, finding no
strong relationships.
One reasonable interpretation is that our findings provide mild support for the hypothesis
that PE ownership causes operational improvements. The point estimates in columns 2 and 3
are quite substantial. For example, EBITDA / (Total Assets) at PE-owned firms is predicted
to be one-seventh higher than for comparable public firms. However, the standard errors are
quite large and we cannot rule out much larger or negligible effects. More problematically
(and unlike the incentive and leverage measures), our results are quite sensitive to specification
choices such as whether to trim outliers, which controls to include, and whether we use OLS
or median regression. Given the variety of results and interpretations we can generate for the
relationship between private equity ownership and operating success, it is perhaps not surprising
that the conclusions of the papers listed in Table 8 are so inconsistent.27 Standard accounting
data (especially given the extreme leverage, write-offs, and other unusual accounting details
associated with private equity) and the fairly small samples available make it difficult to come
to definitive conclusions. Overall, we believe our results are consistent with the possibility that
PE firms improve operational efficiency at their portfolio companies. However, like this literature
as whole, we think drawing any strong conclusions is inappropriate.27A few recent studies have used datasets that are not based on financial disclosures to compare large samples
of PE-backed firms to comparable firms. For example, Davis, et al (2008) use Census data to show how PEownership affects job creation and job destruction, and Lerner, Sørensen, and Stromberg (2008) use patent datato study the connection between PE ownership and innovation. These larger datasets allow for more preciseestimates than can generally be done using accounting data. These analyses are very useful for showing howPE-backed firms operate, but they cannot directly show whether these firms are more or less efficiently operatedthan other firms.
22
6 Longevity of Increased Incentives after IPO
One of the virtues of our dataset is that we focus on PE-owned companies that undergo an IPO,
which allows us to examine changes after the firm transitions from private to public. So we
now analyze the longevity of the higher degree of managerial incentives once these companies go
public. There are at least a couple of reasons why this is interesting. If the degree of managerial
incentives rapidly falls following an IPO (or reverse buyout), this may suggest PE firms do not
implement long-lasting organizational changes in general. Also, PE firms have been criticized by
some commentators for “quick flips”: buying companies and selling them shortly after (in one
year, say) for a large profit. The suggestion is that one year is too short a time to implement real
or permanent improvements in an organization, so the profit must stem from either underpaying
for the company or overselling it to the new owners. However, if managers continue to maintain
high equity stakes in their company after the IPO, then this suggests the IPO valuation may
not be artificially high, because the managers also have significant wealth at stake.
To examine the longevity of managerial incentives following reverse buyouts, we generalize
equation (1) in the following way:
Yit = α + X ′itβ +
4∑j=−1
θjPrivateEquityit +−1∑
k=−5
θkGoingPrivateit + εit. (2)
Instead of including only the first available observation for PE-owned firms that go public,
we now include annual observations for the year before the IPO and each subsequent year up
to four years after the IPO. The θj ’s capture how managerial incentives (or other dependent
variables) evolve at these firms from just before the IPO until four years after. Similarly, instead
of including only the last public year for the going-private sample, we now include all available
years and the θk’s track how incentives evolve in the years leading up to the purchase by a PE
firm.
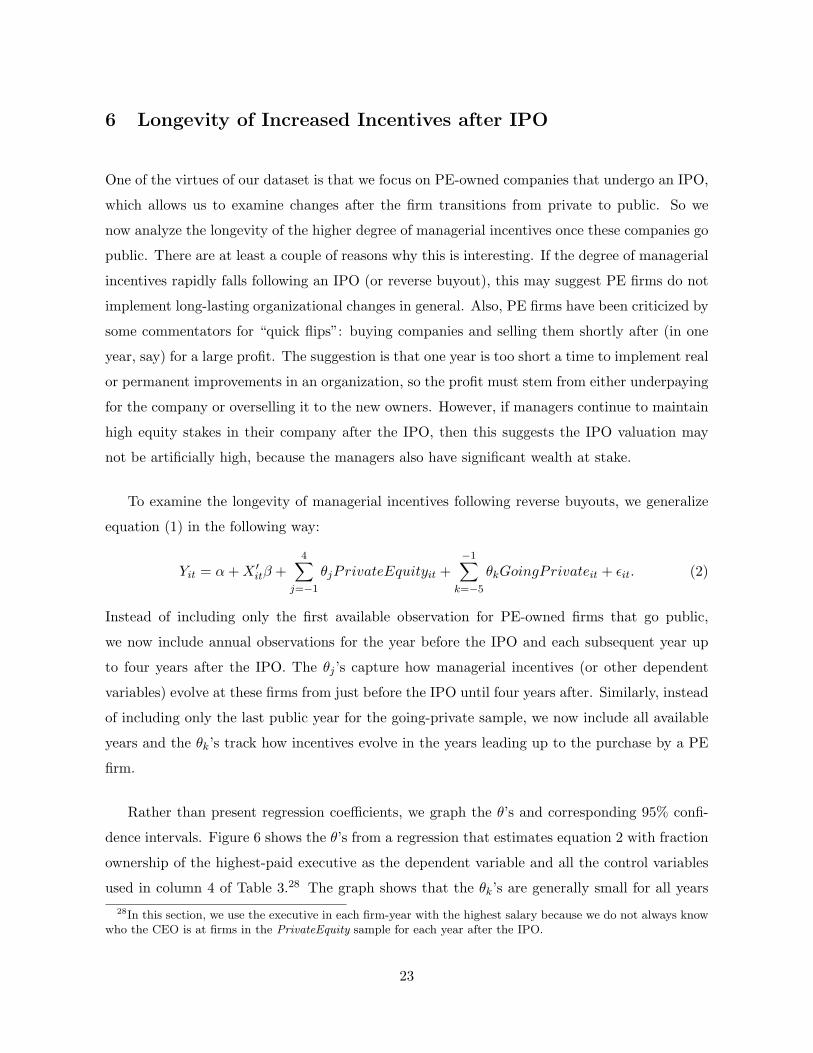
Rather than present regression coefficients, we graph the θ’s and corresponding 95% confi-
dence intervals. Figure 6 shows the θ’s from a regression that estimates equation 2 with fraction
ownership of the highest-paid executive as the dependent variable and all the control variables
used in column 4 of Table 3.28 The graph shows that the θk’s are generally small for all years28In this section, we use the executive in each firm-year with the highest salary because we do not always know
who the CEO is at firms in the PrivateEquity sample for each year after the IPO.
23
leading up to firms going private and there is no obvious trend before PE investments. The evo-
lution of the PE-owned sample (and the θj ’s), however, shows that executive ownership drops
quickly and substantially right after the IPO. Managerial ownership is very high before the IPO
and at the time of the IPO, but quickly drops to levels similar to public firms. This suggests
that whatever incentives PE firms put in place for managers of their companies last only as long
as the PE ownership lasts. The firms do not appear to put in place different incentive systems
that outlive the PE investment.
It would be interesting to distinguish between dilution of equity as a result of an IPO for the
mechanical reason that there is an increase in total shares, and any reduction in CEO equity
ownership due to disinvestment decisions by the CEO. This is difficult to implement in practice
because, as they go public, most firms change the units of their equity in a way that makes a
share before the IPO hard to compare to one after the IPO. However, having combed through
the prospectuses of all the firms in our sample, it is clear to us that dilution is the primary
driver in the decrease in CEO ownership (at least in the first year after the IPO). While there
is a minority of CEOs that sell a substantial portion of their shares within a year after the IPO,
the large majority do not.
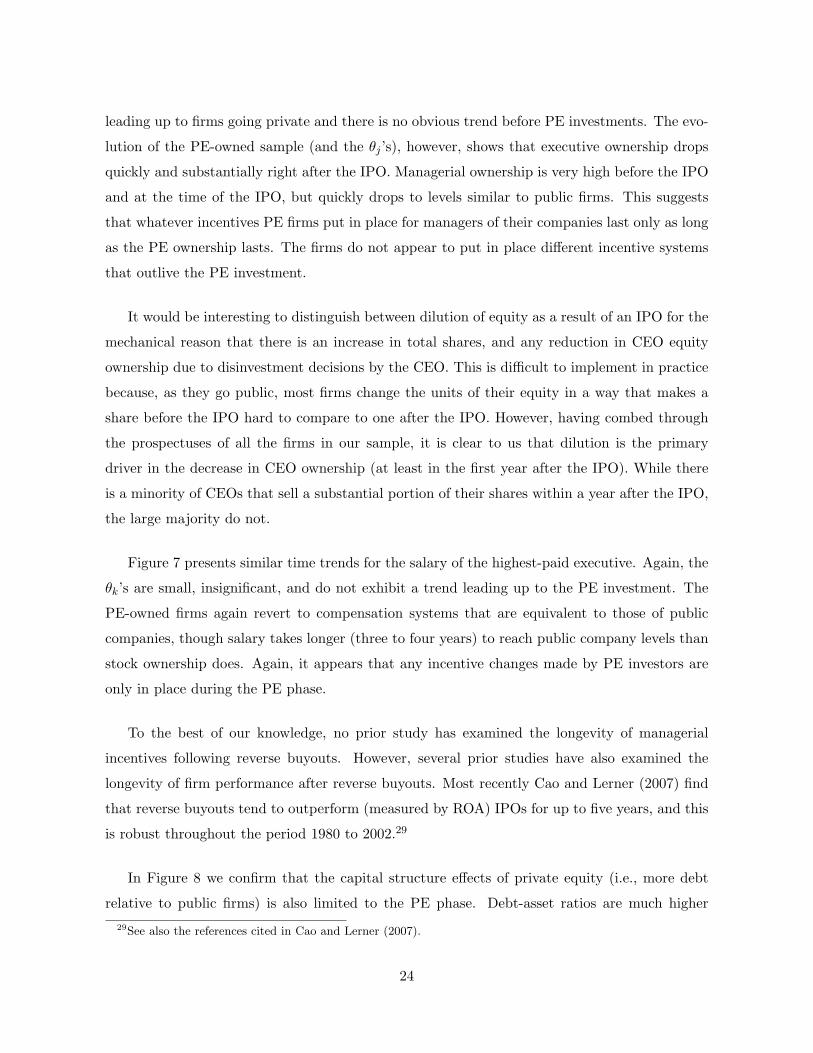
Figure 7 presents similar time trends for the salary of the highest-paid executive. Again, the
θk’s are small, insignificant, and do not exhibit a trend leading up to the PE investment. The
PE-owned firms again revert to compensation systems that are equivalent to those of public
companies, though salary takes longer (three to four years) to reach public company levels than
stock ownership does. Again, it appears that any incentive changes made by PE investors are
only in place during the PE phase.
To the best of our knowledge, no prior study has examined the longevity of managerial
incentives following reverse buyouts. However, several prior studies have also examined the
longevity of firm performance after reverse buyouts. Most recently Cao and Lerner (2007) find
that reverse buyouts tend to outperform (measured by ROA) IPOs for up to five years, and this
is robust throughout the period 1980 to 2002.29
In Figure 8 we confirm that the capital structure effects of private equity (i.e., more debt
relative to public firms) is also limited to the PE phase. Debt-asset ratios are much higher29See also the references cited in Cao and Lerner (2007).
24
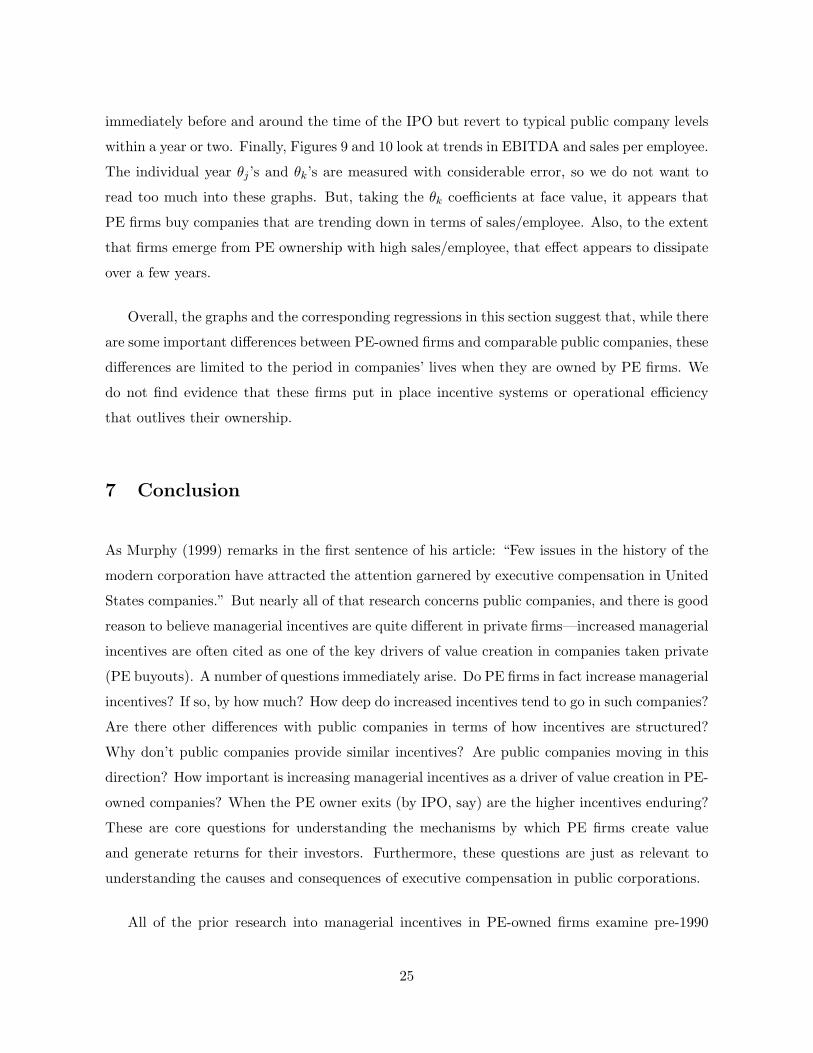
immediately before and around the time of the IPO but revert to typical public company levels
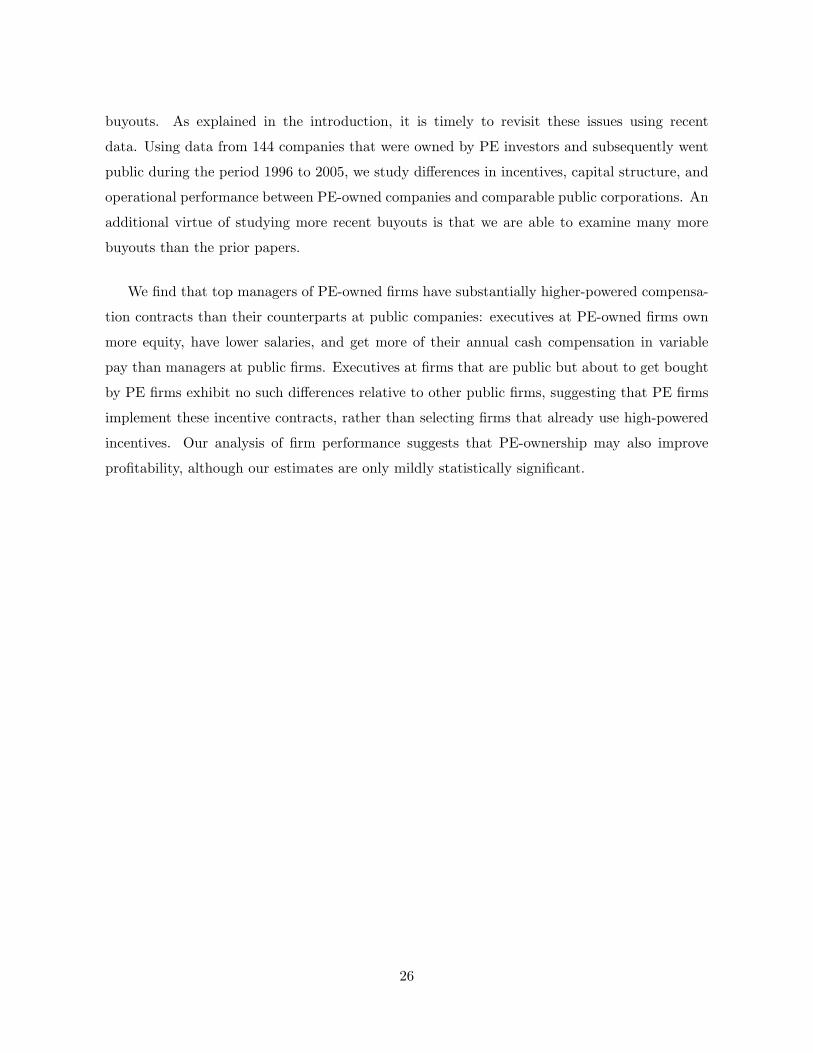
within a year or two. Finally, Figures 9 and 10 look at trends in EBITDA and sales per employee.
The individual year θj ’s and θk’s are measured with considerable error, so we do not want to
read too much into these graphs. But, taking the θk coefficients at face value, it appears that
PE firms buy companies that are trending down in terms of sales/employee. Also, to the extent
that firms emerge from PE ownership with high sales/employee, that effect appears to dissipate
over a few years.
Overall, the graphs and the corresponding regressions in this section suggest that, while there
are some important differences between PE-owned firms and comparable public companies, these
differences are limited to the period in companies’ lives when they are owned by PE firms. We
do not find evidence that these firms put in place incentive systems or operational efficiency
that outlives their ownership.
7 Conclusion
As Murphy (1999) remarks in the first sentence of his article: “Few issues in the history of the
modern corporation have attracted the attention garnered by executive compensation in United
States companies.” But nearly all of that research concerns public companies, and there is good
reason to believe managerial incentives are quite different in private firms—increased managerial
incentives are often cited as one of the key drivers of value creation in companies taken private
(PE buyouts). A number of questions immediately arise. Do PE firms in fact increase managerial
incentives? If so, by how much? How deep do increased incentives tend to go in such companies?
Are there other differences with public companies in terms of how incentives are structured?
Why don’t public companies provide similar incentives? Are public companies moving in this
direction? How important is increasing managerial incentives as a driver of value creation in PE-
owned companies? When the PE owner exits (by IPO, say) are the higher incentives enduring?
These are core questions for understanding the mechanisms by which PE firms create value
and generate returns for their investors. Furthermore, these questions are just as relevant to
understanding the causes and consequences of executive compensation in public corporations.
All of the prior research into managerial incentives in PE-owned firms examine pre-1990
25
buyouts. As explained in the introduction, it is timely to revisit these issues using recent
data. Using data from 144 companies that were owned by PE investors and subsequently went
public during the period 1996 to 2005, we study differences in incentives, capital structure, and
operational performance between PE-owned companies and comparable public corporations. An
additional virtue of studying more recent buyouts is that we are able to examine many more
buyouts than the prior papers.
We find that top managers of PE-owned firms have substantially higher-powered compensa-
tion contracts than their counterparts at public companies: executives at PE-owned firms own
more equity, have lower salaries, and get more of their annual cash compensation in variable
pay than managers at public firms. Executives at firms that are public but about to get bought
by PE firms exhibit no such differences relative to other public firms, suggesting that PE firms
implement these incentive contracts, rather than selecting firms that already use high-powered
incentives. Our analysis of firm performance suggests that PE-ownership may also improve
profitability, although our estimates are only mildly statistically significant.
26
References
Acharya, V.V., M. Hahn and C. Kehoe (2008): “Corporate Governance and Value Creation:Evidence from Private Equity,” Mimeo.
Baker, G.P. and K.H. Wruck (1989): “Organizational Changes and Value Creation in LeveragedBuyouts: The Case of The O.M. Scott & Sons Company,” Journal of Financial Economics,25, 163–90.
Bebchuk, L.A. and J.M. Fried (2004): Pay Without Performance: The Unfulfilled Promise ofExecutive Compensation, Harvard University Press.
Bharath, S.T. and A.K. Dittmar (2006): “To Be Or Not To Be (Public): Using Going PrivateTransactions to Examine Why Firms Go Public,” Mimeo.
Cao, J. and J. Lerner (2007): “The Performance of Reverse Leveraged Buyouts,” forthcomingin Journal of Financial Economics.
Cole, R.A. and H. Mehran (2008): “What Do We Know About Executive Compensation atPrivately Held Firms?” Mimeo.
Cressy, R., F. Munari and A. Malipiero (2007): “Playing to Their Strengths? Evidence thatSpecialization in the Private Equity Industry Confers Competitive Advantage,” forthcom-ing in Journal of Corporate Finance.
Davis, S.J., J. Haltiwanger, R. Jarmin, J. Lerner, and J. Miranda (2008): “Private Equity andEmployment,” Mimeo.
Dehejia, R.H. and S. Wahba (2002): “Propensity Score-Matching Methods for NonexperimentalCausal Studies,” Review of Economics and Statistics, 84, 151–161.
Desbrieres, P. and A. Schatt (2002): “The Impacts of LBOs on the Performance of AcquiredFirms: The French Case,” Journal of Business Finance and Accounting, 29(5), 695-729.
Guo, S., E.S. Hotchkiss and W. Song (2008): “Do Buyouts (Still) Create Value?” Mimeo.
Hall, B.J. and J.B. Liebman (1998): “Are CEOs Really Paid Like Beaurocrats?” QuarterlyJournal of Economics, 113(3), 653–91.
Harris, R., D.S. Siegel, and M. Wright (2005): “Assessing the Impact of Management Buy-outs on Economic Efficiency: Plant-Level Evidence from the United Kingdom,” Review ofEconomics and Statistics, 87(1), 148–53.
Hermalin, B. (2005): “Trends in Corporate Governance,” Journal of Finance, 60(5), 2351–84.
Holmstrom, B. and S.N. Kaplan (2001): “Corporate Governance and Merger Activity in theUnited States: Making Sense of the 1980s and 1990s,” Journal of Economic Perspectives,15(2), 121–44.
27
Jackson, R.J. Jr. (2008): “Private Equity and Executive Compensation,” Mimeo.
Jensen, M.C. (1986): “Agency Costs of Free Cash Flow, Corporate Finance, and Takeovers,”American Economic Review, 76(2), 323–29.
Jensen, M.C. (1989): “Eclipse of the Public Corporation,” Harvard Business Review, September-October, 61–74.
Kaplan, S.N. (1989a): “The Effects of Management Buyouts on Operating Performance andValue,” Journal of Financial Economics, 24, 217–54.
Kaplan, S.N. (1989b): “Management Buyouts: Evidence on Taxes as a Source of Value,”Journal of Finance, 44(3), 611–32.
Kaplan, S.N. (1997): “The Evolution of U.S. Corporate Governance: We Are All Henry KravisNow,” Mimeo.
Kaplan, S.N., M.M. Klebanov, and M. Sorensen (2007): “Which CEO Characteristics andAbilities Matter?” Mimeo.
Kaplan, S.N. and A. Schoar (2005): “Private Equity Performance: Returns, Persistence, andCapital Flows,” Journal of Finance, 60(4), 1791–823.
Lazear, E.P. (2005): “Output-Based Pay: Incentives or Sorting?” in S.W. Polachek (ed.),Research in Labor Economics, vol. 23, 1–25.
Lehn, K. and A. Poulsen (1991): “Contractual Resolution of Bondholder-Stockholder Conflictsin Leveraged Buyouts,” Journal of Law and Economics, 34(2), 645–73.
Lerner, J., M. Sørensen, and P. Stromberg (2008): “Private Equity and Long Run Investment:The Case of Innovation,” NBER Working Paper, No. 14623.
Lichtenberg, F.R. and D.S. Siegel (1990): “The Effects of Leveraged Buyouts on Productivityand Related Aspects of Firm Behavior,” Journal of Financial Economics, 27, 165–94.
Mehran, H. and S. Peristiani (2006): “Financial Visibility and the Decision to Go Private,”Mimeo.
Meuleman, M., K. Amess, M. Wright, and L. Scholes (2008): “Agency, Strategic Entrepreneur-ship and the Performance of Private Equity Backed Buyouts,” Mimeo.
Murphy, K.J. (1999): “Executive Compensation,” in O. Ashenfelter and D. Card (eds.), Hand-book of Labor Economics, vol. 3, 2485–563.
Muscarella, C.J. and M.R. Vetsuypens (1990): “Efficiency and Organizational Structure: AStudy of Reverse LBOs,” Journal of Finance, 45(5), 1389–413.
Ravenscraft, D.J. and F.M. Scherer (1987): “Life After Takeover,” Journal of Industrial Eco-nomics, 36(2), 147–56.
28
Rosenbaum, P.R. and D.B. Rubin (1983): “The Central Role of the Propensity Score in Ob-servational Studies for Causal Effects,” Biometrika, 70, 41–55.
Schaefer, S. (1998): “Influence Costs, Structural Inertia, and Organizational Change,” Journalof Economics and Management Strategy, 7(2), 238–263.
Stromberg, P. (2008): “The New Demography of Private Equity,” Globalization of AlternativeInvestments, Working Papers Volume 1, World Economic Forum.
Smith, A.J. (1990): “Corporate Ownership Structure and Performance: The Case of Manage-ment Buyouts,” Journal of Financial Economics, 27, 143–64.
Vinten, F. (2007): “The Performance of Private Equity Buyout Fund Owned Firms,” Mimeo.
Weir, C., P. Jones, and M. Wright (2008): “Public to Private Transactions, Private Equity andPerformance in the U.K.: An Empirical Analysis of the Impact of Going Private,” Mimeo.
Wright, M., S. Thompson, and K. Robbie (1992): “Venture Capital and Management-LedBuy-Outs: European Evidence,” Journal of Business Venturing, 7(1), 47–71.
Wright, M., N. Wilson, and K. Robbie (1997): “The Longer Term Performance of ManagementBuy-Outs,” Frontiers of Entrepreneurship Research, 555-569.
29
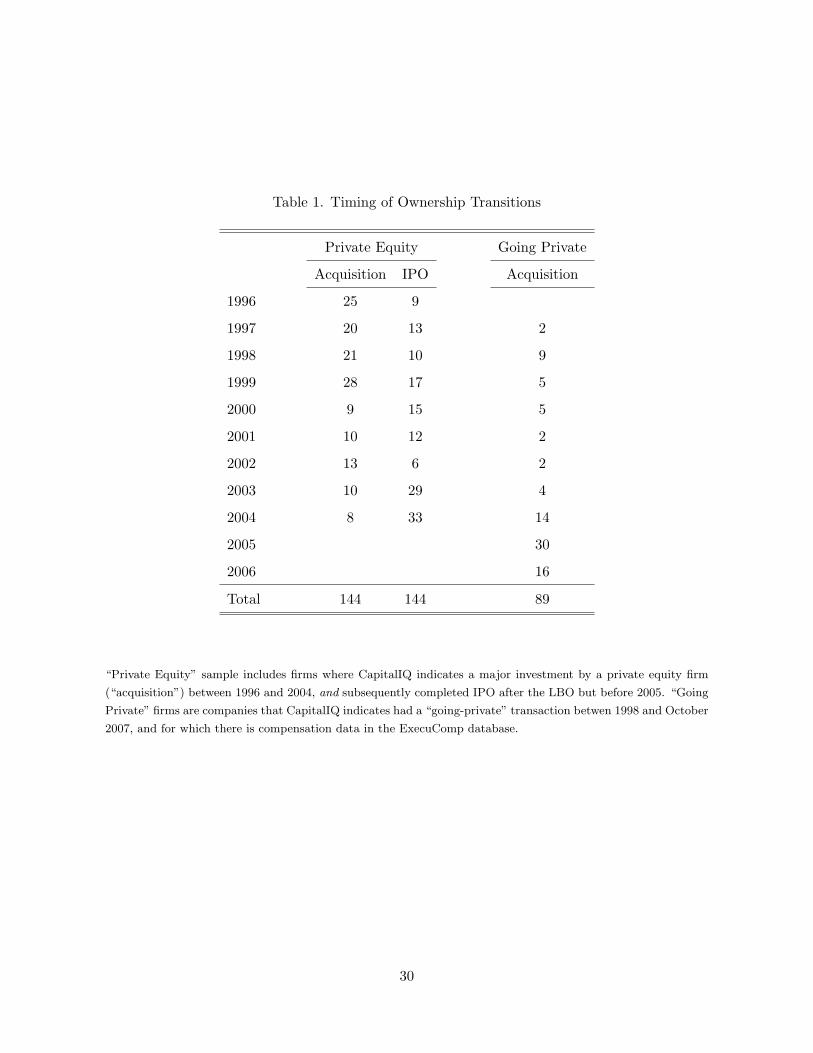
Table 1. Timing of Ownership Transitions
Private Equity Going Private
Acquisition IPO Acquisition
1996 25 9
1997 20 13 2
1998 21 10 9
1999 28 17 5
2000 9 15 5
2001 10 12 2
2002 13 6 2
2003 10 29 4
2004 8 33 14
2005 30
2006 16
Total 144 144 89
“Private Equity” sample includes firms where CapitalIQ indicates a major investment by a private equity firm
(“acquisition”) between 1996 and 2004, and subsequently completed IPO after the LBO but before 2005. “Going
Private” firms are companies that CapitalIQ indicates had a “going-private” transaction betwen 1998 and October
2007, and for which there is compensation data in the ExecuComp database.
30
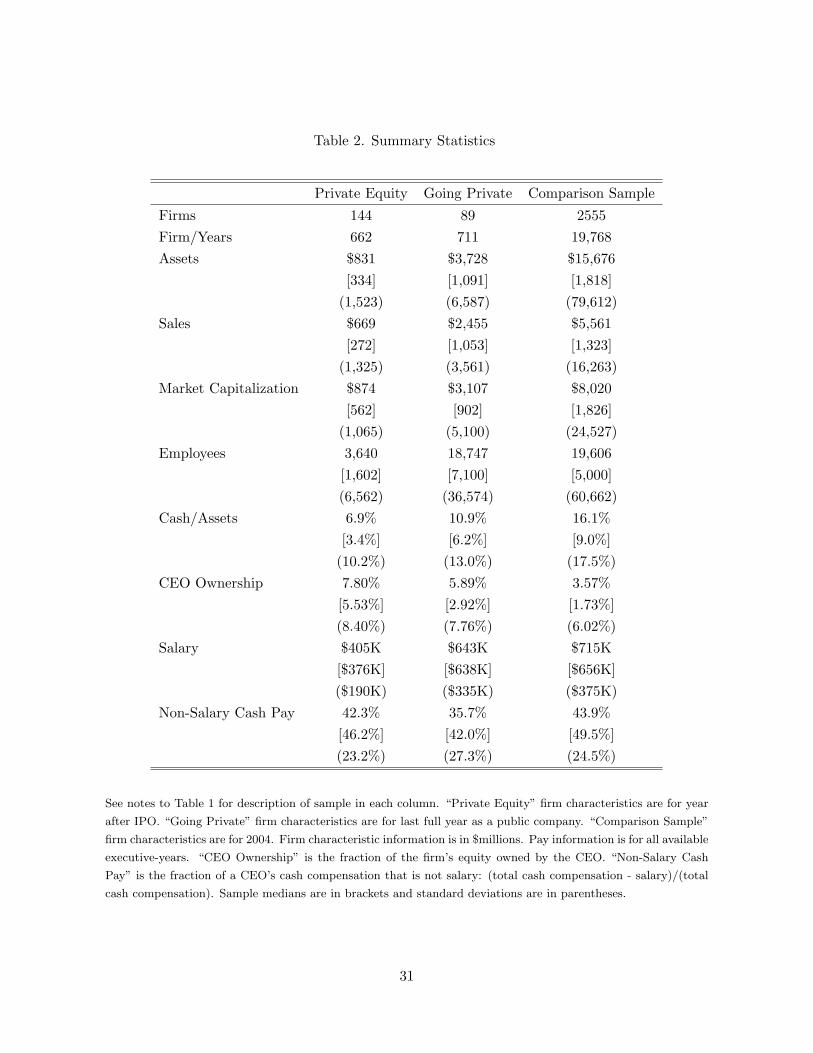
Table 2. Summary Statistics
Private Equity Going Private Comparison Sample
Firms 144 89 2555Firm/Years 662 711 19,768Assets $831 $3,728 $15,676
[334] [1,091] [1,818](1,523) (6,587) (79,612)
Sales $669 $2,455 $5,561[272] [1,053] [1,323]
(1,325) (3,561) (16,263)Market Capitalization $874 $3,107 $8,020
[562] [902] [1,826](1,065) (5,100) (24,527)
Employees 3,640 18,747 19,606[1,602] [7,100] [5,000](6,562) (36,574) (60,662)
Cash/Assets 6.9% 10.9% 16.1%[3.4%] [6.2%] [9.0%]
(10.2%) (13.0%) (17.5%)CEO Ownership 7.80% 5.89% 3.57%
[5.53%] [2.92%] [1.73%](8.40%) (7.76%) (6.02%)
Salary $405K $643K $715K[$376K] [$638K] [$656K]($190K) ($335K) ($375K)
Non-Salary Cash Pay 42.3% 35.7% 43.9%[46.2%] [42.0%] [49.5%](23.2%) (27.3%) (24.5%)
See notes to Table 1 for description of sample in each column. “Private Equity” firm characteristics are for year
after IPO. “Going Private” firm characteristics are for last full year as a public company. “Comparison Sample”
firm characteristics are for 2004. Firm characteristic information is in $millions. Pay information is for all available
executive-years. “CEO Ownership” is the fraction of the firm’s equity owned by the CEO. “Non-Salary Cash
Pay” is the fraction of a CEO’s cash compensation that is not salary: (total cash compensation - salary)/(total
cash compensation). Sample medians are in brackets and standard deviations are in parentheses.
31
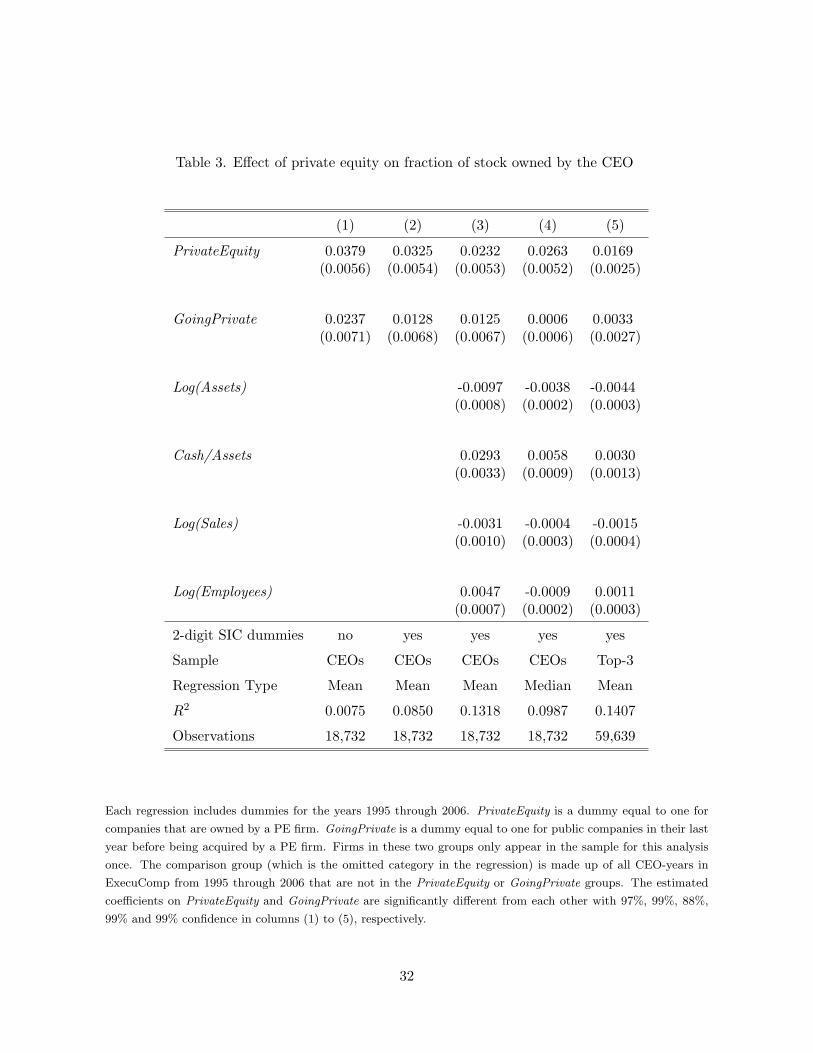
Table 3. Effect of private equity on fraction of stock owned by the CEO
(1) (2) (3) (4) (5)
PrivateEquity 0.0379 0.0325 0.0232 0.0263 0.0169(0.0056) (0.0054) (0.0053) (0.0052) (0.0025)
GoingPrivate 0.0237 0.0128 0.0125 0.0006 0.0033(0.0071) (0.0068) (0.0067) (0.0006) (0.0027)
Log(Assets) -0.0097 -0.0038 -0.0044(0.0008) (0.0002) (0.0003)
Cash/Assets 0.0293 0.0058 0.0030(0.0033) (0.0009) (0.0013)
Log(Sales) -0.0031 -0.0004 -0.0015(0.0010) (0.0003) (0.0004)
Log(Employees) 0.0047 -0.0009 0.0011(0.0007) (0.0002) (0.0003)
2-digit SIC dummies no yes yes yes yes
Sample CEOs CEOs CEOs CEOs Top-3
Regression Type Mean Mean Mean Median Mean
R2 0.0075 0.0850 0.1318 0.0987 0.1407
Observations 18,732 18,732 18,732 18,732 59,639
Each regression includes dummies for the years 1995 through 2006. PrivateEquity is a dummy equal to one for
companies that are owned by a PE firm. GoingPrivate is a dummy equal to one for public companies in their last
year before being acquired by a PE firm. Firms in these two groups only appear in the sample for this analysis
once. The comparison group (which is the omitted category in the regression) is made up of all CEO-years in
ExecuComp from 1995 through 2006 that are not in the PrivateEquity or GoingPrivate groups. The estimated
coefficients on PrivateEquity and GoingPrivate are significantly different from each other with 97%, 99%, 88%,
99% and 99% confidence in columns (1) to (5), respectively.
32
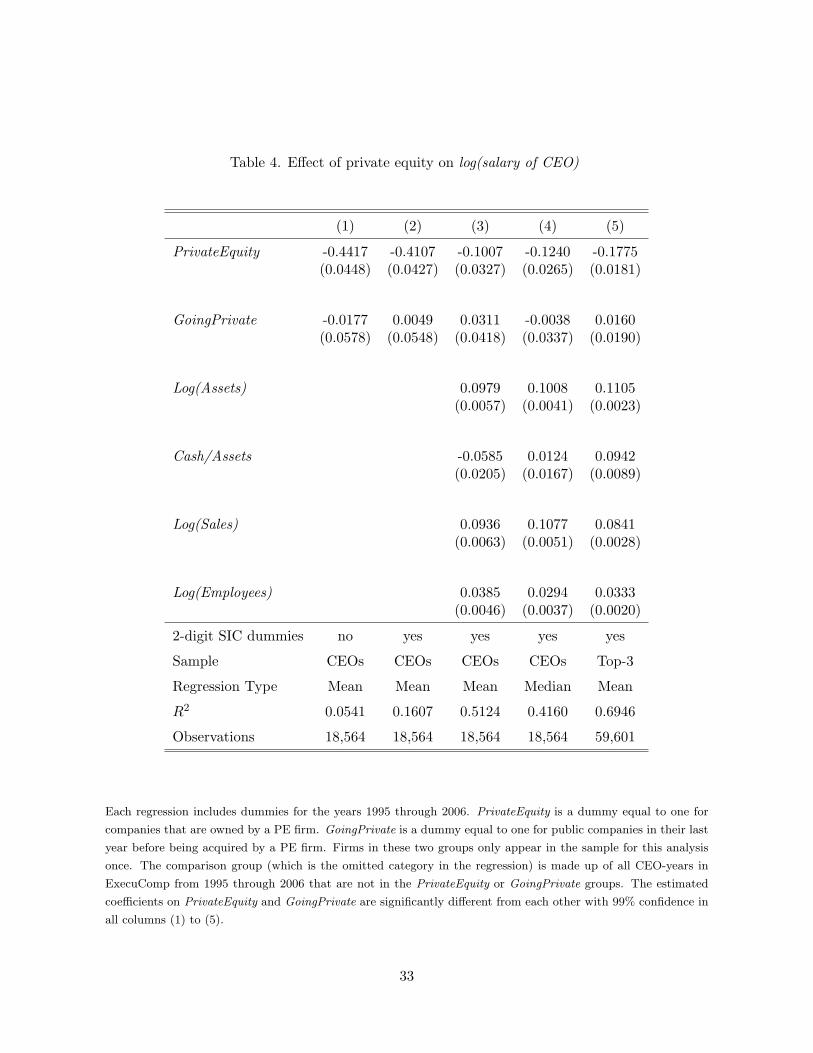
Table 4. Effect of private equity on log(salary of CEO)
(1) (2) (3) (4) (5)
PrivateEquity -0.4417 -0.4107 -0.1007 -0.1240 -0.1775(0.0448) (0.0427) (0.0327) (0.0265) (0.0181)
GoingPrivate -0.0177 0.0049 0.0311 -0.0038 0.0160(0.0578) (0.0548) (0.0418) (0.0337) (0.0190)
Log(Assets) 0.0979 0.1008 0.1105(0.0057) (0.0041) (0.0023)
Cash/Assets -0.0585 0.0124 0.0942(0.0205) (0.0167) (0.0089)
Log(Sales) 0.0936 0.1077 0.0841(0.0063) (0.0051) (0.0028)
Log(Employees) 0.0385 0.0294 0.0333(0.0046) (0.0037) (0.0020)
2-digit SIC dummies no yes yes yes yes
Sample CEOs CEOs CEOs CEOs Top-3
Regression Type Mean Mean Mean Median Mean
R2 0.0541 0.1607 0.5124 0.4160 0.6946
Observations 18,564 18,564 18,564 18,564 59,601
Each regression includes dummies for the years 1995 through 2006. PrivateEquity is a dummy equal to one for
companies that are owned by a PE firm. GoingPrivate is a dummy equal to one for public companies in their last
year before being acquired by a PE firm. Firms in these two groups only appear in the sample for this analysis
once. The comparison group (which is the omitted category in the regression) is made up of all CEO-years in
ExecuComp from 1995 through 2006 that are not in the PrivateEquity or GoingPrivate groups. The estimated
coefficients on PrivateEquity and GoingPrivate are significantly different from each other with 99% confidence in
all columns (1) to (5).
33
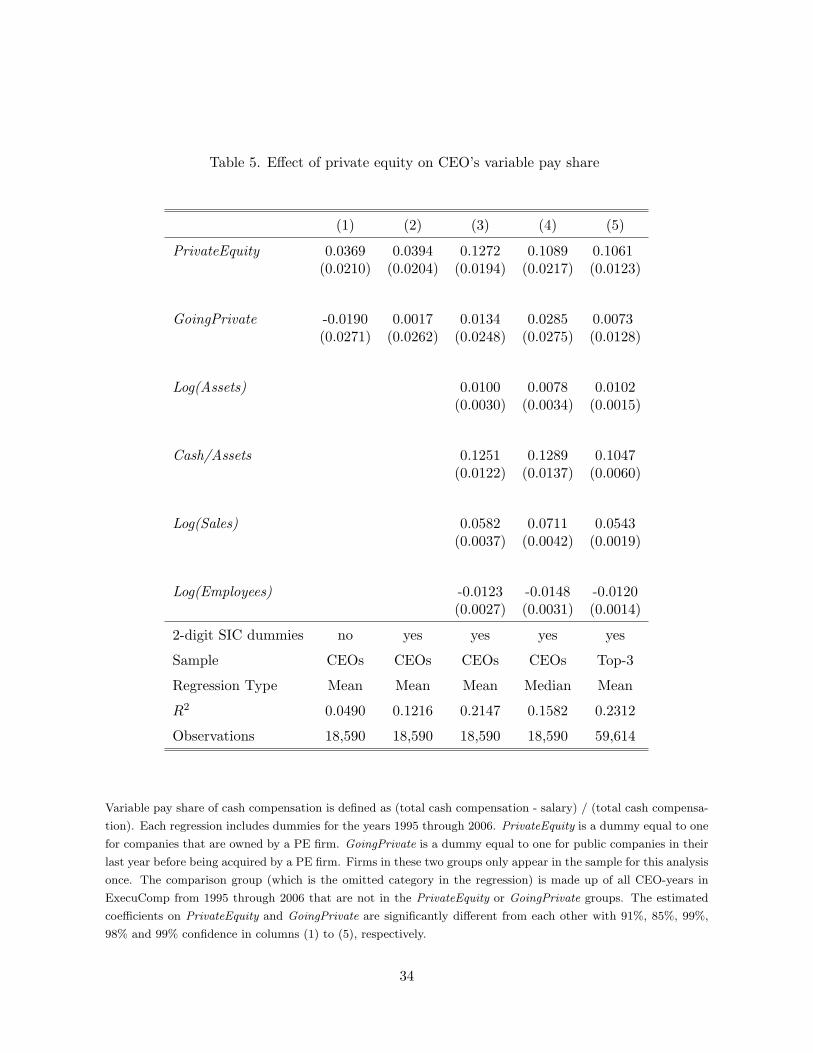
Table 5. Effect of private equity on CEO’s variable pay share
(1) (2) (3) (4) (5)
PrivateEquity 0.0369 0.0394 0.1272 0.1089 0.1061(0.0210) (0.0204) (0.0194) (0.0217) (0.0123)
GoingPrivate -0.0190 0.0017 0.0134 0.0285 0.0073(0.0271) (0.0262) (0.0248) (0.0275) (0.0128)
Log(Assets) 0.0100 0.0078 0.0102(0.0030) (0.0034) (0.0015)
Cash/Assets 0.1251 0.1289 0.1047(0.0122) (0.0137) (0.0060)
Log(Sales) 0.0582 0.0711 0.0543(0.0037) (0.0042) (0.0019)
Log(Employees) -0.0123 -0.0148 -0.0120(0.0027) (0.0031) (0.0014)
2-digit SIC dummies no yes yes yes yes
Sample CEOs CEOs CEOs CEOs Top-3
Regression Type Mean Mean Mean Median Mean
R2 0.0490 0.1216 0.2147 0.1582 0.2312
Observations 18,590 18,590 18,590 18,590 59,614
Variable pay share of cash compensation is defined as (total cash compensation - salary) / (total cash compensa-
tion). Each regression includes dummies for the years 1995 through 2006. PrivateEquity is a dummy equal to one
for companies that are owned by a PE firm. GoingPrivate is a dummy equal to one for public companies in their
last year before being acquired by a PE firm. Firms in these two groups only appear in the sample for this analysis
once. The comparison group (which is the omitted category in the regression) is made up of all CEO-years in
ExecuComp from 1995 through 2006 that are not in the PrivateEquity or GoingPrivate groups. The estimated
coefficients on PrivateEquity and GoingPrivate are significantly different from each other with 91%, 85%, 99%,
98% and 99% confidence in columns (1) to (5), respectively.
34
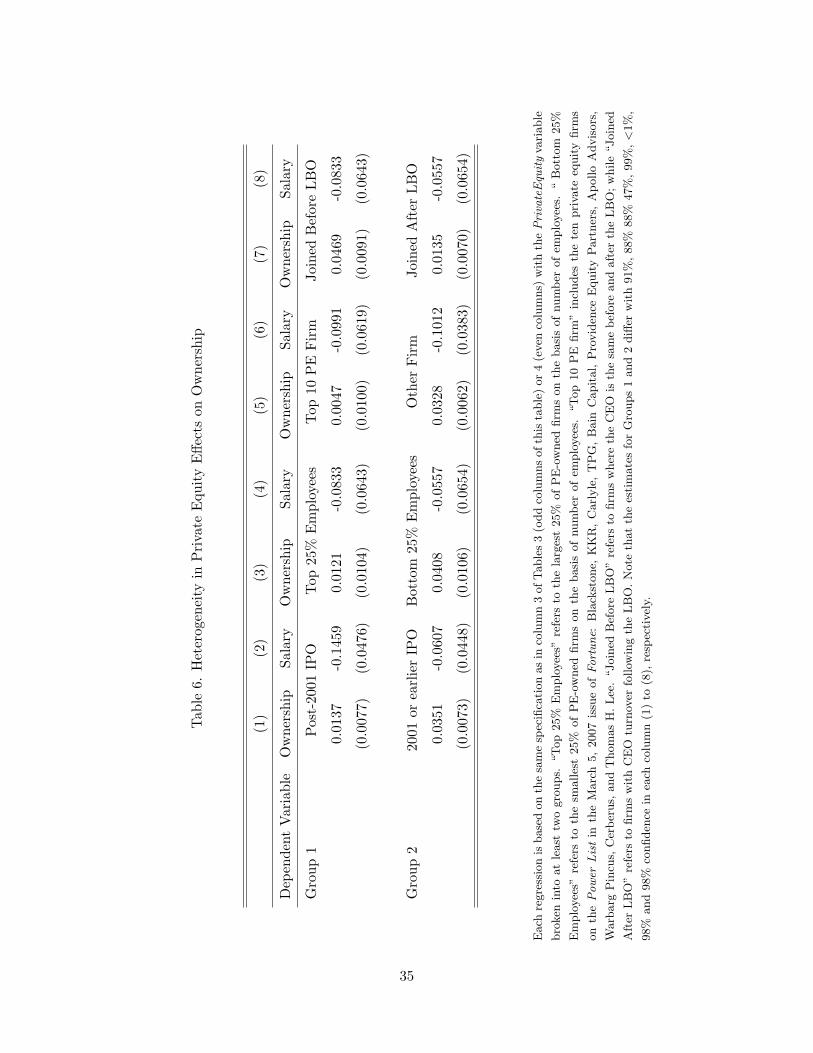
Tab
le6.
Het
erog
enei
tyin
Pri
vate
Equ
ity
Effe
cts
onO
wne
rshi
p
(1)
(2)
(3)
(4)
(5)
(6)
(7)
(8)
Dep
ende
ntV
aria
ble
Ow
ners
hip
Sala
ryO
wne
rshi
pSa
lary
Ow
ners
hip
Sala
ryO
wne
rshi
pSa
lary
Gro
up1
Pos
t-20
01IP
OTop
25%
Em
ploy
ees
Top
10P
EFir
mJo
ined
Bef
ore
LB
O
0.01
37-0
.145
90.
0121
-0.0
833
0.00
47-0
.099
10.
0469
-0.0
833
(0.0
077)
(0.0
476)
(0.0
104)
(0.0
643)
(0.0
100)
(0.0
619)
(0.0
091)
(0.0
643)
Gro
up2
2001
orea
rlie
rIP
OB
otto
m25
%E
mpl
oyee
sO
ther
Fir
mJo
ined
Aft
erLB
O
0.03
51-0
.060
70.
0408
-0.0
557
0.03
28-0
.101
20.
0135
-0.0
557
(0.0
073)
(0.0
448)
(0.0
106)
(0.0
654)
(0.0
062)
(0.0
383)
(0.0
070)
(0.0
654)
Each
regre
ssio
nis
base
don
the
sam
esp
ecifi
cati
on
as
inco
lum
n3
ofTable
s3
(odd
colu
mns
ofth
ista
ble
)or
4(e
ven
colu
mns)
wit
hth
ePri
vate
Equ
ity
vari
able
bro
ken
into
at
least
two
gro
ups.
“Top
25%
Em
plo
yee
s”re
fers
toth
ela
rges
t25%
ofP
E-o
wned
firm
son
the
basi
sofnum
ber
ofem
plo
yee
s.“
Bott
om
25%
Em
plo
yee
s”re
fers
toth
esm
alles
t25%
of
PE
-ow
ned
firm
son
the
basi
sof
num
ber
of
emplo
yee
s.“Top
10
PE
firm
”in
cludes
the
ten
pri
vate
equity
firm
s
on
the
Power
Lis
tin
the
Marc
h5,
2007
issu
eofFort
une:
Bla
ckst
one,
KK
R,
Carl
yle
,T
PG
,B
ain
Capit
al,
Pro
vid
ence
Equity
Part
ner
s,A
pollo
Advis
ors
,
Warb
arg
Pin
cus,
Cer
ber
us,
and
Thom
as
H.Lee
.“Join
edB
efore
LB
O”
refe
rsto
firm
sw
her
eth
eC
EO
isth
esa
me
bef
ore
and
aft
erth
eLB
O;w
hile
“Join
ed
Aft
erLB
O”
refe
rsto
firm
sw
ith
CE
Otu
rnov
erfo
llow
ing
the
LB
O.N
ote
that
the
esti
mate
sfo
rG
roups
1and
2diff
erw
ith
91%
,88%
88%
47%
,99%
,<
1%
,
98%
and
98%
confiden
cein
each
colu
mn
(1)
to(8
),re
spec
tivel
y.
35
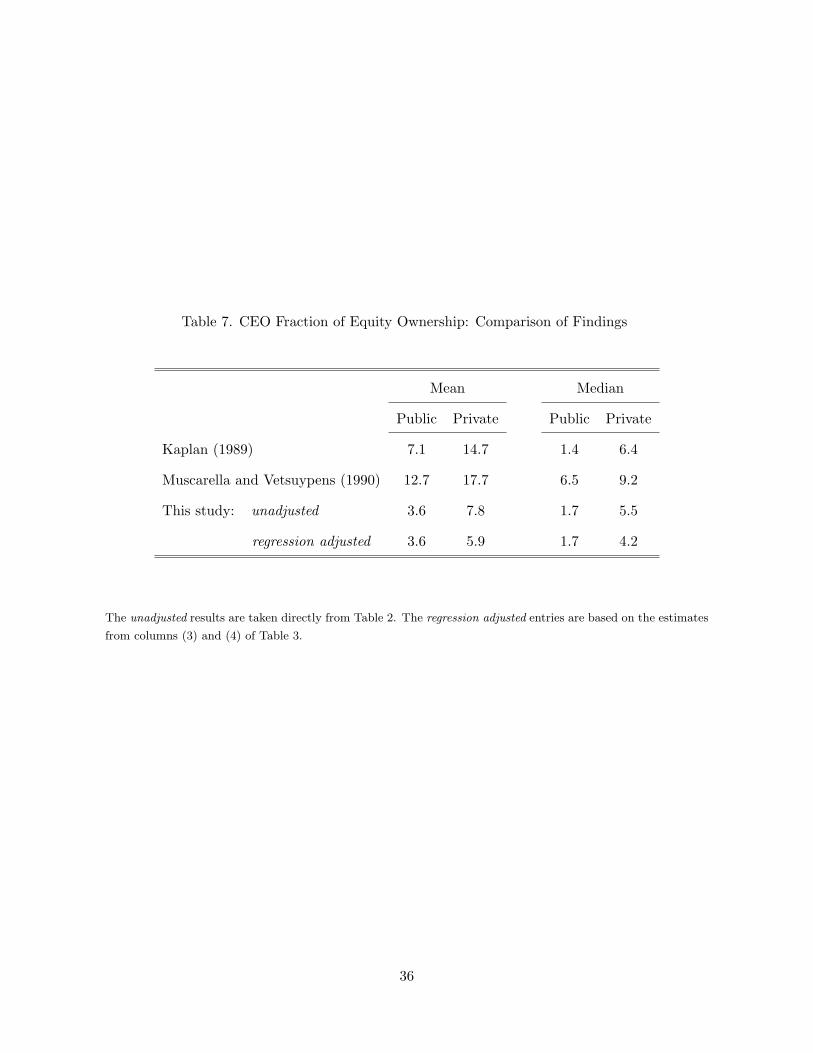
Table 7. CEO Fraction of Equity Ownership: Comparison of Findings
Mean Median
Public Private Public Private
Kaplan (1989) 7.1 14.7 1.4 6.4
Muscarella and Vetsuypens (1990) 12.7 17.7 6.5 9.2
This study: unadjusted 3.6 7.8 1.7 5.5
regression adjusted 3.6 5.9 1.7 4.2
The unadjusted results are taken directly from Table 2. The regression adjusted entries are based on the estimates
from columns (3) and (4) of Table 3.
36
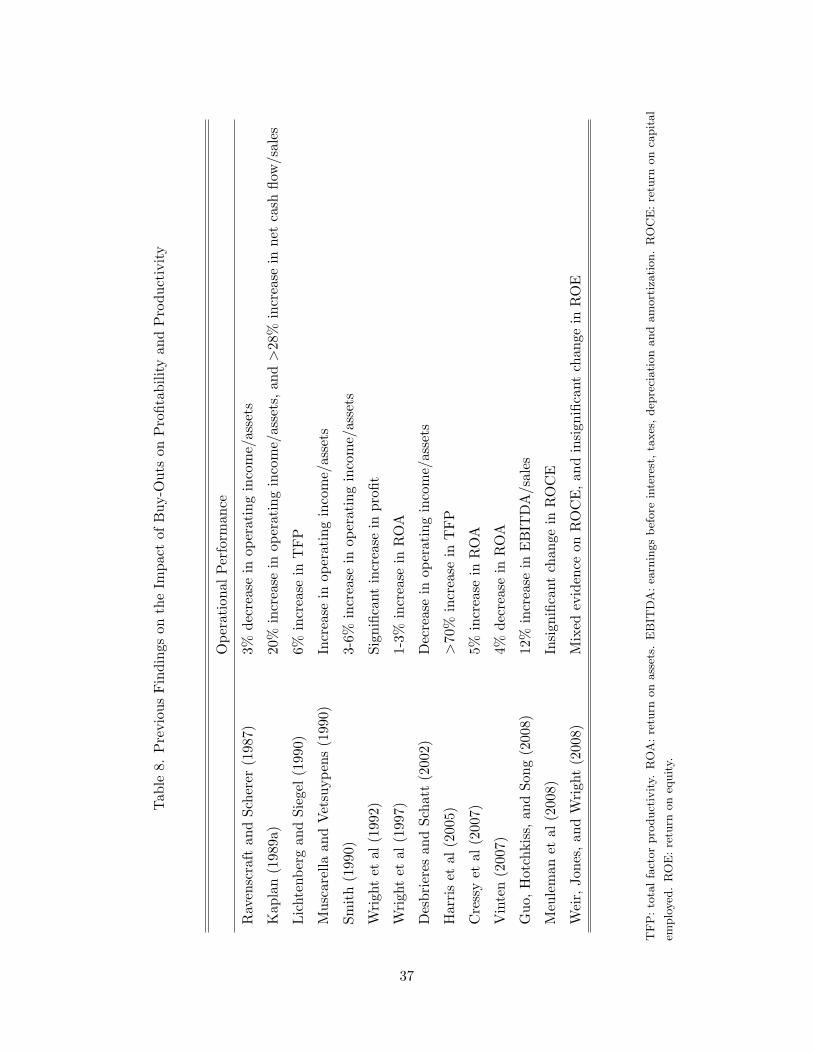
Tab
le8.
Pre
viou
sFin
ding
son
the
Impa
ctof
Buy
-Out
son
Pro
fitab
ility
and
Pro
duct
ivity
Ope
rati
onal
Per
form
ance
Rav
ensc
raft
and
Sche
rer
(198
7)3%
decr
ease
inop
erat
ing
inco
me/
asse
ts
Kap
lan
(198
9a)
20%
incr
ease
inop
erat
ing
inco
me/
asse
ts,an
d>
28%
incr
ease
inne
tca
shflo
w/s
ales
Lic
hten
berg
and
Sieg
el(1
990)
6%in
crea
sein
TFP
Mus
care
llaan
dV
etsu
ypen
s(1
990)
Incr
ease
inop
erat
ing
inco
me/
asse
ts
Smit
h(1
990)
3-6%
incr
ease
inop
erat
ing
inco
me/
asse
ts
Wri
ght
etal
(199
2)Si
gnifi
cant
incr
ease
inpr
ofit
Wri
ght
etal
(199
7)1-
3%in
crea
sein
RO
A
Des
brie
res
and
Scha
tt(2
002)
Dec
reas
ein
oper
atin
gin
com
e/as
sets
Har
ris
etal
(200
5)>
70%
incr
ease
inT
FP
Cre
ssy
etal
(200
7)5%
incr
ease
inR
OA
Vin
ten
(200
7)4%
decr
ease
inR
OA
Guo
,H
otch
kiss
,an
dSo
ng(2
008)
12%
incr
ease
inE
BIT
DA
/sal
es
Meu
lem
anet
al(2
008)
Insi
gnifi
cant
chan
gein
RO
CE
Wei
r,Jo
nes,
and
Wri
ght
(200
8)M
ixed
evid
ence
onR
OC
E,an
din
sign
ifica
ntch
ange
inR
OE
TFP
:to
talfa
ctor
pro
duct
ivity.
RO
A:re
turn
on
ass
ets.
EB
ITD
A:ea
rnin
gs
bef
ore
inte
rest
,ta
xes
,dep
reci
ati
on
and
am
ort
izati
on.
RO
CE
:re
turn
on
capit
al
emplo
yed
.R
OE
:re
turn
on
equity.
37
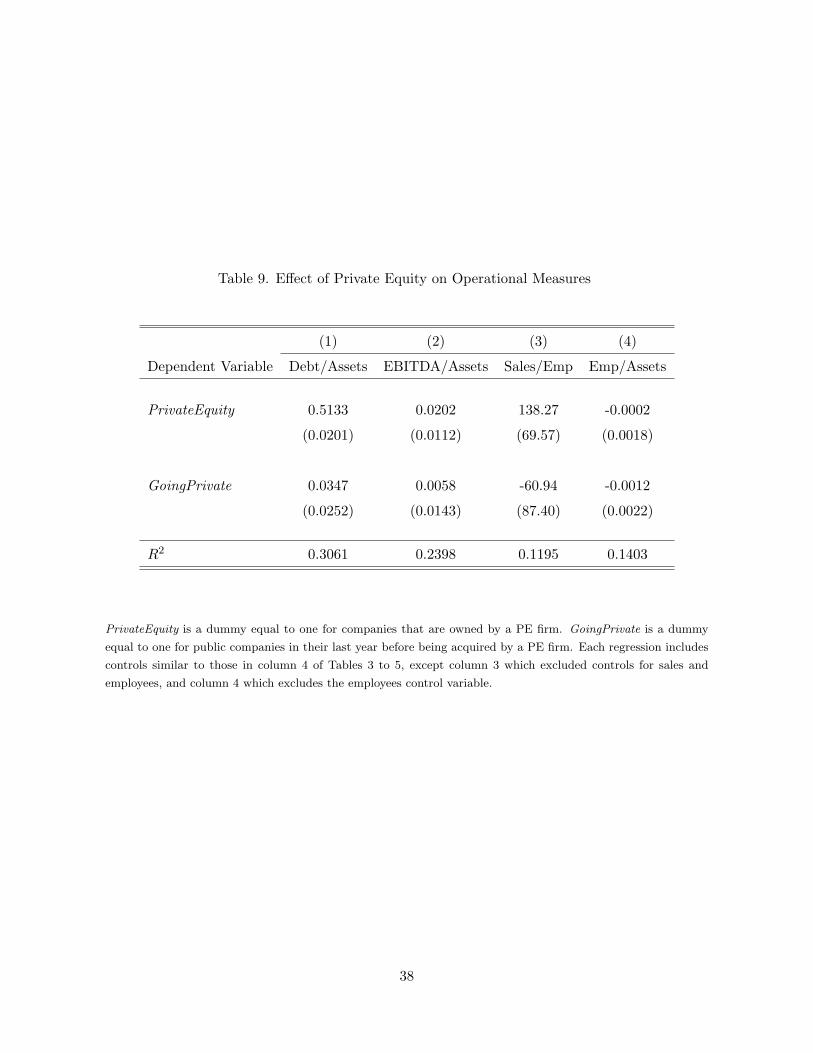
Table 9. Effect of Private Equity on Operational Measures
(1) (2) (3) (4)
Dependent Variable Debt/Assets EBITDA/Assets Sales/Emp Emp/Assets
PrivateEquity 0.5133 0.0202 138.27 -0.0002
(0.0201) (0.0112) (69.57) (0.0018)
GoingPrivate 0.0347 0.0058 -60.94 -0.0012
(0.0252) (0.0143) (87.40) (0.0022)
R2 0.3061 0.2398 0.1195 0.1403
PrivateEquity is a dummy equal to one for companies that are owned by a PE firm. GoingPrivate is a dummy
equal to one for public companies in their last year before being acquired by a PE firm. Each regression includes
controls similar to those in column 4 of Tables 3 to 5, except column 3 which excluded controls for sales and
employees, and column 4 which excludes the employees control variable.
38
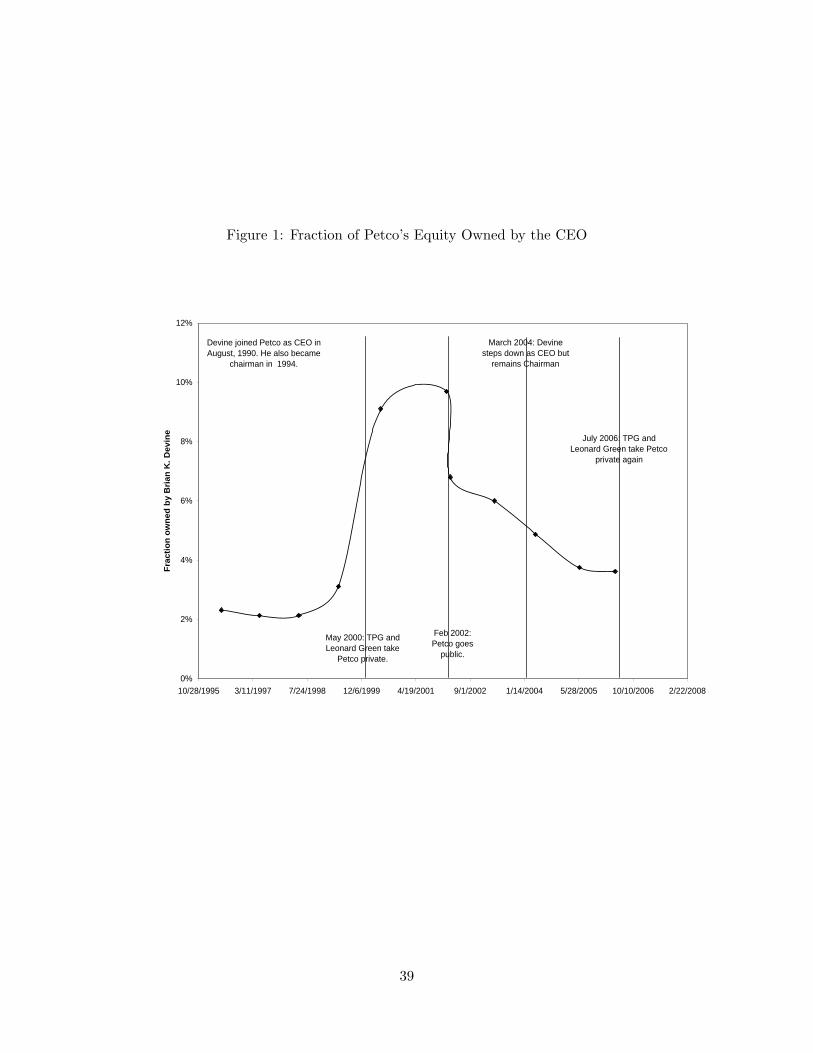
Figure 1: Fraction of Petco’s Equity Owned by the CEO
0%
2%
4%
6%
8%
10%
12%
10/28/1995 3/11/1997 7/24/1998 12/6/1999 4/19/2001 9/1/2002 1/14/2004 5/28/2005 10/10/2006 2/22/2008
Frac
tion
owne
d by
Bria
n K
. Dev
ine
Devine joined Petco as CEO in August, 1990. He also became
chairman in 1994.
May 2000: TPG and Leonard Green take
Petco private.
Feb 2002: Petco goes
public.
March 2004: Devine steps down as CEO but
remains Chairman
July 2006: TPG and Leonard Green take Petco
private again
39
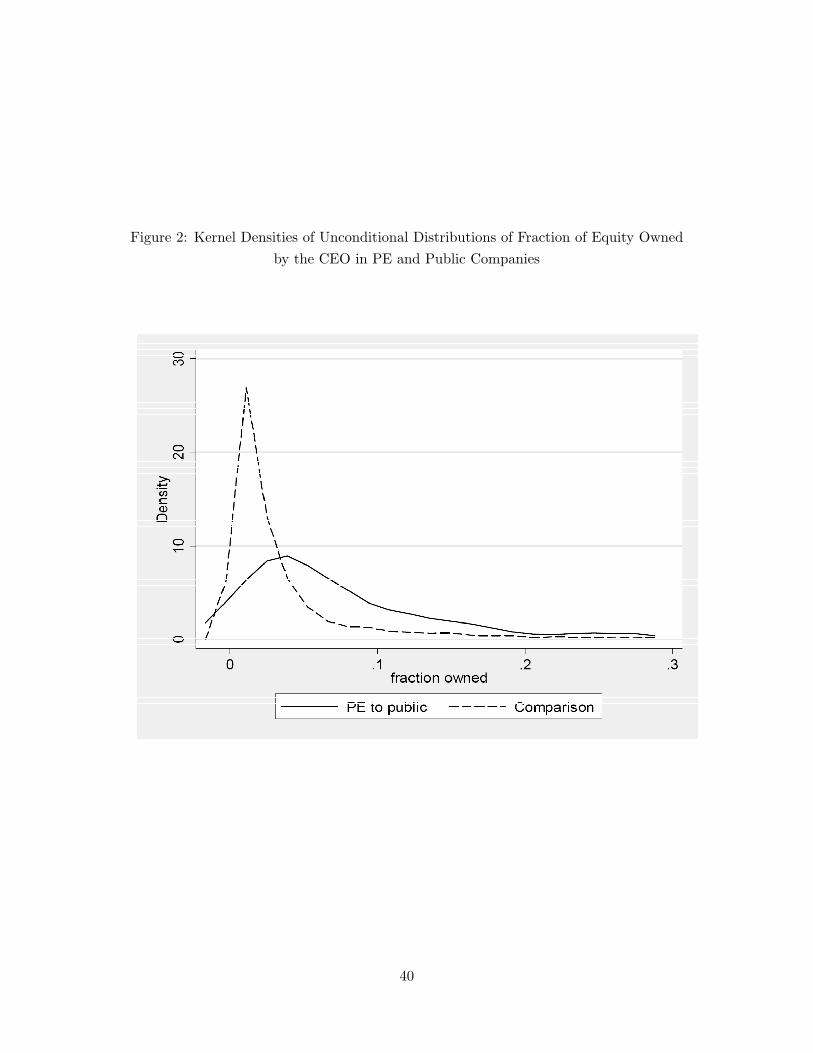
Figure 2: Kernel Densities of Unconditional Distributions of Fraction of Equity Ownedby the CEO in PE and Public Companies
40
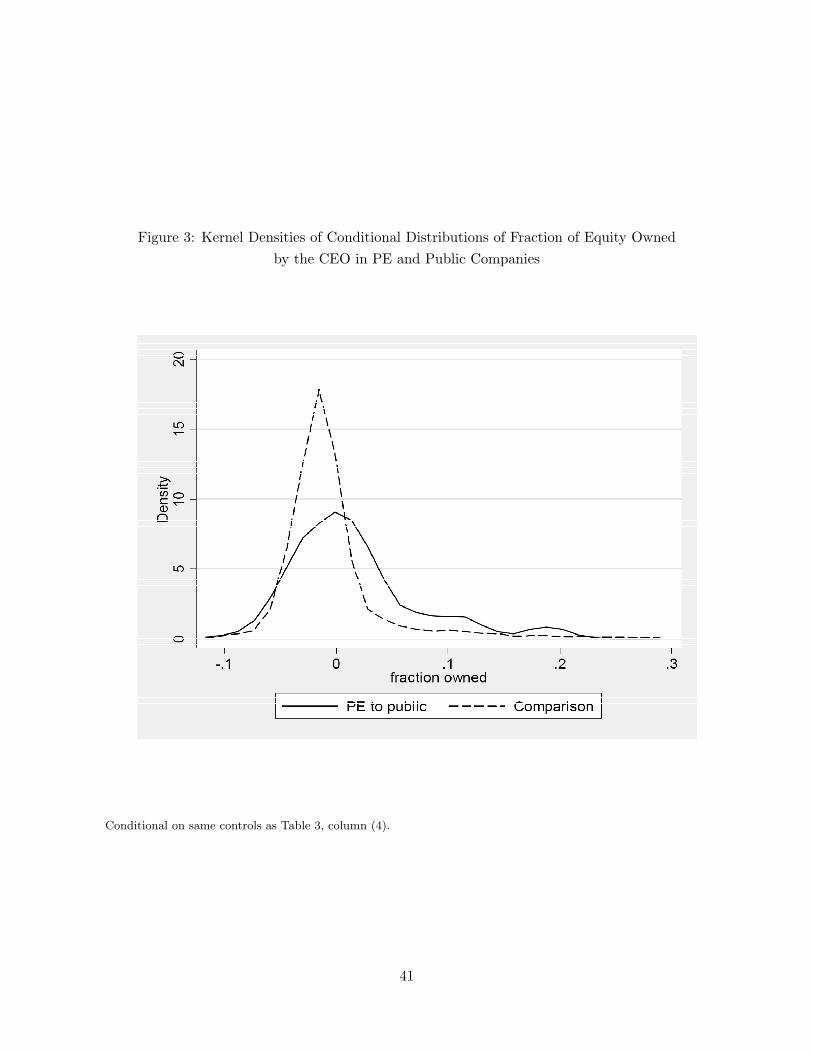
Figure 3: Kernel Densities of Conditional Distributions of Fraction of Equity Ownedby the CEO in PE and Public Companies
Conditional on same controls as Table 3, column (4).
41
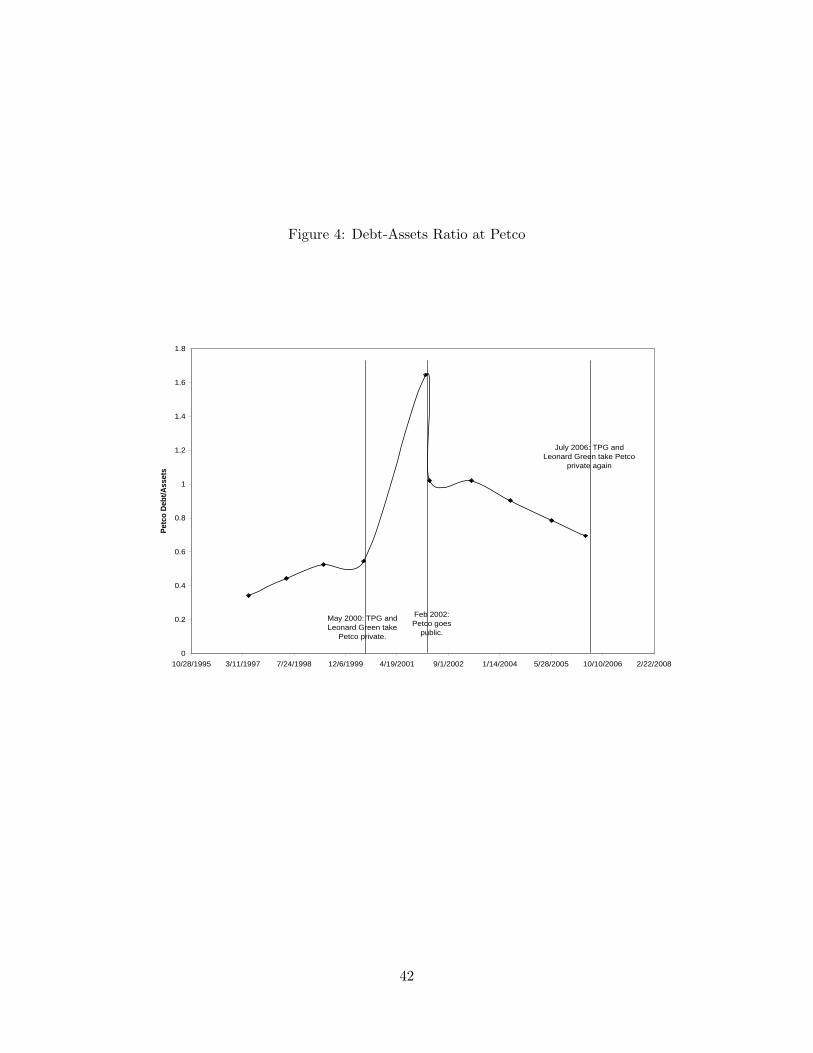
Figure 4: Debt-Assets Ratio at Petco
0
0.2
0.4
0.6
0.8
1
1.2
1.4
1.6
1.8
10/28/1995 3/11/1997 7/24/1998 12/6/1999 4/19/2001 9/1/2002 1/14/2004 5/28/2005 10/10/2006 2/22/2008
Petc
o De
bt/A
sset
s
May 2000: TPG and Leonard Green take
Petco private.
Feb 2002: Petco goes
public.
July 2006: TPG and Leonard Green take Petco
private again
42
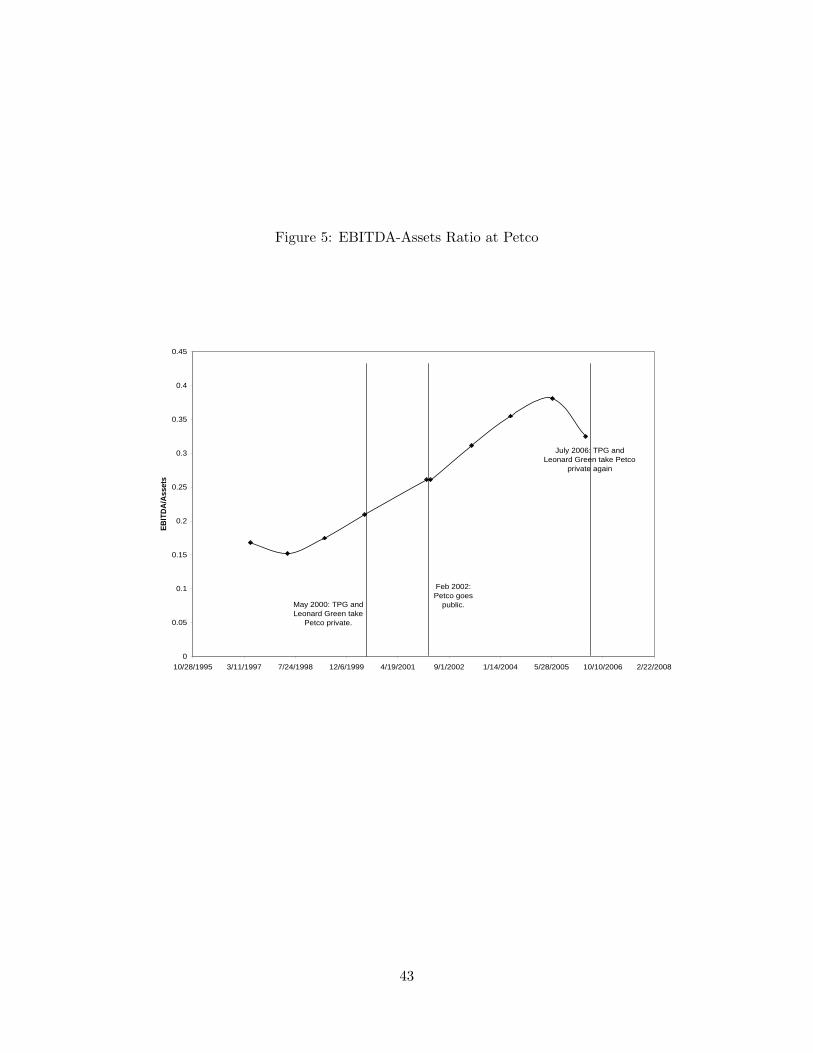
Figure 5: EBITDA-Assets Ratio at Petco
0
0.05
0.1
0.15
0.2
0.25
0.3
0.35
0.4
0.45
10/28/1995 3/11/1997 7/24/1998 12/6/1999 4/19/2001 9/1/2002 1/14/2004 5/28/2005 10/10/2006 2/22/2008
EBIT
DA/A
sset
s
May 2000: TPG and Leonard Green take
Petco private.
Feb 2002: Petco goes
public.
July 2006: TPG and Leonard Green take Petco
private again
43
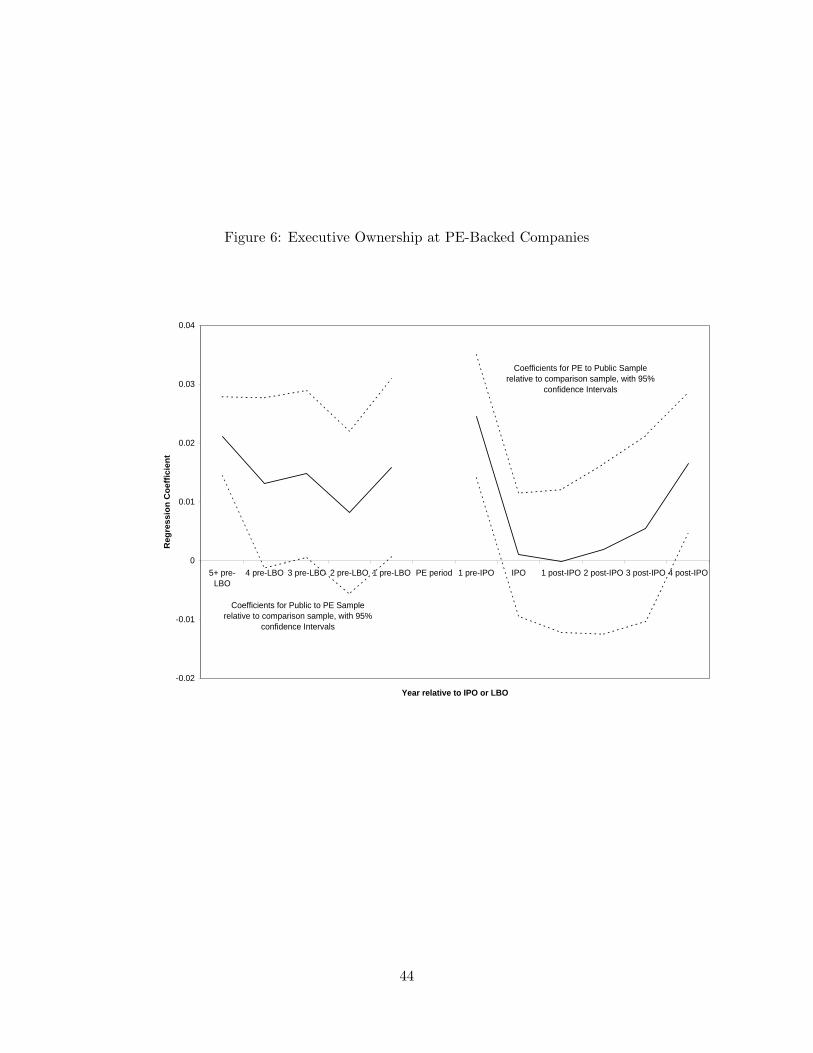
Figure 6: Executive Ownership at PE-Backed Companies
-0.02
-0.01
0
0.01
0.02
0.03
0.04
5+ pre-LBO
4 pre-LBO 3 pre-LBO 2 pre-LBO 1 pre-LBO PE period 1 pre-IPO IPO 1 post-IPO 2 post-IPO 3 post-IPO 4 post-IPO
Year relative to IPO or LBO
Reg
ress
ion
Coe
ffic
ient
Coefficients for PE to Public Sample relative to comparison sample, with 95%
confidence Intervals
Coefficients for Public to PE Sample relative to comparison sample, with 95%
confidence Intervals
44
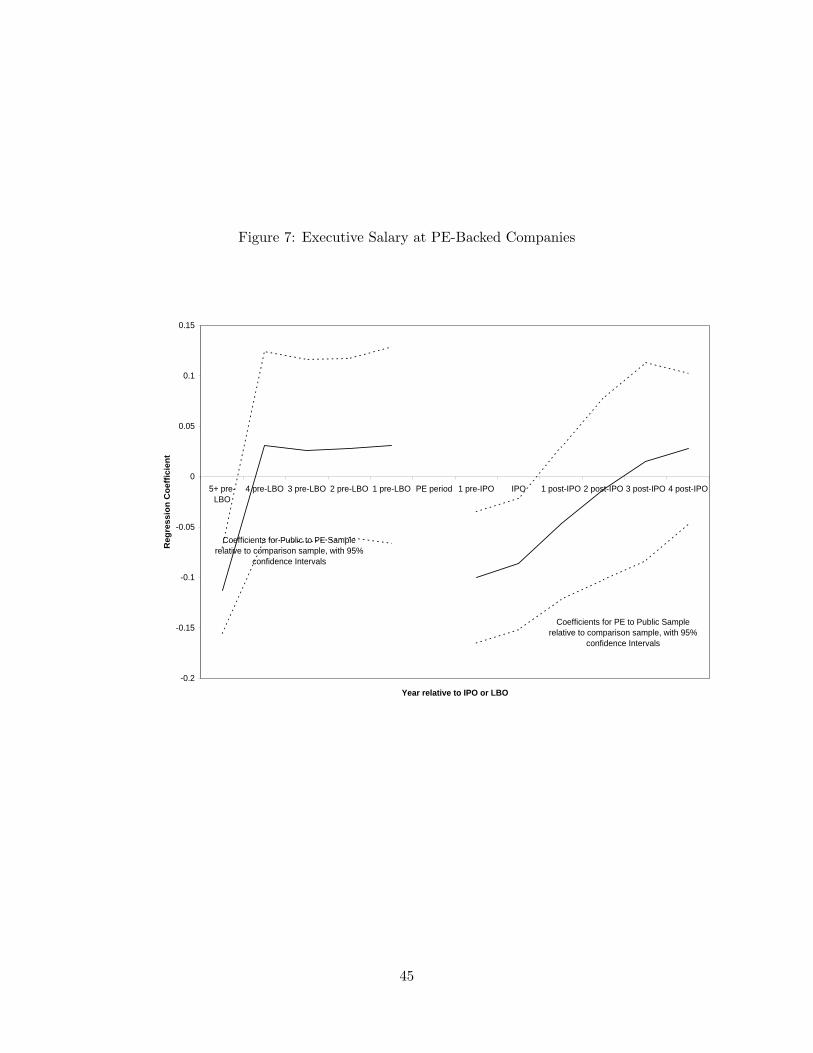
Figure 7: Executive Salary at PE-Backed Companies
-0.2
-0.15
-0.1
-0.05
0
0.05
0.1
0.15
5+ pre-LBO
4 pre-LBO 3 pre-LBO 2 pre-LBO 1 pre-LBO PE period 1 pre-IPO IPO 1 post-IPO 2 post-IPO 3 post-IPO 4 post-IPO
Year relative to IPO or LBO
Reg
ress
ion
Coe
ffic
ient
Coefficients for PE to Public Sample relative to comparison sample, with 95%
confidence Intervals
Coefficients for Public to PE Sample relative to comparison sample, with 95%
confidence Intervals
45
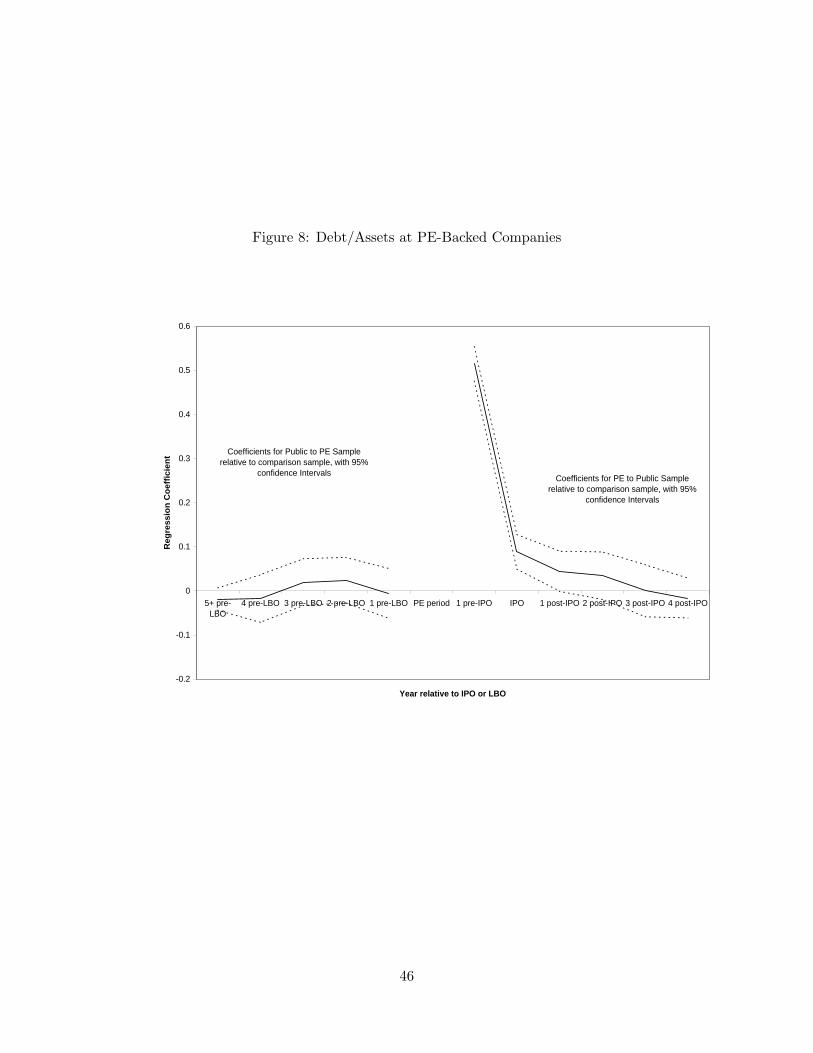
Figure 8: Debt/Assets at PE-Backed Companies
-0.2
-0.1
0
0.1
0.2
0.3
0.4
0.5
0.6
5+ pre-LBO
4 pre-LBO 3 pre-LBO 2 pre-LBO 1 pre-LBO PE period 1 pre-IPO IPO 1 post-IPO 2 post-IPO 3 post-IPO 4 post-IPO
Year relative to IPO or LBO
Reg
ress
ion
Coe
ffic
ient
Coefficients for PE to Public Sample relative to comparison sample, with 95%
confidence Intervals
Coefficients for Public to PE Sample relative to comparison sample, with 95%
confidence Intervals
46
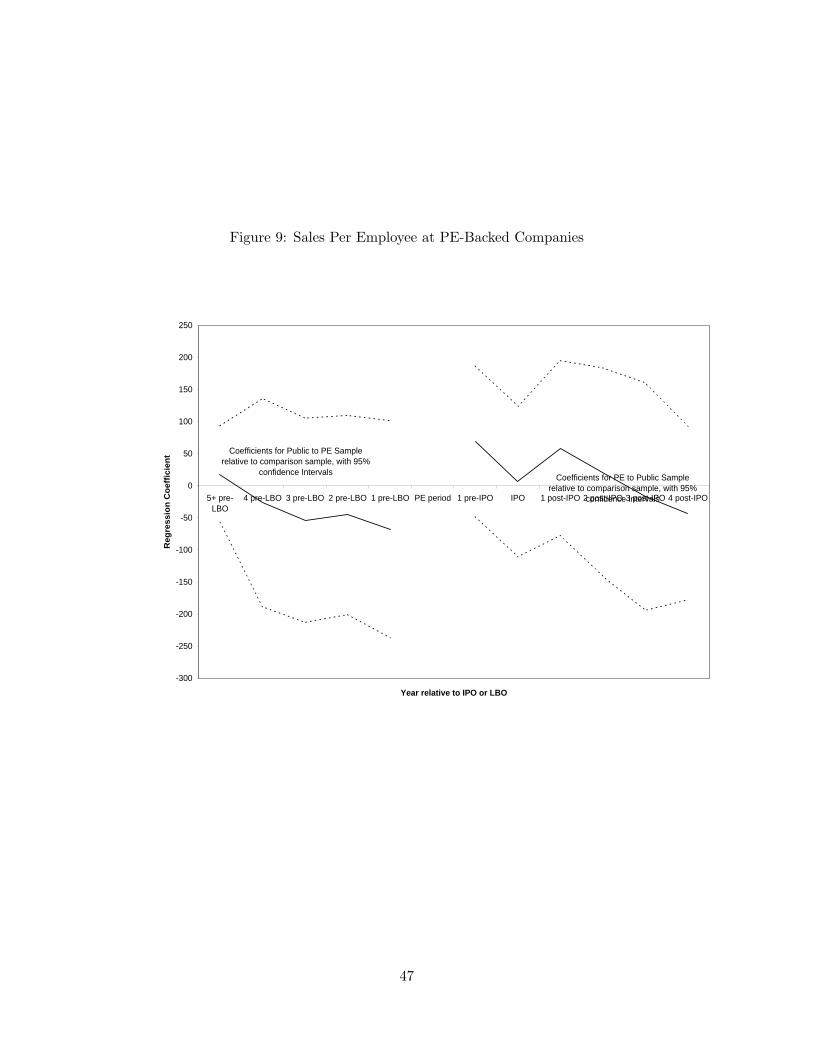
Figure 9: Sales Per Employee at PE-Backed Companies
-300
-250
-200
-150
-100
-50
0
50
100
150
200
250
5+ pre-LBO
4 pre-LBO 3 pre-LBO 2 pre-LBO 1 pre-LBO PE period 1 pre-IPO IPO 1 post-IPO 2 post-IPO 3 post-IPO 4 post-IPO
Year relative to IPO or LBO
Reg
ress
ion
Coe
ffic
ient
Coefficients for PE to Public Sample relative to comparison sample, with 95%
confidence Intervals
Coefficients for Public to PE Sample relative to comparison sample, with 95%
confidence Intervals
47