Embed Size (px)
Citation preview
Managerial Metric Use in Marketing Decisions across 16 Countries:
A Cultural Perspective
Ofer Mintz
Imran S. Currim
Jan-Benedict E.M. Steenkamp
Martijn de Jong *
May 2019
* Ofer Mintz ([email protected]) is Senior Lecturer and Associate Head (External
Engagement) of the Marketing Department at the UTS Business School, University of
Technology Sydney. Imran S. Currim ([email protected]) is UCI Distinguished Professor,
Professor of Marketing, and Director, Beall Center for Innovation and Entrepreneurship at the
Paul Merage School of Business, University of California, Irvine. Jan-Benedict E.M. Steenkamp
([email protected]) is C. Knox Massey Distinguished Professor of Marketing at the University of
North Carolina at Chapel Hill. Martijn de Jong ([email protected]) is Professor of Marketing
Research & Tinbergen Research Fellow at the Department of Business Economics - Section
Marketing, Erasmus School of Economics. This research was supported by grants from the
Marketing Science Institute (MSI), UNC Kenan-Flagler Business School, and the Beall Center
for Innovation and Entrepreneurship at the UCI Paul Merage School of Business.
1
Managerial Metric Use in Marketing Decisions across 16 Countries:
A Cultural Perspective
Abstract
Research on metrics is consistently designated a priority by academics and practitioners. However, less is
known about how culture and cross-national differences can potentially impact metric use, which is
theoretically and managerially limiting. This work develops a model that examines national and
organizational cultural antecedents while controlling for the decision setting. Testing the model on data
collected from 4,384 managerial decisions from 1,637 firms in 16 countries, reveals both levels of culture
are associated with metric use but each has varying effects. Our results enable multinational executives to
better understand and increase managerial metric use across different cultures and settings.
Keywords: Metrics; International Marketing; GLOBE Cultural Variables; Organizational
Culture; Managerial Decision-Making
2
In today’s digital technology-intensive and data-rich environment, understanding managerial
metric use for marketing decisions, i.e., managers’ employment of quantitative information for
considering, benchmarking, or monitoring when making their decisions, is crucial for managerial practice
(Moorman & Day, 2016). Metrics quantify trends or outcomes in order to explain past decisions,
understand current relationships, and predict results of future actions (Farris, Bendle, Pfeifer, & Reibstein,
2010). Metrics also provide information relevant to managers to help diagnose, coordinate, and monitor
firms’ actions (Rust, Ambler, Carpenter, Kumar, & Srivastava, 2004).
The theoretical benefits for managers to employ metrics for their individual marketing-mix
decisions, as suggested by scholars in the judgment and decision-making (JDM), marketing, and
management literatures, among others, are that the greater the managers’ overall use of quantitative
information or metrics when making decisions, the better should be the performance, accuracy, and
overall quality of decisions (e.g., see Bettman, Luce, & Payne, 1998; Fredrickson & Mitchell, 1984;
Menon, Bharadwaj, Adidam, & Edison, 1999). Subsequent empirical research on the use of marketing
metric-based information has found that greater use of metrics in decisions is related to increased firm
profits (Abramson, Currim, & Sarin, 2005), marketing-mix performance (Mintz & Currim, 2013), chief
executive officers’ (CEOs) satisfaction with the marketing department (O’Sullivan & Abela, 2007), and
shareholder value (Schulze, Skiera, & Wiesel, 2012). Consequently, to develop a better understanding of
the role of metrics in marketing-mix decisions, the Marketing Science Institute (MSI) and the Institute for
the Study of Business Markets (ISBM), among other organizations, have continuously called for further
research on metrics and metric use (e.g., MSI Research Priorities 1998-2020, ISBM B-to-B Trends 2008-
2014).
Despite progress in the literature (see Web Appendix Table 1), it is well known that overall use of
metrics by managers making marketing-mix decisions varies considerably across decision settings, and
such variation is likely associated with variance in performance outcomes (Farris et al., 2010). The
consequences of variation in metric use is posited to be directly associated with marketing’s lack of
performance, accountability, and its decreasing influence in the firm (Verhoef & Leeflang, 2009). For
3
example, much has been written over the past couple of decades on marketing’s decreasing influence in
the firm (Rust et al., 2004), in the boardroom (Whitler, Krause, & Lehmann, 2018), and at the corporate
strategy level (McGovern, Court, Quelch, & Crawford, 2004). Marketing is increasingly viewed as a cost
rather than as an investment (Morgan & Rego, 2009), with strategically important aspects of marketing
having been moved to other functions in the organization (Sheth & Sisodia, 2005), despite the plethora of
studies and empirical generalizations demonstrating the relationship between marketing-mix efforts,
competitive sustainability, profits, and stock returns (e.g., see Hanssens, 2015 for a review). This variance
in metric use has resulted in a detrimental credibility gap between marketers and others in the
organization (e.g., Forbes, 2017). Thus, to overcome the credibility gap and increase marketing’s stature
in the firm, marketers are facing substantial demand from the firm’s highest executive levels to employ
metrics to increase their accountability (Lehmann & Reibstein, 2006).
Further, these demands to increase marketing’s accountability are not just prevalent in a single
country, but rather are impacting marketers around the world (O’Sullivan, Abela, & Hutchinson, 2009).
For example, Verhoef et al., (2011) conduct a study on drivers of marketing’s influence in the firm in
seven different countries, and find that accountability is a crucial driver of marketing’s influence and how
it impacts the firm’s performance in each of these seven countries. In addition, the Fournaise Marketing
Group conducted a cross-national survey of 1,200 CEOs and found that 80 percent of these CEOs either
ranked marketers low in the hierarchy of their organizations’ executive committee, or did not include
them at all (Lukovitz, 2012; Wirtz, Kuppelwieser, & Tuzovic, 2014). The Fournaise global survey also
reported that nearly two-thirds of the CEOs have lost faith in marketers’ ability to be accountable for their
efforts, and this has led the CEOs to reduce their marketing function’s responsibilities (Fournaise
Marketing Group, 2012).
However, as summarized in Web Appendix Table 1, most past research on managerial metric use
focuses on U.S. managers, and to our knowledge there has not been a systematic investigation to
determine what explains differences in overall metric use by managers who reside in different countries
or cultures, which is both a theoretical and managerial limitation. If there exists cross-country variation
4
that leads to less overall use of metrics by certain managers, there may be managers who are
underperforming on the use of quantitative information, i.e., metric use, in their decisions because of
cross-country cultural variation. If we as a discipline want to encourage worldwide metric use to help
performance outcomes, it is crucial to first understand why such cross-country cultural variation occurs.
In order to overcome these theoretical and managerial limitations, we also need to address the
false dichotomy or debate that, according to Farley and Lehmann (1994, p. 112), has plagued much of
cross-national marketing, management, and international business (IB) theory, research, and practice,
namely the polarization of views between “everything is the same” versus “everything is different” across
and within countries. Despite calls from scholars and practitioners, there exists a theoretical and
managerial knowledge gap on the drivers of metric use by managers around the world. This paper takes a
first step to address this important gap and debate. Its purpose is to propose and test a theoretical model to
explain the large differences in managerial metric use both across and within countries. Our unit of
analysis is the marketing-mix decision, i.e., everyday decisions on marketing-mix efforts made by
managers.
The main proposed theory that underlies our model of drivers of differences in managerial metric
use is culture theory.i Managers making marketing-mix decisions are embedded in a country with its own
culture, working for a firm with its own culture, and have various other firm, industry, manager, and
decision characteristics, which can each potentially impact their decisions and their use of metrics. These
factors which can potentially cause differences in managerial metric use are important to understand
because from a scholarly and theoretical point of view, prior work has found that cultural orientation
exerts a powerful influence on how individuals acquire, process, and make use of information (e.g.,
Hofstede, Hofstede, & Minkov, 2010; Shavitt, Lalwani, Zhang, & Torelli, 2006). However, less work has
integrated culture’s multiple levels of abstraction (e.g., Kirkman, Lowe, & Gibson, 2006; Tsui, Nifadkar,
& Ou, 2007; Tung & Stahl, 2018; Vora, Martin, Fitzsimmons, Pekerti, Lakshman, & Raheem, 2018) or
focused on how different national and organizational cultures may affect managers’ overall use of
information when making marketing decisions. From a managerial or practical point of view, it is critical
5
for modern businesses to understand differences related to how organizations should manage their
employees across countries (Newman & Nollen, 1996). Hence, understanding differences in metric use
across and within countries allows international executives to better understand and increase managerial
metric use across different cultures and settings.ii
In attempting to explain differences in managerial metric use in our culture-based theoretical
model, we first employ national culture to explain across country variation. National culture refers to the
core set of attitudes and practices shared by members of a country that influence the behavior of members
in the country (Schwartz, 1994). Newman and Nollen (1996: 755) describe national culture as “a central
organizing principle of employees’ understanding of work, their approach to it, and the way in which they
expect to be treated.” Thus, our corresponding first theoretical expectation is that national culture will
impact managerial decision processes and the amount of quantitative information or metrics that
managers will employ when making their decisions. Second, since all firms in the same country will not
have the same culture, we employ organizational culture to explain within country firm-based variation in
metric use. Deshpandé and Webster (1989: 4) define organizational culture as “the pattern of shared
values and beliefs that help individuals understand organizational functioning and thus provide them with
the norms for behavior in the organization.” Consequently, our corresponding second theoretical
expectation is that organizational culture should impact the total amount of metrics employed by
managers. Third, we control for other characteristics of the decision setting that prior research and
theories have suggested can impact managerial information use, such as firm resources (Wernerfelt,
1984), industry norms (DiMaggio & Powell, 1983), type of marketing-mix decision (Farris et al., 2010),
and the decision maker’s characteristics (Perkins & Rao, 1990). Overall, we identify 29 variables
associated with the overall use of metrics by managers making specific types of marketing-mix decisions,
including six country culture variables, two organizational culture variables, and 21 firm, industry,
manager, and decision characteristic control variables.
We test our theoretical model on 4,384 marketing-mix decisions from 16 countries (see Table 1)
obtained by a combination of (i) primary survey data collection on metric use, organizational culture, and
6
control variables from firms of various sizes and industries and (ii) secondary published data on national
culture across our included countries. In doing so, our study makes key contributions to the IB,
marketing, and JDM literatures by proposing and testing a conceptual model that generates important
managerial implications. The development and empirical test of the conceptual model bridges the IB
literature with the JDM literature on decision quality and information use to examine how national (and
organizational) culture can impact managerial information (metric) use in marketing decisions. This
model overcomes a gap identified multiple times by scholars in the IB and culture literature by
specifically examining the impact of multiple levels of culture (macro-national and micro-organizational),
while controlling for the non-cultural drivers such as marketing-mix, manager, firm, and industry
characteristics related to the decision setting (e.g., Caprar, Devinney, Kirkman, & Caligiuri, 2015;
Kirkman et al., 2017; Leung, Bhagat, Buchan, Erez, & Gibson, 2005; Tung & Stahl, 2018). In addition, it
permits us to further understand how culture can positively and negatively affect managerial behavior as
opposed to only having positive or only having negative effects (e.g., Stahl & Tung, 2015; Tung &
Verbeke, 2010). For example, some national cultural dimensions such as individualism are expected and
found to have positive effects or increase metric use while others such as assertiveness are expected and
found to have negative effects or decrease metric use. Further, we also propose that the broader
substantive issue of managerial metric use is an additional and presumably new “mechanism” explaining
why national culture is important to managerial behavior and how it can relate to firm performance. This
is particularly important given that firms operate in an increasingly global business environment, and thus
require better understanding and management of their strategies and decision-making processes across
and within countries (e.g., see Hult, Katsikeas, and Samiee [2019] call for papers for the planned JIBS
special issue on international marketing).
For the empirical test of our proposed conceptual model, we study metric use in the world’s most
important economies, e.g., Australia, Brazil, Canada, China, France, Germany, India, Indonesia, Italy,
Japan, Mexico, Russia, South Korea, Turkey, U.K., and U.S.A. We find via analysis of a main effects
model and 49 additional models examining moderators, that both national and organizational cultures
7
have significant effects on metric use, but these effects are quite complex. Theoretical implications of
these results demonstrate the importance of accounting for both national and organizational levels of
culture as drivers of managerial behavior. Our findings also provide a guide for future research in IB,
marketing, and management that examines both types of cultures’ potential multi-faceted effects, in
contrast to focusing solely on either level of culture or solely on it’s positive or negative effects. Further,
the results demonstrate the nuanced effects of national and organizational culture on managerial behavior
in contrast to a polarization of views assuming either “everything is the same within a country” versus
“everything is different across countries.”
In addition, based on the empirical results, the key managerial contribution further detailed in the
conclusion section is that the estimated effects of our firm- and country-level cultural drivers of metric
use can be employed by top executives of international firms seeking to understand, set expectations, and
encourage metric use by managers making marketing-mix decisions while operating across a variety of
country, firm, industry, and managerial settings. Due to the scarcity of prior research on metric use by
managers residing around the world, the potential contribution of studying metric use across nations is not
to create uniformity in metrics use within multinational corporations (MNCs). Instead, the study of metric
use allows managers to understand differences in the numbers and types of metrics employed across
national and firm cultures as a means toward refining their control mechanisms and potentially their
competitive advantage(s) and firm performance by encouraging metric use in culturally sensitive ways.
The broader implications of our empirical results on managerial metric use across 16 countries can help
establish expectations and help firms evaluate compatibility of managerial decision processes in other
contexts such as in potential cross-national mergers, acquisitions, and joint ventures.
--- Table 1 about here ---
THEORY
Conceptual Framework
Metric use is part of the managerial decision process. Total metric use is defined as the manager’s use of
information for considering, benchmarking, or monitoring when making a particular marketing-mix
8
decision. It is a measure of the extent to which the manager makes a marketing-mix decision based on
analytical, quantitative, and objective data compared to hearsay, qualitative, or subjective information
(Farris et al., 2010). The measure of total metric use builds on the large literature examining the overall
use of information and metrics by managers (e.g., see Fredrickson & Mitchell, 1984; Menon et al., 1999)
and is operationalized as the total number of metrics employed in that decision (i.e., the use of marketing
metrics, which are non-financial and typically more long-term, and the use of financial metrics, which are
typically shorter-term) (Farris et al., 2010; Mintz & Currim, 2013).
To understand what may affect variation in total metric use, it is useful to consider that metric use
at a more granular level has the potential to fulfill the following overlapping purposes. It can serve to (1)
clarify rules and criteria on which performance will be assessed (Moorman & Day, 2016), (2) signal
desired behaviors for strategy implementation and learning (Lehmann & Reibstein, 2006), (3) increase
accountability of individual managers (Rust et al., 2004), (4) empower individual managers (Farris et al.,
2010), and (5) improve the performance of the organization (O’Sullivan & Abela, 2007).
In attempting to explain variation in managerial metric use across and within countries and
decision settings, we employ a cultural perspective (see Figure 1) at multiple levels of abstraction (macro-
national and micro-organizational). Culture is a pattern of shared values and beliefs across organizations
or individuals in a nation (Deshpandé, Farley, & Webster, 1993; Hofstede et al., 2010). Cultural theory
posits that managers working in specific organizations and residing in certain countries share similar
goals and beliefs regarding situational or behavioral domains, which leads them to behave differently than
managers working in other organizations and countries (Newman & Nollen, 1996; Tan, Wei, Watson,
Clapper, & Mclean, 1998). Consequently, our expectation is that managerial behavior (and their
subsequent use of metrics) is affected by the national and organizational cultural context in which
managers operate (Triandis, 1989; Yarbrough, Morgan, & Vorhies, 2011). This expectation is also widely
shared by cultural theorists (e.g., Hofstede, 2001; Roberts & Greenwood, 1997). For example, Hofstede
(1994: 4) suggests that: “... the culture of the human environment in which an organization operates
affects the management processes.”
9
However, it has been repeatedly observed that a fuller understanding of managerial and
organizational behavior requires the investigation of both macro-country and micro-organizational
antecedents as well as controls for non-cultural drivers of managerial behavior (e.g., see Hofstede et al.,
2010; Tung & Stahl, 2018 for reviews). Thus, in our proposed, comprehensive conceptual model, first, we
employ national culture to explain across country variation. National culture according to Triandis (1996:
407) “is reflected in shared cognitions and standard operating procedures.” Hence, our theoretical
expectation, based on prior literature, is that since national culture affects such managerial operating
procedures, it should also impact metric use. For example, national culture can impact the rigidity and
enforcement of control systems designed to impose rules and criteria for how decisions should be made
(Hofstede et al., 2010). In addition, it can focus the decision-making process more toward short- versus
long-term performance objectives (Deleersnyder, Dekimpe, Steenkamp, & Leeflang, 2009). In this study,
we operationalize national culture using the GLOBE national cultural values typology (House, Hanges,
Javidan, Dorfman, & Gupta, 2004). GLOBE was started to address a number of frequently noted
shortcomings in Hofstede’s work, namely that (i) the psychometric properties of the Hofstede measures
were problematic; (ii) the results were based on managers in a single corporation (IBM), which happens
to have a strong organizational culture of its own; and (iii) questions about ratings that were collected
over 50 years ago (Javidan, House, Dorfman, Hanges, & Luque, 2006). As further detailed in the next
section, we hypothesize that six GLOBE cultural values will impact overall metric use.
Second, we employ organizational culture to help explain within country firm-related variation in
metric use. Previous research has documented that organizational culture often guides managerial
decision norms (Morgan & Vorhies, 2018; Yarbrough et al., 2011) and can influence the information
acquisition, transmission, and utilization by managers in one firm relative to another (Moorman, 1995).
Consequently, organizational culture should impact the use, type, and amount of information managers
employ for their decisions. For example, organizational culture can impact internal procedures designed
to encourage managerial learning and use of information (Kale & Singh, 2007). Further, it can also
impact the incentivization and rewards systems to spur managers to employ additional metrics in their
10
decisions (Henri, 2006). Thus, our theoretical expectation is that such organizational culture-based
structures and practices should affect managerial use of metrics for marketing decisions. To
operationalize organizational culture, we employ the widely used Competing Values Framework typology
(Cameron & Quinn, 2011). This framework was proposed as a result of merging two major theoretical
traditions from the organizational behavior literature, i.e., the systems-structural and transaction cost
perspectives; and classifies organizations on two key cultural dimensions, i.e., how much the firm
emphasizes (i) organic versus mechanistic processes and (ii) internal maintenance versus external
positioning (Deshpandé et al., 1993).
Third, as noted earlier, we also need to control for the characteristics of the manager, firm,
industry, and type of marketing-mix decision being made. Therefore, in Figure 1, we present our
conceptual framework, which includes all three sets of variables. In this first work trying to explain both
across and within country managerial variation in the overall use of metrics, we focus our conceptual
framework and hypotheses on main effect drivers of overall metric use; i.e., the effects of national and
organizational culture on overall metric use while controlling for the manager, firm, and industry decision
setting. After discussing the results of the main effect drivers, in the additional analysis section, we follow
Mintz and Currim (2013) and analyze the drivers of only marketing and only financial types of metrics.
Further, in the additional analysis section, we conduct an exploratory analysis of potential moderators.
--- Figure 1 about here ---
Macro-National Level Culture Drivers of Metric Use
Our theoretical expectation, as discussed below and summarized in Table 2, is that six GLOBE cultural
values, i.e., uncertainty avoidance, institutional collectivism, power distance, assertiveness, performance
orientation, and future orientation, will impact total metric use. Due to (i) less theoretical relevance to our
managerial metric use context, and (ii) conceptual overlap and empirical correlations between some of the
aforementioned GLOBE cultural values, we do not consider (a) gender egalitarianism, which is the extent
to which a society minimizes gender role differences, (b) humane orientation, which is the degree that

11
societies encourage individuals to be altruistic, friendly, and generous, and (c) in-group collectivism,
which is the extent to which societies express pride, loyalty, and cohesiveness in their families.
--- Table 2 about here ---
To theoretically understand how the six proposed GLOBE dimensions we consider may affect
across country variation in metric use, it is useful to consider the five granular overlapping purposes of
metric use described earlier. The first aforementioned function of metrics is to clarify the rules and
criteria on which performance will be assessed. The second is to signal desired behaviors for strategy
implementation and learning. These functions should especially resonate in cultures that are high on
uncertainty avoidance. Cultures that avoid uncertainty adopt strict codes of behavior (Steenkamp,
Hofstede, & Wedel, 1999), rely on more formalized processes (House et al., 2004), and attempt to utilize
more information during their decision process (Zaheer & Zaheer, 1997). This results in managerial
decision-making that is more fact- than intuition-based (Naor, Linderman, & Schroeder, 2010) and that
focuses on risk avoidance and reduction (Roth, 1995). The implementation of procedures allows greater
predictability of behavior and orderly meticulous record keeping, which reduces risk (de Luque &
Javidan, 2004). Clearly defined metrics that signal desired behaviors help define the rules of the game for
managers and provide the orderly bureaucratic context that is valued in these societies. Hence, we expect:
H1: Managers residing in higher (lower) uncertainty avoidant societies employ a larger (smaller)
number of metrics in their marketing-mix decisions.
The third aforementioned role of metrics use is to increase the accountability of individual
managers. Managers cannot hide behind the collective or the firm, as their performance will be assessed
on metrics (Farris et al., 2010). This suggests that greater metric use is aligned with cultures that
encourage and reward individual performance as opposed to collective performance. For example,
managers in individualistic (low institutional collectivist) societies are more likely to act independently
(Shavitt et al., 2006), make decisions on their own (Schuler & Rogovsky, 1998), and be judged according
to the results of such actions (Griffin, Guedhami, Kwok, Li, & Shao, 2017). Consequently, this should
increase the likelihood for managers in such societies to employ metrics in their marketing-mix decisions.
12
H2: Managers residing in lower (higher) institutional collectivistic societies employ a larger (smaller)
number of metrics in their marketing-mix decisions.
The fourth aforementioned role of metric use is that it empowers managers. Their performance
can be evaluated on hard and verifiable criteria rather than on contextual or soft criteria. In high power
distance societies, this may not be seen as necessarily desirable, at least not by top management. In these
societies, less powerful people should be dependent on more powerful people (Flynn & Saladin, 2006)
and management by objective-based metrics is less accepted because it presupposes some form of
negotiation between subordinate and superior with which neither party may feel comfortable (Hofstede et
al., 2010). Further, in high power distance societies, managers are more likely to use heuristics in their
decision-making (Lalwani & Forcum, 2016) and are less likely to use diverse sets of information (Aaker,
2006), which should result in less use of metrics. In contrast, in less power distant societies, managers are
more likely to employ a more comprehensive amount of information in their decisions (Lalwani &
Forcum, 2016), and executives of firms are more likely to empower and objectively assess their managers
(Flynn & Saladin, 2006), e.g., based on metrics, which should lead to managers employing a greater
number of metrics in their decisions. This behavior is also associated with people residing in cultures with
higher levels of assertiveness. In such cultures, managers may be more likely to use more metrics because
they are motivated to be “right” and have less pushback on decisions (e.g., Rucker, Hu, & Galinsky,
2014). However, managers in assertive cultures also exude more confidence in their decisions and initial
instincts, and are less open to utilize more information that contradicts such instincts (Flynn & Saladin,
2006), which are all characteristics which would suggest managers in such countries employ less metrics
overall in their decisions. Therefore, we expect:
H3: Managers residing in less (more) power distant societies employ a larger (smaller) number of
metrics in their marketing-mix decisions.
H4: Managers residing in less (more) assertive societies employ a larger (smaller) number of metrics
in their marketing-mix decisions.
The fifth aforementioned role of metric use is to improve the performance of the firm. This
should especially resonate in cultures characterized by a strong performance orientation, who are likely to
13
constantly monitor competitors’ and own managers’ performance (Autio, Pathak, & Wennberg, 2013).
Thus, we expect that metric use will be higher, ceteris paribus, in societies that emphasize performance
orientation. For managers residing in countries with greater future (lower present) orientation, on the one
hand, there are both short and long-term metrics for managers to employ, and managers in such societies
may use additional metrics in their decisions to enable the firm to monitor performance and provide
insights for future strategy and implementation related decision-making. On the other hand, for managers
in such future oriented societies, “persistence” is a key word - persistence in achieving one’s goals,
irrespective of short-term considerations and fluctuations in the environment (Hofstede, 2001), which
should lead to less reliance on metrics in their decisions. In contrast, for managers residing in countries
with greater present (lower future) oriented cultures, the “bottom line” results to be achieved in the next
quarter are heavily emphasized as are control systems to constantly monitor such performance
(Deleersnyder, Dekimpe, Steenkamp, & Leeflang, 2009). Metrics are part of these control systems, and
their performance can be tracked in the short-term (O’Sullivan & Abela, 2007). Hence, we expect
managers in present (lower future) oriented societies to employ more metrics in their decisions.
H5: Managers residing in more (less) performance oriented societies employ a larger (smaller)
number of metrics in their marketing-mix decisions.
H6: Managers residing in less (more) future oriented societies employ a larger (smaller) number of
metrics in their marketing-mix decisions.
Micro-Organizational Level Culture Drivers of Metric Use
Based on prior research on the impact of organizational culture on managerial decision-making (e.g.,
Henri, 2006; Moorman, 1995), our theoretical expectation is that the two dimensions of organizational
culture from the Competing Values Framework will impact within country firm-based variation of metric
use. The first dimension, external positioning vs. internal maintenance, differentiates external culture-
based firms that emphasize a focus on interacting or competing with others outside their boundaries from
internal culture-based firms that emphasize harmonious internal characteristics (Cameron & Quinn,
2011). In internally positioned firms, managerial decision processes typically emphasize greater
organizational involvement, overall cohesiveness, and trust (Deshpandé et al., 1993). Based on such
14
factors, an internal maintenance emphasis is likely to pressure managers in these types of firms to employ
more knowledge sharing based on articulating and disseminating information between different functions
(e.g., Kale & Singh, 2007). Consequently, this should lead managers in such firms to employ a greater
amount of information when making their decisions. Further, internal organizational culture-based firms
are more likely to focus on their own rules and criteria to assess managerial performance, enforce
accountability, and facilitate managerial empowerment (Henri, 2006), which are all aforementioned
functions metric use has the potential to fulfill. Therefore, even though external organizational culture-
based firms could motivate their managers to employ and monitor metrics related to their competitors, we
expect managers working for firms with a greater internal organizational culture will use more metrics
overall when making their marketing decisions. Hence, we hypothesize:
H7: Managers working in more (less) internal-focused organizational cultures employ a larger
(smaller) number of metrics in their marketing-mix decisions.
The second dimension, organic vs. mechanistic processes, differentiates organic culture-based
firms that emphasize flexibility, discretion, and dynamism from mechanistic culture-based firms that
emphasize stability, order, and control. That is, some organizational cultures are more positioned as
changing, adaptable, and flexible; others are viewed as stable, predictable, and structured (Cameron &
Quinn, 2011). Past research focusing on how organizational culture can impact managerial decision-
making (e.g., Huang, Rode, & Schroeder, 2011) has suggested that firms with more flexible decision-
making environments such as in organic cultures promote trust, managerial empowerment, commitment,
and continuous learning among members in organic firms. As a result, this type of organizational culture
creates a more participatory decision environment within the firm as it involves managers with different
priorities and goals (White, Varadarajan, & Dacin, 2003), enables managerial discretion, empowerment,
initiative, and experimentation (Moynihan & Pandey, 2010), and should encourage a greater, diverse use
of information by managers (Henri, 2006). In addition, prior work investigating how organizational
culture impacts marketing managers’ perceived decision-making contexts (e.g., Berthon, Pitt, & Ewing,
2001) suggests that organic-like firm cultures value adaptability, flexibility, and spontaneity, which
15
creates less programmatic decision-making contexts. Managers, when facing such contexts, typically
require greater judgment, effort, and use of information to reduce the uncertainty inherent with such
decisions (Perkins & Rao, 1990), which should lead to a greater use of metrics. Consequently, even
though mechanistic firms will also try to pressure their managers to focus on using metrics in their
decisions via control systems they employ to evaluate such managers, which could lead to an increase in
the use of metrics, we expect that managers in organic-culture firms will use a greater number of metrics
in their marketing-mix decisions. Therefore, we expect:
H8: Managers working in more (less) organic-focused organizational cultures employ a larger
(smaller) number of metrics in their marketing-mix decisions.
Control Variables
To address concerns expressed in the marketing, management, and IB literatures on the lack of non-
cultural controls in studies investigating the effects of culture, we account for the following other
characteristics: the type of manager making the decision, and the firm and industry setting in which the
decision is made. The controls proposed are based on prior literature on metrics and information use (e.g.,
Lehmann & Reibstein, 2006; Mintz & Currim, 2013; Verhoef & Leeflang, 2009), and should be of
interest in their own right as it is likely that their effects in this global study could be different from prior,
single-country based studies.
First, prior research on the resource based theory of the firm (Wernerfelt, 1984), suggests that
greater firm resources enhance managers’ capabilities to monitor current and past marketing efforts
(Mintz & Currim, 2013) and their capacity to compute and benchmark metrics (Morgan et al., 2005);
aspects which should facilitate greater metric use. Hence, we control for five firm characteristics
previously identified in the literature on information use (e.g., Kohli & Jaworski, 1990; Verhoef &
Leeflang, 2009) that should facilitate greater resources for metric use in marketing decisions: the firm’s
market orientation, marketing’s influence in the firm, Chief Marketing Officer (CMO) presence, Chief
Executive Officer (CEO) having a marketing background, and its size.
16
Second, prior work across different business disciplines has suggested that industry
characteristics can potentially impact managerial decision processes (e.g., Eisenhardt, 1988; Morgan et
al., 2005). One reason for this, as suggested by institutional theory, is that firm processes, strategies, and
traditions are often mimicked across the industry (DiMaggio & Powell, 1983). Therefore, we control for
four commonly employed industry environment characteristics: product life cycle, growth, industry
concentration, and turbulence (e.g., Homburg, Workman, & Krohmer, 1999; Morgan et al., 2005). Third,
the decision maker’s perspective-based theory suggests that characteristics of decision makers can often
influence their objectives, interpretation of a situation, and overall use of information (Curren, Folkes, &
Steckel, 1992; Perkins & Rao, 1990). Hence, we control for three managerial characteristics previously
identified in the marketing strategy literature as likely to influence decision-making processes: managerial
level in the firm (mid vs. top-level), work experience, and quantitative background. Finally, value chain
theory posits that the type of marketing-mix decision being made should impact the metrics managers
employ when making their decisions because different types of decisions have divergent goals and
objectives (Farris et al., 2010; Lehmann & Reibstein, 2006). Thus, we control for 10 types of marketing-
mix decisions (listed in the results section).
METHOD
Data Collection
To obtain data on metric use and other variables of interest, we combine primary survey data and
secondary country level data. For the primary data, we collaborated with the market research firm Survata
to collect data by employing an online survey of 16 countries in Asia (China, India, Indonesia, Japan,
South Korea, Turkey), Oceania (Australia), Europe (France, Germany, Italy, Russia, U.K.), North
America (Canada, U.S.), and Latin America (Brazil, Mexico). For the secondary data, we employ data on
the GLOBE national cultures dimensions for each country (House et al., 2004). We focus on this set of 16
countries because they account for over 80% of the world’s total GDP, are the countries in which MNCs
are more likely to operate, and represent various regions with significant business and marketing activity
as well as economic development—i.e., highly advanced, developed, and emerging economies.
17
The primary data collection instrument or questionnaire was first developed in English and then
translated into Chinese, French, German, Indonesian, Italian, Japanese, Korean, Portuguese, Russian,
Spanish, and Turkish using back-translation. Following Mintz and Currim (2013), the central
requirements for managers to partake in our study were that they needed to have (i) a job title in
marketing at a rank of marketing, product, or brand manager or above (i.e., CMO, VP/marketing, director
of marketing), or be a top-level executive in the firm (S/VP or C-level); and (ii) must have been involved
in making marketing-mix decisions in the recent past. No restrictions were included based on the size of
the firm or the type of industry since we were interested in obtaining managerial respondents from a wide
range of firms and industries. Unfortunately, we were unable to accurately collect information on whether
the managers worked for a MNC.
The recruitment of such managers was handled by Survata who paid panelists in each of the 16
countries. Initial screening of respondents was also conducted by Survata, who implemented quality
control checks before, during, and after managers interacted with the survey based on managerial
qualifications, attention checks, analysis for patterned responses, and minimum survey completion times.
Respondents were only paid for quality submissions, i.e., they needed to pass these aforementioned
quality control checks, which were unknown to the respondents. In addition, respondents were informed
by Survata that if they did not pass the quality assurance requirements, they could be omitted from future
panels. Consequently, these multiple methods helped motivate respondents to be engaged and provide
truthful answers.
The data collection occurred over a four-month period in 2015 and comprised of two steps. First,
for each country, we conducted an initial soft launch targeting 15-20% of our sample to assess the quality
of translations of our survey instruments and the quality of the managerial respondents. Second, we
subsequently launched our main survey wave. Our final dataset consists of 4,384 decisions by 1,637
firms/managers (each firm had one manager answer the questionnaire) with an average of 274 decisions
per country. Table 1 provides summary statistics on the number of decisions reported by managers in
each country.
18
Measurement
Managerial metric use. Overall metric use is the number of metrics employed for a specific
marketing-mix decision. This unit of analysis is important since we are interested in how national and
organizational cultures can potentially impact the variation in total metric use for a specific decision. We
focus on actual individual decisions, which managers are likely to remember more accurately and hence
be less likely to feel pressured to respond more normatively, in contrast to a typical or ideal decision-
based scenario which often suffer from representativeness and availability biases and heuristics (Tversky
& Kahneman, 1974).
To measure overall metric use, we adopted the measurement instrument developed by Mintz and
Currim (2013). A total of 84 marketing and financial metrics were identified based on 11 published
studies (see Web Appendix Table 2). Managers were asked to indicate which of 10 marketing-mix
decisions they recently undertook,iii with the clarification following Menon et al. (1999: 28) that they
were to select decisions that “(1) were not so recent that performance evaluation is premature and (2) not
so long ago that memory about the decision and performance is fuzzy.” For each decision, managers were
tasked to indicate which of 24 (12 marketing and 12 financial) general metrics (i.e., metrics that apply to
many types of decisions) and 6 metrics specific to each of 10 marketing-mix decisions (i.e., metrics suited
to that particular type of decision) they employed when making that particular marketing-mix decision.
Managers could view the definitions of the metrics and were also allowed to write-in the use of any
additional metric employed, but almost none did (<1%).
Organizational culture. Organizational culture was measured using the six-item Organizational
Culture Assessment Instrument (Cameron & Quinn, 2011). For each item, there were four response
options; and respondents were tasked with distributing 100 points between the four options depending on
how similar each description is to their firm (see Web Appendix Table 3). This use of constant-sums
represents a form of ipsative-measurement, which is more complex to derive than for the other
explanatory variables in our econometric model. Thus, in the analytical procedure section, we describe
our new method to assess organizational culture based on this measurement technique.
19
National culture. Country scores on the GLOBE business practices dimensions were taken from
House et al. (2004).
Control variables. See Web Appendix Table 3 for information on the measurement and sources
for the control variables, all from the extant literature.
Sample Descriptive Information
Managerial respondents in our sample had an average of 9.5 years of work experience and nearly half
(43%) were top-level managers, i.e., VP or C-level. The average firm has 8,921 full-time employees
(median of 498) and is relatively market oriented (average of 5.61 out of 7.00). The variation in the
sample is good, i.e., 62% of firms compete in the introductory/growth stages in the life cycle and 38% of
firms compete in the mature/declining stages; and 73% compete in less concentrated industries (i.e., 4
largest firms control <50% of market share) and 27% compete in more concentrated industries, which
makes it an appropriate empirical sample to test our hypotheses. Due to word space limitations, further
information regarding the means and standard deviations of our measures are provided in Web Appendix
Table 4.
Data Quality
We conducted the following tests to assess data quality. First, based on Harman’s one-factor and Lindell
and Whitney (2001) post hoc tests, we do not find evidence of common-method bias. Further, as
recommended by Podsakoff, MacKenzie, Lee, and Podsakoff (2003), we used multiple response scales
(nominal, constant sum, Likert scales) in our survey, which should lessen concerns about common
method variance. Second, we do not detect non-response bias in our sample based on the Armstrong and
Overton (1977) test in which late and early respondents scores are compared on the included constructs
(p=n.s.). Third, to counter possible self-selection or non-responses biases where managers only
participated or will only report decisions in which they employ large amounts of metrics, we followed
Fredrickson and Mitchell (1984) and stated that we were interested in responses from managers who do
and do not employ metrics in their decisions and that their answers would remain anonymous (Chang, van
Witteloostuijn & Eden, 2010). Of the 4,384 marketing-mix decisions reported in the total sample, 624
20
(14%) involved managers who only employed zero to three metrics; evidence that managers were not
reluctant to describe decisions in which no metrics or a very small number of metrics were involved.
Deriving Cross-Nationally Comparable Scores
Since our hypothesis testing involves collecting data across a number of different countries, we need to
address the question of measurement invariance (e.g., Singh, 1995). Therefore, we derived cross-
nationally comparable scores on the two control variables measured with Likert scales – market
orientation (8 items) and market turbulence (3 items). Given the large number of countries, the traditional
multi-group confirmatory factor analysis model (Steenkamp & Baumgartner, 1998) becomes
cumbersome. Therefore, we turned to the alignment method, which was recently developed for
simultaneous analysis of many groups, and could be applied for our multi-country context (Asparouhov &
Muthén, 2014).
This method has two steps. First, the multigroup configural model is estimated in which loadings
and intercepts are free across countries, factor means are fixed at 0 in all countries, and factor variances
are fixed at 1 in all countries. Second, alignment optimization frees the factor means and variances, and
chooses their values to minimize the total amount of noninvariance using a simplicity function for every
pair of countries and every intercept and loading using a component loss function f from EFA rotations
(Jennrich, 2006). For our two Likert scaled constructs, we applied this method and found that metric
invariance was supported across all countries for two out of three market turbulence items and all eight
market orientation items. Scalar invariance was supported for all market turbulence items and six out of
eight market orientation items. We calculated the factor scores based on the partial scalar invariance
model (Steenkamp & Baumgartner, 1998) and correlated them with the summated scores. The correlation
for market turbulence was 0.963 and for market orientation 0.983. These findings support the
measurement invariance of the constructs (Asparouhov & Muthén, 2014).
Analytical procedure
Deriving scores on the organizational culture dimensions. To relate the observed constant sum
responses to the six items in the Organizational Culture Assessment Instrument and the underlying
21
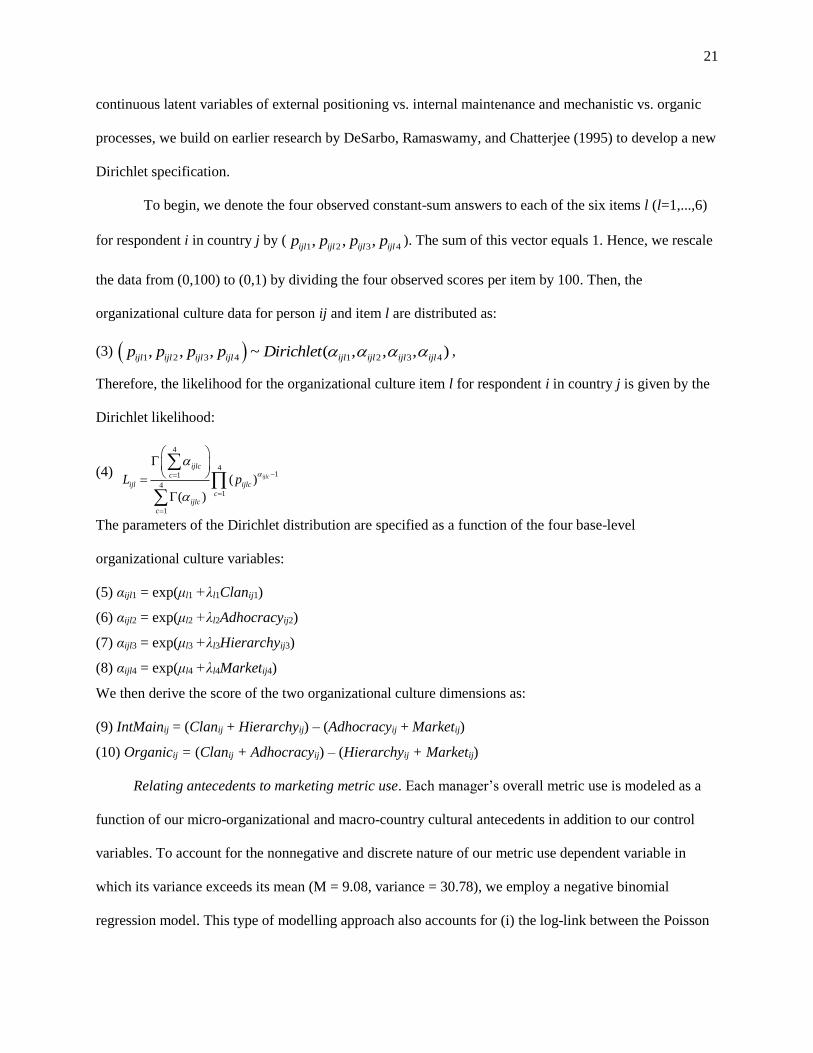
continuous latent variables of external positioning vs. internal maintenance and mechanistic vs. organic
processes, we build on earlier research by DeSarbo, Ramaswamy, and Chatterjee (1995) to develop a new
Dirichlet specification.
To begin, we denote the four observed constant-sum answers to each of the six items l (l=1,...,6)
for respondent i in country j by (1 2 3 4, , ,ijl ijl ijl ijlp p p p ). The sum of this vector equals 1. Hence, we rescale
the data from (0,100) to (0,1) by dividing the four observed scores per item by 100. Then, the
organizational culture data for person ij and item l are distributed as:
(3) 1 2 3 4 1 2 3 4, , , ~ ( , , , )ijl ijl ijl ijl ijl ijl ijl ijlp p p p Dirichlet ,
Therefore, the likelihood for the organizational culture item l for respondent i in country j is given by the
Dirichlet likelihood:
(4)
4
411
41
1
( )
( )
ijlc
ijlc
c
ijl ijlc
cijlc
c
L p
The parameters of the Dirichlet distribution are specified as a function of the four base-level
organizational culture variables:
(5) αijl1 = exp(μl1 +λl1Clanij1)
(6) αijl2 = exp(μl2 +λl2Adhocracyij2)
(7) αijl3 = exp(μl3 +λl3Hierarchyij3)
(8) αijl4 = exp(μl4 +λl4Marketij4)
We then derive the score of the two organizational culture dimensions as:
(9) IntMainij = (Clanij + Hierarchyij) – (Adhocracyij + Marketij)
(10) Organicij = (Clanij + Adhocracyij) – (Hierarchyij + Marketij)
Relating antecedents to marketing metric use. Each manager’s overall metric use is modeled as a
function of our micro-organizational and macro-country cultural antecedents in addition to our control
variables. To account for the nonnegative and discrete nature of our metric use dependent variable in
which its variance exceeds its mean (M = 9.08, variance = 30.78), we employ a negative binomial
regression model. This type of modelling approach also accounts for (i) the log-link between the Poisson
22
mean and the covariates that represent the latent metric usage rate and (ii) a transformed error term that
takes care of the overdispersion (Greene, 2003). To incorporate the dependency between observations
belonging to the same country, we employ a robust maximum-likelihood procedure with cluster-robust
standard errors. This approach allows us to test for macro-national and micro-organizational cultural
effects while controlling for the country, firm, manager, industry, and decision setting in a converging
model (Beugelsdijk, Kostova, & Roth, 2017). Further details, including analysis demonstrating that our
estimation is not expected to suffer from multicollinearity, are provided in Web Appendix A.
RESULTS
Descriptive Information on Metric Use
In Table 3, we present statistics on the average use of metrics by managers in each of the 16 individual
countries and by type of marketing-mix decision. In Figure 2, we provide histograms for the range of
metrics employed per country. Across our entire sample, managers employed an average of 9.08 metrics
per marketing-mix decision. The three countries reporting the greatest average amount of metric use are
South Korea (11.72), China (11.14), and India (10.72); while the three countries reporting the least
amount of use are Japan (4.29), France (5.79), and the U.S. (7.38).
Based on the descriptive statistics provided in Table 3 and Figure 2, we find model-free support
for our expectations of across and within country managerial variation in metric use. Regarding variation
in metric use across countries in our sample, we find a range of 7.43 metrics employed between managers
residing in the country with the greatest average use of metrics (South Korea) vs. managers residing in the
country with the least average use of metrics (Japan), even though the overall average use of metrics is
only 9.08 (see Table 3). Hence, this indicates large variation in metric use by managers across different
countries. For variation in metric use within countries, we find standard deviations in each country in the
range of 3.52-6.43, even though again the average use of metrics in our sample is only 9.08. Therefore,
substantial variation in metric use exists across and within countries, and it does not appear there is
standardization either across or within countries. However, we also note that these model-free statistics
are aggregated by country and do not account for the aforementioned micro-organizational or macro-
23
national level cultural drivers of metric use nor our controls, unlike in our negative binomial regression
model whose results we discuss in the next section.
--- Figure 2 and Table 3 about here ---
Regarding individual metrics, in Table 4 we document that satisfaction (53%), awareness (45%),
and ROI (43%) were the three most used metrics in our sample. In fact, satisfaction was reported to be the
most used metric in 8 of the 16 countries and in the top 3 of used metrics in 13 of the 16 countries. The
highest use of an individual metric in any country was awareness in India, where 71% of managers used
this metric. In Table 5, we report on the three most used metrics for each type of marketing-mix decision
for each of the 16 countries in our sample. Interestingly, some metrics such as satisfaction and awareness
are consistently in the top three most employed metrics by managers residing in different countries for a
variety of marketing-mix decisions. Other metrics like total customers are most employed by managers
for a certain type of decision (i.e., sales force) and metrics such as target volume (i.e., Indonesia) and net
profit (i.e., Mexico and Russia) are more employed by managers in a certain country. Overall, the
statistics provided in Tables 3, 4, and 5 provide valuable benchmarks on the current use of metrics by
managers residing in a number of countries making 10 different types of marketing-mix decision. As a
result, these tables should be useful for researchers, managers, and consultants.
--- Tables 4 and 5 about here ---
Results of Drivers of Metric Use
Table 6 provides the results of our empirical analysis. To begin, we find broad support for our macro-
national cultural drivers of metric use. Specifically, we find uncertainty avoidance (p<.01) is positively
associated with metric use and institutional collectivism (p<.01), power distance (p=.01), assertiveness
(p=.02), and future orientation (p=.02) are each negatively associated with metric use. The anticipated
positive effect of performance orientation does not reach statistical significance (p=.39). Thus, with 5 of
our 6 hypotheses supported (H1, H2, H3, H4, and H6), we find support for our main theoretical
proposition of an association between macro-national culture characteristics and metric use. Second, we
find both of our proposed micro-organizational cultural variable based hypotheses (H7 and H8) are
24
supported. Specifically, we find a significant positive relationship between firms with internal (p=.01) and
organic cultures (p=.06), and metric use. Consequently, we find support for our theoretical expectations
of an association between culture, both at a macro-country and micro-organizational levels, and metric
use.
Third, we compare the effect sizes of our cultural variables reported in Table 6 to allow for better
interpretability of our results (Kirkman et al., 2017). When comparing our standardized coefficients,
regarding the relative impact of macro-national cultural variables on metric use, we find the order is
power distance > institutional collectivism > future orientation > uncertainty avoidance > assertiveness >
performance orientation. We discuss managerial implications of these results in the conclusion section.
Fourth, we find that even though internal and organic organizational cultural variables have somewhat
similar effect sizes, organic culture has a slightly larger effect (0.15 vs. 0.12).
--- Table 6 about here ---
Next, we discuss the results of our control variables (bottom-half of Table 6). For firm resource
theory-based control variables, we find broad support as market orientation (p=.03), marketing’s
influence in the firm (p<.01), CMO presence (p=.03), and firm size (p<.01) are each found positively
associated with metric use, but whether the CEO has a marketing background is not associated with
metric use (p=.56). Similarly, we find broad, strong support for type of marketing-mix decisions (value
chain theory) as control variables with 8 of 9 decisions having a significant effect. More specifically, we
find managers making internet advertising (p<.01), direct to consumer (p<.01), social media (p<.01), sales
force (p<.01), pricing (p=.03), PR/sponsorships (p<.01), new product development (p<.01), and
distribution decisions (p=.06) are more likely to employ metrics than when making traditional advertising
decisions. The sole non-significant type of marketing mix decision is price promotions (p=.14). In
contrast, for industry-level predictors (institutional theory), we find limited support as the only significant
relationship is between industry growth and metric use (p=.03); the remaining industry variables are non-
significant. A possible reason for the lack of support of industry predictors is that there are supplementary
sources of information and methods for managers around the world to enable greater metric use to reduce
25
uncertainty when making their marketing-mix decisions, i.e., national and organizational culture, firm
resources, and type of decision, so the industry institutional environment matters less. In addition, we do
not find support for significant relationships between managerial characteristics (decision maker’s
perspective based theory) and metric use in our international sample. Interestingly, Mintz and Currim
(2013) also find limited support of managerial characteristics affecting metric use in their U.S. focused
sample.
Additional Analysis
We now summarize over 60 additional models conducted to provide more nuanced insights regarding the
relationships between national culture, organizational culture, and metric use by managers residing in
different countries. Due to word space limitations, this section is brief. Therefore, we refer the reader to
Web Appendix B for greater details on motivation, operationalization, and results of such analyses.
Relationship between Metric Use and Performance. For each of the 16 countries in our sample,
we empirically test the relationship between total metric use and subjective assessments of performance
outcomes of the same decision while controlling for the endogeneity of drivers of variation of managerial
metric use. In each of the 16 countries in our sample, we find a significant and positive relationship
between total metric use and marketing-mix performance (each p<.05). These results provide robust
support for (a) prior research conducted in one country (the US) showing that an increasing use of metrics
is beneficial to decision outcomes, and (b) the importance of the current research to IB practice by
identifying culture-based reasons for variation in managerial metric use across and within countries.
Marketing and Financial Metric Use. Since national and organizational culture could affect
managerial use of certain types of metrics, we analyze the results of two additional models with differing
dependent variables; first with marketing metrics and second with financial metrics, based on Mintz and
Currim’s (2013) classifications. For the national culture variables, we find similar effects on marketing
and financial metric use as we did for our earlier results on overall metric use. Likewise, for the
organizational culture variables, we also find a similar effect on marketing and financial metric use for
internal-focused firms and a similar effect on financial metrics for organic-focused firms. Hence, for
26
seven of eight hypothesized variables (see Table 7), we find similar results with type of metric used to
overall use of metrics, so it appears that national and organizational culture largely affect managerial
metric use in aggregate and not just by type of metric.
--- Table 7 about here ---
Interactions between National and Organizational Culture. Prior research has found conflicting
evidence on whether national culture impacts organizational culture or whether each culture operates
independently of the other (e.g., see Naor et al., 2010 for a review). For example, managers may
experience compatibilities and conflicts between their own organizational and national cultural priorities
(Hofstede et al., 2010). To conduct an exploratory analysis of potential moderation between the two levels
of culture, we first test for interactions by including all potential interaction terms between the two levels
of culture in a single model (Bass, 1995). The results of this analysis do not provide much support for
such interaction effects, as we only find four of the twelve interactions to be statistically significant;
internal-focused and future orientation, internal-focused and power distance, and organic-focused and
performance orientation are associated with an increase in metric use, and organic-focused and future
orientation is associated with a decrease in metric use.
As a follow-up, we examine the potential moderation effect of each of the six national and two
organizational culture variables by splitting the sample into higher and lower than median sub-samples,
and estimating a model for each of such 16 different sub-samples. The main finding from these analyses
is that for the high organic organizational culture sub-sample, all six national culture variables have
significant coefficients, but for the low organic sub-sample, we find that only institutional collectivism
has a significant effect. Consequently, it appears that moderation between organic organizational culture
and national culture mostly occurs in firms with higher and equal to the median organic cultures.
Moderation by Type of Marketing-Mix Decision. Next, we explore potential moderation by type
of marketing-mix decision (value chain theory). The main takeaway from these analyses is that for each
of the 10 types of decisions, we find the signs of the coefficients for uncertainty avoidance, institutional
collectivism, and assertiveness are exactly the same as hypothesized, while the signs of the remainder of

27
our national and organizational culture variables vary only slightly (i.e., same signs for 7-9 decisions
depending on the variable). Thus, we find consistency in the direction of impact of our cultural variables
on the use of metrics by managers across 10 different types of marketing-mix decisions, similar to our
expectations.
Further, we identify the types of marketing-mix decisions for which national and organizational
culture matter more or less to managerial use of metrics. We find that (i) both national and organizational
culture impact overall use of metrics for managers making traditional advertising, direct to consumer,
social media, price promotion, and distribution decisions, (ii) national culture matters but organizational
culture does not appear to matter for sales force, pricing, PR/sponsorships, and new product development
decisions, and (iii) neither national or organizational culture appear to matter for internet advertising
decisions.
Moderators based on Control Variables. We also examine potential moderation based on firm
size (resource based theory), work experience (decision maker’s perspective based theory), and industry
growth (institutional theory) sub-segments (higher versus lower than median). For firm size, we find both
national and organizational culture variables matter for each sub-sample, but the main differences
between larger and smaller firms are (i) performance orientation has a significant positive effect on metric
use for larger firms but is a non-significant factor for smaller firms, and (ii) assertiveness and future
orientation both have significant negative effects on metric use for smaller firms but no significant effect
for larger firms.iv For work experience and industry growth, we find that while national culture variables
affect metric use by managers in each sub-sample, organizational culture variables affect metric use in
just the high sub-samples.
Analysis by Country. Finally, we assess the impact of organizational culture on metric use in each
country. Most importantly, we find the signs of the significant coefficients in 12 of the 16 countries are
consistent with our proposed expectations. In addition, we find (i) both organizational culture variables
significantly impact managerial metric use in Australia, Brazil, Canada, Russia, and the United Kingdom;
(ii) neither type of organizational culture impacts the use of metrics by managers residing in China,
28
France, Germany, Japan, South Korea, and the USA; and (iii) only one type of organizational culture
impacts the use of metrics by managers residing in India, Indonesia, Italy, Mexico, and Turkey. An
additional takeaway from these results is that the impact of organizational culture drivers on metric use
varies across countries, which provides evidence that national culture variables need to be included in
such analysis in order to help explain and account for such across country variation.
To summarize the results of the 65 additional analyses briefly overviewed, we find an increase in
metric use is associated with an increase in marketing-mix performance, which demonstrates that
investigating the sources of managerial variation in metric use across and within countries is important to
IB practice. In addition, we find that both national culture and organizational culture are important factors
that help explain such variation in overall managerial metric use. Further, we find that the effects of
national and organizational culture on types of metrics used and overall metric use are largely similar; and
the interaction effects between national and organizational cultures on metric use are limited, apart from
the effects of national culture on organizations with higher than median organic cultures. Finally, and
most importantly, we find through these analyses that it is critical to account for varying levels of
theoretical abstraction (i.e., national, firm, industry, manager, and decision) when investigating causes of
across and within country managerial variation in the overall use of metrics.
CONCLUSION
Marketers around the world are facing intensified demands to increase the accountability of their
decisions via the use of metrics (e.g., Lehmann & Reibstein, 2006; O’Sullivan et al., 2009; Rust et al.,
2004). The reasons are clear: prior research demonstrates that an increase in marketing’s accountability
enhances its stature within the firm which in turn improves the performance of the firm (e.g., Verhoef et
al., 2011; Verhoef & Leeflang, 2009). Consequently, the existence, nature, and business impact of cross-
cultural differences on managerial metric use for individual marketing-mix decisions at both the firm and
national levels are important to both IB, marketing, and management theory and practice. Despite this
importance, little prior research has investigated what drives managerial metric use, which is a key to
accountability in global settings.
29
In this paper, we address this gap in the literature and practice by examining the use of metrics by
managers residing in 16 countries. We propose and empirically test a conceptual model hypothesizing
that cultural effects, at both the organizational and country levels, are important factors driving both
across and within country managerial variation in metric use. After controlling for a host of variables, we
empirically find that managerial metric use is influenced by both the culture of the organization in which
the manager operates as well as by the prevailing culture of the country in which the manager lives.
Although prior research in the IB, marketing, and management literature has found that cultural
orientation exerts a powerful influence on managerial behavior (e.g., Cameron & Quinn, 2011;
Deleersnyder et al., 2009; Naor et al., 2010), few studies have integrated culture’s multiple levels of
abstraction while accounting for the decision setting, leading to a polarization of views between
“everything is the same within a country” and “everything is different across countries” (e.g., Farley &
Lehmann, 1994; Tung & Stahl, 2018). Thus, it was unknown prior to this study whether variation in
metric use by managers residing in different countries could be explained by cross-country cultural
variation, by within-country cross-organizational cultural variation, or by a mixture of the two. Since, we,
as scholars seek to improve the worldwide accountability of managerial decisions and performance of
firms, it is crucial as a first step to determine whether there is variation in metric use by managers residing
in different countries, and if so, subsequently try to determine where such variation originates or how it
can be explained.
Based on the results of our empirical test, we find that variation in metric use by managers
residing in different countries is a function of both variation in country and organizational cultures, so
communications and efforts aimed at increasing metric use will need to be sensitive to differences in both
country and organizational cultures, and not just one or the other. Consequently, the key managerial
contribution of this work based on the empirical results is that our results offer evidence of local
managerial tendencies for using metrics and to this end may help global and large international firms
(MNCs) to adjust their control policy “communications” (process) with managers in nations and cultures
that tend to use fewer metrics. One of our main results is that managers who reside in national cultures

30
with greater (less) institutional collectivism, assertiveness, power distance, and future orientation
(uncertainty avoidance), and whose firm culture lacks internal maintenance and organic processes,
employ fewer metrics in their marketing decisions. Thus, when executives at international firms are
attempting to communicate the need for greater metric use by their managers, culturally sensitive
communications could reflect an understanding of the country culture on the variables we have
considered (uncertainty avoidance, institutional collectivism, assertiveness, power distance, and
performance and future orientations). Additionally, organizations should consider the variables that
reflect the organization culture (internal maintenance and organic processes) in which the downstream
manager operates. For example, we find uncertainty avoidance to have the most positive impact on metric
use and power distance to have the most negative impact. This should help executives to encourage
managers in multiple countries to employ more metrics in their decision-making as it enables a reduction
in ambiguity, particularly in countries like Russia, Japan, and France where managers highly value
ambiguity reduction. In high power distance societies such as Mexico and China, an obstacle toward the
adoption of metric use is convincing superiors that having their lower-level managers employ metrics in
their decisions does not affect their subordinate relationship, but rather is intended to improve the overall
decision quality.
Executives can combine our full set of results accounting for different levels of abstraction to
increase metric use in these cultures, i.e., by increasing the market orientation of the firm, hiring a CMO,
positioning the organizational culture more toward an internal or organic focus, and facilitating data
collection for metric computation. However, a remaining question is whether and how these
recommendations can encourage greater metric use in the national and organizational cultural settings that
hinder it? This is an important question for future research considering that we find substantial variation
in metric use by managers residing in different parts of the world, which as a result produces worse
marketing-mix decision performance outcomes. To answer this, future researchers can conduct field
experiments at international companies with an objective to develop best practices in encouraging metric
use in settings that hinder it, and attempt to establish direct causality of methods to improve these
31
practices. Future research employing such field experiments have potential large-scale implications to
help improve the performance of firms in certain countries, like Japan and France, which report lower
managerial metric use, and compete in industries like consumer electronics and luxury goods that
respectively play a major role in those economies.
Limitations of this research enable future research opportunities. First, we conducted primary
research in 16 countries, but this cross-sectional data may not be fully representative of national samples,
as is common with survey methodologies. Second, although we attempt to be comprehensive in our list of
variables by accounting for 21 controls, there are always additional variables such as managerial
education, industry reporting standards, etc. that could be included. In addition, the impact of the
regulatory environment and changes to this environment may cause more managerial uncertainty, which
could impact managerial decision-making processes and their use of metrics for marketing-mix decisions.
Third, we did not collect information on the importance of a particular metric in a specific marketing-mix
decision, because during our pre-test it appeared that we could not accurately assess this information, so
this measure was subsequently dropped. Further, we did not attempt to evaluate how important each
individual decision was to managers making such decisions. Both of these limitations offer interesting
research opportunities. Fourth, due to survey length constraints, we were unable to assess perceived
characteristics of individual metrics employed or not employed, such as their accuracy, short or long-term
time horizon, etc. Fifth, our data do not capture whether responding firms were units of MNCs. Such
firms are expected to have relatively uniform internal cultures and policy-driven marketing metrics use;
however, it is possible that other influences might lead local affiliates to use additional metrics beyond
those required by their headquarters. Hence, future research could compare metric use by managers
working in multinational corporations, multidomestic corporations, and purely domestic firms. This
would be of particular interest because intuitively one would expect greater within-firm cross-national
similarity in MNCs since managers across subsidiaries are in frequent touch through both structured
meetings (e.g., required training at educational facilities or international conferences and business
meetings) as well as leadership that transcends international boundaries and informal intra-corporate
32
communications (e.g., messaging and phone calls). Sixth, future research could investigate metric use in
less developed countries.
Finally, at a broader level, our integration of national and organizational culture into a single
framework while accounting for the manager, firm, and industry decision setting should be useful for
future research bridging IB, culture, and JDM research. For example, our framework provides a building
block for future research on a wide-range of drivers of managerial behavior, such as decision
implementation, ex-post decision evaluations, strategy setting, adoption of new technology, crises
management, and responses to environmentally forced organizational changes, whose objective is to
investigate how potential cross-country and within-country factors drive certain managerial behavior
while needing to control for manager, firm, and industry characteristics inherent in the decision setting.
Our framework can also provide guidance for how such studies can structure investigations of potential
multi-faceted positive and negative consequences of culture in contrast to just its positive or negative
effects. In addition, at a firm strategic level, our research framework and empirical findings are potentially
equally if not more important for firms interested in acquiring, merging, or entering joint ventures with
other firms in different countries. Such firms have to assess, overcome, and manage both national and
organizational cultural differences (e.g., Nippa & Reuer, 2019), so they potentially face greater
difficulties in integrating their policies into the other firms. Consequently, our findings can provide initial
insights into how the national and organizational cultures and characteristics of the firm and industry
influence managerial behavior and the use of information by such managers in firms located in different
countries.v Thus, we hope that others will build on our work on metric use and managerial behavior in
these potential directions.
33
REFERENCES
Aaker, J. L. 2006. Delineating culture. Journal of Consumer Psychology, 16(4): 343–347.
Abramson, C., Currim, I. S., & Sarin, R. 2005. An experimental investigation of the impact of
information on competitive decision making. Management Science, 51(2): 195–207.
Armstrong, J. S., & Overton, T. S. 1977. Estimating nonresponse bias in mail surveys. Journal of
Marketing Research, 14(3): 396–402.
Asparouhov, T., & Muthén, B. 2014. Multiple-group factor analysis alignment. Structural Equation
Modeling: A Multidisciplinary Journal, 21(4): 495–508.
Autio, E., Pathak, S., & Wennberg, K. 2013. Consequences of cultural practices for entrepreneurial
behaviors. Journal of International Business Studies, 44(4): 334–362.
Bass, F. M. 1995. Empirical generalizations and marketing science: A personal view. Marketing Science,
14(3): G6–G19.
Berthon, P., Pitt, L. F., & Ewing, M. T. 2001. Corollaries of the collective: The influence of
organizational culture and memory development on perceived decision-making context. Journal
of the Academy of Marketing Science, 29(2): 135–150.
Bettman, J. R., Luce, M. F., & Payne, J. W. 1998. Constructive consumer choice processes. Journal of
Consumer Research, 25(3): 187–217.
Beugelsdijk, S., Kostova, T., & Roth, K. 2017. An overview of Hofstede-inspired country-level culture
research in international business since 2006. Journal of International Business Studies, 48(1):
30–47.
Cameron, K. S., & Quinn, R. E. 2011. Diagnosing and changing organizational culture (3rd ed.). San
Francisco, CA: Jossey-Bass.
Caprar, D. V., Devinney, T. M., Kirkman, B. L., & Caligiuri, P. 2015. Conceptualizing and measuring
culture in international business and management: From challenges to potential solutions. Journal
of International Business Studies, 46(9): 1011–1027.
34
Chang, S.-J., van Witteloostuijn, A., & Eden, L. 2010. From the editors: Common method variance in
international business research. Journal of International Business Studies, 41(2): 178–184.
Curren, M. T., Folkes, V. S., & Steckel, J. H. 1992. Explanations for successful and unsuccessful
marketing decisions: The decision maker’s perspective. Journal of Marketing, 56(2): 18–31.
de Luque, M. S., & Javidan, M. 2004. Uncertainty avoidance. In R. J. House, P. J. Hanges, M. Javidan, P.
W. Dorfman, & V. Gupta (Eds.), Culture, leadership, and organizations: The GLOBE study of 62
cultures: 602–653. Thousand Oaks, CA: Sage Publications.
Deleersnyder, B., Dekimpe, M. G., Steenkamp, J.-B. E. M., & Leeflang, P. S. H. 2009. The role of
national culture in advertising’s sensitivity to business cycles: An investigation across continents.
Journal of Marketing Research, 46(5): 623–636.
DeSarbo, W. S., Ramaswamy, V., & Chatterjee, R. 1995. Analyzing constant-sum multiple criterion data:
A segment-level approach. Journal of Marketing Research, 32(2): 222–232.
Deshpandé, R., Farley, J. U., & Webster, F. E., Jr. 1993. Corporate culture, customer orientation, and
innovativeness in Japanese firms: A quadrad analysis. Journal of Marketing, 57(1): 23–37.
Deshpandé, R., & Webster, F. E., Jr. 1989. Organizational culture and marketing: Defining the research
agenda. Journal of Marketing, 53(1): 3–15.
DiMaggio, P. J., & Powell, W. W. 1983. The iron cage revisited: Institutional isomorphism and collective
rationality in organizational fields. American Sociological Review, 48(2): 147–160.
Eisenhardt, K. M. 1988. Agency- and institutional-theory explanations: The case of retail sales
compensation. Academy of Management Journal, 31(3): 488–511.
Farley, J. U., & Lehmann, D. R. 1994. Cross-national “laws” and differences in market response.
Management Science, 40(1): 111–122.
Farris, P. W., Bendle, N. T., Pfeifer, P. E., & Reibstein, D. J. 2010. Marketing metrics: The definitive
guide to measuring marketing performance (2nd ed.). Upper Saddle River, NJ: Wharton School
Publishing.
35
Flynn, B. B., & Saladin, B. 2006. Relevance of Baldrige constructs in an international context: A study of
national culture. Journal of Operations Management, 24(5): 583–603.
Forbes. 2017. Forbes marketing accountability: A CEO blueprint for driving enterprise value by
maximizing the effectiveness of marketing investments, strategies, and actions. http://cmo-
practice.forbes.com/wp-content/uploads/2017/08/Forbes-Marketing-Accountability-Executive-
Summary-10.2.17.pdf, Forbes CMO Practice.
Fournaise Marketing Group. 2012. 70% of CEOs admit they may be responsible for marketers’ poor
perceived performance. https://www.fournaisegroup.com/ceos-marketers-performance.
Fredrickson, J., & Mitchell, T. 1984. Strategic decision processes: Comprehensiveness and performance
in an industry with an unstable environment. Academy of Management Journal, 27(2): 399–423.
Greene, W. H. 2003. Econometric analysis (5th ed.). Upper Saddle River, N.J: Prentice Hall.
Griffin, D., Guedhami, O., Kwok, C. C. Y., Li, K., & Shao, L. 2017. National culture: The missing
country-level determinant of corporate governance. Journal of International Business Studies,
48(6): 740–762.
Hanssens, D. M. (Ed.). 2015. Empirical generalizations about marketing impact (2nd ed.). Cambridge,
MA: Marketing Science Institute.
Henri, J.-F. 2006. Organizational culture and performance measurement systems. Accounting,
Organizations and Society, 31(1): 77–103.
Hofstede, G. 1994. Management scientists are human. Management Science, 40(1): 4–13.
Hofstede, G. 2001. Culture’s consequences: Comparing values, behaviors, institutions, and organizations
across nations (2nd ed.). Thousand Oaks, CA: Sage Publications.
Hofstede, G., Hofstede, G. J., & Minkov, M. 2010. Cultures and organizations: Software of the mind (3rd
ed.). New York, NY: McGraw-Hill.
Homburg, C., Workman Jr., J. P., & Krohmer, H. 1999. Marketing’s influence within the firm. Journal of
Marketing, 63(2): 1–17.

36
House, R. J., Hanges, P. J., Javidan, M., Dorfman, P. W., & Gupta, V. 2004. Culture, leadership, and
organizations. Thousand Oaks, CA: Sage Publications.
Huang, X., Rode, J. C., & Schroeder, R. G. 2011. Organizational structure and continuous improvement
and learning: Moderating effects of cultural endorsement of participative leadership. Journal of
International Business Studies, 42(9): 1103–1120.
Institute for the Study of Business Markets. 2008, 2010, 2012. B-To-B marketing trends. University Park,
PA: The Institute for the Study of Business Markets.
Javidan, M., House, R. J., Dorfman, P. W., Hanges, P. J., & de Luque, M. S. 2006. Conceptualizing and
measuring cultures and their consequences: A comparative review of GLOBE’s and Hofstede’s
approaches. Journal of International Business Studies, 37(6): 897–914.
Jennrich, R. I. 2006. Rotation to simple loadings using component loss functions: The oblique case.
Psychometrika, 71(1): 173–191.
Kale, P., & Singh, H. 2007. Building firm capabilities through learning: The role of the alliance learning
process in alliance capability and firm-level alliance success. Strategic Management Journal,
28(10): 981–1000.
Kirkman, B. L., Lowe, K. B., & Gibson, C. B. 2006. A quarter century of Culture’s Consequences: a
review of empirical research incorporating Hofstede’s cultural values framework. Journal of
International Business Studies, 37(3): 285–320.
Kirkman, B. L., Lowe, K. B., & Gibson, C. B. 2017. A retrospective on Culture’s Consequences: The 35-
year journey. Journal of International Business Studies, 48(1): 12–29.
Kohli, A. K., & Jaworski, B. J. 1990. Market orientation: The construct, research propositions, and
managerial implications. Journal of Marketing, 54(2): 1–18.
Lalwani, A. K., & Forcum, L. 2016. Does a dollar get you a dollar’s worth of merchandise? The impact of
power distance belief on price–quality judgments. Journal of Consumer Research, 43(2): 317–
333.
37
Lehmann, D. R., & Reibstein, D. J. 2006. Marketing metrics and financial performance. Cambridge, MA:
Marketing Science Institute.
Leung, K., Bhagat, R. S., Buchan, N. R., Erez, M., & Gibson, C. B. 2005. Culture and international
business: recent advances and their implications for future research. Journal of International
Business Studies, 36(4): 357–378.
Lindell, M. K., & Whitney, D. J. 2001. Accounting for common method variance in cross-sectional
research designs. Journal of Applied Psychology, 86(1): 114–121.
Lukovitz, K. 2012, November 15. Survey probes the “CEO-marketer divide.” Media Post: Marketing
Daily. https://www.mediapost.com/publications/article/187276/survey-probes-the-ceo-marketer-
divide.html.
Marketing Science Institute. 1998, 2000, 2002, 2004, 2006, 2008, 2010, 2012, 2014, 2016, 2018.
Research priorities: A guide to MSI research programs and procedures. Cambridge, MA:
Marketing Science Institute.
McGovern, G. J., Court, D., Quelch, J. A., & Crawford, B. 2004. Bringing customers into the boardroom.
Harvard Business Review, 82(11): 70–80.
Menon, A., Bharadwaj, S. G., Adidam, P. T., & Edison, S. W. 1999. Antecedents and consequences of
marketing strategy making: A model and a test. Journal of Marketing, 63(2): 18–40.
Mintz, O., & Currim, I. S. 2013. What drives managerial use of marketing and financial metrics and does
metric use affect performance of marketing-mix activities? Journal of Marketing, 77(2): 17–40.
Moorman, C. 1995. Organizational market information processes: Cultural antecedents and new product
outcomes. Journal of Marketing Research, 32(3): 318–335.
Moorman, C., & Day, G. S. 2016. Organizing for marketing excellence. Journal of Marketing, 80(6): 6–
35.
Morgan, N. A., Anderson, E. W., & Mittal, V. 2005. Understanding firms’ customer satisfaction
information usage. Journal of Marketing, 69(3): 131–151.
38
Morgan, N. A., & Rego, L. L. 2009. Brand portfolio strategy and firm performance. Journal of
Marketing, 73(1): 59–74.
Morgan, N. A., & Vorhies, D. W. 2018. The business performance outcomes of market orientation culture
and behaviors. In R. Varadarajan & S. Jayachandran (Eds.), Innovation and strategy: 255–282.
Emerald Group Publishing.
Moynihan, D. P., & Pandey, S. K. 2010. The big question for performance management: Why do
managers use performance information? Journal of Public Administration Research and Theory,
20(4): 849–866.
Naor, M., Linderman, K., & Schroeder, R. 2010. The globalization of operations in Eastern and Western
countries: Unpacking the relationship between national and organizational culture and its impact
on manufacturing performance. Journal of Operations Management, 28(3): 194–205.
Newman, K. L., & Nollen, S. D. 1996. Culture and congruence: The fit between management practices
and national culture. Journal of International Business Studies, 27(4): 753–779.
Nippa, M., & Reuer, J. J. 2019. On the future of international joint venture research. Journal of
International Business Studies, forthcoming.
O’Sullivan, D., & Abela, A. V. 2007. Marketing performance measurement ability and firm performance.
Journal of Marketing, 71(2): 79–93.
O’Sullivan, D., Abela, A. V., & Hutchinson, M. 2009. Marketing performance measurement and firm
performance: Evidence from the European high-technology sector. European Journal of
Marketing, 43(5/6): 843–862.
Perkins, W. S., & Rao, R. C. 1990. The role of experience in information use and decision making by
marketing managers. Journal of Marketing Research, 27(1): 1–10.
Podsakoff, P. M., MacKenzie, S. B., Lee, J.-Y., & Podsakoff, N. P. 2003. Common method biases in
behavioral research: A critical review of the literature and recommended remedies. Journal of
Applied Psychology, 88(5): 879–904.
39
Roberts, P. W., & Greenwood, R. 1997. Integrating transaction cost and institutional theories: Toward a
constrained-efficiency framework for understanding organizational design adoption. Academy of
Management Review, 22(2): 346–373.
Roth, M. S. 1995. The effects of culture and socioeconomics on the performance of global brand image
strategies. Journal of Marketing Research, 32(2): 163–175.
Rucker, D. D., Hu, M., & Galinsky, A. D. 2014. The experience versus the expectations of power: A
recipe for altering the effects of power on behavior. Journal of Consumer Research, 41(2): 381–
396.
Rust, R. T., Ambler, T., Carpenter, G. S., Kumar, V., & Srivastava, R. K. 2004. Measuring marketing
productivity: Current knowledge and future directions. Journal of Marketing, 68(4): 76–89.
Schuler, R. S., & Rogovsky, N. 1998. Understanding compensation practice variations across firms: The
impact of national culture. Journal of International Business Studies, 29(1): 159–177.
Schulze, C., Skiera, B., & Wiesel, T. 2012. Linking customer and financial metrics to shareholder value:
The leverage effect in customer-based valuation. Journal of Marketing, 76(2): 17–32.
Schwartz, S. H. 1994. Are there universal aspects in the structure and contents of human values? Journal
of Social Issues, 50(4): 19–45.
Shavitt, S., Lalwani, A. K., Zhang, J., & Torelli, C. J. 2006. The horizontal/vertical distinction in cross-
cultural consumer research. Journal of Consumer Psychology, 16(4): 325–342.
Sheth, J. N., & Sisodia, R. S. 2005. A dangerous divergence: Marketing and society. Journal of Public
Policy & Marketing, 24(1): 160–162.
Singh, J. 1995. Measurement issues in cross-national research. Journal of International Business Studies,
26(3): 597–619.
Stahl, G. K., & Tung, R. L. 2015. Towards a more balanced treatment of culture in international business
studies: The need for positive cross-cultural scholarship. Journal of International Business
Studies, 46(4): 391–414.
40
Steenkamp, J. E. M., & Baumgartner, H. 1998. Assessing measurement invariance in cross‐national
consumer research. Journal of Consumer Research, 25(1): 78–107.
Steenkamp, J.-B. E. M., ter Hofstede, F., & Wedel, M. 1999. A cross-national investigation into the
individual and national cultural antecedents of consumer innovativeness. Journal of Marketing,
63(2): 55–69.
Tan, B. C. Y., Wei, K., Watson, R. T., Clapper, D. L., & Mclean, E. R. 1998. Computer-mediated
communication and majority influence: Assessing the impact in an individualistic and a
collectivistic culture. Management Science, 44(9): 1263–1278.
Triandis, H. C. 1989. The self and social behavior in differing cultural contexts. Psychological Review,
96(3): 506–520.
Triandis, H. C. 1996. The psychological measurement of cultural syndromes. American Psychologist,
51(4): 407–415.
Tsui, A. S., Nifadkar, S. S., & Ou, A. Y. 2007. Cross-national, cross-cultural organizational behavior
research: Advances, gaps, and recommendations. Journal of Management, 33(3): 426–478.
Tung, R. L., & Stahl, G. K. 2018. The tortuous evolution of the role of culture in IB research: What we
know, what we don’t know, and where we are headed. Journal of International Business Studies,
49(9): 1167–1189.
Tung, R. L., & Verbeke, A. 2010. Beyond Hofstede and GLOBE: Improving the quality of cross-cultural
research. Journal of International Business Studies, 41(8): 1259–1274.
Tversky, A., & Kahneman, D. 1974. Judgment under uncertainty: Heuristics and biases. Science,
185(4157): 1124–1131.
Verhoef, P. C., & Leeflang, P. S. H. 2009. Understanding the marketing department’s influence within
the firm. Journal of Marketing, 73(2): 14–37.
Verhoef, P. C., Leeflang, P. S. H., Reiner, J., Natter, M., Baker, W., Grinstein, A., et al. 2011. A cross-
national investigation into the marketing department’s influence within the firm: Toward initial
empirical generalizations. Journal of International Marketing, 19(3): 59–86.
41
Vora, D., Martin, L., Fitzsimmons, S. R., Pekerti, A. A., Lakshman, C., & Raheem, S. 2018.
Multiculturalism within individuals: A review, critique, and agenda for future research. Journal
of International Business Studies.
Wernerfelt, B. 1984. A resource-based view of the firm. Strategic Management Journal, 5(2): 171–180.
White, J. C., Varadarajan, P. R., & Dacin, P. A. 2003. Market situation interpretation and response: The
role of cognitive style, organizational culture, and information use. Journal of Marketing, 67(3):
63–79.
Whitler, K. A., Krause, R., & Lehmann, D. R. 2018. When and how board members with marketing
experience facilitate firm growth. Journal of Marketing, 82(5): 86–105.
Wirtz, J., G. Kuppelwieser, V., & Tuzovic, S. 2014. The role of marketing in today’s enterprises. Journal
of Service Management, 25(2): 171–194.
Yarbrough, L., Morgan, N. A., & Vorhies, D. W. 2011. The impact of product market strategy –
organizational culture fit on business performance. Journal of the Academy of Marketing Science,
39(4): 555–573.
Zaheer, S., & Zaheer, A. 1997. Country effects on information seeking in global electronic networks.
Journal of International Business Studies, 28(1): 77–100.
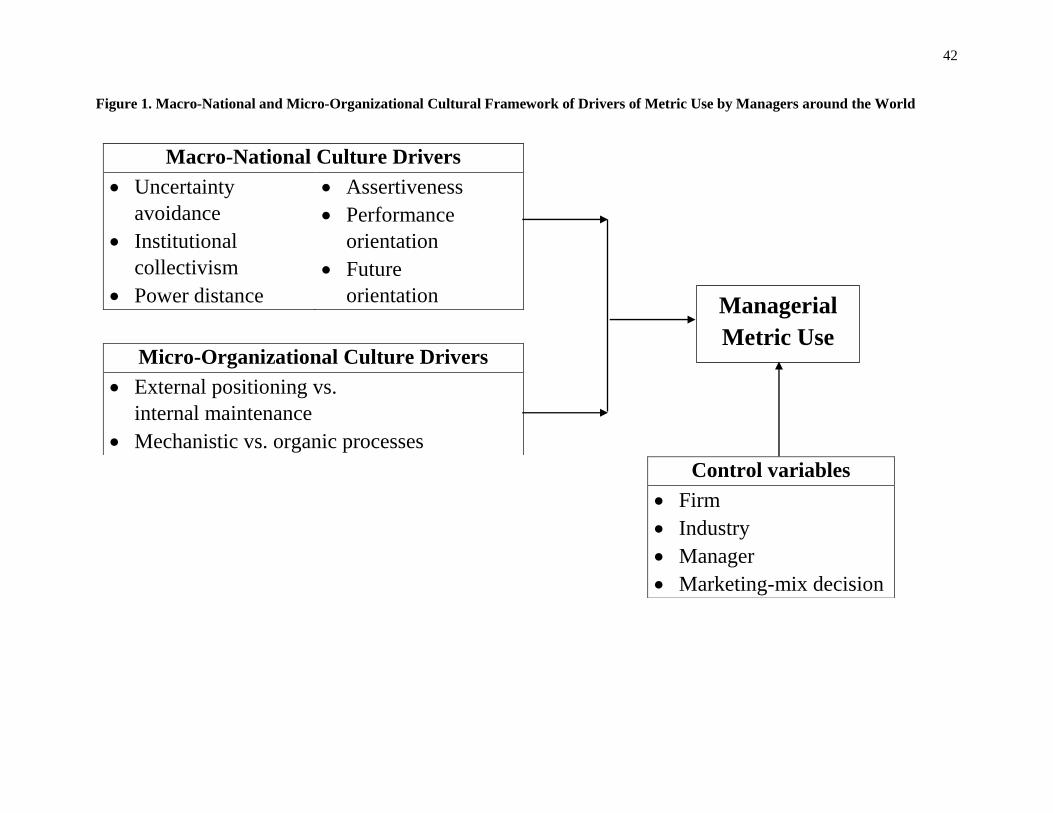
42
Figure 1. Macro-National and Micro-Organizational Cultural Framework of Drivers of Metric Use by Managers around the World
Macro-National Culture Drivers
Uncertainty
avoidance
Institutional
collectivism
Power distance
Assertiveness
Performance
orientation
Future
orientation
Micro-Organizational Culture Drivers
External positioning vs.
internal maintenance
Mechanistic vs. organic processes
Control variables
Firm
Industry
Manager
Marketing-mix decision
Managerial
Metric Use
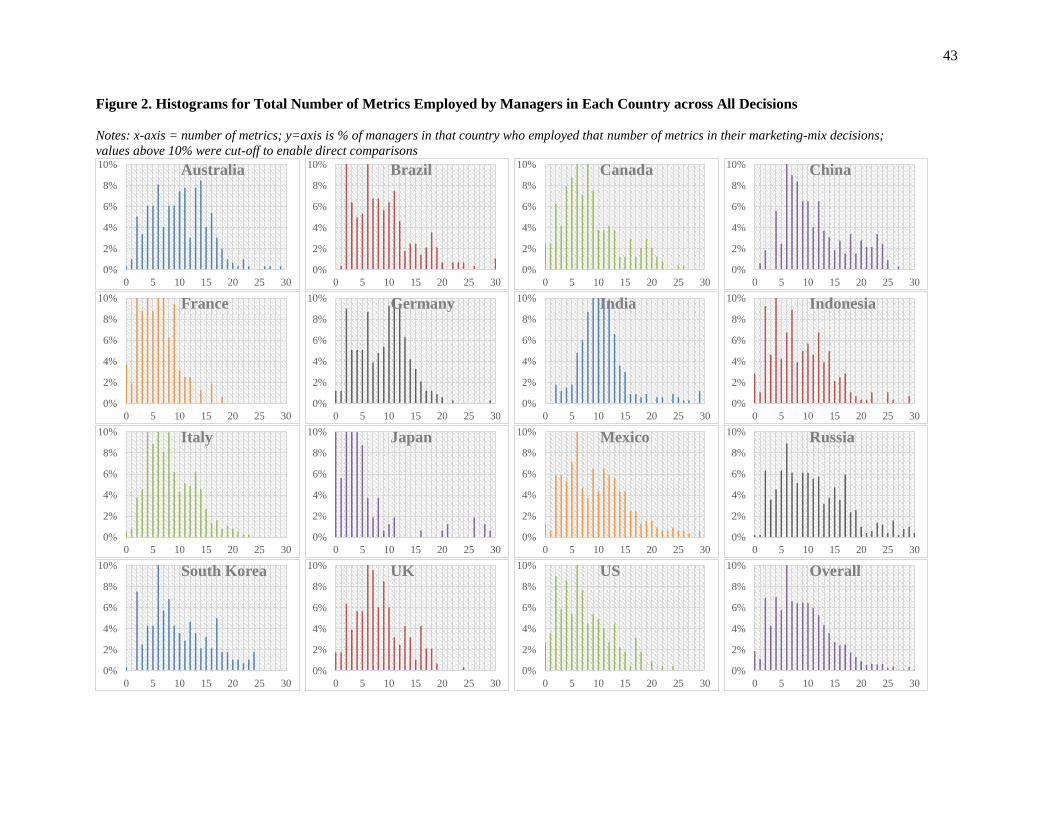
43
Figure 2. Histograms for Total Number of Metrics Employed by Managers in Each Country across All Decisions
Notes: x-axis = number of metrics; y=axis is % of managers in that country who employed that number of metrics in their marketing-mix decisions;
values above 10% were cut-off to enable direct comparisons
0%
2%
4%
6%
8%
10%
0 5 10 15 20 25 30
Australia
0%
2%
4%
6%
8%
10%
0 5 10 15 20 25 30
Brazil
0%
2%
4%
6%
8%
10%
0 5 10 15 20 25 30
Canada
0%
2%
4%
6%
8%
10%
0 5 10 15 20 25 30
China
0%
2%
4%
6%
8%
10%
0 5 10 15 20 25 30
France
0%
2%
4%
6%
8%
10%
0 5 10 15 20 25 30
Germany
0%
2%
4%
6%
8%
10%
0 5 10 15 20 25 30
India
0%
2%
4%
6%
8%
10%
0 5 10 15 20 25 30
Indonesia
0%
2%
4%
6%
8%
10%
0 5 10 15 20 25 30
Italy
0%
2%
4%
6%
8%
10%
0 5 10 15 20 25 30
Japan
0%
2%
4%
6%
8%
10%
0 5 10 15 20 25 30
Mexico
0%
2%
4%
6%
8%
10%
0 5 10 15 20 25 30
Russia
0%
2%
4%
6%
8%
10%
0 5 10 15 20 25 30
South Korea
0%
2%
4%
6%
8%
10%
0 5 10 15 20 25 30
UK
0%
2%
4%
6%
8%
10%
0 5 10 15 20 25 30
US
0%
2%
4%
6%
8%
10%
0 5 10 15 20 25 30
Overall
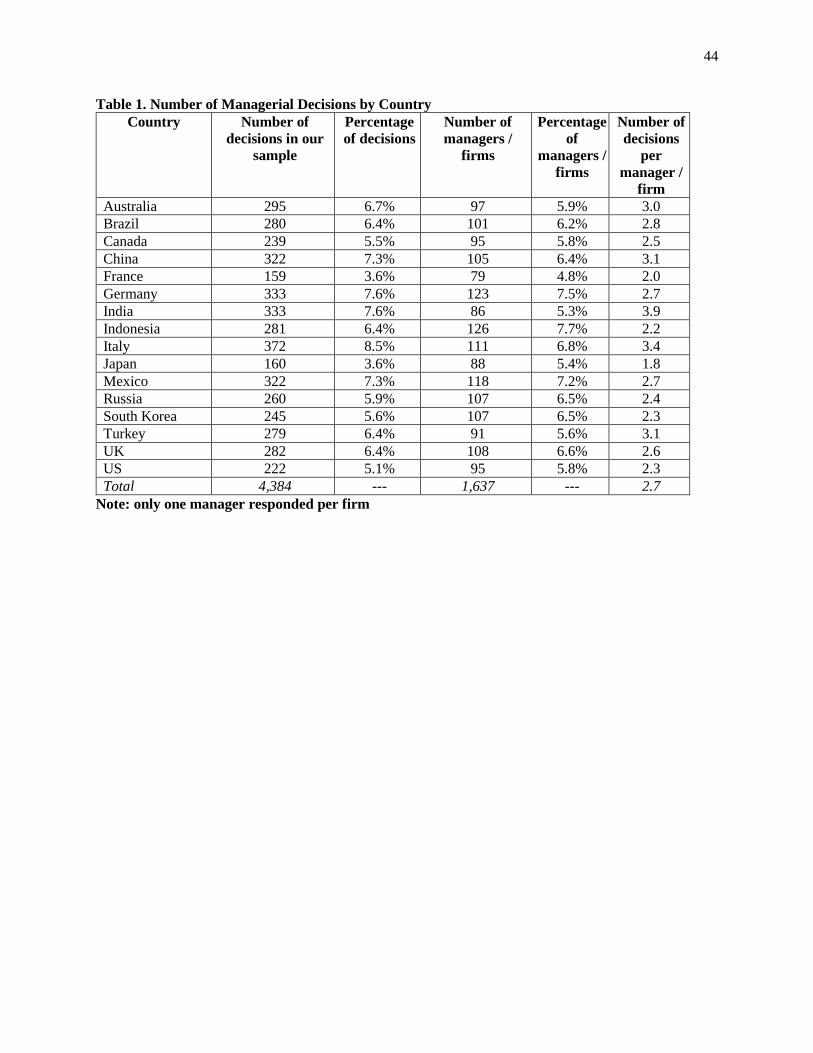
44
Table 1. Number of Managerial Decisions by Country
Country Number of
decisions in our
sample
Percentage
of decisions
Number of
managers /
firms
Percentage
of
managers /
firms
Number of
decisions
per
manager /
firm
Australia 295 6.7% 97 5.9% 3.0
Brazil 280 6.4% 101 6.2% 2.8
Canada 239 5.5% 95 5.8% 2.5
China 322 7.3% 105 6.4% 3.1
France 159 3.6% 79 4.8% 2.0
Germany 333 7.6% 123 7.5% 2.7
India 333 7.6% 86 5.3% 3.9
Indonesia 281 6.4% 126 7.7% 2.2
Italy 372 8.5% 111 6.8% 3.4
Japan 160 3.6% 88 5.4% 1.8
Mexico 322 7.3% 118 7.2% 2.7
Russia 260 5.9% 107 6.5% 2.4
South Korea 245 5.6% 107 6.5% 2.3
Turkey 279 6.4% 91 5.6% 3.1
UK 282 6.4% 108 6.6% 2.6
US 222 5.1% 95 5.8% 2.3
Total 4,384 --- 1,637 --- 2.7
Note: only one manager responded per firm
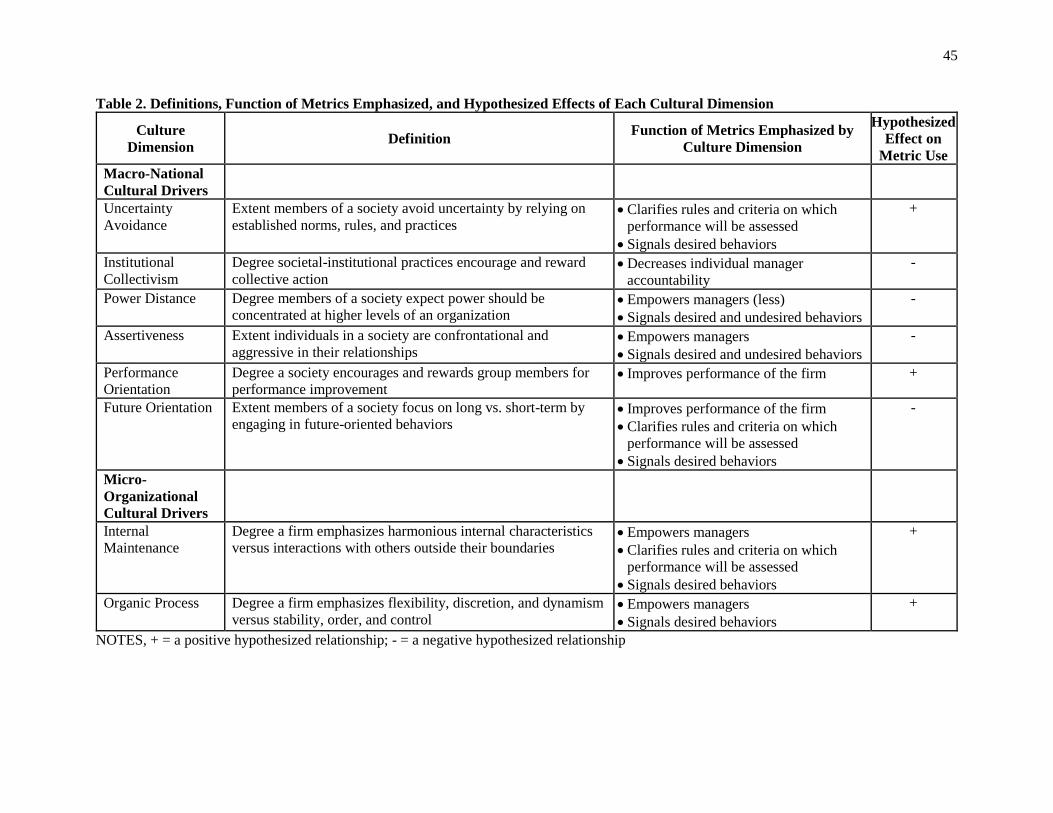
45
Table 2. Definitions, Function of Metrics Emphasized, and Hypothesized Effects of Each Cultural Dimension
Culture
Dimension Definition
Function of Metrics Emphasized by
Culture Dimension
Hypothesized
Effect on
Metric Use
Macro-National
Cultural Drivers
Uncertainty
Avoidance
Extent members of a society avoid uncertainty by relying on
established norms, rules, and practices Clarifies rules and criteria on which
performance will be assessed
Signals desired behaviors
+
Institutional
Collectivism
Degree societal-institutional practices encourage and reward
collective action Decreases individual manager
accountability
-
Power Distance Degree members of a society expect power should be
concentrated at higher levels of an organization Empowers managers (less)
Signals desired and undesired behaviors
-
Assertiveness Extent individuals in a society are confrontational and
aggressive in their relationships Empowers managers
Signals desired and undesired behaviors
-
Performance
Orientation
Degree a society encourages and rewards group members for
performance improvement Improves performance of the firm +
Future Orientation Extent members of a society focus on long vs. short-term by
engaging in future-oriented behaviors Improves performance of the firm
Clarifies rules and criteria on which
performance will be assessed
Signals desired behaviors
-
Micro-
Organizational
Cultural Drivers
Internal
Maintenance
Degree a firm emphasizes harmonious internal characteristics
versus interactions with others outside their boundaries Empowers managers
Clarifies rules and criteria on which
performance will be assessed
Signals desired behaviors
+
Organic Process Degree a firm emphasizes flexibility, discretion, and dynamism
versus stability, order, and control Empowers managers
Signals desired behaviors
+
NOTES, + = a positive hypothesized relationship; - = a negative hypothesized relationship
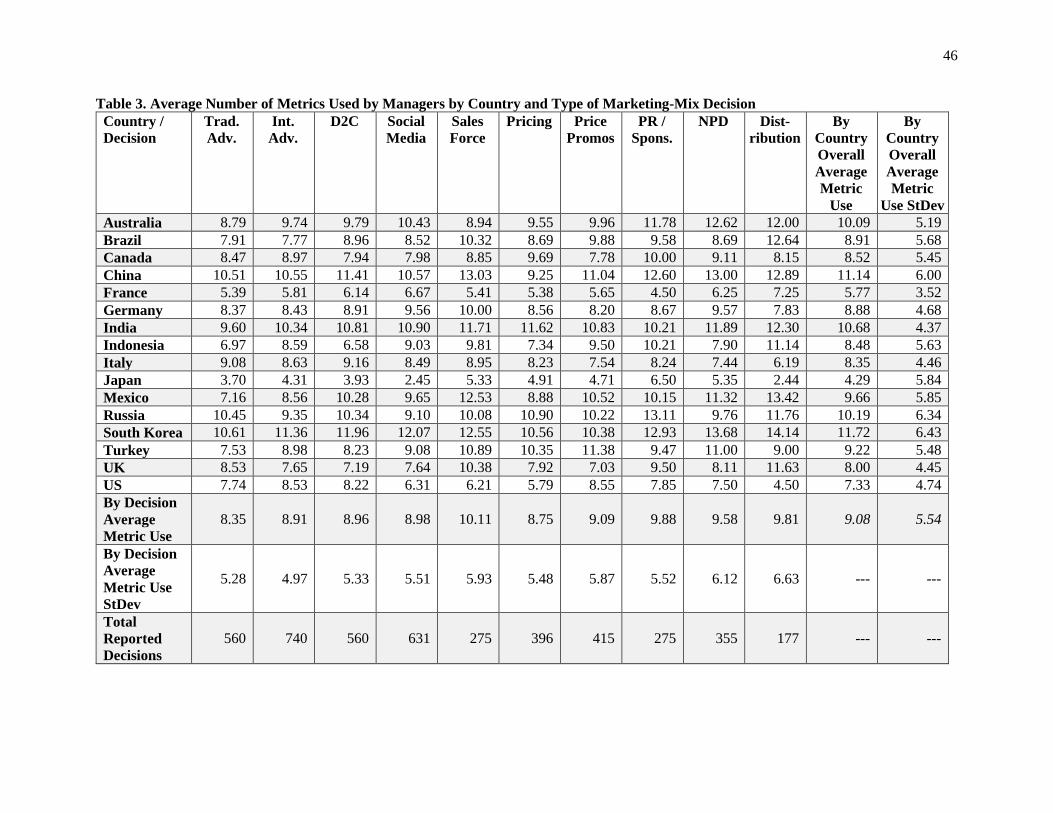
46
Table 3. Average Number of Metrics Used by Managers by Country and Type of Marketing-Mix Decision
Country /
Decision
Trad.
Adv.
Int.
Adv.
D2C Social
Media
Sales
Force
Pricing Price
Promos
PR /
Spons.
NPD Dist-
ribution
By
Country
Overall
Average
Metric
Use
By
Country
Overall
Average
Metric
Use StDev
Australia 8.79 9.74 9.79 10.43 8.94 9.55 9.96 11.78 12.62 12.00 10.09 5.19
Brazil 7.91 7.77 8.96 8.52 10.32 8.69 9.88 9.58 8.69 12.64 8.91 5.68
Canada 8.47 8.97 7.94 7.98 8.85 9.69 7.78 10.00 9.11 8.15 8.52 5.45
China 10.51 10.55 11.41 10.57 13.03 9.25 11.04 12.60 13.00 12.89 11.14 6.00
France 5.39 5.81 6.14 6.67 5.41 5.38 5.65 4.50 6.25 7.25 5.77 3.52
Germany 8.37 8.43 8.91 9.56 10.00 8.56 8.20 8.67 9.57 7.83 8.88 4.68
India 9.60 10.34 10.81 10.90 11.71 11.62 10.83 10.21 11.89 12.30 10.68 4.37
Indonesia 6.97 8.59 6.58 9.03 9.81 7.34 9.50 10.21 7.90 11.14 8.48 5.63
Italy 9.08 8.63 9.16 8.49 8.95 8.23 7.54 8.24 7.44 6.19 8.35 4.46
Japan 3.70 4.31 3.93 2.45 5.33 4.91 4.71 6.50 5.35 2.44 4.29 5.84
Mexico 7.16 8.56 10.28 9.65 12.53 8.88 10.52 10.15 11.32 13.42 9.66 5.85
Russia 10.45 9.35 10.34 9.10 10.08 10.90 10.22 13.11 9.76 11.76 10.19 6.34
South Korea 10.61 11.36 11.96 12.07 12.55 10.56 10.38 12.93 13.68 14.14 11.72 6.43
Turkey 7.53 8.98 8.23 9.08 10.89 10.35 11.38 9.47 11.00 9.00 9.22 5.48
UK 8.53 7.65 7.19 7.64 10.38 7.92 7.03 9.50 8.11 11.63 8.00 4.45
US 7.74 8.53 8.22 6.31 6.21 5.79 8.55 7.85 7.50 4.50 7.33 4.74
By Decision
Average
Metric Use
8.35 8.91 8.96 8.98 10.11 8.75 9.09 9.88 9.58 9.81 9.08 5.54
By Decision
Average
Metric Use
StDev
5.28 4.97 5.33 5.51 5.93 5.48 5.87 5.52 6.12 6.63 --- ---
Total
Reported
Decisions
560 740 560 631 275 396 415 275 355 177 --- ---
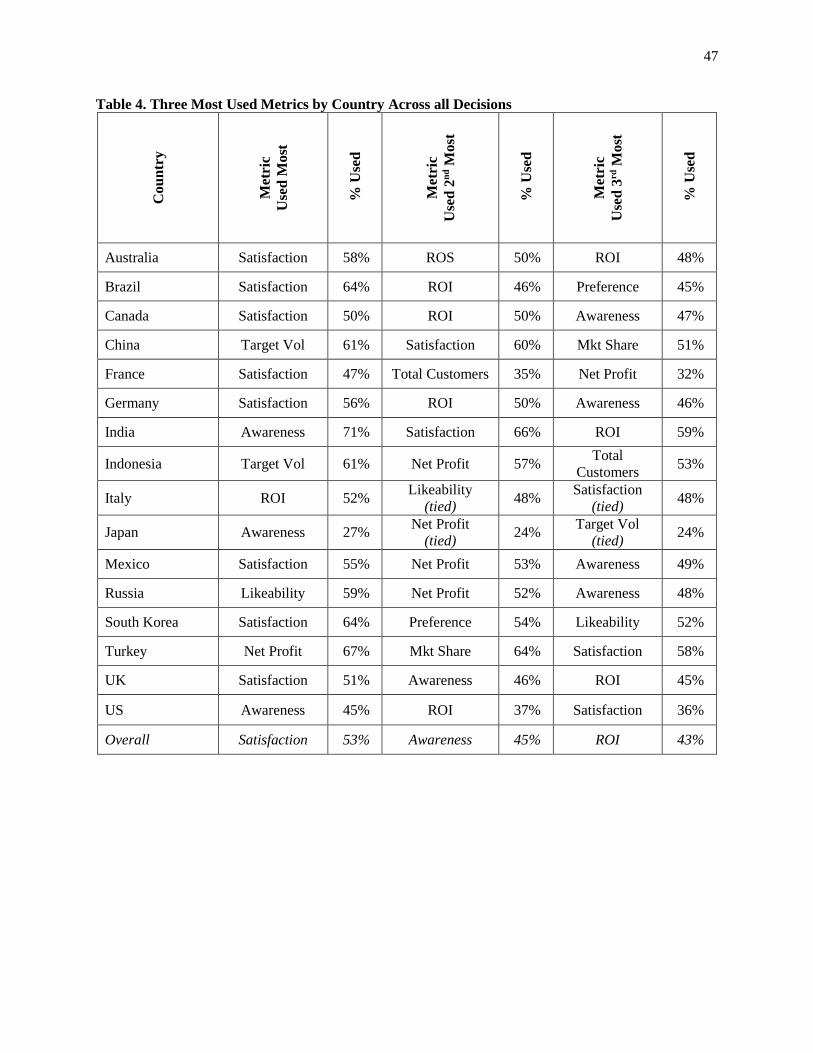
47
Table 4. Three Most Used Metrics by Country Across all Decisions
Co
un
try
Met
ric
Use
d M
ost
% U
sed
Met
ric
Use
d 2
nd M
ost
% U
sed
Met
ric
Use
d 3
rd M
ost
% U
sed
Australia Satisfaction 58% ROS 50% ROI 48%
Brazil Satisfaction 64% ROI 46% Preference 45%
Canada Satisfaction 50% ROI 50% Awareness 47%
China Target Vol 61% Satisfaction 60% Mkt Share 51%
France Satisfaction 47% Total Customers 35% Net Profit 32%
Germany Satisfaction 56% ROI 50% Awareness 46%
India Awareness 71% Satisfaction 66% ROI 59%
Indonesia Target Vol 61% Net Profit 57% Total
Customers 53%
Italy ROI 52% Likeability
(tied) 48%
Satisfaction
(tied) 48%
Japan Awareness 27% Net Profit
(tied) 24%
Target Vol
(tied) 24%
Mexico Satisfaction 55% Net Profit 53% Awareness 49%
Russia Likeability 59% Net Profit 52% Awareness 48%
South Korea Satisfaction 64% Preference 54% Likeability 52%
Turkey Net Profit 67% Mkt Share 64% Satisfaction 58%
UK Satisfaction 51% Awareness 46% ROI 45%
US Awareness 45% ROI 37% Satisfaction 36%
Overall Satisfaction 53% Awareness 45% ROI 43%
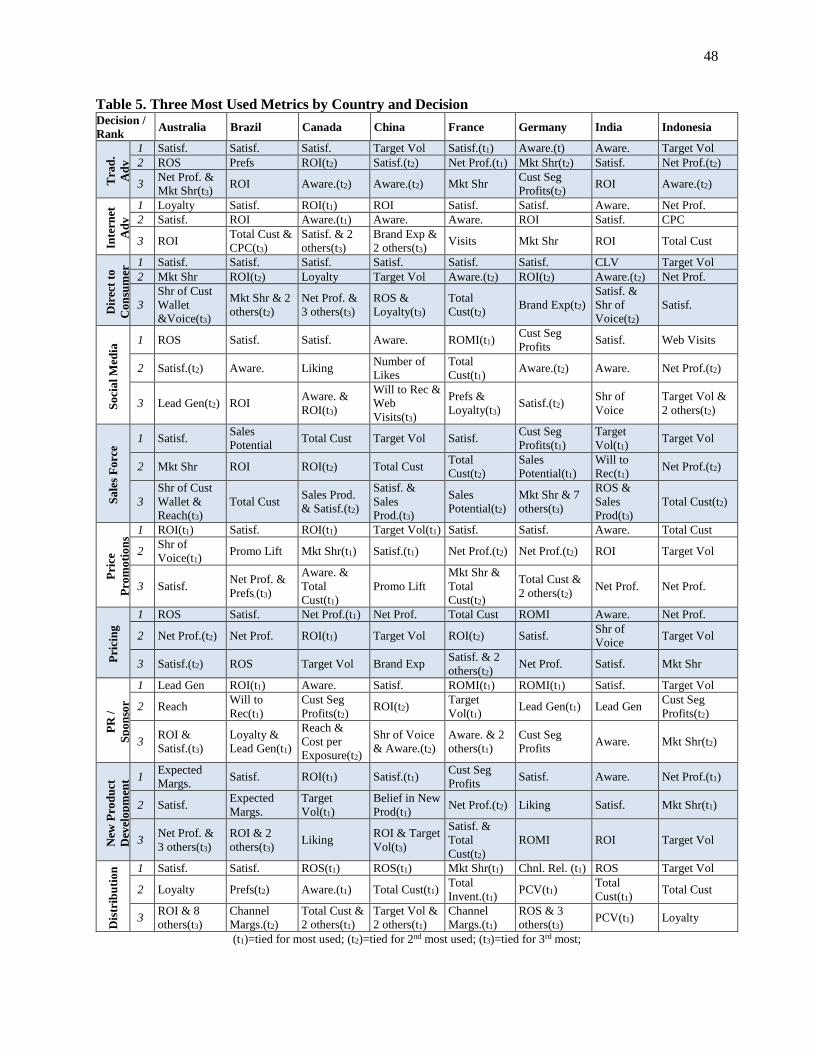
48
Table 5. Three Most Used Metrics by Country and Decision Decision /
Rank Australia Brazil Canada China France Germany India Indonesia
Tra
d.
Ad
v
1 Satisf. Satisf. Satisf. Target Vol Satisf.(t1) Aware.(t) Aware. Target Vol
2 ROS Prefs ROI(t2) Satisf.(t2) Net Prof.(t1) Mkt Shr(t2) Satisf. Net Prof.(t2)
3 Net Prof. &
Mkt Shr(t3) ROI Aware.(t2) Aware.(t2) Mkt Shr
Cust Seg
Profits(t2) ROI Aware.(t2)
Inte
rnet
Ad
v
1 Loyalty Satisf. ROI(t1) ROI Satisf. Satisf. Aware. Net Prof.
2 Satisf. ROI Aware.(t1) Aware. Aware. ROI Satisf. CPC
3 ROI Total Cust &
CPC(t3)
Satisf. & 2
others(t3)
Brand Exp &
2 others(t3) Visits Mkt Shr ROI Total Cust
Dir
ect
to
Co
nsu
mer
1 Satisf. Satisf. Satisf. Satisf. Satisf. Satisf. CLV Target Vol
2 Mkt Shr ROI(t2) Loyalty Target Vol Aware.(t2) ROI(t2) Aware.(t2) Net Prof.
3
Shr of Cust
Wallet
&Voice(t3)
Mkt Shr & 2
others(t2)
Net Prof. &
3 others(t3)
ROS &
Loyalty(t3)
Total
Cust(t2) Brand Exp(t2)
Satisf. &
Shr of
Voice(t2)
Satisf.
So
cia
l M
edia
1 ROS Satisf. Satisf. Aware. ROMI(t1) Cust Seg
Profits Satisf. Web Visits
2 Satisf.(t2) Aware. Liking Number of
Likes
Total
Cust(t1) Aware.(t2) Aware. Net Prof.(t2)
3 Lead Gen(t2) ROI Aware. &
ROI(t3)
Will to Rec &
Web
Visits(t3)
Prefs &
Loyalty(t3) Satisf.(t2)
Shr of
Voice
Target Vol &
2 others(t2)
Sa
les
Fo
rce
1 Satisf. Sales
Potential Total Cust Target Vol Satisf.
Cust Seg
Profits(t1)
Target
Vol(t1) Target Vol
2 Mkt Shr ROI ROI(t2) Total Cust Total
Cust(t2)
Sales
Potential(t1)
Will to
Rec(t1) Net Prof.(t2)
3
Shr of Cust
Wallet &
Reach(t3)
Total Cust Sales Prod.
& Satisf.(t2)
Satisf. &
Sales
Prod.(t3)
Sales
Potential(t2)
Mkt Shr & 7
others(t3)
ROS &
Sales
Prod(t3)
Total Cust(t2)
Pri
ce
Pro
mo
tio
ns
1 ROI(t1) Satisf. ROI(t1) Target Vol(t1) Satisf. Satisf. Aware. Total Cust
2 Shr of
Voice(t1) Promo Lift Mkt Shr(t1) Satisf.(t1) Net Prof.(t2) Net Prof.(t2) ROI Target Vol
3 Satisf. Net Prof. &
Prefs.(t3)
Aware. &
Total
Cust(t1)
Promo Lift
Mkt Shr &
Total
Cust(t2)
Total Cust &
2 others(t2) Net Prof. Net Prof.
Pri
cin
g
1 ROS Satisf. Net Prof.(t1) Net Prof. Total Cust ROMI Aware. Net Prof.
2 Net Prof.(t2) Net Prof. ROI(t1) Target Vol ROI(t2) Satisf. Shr of
Voice Target Vol
3 Satisf.(t2) ROS Target Vol Brand Exp Satisf. & 2
others(t2) Net Prof. Satisf. Mkt Shr
PR
/
Sp
on
sor
1 Lead Gen ROI(t1) Aware. Satisf. ROMI(t1) ROMI(t1) Satisf. Target Vol
2 Reach Will to
Rec(t1)
Cust Seg
Profits(t2) ROI(t2)
Target
Vol(t1) Lead Gen(t1) Lead Gen
Cust Seg
Profits(t2)
3 ROI &
Satisf.(t3)
Loyalty &
Lead Gen(t1)
Reach &
Cost per
Exposure(t2)
Shr of Voice
& Aware.(t2)
Aware. & 2
others(t1)
Cust Seg
Profits Aware. Mkt Shr(t2)
New
Pro
du
ct
Dev
elo
pm
ent 1
Expected
Margs. Satisf. ROI(t1) Satisf.(t1)
Cust Seg
Profits Satisf. Aware. Net Prof.(t1)
2 Satisf. Expected
Margs.
Target
Vol(t1)
Belief in New
Prod(t1) Net Prof.(t2) Liking Satisf. Mkt Shr(t1)
3 Net Prof. &
3 others(t3)
ROI & 2
others(t3) Liking
ROI & Target
Vol(t3)
Satisf. &
Total
Cust(t2)
ROMI ROI Target Vol
Dis
trib
uti
on
1 Satisf. Satisf. ROS(t1) ROS(t1) Mkt Shr(t1) Chnl. Rel. (t1) ROS Target Vol
2 Loyalty Prefs(t2) Aware.(t1) Total Cust(t1) Total
Invent.(t1) PCV(t1)
Total
Cust(t1) Total Cust
3 ROI & 8
others(t3)
Channel
Margs.(t2)
Total Cust &
2 others(t1)
Target Vol &
2 others(t1)
Channel
Margs.(t1)
ROS & 3
others(t3) PCV(t1) Loyalty
(t1)=tied for most used; (t2)=tied for 2nd most used; (t3)=tied for 3rd most;
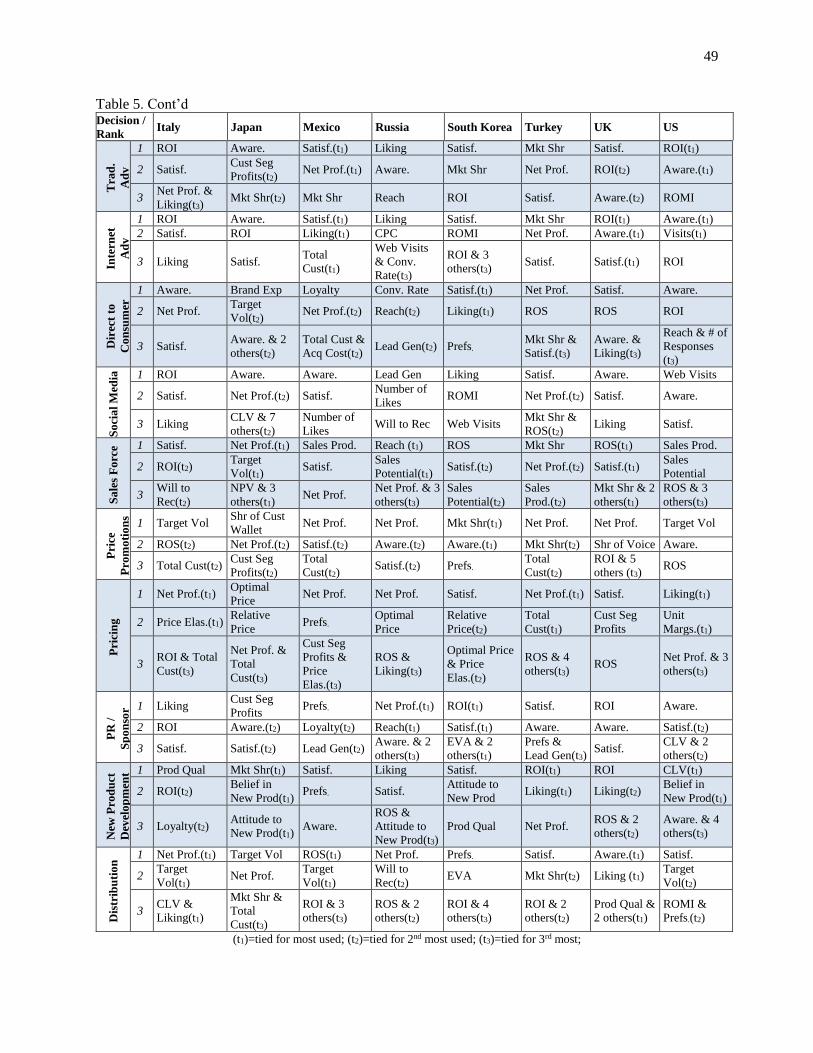
49
Table 5. Cont’d Decision /
Rank Italy Japan Mexico Russia South Korea Turkey UK US
Tra
d.
Ad
v
1 ROI Aware. Satisf.(t1) Liking Satisf. Mkt Shr Satisf. ROI(t1)
2 Satisf. Cust Seg
Profits(t2) Net Prof.(t1) Aware. Mkt Shr Net Prof. ROI(t2) Aware.(t1)
3 Net Prof. &
Liking(t3) Mkt Shr(t2) Mkt Shr Reach ROI Satisf. Aware.(t2) ROMI
Inte
rnet
Ad
v
1 ROI Aware. Satisf.(t1) Liking Satisf. Mkt Shr ROI(t1) Aware.(t1)
2 Satisf. ROI Liking(t1) CPC ROMI Net Prof. Aware.(t1) Visits(t1)
3 Liking Satisf. Total
Cust(t1)
Web Visits
& Conv.
Rate(t3)
ROI & 3
others(t3) Satisf. Satisf.(t1) ROI
Dir
ect
to
Co
nsu
mer
1 Aware. Brand Exp Loyalty Conv. Rate Satisf.(t1) Net Prof. Satisf. Aware.
2 Net Prof. Target
Vol(t2) Net Prof.(t2) Reach(t2) Liking(t1) ROS ROS ROI
3 Satisf. Aware. & 2
others(t2)
Total Cust &
Acq Cost(t2) Lead Gen(t2) Prefs.
Mkt Shr &
Satisf.(t3)
Aware. &
Liking(t3)
Reach & # of
Responses
(t3)
So
cia
l M
edia
1 ROI Aware. Aware. Lead Gen Liking Satisf. Aware. Web Visits
2 Satisf. Net Prof.(t2) Satisf. Number of
Likes ROMI Net Prof.(t2) Satisf. Aware.
3 Liking CLV & 7
others(t2)
Number of
Likes Will to Rec Web Visits
Mkt Shr &
ROS(t2) Liking Satisf.
Sa
les
Fo
rce 1 Satisf. Net Prof.(t1) Sales Prod. Reach (t1) ROS Mkt Shr ROS(t1) Sales Prod.
2 ROI(t2) Target
Vol(t1) Satisf.
Sales
Potential(t1) Satisf.(t2) Net Prof.(t2) Satisf.(t1)
Sales
Potential
3 Will to
Rec(t2)
NPV & 3
others(t1) Net Prof.
Net Prof. & 3
others(t3)
Sales
Potential(t2)
Sales
Prod.(t2)
Mkt Shr & 2
others(t1)
ROS & 3
others(t3)
Pri
ce
Pro
mo
tio
ns
1 Target Vol Shr of Cust
Wallet Net Prof. Net Prof. Mkt Shr(t1) Net Prof. Net Prof. Target Vol
2 ROS(t2) Net Prof.(t2) Satisf.(t2) Aware.(t2) Aware.(t1) Mkt Shr(t2) Shr of Voice Aware.
3 Total Cust(t2) Cust Seg
Profits(t2)
Total
Cust(t2) Satisf.(t2) Prefs.
Total
Cust(t2)
ROI & 5
others (t3) ROS
Pri
cin
g
1 Net Prof.(t1) Optimal
Price Net Prof. Net Prof. Satisf. Net Prof.(t1) Satisf. Liking(t1)
2 Price Elas.(t1) Relative
Price Prefs.
Optimal
Price
Relative
Price(t2)
Total
Cust(t1)
Cust Seg
Profits
Unit
Margs.(t1)
3 ROI & Total
Cust(t3)
Net Prof. &
Total
Cust(t3)
Cust Seg
Profits &
Price
Elas.(t3)
ROS &
Liking(t3)
Optimal Price
& Price
Elas.(t2)
ROS & 4
others(t3) ROS
Net Prof. & 3
others(t3)
PR
/
Sp
on
sor 1 Liking
Cust Seg
Profits Prefs. Net Prof.(t1) ROI(t1) Satisf. ROI Aware.
2 ROI Aware.(t2) Loyalty(t2) Reach(t1) Satisf.(t1) Aware. Aware. Satisf.(t2)
3 Satisf. Satisf.(t2) Lead Gen(t2) Aware. & 2
others(t3)
EVA & 2
others(t1)
Prefs &
Lead Gen(t3) Satisf.
CLV & 2
others(t2)
New
Pro
du
ct
Dev
elo
pm
ent 1 Prod Qual Mkt Shr(t1) Satisf. Liking Satisf. ROI(t1) ROI CLV(t1)
2 ROI(t2) Belief in
New Prod(t1) Prefs. Satisf.
Attitude to
New Prod Liking(t1) Liking(t2)
Belief in
New Prod(t1)
3 Loyalty(t2) Attitude to
New Prod(t1) Aware.
ROS &
Attitude to
New Prod(t3)
Prod Qual Net Prof. ROS & 2
others(t2)
Aware. & 4
others(t3)
Dis
trib
uti
on
1 Net Prof.(t1) Target Vol ROS(t1) Net Prof. Prefs. Satisf. Aware.(t1) Satisf.
2 Target
Vol(t1) Net Prof.
Target
Vol(t1)
Will to
Rec(t2) EVA Mkt Shr(t2) Liking (t1)
Target
Vol(t2)
3 CLV &
Liking(t1)
Mkt Shr &
Total
Cust(t3)
ROI & 3
others(t3)
ROS & 2
others(t2)
ROI & 4
others(t3)
ROI & 2
others(t2)
Prod Qual &
2 others(t1)
ROMI &
Prefs.(t2)
(t1)=tied for most used; (t2)=tied for 2nd most used; (t3)=tied for 3rd most;
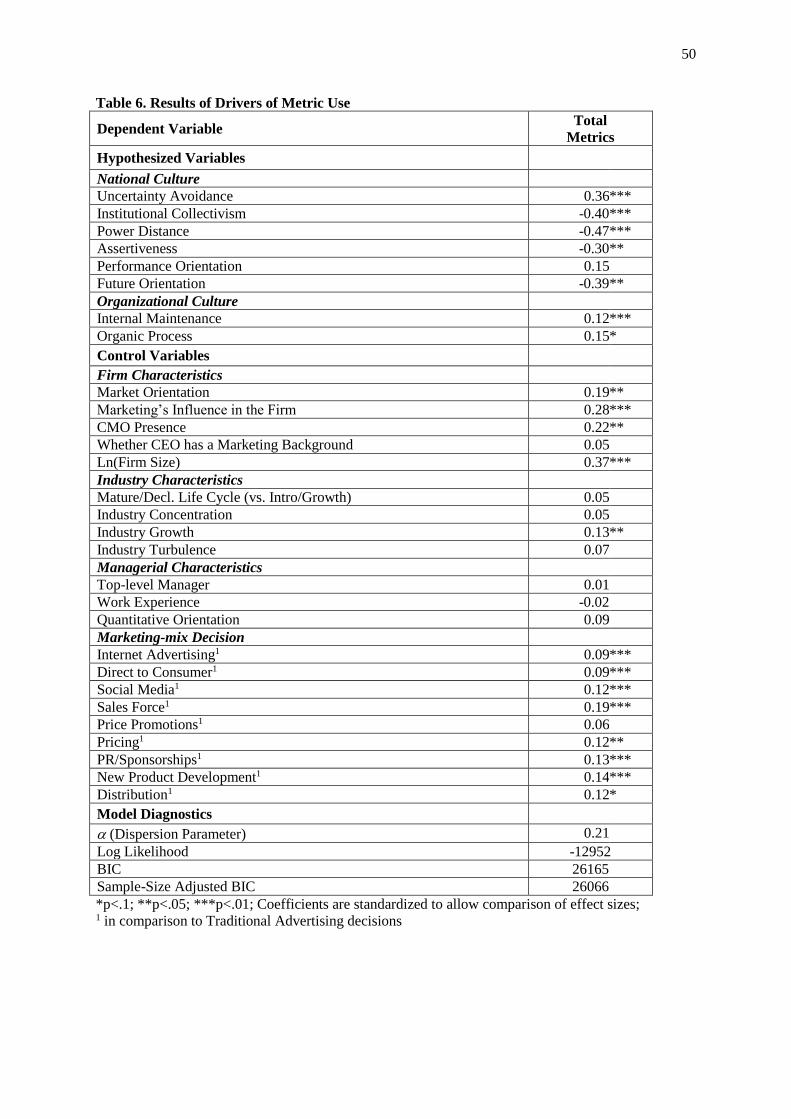
50
Table 6. Results of Drivers of Metric Use
Dependent Variable Total
Metrics
Hypothesized Variables
National Culture
Uncertainty Avoidance 0.36 ***
Institutional Collectivism -0.40 ***
Power Distance -0.47 ***
Assertiveness -0.30 **
Performance Orientation 0.15
Future Orientation -0.39 **
Organizational Culture
Internal Maintenance 0.12 ***
Organic Process 0.15 *
Control Variables
Firm Characteristics
Market Orientation 0.19 **
Marketing’s Influence in the Firm 0.28 ***
CMO Presence 0.22 **
Whether CEO has a Marketing Background 0.05
Ln(Firm Size) 0.37 ***
Industry Characteristics
Mature/Decl. Life Cycle (vs. Intro/Growth) 0.05
Industry Concentration 0.05
Industry Growth 0.13 **
Industry Turbulence 0.07
Managerial Characteristics
Top-level Manager 0.01
Work Experience -0.02
Quantitative Orientation 0.09
Marketing-mix Decision
Internet Advertising1 0.09 ***
Direct to Consumer1 0.09 ***
Social Media1 0.12 ***
Sales Force1 0.19 ***
Price Promotions1 0.06
Pricing1 0.12 **
PR/Sponsorships1 0.13 ***
New Product Development1 0.14 ***
Distribution1 0.12 *
Model Diagnostics
(Dispersion Parameter) 0.21
Log Likelihood -12952
BIC 26165
Sample-Size Adjusted BIC 26066
*p<.1; **p<.05; ***p<.01; Coefficients are standardized to allow comparison of effect sizes; 1 in comparison to Traditional Advertising decisions

51
Table 7. Summary of Proposed and Found Effects of Cultural Drivers of Marketing Metric Use
Variable Expected
sign
Supported
for
Total
Metric Use
Supported
for
Marketing
Metric Use
Supported
for
Financial
Metric Use
Macro-National Cultural Drivers
Uncertainty Avoidance + Yes Yes Yes
Institutional Collectivism - Yes Yes Yes
Power Distance - Yes Yes Yes
Assertiveness - Yes Yes Yes
Performance Orientation + No No No
Future Orientation - Yes Yes Yes
Micro-Organizational Cultural Drivers
Internal Maintenance + Yes Yes Yes
Organic Process + Yes No Yes
NOTES, + = a positive hypothesized relationship; - = a negative hypothesized relationship
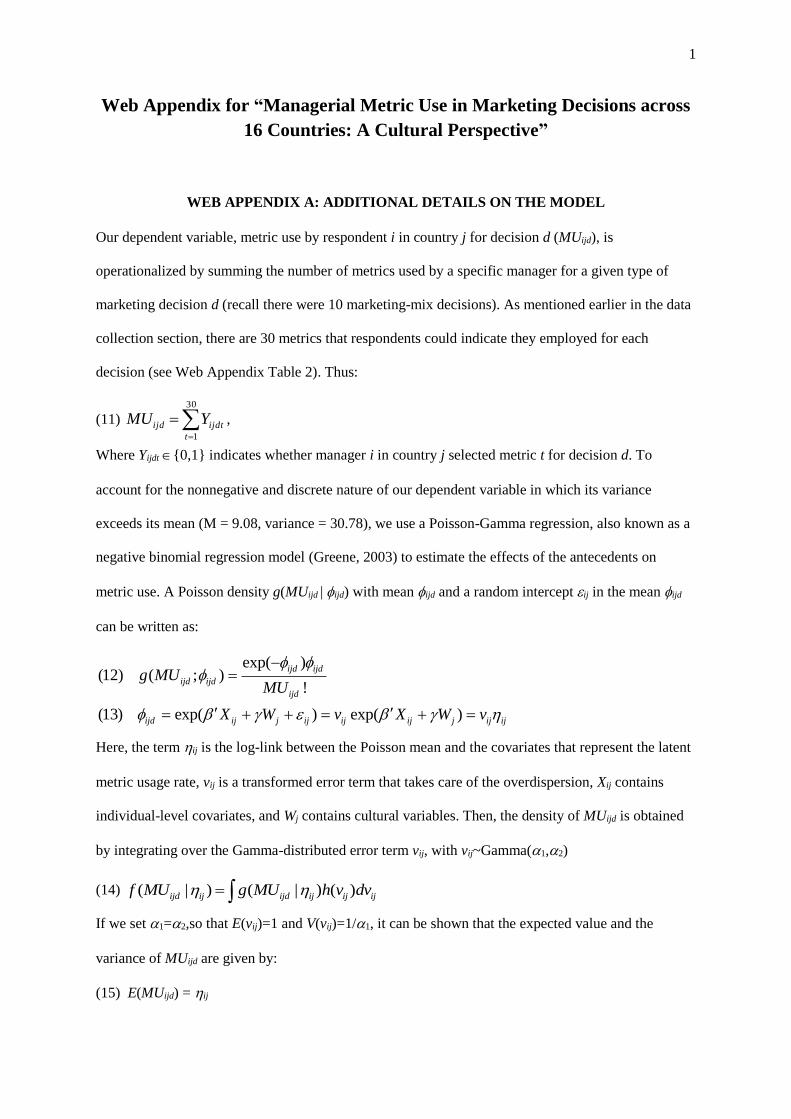
1
Web Appendix for “Managerial Metric Use in Marketing Decisions across
16 Countries: A Cultural Perspective”
WEB APPENDIX A: ADDITIONAL DETAILS ON THE MODEL
Our dependent variable, metric use by respondent i in country j for decision d (MUijd), is
operationalized by summing the number of metrics used by a specific manager for a given type of
marketing decision d (recall there were 10 marketing-mix decisions). As mentioned earlier in the data
collection section, there are 30 metrics that respondents could indicate they employed for each
decision (see Web Appendix Table 2). Thus:
(11)
30
1t
ijdtijd YMU ,
Where Yijdt {0,1} indicates whether manager i in country j selected metric t for decision d. To
account for the nonnegative and discrete nature of our dependent variable in which its variance
exceeds its mean (M = 9.08, variance = 30.78), we use a Poisson-Gamma regression, also known as a
negative binomial regression model (Greene, 2003) to estimate the effects of the antecedents on
metric use. A Poisson density g(MUijd | ijd) with mean ijd and a random intercept ij in the mean ijd
can be written as:
exp( )(12) ( ; )
!
(13) exp( ) exp( )
ijd ijd
ijd ijd
ijd
ijd ij j ij ij ij j ij ij
g MUMU
X W v X W v
Here, the term ij is the log-link between the Poisson mean and the covariates that represent the latent
metric usage rate, vij is a transformed error term that takes care of the overdispersion, Xij contains
individual-level covariates, and Wj contains cultural variables. Then, the density of MUijd is obtained
by integrating over the Gamma-distributed error term vij, with vij~Gamma(1,2)
(14) ( | ) ( | ) ( )ijd ij ijd ij ij ijf MU g MU h v dv
If we set 1=2,so that E(vij)=1 and V(vij)=1/1, it can be shown that the expected value and the
variance of MUijd are given by:
(15) E(MUijd) = ij
2
(16) V(MUijd) = ij + 2
ij / 1
where 1 is the dispersion parameter. Manager i’s latent marketing metrics usage rate ij is then
modeled as a function of our micro and macro cultural antecedents in addition to our control
variables:
(17) ijd = exp(β0 + β1 UAj + β2 InstColj + β3 PDj + β4 Assertj + β5 POj + β6 FOj + β7 IntMainij + β8
Organicij + β9 MarkOrij + β10 MarkInfij + β11 CMOij + β12 CEOij + β13 FirmSizeij + β14
PLCycleij + β15 Mconcij + β16Mgrowthij + β17 Mturbij + β18 ManLevelij +
β19 Experienceij + β20 QuantOrij + ∑ 9𝑘=0 β21+k DecisionTypeijd)
where UA, InstCol, PD, Assert, PO, and FO indicate the national cultural dimensions uncertainty
avoidance, institutional collectivism, power distance, assertiveness, performance orientation, and
future orientation, respectively. IntMain and Organic are the organizational culture dimensions
external positioning (low score) versus internal maintenance (high score) and mechanistic (low score)
versus organic (high score) processes. MarkOr is the market orientation of the firm. MarkInf is
marketing’s influence in the firm, which is the extent to which top management considers marketing
strategically important. CMO indicates CMO presence (=1) or not, CEO is whether the CEO had a
marketing background (=1) or not, and firm size is the log of the firm size. PLCycle indicates whether
the industry in which the firm is operating is in the mature or declining phase (=1) versus the
introductory or growth phase. Mconc is whether the top 4 firms in an industry control more than 50%
of the market (=1) or not. Mgrowth and Mturb denote market growth and turbulence. ManLevel,
Experience, and QuantOr are three individual-level control variables, viz., the rank of the manager in
the organization (CEO/CMO/(S)VP =1), work experience, and quantitative orientation. Finally, we
include 9 dummies to control for the type of marketing-mix decision.
The model is estimated using a robust maximum-likelihood procedure with cluster-robust
standard errors, to incorporate the dependency between observations belonging to the same country.
This approach allows us test for macro-national and micro-organizational cultural effects while
controlling for the country, firm, manager, industry, and decision setting in a converging model
(Beugelsdijk, Kostova, & Roth, 2017; Kirkman, Lowe, & Gibson, 2006). Variance inflation scores are
all below 4. 459 of 465 (99%) pairwise correlation coefficients displayed in Web Appendix Table D
are <.4 and >-.4; five of the six exceptions are a combination of national culture variables. Therefore,

3
we estimated a model which excluded future orientation and assertiveness, and found its results to be
similar to our main model. Hence, estimation is not expected to suffer from multicollinearity (e.g.,
Leeflang et al. 2000).
WEB APPENDIX B: ADDITIONAL ANALYSIS
To provide more nuanced insights regarding the relationships between national culture, organizational
culture, and metric use by managers residing in different countries, we estimate over 60 additional
models. These models are grouped into the following six categories: (i) the relationship between
metric use and marketing-mix performance; (ii) drivers of two types of metrics, marketing and
financial; (iii) interactions between national and organizational culture variables; (iv) potential
moderation based on the type of marketing-mix decision being made by a manager; (v) potential
moderation based on firm size, work experience, and industry growth; and (vi) potential moderation
of the relationship between organizational culture and metric use per individual country.
Relationship between Metric Use and Performance. In our questionnaire, we asked
managers to assess the performance outcomes of the same decision in which they indicated their
metric use, based on the decision’s stated marketing (customer satisfaction, loyalty, market share),
financial (sales, profitability, ROI), and overall outcomes, relative to a firm’s stated objectives and to
similar prior decisions. We employed measures from previous published works (Jaworski & Kohli,
1993; Mintz & Currim, 2013; Moorman & Rust, 1999; Verhoef & Leeflang, 2009 as noted in Web
Appendix Table 3). This enabled us to investigate whether there is variation in the relationship
between metric use for a particular marketing-mix decision and that decision’s performance outcomes
for each of 16 countries. To empirically test this relationship, we first account for the endogeneity of
what causes metric use and the discrete and nonnegative nature of our dependent variable by
estimating our original negative binomial model and obtaining a predicted total metric use for each
observation. Subsequently, for each of 16 countries, we run a two-stage least squares estimation,
where in the first stage total metric use is a function of predicted total metric use for that observation,
an intercept, and an error term, and in the second stage, the marketing-mix decision performance is a
function of the predicted value from the first stage, an intercept, and an error term (Wooldridge,
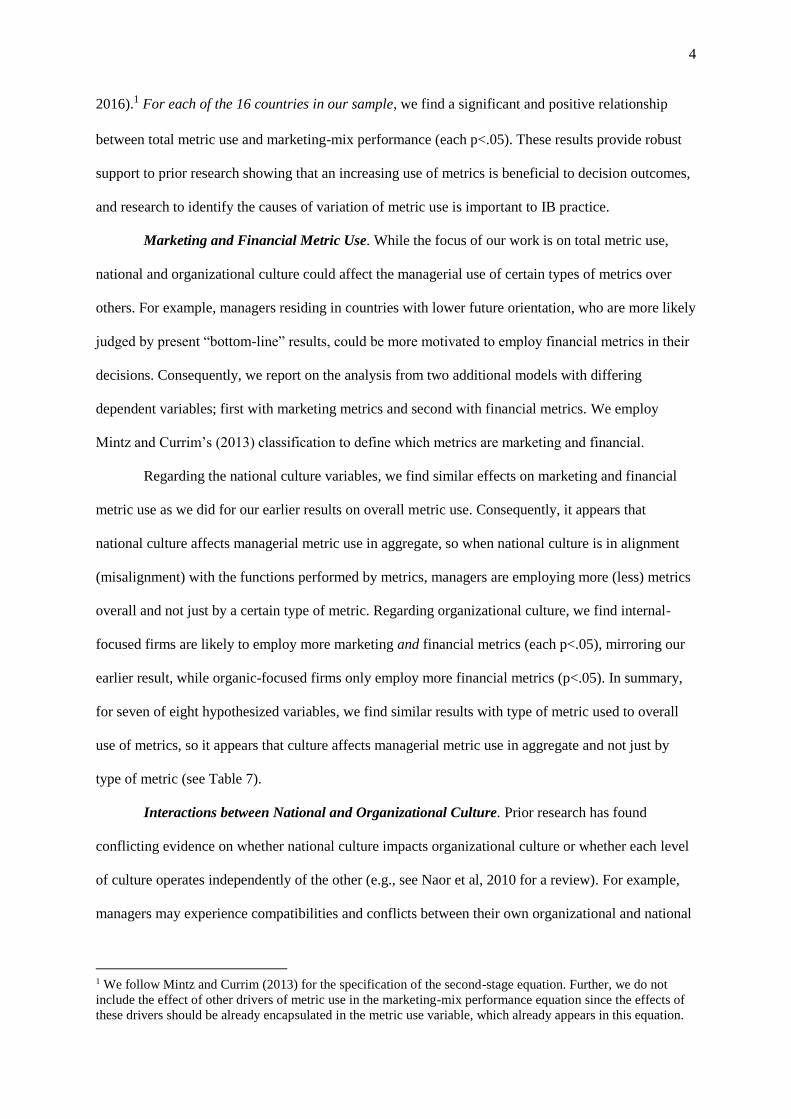
4
2016).1 For each of the 16 countries in our sample, we find a significant and positive relationship
between total metric use and marketing-mix performance (each p<.05). These results provide robust
support to prior research showing that an increasing use of metrics is beneficial to decision outcomes,
and research to identify the causes of variation of metric use is important to IB practice.
Marketing and Financial Metric Use. While the focus of our work is on total metric use,
national and organizational culture could affect the managerial use of certain types of metrics over
others. For example, managers residing in countries with lower future orientation, who are more likely
judged by present “bottom-line” results, could be more motivated to employ financial metrics in their
decisions. Consequently, we report on the analysis from two additional models with differing
dependent variables; first with marketing metrics and second with financial metrics. We employ
Mintz and Currim’s (2013) classification to define which metrics are marketing and financial.
Regarding the national culture variables, we find similar effects on marketing and financial
metric use as we did for our earlier results on overall metric use. Consequently, it appears that
national culture affects managerial metric use in aggregate, so when national culture is in alignment
(misalignment) with the functions performed by metrics, managers are employing more (less) metrics
overall and not just by a certain type of metric. Regarding organizational culture, we find internal-
focused firms are likely to employ more marketing and financial metrics (each p<.05), mirroring our
earlier result, while organic-focused firms only employ more financial metrics (p<.05). In summary,
for seven of eight hypothesized variables, we find similar results with type of metric used to overall
use of metrics, so it appears that culture affects managerial metric use in aggregate and not just by
type of metric (see Table 7).
Interactions between National and Organizational Culture. Prior research has found
conflicting evidence on whether national culture impacts organizational culture or whether each level
of culture operates independently of the other (e.g., see Naor et al, 2010 for a review). For example,
managers may experience compatibilities and conflicts between their own organizational and national
1 We follow Mintz and Currim (2013) for the specification of the second-stage equation. Further, we do not
include the effect of other drivers of metric use in the marketing-mix performance equation since the effects of
these drivers should be already encapsulated in the metric use variable, which already appears in this equation.
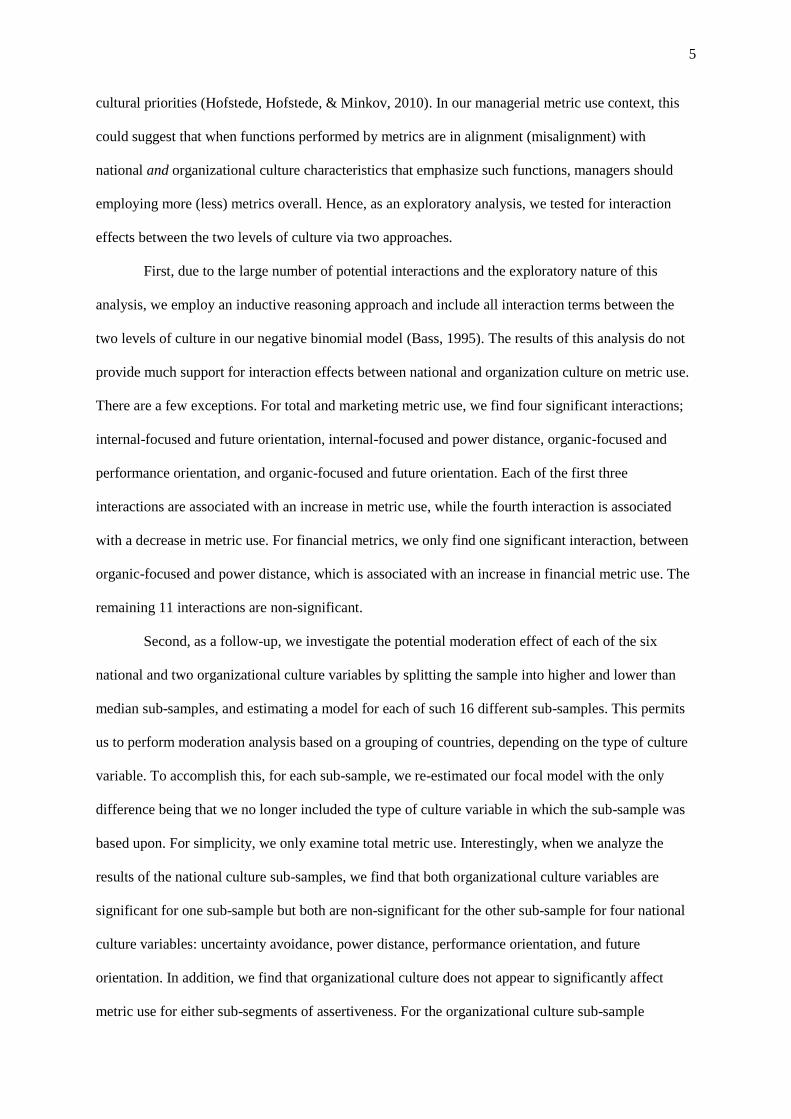
5
cultural priorities (Hofstede, Hofstede, & Minkov, 2010). In our managerial metric use context, this
could suggest that when functions performed by metrics are in alignment (misalignment) with
national and organizational culture characteristics that emphasize such functions, managers should
employing more (less) metrics overall. Hence, as an exploratory analysis, we tested for interaction
effects between the two levels of culture via two approaches.
First, due to the large number of potential interactions and the exploratory nature of this
analysis, we employ an inductive reasoning approach and include all interaction terms between the
two levels of culture in our negative binomial model (Bass, 1995). The results of this analysis do not
provide much support for interaction effects between national and organization culture on metric use.
There are a few exceptions. For total and marketing metric use, we find four significant interactions;
internal-focused and future orientation, internal-focused and power distance, organic-focused and
performance orientation, and organic-focused and future orientation. Each of the first three
interactions are associated with an increase in metric use, while the fourth interaction is associated
with a decrease in metric use. For financial metrics, we only find one significant interaction, between
organic-focused and power distance, which is associated with an increase in financial metric use. The
remaining 11 interactions are non-significant.
Second, as a follow-up, we investigate the potential moderation effect of each of the six
national and two organizational culture variables by splitting the sample into higher and lower than
median sub-samples, and estimating a model for each of such 16 different sub-samples. This permits
us to perform moderation analysis based on a grouping of countries, depending on the type of culture
variable. To accomplish this, for each sub-sample, we re-estimated our focal model with the only
difference being that we no longer included the type of culture variable in which the sub-sample was
based upon. For simplicity, we only examine total metric use. Interestingly, when we analyze the
results of the national culture sub-samples, we find that both organizational culture variables are
significant for one sub-sample but both are non-significant for the other sub-sample for four national
culture variables: uncertainty avoidance, power distance, performance orientation, and future
orientation. In addition, we find that organizational culture does not appear to significantly affect
metric use for either sub-segments of assertiveness. For the organizational culture sub-sample
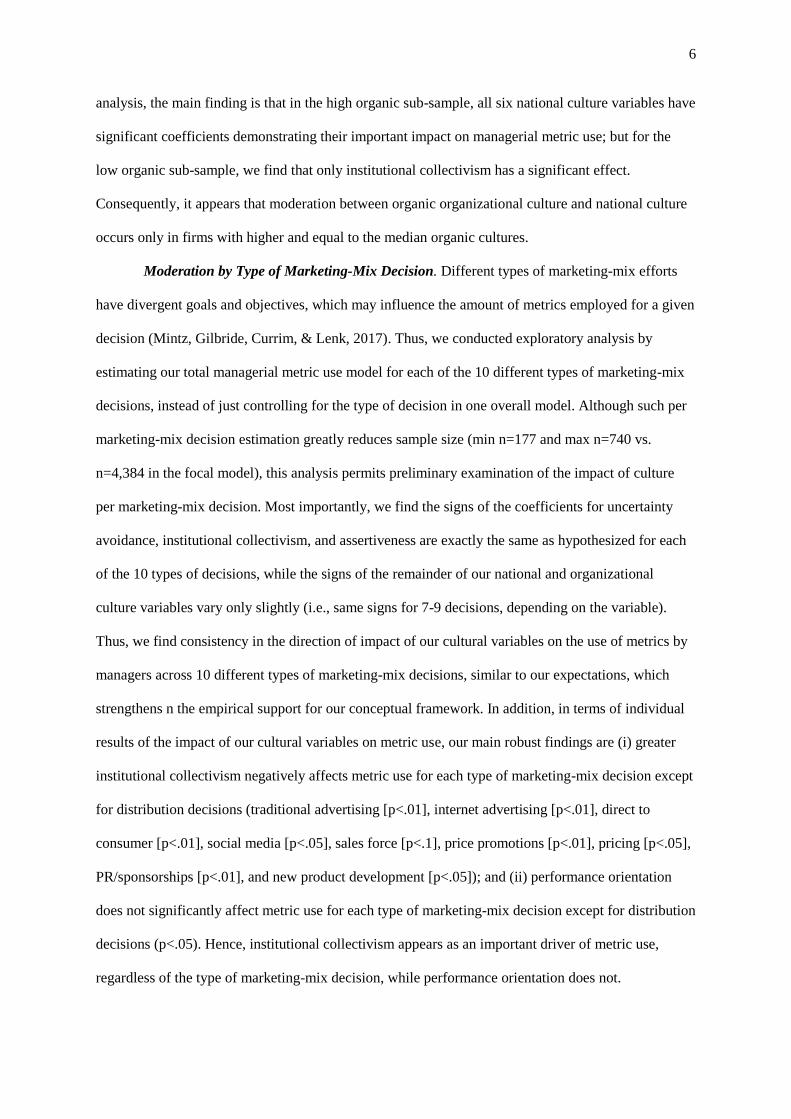
6
analysis, the main finding is that in the high organic sub-sample, all six national culture variables have
significant coefficients demonstrating their important impact on managerial metric use; but for the
low organic sub-sample, we find that only institutional collectivism has a significant effect.
Consequently, it appears that moderation between organic organizational culture and national culture
occurs only in firms with higher and equal to the median organic cultures.
Moderation by Type of Marketing-Mix Decision. Different types of marketing-mix efforts
have divergent goals and objectives, which may influence the amount of metrics employed for a given
decision (Mintz, Gilbride, Currim, & Lenk, 2017). Thus, we conducted exploratory analysis by
estimating our total managerial metric use model for each of the 10 different types of marketing-mix
decisions, instead of just controlling for the type of decision in one overall model. Although such per
marketing-mix decision estimation greatly reduces sample size (min n=177 and max n=740 vs.
n=4,384 in the focal model), this analysis permits preliminary examination of the impact of culture
per marketing-mix decision. Most importantly, we find the signs of the coefficients for uncertainty
avoidance, institutional collectivism, and assertiveness are exactly the same as hypothesized for each
of the 10 types of decisions, while the signs of the remainder of our national and organizational
culture variables vary only slightly (i.e., same signs for 7-9 decisions, depending on the variable).
Thus, we find consistency in the direction of impact of our cultural variables on the use of metrics by
managers across 10 different types of marketing-mix decisions, similar to our expectations, which
strengthens n the empirical support for our conceptual framework. In addition, in terms of individual
results of the impact of our cultural variables on metric use, our main robust findings are (i) greater
institutional collectivism negatively affects metric use for each type of marketing-mix decision except
for distribution decisions (traditional advertising [p<.01], internet advertising [p<.01], direct to
consumer [p<.01], social media [p<.05], sales force [p<.1], price promotions [p<.01], pricing [p<.05],
PR/sponsorships [p<.01], and new product development [p<.05]); and (ii) performance orientation
does not significantly affect metric use for each type of marketing-mix decision except for distribution
decisions (p<.05). Hence, institutional collectivism appears as an important driver of metric use,
regardless of the type of marketing-mix decision, while performance orientation does not.
7
Further, we identify the types of marketing-mix decisions for which national and
organizational culture matter more or less to managerial use of metrics. We find that (i) both national
and organizational culture impact overall use of metrics for managers making traditional advertising,
direct to consumer, social media, price promotion, and distribution decisions, (ii) national culture
matters but organizational culture does not appear to matter for sales force, pricing, PR/sponsorships,
and new product development decisions, and (iii) neither national or organizational culture appear to
matter for internet advertising decisions. The latter result makes sense, because for internet
advertising decisions, there are a plethora of readily available metrics via services provided from, e.g.,
Google, which should lead to a diminished impact of culture on metric use.
Moderators based on Control Variables. In addition, we examine potential moderation of the
effect of national and organizational culture variables on metric use, based on firm size, work
experience, and industry growth sub-segments (higher versus lower than median). As indicated
earlier, these three moderators are selected based on resource, decision maker, and institutional
theories. For firm size, we find both national and organizational culture variables matter for each sub-
sample, but the main differences between larger and smaller firms are (i) performance orientation has
a significant positive effect on metric use for larger firms but is a non-significant factor for smaller
firms, and (ii) assertiveness and future orientation both have significant negative effects on metric use
for smaller firms but no significant effect for larger firms.2 For work experience and industry growth,
we find that while national culture variables affect metric use by managers in each sub-sample,
organizational culture variables affect metric use in just the high sub-samples.
Analysis by Country. Finally, to assess the impact of organizational culture on metric use in
each country, we re-estimate our focal model without the national culture variables for each of the 16
countries in our sample. Although such re-estimation reduces our sample size per model (min n=160
and max n=372 vs. n=4,384 in focal model), it permits us to conduct a preliminary exploratory
examination of moderation effects by country. We find the signs of the significant coefficients in 12
2 We also estimate an additional model where we only analyze firms in our sample which have <1,000
employees. In this analysis of smaller firms, we find similar effects of national and organizational culture as in
the analysis of <median firm size sub-segment (<498 employees).
8
of the 16 countries are consistent with our proposed expectations. In addition, we find that (i) both
types of organizational culture variables significantly impact managerial metrics use in Australia,
Brazil, Canada, Russia, and the United Kingdom; (ii) neither type of organizational culture impacts
the use of metrics by managers residing in China, France, Germany, Japan, South Korea, and the
USA; and (iii) one type of organizational culture impacts the use of metrics by managers residing in
India, Indonesia, Italy, Mexico, and Turkey. These results indicate there is variation across countries
on what are the specific drivers of overall metric use, which provides evidence for the inclusion of
national culture variables to help explain and account for such variation.
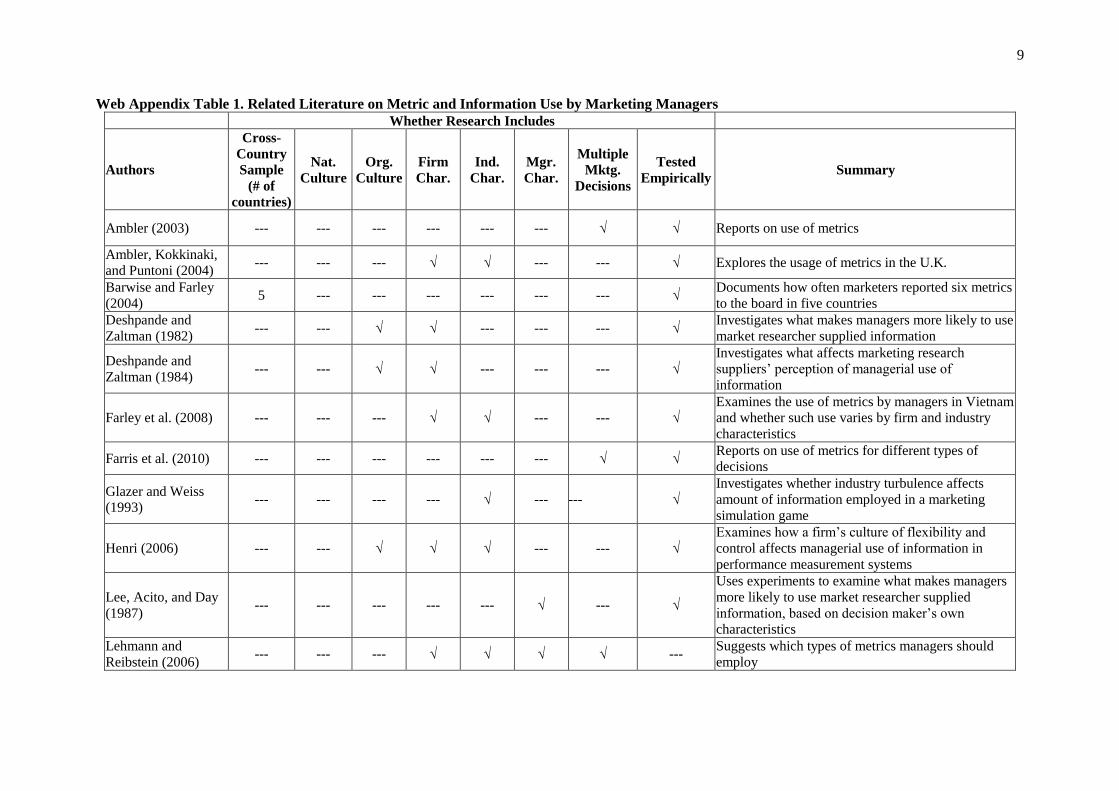
9
Web Appendix Table 1. Related Literature on Metric and Information Use by Marketing Managers
Whether Research Includes
Authors
Cross-
Country
Sample
(# of
countries)
Nat.
Culture
Org.
Culture
Firm
Char.
Ind.
Char.
Mgr.
Char.
Multiple
Mktg.
Decisions
Tested
Empirically Summary
Ambler (2003) --- --- --- --- --- --- √ √ Reports on use of metrics
Ambler, Kokkinaki,
and Puntoni (2004) --- --- --- √ √ --- --- √ Explores the usage of metrics in the U.K.
Barwise and Farley
(2004) 5 --- --- --- --- --- --- √
Documents how often marketers reported six metrics
to the board in five countries
Deshpande and
Zaltman (1982) --- --- √ √ --- --- --- √
Investigates what makes managers more likely to use
market researcher supplied information
Deshpande and
Zaltman (1984) --- --- √ √ --- --- --- √
Investigates what affects marketing research
suppliers’ perception of managerial use of
information
Farley et al. (2008) --- --- --- √ √ --- --- √
Examines the use of metrics by managers in Vietnam
and whether such use varies by firm and industry
characteristics
Farris et al. (2010) --- --- --- --- --- --- √ √ Reports on use of metrics for different types of
decisions
Glazer and Weiss
(1993) --- --- --- --- √ --- --- √
Investigates whether industry turbulence affects
amount of information employed in a marketing
simulation game
Henri (2006) --- --- √ √ √ --- --- √
Examines how a firm’s culture of flexibility and
control affects managerial use of information in
performance measurement systems
Lee, Acito, and Day
(1987) --- --- --- --- --- √ --- √
Uses experiments to examine what makes managers
more likely to use market researcher supplied
information, based on decision maker’s own
characteristics
Lehmann and
Reibstein (2006) --- --- --- √ √ √ √ ---
Suggests which types of metrics managers should
employ
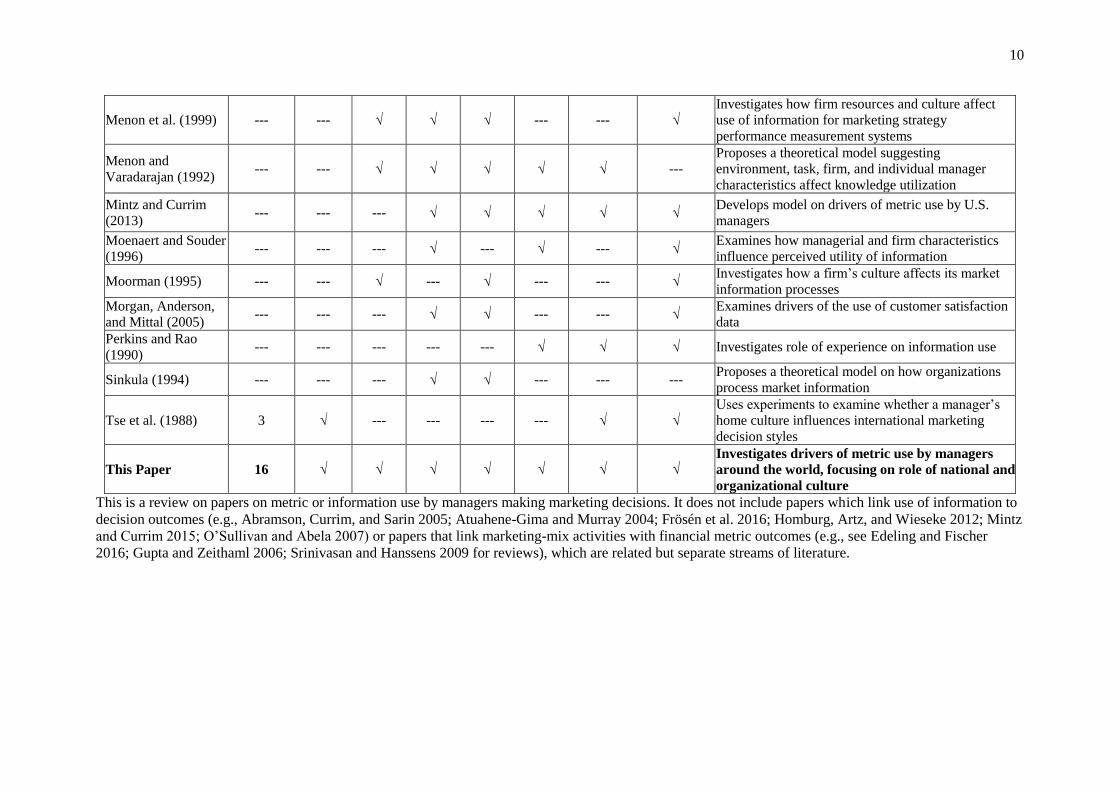
10
Menon et al. (1999) --- --- √ √ √ --- --- √
Investigates how firm resources and culture affect
use of information for marketing strategy
performance measurement systems
Menon and
Varadarajan (1992) --- --- √ √ √ √ √ ---
Proposes a theoretical model suggesting
environment, task, firm, and individual manager
characteristics affect knowledge utilization
Mintz and Currim
(2013) --- --- --- √ √ √ √ √
Develops model on drivers of metric use by U.S.
managers
Moenaert and Souder
(1996) --- --- --- √ --- √ --- √
Examines how managerial and firm characteristics
influence perceived utility of information
Moorman (1995) --- --- √ --- √ --- --- √ Investigates how a firm’s culture affects its market
information processes
Morgan, Anderson,
and Mittal (2005) --- --- --- √ √ --- --- √
Examines drivers of the use of customer satisfaction
data
Perkins and Rao
(1990) --- --- --- --- --- √ √ √ Investigates role of experience on information use
Sinkula (1994) --- --- --- √ √ --- --- --- Proposes a theoretical model on how organizations
process market information
Tse et al. (1988) 3 √ --- --- --- --- √ √
Uses experiments to examine whether a manager’s
home culture influences international marketing
decision styles
This Paper 16 √ √ √ √ √ √ √
Investigates drivers of metric use by managers
around the world, focusing on role of national and
organizational culture
This is a review on papers on metric or information use by managers making marketing decisions. It does not include papers which link use of information to
decision outcomes (e.g., Abramson, Currim, and Sarin 2005; Atuahene-Gima and Murray 2004; Frösén et al. 2016; Homburg, Artz, and Wieseke 2012; Mintz
and Currim 2015; O’Sullivan and Abela 2007) or papers that link marketing-mix activities with financial metric outcomes (e.g., see Edeling and Fischer
2016; Gupta and Zeithaml 2006; Srinivasan and Hanssens 2009 for reviews), which are related but separate streams of literature.
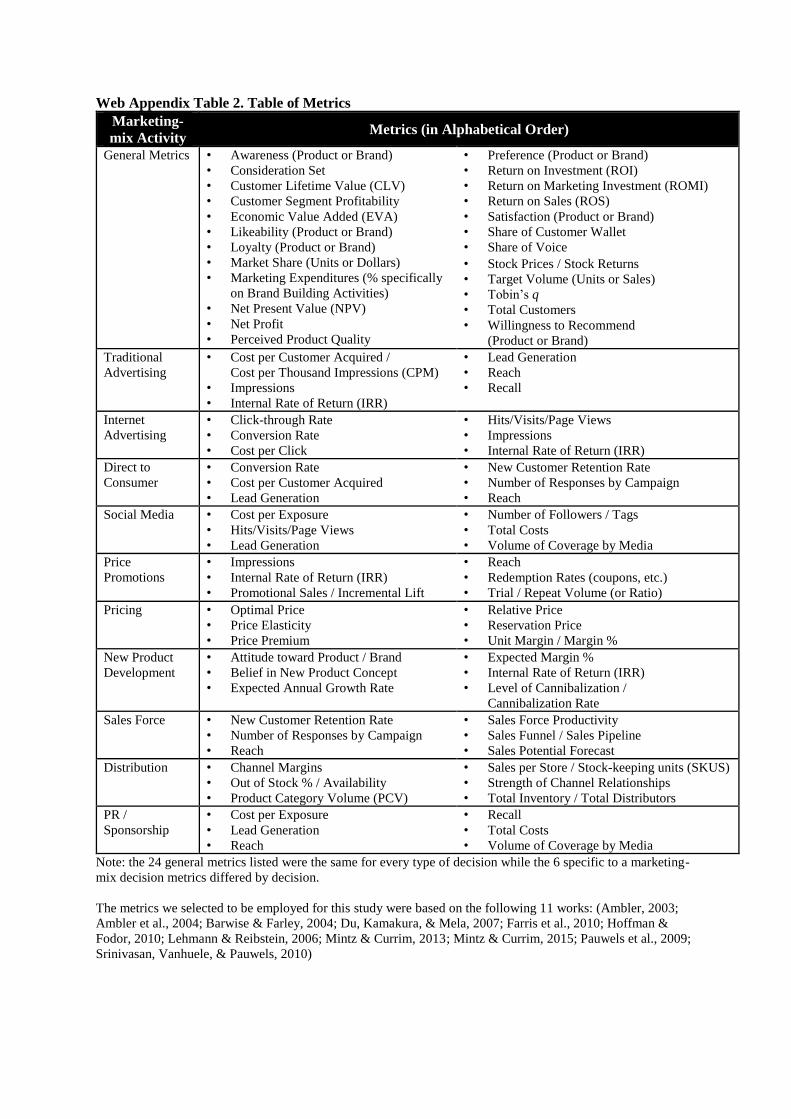
Web Appendix Table 2. Table of Metrics
Marketing-
mix Activity Metrics (in Alphabetical Order)
General Metrics • Awareness (Product or Brand)
• Consideration Set
• Customer Lifetime Value (CLV)
• Customer Segment Profitability
• Economic Value Added (EVA)
• Likeability (Product or Brand)
• Loyalty (Product or Brand)
• Market Share (Units or Dollars)
• Marketing Expenditures (% specifically
on Brand Building Activities)
• Net Present Value (NPV)
• Net Profit
• Perceived Product Quality
• Preference (Product or Brand)
• Return on Investment (ROI)
• Return on Marketing Investment (ROMI)
• Return on Sales (ROS)
• Satisfaction (Product or Brand)
• Share of Customer Wallet
• Share of Voice
• Stock Prices / Stock Returns
• Target Volume (Units or Sales)
• Tobin’s q
• Total Customers
• Willingness to Recommend
(Product or Brand)
Traditional
Advertising
• Cost per Customer Acquired /
Cost per Thousand Impressions (CPM)
• Impressions
• Internal Rate of Return (IRR)
• Lead Generation
• Reach
• Recall
Internet
Advertising
• Click-through Rate
• Conversion Rate
• Cost per Click
• Hits/Visits/Page Views
• Impressions
• Internal Rate of Return (IRR)
Direct to
Consumer
• Conversion Rate
• Cost per Customer Acquired
• Lead Generation
• New Customer Retention Rate
• Number of Responses by Campaign
• Reach
Social Media • Cost per Exposure
• Hits/Visits/Page Views
• Lead Generation
• Number of Followers / Tags
• Total Costs
• Volume of Coverage by Media
Price
Promotions
• Impressions
• Internal Rate of Return (IRR)
• Promotional Sales / Incremental Lift
• Reach
• Redemption Rates (coupons, etc.)
• Trial / Repeat Volume (or Ratio)
Pricing • Optimal Price
• Price Elasticity
• Price Premium
• Relative Price
• Reservation Price
• Unit Margin / Margin %
New Product
Development
• Attitude toward Product / Brand
• Belief in New Product Concept
• Expected Annual Growth Rate
• Expected Margin %
• Internal Rate of Return (IRR)
• Level of Cannibalization /
Cannibalization Rate
Sales Force • New Customer Retention Rate
• Number of Responses by Campaign
• Reach
• Sales Force Productivity
• Sales Funnel / Sales Pipeline
• Sales Potential Forecast
Distribution • Channel Margins
• Out of Stock % / Availability
• Product Category Volume (PCV)
• Sales per Store / Stock-keeping units (SKUS)
• Strength of Channel Relationships
• Total Inventory / Total Distributors
PR /
Sponsorship
• Cost per Exposure
• Lead Generation
• Reach
• Recall
• Total Costs
• Volume of Coverage by Media
Note: the 24 general metrics listed were the same for every type of decision while the 6 specific to a marketing-
mix decision metrics differed by decision.
The metrics we selected to be employed for this study were based on the following 11 works: (Ambler, 2003;
Ambler et al., 2004; Barwise & Farley, 2004; Du, Kamakura, & Mela, 2007; Farris et al., 2010; Hoffman &
Fodor, 2010; Lehmann & Reibstein, 2006; Mintz & Currim, 2013; Mintz & Currim, 2015; Pauwels et al., 2009;
Srinivasan, Vanhuele, & Pauwels, 2010)
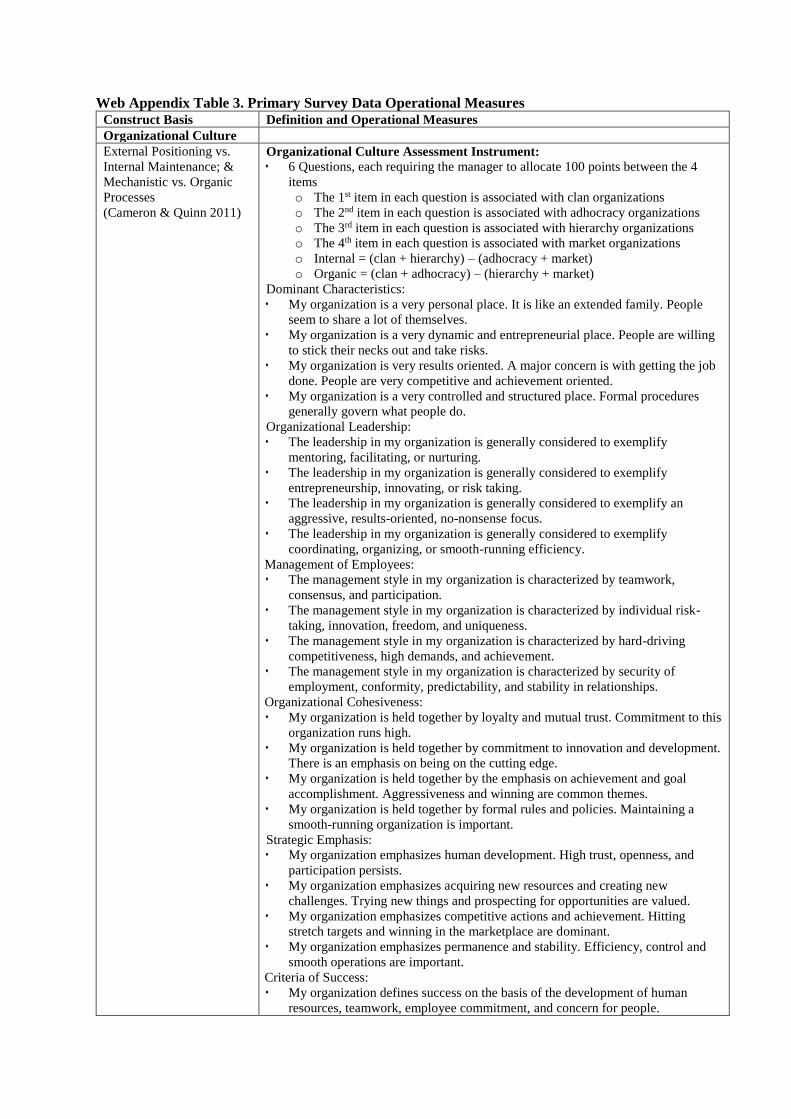
Web Appendix Table 3. Primary Survey Data Operational Measures Construct Basis Definition and Operational Measures
Organizational Culture
External Positioning vs.
Internal Maintenance; &
Mechanistic vs. Organic
Processes
(Cameron & Quinn 2011)
Organizational Culture Assessment Instrument:
6 Questions, each requiring the manager to allocate 100 points between the 4
items
o The 1st item in each question is associated with clan organizations
o The 2nd item in each question is associated with adhocracy organizations
o The 3rd item in each question is associated with hierarchy organizations
o The 4th item in each question is associated with market organizations
o Internal = (clan + hierarchy) – (adhocracy + market)
o Organic = (clan + adhocracy) – (hierarchy + market)
Dominant Characteristics:
My organization is a very personal place. It is like an extended family. People
seem to share a lot of themselves.
My organization is a very dynamic and entrepreneurial place. People are willing
to stick their necks out and take risks.
My organization is very results oriented. A major concern is with getting the job
done. People are very competitive and achievement oriented.
My organization is a very controlled and structured place. Formal procedures
generally govern what people do.
Organizational Leadership:
The leadership in my organization is generally considered to exemplify
mentoring, facilitating, or nurturing.
The leadership in my organization is generally considered to exemplify
entrepreneurship, innovating, or risk taking.
The leadership in my organization is generally considered to exemplify an
aggressive, results-oriented, no-nonsense focus.
The leadership in my organization is generally considered to exemplify
coordinating, organizing, or smooth-running efficiency.
Management of Employees:
The management style in my organization is characterized by teamwork,
consensus, and participation.
The management style in my organization is characterized by individual risk-
taking, innovation, freedom, and uniqueness.
The management style in my organization is characterized by hard-driving
competitiveness, high demands, and achievement.
The management style in my organization is characterized by security of
employment, conformity, predictability, and stability in relationships.
Organizational Cohesiveness:
My organization is held together by loyalty and mutual trust. Commitment to this
organization runs high.
My organization is held together by commitment to innovation and development.
There is an emphasis on being on the cutting edge.
My organization is held together by the emphasis on achievement and goal
accomplishment. Aggressiveness and winning are common themes.
My organization is held together by formal rules and policies. Maintaining a
smooth-running organization is important.
Strategic Emphasis:
My organization emphasizes human development. High trust, openness, and
participation persists.
My organization emphasizes acquiring new resources and creating new
challenges. Trying new things and prospecting for opportunities are valued.
My organization emphasizes competitive actions and achievement. Hitting
stretch targets and winning in the marketplace are dominant.
My organization emphasizes permanence and stability. Efficiency, control and
smooth operations are important.
Criteria of Success:
My organization defines success on the basis of the development of human
resources, teamwork, employee commitment, and concern for people.
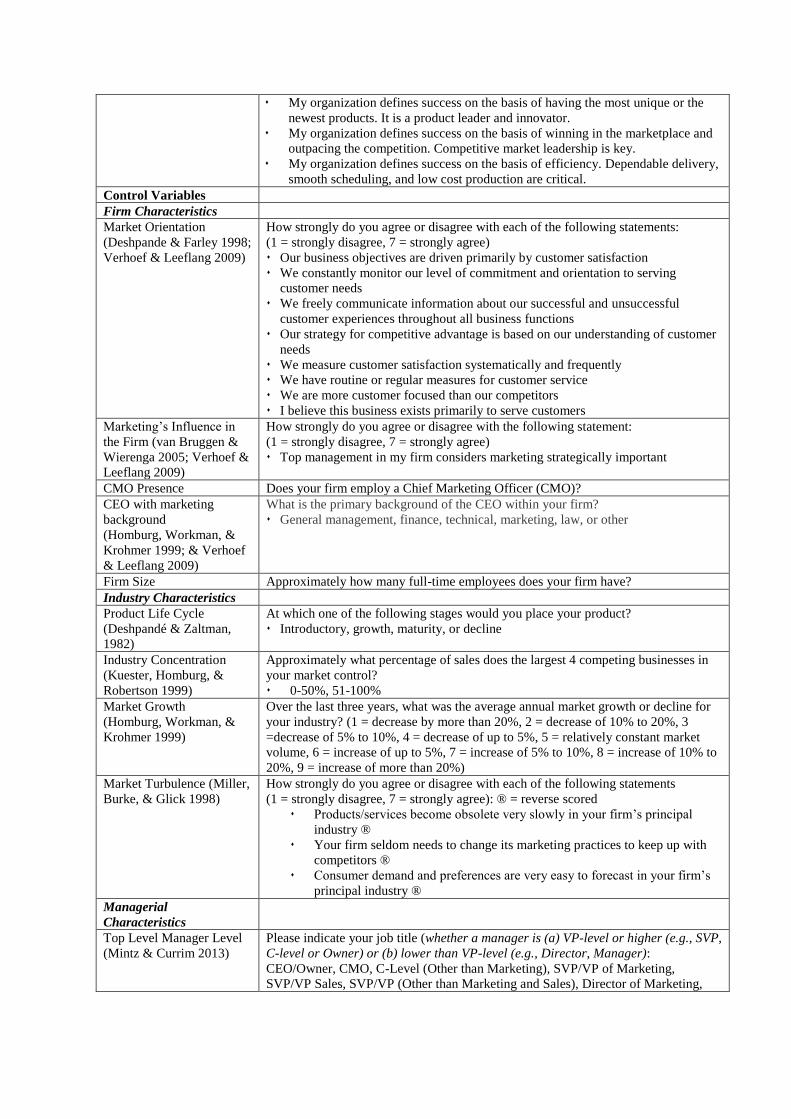
My organization defines success on the basis of having the most unique or the
newest products. It is a product leader and innovator.
My organization defines success on the basis of winning in the marketplace and
outpacing the competition. Competitive market leadership is key.
My organization defines success on the basis of efficiency. Dependable delivery,
smooth scheduling, and low cost production are critical.
Control Variables
Firm Characteristics
Market Orientation
(Deshpande & Farley 1998;
Verhoef & Leeflang 2009)
How strongly do you agree or disagree with each of the following statements:
(1 = strongly disagree, 7 = strongly agree)
Our business objectives are driven primarily by customer satisfaction
We constantly monitor our level of commitment and orientation to serving
customer needs
We freely communicate information about our successful and unsuccessful
customer experiences throughout all business functions
Our strategy for competitive advantage is based on our understanding of customer
needs
We measure customer satisfaction systematically and frequently
We have routine or regular measures for customer service
We are more customer focused than our competitors
I believe this business exists primarily to serve customers
Marketing’s Influence in
the Firm (van Bruggen &
Wierenga 2005; Verhoef &
Leeflang 2009)
How strongly do you agree or disagree with the following statement:
(1 = strongly disagree, 7 = strongly agree)
Top management in my firm considers marketing strategically important
CMO Presence Does your firm employ a Chief Marketing Officer (CMO)?
CEO with marketing
background
(Homburg, Workman, &
Krohmer 1999; & Verhoef
& Leeflang 2009)
What is the primary background of the CEO within your firm?
General management, finance, technical, marketing, law, or other
Firm Size Approximately how many full-time employees does your firm have?
Industry Characteristics
Product Life Cycle
(Deshpandé & Zaltman,
1982)
At which one of the following stages would you place your product?
Introductory, growth, maturity, or decline
Industry Concentration
(Kuester, Homburg, &
Robertson 1999)
Approximately what percentage of sales does the largest 4 competing businesses in
your market control?
0-50%, 51-100%
Market Growth
(Homburg, Workman, &
Krohmer 1999)
Over the last three years, what was the average annual market growth or decline for
your industry? (1 = decrease by more than 20%, 2 = decrease of 10% to 20%, 3
=decrease of 5% to 10%, 4 = decrease of up to 5%, 5 = relatively constant market
volume, 6 = increase of up to 5%, 7 = increase of 5% to 10%, 8 = increase of 10% to
20%, 9 = increase of more than 20%)
Market Turbulence (Miller,
Burke, & Glick 1998)
How strongly do you agree or disagree with each of the following statements
(1 = strongly disagree, 7 = strongly agree): ® = reverse scored
Products/services become obsolete very slowly in your firm’s principal
industry ®
Your firm seldom needs to change its marketing practices to keep up with
competitors ®
Consumer demand and preferences are very easy to forecast in your firm’s
principal industry ®
Managerial
Characteristics
Top Level Manager Level
(Mintz & Currim 2013)
Please indicate your job title (whether a manager is (a) VP-level or higher (e.g., SVP,
C-level or Owner) or (b) lower than VP-level (e.g., Director, Manager):
CEO/Owner, CMO, C-Level (Other than Marketing), SVP/VP of Marketing,
SVP/VP Sales, SVP/VP (Other than Marketing and Sales), Director of Marketing,
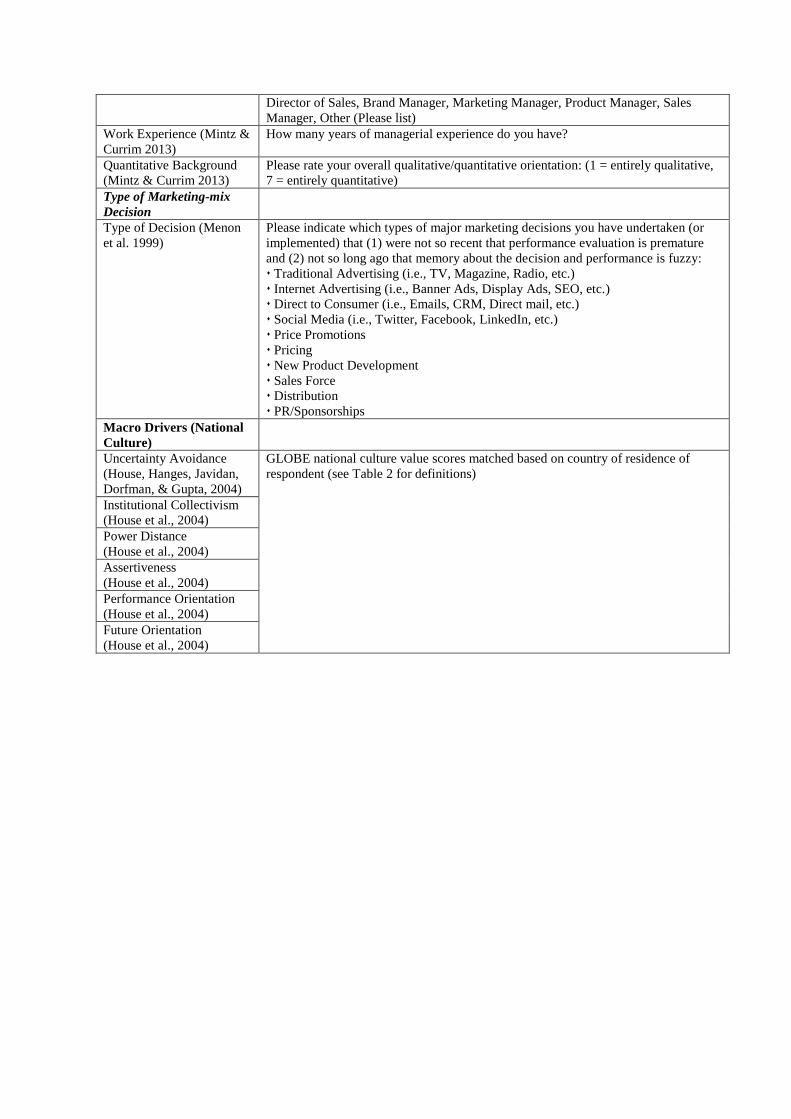
Director of Sales, Brand Manager, Marketing Manager, Product Manager, Sales
Manager, Other (Please list)
Work Experience (Mintz &
Currim 2013)
How many years of managerial experience do you have?
Quantitative Background
(Mintz & Currim 2013)
Please rate your overall qualitative/quantitative orientation: (1 = entirely qualitative,
7 = entirely quantitative)
Type of Marketing-mix
Decision
Type of Decision (Menon
et al. 1999)
Please indicate which types of major marketing decisions you have undertaken (or
implemented) that (1) were not so recent that performance evaluation is premature
and (2) not so long ago that memory about the decision and performance is fuzzy:
Traditional Advertising (i.e., TV, Magazine, Radio, etc.)
Internet Advertising (i.e., Banner Ads, Display Ads, SEO, etc.)
Direct to Consumer (i.e., Emails, CRM, Direct mail, etc.)
Social Media (i.e., Twitter, Facebook, LinkedIn, etc.)
Price Promotions
Pricing
New Product Development
Sales Force
Distribution
PR/Sponsorships
Macro Drivers (National
Culture)
Uncertainty Avoidance
(House, Hanges, Javidan,
Dorfman, & Gupta, 2004)
GLOBE national culture value scores matched based on country of residence of
respondent (see Table 2 for definitions)
Institutional Collectivism
(House et al., 2004)
Power Distance
(House et al., 2004)
Assertiveness
(House et al., 2004)
Performance Orientation
(House et al., 2004)
Future Orientation
(House et al., 2004)
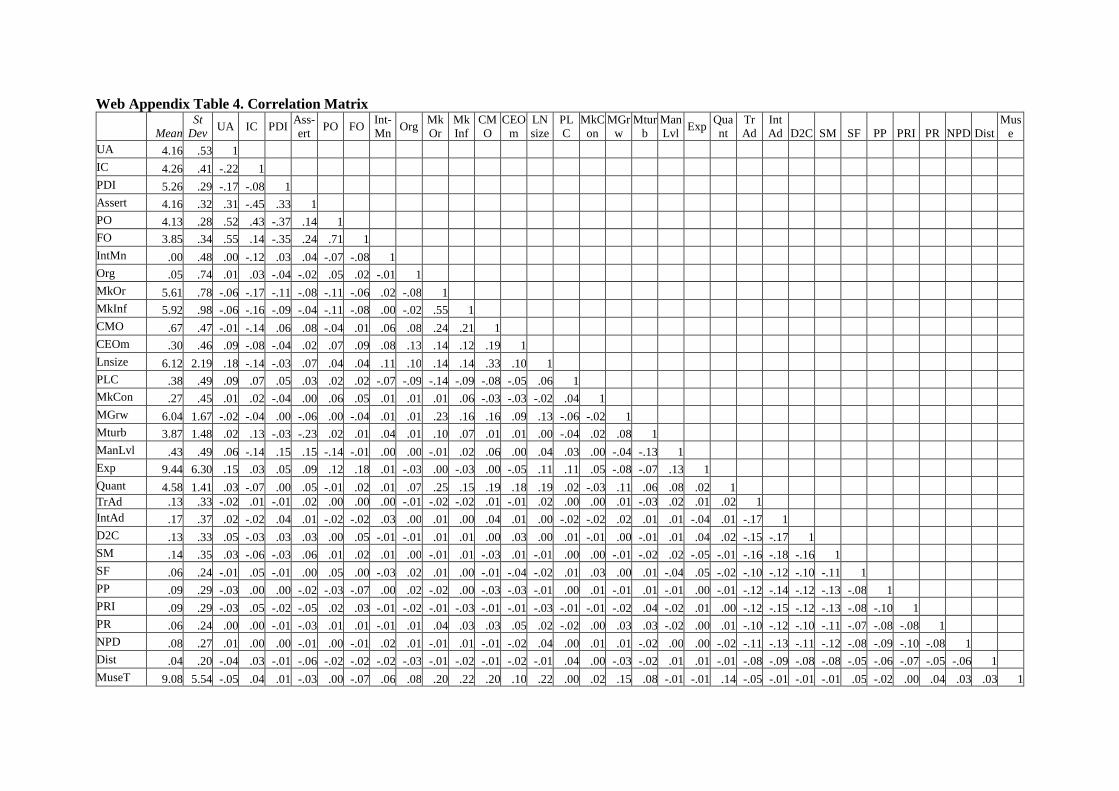
Web Appendix Table 4. Correlation Matrix
Mean
St
Dev UA IC PDI
Ass-
ert PO FO
Int-
Mn Org
Mk
Or
Mk
Inf
CM
O
CEO
m
LN
size
PL
C
MkC
on
MGr
w
Mtur
b
Man
Lvl Exp
Qua
nt
Tr
Ad
Int
Ad D2C SM SF PP PRI PR NPD Dist
Mus
e
UA 4.16 .53 1
IC 4.26 .41 -.22 1
PDI 5.26 .29 -.17 -.08 1
Assert 4.16 .32 .31 -.45 .33 1
PO 4.13 .28 .52 .43 -.37 .14 1
FO 3.85 .34 .55 .14 -.35 .24 .71 1
IntMn .00 .48 .00 -.12 .03 .04 -.07 -.08 1
Org .05 .74 .01 .03 -.04 -.02 .05 .02 -.01 1
MkOr 5.61 .78 -.06 -.17 -.11 -.08 -.11 -.06 .02 -.08 1
MkInf 5.92 .98 -.06 -.16 -.09 -.04 -.11 -.08 .00 -.02 .55 1
CMO .67 .47 -.01 -.14 .06 .08 -.04 .01 .06 .08 .24 .21 1
CEOm .30 .46 .09 -.08 -.04 .02 .07 .09 .08 .13 .14 .12 .19 1
Lnsize 6.12 2.19 .18 -.14 -.03 .07 .04 .04 .11 .10 .14 .14 .33 .10 1
PLC .38 .49 .09 .07 .05 .03 .02 .02 -.07 -.09 -.14 -.09 -.08 -.05 .06 1
MkCon .27 .45 .01 .02 -.04 .00 .06 .05 .01 .01 .01 .06 -.03 -.03 -.02 .04 1
MGrw 6.04 1.67 -.02 -.04 .00 -.06 .00 -.04 .01 .01 .23 .16 .16 .09 .13 -.06 -.02 1
Mturb 3.87 1.48 .02 .13 -.03 -.23 .02 .01 .04 .01 .10 .07 .01 .01 .00 -.04 .02 .08 1
ManLvl .43 .49 .06 -.14 .15 .15 -.14 -.01 .00 .00 -.01 .02 .06 .00 .04 .03 .00 -.04 -.13 1
Exp 9.44 6.30 .15 .03 .05 .09 .12 .18 .01 -.03 .00 -.03 .00 -.05 .11 .11 .05 -.08 -.07 .13 1
Quant 4.58 1.41 .03 -.07 .00 .05 -.01 .02 .01 .07 .25 .15 .19 .18 .19 .02 -.03 .11 .06 .08 .02 1
TrAd .13 .33 -.02 .01 -.01 .02 .00 .00 .00 -.01 -.02 -.02 .01 -.01 .02 .00 .00 .01 -.03 .02 .01 .02 1
IntAd .17 .37 .02 -.02 .04 .01 -.02 -.02 .03 .00 .01 .00 .04 .01 .00 -.02 -.02 .02 .01 .01 -.04 .01 -.17 1
D2C .13 .33 .05 -.03 .03 .03 .00 .05 -.01 -.01 .01 .01 .00 .03 .00 .01 -.01 .00 -.01 .01 .04 .02 -.15 -.17 1
SM .14 .35 .03 -.06 -.03 .06 .01 .02 .01 .00 -.01 .01 -.03 .01 -.01 .00 .00 -.01 -.02 .02 -.05 -.01 -.16 -.18 -.16 1
SF .06 .24 -.01 .05 -.01 .00 .05 .00 -.03 .02 .01 .00 -.01 -.04 -.02 .01 .03 .00 .01 -.04 .05 -.02 -.10 -.12 -.10 -.11 1
PP .09 .29 -.03 .00 .00 -.02 -.03 -.07 .00 .02 -.02 .00 -.03 -.03 -.01 .00 .01 -.01 .01 -.01 .00 -.01 -.12 -.14 -.12 -.13 -.08 1
PRI .09 .29 -.03 .05 -.02 -.05 .02 .03 -.01 -.02 -.01 -.03 -.01 -.01 -.03 -.01 -.01 -.02 .04 -.02 .01 .00 -.12 -.15 -.12 -.13 -.08 -.10 1
PR .06 .24 .00 .00 -.01 -.03 .01 .01 -.01 .01 .04 .03 .03 .05 .02 -.02 .00 .03 .03 -.02 .00 .01 -.10 -.12 -.10 -.11 -.07 -.08 -.08 1
NPD .08 .27 .01 .00 .00 -.01 .00 -.01 .02 .01 -.01 .01 -.01 -.02 .04 .00 .01 .01 -.02 .00 .00 -.02 -.11 -.13 -.11 -.12 -.08 -.09 -.10 -.08 1
Dist .04 .20 -.04 .03 -.01 -.06 -.02 -.02 -.02 -.03 -.01 -.02 -.01 -.02 -.01 .04 .00 -.03 -.02 .01 .01 -.01 -.08 -.09 -.08 -.08 -.05 -.06 -.07 -.05 -.06 1
MuseT 9.08 5.54 -.05 .04 .01 -.03 .00 -.07 .06 .08 .20 .22 .20 .10 .22 .00 .02 .15 .08 -.01 -.01 .14 -.05 -.01 -.01 -.01 .05 -.02 .00 .04 .03 .03 1
16
WEB APPENDIX REFERENCES
Abramson, C., Currim, I. S., & Sarin, R. 2005. An Experimental Investigation of the Impact of
Information on Competitive Decision Making. Management Science, 51(2): 195–207.
Ambler, T. 2003. Marketing and the Bottom Line: The Marketing Metrics to Pump Up Cash Flow (2nd
ed.). London: FT Prentice Hall.
Ambler, T., Kokkinaki, F., & Puntoni, S. 2004. Assessing Marketing Performance: Reasons for Metrics
Selection. Journal of Marketing Management, 20(3): 475–498.
Atuahene-Gima, K., & Murray, J. Y. 2004. Antecedents and Outcomes of Marketing Strategy
Comprehensiveness. Journal of Marketing, 68(4): 33–46.
Barwise, P., & Farley, J. U. 2004. Marketing Metrics: Status of Six Metrics in Five Countries. European
Management Journal, 22(3): 257–262.
Bass, F. M. 1995. Empirical Generalizations and Marketing Science: A Personal View. Marketing
Science, 14(3): G6–G19.
Beugelsdijk, S., Kostova, T., & Roth, K. 2017. An overview of Hofstede-inspired country-level culture
research in international business since 2006. Journal of International Business Studies, 48(1):
30–47.
Bruggen, G. H. van, & Wierenga, B. 2005. When are CRM Systems Successful? The Perspective of the
User and of the Organization. Working Paper. Erasmus Research Institute of Management
(ERIM).
Cameron, K. S., & Quinn, R. E. 2011. Diagnosing and Changing Organizational Culture (3rd ed.). San
Francisco, CA: Jossey-Bass.
Deshpandé, R., & Farley, J. U. 1998. Measuring Market Orientation: Generalization and Synthesis.
Journal of Market-Focused Management, 2(3): 213–232.
Deshpandé, R., & Zaltman, G. 1982. Factors Affecting the Use of Market Research Information: A Path
Analysis. Journal of Marketing Research, 19(1): 14–31.
Deshpandé, R., & Zaltman, G. 1984. A Comparison of Factors Affecting Researcher and Manager
Perceptions of Market Research Use. Journal of Marketing Research, 21(1): 32–38.
Du, R. Y., Kamakura, W. A., & Mela, C. F. 2007. Size and Share of Customer Wallet. Journal of
Marketing, 71(2): 94–113.
Edeling, A., & Fischer, M. 2016. Marketing’s Impact on Firm Value: Generalizations from a Meta-
Analysis. Journal of Marketing Research, 53(4): 515–534.
Farley, J. U., Hoenig, S., Lehmann, D. R., & Hoang Thuy Nguyen. 2008. Marketing Metrics Use in a
Transition Economy: The Case of Vietnam. Journal of Global Marketing, 21(3): 179–190.
17
Farris, P. W., Bendle, N. T., Pfeifer, P. E., & Reibstein, D. J. 2010. Marketing Metrics: The Definitive
Guide to Measuring Marketing Performance (2nd ed.). Upper Saddle River, New Jersey:
Wharton School Publishing.
Frösén, J., Luoma, J., Jaakkola, M., Tikkanen, H., & Aspara, J. 2016. What Counts Versus What Can Be
Counted: The Complex Interplay of Market Orientation and Marketing Performance
Measurement. Journal of Marketing, 80(3): 60–78.
Glazer, R., & Weiss, A. M. 1993. Marketing in Turbulent Environments: Decision Processes and the
Time-Sensitivity of Information. Journal of Marketing Research, 30(4): 509–521.
Greene, W. H. 2003. Econometric Analysis (5th edition.). Upper Saddle River, N.J: Prentice Hall.
Gupta, S., & Zeithaml, V. 2006. Customer Metrics and Their Impact on Financial Performance.
Marketing Science, 25(6): 718–739.
Henri, J.-F. 2006. Organizational Culture and Performance Measurement Systems. Accounting,
Organizations and Society, 31(1): 77–103.
Hoffman, D. L., & Fodor, M. 2010. Can You Measure the ROI of Your Social Media Marketing? MIT
Sloan Management Review, 52(1): 41–49.
Hofstede, G., Hofstede, G. J., & Minkov, M. 2010. Cultures and Organizations: Software of the Mind
(3rd ed.). New York: McGraw-Hill.
Homburg, C., Artz, M., & Wieseke, J. 2012. Marketing Performance Measurement Systems: Does
Comprehensiveness Really Improve Performance? Journal of Marketing, 76(3): 56–77.
Homburg, C., Workman Jr., J. P., & Krohmer, H. 1999. Marketing’s Influence Within the Firm. Journal
of Marketing, 63(2): 1–17.
House, R. J., Hanges, P. J., Javidan, M., Dorfman, P. W., & Gupta, V. 2004. Culture, Leadership, and
Organizations. Thousand Oaks, California: Sage Publications.
Jaworski, B. J., & Kohli, A. K. 1993. Market Orientation: Antecedents and Consequences. Journal of
Marketing, 57(3): 53–70.
Kirkman, B. L., Lowe, K. B., & Gibson, C. B. 2006. A quarter century of Culture’s Consequences: a
review of empirical research incorporating Hofstede’s cultural values framework. Journal of
International Business Studies, 37(3): 285–320.
Kuester, S., Homburg, C., & Robertson, T. S. 1999. Retaliatory Behavior to New Product Entry. Journal
of Marketing, 63(4): 90–106.
Lee, H., Acito, F., & Day, R. L. 1987. Evaluation and Use of Marketing Research by Decision Makers: A
Behavioral Simulation. Journal of Marketing Research, 24(2): 187–196.
Leeflang, P. S. H., Wittink, D. R., Wedel, M., & Naert, P. A. 2000. Building Models for Marketing
Decisions. Dordrecht: Kluwer Academic Publishers.
Lehmann, D. R., & Reibstein, D. J. 2006. Marketing Metrics and Financial Performance. Cambridge,
Massachusetts: Marketing Science Institute.
18
Menon, A., Bharadwaj, S. G., Adidam, P. T., & Edison, S. W. 1999. Antecedents and Consequences of
Marketing Strategy Making: A Model and a Test. Journal of Marketing, 63(2): 18–40.
Menon, A., & Varadarajan, P. R. 1992. A Model of Marketing Knowledge Use within Firms. Journal of
Marketing, 56(4): 53–71.
Miller, C. C., Burke, L. M., & Glick, W. H. 1998. Cognitive Diversity among Upper-Echelon Executives:
Implications for Strategic Decision Processes. Strategic Management Journal, 19(1): 39–58.
Mintz, O., & Currim, I. S. 2013. What Drives Managerial Use of Marketing and Financial Metrics and
Does Metric Use Affect Performance of Marketing-Mix Activities? Journal of Marketing,
77(2): 17–40.
Mintz, O., & Currim, I. S. 2015. When Does Metric Use Matter Less? How Firm and Managerial
Characteristics Moderate the Relationship between Metric Use and Marketing Mix
Performance. European Journal of Marketing, 49(11/12): 1809–1856.
Mintz, O., Gilbride, T. J., Currim, I. S., & Lenk, P. J. 2017. A Model for Evaluating Metric Effectiveness:
Correcting for Endogenous Selection Effects and Ex-Ante Expectations. Working Paper.
Louisiana State University.
Moenaert, R. K., & Souder, W. E. 1996. Context and Antecedents of Information Utility at the
R&D/Marketing Interface. Management Science, 42(11): 1592–1610.
Moorman, C. 1995. Organizational Market Information Processes: Cultural Antecedents and New Product
Outcomes. Journal of Marketing Research, 32(3): 318–335.
Moorman, C., & Rust, R. T. 1999. The Role of Marketing. Journal of Marketing, 63(4): 180–197.
Morgan, N. A., Anderson, E. W., & Mittal, V. 2005. Understanding Firms’ Customer Satisfaction
Information Usage. Journal of Marketing, 69(3): 131–151.
Naor, M., Linderman, K., & Schroeder, R. 2010. The Globalization of Operations in Eastern and Western
countries: Unpacking the Relationship between National and Organizational Culture and its
Impact on Manufacturing Performance. Journal of Operations Management, 28(3): 194–205.
O’Sullivan, D., & Abela, A. V. 2007. Marketing Performance Measurement Ability and Firm
Performance. Journal of Marketing, 71(2): 79–93.
Pauwels, K., Ambler, T., Clark, B. H., LaPointe, P., Reibstein, D. J., Skiera, B., et al. 2009. Dashboards
as a Service: Why, What, How, and What Research Is Needed? Journal of Service Research,
12(2): 175–189.
Perkins, W. S., & Rao, R. C. 1990. The Role of Experience in Information Use and Decision Making by
Marketing Managers. Journal of Marketing Research, 27(1): 1–10.
Sinkula, J. M. 1994. Market Information Processing and Organizational Learning. Journal of Marketing,
58(1): 35–45.
Srinivasan, S., & Hanssens, D. M. 2009. Marketing and Firm Value: Metrics, Methods, Findings, and
Future Directions. Journal of Marketing Research, 46(3): 293–312.
19
Srinivasan, S., Vanhuele, M., & Pauwels, K. 2010. Mind-Set Metrics in Market Response Models: An
Integrative Approach. Journal of Marketing Research, 47(4): 672–684.
Tse, D. K., Lee, K., Vertinsky, Ii., & Wehrung, D. A. 1988. Does Culture Matter? A Cross-Cultural Study
of Executives’ Choice, Decisiveness, and Risk Adjustment in International Marketing. Journal
of Marketing, 52(4): 81–95.
Verhoef, P. C., & Leeflang, P. S. H. 2009. Understanding the Marketing Department’s Influence Within
the Firm. Journal of Marketing, 73(2): 14–37.
Wooldridge, J. M. 2016. Introductory Econometrics: A Modern Approach (6th ed.). Boston, MA:
Cengage Learning US.
20
Endnotes
i We employ the terms culture theory, cultural theory, etc., synonymously. In general, cultural classification tools
have accommodated much research involving culture across nations, and these constitute “theory” in an interpretive
sense.
ii While also plausible, we do not consider specific causes of managerial variation in metric use based on regional
differences within a country. In addition, we are interested in the effect of national and organizational culture on all
firms, not just multinational corporations (MNCs). Based on culture theory, we expect national and organizational
culture to drive across and within country variation in managerial metric use, whether the firm is a MNC or not.
iii Managers were required to describe their metric use for at least one type of recent marketing-mix decision and
were notified that “while selecting multiple types of marketing decisions will help us greatly in our research, if you
are short on time we suggest for you to select only one type of marketing decision. Each additional decision will
increase your survey length by approximately 5 minutes.” On average, managers reported their metric use for 2.7
types of marketing-mix decisions (see Table 1 for details).
iv We also estimate an additional model where we only analyze firms in our sample which have <1,000 employees.
In this analysis of smaller firms, we find similar effects of national and organizational culture as in the analysis of
<median firm size sub-segment (<498 employees).
v We thank the Editor for these ideas.