Embed Size (px)
Citation preview
04.09.2003
1
2 September 2003
Managing a MBS Portfolio
Robert Scott
Portfolio Manager
BIS Asset Management
Outline:
l Aggregating the risks in an MBS Portfolio
l Index Replication
l Relative Value Analysis
04.09.2003
2
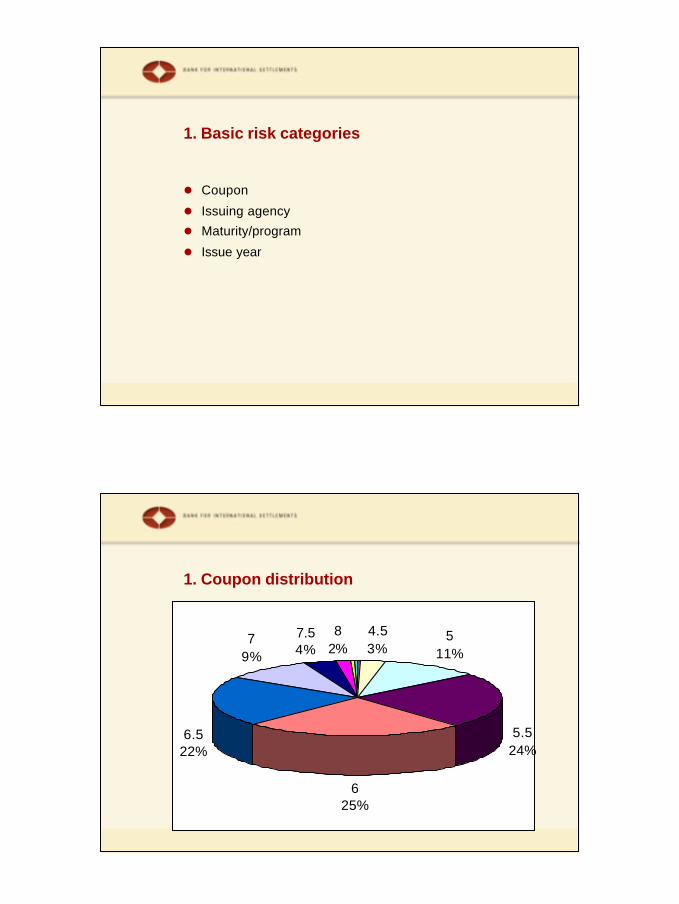
1. Basic risk categories
l Coupon
l Issuing agency
l Maturity/program
l Issue year
1. Coupon distribution
4.53%
511%
5.524%
625%
6.522%
79%
7.54%
82%
04.09.2003
3
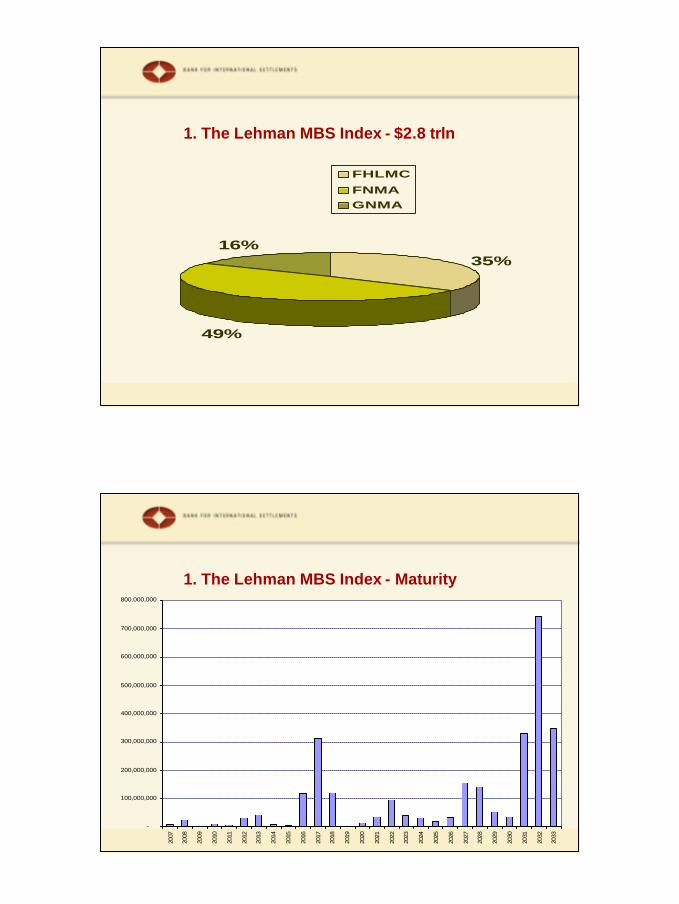
1. The Lehman MBS Index - $2.8 trln
35%
49%
16%
FHLMC
FNMAGNMA
1. The Lehman MBS Index - Maturity
-
100,000,000
200,000,000
300,000,000
400,000,000
500,000,000
600,000,000
700,000,000
800,000,000
2007
2008
2009
2010
2011
2012
2013
2014
2015
2016
2017
2018
2019
2020
2021
2022
2023
2024
2025
2026
2027
2028
2029
2030
2031
2032
2033

04.09.2003
4
1. Factors impacting price changes
l Duration l Yield curve re-shapingl Current-coupon spreadl Volatilityl MBS-Treasury spreadl Convexityl OAS
1. Further difficulties: effective vs empirical durations
l Effective duration assumes all risk factors remain constant
l Empirical duration assumes correlation of all risk factors with interest rates remains constant
l Differ most when OAS has significant negative correlation with interest rates
04.09.2003
5
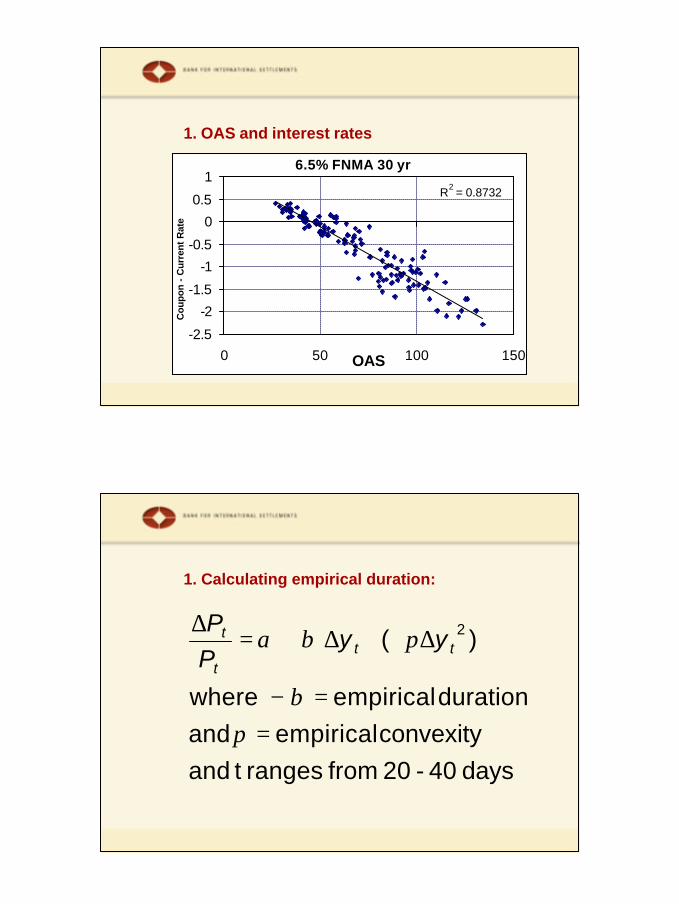
1. OAS and interest rates
6.5% FNMA 30 yr
R2 = 0.8732
-2.5
-2
-1.5
-1
-0.5
0
0.5
1
0 50 100 150OAS
Cou
pon
- C
urre
nt R
ate
1. Calculating empirical duration:
days 40-20 from ranges t andconvexity empirical and
duration empirical where
) ( 2
==−
∆+∆+=∆
πβ
πβα ttt
t yyPP
04.09.2003
6
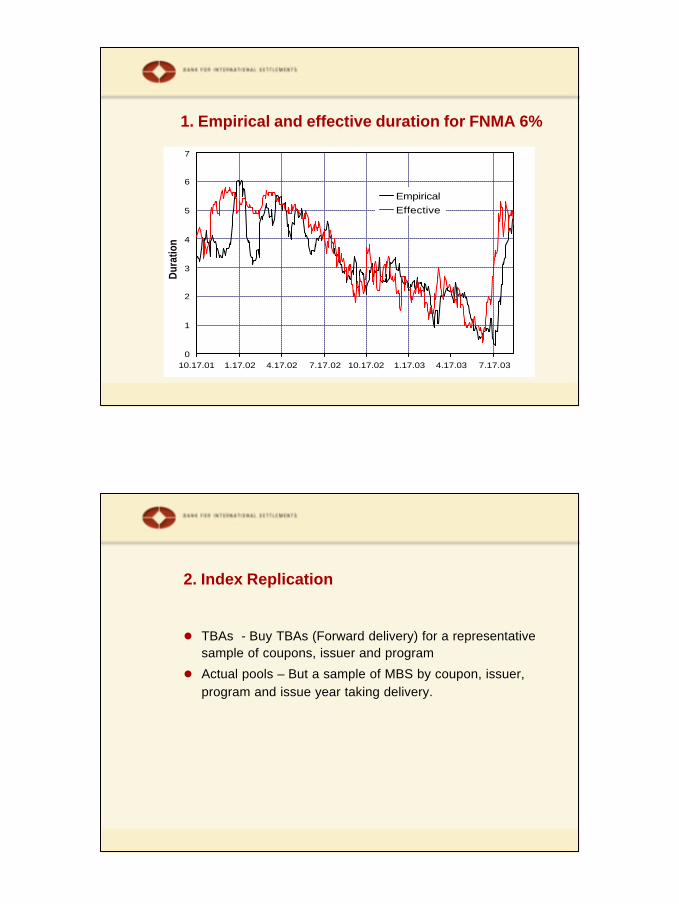
1. Empirical and effective duration for FNMA 6%
0
1
2
3
4
5
6
7
10.17.01 1.17.02 4.17.02 7.17.02 10.17.02 1.17.03 4.17.03 7.17.03
Dur
atio
n
EmpiricalEffective
2. Index Replication
l TBAs - Buy TBAs (Forward delivery) for a representative sample of coupons, issuer and program
l Actual pools – But a sample of MBS by coupon, issuer, program and issue year taking delivery.

04.09.2003
7
2. Index replication – Available indexes
l Lehman MBS Index – 523 issues, 2.8 trln
l Salomon – 1.9 trln (30 yr )
l Merrill Lynch – 423 issues, $2.55 trln
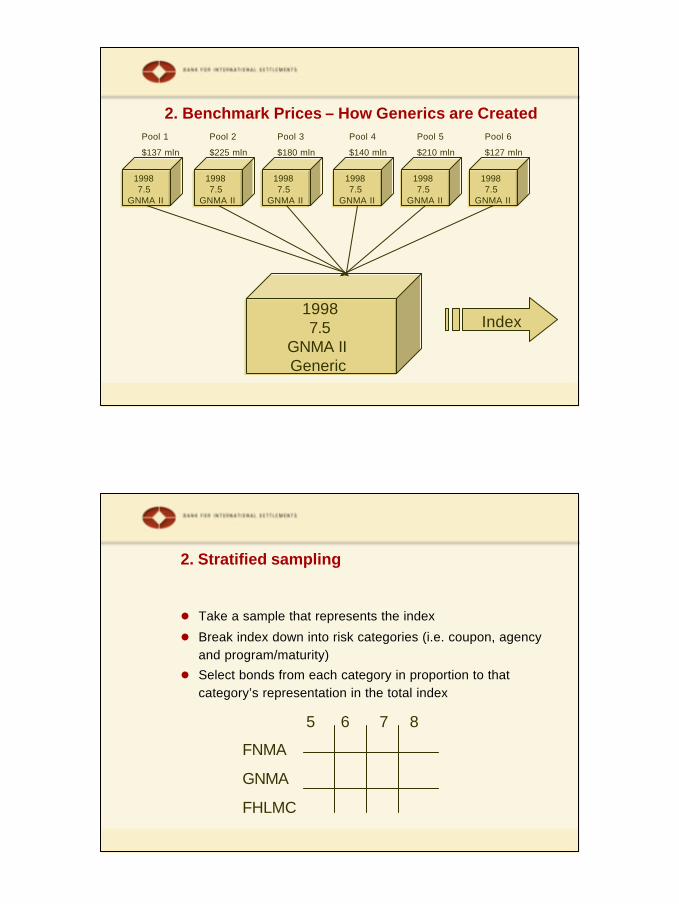
2. Index Replication – About the Lehman Index
l Each bond in the index is a generic – i.e. not tradable
l 526 bonds in the index
l 15 different programs / maturities
l Only 6 programs have 3% or more weighting
04.09.2003
8
2. Benchmark Prices – How Generics are Created
1998 7.5
GNMA II
1998 7.5
GNMA II
1998 7.5
GNMA II
1998 7.5
GNMA II
1998 7.5
GNMA II
1998 7.5
GNMA II
Pool 1
$137 mln
19987.5
GNMA II Generic
Index
Pool 2
$225 mln
Pool 3
$180 mln
Pool 4
$140 mln
Pool 5
$210 mln
Pool 6
$127 mln
2. Stratified sampling
l Take a sample that represents the index
l Break index down into risk categories (i.e. coupon, agency and program/maturity)
l Select bonds from each category in proportion to that category’s representation in the total index
5 6 7 8
FNMA
GNMA
FHLMC

04.09.2003
9
2. An example portfolio – Generic pools Coupon Weight Coupon Weight
4.5 0.3% 5 0.0%5 1.3% 5.5 0.1%
5.5 0.9% 5 1.4%6 1.1% 5.5 4.2%
6.5 0.7% 6 6.8%7 0.4% 6.5 7.2%5 1.7% 7 3.6%
5.5 12.0% 7.5 1.5%6 14.4% 8 0.6%
6.5 17.7% 8.5 0.1%7 12.4%
7.5 5.3% 27 Total 8 3.6% 22 Available as TBA
8.5 1.0% Missing amount: 2.8%9 1.0%
9.5 0.5% Not available as TBA10 0.2%
GNMA I Single Family 'Midget' - 15 years
GNMA I Single Family Pool - 30 years
GNMA II Single Family 'Midget' - 15 years
GNMA II Single Family Pool - 30 years
Effective Duration
Yield
Lehman GNMA MBS Index 2.06 5.17 Generic portfolio 2.01 5.16
An Example Portfolio – TBAs
Program CouponNominal Amount Weight
4.5 660,419 0.3%5 2,621,468 1.3%
5.5 1,777,402 0.9%6 2,310,187 1.2%
6.5 1,376,146 0.7%7 887,138 0.4%5 3,579,151 1.8%
5.5 24,626,704 12.3%6 29,633,028 14.8%
6.5 36,427,822 18.2%7 25,605,481 12.8%
7.5 10,998,343 5.5%8 7,384,985 3.7%5 81,895 0.0%
5.5 110,025 0.1%5 2,935,802 1.5%
5.5 8,609,112 4.3%6 14,046,347 7.0%
6.5 14,729,808 7.4%7 7,356,561 3.7%
7.5 3,048,676 1.5%8 1,193,498 0.6%
200,000,000 100%
GNMA II Single Family Pool - 30 years
GNMA II Single Family 'Midget' - 15 years
GNMA I Single Family Pool - 30 years
GNMA I Single Family 'Midget' - 15 years
04.09.2003
10
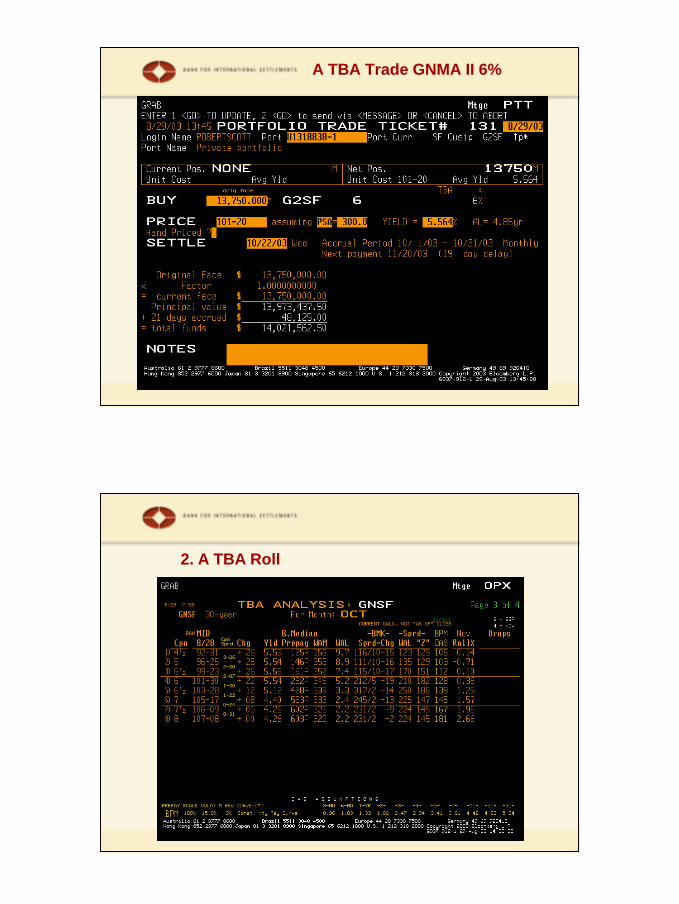
A TBA Trade GNMA II 6%
2. A TBA Roll

04.09.2003
11
2. Replication performance*
l TBA only strategy averages 21 bps annual tracking error
l Large pool strategy averages 15 bps annual tracking error
Source: “Tradable proxy portfolios for the Lehman Brothers MBS Index”, Lehman Brothers Fixed Income Research, July 2001
04.09.2003
12
3. Relative value
l Bottom up or pool specific
l Top-down or Macro-driven
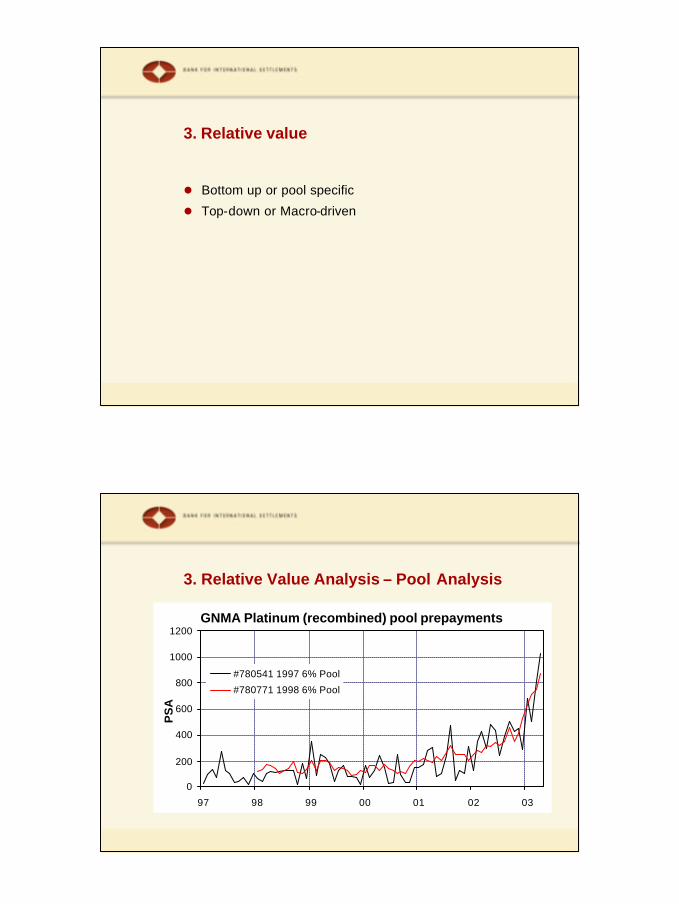
3. Relative Value Analysis – Pool Analysis
GNMA Platinum (recombined) pool prepayments
0
200
400
600
800
1000
1200
97 98 99 00 01 02 03
PS
A
#780541 1997 6% Pool
#780771 1998 6% Pool
04.09.2003
13
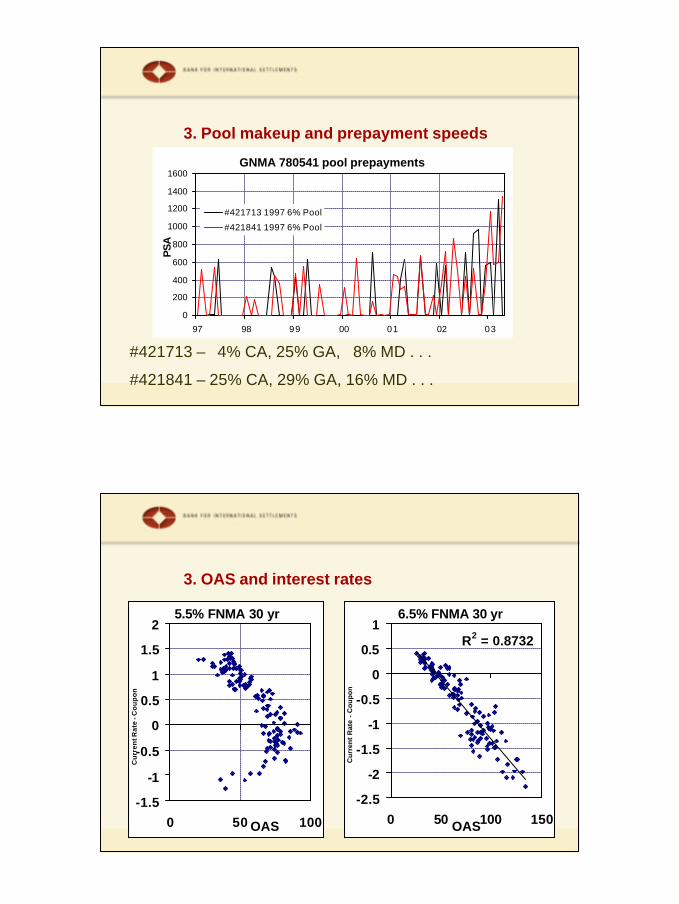
3. Pool makeup and prepayment speeds
#421713 – 4% CA, 25% GA, 8% MD . . .
#421841 – 25% CA, 29% GA, 16% MD . . .
GNMA 780541 pool prepayments
0
200
400
600
800
1000
1200
1400
1600
97 98 99 00 01 02 03
PS
A
#421713 1997 6% Pool
#421841 1997 6% Pool
3. OAS and interest rates
5.5% FNMA 30 yr
-1.5
-1
-0.5
0
0.5
1
1.5
2
0 50 100OAS
Cu
rren
t Rat
e - C
ou
po
n
6.5% FNMA 30 yr
R2 = 0.8732
-2.5
-2
-1.5
-1
-0.5
0
0.5
1
0 50 100 150OAS
Cu
rren
t R
ate
- C
ou
po
n
04.09.2003
14
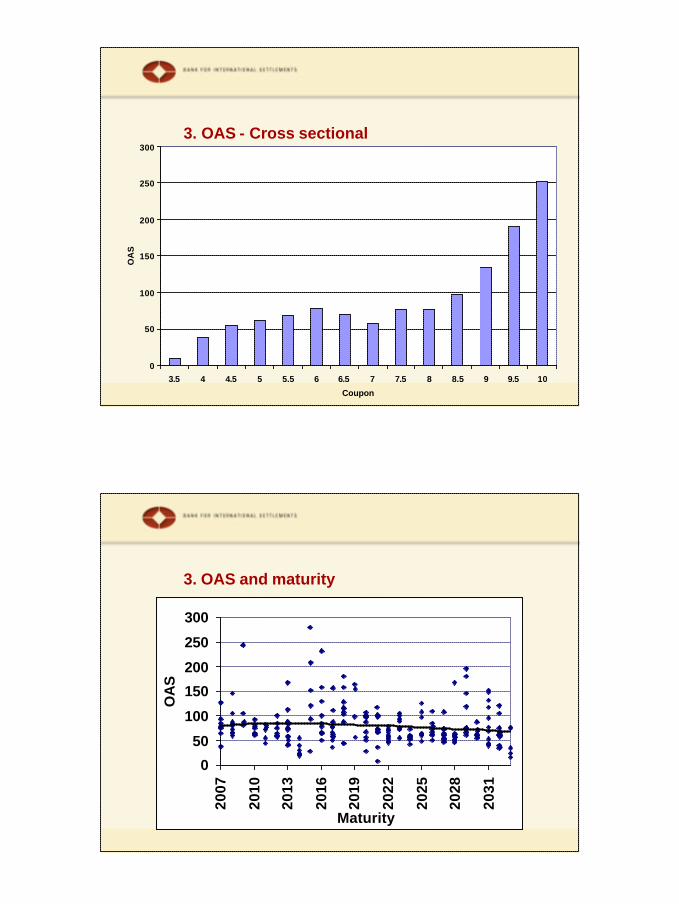
3. OAS - Cross sectional
0
50
100
150
200
250
300
3.5 4 4.5 5 5.5 6 6.5 7 7.5 8 8.5 9 9.5 10
Coupon
OA
S
3. OAS and maturity
0
50
100
150
200
250
300
2007
2010
2013
2016
2019
2022
2025
2028
2031
Maturity
OA
S

04.09.2003
15
In Summary
l Coupon, issue year, agency, program are important for classifying risks
l Duration as a risk measure, effective or empirical, requires assumptions
l TBA-only portfolio can reasonably replicate the Lehman MBS index
l Top-down or bottom -up analysis can be used for more active management
References
l Breeden, Douglas, “Complexities of Hedging Mortgages”, Journal of Fixed-Income, December 1994, pp. 6-41
l DeRosa, P., L. Goodman and M. Zazzarino, 1993, "Duration estimates on Mortgage-backed securities", Journal of Portfolio Management, Winter
l Dynkin, Lev; Vadim Konstantinovsky, Bruce Phelps, “Tradable Proxy Portfolios for the Lehman Brothers MBS Index”, Lehman Brothers Fixed Income Research, July 2001
l Fabozzi, Frank, The Handbook of Mortgage-Backed Securities, McGraw-Hill, NY, 1995 . .
l Hayre, Lakhbir, Guide to Mortgage-Backed and Asset-Backed Securities, John Wiley and Sons, NY, 2001