Embed Size (px)
Citation preview
Managing Carbon on Federal Public Lands: Opportunitiesand Challenges in Southwestern Colorado
Lisa Dilling1,2 • Katharine C. Kelsey3,4 • Daniel P. Fernandez3 • Yin D. Huang3 •
Jana B. Milford5 • Jason C. Neff3
Received: 29 April 2015 / Accepted: 21 May 2016
� Springer Science+Business Media New York 2016
Abstract Federal lands in the United States have been
identified as important areas where forests could be man-
aged to enhance carbon storage and help mitigate climate
change. However, there has been little work examining the
context for decision making for carbon in a multiple-use
public land environment, and how science can support
decision making. This case study of the San Juan National
Forest and the Bureau of Land Management Tres Rios
Field Office in southwestern Colorado examines whether
land managers in these offices have adequate tools, infor-
mation, and management flexibility to practice effective
carbon stewardship. To understand how carbon was dis-
tributed on the management landscape we added a newly
developed carbon map for the SJNF–TRFO area based on
Landsat TM texture information (Kelsey and Neff in
Remote Sens 6:6407–6422. doi:10.3390/rs6076407, 2014).
We estimate that only about 22 % of the aboveground
carbon in the SJNF–TRFO is in areas designated for active
management, whereas about 38 % is in areas with limited
management opportunities, and 29 % is in areas where
natural processes should dominate. To project the effects of
forest management actions on carbon storage, staff of the
SJNF are expected to use the Forest Vegetation Simulator
(FVS) and extensions. While identifying FVS as the best
tool generally available for this purpose, the users and
developers we interviewed highlighted the limitations of
applying an empirically based model over long time hori-
zons. Future research to improve information on carbon
storage should focus on locations and types of vegetation
where carbon management is feasible and aligns with other
management priorities.
Keywords Carbon management � Sequestration � Publiclands � Decision making � Modeling � Climate change
Introduction
Management of forests and agricultural lands to increase
carbon storage has been advanced as a relatively low-cost
strategy to mitigate climate change (McCarl and Sands
2007; McKinley et al. 2011; Zheng et al. 2013). Roughly
half of forest carbon stocks in the United States are esti-
mated to be on federal public lands (Heath et al. 2011;
Dilling et al. 2013). In 2011, to assist national forest
managers in assessing the potential for future carbon
management activities, the US. Forest Service (USFS)
began asking its units to track ‘‘carbon assessment and
stewardship’’ as part of its Climate Change Performance
Scorecard.1 The carbon assessment and stewardship metric
asks (a) Does the unit have a baseline assessment of carbon
stocks and the influence of disturbance and management
& Lisa Dilling
1 Environmental Studies Program, Center for Science and
Technology Policy Research, Cooperative Institute for
Research in Environmental Sciences, University of Colorado
Boulder, Boulder, CO 80309, USA
2 Western Water Assessment, University of Colorado Boulder,
Boulder, CO 80309, USA
3 Environmental Studies Program, University of Colorado
Boulder, Boulder, CO 80309, USA
4 Department of Biological Sciences, University of Alaska
Anchorage, Anchorage, AK 99501, USA
5 Department of Mechanical Engineering, University of
Colorado Boulder, Boulder, CO 80309, USA 1 www.fs.fed.us/climatechange/advisor/scorecard.html.
123
Environmental Management
DOI 10.1007/s00267-016-0714-2
activities on these stocks?, and (b) Is the unit integrating
carbon stewardship with the management of other benefits
being provided by the unit?
This raises the question of how public land resource
managers are positioned to integrate carbon stewardship
into their practices, and whether they have adequate tools
and data to support their decision making in that arena.
Studies on the use of climate information in applied set-
tings have found that both the context of decision making
and factors intrinsic to the characteristics of the science or
the process of producing science themselves affect the
usability of information (Dilling and Lemos 2011). The
requirement to respond to the Performance Scorecard
presents an opportunity to examine whether managers have
the tools to effectively consider how carbon goals map to
existing decision contexts—in other words, how decision
context and the usability and applicability of scientific
information and tools set the stage for managers to begin to
consider carbon in their decision making.
The decision context for public land managers is strongly
guided by existing policy priorities, management plans, and
decision drivers andwill thus represent a strong constraint on
how new policy priorities like carbon management are
integrated into public land management (Ellenwood et al.
2012; Dilling and Failey 2013). Carbon management goals
are being overlain onto a complicated federal land man-
agement structure that must be responsive to multiple
intended users (Failey and Dilling 2010; Olander et al. 2012;
Dilling and Failey 2013; Dilling et al. 2013). Carbon man-
agement is therefore rarely the primary goal for land man-
agement decisionmaking, and can be subordinate to a host of
other driving factors (Ellenwood et al. 2012). The potential
for large amounts of carbon to be managed on public lands is
tempered by the fact that large areas such as designated
wilderness may be effectively off-limits for active manage-
ment, for example (Olander et al. 2012).
Several factors influence the usability of data and tools
to support the management of carbon. Carbon accounting
in practice is regionally and locally specific, and depends
heavily on the availability of appropriate datasets and tools
to establish baselines and to project changes in stocks over
time (Galik et al. 2009). Many of the recommended data-
sets and tools have been developed and calibrated at the
national scale, however, it is important to consider whether
they are adequate at the scale of an individual forest.
Related questions, therefore, are how much of the carbon
stocks present on public lands are actually available for the
active management of carbon, given multiple-use man-
dates, physical landscape constraints, and staffing require-
ments; and whether opportunities for management could be
more clearly identified by considering these constraints.
In this paper we present a case study looking at how
these two factors, decision context and usability of
scientific tools, can be applied to carbon management
decision making in the San Juan National Forest/Tres Rios
Field Office (SJNF–TRFO) areas of federal public land in
southwestern Colorado. First, we examine the degree to
which existing carbon stocks in the SJNF–TRFO overlap
with management designations that allow for interventions
to increase carbon, given the constraints in a multiple-use
policy environment. Second, we examine the suitability of
existing tools and methods for performing carbon analyses
in support of decision making in the federal public land
context. To understand the specific elements of our study
and the methodology involved we first present some
additional background and terminology.
Estimating Carbon Stocks and Changes
Estimates of forest carbon stocks are based on ground-
based observations of forest carbon that are extended to the
landscape using a variety of approaches (Goetz et al. 2009).
For example, some carbon maps are developed by assign-
ing a single carbon value to a categorical landscape unit,
whereas others extend ground-based carbon estimates to
the landscape scale with the use of spatially continuous
data generally derived from remotely sensed imagery. A
primary source of ground-based forest carbon information
in the US is the Forest Inventory Analysis (FIA) dataset
that estimates biomass at a series of plot locations across
the continental US. These data have been used to estimate
and create national maps of carbon inventories on federal
public lands over the US (e.g., Smith and Heath 2004).
However, there are many limitations in the accuracy of
carbon maps developed from these methods. First, ground-
based estimates of forest carbon derived from the mea-
surements of tree dimensions and forest density can include
errors as a result of the measurement protocols used and the
allometric equations used to convert tree dimensions to
estimates of forest carbon (Chave et al. 2004). Second,
estimates of carbon stocks produced by assigning one
carbon value to each spatial unit of the landscape have
limited accuracy due to the heterogeneity present within
each unit (Goetz et al. 2009). Those constructed from
continuous data derived from remotely sensed imagery also
have limitations, including issues with sensor saturation or
saturation of vegetation indices used to estimate carbon
(Dubayah and Drake 2000; Huete and van Leeuwen 1997;
Kasischke et al. 1997), and the mismatch in spatial scale
between the size of measurement plots and the spatial
resolution of remotely sensed imagery. Furthermore, the
relationship between remotely sensed information and
forest carbon can vary between regions (Cutler et al. 2012;
Woodcock et al. 2001, Nowak and Greenfield 2010), cre-
ating challenges regarding the transferability of carbon
estimation methods. All of these issues contribute to the
Environmental Management
123
limitations on the accuracy of forest carbon estimates at
fine spatial resolution and local to regional spatial extents.
For carbon accounting, a key concern is additionality—
whether or not the carbon sequestered by a project would
have been stored even if the project never took place.
Developing a project baseline, that is, an agreed-upon
narrative of how carbon stocks would have evolved in the
absence of deliberate management actions, is a necessary
first step to estimate how management affects carbon
stocks. In one study, creditable carbon varied by up to a
factor of three depending on the baseline assumptions and
carbon stocks included in the analysis (Galik et al. 2009).
Estimating changes in carbon stocks in the future and the
impact of various management regimes on those stocks
relies on the use of models. In recent years, the USFS has
been adapting the Forest Vegetation Simulator (FVS) for
use in projecting carbon storage implications of manage-
ment actions, including under changing climate conditions
(Crookston et al. 2010). FVS is a forest growth and yield
model that was developed for timber management appli-
cations (Crookston and Dixon 2005; Dixon 2002). The
USFS plans to use FVS to model forest carbon dynamics in
the Forest Carbon Management Framework (ForCaMF)
that it is developing for use in Performance Scorecard
assessments (http://www.fs.fed.us/climatechange/advisor/
scorecard/carbon-assessment-stewardship.html, last acces-
sed Jan. 6, 2015).
Roadmap for the Case Study
To examine the management context and the adequacy of
nationally available datasets and tools for carbon man-
agement in the SJNF–TRFO, we first present an updated
map of aboveground live carbon stocks that was created
specifically for this region by adding estimates for the grass
and shrublands to those published recently by Kelsey and
Neff (2014) for forested portions of the SJNF. Errors in
Kelsey and Neff’s local-scale map for the SJNF are com-
pared to errors found for the same area in two different
national maps of forest carbon stocks. Next, we present the
results of a GIS analysis to quantify how carbon stock
estimates, management objectives, and biophysical char-
acteristics of the land can be combined to provide a more
specific estimate of the areas most likely to represent
opportunities for carbon management. This analysis helps
to identify areas and types of vegetation that warrant pri-
ority for research to better understand current stocks and
effects of potential carbon management strategies. To
examine the usability and appropriateness of available
tools for carbon decision support, we present the results of
interviews we conducted with technical specialists to better
understand their perspective on the benefits and limitations
of FVS for use in projecting changes in carbon storage at
the forest/field office level. Finally we use carbon storage
projections from FVS to illustrate the challenge local forest
managers face in evaluating possible management activi-
ties when the resulting changes in carbon storage are
modest in comparison to errors in the baseline.
Methods
Case Background
This paper reports the results of a case study of the SJNF–
TRFO area in southwestern Colorado. The San Juan
National Forest (SJNF) is a part of the US Forest Service
under the Department of Agriculture, while the Tres Rios
Field Office (TRFO) is a part of the Bureau of Land
Management, within the US Department of the Interior.
Because of the proximity of lands managed by the two
agencies, the SJNF–TRFO was managed together for a
period of time in a jointly administered Public Lands Office
at the beginning of our study. The lands have returned to
being managed separately as of 2014 but they are still
tightly coordinated and share a common headquarters
space. We discuss them together for much of this paper,
except for some analyses as noted when we focus on the
SJNF portion exclusively. The SJNF and TRFO together
manage about 9600 km2 of land within the boundaries of a
16,300 km2 area that also includes significant private land.
The SJNF–TRFO area extends from grass and shrublands
to alpine tundra, with elevations ranging from 1500 m to
over 4200 m. The SJNF–TRFO area has been actively
engaging with the issue of carbon management for the past
several years, and provides a valuable context for more
deeply investigating how the issues of decision context and
the use of scientific information in decision making affect
the potential for usable science to support carbon man-
agement. The San Juan National Forest within the SJNF–
TRFO area is one of a handful of FS units that have pur-
sued carbon demonstration projects through the National
Forest Foundation. For example, the San Juan National
Forest has participated in an ongoing partnership program
for carbon offsetting through the National Forest Founda-
tion (https://www.nationalforests.org/corporate-partner
ships last accessed March 27, 2016).
Overview of Approach
Our case study of tools and limitations for carbon reporting
and management in the SJNF–TRFO centers on an
improved map of aboveground carbon stocks developed for
the SJNF by Kelsey and Neff (2014). The information in
this map was supplemented with aboveground carbon
estimates for the grass and shrublands to provide complete
Environmental Management
123
coverage of how aboveground carbon stocks vary across
the SJNF–TRFO area. We used existing FIA data and new
aboveground forest carbon survey data collected for this
study to assess errors in the new carbon map for the SJNF
specifically and in previously published maps that are
widely used to assess carbon stocks. We examined the
change in carbon stocks that might be achieved in forest
stands within the SJNF through two illustrative manage-
ment activities—thinning to improve forest health and
replanting after a fire. Finally, the new carbon map was
combined with GIS-based information about management
aims and physical restrictions within the SJNF–TRFO
domain to understand how they might limit options for
active carbon management.
SJNF–TRFO Carbon Calculations
Maps of aboveground live carbon stocks for the SJNF and
TRFO were derived from two different sources. Carbon
estimates from the forested regions within SJNF–TRFO
were taken from the carbon map produced by Kelsey and
Neff (2014). Carbon estimates for the non-forested regions
within SJNF–TRFO were created for the purpose of this
study. These two different maps were combined into a
single carbon map for the SJNF–TRFO area.
The forest carbon estimates from Kelsey and Neff
(2014) were based on field-sampled aboveground carbon
data from the Forest Inventory and Analysis (FIA) pro-
gram. The field-sampled data were used to train a model
that predicts forest carbon based on image texture infor-
mation derived from Landsat TM imagery. This texture-
based model was used to create a continuous map of forest
carbon stocks for all forest vegetation types within SJNF
including Ponderosa Pine (Pinus ponderosa) woodlands,
Warm–Dry Mixed Conifer forests, Cool–Moist Mixed
Conifer forests, and Spruce–Fir (Picea engelmannii and
Abies lasiocarpa) forests (Kelsey and Neff 2014). Kelsey
and Neff compared models estimated using texture metrics,
physical variables (elevation, slope, aspect, and precipita-
tion), and spectral variables (NDVI and EVI). The best
performing model, which was used to prepare the map
presented here, included texture metrics along with slope.
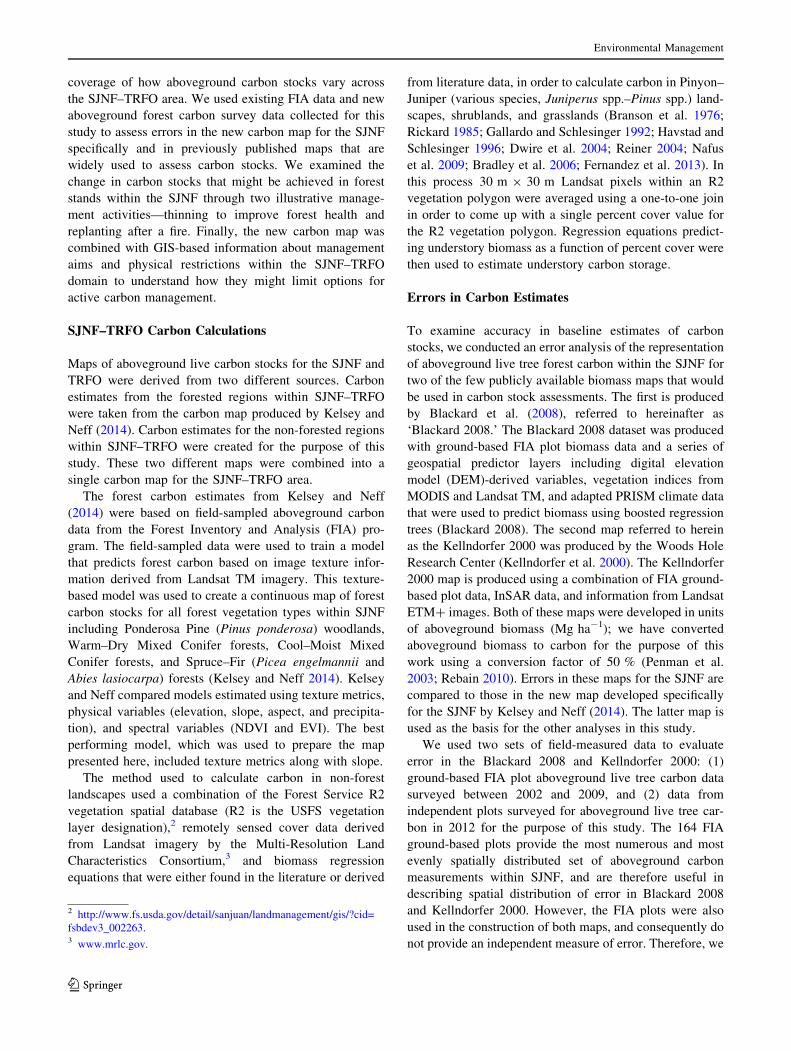
The method used to calculate carbon in non-forest
landscapes used a combination of the Forest Service R2
vegetation spatial database (R2 is the USFS vegetation
layer designation),2 remotely sensed cover data derived
from Landsat imagery by the Multi-Resolution Land
Characteristics Consortium,3 and biomass regression
equations that were either found in the literature or derived
from literature data, in order to calculate carbon in Pinyon–
Juniper (various species, Juniperus spp.–Pinus spp.) land-
scapes, shrublands, and grasslands (Branson et al. 1976;
Rickard 1985; Gallardo and Schlesinger 1992; Havstad and
Schlesinger 1996; Dwire et al. 2004; Reiner 2004; Nafus
et al. 2009; Bradley et al. 2006; Fernandez et al. 2013). In
this process 30 m 9 30 m Landsat pixels within an R2
vegetation polygon were averaged using a one-to-one join
in order to come up with a single percent cover value for
the R2 vegetation polygon. Regression equations predict-
ing understory biomass as a function of percent cover were
then used to estimate understory carbon storage.
Errors in Carbon Estimates
To examine accuracy in baseline estimates of carbon
stocks, we conducted an error analysis of the representation
of aboveground live tree forest carbon within the SJNF for
two of the few publicly available biomass maps that would
be used in carbon stock assessments. The first is produced
by Blackard et al. (2008), referred to hereinafter as
‘Blackard 2008.’ The Blackard 2008 dataset was produced
with ground-based FIA plot biomass data and a series of
geospatial predictor layers including digital elevation
model (DEM)-derived variables, vegetation indices from
MODIS and Landsat TM, and adapted PRISM climate data
that were used to predict biomass using boosted regression
trees (Blackard 2008). The second map referred to herein
as the Kellndorfer 2000 was produced by the Woods Hole
Research Center (Kellndorfer et al. 2000). The Kellndorfer
2000 map is produced using a combination of FIA ground-
based plot data, InSAR data, and information from Landsat
ETM? images. Both of these maps were developed in units
of aboveground biomass (Mg ha-1); we have converted
aboveground biomass to carbon for the purpose of this
work using a conversion factor of 50 % (Penman et al.
2003; Rebain 2010). Errors in these maps for the SJNF are
compared to those in the new map developed specifically
for the SJNF by Kelsey and Neff (2014). The latter map is
used as the basis for the other analyses in this study.
We used two sets of field-measured data to evaluate
error in the Blackard 2008 and Kellndorfer 2000: (1)
ground-based FIA plot aboveground live tree carbon data
surveyed between 2002 and 2009, and (2) data from
independent plots surveyed for aboveground live tree car-
bon in 2012 for the purpose of this study. The 164 FIA
ground-based plots provide the most numerous and most
evenly spatially distributed set of aboveground carbon
measurements within SJNF, and are therefore useful in
describing spatial distribution of error in Blackard 2008
and Kellndorfer 2000. However, the FIA plots were also
used in the construction of both maps, and consequently do
not provide an independent measure of error. Therefore, we
2 http://www.fs.usda.gov/detail/sanjuan/landmanagement/gis/?cid=
fsbdev3_002263.3 www.mrlc.gov.
Environmental Management
123
also evaluate error using a set of 25 independent ground-
based carbon measurements collected for the purpose of
this study. Error was evaluated by comparing the above-
ground carbon value predicted by the map to the measured
carbon value for each inventory plot location.
Absolute and relative error was calculated for both the
ground-based FIA plot data and the independent plots. The
absolute error in carbon storage was calculated as the dif-
ference between predicted and observed aboveground
carbon, and is reported in Mg C ha-1. An analysis of
variance (ANOVA) was used to test for differences in the
mean absolute and relative error between vegetation types
in the Blackard 2008 and Kellndorfer 2000 maps.
Errors in the carbon map produced by Kelsey and Neff
were determined by withholding 30 % of the inventory
plots during the model training process to serve as vali-
dation plots. The measured carbon value of each validation
plot was then compared to the predicted carbon values for
that location in order to derive an estimate of map error.
SJPL Management Zones Carbon Calculations
To characterize the decision context in the SJNF–TRFO,
we examined how existing features of the landscape and
vegetation patterns intersected with management objec-
tives to define where active carbon management was likely
to be an option. For this we superimposed GIS-based
aboveground carbon estimates with boundaries of areas
where certain activities are restricted by law, restrictive
features of the landscape such as steepness and access to
roads, and management zones that are designated in the
area’s forest and land management plan. GIS data defining
management area categories and plan criteria are available
at http://www.fs.usda.gov/detail/sanjuan/landmanagement/
planning/?cid=stelprdb5432707.
Interviews and Other Supporting Information
Qualitative interviews were conducted as supplementary
background to our analysis. In 2012 we conducted six
semi-structured interviews of land managers and technical
specialists of the SJNF–TRFO area including those who
make permitting decisions and those who support decisions
through technical analysis. We asked questions about the
key decisions made by the individuals, the tools used to
support those decisions, and whether carbon management
was considered. In order to investigate the use of FVS as a
tool for managing for carbon, in 2013 we also conducted
informal, semi-structured, interviews of 20 FVS users and
developers from both in and outside of the USFS. We
asked questions on how FVS is being used within the
organization, what users’ experience has been like in
applying FVS to estimate carbon balances on a regional
level, and what the limitations and opportunities for FVS
and other tools for carbon management were going to be.
These individuals were identified by their authorship of
papers in technical conferences focusing on the use of FVS,
with additional individuals identified through snowball
sampling (meaning that we asked each interviewee whether
there were additional experts on the use of FVS that we
should talk with). We relied on these interviews for sup-
plementary information on the context of the use of FVS.
We also reviewed documents for the region such as the
Forest Management Plans, FVS user guides, and technical
papers on the application of FVS.
Estimating Results of Example Management Actions
We used two hypothetical scenarios to estimate the mag-
nitude of changes in carbon stocks from management
actions that might typically be contemplated for forested
ecosystems within the SJNF–TRFO area. Changes are
projected for a 100-year time horizon. Both scenarios were
run using FVS, which is the tool most likely to be used for
such projections. Forest growth and the effects of wildfire
and management were modeled using the Central Rockies
variant of FVS (Dixon 2002) and the Fire and Fuels
Extension (FFE; Rebain 2010). The scenarios were con-
structed using default growth equations, as might be done
for a preliminary screening assessment. More adjustments
to the model would likely be made if FVS was used to help
secure credits for carbon sequestration.
Scenario 1 examined the effects of varying scenarios of
forest thinning on the forest carbon stocks of 18 stands
within Ponderosa Pine and Warm–Dry Mixed Conifer
vegetation types in the Fossett Gulch area, which is in the
southern part of the SJNF. Projected carbon stocks were
evaluated under four management options: (1) all stands
are thinned to a basal area of 60 ft2 per acre
(13.77 m2 ha-1) in 2015, (2) all stands are thinned to a
basal area of 70 ft2 per acre (16.07 m2 ha-1) in 2015, (3)
all stands are thinned to a basal area of 80 ft2 per acre
(18.37 m2 ha-1) in 2015, and (4) a scenario of no thinning.
The initial forest condition for Scenario 1 was determined
using Forest Service Common Stand Exam plots obtained
from SJNF staff. Effects of forest thinning were modeled
using the ‘thin from below’ function in FVS, which will
remove trees from the stand starting with the smallest
diameter trees, until the stand reaches the desired basal
area. Scenario 2 investigated the carbon balance of a
spruce–fir forest following a wildfire in 2010 with two
scenarios of post-fire regeneration—one scenario with only
natural regeneration of conifers following the fire, and a
second with a planting of 300 spruce trees per acre (ap-
proximately 742 per hectare) 5 years after the fire. For the
wildfire scenario, we modeled the effect of fire under
Environmental Management
123
hazardous fire conditions including 35 mph (56 km h-1)
wind, 85 �F (29.4 �C) air temperature, and the ‘very dry’
default fuel moisture content level within FVS–FFE. FVS–
FFE was used to predict mortality following this fire.
Results
Estimating Aboveground Carbon Stocks in SJNF–
TRFO
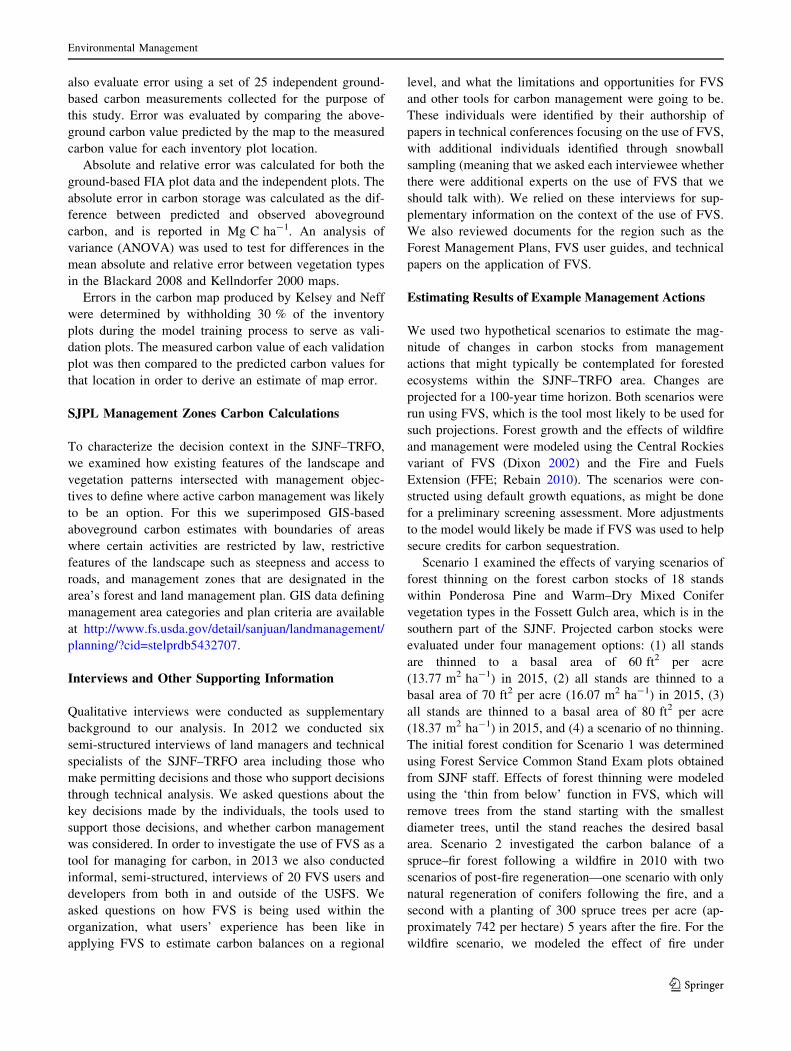
Figure 1 shows aboveground carbon (Mg C ha-1) on
public lands in the SJNF and TRFO units. Ninety-seven
percent of the carbon is on forested units, with the
remainder on non-forested grass and shrublands. As dis-
cussed in more detail by Kelsey and Neff (2014), above-
ground carbon in the SJNF unit generally increases with
elevation. Kelsey and Neff (2014) estimate the correlation
of predicted versus observed carbon values for the SJNF
portion of the map which is r = 0.86 and the RMSE is
22.8 Mg C ha-1. For comparison, the mean aboveground
carbon observed in FIA plots within the SJNF is
67.4 Mg C ha-1. Kelsey and Neff found that incorporation
of Landsat TM-derived texture information improved the
ability of their model to capture changes in aboveground
forest carbon after disturbance.
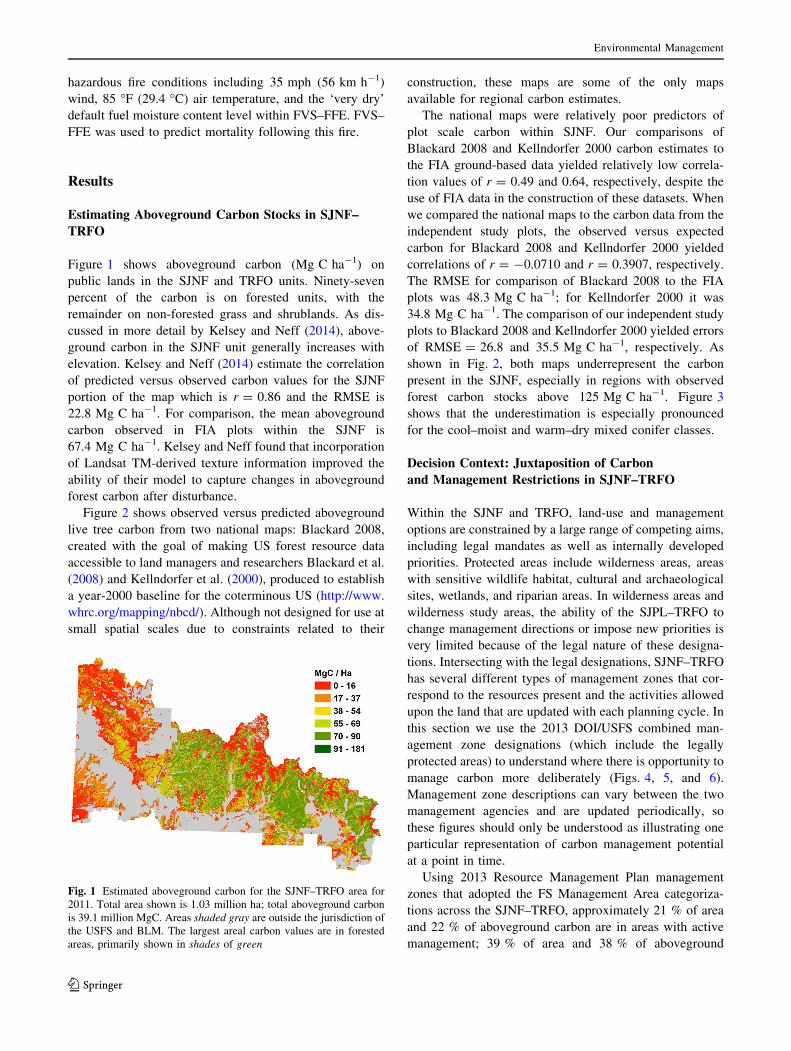
Figure 2 shows observed versus predicted aboveground
live tree carbon from two national maps: Blackard 2008,
created with the goal of making US forest resource data
accessible to land managers and researchers Blackard et al.
(2008) and Kellndorfer et al. (2000), produced to establish
a year-2000 baseline for the coterminous US (http://www.
whrc.org/mapping/nbcd/). Although not designed for use at
small spatial scales due to constraints related to their
construction, these maps are some of the only maps
available for regional carbon estimates.
The national maps were relatively poor predictors of
plot scale carbon within SJNF. Our comparisons of
Blackard 2008 and Kellndorfer 2000 carbon estimates to
the FIA ground-based data yielded relatively low correla-
tion values of r = 0.49 and 0.64, respectively, despite the
use of FIA data in the construction of these datasets. When
we compared the national maps to the carbon data from the
independent study plots, the observed versus expected
carbon for Blackard 2008 and Kellndorfer 2000 yielded
correlations of r = -0.0710 and r = 0.3907, respectively.
The RMSE for comparison of Blackard 2008 to the FIA
plots was 48.3 Mg C ha-1; for Kellndorfer 2000 it was
34.8 Mg C ha-1. The comparison of our independent study
plots to Blackard 2008 and Kellndorfer 2000 yielded errors
of RMSE = 26.8 and 35.5 Mg C ha-1, respectively. As
shown in Fig. 2, both maps underrepresent the carbon
present in the SJNF, especially in regions with observed
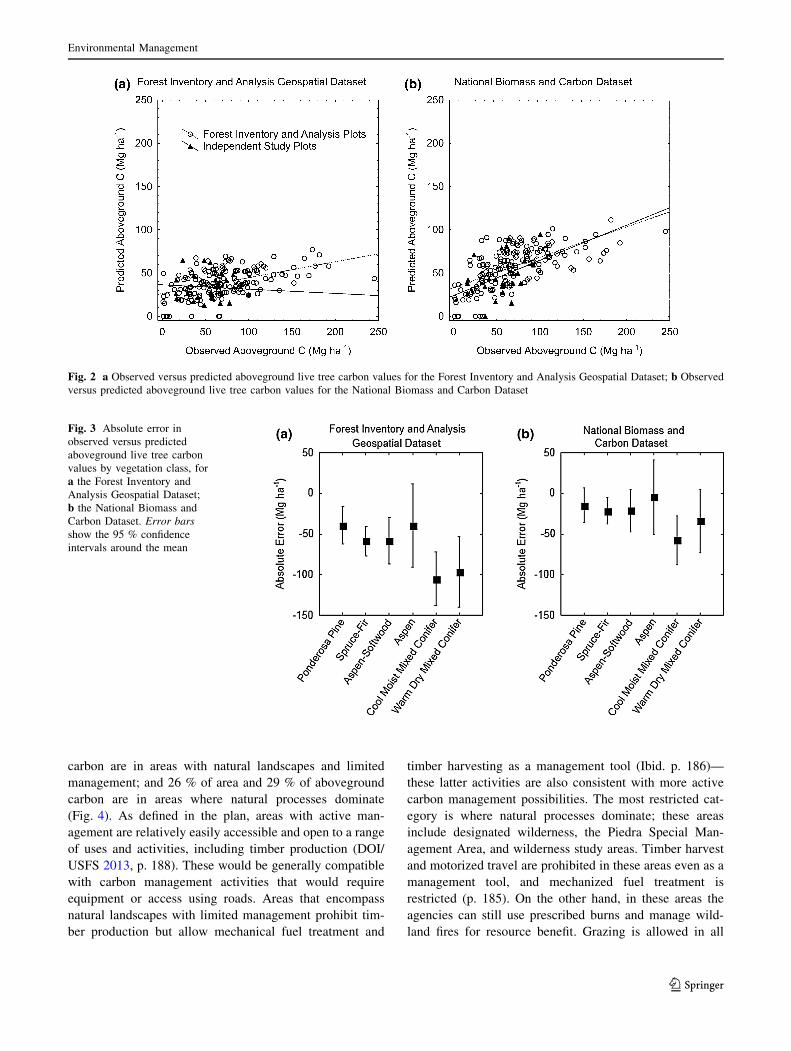
forest carbon stocks above 125 Mg C ha-1. Figure 3
shows that the underestimation is especially pronounced
for the cool–moist and warm–dry mixed conifer classes.
Decision Context: Juxtaposition of Carbon
and Management Restrictions in SJNF–TRFO
Within the SJNF and TRFO, land-use and management
options are constrained by a large range of competing aims,
including legal mandates as well as internally developed
priorities. Protected areas include wilderness areas, areas
with sensitive wildlife habitat, cultural and archaeological
sites, wetlands, and riparian areas. In wilderness areas and
wilderness study areas, the ability of the SJPL–TRFO to
change management directions or impose new priorities is
very limited because of the legal nature of these designa-
tions. Intersecting with the legal designations, SJNF–TRFO
has several different types of management zones that cor-
respond to the resources present and the activities allowed
upon the land that are updated with each planning cycle. In
this section we use the 2013 DOI/USFS combined man-
agement zone designations (which include the legally
protected areas) to understand where there is opportunity to
manage carbon more deliberately (Figs. 4, 5, and 6).
Management zone descriptions can vary between the two
management agencies and are updated periodically, so
these figures should only be understood as illustrating one
particular representation of carbon management potential
at a point in time.
Using 2013 Resource Management Plan management
zones that adopted the FS Management Area categoriza-
tions across the SJNF–TRFO, approximately 21 % of area
and 22 % of aboveground carbon are in areas with active
management; 39 % of area and 38 % of aboveground
Fig. 1 Estimated aboveground carbon for the SJNF–TRFO area for
2011. Total area shown is 1.03 million ha; total aboveground carbon
is 39.1 million MgC. Areas shaded gray are outside the jurisdiction of
the USFS and BLM. The largest areal carbon values are in forested
areas, primarily shown in shades of green
Environmental Management
123
carbon are in areas with natural landscapes and limited
management; and 26 % of area and 29 % of aboveground
carbon are in areas where natural processes dominate
(Fig. 4). As defined in the plan, areas with active man-
agement are relatively easily accessible and open to a range
of uses and activities, including timber production (DOI/
USFS 2013, p. 188). These would be generally compatible
with carbon management activities that would require
equipment or access using roads. Areas that encompass
natural landscapes with limited management prohibit tim-
ber production but allow mechanical fuel treatment and
timber harvesting as a management tool (Ibid. p. 186)—
these latter activities are also consistent with more active
carbon management possibilities. The most restricted cat-
egory is where natural processes dominate; these areas
include designated wilderness, the Piedra Special Man-
agement Area, and wilderness study areas. Timber harvest
and motorized travel are prohibited in these areas even as a
management tool, and mechanized fuel treatment is
restricted (p. 185). On the other hand, in these areas the
agencies can still use prescribed burns and manage wild-
land fires for resource benefit. Grazing is allowed in all
Fig. 2 a Observed versus predicted aboveground live tree carbon values for the Forest Inventory and Analysis Geospatial Dataset; b Observed
versus predicted aboveground live tree carbon values for the National Biomass and Carbon Dataset
Fig. 3 Absolute error in
observed versus predicted
aboveground live tree carbon
values by vegetation class, for
a the Forest Inventory and
Analysis Geospatial Dataset;
b the National Biomass and
Carbon Dataset. Error bars
show the 95 % confidence
intervals around the mean
Environmental Management
123
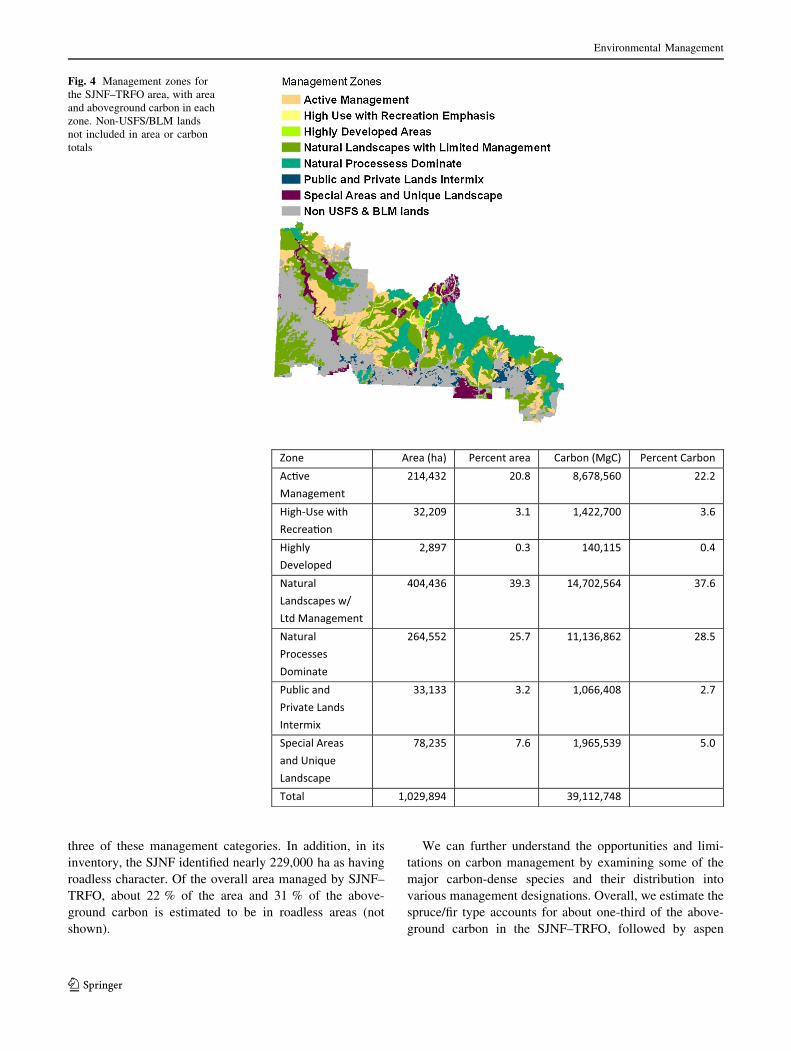
three of these management categories. In addition, in its
inventory, the SJNF identified nearly 229,000 ha as having
roadless character. Of the overall area managed by SJNF–
TRFO, about 22 % of the area and 31 % of the above-
ground carbon is estimated to be in roadless areas (not
shown).
We can further understand the opportunities and limi-
tations on carbon management by examining some of the
major carbon-dense species and their distribution into
various management designations. Overall, we estimate the
spruce/fir type accounts for about one-third of the above-
ground carbon in the SJNF–TRFO, followed by aspen
Zone Area (ha) Percent area Carbon (MgC) Percent Carbon Ac�ve Management
214,432 20.8 8,678,560 22.2
High-Use with Recrea�on
32,209 3.1 1,422,700 3.6
Highly Developed
2,897 0.3 140,115 0.4
Natural Landscapes w/ Ltd Management
404,436 39.3 14,702,564 37.6
Natural Processes Dominate
264,552 25.7 11,136,862 28.5
Public and Private Lands Intermix
33,133 3.2 1,066,408 2.7
Special Areas and Unique Landscape
78,235 7.6 1,965,539 5.0
Total 1,029,894 39,112,748
Fig. 4 Management zones for
the SJNF–TRFO area, with area
and aboveground carbon in each
zone. Non-USFS/BLM lands
not included in area or carbon
totals
Environmental Management
123
(Populus tremuloides)/conifer, ponderosa pine, cool–moist
mixed forest, and pinyon/juniper at 13–14 % each. How-
ever, much of the spruce/fir forest is in areas where natural
processes are to dominate. For the active management
zones, ponderosa pine accounts for the largest share of
aboveground carbon at about 29 %, followed by spruce/fir
at 26 %, and aspen/conifer at 15 % (not shown).
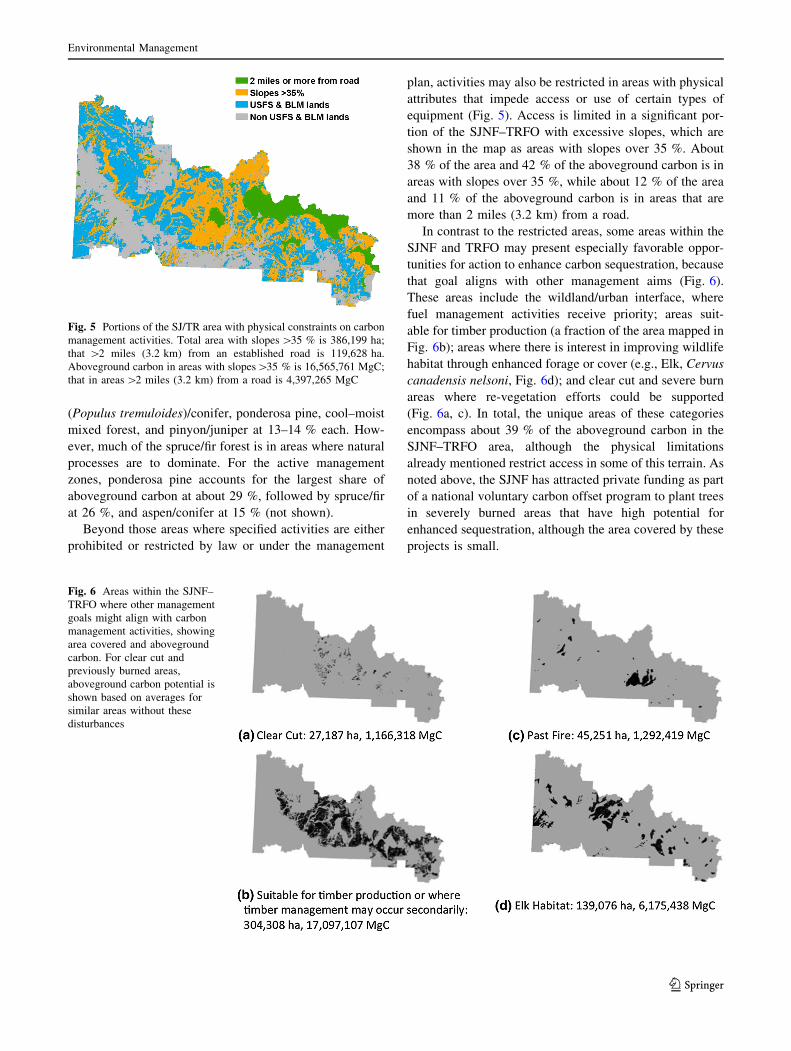
Beyond those areas where specified activities are either
prohibited or restricted by law or under the management
plan, activities may also be restricted in areas with physical
attributes that impede access or use of certain types of
equipment (Fig. 5). Access is limited in a significant por-
tion of the SJNF–TRFO with excessive slopes, which are
shown in the map as areas with slopes over 35 %. About
38 % of the area and 42 % of the aboveground carbon is in
areas with slopes over 35 %, while about 12 % of the area
and 11 % of the aboveground carbon is in areas that are
more than 2 miles (3.2 km) from a road.
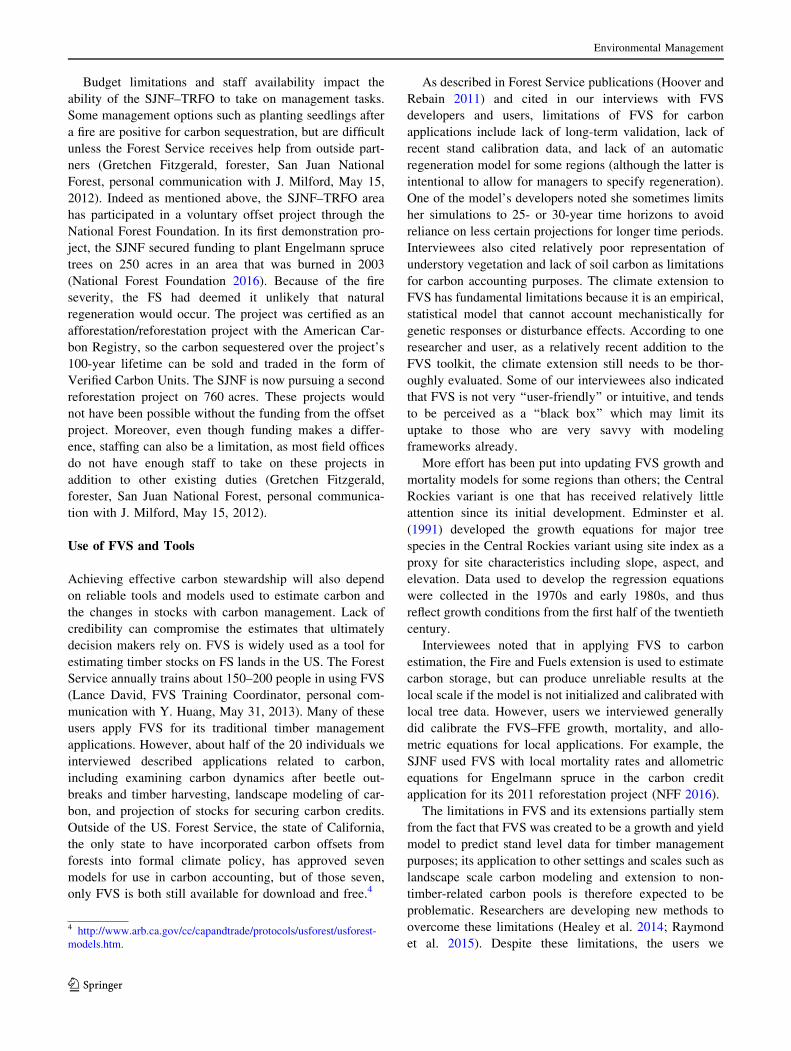
In contrast to the restricted areas, some areas within the
SJNF and TRFO may present especially favorable oppor-
tunities for action to enhance carbon sequestration, because
that goal aligns with other management aims (Fig. 6).
These areas include the wildland/urban interface, where
fuel management activities receive priority; areas suit-
able for timber production (a fraction of the area mapped in
Fig. 6b); areas where there is interest in improving wildlife
habitat through enhanced forage or cover (e.g., Elk, Cervus
canadensis nelsoni, Fig. 6d); and clear cut and severe burn
areas where re-vegetation efforts could be supported
(Fig. 6a, c). In total, the unique areas of these categories
encompass about 39 % of the aboveground carbon in the
SJNF–TRFO area, although the physical limitations
already mentioned restrict access in some of this terrain. As
noted above, the SJNF has attracted private funding as part
of a national voluntary carbon offset program to plant trees
in severely burned areas that have high potential for
enhanced sequestration, although the area covered by these
projects is small.
Fig. 5 Portions of the SJ/TR area with physical constraints on carbon
management activities. Total area with slopes[35 % is 386,199 ha;
that [2 miles (3.2 km) from an established road is 119,628 ha.
Aboveground carbon in areas with slopes[35 % is 16,565,761 MgC;
that in areas[2 miles (3.2 km) from a road is 4,397,265 MgC
Fig. 6 Areas within the SJNF–
TRFO where other management
goals might align with carbon
management activities, showing
area covered and aboveground
carbon. For clear cut and
previously burned areas,
aboveground carbon potential is
shown based on averages for
similar areas without these
disturbances
Environmental Management
123
Budget limitations and staff availability impact the
ability of the SJNF–TRFO to take on management tasks.
Some management options such as planting seedlings after
a fire are positive for carbon sequestration, but are difficult
unless the Forest Service receives help from outside part-
ners (Gretchen Fitzgerald, forester, San Juan National
Forest, personal communication with J. Milford, May 15,
2012). Indeed as mentioned above, the SJNF–TRFO area
has participated in a voluntary offset project through the
National Forest Foundation. In its first demonstration pro-
ject, the SJNF secured funding to plant Engelmann spruce
trees on 250 acres in an area that was burned in 2003
(National Forest Foundation 2016). Because of the fire
severity, the FS had deemed it unlikely that natural
regeneration would occur. The project was certified as an
afforestation/reforestation project with the American Car-
bon Registry, so the carbon sequestered over the project’s
100-year lifetime can be sold and traded in the form of
Verified Carbon Units. The SJNF is now pursuing a second
reforestation project on 760 acres. These projects would
not have been possible without the funding from the offset
project. Moreover, even though funding makes a differ-
ence, staffing can also be a limitation, as most field offices
do not have enough staff to take on these projects in
addition to other existing duties (Gretchen Fitzgerald,
forester, San Juan National Forest, personal communica-
tion with J. Milford, May 15, 2012).
Use of FVS and Tools
Achieving effective carbon stewardship will also depend
on reliable tools and models used to estimate carbon and
the changes in stocks with carbon management. Lack of
credibility can compromise the estimates that ultimately
decision makers rely on. FVS is widely used as a tool for
estimating timber stocks on FS lands in the US. The Forest
Service annually trains about 150–200 people in using FVS
(Lance David, FVS Training Coordinator, personal com-
munication with Y. Huang, May 31, 2013). Many of these
users apply FVS for its traditional timber management
applications. However, about half of the 20 individuals we
interviewed described applications related to carbon,
including examining carbon dynamics after beetle out-
breaks and timber harvesting, landscape modeling of car-
bon, and projection of stocks for securing carbon credits.
Outside of the US. Forest Service, the state of California,
the only state to have incorporated carbon offsets from
forests into formal climate policy, has approved seven
models for use in carbon accounting, but of those seven,
only FVS is both still available for download and free.4
As described in Forest Service publications (Hoover and
Rebain 2011) and cited in our interviews with FVS
developers and users, limitations of FVS for carbon
applications include lack of long-term validation, lack of
recent stand calibration data, and lack of an automatic
regeneration model for some regions (although the latter is
intentional to allow for managers to specify regeneration).
One of the model’s developers noted she sometimes limits
her simulations to 25- or 30-year time horizons to avoid
reliance on less certain projections for longer time periods.
Interviewees also cited relatively poor representation of
understory vegetation and lack of soil carbon as limitations
for carbon accounting purposes. The climate extension to
FVS has fundamental limitations because it is an empirical,
statistical model that cannot account mechanistically for
genetic responses or disturbance effects. According to one
researcher and user, as a relatively recent addition to the
FVS toolkit, the climate extension still needs to be thor-
oughly evaluated. Some of our interviewees also indicated
that FVS is not very ‘‘user-friendly’’ or intuitive, and tends
to be perceived as a ‘‘black box’’ which may limit its
uptake to those who are very savvy with modeling
frameworks already.
More effort has been put into updating FVS growth and
mortality models for some regions than others; the Central
Rockies variant is one that has received relatively little
attention since its initial development. Edminster et al.
(1991) developed the growth equations for major tree
species in the Central Rockies variant using site index as a
proxy for site characteristics including slope, aspect, and
elevation. Data used to develop the regression equations
were collected in the 1970s and early 1980s, and thus
reflect growth conditions from the first half of the twentieth
century.
Interviewees noted that in applying FVS to carbon
estimation, the Fire and Fuels extension is used to estimate
carbon storage, but can produce unreliable results at the
local scale if the model is not initialized and calibrated with
local tree data. However, users we interviewed generally
did calibrate the FVS–FFE growth, mortality, and allo-
metric equations for local applications. For example, the
SJNF used FVS with local mortality rates and allometric
equations for Engelmann spruce in the carbon credit
application for its 2011 reforestation project (NFF 2016).
The limitations in FVS and its extensions partially stem
from the fact that FVS was created to be a growth and yield
model to predict stand level data for timber management
purposes; its application to other settings and scales such as
landscape scale carbon modeling and extension to non-
timber-related carbon pools is therefore expected to be
problematic. Researchers are developing new methods to
overcome these limitations (Healey et al. 2014; Raymond
et al. 2015). Despite these limitations, the users we
4 http://www.arb.ca.gov/cc/capandtrade/protocols/usforest/usforest-
models.htm.
Environmental Management
123
contacted expected the tool to continue to be widely used
for the established purposes such as estimation of timber
yields and new purposes like assessment of carbon storage
dynamics, in part because of its widespread use and
acceptance, the model’s record of calibration over the past
30 years, and lack of an established alternative that pro-
vides better results. The researchers developing the USFS
ForCaMF tool considered other models for projecting
carbon growth, but concluded that FVS was the best option
(Sean Healey and Crystal Raymond, Rocky Mountain
Research Station, personal communication with Y. Huang,
March 26, 2013). At the SJNF–TRFO office there are only
a few individuals who are trained and experienced in
running FVS, and it is unlikely given the workload that
they would want to take on a completely different tool for
carbon assessments when they would still need to run FVS
for other purposes.
Illustrative Results of Carbon Management
Activities in the SJNF–TRFO
Carbon accounting is accomplished through comparison of
proposed activities to a baseline, often generated through a
model as described above. It is beyond the knowledge of
carbon stocks, therefore, land managers need information
on the projected carbon storage effects of alternative
actions in order to assess carbon management potential. To
illustrate the magnitude of carbon storage changes that
might be affected by management alternatives in the
SJNF–TRFO area, we applied the FVS model to two sce-
narios, one involving thinning in stands of ponderosa pine
and warm–dry mixed conifer; and one involving replanting
of Engelmann spruce trees after a fire.
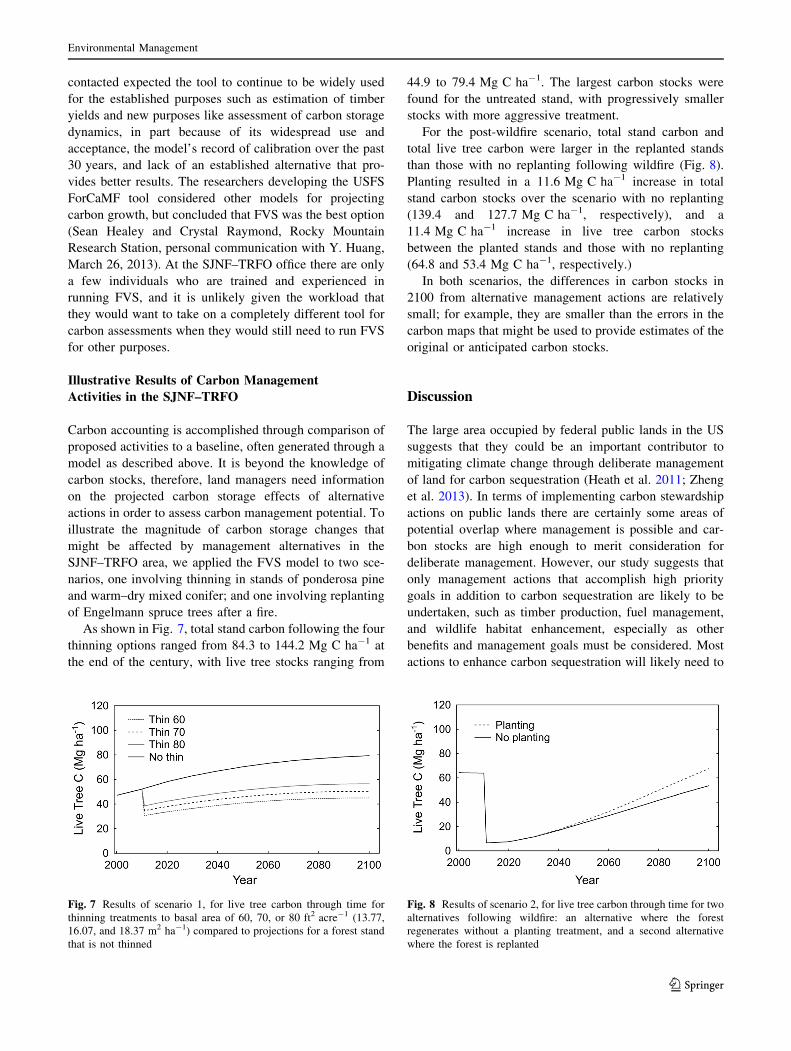
As shown in Fig. 7, total stand carbon following the four
thinning options ranged from 84.3 to 144.2 Mg C ha-1 at
the end of the century, with live tree stocks ranging from
44.9 to 79.4 Mg C ha-1. The largest carbon stocks were
found for the untreated stand, with progressively smaller
stocks with more aggressive treatment.
For the post-wildfire scenario, total stand carbon and
total live tree carbon were larger in the replanted stands
than those with no replanting following wildfire (Fig. 8).
Planting resulted in a 11.6 Mg C ha-1 increase in total
stand carbon stocks over the scenario with no replanting
(139.4 and 127.7 Mg C ha-1, respectively), and a
11.4 Mg C ha-1 increase in live tree carbon stocks
between the planted stands and those with no replanting
(64.8 and 53.4 Mg C ha-1, respectively.)
In both scenarios, the differences in carbon stocks in
2100 from alternative management actions are relatively
small; for example, they are smaller than the errors in the
carbon maps that might be used to provide estimates of the
original or anticipated carbon stocks.
Discussion
The large area occupied by federal public lands in the US
suggests that they could be an important contributor to
mitigating climate change through deliberate management
of land for carbon sequestration (Heath et al. 2011; Zheng
et al. 2013). In terms of implementing carbon stewardship
actions on public lands there are certainly some areas of
potential overlap where management is possible and car-
bon stocks are high enough to merit consideration for
deliberate management. However, our study suggests that
only management actions that accomplish high priority
goals in addition to carbon sequestration are likely to be
undertaken, such as timber production, fuel management,
and wildlife habitat enhancement, especially as other
benefits and management goals must be considered. Most
actions to enhance carbon sequestration will likely need to
Fig. 7 Results of scenario 1, for live tree carbon through time for
thinning treatments to basal area of 60, 70, or 80 ft2 acre-1 (13.77,
16.07, and 18.37 m2 ha-1) compared to projections for a forest stand
that is not thinned
Fig. 8 Results of scenario 2, for live tree carbon through time for two
alternatives following wildfire: an alternative where the forest
regenerates without a planting treatment, and a second alternative
where the forest is replanted
Environmental Management
123
be a part of these existing management foci. Our case study
found that even the most effective land management option
that is clearly carbon positive, i.e., revegetating after a fire,
is also costly in terms of both money and staff time, implies
difficult choices for staff considering actions with less
well-known outcomes for carbon storage such as pre-
scribed burning or mechanical thinning.
Unless additional resources are allocated, the ability to
create a baseline assessment of carbon stocks will likely
depend on their existing resources such as staff capacity
and access to tools and datasets. Forest Service units may
not have unit-specific tools or data to accomplish the
Scorecard reporting requirements they are being asked to
fulfill. The Forest Carbon Management Framework being
developed to support future Scorecard assessments will
combine FVS simulations of carbon dynamics with FIA
data and remote sensing of land cover changes and dis-
turbances (USFS 2011). It is therefore reasonable to
assume that most National Forests will rely on FIA data
and FVS to fulfill this requirement at least for now. The
Forest Service is actively researching tools and methods to
support carbon accounting,5 and is conducting annual
assessments to track participation in the Scorecard across
its field offices.6 Undoubtedly these research projects and
assessments will contribute to an evolution of the Score-
card over time.
We find from this case study that using existing national
biomass maps based on Blackard et al. (2008) and Kell-
ndorfer et al. (2000) to estimate aboveground carbon stocks
in the SJNF–TRFO local area tends to underestimate car-
bon stocks in the region. This underestimation tendency
has been identified previously, due in part to the saturation
of reflectance values in regions of high biomass and
complex forest canopies (Blackard et al. 2008). As dis-
cussed in more detail by Kelsey and Neff (2014), including
image texture information appears to be a viable approach
for improving aboveground forest carbon estimates. How-
ever, most Forest Service units do not have the personnel or
computational resources to create these carbon maps on
their own.
Our study showed substantial errors for estimating car-
bon stocks at the Forest and Field Office level. Errors in
estimating baseline stocks of the magnitude seen with the
national maps could have substantial effects on regional
applications, not only in assessing regional carbon stocks
but also for informing land management decisions and
calculating emissions from past or future disturbance.
These errors tend to swamp the differences achieved by
alternative management strategies as modeled for the
SJNF–TRFO region. These errors contribute another
source of uncertainty to estimating the effect of manage-
ment strategies on carbon in addition to those introduced
by vegetation type, age of stand, methods of management,
land history, climate, and time frame over which carbon
implications are estimated (Hurteau et al. 2008; Hurteau
and North 2010; Reinhardt and Holsinger 2010; Kelsey
et al. 2014). In addition, because the errors are not evenly
distributed across species, and are greater for certain tree
ecosystems (in our study, cool–moist mixed conifer and
warm–dry mixed conifer), systematic biases in estimation
could grow as tree species shift in distribution or numbers
with climate change, landscape-changing fires, and pest
disturbances. This highlights the importance of accurate,
regionally specific data, and tools for estimating both car-
bon baselines and the impact of management strategies. It
also highlights the need for growth projection tools to
incorporate future climate change scenarios (Rehfeldt et al.
2012).
As recognized by FVS users and developers, the mod-
el’s limitations highlight the importance of using local
stand measurements to both initialize and calibrate FVS
(as outlined in Vandendriesche 2010) and other growth
projection models in assessing the benefit of proposed
management actions. Ongoing efforts to improve FVS and
its carbon and climate extensions will enhance the accuracy
and usability of these tools over time. Furthermore, the
widespread use of FVS and lack of funding for capacity
building, training, and maintenance of alternative tools are
barriers to adoption of alternative models of carbon and
climate dynamics. For the time being, despite the
acknowledged deficiencies in FVS, it may be a ‘‘good
enough’’ tool for a relative assessment of carbon opportu-
nities, especially if used in conjunction with other GIS
layers that can provide targets of opportunity for compat-
ible management objectives. Nevertheless, due to funda-
mental limitations with FVS and its climate extension,
including reliance on empirical relationships that may
become obsolete as conditions change, research into more
mechanistically based projection models should remain a
priority.
In the meantime, estimates of local contributions to
national-scale inventories or assessments of carbon man-
agement potential should be treated with caution, as
nationally available tools have limited accuracy for
assessing local carbon stocks or responses. Cash and Moser
(2000) have pointed out the difficulty of applying scientific
information generated for use at one scale to a different
scale—this is often a problem in the application of down-
scaled climate models to local hydrology for use in deci-
sion making, for example (Fowler et al. 2007). Moreover,
datasets and tools can be validated at a coarse scale, but
5 http://www.fs.fed.us/climatechange/advisor/scorecard/carbon-
assessment-stewardship.html.6 http://www.fs.fed.us/climatechange/updates/October%202014%
20Climate%20Update.pdf.
Environmental Management
123
this may mask errors at the local scale that are not
detectable when results are averaged across larger regions.
This points to the necessity of testing and evaluating tools
at the intended scale of use to ensure that they are robust at
that scale.
Because of this region’s unique characteristics, the
results of this case study may not hold elsewhere although
similar categories of questions about the technical and
management details needed to implement the Scorecard are
likely to be relevant. A case study in the Pacific Northwest,
for example, where carbon stocks are much higher per unit
area may yield a much different result.
Finally our case study of the SJNF–TRFO suggests that
future research should focus on the conditions under which
it makes sense to invest in refining measurement strategies
to reduce uncertainty in baseline carbon measurements and
improve understanding about how management activities
affect carbon stocks. In multi-use areas such as the SJNF–
TRFO, overlaying maps of management zones, biophysical
information, and carbon can help identify locations and
types of vegetation where improved information about
stocks and dynamics are most likely to influence decisions.
The cost of acquiring new information in terms of research
expenditures, staff time, and equipment availability will
need to be weighed against the value of that information in
decision making, and the alternatives available for the
same potential climate mitigation benefit.
Acknowledgments This research was supported by USDA NIFA
Award COLW-2011-00831. We are grateful to the staff of San Juan
National Forest and the Tres Rios Field Office of the Bureau of Land
Management for their assistance. Quotes from agency personnel do not
necessarily represent the views of the agency that employs them. All
findings and interpretation are the sole responsibility of the authors.
References
Blackard J, Finco M, Helmer E, Holden G, Hoppus M, Jacobs D,
Lister A, Moisen G, Nelson M, Reimann R (2008) Mapping US
forest biomass using nationwide forest inventory data and
moderate resolution information. Remote Sens Environ
112(4):1658–1677. doi:10.1016/j.rse.2007.08.021
Bradley BA, Houghton RA, Mustard JF, Hamburg SP (2006) Invasive
grass reduces aboveground carbon stocks and shrublands of the
western US. Glob Change Biol 12:1815–1822. doi:10.111/j.365-
2486.2006.-1232.x
Branson FA, Miller RF, McQueen IS (1976) Moisture relationship in
twelve northern deser shrub communities near Grand Junction,
Colorado. Ecology 57(6):1104–1124
Cash DW, Moser SC (2000) Linking global and local scales:
designing dynamic assessment and management processes. Glob
Environ Change 10:109–120
Chave J, Condit R,Aguilar S,HernandezA, Lao S, PerezR (2004) Error
propagation and scaling for tropical forest biomass estimates.
Philos Trans R Soc Lond B Biol Sci 359(1443):409–420. doi:10.
1098/rstb.2003.1425
Crookston NL, Dixon GE (2005) The forest vegetation simulator: a
review of its structure, content, and applications. Comput
Electron Agric 49(1):60–80. doi:10.1016/j.compag.2005.02.003
Crookston NL, Rehfeldt GE, Dixon GE, Weiskittel AR (2010)
Addressing climate change in the forest vegetation simulator to
assess impacts on landscape forest dynamics. For Ecol Manag
260(7):1198–1211
Cutler MEJ, Boyd DS, Foody GM, Vetrivel A (2012) Estimating
tropical forest biomass with a combination of SAR image texture
and Landsat TM data: an assessment of predictions between
regions. ISPRS J Photogramm Remote Sens 70:66–77. doi:10.
1016/j.isprsjprs.2012.03.011
Dilling L, Failey E (2013) Managing carbon in a multiple use world:
the implications of land-use decision context for carbon man-
agement. Glob Environ Change 23:291–300. doi:10.1016/j.
gloenvcha.2012.10.012
Dilling L, Lemos MC (2011) Creating usable science: opportunities
and constraints for climate knowledge use and their implications
for science policy. Glob Environ Change 21:680–689. doi:10.
1016/j.gloenvcha.2010.11.006
Dilling L, Birdsey R, Pan Y (2013) Opportunities and challenges for
carbon management on US public lands. In: Brown D, Robinson
D, French N, Reed B (eds) Land use and the carbon cycle.
Cambridge University Press, Cambridge, pp 455–476
Dixon GE (2002) Essential FVS: a user’s guide to the forest
vegetation simulator. US Department of Agriculture, Forest
Service, Forest Management Service Center, Fort Collins
(revised 2011)
DOI/USFS (2013) Final San Juan National Forest and Proposed Tres
Rios Field Office Land and Resource Management Plan. US
Department of Interior, Bureau of Land Management, Colorado
Southwest District, Tres Rios Field Office, and US Department
of Agriculture, US Forest Service Region 2, San Juan National
Forest, September
Dubayah RO, Drake JB (2000) Lidar remote sensing for forestry.
J For 98(6):44–46
Dwire KA, Kauffman JB, Brookshire ENJ, Bahan JE (2004) Plant
biomass and species composition along an environmental
gradient in montane riparian meadows. Oecologia
139(2):309–317. doi:10.1007/s00442-004-1498-2
Edminster CB, Mowrer HT, Mathiasen RL, Schuler TM, Olsen WK,
Hawksworth FG (1991) GENGYM: a variable density stand
table projection system calibrated for mixed conifer and
ponderosa pine stands in the southwest. In: Research Paper
RM-297. USDA Forest Service, Rocky Mountain Forest and
Range Experiment Station, Fort Collins, p 32
Ellenwood MS, Dilling L, Milford JB (2012) Managing United States
public lands in response to climate change: a view from the
ground up. Environ Manag 49:954–967. doi:10.1007/s00267-
012-9829-2
Failey E, Dilling L (2010) Carbon stewardship: land management
decisions and the potential for carbon sequestration in Colorado,
USA. Environ Res Lett 5(2):1–8
Fernandez DP, Neff JC, Huang C, Asner GP, Barger NB (2013)
Twentieth century carbon stock changes related to Pinon–Juniper
expansion into a black sagebrush community. Carbon Balance
Manag. doi:10.1186/1750-0680-8-8
Fowler HJ, Blenkinsop S, Tebaldi C (2007) Linking climate change
modelling to impacts studies: recent advances in downscaling
techniques for hydrological modelling. Int J Climatol
27(12):1547–1578. doi:10.1002/joc.1556
Galik CS, Mobley ML, de Richter D (2009) A virtual ‘field test’ of
forest management carbon offset protocols: the influence of
accounting. Mitig Adapt Strateg Glob Change 14(7):677–690.
doi:10.1007/s11027-009-9190-9
Environmental Management
123
Gallardo A, Schlesinger WH (1992) Carbon and nitrogen limitations
of soil microbial biomass in desertecosystems. Biogeochemistry
18:1–17
Goetz SJ, Baccini A, Laporte NT, Johns T, Walker W, Kellndorfer J
et al (2009) Mapping and monitoring carbon stocks with satellite
observations: a comparison of methods. Carbon Balance Manag
4(1):2. doi:10.1186/1750-0680-4-2
Havstad KM, Schlesinger WH (1996) Reflections on a century of
rangeland research in the Jornada basin of New Mexico. In:
Barrow JR, McArthur ED, Sosebee RE, Tausch RJ (eds)
Proceedings: symposium on shrubland ecosystem dynamics in
a changing environment. US Department of Agriculture, Forest
Service, Intermountain Research Station, Ogden, pp 10–15
Healey SP, Urbanski SP, Patterson PL, Garrard C (2014) A
framework for simulating map error in ecosystem models.
Remote Sens Environ 150:207–217. doi:10.1016/j.rse.2014.04.
028
Heath LS, Smith JE, Woodall CW, Azuma DL, Waddell KL (2011)
Carbon stocks on forestland of the United States, with emphasis
on USDA Forest Service ownership. Ecosphere. doi:10.1890/
ES10-00126.1
Hoover CM, Rebain SA (2011) Forest carbon estimation using the
Forest Vegetation simulator: seven things you need to know.
General Technical Report NRS-77. US Department of Agricul-
ture, Forest Service, Northern Research Station, Newtown
Square
Huete AR, van Leeuwen WJD (1997) The use of vegetation indices in
forested regions: issues of linearity and saturation. In:
IGARSS’97. 1997 IEEE International Geoscience and Remote
Sensing Symposium Proceedings. Remote Sensing-A Scientific
Vision for Sustainable Development, vol. 4, pp. 1966–1968.
IEEE. doi:10.1109/IGARSS.1997.609169
Hurteau MD, North M (2010) Carbon recovery rates following
different wildfire risk mitigation treatments. For Ecol Manag
260:930–937. doi:10.1016/j.foreco.2010.06.015
Hurteau MD, Koch GW, Hungate BA (2008) Carbon protection and
fire risk reduction: toward a full accounting of forest carbon
offsets. Front Ecol Environ 6:493–498. doi:10.1890/070187
Kasischke ES, Melack JM, Dobson CM (1997) The use of imaging
radars for ecological applications—a review. Remote Sens
Environ 59(2):141–156. http://www.sciencedirect.com/science/
article/pii/S0034425796001484
Kellndorfer J, Walker W, LaPoint E, Bishop J, Cormier T, Fiske G,
Hoppus M, Kirsh K, Westfall J (2000) NACP aboveground
biomass and carbon baseline data. Data Set. Available at: http://
daac.ornl.gov/NACP/guides/NBCD_2000.html. Accessed 4 June
2016
Kelsey KC, Neff JC (2014) Estimates of aboveground biomass from
texture analysis of Landsat imagery. Remote Sens 6:6407–6422.
doi:10.3390/rs6076407
Kelsey KC, Barnes KL, Ryan MG, Neff JC (2014) Short and long-
term carbon balance of bioenergy electricity production fueled
by forest treatments. Carbon Balance Manag 9:6. doi:10.1186/
s13021-014-0006-1
McCarl BA, Sands RD (2007) Competitiveness of terrestrial green-
house gas offsets: are they a bridge to the future? Clim Change
80(1–2):109–126. doi:10.1007/s10584-006-9168-5
McKinley DC, Ryan MG, Birdsey RA, Giardina CP, Harmon ME,
Heath LS, Houghton RA et al (2011) A synthesis of current
knowledge on forests and carbon storage in the United States.
Ecol Appl 21(6):1902–1924
Nafus AM, McClaran MP, Archer SR, Throop HL (2009) Multi-
species allometric models predict grass biomass in a semi-desert
rangeland. Rangel Ecol Manag 62:68–72. doi:10.2111/0-003
National Forest Foundation (2016) Carbon Demonstration Project:
San Juan National Forest. Available at: http://old.nationalforests.
org/press/releases/nff-teams-with-chevy-on-carbon-offset-project.
Accessed 3 June 2016
Nowak DJ, Greenfield EJ (2010) Evaluating the national land cover
database tree canopy and impervious cover estimates across the
conterminous United States: a comparison with photo-inter-
preted estimates. Environ Manag 46(3):378–390
Olander LP, Cooley DM, Galik CS (2012) The potential role for
management of US public lands in greenhouse gas mitigation
and climate policy. Environ Manag 49(3):523–533. doi:10.1007/
s00267-011-9806-1
Penman J, Gytarsky M, Hiraishi T, et al (2003) (eds) Good practice
guidance for land use, land use change, and forestry. Institute for
Global Environmental Strategies for the Intergovernmental Panel
on Climate Change, Hayama, pp 1–502
Raymond CL, Healey S, Peduzzi A, Patterson P (2015) Represen-
tative regional models of post-disturbance forest carbon accu-
mulation: integrating inventory data and a growth and yield
model. For Ecol Manag 336:21–34. doi:10.1016/j.foreco.2014.
09.038
Rebain SA (2010) The fire and fuels extension to the forest vegetation
simulator: updated model documentation. In: Internal Report. US
Department of Agriculture, Forest Service, Forest Management
Service Center, Fort Collins, pp 1–397
Rehfeldt G, Crookston NL, Saenz-Romero C, Campbell EM (2012)
North American vegetation model for land-use planning in a
changing climate: a solution to large classification problems.
Ecol Appl 22(1):119–141
Reiner AL (2004) Fuel load and understory community changes
associated with varying elevation and Pinyon–Juniper domi-
nance [thesis]. University of Nevada, Reno
Reinhardt E, Holsinger L (2010) Effects of fuel treatments on carbon-
disturbance relationships in forests of the northern Rocky
Mountains. For Ecol Manag 259(8):1427–1435. doi:10.1016/j.
foreco.2010.01.015
Rickard WH (1985) Biomass and shoot production in an undisturbed
sagebrush-bunchgrass community. Northwest Sci 59:126–133
Smith JE, Heath LS (2004) Carbon stocks and projections on public
forestlands in the United States, 1952–2040. Environ Manag
33:433–442
USFS (2011) Climate change scorecard guide version 1. http://www.
fs.fed.us/climatechange/advisor/scorecard/scorecard-guidance-08-
2011.pdf. Accessed 28 Dec 2014
Vandendriesche D (2010) FVS out of the box: assembly required.
USDA Forest Service Preceedings, Rocky Mountain Research
Station-P-61, pp 289–306
Woodcock CE, Macomber SA, Pax-Lenney M, Cohen WB (2001)
Monitoring large areas for forest change using Landsat: gener-
alization across space, time and Landsat sensors. Remote Sens
Environ 78(1–2):194–203. doi:10.1016/S0034-4257(01)00259-0
Zheng D, Heath LS, Ducey MJ (2013) Carbon benefits from protected
areas in the conterminous United States. Carbon Balance Manag.
doi:10.1186/1750-0680-8-4
Environmental Management
123