Embed Size (px)
Citation preview
Managing Cyber Threat Activities through Formal
Modeling of CTI Data
By
Zafar Iqbal
(Registration No: 2012-NUST-PhD-IT-35)
Thesis Supervisor: Dr. Zahid Anwar
Department of Computing
School of Electrical Engineering and Computer Science,
National University of Sciences & Technology (NUST),
Islamabad, Pakistan.
(2020)
Managing Cyber Threat Activities through Formal
Modeling of CTI Data
By
Zafar Iqbal
(Registration No: 2012-NUST-PhD-IT-35)
A thesis submitted to the National University of Sciences and Technology, Islamabad,
in partial fulfillment of the requirements for the degree of
Doctor of Philosophy in
Information Technology
Thesis Supervisor: Dr. Zahid Anwar
Department of Computing
School of Electrical Engineering and Computer Science,
National University of Sciences & Technology (NUST)
Islamabad, Pakistan
(2020)


Abstract
Cyber-attacks launched by nation-states, organizations, and individuals within and
across borders are on the rise. Modern-day adversaries change signatures and use
multiple malware to launch attacks. Such attacks are termed as Advanced Persistence
Threats (APTs). Although, a large amount of cyber threat data regarding these APTs is
available online, however, due to its high veracity and large volume, timely analysis
of APTs is a challenging task for security analysts. Moreover, it is being witnessed that
APTs launched against an organization subsequently succeeded with high probability
against other similar organizations. Therefore, it has become a need of the time that or-
ganizations accumulate and share cyber threat data with peers. Furthermore, this data
should incorporate information regarding various phases of cyber threat management
(CTM) namely cyber threat prevention, detection, and the response. In this regard, a
few efforts have been made towards the structuring and sharing of cyber threat data.
Noteworthy among these is the Structured Threat Information Expression (STIX). Un-
fortunately, the current state of the structured data is poor. Structured reports are not
appropriately formatted, use incorrect vocabulary, wrongly label threat data or leave
out key components, which curtail their usefulness for CTM. The solution presented
in this thesis to address the aforesaid problems can be categorized under three formal
sub-frameworks namely STIXGEN, SCERM, and A2CS. Each of these sub-frameworks
is designed towards obtaining three exclusive thesis goals.
The STIX Generation (STIGEN) framework is proposed and its prototype is devel-
oped to automatically generate distinct, threat relevant, and error-free structured data.
A comprehensive STIX dataset of well-known APTs has been generated and shared
with the community for the benefit of researchers.
The Structured threat data Cleansing, Evaluation, and Refinement (SCERM) frame-
work has been developed to acquire STIX reports from the STIXGEN and other re-
i
sources and uplift Cyber Threat Intelligence (CTI) data, refining incomplete or missing
components, and valuating it for different phases of CTM. During SCERM’s evalua-
tion, it is observed that current STIX reports have limited information on prevention
and almost none for the response phase of CTM. The results further demonstrate that
SCERM significantly enriches STIX reports. The improvement in prevention is 73%
and in the response is 100%.
Subsequently, the APTs Analysis and Classification System (A2CS) has been devel-
oped for automatic analysis of APTs. It employs ontology modeling and semantic rules
for APTs analysis, identification of their missing artifacts, and inferencing of the tac-
tics, techniques and procedures (TTPs) being employed. A2CS takes refined structured
data as input from SCERM and extracts both high and low-level artifacts according to
the various attacker and defender models. Then, it maps this data on the ontology that
helps in identification of the missing artifacts of APTs and inferencing of high-level
TTPs with help of low-level artifacts.
Overall the proposed solution generates refined, distinct, error-free, and properly
labeled structured threat data, valuates it for different phases of CTM and employs
different attacker and defender models for automated analysis of APTs, identification
of missing artifacts, and inferencing of the high-level artifacts.
ii

Acknowledgment
All the praises and thanks be to the Allah Almighty, Who showered his countless bless-
ings and bestowed the intellect, strength and resources upon me to complete this the-
sis.
I owe my deepest gratitude to my supervisor, Dr. Zahid Anwar, whose ever-present
support, and guidance enabled me to complete my thesis, well within the stipulated
time. Despite his prolonged commitments with a series of foreign assignments, he
always remained available to nourish my stray ideas with his valuable experiences and
strong technical background for which, I am highly indebted to him. This dissertation
would not have been completed without his guidelines and encouragement.
I am also heartily thankful to my co-supervisor Dr. Yousra Javed, and to my guid-
ance committee members, Dr. Rafia Mumtaz, Dr. Asad Waqar Malik, Dr. Hassan Islam,
and Dr. Shahzad Saleem for their effective supervision, encouragement, and guidance.
This thesis would not have been possible without the love, prayers, and support of
my parents and my wife who effectively shared my responsibilities and independently
managed all domestic affairs, thus enabled me to stay focused on my research.
I am also grateful to all members of NUST administration, particularly, Dr. Osman
Hasan (Principal SEECS), Dr. Sharifullah Khan (Senior HoD Deptt. of Computing
(DoC), SEECS), Dr. Rafia Mumtaz (HoD IT, SEECS), Dr. Rabia Irfan (PhD Coordinator
Doc), Mr. Zahid Aslam Raja (OIC Exams (PG), SEECS), Mr. Muhammad Banaras (DD
Monitoring at HQ NUST), Mr. Ejaz Ahmed (DoC Secretary) and Mr. Muhammad
Adnan Bhatti (Personnel Assistant of SHOD DoC) for their kind support and guidance
in administrative affairs. I am also thankful to all those who remember me in their
prayers, during all phases of PhD.
iii

In the name of Allah, the most Gracious, the most Merciful.
I dedicate my work to my parents, my wife and my all family members, whose sacrifices, love,
and prayers enable me to reach this stage.
iv
List of Publications
Journal Publications
1. Zafar Iqbal, and Zahid Anwar., “SCERM - A Novel Framework for Automated
Management of Cyber Threat Response Activities”, Future Generation Computer
Systems, Volume 108, July 2020, Pages 687-708, Publisher = Elsevier.
2. Zafar Iqbal, and Zahid Anwar. ”Ontology Generation of Advanced Persistent
Threats and their Automated Analysis.” NUST Journal of Engineering Sciences
9, Volume no. 2 (2016): Pages 68-75.
Conference Publications
1. Zafar Iqbal, Zahid Anwar, and Rafia Mumtaz. ”STIXGEN-A Novel Framework
for Automatic Generation of Structured Cyber Threat Information.” In 2018 Inter-
national Conference on Frontiers of Information Technology (FIT), Pages 241-246.
IEEE, 2018.
v
Table of Contents
1 Introduction 1
1.1 Cyber Attack - A Global Risk . . . . . . . . . . . . . . . . . . . . . . . . . 1
1.2 Cyber Attacks and Worldwide Expenditures . . . . . . . . . . . . . . . . 2
1.3 Cyber Threat Data . . . . . . . . . . . . . . . . . . . . . . . . . . . . . . . . 3
1.3.1 Classification of Data . . . . . . . . . . . . . . . . . . . . . . . . . . 4
1.3.2 Structuring of Data . . . . . . . . . . . . . . . . . . . . . . . . . . . 4
1.4 Cyber Threat Management . . . . . . . . . . . . . . . . . . . . . . . . . . . 5
1.4.1 Shared Responsibility . . . . . . . . . . . . . . . . . . . . . . . . . 6
1.4.2 Cyber Threat Strategies . . . . . . . . . . . . . . . . . . . . . . . . 6
1.5 Present Security Solutions . . . . . . . . . . . . . . . . . . . . . . . . . . . 7
1.6 Research Motivation . . . . . . . . . . . . . . . . . . . . . . . . . . . . . . 7
1.7 Research Questions . . . . . . . . . . . . . . . . . . . . . . . . . . . . . . . 9
1.8 Proposed Framework . . . . . . . . . . . . . . . . . . . . . . . . . . . . . . 10
1.8.1 STIXGEN - STIX Generator . . . . . . . . . . . . . . . . . . . . . . 10
1.8.2 SCERM - Structured threat data Cleansing, Evaluation, and Re-
finement . . . . . . . . . . . . . . . . . . . . . . . . . . . . . . . . . 11
1.8.3 A2CS - APTs Analysis and Classification System . . . . . . . . . . 11
1.9 Results . . . . . . . . . . . . . . . . . . . . . . . . . . . . . . . . . . . . . . 11
1.10 Contributions . . . . . . . . . . . . . . . . . . . . . . . . . . . . . . . . . . 12
1.11 Thesis Organization . . . . . . . . . . . . . . . . . . . . . . . . . . . . . . . 13
2 Background 14
2.1 Introduction . . . . . . . . . . . . . . . . . . . . . . . . . . . . . . . . . . . 14
2.2 Cyber Security Solutions . . . . . . . . . . . . . . . . . . . . . . . . . . . . 14
2.2.1 Intrusion Detection System . . . . . . . . . . . . . . . . . . . . . . 15
vi
2.2.2 Security Information and Event Management System . . . . . . . 16
2.2.3 Ontology . . . . . . . . . . . . . . . . . . . . . . . . . . . . . . . . . 17
2.3 Cyber Threat Analysis Models . . . . . . . . . . . . . . . . . . . . . . . . 19
2.3.1 Cyber Kill Chain . . . . . . . . . . . . . . . . . . . . . . . . . . . . 20
2.3.2 Pyramid of Pain . . . . . . . . . . . . . . . . . . . . . . . . . . . . . 20
2.3.3 MITRE ATT&CK . . . . . . . . . . . . . . . . . . . . . . . . . . . . 21
2.3.4 Diamond Model . . . . . . . . . . . . . . . . . . . . . . . . . . . . 21
2.4 Structured Threat Intelligence Solutions . . . . . . . . . . . . . . . . . . . 22
2.4.1 STIX Use Cases . . . . . . . . . . . . . . . . . . . . . . . . . . . . . 25
2.4.2 STIX-Shifter . . . . . . . . . . . . . . . . . . . . . . . . . . . . . . . 25
2.4.3 STIXViz . . . . . . . . . . . . . . . . . . . . . . . . . . . . . . . . . 25
3 Related Work 27
3.1 Introduction . . . . . . . . . . . . . . . . . . . . . . . . . . . . . . . . . . . 27
3.2 Overview . . . . . . . . . . . . . . . . . . . . . . . . . . . . . . . . . . . . . 27
3.3 Advanced Persistence Threats . . . . . . . . . . . . . . . . . . . . . . . . . 28
3.3.1 Models . . . . . . . . . . . . . . . . . . . . . . . . . . . . . . . . . . 28
3.3.2 Tactics, Techniques, and Procedures . . . . . . . . . . . . . . . . . 29
3.3.3 Advanced Persistence Threats Exploit Humans . . . . . . . . . . 30
3.4 Cyber Threat Data . . . . . . . . . . . . . . . . . . . . . . . . . . . . . . . . 31
3.4.1 Structuring of Cyber Threat Data . . . . . . . . . . . . . . . . . . . 31
3.4.2 Structured Threat Data Generation . . . . . . . . . . . . . . . . . . 32
3.4.3 Cyber Threat Intelligence Quality Testing . . . . . . . . . . . . . . 33
3.5 Cyber Preparation Assessment . . . . . . . . . . . . . . . . . . . . . . . . 34
3.6 Machine learning based systems . . . . . . . . . . . . . . . . . . . . . . . 36
3.7 Cyber Threat Scoring System . . . . . . . . . . . . . . . . . . . . . . . . . 37
3.8 Graph-Based Ranking Systems . . . . . . . . . . . . . . . . . . . . . . . . 37
3.9 Reputation-Based Security Systems . . . . . . . . . . . . . . . . . . . . . . 39
3.10 Inference or Ontology-Based Security Systems . . . . . . . . . . . . . . . 40
3.11 Conclusion . . . . . . . . . . . . . . . . . . . . . . . . . . . . . . . . . . . . 42
4 Automatic Generation of Structured Threat Data 43
4.1 Introduction . . . . . . . . . . . . . . . . . . . . . . . . . . . . . . . . . . . 43
vii
4.2 Research Approach and Contributions . . . . . . . . . . . . . . . . . . . . 43
4.3 STIXGEN System Model . . . . . . . . . . . . . . . . . . . . . . . . . . . . 44
4.4 STIXGEN Design and Architecture . . . . . . . . . . . . . . . . . . . . . . 45
4.5 Case Study . . . . . . . . . . . . . . . . . . . . . . . . . . . . . . . . . . . 46
4.5.1 Retail Industry - APTs Selection . . . . . . . . . . . . . . . . . . . 46
4.5.2 Data Entry . . . . . . . . . . . . . . . . . . . . . . . . . . . . . . . . 46
4.5.3 STIX Encoder . . . . . . . . . . . . . . . . . . . . . . . . . . . . . . 47
4.5.4 Analysis of the Generated STIX . . . . . . . . . . . . . . . . . . . . 49
4.5.5 Comparison of the POS APTs . . . . . . . . . . . . . . . . . . . . . 52
4.6 STIXGEN Evaluation . . . . . . . . . . . . . . . . . . . . . . . . . . . . . . 56
4.6.1 Accuracy . . . . . . . . . . . . . . . . . . . . . . . . . . . . . . . . . 56
4.6.2 Effectiveness . . . . . . . . . . . . . . . . . . . . . . . . . . . . . . 58
5 Cyber Threat Response Activities 59
5.1 Introduction . . . . . . . . . . . . . . . . . . . . . . . . . . . . . . . . . . . 59
5.2 Research Approach and Contributions . . . . . . . . . . . . . . . . . . . . 59
5.3 Design . . . . . . . . . . . . . . . . . . . . . . . . . . . . . . . . . . . . . . 60
5.3.1 Formal Model of STIX Architecture - SAM . . . . . . . . . . . . . 60
5.3.2 Modeling of the Use Case - Managing Cyber-Threat Response
Activities . . . . . . . . . . . . . . . . . . . . . . . . . . . . . . . . . 66
5.3.3 Cyber threat Prevention and Response Model . . . . . . . . . . . 66
5.3.4 Cyber threat Detection . . . . . . . . . . . . . . . . . . . . . . . . . 72
5.4 Architecture and Implementation . . . . . . . . . . . . . . . . . . . . . . . 75
5.4.1 Preprocessing . . . . . . . . . . . . . . . . . . . . . . . . . . . . . . 76
5.4.2 Valuation . . . . . . . . . . . . . . . . . . . . . . . . . . . . . . . . 78
5.4.3 Refinement . . . . . . . . . . . . . . . . . . . . . . . . . . . . . . . 79
5.5 Case Study . . . . . . . . . . . . . . . . . . . . . . . . . . . . . . . . . . . 80
5.5.1 APT Selection . . . . . . . . . . . . . . . . . . . . . . . . . . . . . . 80
5.5.2 A Brief Description of the Report . . . . . . . . . . . . . . . . . . 81
5.5.3 Signal Boosting . . . . . . . . . . . . . . . . . . . . . . . . . . . . . 83
5.5.4 Valuation of the TG-3390 Boosted STIX Report . . . . . . . . . . . 85
5.5.5 Refinement . . . . . . . . . . . . . . . . . . . . . . . . . . . . . . . 89
5.5.6 Valuation Comparison . . . . . . . . . . . . . . . . . . . . . . . . . 90
viii
5.6 SCERM Evaluation . . . . . . . . . . . . . . . . . . . . . . . . . . . . . . . 91
5.6.1 Dataset Selection and Evaluation Setup . . . . . . . . . . . . . . . 91
5.6.2 Current State of the STIX Reports for Cyber Threat Management 92
5.6.3 Effectiveness of the Proposed Solution . . . . . . . . . . . . . . . . 93
5.6.4 Efficiency . . . . . . . . . . . . . . . . . . . . . . . . . . . . . . . . 98
6 APTs Analysis and Classification System 101
6.1 Introduction . . . . . . . . . . . . . . . . . . . . . . . . . . . . . . . . . . . 101
6.2 Research Approach and Contributions . . . . . . . . . . . . . . . . . . . . 101
6.3 A2CS Architecture . . . . . . . . . . . . . . . . . . . . . . . . . . . . . . . 103
6.4 Analysis via Reasoning . . . . . . . . . . . . . . . . . . . . . . . . . . . . . 105
6.4.1 Identification of Missing Artifacts . . . . . . . . . . . . . . . . . . 105
6.4.2 Tactics, Techniques and Procedure (TTPs) Analysis . . . . . . . . 107
7 Discussion 110
8 Conclusions and Future Research Directions 113
8.1 Conclusions . . . . . . . . . . . . . . . . . . . . . . . . . . . . . . . . . . . 113
8.2 Future Research Directions . . . . . . . . . . . . . . . . . . . . . . . . . . . 114
Bibliography 115
Appendices 130
A STIX Dataset and Source Code 131
A.1 STIX Dataset . . . . . . . . . . . . . . . . . . . . . . . . . . . . . . . . . . . 131
A.2 Source Code and Dataset . . . . . . . . . . . . . . . . . . . . . . . . . . . . 131
ix
List of Figures
1.1 Advanced Cyber Threats Management Challenges . . . . . . . . . . . . . 8
1.2 Proposed Solution . . . . . . . . . . . . . . . . . . . . . . . . . . . . . . . 10
2.1 Intrusion Detection System . . . . . . . . . . . . . . . . . . . . . . . . . . 15
2.2 Security Information and Event Management System . . . . . . . . . . . 16
2.3 SIEM Search Mechanism . . . . . . . . . . . . . . . . . . . . . . . . . . . . 17
2.4 Cyber Kill Chain . . . . . . . . . . . . . . . . . . . . . . . . . . . . . . . . 20
2.5 Pyramid of Pain . . . . . . . . . . . . . . . . . . . . . . . . . . . . . . . . . 21
2.6 MITRE ATT&CK Vs Cyber Kill Chain . . . . . . . . . . . . . . . . . . . . 22
2.7 Diamond Model . . . . . . . . . . . . . . . . . . . . . . . . . . . . . . . . . 22
2.8 POS STIX . . . . . . . . . . . . . . . . . . . . . . . . . . . . . . . . . . . . . 26
3.1 Overview of Related work . . . . . . . . . . . . . . . . . . . . . . . . . . . 28
4.1 STIXGEN Flow Diagram . . . . . . . . . . . . . . . . . . . . . . . . . . . . 45
4.2 STIXGEN’s Database Schema . . . . . . . . . . . . . . . . . . . . . . . . . 45
4.3 Backoff APT and Security Blogs . . . . . . . . . . . . . . . . . . . . . . . . 47
4.4 POS STIX : POS’s STIX Report generated by STIXGEN . . . . . . . . . . . 49
4.5 Alina POS APT . . . . . . . . . . . . . . . . . . . . . . . . . . . . . . . . . 49
4.6 JackPOS APT . . . . . . . . . . . . . . . . . . . . . . . . . . . . . . . . . . 50
4.7 BackOff POS APT . . . . . . . . . . . . . . . . . . . . . . . . . . . . . . . . 51
4.8 CenterPOS APT . . . . . . . . . . . . . . . . . . . . . . . . . . . . . . . . . 51
4.9 ProPOS APT . . . . . . . . . . . . . . . . . . . . . . . . . . . . . . . . . . . 51
4.10 TTP employed . . . . . . . . . . . . . . . . . . . . . . . . . . . . . . . . . . 52
4.11 Protocol Employed . . . . . . . . . . . . . . . . . . . . . . . . . . . . . . . 53
4.12 Operating System Employed . . . . . . . . . . . . . . . . . . . . . . . . . 53
x
4.13 Folder Path Employed . . . . . . . . . . . . . . . . . . . . . . . . . . . . . 54
4.14 Encryption Evolution . . . . . . . . . . . . . . . . . . . . . . . . . . . . . . 54
4.15 Observables for CTM . . . . . . . . . . . . . . . . . . . . . . . . . . . . . . 55
4.16 IBM X-Force Exchange vs STIXGEN . . . . . . . . . . . . . . . . . . . . . 57
4.17 IBM X-Force Exchange Textual Report . . . . . . . . . . . . . . . . . . . . 57
4.18 IBM X-Force Exchange vs STIXGEN . . . . . . . . . . . . . . . . . . . . . 58
5.1 Campaign and its Related Components . . . . . . . . . . . . . . . . . . . 62
5.2 Formal Depiction of the Campaign Components . . . . . . . . . . . . . . 63
5.3 COA Stage . . . . . . . . . . . . . . . . . . . . . . . . . . . . . . . . . . . . 67
5.4 COA and its Relations . . . . . . . . . . . . . . . . . . . . . . . . . . . . . 69
5.5 High level Architecture Diagram of SCERM . . . . . . . . . . . . . . . . . 76
5.6 IBM X-Force STIX XML . . . . . . . . . . . . . . . . . . . . . . . . . . . . . 81
5.7 STIX-1: IBM X-Force STIX . . . . . . . . . . . . . . . . . . . . . . . . . . . 82
5.8 IBM Text Report . . . . . . . . . . . . . . . . . . . . . . . . . . . . . . . . . 83
5.9 IBM STIX Description Portion . . . . . . . . . . . . . . . . . . . . . . . . . 84
5.10 STIX-2 : Boosted STIX Report . . . . . . . . . . . . . . . . . . . . . . . . . 84
5.11 Valuation Report for Cyber Threat Prevention . . . . . . . . . . . . . . . 85
5.12 Valuation Report for Cyber Threat Detection . . . . . . . . . . . . . . . . 87
5.13 Valuation Report for Cyber Threat Response . . . . . . . . . . . . . . . . 88
5.14 STIX Valuation for CTM . . . . . . . . . . . . . . . . . . . . . . . . . . . . 89
5.15 TG-3390 Techniques, Mitigation and Detection . . . . . . . . . . . . . . . 89
5.16 SCERM’s Refined STIX Report . . . . . . . . . . . . . . . . . . . . . . . . 90
5.17 Valuation Comparison - Boosted vs Refined STIX Reports . . . . . . . . 90
5.18 Current State of STIX Repositories for CTM . . . . . . . . . . . . . . . . . 92
5.19 Evaluation of RAW STIX Reports for CTM . . . . . . . . . . . . . . . . . . 94
5.20 Evaluation of STIX Repositories for CTM . . . . . . . . . . . . . . . . . . 95
5.21 Statistical Comparison . . . . . . . . . . . . . . . . . . . . . . . . . . . . . 97
5.22 SCERM Efficiency . . . . . . . . . . . . . . . . . . . . . . . . . . . . . . . . 100
6.1 Combined Ontology of CKC and POP . . . . . . . . . . . . . . . . . . . . 102
6.2 A2CS Flow Diagram . . . . . . . . . . . . . . . . . . . . . . . . . . . . . . 103
6.3 Concepts Extraction and Mapping . . . . . . . . . . . . . . . . . . . . . . 104
xi
6.4 Identification of Missing Artifacts . . . . . . . . . . . . . . . . . . . . . . . 105
6.5 Correlation of JackPOS and BackOff APTs . . . . . . . . . . . . . . . . . . 107
6.6 Summary of Correlation Results . . . . . . . . . . . . . . . . . . . . . . . 108
6.7 Ontology of Rule-1 . . . . . . . . . . . . . . . . . . . . . . . . . . . . . . . 108
6.8 Ontology of Rule-2 . . . . . . . . . . . . . . . . . . . . . . . . . . . . . . . 109
6.9 Ontology of Rule-3 . . . . . . . . . . . . . . . . . . . . . . . . . . . . . . . 109
A.1 Financial APT’s STIX . . . . . . . . . . . . . . . . . . . . . . . . . . . . . . 132
A.2 Cyber Espionage APT’s STIX . . . . . . . . . . . . . . . . . . . . . . . . . 132
A.3 MITRE APT’s STIX . . . . . . . . . . . . . . . . . . . . . . . . . . . . . . . 133
A.4 POS APT’s STIX . . . . . . . . . . . . . . . . . . . . . . . . . . . . . . . . 133
A.5 Ransomware APT’s STIX . . . . . . . . . . . . . . . . . . . . . . . . . . . . 134
A.6 GitHub link . . . . . . . . . . . . . . . . . . . . . . . . . . . . . . . . . . . 134
xii
List of Tables
4.1 Comparison of APTs . . . . . . . . . . . . . . . . . . . . . . . . . . . . . . 55
4.2 Comparison of STIX Generators . . . . . . . . . . . . . . . . . . . . . . . . 58
5.1 Component Selection . . . . . . . . . . . . . . . . . . . . . . . . . . . . . . 64
5.2 SCERM’s Variables and their purpose . . . . . . . . . . . . . . . . . . . . 64
5.3 Levels of Impact, Efficacy, and Confidence for Course of Action . . . . . 68
5.4 COAs Producers and their Strength . . . . . . . . . . . . . . . . . . . . . . 69
5.5 Variables for Prevention and Response phases . . . . . . . . . . . . . . . 71
5.6 Indicator Efficacy . . . . . . . . . . . . . . . . . . . . . . . . . . . . . . . . 74
5.7 Variables for Detection phase . . . . . . . . . . . . . . . . . . . . . . . . . 75
5.8 STIX Valuation for Prevention Phase . . . . . . . . . . . . . . . . . . . . . 86
5.9 STIX Valuation for Detection Phase . . . . . . . . . . . . . . . . . . . . . . 87
5.10 STIX Valuation for Response Phase . . . . . . . . . . . . . . . . . . . . . . 88
5.11 STIX Dataset . . . . . . . . . . . . . . . . . . . . . . . . . . . . . . . . . . . 91
5.12 Qualitative Comparison . . . . . . . . . . . . . . . . . . . . . . . . . . . . 96
5.13 Participants Details . . . . . . . . . . . . . . . . . . . . . . . . . . . . . . . 98
5.14 SCERM Evaluation Survey . . . . . . . . . . . . . . . . . . . . . . . . . . . 98
xiii
List of Abbreviations
AI Artificial Intelligence
APT Advanced Persistent Threats
ACT Activities
A2CS APTs Analysis and Classification System
CKC Cyber Kill Chain
CTM Cyber Threat Management
Cyber Threat Intelligence
COA Course of Actions
LM Lockheed Martin
Mgmt Management
OWL Web Ontology Language
STIX Structured Threat Information eXpression
POP Pyramid of Pain
POS Point of Sales
RESP Response
SWRL Semantic Web Rule Language
SPARQL Simple Protocol and RDF Query Language
SQWRL Semantic Query Enhanced Web Rule Language
xiv
STIXGEN STIX Generation
SCERM Structured threat data Cleansing, Evaluation, and Refinement
SAM STIX Architecture based formal Model
SDO STIX Domain Objects
SRO STIX Relationship Objects
SEM Security Event Management
SIM Security Information Management
SIEM Security Information and Event Management
TTP Tactics Techniques and Procedures
TAXII Trusted Automated eXchange of Indicator Information
TA Threat Actor
xv
Chapter 1
Introduction
In this chapter, at first, a highlight of cyber attacks launched in the last decade is shared.
Subsequently, worldwide spending on cyber security is discussed. After that, cyber
threat data classification and structuring are shared. Then, the organizational roles of
different individuals according to cyber threat strategies and their related cyber threat
indicators are reviewed. Afterwards, different security solutions presently employed
to handle the current cyber threats are presented. Subsequently, the research problem is
introduced and then the research motivation is built. Finally, the chapter is concluded
by summarizing the research contributions and their outcomes.
1.1 Cyber Attack - A Global Risk
In this era of information technology, cyber attacks [1] [2] [3] are becoming a global
risk. According to the World Economic Forum’s (WEF) Global Risk Report (GRR) 2018 [4],
cyber attacks were the third most probable global risk for 2018.
As discovered in a security survey [5], security incidents have raised to 42.8M
around the world and these incidents rise 66% each year since 2009. In 2014, the aver-
age reported loss was up to 34% as compared to 2013 and 86% of the cyber-attacks
involved by these losses were launched by nation-states. Some governments have
made cyber-attacks campaign part of their military strategy and have built their cy-
ber armies. According to ISACA report [6], cyber criminals are trying their best to
attack individuals, organizations and different states. A majority of these attacks are
targeting government, financial, healthcare and marketing industries. As reported by
1
Chapter 1. Introduction
Symantec report, ISTR April 2017 [7], 106 new families of ransomware were discov-
ered in 2016, which are more than three times seen in the previous year. The “Wan-
naCry” [8] ransomware attack was launched in May 2017, which swiftly spread in 150
countries and damaged more than 0.3M computers. In June 2017, “NotPetya” [9] was
launched against Ukraine and other countries, which caused an estimated loss [10] of
$200M to $300M in the 3rd Quarter (Q3) alone to a shipping giant Maersk and $300M
to another shipping company FedEx. In May 2017, two billion phone records [11] were
stolen from a Chinese firm namely Du Caller group. In September 2017, Equifax [12],
a US-based company endured a data breach, where $145M (44% of the US popula-
tion) customer’s personal and credit card data was stolen. In November 2017, 57M
customer and driver data were stolen in the Uber [12] data breach and the company
paid a $ 100,000 to hackers to delete the stolen data. In the same year (2017), the Son-
icWall Capture Labs threat network detected 101.2% (2,855) ransomware signatures [13]
in contrast to 1,419 identified in the year 2016.
In another cyber-attack [14], 30M US-based Facebook users’ data was stolen by the
UK based firm Cambridge Analytica (CA). Later on, this data was used to attract voters
for the USA president Trump’s 2016 elections campaign. Moreover, attacks having a
subversive purpose, in particular, those launched during the US presidential elections
2016 [15] represent a new form of top-notch cyber-attacks. As stated in the McAfee Labs
threats report March 2018 [16], the health care division faced 210% increased security
incidents (publicly disclosed) in 2017 as compared to the previous year. If we deeply
analyze the above attacks and other such attacks like Zeus [17], BackOff Point of Sales
(POS) [18], we will find that with passage of time these attacks have succeeded against
many analogous organizations. This fact shows that a cyber-attack launched against an
organization can be easily used against parallel organizations because of their similar
IT infrastructure. Therefore, the collection and timely sharing of CTI data are very
important for the prevention, detection, and response of cyber-attacks.
1.2 Cyber Attacks and Worldwide Expenditures
In the past, cyber-attacks were floated against individual users for fun and damage but
nowadays these attacks are being launched against business chains, industries and na-
2
Chapter 1. Introduction
tions for financial and political gains. It seems that the Internet landscape has become
binary warfare.
Although worldwide information security spending is increasing every year [19],
it has reached $124 billion in 2019, yet record-breaking data breaches are occurring
globally. According to Gartner Inc., [19] this outlay was approximately $96 billion in
2018, which is 8% more than the previous year from 2017. In 2017, major data breaches
took place. In May 2017, two billion phone records [11] were stolen from a Chinese
firm. In the same year, a US-based company Equifax [12] suffered a data breach, where
145M customers’ data was stolen.
Due to the proliferation of cyber incidents, Cyber Threat Management (CTM) is
emerging as a systematic approach for the timely prevention, detection, and response
of these incidents because its activities involve identifying threats, understanding their
nature and applying appropriate actions.
1.3 Cyber Threat Data
Multiple organizations are continuously sharing a large volume of CTI data for CTM.
For example, MITRE Corporation [20] is a non-profit organization. Currently, it pro-
vides CTI data for about 94 different threat groups. This CTI data consists of vari-
ous indicators such as TTPs, Network and Host artifacts, IPs, and DNS information.
Likewise, HAILATAXII [21] is an open-source repository which has about 1,107,066 in-
dicators. Similarly, IBM-XForce Exchange [22] shares machine-readable indicators for
security tools such as IDS, IPS, and firewalls. Financial Services Information Sharing and
Analysis Center (FS-ISAC) [23] is an industry consortium which regularly provides CTI
data to safeguard the financial domain from cyber threats. Similarly, Research and Ed-
ucation Networks Information Sharing and Analysis Center (REN-ISAC) [24] is producing
a large amount of CTI data for incident response teams, researchers and education
community.
Although, a massive volume of cyber threat data is available on different security
blogs, however, it has become a great challenge for security analysts, to decide which
is required data for cyber threat management. In this regard, multiple models are
available. Details are provided in the following subsections.
3
Chapter 1. Introduction
1.3.1 Classification of Data
In the recent past, multiple models are presented for the classification of cyber threat
data. Among these models, the Cyber Kill Chain (CKC) [25] and the Pyramid of Pain
(POP) [26] are prominent. The CKC model guides an analyst how a perpetrator may
use different phases such as Reconnaissance, Weaponization, Delivery, Exploitation, Instal-
lation, and Exfiltration to launch an Advanced Persistent Threats (APTs), while the POP
details how signatures and artifacts, available at different attack levels, can be used to
defend their network from APTs. The POP model further guides that publically avail-
able cyber threat data is generally regarding atomic and computed indicators namely
IPs, Domain Names, and Hash Values, while the data related to higher-level artifacts
such as File name, Registry entries, Protocols used, Obfuscation methods, and TTPs, which
is more related to decisions is mostly missing. The model further imparts that perpe-
trators can change the atomic indicators with little effort but the higher-level artifacts
are hard to change because perpetrators invested great time and money during the
development of these artifacts.
1.3.2 Structuring of Data
In the last decade, a massive volume of cyber threat data has been published on dif-
ferent security blogs, however, this data is generally scattered, as well as unstruc-
tured [27]. Several efforts such as IODEF, STIX [28] and YARA [29] are put forward by
the government and the industry to convert non-structured data [30] into a structured
and machine-readable format. Among these, STIX [28] is a de-facto standard [31].
STIX is a community-based effort, which not only structures cyber threat data but also
enables sharing, visualization, and analysis capabilities. STIX has several components
such as Campaign, Tactics techniques and procedures (TTPs), Exploits, Indicators, Observ-
ables, Incidents, Course of Actions (COAs) and Threatactors to represent cyber threat data.
1.3.2.1 Present State of Structured Data
Although, STIX is a remarkable effort for structuring and sharing of CTI data, however,
it is slow in adoption, which is due to the manual STIX generation process. Moreover,
it has been noticed that publicly available STIXs are few and have mostly erroneous,
4
Chapter 1. Introduction
misplaced and meaningless data. Although sharing and structuring of CTI is very
important, it is paramount that data being shared must be meaningful, threat-relevant
[32], properly placed and error-free.
1.3.2.2 Generation of Structured Data
There are many cyber threat analysis tools publicly available such as Bro [33], Splunk
[34], STIXViz [35], where Bro is a log analysis tool, Splunk is being used to search,
visualize and analyze the logs generated from different sensors, while STIXViz is for
visual analysis of the STIXs reports. However, there is no tool available to generate
distinct, threat relevant and error-free structured data.
1.3.2.3 Valuation of Structured data
There are several challenges to the current state of CTI data [36] [37] that hinders the
automation of CTM. Cyber analysts witness a lot of sketchy, erroneous, and redun-
dant CTI data [38], lack of novel information, as well as a paucity of a standardized
vocabulary. This means that CTI data producers do not always follow the standards
when publishing information or they republish the same threat information in part or
by the whole that they or another source published previously. Also frequently, there
is a lot of extraneous information that is not very useful to the threat analyst amongst
very sparse new terms. The same information is published using semantically similar
terminology due to a lack of standardized vocabulary. Moreover, currently available
CTI data has very limited information for CTM.
1.4 Cyber Threat Management
Cyber Threat Management (CTM) involves prevention, detection, and response to
cyber-attacks by identifying and understanding threats and applying appropriate ac-
tions.
5
Chapter 1. Introduction
1.4.1 Shared Responsibility
Cyber Threat Management is a shared responsibility undertaken by multiple stake-
holders within an organization [39] such as the Chief Executive Officer (CEOs), the Chief
Information Security Officer (CISO), and the Security Administrator (SA), each of whom
consumes specialized components of cyber threat intelligence data in order to effec-
tively perform their duties. For example, the CEO is generally interested in under-
standing if the prevalent cyber attack is relevant to the organization’s primary business
and determining the threatactor whether they are a competitor or elements who want
to conduct extortion. A CISO, on the other hand, wants to know if the organization can
resist the attack and if not, then he determines the COAs to safeguard the organization.
Accordingly, the SA applies the identified COAs.
1.4.2 Cyber Threat Strategies
Cyber Threat Management has several strategies, which can be grouped into three
phases namely cyber threat prevention, detection, and response. These phases are
continuous and concurrent processes, each of which requires a separate team having
focused tasks and expertise. For cyber threat prevention, the CISO studies and au-
dits the organizational network, analyzes assets, operational procedures and identifies
the exploits and their COAs. Afterwards, the SA implements the COAs in the shape of
patch updates and defines policies to prevent cyber attacks. Despite these preventive
measures, the prevention team cannot stop all of the advanced, sophisticated, multi-
stage and targeted attacks. Therefore, to trace these attacks the responsibility lies on
the detection team. This team studies emerging attacks by using the corresponding
indicators and observables signifies the behavioral signatures and correlates these to the
log files of the organizational network to determine the nature of a suspected cyber
attack. Once identified, the CISO studies the appropriate COAs to mitigate the attack.
Once approved the SA implements these COAs in the shape of software installation
and defines policies to stop or limit ongoing cyber attacks.
6
Chapter 1. Introduction
1.5 Present Security Solutions
Nowadays, several security tools are used for CTM such as Antivirus, Intrusion Detec-
tion Systems (IDS) and Security Information and Event Management Systems (SIEM). Virus
Total [40] is an antivirus, which employs signatures for identification of the malware.
Bro [33] is an IDS which takes log files as an input. In Bro, rules can be written to de-
tect intrusion. Splunk [34] is a SIEM. It correlates low-level artifacts such as log files,
for intrusion detection. The above-mentioned tools do not process structured data di-
rectly but mostly examine low-level attack artifacts such as log files. Moreover, these
aforesaid tools or any other tools for that matter allow for very limited valuation and
refinement of structured threat feeds.
Cyber-attacks of the present time are dynamic, stealthy [41] and persistent, which
can’t be blocked by legacy security mechanisms.
1.6 Research Motivation
In the present time, cyber threats management has many challenges as shown in Figure
1.1. For example, present day APTs are prolonged, customised, and targeted, there-
fore, most of the time these remain undetected by the conventional security solutions.
These attacks have diverse goals such as some attacks are launched for financial gains,
for example, Zeus and Carbanak, some attacks aimed at political gains and sabotage
like Naikon and Stuxnet APTs and other required personal information, for instance,
PoSeidon and BlackPOS.
Despite this, a substantial amount of cyber threat data is available in the litera-
ture and online repositories, however, most of the data is unstructured and distributed
which cannot be read by machines and humans as well. Due to high adaptivity, large
volume, and unstructured nature, analyzing information about cyber incidents is a
challenging task for security analysts.
Although, multiple efforts are being carried out to analyze the APTs and to struc-
ture CTI data for CTM, however, none of these became successful so for. During the
literature review, it is revealed that to understand systems and to study their compo-
nents, W3C recommends ontological modeling. Moreover, ontology’s are developed
to share, reuse, and to analyze the domain knowledge. Therefore, this research was
7
Chapter 1. Introduction
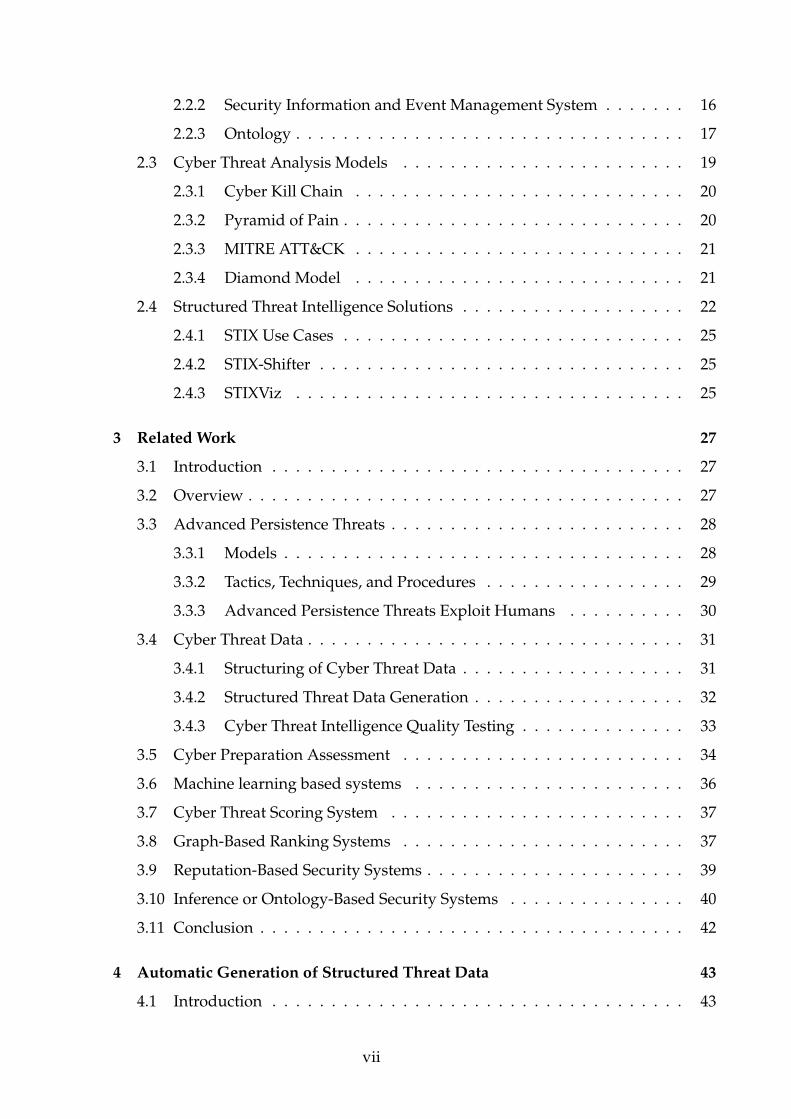
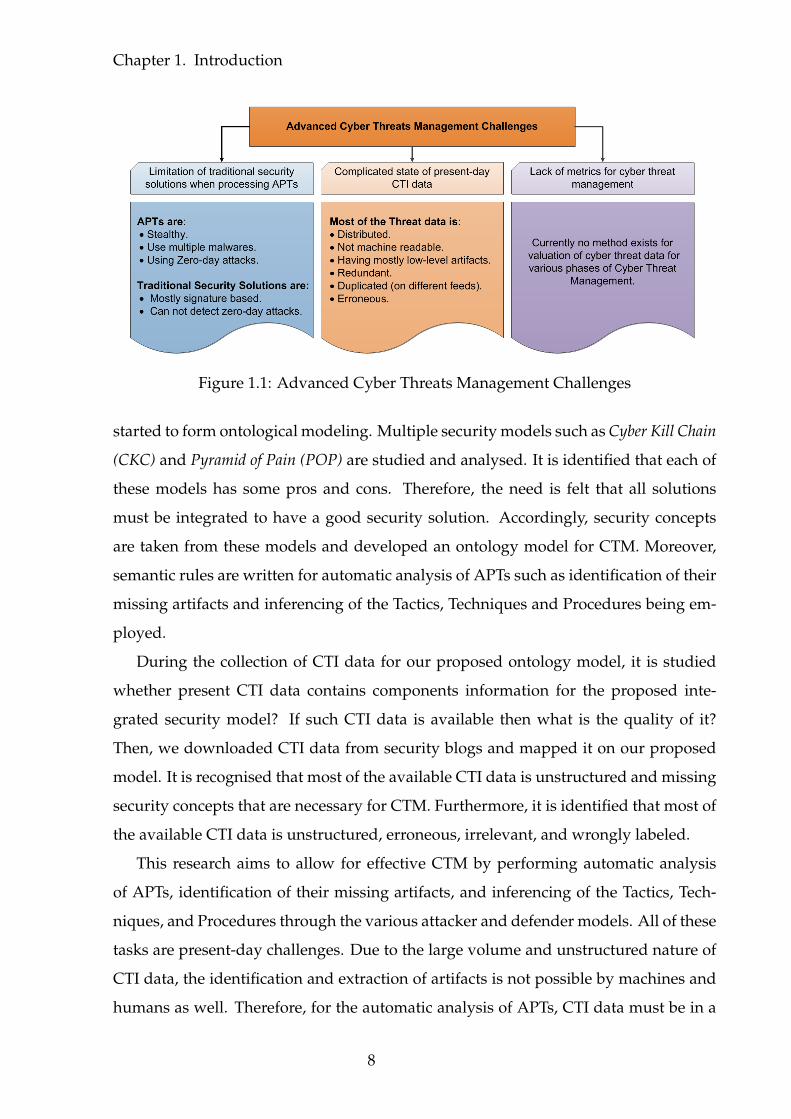
Figure 1.1: Advanced Cyber Threats Management Challenges
started to form ontological modeling. Multiple security models such as Cyber Kill Chain
(CKC) and Pyramid of Pain (POP) are studied and analysed. It is identified that each of
these models has some pros and cons. Therefore, the need is felt that all solutions
must be integrated to have a good security solution. Accordingly, security concepts
are taken from these models and developed an ontology model for CTM. Moreover,
semantic rules are written for automatic analysis of APTs such as identification of their
missing artifacts and inferencing of the Tactics, Techniques and Procedures being em-
ployed.
During the collection of CTI data for our proposed ontology model, it is studied
whether present CTI data contains components information for the proposed inte-
grated security model? If such CTI data is available then what is the quality of it?
Then, we downloaded CTI data from security blogs and mapped it on our proposed
model. It is recognised that most of the available CTI data is unstructured and missing
security concepts that are necessary for CTM. Furthermore, it is identified that most of
the available CTI data is unstructured, erroneous, irrelevant, and wrongly labeled.
This research aims to allow for effective CTM by performing automatic analysis
of APTs, identification of their missing artifacts, and inferencing of the Tactics, Tech-
niques, and Procedures through the various attacker and defender models. All of these
tasks are present-day challenges. Due to the large volume and unstructured nature of
CTI data, the identification and extraction of artifacts is not possible by machines and
humans as well. Therefore, for the automatic analysis of APTs, CTI data must be in a
8
Chapter 1. Introduction
structured form. Moreover, this data must be error-free, threat relevant, and distinct
otherwise, it would lead to the wrong conclusion. Furthermore, it is learned during the
research that most of the publicly available CTI data is wrongly labeled, having incom-
plete artifacts, and is distributed over different security blogs. Therefore, for effective
CTM the threat data must be collected, boosted, and refined from various security
blogs. Presently, all of these tasks cannot be accomplished due to the non-availability
of such algorithms and frameworks that automatically generate, refines, valuates and
analyse the structured CTI data. Although, some manual tools are available to gener-
ate structured CTI data, however, these tools are naturally difficult to use and produce
errors.
Therefore, the need is felt for such a CTM framework that should consist of three
stages. The first stage must automatically generate error-free, properly labeled, and
threat relevant CTI data in the structured format. Whereas, the second stage should
evaluate the quality of the input structured data for various phases of the CTM namely
cyber threat prevention, detection, and response. Moreover, this stage must be able to
boost and refine the structured CTI data through the input of various analysts and se-
curity blogs. Likewise, the third stage of the framework should take refined structured
CTI data as input and extract both high and low-level artifacts according to the various
attacker and defender models. Finally, this stage needs to deduce the required TTPs
based on the previously extracted indicators through formal models.
This research takes all aforesaid problems as a challenge and develop a frame-
work that generates refined, distinct, error-free, and properly labeled structured threat.
Moreover, it also valuates the structured CTI data for different phases of CTM. Fur-
thermore, this framework employs different security models for automatic analysis of
APTs, identification of their missing artifacts, and inferencing of the TTPs.
1.7 Research Questions
This research will focus on addressing the following questions. (1) Does currently
available cyber threat intelligence data follows NIST guidelines of timely, relevant,
specific, accurate, and actionable threat intelligence? (2) Is it possible to quantitatively
measure the quality of CTI data produced by cyber threat sources and ultimately rank
9
Chapter 1. Introduction
them? (3) What level of CTI data’s refinement can be achieved for cyber threat pre-
vention, detection and response activities? (4) If ontological modeling of cyber threat
data according to existing solutions is performed, will it help to understand and de-
fend cyber attacks? (5) Can formal rules be devised such that they can aid machines in
automated analysis of cyber attacks, their prevention, detection, and response?
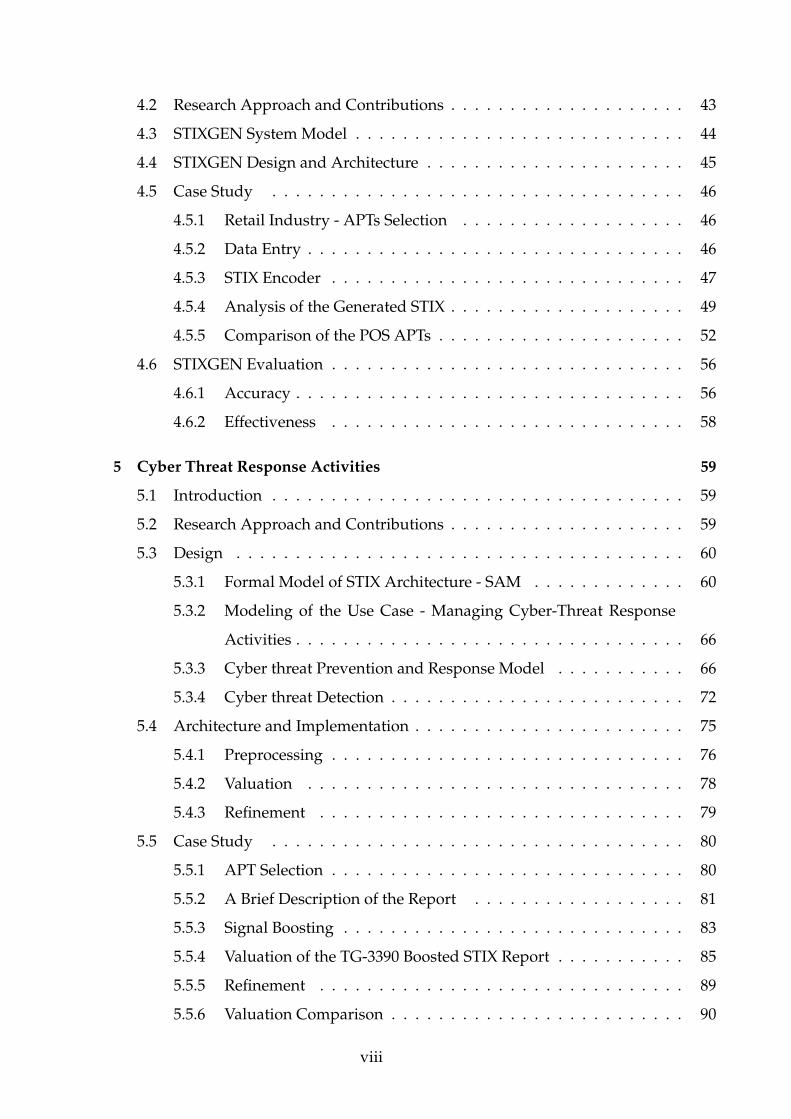
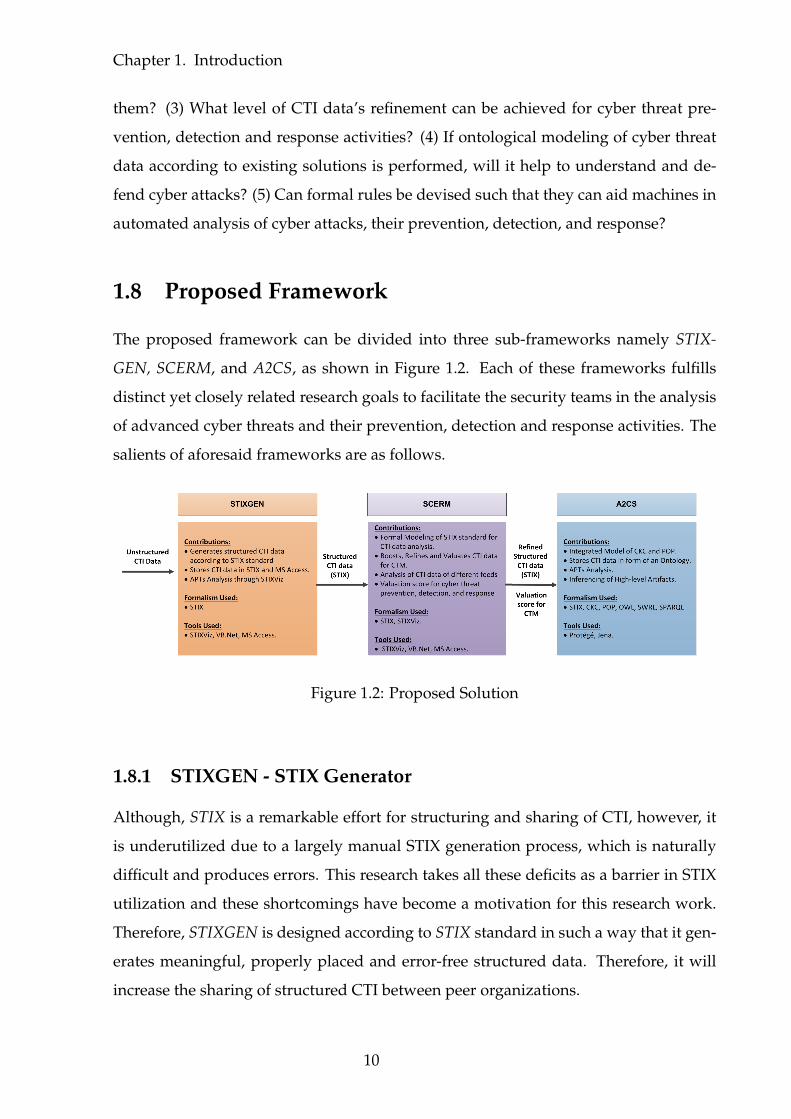
1.8 Proposed Framework
The proposed framework can be divided into three sub-frameworks namely STIX-
GEN, SCERM, and A2CS, as shown in Figure 1.2. Each of these frameworks fulfills
distinct yet closely related research goals to facilitate the security teams in the analysis
of advanced cyber threats and their prevention, detection and response activities. The
salients of aforesaid frameworks are as follows.
Figure 1.2: Proposed Solution
1.8.1 STIXGEN - STIX Generator
Although, STIX is a remarkable effort for structuring and sharing of CTI, however, it
is underutilized due to a largely manual STIX generation process, which is naturally
difficult and produces errors. This research takes all these deficits as a barrier in STIX
utilization and these shortcomings have become a motivation for this research work.
Therefore, STIXGEN is designed according to STIX standard in such a way that it gen-
erates meaningful, properly placed and error-free structured data. Therefore, it will
increase the sharing of structured CTI between peer organizations.
10
Chapter 1. Introduction
1.8.2 SCERM - Structured threat data Cleansing, Evaluation, and Re-
finement
During this research, it is realised that the identification and prioritization of CTI data
for CTM cannot be meaningfully accomplished without having a formal model of
threat intelligence components, their connectivity, and dependency. Therefore, SCERM
is proposed that boosts, refines, and valuates STIX reports for CTM. The prototype pro-
duces valuation scores for STIX reports and a list of extracted components for every
phase of CTM. In fact, SCERM provides a starting point for CTM teams for the preven-
tion, detection, and response of cyber threats.
1.8.3 A2CS - APTs Analysis and Classification System
Due to the importance of the CKC and the POP models, A combined ontology of both
models is developed. The proposed framework A2CS accepts both the structured and
unstructured CTI data as input. Then, it extracts CTI data related to the CKC and the
POP models. After that, the A2CS maps this data on the integrated ontology of the CKC
and the POP models that helps an analyst for identification of the missing artifacts of
APTs and inferencing of the high-level TTPs with the help of the low-level artifacts.
1.9 Results
For the thorough assessment of the proposed framework, CTI data of real-life APTs is
taken. For example, for a comprehensive assessment of STIXGEN, multiple APTs [42]
are selected and generated their STIXs by using STIXGEN and by employing state-of-
the-art online tools. It was found that our proposed framework’s results are better than
the results of other tools and are distinct, relevant and error-free.
Likewise, SCERM is evaluated by using publicly available STIX’s repositories such
as the Schemas-test [43], IBM X-Force Exchange [22], and HAILATAXII [21]. These repos-
itories were analyzed, valuated, and prioritized for different phases of CTM life-cycle.
The evaluation results highlight that publicly available STIX reports have limited infor-
mation for the cyber threat prevention and they contain almost none for the response
phase of CTM. The valuation results demonstrate that the SCERM system significantly
11
Chapter 1. Introduction
augments the STIX reports.
Similarly, A2CS framework, two famous Point of Sale (POS) APTs are selected and
correlated. The results generated by the proposed system indicate that most of the
phases of these APTs such as Weaponization, Host Artifacts, Network Artifacts, and TTPs
are common.
1.10 Contributions
During our research, we develop three novel sub-frameworks. Each of these frame-
works fulfills distinct yet closely related research goals to facilitate the security teams
in the analysis of advanced cyber threats and their prevention, detection, and response
activities.
Currently, threat data is error-prone and missing important CTI for CTM. Therefore
threat analysts hesitate to use threat data. Our first sub-framework takes CTI data as
input and produces properly labeled, error-free, and threat relevant structured threat
data for CTM.
It is learned during the research that most of the publicly available CTI data is
wrongly labeled, having incomplete artifacts, and missing important indicators re-
garding cyber threat prevention, detection, and response. Therefore, for effective CTM,
there is a need for a sub-framework that should boost, refine, and evaluate the struc-
tured CTI data. However, these tasks cannot be meaningfully accomplished without
having a formal model of threat intelligence components, their connectivity, and de-
pendency. Therefore, A novel sub-framework is proposed for the valuation of struc-
tured data, which formally models the STIX architecture on the basis of the STIX use
case Managing cyber threat response activities.
It is expected that the proposed framework will enhance the user confidence over
structured CTI data, and hence the quality and usage of structured reports for CTM
will increase. Moreover, it will be used to generate good quality STIXs for students
and analysts in a simple and effective way.
12
Chapter 1. Introduction
1.11 Thesis Organization
The rest of the thesis is organized as follows. Chapter 2 briefly describes the back-
ground knowledge of key domain concepts namely Present Security Solutions, Cyber
Kill Chain, Pyramid of Pain, Structured Threat Intelligence Solutions, and STIXViz. Then,
chapter 3 shares a comprehensive literature review that describes research contribu-
tions carried out in the domain of APTs analysis, CTI data analysis and structuring,
and other associated areas. After that, chapter 6 describes how ontological model-
ing and semantic rules are used for APTs analysis. Next, chapter 4 details how dis-
tinct, threat relevant, and error-free structured data is automatically generated. Sub-
sequently, chapter 5 formally models the STIX architecture and valuates STIX reports
for different phases of cyber threat management. Chapter 7 provides answers to the
aforementioned research question raised in chapter 1. Finally, chapter 8 concludes
this thesis and provides future research directions. Moreover, a comprehensive STIX
dataset is provided for researchers in Appendix A.1.
13
Chapter 2
Background
2.1 Introduction
This chapter briefly describes various security solutions, standards, and techniques
that are employed in various sub-frameworks proposed in the thesis. For example,
the Pyramid of Pain (POP), Cyber Kill Chain (CKC), and Ontologies are chosen for cyber
threat analysis and these concepts are made part of the A2CS framework. Similarly,
STIX standard, its Use Cases, and MITRE ATT&CK are employed in STIXGEN and
SCERM frameworks for the analysis, refinement, and the valuation of the CTI data for
CTM. We do not assume that users have prior knowledge of these. For ease of their
reading and better understanding, we are briefly discussing these concepts namely
Present security solutions, Ontology, Pyramid of Pain, Cyber Kill Chain, and State-of-the-Art
solutions for sharing and visualization of Structured Threat Intelligence are shared in the
following subsections. Moreover, references are provided for further reading.
2.2 Cyber Security Solutions
Presently, several security solutions are used for cyber threat prevention, detection, and
response. These solutions can be divided into three main categories namely Intrusion
Detection Systems (IDS), Security Information and Event Management Systems (SIEMS),
and Ontology based systems. Details of these are provided in the following subsections.
14
Chapter 2. Background
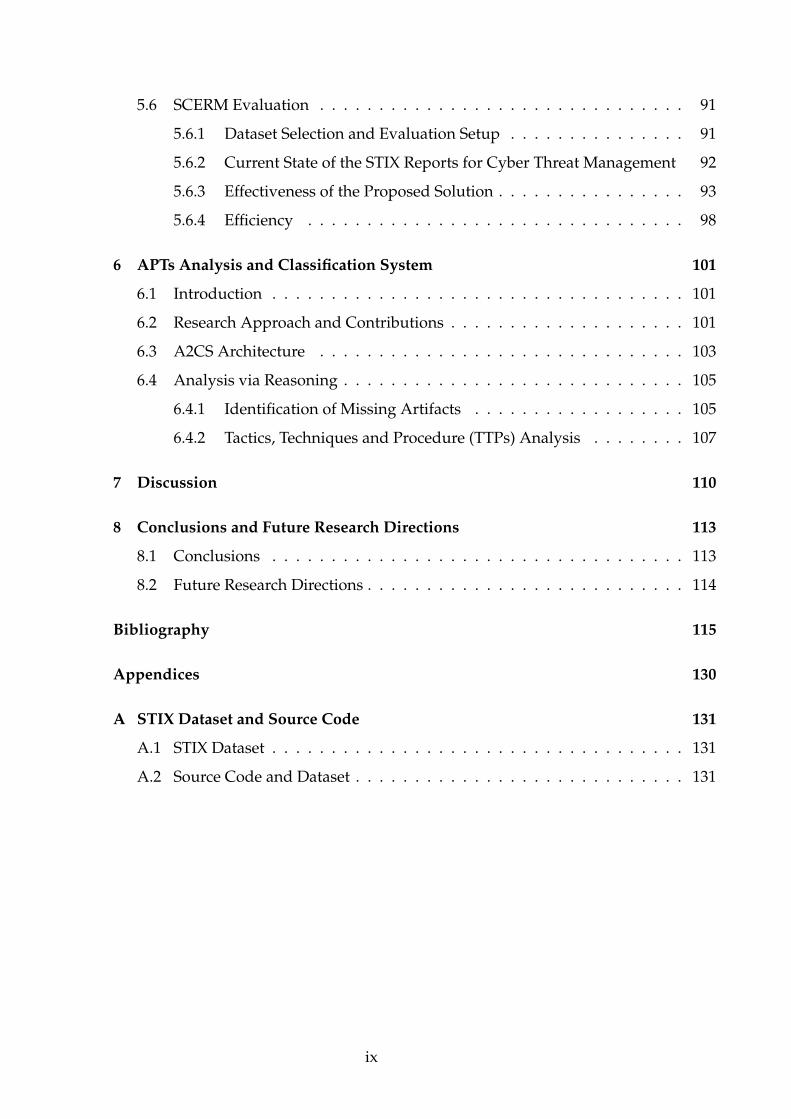
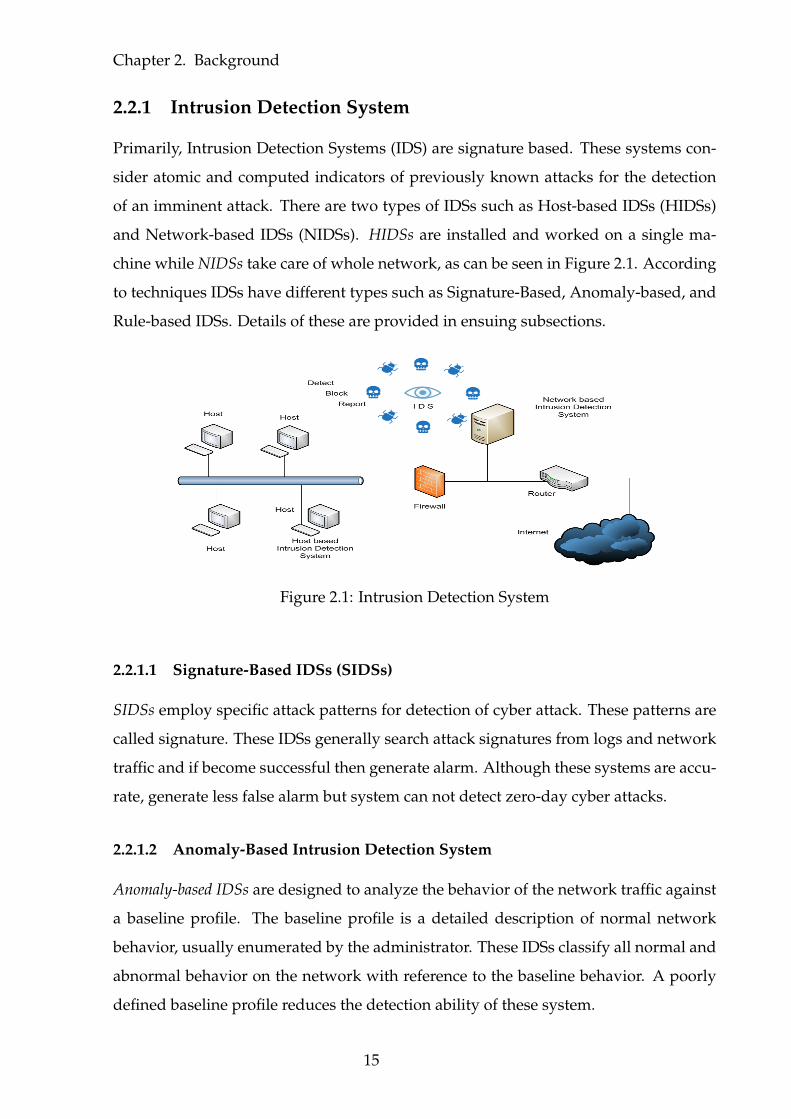
2.2.1 Intrusion Detection System
Primarily, Intrusion Detection Systems (IDS) are signature based. These systems con-
sider atomic and computed indicators of previously known attacks for the detection
of an imminent attack. There are two types of IDSs such as Host-based IDSs (HIDSs)
and Network-based IDSs (NIDSs). HIDSs are installed and worked on a single ma-
chine while NIDSs take care of whole network, as can be seen in Figure 2.1. According
to techniques IDSs have different types such as Signature-Based, Anomaly-based, and
Rule-based IDSs. Details of these are provided in ensuing subsections.
Figure 2.1: Intrusion Detection System
2.2.1.1 Signature-Based IDSs (SIDSs)
SIDSs employ specific attack patterns for detection of cyber attack. These patterns are
called signature. These IDSs generally search attack signatures from logs and network
traffic and if become successful then generate alarm. Although these systems are accu-
rate, generate less false alarm but system can not detect zero-day cyber attacks.
2.2.1.2 Anomaly-Based Intrusion Detection System
Anomaly-based IDSs are designed to analyze the behavior of the network traffic against
a baseline profile. The baseline profile is a detailed description of normal network
behavior, usually enumerated by the administrator. These IDSs classify all normal and
abnormal behavior on the network with reference to the baseline behavior. A poorly
defined baseline profile reduces the detection ability of these system.
15
Chapter 2. Background
2.2.1.3 Rule-Based Intrusion Detection System
In Rule-based IDSs, the intrusion is detected by perceiving events on the network. Rules
are applied to decide whether an activity is an intrusion or not. The malware detection
capability of such systems greatly depends on the rules. In these systems, defining
the correlation rules is the biggest challenge. Furthermore, analysts need to consider
numerous logs because they don not have an idea, which log will be relevant. To keep
track all of this requires considerable expertise. Customized protocols used by the
perpetrator makes writing rules a difficult job. With all of these challenges, manual
writing of rules is not practically feasible.
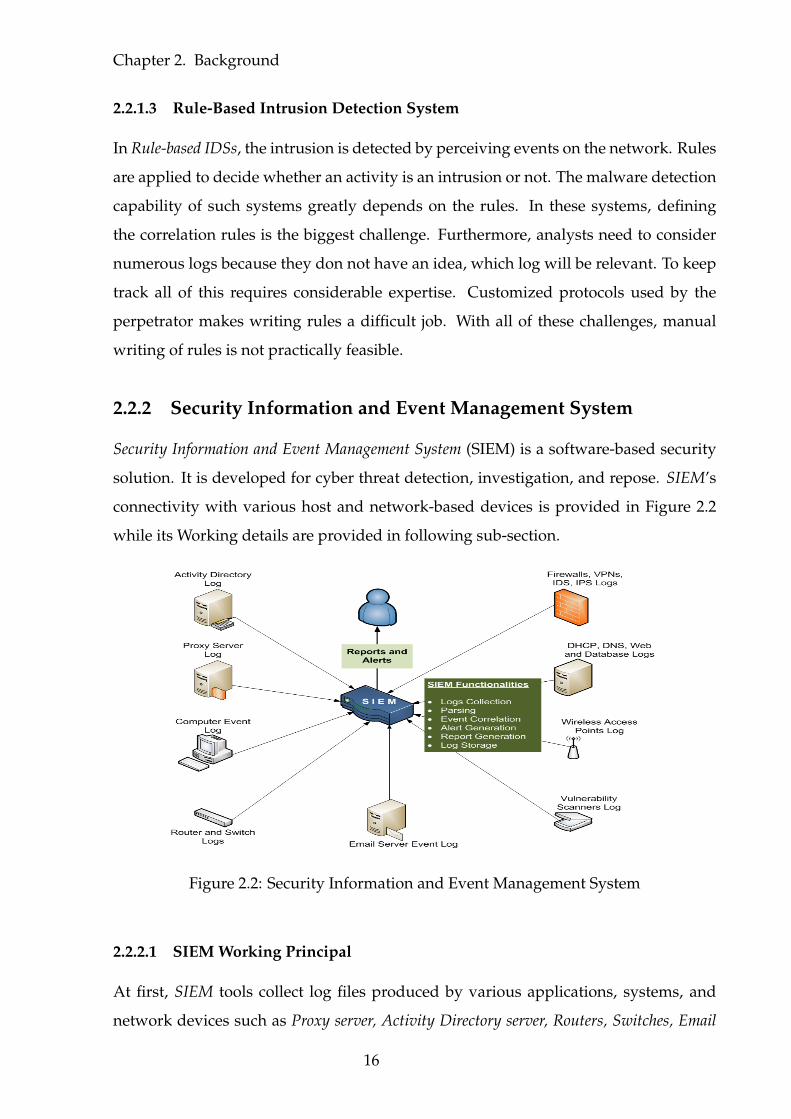
2.2.2 Security Information and Event Management System
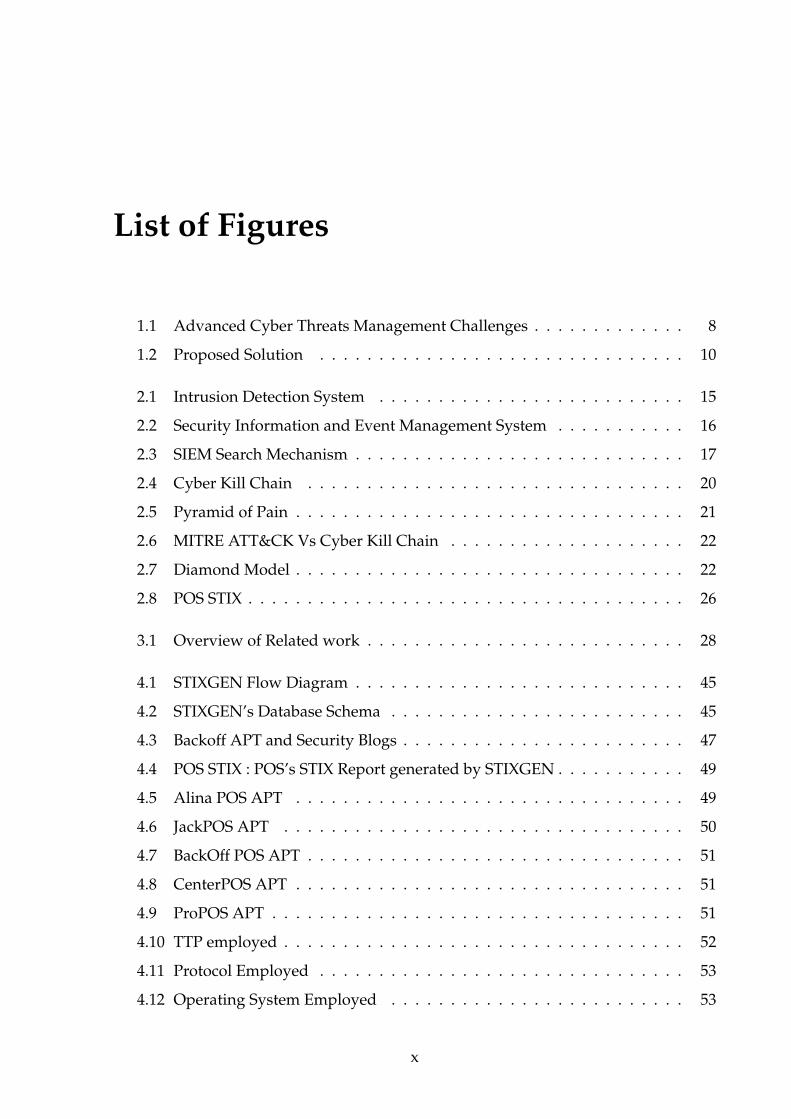
Security Information and Event Management System (SIEM) is a software-based security
solution. It is developed for cyber threat detection, investigation, and repose. SIEM’s
connectivity with various host and network-based devices is provided in Figure 2.2
while its Working details are provided in following sub-section.
Figure 2.2: Security Information and Event Management System
2.2.2.1 SIEM Working Principal
At first, SIEM tools collect log files produced by various applications, systems, and
network devices such as Proxy server, Activity Directory server, Routers, Switches, Email
16
Chapter 2. Background
servers, Access points, Database server and different Vulnerability scanners. Then, it parses
these logs and correlates events. If some malicious activity is detected then it generates
alerts.
In fact, SIEM has two main modules called Security Event Management (SEM) and
Security Information Management (SIM). The SEM is responsible for real-time monitor-
ing of events and their correlation. Once suspicious activity detected then it generates
alert and takes measures according. While, the SIM is responsible for storage and re-
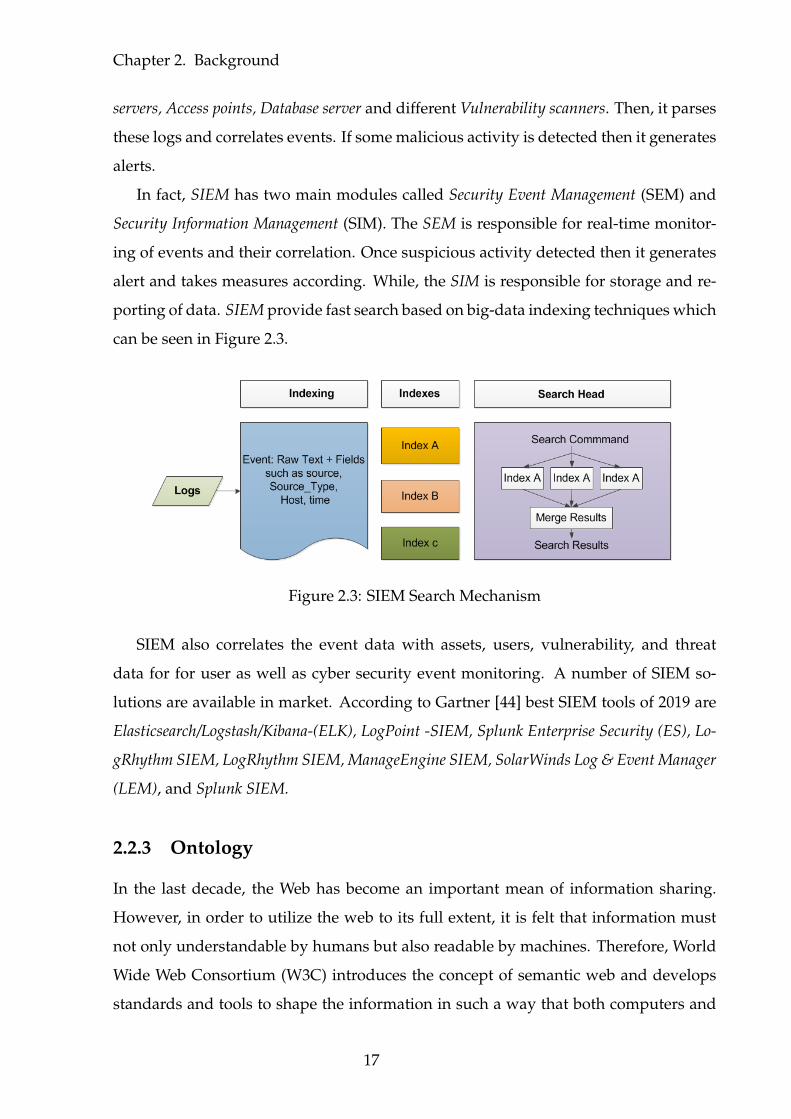
porting of data. SIEM provide fast search based on big-data indexing techniques which
can be seen in Figure 2.3.
Figure 2.3: SIEM Search Mechanism
SIEM also correlates the event data with assets, users, vulnerability, and threat
data for for user as well as cyber security event monitoring. A number of SIEM so-
lutions are available in market. According to Gartner [44] best SIEM tools of 2019 are
Elasticsearch/Logstash/Kibana-(ELK), LogPoint -SIEM, Splunk Enterprise Security (ES), Lo-
gRhythm SIEM, LogRhythm SIEM, ManageEngine SIEM, SolarWinds Log & Event Manager
(LEM), and Splunk SIEM.
2.2.3 Ontology
In the last decade, the Web has become an important mean of information sharing.
However, in order to utilize the web to its full extent, it is felt that information must
not only understandable by humans but also readable by machines. Therefore, World
Wide Web Consortium (W3C) introduces the concept of semantic web and develops
standards and tools to shape the information in such a way that both computers and
17
Chapter 2. Background
people consumes it and work in a cooperative manner. In this regard, Ontologies are
introduced which acts as a key for the semantic web.
Ontology is a graph model which represents domain knowledge, by which devel-
opers and machines can exchange domain information with each other and with other
experts. Since last few years, researchers have focused on how an ontology and linked
knowledgebase could be constructed from structured and unstructured data sources
and how to infer an attack using knowledgebase.
Ontologies are developed in the form of concepts, axioms, data values, and their
relationships. These are designed for sharing of formally represented knowledge. Web
Ontology Language (OWL) [45] is the W3C recommendation for ontologies design and
management. It is a de-facto standard of the semantic web. OWL is developed by
the World Wide Web Consortium (W3C). Formally an ontology is defined as: O =
{C,I,R,A}
C : Set of Domain’s Concepts.
I : Set of Domain’s Objects.
R : Set of Relationships between Concepts and Objects.
A : Set of Axioms holding among Concepts, Objects and their Relationships.
2.2.3.1 Rule-based Reasoning
As Web Ontology Language (OWL) cannot be used to deduce new knowledge. There-
fore, Semantic Web Rule Language (SWRL) is introduced by W3C. It is an extension of
OWL. SWRL rules are simple and are developed from OWL concepts and properties.
It has a number of data handling operations such as arithmetic, comparison, date, time
and many others. These rules have two parts i.e. antecedent (body) consequent (head).
Antecedent =⇒ consequent
When conditions in the body of the rule becomes true then conditions in the head
part must also holds.
hasClass(?x, ?z) ∧ hasClass(?y, ?z) =⇒ hasSameClass(?x, ?y)
From this rule, if Ali is studying in class seven and Aslam is also studying in class
seven then we can say that both are in same class.
18
Chapter 2. Background
2.2.3.2 Querying the Inferred Knowledge
The OWL and SWRL languages based on Open World Assumption, therefore they do
not support closure. Moreover, OWL does not support operations such as counting,
aggregation, and negation. To overcome these gaps Semantic Query-enhanced Web
Rule Language (SQWRL) and Simple Protocol and RDF Query Language (SPARQL)
are developed. It allows the use of both SWRL and SQWRL side-by-side. To count all
student of class seven following SQWRL query can be used.
student(?x, ?z) −→ sqwrl : count(?x)
The main advantage of the ontological modeling is their ability to define a semantic
model of data with its domain knowledge. Beside this, ontologies are also used to link
various types of semantic knowledge. Furthermore, it is important to highlight that
ontologies are not only used to present already shared knowledge but new domain
knowledge can be added. Therefore, it can be concluded that ontological modeling
provides data presentation, addition, searching, and reasoning capabilities.
2.3 Cyber Threat Analysis Models
Cyber attacks are increasing every year. Several security efforts are made for the pre-
vention, detection, and response of cyber attacks such as the Cyber Kill Chain (CKC) [25],
Pyramid of Pain (POP) [26], MITRE ATT&CK [20], and Diamond model [46]. CKC is
an attacker model whereas the POP is a defender model. The CKC describes various
phases of a cyber attack. Whereas, the POP model guides the security analyst on how
signatures and artifacts of various attack levels can be used for the prevention, detec-
tion, and response of cyber attack. Likewise, the MITRE ATT&CK is a knowledgebase
that provides CTI data of real cyber attacks. Similarly, the Diamond model describes
how cyber attackers launch cyber attacks. Moreover, this model also guides analysts
about the analysis of cyber attacks. Details of the aforesaid models are provided in the
following subsections.
19
Chapter 2. Background
2.3.1 Cyber Kill Chain
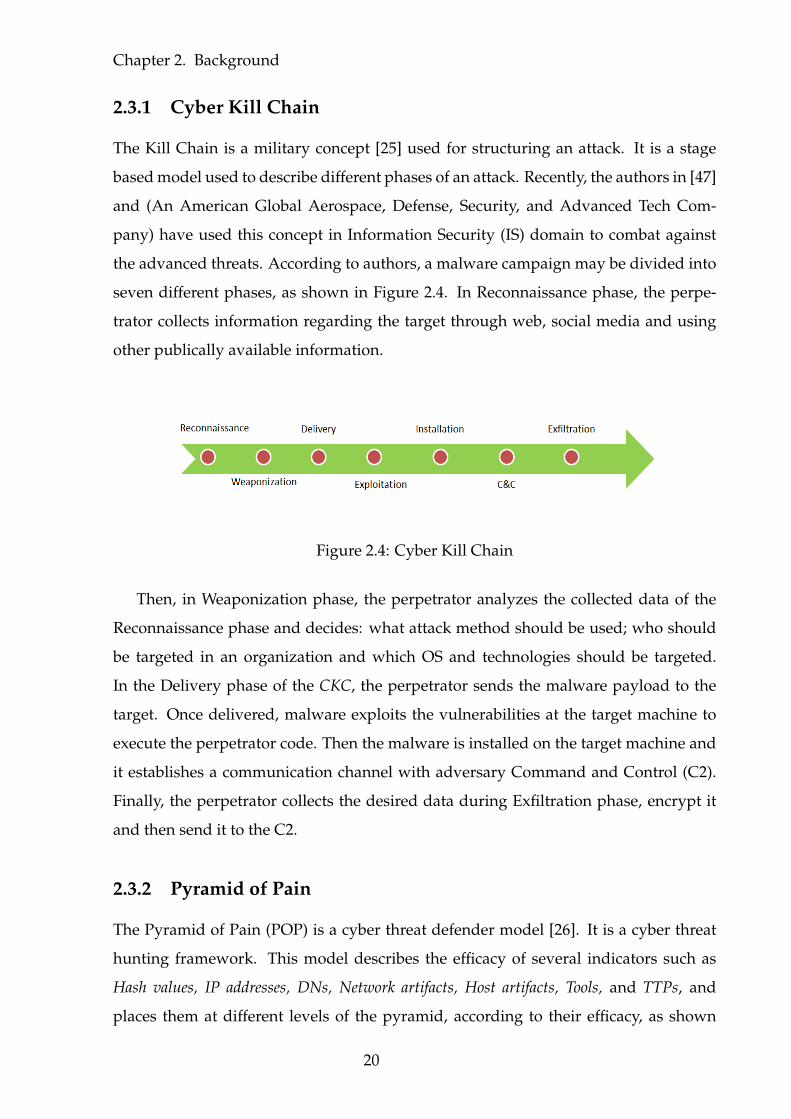
The Kill Chain is a military concept [25] used for structuring an attack. It is a stage
based model used to describe different phases of an attack. Recently, the authors in [47]
and (An American Global Aerospace, Defense, Security, and Advanced Tech Com-
pany) have used this concept in Information Security (IS) domain to combat against
the advanced threats. According to authors, a malware campaign may be divided into
seven different phases, as shown in Figure 2.4. In Reconnaissance phase, the perpe-
trator collects information regarding the target through web, social media and using
other publically available information.
Figure 2.4: Cyber Kill Chain
Then, in Weaponization phase, the perpetrator analyzes the collected data of the
Reconnaissance phase and decides: what attack method should be used; who should
be targeted in an organization and which OS and technologies should be targeted.
In the Delivery phase of the CKC, the perpetrator sends the malware payload to the
target. Once delivered, malware exploits the vulnerabilities at the target machine to
execute the perpetrator code. Then the malware is installed on the target machine and
it establishes a communication channel with adversary Command and Control (C2).
Finally, the perpetrator collects the desired data during Exfiltration phase, encrypt it
and then send it to the C2.
2.3.2 Pyramid of Pain
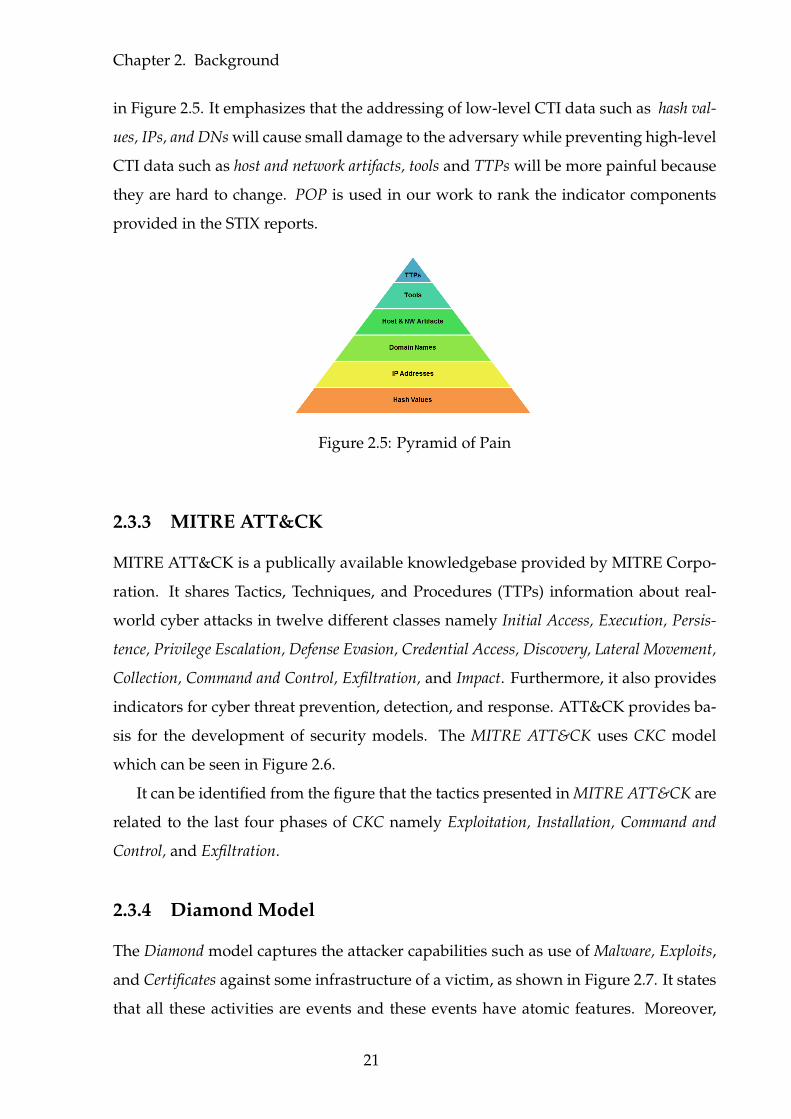
The Pyramid of Pain (POP) is a cyber threat defender model [26]. It is a cyber threat
hunting framework. This model describes the efficacy of several indicators such as
Hash values, IP addresses, DNs, Network artifacts, Host artifacts, Tools, and TTPs, and
places them at different levels of the pyramid, according to their efficacy, as shown
20
Chapter 2. Background
in Figure 2.5. It emphasizes that the addressing of low-level CTI data such as hash val-
ues, IPs, and DNs will cause small damage to the adversary while preventing high-level
CTI data such as host and network artifacts, tools and TTPs will be more painful because
they are hard to change. POP is used in our work to rank the indicator components
provided in the STIX reports.
Figure 2.5: Pyramid of Pain
2.3.3 MITRE ATT&CK
MITRE ATT&CK is a publically available knowledgebase provided by MITRE Corpo-
ration. It shares Tactics, Techniques, and Procedures (TTPs) information about real-
world cyber attacks in twelve different classes namely Initial Access, Execution, Persis-
tence, Privilege Escalation, Defense Evasion, Credential Access, Discovery, Lateral Movement,
Collection, Command and Control, Exfiltration, and Impact. Furthermore, it also provides
indicators for cyber threat prevention, detection, and response. ATT&CK provides ba-
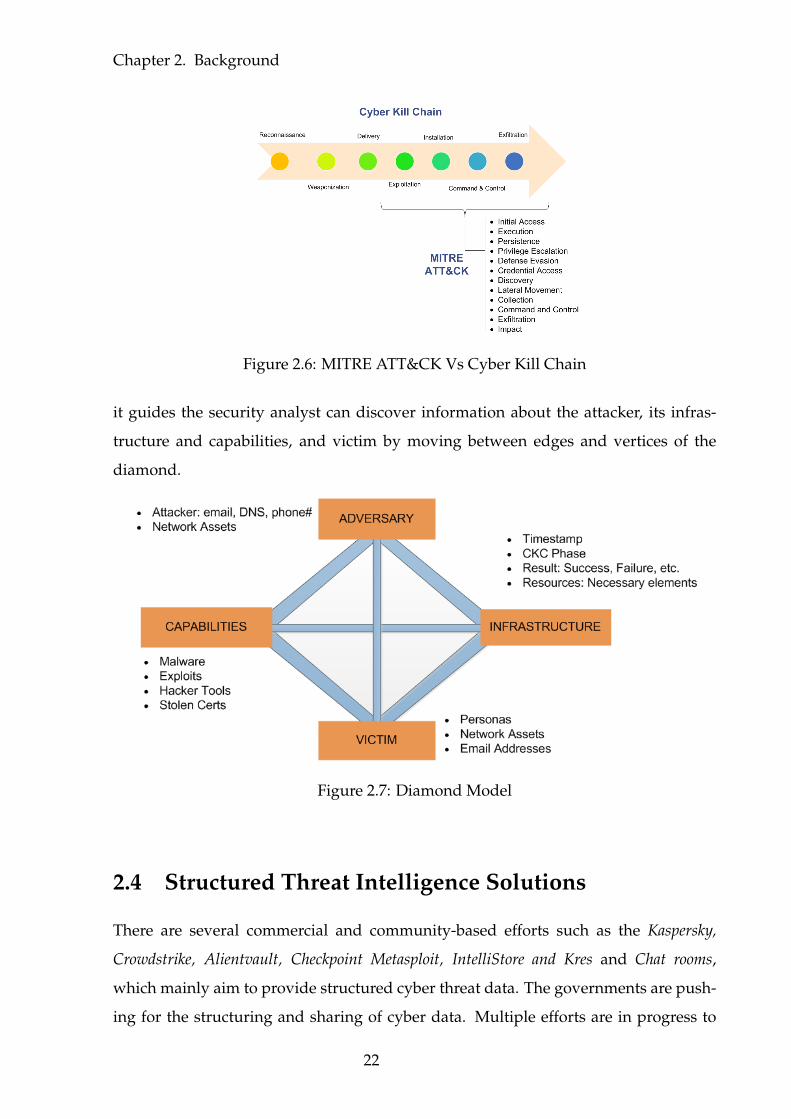
sis for the development of security models. The MITRE ATT&CK uses CKC model
which can be seen in Figure 2.6.
It can be identified from the figure that the tactics presented in MITRE ATT&CK are
related to the last four phases of CKC namely Exploitation, Installation, Command and
Control, and Exfiltration.
2.3.4 Diamond Model
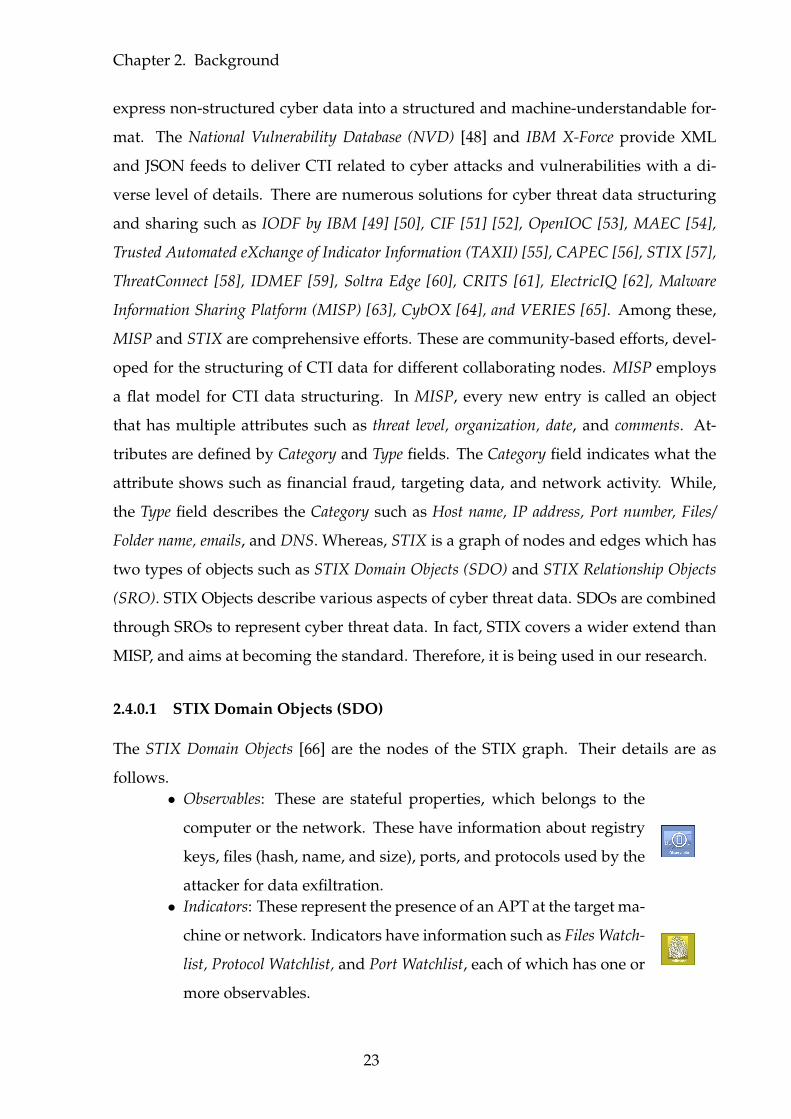
The Diamond model captures the attacker capabilities such as use of Malware, Exploits,
and Certificates against some infrastructure of a victim, as shown in Figure 2.7. It states
that all these activities are events and these events have atomic features. Moreover,
21
Chapter 2. Background
Figure 2.6: MITRE ATT&CK Vs Cyber Kill Chain
it guides the security analyst can discover information about the attacker, its infras-
tructure and capabilities, and victim by moving between edges and vertices of the
diamond.
Figure 2.7: Diamond Model
2.4 Structured Threat Intelligence Solutions
There are several commercial and community-based efforts such as the Kaspersky,
Crowdstrike, Alientvault, Checkpoint Metasploit, IntelliStore and Kres and Chat rooms,
which mainly aim to provide structured cyber threat data. The governments are push-
ing for the structuring and sharing of cyber data. Multiple efforts are in progress to
22
Chapter 2. Background
express non-structured cyber data into a structured and machine-understandable for-
mat. The National Vulnerability Database (NVD) [48] and IBM X-Force provide XML
and JSON feeds to deliver CTI related to cyber attacks and vulnerabilities with a di-
verse level of details. There are numerous solutions for cyber threat data structuring
and sharing such as IODF by IBM [49] [50], CIF [51] [52], OpenIOC [53], MAEC [54],
Trusted Automated eXchange of Indicator Information (TAXII) [55], CAPEC [56], STIX [57],
ThreatConnect [58], IDMEF [59], Soltra Edge [60], CRITS [61], ElectricIQ [62], Malware
Information Sharing Platform (MISP) [63], CybOX [64], and VERIES [65]. Among these,
MISP and STIX are comprehensive efforts. These are community-based efforts, devel-
oped for the structuring of CTI data for different collaborating nodes. MISP employs
a flat model for CTI data structuring. In MISP, every new entry is called an object
that has multiple attributes such as threat level, organization, date, and comments. At-
tributes are defined by Category and Type fields. The Category field indicates what the
attribute shows such as financial fraud, targeting data, and network activity. While,
the Type field describes the Category such as Host name, IP address, Port number, Files/
Folder name, emails, and DNS. Whereas, STIX is a graph of nodes and edges which has
two types of objects such as STIX Domain Objects (SDO) and STIX Relationship Objects
(SRO). STIX Objects describe various aspects of cyber threat data. SDOs are combined
through SROs to represent cyber threat data. In fact, STIX covers a wider extend than
MISP, and aims at becoming the standard. Therefore, it is being used in our research.
2.4.0.1 STIX Domain Objects (SDO)
The STIX Domain Objects [66] are the nodes of the STIX graph. Their details are as
follows.• Observables: These are stateful properties, which belongs to the
computer or the network. These have information about registry
keys, files (hash, name, and size), ports, and protocols used by the
attacker for data exfiltration.• Indicators: These represent the presence of an APT at the target ma-
chine or network. Indicators have information such as Files Watch-
list, Protocol Watchlist, and Port Watchlist, each of which has one or
more observables.
23
Chapter 2. Background
• Incidents: They detail victims, assets effected, and the impact of the
cyber attack.
• Tactics, Techniques and Procedures (TTPs): These depict the behavior
or the strategy of a cyber attacker.
• ThreatActor (TA): This component describes a malicious actor,
which launches a cyber attack.
• Exploit Targets: These describe the weaknesses of a target system
and its network.• Campaign: This component is a collection of instances of the Ac-
tor’s presumed intents, which can be observed through TTPs, in-
cidents, indicators, and exploits across the organizations.
• Course of Actions (COA): These are the specific measures for the
prevention, detection or response to a cyber attack.
• Attack Pattern: It is a type of TTP that are used by TAs to compro-
mise targets.
• Identity: It is used to represent information related to individuals,
organizations, and groups such as contact information and sectors.
• Malware: It is a type of TTP or software used to compromise the
target’s data.
• Tool: These are tools that are used by attackers to perform cyber
attacks.• Report: These are collections of the CTI data about various STIX
domain objects.
2.4.0.2 STIX Relationship Objects (SRO)
The STIX Relationship Objects [66] are the edges of the STIX graph. STIX has defines
two types of SROs. Details are as follows.• Relationship: It describes the SDO’s relationship with itself or with
another SDO. Relationship’s examples are uses, mitigates, targets,
and indicates.• Sighting: It is a count which indicates how many time a SDOs is
observed.
24
Chapter 2. Background
2.4.1 STIX Use Cases
The STIX provides four high-level use cases for cyber threat management [67] which
are (1) cyber-threat analysis, (2) specifying indicator patterns, (3) managing cyber threat re-
sponse activities and (4) CTI sharing.
In these, the “managing cyber threat response activities” is the most important use case,
which expresses the significance of different STIX components with the cyber threat
management life-cycle. The use case characterizes the significance of different STIX
components according to the cyber threat management life-cycle. The use case asserts
that all STIX components are not equally important for every phase of cyber threat
management rather certain components are more relevant to a particular phase. For
example, exploits and their COAs are necessary for cyber threat prevention, indicators
and observables are essential for cyber threat detection, while indicators, observables and
their respective COAs are important for the cyber threat response phase.
2.4.2 STIX-Shifter
STIX-Shifter [68] is a python based open-source library. It uses STIX Patterning mod-
ule to connect with various cyber threat products that have data repositories. STIX
Patterning module takes STIX patterns as an input, searches data from the connected
data repository, and if matches, then return the identified pattern. Afterwards, the
STIX-Shifter converts the identified pattern into STIX format.
2.4.3 STIXViz
STIXViz is a graphical tool [35] that is designed and developed by the STIX project.
This tool is implemented in JavaScript and HTML by employing the NW.js application.
STIXViz is designed for the visual analysis of STIX reports in the node-link graph. In
this tool, multiple views such as graph, tree, and timeline are provided for visual analysis
of the STIX reports. Where the graph view provides a forced directed graph of STIX’s
components, tree view shows the STIX’s components in a tree structure, whereas the
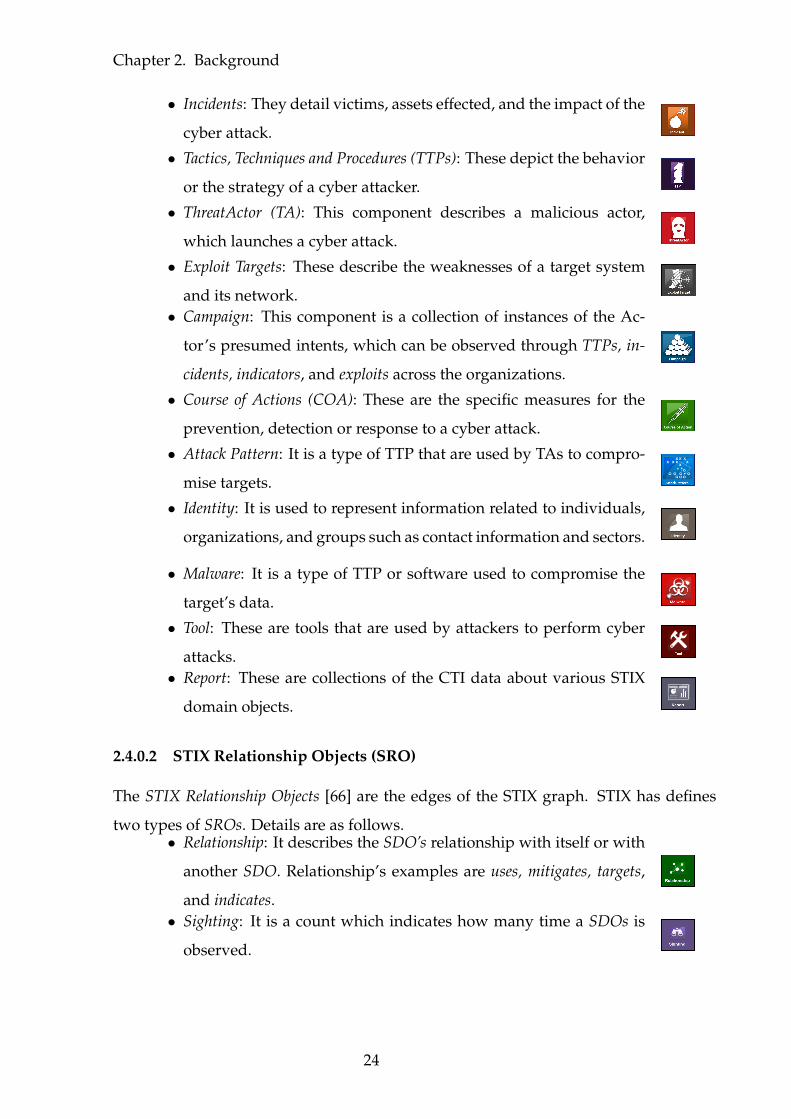
timeline view displays time-stamped STIX components. The tree view of Point of Sale
(POS) APTs is shown in Figure 2.8.
25
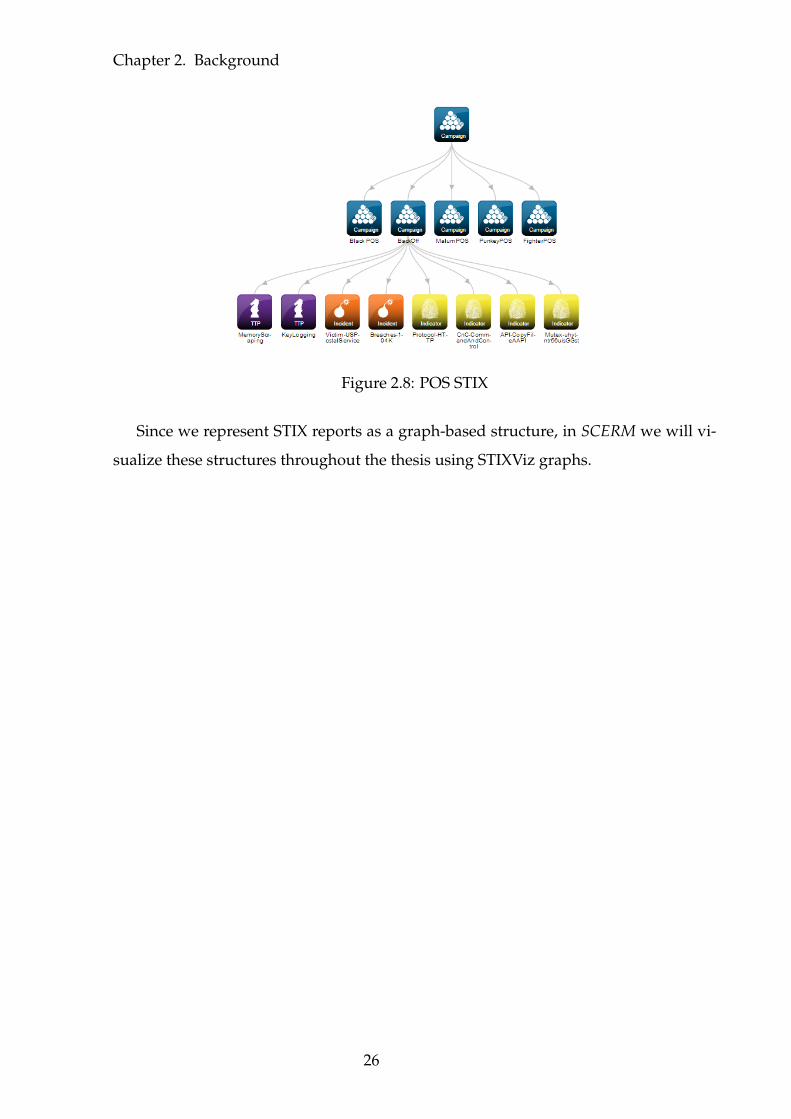
Chapter 2. Background
Figure 2.8: POS STIX
Since we represent STIX reports as a graph-based structure, in SCERM we will vi-
sualize these structures throughout the thesis using STIXViz graphs.
26
Chapter 3
Related Work
3.1 Introduction
The research work shared in the thesis is innovative and comprises of closely-meshed
research disciplines. This work includes APTs analysis and classification, structured
threat data generation, boosting, evaluation, and refinement of CTI data for CTM. It
is therefore important that before sharing this state-of-the-art research work with the
reader, a brief description of the related works and their critical comparison with the
research work be presented, where appropriate.
3.2 Overview
Due to the novelty of this research work, there is a lack of literature directly related to
this domain. Research is being carried out on closely related domains. To understand
our research, it is necessary to grasp these associated research domains. Therefore,
various closely related research domains are thoroughly studied and are made part of
this thesis, as can be seen in Figure 3.1. For example, this research is mainly related to
APTs. Therefore, a section is provided to understand APTs, their TTPs, and analysis
models as shown in the first branch of the taxonomy tree shown in Figure 3.1. Similarly,
the second branch of this diagram shows the taxonomy of cyber threat data which is
necessarily important for APT analysis. Therefore, a section is added that describes the
importance and quality of structured CTI data. Moreover, this section shares publicly
available tools for the generation of structured CTI data. Next, in the third branch
27
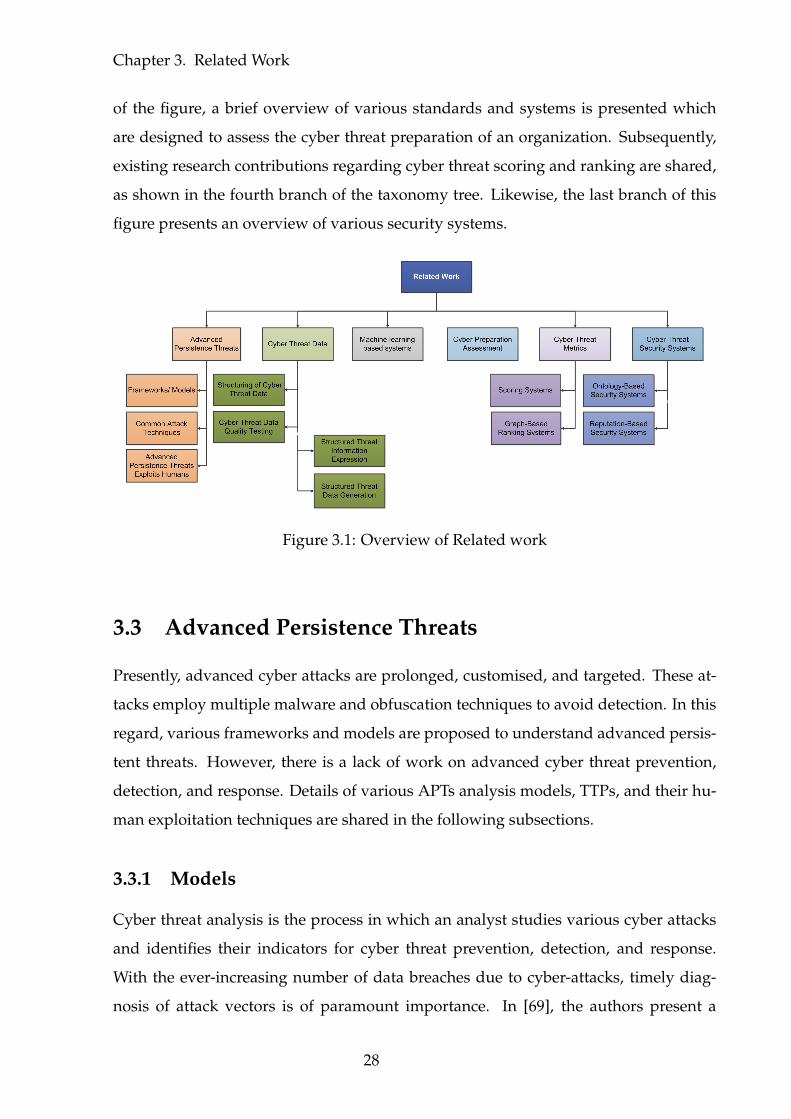
Chapter 3. Related Work
of the figure, a brief overview of various standards and systems is presented which
are designed to assess the cyber threat preparation of an organization. Subsequently,
existing research contributions regarding cyber threat scoring and ranking are shared,
as shown in the fourth branch of the taxonomy tree. Likewise, the last branch of this
figure presents an overview of various security systems.
Figure 3.1: Overview of Related work
3.3 Advanced Persistence Threats
Presently, advanced cyber attacks are prolonged, customised, and targeted. These at-
tacks employ multiple malware and obfuscation techniques to avoid detection. In this
regard, various frameworks and models are proposed to understand advanced persis-
tent threats. However, there is a lack of work on advanced cyber threat prevention,
detection, and response. Details of various APTs analysis models, TTPs, and their hu-
man exploitation techniques are shared in the following subsections.
3.3.1 Models
Cyber threat analysis is the process in which an analyst studies various cyber attacks
and identifies their indicators for cyber threat prevention, detection, and response.
With the ever-increasing number of data breaches due to cyber-attacks, timely diag-
nosis of attack vectors is of paramount importance. In [69], the authors present a
28
Chapter 3. Related Work
framework to model APTs attack by using Intrusion Kill Chain (IKC) which is simi-
lar to the Lockheed Martin (LC) KC. The researchers in [70] classify APTs attack into
five different phases from malware delivery to data exfiltration. They do not discuss
the Reconnaissance and Weaponization phases of APTs.
In [71], the authors present the analysis of different attacks and on the basis of these,
they describe an attack process model. The model has eight different steps and some of
these are similar to CKC. The authors in [72] present a computer attack taxonomy that
has five components such as Target, Carrier, Vulnerability, Privilege Escalation and Firing
Source.
All of these research works study APTs from different angles. Therefore, to get
maximum benefits from these, it is required to use these works holistically. Accord-
ingly, these are combined for analysis, boosting, valuation, and refinement of APTs for
different phases of CTM.
3.3.2 Tactics, Techniques, and Procedures
Research shows that tactics and techniques in multiple APTs remain the same or used
with small changes. Therefore, if analysts know the general technique of APTs then
they can detect multiple APTs easily. The McAfee in [70] outlines that during the anal-
ysis of a single Command and Control (used by Operation Shady Rat) their researchers
have found a single organization that hacked almost 71 companies of 31 diverse indus-
tries of different countries. In [73], the researchers developed a technique to identify
the patterns in DNS to infer whether an attack is generated by an algorithm or by some
human beings. This technique can be employed to detect domain fluxing. The authors
in [74] provide a survey of various obfuscation techniques that are being employed by
APTs such as Dead-Code insertion, Subroutine Reordering, Register Reassignment, Instruc-
tion Substitution, Code Transposition, and Code Integration. Moreover, they also predict
future trends of obfuscation techniques such as JavaScript and Emulation of virtual pro-
cessors.
Eric et al. [39] present a layered taxonomy model to classify cyber threat sharing
platforms. The proposed model defines five layers namely Transport, Session, Indicators,
Intelligence and 5Ws. The Transport layer is the first layer, it provides communication
between different organizations to share the CTI data. The Session Layer is the second
29
Chapter 3. Related Work
layer of the model which provides authentication and authorization services. The third
layer is the Indicators layer that shares information about patterns or observables that
show the presence of the cyber attack within a network. The Intelligence layer is the
fourth layer that describes the COAs i.e. when and what to do. The topmost layer 5W’s
illustrates the actors, techniques, procedures, and victims. Moreover, authors map
information sharing technologies such as STIX, IODEF, and YARA to the proposed
taxonomy. They highlight that STIX has a broader range of terms like TTPs, Indicators,
and Course of Actions than others.
All of these research works highlight that TTPs are very important for attackers
because they invest greater time and money on them [26]. Therefore, for effective
cyber threat management, the prevention, detection, and response of the TTPs are
paramount important. Due to these facts, our research work considered TTPs as the
topmost indicator for the analysis and valuation of the APTs.
3.3.3 Advanced Persistence Threats Exploit Humans
Presently, attackers are extensively using social engineering techniques such as Emails,
Facebook, LinkedIn, and Blogs for the Reconnaissance and Delivery phases of a cyber
attack. In [75], the authors describe that social media is widely used for target re-
connaissance and the delivery of malware. They also present the taxonomy of social
engineering that classifies cyber attack characteristics and attack scenarios. In [76], the
author presents different techniques, which can be used to send malicious codes to
victim machines. Spear phishing and web-based click hijacking are mostly used for
malware delivery. The authors in [77] describe that the Reconnaissance and Delivery
phases of APTs are successful because of human manipulation. They highlight some of
the famous examples of APTs that uses human manipulation for delivery of the APTs
such as Stuxnet uses USBs; Dugu uses infected MS Word files via email; Red October
uses infected MS Word and Excel documents via spear-phishing; Operation Aurora uses
infected web sites; Operation Shady Rat uses infected MS Word, Excel and PDF documents
via spear phishing and RSA attacks uses MS Excel documents attachment within spear-
phishing emails.
All of the above research works describe that APTs are widely exploiting humans
through social engineering techniques. In our research, human aspects of the APT’s
30
Chapter 3. Related Work
indicators are particularly focused because of their paramount importance seen in the
research works.
3.4 Cyber Threat Data
Cyber threat data provides information regarding context, tactics, techniques and pro-
cedures, TTPs, indicators, impact, and remedial actions of cyber attacks. For example,
IPs, domain names, hash values, filename, registry entries, protocols used, obfuscation meth-
ods, and TTPs. This data is used for the prevention, detection, and response of cyber
attacks. Although, a large amount of cyber threat data is publicly available, however,
most of the data is unstructured and distributed which cannot be read by machines
and humans as well. Due to the large volume and unstructured nature, analyzing this
information about cyber incidents is a challenging task for security analysts. In sub-
sections, first of all, a brief description of different structuring techniques are shared.
Then, various solutions of structured CTI generations are described. Finally, state of
CTI data is presented.
3.4.1 Structuring of Cyber Threat Data
Multiple efforts are being carried out for expressing non-structured information into
the structured and machine-understandable format. In this regard, few efforts are
made for structuring and sharing of CTI data. IBM X-Force [22] and National Vul-
nerability Database (NVD) [48] provide an XML feed that gives information regarding
cyber-attacks and vulnerabilities with the diverse degree of details. There exist mul-
tiple standards of threat information exchange such as CIF, IODF by IBM, CRITS by
Community, OPEN IOC, STIX, TAXII, and Cybox.
Furthermore, researchers decompose multiple CTI structuring formats such as
IODEF, STIX [28] and YARA [29] according to the various layers of the proposed taxon-
omy model [39] and explore interoperability between these. Moreover, they conclude
that STIX is a promising standard, which provides broader concepts of CTM namely
the TTPs, exploits, indicators, observables, COAs, threat actors and incidents. Clemens et
al. [31] conducted a survey to examine cyber threat intelligence platforms. During the
study, they analyze, compare 22 threat intelligence platforms and identify STIX as a
31
Chapter 3. Related Work
de-facto standard, which not only structures CTI data but also provides visualization
and analysis capabilities.
Sara et al. [78] present a cyber threat analytic platform called STIX Analyzer, which
is built on Web Ontology Language - OWL ontology, CVEs, CyboX and STIX. STIX Ana-
lyzer is developed to analyze cyber attacks. It acquires STIX repositories, extracts STIX
components: TTPs, exploits, indicators, observables, incidents and populates the ontol-
ogy. Then it performs inferencing by employing Semantic web Rule Language - SWRL to
identify the exploits and to perform risk analysis within the network.
Although multiple efforts are being carried out for the structuring of CTI data
which are competing and have many things in common. However, research shows
that STIX and YARA are most prominent. We have also chosen to formalise the STIX
format for our research because of its popularity.
3.4.2 Structured Threat Data Generation
The manual process of sifting through tons of log data to pinpoint APTs tactics and
techniques is a challenging job. Efforts are required for the automatic detection of APTs
techniques. Accordingly, several tools are developed for expressing unstructured CTI
into the structured and machine-understandable format. A few of these tools are as
follows.
3.4.2.1 STIX Data Generator
STIX Data Generator (SDG) [79] is developed by the Cosive team, which offers “Ran-
dom and Selected” modes for STIX generation. In both of these modes, SDG does not
take CTI data from the user for STIX generation but uses test data only. Moreover,
if we select a single CTI parameter (URL) or several parameters (URL, IP, DNs), the
generated STIX remains the same.
3.4.2.2 Python-STIX Library
The Python-STIX library [80] has been developed by the MITRE Corporation, which
provides an API for the creation and parsing of a STIX XML report. It is a console-
based solution, which requires programmer level expertise for data entry and STIX
32
Chapter 3. Related Work
generation. These requirements limit the utilization of STIX and due to the manual
process, there are always chances of errors in generated STIXs.
3.4.2.3 IBM X-Force Exchange
IBM has a CTI platform by the name of “X-Force Exchange” [22] which allows organi-
zations to consume and share threat intelligence, and get benefit from the contributions
of IBM’s experts. It provides CTI in textual as well as in STIX format. Besides human
aid, it is also supported by machine-generated CTI. It provides a free API, which gives
limited programmatic access for non-commercial use.
Presently, there is a lack of easy to use frameworks, which produce and share
distinct, error-free, and threat relevant CTI data in a structured form. All of these
problems are the motivation for our research work. Therefore, we developed a sub-
framework that structures CTI data in STIX format.
3.4.3 Cyber Threat Intelligence Quality Testing
In [81], researchers introduce an Intelligence Quotient Test tiq-test, which employs mul-
tiple tests to measure the novelty, life span, population and uniqueness of the CTI data.
Where the Novelty test details how often a threat feed updates itself, the Aging test mea-
sures the life span of the indicator on the feed i.e. how long an indicator stays on a feed.
The Population test guides the user on how the population distribution of the CTI feed
compares with the user’s data. The Uniqueness test highlights how many unique indi-
cators are present on a CTI feed. The Overlap test checks how many threat indicators
are repeated on different threat intelligence feeds.
Roland et al. [82] present FeedRank, an algorithm for the ranking of cyber threat in-
telligence feeds (CTIF). The FeedRank valuates the CTIFs according to the novelty of
their provided information and the reuse of their contents by other CTIFs. It performs
the temporal correlation of the feed’s contents to identify the dishonest feeds among
the real feeds. In [83], the authors use a triangulation study for analysis and classifi-
cation of cyber threat data sources. This study comprises of literature review, a quan-
titative analysis of expert-level discussion on Twitter, and a data sources survey. In
total, 68 publicly available cyber threat data sources are analyzed and classified based
on Information type, Timelines, Integrability, Originality, Type of source, and Trustworthi-
33
Chapter 3. Related Work
ness. In [84], the authors proposed a framework namely Enhanced Cyber Attribution
Framework (NEON). At first, NEON gets cyber threat data from various sources such
as security blogs, social media, honey pots, incident detection systems, and network
forensics. Then, it correlates the input data. Subsequently, NEON employs a game
theory approach to propose optimal security response.
These efforts describe several characteristics of the CTI data and compare different
threat feeds, however, these do not discuss the valuation of CTI data for CTM. On the
other hand, our research not only explores several traits of CTI data but it also valuates
the structured CTI data for CTM.
3.5 Cyber Preparation Assessment
The cyber threat landscape is continuously changing. Attackers are using new tactics
and techniques, which enable them to target a wide range of organizations within and
across the borders. Therefore, organizations are being required to define their strate-
gies for cyber threat management. Cyber Prep 2.0 [85] is a threat oriented methodology
presented by MITRE Corporation to identify the threat levels faced by an organiza-
tion. It defines five classes of cyber threats that are formulated on the attacker’s inten-
tion such as cyber Vandalism, Incursion, Breach, Organizational Disruption, Espionage and
Cyber Supported Strategic Extended Disruption. Similarly, it describes five correspond-
ing classes of organizational preparation according to the expertise of an attacker such
as inexperienced, average resourced, experienced and well-resourced attacker. These classes
guide an organization to prepare its business risk management framework, define its
cybersecurity methodology and designate inconsistency between its risk management
framework and methodologies.
Mark et al. [86] present an Operational Threat Assessment framework called OTA.
It describes the process of collecting information regarding the system under assess-
ment from classified and open-source documents. Afterwards, it identifies threats and
vulnerabilities of the system. Subsequently, it confirms remedial actions accordingly.
The OTA framework employs a generic threat matrix (GTM) to identify the threat level
faced by an organization. The GTM defines two types of threat attributes such as com-
mitment and resource. The commitment attributes describe the threat such as threat
34
Chapter 3. Related Work
intensity, stealth, and duration, while the resource attributes define people, knowledge,
and access. These attributes represent eight different threat levels i.e. 1 to 8, which de-
scribe dangerous to the least capable threat, in sequence. In [87], researchers present a
Cyber Threat Intelligence capability model (CTI-CM). This model describes various ca-
pabilities required for cyber threat experts such as analytical component capability (ACC),
contextual response capability (CRC), and experiential practice (EPC). The ACC is associ-
ated with the management of the analytical aspects of CTI. The CRC is related to man-
aging business and security to respond to APTs. Whereas, the EPC is a capability that
belongs to solutions formulation.
Anoop and Ximming [88] present a security risk analysis model of enterprise net-
works by using probabilistic attack graphs. This model describes how several vul-
nerabilities may be clustered to attack a network. It measures the security risk of the
enterprise network by using the common vulnerabilities score CVSS [89]. At first, it
accumulates the vulnerabilities by using a probabilistic attack graph, which represents
all the attack paths that allow network penetration, then it propagates the possibility
of a cyber attack through the graph. Using this attack graph technique, the security
assessment can cause a high degree of complexity if the network is too large. Another
limitation of the proposed model is that since it solely relies on the availability of vul-
nerability scores (CVSS), if a zero-day vulnerability is employed than the assessment
will fail. In contrast, in our research, the refinement phase will discover appropriate
preventive actions from similar attacks that have been seen before even if the informa-
tion about the particular vulnerabilities does not exist in the report.
By comparing Cyber Prep, OTA and our research, it can be identified that Cyber
Prep employs qualitative metrics, only, while OTA and our research use qualitative, as
well as quantitative metrics. The OTA identifies threats faced by an organization and
proposed remedies accordingly, however, it does not valuate the CTI data for CTM.
Whereas, our research performs valuation and refinement of CTI data for different
phases of CTM.
35
Chapter 3. Related Work
3.6 Machine learning based systems
In [81], researchers introduce an Machine Learning based Security project (MLSec),
which employs machine learning techniques to measure the novelty, life span, popula-
tion and uniqueness of the CTI data. These tests are written in the R language. MLSec
takes low-level artifacts such as IP and Domain Names in structured format that is .csv.
In [90], researchers present a supervised machine learning (SML) approach for au-
tomatic extraction of high-Level threat intelligence from unstructured data sources. It
uses Natural Language Processing (NLP) based learning of a Named Entity Recogni-
tion (NER) model for extraction of high-level CTI data from the textual content. Sub-
sequently, the proposed solution removes data redundancy and provides CTI in STIX
format. Moreover, it ranks the text sources according to the novelty and quality of their
shared data.
In [91], the authors propose a machine learning based frame work namely Data
Breach Investigation Framework (DBIF). It detects cyber attacks on the basis of identified
cyber threat indicators. DBIF receives cyber threat investigation reports as input, in-
dexes them, and prepares a TTP dictionary. Afterwards, the DBIF framework is trained
on extracted TTPs for detection of cyber attacks.
In [92], researchers share a framework called Artificial Intelligence (AI) based Cyber
Threat Framework which is designed to detect AI-based cyber attack. This framework
is based on the Cyber Kill Chain (CKC) that is employed to understand various cyber-
attacks and to opt multiple defensive strategies. It divides CKC stages into three phases
namely Planning, Intrusion, and Execution. The Planning phase consists of the first two
stages of CKC namely Reconnaissance and Weaponization. This phase is responsible for
target research and to identify weaponizing deliverable. Intrusion is the second phase
of the proposed framework that consists of three stages of the CKC namely Delivery,
Exploitation, and Installation. This phase describes the exploitation, delivery, and instal-
lation of the malicious code. Whereas, the Execution phase comprises of Command and
Control and Exfiltration stages of the CKC. This phase details the paths and objectives
of the threat actor.
These efforts describe several characteristics of the CTI data, however these do not
address the valuation and refinement of CTI data to a sufficient extent for cyber threat
management. On the other hand, this research work not only explores several traits of
36
Chapter 3. Related Work
CTI data but it also valuates and refines the structured data for cyber threat manage-
ment.
3.7 Cyber Threat Scoring System
Peter et al. present a Common Vulnerability Scoring System [89] to measure the risk
associated with computer vulnerabilities. It is a comprehensive system, which consists
of the base, the temporal and the environmental metric groups. Where the bases metric
group describes vulnerability’s inheritance characteristics, the temporal metric group
describes such characteristics of vulnerabilities that change with respect to the time,
whereas the environmental metric explains such characteristics of the vulnerabilities
which change with respect to the environment.
TISA [93] is a scoring and analysis model for threat intelligence, which uses natural
language processing (NLP) and machine learning techniques for scoring and analysis
of threats. It is designed to identify and prioritize the CTI indicators. Similarly, the
Common Weakness Scoring System (CWSS) [94] is a community-based effort, which is
designed to identify the weaknesses of a software. CWSS is very simple in operation.
At first, it offers quantitative measurements of the software’s weaknesses and then
prioritizes them. CWSS is different from CVSS in many aspects one of which is the
usage scenarios. For example, CVSS is used to assess already identified vulnerabilities,
whereas CWSS can be used earlier.
All of these efforts are aimed to assess the risk associated with software vulnerabil-
ities. Whereas our research work assesses the structured data and valuates it for CTM
life-cycle, which improves cyber threat prevention, detection and response results.
3.8 Graph-Based Ranking Systems
Hassan and Lise [95] present the FutureRank algorithm [95] for future citation calcu-
lation of research articles. This algorithm combines information regarding authors,
publications and citations for predicting the future ranking of scientific articles. The
FutureRank algorithm is based on a number of assumptions. For example, important
publications are cited by other important publications, authors with high repute pro-
37
Chapter 3. Related Work
duce high-quality publications, recently published publications will be cited more in
the future and among old publications, and newly cited publications are more useful.
The arXiv (High Energy Physics Theory (hep-th) from 1993 to 2003) dataset is used to
evaluate the FutureRank algorithm. Lawrence et al. [96] share a web page ranking tech-
nique called PageRank which is based on the graph of web lines without considering
the contents of the actual web pages. Web pages have forward links (out-edges) and
backward links (in-edges) for other web pages. The proposed algorithm is based on
the assumption that the rank of a web page is high if the sum of its backlinks (in-edges)
is high and backlinks from important web pages are more vital than average or normal
web pages’ backlinks.
Wenzheng et al. [97] present a structural diversity model to find the most persuasive
users. Social networks are the most economical and rapid way of marketing. The com-
pany selects the most influential users on the social network and gives them product
samples without any cost. These users then endorse the offered product to their social
media friends. According to the proposed model, a user is more likely to accept a prod-
uct recommendation if more of his friends with diverse contexts suggest the product to
him. For the evaluation of their proposed model, they use datasets from four real social
networks namely NetHEPT - arXiv High Energy Physics theory section, NetPHY - arXiv
Physics section, Facebook - Online social network and DBLP - Computer Science Bibliography.
In another similar work, Wang et al. [98] present a conformity based model to find the
top-k most persuasive users. This model is based on emotional conformity i.e. during
retweet, how much a user follows the original user from the emotional point of view.
The sentiments are expressed -1 or negative or opposite to original user, 0 or neutral and
1 or positive sentiment or same sentiment with the original user. To evaluate the proposed
model, a dataset from a famous Chinese social media platform is collected.
Zahid et al. [99] present a dynamic cybersecurity solution for a power grid. A power
grid is a network, which delivers electricity from the power station to the consumers.
As these systems have modernized and computer networks have become core compo-
nents of these, hence their security has become critical. Although the perfect security
of these systems is ideal, however, it is not possible due to budgetary constraints. The
solution is proposed to figure out the spending on the security devices that are most
critical. The proposed solution takes electrical network configurations with budgetary
38
Chapter 3. Related Work
constraints and security schemes as an input, identifies the critical devices and selects
the best scheme for maximum security.
Abel and Allan [100] present a systematic review to estimate the use of Open Source
Intelligence (OSINT) to identify the threats and exploits on social networks for reme-
dial purposes. They retrieved eighteen research papers and reviewed them. Eleven
out of eighteen papers, quantitatively recognized social media vulnerabilities because
of user’s ignorance, while three studies qualitatively identified a small set of Person-
ally Identifiable Information (PII) that users require to provide for social media inter-
actions.
The above-stated ranking systems generally talk about the ranking of published pa-
pers, web sites, and social media users but none of these consider CTI data refinement
and valuation for different phases of CTM, which is the core theme of our research.
3.9 Reputation-Based Security Systems
According to the McAfee corporation [101], nowadays organizations are relying on
reputation-based security systems. These systems provide reputation scores for dy-
namic policy decisions. Traditional security systems are static: whitelist and blacklist
systems, whereas reputation-based systems learn and update the reputational score of
the indicators or observables with the time. System confidence is built through data vol-
ume, longevity, and trustworthiness.
Tayson [102] proposes a reputation-based security system. The central entity In-
telligence Head Quarter - IHQ receives raw cyber threat data from multiple sensors. It
combines and processes the input data, prepares a threat list and then shares it with
all the sensors, which collects cyber data accordingly. The collected data may have
IPs, ASNs, Ports, DN, CIDR blocks, and Payload. Subsequently, IHQ gets collected data
from the sensors, processes it and computes a reputation score for indicators or observ-
ables. Afterwards, the IHQ prepares an updated threat list and shares it with sensors
for further data collection. This data cycle between sensors and the IHQ repeats, which
provides system maturity, anomalies and attack detection on the basis of regular pat-
terns.
Allan and Christopher [103] present a system TIC, which receives threat indicators
39
Chapter 3. Related Work
from the data source and shares it through a graphical user interface with the cyber
threat analyst. The analyst evaluates the provided indicator on the basis of several char-
acteristics and calculates the TIC score accordingly. Then, the computed TIC score is
shared with the data source and saved into a TIC server for future processing. All of
these systems perform CTI data evaluation on the basis of indicators’ occurrence and
do not consider the efficacy of indicators for CTM.
In contrast to these systems, our solution evaluates indicators on the basis of their
efficacy and ranks them according to the POP model and the STIX use case on manag-
ing cyber threat response activities.
3.10 Inference or Ontology-Based Security Systems
Few efforts has been made on ontologies and are generally based on the representation
of the cyber-attacks attributes in a taxonomical structure. In [104], the authors suggest
countermeasures based on the cost of the metrics. The researchers in [105] describe
nine different metrics such as Input Validation, Authentication, Authorization, Configura-
tion and Installation, Sensitive Data, Session Management, Cryptography, Exception Manage-
ment, Auditing, and Logging. They suggested a metric based model for malware clas-
sification. In [106], the authors present an ontology-based framework for cyber threat
analysis. Initially, SWRL rules are written for verification of the proposed framework
in the domain of digital banking. After that, the authors implemented a java-based in-
ference engine to enhance the performance. The researchers believe that the proposed
framework can be employed in business and commercial operations. The paper [107]
is an extension of the author’s previous work [105]. The research is mostly focused on
extracted metrics, attacks against these and countermeasures to prevent these attacks.
The authors in [108] present a model that takes security logs as input and employs
storytelling techniques to generate cyber threat reports. This model comprises of four
layers namely Preprocessing, Extraction, Inference, and Storytelling. The Preprocessing
layer takes log messages as input and parse them. Then, the Extraction layer extracts
date, time, IPs, and port numbers. After that, the Inference layer employs snort rules
to identify the TA and aim of the cyber attack. Subsequently, the Storytelling layer
generates the story of the cyber attack from the above extracted CTI data.
40
Chapter 3. Related Work
The researchers in [109] present a CTI exchange framework that employs blockchain,
semantic web technologies, and STIX standard. It defines the different roles of partic-
ipants such as producers, consumers, and owners. Then, it assigns incentives for each
aforesaid role. The proposed framework is a smart marketplace that defines CTI data
as digital asset. This marketplace incentivize the shared CTI data by its reasoning ca-
pabilities, varying from the participants’ role to the inference of new CTI data.
In [110], the researchers present the idea of extracting security concepts from the
text, compare these with monitoring sensors logs and then generate security alerts with
the help of reasoner. To the best of our knowledge, the idea of using heterogeneous
sources (txt and IDS logs) is a worthy solution, although ontology (taken from [111]) is
a very basic and does not give a holistic view of an attack. The authors in [27] present
a framework for the extraction of vulnerability and cyber-attack related information
from web text and then compare these with Wikitology. A model is proposed in [112],
which takes unstructured text as an input, automatically extract the entities and con-
cepts from it and then passes these to the DBpedia spotlight. At DBpedia, these concepts
matched and assigned corresponding class values. The authors in [113] present a Max-
imum Entropy model for automatic labeling of text.
In [114], the authors propose a cyber-attack analysis model that groups the cyber
attacks based on infringement information such as time, Command and Control IPs, pro-
tocols, exploit site, malware, distribution site, attack vulnerability, domain names, files names,
registry entries, strings, API sequences, and services names used by malicious codes.
The authors in [115] present a threat intelligence system to learn attack patterns and
TA behaviors. The propose system is evaluated by employing several techniques such
as cloud-based honeypots called Kippo, Elasticsearch stack, and Kibana. The Kippo is used
for the collection of various events logs. The Elastic stack is employed for cyber threat
event search. Whereas, the Kibana is an open-source CTI visualization dashboard for
the Elasticsearch. In the proposed system, several cyber attack events are identified
such as Root trying auth none, Root trying auth password, Root failed with a password, Login
attempt failed, Channel open failed, Root authenticated with a password, Connection Lost, and
Unauthorized login.
All aforesaid works are a worthy contribution for point of data retrieval and these
efforts are complementary for our work.
41
Chapter 3. Related Work
3.11 Conclusion
In the literature review, a case is prepared that APTs are a complex cyber attack. It is ob-
served that although a massive volume of CTI data is publicly available, however, most
of the data have quality issues. Hence, APTs analysis is a challenging task. Although
tools are publicly available to generate structured CTI data, however, their produced
data is redundant, erroneous, threat-irrelevant, and does not follow threat analysis
models properly, especially that are related to CKC and POP. All of these issues be-
come a motivation for our research. During the literature review, the STIX format is
selected for the analysis of structured CTI data. Then, a tool namely STIXGEN is de-
veloped to generate error-free and threat-relevant structured CTI data in STIX format.
Subsequently, it is felt that most of the CTI data is not suitable for different phases of
CTM. Therefore, a sub-framework called SCERM is developed, which boosts, refines,
and valuates structured CTI data for the detection, prevention, and response phases
of CTM. Afterwards, it is studied that ontological modeling is an appropriate way for
the analysis of domain knowledge. Therefore, a combined ontology of CKC and POP
is developed for APTs analysis and effective CTM.
42
Chapter 4
Automatic Generation of Structured
Threat Data
4.1 Introduction
Presently, a large number of CTI data is publically available regarding APTs. How-
ever, due to the large volume and distributed nature of the data, the identification and
collection of the data for CTM is challenging. It is observed during the research that
APTs launched against an organization subsequently succeeded with high probability
against other similar organizations. Therefore, it is the need of the time that organiza-
tions compile and share CTI data with peers in a structured form for timely prevention,
detection, and the response of a cyber attack. Ironically, publically available solutions
of the structure data generation are manual and produce erroneous and redundant
CTI data, most of the time. To overcome these problems, this chapter presents a sub-
framework namely STIXGEN which takes CTI data as input and produces properly
labeled, error-free, and threat relevant structured threat data for CTM. In this regard,
the “Structured Threat Information eXpression (STIX)” format is used which is a com-
prehensive effort.
4.2 Research Approach and Contributions
We take all the aforesaid deficits as a barrier in structured data utilization and these
shortcomings have become a motivation for our research work. We designed and de-
43
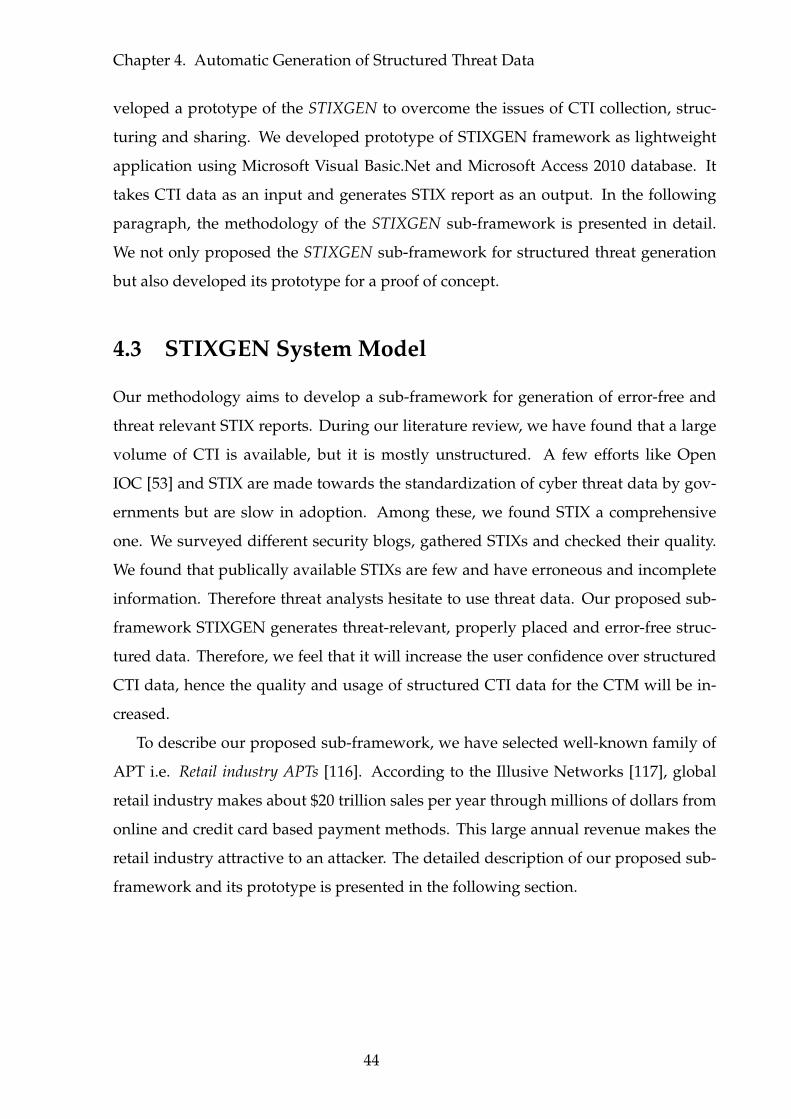
Chapter 4. Automatic Generation of Structured Threat Data
veloped a prototype of the STIXGEN to overcome the issues of CTI collection, struc-
turing and sharing. We developed prototype of STIXGEN framework as lightweight
application using Microsoft Visual Basic.Net and Microsoft Access 2010 database. It
takes CTI data as an input and generates STIX report as an output. In the following
paragraph, the methodology of the STIXGEN sub-framework is presented in detail.
We not only proposed the STIXGEN sub-framework for structured threat generation
but also developed its prototype for a proof of concept.
4.3 STIXGEN System Model
Our methodology aims to develop a sub-framework for generation of error-free and
threat relevant STIX reports. During our literature review, we have found that a large
volume of CTI is available, but it is mostly unstructured. A few efforts like Open
IOC [53] and STIX are made towards the standardization of cyber threat data by gov-
ernments but are slow in adoption. Among these, we found STIX a comprehensive
one. We surveyed different security blogs, gathered STIXs and checked their quality.
We found that publically available STIXs are few and have erroneous and incomplete
information. Therefore threat analysts hesitate to use threat data. Our proposed sub-
framework STIXGEN generates threat-relevant, properly placed and error-free struc-
tured data. Therefore, we feel that it will increase the user confidence over structured
CTI data, hence the quality and usage of structured CTI data for the CTM will be in-
creased.
To describe our proposed sub-framework, we have selected well-known family of
APT i.e. Retail industry APTs [116]. According to the Illusive Networks [117], global
retail industry makes about $20 trillion sales per year through millions of dollars from
online and credit card based payment methods. This large annual revenue makes the
retail industry attractive to an attacker. The detailed description of our proposed sub-
framework and its prototype is presented in the following section.
44
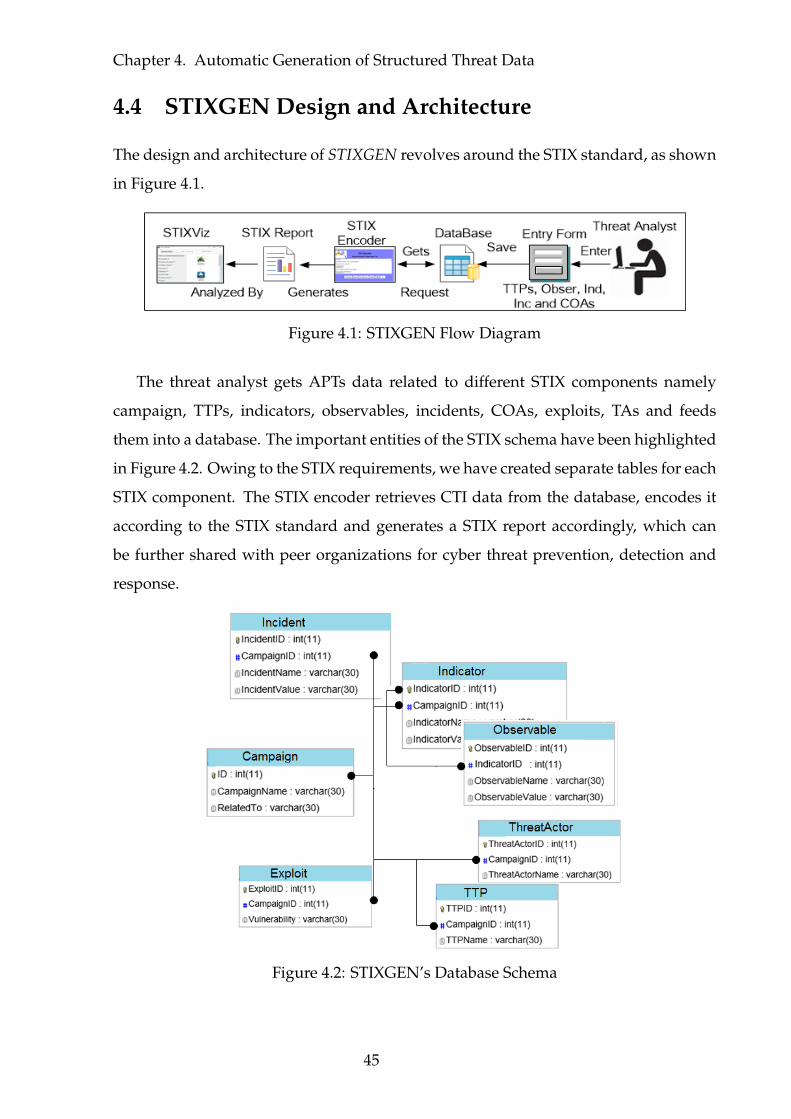
Chapter 4. Automatic Generation of Structured Threat Data
4.4 STIXGEN Design and Architecture
The design and architecture of STIXGEN revolves around the STIX standard, as shown
in Figure 4.1.
Figure 4.1: STIXGEN Flow Diagram
The threat analyst gets APTs data related to different STIX components namely
campaign, TTPs, indicators, observables, incidents, COAs, exploits, TAs and feeds
them into a database. The important entities of the STIX schema have been highlighted
in Figure 4.2. Owing to the STIX requirements, we have created separate tables for each
STIX component. The STIX encoder retrieves CTI data from the database, encodes it
according to the STIX standard and generates a STIX report accordingly, which can
be further shared with peer organizations for cyber threat prevention, detection and
response.
Figure 4.2: STIXGEN’s Database Schema
45
Chapter 4. Automatic Generation of Structured Threat Data
4.5 Case Study
A case study is provided for a better understanding of STIXGEN with a real-world
example. For this purpose, we have selected well-known APTs of the retail industry. At
first, we will briefly describe the retail industry’s APTs, then we will describe how the
user feeds CTI data in STIXGEN and generates STIX reports. Subsequently, analysis of
the Generated STIX will be shared.
4.5.1 Retail Industry - APTs Selection
The retail industry comprises of individuals and companies involved in the selling
of goods and services to the end-users. Earlier, a cash register was used for record-
keeping, which has been replaced by an electronic device such as “Point of Sale (POS)
terminal”. These terminals are being used by for the payments of goods through credit
and debit cards. The POS system gets the user’s financial data from credit and debit
cards, and saves it in a central server. POS APTs are launched to steal the user’s finan-
cial data from the POS terminals and the central servers. POS APTs have more than
a dozen variants [116]. We selected some of these variants to describe the working of
STIXGEN. The detailed description of the STIXGEN sub-framework and its prototype
is presented in the ensuing sections.
4.5.2 Data Entry
First of all, a threat analyst scans different security blogs to gather CTI data related to
renowned POS APTs such as Alina [118], JackPOS [119], BackOff POS [18], CenterPOS
[120], and ProPOS [121]. After data collection, threat analyst extracts CTI data related
to STIX components from security blogs and feeds it into the database through an entry
form. The part of CTI data related to the Backoff APT collected from three different
security blogs namely SecureBox, Symantec, and RSA can be seen in Figure 4.3. It can
be identified that the SecureBox provides information regarding Campaign and TTPs
only. Whereas, the Symantec and RSA share indicator information.
46
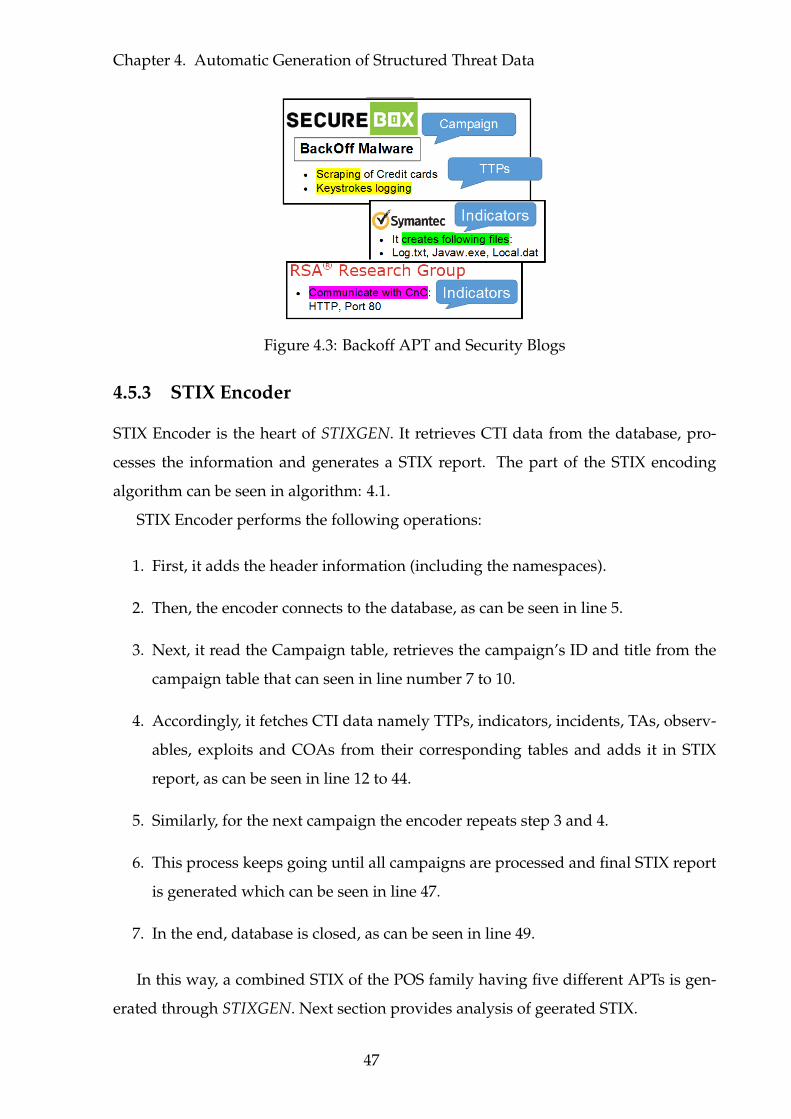
Chapter 4. Automatic Generation of Structured Threat Data
Figure 4.3: Backoff APT and Security Blogs
4.5.3 STIX Encoder
STIX Encoder is the heart of STIXGEN. It retrieves CTI data from the database, pro-
cesses the information and generates a STIX report. The part of the STIX encoding
algorithm can be seen in algorithm: 4.1.
STIX Encoder performs the following operations:
1. First, it adds the header information (including the namespaces).
2. Then, the encoder connects to the database, as can be seen in line 5.
3. Next, it read the Campaign table, retrieves the campaign’s ID and title from the
campaign table that can seen in line number 7 to 10.
4. Accordingly, it fetches CTI data namely TTPs, indicators, incidents, TAs, observ-
ables, exploits and COAs from their corresponding tables and adds it in STIX
report, as can be seen in line 12 to 44.
5. Similarly, for the next campaign the encoder repeats step 3 and 4.
6. This process keeps going until all campaigns are processed and final STIX report
is generated which can be seen in line 47.
7. In the end, database is closed, as can be seen in line 49.
In this way, a combined STIX of the POS family having five different APTs is gen-
erated through STIXGEN. Next section provides analysis of geerated STIX.
47
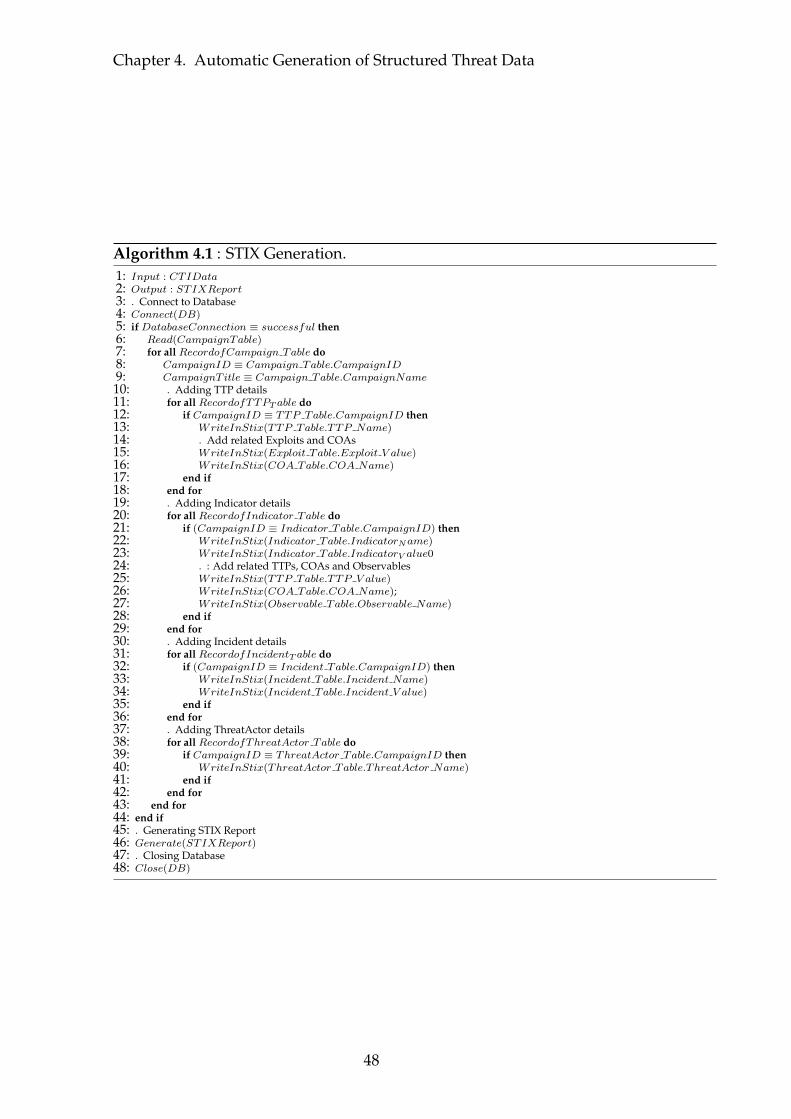
Chapter 4. Automatic Generation of Structured Threat Data
Algorithm 4.1 : STIX Generation.1: Input : CTIData2: Output : STIXReport3: . Connect to Database4: Connect(DB)5: if DatabaseConnection ≡ successful then6: Read(CampaignTable)7: for all RecordofCampaign Table do8: CampaignID ≡ Campaign Table.CampaignID9: CampaignT itle ≡ Campaign Table.CampaignName10: . Adding TTP details11: for all RecordofTTPT able do12: if CampaignID ≡ TTP Table.CampaignID then13: WriteInStix(TTP Table.TTP Name)14: . Add related Exploits and COAs15: WriteInStix(Exploit Table.Exploit V alue)16: WriteInStix(COA Table.COA Name)17: end if18: end for19: . Adding Indicator details20: for all RecordofIndicator Table do21: if (CampaignID ≡ Indicator Table.CampaignID) then22: WriteInStix(Indicator Table.IndicatorName)23: WriteInStix(Indicator Table.IndicatorV alue024: . : Add related TTPs, COAs and Observables25: WriteInStix(TTP Table.TTP V alue)26: WriteInStix(COA Table.COA Name);27: WriteInStix(Observable Table.Observable Name)28: end if29: end for30: . Adding Incident details31: for all RecordofIncidentT able do32: if (CampaignID ≡ Incident Table.CampaignID) then33: WriteInStix(Incident Table.Incident Name)34: WriteInStix(Incident Table.Incident V alue)35: end if36: end for37: . Adding ThreatActor details38: for all RecordofThreatActor Table do39: if CampaignID ≡ ThreatActor Table.CampaignID then40: WriteInStix(ThreatActor Table.ThreatActor Name)41: end if42: end for43: end for44: end if45: . Generating STIX Report46: Generate(STIXReport)47: . Closing Database48: Close(DB)
48
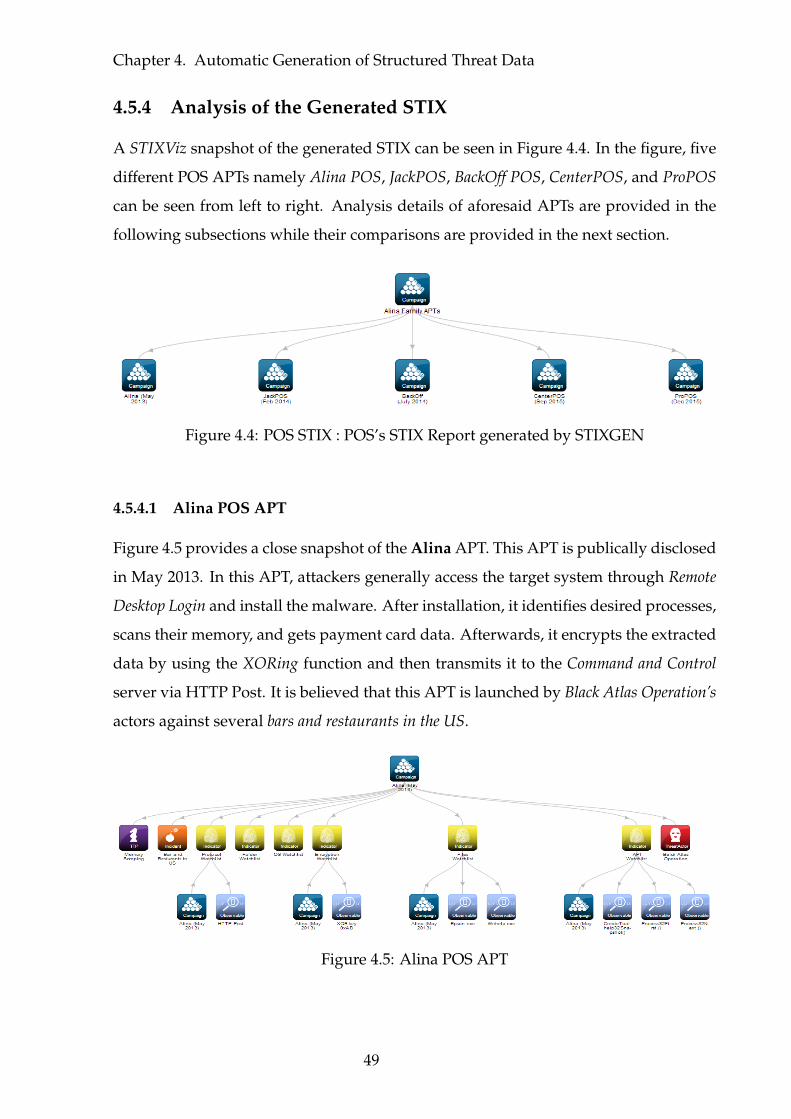
Chapter 4. Automatic Generation of Structured Threat Data
4.5.4 Analysis of the Generated STIX
A STIXViz snapshot of the generated STIX can be seen in Figure 4.4. In the figure, five
different POS APTs namely Alina POS, JackPOS, BackOff POS, CenterPOS, and ProPOS
can be seen from left to right. Analysis details of aforesaid APTs are provided in the
following subsections while their comparisons are provided in the next section.
Figure 4.4: POS STIX : POS’s STIX Report generated by STIXGEN
4.5.4.1 Alina POS APT
Figure 4.5 provides a close snapshot of the Alina APT. This APT is publically disclosed
in May 2013. In this APT, attackers generally access the target system through Remote
Desktop Login and install the malware. After installation, it identifies desired processes,
scans their memory, and gets payment card data. Afterwards, it encrypts the extracted
data by using the XORing function and then transmits it to the Command and Control
server via HTTP Post. It is believed that this APT is launched by Black Atlas Operation’s
actors against several bars and restaurants in the US.
Figure 4.5: Alina POS APT
49
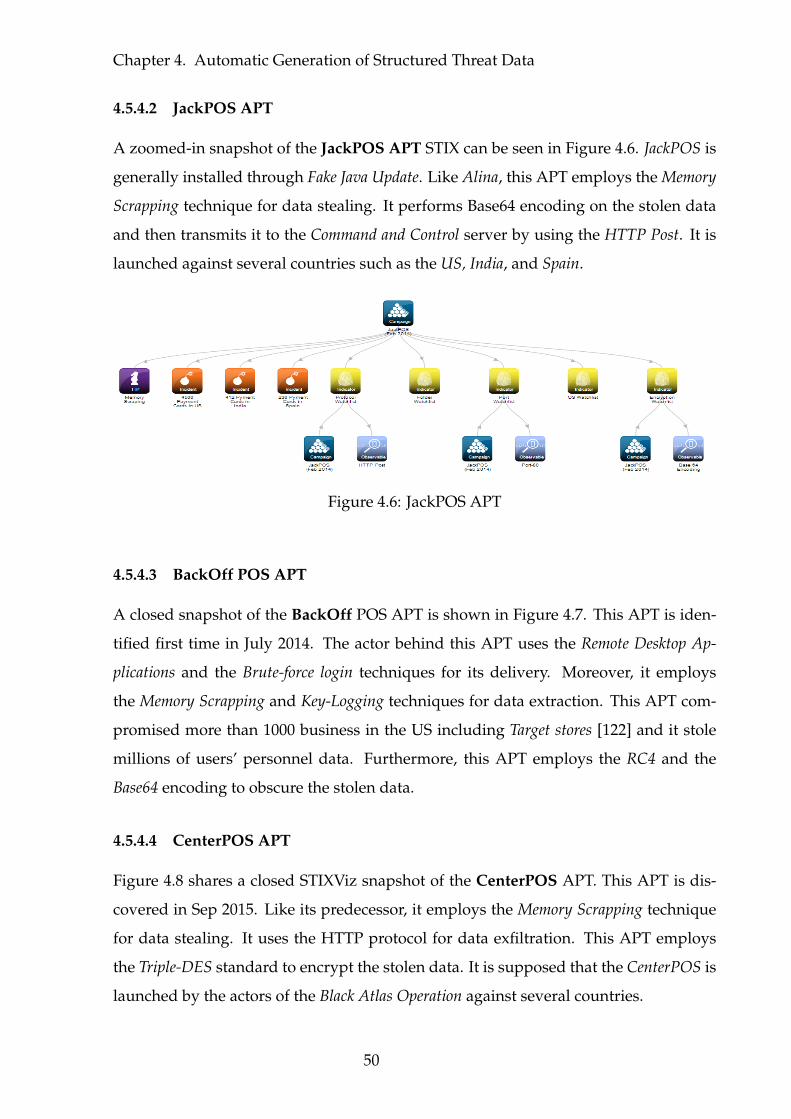
Chapter 4. Automatic Generation of Structured Threat Data
4.5.4.2 JackPOS APT
A zoomed-in snapshot of the JackPOS APT STIX can be seen in Figure 4.6. JackPOS is
generally installed through Fake Java Update. Like Alina, this APT employs the Memory
Scrapping technique for data stealing. It performs Base64 encoding on the stolen data
and then transmits it to the Command and Control server by using the HTTP Post. It is
launched against several countries such as the US, India, and Spain.
Figure 4.6: JackPOS APT
4.5.4.3 BackOff POS APT
A closed snapshot of the BackOff POS APT is shown in Figure 4.7. This APT is iden-
tified first time in July 2014. The actor behind this APT uses the Remote Desktop Ap-
plications and the Brute-force login techniques for its delivery. Moreover, it employs
the Memory Scrapping and Key-Logging techniques for data extraction. This APT com-
promised more than 1000 business in the US including Target stores [122] and it stole
millions of users’ personnel data. Furthermore, this APT employs the RC4 and the
Base64 encoding to obscure the stolen data.
4.5.4.4 CenterPOS APT
Figure 4.8 shares a closed STIXViz snapshot of the CenterPOS APT. This APT is dis-
covered in Sep 2015. Like its predecessor, it employs the Memory Scrapping technique
for data stealing. It uses the HTTP protocol for data exfiltration. This APT employs
the Triple-DES standard to encrypt the stolen data. It is supposed that the CenterPOS is
launched by the actors of the Black Atlas Operation against several countries.
50
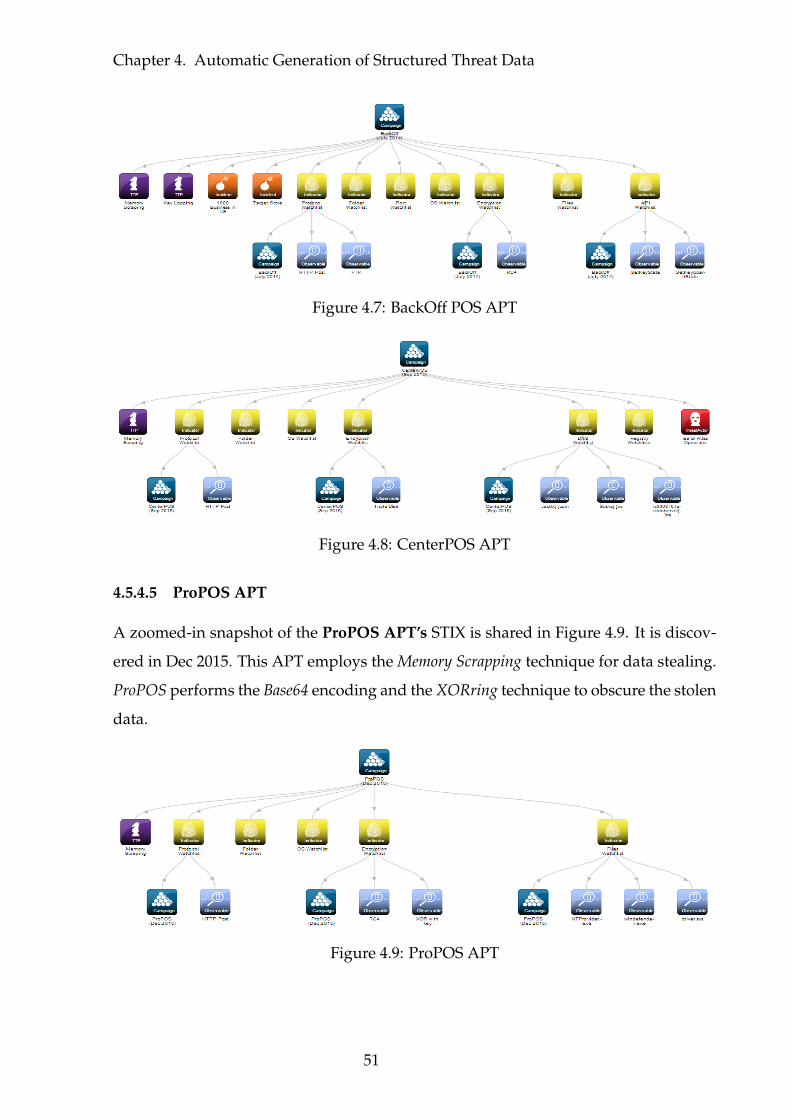
Chapter 4. Automatic Generation of Structured Threat Data
Figure 4.7: BackOff POS APT
Figure 4.8: CenterPOS APT
4.5.4.5 ProPOS APT
A zoomed-in snapshot of the ProPOS APT’s STIX is shared in Figure 4.9. It is discov-
ered in Dec 2015. This APT employs the Memory Scrapping technique for data stealing.
ProPOS performs the Base64 encoding and the XORring technique to obscure the stolen
data.
Figure 4.9: ProPOS APT
51
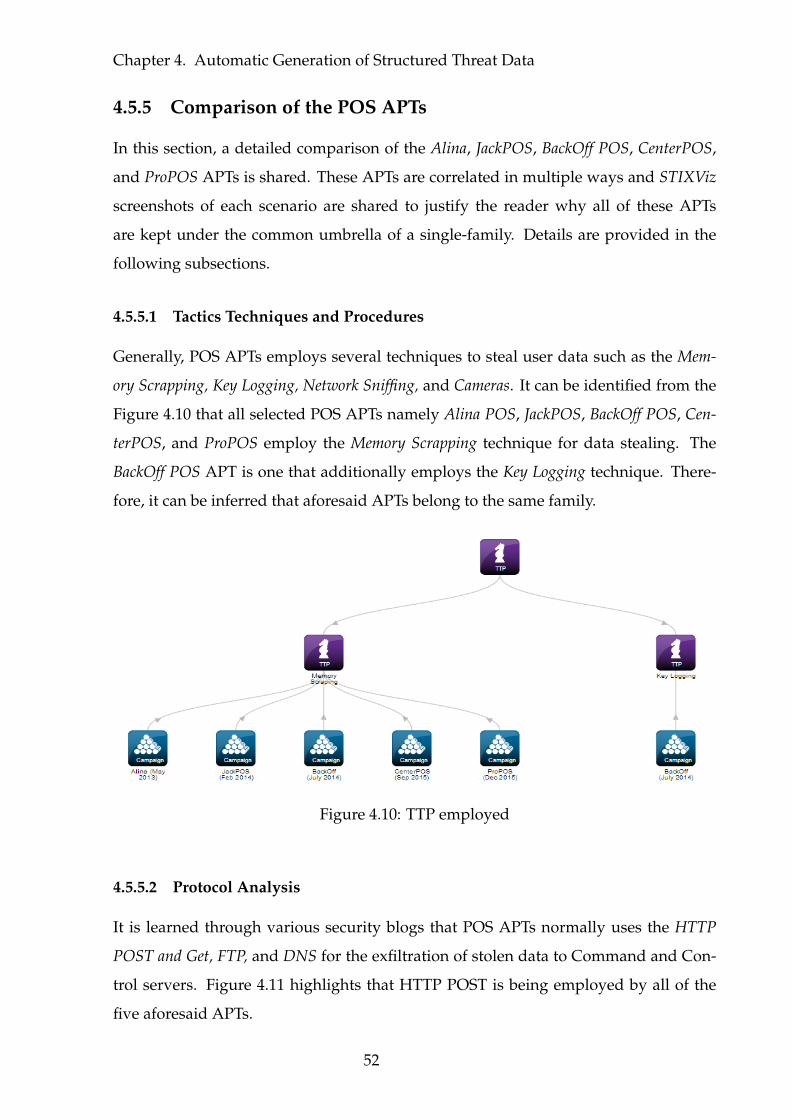
Chapter 4. Automatic Generation of Structured Threat Data
4.5.5 Comparison of the POS APTs
In this section, a detailed comparison of the Alina, JackPOS, BackOff POS, CenterPOS,
and ProPOS APTs is shared. These APTs are correlated in multiple ways and STIXViz
screenshots of each scenario are shared to justify the reader why all of these APTs
are kept under the common umbrella of a single-family. Details are provided in the
following subsections.
4.5.5.1 Tactics Techniques and Procedures
Generally, POS APTs employs several techniques to steal user data such as the Mem-
ory Scrapping, Key Logging, Network Sniffing, and Cameras. It can be identified from the
Figure 4.10 that all selected POS APTs namely Alina POS, JackPOS, BackOff POS, Cen-
terPOS, and ProPOS employ the Memory Scrapping technique for data stealing. The
BackOff POS APT is one that additionally employs the Key Logging technique. There-
fore, it can be inferred that aforesaid APTs belong to the same family.
Figure 4.10: TTP employed
4.5.5.2 Protocol Analysis
It is learned through various security blogs that POS APTs normally uses the HTTP
POST and Get, FTP, and DNS for the exfiltration of stolen data to Command and Con-
trol servers. Figure 4.11 highlights that HTTP POST is being employed by all of the
five aforesaid APTs.
52
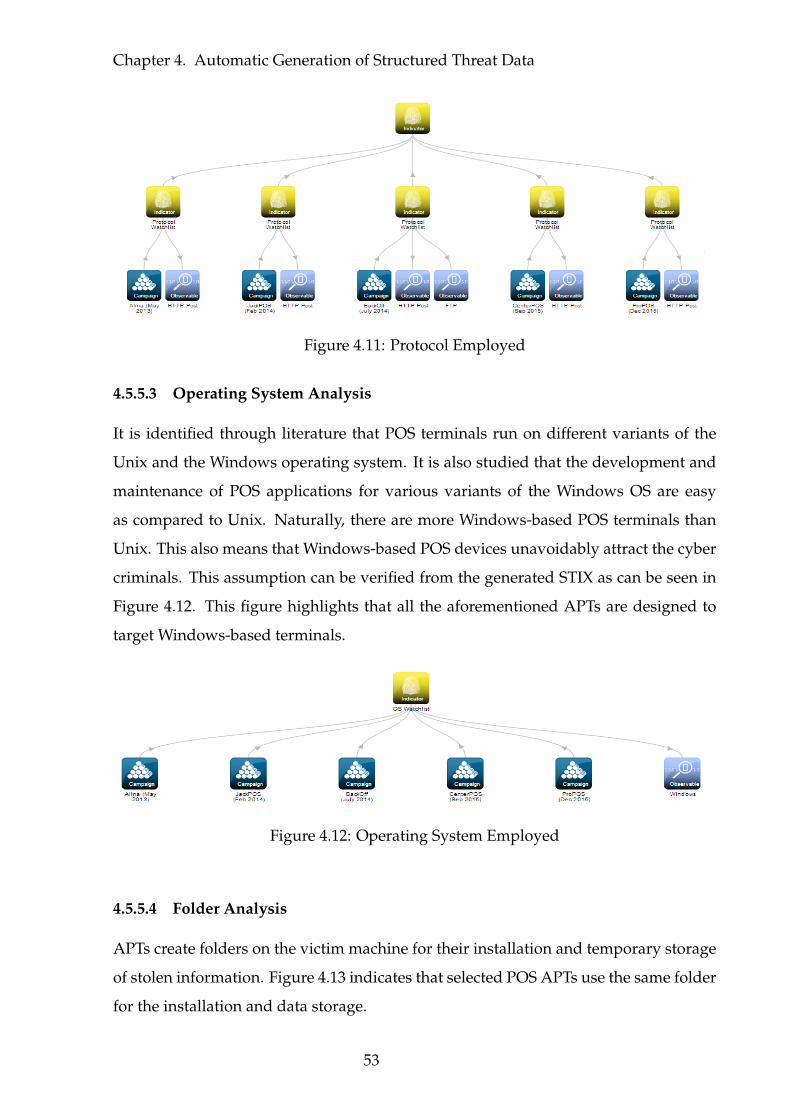
Chapter 4. Automatic Generation of Structured Threat Data
Figure 4.11: Protocol Employed
4.5.5.3 Operating System Analysis
It is identified through literature that POS terminals run on different variants of the
Unix and the Windows operating system. It is also studied that the development and
maintenance of POS applications for various variants of the Windows OS are easy
as compared to Unix. Naturally, there are more Windows-based POS terminals than
Unix. This also means that Windows-based POS devices unavoidably attract the cyber
criminals. This assumption can be verified from the generated STIX as can be seen in
Figure 4.12. This figure highlights that all the aforementioned APTs are designed to
target Windows-based terminals.
Figure 4.12: Operating System Employed
4.5.5.4 Folder Analysis
APTs create folders on the victim machine for their installation and temporary storage
of stolen information. Figure 4.13 indicates that selected POS APTs use the same folder
for the installation and data storage.
53
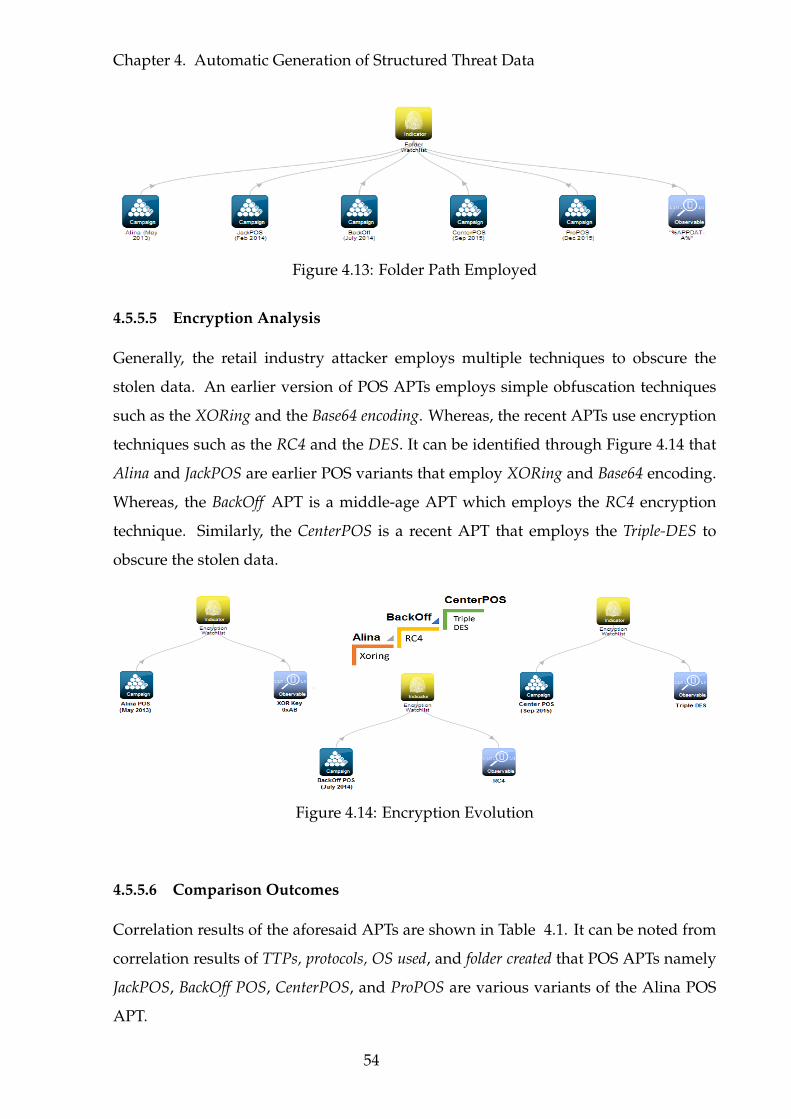
Chapter 4. Automatic Generation of Structured Threat Data
Figure 4.13: Folder Path Employed
4.5.5.5 Encryption Analysis
Generally, the retail industry attacker employs multiple techniques to obscure the
stolen data. An earlier version of POS APTs employs simple obfuscation techniques
such as the XORing and the Base64 encoding. Whereas, the recent APTs use encryption
techniques such as the RC4 and the DES. It can be identified through Figure 4.14 that
Alina and JackPOS are earlier POS variants that employ XORing and Base64 encoding.
Whereas, the BackOff APT is a middle-age APT which employs the RC4 encryption
technique. Similarly, the CenterPOS is a recent APT that employs the Triple-DES to
obscure the stolen data.
Figure 4.14: Encryption Evolution
4.5.5.6 Comparison Outcomes
Correlation results of the aforesaid APTs are shown in Table 4.1. It can be noted from
correlation results of TTPs, protocols, OS used, and folder created that POS APTs namely
JackPOS, BackOff POS, CenterPOS, and ProPOS are various variants of the Alina POS
APT.
54
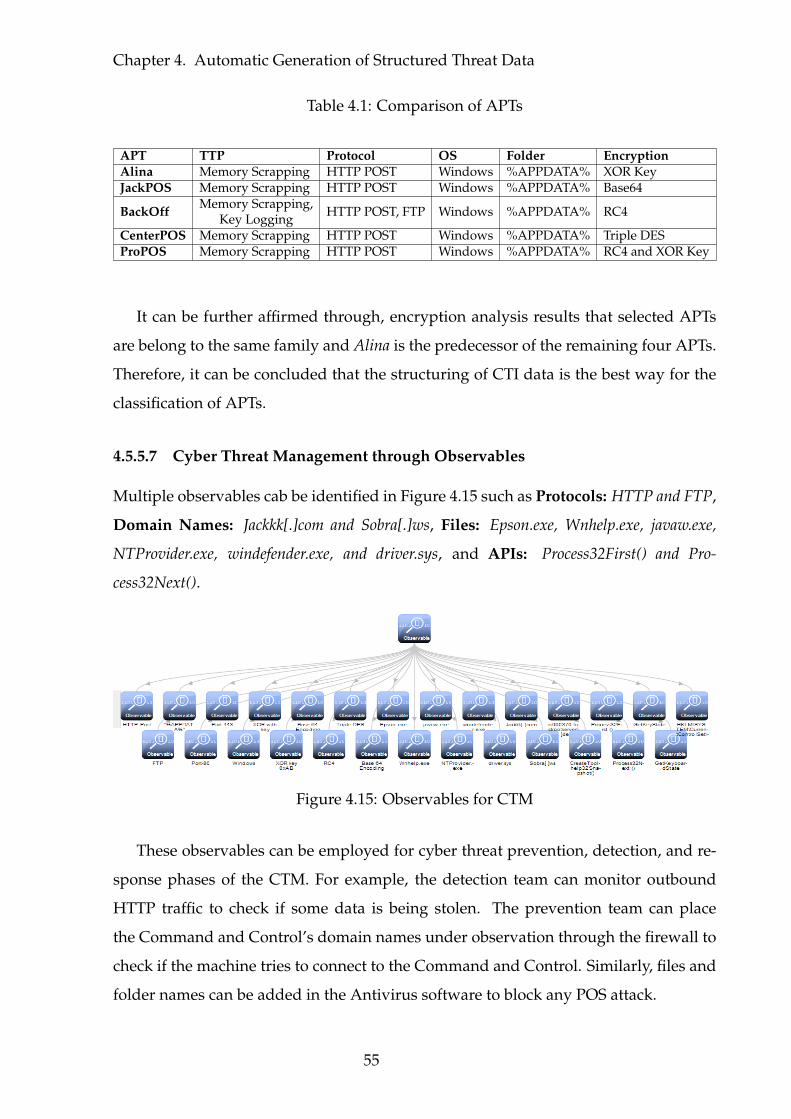
Chapter 4. Automatic Generation of Structured Threat Data
Table 4.1: Comparison of APTs
APT TTP Protocol OS Folder EncryptionAlina Memory Scrapping HTTP POST Windows %APPDATA% XOR KeyJackPOS Memory Scrapping HTTP POST Windows %APPDATA% Base64
BackOff Memory Scrapping,Key Logging HTTP POST, FTP Windows %APPDATA% RC4
CenterPOS Memory Scrapping HTTP POST Windows %APPDATA% Triple DESProPOS Memory Scrapping HTTP POST Windows %APPDATA% RC4 and XOR Key
It can be further affirmed through, encryption analysis results that selected APTs
are belong to the same family and Alina is the predecessor of the remaining four APTs.
Therefore, it can be concluded that the structuring of CTI data is the best way for the
classification of APTs.
4.5.5.7 Cyber Threat Management through Observables
Multiple observables cab be identified in Figure 4.15 such as Protocols: HTTP and FTP,
Domain Names: Jackkk[.]com and Sobra[.]ws, Files: Epson.exe, Wnhelp.exe, javaw.exe,
NTProvider.exe, windefender.exe, and driver.sys, and APIs: Process32First() and Pro-
cess32Next().
Figure 4.15: Observables for CTM
These observables can be employed for cyber threat prevention, detection, and re-
sponse phases of the CTM. For example, the detection team can monitor outbound
HTTP traffic to check if some data is being stolen. The prevention team can place
the Command and Control’s domain names under observation through the firewall to
check if the machine tries to connect to the Command and Control. Similarly, files and
folder names can be added in the Antivirus software to block any POS attack.
55
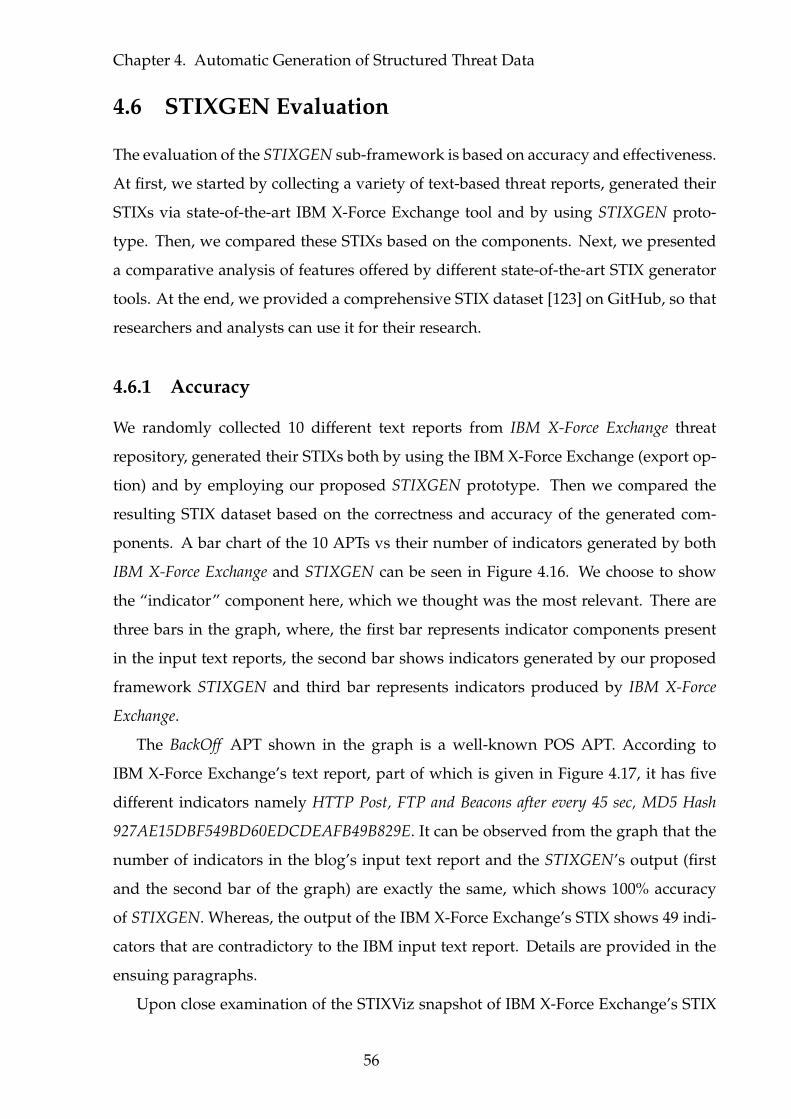
Chapter 4. Automatic Generation of Structured Threat Data
4.6 STIXGEN Evaluation
The evaluation of the STIXGEN sub-framework is based on accuracy and effectiveness.
At first, we started by collecting a variety of text-based threat reports, generated their
STIXs via state-of-the-art IBM X-Force Exchange tool and by using STIXGEN proto-
type. Then, we compared these STIXs based on the components. Next, we presented
a comparative analysis of features offered by different state-of-the-art STIX generator
tools. At the end, we provided a comprehensive STIX dataset [123] on GitHub, so that
researchers and analysts can use it for their research.
4.6.1 Accuracy
We randomly collected 10 different text reports from IBM X-Force Exchange threat
repository, generated their STIXs both by using the IBM X-Force Exchange (export op-
tion) and by employing our proposed STIXGEN prototype. Then we compared the
resulting STIX dataset based on the correctness and accuracy of the generated com-
ponents. A bar chart of the 10 APTs vs their number of indicators generated by both
IBM X-Force Exchange and STIXGEN can be seen in Figure 4.16. We choose to show
the “indicator” component here, which we thought was the most relevant. There are
three bars in the graph, where, the first bar represents indicator components present
in the input text reports, the second bar shows indicators generated by our proposed
framework STIXGEN and third bar represents indicators produced by IBM X-Force
Exchange.
The BackOff APT shown in the graph is a well-known POS APT. According to
IBM X-Force Exchange’s text report, part of which is given in Figure 4.17, it has five
different indicators namely HTTP Post, FTP and Beacons after every 45 sec, MD5 Hash
927AE15DBF549BD60EDCDEAFB49B829E. It can be observed from the graph that the
number of indicators in the blog’s input text report and the STIXGEN’s output (first
and the second bar of the graph) are exactly the same, which shows 100% accuracy
of STIXGEN. Whereas, the output of the IBM X-Force Exchange’s STIX shows 49 indi-
cators that are contradictory to the IBM input text report. Details are provided in the
ensuing paragraphs.
Upon close examination of the STIXViz snapshot of IBM X-Force Exchange’s STIX
56
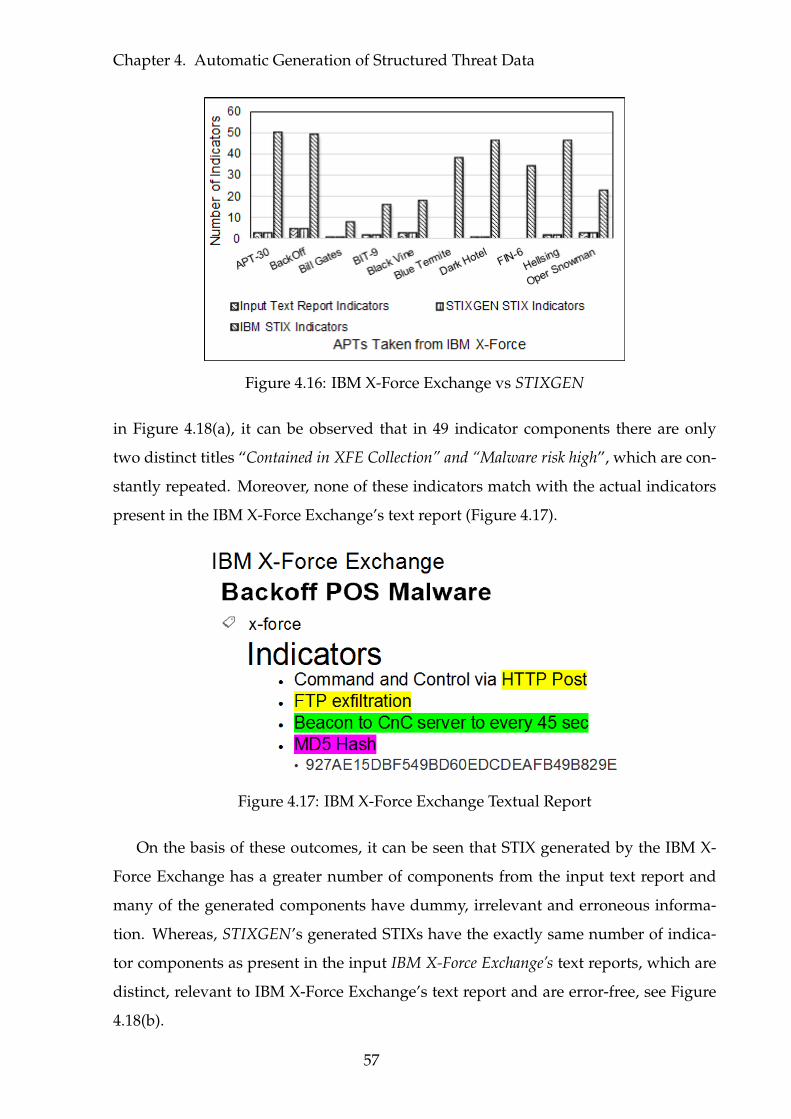
Chapter 4. Automatic Generation of Structured Threat Data
Figure 4.16: IBM X-Force Exchange vs STIXGEN
in Figure 4.18(a), it can be observed that in 49 indicator components there are only
two distinct titles “Contained in XFE Collection” and “Malware risk high”, which are con-
stantly repeated. Moreover, none of these indicators match with the actual indicators
present in the IBM X-Force Exchange’s text report (Figure 4.17).
Figure 4.17: IBM X-Force Exchange Textual Report
On the basis of these outcomes, it can be seen that STIX generated by the IBM X-
Force Exchange has a greater number of components from the input text report and
many of the generated components have dummy, irrelevant and erroneous informa-
tion. Whereas, STIXGEN’s generated STIXs have the exactly same number of indica-
tor components as present in the input IBM X-Force Exchange’s text reports, which are
distinct, relevant to IBM X-Force Exchange’s text report and are error-free, see Figure
4.18(b).
57
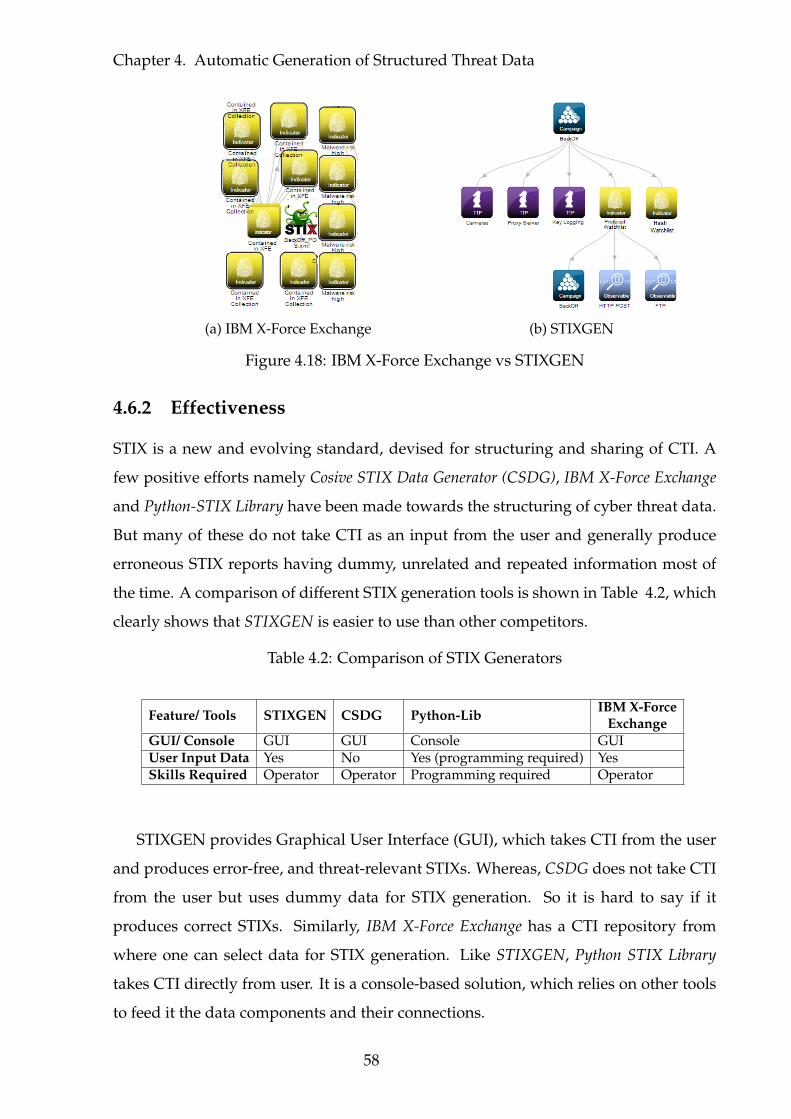
Chapter 4. Automatic Generation of Structured Threat Data
(a) IBM X-Force Exchange (b) STIXGEN
Figure 4.18: IBM X-Force Exchange vs STIXGEN
4.6.2 Effectiveness
STIX is a new and evolving standard, devised for structuring and sharing of CTI. A
few positive efforts namely Cosive STIX Data Generator (CSDG), IBM X-Force Exchange
and Python-STIX Library have been made towards the structuring of cyber threat data.
But many of these do not take CTI as an input from the user and generally produce
erroneous STIX reports having dummy, unrelated and repeated information most of
the time. A comparison of different STIX generation tools is shown in Table 4.2, which
clearly shows that STIXGEN is easier to use than other competitors.
Table 4.2: Comparison of STIX Generators
Feature/ Tools STIXGEN CSDG Python-Lib IBM X-ForceExchange
GUI/ Console GUI GUI Console GUIUser Input Data Yes No Yes (programming required) YesSkills Required Operator Operator Programming required Operator
STIXGEN provides Graphical User Interface (GUI), which takes CTI from the user
and produces error-free, and threat-relevant STIXs. Whereas, CSDG does not take CTI
from the user but uses dummy data for STIX generation. So it is hard to say if it
produces correct STIXs. Similarly, IBM X-Force Exchange has a CTI repository from
where one can select data for STIX generation. Like STIXGEN, Python STIX Library
takes CTI directly from user. It is a console-based solution, which relies on other tools
to feed it the data components and their connections.
58
Chapter 5
Cyber Threat Response Activities
5.1 Introduction
In the previous chapter, a novel sub-framework namely STIXGEN is presented which
is designed to automatically generate distinct, error-free, and threat relevant structured
CTI data. It is learned during the research that most of the publicly available CTI data
is wrongly labeled, having incomplete artifacts, and missing important indicators re-
garding cyber threat prevention, detection, and response. Therefore, for effective CTM,
there is a need for a sub-framework that should boost, refine, and evaluate the struc-
tured CTI data. Accordingly, a formal sub-framework called SCERM is developed that
ranks, boosts and refines the structured CTI data for CTM. This chapter thoroughly
provides the details of the SCERM.
5.2 Research Approach and Contributions
For this research, our observation is that the identification and prioritization of CTI
data for different phases of cyber threat management cannot be meaningfully accom-
plished without having a formal model of threat intelligence components, their con-
nectivity, and dependency. Therefore, SCERM is proposed for the valuation of struc-
tured data, which formally models the STIX architecture [66] on the basis of the STIX
use case Managing cyber threat response activities [67]. The use case characterizes the
significance of different STIX components according to the cyber threat management
life-cycle. The use case asserts that all STIX components are not equally important
59
Chapter 5. Cyber Threat Response Activities
for every phase of cyber threat management rather certain components are more rel-
evant to a particular phase. For example, exploits and their COAs are necessary for
cyber threat prevention, indicators and observables are essential for cyber threat detec-
tion, while indicators, observables and their respective COAs are important for the cyber
threat response phase. As part of our solution we developed a prototype of SCERM,
which boosts, refines, and valuates STIX reports for cyber threat management. The
Boosting module remaps wrongly placed contents to a data model of STIX components
if required. Then, the Refinement module identifies and augments incomplete or miss-
ing artifacts. Subsequently, the Valuation component evaluates the refined CTI data and
provides valuation reports. These reports comprise of valuation score (vScore) and a list
of extracted components for every phase of cyber threat management. The valuation
and refinement processes are repeated until the STIX report improves to a threshold
suitable for use in cyber threat management. In fact, SCERM provides a starting point
for cyber threat management teams and categorizes STIX reports based on their benefit
for the prevention, detection, and the response phases of cyber threat management or
a combination thereof.
5.3 Design
This section provides a detailed description of the formal model used in the SCERM
system. The STIX Architecture based formal Model (SAM) is presented first, followed
by the formalization of the use case managing cyber threat response activities. The STIX
formal model is used to derive individual tests for different phases of cyber threat man-
agement namely cyber threat prevention, detection and response. Details are provided
in the following subsections.
5.3.1 Formal Model of STIX Architecture - SAM
The STIX architecture [66] describes cyber threat concepts as autonomous and reusable
constructs. The reason for the popularity of the STIX is that it objectively defines differ-
ent aspects of the cyber-threat that answer questions such as “what happened”, “how
the incident occurred”, “what vulnerabilities were exploited” and “who did it”. At the
same time, it establishes connections between these aspects. Based on our literature
60
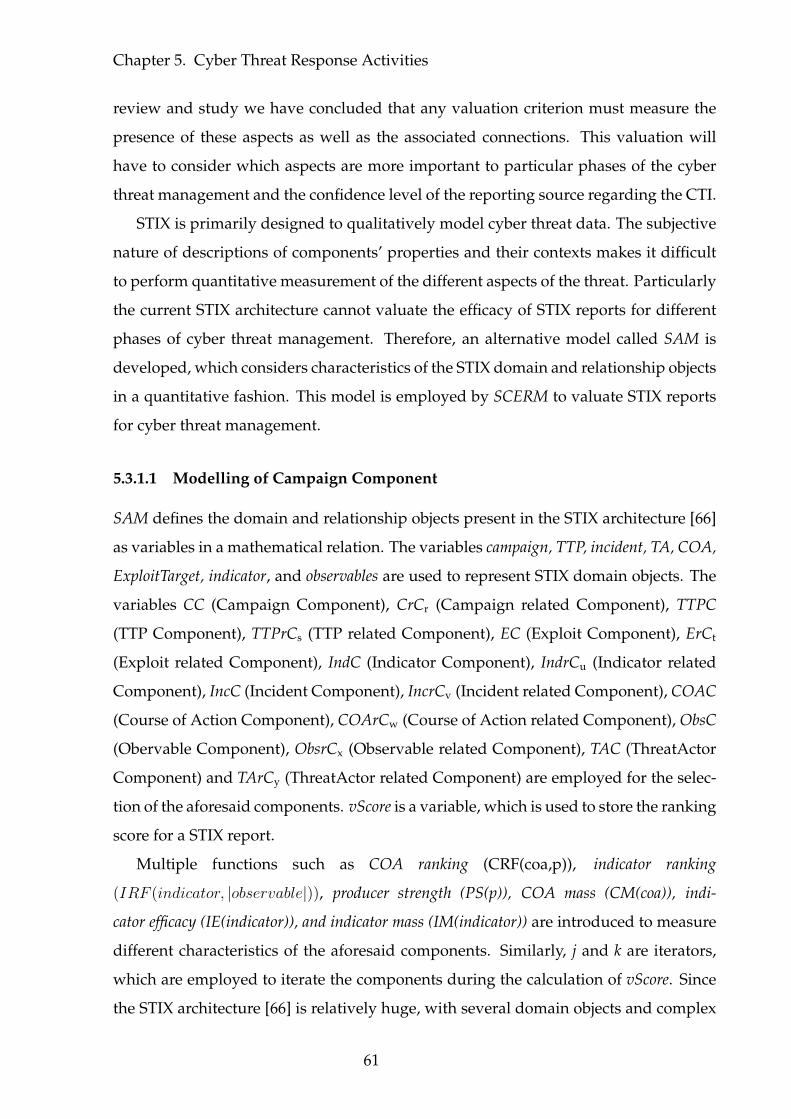
Chapter 5. Cyber Threat Response Activities
review and study we have concluded that any valuation criterion must measure the
presence of these aspects as well as the associated connections. This valuation will
have to consider which aspects are more important to particular phases of the cyber
threat management and the confidence level of the reporting source regarding the CTI.
STIX is primarily designed to qualitatively model cyber threat data. The subjective
nature of descriptions of components’ properties and their contexts makes it difficult
to perform quantitative measurement of the different aspects of the threat. Particularly
the current STIX architecture cannot valuate the efficacy of STIX reports for different
phases of cyber threat management. Therefore, an alternative model called SAM is
developed, which considers characteristics of the STIX domain and relationship objects
in a quantitative fashion. This model is employed by SCERM to valuate STIX reports
for cyber threat management.
5.3.1.1 Modelling of Campaign Component
SAM defines the domain and relationship objects present in the STIX architecture [66]
as variables in a mathematical relation. The variables campaign, TTP, incident, TA, COA,
ExploitTarget, indicator, and observables are used to represent STIX domain objects. The
variables CC (Campaign Component), CrCr (Campaign related Component), TTPC
(TTP Component), TTPrCs (TTP related Component), EC (Exploit Component), ErCt
(Exploit related Component), IndC (Indicator Component), IndrCu (Indicator related
Component), IncC (Incident Component), IncrCv (Incident related Component), COAC
(Course of Action Component), COArCw (Course of Action related Component), ObsC
(Obervable Component), ObsrCx (Observable related Component), TAC (ThreatActor
Component) and TArCy (ThreatActor related Component) are employed for the selec-
tion of the aforesaid components. vScore is a variable, which is used to store the ranking
score for a STIX report.
Multiple functions such as COA ranking (CRF(coa,p)), indicator ranking
(IRF (indicator, |observable|)), producer strength (PS(p)), COA mass (CM(coa)), indi-
cator efficacy (IE(indicator)), and indicator mass (IM(indicator)) are introduced to measure
different characteristics of the aforesaid components. Similarly, j and k are iterators,
which are employed to iterate the components during the calculation of vScore. Since
the STIX architecture [66] is relatively huge, with several domain objects and complex
61
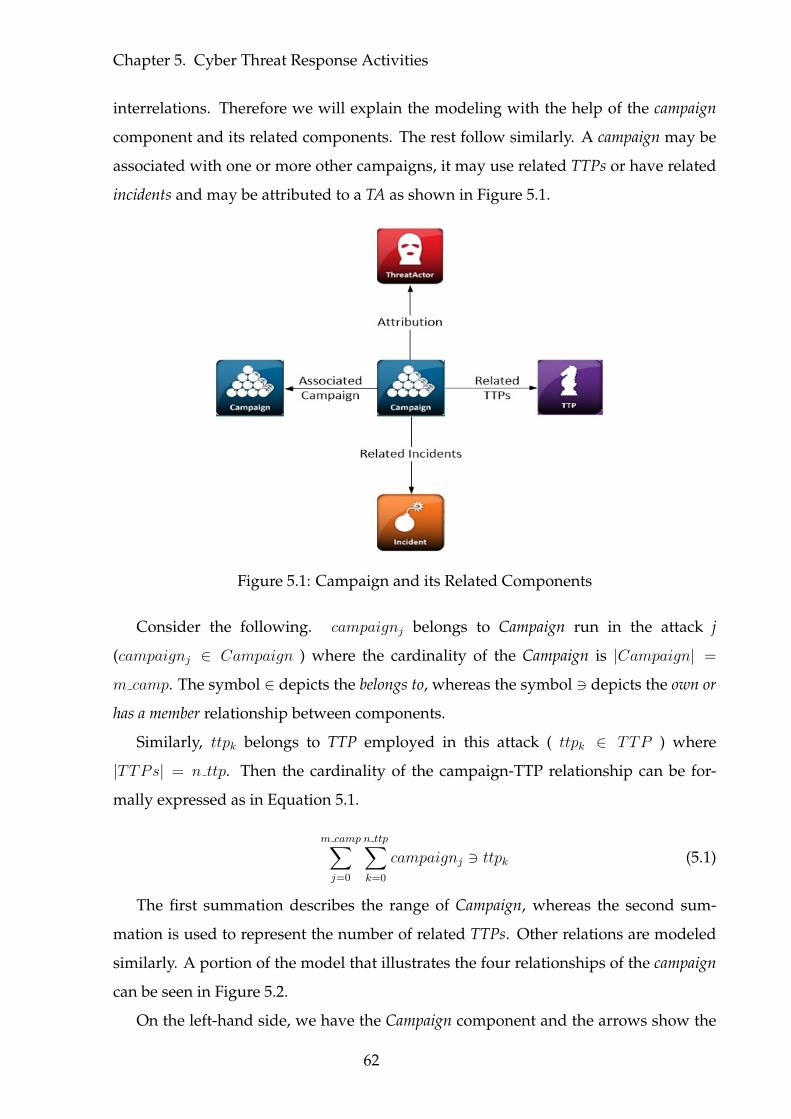
Chapter 5. Cyber Threat Response Activities
interrelations. Therefore we will explain the modeling with the help of the campaign
component and its related components. The rest follow similarly. A campaign may be
associated with one or more other campaigns, it may use related TTPs or have related
incidents and may be attributed to a TA as shown in Figure 5.1.
Figure 5.1: Campaign and its Related Components
Consider the following. campaignj belongs to Campaign run in the attack j
(campaignj ∈ Campaign ) where the cardinality of the Campaign is |Campaign| =
m camp. The symbol ∈ depicts the belongs to, whereas the symbol 3 depicts the own or
has a member relationship between components.
Similarly, ttpk belongs to TTP employed in this attack ( ttpk ∈ TTP ) where
|TTPs| = n ttp. Then the cardinality of the campaign-TTP relationship can be for-
mally expressed as in Equation 5.1.
m camp∑j=0
n ttp∑k=0
campaignj 3 ttpk (5.1)
The first summation describes the range of Campaign, whereas the second sum-
mation is used to represent the number of related TTPs. Other relations are modeled
similarly. A portion of the model that illustrates the four relationships of the campaign
can be seen in Figure 5.2.
On the left-hand side, we have the Campaign component and the arrows show the
62
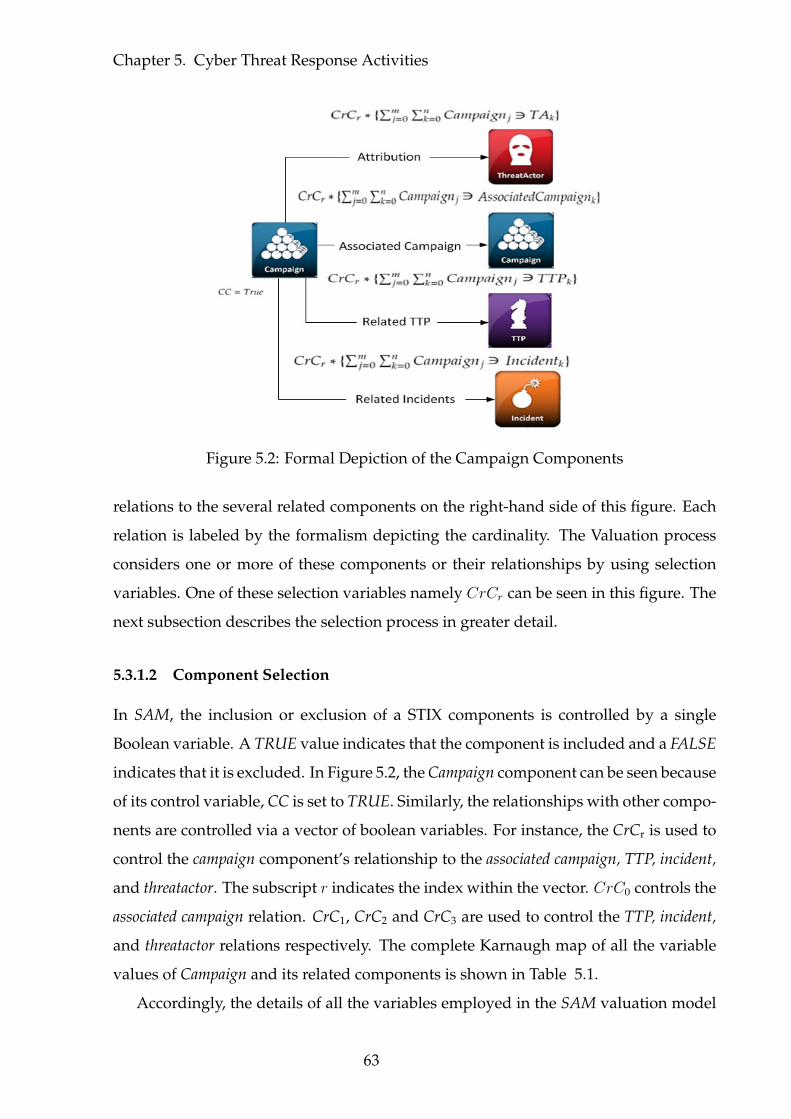
Chapter 5. Cyber Threat Response Activities
Figure 5.2: Formal Depiction of the Campaign Components
relations to the several related components on the right-hand side of this figure. Each
relation is labeled by the formalism depicting the cardinality. The Valuation process
considers one or more of these components or their relationships by using selection
variables. One of these selection variables namely CrCr can be seen in this figure. The
next subsection describes the selection process in greater detail.
5.3.1.2 Component Selection
In SAM, the inclusion or exclusion of a STIX components is controlled by a single
Boolean variable. A TRUE value indicates that the component is included and a FALSE
indicates that it is excluded. In Figure 5.2, the Campaign component can be seen because
of its control variable, CC is set to TRUE. Similarly, the relationships with other compo-
nents are controlled via a vector of boolean variables. For instance, the CrCr is used to
control the campaign component’s relationship to the associated campaign, TTP, incident,
and threatactor. The subscript r indicates the index within the vector. CrC0 controls the
associated campaign relation. CrC1, CrC2 and CrC3 are used to control the TTP, incident,
and threatactor relations respectively. The complete Karnaugh map of all the variable
values of Campaign and its related components is shown in Table 5.1.
Accordingly, the details of all the variables employed in the SAM valuation model
63
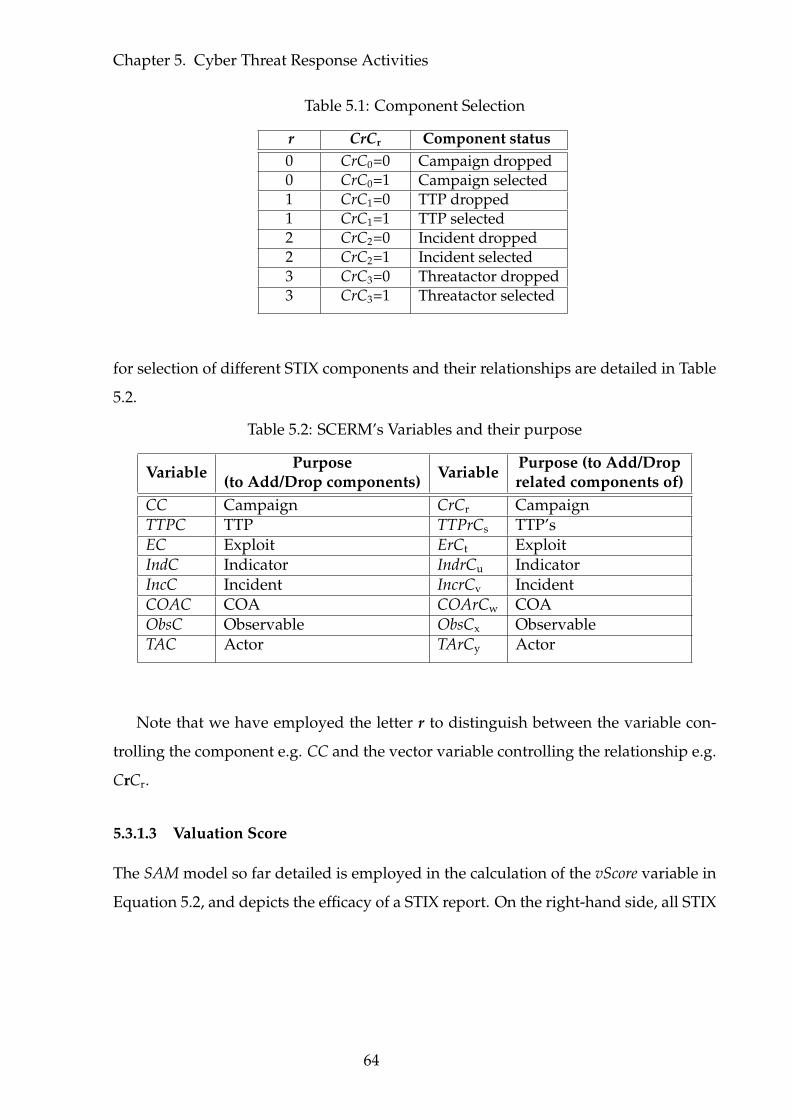
Chapter 5. Cyber Threat Response Activities
Table 5.1: Component Selection
r CrCr Component status0 CrC0=0 Campaign dropped0 CrC0=1 Campaign selected1 CrC1=0 TTP dropped1 CrC1=1 TTP selected2 CrC2=0 Incident dropped2 CrC2=1 Incident selected3 CrC3=0 Threatactor dropped3 CrC3=1 Threatactor selected
for selection of different STIX components and their relationships are detailed in Table
5.2.
Table 5.2: SCERM’s Variables and their purpose
Variable Purpose(to Add/Drop components) Variable Purpose (to Add/Drop
related components of)CC Campaign CrCr CampaignTTPC TTP TTPrCs TTP’sEC Exploit ErCt ExploitIndC Indicator IndrCu IndicatorIncC Incident IncrCv IncidentCOAC COA COArCw COAObsC Observable ObsCx ObservableTAC Actor TArCy Actor
Note that we have employed the letter r to distinguish between the variable con-
trolling the component e.g. CC and the vector variable controlling the relationship e.g.
CrCr.
5.3.1.3 Valuation Score
The SAM model so far detailed is employed in the calculation of the vScore variable in
Equation 5.2, and depicts the efficacy of a STIX report. On the right-hand side, all STIX
64
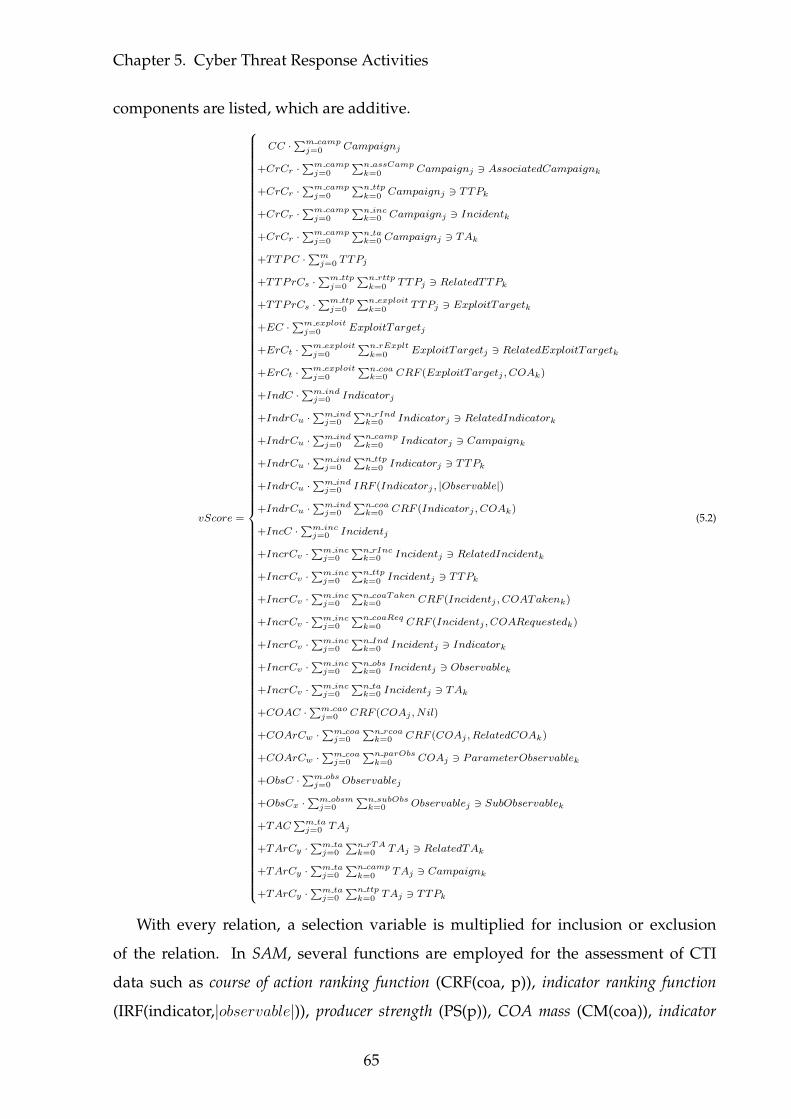
Chapter 5. Cyber Threat Response Activities
components are listed, which are additive.
vScore =
CC ·∑m camp
j=0 Campaignj
+CrCr ·∑m camp
j=0
∑n assCampk=0 Campaignj 3 AssociatedCampaignk
+CrCr ·∑m camp
j=0
∑n ttpk=0 Campaignj 3 TTPk
+CrCr ·∑m camp
j=0
∑n inck=0 Campaignj 3 Incidentk
+CrCr ·∑m camp
j=0
∑n tak=0 Campaignj 3 TAk
+TTPC ·∑m
j=0 TTPj
+TTPrCs ·∑m ttp
j=0
∑n rttpk=0 TTPj 3 RelatedTTPk
+TTPrCs ·∑m ttp
j=0
∑n exploitk=0 TTPj 3 ExploitTargetk
+EC ·∑m exploit
j=0 ExploitTargetj
+ErCt ·∑m exploit
j=0
∑n rExpltk=0 ExploitTargetj 3 RelatedExploitTargetk
+ErCt ·∑m exploit
j=0
∑n coak=0 CRF (ExploitTargetj , COAk)
+IndC ·∑m ind
j=0 Indicatorj
+IndrCu ·∑m ind
j=0
∑n rIndk=0 Indicatorj 3 RelatedIndicatork
+IndrCu ·∑m ind
j=0
∑n campk=0 Indicatorj 3 Campaignk
+IndrCu ·∑m ind
j=0
∑n ttpk=0 Indicatorj 3 TTPk
+IndrCu ·∑m ind
j=0 IRF (Indicatorj , |Observable|)
+IndrCu ·∑m ind
j=0
∑n coak=0 CRF (Indicatorj , COAk)
+IncC ·∑m inc
j=0 Incidentj
+IncrCv ·∑m inc
j=0
∑n rInck=0 Incidentj 3 RelatedIncidentk
+IncrCv ·∑m inc
j=0
∑n ttpk=0 Incidentj 3 TTPk
+IncrCv ·∑m inc
j=0
∑n coaTakenk=0 CRF (Incidentj , COATakenk)
+IncrCv ·∑m inc
j=0
∑n coaReqk=0 CRF (Incidentj , COARequestedk)
+IncrCv ·∑m inc
j=0
∑n Indk=0 Incidentj 3 Indicatork
+IncrCv ·∑m inc
j=0
∑n obsk=0 Incidentj 3 Observablek
+IncrCv ·∑m inc
j=0
∑n tak=0 Incidentj 3 TAk
+COAC ·∑m cao
j=0 CRF (COAj , Nil)
+COArCw ·∑m coa
j=0
∑n rcoak=0 CRF (COAj , RelatedCOAk)
+COArCw ·∑m coa
j=0
∑n parObsk=0 COAj 3 ParameterObservablek
+ObsC ·∑m obs
j=0 Observablej
+ObsCx ·∑m obsm
j=0
∑n subObsk=0 Observablej 3 SubObservablek
+TAC∑m ta
j=0 TAj
+TArCy ·∑m ta
j=0
∑n rTAk=0 TAj 3 RelatedTAk
+TArCy ·∑m ta
j=0
∑n campk=0 TAj 3 Campaignk
+TArCy ·∑m ta
j=0
∑n ttpk=0 TAj 3 TTPk
(5.2)
With every relation, a selection variable is multiplied for inclusion or exclusion
of the relation. In SAM, several functions are employed for the assessment of CTI
data such as course of action ranking function (CRF(coa, p)), indicator ranking function
(IRF(indicator,|observable|)), producer strength (PS(p)), COA mass (CM(coa)), indicator
65
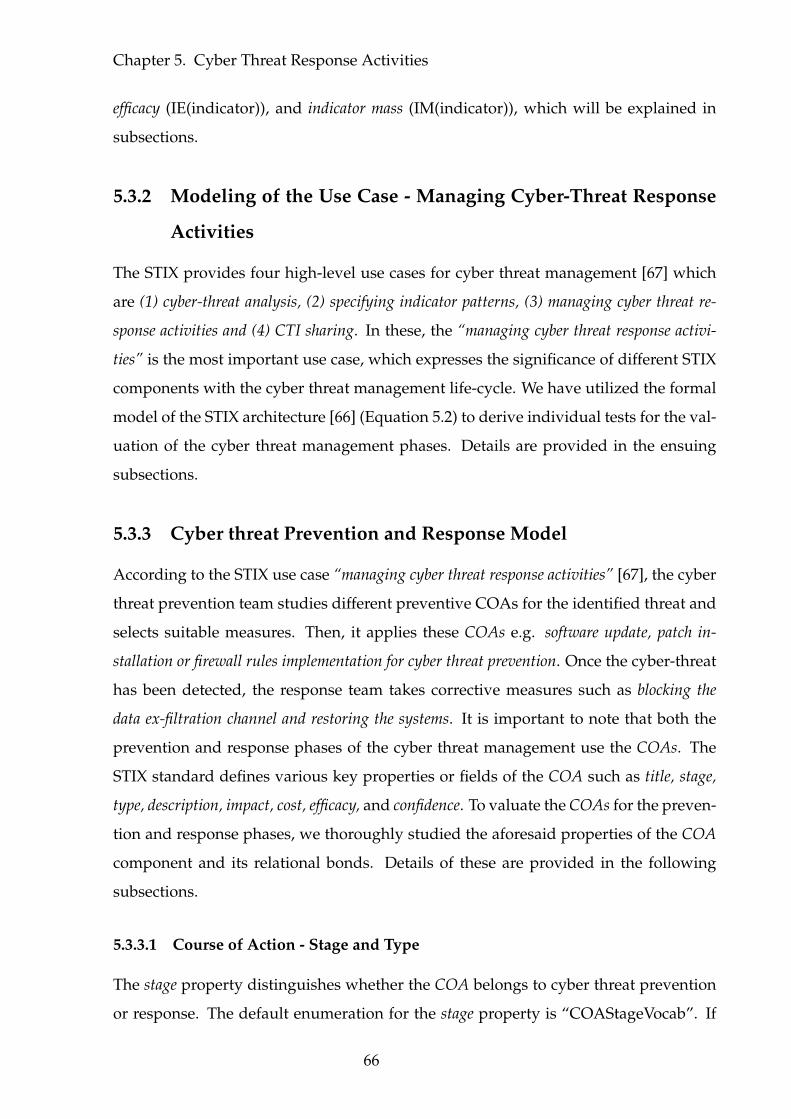
Chapter 5. Cyber Threat Response Activities
efficacy (IE(indicator)), and indicator mass (IM(indicator)), which will be explained in
subsections.
5.3.2 Modeling of the Use Case - Managing Cyber-Threat Response
Activities
The STIX provides four high-level use cases for cyber threat management [67] which
are (1) cyber-threat analysis, (2) specifying indicator patterns, (3) managing cyber threat re-
sponse activities and (4) CTI sharing. In these, the “managing cyber threat response activi-
ties” is the most important use case, which expresses the significance of different STIX
components with the cyber threat management life-cycle. We have utilized the formal
model of the STIX architecture [66] (Equation 5.2) to derive individual tests for the val-
uation of the cyber threat management phases. Details are provided in the ensuing
subsections.
5.3.3 Cyber threat Prevention and Response Model
According to the STIX use case “managing cyber threat response activities” [67], the cyber
threat prevention team studies different preventive COAs for the identified threat and
selects suitable measures. Then, it applies these COAs e.g. software update, patch in-
stallation or firewall rules implementation for cyber threat prevention. Once the cyber-threat
has been detected, the response team takes corrective measures such as blocking the
data ex-filtration channel and restoring the systems. It is important to note that both the
prevention and response phases of the cyber threat management use the COAs. The
STIX standard defines various key properties or fields of the COA such as title, stage,
type, description, impact, cost, efficacy, and confidence. To valuate the COAs for the preven-
tion and response phases, we thoroughly studied the aforesaid properties of the COA
component and its relational bonds. Details of these are provided in the following
subsections.
5.3.3.1 Course of Action - Stage and Type
The stage property distinguishes whether the COA belongs to cyber threat prevention
or response. The default enumeration for the stage property is “COAStageVocab”. If
66
Chapter 5. Cyber Threat Response Activities
stage is set to Remedy then the COA is designed for cyber threat prevention and if its
value is Response then the COA is defined for cyber threat response, as can be seen in
Figure 5.3.
Figure 5.3: COA Stage
This property is applied through the type property, which states a class of the COA.
The type property is implemented through vocabulary “CourseOfActionTypeVocab-
1.0”. This vocabulary defines multiples classes of COA such as patching, hardening,
redirection, public or logical address restriction, eradication, perimeter or host blocking.
5.3.3.2 Course of Action - Impact, Efficacy, and Confidence
The STIX standard provides several properties such as impact, efficacy, and confidence
to describe the COA. (1) The impact property describes the repercussion of implement-
ing the COA. (2) The efficacy states the effectiveness of the COA in getting its intended
goals. (3) The confidence property gives the level of trust of the analyst on the assigned
scores of the impact and efficacy. The STIX standard uses an enumeration “HighMedi-
umLowVocab”, which defines vocabulary to express the various level of these proper-
ties such as unknown, none, low, medium, and high.
To measure the strength of a COA, the following procedure is adopted. (1) At first,
aforesaid qualitative vocabulary levels are converted into quantitative values 0, 1, 2,
and 3, respectively, for the valuation of the COA, as can be seen in Table 5.3. (2) Then
four functions namely CM(coa), I(coa), E(coa) and C(coa, string) are introduced. The
I(coa) (Equation 5.3) and E(coa) (Equation 5.4) functions take coa as input and extracts
67
Chapter 5. Cyber Threat Response Activities
Table 5.3: Levels of Impact, Efficacy, and Confidence for Course of Action
EnumerationVocabulary Values
AssignedNumerical Values
High 3Medium 2Low 1None or Unknown 0
the impact and efficacy levels, which are from 0 to 3 according to Table 5.3.
I (coa) 7−→ {0 , 1 , 2 and 3}
where : 0 , 1 , 2 and 3 are impact levels(5.3)
E (coa) 7−→ {0 , 1 , 2 and 3}
where : 0 , 1 , 2 and 3 are efficacy levels(5.4)
The C(coa, “impact or efficacy”) function takes the coa as well as a string argument asinput. When the caller function passes “impact” as a string then the C(coa, “impact”)function gives the confidence score for the impact of the subject COA, as can be seen inEquation 5.5. This function may results impact and efficacy score from 0 to 3.
C (coa, “impact ′′) 7−→ {0 , 1 , 2 and 3}
where : 0 , 1 , 2 and 3 are confidence levels(5.5)
On the other hand, when “efficacy” is passed then C(coa, “efficacy”) function pro-
duces a confidence score for the effectiveness of the COA, which can be seen in Equa-
tion 5.6.
C (coa, “efficacy ′′) 7−→ {0 , 1 , 2 and 3}
where : 0 , 1 , 2 and 3 are confidence levels(5.6)
(3) The CM(coa) is the main function, which calls the aforesaid IM(coa), E(coa), and
C(coa) functions, adds their produced scores namely impact, efficacy, and confidence,
as shown in Equation 5.7.
CM(coa) = I (coa) + C (coa, “impact ′′) + E (coa) + C (coa, “efficacy ′′) (5.7)
68
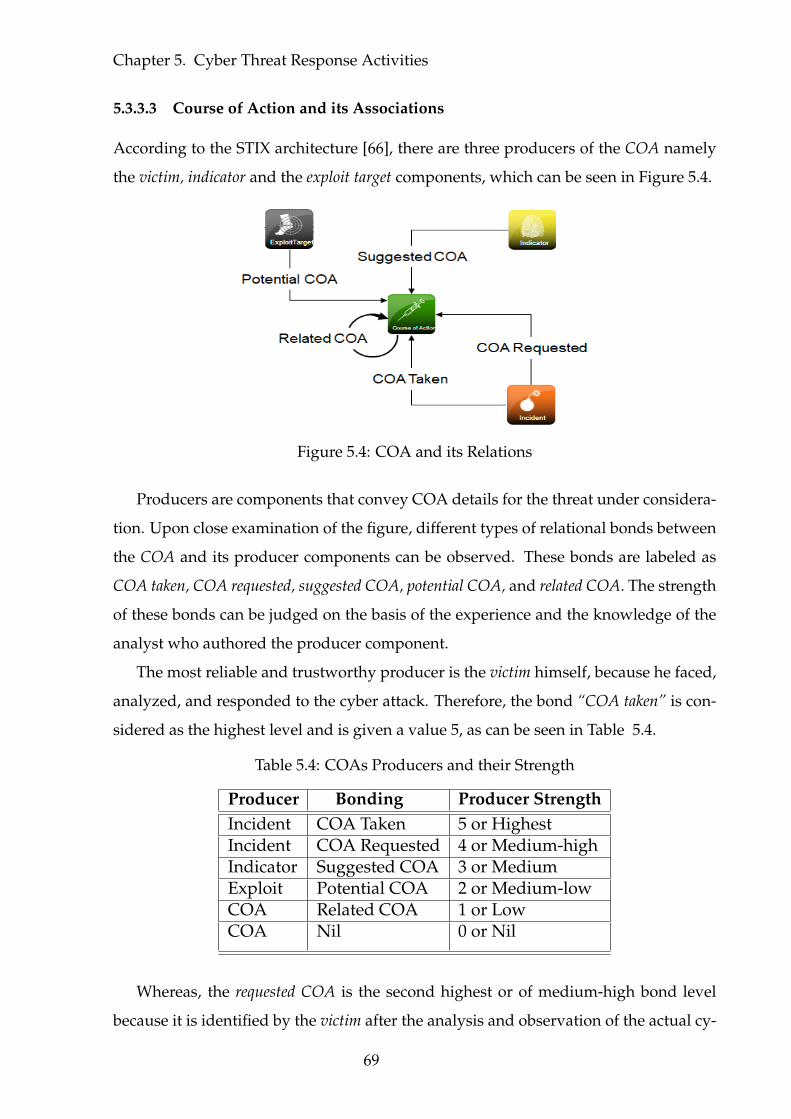
Chapter 5. Cyber Threat Response Activities
5.3.3.3 Course of Action and its Associations
According to the STIX architecture [66], there are three producers of the COA namely
the victim, indicator and the exploit target components, which can be seen in Figure 5.4.
Figure 5.4: COA and its Relations
Producers are components that convey COA details for the threat under considera-
tion. Upon close examination of the figure, different types of relational bonds between
the COA and its producer components can be observed. These bonds are labeled as
COA taken, COA requested, suggested COA, potential COA, and related COA. The strength
of these bonds can be judged on the basis of the experience and the knowledge of the
analyst who authored the producer component.
The most reliable and trustworthy producer is the victim himself, because he faced,
analyzed, and responded to the cyber attack. Therefore, the bond “COA taken” is con-
sidered as the highest level and is given a value 5, as can be seen in Table 5.4.
Table 5.4: COAs Producers and their Strength
Producer Bonding Producer StrengthIncident COA Taken 5 or HighestIncident COA Requested 4 or Medium-highIndicator Suggested COA 3 or MediumExploit Potential COA 2 or Medium-lowCOA Related COA 1 or LowCOA Nil 0 or Nil
Whereas, the requested COA is the second highest or of medium-high bond level
because it is identified by the victim after the analysis and observation of the actual cy-
69
Chapter 5. Cyber Threat Response Activities
ber attack but somehow he could not apply it. Hence, it is considered a second higher
remedial action for the cyber attack. Therefore, it is assigned a value 4. The “suggested
COA” is considered as a medium bond, because it is suggested by an expert after study
and analysis of the cyber attack. Hence, it is assigned a value 3. The COA produced on
the basis of common sense knowledge namely “potential COA” is more of an estimate
and is of a medium-low level or value 2. The related COA is considered as a weak bond
because some of the producers generically associate certain defense mechanisms with
each other without considering the cyber attack scenario. For example, the firewalls and
IDSes are commonly associated with network defence even though in actuality each of
these have their own specific utilization when considering the exact network attack in
question. Hence if a related COA has been mentioned in the STIX then the proposed
model assigns it a low-level value of 1. Similarly, the value of “ Nil or 0” is assigned a
COA, which does not have any association with a producer.
Afterwards, a function namely PS(p) is introduced to measure the strength of a
COA’s producer, which can be seen in Equation 5.8. It take producer as input and
returns the producer strength score according to Table 5.4.
PS (p) 7−→ {0 , 1 , 2 , 3 , 4 , and 5}
where : P ∈ producer of coa
0, 1, 2, 3, 4, and 5 are producer strength scores
(5.8)
5.3.3.4 Ranking of a Course of Action
To rank the COA component, a CRF function is introduced, which can be seen in Equa-
tion 5.9. It accepts coa and its producer (p) as input arguments and passes these to
the CM(coa) (sec. 5.3.3.2) and PS(p) (sec. 5.3.3.3) functions, respectively. The CM(coa)
function produces the mass score of a COA, while PS(p) function returns the producer
strength score. Finally, these scores are added (CM(coa) + PS(p)) to produce the rank-
ing score of the COA.
CRF (coa, p) = CM (coa) + PS (p)
where : coa ∈ COA
p ∈ the producer of the COA.
(5.9)
70
Chapter 5. Cyber Threat Response Activities
The STIX use case - “managing cyber threat response activities” [67], the COA com-
ponent properties and its relational bonding is a basis for us for the valuation of the
STIX reports for the prevention and response phases of the cyber threat management.
The valuation metric is formalized for all the relations enumerated in the SAM model
which have COA components and can be seen in an Equation 5.10 for the cyber threat
prevention and response phases.
vScore = COAC·m coa∑j=0
CRF (COAj , Nil)
+COArCw·m coa∑j=0
n rCOA∑k=0
CRF (COAj , RelatedCOAk)
+IndrCu·m Ind∑j=0
n coa∑k=0
CRF (Indicatorj , COAk)
+IncrCv ·m Inc∑j=0
n coareq∑k=0
CRF (Incidentj , COARequestedk)
+IncrCv ·m Inc∑j=0
n coaTaken∑k=0
CRF (Incidentj , COATakenk)
+TTPrCt·m Exp∑j=0
n coa∑k=0
CRF (ExploitTargetj , COAk)
(5.10)
To automate the relations selection procedure for the cyber threat prevention and
response phases, it is required to set the component selection variables in the SAM
equation (Equation 5.2) according to Table 5.5.
Table 5.5: Variables for Prevention and Response phases
Variables ValuesCC, CrCr 0 , r = 0TTPC, TTPrCs 0 , s = 0EC, ErCt 0 , t = 2IndC, IndrCu 0 , u = 5IncC, IncrCv 0 , v = 3, 4COAC, COArCw 1 , w = 1ObsC, ObsCx 0 , x = 0TAC, TArCy 0 , y = 0
The first column in the table shows the components selection variables, while the
second column represents the values of the variables for the automatic inclusion or
exclusion of the STIX component and to reduce the SAM equation for the prevention
71
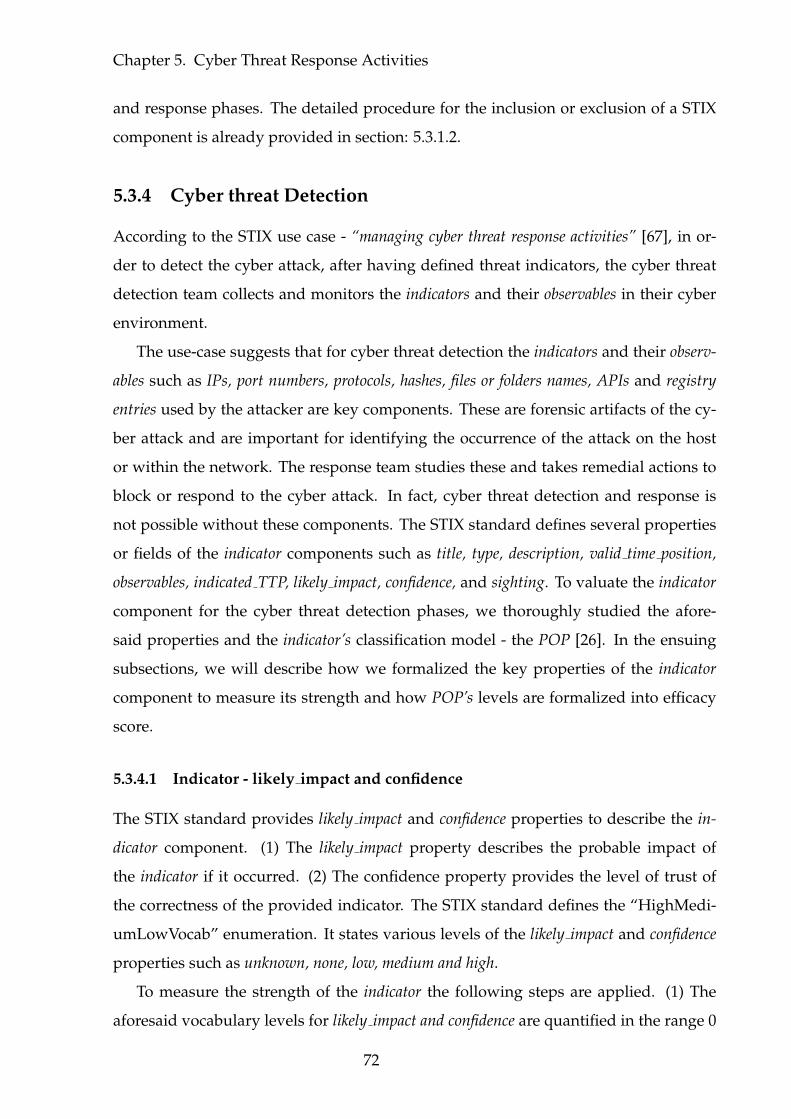
Chapter 5. Cyber Threat Response Activities
and response phases. The detailed procedure for the inclusion or exclusion of a STIX
component is already provided in section: 5.3.1.2.
5.3.4 Cyber threat Detection
According to the STIX use case - “managing cyber threat response activities” [67], in or-
der to detect the cyber attack, after having defined threat indicators, the cyber threat
detection team collects and monitors the indicators and their observables in their cyber
environment.
The use-case suggests that for cyber threat detection the indicators and their observ-
ables such as IPs, port numbers, protocols, hashes, files or folders names, APIs and registry
entries used by the attacker are key components. These are forensic artifacts of the cy-
ber attack and are important for identifying the occurrence of the attack on the host
or within the network. The response team studies these and takes remedial actions to
block or respond to the cyber attack. In fact, cyber threat detection and response is
not possible without these components. The STIX standard defines several properties
or fields of the indicator components such as title, type, description, valid time position,
observables, indicated TTP, likely impact, confidence, and sighting. To valuate the indicator
component for the cyber threat detection phases, we thoroughly studied the afore-
said properties and the indicator’s classification model - the POP [26]. In the ensuing
subsections, we will describe how we formalized the key properties of the indicator
component to measure its strength and how POP’s levels are formalized into efficacy
score.
5.3.4.1 Indicator - likely impact and confidence
The STIX standard provides likely impact and confidence properties to describe the in-
dicator component. (1) The likely impact property describes the probable impact of
the indicator if it occurred. (2) The confidence property provides the level of trust of
the correctness of the provided indicator. The STIX standard defines the “HighMedi-
umLowVocab” enumeration. It states various levels of the likely impact and confidence
properties such as unknown, none, low, medium and high.
To measure the strength of the indicator the following steps are applied. (1) The
aforesaid vocabulary levels for likely impact and confidence are quantified in the range 0
72
Chapter 5. Cyber Threat Response Activities
to 3, with 0 being the lowest and 3 being the highest, similar to how the trustworthiness
levels of the COA component properties were mapped as shown in section: 5.3.3.2. (2)
Next, IM(indicator) function is employed, which takes indicator component information
as an input and forwards this information to the LI(indicator) and C(indicator) functions.
Where, the LI(indicator) function produces the likely impact and C(indicator) function
gives the confidence level for the impact of the subject indicator. Subsequently, these
scores are added to produce the indicator mass score, which can be seen in Equation
5.11.
IM (indicator) = I (indicator) + C (indicator) (5.11)
5.3.4.2 Formalization of POP indicator levels as efficacy scores
The POP model emphasises that all indicators are not equally important for cyber at-
tack detection. It classifies the indicators on the basis of their efficacy and places them
at different levels of the pyramid. Moreover, this model suggests that the higher an
indicator is in the pyramid, the more useful it is for cyber threat management because
it causes more damage to the adversary and it is difficult to change, as the adversary
invests more resources and time on indicators that are higher in the pyramid. For ex-
ample, responding to low-level indicators namely hashes, IPs and DNs will cause minor
damage, while preventing high-level indicators such as host and network artifacts, tools
and TTPs will cause more pain to the adversary. According to the various levels of the
POP, efficacy scores are assigned to the indicators, as shown in Table 5.6.
A lower score value is assigned to the low-level indicator than that assigned to the
higher level indicator. For example, a score of 5 is assigned to exploit watchlist which
is at a higher level than hash watchlist that is assigned a 1. All indicators are assigned
scores in this fashion. Next, IE(indicator) function is introduced, which takes indicator
as an input argument and returns indicator efficacy score according to the Table 5.6,
as can be seen in Equation 5.12.
IE (indicator) 7−→ {1 , 2 , 3 , 4 , and 5}
where : 1 , 2 , 3 , 4 , and 5 are indicator efficacy scores(5.12)
73
Chapter 5. Cyber Threat Response Activities
Table 5.6: Indicator Efficacy
Indicator Efficacy ScoreExploit Watchlist 5APIs Watchlist 4Folders Watchlist 4Files Watchlist 4Registry Watchlist 4Mutex Watchlist 4Registry Watchlist 4Data Staged 4Protocol Watchlist 3Port Watchlist 3DN Watchlist 2IP Watchlist 2Hash Watchlist 1
5.3.4.3 Ranking of an Indicator
Indicator Ranking Function (IRF (indicator, |observable|)) is proposed to rank the indica-
tor component of the STIX reports, which can be seen in Equation 5.13. It takes indica-
tor and |observable| as input and forwards indicator to the indicator mass (IM(indicator))
(sec. 5.3.4.1) and indicator efficacy (IE(indicator)) (sec. 5.3.4.2) functions. These func-
tions return indicator mass and efficacy scores respectively, which are later added and
the sum is multiplied with the |observable|. Subsequently, the result is returned to the
caller function.
IRF (indicator , |observable|) = {IM (indicator) + IE (indicator)} × |observable| (5.13)
The STIX use case - “managing cyber threat response activities” [67], the indicator com-
ponent’s properties and the indicators classification model - POP is a basis for us for the
valuation of the STIX reports for the cyber threat detection phase of the cyber threat
management. The valuation metric is formalized as Equation 5.14 for the relation enu-
merated in the SAM model and uses the indicator and observable components.
vScore = IndrC ·m ind∑j=0
IRF (Indicatorj, |Observable|) (5.14)
74
Chapter 5. Cyber Threat Response Activities
To automate the relations selection procedure for the cyber threat detection phase,
it is required to set the component selection variables in the SAM equation (Equation
5.2) according to Table 5.7.
Table 5.7: Variables for Detection phase
Variables ValuesCC, CrCr 0 , 0TTPC, TTPrCs 0 , 0EC, ErCt 0 , 0IndC, IndrCu 0 , u=4IncC, IncrCv 0 , 0COAC, COArCw 0 , 0ObsC, ObsCx 0 , 0
The table shows the component selection variables and their values to reduce the
SAM equation (Equation 5.2) for the cyber threat detection phase. The detailed proce-
dure for the inclusion or exclusion of a STIX component is already provided in section:
5.3.1.2.
5.4 Architecture and Implementation
The high-level architecture of the SCERM system is shown in Figure 5.5 while pseudo
code is provided in algorithm 5.1 detailing the connectivity of the various modules and
their submodules.
The three main modules that the SCERM system is composed of includes (1) the
Preprocessing, (2) the Valuation and (3) the Refinement. The Preprocessing module consists
of Parser and Booster submodules. The Parser accepts STIX reports as an input, extracts,
and stores the desired STIX components into the graph database. Afterwards, the
Booster submodule retrieves distinct components and saves them into Distinct compo-
nent list (DCL). Then, the Booster function identifies and places the misplaced component
under a Native Component List (NCL[]).
Afterwards, the Valuation module takes the database as an input, formally evalu-
ates the STIX model and generates valuation scores for different phases of CTM. These
scores are communicated to the analyst. Subsequently, Refinement module gets com-
75
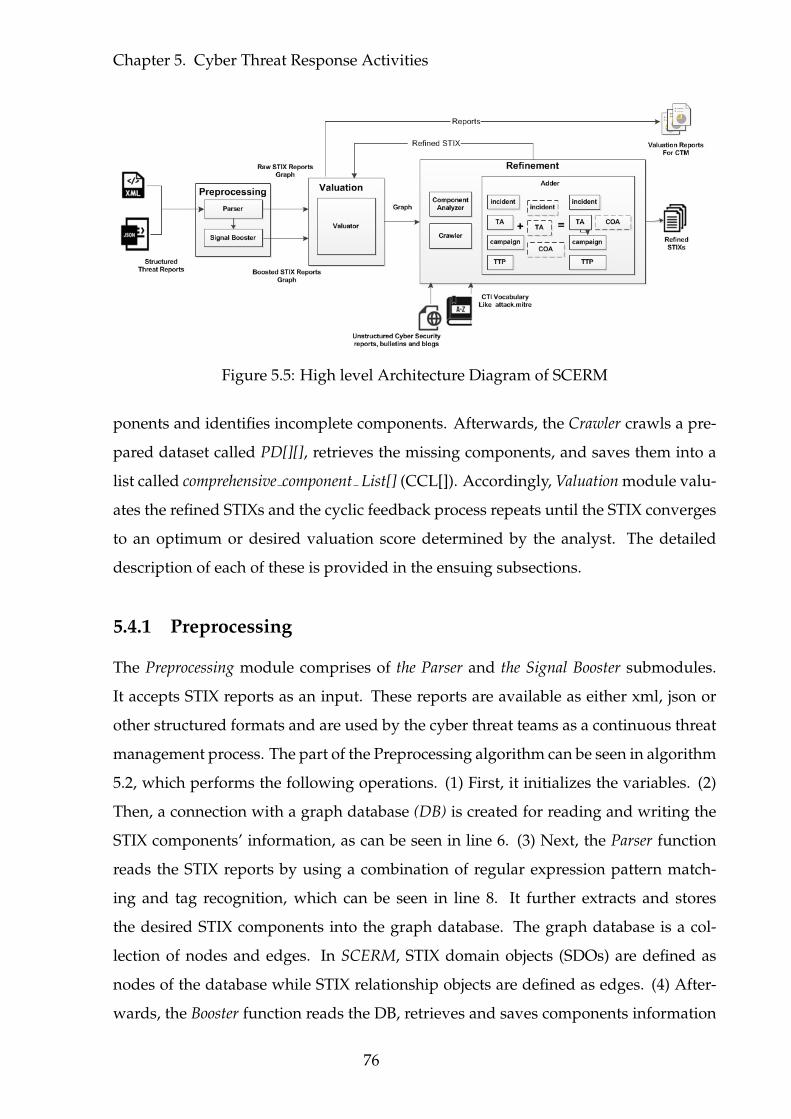
Chapter 5. Cyber Threat Response Activities
Figure 5.5: High level Architecture Diagram of SCERM
ponents and identifies incomplete components. Afterwards, the Crawler crawls a pre-
pared dataset called PD[][], retrieves the missing components, and saves them into a
list called comprehensive component List[] (CCL[]). Accordingly, Valuation module valu-
ates the refined STIXs and the cyclic feedback process repeats until the STIX converges
to an optimum or desired valuation score determined by the analyst. The detailed
description of each of these is provided in the ensuing subsections.
5.4.1 Preprocessing
The Preprocessing module comprises of the Parser and the Signal Booster submodules.
It accepts STIX reports as an input. These reports are available as either xml, json or
other structured formats and are used by the cyber threat teams as a continuous threat
management process. The part of the Preprocessing algorithm can be seen in algorithm
5.2, which performs the following operations. (1) First, it initializes the variables. (2)
Then, a connection with a graph database (DB) is created for reading and writing the
STIX components’ information, as can be seen in line 6. (3) Next, the Parser function
reads the STIX reports by using a combination of regular expression pattern match-
ing and tag recognition, which can be seen in line 8. It further extracts and stores
the desired STIX components into the graph database. The graph database is a col-
lection of nodes and edges. In SCERM, STIX domain objects (SDOs) are defined as
nodes of the database while STIX relationship objects are defined as edges. (4) After-
wards, the Booster function reads the DB, retrieves and saves components information
76
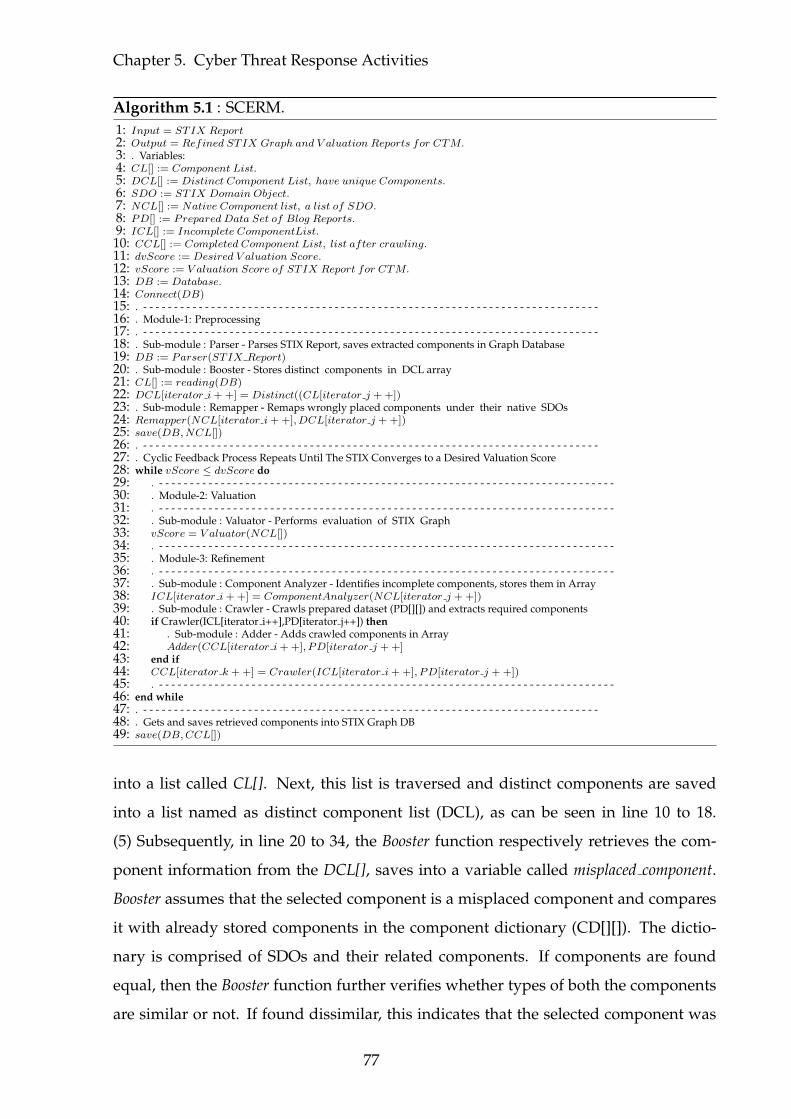
Chapter 5. Cyber Threat Response Activities
Algorithm 5.1 : SCERM.1: Input = STIX Report2: Output = Refined STIX Graph and V aluation Reports for CTM.3: . Variables:4: CL[] := Component List.5: DCL[] := Distinct Component List, have unique Components.6: SDO := STIX Domain Object.7: NCL[] := Native Component list, a list of SDO.8: PD[] := Prepared Data Set of Blog Reports.9: ICL[] := Incomplete ComponentList.10: CCL[] := Completed Component List, list after crawling.11: dvScore := Desired V aluation Score.12: vScore := V aluation Score of STIX Report for CTM.13: DB := Database.14: Connect(DB)15: . - - - - - - - - - - - - - - - - - - - - - - - - - - - - - - - - - - - - - - - - - - - - - - - - - - - - - - - - - - - - - - - - - - - - - - - - - -16: . Module-1: Preprocessing17: . - - - - - - - - - - - - - - - - - - - - - - - - - - - - - - - - - - - - - - - - - - - - - - - - - - - - - - - - - - - - - - - - - - - - - - - - - -18: . Sub-module : Parser - Parses STIX Report, saves extracted components in Graph Database19: DB := Parser(STIX Report)20: . Sub-module : Booster - Stores distinct components in DCL array21: CL[] := reading(DB)22: DCL[iterator i++] = Distinct((CL[iterator j ++])23: . Sub-module : Remapper - Remaps wrongly placed components under their native SDOs24: Remapper(NCL[iterator i++], DCL[iterator j ++])25: save(DB,NCL[])26: . - - - - - - - - - - - - - - - - - - - - - - - - - - - - - - - - - - - - - - - - - - - - - - - - - - - - - - - - - - - - - - - - - - - - - - - - - -27: . Cyclic Feedback Process Repeats Until The STIX Converges to a Desired Valuation Score28: while vScore ≤ dvScore do29: . - - - - - - - - - - - - - - - - - - - - - - - - - - - - - - - - - - - - - - - - - - - - - - - - - - - - - - - - - - - - - - - - - - - - - - - - - -30: . Module-2: Valuation31: . - - - - - - - - - - - - - - - - - - - - - - - - - - - - - - - - - - - - - - - - - - - - - - - - - - - - - - - - - - - - - - - - - - - - - - - - - -32: . Sub-module : Valuator - Performs evaluation of STIX Graph33: vScore = V aluator(NCL[])34: . - - - - - - - - - - - - - - - - - - - - - - - - - - - - - - - - - - - - - - - - - - - - - - - - - - - - - - - - - - - - - - - - - - - - - - - - - -35: . Module-3: Refinement36: . - - - - - - - - - - - - - - - - - - - - - - - - - - - - - - - - - - - - - - - - - - - - - - - - - - - - - - - - - - - - - - - - - - - - - - - - - -37: . Sub-module : Component Analyzer - Identifies incomplete components, stores them in Array38: ICL[iterator i++] = ComponentAnalyzer(NCL[iterator j ++])39: . Sub-module : Crawler - Crawls prepared dataset (PD[][]) and extracts required components40: if Crawler(ICL[iterator i++],PD[iterator j++]) then41: . Sub-module : Adder - Adds crawled components in Array42: Adder(CCL[iterator i++], PD[iterator j ++]43: end if44: CCL[iterator k ++] = Crawler(ICL[iterator i++], PD[iterator j ++])45: . - - - - - - - - - - - - - - - - - - - - - - - - - - - - - - - - - - - - - - - - - - - - - - - - - - - - - - - - - - - - - - - - - - - - - - - - - -46: end while47: . - - - - - - - - - - - - - - - - - - - - - - - - - - - - - - - - - - - - - - - - - - - - - - - - - - - - - - - - - - - - - - - - - - - - - - - - - -48: . Gets and saves retrieved components into STIX Graph DB49: save(DB,CCL[])
into a list called CL[]. Next, this list is traversed and distinct components are saved
into a list named as distinct component list (DCL), as can be seen in line 10 to 18.
(5) Subsequently, in line 20 to 34, the Booster function respectively retrieves the com-
ponent information from the DCL[], saves into a variable called misplaced component.
Booster assumes that the selected component is a misplaced component and compares
it with already stored components in the component dictionary (CD[][]). The dictio-
nary is comprised of SDOs and their related components. If components are found
equal, then the Booster function further verifies whether types of both the components
are similar or not. If found dissimilar, this indicates that the selected component was
77
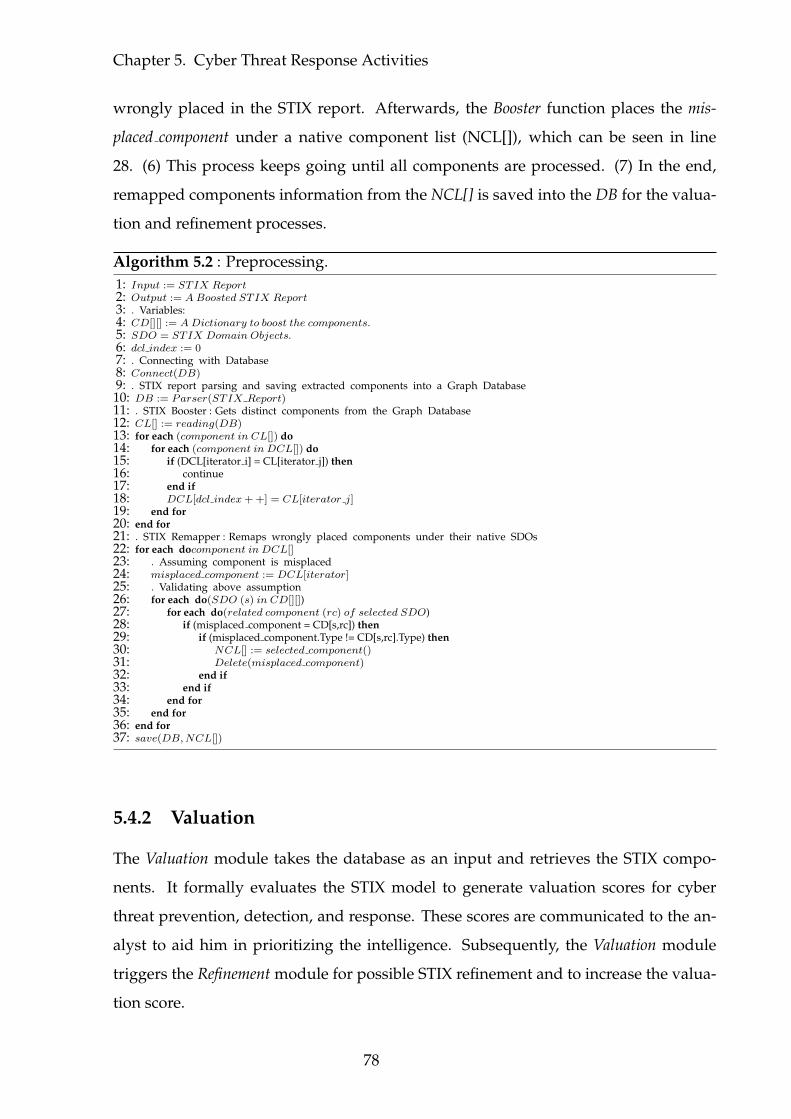
Chapter 5. Cyber Threat Response Activities
wrongly placed in the STIX report. Afterwards, the Booster function places the mis-
placed component under a native component list (NCL[]), which can be seen in line
28. (6) This process keeps going until all components are processed. (7) In the end,
remapped components information from the NCL[] is saved into the DB for the valua-
tion and refinement processes.
Algorithm 5.2 : Preprocessing.1: Input := STIX Report2: Output := A Boosted STIX Report3: . Variables:4: CD[][] := ADictionary to boost the components.5: SDO = STIX Domain Objects.6: dcl index := 07: . Connecting with Database8: Connect(DB)9: . STIX report parsing and saving extracted components into a Graph Database10: DB := Parser(STIX Report)11: . STIX Booster : Gets distinct components from the Graph Database12: CL[] := reading(DB)13: for each (component in CL[]) do14: for each (component in DCL[]) do15: if (DCL[iterator i] = CL[iterator j]) then16: continue17: end if18: DCL[dcl index++] = CL[iterator j]19: end for20: end for21: . STIX Remapper : Remaps wrongly placed components under their native SDOs22: for each docomponent in DCL[]23: . Assuming component is misplaced24: misplaced component := DCL[iterator]25: . Validating above assumption26: for each do(SDO (s) in CD[][])27: for each do(related component (rc) of selected SDO)28: if (misplaced component = CD[s,rc]) then29: if (misplaced component.Type != CD[s,rc].Type) then30: NCL[] := selected component()31: Delete(misplaced component)32: end if33: end if34: end for35: end for36: end for37: save(DB,NCL[])
5.4.2 Valuation
The Valuation module takes the database as an input and retrieves the STIX compo-
nents. It formally evaluates the STIX model to generate valuation scores for cyber
threat prevention, detection, and response. These scores are communicated to the an-
alyst to aid him in prioritizing the intelligence. Subsequently, the Valuation module
triggers the Refinement module for possible STIX refinement and to increase the valua-
tion score.
78
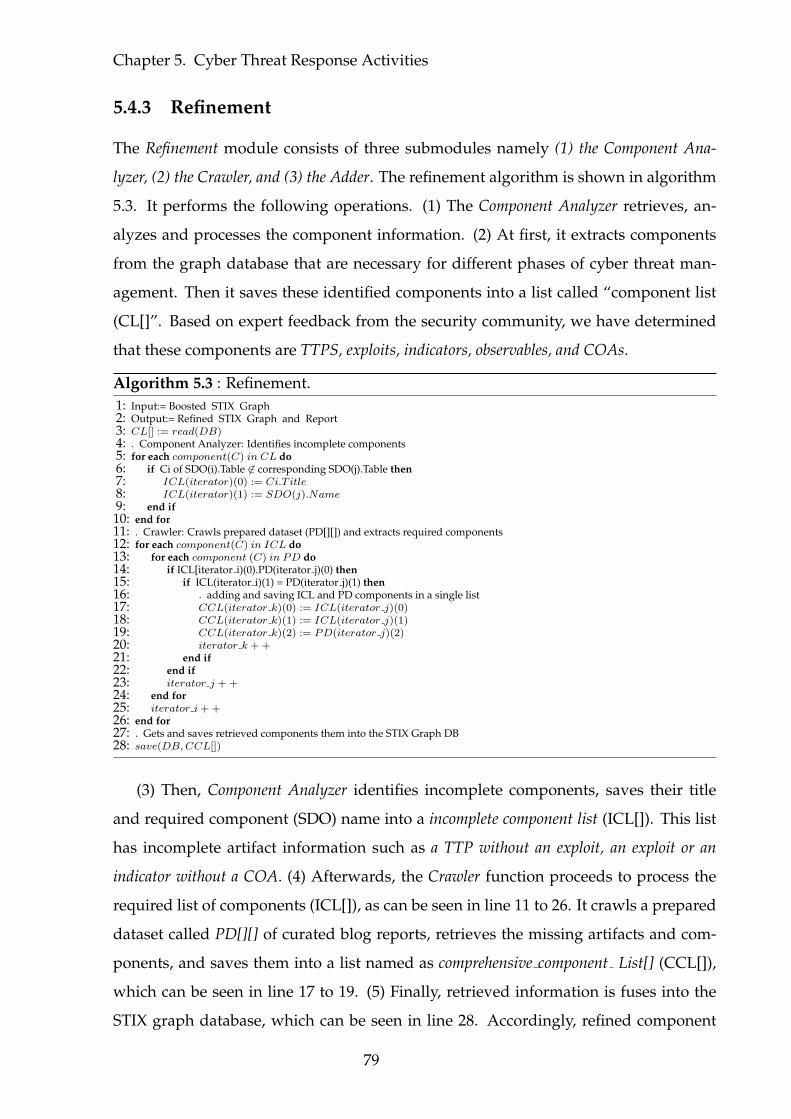
Chapter 5. Cyber Threat Response Activities
5.4.3 Refinement
The Refinement module consists of three submodules namely (1) the Component Ana-
lyzer, (2) the Crawler, and (3) the Adder. The refinement algorithm is shown in algorithm
5.3. It performs the following operations. (1) The Component Analyzer retrieves, an-
alyzes and processes the component information. (2) At first, it extracts components
from the graph database that are necessary for different phases of cyber threat man-
agement. Then it saves these identified components into a list called “component list
(CL[]”. Based on expert feedback from the security community, we have determined
that these components are TTPS, exploits, indicators, observables, and COAs.
Algorithm 5.3 : Refinement.1: Input:= Boosted STIX Graph2: Output:= Refined STIX Graph and Report3: CL[] := read(DB)4: . Component Analyzer: Identifies incomplete components5: for each component(C) in CL do6: if Ci of SDO(i).Table 6∈ corresponding SDO(j).Table then7: ICL(iterator)(0) := Ci.T itle8: ICL(iterator)(1) := SDO(j).Name9: end if10: end for11: . Crawler: Crawls prepared dataset (PD[][]) and extracts required components12: for each component(C) in ICL do13: for each component (C) in PD do14: if ICL[iterator i)(0).PD(iterator j)(0) then15: if ICL(iterator i)(1) = PD(iterator j)(1) then16: . adding and saving ICL and PD components in a single list17: CCL(iterator k)(0) := ICL(iterator j)(0)18: CCL(iterator k)(1) := ICL(iterator j)(1)19: CCL(iterator k)(2) := PD(iterator j)(2)20: iterator k ++21: end if22: end if23: iterator j ++24: end for25: iterator i++26: end for27: . Gets and saves retrieved components them into the STIX Graph DB28: save(DB,CCL[])
(3) Then, Component Analyzer identifies incomplete components, saves their title
and required component (SDO) name into a incomplete component list (ICL[]). This list
has incomplete artifact information such as a TTP without an exploit, an exploit or an
indicator without a COA. (4) Afterwards, the Crawler function proceeds to process the
required list of components (ICL[]), as can be seen in line 11 to 26. It crawls a prepared
dataset called PD[][] of curated blog reports, retrieves the missing artifacts and com-
ponents, and saves them into a list named as comprehensive component List[] (CCL[]),
which can be seen in line 17 to 19. (5) Finally, retrieved information is fuses into the
STIX graph database, which can be seen in line 28. Accordingly, refined component
79
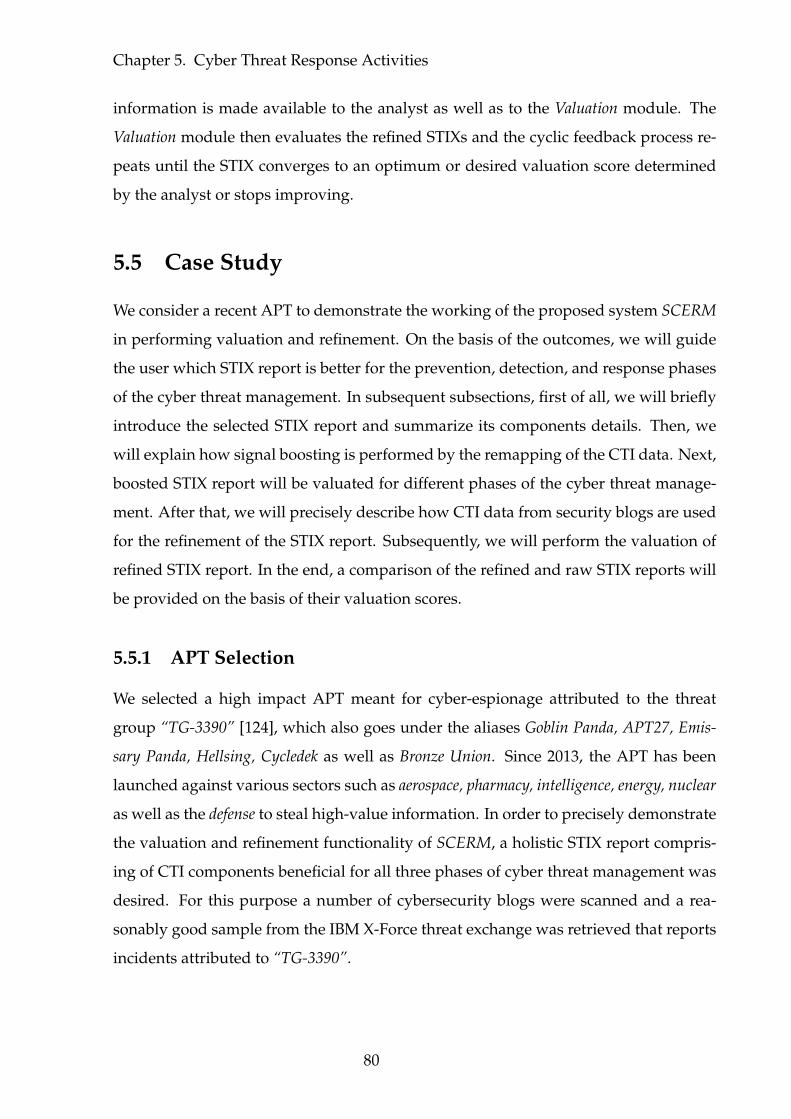
Chapter 5. Cyber Threat Response Activities
information is made available to the analyst as well as to the Valuation module. The
Valuation module then evaluates the refined STIXs and the cyclic feedback process re-
peats until the STIX converges to an optimum or desired valuation score determined
by the analyst or stops improving.
5.5 Case Study
We consider a recent APT to demonstrate the working of the proposed system SCERM
in performing valuation and refinement. On the basis of the outcomes, we will guide
the user which STIX report is better for the prevention, detection, and response phases
of the cyber threat management. In subsequent subsections, first of all, we will briefly
introduce the selected STIX report and summarize its components details. Then, we
will explain how signal boosting is performed by the remapping of the CTI data. Next,
boosted STIX report will be valuated for different phases of the cyber threat manage-
ment. After that, we will precisely describe how CTI data from security blogs are used
for the refinement of the STIX report. Subsequently, we will perform the valuation of
refined STIX report. In the end, a comparison of the refined and raw STIX reports will
be provided on the basis of their valuation scores.
5.5.1 APT Selection
We selected a high impact APT meant for cyber-espionage attributed to the threat
group “TG-3390” [124], which also goes under the aliases Goblin Panda, APT27, Emis-
sary Panda, Hellsing, Cycledek as well as Bronze Union. Since 2013, the APT has been
launched against various sectors such as aerospace, pharmacy, intelligence, energy, nuclear
as well as the defense to steal high-value information. In order to precisely demonstrate
the valuation and refinement functionality of SCERM, a holistic STIX report compris-
ing of CTI components beneficial for all three phases of cyber threat management was
desired. For this purpose a number of cybersecurity blogs were scanned and a rea-
sonably good sample from the IBM X-Force threat exchange was retrieved that reports
incidents attributed to “TG-3390”.
80
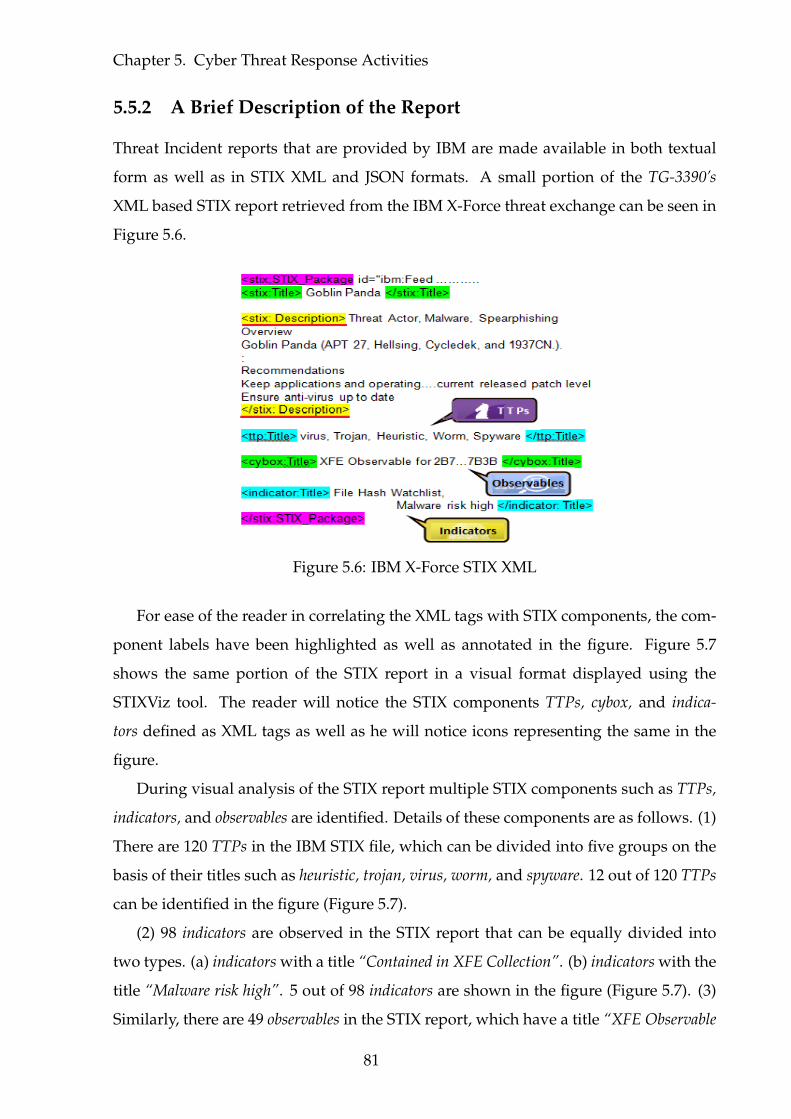
Chapter 5. Cyber Threat Response Activities
5.5.2 A Brief Description of the Report
Threat Incident reports that are provided by IBM are made available in both textual
form as well as in STIX XML and JSON formats. A small portion of the TG-3390’s
XML based STIX report retrieved from the IBM X-Force threat exchange can be seen in
Figure 5.6.
Figure 5.6: IBM X-Force STIX XML
For ease of the reader in correlating the XML tags with STIX components, the com-
ponent labels have been highlighted as well as annotated in the figure. Figure 5.7
shows the same portion of the STIX report in a visual format displayed using the
STIXViz tool. The reader will notice the STIX components TTPs, cybox, and indica-
tors defined as XML tags as well as he will notice icons representing the same in the
figure.
During visual analysis of the STIX report multiple STIX components such as TTPs,
indicators, and observables are identified. Details of these components are as follows. (1)
There are 120 TTPs in the IBM STIX file, which can be divided into five groups on the
basis of their titles such as heuristic, trojan, virus, worm, and spyware. 12 out of 120 TTPs
can be identified in the figure (Figure 5.7).
(2) 98 indicators are observed in the STIX report that can be equally divided into
two types. (a) indicators with a title “Contained in XFE Collection”. (b) indicators with the
title “Malware risk high”. 5 out of 98 indicators are shown in the figure (Figure 5.7). (3)
Similarly, there are 49 observables in the STIX report, which have a title “XFE Observable
81
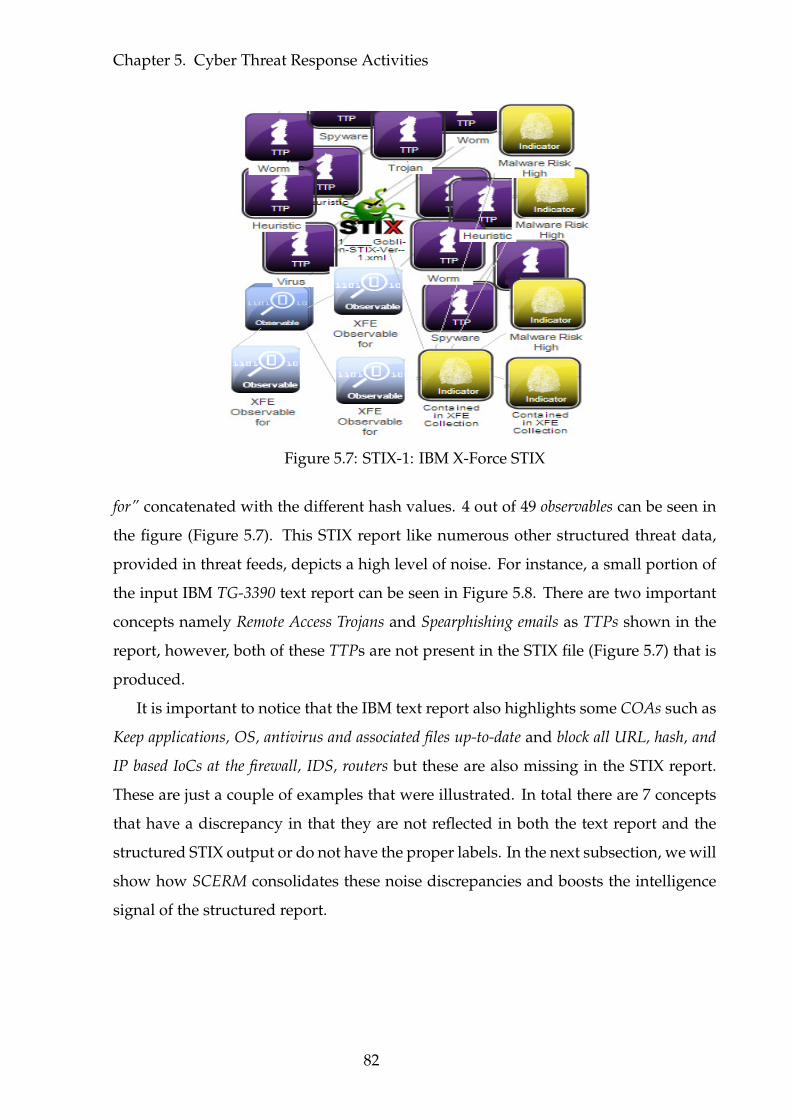
Chapter 5. Cyber Threat Response Activities
Figure 5.7: STIX-1: IBM X-Force STIX
for” concatenated with the different hash values. 4 out of 49 observables can be seen in
the figure (Figure 5.7). This STIX report like numerous other structured threat data,
provided in threat feeds, depicts a high level of noise. For instance, a small portion of
the input IBM TG-3390 text report can be seen in Figure 5.8. There are two important
concepts namely Remote Access Trojans and Spearphishing emails as TTPs shown in the
report, however, both of these TTPs are not present in the STIX file (Figure 5.7) that is
produced.
It is important to notice that the IBM text report also highlights some COAs such as
Keep applications, OS, antivirus and associated files up-to-date and block all URL, hash, and
IP based IoCs at the firewall, IDS, routers but these are also missing in the STIX report.
These are just a couple of examples that were illustrated. In total there are 7 concepts
that have a discrepancy in that they are not reflected in both the text report and the
structured STIX output or do not have the proper labels. In the next subsection, we will
show how SCERM consolidates these noise discrepancies and boosts the intelligence
signal of the structured report.
82
Chapter 5. Cyber Threat Response Activities
Figure 5.8: IBM Text Report
5.5.3 Signal Boosting
During our research, it has been observed that STIX reports are not appropriately for-
matted, use incorrect vocabulary and are either missing key components or have erro-
neously labeled elements reducing their usefulness for effective cyber threat manage-
ment. For example, the TG-3390 STIX report selected for the case study has important
CTI data under the description tag. By zooming into the description tag in the figure
(Figure 5.6), the CTI data related to important STIX components such as TTPS, indica-
tors, observables, and COAs can be identified, as shown in Figure 5.9.
This CTI data is exactly the same as the IBM text report (Figure 5.8). The Signal
Booster retrieves CTI data from the description tag of the STIX and remaps it under
the appropriate STIX component’s tag. For example, the CTI Remote Access Trojans and
Spearphishing emails are placed under the TTP tag, the Keep applications, OS, antivirus
and associated files up-to-date are placed under the exploit components, while Block hashes
at the firewall, IDS, routers are placed under the observable component. Then the updated
information is stored into the shared graph database. The updated STIX report, gen-
erated from the boosted components information, has meaningful, threat-relevant and
distinct CTI Data, as shown in Figure 5.10.
Upon close examination of the updated STIX report, followings components infor-
mation can be observed. (1) There are 2 TTPs namely Remote Access Trojan and Spear
83
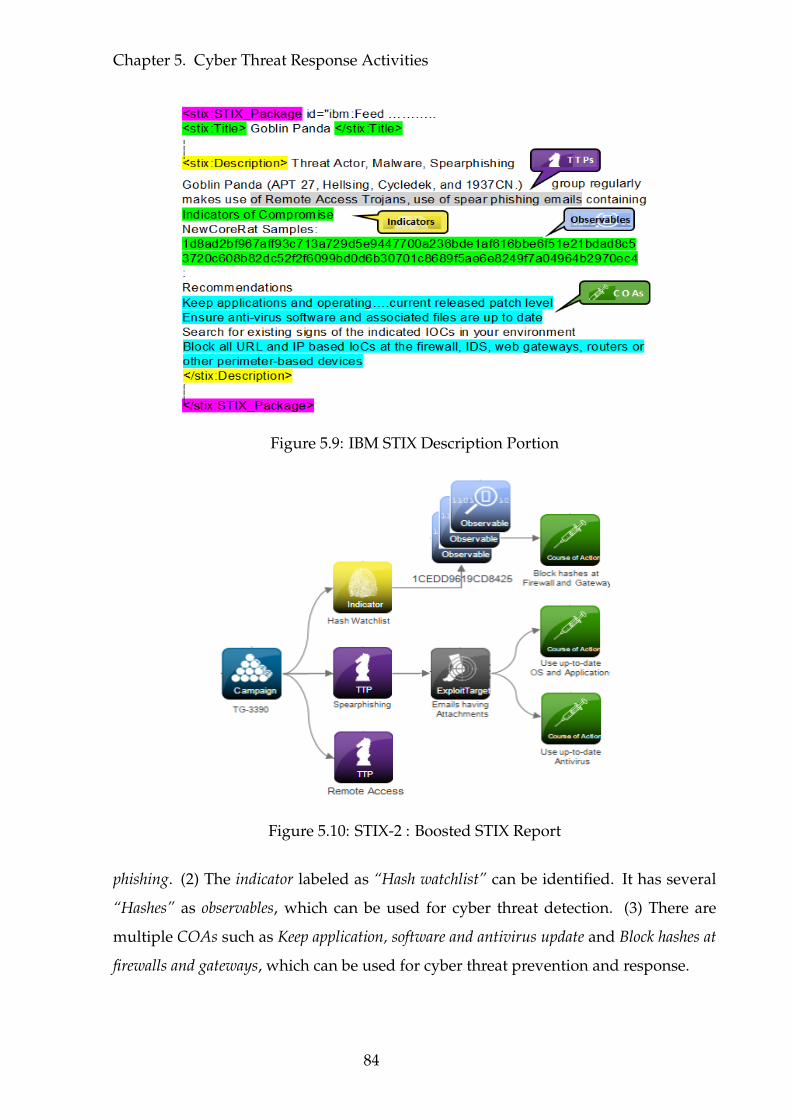
Chapter 5. Cyber Threat Response Activities
Figure 5.9: IBM STIX Description Portion
Figure 5.10: STIX-2 : Boosted STIX Report
phishing. (2) The indicator labeled as “Hash watchlist” can be identified. It has several
“Hashes” as observables, which can be used for cyber threat detection. (3) There are
multiple COAs such as Keep application, software and antivirus update and Block hashes at
firewalls and gateways, which can be used for cyber threat prevention and response.
84
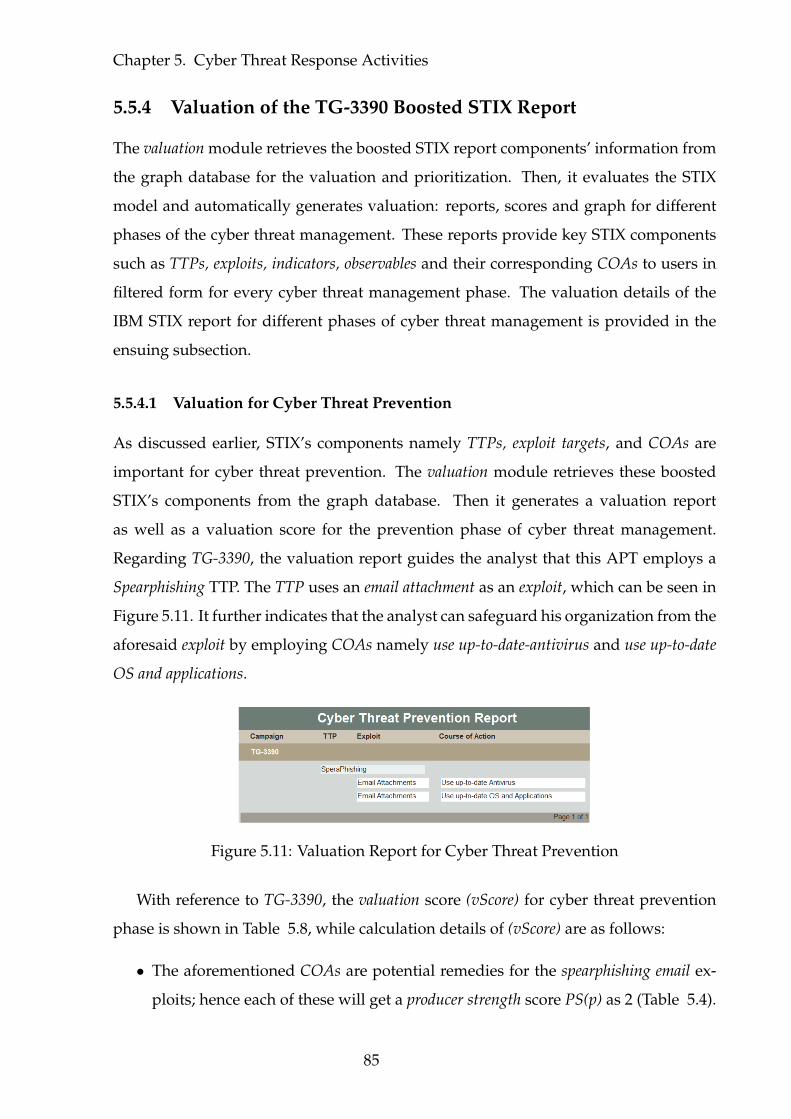
Chapter 5. Cyber Threat Response Activities
5.5.4 Valuation of the TG-3390 Boosted STIX Report
The valuation module retrieves the boosted STIX report components’ information from
the graph database for the valuation and prioritization. Then, it evaluates the STIX
model and automatically generates valuation: reports, scores and graph for different
phases of the cyber threat management. These reports provide key STIX components
such as TTPs, exploits, indicators, observables and their corresponding COAs to users in
filtered form for every cyber threat management phase. The valuation details of the
IBM STIX report for different phases of cyber threat management is provided in the
ensuing subsection.
5.5.4.1 Valuation for Cyber Threat Prevention
As discussed earlier, STIX’s components namely TTPs, exploit targets, and COAs are
important for cyber threat prevention. The valuation module retrieves these boosted
STIX’s components from the graph database. Then it generates a valuation report
as well as a valuation score for the prevention phase of cyber threat management.
Regarding TG-3390, the valuation report guides the analyst that this APT employs a
Spearphishing TTP. The TTP uses an email attachment as an exploit, which can be seen in
Figure 5.11. It further indicates that the analyst can safeguard his organization from the
aforesaid exploit by employing COAs namely use up-to-date-antivirus and use up-to-date
OS and applications.
Figure 5.11: Valuation Report for Cyber Threat Prevention
With reference to TG-3390, the valuation score (vScore) for cyber threat prevention
phase is shown in Table 5.8, while calculation details of (vScore) are as follows:
• The aforementioned COAs are potential remedies for the spearphishing email ex-
ploits; hence each of these will get a producer strength score PS(p) as 2 (Table 5.4).
85
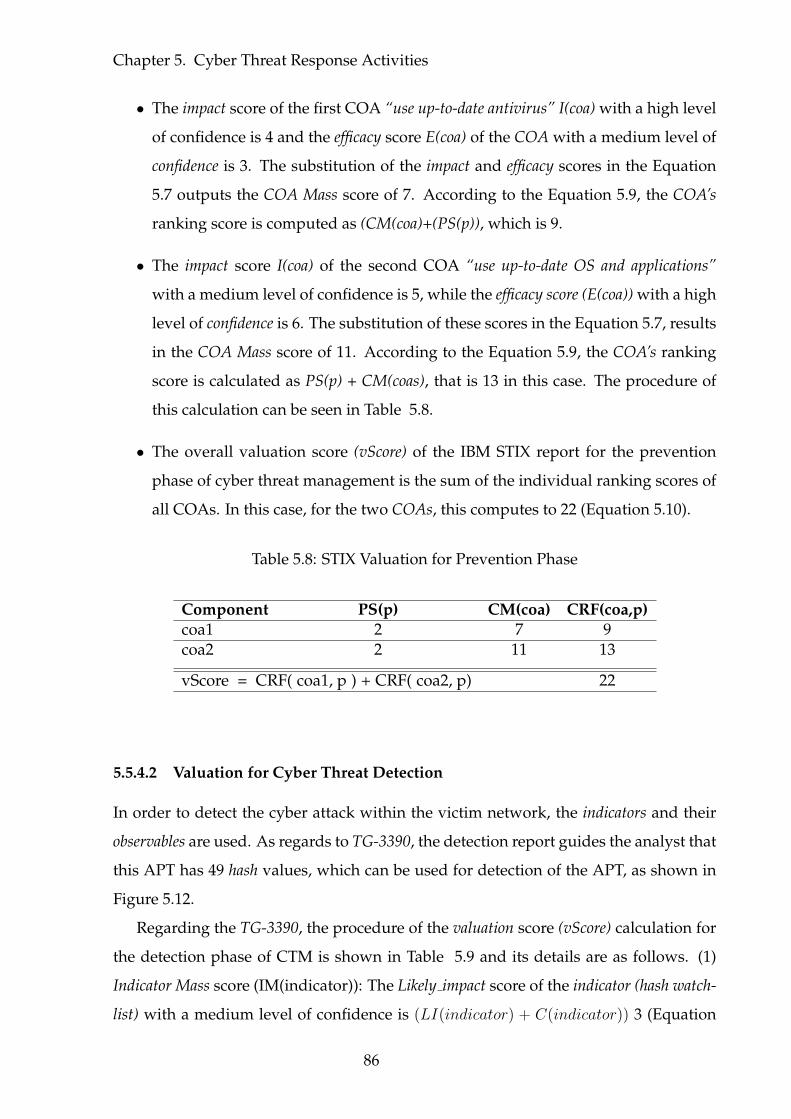
Chapter 5. Cyber Threat Response Activities
• The impact score of the first COA “use up-to-date antivirus” I(coa) with a high level
of confidence is 4 and the efficacy score E(coa) of the COA with a medium level of
confidence is 3. The substitution of the impact and efficacy scores in the Equation
5.7 outputs the COA Mass score of 7. According to the Equation 5.9, the COA’s
ranking score is computed as (CM(coa)+(PS(p)), which is 9.
• The impact score I(coa) of the second COA “use up-to-date OS and applications”
with a medium level of confidence is 5, while the efficacy score (E(coa)) with a high
level of confidence is 6. The substitution of these scores in the Equation 5.7, results
in the COA Mass score of 11. According to the Equation 5.9, the COA’s ranking
score is calculated as PS(p) + CM(coas), that is 13 in this case. The procedure of
this calculation can be seen in Table 5.8.
• The overall valuation score (vScore) of the IBM STIX report for the prevention
phase of cyber threat management is the sum of the individual ranking scores of
all COAs. In this case, for the two COAs, this computes to 22 (Equation 5.10).
Table 5.8: STIX Valuation for Prevention Phase
Component PS(p) CM(coa) CRF(coa,p)coa1 2 7 9coa2 2 11 13
vScore = CRF( coa1, p ) + CRF( coa2, p) 22
5.5.4.2 Valuation for Cyber Threat Detection
In order to detect the cyber attack within the victim network, the indicators and their
observables are used. As regards to TG-3390, the detection report guides the analyst that
this APT has 49 hash values, which can be used for detection of the APT, as shown in
Figure 5.12.
Regarding the TG-3390, the procedure of the valuation score (vScore) calculation for
the detection phase of CTM is shown in Table 5.9 and its details are as follows. (1)
Indicator Mass score (IM(indicator)): The Likely impact score of the indicator (hash watch-
list) with a medium level of confidence is (LI(indicator) + C(indicator)) 3 (Equation
86
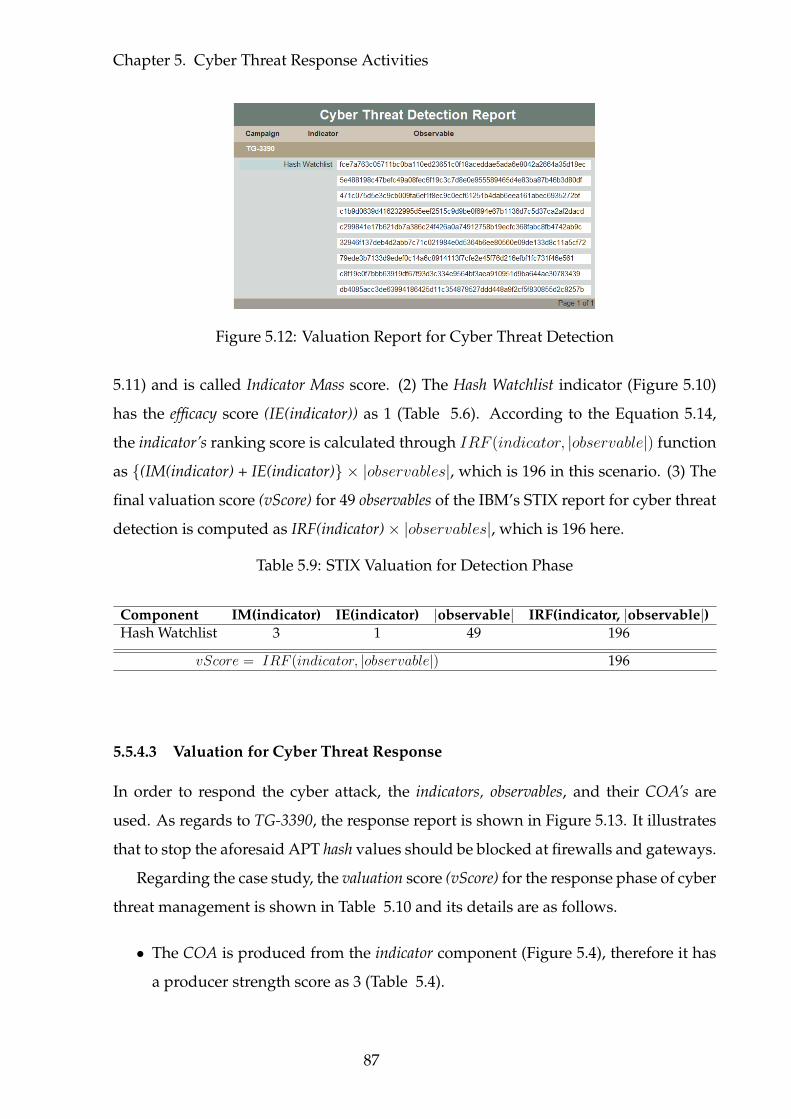
Chapter 5. Cyber Threat Response Activities
Figure 5.12: Valuation Report for Cyber Threat Detection
5.11) and is called Indicator Mass score. (2) The Hash Watchlist indicator (Figure 5.10)
has the efficacy score (IE(indicator)) as 1 (Table 5.6). According to the Equation 5.14,
the indicator’s ranking score is calculated through IRF (indicator, |observable|) function
as {(IM(indicator) + IE(indicator)} × |observables|, which is 196 in this scenario. (3) The
final valuation score (vScore) for 49 observables of the IBM’s STIX report for cyber threat
detection is computed as IRF(indicator)× |observables|, which is 196 here.
Table 5.9: STIX Valuation for Detection Phase
Component IM(indicator) IE(indicator) |observable| IRF(indicator, |observable|)Hash Watchlist 3 1 49 196
vScore = IRF (indicator, |observable|) 196
5.5.4.3 Valuation for Cyber Threat Response
In order to respond the cyber attack, the indicators, observables, and their COA’s are
used. As regards to TG-3390, the response report is shown in Figure 5.13. It illustrates
that to stop the aforesaid APT hash values should be blocked at firewalls and gateways.
Regarding the case study, the valuation score (vScore) for the response phase of cyber
threat management is shown in Table 5.10 and its details are as follows.
• The COA is produced from the indicator component (Figure 5.4), therefore it has
a producer strength score as 3 (Table 5.4).
87
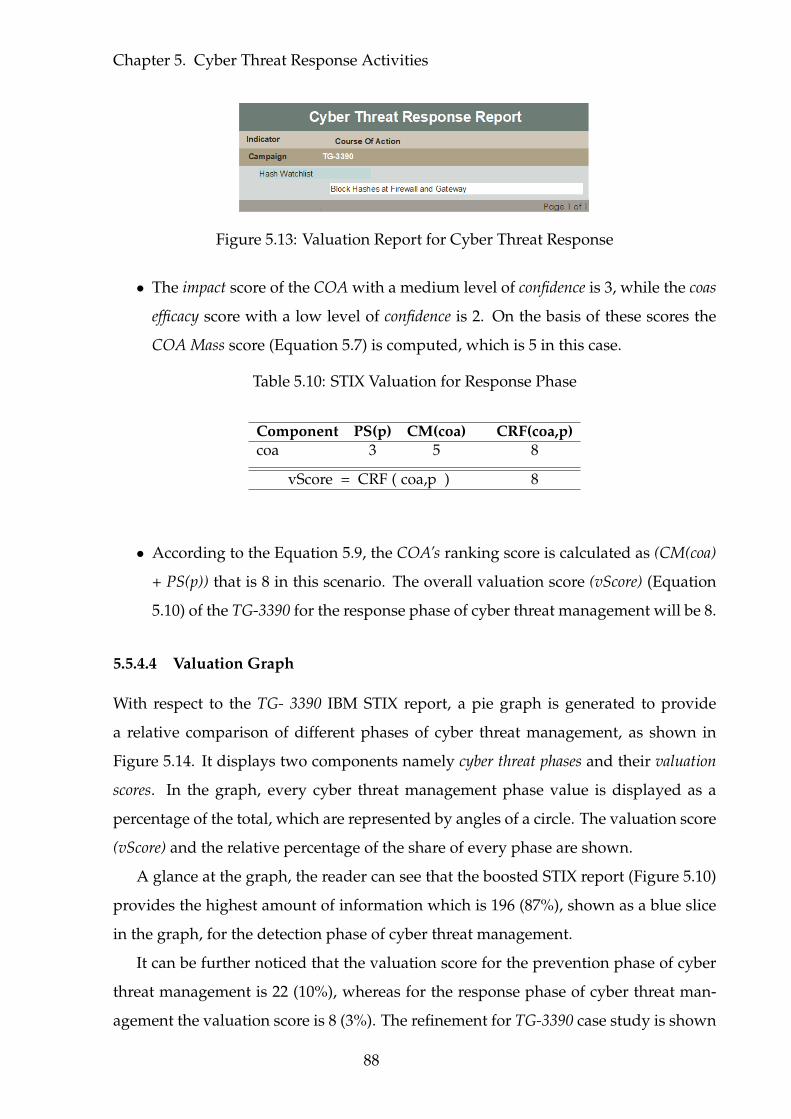
Chapter 5. Cyber Threat Response Activities
Figure 5.13: Valuation Report for Cyber Threat Response
• The impact score of the COA with a medium level of confidence is 3, while the coas
efficacy score with a low level of confidence is 2. On the basis of these scores the
COA Mass score (Equation 5.7) is computed, which is 5 in this case.
Table 5.10: STIX Valuation for Response Phase
Component PS(p) CM(coa) CRF(coa,p)coa 3 5 8
vScore = CRF ( coa,p ) 8
• According to the Equation 5.9, the COA’s ranking score is calculated as (CM(coa)
+ PS(p)) that is 8 in this scenario. The overall valuation score (vScore) (Equation
5.10) of the TG-3390 for the response phase of cyber threat management will be 8.
5.5.4.4 Valuation Graph
With respect to the TG- 3390 IBM STIX report, a pie graph is generated to provide
a relative comparison of different phases of cyber threat management, as shown in
Figure 5.14. It displays two components namely cyber threat phases and their valuation
scores. In the graph, every cyber threat management phase value is displayed as a
percentage of the total, which are represented by angles of a circle. The valuation score
(vScore) and the relative percentage of the share of every phase are shown.
A glance at the graph, the reader can see that the boosted STIX report (Figure 5.10)
provides the highest amount of information which is 196 (87%), shown as a blue slice
in the graph, for the detection phase of cyber threat management.
It can be further noticed that the valuation score for the prevention phase of cyber
threat management is 22 (10%), whereas for the response phase of cyber threat man-
agement the valuation score is 8 (3%). The refinement for TG-3390 case study is shown
88
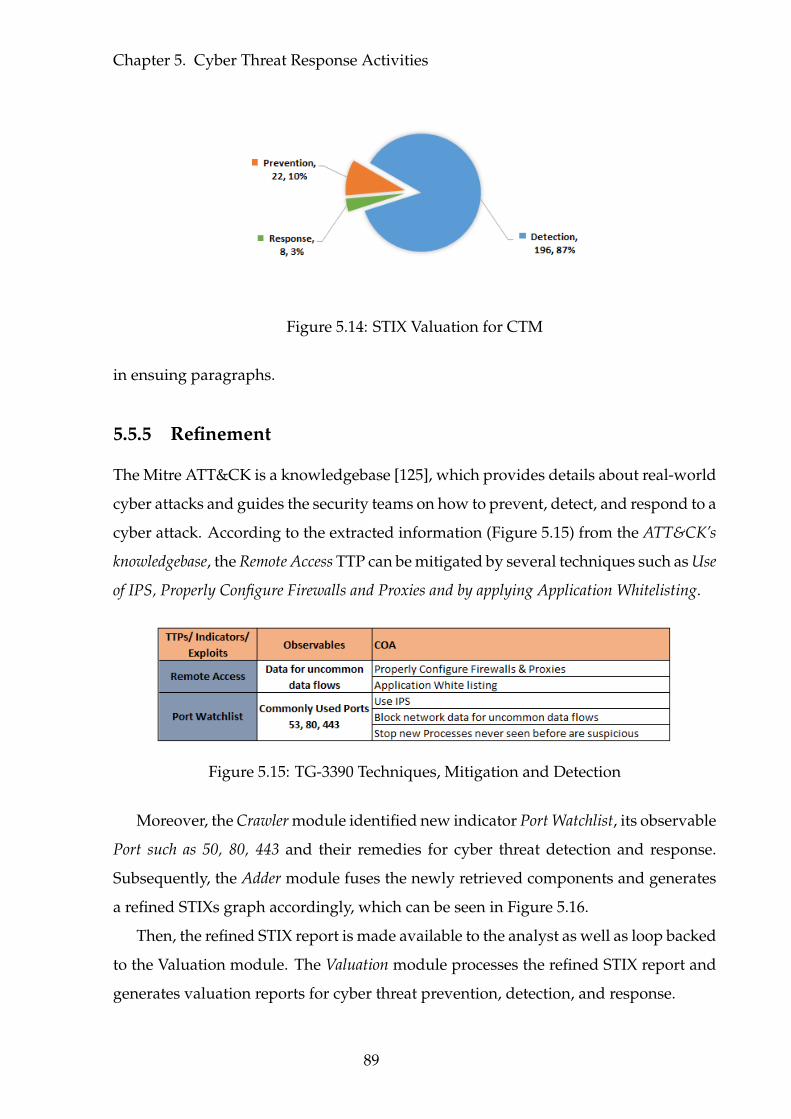
Chapter 5. Cyber Threat Response Activities
Figure 5.14: STIX Valuation for CTM
in ensuing paragraphs.
5.5.5 Refinement
The Mitre ATT&CK is a knowledgebase [125], which provides details about real-world
cyber attacks and guides the security teams on how to prevent, detect, and respond to a
cyber attack. According to the extracted information (Figure 5.15) from the ATT&CK’s
knowledgebase, the Remote Access TTP can be mitigated by several techniques such as Use
of IPS, Properly Configure Firewalls and Proxies and by applying Application Whitelisting.
Figure 5.15: TG-3390 Techniques, Mitigation and Detection
Moreover, the Crawler module identified new indicator Port Watchlist, its observable
Port such as 50, 80, 443 and their remedies for cyber threat detection and response.
Subsequently, the Adder module fuses the newly retrieved components and generates
a refined STIXs graph accordingly, which can be seen in Figure 5.16.
Then, the refined STIX report is made available to the analyst as well as loop backed
to the Valuation module. The Valuation module processes the refined STIX report and
generates valuation reports for cyber threat prevention, detection, and response.
89
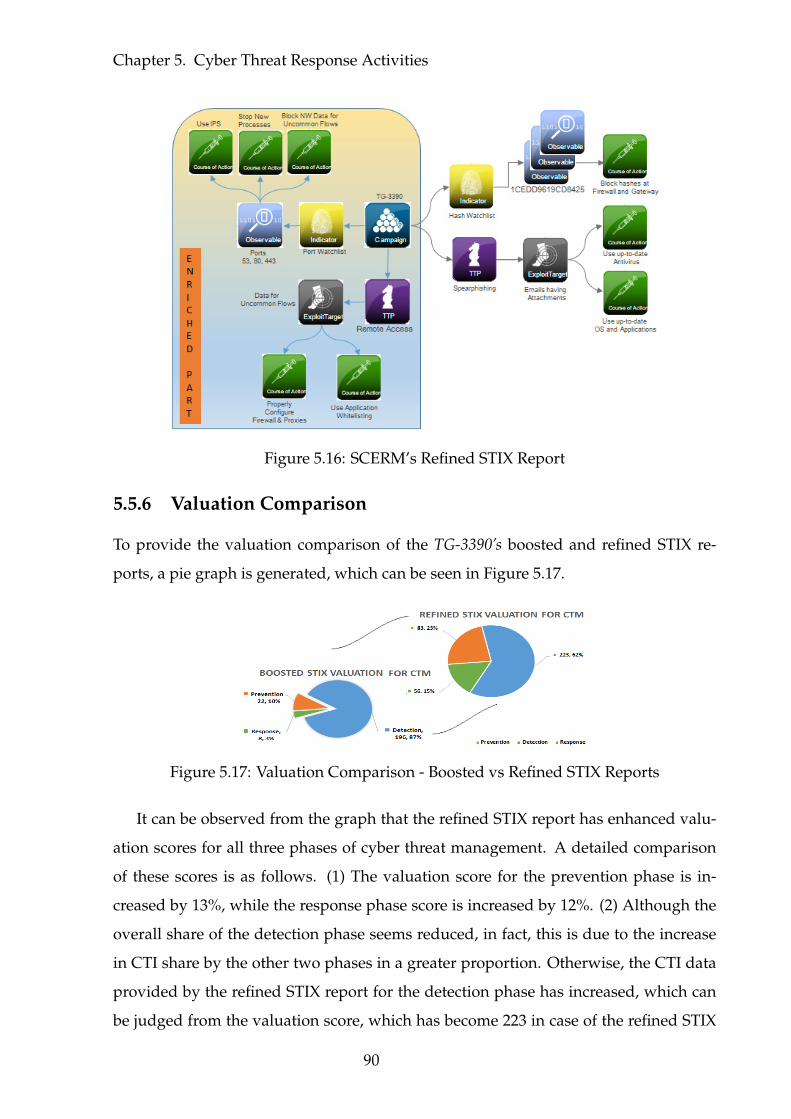
Chapter 5. Cyber Threat Response Activities
Figure 5.16: SCERM’s Refined STIX Report
5.5.6 Valuation Comparison
To provide the valuation comparison of the TG-3390’s boosted and refined STIX re-
ports, a pie graph is generated, which can be seen in Figure 5.17.
Figure 5.17: Valuation Comparison - Boosted vs Refined STIX Reports
It can be observed from the graph that the refined STIX report has enhanced valu-
ation scores for all three phases of cyber threat management. A detailed comparison
of these scores is as follows. (1) The valuation score for the prevention phase is in-
creased by 13%, while the response phase score is increased by 12%. (2) Although the
overall share of the detection phase seems reduced, in fact, this is due to the increase
in CTI share by the other two phases in a greater proportion. Otherwise, the CTI data
provided by the refined STIX report for the detection phase has increased, which can
be judged from the valuation score, which has become 223 in case of the refined STIX
90
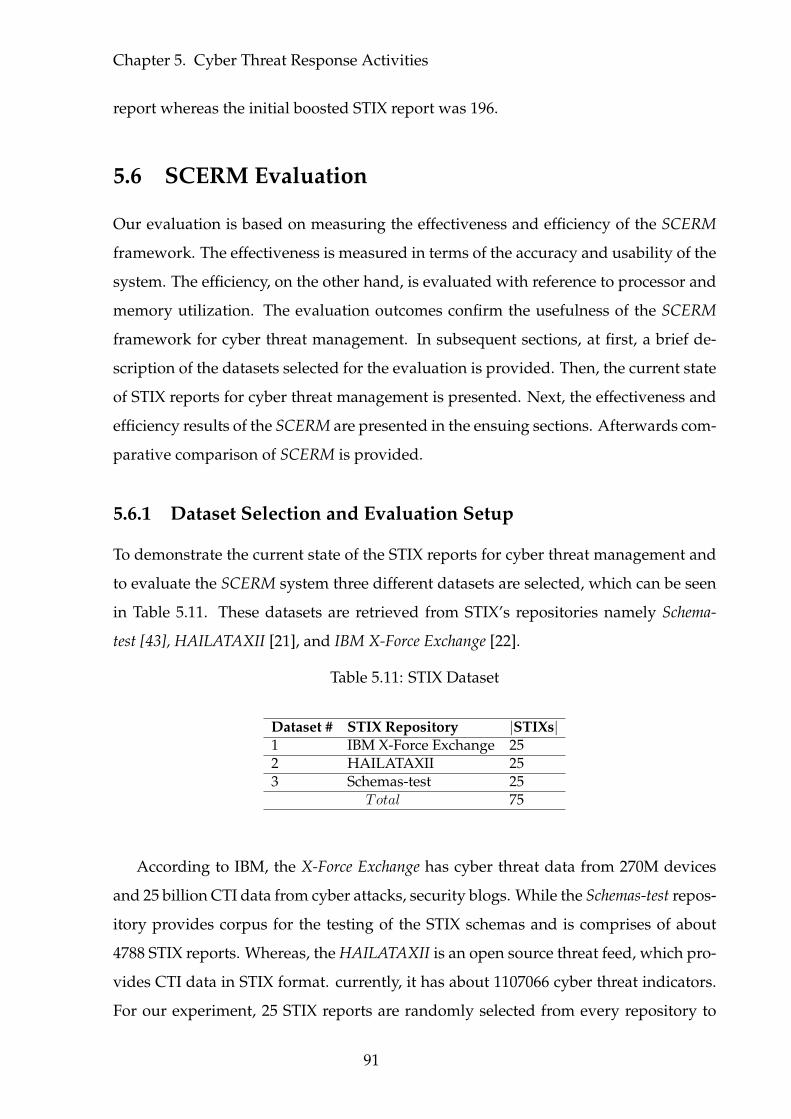
Chapter 5. Cyber Threat Response Activities
report whereas the initial boosted STIX report was 196.
5.6 SCERM Evaluation
Our evaluation is based on measuring the effectiveness and efficiency of the SCERM
framework. The effectiveness is measured in terms of the accuracy and usability of the
system. The efficiency, on the other hand, is evaluated with reference to processor and
memory utilization. The evaluation outcomes confirm the usefulness of the SCERM
framework for cyber threat management. In subsequent sections, at first, a brief de-
scription of the datasets selected for the evaluation is provided. Then, the current state
of STIX reports for cyber threat management is presented. Next, the effectiveness and
efficiency results of the SCERM are presented in the ensuing sections. Afterwards com-
parative comparison of SCERM is provided.
5.6.1 Dataset Selection and Evaluation Setup
To demonstrate the current state of the STIX reports for cyber threat management and
to evaluate the SCERM system three different datasets are selected, which can be seen
in Table 5.11. These datasets are retrieved from STIX’s repositories namely Schema-
test [43], HAILATAXII [21], and IBM X-Force Exchange [22].
Table 5.11: STIX Dataset
Dataset # STIX Repository |STIXs|1 IBM X-Force Exchange 252 HAILATAXII 253 Schemas-test 25
Total 75
According to IBM, the X-Force Exchange has cyber threat data from 270M devices
and 25 billion CTI data from cyber attacks, security blogs. While the Schemas-test repos-
itory provides corpus for the testing of the STIX schemas and is comprises of about
4788 STIX reports. Whereas, the HAILATAXII is an open source threat feed, which pro-
vides CTI data in STIX format. currently, it has about 1107066 cyber threat indicators.
For our experiment, 25 STIX reports are randomly selected from every repository to
91
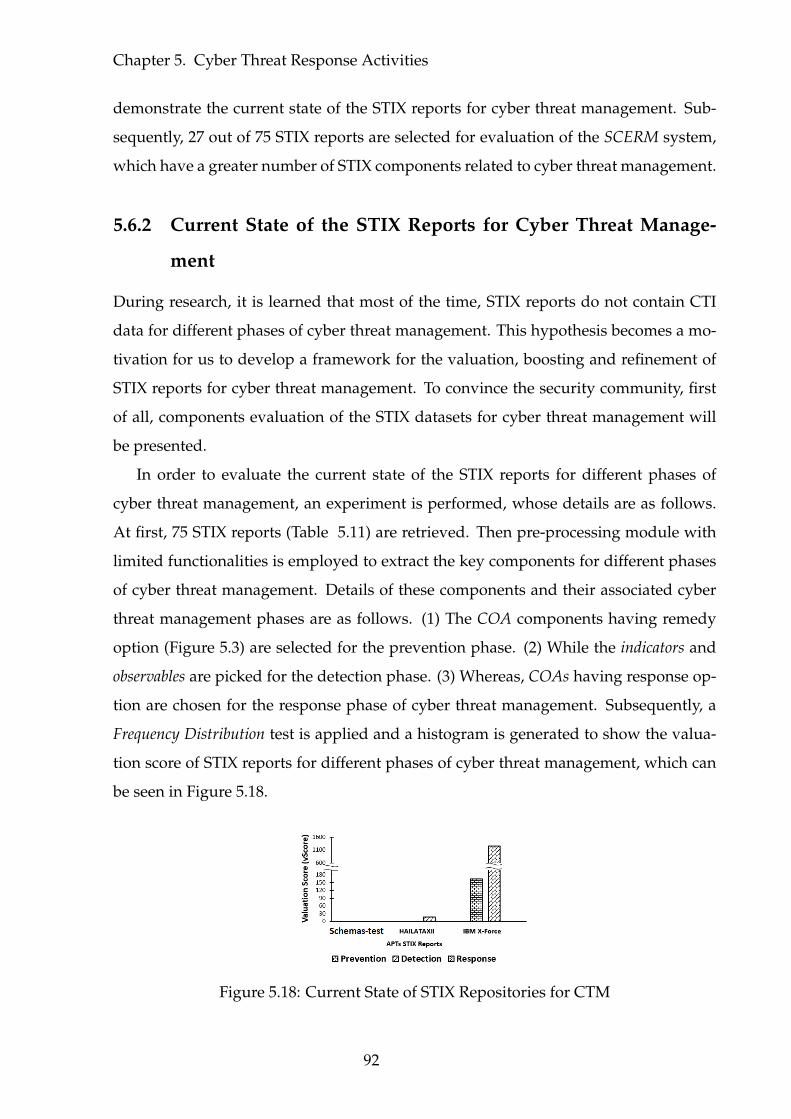
Chapter 5. Cyber Threat Response Activities
demonstrate the current state of the STIX reports for cyber threat management. Sub-
sequently, 27 out of 75 STIX reports are selected for evaluation of the SCERM system,
which have a greater number of STIX components related to cyber threat management.
5.6.2 Current State of the STIX Reports for Cyber Threat Manage-
ment
During research, it is learned that most of the time, STIX reports do not contain CTI
data for different phases of cyber threat management. This hypothesis becomes a mo-
tivation for us to develop a framework for the valuation, boosting and refinement of
STIX reports for cyber threat management. To convince the security community, first
of all, components evaluation of the STIX datasets for cyber threat management will
be presented.
In order to evaluate the current state of the STIX reports for different phases of
cyber threat management, an experiment is performed, whose details are as follows.
At first, 75 STIX reports (Table 5.11) are retrieved. Then pre-processing module with
limited functionalities is employed to extract the key components for different phases
of cyber threat management. Details of these components and their associated cyber
threat management phases are as follows. (1) The COA components having remedy
option (Figure 5.3) are selected for the prevention phase. (2) While the indicators and
observables are picked for the detection phase. (3) Whereas, COAs having response op-
tion are chosen for the response phase of cyber threat management. Subsequently, a
Frequency Distribution test is applied and a histogram is generated to show the valua-
tion score of STIX reports for different phases of cyber threat management, which can
be seen in Figure 5.18.
Figure 5.18: Current State of STIX Repositories for CTM
92
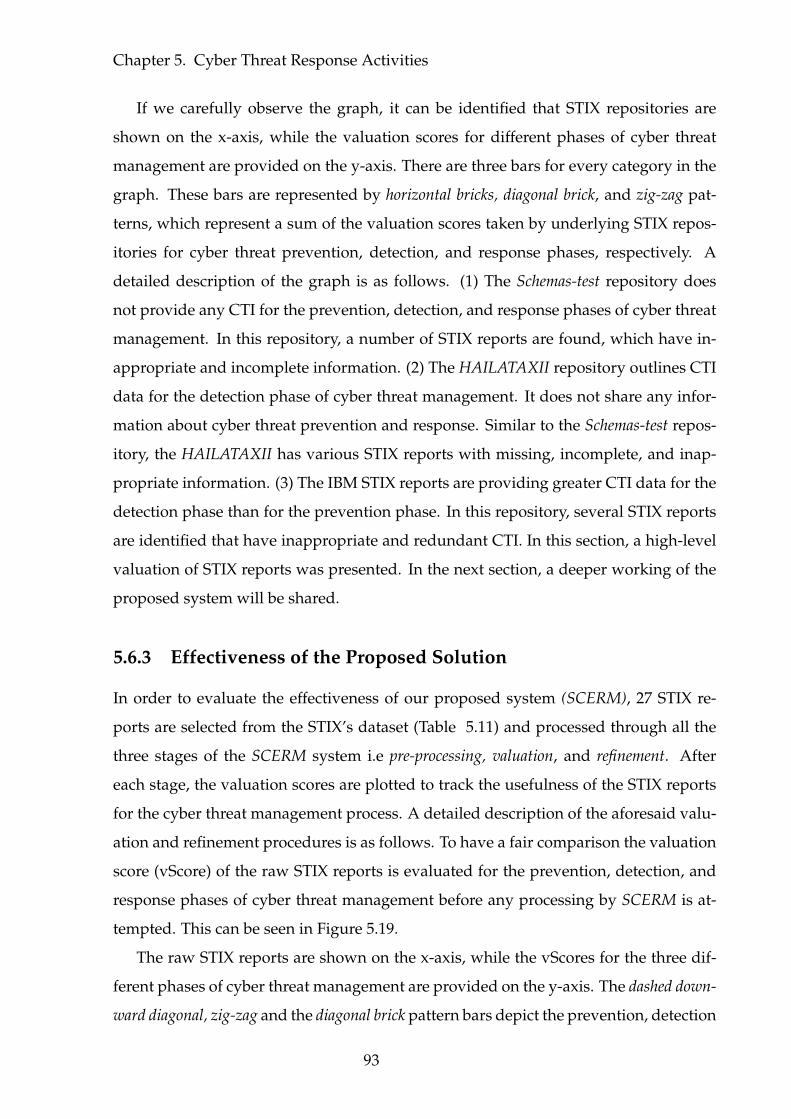
Chapter 5. Cyber Threat Response Activities
If we carefully observe the graph, it can be identified that STIX repositories are
shown on the x-axis, while the valuation scores for different phases of cyber threat
management are provided on the y-axis. There are three bars for every category in the
graph. These bars are represented by horizontal bricks, diagonal brick, and zig-zag pat-
terns, which represent a sum of the valuation scores taken by underlying STIX repos-
itories for cyber threat prevention, detection, and response phases, respectively. A
detailed description of the graph is as follows. (1) The Schemas-test repository does
not provide any CTI for the prevention, detection, and response phases of cyber threat
management. In this repository, a number of STIX reports are found, which have in-
appropriate and incomplete information. (2) The HAILATAXII repository outlines CTI
data for the detection phase of cyber threat management. It does not share any infor-
mation about cyber threat prevention and response. Similar to the Schemas-test repos-
itory, the HAILATAXII has various STIX reports with missing, incomplete, and inap-
propriate information. (3) The IBM STIX reports are providing greater CTI data for the
detection phase than for the prevention phase. In this repository, several STIX reports
are identified that have inappropriate and redundant CTI. In this section, a high-level
valuation of STIX reports was presented. In the next section, a deeper working of the
proposed system will be shared.
5.6.3 Effectiveness of the Proposed Solution
In order to evaluate the effectiveness of our proposed system (SCERM), 27 STIX re-
ports are selected from the STIX’s dataset (Table 5.11) and processed through all the
three stages of the SCERM system i.e pre-processing, valuation, and refinement. After
each stage, the valuation scores are plotted to track the usefulness of the STIX reports
for the cyber threat management process. A detailed description of the aforesaid valu-
ation and refinement procedures is as follows. To have a fair comparison the valuation
score (vScore) of the raw STIX reports is evaluated for the prevention, detection, and
response phases of cyber threat management before any processing by SCERM is at-
tempted. This can be seen in Figure 5.19.
The raw STIX reports are shown on the x-axis, while the vScores for the three dif-
ferent phases of cyber threat management are provided on the y-axis. The dashed down-
ward diagonal, zig-zag and the diagonal brick pattern bars depict the prevention, detection
93
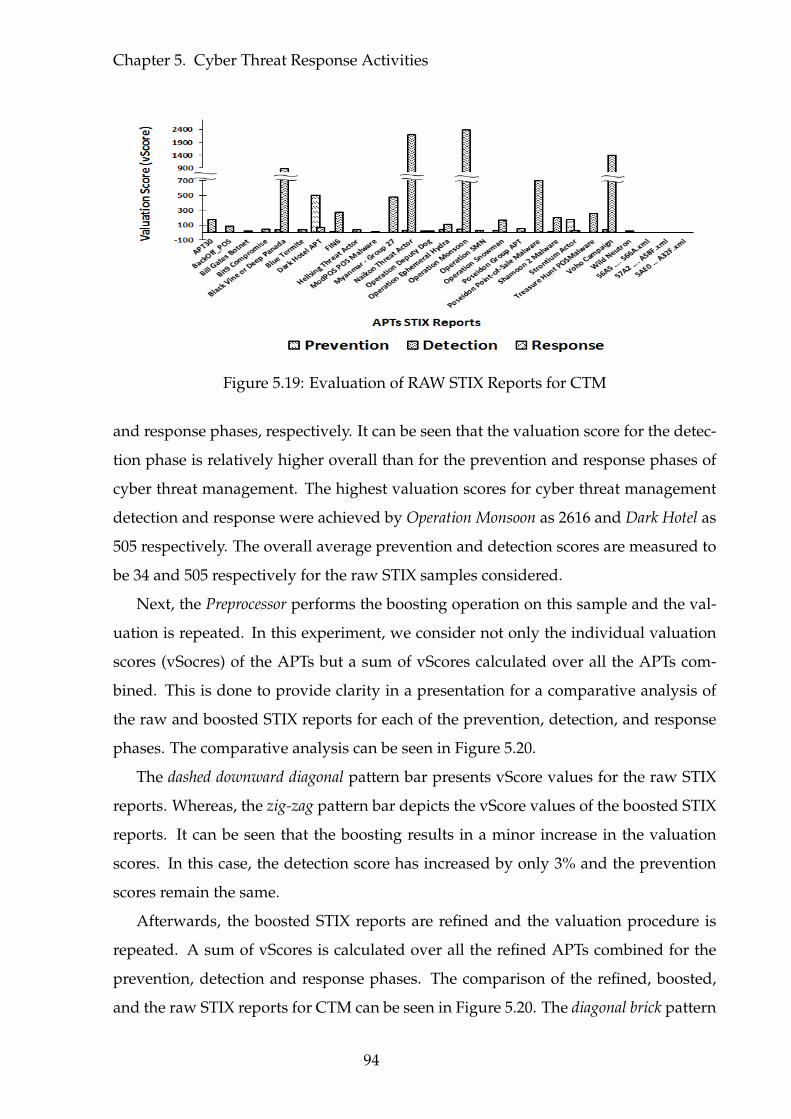
Chapter 5. Cyber Threat Response Activities
Figure 5.19: Evaluation of RAW STIX Reports for CTM
and response phases, respectively. It can be seen that the valuation score for the detec-
tion phase is relatively higher overall than for the prevention and response phases of
cyber threat management. The highest valuation scores for cyber threat management
detection and response were achieved by Operation Monsoon as 2616 and Dark Hotel as
505 respectively. The overall average prevention and detection scores are measured to
be 34 and 505 respectively for the raw STIX samples considered.
Next, the Preprocessor performs the boosting operation on this sample and the val-
uation is repeated. In this experiment, we consider not only the individual valuation
scores (vSocres) of the APTs but a sum of vScores calculated over all the APTs com-
bined. This is done to provide clarity in a presentation for a comparative analysis of
the raw and boosted STIX reports for each of the prevention, detection, and response
phases. The comparative analysis can be seen in Figure 5.20.
The dashed downward diagonal pattern bar presents vScore values for the raw STIX
reports. Whereas, the zig-zag pattern bar depicts the vScore values of the boosted STIX
reports. It can be seen that the boosting results in a minor increase in the valuation
scores. In this case, the detection score has increased by only 3% and the prevention
scores remain the same.
Afterwards, the boosted STIX reports are refined and the valuation procedure is
repeated. A sum of vScores is calculated over all the refined APTs combined for the
prevention, detection and response phases. The comparison of the refined, boosted,
and the raw STIX reports for CTM can be seen in Figure 5.20. The diagonal brick pattern
94
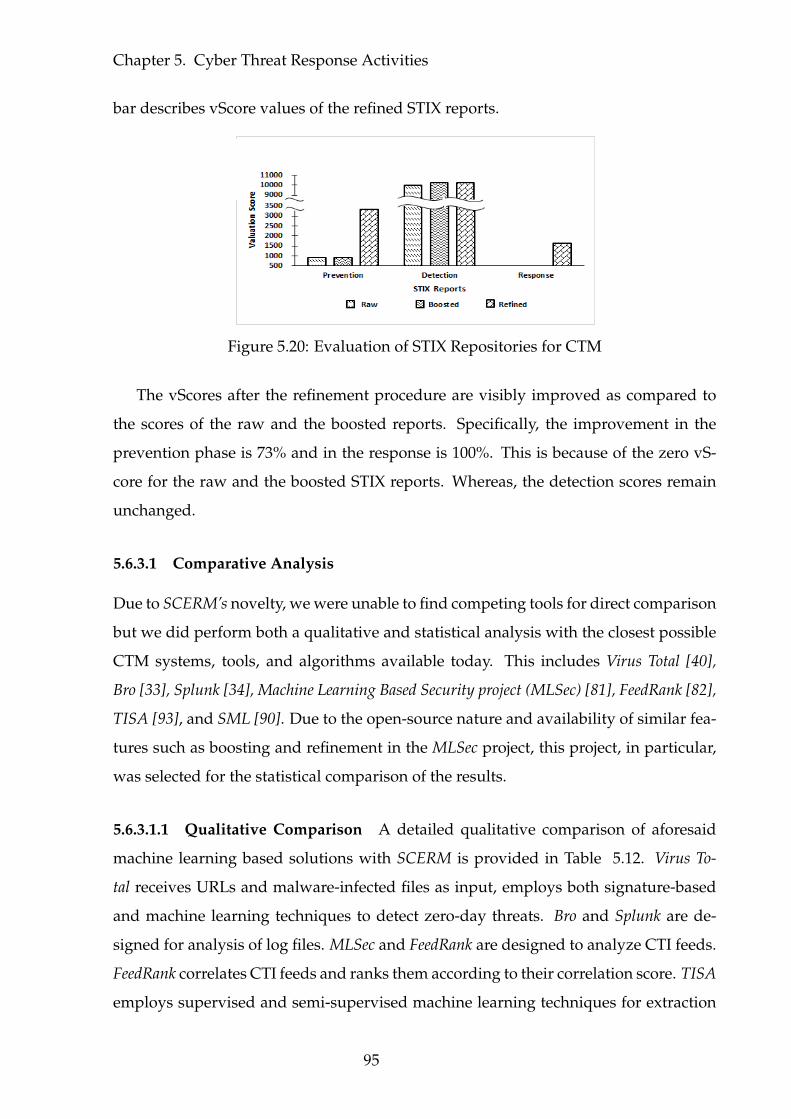
Chapter 5. Cyber Threat Response Activities
bar describes vScore values of the refined STIX reports.
Figure 5.20: Evaluation of STIX Repositories for CTM
The vScores after the refinement procedure are visibly improved as compared to
the scores of the raw and the boosted reports. Specifically, the improvement in the
prevention phase is 73% and in the response is 100%. This is because of the zero vS-
core for the raw and the boosted STIX reports. Whereas, the detection scores remain
unchanged.
5.6.3.1 Comparative Analysis
Due to SCERM’s novelty, we were unable to find competing tools for direct comparison
but we did perform both a qualitative and statistical analysis with the closest possible
CTM systems, tools, and algorithms available today. This includes Virus Total [40],
Bro [33], Splunk [34], Machine Learning Based Security project (MLSec) [81], FeedRank [82],
TISA [93], and SML [90]. Due to the open-source nature and availability of similar fea-
tures such as boosting and refinement in the MLSec project, this project, in particular,
was selected for the statistical comparison of the results.
5.6.3.1.1 Qualitative Comparison A detailed qualitative comparison of aforesaid
machine learning based solutions with SCERM is provided in Table 5.12. Virus To-
tal receives URLs and malware-infected files as input, employs both signature-based
and machine learning techniques to detect zero-day threats. Bro and Splunk are de-
signed for analysis of log files. MLSec and FeedRank are designed to analyze CTI feeds.
FeedRank correlates CTI feeds and ranks them according to their correlation score. TISA
employs supervised and semi-supervised machine learning techniques for extraction
95
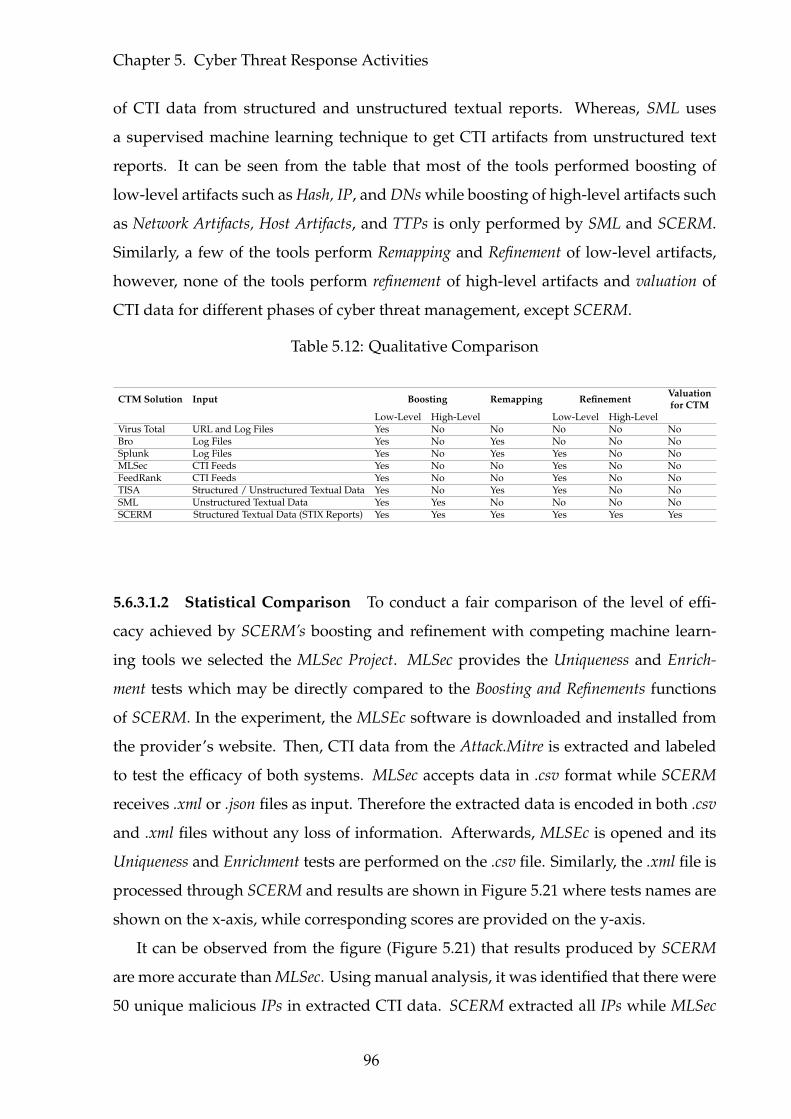
Chapter 5. Cyber Threat Response Activities
of CTI data from structured and unstructured textual reports. Whereas, SML uses
a supervised machine learning technique to get CTI artifacts from unstructured text
reports. It can be seen from the table that most of the tools performed boosting of
low-level artifacts such as Hash, IP, and DNs while boosting of high-level artifacts such
as Network Artifacts, Host Artifacts, and TTPs is only performed by SML and SCERM.
Similarly, a few of the tools perform Remapping and Refinement of low-level artifacts,
however, none of the tools perform refinement of high-level artifacts and valuation of
CTI data for different phases of cyber threat management, except SCERM.
Table 5.12: Qualitative Comparison
CTM Solution Input Boosting Remapping Refinement Valuationfor CTM
Low-Level High-Level Low-Level High-LevelVirus Total URL and Log Files Yes No No No No NoBro Log Files Yes No Yes No No NoSplunk Log Files Yes No Yes Yes No NoMLSec CTI Feeds Yes No No Yes No NoFeedRank CTI Feeds Yes No No Yes No NoTISA Structured / Unstructured Textual Data Yes No Yes Yes No NoSML Unstructured Textual Data Yes Yes No No No NoSCERM Structured Textual Data (STIX Reports) Yes Yes Yes Yes Yes Yes
5.6.3.1.2 Statistical Comparison To conduct a fair comparison of the level of effi-
cacy achieved by SCERM’s boosting and refinement with competing machine learn-
ing tools we selected the MLSec Project. MLSec provides the Uniqueness and Enrich-
ment tests which may be directly compared to the Boosting and Refinements functions
of SCERM. In the experiment, the MLSEc software is downloaded and installed from
the provider’s website. Then, CTI data from the Attack.Mitre is extracted and labeled
to test the efficacy of both systems. MLSec accepts data in .csv format while SCERM
receives .xml or .json files as input. Therefore the extracted data is encoded in both .csv
and .xml files without any loss of information. Afterwards, MLSEc is opened and its
Uniqueness and Enrichment tests are performed on the .csv file. Similarly, the .xml file is
processed through SCERM and results are shown in Figure 5.21 where tests names are
shown on the x-axis, while corresponding scores are provided on the y-axis.
It can be observed from the figure (Figure 5.21) that results produced by SCERM
are more accurate than MLSec. Using manual analysis, it was identified that there were
50 unique malicious IPs in extracted CTI data. SCERM extracted all IPs while MLSec
96
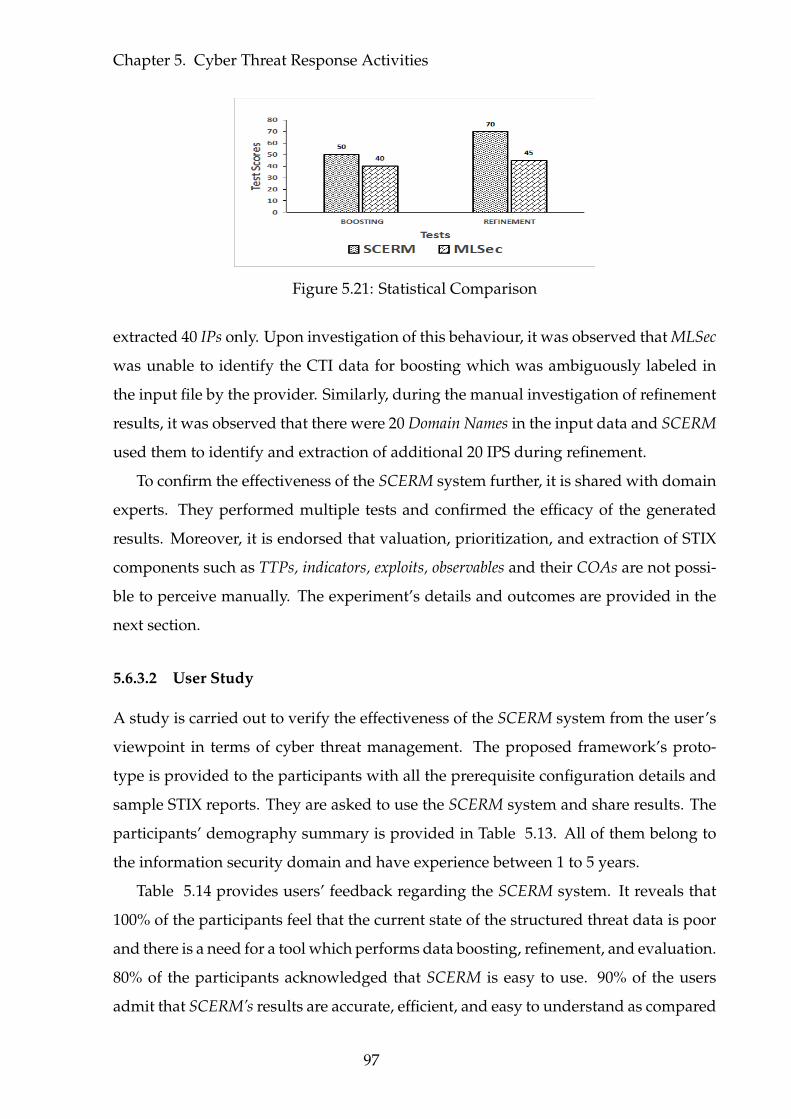
Chapter 5. Cyber Threat Response Activities
Figure 5.21: Statistical Comparison
extracted 40 IPs only. Upon investigation of this behaviour, it was observed that MLSec
was unable to identify the CTI data for boosting which was ambiguously labeled in
the input file by the provider. Similarly, during the manual investigation of refinement
results, it was observed that there were 20 Domain Names in the input data and SCERM
used them to identify and extraction of additional 20 IPS during refinement.
To confirm the effectiveness of the SCERM system further, it is shared with domain
experts. They performed multiple tests and confirmed the efficacy of the generated
results. Moreover, it is endorsed that valuation, prioritization, and extraction of STIX
components such as TTPs, indicators, exploits, observables and their COAs are not possi-
ble to perceive manually. The experiment’s details and outcomes are provided in the
next section.
5.6.3.2 User Study
A study is carried out to verify the effectiveness of the SCERM system from the user’s
viewpoint in terms of cyber threat management. The proposed framework’s proto-
type is provided to the participants with all the prerequisite configuration details and
sample STIX reports. They are asked to use the SCERM system and share results. The
participants’ demography summary is provided in Table 5.13. All of them belong to
the information security domain and have experience between 1 to 5 years.
Table 5.14 provides users’ feedback regarding the SCERM system. It reveals that
100% of the participants feel that the current state of the structured threat data is poor
and there is a need for a tool which performs data boosting, refinement, and evaluation.
80% of the participants acknowledged that SCERM is easy to use. 90% of the users
admit that SCERM’s results are accurate, efficient, and easy to understand as compared
97
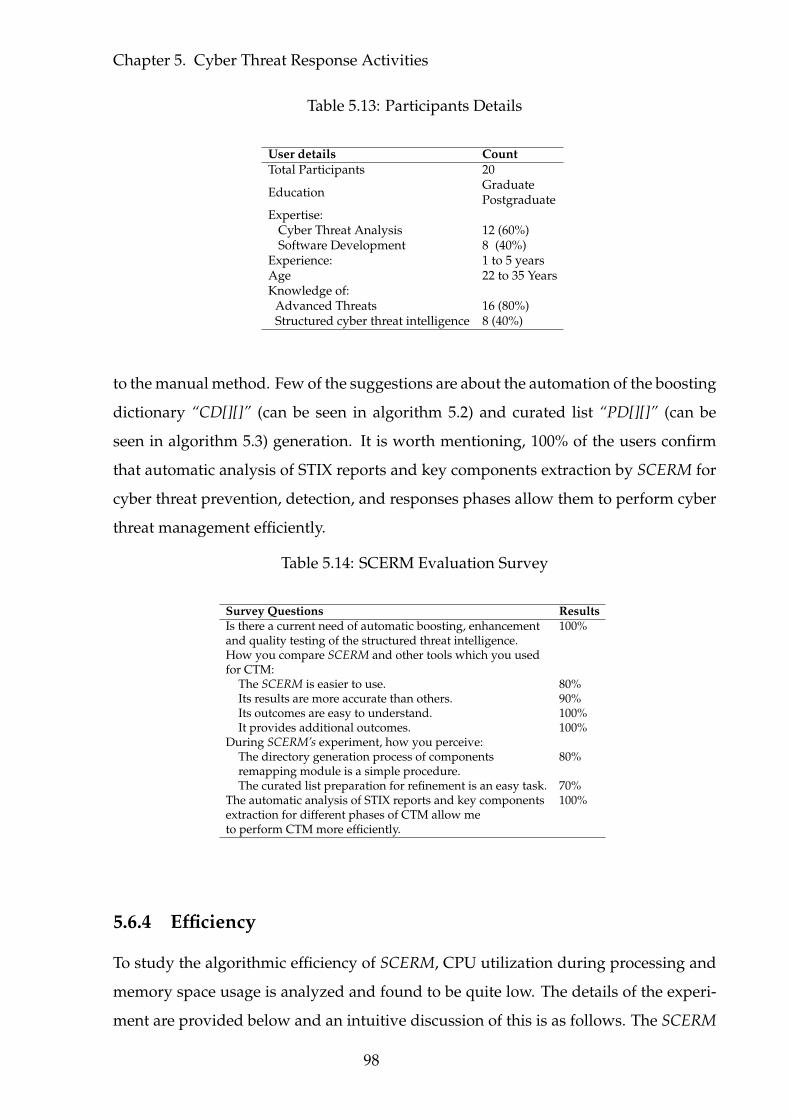
Chapter 5. Cyber Threat Response Activities
Table 5.13: Participants Details
User details CountTotal Participants 20
Education GraduatePostgraduate
Expertise:Cyber Threat Analysis 12 (60%)Software Development 8 (40%)
Experience: 1 to 5 yearsAge 22 to 35 YearsKnowledge of:
Advanced Threats 16 (80%)Structured cyber threat intelligence 8 (40%)
to the manual method. Few of the suggestions are about the automation of the boosting
dictionary “CD[][]” (can be seen in algorithm 5.2) and curated list “PD[][]” (can be
seen in algorithm 5.3) generation. It is worth mentioning, 100% of the users confirm
that automatic analysis of STIX reports and key components extraction by SCERM for
cyber threat prevention, detection, and responses phases allow them to perform cyber
threat management efficiently.
Table 5.14: SCERM Evaluation Survey
Survey Questions ResultsIs there a current need of automatic boosting, enhancement 100%and quality testing of the structured threat intelligence.How you compare SCERM and other tools which you usedfor CTM:
The SCERM is easier to use. 80%Its results are more accurate than others. 90%Its outcomes are easy to understand. 100%It provides additional outcomes. 100%
During SCERM’s experiment, how you perceive:The directory generation process of components 80%remapping module is a simple procedure.The curated list preparation for refinement is an easy task. 70%
The automatic analysis of STIX reports and key components 100%extraction for different phases of CTM allow meto perform CTM more efficiently.
5.6.4 Efficiency
To study the algorithmic efficiency of SCERM, CPU utilization during processing and
memory space usage is analyzed and found to be quite low. The details of the experi-
ment are provided below and an intuitive discussion of this is as follows. The SCERM
98
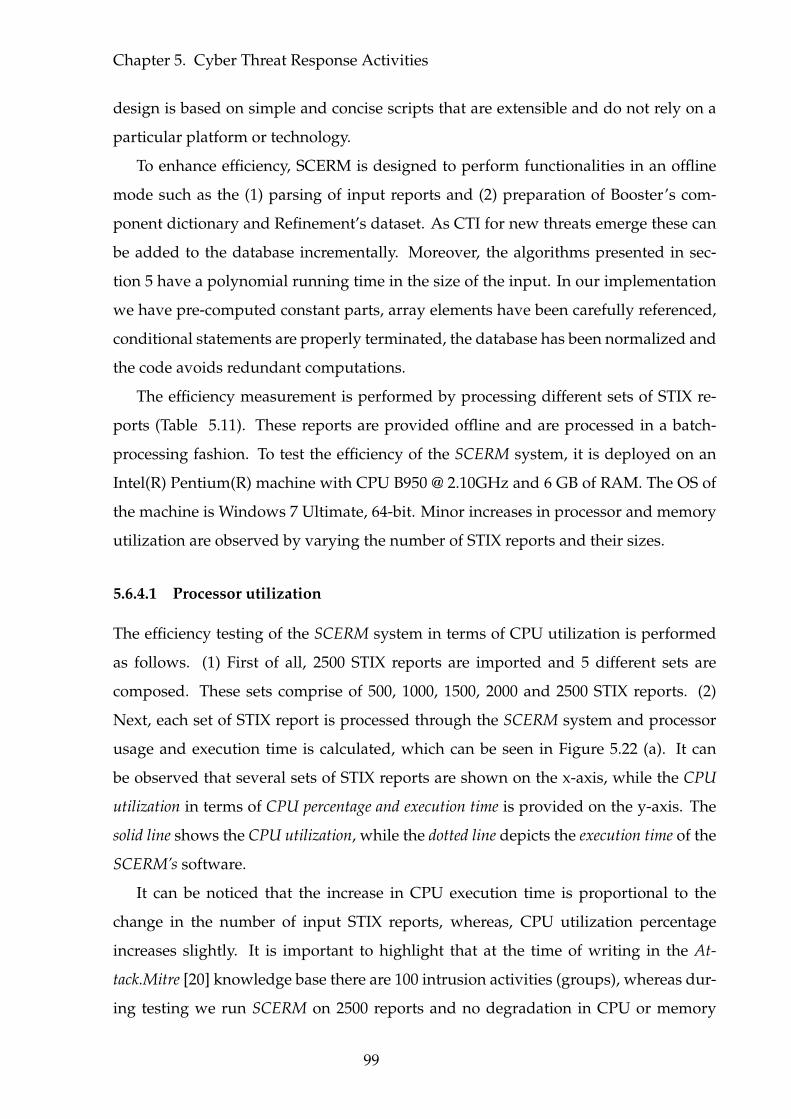
Chapter 5. Cyber Threat Response Activities
design is based on simple and concise scripts that are extensible and do not rely on a
particular platform or technology.
To enhance efficiency, SCERM is designed to perform functionalities in an offline
mode such as the (1) parsing of input reports and (2) preparation of Booster’s com-
ponent dictionary and Refinement’s dataset. As CTI for new threats emerge these can
be added to the database incrementally. Moreover, the algorithms presented in sec-
tion 5 have a polynomial running time in the size of the input. In our implementation
we have pre-computed constant parts, array elements have been carefully referenced,
conditional statements are properly terminated, the database has been normalized and
the code avoids redundant computations.
The efficiency measurement is performed by processing different sets of STIX re-
ports (Table 5.11). These reports are provided offline and are processed in a batch-
processing fashion. To test the efficiency of the SCERM system, it is deployed on an
Intel(R) Pentium(R) machine with CPU B950 @ 2.10GHz and 6 GB of RAM. The OS of
the machine is Windows 7 Ultimate, 64-bit. Minor increases in processor and memory
utilization are observed by varying the number of STIX reports and their sizes.
5.6.4.1 Processor utilization
The efficiency testing of the SCERM system in terms of CPU utilization is performed
as follows. (1) First of all, 2500 STIX reports are imported and 5 different sets are
composed. These sets comprise of 500, 1000, 1500, 2000 and 2500 STIX reports. (2)
Next, each set of STIX report is processed through the SCERM system and processor
usage and execution time is calculated, which can be seen in Figure 5.22 (a). It can
be observed that several sets of STIX reports are shown on the x-axis, while the CPU
utilization in terms of CPU percentage and execution time is provided on the y-axis. The
solid line shows the CPU utilization, while the dotted line depicts the execution time of the
SCERM’s software.
It can be noticed that the increase in CPU execution time is proportional to the
change in the number of input STIX reports, whereas, CPU utilization percentage
increases slightly. It is important to highlight that at the time of writing in the At-
tack.Mitre [20] knowledge base there are 100 intrusion activities (groups), whereas dur-
ing testing we run SCERM on 2500 reports and no degradation in CPU or memory
99
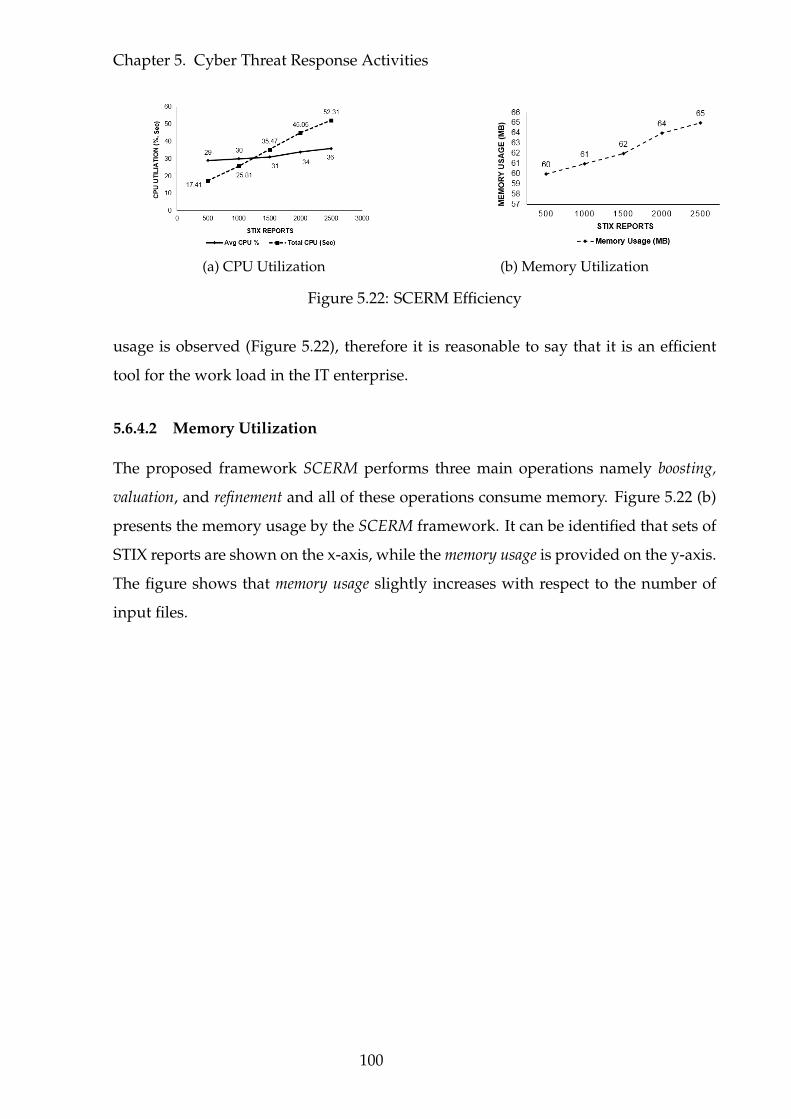
Chapter 5. Cyber Threat Response Activities
(a) CPU Utilization (b) Memory Utilization
Figure 5.22: SCERM Efficiency
usage is observed (Figure 5.22), therefore it is reasonable to say that it is an efficient
tool for the work load in the IT enterprise.
5.6.4.2 Memory Utilization
The proposed framework SCERM performs three main operations namely boosting,
valuation, and refinement and all of these operations consume memory. Figure 5.22 (b)
presents the memory usage by the SCERM framework. It can be identified that sets of
STIX reports are shown on the x-axis, while the memory usage is provided on the y-axis.
The figure shows that memory usage slightly increases with respect to the number of
input files.
100
Chapter 6
APTs Analysis and Classification
System
6.1 Introduction
This chapter presents the procedure and techniques adopted by the APTs Analysis
and Classification System A2CS for automatic analysis of APTs, identification of their
missing artifacts, and inferencing of the Tactics, Techniques and Procedures being em-
ployed. In the A2CS sub-framework, a combined ontology of CKC and POP models
is developed. SWRL rules are written for APTs analysis and identification of their
missing artifacts. Furthermore, a case study of the Point of Sales (POS) system is also
presented to demonstrate the working of the A2CS.
6.2 Research Approach and Contributions
In the recent past, several models have been proposed related to cyber attack analysis
of which two particulars models are of interest and are more popular. These models
are the CKC [25] and the POP [26]. The CKC guides an analyst regarding how a perpe-
trator uses different phases such as Reconnaissance, Weaponization, Delivery, Exploitation,
Installation, and Exfiltration to launch a cyber attack. It further guides the security an-
alyst regarding how various signatures and artifacts available at different attack levels
can be used to defend their network from advanced cyber attacks. Whereas, the POP
model describes the efficacy of indicators namely Hash values, IP addresses, DNs, Net-
101
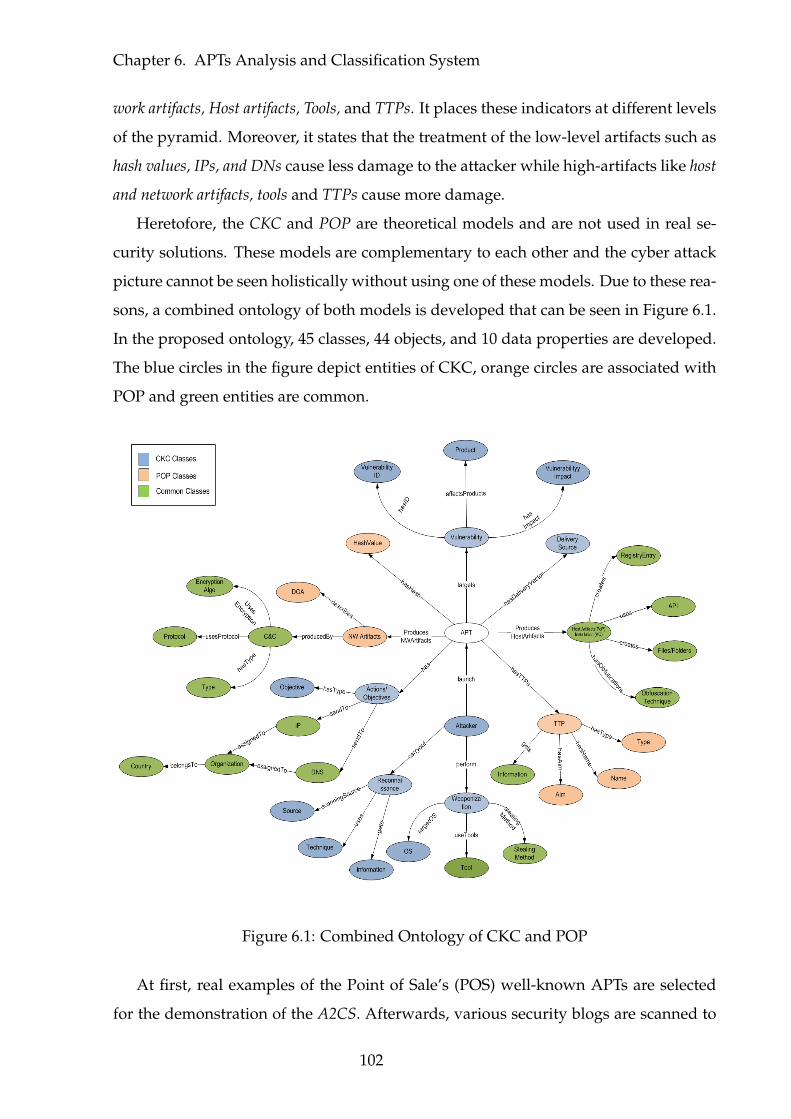
Chapter 6. APTs Analysis and Classification System
work artifacts, Host artifacts, Tools, and TTPs. It places these indicators at different levels
of the pyramid. Moreover, it states that the treatment of the low-level artifacts such as
hash values, IPs, and DNs cause less damage to the attacker while high-artifacts like host
and network artifacts, tools and TTPs cause more damage.
Heretofore, the CKC and POP are theoretical models and are not used in real se-
curity solutions. These models are complementary to each other and the cyber attack
picture cannot be seen holistically without using one of these models. Due to these rea-
sons, a combined ontology of both models is developed that can be seen in Figure 6.1.
In the proposed ontology, 45 classes, 44 objects, and 10 data properties are developed.
The blue circles in the figure depict entities of CKC, orange circles are associated with
POP and green entities are common.
Figure 6.1: Combined Ontology of CKC and POP
At first, real examples of the Point of Sale’s (POS) well-known APTs are selected
for the demonstration of the A2CS. Afterwards, various security blogs are scanned to
102
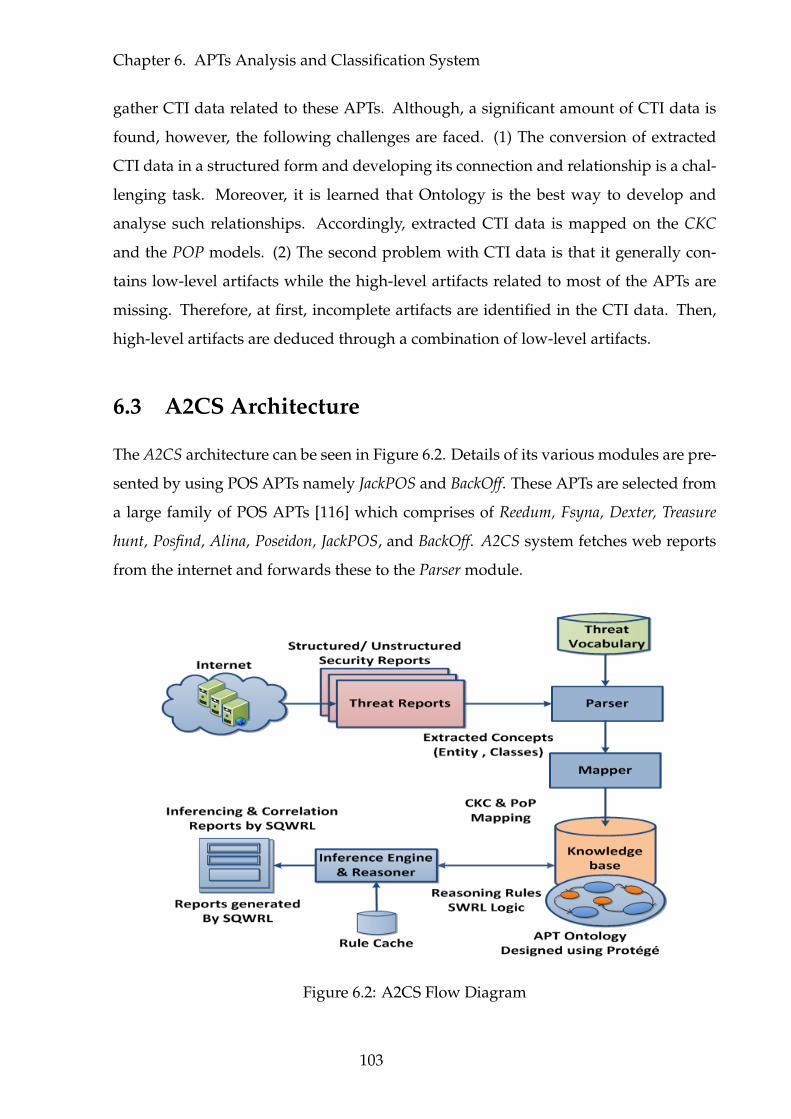
Chapter 6. APTs Analysis and Classification System
gather CTI data related to these APTs. Although, a significant amount of CTI data is
found, however, the following challenges are faced. (1) The conversion of extracted
CTI data in a structured form and developing its connection and relationship is a chal-
lenging task. Moreover, it is learned that Ontology is the best way to develop and
analyse such relationships. Accordingly, extracted CTI data is mapped on the CKC
and the POP models. (2) The second problem with CTI data is that it generally con-
tains low-level artifacts while the high-level artifacts related to most of the APTs are
missing. Therefore, at first, incomplete artifacts are identified in the CTI data. Then,
high-level artifacts are deduced through a combination of low-level artifacts.
6.3 A2CS Architecture
The A2CS architecture can be seen in Figure 6.2. Details of its various modules are pre-
sented by using POS APTs namely JackPOS and BackOff. These APTs are selected from
a large family of POS APTs [116] which comprises of Reedum, Fsyna, Dexter, Treasure
hunt, Posfind, Alina, Poseidon, JackPOS, and BackOff. A2CS system fetches web reports
from the internet and forwards these to the Parser module.
Figure 6.2: A2CS Flow Diagram
103
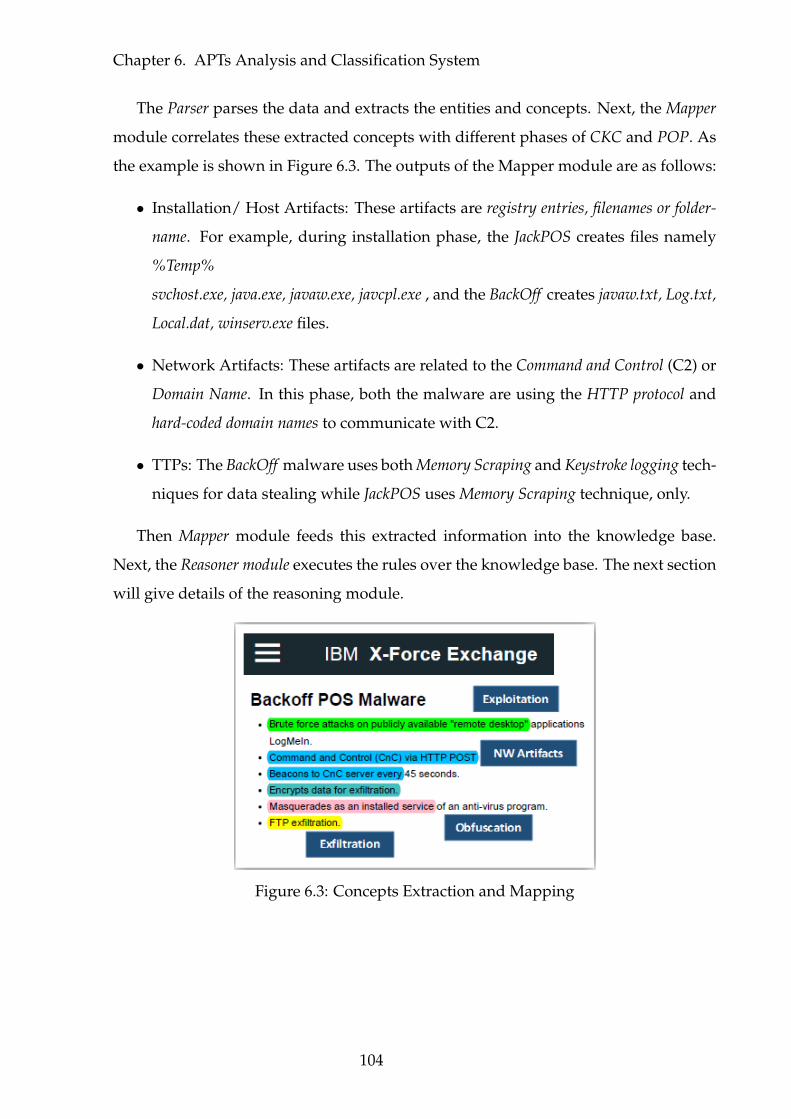
Chapter 6. APTs Analysis and Classification System
The Parser parses the data and extracts the entities and concepts. Next, the Mapper
module correlates these extracted concepts with different phases of CKC and POP. As
the example is shown in Figure 6.3. The outputs of the Mapper module are as follows:
• Installation/ Host Artifacts: These artifacts are registry entries, filenames or folder-
name. For example, during installation phase, the JackPOS creates files namely
%Temp%
svchost.exe, java.exe, javaw.exe, javcpl.exe , and the BackOff creates javaw.txt, Log.txt,
Local.dat, winserv.exe files.
• Network Artifacts: These artifacts are related to the Command and Control (C2) or
Domain Name. In this phase, both the malware are using the HTTP protocol and
hard-coded domain names to communicate with C2.
• TTPs: The BackOff malware uses both Memory Scraping and Keystroke logging tech-
niques for data stealing while JackPOS uses Memory Scraping technique, only.
Then Mapper module feeds this extracted information into the knowledge base.
Next, the Reasoner module executes the rules over the knowledge base. The next section
will give details of the reasoning module.
Figure 6.3: Concepts Extraction and Mapping
104
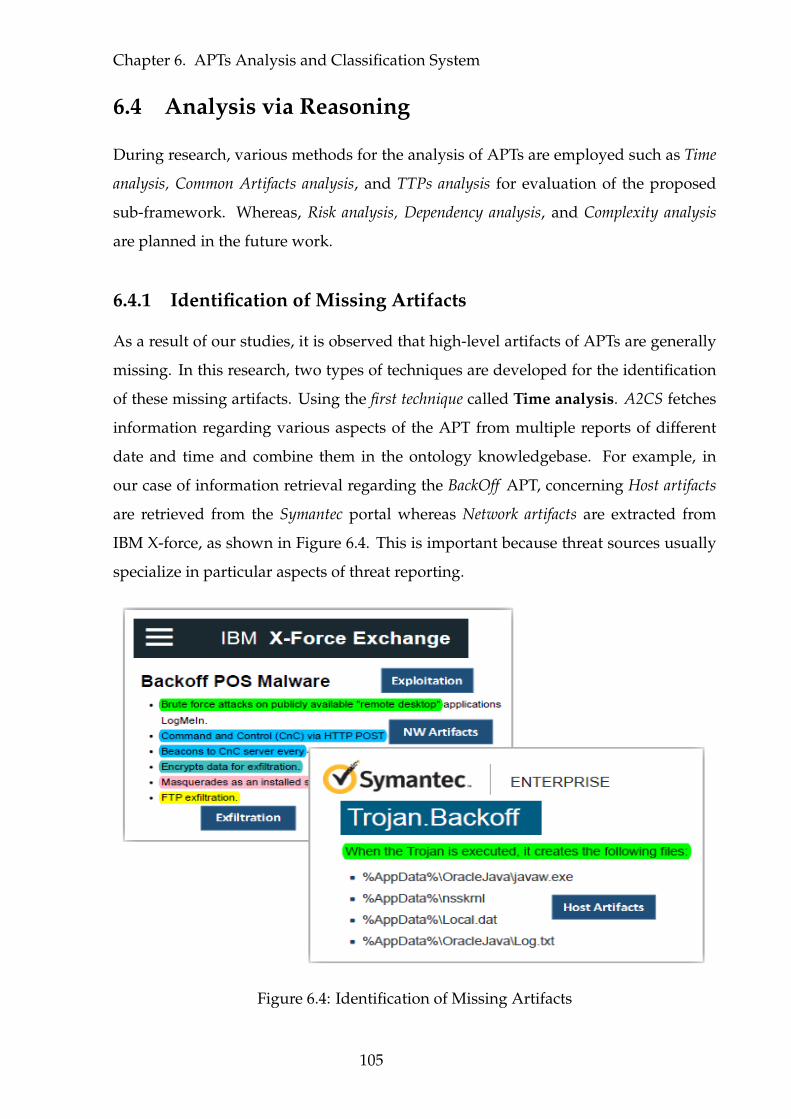
Chapter 6. APTs Analysis and Classification System
6.4 Analysis via Reasoning
During research, various methods for the analysis of APTs are employed such as Time
analysis, Common Artifacts analysis, and TTPs analysis for evaluation of the proposed
sub-framework. Whereas, Risk analysis, Dependency analysis, and Complexity analysis
are planned in the future work.
6.4.1 Identification of Missing Artifacts
As a result of our studies, it is observed that high-level artifacts of APTs are generally
missing. In this research, two types of techniques are developed for the identification
of these missing artifacts. Using the first technique called Time analysis. A2CS fetches
information regarding various aspects of the APT from multiple reports of different
date and time and combine them in the ontology knowledgebase. For example, in
our case of information retrieval regarding the BackOff APT, concerning Host artifacts
are retrieved from the Symantec portal whereas Network artifacts are extracted from
IBM X-force, as shown in Figure 6.4. This is important because threat sources usually
specialize in particular aspects of threat reporting.
Figure 6.4: Identification of Missing Artifacts
105
Chapter 6. APTs Analysis and Classification System
The second technique is called Common Artifacts analysis. It concerns the aug-
mentation and enrichment of information about an incomplete APT from information
about known or previously studied APTs of the same family. For example, JackPOS is a
recent successor of BackOff and is therefore not as well studied as the latter. Our knowl-
edgebase already consisted of information regarding BackOff APT’s stealing methods
and affected device. When the reasoning module correlated the artifacts of both, it
concluded that since both are attacking the same domain i.e. the retailer industry and
directly affecting the terminal. Therefore, JackPOS may be employing a similar stealing
Method as used by the BackOff.
A number of queries are developed for the identification of missing artifacts in the
Semantic Query-Enhanced Web Rule Language (SQWRL), a sample of these queries are as
follows.
The Query-1 Equation 6.1 correlates files and folders names, and identifies the com-
mon.
Attacker(?AT ) ∧ APT (?AP) ∧ launch(?AT , ?AP)∧
producesHostArtifacts(?AP , ?HA) ∧ createFile(?HA, ?CF )→
sqwrl : select(?AP , ?CF ) ∧ sqwrl : orderBy(?CF )
(6.1)
Similarly, the Query-2 Equation 6.2 is designed for finding the information regard-
ing stealing methods used by the APTs.
Attacker(?AT ) ∧ APT (?AP) ∧Weaponization(?WP)∧
Perform(?AT , ?WP) ∧ StealingMethod(?WP , ?SM )→
launch(?AT , ?AP)∧
sqwrl : select(?AP , ?SMF ) ∧ sqwrl : orderBy(?AP)
(6.2)
The correlation of the JackPOS and BackOff APTs generated by our proposed system
is shown in Figure 6.5. Dotted lines indicate partially matched artifacts while fully
matched artifacts are presented by solid lines.
The correlation results are summarized in Figure 6.6. These results indicate that
106
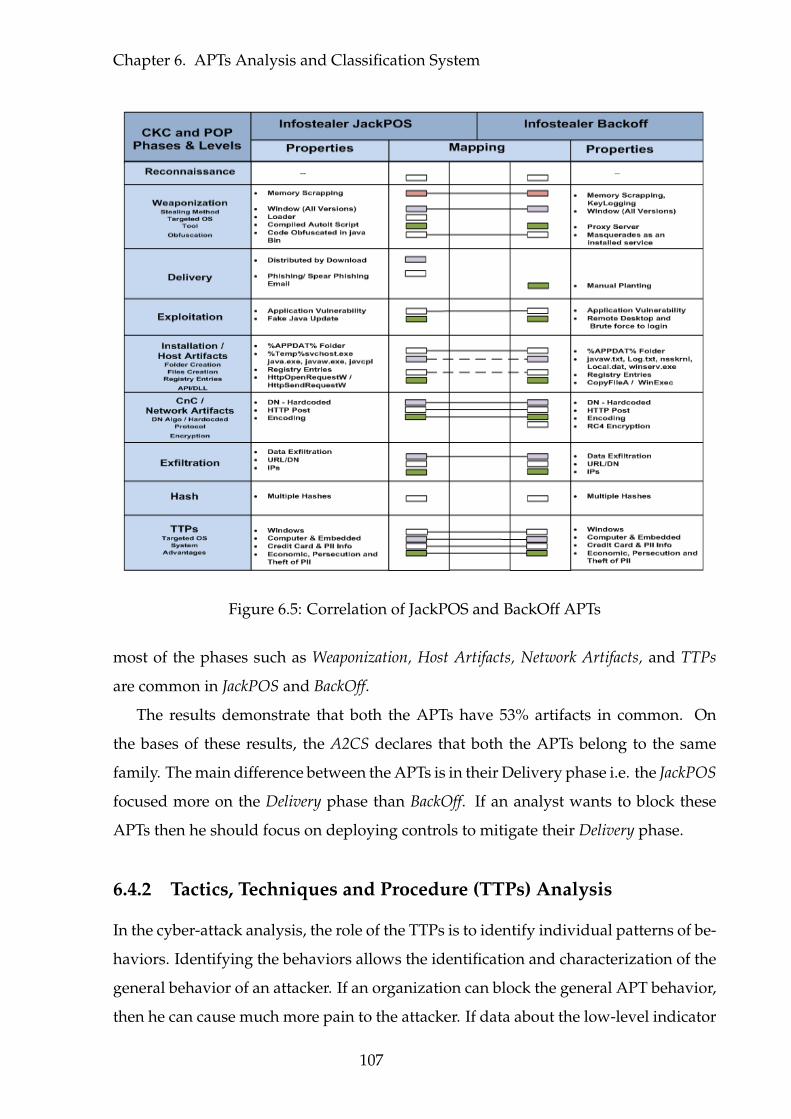
Chapter 6. APTs Analysis and Classification System
Figure 6.5: Correlation of JackPOS and BackOff APTs
most of the phases such as Weaponization, Host Artifacts, Network Artifacts, and TTPs
are common in JackPOS and BackOff.
The results demonstrate that both the APTs have 53% artifacts in common. On
the bases of these results, the A2CS declares that both the APTs belong to the same
family. The main difference between the APTs is in their Delivery phase i.e. the JackPOS
focused more on the Delivery phase than BackOff. If an analyst wants to block these
APTs then he should focus on deploying controls to mitigate their Delivery phase.
6.4.2 Tactics, Techniques and Procedure (TTPs) Analysis
In the cyber-attack analysis, the role of the TTPs is to identify individual patterns of be-
haviors. Identifying the behaviors allows the identification and characterization of the
general behavior of an attacker. If an organization can block the general APT behavior,
then he can cause much more pain to the attacker. If data about the low-level indicator
107
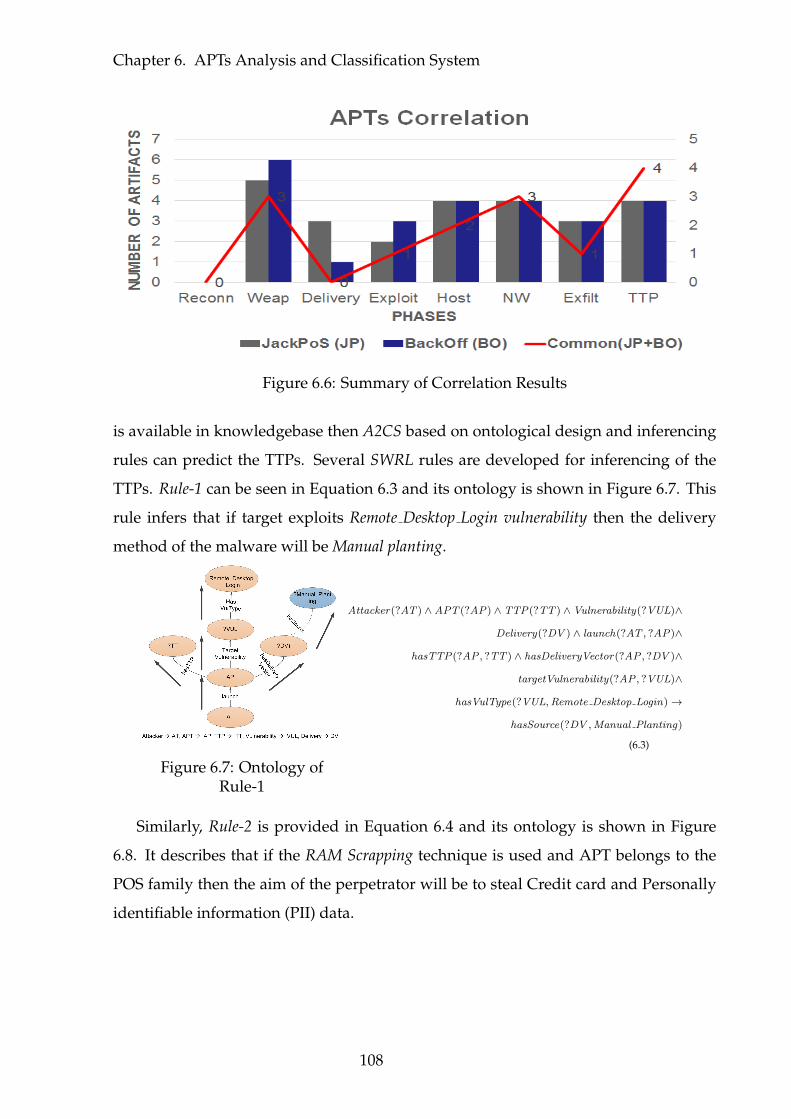
Chapter 6. APTs Analysis and Classification System
Figure 6.6: Summary of Correlation Results
is available in knowledgebase then A2CS based on ontological design and inferencing
rules can predict the TTPs. Several SWRL rules are developed for inferencing of the
TTPs. Rule-1 can be seen in Equation 6.3 and its ontology is shown in Figure 6.7. This
rule infers that if target exploits Remote Desktop Login vulnerability then the delivery
method of the malware will be Manual planting.
Figure 6.7: Ontology ofRule-1
Attacker(?AT ) ∧APT (?AP) ∧ TTP(?TT ) ∧Vulnerability(?VUL)∧
Delivery(?DV ) ∧ launch(?AT , ?AP)∧
hasTTP(?AP , ?TT ) ∧ hasDeliveryVector(?AP , ?DV )∧
targetVulnerability(?AP , ?VUL)∧
hasVulType(?VUL,Remote Desktop Login)→
hasSource(?DV ,Manual Planting)
(6.3)
Similarly, Rule-2 is provided in Equation 6.4 and its ontology is shown in Figure
6.8. It describes that if the RAM Scrapping technique is used and APT belongs to the
POS family then the aim of the perpetrator will be to steal Credit card and Personally
identifiable information (PII) data.
108
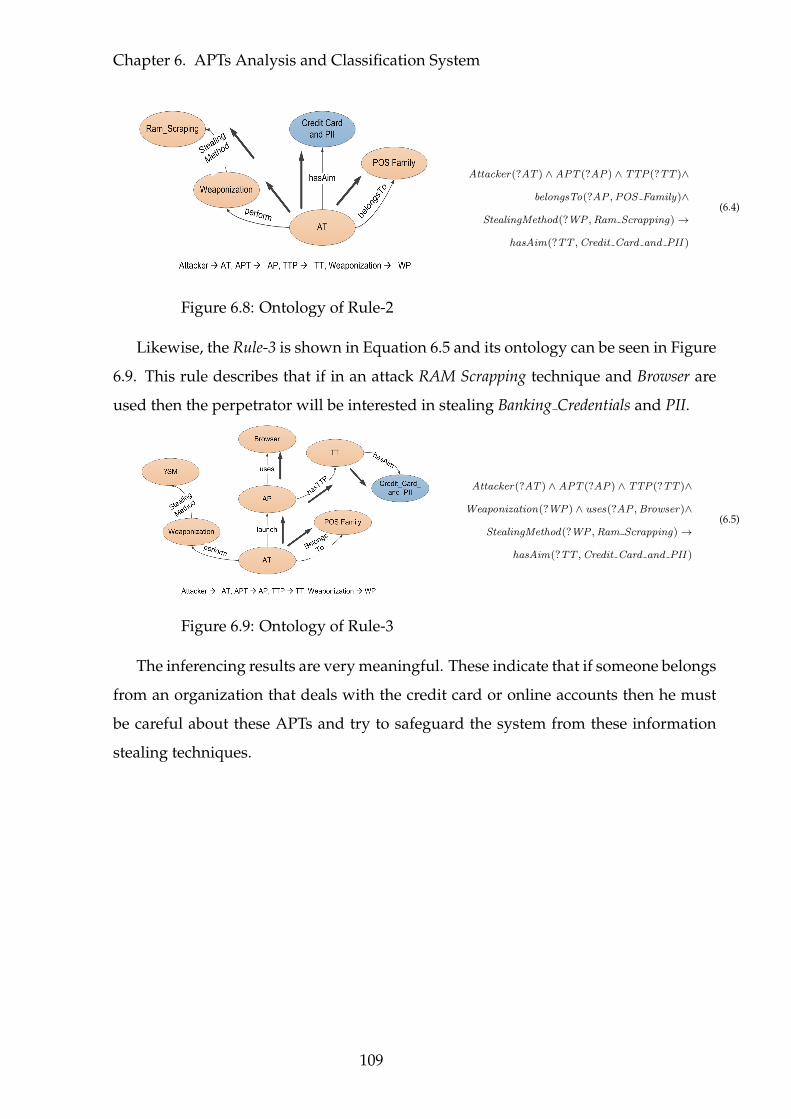
Chapter 6. APTs Analysis and Classification System
Figure 6.8: Ontology of Rule-2
Attacker(?AT ) ∧APT (?AP) ∧ TTP(?TT )∧
belongsTo(?AP ,POS Family)∧
StealingMethod(?WP ,Ram Scrapping)→
hasAim(?TT ,Credit Card and PII )
(6.4)
Likewise, the Rule-3 is shown in Equation 6.5 and its ontology can be seen in Figure
6.9. This rule describes that if in an attack RAM Scrapping technique and Browser are
used then the perpetrator will be interested in stealing Banking Credentials and PII.
Figure 6.9: Ontology of Rule-3
Attacker(?AT ) ∧APT (?AP) ∧ TTP(?TT )∧
Weaponization(?WP) ∧ uses(?AP ,Browser)∧
StealingMethod(?WP ,Ram Scrapping)→
hasAim(?TT ,Credit Card and PII )
(6.5)
The inferencing results are very meaningful. These indicate that if someone belongs
from an organization that deals with the credit card or online accounts then he must
be careful about these APTs and try to safeguard the system from these information
stealing techniques.
109
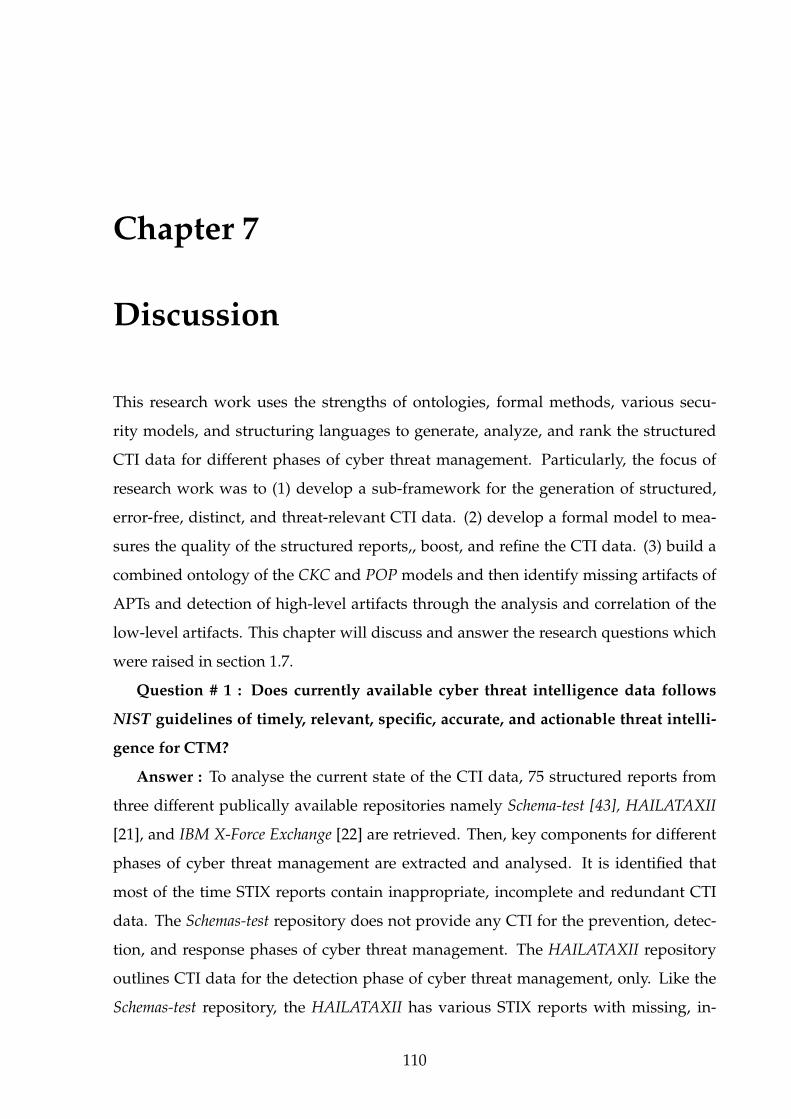
Chapter 7
Discussion
This research work uses the strengths of ontologies, formal methods, various secu-
rity models, and structuring languages to generate, analyze, and rank the structured
CTI data for different phases of cyber threat management. Particularly, the focus of
research work was to (1) develop a sub-framework for the generation of structured,
error-free, distinct, and threat-relevant CTI data. (2) develop a formal model to mea-
sures the quality of the structured reports,, boost, and refine the CTI data. (3) build a
combined ontology of the CKC and POP models and then identify missing artifacts of
APTs and detection of high-level artifacts through the analysis and correlation of the
low-level artifacts. This chapter will discuss and answer the research questions which
were raised in section 1.7.
Question # 1 : Does currently available cyber threat intelligence data follows
NIST guidelines of timely, relevant, specific, accurate, and actionable threat intelli-
gence for CTM?
Answer : To analyse the current state of the CTI data, 75 structured reports from
three different publically available repositories namely Schema-test [43], HAILATAXII
[21], and IBM X-Force Exchange [22] are retrieved. Then, key components for different
phases of cyber threat management are extracted and analysed. It is identified that
most of the time STIX reports contain inappropriate, incomplete and redundant CTI
data. The Schemas-test repository does not provide any CTI for the prevention, detec-
tion, and response phases of cyber threat management. The HAILATAXII repository
outlines CTI data for the detection phase of cyber threat management, only. Like the
Schemas-test repository, the HAILATAXII has various STIX reports with missing, in-
110
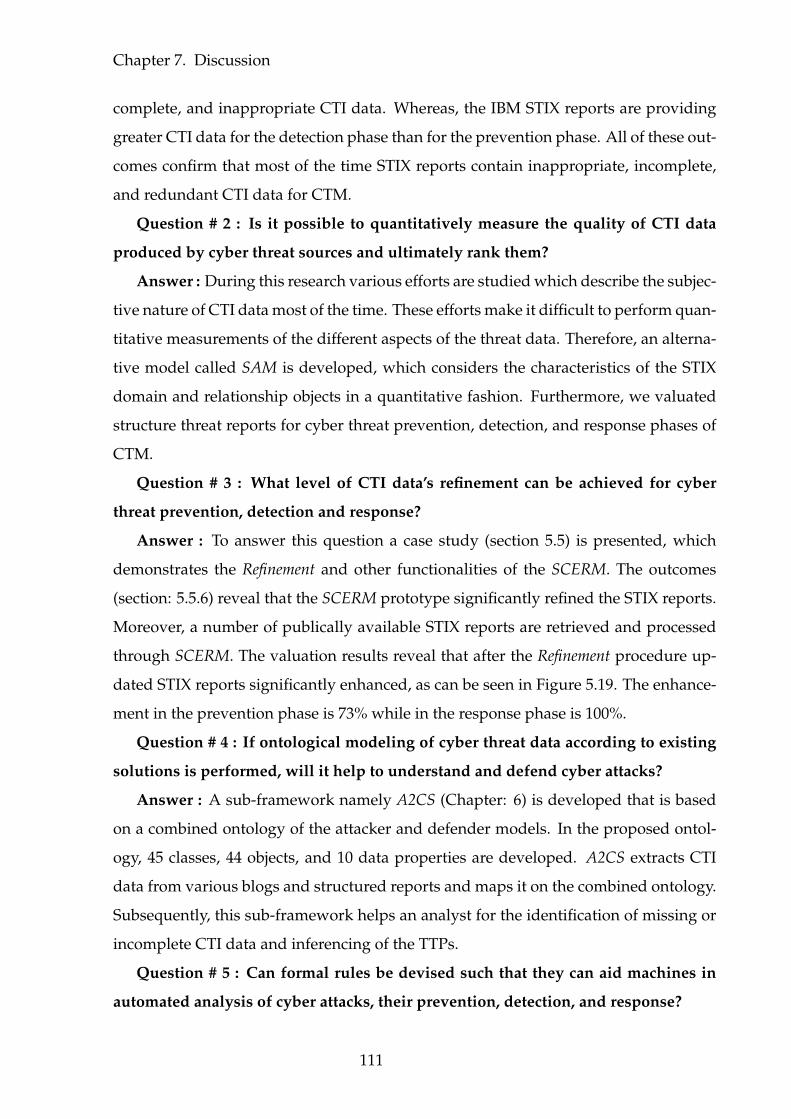
Chapter 7. Discussion
complete, and inappropriate CTI data. Whereas, the IBM STIX reports are providing
greater CTI data for the detection phase than for the prevention phase. All of these out-
comes confirm that most of the time STIX reports contain inappropriate, incomplete,
and redundant CTI data for CTM.
Question # 2 : Is it possible to quantitatively measure the quality of CTI data
produced by cyber threat sources and ultimately rank them?
Answer : During this research various efforts are studied which describe the subjec-
tive nature of CTI data most of the time. These efforts make it difficult to perform quan-
titative measurements of the different aspects of the threat data. Therefore, an alterna-
tive model called SAM is developed, which considers the characteristics of the STIX
domain and relationship objects in a quantitative fashion. Furthermore, we valuated
structure threat reports for cyber threat prevention, detection, and response phases of
CTM.
Question # 3 : What level of CTI data’s refinement can be achieved for cyber
threat prevention, detection and response?
Answer : To answer this question a case study (section 5.5) is presented, which
demonstrates the Refinement and other functionalities of the SCERM. The outcomes
(section: 5.5.6) reveal that the SCERM prototype significantly refined the STIX reports.
Moreover, a number of publically available STIX reports are retrieved and processed
through SCERM. The valuation results reveal that after the Refinement procedure up-
dated STIX reports significantly enhanced, as can be seen in Figure 5.19. The enhance-
ment in the prevention phase is 73% while in the response phase is 100%.
Question # 4 : If ontological modeling of cyber threat data according to existing
solutions is performed, will it help to understand and defend cyber attacks?
Answer : A sub-framework namely A2CS (Chapter: 6) is developed that is based
on a combined ontology of the attacker and defender models. In the proposed ontol-
ogy, 45 classes, 44 objects, and 10 data properties are developed. A2CS extracts CTI
data from various blogs and structured reports and maps it on the combined ontology.
Subsequently, this sub-framework helps an analyst for the identification of missing or
incomplete CTI data and inferencing of the TTPs.
Question # 5 : Can formal rules be devised such that they can aid machines in
automated analysis of cyber attacks, their prevention, detection, and response?
111
Chapter 7. Discussion
Answer : To answer this question, several rules are developed (section: 6.4.2) in the
Semantic Web Rule Language (SWRL) that helps an analyst to predict high-level artifacts
from the low-level artifacts. Moreover, multiple queries are also developed (section:
6.4.1) in the Semantic Query-Enhanced Web Rule Language (SQWRL) for the identification
of the missing artifacts. Then, two well-known APTs namely JackPOS and BackOff are
selected for the inferencing of missing artifacts and analysis of TTPs. Various security
blogs are scanned and CTI data is extracted. subsequently, this CTI data is mapped
on the combined ontology and aforesaid rules and queries are applied. The results
demonstrate that both the APTs have 53% artifacts in common. On the bases of these
results, the A2CS declares that both the APTs belong to the same family. The main
difference between the APTs is in their Delivery phase i.e. the JackPOS focused more
on the Delivery phase than BackOff. If an analyst wants to block these APTs then he
should focus on deploying controls to mitigate their Delivery phase.
Although STIX is a well-defined language, which provides multiple properties such
as impact, efficacy, and confidence to describe the usefulness of the shared CTI. However,
most of the shared STIX reports do not employ these properties. Therefore shared re-
ports do not contribute much to the CTM. It is important to highlight that available
STIX reports provide indicators and their observables most of the time and they share
fewer COAs, which are instrumental components for the prevention and response
phases of CTM.
It is very encouraging that governments and the security industry are struggling
hard for structuring and sharing of CTI as a standard, as well as a routine process.
Therefore, it is assuming that ultimately security firms will be more vigilant about the
authenticity and completeness of the structured CTI data for various phases of the
CTM. Accordingly, our framework contribution regarding the structuring, boosting,
valuation, refinement, and APT analysis will be increased significantly.
112
Chapter 8
Conclusions and Future Research
Directions
8.1 Conclusions
The outcome of this thesis is a security framework that consists of three sub-
frameworks namely STIXGEN, SCERM, and A2CS. Each of these sub-frameworks is
developed to achieve set of goals aimed in this research. A brief synopsis of the novel
contributions made by aforesaid sub-frameworks is provided in the following subsec-
tions.
It is learned during the research that presently no online tool is available that au-
tomatically generates distinct, meaningful and error-free structured CTI from the text.
The STIXGEN prototype is the first tool that is designed according to STIX standard
in such a way that it generates threat-relevant, properly placed and error-free struc-
tured data. Therefore, we feel that it will increase the STIX utilization and sharing of
structured CTI between peer organizations. Moreover, it will be used to generate good
quality STIXs for students and analysts in a simple and effective way.
According to our study, most of the time, structured CTI reports do not contain CTI
data for the prevention, detection and response phases of CTM. Although some data
is available, however, that carries inappropriate, incomplete, wrongly placed, and re-
dundant information. Therefore available structured reports cannot be used for CTM.
Ironically, no tool is available to measure the quality of publicly available structured
data. The SCERM prototype is the first tool, which valuates the structured reports ac-
113
Chapter 8. Conclusions and Future Research Directions
cording to different phases of the CTM such as the prevention, detection, and response.
First of all, it performs CTI data cleansing and remapping. Afterwards, it identifies
missing CTI data required for CTM and refines the structured reports accordingly. In
fact, our proposed sub-framework SCERM will enhance the user confidence over struc-
tured CTI data, hence the quality and usage of structured CTI data for the CTM will be
increased.
The Pyramid of Pain and Cyber Kill Chain are emerging and promising models for
network defense. These models are complementary for each other and the cyber at-
tack picture can not be seen exclusively without any of these models. To best of our
knowledge both of these models are theoretical and previously no one has developed a
combined ontology of these. Due to these reasons, we developed a combined ontology
of both the models for the identification of missing artifacts and inferencing of TTPs.
We tested our proposed solution using data from real-world APTs and found that a
large percentage of APTs have several behaviors in common.
8.2 Future Research Directions
The research work shared in this thesis can be further extended in multiple new di-
rections. Few of the research ideas, which are currently being worked upon by our
research group are briefly explained in the following subsections.
Currently, a prototype of STIXGEN is developed to generate structured threat data.
A more useful extension of our proposed framework is to upgrade the STIXGEN ap-
plication for online users so that security analysts can utilize it for STIX generation
and we can get more and more structured CTI to draw the bigger picture of the cyber
threats.
We discuss some limitations of our work and plans for addressing these in our fu-
ture work. The NIST standard [126] defines good quality threat intelligence to be timely,
relevant, specific, accurate, and actionable. Presently, the SCERM framework directly con-
siders the relevance, specificity, and actionable properties of shared CTI data. Regarding
accuracy, we assume that sources of CTI data are trustworthy and the provided im-
pact, efficacy, and confidence scores of COA and indicators are directly consumed by
SCERM without verification. We also utilized data from well-reputed threat vendors
114
Chapter 8. Conclusions and Future Research Directions
for our experiments. However, it is entirely plausible for low integrity threat sources
to lie or report false threat data to mislead others. Consider the obvious advantage
to a malicious actor to attempt to poison the well and inject fake indicators about his
next imminent APT in the CTI community to avoid detection. In the future, we plan
to develop a methodology to measure the accuracy of the provided CTI data. Rank-
ing threat sources according to a majority decision and keeping track of their previous
credibility will be explored.
Similarly, timely sharing of threat data is critical for effective CTM. Historically,
it has been the case that the same cyber-attack was launched against multiple orga-
nizations almost simultaneously. Firms are generally reluctant in sharing data about
breaches because they feel it may damage their reputation and drop their stock price.
To encourage timely data sharing, we will examine temporal aspects of threat feeds
and develop procedures to rank the data sources based on timely sharing.
For the refinement phase of SCERM, we plan to explore other related datasets simi-
lar to ATTACK.MITRE such as the IMPACT [127] dataset to enhance threat feeds. Merg-
ing CTI reports addressing different incidents related to the same APT may allow for
better refinement of CTI data.
Finally, in this work, we have mostly focused on understanding the big picture
of the cyber threat landscape for CTM. Actually investigating the presence of these
threats in an enterprise environment will require considering user data. In the future,
we will correlate users’ traffic behaviors with the CTI data for cyber threat prevention,
detection, and response.
As we know, ontologies are developed for knowledge sharing and reuse. More-
over, these empower software system to analyze and reason over this shared knowl-
edge. In the A2CS sub-framework, a combined ontology of CKC and POP models is
developed. SWRL rules are written for APTs analysis and identification of their miss-
ing artifacts. Therefore, in the ontology engineering domain, one of the alluring works
is to develop an Intrusion Detection System (IDS) on the bases of our proposed A2CS
sub-framework.
115
Bibliography
[1] R. Walters, “Cyber attacks on us companies in 2014,” The Heritage Foundation,
vol. 4289, pp. 1–5, 2014.
[2] A. Mohaisen and O. Alrawi, “Unveiling zeus: automated classification of mal-
ware samples,” in Proceedings of the 22nd International Conference on World Wide
Web. ACM, 2013, pp. 829–832.
[3] Krebs, “Home depot hit by same malware as target,” www.krebsonsecurity.
com/, accessed: 2018-1-5.
[4] World Economic Forum, “The global risks report 2018,” http://www3.
weforum.org/docs/WEF GRR18 Report.pdf/, accessed: 2018-8-30.
[5] PricewaterhouseCoopers, “The Global State of Information Security Survey
2015,” https://www.pwc.ru/en/publications/information-security-survey1.
html/, accessed: 2016-06-22.
[6] Information Systems Audit and Control Association, “2015 advanced persistent
threat awareness - third annual study,” https://www.isaca.org//, accessed:
2016-04-17.
[7] Symantec, “Internet security threat report,” https://www.symantec.com/
content/dam/symantec/docs/reports/istr-22-2017-en.pdf/, accessed: 2018-21-
3.
[8] McAfee, “Wannacry,” https://ics-cert.kaspersky.com/tag/wannacry/, ac-
cessed: 2018-30-13.
[9] N. Lomas, “Uk accuses russia of 2017’s notpetya ran-
somware attacks,” https://techcrunch.com/2018/02/15/
116
Chapter 8. BIBLIOGRAPHY
uk-accuses-russia-of-2017s-notpetya-ransomware-attacks/, accessed: 2018-
30-3.
[10] Techrepublic, “Notpetya ransomware outbreak
cost merck,” https://www.techrepublic.com/article/
notpetya-ransomware-outbreak-cost-merck-more-than-300m-per-quarter/,
accessed: 2018-30-4.
[11] A. Coburn, J. Daffron, A. Smith, J. Bordeau, E. Leverett, S. Sweeney, and T. Har-
vey, “Cyber-risk outlook,” 2018.
[12] CheckPoint, “2018 security report,” www.checkpoint.com/, accessed: 2018-22-8.
[13] SonicWall, “2018 sonicwall cyber threat report,” www.cdn.sonicwall.com/, ac-
cessed: 2018-21-8.
[14] K. Wagner, “Facebook suspended accounts for strategic communi-
cation laboratories,” https://www.recode.net/2018/3/17/17132646/
facebook-cambridge-analytica-suspended-trump-election-campaign/, ac-
cessed: 2018-21-4.
[15] E. Tillett, “Dhs official : Election systems in 21 states were targeted in russia cyber
attacks,” https://firenewsfeed.com/news/178859/, accessed: 2018-21-3.
[16] McAfee Lab, “2018 mcafee labs threat report,” www.mcafee.com/, accessed:
2018-31-8.
[17] KasperSky, “Zeus malware,” https://usa.kaspersky.com/resource-center/
threats/zeus-virus/, accessed: 2017-12-1.
[18] US-CERT, “Backoff point-of-sale malware,” https://www.us-cert.gov/ncas/
alerts/TA14-212A/, accessed: 2017-1-4.
[19] Gartner, “Gartner forecasts worldwide security spending,” https://www.
gartner.com/newsroom/id/3836563/, accessed: 2018-30-3.
[20] MITRE ATTCK, “Adversarial tactics, techniques & common knowledge,” ac-
cessed: 2016-05-2.
117
Chapter 8. BIBLIOGRAPHY
[21] Open Source, “Hailataxii : Open source cyber threat intelligence feeds,” www.
hailataxii.com/, accessed: 2018-2-1.
[22] IBM, “Ibm x-force exchange,” www.exchange.xforce.ibmcloud.com/, accessed:
2017-10-10.
[23] FS-ISAC, “Safeguarding the global financial system by reducing cyber-risk (fs-
isac),” https://www.fsisac.com/, accessed: 2019-06-11.
[24] REN-ISAC, “Research and education networks information sharing and analysis
center (ren-isac),” https://www.ren-isac.net/, accessed: 2019-06-11.
[25] A. J. Hebert, “Compressing the kill chain,” Air Force Magazine, vol. 86, no. 3, pp.
50–50, 2003.
[26] D. Bianco, “The pyramid of pain,” https://detect-respond.blogspot.com/2013/
03/the-pyramid-of-pain.html/, accessed: 2016-06-22.
[27] V. Mulwad, W. Li, A. Joshi, T. Finin, and K. Viswanathan, “Extracting infor-
mation about security vulnerabilities from web text,” in Proceedings of the 2011
IEEE/WIC/ACM International Conferences on Web Intelligence and Intelligent Agent
Technology-Volume 03. IEEE Computer Society, 2011, pp. 257–260.
[28] MITRE, “Sharing threat intelligence just got a lot easier,” www.oasis-open.
github.io, accessed: 2018-31-12.
[29] YARA, “Yara,” www.plusvic.github.io/, accessed: 2018-16-7.
[30] T. D. Wagner, “Sharing cyber intelligence in trusted environments - a literature
review,” School of Computing, Telecommunications and Networks Faculty of
Computing, Engineering and the Built Environment, Birmingham City Univer-
sity.
[31] C. Sauerwein, C. Sillaber, A. Mussmann, and R. Breu, “Threat intelligence shar-
ing platforms: An exploratory study of software vendors and research perspec-
tives,” 2017.
[32] H. Dalziel, How to define and build an effective cyber threat intelligence capability.
Syngress, 2014.
118
Chapter 8. BIBLIOGRAPHY
[33] BRO, “Bro - the bro network security monitor,” https://www.bro.org/, accessed:
2017-6-6.
[34] Splunk Corporation, “Splunk - log management and analysis,” https://www.
splunk.com/, accessed: 2017-6-5.
[35] MITRE, “Stix visualization tool,” https://github.com/STIXProject/stix-viz/, ac-
cessed: 2017-10-2.
[36] M. S. Abu, S. R. Selamat, A. Ariffin, and R. Yusof, “Cyber threat intelligence:
Issue and challenges,” Indonesian Journal of Electrical Engineering and Computer
Science, vol. 10, no. 1, pp. 371–379, 2018.
[37] W. Tounsi and H. Rais, “A survey on technical threat intelligence in the age of
sophisticated cyber attacks,” Computers & security, vol. 72, pp. 212–233, 2018.
[38] Z. Iqbal, Z. Anwar, and R. Mumtaz, “Stixgen-a novel framework for automatic
generation of structured cyber threat information,” in 2018 International Confer-
ence on Frontiers of Information Technology (FIT). IEEE, 2018, pp. 241–246.
[39] E. W. Burger, M. D. Goodman, P. Kampanakis, and K. A. Zhu, “Taxonomy model
for cyber threat intelligence information exchange technologies,” in Proceedings
of the 2014 ACM Workshop on Information Sharing & Collaborative Security. ACM,
2014, pp. 51–60.
[40] Virus Total, “Virus total,” www.virustotal.com/, accessed: 2019-24-2.
[41] I. You and K. Yim, “Malware obfuscation techniques: A brief survey,” in 2010
International conference on broadband, wireless computing, communication and appli-
cations. IEEE, 2010, pp. 297–300.
[42] Z. Iqbal and Z. Anwar, “Ontology generation of advanced persistent threats and
their automated analysis,” NUST Journal of Engineering Sciences, vol. 9, no. 2, pp.
68–75, 2016.
[43] MITRE, “Stixproject schema test,” www.github.com/, accessed: 2017-20-3.
[44] Gartner, “Best security information and event management software of 2019,”
https://www.gartner.com/, accessed: 2019-05-11.
119
Chapter 8. BIBLIOGRAPHY
[45] H. McGuinness, “Owl web ontology language overview,” W3C recommendation,
vol. 10, no. 10, p. 2004, 2004.
[46] S. Caltagirone, A. Pendergast, and C. Betz, “The diamond model of intrusion
analysis,” Center For Cyber Intelligence Analysis and Threat Research Hanover
Md, Tech. Rep., 2013.
[47] E. M. Hutchins, M. J. Cloppert, and R. M. Amin, “Intelligence-driven computer
network defense informed by analysis of adversary campaigns and intrusion
kill chains,” Leading Issues in Information Warfare & Security Research, vol. 1, no. 1,
p. 80, 2011.
[48] NIST, “National vulnerability database,” www.nvd.nist.gov/, accessed: 2017-09-
5.
[49] IBM, “Input output definition file (iodf),” www.ibm.com/, accessed: 2017-8-3.
[50] T. Takahashi, K. Landfield, T. Millar, and Y. Kadobayashi, “Iodef-extension
to support structured cybersecurity information,” draft-ietf-mile-sci-05. txt, IETF
draft, 2012.
[51] Iovin and Gabriel, “Collective intelligence framework,” www.github.com/, ac-
cessed: 2017-21-8.
[52] Leimeister and J. Marco, “Collective intelligence,” Business & Information Systems
Engineering, vol. 2, no. 4, pp. 245–248, 2010.
[53] FireEye, “Openioc back to the basics,” https://www.fireeye.com/blog/
threat-research/2013/10/openioc-basics.html/, accessed: 2017-25-10.
[54] MITRE Corporation, “Malware attribute enumeration and characterization
(maec),” www.maecproject.github.io/, accessed: 2018-5-4.
[55] OASIS, “Trusted automated exchange of indicator information (taxii),” www.
taxiiproject.github.io/, accessed: 2018-5-4.
[56] MITRE Corporation, “Common attack pattern enumeration and classification,”
www.capec.mitre.org/, accessed: 2018-5-6.
120
Chapter 8. BIBLIOGRAPHY
[57] M. Apoorva, R. Eswarawaka, and P. V. B. Reddy, “A latest comprehensive study
on structured threat information expression (stix) and trusted automated ex-
change of indicator information (taxii),” in Proceedings of the 5th international con-
ference on frontiers in intelligent computing: theory and applications. Springer, 2017,
pp. 477–482.
[58] Threatconnect, “Threatconnect, inc.(2015),” URL: http://www. informationweek.
com/whitepaper, 2017.
[59] H. Debar, D. Curry, and B. Feinstein, “The intrusion detection message exchange
format (idmef),” 2007.
[60] Soltra, “Soltra edge,” www.soltra.com/en/, accessed: 2017-16-7.
[61] Open Source, “Collaborative research into threats,” www.github.com/crits/, ac-
cessed: 2017-12-7.
[62] EclecticIQ, “Eclecticiq platform,” www.eclecticiq.com/, accessed: 2017-13-7.
[63] C. Wagner, A. Dulaunoy, G. Wagener, and A. Iklody, “Misp: The design and im-
plementation of a collaborative threat intelligence sharing platform,” in Proceed-
ings of the 2016 ACM on Workshop on Information Sharing and Collaborative Security.
ACM, 2016, pp. 49–56.
[64] OASIS, “Cyber observable expression (cybox) archive,” www.cyboxproject.
github.io/, accessed: 2018-21-12.
[65] Verizon, “2017 data breach investigations report,” 2015.
[66] MITRE, “Stix architecture,” https://stixproject.github.io/about/, accessed:
2017-2-9.
[67] MITRE Corporation, “Stix use cases,” https://www.stixproject.github.io/, ac-
cessed: 2017-24-11.
[68] Open Source, “Stix shifter,” https://pypi.org/project/stix-shifter/2.5.5/, ac-
cessed: 2020-4-15.
121
Chapter 8. BIBLIOGRAPHY
[69] P. Bhatt, E. T. Yano, and P. Gustavsson, “Towards a framework to detect multi-
stage advanced persistent threats attacks,” in 2014 IEEE 8th International Sympo-
sium on Service Oriented System Engineering. IEEE, 2014, pp. 390–395.
[70] McAfee, “Combating advanced persistent threats, white pa-
per,” https://www.mcafee.com/mx/resources/white-papers/
wp-combat-advanced-persist-threats.pdf/, accessed: 2016-21-4.
[71] M. Gadelrab, A. A. El Kalam, and Y. Deswarte, “Execution patterns in automatic
malware and human-centric attacks,” in 2008 Seventh IEEE International Sympo-
sium on Network Computing and Applications. IEEE, 2008, pp. 29–36.
[72] M. S. Gadelrab, E. Kalam, A. Abou, and Y. Deswarte, “Defining categories to
select representative attack test-cases,” in Proceedings of the 2007 ACM workshop
on Quality of protection. ACM, 2007, pp. 40–42.
[73] Yadav, Sandeep et al., “Detecting algorithmically generated malicious domain
names,” in Proceedings of the 10th ACM SIGCOMM conference on Internet measure-
ment, 2010, pp. 48–61.
[74] I. You and K. Yim, “Malware obfuscation techniques: A brief survey,” in 2010
International conference on broadband, wireless computing, communication and appli-
cations. IEEE, 2010, pp. 297–300.
[75] K. Krombholz, H. Hobel, M. Huber, and E. Weippl, “Advanced social engineer-
ing attacks,” Journal of Information Security and applications, vol. 22, pp. 113–122,
2015.
[76] Ponemon.Institute, “2014 state of endpoint risk. white paper,” Dec 2013.
[77] M. Bere, F. Bhunu-Shava, A. Gamundani, and I. Nhamu, “How advanced per-
sistent threats exploit humans,” International Journal of Computer Science Issues
(IJCSI), vol. 12, no. 6, p. 170, 2015.
[78] S. Qamar, Z. Anwar, M. A. Rahman, E. Al-Shaer, and B.-T. Chu, “Data-driven
analytics for cyber-threat intelligence and information sharing,” Computers & Se-
curity, vol. 67, pp. 35–58, 2017.
122
Chapter 8. BIBLIOGRAPHY
[79] Cosive, “Stix data generator,” https://generator.cosive.com/, accessed: 2017-14-
12.
[80] Open Source, “Python - stix,” https://github.com/STIXProject/python-stix/,
accessed: 2018-5-1.
[81] Open.Source, “Threat intelligence quotient test,” github.com/mlsecproject/
tiq-test/, accessed: 2016-20-12.
[82] R. Meier, C. Scherrer, D. Gugelmann, V. Lenders, and L. Vanbever, “Feedrank:
A tamper-resistant method for the ranking of cyber threat intelligence feeds,”
in 2018 10th International Conference on Cyber Conflict (CyCon). IEEE, 2018, pp.
321–344.
[83] C. Sauerwein, I. Pekaric, M. Felderer, and R. Breu, “An analysis and classifica-
tion of public information security data sources used in research and practice,”
Computers & security, vol. 82, pp. 140–155, 2019.
[84] N. Pitropakis, E. Panaousis, A. Giannakoulias, G. Kalpakis, R. D. Rodriguez, and
P. Sarigiannidis, “An enhanced cyber attack attribution framework,” in Interna-
tional Conference on Trust and Privacy in Digital Business. Springer, 2018, pp.
213–228.
[85] D. Bodeau and R. Graubart, “Cyber prep 2.0: Motivating organizational cyber
strategies in terms of threat preparedness,” MITRE, Bedford, MA, USA, Tech. Rep,
pp. 15–0797, 2017.
[86] M. Mateski, C. M. Trevino, C. K. Veitch, J. Michalski, J. M. Harris, S. Maruoka,
and J. Frye, “Cyber threat metrics,” Sandia National Laboratories, 2012.
[87] B. Shin and P. B. Lowry, “A review and theoretical explanation of the
‘cyberthreat-intelligence (cti) capability’that needs to be fostered in information
security practitioners and how this can be accomplished,” Computers & Security,
p. 101761, 2020.
[88] A. Singhal and X. Ou, “Security risk analysis of enterprise networks using prob-
abilistic attack graphs,” in Network Security Metrics. Springer, 2017, pp. 53–73.
123
Chapter 8. BIBLIOGRAPHY
[89] P. Mell, K. Scarfone, and S. Romanosky, “A complete guide to the common vul-
nerability scoring system version 2.0,” in Published by FIRST-Forum of Incident
Response and Security Teams, vol. 1, 2007, p. 23.
[90] Y. Ghazi, Z. Anwar, R. Mumtaz, S. Saleem, and A. Tahir, “A supervised machine
learning based approach for automatically extracting high-level threat intelli-
gence from unstructured sources,” in 2018 International Conference on Frontiers
of Information Technology (FIT). IEEE, 2018, pp. 129–134.
[91] U. Noor, Z. Anwar, A. W. Malik, S. Khan, and S. Saleem, “A machine learning
framework for investigating data breaches based on semantic analysis of adver-
sary’s attack patterns in threat intelligence repositories,” Future Generation Com-
puter Systems, vol. 95, pp. 467–487, 2019.
[92] N. Kaloudi and J. Li, “The ai-based cyber threat landscape: A survey,” ACM
Computing Surveys (CSUR), vol. 53, no. 1, pp. 1–34, 2020.
[93] CyberInt, “Threat intelligence scoring and analysis,” www.cyberint.com/
wp-content/uploads/, accessed: 2018-21-5.
[94] MITRE, “Common weakness scoring system,” www.cwe.mitre.org/cwss/, ac-
cessed: 2018-12-6.
[95] H. Sayyadi and L. Getoor, “Futurerank: Ranking scientific articles by predicting
their future pagerank,” in Proceedings of the 2009 SIAM International Conference on
Data Mining. SIAM, 2009, pp. 533–544.
[96] L. Page, S. Brin, R. Motwani, and T. Winograd, “The pagerank citation ranking:
Bringing order to the web.” Stanford InfoLab, Tech. Rep., 1999.
[97] W. Xu, W. Liang, X. Lin, and J. X. Yu, “Finding top-k influential users in social
networks under the structural diversity model,” Information Sciences, vol. 355,
pp. 110–126, 2016.
[98] Q. Wang, Y. Jin, S. Cheng, and T. Yang, “Conformrank: A conformity-based rank
for finding top-k influential users,” Physica A: Statistical Mechanics and its Appli-
cations, vol. 474, pp. 39–48, 2017.
124
Chapter 8. BIBLIOGRAPHY
[99] Z. Anwar, M. Montanari, A. Gutierrez, and R. H. Campbell, “Budget con-
strained optimal security hardening of control networks for critical cyber-
infrastructures,” International Journal of Critical Infrastructure Protection, vol. 2, no.
1-2, pp. 13–25, 2009.
[100] A. Yeboah-Ofori and A. Brimicombe, “Cyber intelligence & osint: Developing
mitigation techniques against cybercrime threats on social media a systematic re-
view july 2017,” International Journal of Cyber-Security and Digital Forensics, vol. 7,
no. 1, pp. 87–99, 2018.
[101] J. Barnett, “Reputation: The foundation of effective threat protection,” McAfee,
White Paper, vol. 11, 2010.
[102] T. Macaulay, “System and method for generating and refining cyber threat intel-
ligence data,” Aug. 25 2015, uS Patent 9,118,702.
[103] A. Thomson and C. D. Coleman, “Apparatuses, methods and systems for a cyber
threat confidence rating visualization and editing user interface,” Mar. 14 2017,
uS Patent 9,596,256.
[104] I. Kotenko, O. Polubelova, I. Saenko, and E. Doynikova, “The ontology of metrics
for security evaluation and decision support in siem systems,” in 2013 Interna-
tional Conference on Availability, Reliability and Security. IEEE, 2013, pp. 638–645.
[105] M. S. Geramiparvar and N. Modiri, “Presenting a metric-based model for mal-
ware detection and classification,” International Journal of Computer & Information
Technology (IJOCIT), vol. 2, pp. 528–539, 2014.
[106] V. Vassilev, V. Sowinski-Mydlarz, P. Gasiorowski, K. Ouazzane, A. Phipps
et al., “Intelligence graphs for threat intelligence and security policy valida-
tion of cyber systems,” in Proc. Int. Conf. on Artificial Intelligence and Applications
(ICAIA2020). Advances in Intelligent Systems and Computing, Springer, 2020.
[107] M. S. Geramiparvar and N. Modiri, “An approach to counteracting the common
cyber-attacks according to the metric-based model,” International Journal of Com-
puter Science and Network Security (IJCSNS), vol. 16, no. 1, p. 81, 2016.
125
Chapter 8. BIBLIOGRAPHY
[108] N. Afzaliseresht, Y. Miao, S. Michalska, Q. Liu, and H. Wang, “From logs to
stories: Human-centred data mining for cyber threat intelligence,” IEEE Access,
vol. 8, pp. 19 089–19 099, 2020.
[109] R. Riesco, X. Larriva-Novo, and V. Villagra, “Cybersecurity threat intelligence
knowledge exchange based on blockchain,” Telecommunication Systems, vol. 73,
no. 2, pp. 259–288, 2020.
[110] S. More, M. Matthews, A. Joshi, and T. Finin, “A knowledge-based approach to
intrusion detection modeling,” in 2012 IEEE Symposium on Security and Privacy
Workshops. IEEE, 2012, pp. 75–81.
[111] J. Undercoffer, A. Joshi, and J. Pinkston, “Modeling computer attacks: An on-
tology for intrusion detection,” in International Workshop on Recent Advances in
Intrusion Detection. Springer, 2003, pp. 113–135.
[112] A. Joshi, R. Lal, T. Finin, and A. Joshi, “Extracting cybersecurity related linked
data from text,” in 2013 IEEE Seventh International Conference on Semantic Comput-
ing. IEEE, 2013, pp. 252–259.
[113] R. Corinne, L. Jones et al., “Adversarial tactics, techniques, and common knowl-
edge,” arXiv, 2013.
[114] K. Son, Kim et al., “Cyber-attack group analysis method based on association
of cyber-attack information.” KSII Transactions on Internet & Information Systems,
vol. 14, no. 1, 2020.
[115] H. Al-Mohannadi, I. Awan, and J. Al Hamar, “Analysis of adversary activities
using cloud-based web services to enhance cyber threat intelligence,” Service Ori-
ented Computing and Applications, pp. 1–13, 2020.
[116] Symantec, “Attacks on point of sales systems,” https://
www.symantec.com/content/dam/symantec/docs/white-papers/
attacks-on-point-of-sale-systems-en.pdf/, accessed: 2016-12-8.
[117] Illusive, “Retail industry under attack,” https://cdn2.hubspot.net/hubfs/
725085/Fact Sheets/RetailIndustryUnderAttack.pdf/, accessed: 2016-31-7.
126
Chapter 8. BIBLIOGRAPHY
[118] Panda Media Center, “Alina, the latest pos malware,” https://www.
pandasecurity.com/mediacenter/pandalabs/alina-pos-malware/, accessed:
2019-11-6.
[119] EnigmaSoft, “Jackpos,” https://www.enigmasoftware.com/jackpos-removal/,
accessed: 2019-11-6.
[120] FireEye, “Centerpos: An evolving pos threat,” https://www.fireeye.com/blog/
threat-research/2016/01/, accessed: 2019-9-6.
[121] CISCO, “Threat spotlight: Holiday greetings from pro pos,” https://blog.
talosintelligence.com/2015/12/pro-pos.html, accessed: 2019-10-6.
[122] Target Corporation, “Target confirms unauthorized access to payment card
data in u.s. stores,” https://corporate.target.com/press/releases/2013/12/, ac-
cessed: 2016-12-6.
[123] Z. Iqbal and Z. Anwar, “Stix dataset,” https://github.com/zafarabbasi/
STIXDataset/, created: 2018-5-7.
[124] Secureworks, “Threat group tg 3390,” www.secureworks.com/research/, ac-
cessed: 2017-20-12.
[125] L. Obrst, P. Chase, and R. Markeloff, “Developing an ontology of the cyber secu-
rity domain.” in STIDS, 2012, pp. 49–56.
[126] Chris Johnson NIST, “Nist sp 800-150:guide to cyber threat information shar-
ing,” https://csrc.nist.gov/, accessed: 2018-09-5.
[127] IMPACT, “Information marketplace for policy and analysis of cyber-risk &
trust,” https://www.impactcybertrust.org/, accessed: 2019-27-12.
[128] SANS, “Killing advanced threats in their tasks - an intellignece approach to at-
tack prevention,” 2014.
[129] D. Bianco, “What do you get when you cross a pyramid
with a chain,” https://detect-respond.blogspot.com/2013/03/
what-do-you-get-when-you-cross-pyramid.html/, accessed: 2016-06-22.
127
Chapter 8. BIBLIOGRAPHY
[130] A. Oltramari, L. F. Cranor, R. J. Walls, and P. D. McDaniel, “Building an ontology
of cyber security.” in STIDS. Citeseer, 2014, pp. 54–61.
[131] A. Oltramari, L. F. Cranor, R. J. Walls, and P. McDaniel, “Computational ontol-
ogy of network operations,” in MILCOM 2015-2015 IEEE Military Communica-
tions Conference. IEEE, 2015, pp. 318–323.
[132] A. Razzaq, K. Latif, H. F. Ahmad, A. Hur, Z. Anwar, and P. C. Bloodsworth, “Se-
mantic security against web application attacks,” Information Sciences, vol. 254,
pp. 19–38, 2014.
[133] Z. Syed, A. Padia, T. Finin, L. Mathews, and A. Joshi, “Uco: A unified cyberse-
curity ontology,” in Workshops at the Thirtieth AAAI Conference on Artificial Intelli-
gence, 2016.
[134] B. Schneier, “Structured threat information expression (stix) 1.x archive website,”
https://stixproject.github.io/, accessed: 2017-23-10.
[135] G. White and K. Harrison, “State and community information sharing and anal-
ysis organizations,” 2017.
[136] NIST, “Comparing stix 1.x/cybox 2.x with stix 2,” https://oasis-open.github.io/
cti-documentation/stix/compare/, accessed: 2017-31-12.
[137] Symantec, “nfostealer malumpos,” https://www.symantec.com/
security-center/writeup/2015-060806-3221-99/, accessed: 2017-6-5.
[138] Panda Security, “Pos and credit cards: In the line of fire with punkeypos,”
https://www.pandasecurity.com/mediacenter/malware/punkeypos/, ac-
cessed: 2017-6-5.
[139] Trend Micro, “Fighterpos a new one-man pos malware cam-
paign,” https://www.trendmicro.com/vinfo/us/security/news/
cybercrime-and-digital-threats/fighterpos-one-man-pos-malware-campaign/,
accessed: 2017-7-5.
128
Chapter . BIBLIOGRAPHY
[140] Z. Iqbal and Z. Anwar, “Ontology generation of advanced persistent threats and
their automated analysis,” NUST Journal of Engineering Sciences, vol. 9, no. 2, pp.
68–75, 2016.
129

Appendices
130
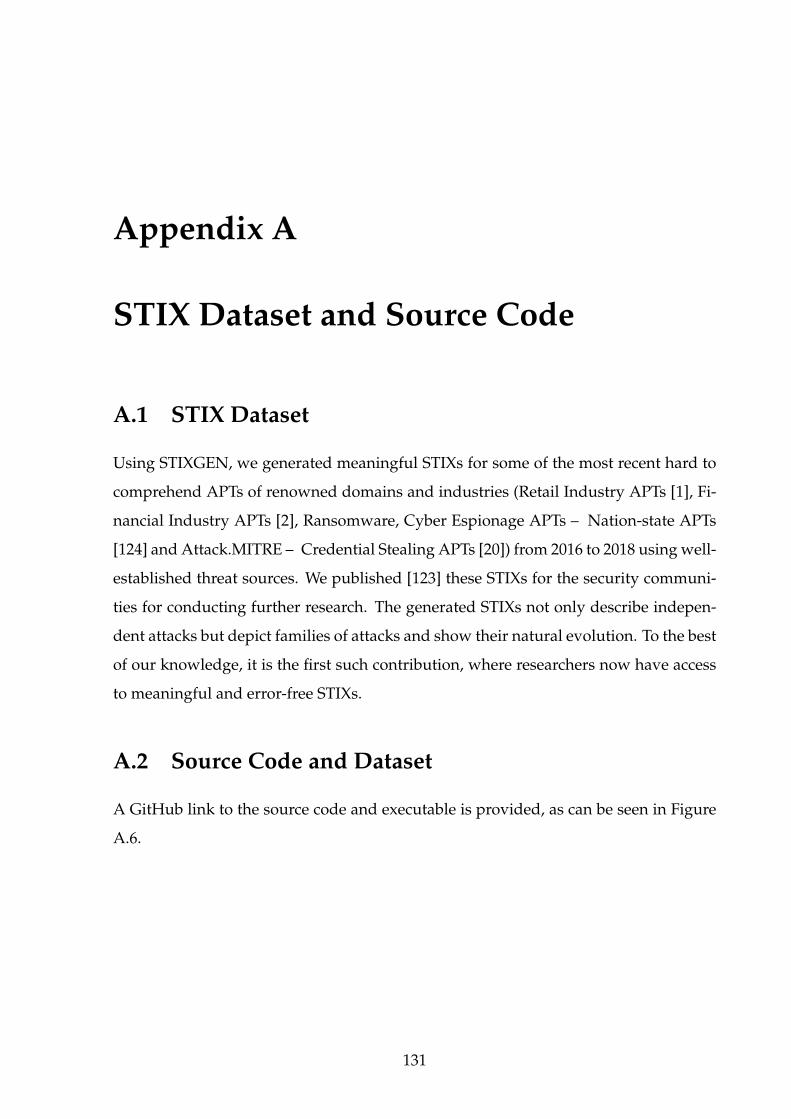
Appendix A
STIX Dataset and Source Code
A.1 STIX Dataset
Using STIXGEN, we generated meaningful STIXs for some of the most recent hard to
comprehend APTs of renowned domains and industries (Retail Industry APTs [1], Fi-
nancial Industry APTs [2], Ransomware, Cyber Espionage APTs – Nation-state APTs
[124] and Attack.MITRE – Credential Stealing APTs [20]) from 2016 to 2018 using well-
established threat sources. We published [123] these STIXs for the security communi-
ties for conducting further research. The generated STIXs not only describe indepen-
dent attacks but depict families of attacks and show their natural evolution. To the best
of our knowledge, it is the first such contribution, where researchers now have access
to meaningful and error-free STIXs.
A.2 Source Code and Dataset
A GitHub link to the source code and executable is provided, as can be seen in Figure
A.6.
131
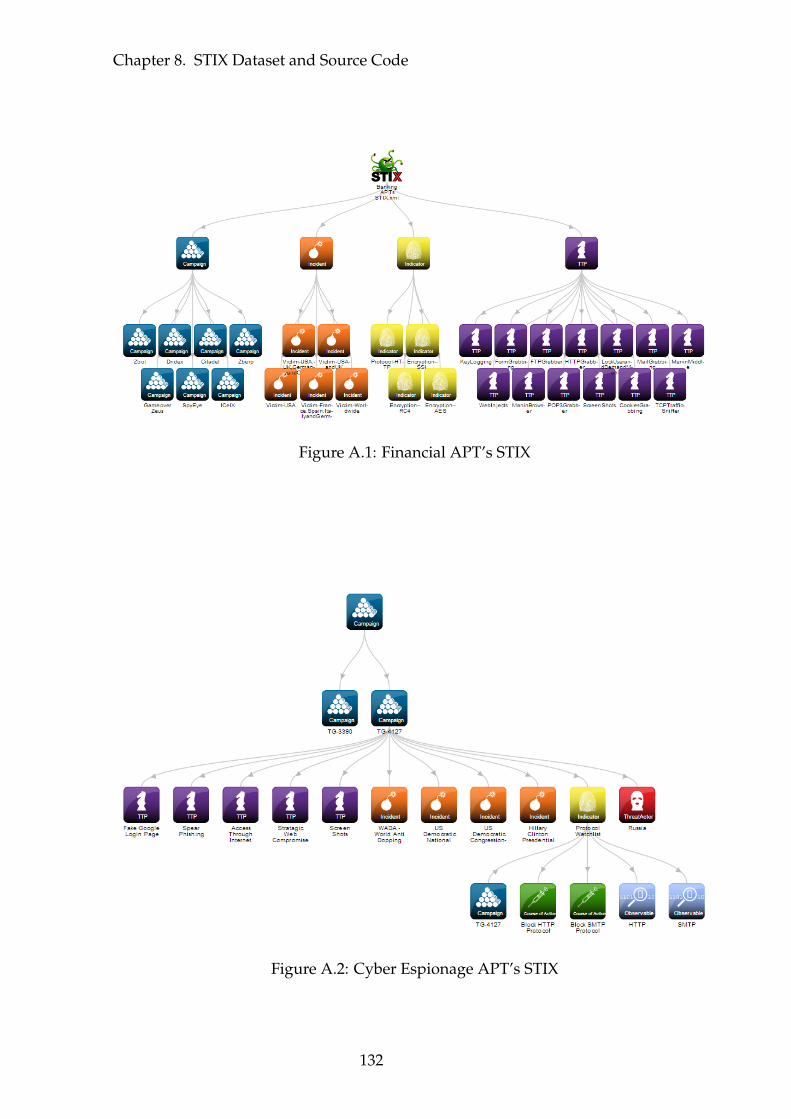
Chapter 8. STIX Dataset and Source Code
Figure A.1: Financial APT’s STIX
Figure A.2: Cyber Espionage APT’s STIX
132
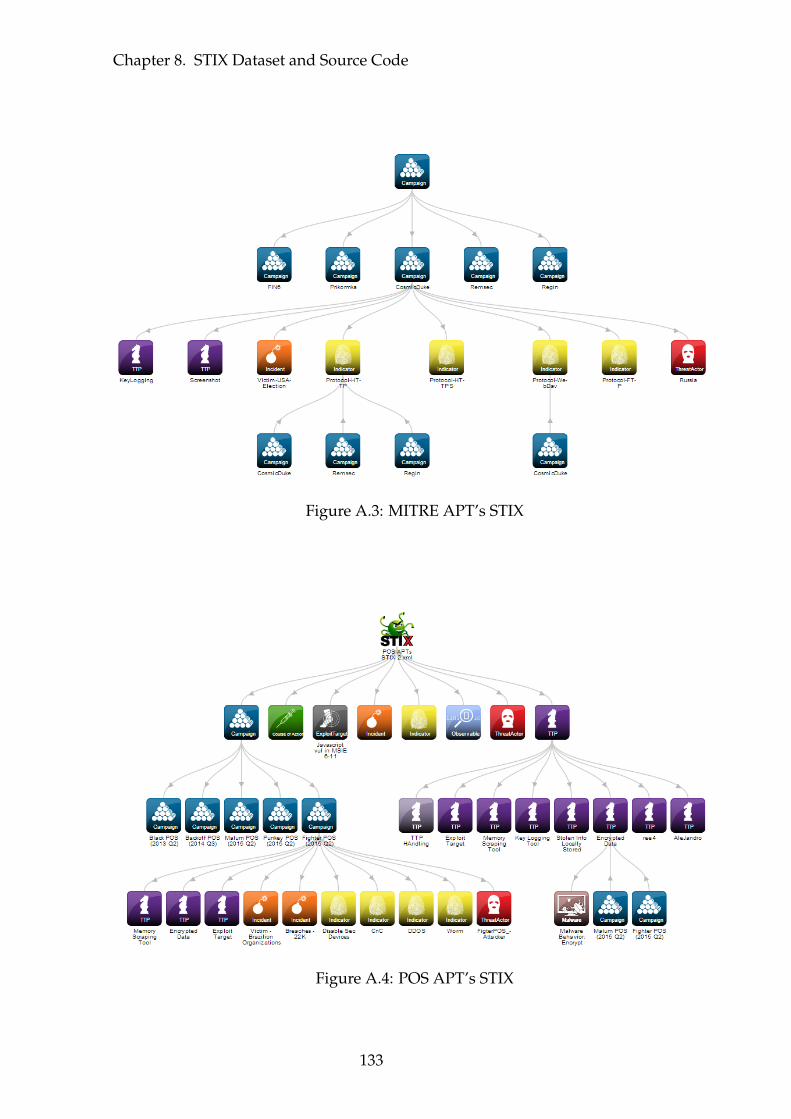
Chapter 8. STIX Dataset and Source Code
Figure A.3: MITRE APT’s STIX
Figure A.4: POS APT’s STIX
133
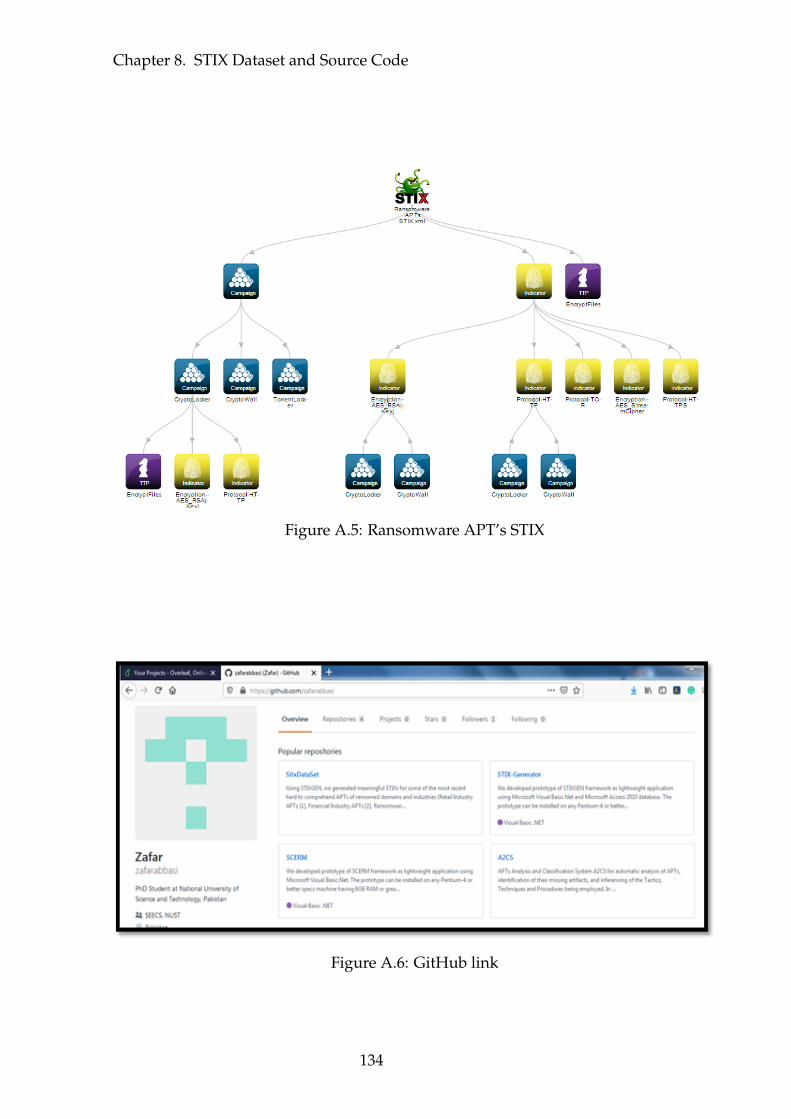
Chapter 8. STIX Dataset and Source Code
Figure A.5: Ransomware APT’s STIX
Figure A.6: GitHub link
134