Embed Size (px)
Citation preview

Managing Director – David Stevens
• Contango MicroCap Limited
1

Contango MicroCap Limited
• Portfolio
Economic outlook sound
Valuations are reasonable
• CTN now owns and controls our manager – no performance
fee to external manager
• Manager’s growth opportunities:
Institutional
• Large cap, small cap and micro cap
• Transition to retirement – low volatility equity income funds
Retail / High Net Wealth - SMSF / LIC
• Income capabilities
• Global fund
• China initiatives
Institutional relationships
2

Institutional - Australian Equities Allocations
• Larger mandates
• Fee compression
• International and Alternatives
• Industry fund owned manager
• In house capability
3

Institutional - Contango
Core Equities - Bellwether / Contango Synergies
Small / MicroCap - High Alpha remains attractive and fee resilient
Transition to retirement - Ex-30 Income Fund gaining traction
4

Listed Closed End Capacity - Contango
• 10 Year market leading performance
• Internalised vehicle capable of generating shareholder cross
ownership
• Shareholder base grown to 5,427
• Strong capabilities in sectors in demand
– (Micro’s, Income, International)
• Emerging brand recognition
5

Contango - Income Capability
Why now is a good time
• Aging demographic needs income
• Ex 30 excludes 4 Banks, Telstra, Woolworths, Coles
• Ex 30 – 37% of index – a source of equity income generally not
being accessed by Institutions
• Low volatility share investments with strong yields
• Low correlation to the business cycle
• Up to 50% cash
• Outperformed in 7 out of 7 down months
6

7
Performance and reduced volatility
Gross Returns before fees, charges and tax. Past performance is no guide to future performance. At 30.09.14
3m 6m 1 Year 1.5 Yr (% pa)
3 Yrs (% pa)
5 Yrs (% pa)
Contango Income Generator Fund 0.9 3.8 12.5 14.0 22.7 13.3
Contango Ex 30 Income Fund 1.7 12.5 17.5 18.2 - -
ASX All Ords Accum -0.3 0.2 5.9 8.7 14.0 6.7
ASX300 Industrials Accum -0.1 1.2 7.9 10.8

Contango Global Value Fund of Funds
8
Morningstar Australia Institutional Sector Survey
30 September 2014
Global Equity Quartile Rankings*
1 Year
%
3 Years
(% p.a)
5 Years
(% p.a)
Contango Global Value 20.6 31.8 19.1
Top Quartile 21.7 24.0 12.6
Median 19.3 22.5 11.5
Bottom Quartile 17.7 20.6 10.6
* MSCI World Ex Australia AUD
Past performance is no guide to future performance. (Contango is not in this survey)

Portfolio Manager – Bill Laister
• Economic Overview
• Review of MicroCap Portfolio
9

Global economic growth to continue grinding higher into
next year
• Driven mostly by the recovery in the US economy
– Financial conditions still very accommodative despite end of QE
– Payroll growth to support spending,
– Profitability to support investment
• Global growth ex-US is lacklustre
– Growth in Europe and Japan weak
– Growth in China strong, but should continue to moderate with rebalancing of
economy
• Domestically, headline growth solid but components mixed
– Real GDP growth strong on booming export volumes
– But domestic demand weak and nominal economy under pressure from falling
commodity prices
– Lower AUD and record low interest rates to support
• Global interest rates will remain low despite end of QE
– Falling oil prices increasing global risk of deflation
– US labour market has spare capacity, expect only gradual Fed rate rises
– ECB and BoJ policy to remain highly accommodative

Slack in US labour market will help keep global interest
rates low
11
Nov-84 Nov-90 Oct-96 Nov-02 Oct-08 Nov-14
10
15
20
25
30
35
40
45
31.90
Share of long term unemployed (>27 weeks)
Nov-84 Nov-90 Oct-96 Nov-02 Oct-08 Nov-14
63
64
65
66
67
62.70
Participation rate
Nov-94 Nov-98 Nov-02 Nov-06 Nov-10 Nov-146
8
10
12
14
16
18
11.80
Underemployment rate
Nov-99 Oct-02 Nov-05 Oct-08 Nov-11 Nov-14
1.5
2
2.5
3
3.5
4
4.5
1.80
3.30
Quit and Hire rates
Quits Rate Hire Rate

Despite recent volatility, the low interest rate environment
will continue to support equity markets and risk assets
• Global equity markets will continue grinding higher
– Low interest rates, recovering US economy
– Equity market expected returns still attractive versus bonds and cash
• But we expect some increased volatility
– Corrections are a normal part of markets, prevents price bubbles
– However, we do not expect a significant correction with interest rates at
such low levels
• Domestic equity market to follow global markets higher
– Earnings set to improve in Australia on lower AUD
• Microcaps remain an attractive asset class
– Low interest rates will support risk assets
– Sector offers superior earnings growth and higher return opportunities
through alpha generation
– Undiscovered ‘gems’, disruptive business models, industries of the future
12

Domestic earnings growth will be supported by lower AUD
Oct-99 Oct-03 Oct-07 Oct-11 Nov-15-5
0
5
10
15
20
25
30
-30
-20
-10
0
10
20
30
40
7.39
5.09
ASX 300 Earnings Growth vs NAB Business Conditions
ASX 300 Industrials Earnings Grow th (1YF)
NAB Business Conditions (1Y Change, 3m lead) (LHS)
Nov-12 May-13 Nov-13 May-14 Nov-140.85
0.90
0.95
1.00
1.05
0.88
Australian Dollar

Performance (at 30/09/14)
14
1Yr
%
2 Yrs
% pa
3 Yrs
% pa
4 Yrs
% pa
5 Yrs
% pa
10 Yrs
% pa
Inception
% pa
(25/03/04)
CTN Investment Portfolio 6.9% 11.3% 9.4% 5.5% 7.2% 15.1% 16.7%
Emerging Co’s Accum. Index -1.8% -10.0% -6.7% -7.6% -4.4% 2.9% 3.1%
ASX Small Ords Accum. Index -0.1% 0.7% 1.7% -1.9% -0.3% 3.6% 4.6%
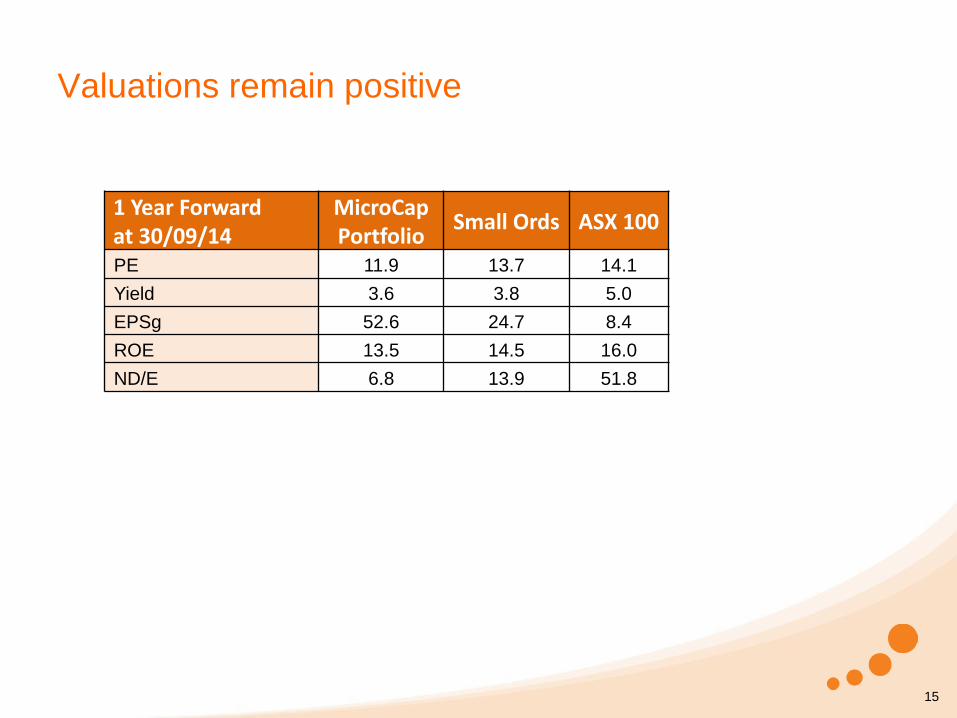
Valuations remain positive
15
1 Year Forward at 30/09/14
MicroCap Portfolio
Small Ords ASX 100
PE 11.9 13.7 14.1
Yield 3.6 3.8 5.0
EPSg 52.6 24.7 8.4
ROE 13.5 14.5 16.0
ND/E 6.8 13.9 51.8

Placements & IPOs – September Quarter
16
MicroCap Fund MicroCap Fund Placements - September Qtr 2014 IPO's - September Qtr 2014
AEK Anatolia Energy Limited ENN Elanor Investors Group
MLD MACA Limited ASH Ashley Services Group
Limited
EPD Empired Limited OTC OTOC Limited

Getting sector calls right
17

Top 20 Stocks (at 30/09/14)
18
Code Stock Position Code Stock Position
SGH Slater & Gordon Limited 4.0% BTT BT Investment Mgmt 2.3%
AFJ Affinity Education Grp 3.2% PRT Prime Media Group 2.3%
VLW Villa World 3.0% AUB Austbrokers Holdings 2.3%
GBT GBST Holdings 2.9% CWP Cedar Woods Properties 2.2%
IPP Iproperty Group 2.6% PMP PMP 2.1%
AHE Automotive Hldgs Grp 2.6% EPW ERM Power 2.0%
TGS Tiger Resources 2.6% SGF SG Fleet Group 2.0%
VRL Village Roadshow 2.5% EGG Enero Group 1.9%
ASB Austal 2.4% IFM Infomedia Ltd 1.8%
MYX Mayne Pharma Group 2.4% OKN Oakton 1.8%
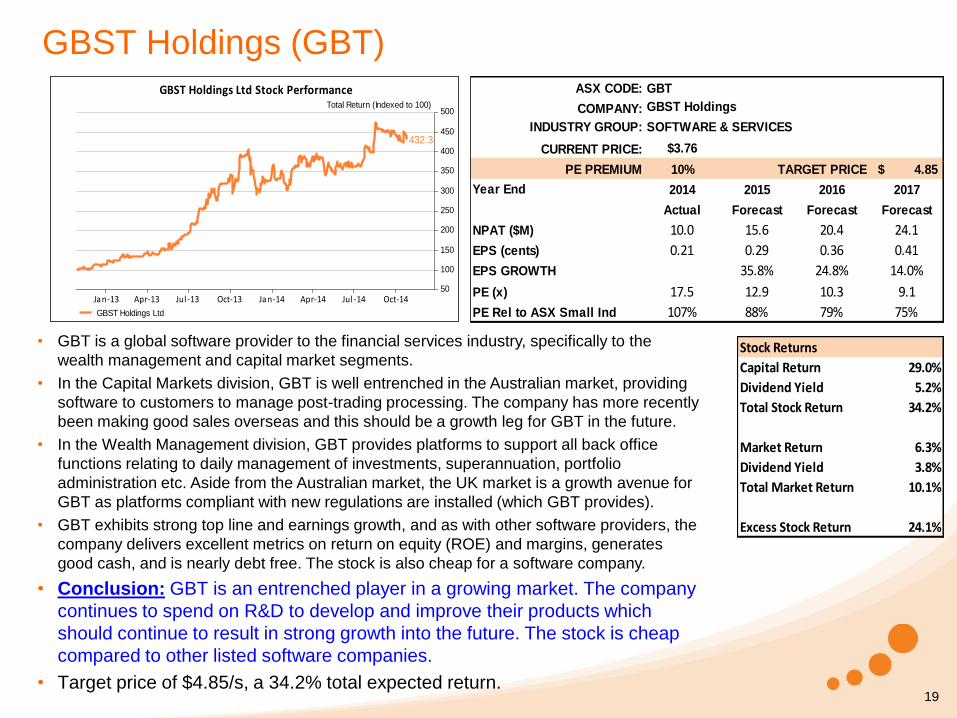
GBST Holdings (GBT)
19
• GBT is a global software provider to the financial services industry, specifically to the
wealth management and capital market segments.
• In the Capital Markets division, GBT is well entrenched in the Australian market, providing
software to customers to manage post-trading processing. The company has more recently
been making good sales overseas and this should be a growth leg for GBT in the future.
• In the Wealth Management division, GBT provides platforms to support all back office
functions relating to daily management of investments, superannuation, portfolio
administration etc. Aside from the Australian market, the UK market is a growth avenue for
GBT as platforms compliant with new regulations are installed (which GBT provides).
• GBT exhibits strong top line and earnings growth, and as with other software providers, the
company delivers excellent metrics on return on equity (ROE) and margins, generates
good cash, and is nearly debt free. The stock is also cheap for a software company.
• Conclusion: GBT is an entrenched player in a growing market. The company
continues to spend on R&D to develop and improve their products which
should continue to result in strong growth into the future. The stock is cheap
compared to other listed software companies.
• Target price of $4.85/s, a 34.2% total expected return.
Stock Returns
Capital Return 29.0%
Dividend Yield 5.2%
Total Stock Return 34.2%
Market Return 6.3%
Dividend Yield 3.8%
Total Market Return 10.1%
Excess Stock Return 24.1%
ASX CODE: GBT
COMPANY: GBST Holdings
INDUSTRY GROUP: SOFTWARE & SERVICES
CURRENT PRICE: $3.76
PE PREMIUM 10% TARGET PRICE 4.85$
2014 2015 2016 2017
Actual Forecast Forecast Forecast
NPAT ($M) 10.0 15.6 20.4 24.1
EPS (cents) 0.21 0.29 0.36 0.41
EPS GROWTH 35.8% 24.8% 14.0%
PE (x) 17.5 12.9 10.3 9.1
PE Rel to ASX Small Ind 107% 88% 79% 75%
Year End
Jan-13 Apr-13 Jul -13 Oct-13 Jan-14 Apr-14 Jul -14 Oct-1450
100
150
200
250
300
350
400
450
500
432.3
GBST Holdings Ltd Stock PerformanceTotal Return (Indexed to 100)
GBST Holdings Ltd

Affinity Education Group (AFJ)
20
• AFJ operates child care centres in Australia, having formed in late 2013 when it listed. The
group has 128 child care centres across several states.
• The company is exposed to strong underlying demand for its services due to factors such
as increased participation of women in the workforce.
• Industry is extremely positive. The child care market is forecast to grow at 5% p.a. in
revenue over the next 5 years and enjoys a high level of government support.
• AFJ is growing via acquisitions. A clear strategy exists of acquiring centres cheaply in a
highly fragmented market, while ensuring that debt levels are managed.
• Earnings risk is to the upside in forecast years as they convert their pipeline of
opportunities.
• We expect AFJ to enjoy similar success as GEM (listed peer and competitor), and
gradually re-rate towards GEM’s multiple as AFJ demonstrates successful execution.
• Conclusion: AFJ operates in a very positive and supportive industry which
isn’t overly cyclical, while trading at a substantial discount to the market and
listed competitor GEM. We expect strong delivery growth in earnings over the
coming 12 months which should result in a re-rate of the stock.
• Target price of $2.10/s, a 67.2% total expected return.
Stock Returns
Capital Return 61.5%
Dividend Yield 5.7%
Total Stock Return 67.2%
Market Return 6.3%
Dividend Yield 3.8%
Total Market Return 10.1%
Excess Stock Return 57.1%
ASX CODE: AFJ
COMPANY: Affinity Education Group
INDUSTRY GROUP: CONSUMER SERVICES
CURRENT PRICE: $1.30
PE PREMIUM 10% TARGET PRICE 2.10$
2014 2015 2016 2017
Forecast Forecast Forecast Forecast
NPAT ($M) 14.5 24.3 29.3 35.0
EPS (cents) 0.10 0.14 0.17 0.21
EPS GROWTH 48.3% 20.5% 19.7%
PE (x) 13.3 9.0 7.4 6.2
PE Rel to ASX Small Ind 81% 62% 57% 52%
Year End
Nov-13 Jan-14 Mar-14 May-14 Jul -14 Sep-1490
100
110
120
130
140
150
134.5
Affinity Education Group Ltd. Stock PerformanceTotal Return (Indexed to 100)
Affinity Education Group Ltd.

Villa World (VLW)
21
• VLW is an Australian residential property developer with a focus on affordable housing
in the sub-$500k price range in major metropolitan areas on the east coast.
• VLW specialises in development and construction of 3-4 bedroom detached homes,
integrated housing solutions (for example 2-3 story joined townhouses) and the sub-
division and sale of land lots.
• VLW sells houses and land in blocks of 10-15 (to individual buyers), and then builds
them in parallel (i.e. lay all the slabs together, construct all the frames together, and so
on). This saves time and money, and increases product quality.
• Geographically their overweight QLD exposure (>80%) is a positive in the current
environment, given the strong momentum in QLD housing following a lagged recovery
compared to other States.
• VLW is cheap on 7.8x FY15 earnings, with 10% CAGR growth over three years to
FY17, and an 8.7% FY15 dividend yield.
• Conclusion: VLW is a well-run residential developer with macro tailwinds,
a strong earnings growth profile, and is trading cheaply on 7.8x earnings.
• Target price of $2.61/s, a 47.4% total expected return.
Jan-13 Apr-13 Jul -13 Oct-13 Jan-14 Apr-14 Jul -14 Oct-1450
100
150
200
250
300
350
255.5
Villa World Limited Stock PerformanceTotal Return (Indexed to 100)
Villa World Limited
ASX CODE: VLW
COMPANY: Villa World
INDUSTRY GROUP: REAL ESTATE
CURRENT PRICE: $1.89
PE PREMIUM -25% TARGET PRICE 2.61$
2014 2015 2016 2017
Actual Forecast Forecast Forecast
NPAT ($M) 19.1 22.6 24.8 27.0
EPS (cents) 0.22 0.24 0.26 0.29
EPS GROWTH 10.7% 9.6% 9.1%
PE (x) 8.7 7.8 7.1 6.6
PE Rel to ASX Small Ind 58% 51% 53% 54%
Year End
Stock Returns
Capital Return 38.3%
Dividend Yield 9.1%
Total Stock Return 47.4%
Market Return 6.3%
Dividend Yield 3.8%
Total Market Return 10.1%
Excess Stock Return 37.3%

Elanor Investors Group (ENN)
22
Nov-13 Jan-14 Mar-14 May-14 Jul -14 Sep-1498
100
102
104
106
108
110
112
114
105.5
Elanor Investors Group Stock PerformanceTotal Return (Indexed to 100)
Elanor Investors Group
ASX CODE: ENN
COMPANY: Elanor Investors Group
INDUSTRY GROUP: DIVERSIFIED FINANCIALS
CURRENT PRICE: $1.35
NPV PREMIUM -10% TARGET PRICE 1.68$
2015 2016 2017
Forecast Forecast Forecast
NPAT ($M) 7.9 8.5 9.1
EPS (cents) 0.13 0.14 0.15
EPS GROWTH 7.9% 6.5%
PE (x) 9.6 8.9 8.4
PE Rel to ASX Small Ind 69% 70% 70%
Year End
• ENN is an investment and funds management business focusing on assets and
operating businesses that deliver sustainable cash flows with potential for
development or restructure.
• Quality management team with an impressive track record established pre-IPO
(under the pre-IPO privately owned Moss Capital entity, which was co-founded by
Bill Moss and Glenn Willis in early 2009).
• Potential for a substantial increase in funds under management as management
focus on their key objective to roll out syndicates and wholesale funds.
• Valuation upside to assets held on balance sheet – given conservative book
values, management’s ability to enhance operating performance of assets, and
likely execution of developments.
• Strong balance sheet, with a 27% gearing level (debt / equity).
• ENN is cheap, trading on a 9.6x FY15 PE and an 8.7% dividend yield.
• Conclusion: ENN has quality management with an impressive track
record, upside potential at the asset level, upside potential in funds
under management, a solid balance sheet, and is cheap.
• Target price of $1.68/s, a 44.0% total expected return.
Stock Returns
Capital Return 34.4%
Dividend Yield 9.6%
Total Stock Return 44.0%
Market Return 6.3%
Dividend Yield 3.8%
Total Market Return 10.1%
Excess Stock Return 33.9%

23
Contact Boyd Peters National Distribution Manager Contango MicroCap Ltd (ASX: CTN)
Add: Level 27, 35 Collins St, Melbourne, Vic 3000 Ph: 03 9222 2333 Dir: 03 9222 2329 M: 0459 233 600 E: [email protected] W: www.contango.com.au
Disclaimer: Contango MicroCap Limited, its related entities and each of their respective directors, officers and agents (together “the
Disclosers”) have prepared the information contained in these materials in good faith. The information provided, including any expression of
opinion, has been obtained from or is based upon sources believed to be reliable, but has not in any way been independently verified.
No warranty (express or implied) is made as to the accuracy, completeness or reliability of any statements, estimates, or opinions or other
information contained in these materials (any of which may change without notice) and to the maximum extent permitted by law, the Disclosers
disclaim all liability and responsibility (including, without limitation, and liability arising from fault or negligence on the part of any or all of the
Disclosers), for any direct or indirect loss or damage which may be suffered by any recipient through relying on anything contained in or omitted
from these materials.
Forecasts in this presentation are predictive in character, based on numerous assumptions including the forecasted outlook for key variables
and may be affected by various factors including inaccurate assumptions, risk and unforeseen events. Accordingly, actual results may differ
materially from those forecasted.
Performance information where provided is historical. Performance returns may vary. Past performance is not indicative of future performance.
Any reader is strongly advised to make their own enquiries and seek independent professional advice regarding information contained in these
materials.
These materials have been prepared solely for the purpose of information and do not constitute, nor are they intended to constitute advice nor
an offer or invitation to any person to subscribe for, buy or sell any shares or any other securities.
![BMBX Presentation - Copy.pptx [Read-Only]...2nd Qtr 2014 3rd Qtr 2014 4th Qtr 2014 1st Qtr 2015 2nd Qtr 2015 3rd Qtr 2015 Patients who developed issues requiring emergency care of](https://img.pdfslide.net/doc/110x75/5f23ef5e2f86d60d687ef19d/bmbx-presentation-copypptx-read-only-2nd-qtr-2014-3rd-qtr-2014-4th-qtr.jpg)


![Item-06-AI0000030418€¦ · ^E Á } v µ ] } v _ µ ] o ] v P W u ] Data 1st Qtr 2016 2nd Qtr 2016 3rd Qtr 2016 4th Qtr 2016 1st Qtr 2017 Permits $ Value Permits $ Value Permits](https://img.pdfslide.net/doc/110x75/5fcb107d1e181d01d75aae23/item-06-ai0000030418-e-v-v-o-v-p-w-u-data-1st-qtr-2016-2nd.jpg)