Embed Size (px)
Citation preview


4 MANAGED CARE / MAY 2016
M A N A G I N G E D I T O R ’ S M E M O
Code Puts More Diabetes Care Into Hands of Engaged PatientsBy Frank Diamond
EditorPeter [email protected]
Managing EditorFrank [email protected]
Senior Contributing EditorsMichael D. DalzellTimothy Kelley
Contributing EditorsJoseph BurnsThomas Reinke
Design DirectorPhilip Denlinger
DesignerKevin Riley
PresidentLee Termini(267) [email protected]
VP, Group PublisherMaureen Dwyer Liberti(267) [email protected]
Director of Production ServicesDawn Flook(267) [email protected]
Circulation ManagerJacquelyn Ott(267) [email protected]
MANAGED CARE is indexed in PubMed and in Scopus.
The full contents of each issue are available free at
www.ManagedCareMag.com
Major articles are reviewed by appropriate
members of the editorial advisory board and/
or other qualified experts. Opinions are those
of the authors and not necessarily those of the
institutions that employ the authors, nor of the
publisher, editor, or editorial advisory board of
MANAGED CARE.
A worried parent guarantees patient engagement (at least by proxy). That’s what started the Nightscout Project, a mobile technology system. As noted in a viewpoint piece by Joyce M. Lee (lead author), Emily
Hirschfeld, and James Wedding in the April 12 edition of JAMA, a 4-year-old boy with type 1 diabetes began wearing a continuous glucose monitoring system in February 2013. He was about to start school; his parents wanted readings every five minutes. The father, a software programmer, developed a computer code that allowed him to monitor glucose readings remotely via some ingenious cloud computing.
The father, who is not named, sent out a Twitter announcement about what he’d done. As you might expect, other worried parents and patients took notice. The father shared the code with a growing online community, which began adapting it for new uses and innovations, such as a smartphone alert for glucose levels and portals allowing caregivers to enter other data like insulin doses and carbohydrate levels. The group also created a Facebook page.
Diabetes and its kid brother, prediabetes, are conditions that respond to the engaged patient who eats right, works to keep the extra pounds off, and is physically active. And now there is a menagerie of devices that can help. There’s growing hope that this long-joined fight can be won. That’s what this entire issue of Managed Care is about. This really could be the industry’s big success story, but it won’t happen from the top down.
In a blog discussion, Lee, a physician at the University of Michigan, encouraged stakeholders to “embrace not only new technologies (mobile technology and social media) but a new participatory culture [that] welcomes patients as partners for achieving innovation and transformation inside the health care ecosystem.”
Stakeholders? What say you?
Clinical judgment must guide each clinician in weighing the benefits of treatment against the risk of toxicity. Dosages, indications, and meth-
ods of use for products referred to in this publication may reflect the professional literature or other clinical sources, or may reflect the clinical
experience of the authors, and might not be the same as what is on the approved package insert. Please consult the complete prescribing
information for any products mentioned in this publication. MMMM Group LLC assumes no liability for the information published herein.
MANAGED CARE (ISSN 1062-3388) is published monthly by MMMM Group LLC, an ICON Plc company, at 780 Township Line Road, Yardley, PA
19067. This is Volume 25, Issue 5. Send letters to the editor to Frank Diamond by email, [email protected], or by mail to MANAGED CARE, 780 Township Line Road, Yardley, PA 19067. Letters may be edited for length and clarity.
Copyright 2016 by MMMM Group LLC. All rights reserved under the United States, International, and Pan-American copyright conventions.
No part of this publication may be reproduced, stored in a retrieval system, or transmitted in any form or by any means, mechanical, photo-
copying, electronic, or otherwise, without the prior written permission of MMMM Group LLC. The copyright law of the United States governs
the making of photocopies or other reproductions of copyrighted material.
Subscriptions for individuals or institutions in the U.S.A. are $100 per year, $10 per single copy; elsewhere, $120 per year, $22 per single copy.
Inquiries about paid subscriptions: Dawn Flook, telephone (267) 685-3422; email: [email protected].
Postmaster: Send address changes to MANAGED CARE, PO Box 2019, Morrisville, PA 19067. Periodicals postage paid at Morrisville, Pa., and at
additional mailing offices.
CONTACT E-MAIL ADDRESSES:Editorial: [email protected]: [email protected]: [email protected]: [email protected]

Ocularsurfacestress
Tear filminstability
InflammationOcular surfacedamage
These substances initiate an infl ammatory process, attracting T cells to the ocular surface tissues.14 T-cell recruitment and activation are characteristic of DED infl ammation.13
OSS and infl ammation lead to an abnormal tear fi lm characterized by instability.8
The DED cycle includes ocular surface stress (OSS), which occurs when a stimulus triggers ocular surface infl ammation and the increased production of infl ammatory mediators, such as intercellular adhesion molecule-1 (ICAM-1).14
Infi ltration of cytokines promotes damage to ocular surface tissues, further stressing the ocular surface and perpetuating the cycle.5,14
New Insights into Dry Eye Disease
Inflammation plays a prominent role in the development and self-perpetuating cycle of dry eye disease12,13
References: 1. US Census Data. Age and sex composition in the United States: 2012. https://www.census.gov/population/age/data/2012comp.html. Accessed December 9, 2015. 2. Paulsen AJ, Cruickshanks KJ, Fischer ME, et al. Dry eye in the beaver dam offspring study: prevalence, risk factors, and health-related quality of life. Am J Ophthalmol. 2014;157(4):799-806. 3. Shire Data on File SHP606-008. 4. American Academy of Ophthalmology (AAO) Corneal/Eternal Disease Panel. Preferred Practice Pattern. (PPP) Guidelines. Dry eye syndrome. http://www.aao.org/preferred-practice-pattern/dry-eye-syndrome-ppp—2013. Accessed January 20, 2016. 5. Baudouin C, Aragona P, Van Setten G, et al. Diagnosing the severity of dry eye: a clear and practical algorithm. Br J Ophthalmol. 2014;98(9):1168-1176. 6. Schein OD, Munoz B, Tielsch JM, Bandeen-Roche K, West S. Prevalence of dry eye among the elderly. Am J Ophthalmol. 1997;124(6):723-728. 7. DEWS Research Subcommittee. The defi nition and classifi cation of dry eye disease: report of the Defi nition and Classifi cation Subcommittee of the International WorkShop (2007). Ocul Surf. 2007;5(2):75-92. 8. Stern ME, Schaumburg CS, Pfl ugfelder SC. Dry eye as a mucosal autoimmune disease. Int Rev Immunol. 2013;32(1):19-41. 9. Schaumberg DA, Uchino M, Christen WG, et al. Patient reported differences in dry eye disease between men and women: impact, management, and patient satisfaction. PLoS ONE. 2013;8(9):e76121. 10. Barabino S, Chen Y, Chauhan S, Dana R. Ocular surface immunity: homeostatic mechanisms and their disruption in dry eye disease. Prog Retin Eye Res. 2012;32(3):271-285. 11. Lemp MA, Crews LA, Bron AJ, Foulks GN, Sullivan BD. Distribution of aqueous-defi cient and evaporative dry eye in a clinic-based patient cohort: a retrospective study. Cornea. 2012;31(5):472-478. 12. Pfl ugfelder SC, Corrales RM, de Paiva CS. T helper cytokines in dry eye disease. Exp Eye Res. 2013;117:118-125. 13. Stevenson W, Chauhan SK, Dana R. Dry eye disease: an immune-mediated ocular surface disorder. Arch Ophthalmol. 2012;130(1):90-100. 14. Stern ME, Pfl ugfelder SC. Dry eye: an immune-based infl ammation. In: Dartt DA, Bex P, D’Amore P, Dana R, McLoon LK, Niederkorn JY, eds. Ocular Periphery and Disorders. San Diego, CA: Academic Press; 2010:381-389.
ADVERT ISEMENT
©2016 Shire US Inc., Lexington, MA 02421 S10980 2/16
Dry eye disease (DED) is a growing public health concern. Twenty-nine million adults in the US have reported symptoms associated with DED.1,2 Approximately 16.4 million adults (6.8%) in the US are diagnosed with DED, and the number is expected to increase.3 DED is often chronic, can be progressive, and is a very common complaint presenting to eye care professionals today.4-6 This multifactorial disease can result in symptoms of discomfort, visual disturbance, and tear fi lm instability with potential damage to the surface of the eye.7 In addition to traditional risk factors such as age, female sex, and hormone changes, modern risk factors such as prolonged screen time, contact lenses, and LASIK can increase the risk of DED in both commercial and Medicare members.4,8-10
Our changing understanding of DED
Once considered to be the result of reduced tear volume, we now know DED is most often the result of abnormal tear composition.8 It is estimated that ~10% of DED is purely due to a defi cit in tear production.11 Increased tear evaporation, decreased tear production, and/or decreased blink rate can alter tear composition, promoting infl ammation on the surface of the eye.12 This infl ammation is now recognized as both a cause and consequence of DED, playing a prominent role in the self-perpetuating cycle of the disease (Figure).4,12,13
A commitment to ophthalmics and DED
In May 2014, Shire established its Ophthalmics Business Unit, solidifying its commitment to growing in this therapeutic area. Shire’s multi-faceted approach to discovery, development, and delivery in both rare diseases and specialty conditions includes our efforts to address unmet needs in eye care, such as DED. In addition to DED, Shire’s ophthalmic pipeline includes investigational candidates in infectious conjunctivitis, retinopathy of prematurity, autosomal dominant retinitis pigmentosa, and glaucoma.

CO U L D D I A B E T E S B E M A N A G E D C A R E ’S B I G C H A N C E?
Cornering Diabetes 14With incidence and complications trending downward, this might be man-aged care’s time to seize the momentum against a costly disease.
Medicaid Braces for Infl ux of Diabetes Patients 23Costs might spike initially. But there’s also the opportunity to avoidfuture complications, helping patients and budgets.
Prediabetes Pilot Lands CMS Expansion 26A demonstration project at 17 YMCAs scored high enough in quality improvement and cost containment to merit a nationwide extension.
Diabetes Self-Management Goes High-Tech 30Employers like what they see in new digital health care tools that aim to get patients engaged.
Point–Counterpoint on Wellness Programs 32Al Lewis, a vociferous critic of such programs, and Harris Allen, a deter-mined defender, lay out opposing arguments.
Prediabetes: A Review 35Categorizing people as having prediabetes could lead to overtreatmentand added expense. Diet and exercise beat medication at this stage.
O R I G I N A L R E S E A R C H
Less Invasive GERD Treatment Saves Money 42Radiofrequency energy can more eff ectively manage patients with the condi-tion under value-based care arrangements.
DEPARTMENTS
Vol. 25, No. 5May 2016
The digital edition does not contain some of the advertising pages that appear in the print edition.
COVER: GETTY IMAGES
Webwww.managedcaremag.com
Digital Editionwww.managedcaremag.com/digital
Managing Editor’s Memo ...................4Patient initiative scores against diabetes. News & Commentary ............................7Diabetes not just a rich-country problem. Legislation & Regulation ................. 12Drug importation now an election issue. Plan Watch .............................................. 25Blues dealing with ACA challenges.
Tomorrow’s Medicine ........................ 28Startup hopes to sell diabetes prevention.
Ad Index .................................................. 29
Viewpoint ............................................... 34Managing diabetes by the population.
Formulary Files .................................... 51Rebates, coupons aplenty for diabetes.
23
Kenneth Thorpe
Sabra Matovsky
Edward McEachern, MD
14
26
5.3% 7.3%
33m 64m
Europe
4.4%
29m
WePa
4.1% 8.6%
17m 96m
Southeast Asia
5.9%13.7%
6m 43m
Eastern Mediterranean
3.1% 7.1%
Africa
7
N E W S & C O M M E N TA R Y
MAY 2016 / MANAGED CARE 7
hand with this shocker: The number of people living in extreme poverty (less than the equivalent of $1.90 a day) dipped to 10% last year for the first time in human history, according to the World Bank. And—get this—poverty might actually end by 2030.
Yet every silver lining has its cloud, and the quarter-century march that just might end world hunger not only spreads the wealth but also ill health, in this case in the form of problems that come from eating more poorly.
Diabetes, a once-near exclusive first world problem, now dispro-portionately affects poorer parts of the planet, according to WHO in its Global Report on Diabetes published in April. That this is the organiza-tion’s first such study of the problem
can be taken as an indicator of just how much diabetes has grown as a worldwide problem.
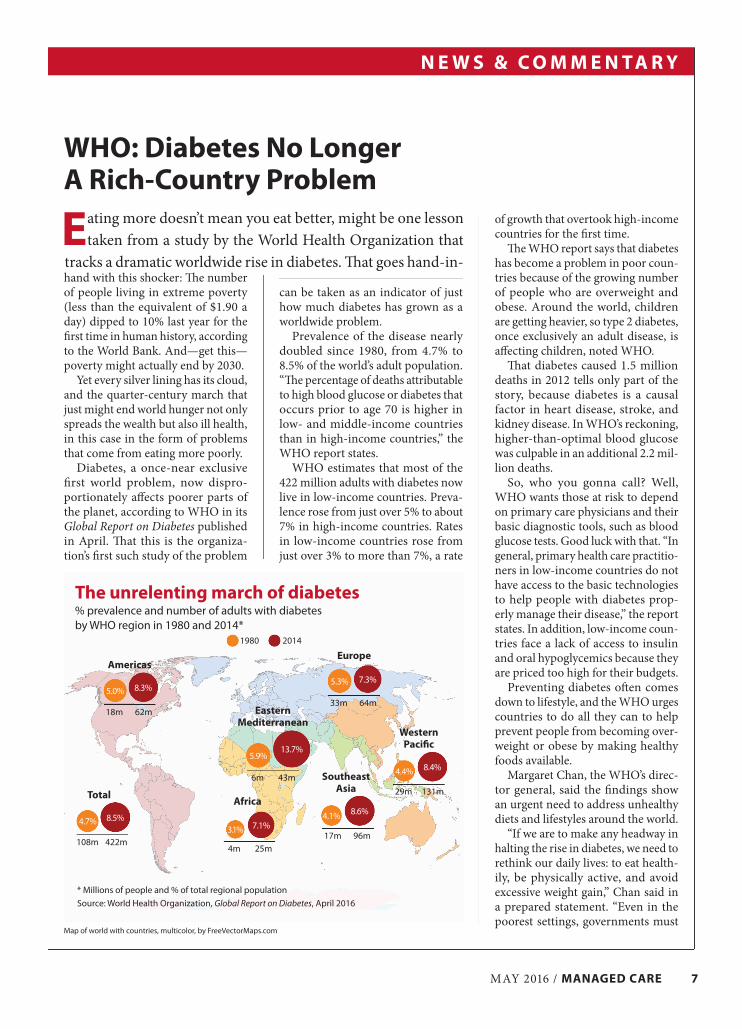
Prevalence of the disease nearly doubled since 1980, from 4.7% to 8.5% of the world’s adult population. “The percentage of deaths attributable to high blood glucose or diabetes that occurs prior to age 70 is higher in low- and middle-income countries than in high-income countries,” the WHO report states.
WHO estimates that most of the 422 million adults with diabetes now live in low-income countries. Preva-lence rose from just over 5% to about 7% in high-income countries. Rates in low-income countries rose from just over 3% to more than 7%, a rate
of growth that overtook high-income countries for the first time.
The WHO report says that diabetes has become a problem in poor coun-tries because of the growing number of people who are overweight and obese. Around the world, children are getting heavier, so type 2 diabetes, once exclusively an adult disease, is affecting children, noted WHO.
That diabetes caused 1.5 million deaths in 2012 tells only part of the story, because diabetes is a causal factor in heart disease, stroke, and kidney disease. In WHO’s reckoning, higher-than-optimal blood glucose was culpable in an additional 2.2 mil-lion deaths.
So, who you gonna call? Well, WHO wants those at risk to depend on primary care physicians and their basic diagnostic tools, such as blood glucose tests. Good luck with that. “In general, primary health care practitio-ners in low-income countries do not have access to the basic technologies to help people with diabetes prop-erly manage their disease,” the report states. In addition, low-income coun-tries face a lack of access to insulin and oral hypoglycemics because they are priced too high for their budgets.
Preventing diabetes often comes down to lifestyle, and the WHO urges countries to do all they can to help prevent people from becoming over-weight or obese by making healthy foods available.
Margaret Chan, the WHO’s direc-tor general, said the findings show an urgent need to address unhealthy diets and lifestyles around the world.
“If we are to make any headway in halting the rise in diabetes, we need to rethink our daily lives: to eat health-ily, be physically active, and avoid excessive weight gain,” Chan said in a prepared statement. “Even in the poorest settings, governments must
WHO: Diabetes No Longer A Rich-Country Problem
Eating more doesn’t mean you eat better, might be one lesson taken from a study by the World Health Organization that
tracks a dramatic worldwide rise in diabetes. That goes hand-in-
Map of world with countries, multicolor, by FreeVectorMaps.com
5.0% 8.3%
18m 62m
Americas
5.3% 7.3%
33m 64m
Europe
4.4% 8.4%
29m 131m
Western Pacific
4.1% 8.6%
17m 96m
Southeast Asia
5.9%13.7%
6m 43m
Eastern Mediterranean
3.1% 7.1%
4m 25m
Africa
4.7% 8.5%
108m 422m
Total
The unrelenting march of diabetes% prevalence and number of adults with diabetes by WHO region in 1980 and 2014*
* Millions of people and % of total regional population
Source: World Health Organization, Global Report on Diabetes, April 2016
1980 2014

N E W S & C O M M E N TA R Y
8 MANAGED CARE / MAY 2016
ensure that people are able to make these healthy choices and that health systems are able to diagnose and treat people with diabetes.”
Choice ProgramMay Shake Up VHAOne of the responses to the mess sur-rounding the Veterans Health Ad-ministration (VHA) in the last several years was a law passed by Congress in 2014 that would give veterans a chance to receive care outside of VA facilities.
Joel Kupersmith, head of the VA’s office of research and development, noted in a recent Health Affairs blog post that the effect so far of the Veter-ans Access, Choice, and Accountabil-ity Act has been small, but “the nose is in the tent, and the care of veterans may change dramatically.”
The Veterans Choice Program that the act authorized “will potentially move VHA into a distinctive role of payer, insurer, and provider of care.”
The eventual impact on non-VA providers and insurance companies (veterans’ private insurance pays first dollar in the Choice program) could be dramatic; currently about 900,000 vet-erans are eligible for community care.
There are about 9 million vets en-rolled in the VHA. Another 7 million could be enrolled but are not. Kuper-smith rattled off a series of questions: “How many of the 7 million eligible veterans who do not now use VHA will be eligible for community care? How many will turn to it if they can thereby receive care from their own physician at minimal or no cost and more easily than going to a VA Medi-cal Center? How many current VHA enrollees will increase their utiliza-tion? In addition, the cost of outsourc-ing specialty care—which is currently limited—is unknown and potentially very large.”
There are certainly things the VA can learn from health plans, Kuper-smith argues.
“The community care plan depends heavily on industry-benchmarked goals that have been elusive for the VA—streamlined and integrated ad-ministrative process and IT, prompt
authorization, billing and reimburse-ment, audits and appeals vehicles, care coordination, and medical records management.”
Employers: It’s on UsTo Tackle Care Costs When you call yourself the Health Transformation Alliance, you better bring some game. But lack of con-fidence will never be an issue with the 25 major corporations that have recently banded together in an effort to bring health care costs down.
Verizon, American Express, Macy’s and other members provide coverage for some 4 million people, and they plan to share data about spending and outcomes in the hopes that pooled information might be able to stabilize costs. Most big companies self-insure, and alliance members want to build a firewall against rising care and medi-cation costs. They came together in February and, last month, appointed Glenn Steele, MD, the former CEO of Geisinger Health System, as the alliance’s vice chairman.
“Employers are the ‘sleeping giant’ in health care because, if they act to-gether, they can successfully deliver
higher quality results at better costs for employees,” Steele said in an alliance press release.
Sally Pipes, president of the Pacific Research Institute, a California-based think tank, calls the alliance a “worth-while experiment” in which members could “leverage their collective pur-chasing power to negotiate better deals with health care providers.”
In an opinion piece April 4 in Forbes, Pipes wrote that government has largely failed to rein in health care costs. “The private sector will have to take matters into its own hands and find ways to creatively deploy market forces to its benefit,” Pipes wrote.
The alliance envisions a three-pronged approach. First, the companies will need to examine health care data the way they examine sales, or opera-tions data. “The hope is to determine which providers are delivering the best care at the lowest cost—and then to direct workers toward these high-performing providers,” wrote Pipes. The alliance members will also need to pool their buying power to work out better deals. And finally, they’re aiming to educate employees. Most consumers are clueless about buying health care and they may welcome a nudge from an
“I thought about escaping too, but I can’t give up the constant attention.”

N E W S & C O M M E N TA R Y
MAY 2016 / MANAGED CARE 9
Most consumers see no link between price, quality
A lot depends on how you frame the question, say researchers at the University of California–San Francisco. “For example, people are more unhappy about losing $100 than they are elated about winning $100,” they say
in a study in April’s Health Affairs. Responses by 2,010 adults to four questions about the relationship between quality and prices were analyzed. Depending on the question, between 58% and 71% did not make an association between price and health care quality. On the other hand, 21% to 24% of consumers did make that association, and researchers said that their concerns must be addressed. “If comparing prices cause people to perceive that price and quality are associated, then developers of transparency initiatives must grapple with the question of whether that perception is justified, and how to address the perception if it is justified or counter it if it is not.”
Answers vary with how the question is asked
21%
22%
23%
24%
71%
63%
67%
58%
8%
14%
9%
16%
No Yes Don’t know
employer toward a high-quality, low-cost clinic or provider, wrote Pipes, and “if it saves their bosses some money, all the better.”
Expanded Medicaid Helps Mental Health Uncle Sam isn’t giving up on states that have not expanded Medicaid under the ACA. In fact, a recent HHS report argued that expanding Medicaid could do wonders to state efforts to treat opi-oid abuse, and depression and other mental health issues. Improvements can be budget-neutral or even lead to savings. States that expanded Medicaid did not need to use some of their gen-eral funds to pay for behavioral health treatment for the uninsured, the report stated. “While state behavioral health budgets saw state funding cuts dur-ing the recession, those that expanded Medicaid were able to find savings to restore former budget cuts, or increase
Source: Phillips KA et al., Health Affairs, April 2016
general fund saving,” said the report, issued on March 28 by HHS’s office of the assistant secretary for planning and evaluation.
There are 1.9 million low-income, uninsured people who struggle with a mental illness or substance abuse in the 19 states that have not expanded Medicaid. Those with behavioral health needs make up about 28% of the low-income uninsured individuals in those states.
Low-income adults with serious mental illness are 30% more likely to get treatment if they’re covered by Medicaid. “This will be especially important to states as they work to address opioid disorder and serious mental illness,” the report states. If the remaining states expanded Medicaid, there would be 371,000 fewer people with depression, according to HHS.
In reporting about the HHS effort, the Wall Street Journal pointed out that “opponents of expansion argue
that neither states nor the federal gov-ernment can afford to further swell the program, and that a shortage of providers to treat the newly insured poses an additional challenge in trying to enroll more people in it.”
Those arguments have won the debate in the 19 holdouts, but HHS wants officials to consider the big pic-ture. Quality of life improves for those getting treatment, sure, but also “treat-ing behavioral conditions has been shown to reduce rates of disability, increase employment productivity, and decrease criminal justice costs.”
Anti-Depression ToolA Disappointment A recent study by Spanish research-ers posited: With the right diagnostic approach, primary care physicians (PCPs) should be able to get a bead on which of their patients might be most susceptible to major depression, and
Would you say higher prices are typically a sign of better quality medical care or not?
Would you say lower prices are typically a sign of lower quality medical care or not?
If one doctor charged more than another doctor for the same service, would you think that the more expensive doctor is providing higher quality care or would you not think that?
If one doctor charged less than another doctor for the same service, would you think that the less expensive doctor is providing lower quality care or would you not think that?

N E W S & C O M M E N TA R Y
10 MANAGED CARE / MAY 2016
thereby intercept the problem before it begins.
Unfortunately, the results were less than convincing, according to the study published in the Annals of Internal Medicine on March 29.
“Compared with usual care, an intervention based on personal pre-dictors of risk for depression imple-mented by PCPs provided a modest but nonsignificant reduction in the incidence of major depression,” the study concluded.
Of course, they urged additional study because “few trials on depres-sion prevention have been done in primary care settings, although we believe this setting is ideal because so many patients receive primary care,” the study stated.
The study’s lead author, Juan An-gel Bellon, tells Managed Care that “We could make an analogy with the prevention of cardiovascular diseases. No one doubts that most of it should be carried out in primary care and not by cardiologists. Primary prevention has to target healthy people, who have not yet developed the disease.”
Researchers looked at 70 PCP centers scattered over seven cities in Spain. Participants included 140 PCPs (70 in the control group and 70 in the intervention group) and 3,326 patients (1,663 each in the control and intervention groups). The study took place from October 2010 to Feb-ruary 2011.
The intervention group included running a 10- to 15-hour training workshop for PCPs; using a tool called predictD to measure a patient’s risk factors for getting depression; giv-ing patients a booklet about how to prevent depression; educating pa-tients about what to do when they detect signs of depression; and the assembling, by the PCP, of a bio-psycho-family-social intervention. This last involves patients answer-ing questions about their mental and physical quality of life; whether they suffered from depression in the past or physical abuse in childhood; if he or she is currently taking medication for anxiety, stress or depression; dis-satisfaction with living in the home,
and dissatisfaction with unpaid work (basically, housework). It’s similar to trying to judge the chances of some-one suffering a heart attack in the next 10 years, says Bellon.
“Once a PCP communicated the patient’s probability of depression, they discuss the risk factors that in particular might affect him or her,” says Bellon.
The study states that, “Patients in the control group continued to re-ceive regular care, except that they were assessed for depression, anxiety, and other information at the same intervals as patients in the interven-tion group.”
After 18 months, 7.39% of interven-tion patients developed major depres-sion, as opposed to 9.4% in the usual care group.
However, they did find that anxiety decreased in a significant way at 18 months for 2,998 patients. To calculate the new cases of anxiety disorder, re-searchers had to exclude 328 patients who had already suffered from the condition. They found that 10.4% in the intervention group developed it by 18 months, compared with 13.1% in the control group.
Briefly NotedSome physicians are joining the grassroots movement demanding the legalization and regulation of mari-juana. Doctors for Cannabis Regula-tion isn’t just talking about medical use, either. The doctors’ group thinks that marijuana should be available for recreational use. The group includes some heavy hitters in the medical community, including former Sur-geon General Joycelyn Elders. There are heavy hitters on the other side as well—respected physicians who think legalization would be a mistake…. The cost of insulin in the United States reached $12.92 per millimeter in 2011–2013, according to a study in JAMA. That’s a huge increase over 2002–2004, when the cost was $4.34 per millimeter. Researchers say that use of analog insulin fuels the in-creased costs, and made annual per-patient spending on insulin rise from $232.48 to $736.09 during the study
period, which in turn caused spending on insulin to rise higher than spend-ing on all other diabetes medications combined…. Researchers are still figuring out the relationship between atherosclerosis and Alzheimer’s dis-ease and dementia among the very elderly. But a study published in the Journal of the American College of Cardiology suggests that a connection exists. The researchers reported that the incidence of dementia was sig-nificantly lower among white women with low coronary artery calcium scores. Coronary artery calcium is a marker for atherosclerosis…. Pay-for-performance may work, but perhaps not as well as some hope, according to a study in JAMA Pediatrics. In an ACO for children with Medicaid cov-erage, incentivized community physi-cians had greater improvement than nonincentivized, hospital-employed physicians on 6 of 14 incentivized measures. In fact, incentives weren’t much of an incentive: The incentivized community physicians performed bet-ter than their hospital colleagues on 6 of the 7 nonincentivized measures…. Physicians and hospitals are scram-bling for ways to deal with shortages of drugs, the New York Times reports. “The American Society of Health-System Pharmacists currently lists inadequate supplies of more than 150 drugs and therapeutics, for reasons ranging from manufacturing prob-lems to federal safety crackdowns to drug makers abandoning low-profit products,” according to the newspaper. Rationing goes on behind the scenes, reports the Times. Obese patients, who need higher doses of some antibiotics for the drugs to be effective, get doses appropriate for average-size patients, the newspaper reports. If chemother-apy drugs are in short supply, children may be favored over adults…. Type 2 diabetes is associated with a higher risk for several types of cancer, includ-ing cancers of the liver, female genital organs, small intestine, and pancreas, according to an Italian study. The news isn’t all bad: The study, published in Cancer Epidemiology, found a reduced risk for prostate cancer.
— Frank Diamond

DON’T RISK YOUROUTPATIENT GENETIC AND CLINICAL
LABORATORY TESTING MANAGEMENTWITH UNPROVEN PROGRAMS BY COMPANIES
TRYING TO LEARN AT YOUR EXPENSE!THERE IS ONLY ONE VALIDATED NATIONAL OUTPATIENT GENETIC
AND CLINICAL LABORATORY BENEFIT MANAGEMENT EXPERT
ONLY
NOT
“Kentmere Proactive”
Unequaled Independent References
302-478-7600 | [email protected] | WILMINGTON DE
– Validated Results NOT Unsubstantiated Promises –
Visit us at the BCBSA Summit in Orlando; May 16-19, Booth 528 or AHIP Insitute in Las Vegas; June 15-17, Booth 240
Contact us about our “For Health Plans Only Genetic Testing UM/Reimbursement Conference” June 23 & 24, 2016 in Philadelphia.
KENTMERE HEALTHCARE CONSULTING CORPORATION
12 MANAGED CARE / MAY 2016
L E G I S L AT I O N & R E G U L AT I O N
For presidential candidates, advocating for more drug imports as a way of driving down consumer drug costs can make for a
neat campaign sound bite while taking a swipe at big pharma. Both Donald Trump and Bernie Sanders have embraced the idea, but the reality of importing drugs—or, rather, importing more drugs—isn’t so neat.
Different schemesTrump’s plan, called “Healthcare Reform to Make America Great Again,” has as one of its main points a promise to “remove barriers to entry into free markets for drug providers that offer safe, reliable, and cheaper products.” Sanders’s platform calls for drug imports from Canada, and he has a track record of support-ing imported drugs. During the markup of the ACA, he supported a futile amendment that would have allowed prescription drug imports from countries where those drugs are sold at much lower prices. Last September, months after he announced his bid for president, Sanders cosponsored a Senate bill to allow some drug imports from Canada.
They make it sound like the United States bans drug imports. It does not.
The reality is that drug imports account for about 20% of the value of the U.S. prescription drug market, or about $86.1 billion, in 2015, ac-cording to U.S. Census figures. Pharmaceutical companies are allowed to import branded drugs for consumer use provided the factories that make the drugs meet FDA standards. Estimates from BioPharmaDive.com suggest that 40% of all generic drugs in the United States come from India.
The Food and Drug Administration Safety and Innovation Act of 2012 requires the FDA to inspect foreign and domestic drug manu-facturing facilities, and the Generic Drug User Free Amendments requires the agency to
inspect foreign facilities on the same inspection schedule as domestic plants. In recent years, the FDA has stepped up inspections at foreign drug factories, according to an agency spokes-man. Inspections almost have tripled since 2007, reaching 847 last year. The agency has been especially aggressive in India, with inspections there almost doubling from 2014 to 2015 alone.
India and China are the two leading drug exporters to the United States, with nearly 1,300 registered drug manufacturing facilities between them, according to the FDA. Canada, Germany, and Great Britain are other large exporters with about 600 registered facilities combined.
In March 2015, the FDA banned imports from two factories owned by Ipac Laboratories, an Indian pharmaceutical company, because of quality-control problems. A few months later, the FDA moved to ban imports from more than 40 drug companies in India, again for quality problems. But how aggressive the FDA is compared to agencies in other industrialized countries is questionable; for example, Health Canada and European authorities banned im-portation of products from Polydrug Labora-tories in Mumbai months before the FDA last September put Polydrug on its no-import list.
Turning a blind eyeIn another area of drug importation, the FDA is more like the cop who lets drivers whiz by at speeds much higher than the speed limit: The agency generally turns a blind eye toward individuals who purchase prescription drugs from Canadian internet pharmacies.
Bryan Tackett, executive director of Campaign for Personal Prescription Information, says 1 million Americans each year get their health maintenance drugs from licensed Canadian pharmacies. Tackett’s group advocates for in-dividuals who buy from Canadian pharmacies.
The Canadian pharmacies that fill the pre-
Drug Imports: The New Idea That’s Kind of OldPharma will fight it, but Donald Trump and Bernie Sanders both see liberalization of the rules for drug importation as a way to bring prices down.By Richard Mark Kirkner
Campaign 2016
Almost a mil-lion Americans a year get their health main-tenance drugs from licensed Canadian pharmacies, says Bryan Tackett of Campaign for Personal Prescription Information.

L E G I S L AT I O N & R E G U L AT I O N
MAY 2016 / MANAGED CARE 13
scriptions of Americans are typically members of the Canadian International Pharmacy As-sociation (CIPA), according to Tackett. They require valid prescriptions from a U.S. physician to fill Americans’ orders, he says, and follow strict safety and privacy protocols.
Orders also require a health profile that in-cludes a review of other medications the person takes, says Tackett. Because of these safeguards, CIPA-certified pharmacies have had a perfect safety record, he says. Americans who use the Canadian pharmacies can save a lot of money. A 90-day supply of Celebrex in the United States costs about $740, whereas in Canada it goes for about $220.
But while this pipeline to cheap Canadian drugs is a reality, it’s not exactly legitimate. The Medicare Modernization Act of 2003 prohibits individuals from importing drugs from Canada, although technically the HHS secretary can grant waivers to the ban. According to Tackett, that has never happened. Last year, Sen. John McCain, the Arizona Republican, reintroduced
legislation that would legitimize drug importa-tion by individuals by allowing Americans with a prescription from a physician licensed in the U.S. to order up to a 90-day supply of medicines from a licensed Canadian pharmacy. Sanders is among the seven cosponsors, which include two Republicans. In the House, Maine Democrat Chellie Pingree is the sponsor, but the bill has no Republican cosponsors.
Overseas inspectionsPhRMA takes exception to the claim that pro-tectionism against drug imports drives up drug costs for U.S. consumers. “The competitive biopharmaceutical marketplace for medicines in the U.S. works to control costs and encourage the development of new treatments and cures for patients,” says Holly Campbell, senior director
of communications for PhRMA. “The competi-tive marketplace is why 90% of all medicines prescribed to U.S. patients are generics and typically cost less than in other countries.”
Disclose where drugs come fromFormer FDA official David Gortler, who’s now with FormerFDA.com, a consulting group of former FDA officers and staff, says if Trump or Sanders want to enact policy that leads to more, and cheaper, drug imports, they might want to start with regulations that let people know where their drugs are made. “Banning imports isn’t possible, but I think an easy first step would be to let the consumer make an informed decision on exactly where their drugs are coming from,” says Gortler, an associate professor at Georgetown.
“People don’t realize that there historically have been many very serious quality control issues with their sweatshop-imported $4-per-month prescriptions advertised by most chain pharmacies,” says Gortler, noting that there is no information about a drug’s country of origin disclosed on prescription bottles, and even if a consumer were to ask where a drug was made, the pharmacist wouldn’t know.
Hiring better inspectorsHe says the countries notorious for producing substandard drugs include China, India, Philip-pines, Taiwan, and Jordan. The FDA may talk about all the overseas factories its inspectors are checking out, but the agency inspects factories in those countries only once every seven years on average, while domestic drug factories are inspected every other year, according to Gortler.
Gortler also believes that the agency needs to do a better job of hiring inspectors—not only in quantity but also in quality. He blames the USAJobs.gov website, the jobs site of the U.S. Office of Personnel Management, for weeding out qualified candidates. “The people reviewing applications at USA Jobs don’t have a scientific background and they therefore aren’t hiring the best and brightest,” he says. Gortler and his graduate students have done a study that documents problems with the hiring process.
But for candidates, talking about how to improve FDA oversight of foreign-sourced drugs makes for a clunky sound bite on the campaign trail.
Let people know where their drugs are being imported from, says David Gortler of the consulting group Former-FDA.com. That’s “an easy first step.” The FDA may talk about all
the overseas factories its
inspectors are checking out, but
the agency inspects factories in
those countries only once every
seven years on average.

14 MANAGED CARE / MAY 2016
By Timothy KelleySenior Contributing Editor
It was hard to resist metaphors of conflict with the news in March of the death of pioneering rap singer Phife Dawg of the group A Tribe Called Quest
from complications of type 2 diabetes. Trite as it is to cast every national problem as a “war,” one couldn’t help seeing him as a casualty. After all, he was only 45, and he’d gone public about his fight against dia-betes—America’s seventh-ranking cause of death by itself, and even more lethal as a contributor to the number-one killer, heart disease.
Clichés aside, it’s a war-sized problem. By 2012, says the CDC, diabetes afflicted 29.1 million Americans (8.1 million of them unaware of it) and was costing the country $245 billion a year, $176 billion of it in direct medical costs. But even that’s not the full picture—especially if you’re a health plan looking to cover lives, keep populations healthy, and manage the
bottom line. Another key stat is the tally of those with prediabetes, which is associated with increased risk for developing type 2 diabetes, heart disease and stroke. The 2012 CDC estimate for that group? Eighty-six million U.S. adults, or more than a third of the adult population. CMS announced a new program in March that will reimburse providers for prevention efforts for people with prediabetes (see page 26).
That’s not to say there haven’t been victories. Rates of grave (and costly) diabetes complications such as stroke, heart attack, amputations, and end-stage renal disease began to trend downward in about 1995 while diagnoses of diabetes itself kept going up. Then, last December, came what medical history may come to regard as a tipping point. New CDC data for 2014 showed decisively that the incidence of diabetes was heading downward at last—2014 had brought us 1.4 million new cases, down about one-fifth from the 1.7 million of 2008. As a result, prevalence also has been leveling out for the last several years, notwithstanding
DIABETES COULDBE MANAGED CARE’S
BIG CHANCE The industry will never get to bask in do-gooder glory. But complications from
diabetes are down. Programs targeting prediabetes are working. We know what to do, a top doctor declares. Now is the time to organize delivery to do it.
Per-member, per-year spend for the top 10 traditional drug therapy classes
Source: Express Scripts 2015 Drug Trend Report
$77.50
$40.65
$32.66 $29.44
$25.70 $23.95 $23.28 $22.72 $20.62 $20.18
Diabetes Pain/ inflammation
High blood cholesterol
Attention disorders
High blood pressure/
heart disease
Heartburn/ulcer disease
Mental/neurological
disorders
Asthma Compound-ed drugs
Skin conditions

MAY 2016 / MANAGED CARE 15
preliminary data showing an uptick last year. “Initially it was a little surprising,” CDC diabetes researcher Edward Gregg said about the declining incidence in an interview with the New York Times, “because I had become so used to seeing increases everywhere we looked.”
At least one diabetes expert doesn’t think we should be turning a statistical jog in the right direction into a victory march. “It’s a hopeful early indicator, perhaps, of good things happening,” says Robert A. Gabbay, MD, senior vice president and chief medical officer of the Joslin Diabetes Center in Boston. “We’ve won a bit of the battle, but we’re still largely losing the war. The rate of diabetes remains super high, and it’s still the leading cause of kidney failure, blindness, and amputations, affecting millions—not to mention the overall costs of care, which are really astronomical and threaten to bankrupt the health system.” CDC researchers, Gregg among them, reported last year that adults at age 50 with diabetes died, on average, 4.6 years earlier than adults without diabetes, developed disability six to seven years earlier, and spent about one to two more years in a disabled state.
Of course, the challenge of burgeoning costs is no
news to the health care industry, and diabetes care is front and center in that cost challenge. For one thing, drug costs are rising fast. According to Express Scripts’ 2015 Drug Trend Report, this was the fifth year in a row that diabetes was the most expensive traditional therapeutic class on a per-member, per-year basis. In fact, in Express Scripts’ telling, three of the top five drugs in spend across all traditional classes are diabe-tes medications: insulin glargine (Lantus), sitagliptin
(Januvia), and insulin lispro (Humalog). There are no generic insulins on the market, although as Express Scripts points out, many of the most commonly pre-scribed diabetes medications—metformin, glipizide, glimepiride, and pioglitazone—have been available as generics for many years. Meanwhile, the IMS Institute for Healthcare Informatics’ annual report on drug spending shows drug manufacturers are aggressive about using coupon programs to lower the out-of-pocket costs of their diabetes drugs—wreaking havoc with tiered formularies in the process (see page 51).
Poster child for change?But even a pricey medication can be a bargain for a health plan if it helps to head off a hospitalization. And in a sense, the bad news about diabetes is the news we already know about health care in general—that its cost curve must be “bent,” quality improved, and efficiency heightened. The way to pull off that trifecta, many observers say, is to go all-in on value-based care and infuse some reality into the buzzphrase. Indeed, this management-intensive disease, with its potentially lethal consequences for neglect, may be the ideal poster child for needed change in health care as a whole.
“Diabetes is the perfect disease, in many ways, for how our system could work better, because so many of the costs associated with it are related to its long-term complications,” says Joslin’s Gabbay. “And the route to cost savings is pretty clear.” Control the ABCs, he says—A1c levels, blood pressure, and cholesterol. Progress has been made, but still less than one fourth of the people with diabetes are well controlled on those three parameters, he adds, and the strategies for controlling them are “woefully underreimbursed. The big reimbursement is still for treating the disease’s long-term complications.”
Prevalence of diagnosed diabetes among adults aged 18 and over: United States, 1997–2015 (age-adjusted %)
*January–SeptemberSource: CDC, “Early Release of Selected Estimates Based on Data From the National Health Interview Survey, Jan–Sept. 2015,” February 2016
0
1
2
3
4
5
6
7
8
9
10
1997 1999 2001 2003 2005 2007 2009 2011 2013 2015*
“A lot of money is spent” on outreach by insurers to patients and not always wisely, says Robert A. Gabbay, MD, senior vice president and CMO of the Joslin Diabetes Center in Boston.
8.7%
5.3%

16 MANAGED CARE / MAY 2016
Gabbay says the incentives still aren’t yet properly aligned to improve diabetes outcomes. Better care requires an investment by providers—physician groups and hospital systems, for instance—while health in-surance plans or employers reap the savings. He says Kaiser Permanente and Group Health Cooperative of Puget Sound are two of the country’s best-performing health plans when it comes to diabetes, and he be-lieves it’s no coincidence that they’re also provider organizations.
Providers, not health plans, he says, are best situated to reach out to patients to encourage them to manage
their diabetes prudently, getting regular eye and foot exams and testing and controlling their blood HbA1c levels. The plan’s job, Gabbay contends, is to reform benefit structures to incentivize truly proactive care. For example, “if you gave statins away free, and over a five- or ten-year period studied the cost of care for a population, it’d more than pay for itself,” he says.
Disease management’s top disease“A lot of money is spent” on direct outreach by health plans to members related to diabetes, says Gabbay, and he’s not sure it’s all spent wisely. Indeed, for 20 years health plans have used disease management (DM) programs to reach out to people with, or at risk for, diabetes and give them preventive care to head off trouble later. America’s Health Insurance Plans, the industry’s main trade and lobbying organization, iden-tifies diabetes as the number one disease management target, followed by asthma and congestive heart failure. These DM programs have measured outcomes, set care standards using evidence-based guidelines, provided feedback to physicians, and contacted members via nurse call centers, mailings, and other methods to get patients to have regular eye exams to spot diabetic retinopathy, foot exams to identify foot ulcers (and prevent amputations), and regular testing to control the all-important HbA1c level.
Experts continue to argue about whether the return on investment is really there, but DM programs have grown in sophistication—and in their ability to address comorbidities. Back in 2003, one study of
a HealthPartners diabetes DM program concluded that accrued savings over a decade amounted to just $75 per patient. But a British study linked a 1-point reduction in HbA1c levels with a 37% decline in the risk of “microvascular complications,” and that surely
implies savings—if plans retain members long enough to reap them. In a retrospective study reported online in April 2013 by the American Journal of Managed Care, a review of two years’ claims data from one integrated system, based on comparing diabetic par-ticipants’ claims with those of diabetic nonparticipants, showed $2.23 in savings for every dollar invested. The authors add, however, that others who tried to equal these results were unable to do so.
Should health plans indeed butt out when it comes to member contact about diabetes, leaving that job to providers? Kenneth Snow, MD, medical director for Aetna’s Northeast Region, says that’s not his company’s approach. “We have nurses reach out to patients who are at high risk to make sure they understand their medications and how to take them properly, that any barriers that are put in their way are knocked down as best one can,” he explains. “Obviously, we’re not prescribing the medication, we’re not treating the member, but we can facilitate so that the care that the provider wants that member to get actually occurs.”
Put Ann Baker, too, down on the “yes” side on the usefulness of plan-to-member diabetes contacts. She’s vice president of wellness and care management of Blue Cross Blue Shield of Michigan. “Diabetes is a big problem,” she says, “and as such it needs multiple approaches from multiple sources.”
Cloudy futureBaker argues that there is a role for health plans in promoting health and wellness to the community and offering services to improve health. “We have direct contact with the membership,” she explains. “Sometimes, I think physicians are focused on who’s in their office on a given day. They tend to forget that about 20 percent of our patients never go to the doctor during the year.”
Like many health plans, the Michigan Blues plan has financial incentives—based on performance on Health Plan Employer Data and Information Set (HEDIS)
Data analytics would do a better job of helping to manage diabetes than old-fashioned actuarial calculation, contends Vivek Garipalli, CEO and founder of Clover Health.
Diabetes is a big problem,” says Ann Baker of Blue Cross
Blue Shield of Michigan, “and as such, it needs multiple approaches from multiple sources.”
“
continued on page 20

MAY 2016 / MANAGED CARE 19
E D I T O R I A L A D V I S O R Y B O A R D
Managed Care publishes origi-nal papers and feature articles dealing with diverse elements of
the health care system. Among these are impartial peer-reviewed research and review articles examining clinical and financial aspects of managed care.ALAN G. ADLER, MD Senior Medical Director Independence Blue Cross Philadelphia, Pa.PARTHA S. ANBIL Principal The ConfluenceElite Group, LLC West Chester, Pa.JAN BERGER, MD, MJ President Health Intelligence Partners Chicago, Ill.THOMAS BODENHEIMER, MD Family and Community Medicine University of California–San Francisco San Francisco, Calif.PETER BOLAND, PhD President, Boland Healthcare Berkeley, Calif.LARRY S. BORESS, MPA President & CEO Midwest Business Group on Health Chicago, Ill.H. ERIC CANNON, PharmD Chief of Pharmacy SelectHealth/Intermountain Healthcare Salt Lake City, UtahGEORGANNE CHAPIN, MPhil, JD President & CEO Hudson Health Plan Tarrytown, N.Y.VIVIAN H. COATES, MBA Vice President Information Services and Health Technology Assessment ECRI Institute Plymouth Meeting, Pa.HELEN DARLING Strategic Adviser Former President and CEO National Business Group on Health Washington, D.C.GARY SCOTT DAVIS, JD Partner, Health Law Department McDermott, Will & Emery LLP Miami, Fla.D.S. (PETE) FULLERTON, PhD, RPh Strategic Pharmacy Innovations Seattle, Wash.ARCHELLE GEORGIOU, MD Founder Georgiou Consulting Minneapolis, Minn.JEFF GOLDSMITH, PhD President, Health Futures Inc. Charlottesville, Va.ALICE G. GOSFIELD, Esq. Principal, Gosfield & Associates, P.C. Philadelphia, Pa.
MICHAEL T. HALPERN, MD, PhD Associate Professor of Public Health College of Public Health University of Arizona Tucson, Ariz.JAN HIRSCH, PhD Associate Professor of Clinical Pharmacy, Scaggs School of Pharmacy and Pharmaceutical Sciences University of California–San Diego San Diego, Calif.GEORGE J. ISHAM, MD Senior Adviser HealthPartners Minneapolis, Minn.LUCY JOHNS, MPH Independent Consultant Health Care Planning and Policy San Francisco, Calif.ROBERT C. JOHNSON, MS President, R.C. Johnson & Associates Former President, American Pharmaceutical Association Scottsdale, Ariz.THOMAS KAYE, RPh, MBA Pharmacy Consultant Louisville, Ky.RANDALL KRAKAUER, MD, FACP, FACR Vice President, National Medical Director, Medical Strategy Aetna Princeton, N.J.PETER KONGSTVEDT, MD, FACP President P.R. Kongstvedt Co. McLean, Va.THOMAS H. LEE, MD, SM Chief Medical Officer Press Ganey Associates Wakefield, Mass.ATEEV MEHROTRA, MD, MPH Associate Professor of Medicine and Health Care Policy Department of Health Care Policy Harvard Medical School Boston, Mass.MICHAEL L. MILLENSON President Health Quality Advisors LLC Highland Park, Ill.THOMAS MORROW, MD Chief Medical Officer Next IT Spokane, Wash.SAM NUSSBAUM, MD Executive Vice President and Chief Medical Officer Anthem Indianapolis, Ind.MATT NYE, PharmD Vice President Pharmacy Care Support Services Kaiser Permanente Downey, Calif.
BURTON I. ORLAND, BS, RPh President BioCare Consultants Westport, Conn.
STEVEN R. PESKIN, MD, MBA, FACP Associate Clinical Professor of Medicine University of Medicine and Dentistry of New Jersey– Robert Wood Johnson Medical School New Brunswick, N.J.
UWE E. REINHARDT, PhD James Madison Professor of Political Economy Princeton University Princeton, N.J.
EMAD RIZK, MD President & CEO Accretive Health Chicago, Ill.
JOHN ROGLIERI, MD, MBA Medical Director New York Life Insurance Co. New York, N.Y.
TIM SAWYERS, BPharm, MBA, PAHM Director of Account Management Magellan Rx Management Nashville, Tenn.
JAMES M. SCHIBANOFF, MD Editor-in-Chief, Milliman Care Guidelines Milliman USA San Diego, Calif.
STEPHEN W. SCHONDELMEYER, PharmD, PhD Professor & Director, PRIME Institute University of Minnesota College of Pharmacy Minneapolis, Minn.
JAAN SIDOROV, MD, MHSA Chief Medical Officer medSolis Frisco, Texas
THOMAS D. SNOOK, FSA, MAAA Principal & Consulting Actuary Milliman Inc. Phoenix, Ariz.
RICHARD G. STEFANACCI, DO, MGH, MBA, AGSF, CMD Chief Medical Officer, The Access Group Jefferson College of Population Health Thomas Jefferson University Philadelphia, Pa.
F. RANDY VOGENBERG, PhD, RPh Partner Access Market Intelligence Greenville, S.C.
JONATHAN P. WEINER, DrPH Professor and Director of the Center for Population Health Johns Hopkins University Bloomberg School of Public Health Baltimore, Md.
20 MANAGED CARE / MAY 2016
scores and other data—to reward doctors for good care and for “building the capabilities required to actually deliver population health care,” says Baker. Thanks in part to programs that facilitate payment for care man-agement services, an increasing number of primary care physicians can now receive reimbursement for helping patients manage conditions such as diabetes.
But for the initiative she’s currently excited about, BCBSM has functioned principally as a “matchmaker.” It’s a joint venture with the “digital insulin enhance-ment” company Hygieia to test an insulin guidance system called d-Nav, which uses cloud-based infor-mation technology to guide insulin administration. Attracted by the success of a similar demonstration project Hygieia conducted in the U.K., which showed that for participating patients there were significant re-ductions in both HbA1c levels and diabetes care costs, Michigan Blue matched one of its contracted provider organizations—a 30-year-old southeast Michigan physician organization called Oakland Southfield Physicians—with Hygieia for a one-year, 1,000-patient demonstration project that was announced March 31.
“Insulin is effective, but it needs to be titrated fre-quently—sometimes one or two times a week—to
manage blood glucose effectively,” she explains. But patients don’t go see their doctor that often, even if that doctor’s office is set up as a patient-centered medical home. The result, says Baker, is that many patients never achieve good glucose control. They are prescribed more and more oral medications and end up with less than optimal care that’s more and more costly. As an alternative, d-Nav works like a car’s GPS system, charting adjustments in insulin doses the patient administers at home to help that patient reach a goal. It automatically reports glucose levels and uses its cloud-based software to increase insulin when sugar is above target and decrease it when sugar is below. An independent health economics research organiza-tion will assess the results of the demonstration. The Michigan Blue hopes the technology could end up being a tool that improves blood glucose control for diabetics across the country, says Baker, and saves money for health plans.
Clover Health also thinks it has found a better way to manage diabetes. Headquarted in San Francisco, the Medicare Advantage plan is one of the health insurance start-ups that has convinced its investors that brainy use of data can reshape a hidebound industry. CEO
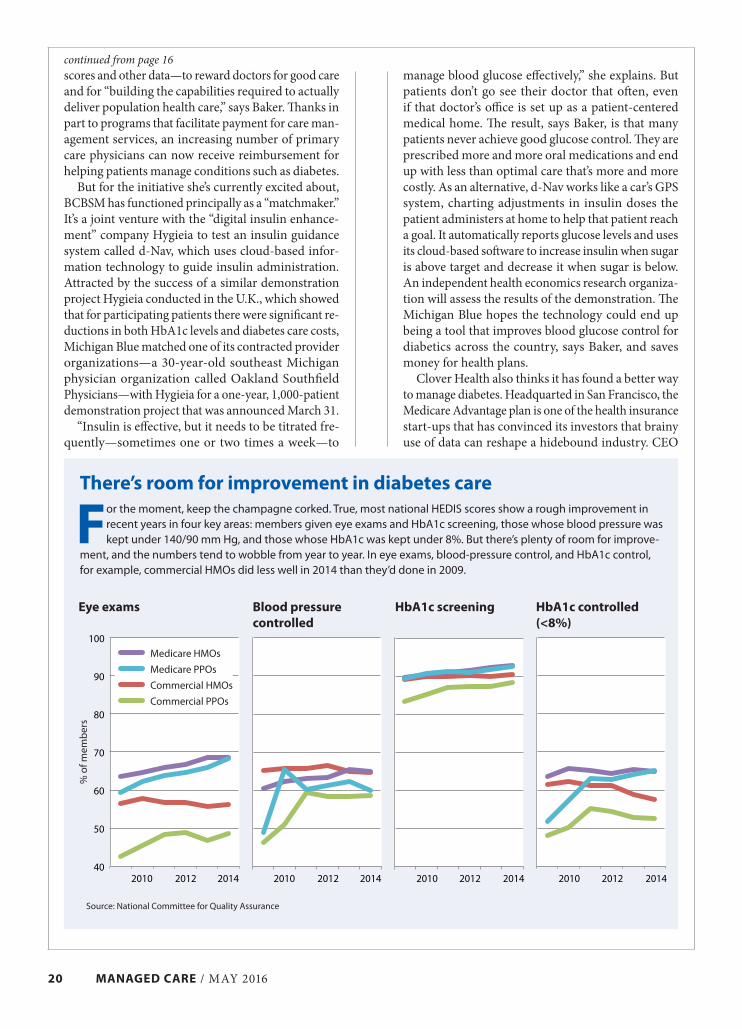
There’s room for improvement in diabetes care
For the moment, keep the champagne corked. True, most national HEDIS scores show a rough improvement in recent years in four key areas: members given eye exams and HbA1c screening, those whose blood pressure was kept under 140/90 mm Hg, and those whose HbA1c was kept under 8%. But there’s plenty of room for improve-
ment, and the numbers tend to wobble from year to year. In eye exams, blood-pressure control, and HbA1c control, for example, commercial HMOs did less well in 2014 than they’d done in 2009.
Source: National Committee for Quality Assurance
Eye exams Blood pressure controlled
HbA1c screening HbA1c controlled (<8%)
40
50
60
70
80
90
100
2010 2012 2014 2010 2012 2014 2010 2012 2014 2010 2012 2014
Medicare HMOs
Medicare PPOs
Commercial HMOs
Commercial PPOs
continued from page 16
% o
f mem
ber
s

MAY 2016 / MANAGED CARE 21
and founder Vivek Garipalli spins Clover as a “clinical operations company,” and a break from a past when health insurance was all about actuarial calculation.
Clover doesn’t have a special diabetes program per se but attends to it like other high-cost diseases such as congestive heart failure and chronic obstructive pul-monary disease. Garipalli says Clover’s data analytics surpass the models used by insurers that depend on claims and enable the company to predict with 80% accuracy which of its members with diabetes will develop complications in the next 24 months. Clover focuses on the “inflection point” before complications develop, he says, rather than struggling to manage high costs after they do. The other 20% are false positives that get more attention than needed but probably still to good effect, says Garipalli. According to a Clover spokesperson, the company had identified 2,972 of its 6,800 members as having diabetes by the end of
last year, almost all had had phone contact with the health plan and just over half (56%) had received a home visit. Garipalli says Clover uses those contacts to collect data on members as well as provide advice
and services. Moreno steps are taken with members without a metric attached. “We won’t roll out some-thing without the ability to measure it,” say Garipalli. And the results? They are a mystery right now. The company says it will share them in an upcoming peer-reviewed paper.
Here today, gone tomorrow?One managed care worry that troubles Joslin’s Gabbay no longer costs Baker, in Michigan, any sleep. It’s the old turnover lament. “Health plans understandably say about a patient with diabetes, ‘He’s not going to be my member in 10 years, so why should I make the needed upfront investments in care to save money in the long run when my competitor may be the one who actually benefits?’” says Gabbay.
“That used to be a big concern, but these days it’s less so,” says Baker. “We think about our community more holistically than that. We know that things we’ve done in our Value Partners [physician incentive] program have helped our competitors, but the overall health of the residents in the state is important to us.”
That’s a promising portent for the management of this complex disease even if formal incentives are still only halfway to where they should be. Given the ACA, ACOs and the almost universal prevalence of diabetes DM programs (though they keep evolving and chang-ing in search of better outcomes and demonstrable ROI), we could be approaching an “everybody’s doin’ it” era in which a self-respecting health plan would no more be caught with less-than-aggressive diabetes management than a proud suburban homeowner would be seen with a lawn full of crabgrass.
The psychology of diabetesAny rosy scenario for solving the national health crisis that is diabetes must take into account some of the disease’s complicating aspects. For example, Aetna’s Snow points out that diabetes risks appear to be higher
Steady progress in reducing amputations“No one’s happy when there’s an amputation,” says Kenneth Snow, MD, Aetna’s medical director for Northeast Regional Care Management. It’s tragic for a patient to lose a leg or a toe, it’s a defeat for the treating doctor, and it’s a large cost for the health insurer—usually an avoid-able one. Fortunately, the last couple of decades have shown a consistent decline in amputations among people with diabetes.
Age-adjusted hospital discharge rates for nontraumatic lower extremity amputations per 1,000 people with diabetes, by type of amputation
Source: CDC
0.0
0.5
1.0
1.5
2.0
2.5
3.0
3.5
4.0
1994 1999 2004 2009
Toe
Foot
Leg below knee
Leg above knee
Those old managed care concerns about member turnover and
whether prevention efforts pay may be fading. Every health plan may soon have an aggressive diabetes disease management program.

22 MANAGED CARE / MAY 2016
for some minority populations (African-Americans, Native Americans, and Asians, for example) as a matter of genetics, even when you strip away the effects of poverty and lifestyle. That suggests the delicacy of targeting people appropriately for health interven-tions without insensitively “profiling” them as law enforcement has been accused of doing. Of course, one could argue that target interventions aimed at saving lives are positive and should always be wel-comed, but there’s a danger of seeming to patronize or preach—or just miss the mark. While today Aetna prides itself on the cultural sensitivity of its outreach programs for patients, Snow recalls from his days as a clinician that at a clinic (where he did not work), older Asian-Americans were told to stop eating rice. “That’s just silly advice!” he says.
Edward McEachern, MD, the Boise, Idaho-based medical director of Medicare Advantage programs for PacificSource Health Plans, a not-for-profit that covers more than 275,000 people in Oregon, Idaho, and Montana, says his company’s experience suggests that “there are a bunch of things the health plan can do better than the provider, and a bunch that the provider can do better than the health plan.” PacificSource has learned two key lessons as it has shuffled its DM ap-proach for better results. One, which McEachern says “pains me as a pathologist,” is that functional status is a more important predictor of long-term outcomes than lab values and clinical specifics.
Five key bucketsAccordingly, PacificSource uses predictive analytics to target people not for diabetes per se but for their presence in one of five key “buckets” based on func-tionality: well, walking wounded, rising-risk, high risk, and frail. The second lesson is that “behavioral health issues are a co-conspirator in outcomes. If you have twin brothers with diabetes and one has a mental or behavioral issue and the other doesn’t, the first one will consume a lot more resources.”
Indeed, one hears from many experts this em-phasis on the psychology of diabetes. “When people can’t achieve good glucose control they can become discouraged,” says Baker of Blue Cross Blue Shield of Michigan. “They’re trying to lose weight and manage
their diabetes, but they’re not getting better. They feel frustrated and defeated. They may eat more and exercise less, and it can become an awful catch-22.”
That messy fact is actually part of the opportunity for health plans. While the conquest of diabetes will surely require growing sophistication in the use of data—the BCBSM demonstration project with d-Nav, for example—it will take human talent, empathy, and imagination too. As Snow says, “particularly for patients who have multiple comorbidities, there is a real value in person-to-person interaction.”
The human element will be required, for example, in an outreach technique called “motivational in-terviewing” that Gabbay advocates. “You let people figure out what’s doable,” he says. “Instead of saying, ‘You need to go to the gym three times a week,’ you ask, ‘How might you be able to exercise more often? What are you willing to commit to?’” Reminded that this is expensive because it can’t be done with just a computer program, Gabbay retorts: “Yes, but it’s way cheaper than a bypass surgery.”
Everyone agrees that health care needs to keep stepping up its game against diabetes. “We can’t just do what we were doing 10 years ago,” says Snow. And McEachern thinks the continuing advance of proactive diabetes care will unearth connections not yet understood that link diabetes not only to behavioral health in new ways but to things like childhood trauma.
“The thinking we engaged in to get into this mess may turn out to be really different from the thinking we’ll need to get out of it,” he says.
If one can speak just once more of a “war” against diabetes, let Winston Churchill’s words tell where we are now that the incidence of the disease has at last begun to decline. “This is not the end,” he declared at one point in World War II. “It is not even the be-ginning of the end. But it is, perhaps, the end of the beginning.”
“The thinking we engaged in to get into this mess may turn out to be really different” from the thinking we’ll need to get out, says Edward McEachern, MD, of PacificSource Health Plans.
FEEDBACK PLEASE!Any thoughts about this article? Is there a pertinent angle that we haven’t touched upon? Let us know. We strive to present must-read material for busy clinician executives and other officials at health insurance plans. So, talk to us. If you want to remain anonymous, send responses to Managing Editor Frank Diamond at [email protected]. If you want to write a letter to the editor, send it to:
MANAGED CARE/Letters; attn: Frank Diamond 780 Township Line Road Yardley, PA 19067
Letters may be edited for space and clarity.

MAY 2016 / MANAGED CARE 23
Medicaid officials and Medicaid managed care plans have been eyeing figures like that with some trepidation as Medicaid has expanded under the ACA. According to Kaiser’s latest tally, 31 states and the District of Columbia have expanded Medicaid. A 2012 Kaiser Family Foundation report on Medicaid
and diabetes reported that the prevalence of diabetes among Medicaid beneficiaries was almost twice as high as it was among the uninsured (9% vs. 5%), but the Kaiser experts noted that part of the difference was a higher rate of undiagnosed diabetes among the uninsured. In a 2012 Health Affairs article, a pair of Kaiser researchers, Rachel Garfield and Anthony Damico, wrote: “Uninsured adults with diabetes who gain Medicaid coverage under health reform are likely to enter the program with unmet needs, and coverage is likely to result in both improved access and increased use of health care.”
And that appears to be what’s happening. Quest Diagnostics, which performs laboratory tests
for 1 in 3 adult Americans and half the physicians and hospitals in the United States, analyzed data for 434,288 patients aged 19 to 24. It found that states expanding Medicaid under the ACA had a 23% higher rate of newly identified patients with diabetes in the first six months of 2014 compared with the first six months of 2013 (before expansion).
States that did not expand Medicaid had less than a 1% increase in the newly identified Medicaid ben-eficiaries with diabetes in the first six months of 2014.
Medicaid bumpA study published in the Annals of Internal Medicinein April comparing expansion to nonexpansion also showed that there’s a bump in diabetes diagnoses from Medicaid coverage. Using data from the National Health Interview Survey, the researchers found that in expansion states, the percentage of people who had been diagnosed with diabetes increased from 8.3% to
By Robert Calandra
Sabra Matovsky met her at a town hall meeting for low-income residents in Riverside, California. The 60-year-old woman was depressed. She was
caring for her mentally ill adult son and had recently been diagnosed with diabetes. Her primary care doctor had dutifully loaded her up with educational mate-rial—brochures, pamphlets, websites, the name of a support group. But the woman couldn’t deal with it.
“She was overwhelmed. Her health care really took a back seat to dealing with her son’s issues,” says Matovsky, the executive vice president of Inte-grated Health Partners, a consortium of 11 federally qualified health centers caring for more than 500,000 Medi-Cal patients in San Diego and Riverside counties (Medi-Cal is California’s Medicaid program).
What motivates patients?It wasn’t till she found help at a community health center that she was able to take control of her life—and her health problems, says Matovksy. One of the programs at the center, Medi-Cal’s MediConnect, con-nects high-risk Medicaid (and Medicare) beneficiaries with care managers. That kind of matchmaking has been going on for years, but the goal now is to gain some insight into the motivations of patients, says Matovsky: “By working more through a motivational interviewing technique you figure out what is impor-tant to them and help them devise a plan to get where they need to go.”
If there is a pecking order to diseases, diabetes is not at the top of it. Heart disease and cancer take those honors in most domains (funding, sophistication of the treatments, charity). But in terms of expense, diabetes is in their league. The cost of diabetes (in-cluding undiagnosed cases) in 2012 exceeded $322 billion, according to a study published in Diabetes Care a couple of years ago. A report for the American Diabetes Association estimated direct medical costs of the disease to be $176 billion, less than the $193 billion spent on heart disease but more than the $157 billion for cancer. Complications, such as blindness, kidney disease, and amputations, are a major factor in the cost of diabetes. By some accounts, a beneficiary with diabetes costs an insurer, on average, about 3 times more per year than a beneficiary without the disease.
Diagnoses of diabetes go up with expansion. Optimists see a new chance to prevent expensive complications and help with behavioral health issues.
Medicaid Prepares to Shoulder Diabetes Burden
A motivational interviewing technique allows providers to devise a plan for diabetes patients that can help them “get where they need to go,” says Sabra Matovsky of Integrated Health Partners.

24 MANAGED CARE / MAY 2016
12.8%, whereas in nonexpansion states, the percentage fell from 9.6% to 8.1%.
But there are plenty of advantages to catching dia-betes early, notes Patrick Tellez, MD. “Earlier inter-vention is much less costly and yields better health outcomes for patients” says Tellez, chief medical officer of North County Health Services, one of the centers in the Integrated Health Partners’ network. “That has been shown time and again.”
Tellez has seen firsthand in his own organization both the increase in the number of people diagnosed as well as improved outcomes. About three quarters of the 62,000 people who get care at North County Health Services are Medi-Cal beneficiaries. In 2013, 2,347 of the center’s patients were diagnosed with diabetes; last year that number rose to 3,385.
Philly has a problemPhiladelphia has one of the worst diabetes problems in the country, and Keystone First, the largest Medicaid managed care plan in the area, has responded with a program that encourages eye exams and weight loss. About one in every six adult residents of the city has diabetes, and incidence went up by 50% between 2004 and 2012. Keystone identifies members with diabetes who are not up to date with screenings and gets them caught up. Beneficiaries are enrolled in workshops and given help aimed at cementing relationships with their primary care physicians. According to Keystone First, participants typically lose between 10 and 15 pounds.
“Lifestyle changes, behavior modification, and routine checkups are some of the best ways we can minimize diabetic patient costs and help patients live full, healthy lives,” says Andy Bhugra, director of government health solutions for Navigant, a health care consulting firm with clients that have Medicaid
programs. “Physicians are starting to take a more personalized approach to prevention and diabetes management.”
Take for example the woman Matovsky met at the meeting. She is still struggling with her son’s issues. But she has also taken control of her health, regularly attending meetings of a local diabetes support group, according to Matovsky.
For people with diabetes, depression is often an added burden to their health. Simply telling a patient with diabetes that they have to stop smoking, lose weight, eat a better diet, and stop drinking alcohol may add to their sense of hopelessness. Research has also suggested that diabetes may have a direct effect on the brain, changing the neuronal circuits that influence mood and motivation.
That’s why programs like MediConnect employ a team approach to address both physical and behavioral health issues.
“We do warm handoffs to behavioral health so those issues can be addressed in a one-stop shop to enable the person to get a handle on some of the factors affect-ing their ability to take care of themselves,” says Tellez.
And with more insurance companies managing Medicaid programs, the hope is that they will bring better technology and sophisticated management techniques to bear. “They can invest in better care management—maybe patient-facing mobile technol-ogy that enables coaching in a much more connected way and other innovations like telemedicine that improve access to earlier intervention and capitalize on the business opportunity of better management with a focus on patient services,” Tellez says.
Robert Calandra is an independent journalist in Philadelphia with more than 20 years experience
writing about health care.
With no usual source of care because of cost
Preexpansion period was defined as 2010–2013. Post-expansion was the second half of 2014. Results based on data from the National Health Interview Study.Source: Wherry LR and Miller S et al., Annals of Internal Medicine, April 2016
Ever diagnosed with diabetes
Ever diagnosed with high cholesterol
Preexpansion Postexpansion Preexpansion Postexpansion Preexpansion Postexpansion
13.3
6.6
14.4 12.1
0
5
10
15
20
25
8.3
12.8
9.6
8.1
17.9
22.5 20.0
18.2
Expansion states Nonexpansion states
Medicaid expansion: Differing experience in expansion and nonexpansion statesPercentage of Medicaid beneficiaries

P L A N W AT C H
MAY 2016 / MANAGED CARE 25
ACA Means More Coverage of Diabetes for Blues By Frank Diamond
The Blues have participated in ACA ex-changes more than any other health insurer for two reasons. It’s good business:
The exchanges mean millions of new enrollees. And helping those who are uninsured or under-insured has always been the stated mission of the Blue Cross Blue Shield Association.
But a recent association report points out some of the challenges that come with jumping into the health care exchanges with both feet. Blues officials wanted to see what changed about their claims data in the individual market after the ACA exchanges took effect. The report also compares the post-ACA experience of those with individual Blues coverage with those who are covered by Blues plans through their em-ployers.
One finding that jumps out from the report is that the new buyers of Blues individual cover-age in 2014 and 2015 were almost twice (94% higher) as likely to have diabetes as those who had bought individual Blues coverage prior to 2014 and continued with it through 2015.
And diabetes was not some oddball exception to the rule: The prevalence of HIV, hepatitis C, depression, coronary artery disease, and hyper-tension was also higher among new 2014 and 2015 individual coverage enrollees.
With the higher prevalence of expensive chronic disease, it’s not surprising that the Blues also saw an increase in medical spending.
For the first nine months of 2014, the medical spending per member per month for those with individual Blues coverage was $501. For the first nine months of 2015, the medical spend per month jumped to $559, an increase of 12%.
Ideally, people with diabetes are engaged patients, mindful of their condition and con-scientious about taking their medications. That is something the Blues want to facilitate, says Alissa Fox, senior vice president of the office of policy and representation for the Blue Cross Blue Shield Association. “Our plans are leading the health care industry in the development of patient-focused care programs that empha-size prevention, wellness, and coordinated care so that individuals get healthy faster and stay healthy longer,” Fox tells Managed Care. “We have documented reductions in emergency room visits, fewer hospital admissions and read-missions, and reduced hospital infection rates.”
She referred to the move to value-based care as well. “The programs today are centered on Blue companies’ ability to partner with medical professionals,” she said, ticking off some of the usual suspects of value-based care: data, ana-lytical expertise, and delivering “the most ap-propriate care in the most appropriate setting.”
With UnitedHealthcare’s announcement in April that it will be exiting most ACA exchanges next year, the challenges that the Blues face in the individual market may only get steeper.
Based on the first nine months of 2015 medical claims data. The blue bar represents individuals who enrolled prior to 2014 and continued BCBS individual coverage into 2015.Source: Blue Cross Blue Shield Association, “Newly Enrolled Members in the Individual Health Insurance Market After Health Care Reform: The Experience From 2014 and 2015,” March 2016
2015 prevalence of select conditions(Per 10,000)
0
100
200
300
400
500
600
700
800
565
702 735
235
456424
244
371 351
101 133 109
Hypertension Diabetes Depression Coronary artery disease
Individuals whoenrolled prior to 2014
Employer-based groupmembers in 2015
Newly enrolled individualsin 2014 and 2015

26 MANAGED CARE / MAY 2016
are “very preliminary,” CMS said. Data collected as the program rolls on will help nail down the cost details. In addition, the demonstration project was not a randomized controlled trial, so there should be some caution about strong conclusions drawn from comparisons of participants and nonparticipants.
Patients with prediabetes were identified through ICD-9 codes related to glucose levels, which do not match the criteria CMS used for inclusion in the program and which might have created biased results, CMS said. “In particular, 38% of the participants in the treatment group were diagnosed with diabetes at some point, a factor that would have made them ineligible for the intervention,” CMS said. When RTI International, the government contractor that evalu-ated the demonstration, redid their analysis without the participants with diabetes, the savings were halved, although they were still statistically significant.
The eligibility requirements of the expansion will be the same, and include a BMI of 25 or greater. One difference: The expansion might set the FPG at 110 to 125 mg/dl, CMS said.
Health insurers have historically been lukewarm about diabetes prevention and disease management programs, mostly because some competitor might reap the benefit five or ten years down the line. That’s not quite the case any more, said Kenneth Thorpe, a professor at Emory University.
By Frank Diamond
CMS has got prediabetes in its sights. The agency was so pleased with a demonstration project aimed at this condition, it announced last month
that it would expand the effort nationally. Currently, the agency operates the prediabetes program, officially called the YMCA of the USA Diabetes Prevention Program (Y-USA DPP), at 17 Ys across the country.
Medicare beneficiaries with prediabetes began en-rolling in the demonstration on Feb. 15, 2013. As of March 2015, the latest available tally, 6,874 people had attended at least one session; 5,696 became enrolled, which CMS defines as having attended at least four sessions. More than 60% of participants were aged 65 to 75. The sessions—very hands-on experiences—are all about diet and exercise. Those attending at least four core sessions experienced an average weight loss of 4.73%, and those attending at least nine lost 5.17%.
Diabetes is diagnosed with an HbA1c of 6.5% or greater; a fasting plasma glucose (FPG) of 126 mg/dl or above; and an oral glucose tolerance test (OGTT) of 200 mg/dl or higher. Prediabetes is defined as an HbA1c of 5.7% to 6.5%; an FPG of 100 to 125 mg/dl; and an OGTT of 140 to 199 mg/dl.
Medicare officials estimate the program saved $2,650 per enrollee over 15 months, compared with matched beneficiaries who did not participate. After the end-of-study follow-up (2.8 years, on average), diabetes incidence was reduced 58% in the lifestyle group compared with the comparison group, accord-ing to the CMS letter certifying the program.
Still to comeDetails of the expansion, in which public comment will be invited, have yet to be announced, but that expansion is definitely coming. Under the ACA, HHS Secretary Sylvia Mathews Burwell can expand, by regulation, successful demonstration programs that save money. Before the ACA, such a move required Congressional approval, and all the haggling and horse trading that might involve.
It’s a crucial distinction, because the financial ben-efits of wellness programs are a source of contention (see page 32), and even CMS alluded to the problem. The savings look promising, for now, but the results
Details are yet to come, but officials hope to replicate the impressive clinical and cost saving achievements garnered in a program that has been run out of selected YMCAs.
Prediabetes Pilot Lands CMS Expansion
You get results within the first six months in the CMS program, notes Kenneth Thorpe of Emory University. That’s just one of the reasons that health insurers will be watching.

MAY 2016 / MANAGED CARE 27
“You get results within the first six months,” Thorpe told Managed Care. “And certainly within the first year, you’re seeing weight loss of 5% to 7%. So, if you can prevent basically 58% of new cases of diabetes, you’re saving money in the first year.”
Thorpe was lead author of a September 2011 study in Health Affairs that first measured the benefit of weight loss programs at YMCAs. It concluded that “Medicare savings could range from approximately $7 billion to $15 billion, depending on how broadly program eligibility was defined and actual levels of program participation, for a single ‘wave’ of eligible people.” The next year, the Y received a federal grant of about $12 million to test the diabetes prevention program in eight states.
Employers and health plans should pay atten-tion, said Thorpe. “The management of diabetes is
important for any employer, because to the extent that you have it under control, you’re going to avoid workers going blind, you’re going to avoid very costly amputations, and [avoid] other serious cardiovascular events that are very, very expensive. If you’re a self-insured employer, these are savings that go right to your bottom line pretty quickly.”
Of course, everything comes back to funding. The fact that CMS picks up the tab for the program made enrollment at YMCAs that participated in the dem-onstration jump nearly 1,100% compared with the antidiabetes programs that the Ys historically ran, and for which participants often had to pay. CMS hasn’t yet said how it plans to pay for the expansion.
The core curriculum’s 16 sessions, delivered over eight months to a year, cover diet, exercise, and making lifestyle changes. “After completion of the core cur-riculum, lifestyle coaches were required to meet with participants face-to-face once every two months, in either a group or an individual setting,” the CMS certification letter said.
The expansion, which will also use “lay health workers,” will again be run at YMCAs, but CMS of-ficials also mentioned community centers, churches, and other local organizations. “Lifestyle coaches
receive about 30 hours of training; however, aside from this instruction, a high school diploma is the only requirement for employment,” CMS said.
Modern spinOmada Health, a San Francisco-based digital behav-ioral medicine company, has discussed a possible role in the expansion with CMS officials that would give the effort more of a 21st century feel, said Mike Payne, Omada’s head of medical affairs. “We are a health care provider organization, in some ways akin to a specialty clinic,” Payne told Managed Care. “It just so happens that patients don’t come in and see us. They get on their phones, tablets, computers.”
Omada provides diabetes prevention services for about 55,000 people, most of whom have employer-sponsored insurance. Payne describes what Omada does as digital behavioral medicine that borrows some techniques from Alcoholics Anonymous and similar programs.
“You’ve got a health coach, you’ve got a curriculum, you’ve got some tracking tools, you have some educa-tion, but you also have a lot of emotional interactions and collaboration, and in some cases, competition around things like weight loss,” Payne said.
Payne also points out that Omada’s approach very much keeps in line with CMS’s push for value-based health care. The agency wants 30% of Medicare outlays by 2016, and half by 2018, to be routed through alter-native payment models such as ACOs and bundled payments.
“We price based on outcomes,” Payne said. “We just don’t believe in pricing for access, for example, per member per month.” Omada charges a “modest” enrollment fee, “but then we only make money if we help people.”
CMS officials might include digital tools in the expansion of the prediabetes program, says Mike Payne, head of medical affairs at Omada Health. Omada hopes to supply those tools.
The fact that CMS picks up the tab for the program made enrollment
at YMCAs that participated in the dem-onstration jump nearly 1,100% com-pared with the antidiabetes programs that the Ys historically ran, and for which participants often had to pay.
28 MANAGED CARE / MAY 2016
T O M O R R O W ’ S M E D I C I N E
My “times have changed” file seems to get bigger by the day. When I was a medical student more than 40 years
ago, we were taught several things about type II diabetes—we used the Roman numeral back then. It was rare, affecting less than 1% of the population. That it was a so-called lifestyle disease that could be influenced by the way people ate, how much they exercised, and the pounds they gained or lost. And that it could be brought under control with sulfonylurea drugs, such as acetohexamide, chlorpropamide, and tolbutamide, or one or more of the several different varieties of insulin derived from the pancreases of pigs and cattle.
The sulfonylurea drugs are now almost relics, replaced by scores of other medications and an array of combinations. Recombinant DNA techniques have made harvesting insulin from animals obsolete. Yet despite the truly mindbog-gling amounts of money and effort spent on research into the pathophysiology of diabetes and its treatment, the disease is now almost 10 times as common as it used to be and is predicted to climb to catastrophic levels by midcentury, partly because people are getting heavier and heavier.
No doubt the pharmaceutical and device companies have made significant strides in the treatment of diabetes after it has developed. But there is renewed attention on preventing diabe-tes from developing in the first place. Almost 90 million Americans—the equivalent of the
populations of California, Texas, and Florida combined—are in the “prediabetes” category, that is easily identified and can be managed outside the walls of a doctor’s office or a health clinic. The CDC estimates that without inter-vention of some kind, between 15% and 30% of adults at high risk for developing type 2 diabetes will develop the disease within five years and that within 10 years, most will.
Numerous diabetes prevention trials have shown that moderate weight loss (5% to 7% of body weight) and increased physical activity can prevent or delay the incidence of diabetes by 58%, and among adults older than age 60, the results are even better.
CDC monitoringBased on an NIH-funded clinical trial published in the New England Journal of Medicine in 2002, the CDC began to build capacity among a wide variety of community organizations to deliver the National Diabetes Prevention Program, which not only encourages people to improve their diets and get more exercise but also deliv-ers advice about how to cope with stress and deal with the backsliding that inevitably occurs when people work to undo bad habits. The CDC established the Diabetes Prevention Recognition Program to monitor providers of the program and acknowledge successful organizations.
Hundreds of organizations have gotten the CDC’s diabetes prevention stamp of approval, including the YMCA, faith-based groups, and companies like Weight Watchers. These organ-izations are providing low-cost prevention pro-grams at a grassroots level that no centralized program could ever match.
This is 2016, so naturally dozens of digital companies are jumping into the fray, including Yes Health, Noom, and Retrofit, with programs that they say they can scale up. Other companies, such as Omada Health and Pack Health, are also
Startup Creates Marketplace For Diabetes Prevention ProgramsA CDC program shows that diabetes prevention works. Solera hopes to link up health plan enrollees with digital and community-based prevention programs.Thomas Morrow, MD
Thomas Morrow, MD, is the chief medical officer of Next IT. He has been the founding medical director of five HMOs and a disease management company, a medical director at Genentech, and president of the National Association of Managed Care Physicians. You can contact him at [email protected].
MAY 2016 / MANAGED CARE 29
T O M O R R O W ’ S M E D I C I N E
viders, many of which had previously relied on ad hoc grant funding.
But we are just at the start of an era of orga-nized marketplaces for prediabetes programs and perhaps other prevention services. Another company, Equity Healthcare in Nashville, is right on the heels of Solera with plans to offer a technology platform or “marketplace” for diabetes and prediabetes. Equity is also rolling out an innovative product that will allow large employers to purchase discounted “blocks” of medical care. The company says it will eventually have a platform where employers and employees can purchase joint replacements, durable medi-cal goods, dental care, care for some individual diseases—the list goes on and on. Equity says it will be serving up an abundance of price transparency, comparative data, and bundled payments, all of which are in sync with the value-based payment models CMS and other insurers are offering.
In diabetes, it may be time to try a new ap-proach. All the new medications and devices in the clinical realm that I have highlighted in To-morrow’s Medicine over the past 15 years have not prevented diabetes, once a relatively rare dis-ease, from becoming increasingly common and with that, a major health and financial burden.
Perhaps we need a new combination to change the future of diabetes and all the suf-fering it brings: Prevention programs with deep community roots and savvy and the kind of sophisticated, digital, and data-gathering technology platforms that Solera and Equity Healthcare are building.
getting into the game, using a combination of telephone-based coaching along with various levels of digital integration to build on the model.
Enter Solera Health, a Phoenix start-up that says it can be the Amazon or Uber of diabetes and other chronic disease prevention programs. The company contracts with health plans to provide diabetes prevention under a pay-for-performance model. Solera’s pitch is that it can be a go-between for the millions of people who might benefit from an organized prevention pro-gram and the growing number of organizations that are more than willing to provide one. The company touts the versatility of its technology platform and its ability to handle payment, data aggregation, and government reporting as well as service referrals. Solera says doctors will be fans because they will be able refer their patients to a vetted network of community and digital prevention providers. And if Solera lives up to its promise, patients should also utilize an online experience that allows them to pick from a variety of community and digital providers based on their needs, ease of access, language and other preferences.
Solera says it can also help the providers of diabetes prevention programs by assuming re-sponsibility for patient identification, enroll-ment processes, and reimbursement.
Equity Healthcare in the gameGuided by the CDC’s curriculum and extensive data collection along the way, the providers of diabetes prevention programs as managed by Solera are paid on outcomes—after the results are attained, not before! All de-identified pa-tient data on qualification criteria, engagement, minutes of physical activity, frequency of food tracking, and weight loss are sent to the CDC. Results so far have shown that about half of all people who enroll are engaged enough to meet the 5% weight loss that triggers the payment. Research, as well as Solera’s experience, has shown that purely digital programs and those that involve contact with a person, either in person or over the phone, are equally popular and produce similar outcomes.
Currently, Solera offers its services to more than 21 million people through their health plan contracts. There is no cost to the plan members; the health plan pays all of the fees. The money flows through to the prevention program pro-
ADVERTISING INDEX
Kentmeme HealthcareCorporate .........................................................................11
ShireDisease Awareness ............................................................5
Editor’s note: Conflict of Interest statementDr. Morrow in his role as chief medical officer of Next IT is in the early stages of creating a virtual health coach for prediabetes using artificial intel-ligence and natural language. Next IT’s services may eventually be offered on Solera’s platform.

30 MANAGED CARE / MAY 2016
Digital health tools In March, NEBGH issued Digital Diabetes Prevention and Management Solutions, a report that profiles digital health tools for diabetes self-management.
“We believe digital diabetes tools can help employ-ers achieve better outcomes by addressing challenges with traditional diabetes programs such as employee engagement, effective collaboration with the delivery system and sustaining behavior change,” says Nobel.
The lack of engagement is the biggest challenge. Nobel says employees in current programs either don’t participate at all since coaching calls in most programs come from an entity separate from their doctor, or employees don’t sustain their participation over the long term. There is both apathy on the part of employees and a lack of personalization on the part of the program providers. And, importantly, there is little or no integration with the employee’s primary medical care.
NEBGH’s digital tools guide is designed to help employers determine which features are most im-portant in addressing the specific challenges they face with their workplace diabetes programs. The guide categorizes 25 tools according to their primary capability such as health management courses with live coaches, scripted coaching, capture of glucometer and other personal health data, and links to primary care providers. It also has a section on the social net-working features. For example, there are tools that connect to continuous glucose monitors and allow data to be transmitted to up to five other individu-als. With today’s medicines, hypoglycemia is much more of a risk than hyperglycemia and connectivity to others might be particularly beneficial for patients who are susceptible because then others keep an eye on the person’s glucose levels. The social networking
By Thomas Reinke
Employer sponsored wellness programs started out as rather simple initiatives designed to get employees thinking about managing their health.
The first-generation programs were usually voluntary and involved completing a health risk assessment and sometimes modest cash incentives to see if a little extra money could motivate more participation.
But many of these programs had few takers, partly because they were voluntary. Other problems were limited and poorly designed services that were not personalized. As a result they often did not lead to behavior changes to reduce risks or more active man-agement of existing health problems.
Now the first wave of wellness programs are giving way to the 2.0 version that proponents say are more personalized and have more actionable services than their forerunners. And perhaps the biggest change is that employers are moving to make them mandatory.
Diabetes is one of the reasons that employers are ramping up their wellness programs. “Employers are keenly aware of the impact of diabetes on health care costs and they see the opportunity for digital health tools to help manage this complex condition,” says Jeremy Nobel, MD, medical director of the Northeast Business Group on Health (NEBGH). Diabetes, with its peaks and valleys in blood sugar levels, requires much more active daily management in comparison to other chronic conditions such as hypertension or dyslipidemia, says Nobel.
Moreover, when it’s not managed well, diabetes increases the risks for cardiovascular disease, kidney dysfunction, retinopathy, and amputations. Mean-while, the cost of diabetes medications is soaring. The 2016 Express Scripts drug trend report lists diabetic medications as the top traditional therapy drug class with per-member, per-year (PMPY) expenditures at $77.50 for commercial members (see page 51 for more on diabetes medications). Pain medications at $40.65 PMPY are a distant second. According to the Express Scripts report, spending on diabetes medi-cations increased 14% in 2015 with 6.7% attributable to utilization increases and 7.4% coming from unit cost increases.
Many new digital health care tools focus on what has too often stumped anti-diabetes efforts in the past: lack of patient engagement.
Diabetes Self-ManagementMoves Into the 21st Century
Many programs suffer from employee apathy and a lack of personalization on the part of program directors, says Jeremy Nobel, MD, of the North-east Business Group on Health.

MAY 2016 / MANAGED CARE 31
capabilities also provide an opportunity for patients to connect with others in a self-support group, which can increase their motivation to manage their disease.
Traditional vs. newNobel says employers are interested in tools that promote more active self-management. Many of the tools capture clinical and activity data and offer analytics that translate the information into person-alized and actionable feedback which is key to self-management and long term engagement.
Another engagement and self-management feature that employers are interested in is the ability to connect employees to their doctors to coordinate care; however, physician practices are very busy and telehealth re-imbursement is still a problem.
HealthMine, a company that offers wellness pro-grams to employers and health plans has studied the use of some of the new tools in a population of commercially insured adults with diabetes. It found that 74% of the respondents used mobile apps daily but only 45% use diabetes mobile apps. Among the nonusers, 41% said they preferred traditional methods for monitoring and managing their diabetes. Among those using mobile apps the top three were a blood sugar monitor, a blood pressure monitor and a food/nutrition app.
Bryce Williams, the CEO of HealthMine, says wellness programs have suffered because they are not personal enough: “People want personal data returned to tell them what they need to do next.” He says programs are being redesigned to include IT platforms that will store clinical and behavioral health data and provide individualized guidance for improving risk factors.
Williams says employers are starting to include both carrot and stick in their wellness programs, a trend that the ACA has fueled and sanctioned with its provision that allows employers to vary premiums and out-of-pocket health care costs with participation in wellness programs. Williams says carrots include new incentives tied to the achievement of personal-ized goals that are developed from clinical data. He calls these new incentives dynamic incentives; they are variable incentives tied to the achievement of
goals structured in steps with increased incentives for higher levels of performance. The sticks include financial penalties for not participating in or complet-ing health actions such as getting an annual physical and taking medications as prescribed for conditions like high cholesterol.
There use of penalties and disincentives has been limited, in part, because of conflicting regulations from the Department of Labor, the IRS, and HHS. In the past year, court decisions on several lawsuits have paved the way for employers to mandate participation in wellness programs and impose sizable penalties on employees who do not participate.
In the most publicized case, Honeywell successfully defended itself against the lawsuit brought by the Equal Employment Opportunity Commission (EEOC) to block the company from assessing financial penalties on workers who refuse to participate in the company’s wellness program. Holdouts were assessed a $500 sur-charge on their 2015 health insurance plans and could lose as much as $1,500 in company contributions to health savings accounts. They also could be docked as much as $2,000 more in tobacco-related surcharges.
The EEOC took the position that the penalties violated the Americans with Disabilities Act (ADA) and the Genetic Information Nondiscrimination Act (GINA). The ADA limits required medical exams and GINA prevents discrimination against inherited traits. But the court ruled that Honeywell’s program did not violate the relevant laws and, subsequently, the EEOC proposed rules that allow the use of financial rewards and penalties.
HealthMine’s Williams says that as a result of Hon-eywell’s success other employers are beginning to im-plement stiffer financial penalties for nonparticipation.
A 2015 HealthMine survey of 2,000 insured con-sumers found that workers themselves support the idea of higher costs for unhealthy behaviors; for example, 63% say that plan members who smoke should pay more for their health insurance or health care.
Employer involvementDiabetes makes sense as a target for wellness efforts. Its complications are costly. There’s good evidence that eating and exercise habits that people have some control over—and that wellness programs might in-fluence—can help manage the disease and possibly prevent it from developing in the first place.
Doubts remain, though. These new-and-improved IT-based wellness programs have a limited track record. And there’s the fundamental question of how people will respond to their employers getting so involved in issues like how much they weigh and what they eat.
Wellness programs are being redesigned to include IT plat-forms that will store clinical data and provide guidance, says Bryce Williams, CEO of HealthMine.

32 MANAGED CARE / MAY 2016
Wellness Programs Will Not and Cannot Prevent Diabetes
By Al Lewis
Conventional workplace wellness has not worked, by any measure. Partly, that’s because only a small percentage of people who quit smoking or lose
weight succeed in the long term even when they are self-motivated. And employers cajoling employees is the opposite of self-motivation. Also, employers spend surprisingly little money on hospital admissions related to conditions that wellness programs are de-signed to address, compounding the poor economics of medicalizing the workplace.
Prediabetes risk factor reduction is the poster child for the failure of workplace wellness. It specifically has failed in three in-stances where success would have seemed most likely: a health insurance company spending $500 per employee, a wellness vendor itself, and an award-winning wellness program.
Aetna’s experienceTake the first instance. Aetna thought workplace wellness could prevent diabetes and prediabetes. To that end, it launched a program for 500 of its own employees in October 2013. In practice, however, Aetna’s study group didn’t outperform its control group, despite Aetna spending an industry-leading $500 per participant fee, as outlined in a December 2015 study published in the Journal of Environmental and Occupational Medicine.
Then, there are the wellness vendors themselves. One, Vitality, couldn’t reduce the weight of its own employees. At least that was an honest admission. Now, examine the industry’s allegedly most successful program by visit-ing the website that I write for, www.theysaidwhat.net, and search for Navistar. Navistar originally claimed an industry-leading 400-to-1 ROI. Then their ROI inexpli-cably plummeted to 40-to-1 before equally inexplicably
bouncing back to 400-to-1. Questioning that accounting would put you in good company: While Navistar was “doing wellness,” it was also “doing fraud.” The Dow Jones dropped them and the stock exchange delisted them. They also wrote off $4 billion in fake shareholder equity, fired successive CFOs, and sued their auditor.
Next, consider McKesson. As described in Employee Benefit News, McKesson’s program won the 2015 C. Everett Koop National Health Award. Yet BMI and glucose increased. If an award-winning company can’t reduce
employee diabetes risk factors, who can?
Losses and more lossesEven the hypothetical scenario presented by the Health Enhancement Research Organi-zation and Population Health Alliance to justify wellness (“Program Measurement and Evaluation Guide: Core Metrics for Employee Health Management”) actually shows losses—a vendor charging $18 per employee per year to save only $12 in claims. Substituting your own program fees for that hypothetical $18
could even increase those losses. And note their caution that utilization declines only in wellness-sensitive hospi-tal admissions. They freely admit other medical claims increase, but they don’t count those increases against the $12 in gross savings.
If wellness worked in practice, there would have been a steady and dramatic reduction in admissions related to heart disease, diabetes, and other cardiometabolic problems paralleling this century’s explosion of wellness programs. Instead, the admission rate for the commercially insured population (largely exposed to wellness) has flat-lined on an absolute basis. On a relative basis, the exposed population has slightly underperformed the remainder of the population that has no exposure to workplace wellness. In other words, wellness-sensitive admissions haven’t declined faster than admissions as a whole.
DO DIABETES WELLNESS It depends on whom you ask. Managed Care asked two experts: “Can a wellness program help decrease the incidence of and/or lessen the severity of diabetes or prediabetes?”
No! argues Al Lewis. Lewis, a critic of the programs, is the CEO
of Quizzify, a leading employee health care education company, and author of Why Nobody Believes the Numbers: Separating Fact from Fiction in Population Health Man-agement.
Yes! rebuts Harris Allen, PhD. Allen, a defender of wellness, leads
the Harris Allen Group, an inde-pendent consultancy founded in 1998 to promote stakeholder value and sustainability in health and health care.
Allen is also a senior lecturer on health care leadership at Brown University.
POINT/counterPOINT
Al Lewis

MAY 2016 / MANAGED CARE 33
PROGRAMS WORK?Workplace Wellness and Diabetes: An Approach Coming of Age
By Harris Allen
Some 86 million Americans with prediabetes prog-ress toward diabetes at a rate of 5% to 10% per year. The CDC Diabetes Prevention Program (DPP),
a randomized clinical trial based on the NIH-funded Diabetes Prevention Program, has shown that this rate can be reduced significantly by a structured lifestyle intervention focusing on physical exercise and diet and by prophylactic metformin treatment.
Subsequent work has paved the way for deployment of the DPP and like-minded inter ventions in work settings. For instance, in an initial test, researchers at Brigham Young University demonstrated that the DPP can be success-fully implemented in the workplace.
Moreover, to mitigate the structural dif-ficulties of implementing large-scale life-style enhancement programs and concerns about metformin side effects, University of Michigan researchers have developed risk-stratification models. Likewise, a 12-month worksite-based education program can sig-nificantly improve diabetes knowledge and self-efficacy, even in a workforce with well-controlled diabetes, as demonstrated in a 2015 study published in Population Health Management.
The Validation Institute, which has been critical of workplace wellness programs, recently publicized a claims-based audit of prepublished data on diabetes that documents workplace wellness effectiveness. Among the institute’s “validated organizations” is US Preven-tive Medicine (USPM), a leading wellness services pro-vider. The institute’s website cites USPM’s “sustained … reduction(s) in wellness-sensitive medical events” across several major diseases—including diabetes—that “sig-nificantly outpaced the much smaller national decline in these events.” While the institute’s website does not furnish the details—in sharp contrast to that provided on other similar entities’s websites like the Koop Award program—this development helps to dispel the notion that workplace wellness is incapable of sustained reduc-tions in diabetes burden.
Not all studies of workplace programs have yielded positive results. Consider a randomized controlled trial
of three self-management interventions for employees with diabetes. The results, published in Population Health Management in 2012, show that at one year, neither use of a personal digital assistant handheld device, participation in a six-week chronic disease self-management program, nor the two combined, led to greater reductions in lost productivity costs than the usual care arm.
What accounts for the uneven results? One explana-tion is scope. Compare the information-imparting focus of self-management interventions with the information → knowledge → activation → sustainment progression
that USPM promotes with its integrated suite of “high tech, high touch” population health services.
Clearly, all that passes today for workplace wellness is not geared for success. Kaiser’s Employer Health Benefit Survey reports that while 74% of firms offering health benefits in 2014 included wellness programs, there is variation in the services they provide. The Rand Corporation reports that only 12.9% of wellness programs can be characterized as comprehensive.
The question is not whether workplace wellness can exert an impact—it can—but how best to design a program so it will. Researchers at HealthPartners Institute have identified five elements defining comprehensive-ness: health education, supportive physical and social environments, program integration into the organization’s structure, linkages to related programs, and worksite screening programs. Comprehensiveness, however, is just one of nine dimensions in their framework. Their premise is that the more that interventions advance on all these dimensions, the better the chances of success.
Ultimately the will to make the investments that move the needle is key. Evidence-based workplace health pro-motion and disease management programs continue to present opportunities for employers to reduce the incidence and severity of diabetes. Elsewhere I have argued that the workplace wellness successes of leading employers offer much grist for providers, payers, and other stakeholders as the latter grapple with their own value/sustainability challenges. These gains on diabetes further attest that it is very much in our collective best interest to promote well-executed workplace wellness.
Harris Allen
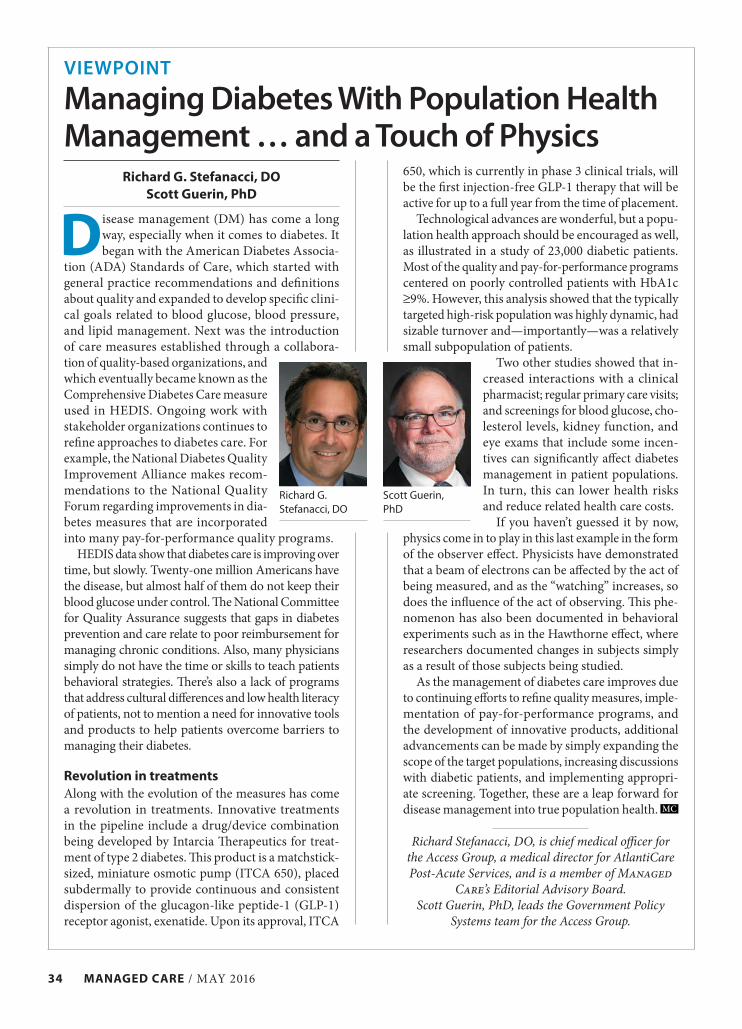
34 MANAGED CARE / MAY 2016
Richard G. Stefanacci, DO Scott Guerin, PhD
Disease management (DM) has come a long way, especially when it comes to diabetes. It began with the American Diabetes Associa-
tion (ADA) Standards of Care, which started with general practice recommendations and definitions about quality and expanded to develop specific clini-cal goals related to blood glucose, blood pressure, and lipid management. Next was the introduction of care measures established through a collabora-tion of quality-based organizations, and which eventually became known as the Comprehensive Diabetes Care measure used in HEDIS. Ongoing work with stakeholder organizations continues to refine approaches to diabetes care. For example, the National Diabetes Quality Improvement Alliance makes recom-mendations to the National Quality Forum regarding improvements in dia-betes measures that are incorporated into many pay-for-performance quality programs.
HEDIS data show that diabetes care is improving over time, but slowly. Twenty-one million Americans have the disease, but almost half of them do not keep their blood glucose under control. The National Committee for Quality Assurance suggests that gaps in diabetes prevention and care relate to poor reimbursement for managing chronic conditions. Also, many physicians simply do not have the time or skills to teach patients behavioral strategies. There’s also a lack of programs that address cultural differences and low health literacy of patients, not to mention a need for innovative tools and products to help patients overcome barriers to managing their diabetes.
Revolution in treatments Along with the evolution of the measures has come a revolution in treatments. Innovative treatments in the pipeline include a drug/device combination being developed by Intarcia Therapeutics for treat-ment of type 2 diabetes. This product is a matchstick-sized, miniature osmotic pump (ITCA 650), placed subdermally to provide continuous and consistent dispersion of the glucagon-like peptide-1 (GLP-1) receptor agonist, exenatide. Upon its approval, ITCA
650, which is currently in phase 3 clinical trials, will be the first injection-free GLP-1 therapy that will be active for up to a full year from the time of placement.
Technological advances are wonderful, but a popu-lation health approach should be encouraged as well, as illustrated in a study of 23,000 diabetic patients. Most of the quality and pay-for-performance programs centered on poorly controlled patients with HbA1c ≥9%. However, this analysis showed that the typically targeted high-risk population was highly dynamic, had sizable turnover and—importantly—was a relatively small subpopulation of patients.
Two other studies showed that in-creased interactions with a clinical pharmacist; regular primary care visits; and screenings for blood glucose, cho-lesterol levels, kidney function, and eye exams that include some incen-tives can significantly affect diabetes management in patient populations. In turn, this can lower health risks and reduce related health care costs.
If you haven’t guessed it by now, physics come in to play in this last example in the form of the observer effect. Physicists have demonstrated that a beam of electrons can be affected by the act of being measured, and as the “watching” increases, so does the influence of the act of observing. This phe-nomenon has also been documented in behavioral experiments such as in the Hawthorne effect, where researchers documented changes in subjects simply as a result of those subjects being studied.
As the management of diabetes care improves due to continuing efforts to refine quality measures, imple-mentation of pay-for-performance programs, and the development of innovative products, additional advancements can be made by simply expanding the scope of the target populations, increasing discussions with diabetic patients, and implementing appropri-ate screening. Together, these are a leap forward for disease management into true population health.
Richard Stefanacci, DO, is chief medical officer for the Access Group, a medical director for AtlantiCare Post-Acute Services, and is a member of Managed
Care’s Editorial Advisory Board. Scott Guerin, PhD, leads the Government Policy
Systems team for the Access Group.
Managing Diabetes With Population Health Management … and a Touch of Physics
VIEWPOINT
Richard G. Stefanacci, DO
Scott Guerin, PhD
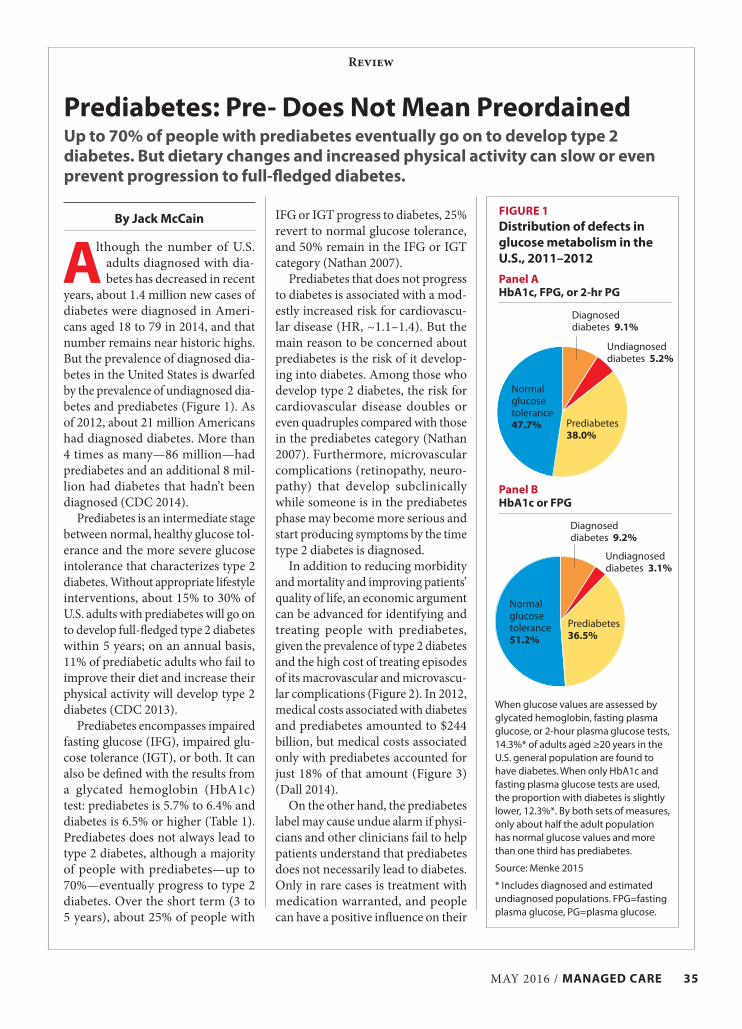
MAY 2016 / MANAGED CARE 35
Prediabetes: Pre- Does Not Mean PreordainedUp to 70% of people with prediabetes eventually go on to develop type 2 diabetes. But dietary changes and increased physical activity can slow or even prevent progression to full-fledged diabetes.
By Jack McCain
Although the number of U.S. adults diagnosed with dia-betes has decreased in recent
years, about 1.4 million new cases of diabetes were diagnosed in Ameri-cans aged 18 to 79 in 2014, and that number remains near historic highs. But the prevalence of diagnosed dia-betes in the United States is dwarfed by the prevalence of undiagnosed dia-betes and prediabetes (Figure 1). As of 2012, about 21 million Americans had diagnosed diabetes. More than 4 times as many—86 million—had prediabetes and an additional 8 mil-lion had diabetes that hadn’t been diagnosed (CDC 2014).
Prediabetes is an intermediate stage between normal, healthy glucose tol-erance and the more severe glucose intolerance that characterizes type 2 diabetes. Without appropriate lifestyle interventions, about 15% to 30% of U.S. adults with prediabetes will go on to develop full-fledged type 2 diabetes within 5 years; on an annual basis, 11% of prediabetic adults who fail to improve their diet and increase their physical activity will develop type 2 diabetes (CDC 2013).
Prediabetes encompasses impaired fasting glucose (IFG), impaired glu-cose tolerance (IGT), or both. It can also be defined with the results from a glycated hemoglobin (HbA1c) test: prediabetes is 5.7% to 6.4% and diabetes is 6.5% or higher (Table 1). Prediabetes does not always lead to type 2 diabetes, although a majority of people with prediabetes—up to 70%—eventually progress to type 2 diabetes. Over the short term (3 to 5 years), about 25% of people with
Review
IFG or IGT progress to diabetes, 25% revert to normal glucose tolerance, and 50% remain in the IFG or IGT category (Nathan 2007).
Prediabetes that does not progress to diabetes is associated with a mod-estly increased risk for cardiovascu-lar disease (HR, ~1.1–1.4). But the main reason to be concerned about prediabetes is the risk of it develop-ing into diabetes. Among those who develop type 2 diabetes, the risk for cardiovascular disease doubles or even quadruples compared with those in the prediabetes category (Nathan 2007). Furthermore, microvascular complications (retinopathy, neuro-pathy) that develop subclinically while someone is in the prediabetes phase may become more serious and start producing symptoms by the time type 2 diabetes is diagnosed.
In addition to reducing morbidity and mortality and improving patients’ quality of life, an economic argument can be advanced for identifying and treating people with prediabetes, given the prevalence of type 2 diabetes and the high cost of treating episodes of its macrovascular and microvascu-lar complications (Figure 2). In 2012, medical costs associated with diabetes and prediabetes amounted to $244 billion, but medical costs associated only with prediabetes accounted for just 18% of that amount (Figure 3) (Dall 2014).
On the other hand, the prediabetes label may cause undue alarm if physi-cians and other clinicians fail to help patients understand that prediabetes does not necessarily lead to diabetes. Only in rare cases is treatment with medication warranted, and people can have a positive influence on their
When glucose values are assessed by glycated hemoglobin, fasting plasma glucose, or 2-hour plasma glucose tests, 14.3%* of adults aged ≥20 years in the U.S. general population are found to have diabetes. When only HbA1c and fasting plasma glucose tests are used, the proportion with diabetes is slightly lower, 12.3%*. By both sets of measures, only about half the adult population has normal glucose values and more than one third has prediabetes.
Source: Menke 2015
* Includes diagnosed and estimated undiagnosed populations. FPG=fasting plasma glucose, PG=plasma glucose.
FIGURE 1Distribution of defects in glucose metabolism in the U.S., 2011–2012
Diagnosed diabetes 9.2%
Panel BHbA1c or FPG
Panel AHbA1c, FPG, or 2-hr PG
Prediabetes 36.5%
Normal glucose tolerance 51.2%
Diagnosed diabetes 9.1%
Prediabetes 38.0%
Normal glucose tolerance 47.7%
Undiagnosed diabetes 5.2%
Undiagnosed diabetes 3.1%
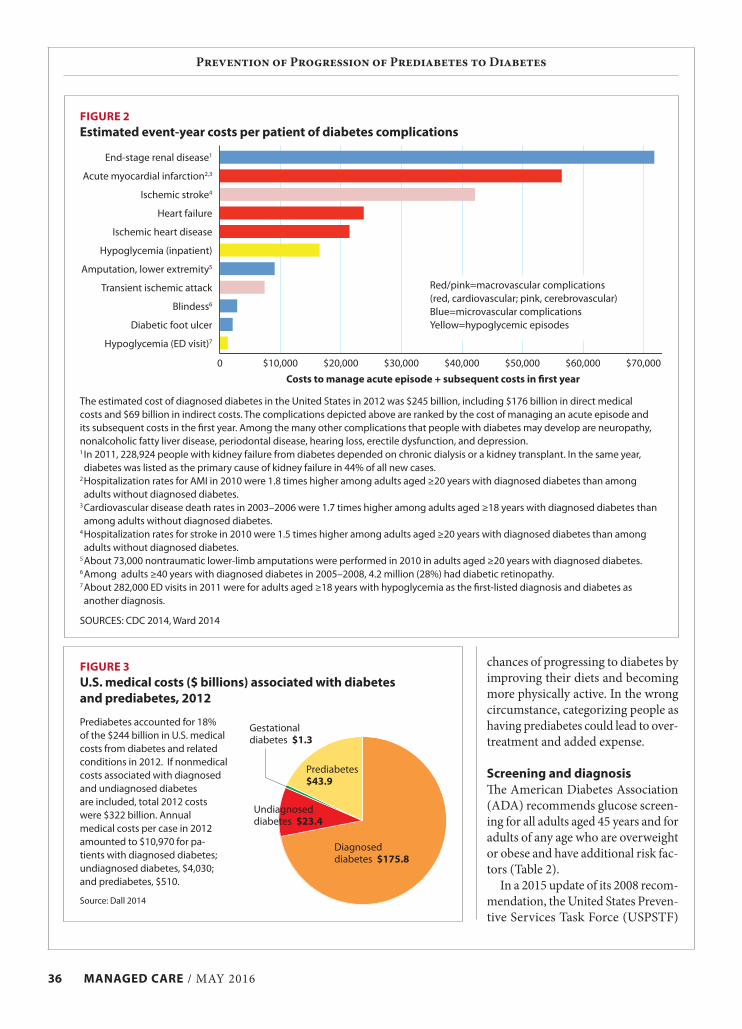
36 MANAGED CARE / MAY 2016
Prevention of Progression of Prediabetes to Diabetes
chances of progressing to diabetes by improving their diets and becoming more physically active. In the wrong circumstance, categorizing people as having prediabetes could lead to over-treatment and added expense.
Screening and diagnosisThe American Diabetes Association (ADA) recommends glucose screen-ing for all adults aged 45 years and for adults of any age who are overweight or obese and have additional risk fac-tors (Table 2).
In a 2015 update of its 2008 recom-mendation, the United States Preven-tive Services Task Force (USPSTF)
FIGURE 3U.S. medical costs ($ billions) associated with diabetes and prediabetes, 2012
Prediabetes accounted for 18% of the $244 billion in U.S. medical costs from diabetes and related conditions in 2012. If nonmedical costs associated with diagnosed and undiagnosed diabetes are included, total 2012 costs were $322 billion. Annual medical costs per case in 2012 amounted to $10,970 for pa-tients with diagnosed diabetes; undiagnosed diabetes, $4,030; and prediabetes, $510.
Source: Dall 2014
The estimated cost of diagnosed diabetes in the United States in 2012 was $245 billion, including $176 billion in direct medical costs and $69 billion in indirect costs. The complications depicted above are ranked by the cost of managing an acute episode and its subsequent costs in the first year. Among the many other complications that people with diabetes may develop are neuropathy, nonalcoholic fatty liver disease, periodontal disease, hearing loss, erectile dysfunction, and depression. 1 In 2011, 228,924 people with kidney failure from diabetes depended on chronic dialysis or a kidney transplant. In the same year, diabetes was listed as the primary cause of kidney failure in 44% of all new cases.
2 Hospitalization rates for AMI in 2010 were 1.8 times higher among adults aged ≥20 years with diagnosed diabetes than among adults without diagnosed diabetes.
3 Cardiovascular disease death rates in 2003–2006 were 1.7 times higher among adults aged ≥18 years with diagnosed diabetes than among adults without diagnosed diabetes.
4 Hospitalization rates for stroke in 2010 were 1.5 times higher among adults aged ≥20 years with diagnosed diabetes than among adults without diagnosed diabetes.
5 About 73,000 nontraumatic lower-limb amputations were performed in 2010 in adults aged ≥20 years with diagnosed diabetes.6 Among adults ≥40 years with diagnosed diabetes in 2005–2008, 4.2 million (28%) had diabetic retinopathy. 7 About 282,000 ED visits in 2011 were for adults aged ≥18 years with hypoglycemia as the first-listed diagnosis and diabetes as another diagnosis.
SOURCES: CDC 2014, Ward 2014
FIGURE 2Estimated event-year costs per patient of diabetes complications
End-stage renal disease1
Acute myocardial infarction2,3
Ischemic stroke4
Heart failure
Ischemic heart disease
Hypoglycemia (inpatient)
Amputation, lower extremity5
Transient ischemic attack
Blindess6
Diabetic foot ulcer
Hypoglycemia (ED visit)7
Costs to manage acute episode + subsequent costs in first year
Red/pink=macrovascular complications (red, cardiovascular; pink, cerebrovascular)Blue=microvascular complicationsYellow=hypoglycemic episodes
$10,0000 $20,000 $30,000 $40,000 $50,000 $60,000 $70,000
Diagnosed diabetes $175.8
Prediabetes $43.9
Gestational diabetes $1.3
Undiagnosed diabetes $23.4

MAY 2016 / MANAGED CARE 37
Prevention of Progression of Prediabetes to Diabetes
plasma glucose after a fast of at least 8 hours. The OGTT begins with an FPG test, after which the patient in-gests 75 g of glucose, which stimulates insulin secretion; plasma glucose is measured 2 hours after the glucose is swallowed. The HbA1c test measures the percentage of hemoglobin A (the predominant form of hemoglobin)
untreated) (Selph 2015b).The ADA today recognizes three
blood tests to screen for and diag-nose prediabetes and diabetes: theoral glucose tolerance test (OGTT), which is also known as the 2-hour plasma glucose test; fasting plasma glucose (FPG); and HbA1c (Table 1). The FPG test measures the amount of
recommended screening asymptom-atic nonpregnant adults, ages 40 to 70, for glucose abnormalities and type 2 diabetes if their body-mass index (BMI) is 25 or greater (Siu 2015). The task force previously recommended screening asymptomatic adults for diabetes if they had sustained blood pressure >135/80 mmHg (treated or
TABLE 1Screening and diagnostic tests for prediabetes and diabetes
Test
Test values
Advantages DisadvantagesNormal Prediabetes1 Diabetes
Fasting plasma glucose
<100 mg/dL
100–125 mg/dL(impaired fasting
glucose)
≥126 mg/dL • More convenient for patients than OGTT
• Less costly than OGTT
• Requires fasting ≥8 hours• Subject to day-to-day within-patient
variability• Acute illness or stress may increase
glucose levels• Unstable at room temperature
Oral glucose tolerance
<140 mg/dL
140–199 mg/dL (impaired glucose
tolerance)
≥200 mg/dL over
2 hours
• Requires fasting ≥ 8 hours• Requires 2 hours between blood draws• Subject to day-to-day within-patient
variability• Acute illness or stress may increase
glucose levels
HbA1c <5.7% 5.7–6.4% ≥6.5% • More convenient than glucose tests (no fasting, no timed measurements)
• Not subject to day-to-day within-patient variability
• Provides retrospective view of last 2–3 months of glucose level
• Severe illness may reduce life of red blood cells, resulting in value below true level
1Risk for diabetes can extend below the ranges listed. Within the ranges, risk increases in curvilinear fashion, such that the risk predicted when test results are in the high end of the range is considerably higher than the risk predicted by results in its low end.
Sources: ADA 2016a, ADA 2016b, Siu 2015
TABLE 2Screening for prediabetes and diabetes: Current ADA and USPSTF recommendations
ADA (ADA 2016a, ADA 2016b) USPSTF (Siu 2015)
Target population
• Asymptomatic adults of any age who are overweight or obese (BMI ≥25; ≥23 for Asian-Americans) and have additional risk factors1
• All adults age ≥45
• Adults aged 40–70 years who are overweight or obese
Screening interval
• Every 3 years (minimum) if tests are normal• Annually if patient has prediabetes or elevated risk
• Every 3 years if initial test normal
Confirmation of diagnosis
• Repeat same test without delay (with new blood sample)• If different test is used and both results are above diagnostic threshold,
diagnosis is confirmed• If different test is used and results are discordant, the test whose result is
above the diagnostic threshold should be repeated
• Repeat with same test on different day
Interventions • Intensive counseling on diet and physical activity• Metformin to be considered for patients with BMI >35, age <60 years,
or history of gestational diabetes
• Repeated counseling on diet and physical activity
1 Risk factors: prior test showing HbA1c ≥5.7%, IFG, or IGT; physical inactivity; first-degree relative with diabetes; belonging to race or ethnic group with high risk for diabetes; blood pressure ≥140/90 mmHg; current therapy for hypertension; HDL-cholesterol <35 mg/dL; triglyceride level >250 mg/dL; history of cardiovascular disease; diagnosis of gestational diabetes; delivery of baby >9 lb.

38 MANAGED CARE / MAY 2016
Prevention of Progression of Prediabetes to Diabetes
tions were found to decrease the risk of progression to diabetes by 45% (pooled RR, 0.55; CI, 0.43–0.70) (Selph 2015a). The USPSTF notes that while metformin and other drugs are effective in reducing progression to diabetes in patients with glucose abnormalities, lifestyle modifications (dietary changes and increased physi-cal activity) are more effective.
Yet in its review, the USPSTF found little evidence from random-ized controlled trials (RCTs) show-ing that treating IFG, IGT, or diabetes detected via screening results in mor-
risk patients tend to have multiple risk factors. Eating healthy foods and be-coming more physically active address elevated blood sugar, excessive weight, high blood pressure, and elevated lipid levels all at once, in contrast to drug treatment narrowly focused on indi-vidual risk factors (Siu 2015).
Research shows that lifestyle modi-fications modestly reduce the risk for CVD in populations with multiple risk factors such as excessive weight, hypertension, lipid disorders, and IFG or IGT. But in studies of patients with IFG or IGT, lifestyle interven-
to which glucose has bound, forming glycated hemoglobin. Once formed, HbA1c persists in a red blood cell un-til the cell dies. Because red blood cells live about 2 or 3 months, measuring the percentage of HbA1c provides a long-term picture of glycemic levels, in contrast to snapshots provided by glucose tests taken on a single day. These tests should not be regarded as just different ways to measure the same phenomenon, however.
The ADA notes that each test is equally appropriate but that a given test may fail to detect diabetes or prediabetes in an individual (ADA 2016a). That can happen because the physiologic mechanisms underly-ing IFG and IGT are different. IFG is characterized by hepatic insulin resistance, while IGT is character-ized by insulin resistance in skeletal muscle and greater beta-cell dysfunc-tion (Table 3, Figure 4).
Interventions The goal for patients with predia-betes is to stave off progression to full-blown diabetes. The ADA rec-ommends intensive counseling about diet and physical activity that aims for losing 7% of body weight. The term physical activity includes but is not restricted to structured exercise. For certain patients (BMI >35, age <60 years, history of gestational diabe-tes), metformin therapy also should be considered in addition to lifestyle modification (ADA 2016b).
The USPSTF found that a substan-tial body of evidence supports similar behavioral intervention because at-
TABLE 3Differences in metabolic abnormalities in IFG and IGT
Impaired fasting glucose (IFG) Impaired glucose tolerance (IGT)
Insulin resistance, hepatic Severe Modest
Insulin resistance, skeletal muscle Normal or near normal Severe
Beta-cell insulin secretion, first phase Severe impairment Severe impairment
Beta-cell insulin secretion, second phase Near normal Severe impairment
Source: Kanat 2012
Impaired fasting glucose (IFG) initially was defined, in 1997, as fasting plasma glucose (FPG) ≥110 mg/dL to 125 mg/dL. In 2003, the range was lowered to 100 mg/dL. In the fasting state, the rate of hepatic glucose production is the key factor determining the plasma glucose level; insulin-resistant hepatocytes release glucose into the bloodstream, resulting in elevated plasma glucose concentrations. Despite 2-hour glucose <140 mg/dL, patients with isolated IFG are at higher risk of progressing to diabetes, possibly because of diminished β-cell function.
Source: ADA 2016a, Abdul-Ghani 2008, Faerch 2016
FIGURE 4Glucose defects in IFG, IGT by current ADA definitions
Isolated IFG(hepatic insulin
resistance + 1st-phase β-cell impairment)
Type 2 diabetes
Normal glucose tolerance
Combined IFG/IGT(defects of IFG and IGT)
Isolated IGT(skeletal muscle insulin
resistance + 1st- and 2nd-phase β-cell impairment)
2001402-hour plasma glucose, mg/dl
Fast
ing
pla
sma 125
100

MAY 2016 / MANAGED CARE 39
Prevention of Progression of Prediabetes to Diabetes
gold standard for diagnosing diabetes.An argument supporting the initial
range defining IGT was that micro-vascular complications of diabetes were thought to be relatively rare within the range. In 1997, however, the Expert Committee on the Diag-nosis and Classification of Diabetes Mellitus challenged this notion by citing studies of diabetic retinopathy in three populations: Pima Indians, Egyptians, and the general U.S. pop-ulation. Those studies used OGTT, FPG, and HbA1c tests; retinopathy was determined via fundus photog-raphy or ophthalmoscopy. In all three populations, similar thresholds for 2-hour plasma glucose, FPG, and HbA1c were identified, below which the prevalence of retinopathy was low
of prediabetes and the appropriate method for identifying it has been the subject of extensive debate and revi-sion. The National Institute of Diabe-tes and Digestive and Kidney Diseases assembled a small group of diabetes experts in the late 1970s called Na-tional Diabetes Data Group (NDDG). In 1979, the NDDG defined diabetes in 3 ways: by the presence of classic symptoms, by FPG ≥140 mg/dL, or by 2-hour plasma glucose ≥200 mg/dL. At the same time the NDDG also introduced impaired glucose tolerance as an intermediate stage between nor-mal glucose tolerance and diabetes. IGT was defined as FPG <140 mg/dL at the start of the OGTT and 2-hour plasma glucose ≥140 to 199 mg/dL. The OGTT was widely regarded as the
tality benefits. The USPSTF said the best (and only) evidence available for such a benefit comes from a Chinese study in which 6 years of lifestyle in-tervention after 23 years of follow-up resulted in a 29% reduction in risk for all-cause mortality (HR, 0.71 [CI, 0.51–0.99]) and a 41% reduction in risk for cardiovascular mortality (HR, 0.59 [CI, 0.36–0.96]) compared with usual care (Selph 2015a). After 20 years of follow-up, however, no sta-tistically significant difference in all-cause mortality and cardiovascular mortality had been observed. This study enrolled overweight adults (mean BMI, 25.8) with IGT. Neither was any mortality benefit found in similar trials with shorter follow-up than the Chinese study.
Trials of drug treatment—with or without lifestyle intervention—in people who are overweight or obese with IFG, IGT, or early diabetes have shown no mortality benefit and few differences in other health outcomes (Selph 2015a). For eight studies of glucose-lowering drugs, the pooled odds ratio for all-cause mortality was 1.1 (CI, 0.87–1.18); for cardiovascular mortality, 1.06 (CI, 0.84–1.35). Be-cause of the high cost, large number of subjects, and lengthy follow-up re-quired, it is doubtful that an RCT ever will be conducted to find out if there is a mortality benefit from screening for prediabetes.
The dearth of evidence from RCTs is offset to some extent by the substan-tial amount of evidence showing that lifestyle interventions can delay—and possibly prevent—prediabetes from worsening into diabetes. Moreover, there is little, if any chance, of harm from improved diets or greater physi-cal activity. For these reasons, the USPSTF sees a moderate net benefit in screening for abnormal glucose metabolism.
Debate about definitionsOver the past 3 decades, the concept
Online risk calculators: Plug in your numbersA number of free online calculators can help people learn about their prediabetes and diabetes risk. About 90% of American adults with predia-betes are unaware of their condition (CDC 2013). In an effort to correct that situation, the Ad Council, with sponsorship from the American Diabetes Association (ADA), the American Medical Association, and the CDC, recently launched a campaign of public service announcements and a website (DoIHavePrediabetes.org) with a calculator that helps people learn if they are at high risk for prediabetes and, if they are, to see a physician so that blood work can be done.
The risk factors for prediabetes are the same as those for diabetes, and the DoIHavePrediabetes calculator uses 7 of them: age ≥40 years, male sex, history of hypertension, history of gestational diabetes, physical inactivity, excessive weight, and family history of diabetes.
A different online calculator (www.framinghamheartstudy.org/risk- functions/diabetes), designed with data from the Framingham Offspring Study, allows people, ages 45 to 64, to assess their risk of developing diabetes in the next 8 years (Wilson 2007). The calculator’s algorithm gives the greatest weight to IFG (10 points), BMI ≥30 (5 points), and low HDL-cholesterol (5 points). But IFG by itself leads to an 8-year risk of developing diabetes of 3% or less, according to this calculator. The more risk factors present in addition to IFG, the greater the risk of progression, and in the absence of risk factors other than IFG, the risk of progression can be low despite IFG. Most patients with IFG also have additional risk factors and, like IFG, these risk factors tend to be components of the metabolic syndrome, which are important for determining a person’s risk of diabetes, along with cardiovascular disease.
A similar calculator (http://aricnews.net/DiabRisk/DiabRC1.html) is based on the Atherosclerosis Risk in Communities (ARIC) study and provides a 9-year risk estimate (Schmidt 2005).

40 MANAGED CARE / MAY 2016
Prevention of Progression of Prediabetes to Diabetes
the ADA’s annually revised standard of care for diabetes.
The takeaway Determining whether a person has prediabetes could be a starting point for helping patients to adopt a health-ier lifestyle, but an assessment of the person’s risk for progressing to type 2 diabetes requires identifying the many other risk factors at play. A great ad-vantage of the recommended inter-vention, lifestyle modification, for prediabetes is that it presents little or no drawbacks while addressing mul-tiple risk factors—not just glucose lev-els but also high blood pressure, high triglycerides, low HDL-cholesterol, and excess weight, all of which are also risk factors for cardiovascular disease. Furthermore, improvements in diet and physical activity provide many benefits not easily captured by data entered into a medical record but which are commonly recognized by people who pursue such changes.
Jack McCain is a freelance medical writer living in Durham, Conn. He has been writing about health care
for almost 30 years.
ReferencesAbdul-Ghani MA, Matsuda M, Jani R, et
al. The relationship between fasting hyperglycemia and insulin secretion in subjects with normal or impaired glu-cose tolerance. Am J Physiol Endocrinol Metab. 2008;295(2):E401–E406.
ADA (American Diabetes Association). Classification and diagnosis of diabetes. Diabetes Care. 2016a;39(suppl 1):S13–S22.
ADA. Prevention or delay of type 2 diabetes. Diabetes Care. 2016b;39(suppl 1):S36–S38.
ADA. Standards of medical care in diabe-tes—2010. Diabetes Care. 2010;33(suppl 1):S11–S61. Erratum in: Diabetes Care. 2010;33(3):692.
CDC (Centers for Disease Control and Prevention). Awareness of pre-diabetes—United States, 2005–2010. MMWR Morb Mortal Wkly Rep. 2013;62(11):209–212.
CDC. National Diabetes Statistics Report: Estimates of Diabetes and Its Burden in the United States, 2014. Atlanta, GA:
had cited the lack of assay standard-ization as a reason for not adopting HbA1c as a diagnostic tool. Although this objection had been overcome by 2003, the expert committee still rec-ommended against using HbA1c to diagnose diabetes. The ADA adopted the IEC recommendation, however, and added HbA1c testing to its 2010 standards of medical care (ADA 2010), with HbA1c ≥6.5% designat-ing diabetes and with HbA1c in the range of 5.7% to 6.4% identified as prediabetes.
In its 2009 report, the IEC went be-yond simply endorsing HbA1c test-ing, however. It rejected the notion that any test is the gold standard, with respect to microvascular and macro-vascular complications of diabetes and took issue with the concepts of prediabetes, IFG, and IGT:
While there appears to be an approximate glycemic threshold above which the risk for retinopa-thy escalates, there does not ap-pear to be a specific level at which risk for diabetes clearly begins. A continuum of risk for the develop-ment of diabetes across a wide range of subdiabetic A1c levels may make the classification of individuals into categories similar to IFG and IGT equally problem-atic for A1c, as it implies that we actually know where risk begins or becomes clinically important. The continuum of risk in the subdia-betic glycemic range argues for the elimination of dichotomous subdiabetic classifications, such as “pre-diabetes,” IFG, and IGT.
But the committee’s prediction that, with the arrival of HbA1c testing, “the categorical clinical states prediabetes, IFG, and IGT ... will be phased out” has not yet happened (and neither has HbA1c testing replaced the fast-ing glucose test). As of 2016, these terms continue to be prominent in
and above which it was much higher. The FPG cutpoint in those studies was well below the 140 mg/dL level that triggered a diabetes diagnosis accord-ing to the 1979 NDDG definition. As a result, the committee recommended that diabetes be diagnosed at a lower FPG concentration, 126 mg/dL, and this recommendation was adopted by the ADA.
In addition, the committee recom-mended that impaired fasting glucose, defined as FPG ≥110 mg/dL to 125 mg/dL, be used to describe the inter-mediate state between normal glucose tolerance and diabetes. The ADA also adopted this recommendation. The previous conventions for OGTT and IGT stayed in place. The World Health Organization, which concurred with the 1979 definitions, went along with most of what the expert committee said in 1997 except for continuing to regard OGTT as the gold standard and recommending that it be used whenever feasible to make sure pa-tients with IFG didn’t have diabetes.
In 2003, the expert committee made a further adjustment, lowering the threshold for IFG from 110 mg/dL to 100 mg/dL so that IFG would be more comparable with IGT, from a numerical perspective, with respect to prevalence.
The most recent change, setting the current testing triad in place, came from a recommendation from a third group, the International Expert Com-mittee (IEC), whose members were appointed by the ADA, the European Association for the Study of Diabe-tes, and the International Diabetes Federation. The IEC added HbA1c testing as a tool for diagnosing pre-diabetes and diabetes (IEC 2009), arguing that the correlation between HbA1c and retinopathy was stronger than the correlation between FPG and retinopathy, and that a measure that captures long-term glucose levels is superior to the measure of a single point. In 1997, the Expert Committee

MAY 2016 / MANAGED CARE 41
Prevention of Progression of Prediabetes to Diabetes
U.S. Department of Health and Human Services; 2014. http://www.cdc.gov/diabetes/pubs/statsreport14/national-diabetes-report-web.pdf Accessed April 12, 2016.
Dall TM, Yang W, Halder P, et al. The economic burden of elevated blood glucose levels in 2012: diagnosed and undiagnosed dia-betes, gestational diabetes mellitus, and prediabetes. Diabetes Care. 2014;37(12):3172–3179.
Faerch K, Hulmán A, Solomon TP. Heterogeneity of pre-diabetes and type 2 diabetes: implications for prediction, prevention and treatment responsiveness. Curr Diabetes Rev. 2016;12(1):30–41.
IEC (International Expert Committee). International Expert Com-mittee report on the role of the A1c assay in the diagnosis of diabetes. Diabetes Care. 2009;32(7):1327–1334.
Kanat M, Mari A, Norton L, et al. Distinct β-cell defects in impaired fasting glucose and impaired glucose tolerance. Diabetes. 2012;61(2):447–453.
Menke A, Casagrande S, Geiss L, Cowie CC. Prevalence of and trends in diabetes among adults in the United States, 1988–2012. JAMA. 2015;314(10):1021–1029.
Nathan DM, Davidson MB, DeFronzo RA, et al; American Diabetes Association. Impaired fasting glucose and impaired glucose tolerance: implications for care. Diabetes Care. 2007;30(3): 753–759.
Schmidt MI, Duncan BB, Bang H, et al; Atherosclerosis Risk in Communities Investigators. Identifying individuals at high risk for diabetes: The Atherosclerosis Risk in Communities study. Diabetes Care. 2005;28(8):2013–2018.
Selph S, Dana T, Blazina I, et al. Screening for type 2 diabetes mel-litus: a systematic review for the U.S. Preventive Services Task Force. Ann Intern Med. 2015a;162(11):765–776.
Selph S, Dana T, Bougatsos C, et al. Screening for Abnormal Glucose and Type 2 Diabetes Mellitus: A Systematic Review to Update the 2008 U.S. Preventive Services Task Force Recommendation. Evidence Synthesis No. 117. AHRQ Publication No. 13-05190-EF-1. Rockville, MD: Agency for Healthcare Research and Quality; 2015b.
Siu AL; U.S. Preventive Services Task Force. Screening for abnormal blood glucose and type 2 diabetes mellitus: U.S. Preventive Services Task Force recommendation statement. Ann Intern Med. 2015;163(11):861–868.
Ward A, Alvarez P, Vo L, Martin S. Direct medical costs of com-plications of diabetes in the United States: estimates for event-year and annual state costs (USD 2012). J Med Econ. 2014;17(3):176–183.
Wilson PW, Meigs JB, Sullivan L, et al. Prediction of incident diabe-tes mellitus in middle-aged adults: the Framingham Offspring Study. Arch Intern Med. 2007;167(10):1068–1074.
Friends, Romans, countrymen—and health care providers, payers, researchers, and KOLs…
Share your research, opinions, analysis, and personal essays with 60,000 readers of MANAGED CARE.
We want to hear what you have to say about the fundamental health care topics of our time. Balancing cost and quality. Increasing access. Paying for value vs. paying for volume. Pharmaceutical advances and prices.
Our pages and website (managedcaremag.com) can be a forum for your thought- provoking research and ideas about how to improve the financing and delivery of American health care.
We particularly welcome submissions related to our editorial calendar:
June ..............Convenience medicineJuly ................Autoimmune diseaseAugust ..........Women’s healthSeptember ....The 2016 electionOctober .........CancerNovember .....Medical directorsDecember .....The year in preview
Please email your submissions to: Frank Diamond, Managing [email protected]
Lend us your views!

42 MANAGED CARE / MAY 2016
Budget Impact Analysis to Estimate the Cost Dynamics of Treating Refractory Gastroesophageal Reflux Disease With Radiofrequency Energy: a Payer Perspective David Gregory, MPA,1 Dennis J. Scotti, PhD, MS, MBA,2 Daniel Buck, MBA, MPH,1 George Triadafilopoulos, MD, DSc3
1Baker Tilly LLP, New York, New York; 2Fairleigh Dickinson University, Teaneck, N.J.; 3Division of Gastroenterology and Hepatology, Stanford University School of Medicine, Stanford, Calif.
INTRODUCTIONGastroesophageal reflux disease (GERD) is an extremely prevalent condition, with some studies sug-gesting that it affects between 18% and 27% of individuals in the United States (El-Serag 2014). Moreover, GERD imposes a significant disease burden worldwide and is rising in prominence globally. According to a report by the American Gastroenter-ology Association, GERD is the most costly gastrointestinal (GI) disease in the United States and was associated with about $142 billion in direct and indirect costs in 2009 (Peery 2012).
The most common first-line treat-ment for GERD is the use of proton pump inhibitors (PPIs), which have been demonstrated in clinical trials to be highly effective for both heal-ing and symptom control. However, evidence is emerging that long-term use of PPIs may be associated with infectious complications, cardiac se-quelae, and nutritional deficits (Shah 2015). Furthermore, PPI therapy is costly and contributes significantly to the overall cost burden of GERD, especially considering treatment of potential adverse effects. A review of Medicare Part D claims data re-vealed that a single agent used for PPI therapy cost the program about $2.5 billion in 2013 (Herman 2015).
GERD is considered refractory when patients do not respond to daily PPI treatment or when their response is incomplete. For people with refractory GERD, a minimally invasive endoscopic treatment that utilizes radiofrequency energy
Original Research
(RFE), branded as the Stretta System (Mederi, Norwalk, Conn.), has re-ceived increased attention as a mid-dle-ground therapy before patients are subjected to complicated and inva-sive surgical procedures, specifically Nissen fundoplication (NF). After its approval by the FDA in 2000, Stretta demonstrated significant improve-
ments in heartburn control, patient satisfaction, and patient quality of life (Aziz 2010, Arts 2012, Corley 2003, Dughera 2011, Perry 2012).
In 2012, the Society of American Gastrointestinal and Endoscopic Sur-geons (SAGES) reviewed the findings of the available literature and recom-mended the use of RFE in refractory
ABSTRACTPurpose: A minimally invasive endoscopic treatment that utilizes radio-
frequency energy (RFE) has received increased attention as an appropriate middle-ground approach in the treatment of refractory gastroesophageal reflux disease (GERD) and as an alternative to complicated and invasive surgical procedures. The objective of this study was to develop a longitudinal budget impact analysis from the payer perspective to estimate the direct medical costs of treatment for the refractory GERD patient population and to estimate the budgetary impact of further extending the RFE treatment option to other target populations.
Design and methodology: A retrospective analysis of claims designed to assess the longitudinal costs and budget impact on payer expenditures associated with managing and treating GERD surgically (Nissen fundoplica-tion [NF]), endoscopically (RFE), or medically was performed. Both Medicare and commercially insured claims databases were interrogated for such population-level analyses.
Results: At current adoption rates (less than 1% of procedures), RFE dem-onstrated overall cost savings ranging from 7.3% to 50.5% in the 12-month time period following the index procedure (inclusive of procedure costs) when compared to medical management and fundoplication across the commercial and Medicare patient populations. Increasing the total number of RFE procedures to 2% of total cases performed generated per-member, per-month (PMPM) savings of $0.28 in the Medicare population and $0.37 in the commercially insured population. Further increases yielded higher PMPM savings.
Conclusion: Adding to the clinical importance of RFE in filling the gap between medical and surgical management, this economic analysis demon-strates to payers that the adoption of RFE can create notable savings to their plans when compared to surgery or medical management.
Key terms: GERD, radiofrequency energy, Nissen, fundoplication, Stretta, proton pump inhibitor, PPI

MAY 2016 / MANAGED CARE 43
Budget Analysis of Radiofrequency Energy Treatment of Refractory GERD
and postprocedure medical claims designed to provide a longitudinal assessment of costs and budget im-pact to payers. Costs are defined as the total payments (also known as reimbursements) made to provid-ers (allowed amounts), for manag-ing and treating GERD with the four therapeutic options previously iden-tified with respect to the following procedural index events as listed in the Current Procedural Terminology (CPT) and International Classifica-tion of Diseases Version 9 (ICD-9) coding manuals:
• Medical management (abbreviated in text and tables as MEDMGT) (index event: esophageal mano-metry, CPT code 91010); the CPT code for manometry was used to identify patients in the claims data-bases who were considered candi-dates for surgical intervention to treat their refractory GERD
• Outpatient fundoplication (NF-OP) (index event: fundoplication, CPT code 43280)
• Inpatient fundoplication (NF-IP) (index event: fundoplication, ICD-9 procedure code 44.66/44.67)
• Outpatient RFE (index event: RFE, CPT code 43257)
The above treatment options required a diagnosis code of 530.81, 530.11, 530.19 or 530.9x, (ICD-9 coding des-ignations for diseases of the esopha-gus, stomach, and duodenum) along with the above noted CPT or ICD-9 procedure code to be assigned to the appropriate treatment group.
If an individual underwent mul-tiple procedures spanning treatment categories, they were assigned to a pri-mary treatment group in the following order: outpatient RFE, NF-IP, NF-OP, MEDMGT. Analyses were performed on the entire population of beneficia-ries for whom payments were made to providers by Medicare and also by a major commercial health plan. De-
of life, and reduced productivity—all of which can contribute to extrane-ous costs. For example, a review con-ducted at 53 primary and secondary care centers in the United States iden-tified that incomplete response to PPI therapy (and in most cases, maximal PPI therapy) added $4,068 in direct costs per patient and $5,876 in indirect costs per patient (Stålhammar 2012).
GERD symptoms often mimic potentially life-threatening diseases, such as cardiac ischemia. One cost of GERD that is often overlooked is the evaluation of chest pain that might be a symptom of cardiac ischemia but turns out to be a symptom of GERD. Borzechi (2000) reviewed the cost im-plications of evaluation of noncardiac chest pain. This analysis identified about 180,000 cases a year costing about $750 million. About 60% of the cases were due to esophageal causes, with GERD being the most prominent diagnosis.
Evidence suggests that the use of RFE improves patient quality of life and may spare some patients from the side effects of prolonged PPI exposure as well as from the potential risks as-sociated with invasive surgical inter-ventions. Less clear are the cost im-plications of increased access to RFE in the treatment of refractory GERD. In order to address this question of cost, our present study enhances the existing clinical and economic profile of GERD with a specific focus on re-fractory GERD and its impact on all components of payer costs across a longitudinal period (12 months be-fore and after the index procedure). We expect that this population-based research will assist policymakers, pay-ers, and providers in evaluating the current treatment options available for refractory GERD that is both dif-ficult and expensive to treat.
METHODSStudy designThis is a retrospective analysis of pre-
GERD patients (Auyang 2013). Subse-quent to the SAGES recommendation, research on the clinical efficacy of RFE has yielded mixed results. Some studies supported and reinforced the finding of previous studies that RFE mitigates GERD-related symptoms and improves patient quality of life (Dughera 2014, Lo 2015, Yan 2015), while others were unsuccessful in es-tablishing sustained gains in objective clinical outcomes for RFE when com-pared to traditional surgical inter-ventions (Hopkins 2015, Lipka 2015). As indicated in the SAGES guidelines, it is important to emphasize that the RFE procedure is not considered an alternative to effective PPI therapy.
Treatment-related costs associated with PPI therapy are difficult to quan-tify; however, a review of Medicare Part D claims data from 2013 shows that a single agent, esomeprazole, generated about $2.5 billion in costs alone (Herman 2015). In the general population, GERD may add as much as $3,355 per patient, inclusive of di-rect medical or therapy costs (81%) as well as indirect costs associated with lost productivity (19%) (Brook 2007).Not surprisingly, treatment of patients with refractory GERD is more expen-sive than treatment of patients with GERD that is treatable with PPIs. For example, the evaluation of patients with extra-esophageal reflux may cost as much as an additional $5,438 per patient, while the medical compo-nents could add as much as $5,154; during the first year of evaluation and treatment, costs among these patients are about 5.6 higher than the typical GERD patient ($51 billion versus $9 billion) (Francis 2013).
Empiric therapy with a PPI is often attempted as an initial strategy for pa-tients assumed to have GERD. While this is effective in most cases, approxi-mately 20% of patients will not fully respond to PPI therapy (Amos 2012) and continue to suffer from a high symptom burden, impaired quality
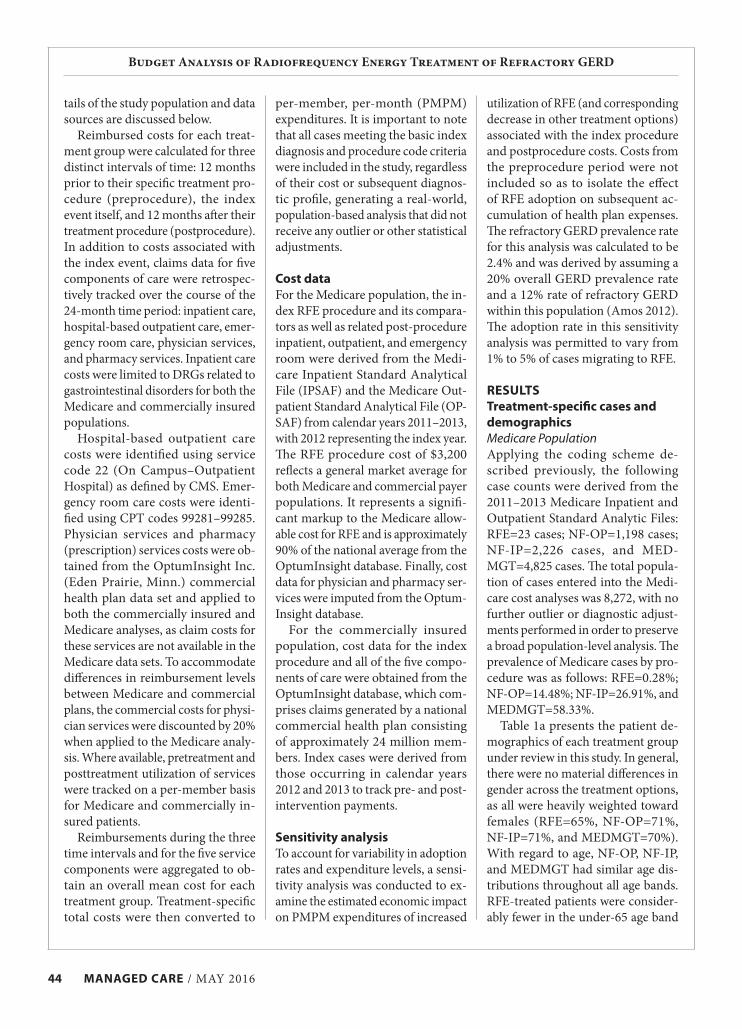
44 MANAGED CARE / MAY 2016
Budget Analysis of Radiofrequency Energy Treatment of Refractory GERD
per-member, per-month (PMPM) expenditures. It is important to note that all cases meeting the basic index diagnosis and procedure code criteria were included in the study, regardless of their cost or subsequent diagnos-tic profile, generating a real-world, population-based analysis that did not receive any outlier or other statistical adjustments.
Cost data For the Medicare population, the in-dex RFE procedure and its compara-tors as well as related post-procedure inpatient, outpatient, and emergency room were derived from the Medi-care Inpatient Standard Analytical File (IPSAF) and the Medicare Out-patient Standard Analytical File (OP-SAF) from calendar years 2011–2013, with 2012 representing the index year. The RFE procedure cost of $3,200 reflects a general market average for both Medicare and commercial payer populations. It represents a signifi-cant markup to the Medicare allow-able cost for RFE and is approximately 90% of the national average from the OptumInsight database. Finally, cost data for physician and pharmacy ser-vices were imputed from the Optum-Insight database.
For the commercially insured population, cost data for the index procedure and all of the five compo-nents of care were obtained from the OptumInsight database, which com-prises claims generated by a national commercial health plan consisting of approximately 24 million mem-bers. Index cases were derived from those occurring in calendar years 2012 and 2013 to track pre- and post-intervention payments.
Sensitivity analysisTo account for variability in adoption rates and expenditure levels, a sensi-tivity analysis was conducted to ex-amine the estimated economic impact on PMPM expenditures of increased
tails of the study population and data sources are discussed below.
Reimbursed costs for each treat-ment group were calculated for three distinct intervals of time: 12 months prior to their specific treatment pro-cedure (preprocedure), the index event itself, and 12 months after their treatment procedure (postprocedure). In addition to costs associated with the index event, claims data for five components of care were retrospec-tively tracked over the course of the 24-month time period: inpatient care, hospital-based outpatient care, emer-gency room care, physician services, and pharmacy services. Inpatient care costs were limited to DRGs related to gastrointestinal disorders for both the Medicare and commercially insured populations.
Hospital-based outpatient care costs were identified using service code 22 (On Campus–Outpatient Hospital) as defined by CMS. Emer-gency room care costs were identi-fied using CPT codes 99281–99285. Physician services and pharmacy (prescription) services costs were ob-tained from the OptumInsight Inc. (Eden Prairie, Minn.) commercial health plan data set and applied to both the commercially insured and Medicare analyses, as claim costs for these services are not available in the Medicare data sets. To accommodate differences in reimbursement levels between Medicare and commercial plans, the commercial costs for physi-cian services were discounted by 20% when applied to the Medicare analy-sis. Where available, pretreatment and posttreatment utilization of services were tracked on a per-member basis for Medicare and commercially in-sured patients.
Reimbursements during the three time intervals and for the five service components were aggregated to ob-tain an overall mean cost for each treatment group. Treatment-specific total costs were then converted to
utilization of RFE (and corresponding decrease in other treatment options) associated with the index procedure and postprocedure costs. Costs from the preprocedure period were not included so as to isolate the effect of RFE adoption on subsequent ac-cumulation of health plan expenses. The refractory GERD prevalence rate for this analysis was calculated to be 2.4% and was derived by assuming a 20% overall GERD prevalence rate and a 12% rate of refractory GERD within this population (Amos 2012). The adoption rate in this sensitivity analysis was permitted to vary from 1% to 5% of cases migrating to RFE.
RESULTSTreatment-specific cases and demographicsMedicare PopulationApplying the coding scheme de-scribed previously, the following case counts were derived from the 2011–2013 Medicare Inpatient and Outpatient Standard Analytic Files: RFE=23 cases; NF-OP=1,198 cases; NF-IP=2,226 cases, and MED-MGT=4,825 cases. The total popula-tion of cases entered into the Medi-care cost analyses was 8,272, with no further outlier or diagnostic adjust-ments performed in order to preserve a broad population-level analysis. The prevalence of Medicare cases by pro-cedure was as follows: RFE=0.28%; NF-OP=14.48%; NF-IP=26.91%, and MEDMGT=58.33%.
Table 1a presents the patient de-mographics of each treatment group under review in this study. In general, there were no material differences in gender across the treatment options, as all were heavily weighted toward females (RFE=65%, NF-OP=71%, NF-IP=71%, and MEDMGT=70%). With regard to age, NF-OP, NF-IP, and MEDMGT had similar age dis-tributions throughout all age bands. RFE-treated patients were consider-ably fewer in the under-65 age band
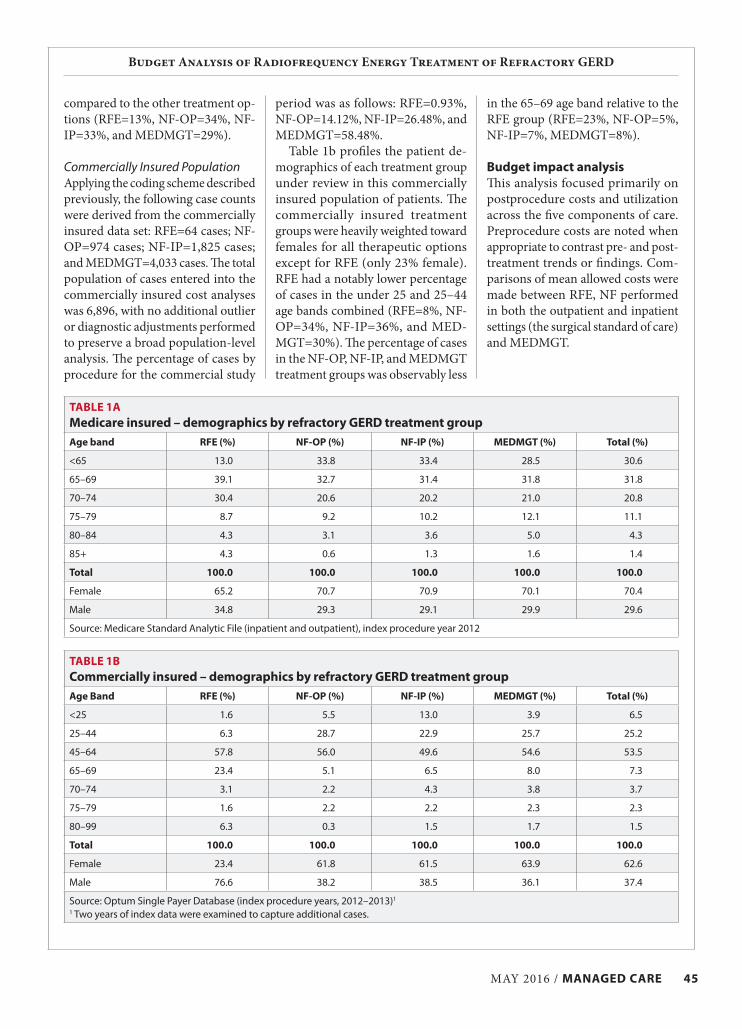
MAY 2016 / MANAGED CARE 45
Budget Analysis of Radiofrequency Energy Treatment of Refractory GERD
in the 65–69 age band relative to the RFE group (RFE=23%, NF-OP=5%, NF-IP=7%, MEDMGT=8%).
Budget impact analysisThis analysis focused primarily on postprocedure costs and utilization across the five components of care. Preprocedure costs are noted when appropriate to contrast pre- and post-treatment trends or findings. Com-parisons of mean allowed costs were made between RFE, NF performed in both the outpatient and inpatient settings (the surgical standard of care) and MEDMGT.
period was as follows: RFE=0.93%, NF-OP=14.12%, NF-IP=26.48%, and MEDMGT=58.48%.
Table 1b profiles the patient de-mographics of each treatment group under review in this commercially insured population of patients. The commercially insured treatment groups were heavily weighted toward females for all therapeutic options except for RFE (only 23% female). RFE had a notably lower percentage of cases in the under 25 and 25–44 age bands combined (RFE=8%, NF-OP=34%, NF-IP=36%, and MED-MGT=30%). The percentage of cases in the NF-OP, NF-IP, and MEDMGT treatment groups was observably less
compared to the other treatment op-tions (RFE=13%, NF-OP=34%, NF-IP=33%, and MEDMGT=29%).
Commercially Insured PopulationApplying the coding scheme described previously, the following case counts were derived from the commercially insured data set: RFE=64 cases; NF-OP=974 cases; NF-IP=1,825 cases; and MEDMGT=4,033 cases. The total population of cases entered into the commercially insured cost analyses was 6,896, with no additional outlier or diagnostic adjustments performed to preserve a broad population-level analysis. The percentage of cases by procedure for the commercial study
TABLE 1AMedicare insured – demographics by refractory GERD treatment groupAge band RFE (%) NF-OP (%) NF-IP (%) MEDMGT (%) Total (%)
<65 13.0 33.8 33.4 28.5 30.6
65–69 39.1 32.7 31.4 31.8 31.8
70–74 30.4 20.6 20.2 21.0 20.8
75–79 8.7 9.2 10.2 12.1 11.1
80–84 4.3 3.1 3.6 5.0 4.3
85+ 4.3 0.6 1.3 1.6 1.4
Total 100.0 100.0 100.0 100.0 100.0
Female 65.2 70.7 70.9 70.1 70.4
Male 34.8 29.3 29.1 29.9 29.6
Source: Medicare Standard Analytic File (inpatient and outpatient), index procedure year 2012
TABLE 1BCommercially insured – demographics by refractory GERD treatment groupAge Band RFE (%) NF-OP (%) NF-IP (%) MEDMGT (%) Total (%)
<25 1.6 5.5 13.0 3.9 6.5
25–44 6.3 28.7 22.9 25.7 25.2
45–64 57.8 56.0 49.6 54.6 53.5
65–69 23.4 5.1 6.5 8.0 7.3
70–74 3.1 2.2 4.3 3.8 3.7
75–79 1.6 2.2 2.2 2.3 2.3
80–99 6.3 0.3 1.5 1.7 1.5
Total 100.0 100.0 100.0 100.0 100.0
Female 23.4 61.8 61.5 63.9 62.6
Male 76.6 38.2 38.5 36.1 37.4
Source: Optum Single Payer Database (index procedure years, 2012–2013)1
1 Two years of index data were examined to capture additional cases.

46 MANAGED CARE / MAY 2016
Budget Analysis of Radiofrequency Energy Treatment of Refractory GERD
were coupled with the index pro-cedure costs, a savings of $2,741.13 (13.4%) was realized for RFE com-pared to NF-OP. During the post-procedure time frame, RFE was as-sociated with lower utilization per member in emergency room use (0.2 vs. 0.4 visits per member, 50.0% reduction), pharmacy services (10.8 vs. 12.3 scripts per member, 13.9% re-duction), and physician services (33.5 vs. 34.9 procedures per member, 4.0% reduction). Moreover, RFE showed a 31.6% reduction in pharmacy pre-scriptions per member from the preprocedure period to the postpro-cedure period (15.8 vs. 10.8 scripts), while NF-OP generated only a 12.8% reduction (14.1 vs. 12.3 scripts). On balance, total costs per case during the 24-month episode of care were comparable between RFE and NF-OP (i.e., RFE was $210.65 less costly).
RFE vs. NF-IP: For the preproce-dure tracking period, the differences in allowed costs per claim trended in favor of RFE for all service com-ponents except outpatient ($4,177.85 greater for RFE). When totaled, how-ever, preprocedure costs for RFE were $2,930.32 (16.7%) lower than NF-IP ($14,634.17 vs. $17,564.49). Average costs for RFE also trended favorably for all service components in the postprocedure period other than outpatient costs ($3,047.69 greater for RFE) compared to NF-IP. Nevertheless, total costs per claims for index procedure and 12-month follow-up care averaged $12,579.12 ($17,703.21 vs. $30,282.33) less for the RFE group than for patients receiving NF-IP treatment, a 41.5% reduction in payments. Total expenditures for the 24-month episode of care were found to be $15,509.44 lower for RFE- treated patients (NF-IP=$47,846.82 vs. RFE=$32,337.38), a 32.4% savings. In both cases, the high cost of an NF-IP procedure contributed to the size-able observed variances.
Compared to NF-IP, RFE also
evidenced reduced payments total-ing $9,853.86 (a 50.5% savings over NF-IP). Over the 24-month episode of care, the resultant savings totaled $12,035.42 per case (41.1% reduc-tion) associated with use of RFE in this group of beneficiaries.
RFE vs. MEDMGT: When com-pared against the MEDMGT group, RFE-treated patients incurred com-parable preprocedure pharmacy costs and modestly lower inpatient and emergency room costs. Preprocedure outpatient costs incurred by patients treated with RFE vs. MEDMGT were notably lower ($1,487.93 vs. $2,535.19 respectively), which is likely attribut-able to a lower outpatient visit rate of 5.5 for RFE versus 9.5 for the MED-MGT treatment group. For the post-procedure period, the differentials in allowed costs per claim favored RFE for all service components other than physician services. When tracked for 24 months, the RFE treatment op-tion had total costs, on average, that were $2,285.84 lower (11.7% savings) than those observed in the MEDMGT treatment group.
Commercially Insured PopulationTables 4a, 4b, and 4c compare the mean allowed payments for com-mercially insured patients whose refractory GERD was treated with RFE versus those receiving the other treatment options (12 months prior to index procedure, 12 months following the index procedure, and for the en-tire 24-month tracking period). These tables are supplemented by Table 5, which shows the average utilization per commercially insured beneficiary, by component of care, for each time period.
RFE vs. NF-OP: Patients treated with RFE vs. NF-OP exhibited higher preprocedure costs (RFE=$14,634.17 vs. NF-OP=$12,103.69) and postpro-cedure service costs (RFE=$14,009.68 vs. NF-OP=$9,421.76). However, when postprocedure service costs
Medicare PopulationTables 2a, 2b, and 2c compare the mean allowed payments for Medicare patients whose refractory GERD was treated with RFE versus those receiv-ing the other treatment options (12 months prior to index procedure, 12 months following the index proce-dure, and for the entire 24-month tracking period). These tables are sup-plemented by Table 3, which shows the average utilization per Medicare beneficiary, by component of care, for each time period.
RFE vs. NF-OP: For the 12 months leading up to the referent index pro-cedure, the major cost variance was observed in the average physician service payments (RFE=$4,671.61, NF-OP=$3,553.15). This increased cost difference in physician service utilization of $1,118.47 (31.5%) was the major reason the overall cost of RFE was higher than NF-OP for the preprocedure period ($7,622.60 vs. $7,328.84, a 4.0% difference). Twelve months postprocedure, a nominal savings of $294.28 (4.4%) in total service costs was associated with RFE and was driven primarily by a $1,103.16 (56.7%) reduction in outpa-tient costs. This savings could be par-tially attributed to reduced reliance on postprocedure outpatient visits: RFE-treated patients utilized outpatient visits half as often as NF-OP patients (3.7 visits per member vs. 7.9 visits per member). Combining index proce-dure costs and postprocedure service costs for both groups revealed a 10.0% cost savings ($1,066.93) for RFE.
RFE vs. NF-IP: Average payments for RFE were considerably lower than NF-IP for several key elements of the analysis: estimated preprocedure out-patient costs ($1,487.93 vs. $2,673.91), index procedure costs ($3,200.00 vs. 11,342.75), and average postproce-dure outpatient costs ($841.33 vs. $2,449.07). When index-procedure costs were combined with 12-month follow-up costs, RFE-treated patients

MAY 2016 / MANAGED CARE 47
Budget Analysis of Radiofrequency Energy Treatment of Refractory GERD
TABLE 2A Medicare insured – comparison of average allowed costs per case for RFE vs. treatment options by service component (12 months pre-index procedure)
Service component RFE ($) NF-OP ($)
∆ for RFE vs
NF-OP ($)
% ∆ for RFE vs NF-OP NF-IP ($)
∆ for RFE vs NF-IP
($)
% ∆ for RFE vs NF-IP
MEDMGT ($)
∆ for RFE vs MED-MGT ($)
% ∆ for RFE vs
MEDMGT
Inpatient1 191.04 238.00 (46.95) –19.7 566.66 (375.61) –66.3 449.09 (258.05) –57.5
Outpatient1 1,487.93 2,225.71 (737.78) –33.1 2,673.91 (1,185.98) –44.4 2,535.19 (1,047.26) –41.3
Emergency room1
68.00 169.09 (101.09) –59.8 156.56 (88.56) –56.6 199.63 (131.64) –65.9
Physician2 4,671.61 3,553.15 1,118.47 31.5 5,078.08 (406.47) –8.0 3,710.89 960.72 25.9
Pharmacy2 1,204.02 1,142.90 61.12 5.3 1,328.96 (124.94) –9.4 1,230.94 (26.92) –2.2
Total allowed cost per claim
7,622.60 7,328.84 293.76 4.0 9,804.16 (2,181.56) –22.3 8,125.75 (503.15) –6.2
1Source: Medicare Standard Analytic File (inpatient and outpatient) 2011–20132Source: Optum Single Payer Database 2011–2014
TABLE 2B Medicare insured – comparison of average allowed costs per case for RFE vs. treatment options by service component (12 months post-index procedure)
Service component RFE ($) NF-OP ($)
∆ for RFE vs NF-OP
($)
% ∆ for RFE vs NF-OP NF-IP ($)
∆ for RFE vs NF-IP
($)
% ∆ for RFE vs NF-IP
MEDMGT ($)
∆ for RFE vs MED-MGT ($)
% ∆ for RFE vs
MEDMGT
Inpatient1 444.78 416.56 28.22 6.8 839.81 (395.03) –47.0 2,421.05 (1,976.26) –81.6
Outpatient1 841.33 1,944.49 (1,103.16) –56.7 2,449.07 (1,607.74) –65.6 2,851.32 (2,009.99) –70.5
Emergency room1
96.21 188.49 (92.28) –49.0 166.86 (70.66) –42.3 196.97 (100.76) –51.2
Physician2 4,129.63 3,155.07 974.56 30.9 3,629.94 499.68 13.8 4,525.91 (396.28) –8.8
Pharmacy2 943.56 1,045.18 (101.62) –9.7 1,080.92 (137.36) –12.7 1,111.10 (167.54) –15.1
Index procedure3
3,200.00 3,972.64 (772.64) –19.4 11,342.75 (8,142.75) –71.8 331.85 2,868.15 864.3
Total allowed cost per claim
9,655.51 10,722.43 (1,066.93) –10.0 19,509.37 (9,853.86) –50.5 11,438.20 (1,782.70) –15.6
1Source: Medicare Standard Analytic File (inpatient and outpatient) 2011–20132Source: Optum Single Payer Database 2011–20143Source: Medicare Standard Analytic File (inpatient and outpatient) 2011–2013; RFE is an industry source
TABLE 2C Medicare insured – comparison of average allowed costs per case for RFE vs. treatment options by service component (24 months pre- and post-index procedure)
Service component RFE ($) NF-OP ($)
∆ for RFE vs. NF-OP
($)
% ∆ for RFE vs. NF-OP NF-IP ($)
∆ for RFE vs. NF-IP ($)
% ∆ for RFE vs. NF-IP
MEDMGT ($)
∆ for RFE vs. MED-MGT ($)
% ∆ for RFE vs.
MEDMGT
Inpatient1 635.83 654.56 (18.73) –2.9 1,406.47 (770.64) –54.8 2,870.14 (2,234.31) –77.8
Outpatient1 2,329.26 4,170.20 (1,840.94) –44.1 5,122.98 (2,793.72) –54.5 5,386.51 (3,057.25) –56.8
Emergency room1
164.21 357.58 (193.37) –54.1 323.42 (159.22) –49.2 396.60 (232.40) –58.6
Physician2 8,801.24 6,708.22 2,093.03 31.2 8,708.02 93.22 1.1 8,236.80 564.44 6.9
Pharmacy2 2,147.58 2,188.08 (40.50) –1.9 2,409.88 (262.30) –10.9 2,342.05 (194.47) –8.3
Index procedure3
3,200.00 3,972.64 (772.64) –19.4 11,342.75 (8,142.75) –71.8 331.85 2,868.15 864.3
Total allowed cost per claim
17,278.11 18,051.27 (773.17) –4.3 29,313.53 (12,035.42) –41.1 19,563.95 (2,285.84) –11.7
1Source: Medicare Standard Analytic File (inpatient and outpatient) 2011–20132Source: Optum Single Payer Database 2011–20143Source: Medicare Standard Analytic File (inpatient and outpatient) 2011–2013; RFE is an industry source

48 MANAGED CARE / MAY 2016
Budget Analysis of Radiofrequency Energy Treatment of Refractory GERD
modest redistribution to RFE of be-tween 1% and 5% of total cases, with 20% of this volume coming from the MEDMGT treatment option and the remaining 80% coming from the NF-OP and NF-IP treatment options.
Medicare population: The NF allo-cations were based on a recent Medi-care case mix (27.99% from NF-OP and 52.01% from NF-IP). Setting the historic distribution of procedures as the baseline, the estimated PMPM costs of each treatment group were: RFE=$0.06; NF-OP= $3.73; NF-IP=$12.60, and MEDMGT=$16.01. Assuming RFE utilization frequency increases to 1% of the total procedure mix, the overall estimated impact on payer expenditures would be a net savings of $0.14 PMPM. Increasing the RFE adoption percentage to a level at which RFE cases were 5% of total cases performed reduces overall ex-penditures by $0.69 PMPM.
Commercial population: The NF allocation was based on a recent commercial case mix (27.84% from NF-OP and 52.16% from NF-IP). Set-ting the historic distribution of pro-cedures as the baseline, the PMPM costs of each treatment option were: RFE=$0.40; NF-OP=$7.07; NF-IP=$19.63, and MEDMGT=$27.38. Assuming RFE utilization frequency increases to 1% of the total procedure frequency, the overall estimated im-pact on payer expenditures would be a net savings of $0.19 PMPM. Increas-
care (2.8 vs. 3.4 visits per member, 18.0% lower) and emergency room use (0.2 vs. 0.4 visits per member, 56.3% lower). Figure 1 (page 49) sum-marizes the cost of 24-month episodes of care for RFE and other treatments.
Sensitivity analysisTables 6a and 6b illustrate for the Medicare and commercially insured populations, respectively, the impact on PMPM expenditures of shifting the observed procedure frequency distribution to one where a higher percentage of RFE is assumed. The formulas used to calculate current PMPM costs, projected PMPM costs, and PMPM savings for both the Medicare and commercially insured populations are as follows:
Current PMPM costs=(refractory GERD members * total episode of care cost * current refractory GERDdistribution) / member months pro-jected PMPM costs=(refractory GERDmembers * total episode of care cost * projected refractory GERD distribu-tion) / member months
PMPM savings=projected PMPM – current PMPM
Note: In order to derive an annual PMPM savings, the PMPM costs span-ning 24 months were divided by 2.
The sensitivity analyses reflect a
showed lower utilization per member during the postprocedure period in the categories of pharmacy services (10.8 vs. 11.5 scripts per member, 6.1% lower), outpatient care (2.8 vs. 2.9 visits per member, 4.6% lower) and emergency room use (0.2 vs. 0.6 visits per member, 69.6% lower). It is important to note that this outpatient utilization reduction reinforces that the higher RFE costs noted in this sec-tion are driven by higher unit costs. Our review of the data could not determine if these higher unit costs for RFE were the result of higher-intensity services or less desirable contracted rates with the outpatient providers.
RFE vs. MEDMGT: During the postprocedure period, average costs for all service categories (except out-patient care) were lower for patients treated with RFE relative to those in the MEDMGT group. Overall, com-bined costs of the index procedure and postprocedure care for the RFE treatment group generated costs that were $1,403.57 (7.3%) lower than those observed in the MEDMGT treatment group.
RFE treatment was accompanied by lower service utilization per mem-ber in the postprocedure period, com-pared to MEDMGT, in the categories of pharmacy (10.8 vs. 13.1 scripts per member, 17.6% lower), physician ser-vices (33.5 vs. 37.3 procedures per member, 10.2% lower), outpatient
TABLE 3Medicare insured – average service utilization per member with refractory GERD (pre- and post-index procedure)
Pre-procedure average 12-month utilization Post-procedure average 12-month utilization
Treatment options RFE NF-OP % ∆ NF-IP % ∆
MED-MGT % ∆ RFE NF-OP % ∆ NF-IP % ∆
MED-MGT % ∆
Outpatient1 5.5 9.1 –39.6 9.5 –42.2 9.5 –42.1 3.7 7.9 –54.1 8.5 –57.0 9.8 –62.6
Emergency room1
0.5 1.0 –49.3 0.9 –38.7 1.1 –51.2 0.4 1.1 –64.9 0.9 –55.5 1.0 –62.1
Source: Outpatient Standard Analytical File 2011–20131 Visits per member.Note: Physician and pharmacy service utilization rates are not available in the Medicare Outpatient Standard Analytic File.

MAY 2016 / MANAGED CARE 49
Budget Analysis of Radiofrequency Energy Treatment of Refractory GERD
TABLE 4A Commercially insured – comparison of average allowed costs per case for RFE vs. treatment options by service component (12 months pre-index procedure)
Service component RFE ($) NF-OP ($)
∆ for RFE vs NF-OP
($)
% ∆ for RFE vs NF-OP NF-IP ($)
∆ for RFE vs NF-IP
($)
% ∆ for RFE vs NF-IP
MEDMGT ($)
∆ for RFE vs MED-MGT ($)
% ∆ for RFE vs MED-MGT
Inpatient 222.57 221.35 1.22 0.6 1,539.22 (1,316.66) –85.5 427.75 (205.19) –48.0
Outpatient 7,186.19 4,984.00 2,202.19 44.2 6,056.03 1,130.16 18.7 4,771.75 2,414.44 50.6
Emergency room 181.87 988.14 (806.27) –81.6 1,272.46 (1,090.58) –85.7 1,119.70 (937.83) –83.8
Physician 5,839.52 4,720.17 1,119.35 23.7 7,316.14 (1,476.62) –20.2 4,796.64 1,042.88 21.7
Pharmacy 1,204.02 1,190.03 13.99 1.2 1,380.63 (176.61) –12.8 1,274.42 (70.40) –5.5
Total allowed cost per claim
14,634.17 12,103.69 2,530.48 20.9 17,564.49 (2,930.32) –16.7 12,390.27 2,243.90 18.1
Source: Optum Single Payer Database 2011–2014
TABLE 4B Commercially insured – comparison of average allowed costs per case for RFE vs. treatment options by service component (12 months post-index procedure)
Service component RFE ($) NF-OP ($)
∆ for RFE vs NF-OP
($)
% ∆ for RFE vs NF-OP NF-IP ($)
∆ for RFE vs NF-IP
($)
% ∆ for RFE vs NF-IP
MEDMGT ($)
∆ for RFE vs MED-MGT ($)
% ∆ for RFE vs
MEDMGT
Inpatient 909.50 517.37 392.13 75.8 1,793.57 (884.07) –49.3 3,164.13 (2,254.63) –71.3
Outpatient 6,665.60 2,724.23 3,941.37 144.7 3,617.91 3,047.69 84.2 6,237.43 428.17 6.9
Emergency room 328.99 851.45 (522.46) –61.4 1,275.28 (946.29) –74.2 $835.94 (506.95) –60.6
Physician 5,162.04 4,208.84 953.19 22.6 5,191.60 (29.57) –0.6 6,054.78 (892.74) –14.7
Pharmacy 943.56 1,119.87 (176.31) –15.7 1,154.31 (210.76) –18.3 1,199.97 (256.42) –21.4
Index procedure 3,693.53 11,022.58 (7,329.05) –66.5 17,249.65 (13,556.12) –78.6 1,614.53 2,079.00 128.8
Total allowed cost per claim
17,703.21 20,444.34 (2,741.13) –13.4 30,282.33 (12,579.12) –41.5 19,106.78 (1,403.57) –7.3
Source: Optum Single Payer Database 2011–2014
TABLE 4C Commercially insured – comparison of average allowed costs per case for RFE vs. treatment options by service component (24 months pre- and post-index procedure)
Service component RFE ($) NF-OP ($)
∆ for RFE vs NF-OP
($)
% ∆ for RFE vs NF-OP NF-IP ($)
∆ for RFE vs NF-IP
($)
% ∆ for RFE vs NF-IP
MEDMGT ($)
∆ for RFE vs MED-MGT ($)
% ∆ for RFE vs
MEDMGT
Inpatient 1,132.06 738.71 393.35 53.2 3,332.79 (2,200.73) –66.0 3,591.88 (2,459.82) –68.5
Outpatient 13,851.79 7,708.23 6,143.55 79.7 9,673.94 4,177.85 43.2 11,009.18 2,842.61 25.8
Emergency room
510.87 1,839.60 (1,328.73) –72.2 2,547.74 (2,036.88) –79.9 1,955.65 (1,444.78) –73.9
Physician 11,001.55 8,929.01 2,072.54 23.2 12,507.75 (1,506.19) –12.0 10,851.42 150.14 1.4
Pharmacy 2,147.58 2,309.90 (162.32) –7.0 2,534.95 (387.37) –15.3 2,474.39 (326.81) –13.2
Index procedure 3,693.53 11,022.58 (7,329.05) –66.5 17,249.65 (13,556.12) –78.6 1,614.53 2,079.00 128.8
Total allowed cost per claim
32,337.38 32,548.03 (210.65) –0.6 47,846.82 (15,509.44) –32.4 31,497.05 840.33 2.7
Source: Optum Single Payer Database 2011–2014

50 MANAGED CARE / MAY 2016
Budget Analysis of Radiofrequency Energy Treatment of Refractory GERD
into the economic consequences when assessing the treatment options available for this chronic condition. It is also important to emphasize that our study employed a population per-spective in that all claims for which a payment was made and that met the basic inclusion criteria (based on the target diagnoses and procedures) were included. We anticipate that this real-world approach will be attractive to U.S. public and private payers.
As our results demonstrate, RFE is an economically favorable choice for payers based on index and post-procedure resource consumption analyses. When considering the index and postprocedure time period, RFE demonstrated a net savings over its comparators in both the Medicare and commercial populations. Of particu-lar note is the favorable impact on ER and pharmacy utilization and costs, where significant reductions on the order of 13% in pharmacy utilization when compared to NF-OP and 70% in ER utilization when compared to NF-IP were observed. Presumably, these reductions were driven by improved symptom profiles in RFE patients that allowed patients and their physicians to avoid ER visits for severe but often transient symptoms, as well as moder-ate pharmacy costs.
While this cost profile and analysis
to assist U.S. payers in better under-standing the economic implications associated with the four best known treatment options for refractory GERD. Moreover, the primary focus of this study was to provide payers with information on how medical re-sources are consumed in both Medi-care and commercially insured GERD populations on a longitudinal basis. In light of the renewed focus of both CMS and private payers on episode-of-care arrangements, this study offers policymakers, payers, and account-able care entities additional insight
ing the RFE percentage to 5% of total cases would yield an overall estimated savings of $0.93 PMPM.
DISCUSSION GERD is considered a major health issue in the United States and poses a significant health and economic chal-lenge to payers. Given its incidence and complication profile, refractoryGERD is a disease process worthy of refined clinical and economic re-search to fully understand the most effective and efficient ways to manage it. To this end, our study was designed
$32,337.38 $32,548.03
$47,846.82
$31,497.05
$17,278.11 $18,051.27
$29,313.53
$19,563.95
RFE NF-OP NF-IP MEDMGMT
Medicare insured
Commercially insured
FIGURE 1Radiofrequency energy compared with other treatments of GERD for 24-month episode of care
Based on results presented in Tables 2C and 4C
TABLE 5Commercially insured – average service utilization per member with refractory GERD (pre- and post-index procedure)
Pre-procedure average 12-month utilization Post-procedure average 12-month utilization
Treatment options RFE NF-OP % ∆ NF-IP % ∆
MED-MGT % ∆ RFE NF-OP % ∆ NF-IP % ∆
MED-MGT % ∆
Outpatient1 3.3 3.7 –10.0% 4.5 –26.3% 3.6 –8.4% 2.8 2.1 36.9% 2.9 –4.6% 3.4 –17.6%
Emergency room1
0.1 0.5 –71.0% 0.7 –78.6% 0.5 –73.8% 0.2 0.4 –56.8% 0.6 –69.6% 0.4 –56.3%
Physician2 37.9 35.4 7.2% 44.6 –14.9% 38.8 –2.3% 33.5 34.9 –3.9% 27.1 23.7% 37.3 –10.0%
Pharmacy3 15.8 14.1 11.8% 13.6 15.7% 14.0 12.3% 10.8 12.3 –12.6% 11.5 –6.1% 13.1 –18.0%
Source: Optum Single Payer Database 2011–20141 Visits per member.2a Physician services per member. On average, physician services include 4-5 procedures per visit, yielding up to 6-8 visits per year.2b Examples of physician services include injectable administration, EKG interpretation, and pH monitoring.3 Prescriptions per member.

MAY 2016 / MANAGED CARE 50A
Budget Analysis of Radiofrequency Energy Treatment of Refractory GERD
While this research offers economic stakeholders a viable framework for evaluating technologies like RFE, several points should be considered when interpreting the results. First, our data sources presented challenges defining the study treatment groups, which solely relied on claims coding. For example, there could be refrac-tory GERD patients who did not fall into any of the four categories, spe-cifically those who did not undergo RFE, fundoplication, or manometry, and whose costs might have affected the results of this analysis, if included. Second, with regard to the commer-cial and Medicare claims sets uti-lized, while the membership of both populations was large and national in scope, the results reported in this study may not accurately reflect the
efficacy profile and its inclusion in SAGES treatment guidelines. Nota-bly, RFE is positioned as an option for those patients who are not get-ting relief from PPIs and are also not good surgical candidates, a group that represents approximately 20% of the total GERD population. Moreover, RFE is emerging as the only option for patients with GERD after bariat-ric surgery, offering a welcome relief to a patient cohort that often exhib-its GERD symptoms but previously had limited options to address them. Thus, RFE is an important option for addressing an existing treatment gap in the continuum of GERD, and this research lays out its estimated eco-nomic value as a complement to its clinical utility.
Few studies are without limitations.
of RFE generally kept the Medicare and commercial populations separate (except where data gaps existed), it is worth noting that similar savings trends in the index procedure plus postprocedure periods were observed when RFE was compared to all treat-ment groups. Accordingly, this in-vestigation likely has identified some consistent and generalizable trends across multiple patient populations, treatment interventions and care components.
Finally, from an economic stand-point, this study has detailed the favorable impact of incremental migration from current surgical and medical options to RFE at vari-ous levels that should be considered reasonable and achievable, particu-larly given the procedure’s safety and
TABLE 6AMedicare insured – sensitivity analysis of impact on PMPM expenditures for members with refractory GERD (index procedure plus 12 months post-procedure)
Distribution RFE PMPM NF-OP PMPM NF-IP PMPM MEDMGT PMPM
Change in PMPM Post-percentage
distribution
Current $0.0644 $3.7269 $12.6000 $16.0124 N/A
1% $0.2962 $3.6549 $12.3564 $15.9575 ($0.1387)
2% $0.5279 $3.5829 $12.1129 $15.9026 ($0.2774)
3% $0.7596 $3.5108 $11.8694 $15.8477 ($0.4162)
4% $0.9914 $3.4388 $11.6259 $15.7928 ($0.5549)
5% $1.2231 $3.3668 $11.3824 $15.7379 ($0.6936)
Source: Medicare Standard Analytic File (Inpatient and Outpatient) 2011–2013, Optum Single Payer Database 2011–2014
TABLE 6BCommercially insured – sensitivity analysis of impact on PMPM expenditures for members with refractory GERD (index procedure plus 12 months post-procedure)
Distribution RFE PMPM NF-OP PMPM NF-IP PMPM MEDMGT PMPM
Change in PMPM Post-percentage
distribution
Current $0.4025 $7.0748 $19.6353 $27.3779 N/A
1% $0.8363 $6.9354 $19.2483 $27.2843 ($0.1863)
2% $1.2700 $6.7960 $18.8613 $27.1907 ($0.3727)
3% $1.7038 $6.6565 $18.4742 $27.0970 ($0.5590)
4% $2.1375 $6.5171 $18.0872 $27.0034 ($0.7453)
5% $2.5713 $6.3776 $17.7002 $26.9098 ($0.9317)
Source: Optum Single Payer Database 2011–2014

50B MANAGED CARE / MAY 2016
Budget Analysis of Radiofrequency Energy Treatment of Refractory GERD
treatment for GERD: results of an 8-year follow-up. Gastroenterol Res Pract. 2014;2014:531907.
El-Serag HB, Sweet S, Winchester CC, Dent J. Update on the epidemiology of gastro-oesophageal reflux disease: a systematic review. Gut. 2014;63(6):871–880.
Francis DO, Rymer JA, Slaughter JC, et al. High economic burden of caring for patients with suspected extraesophageal reflux. Am J Gastroenterol. 2013;108(6):905–911.
Herman B. CMS unleashes Part D drug data; Nexium costs program most. Modern Healthcare. April 30, 2015.
Hopkins J, Switzer NJ, Karmali S. Update on novel endoscopic therapies to treat gastro-esophageal reflux disease: a review. World J Gastrointest Endosc. 2015;7(11):1039–1044.
Lipka S, Kumar A, Richter JE. No evidence for efficacy of radiofrequency ablation for treatment of gastroesophageal reflux disease: a systematic review and meta-analysis. Clin Gastroenterol Hepatol. 2015;13(6):1058.el–1067.e1.
Lo WK, Mashimo H. Critical assessment of endoscopic techniques for gastroeso-phageal reflux disease. J Clin Gastroenterol. 2015;49(9):720–724.
Peery AF, Dellon ES, Lund J, et al. Burden of gastrointestinal disease in the United States: 2012 update. Gastroenterology. 2012;143(5):1179–1187.
Perry KA, Banerjee A, Melvin WS. Radio-frequency energy delivery to the lower esophageal sphincter reduces esophageal acid exposure and improves GERD symptoms: a systematic review and meta-analysis. Surg Laparosc Endosc Percutan Tech. 2012;22(4):283–288.
Shah NH, LePendu P, Bauer-Mehren A, et al. Proton pump inhibitor usage and the risk of myocardial infarction in the general population. PLoS One. 2015;10(6):e0124653.
Stålhammar NO, Spiegel BM, Granstedt LH, et al. Partial response to proton pump inhibitor therapy for GERD: observational study of patient characteristics, burden of disease, and costs in the USA. Pragmatic Observational Res. 2012;3:57–67.
Yan C, Liang WT, Wang ZG, et al. Comparison of Stretta procedure and toupet fundopli-cation for gastroesophageal reflux disease-related extra-esophageal symptoms. World J Gastroenterol. 2015;21(45):12882–12887.
age episodes of care governed by risk-based contracting with a focus on population health, budget impact modeling can be useful in evaluating the most efficient ways to manage a chronic and costly condition, such as refractory GERD. Although by no means a new technique, RFE is an im-portant and cost-efficient procedure that fills an important treatment void for GERD patients not getting relief from PPI use. Payers and providers should carefully consider the results of this study when reviewing options for their GERD patients: RFE offers both stakeholders another tool for more effectively managing patients with GERD under value-based care arrangements and population health strategies.
REFERENCESAmos JA. Acid reflux (GERD) statistics and
facts. www.healthline.com/health/gerd/statistics. June 30, 2012. Accessed April 19, 2016.
Arts J, Bisschops R, Blondeau K, et al. A double-blind sham-controlled study of the effect of radiofrequency energy on symptoms and distensibility of the gastro-esophageal junction in GERD. Am J Gastroenterol. 2012;107(2):222–230.
Auyang ED, Carter P, Rauth T, Fanelli RD; SAGES Guidelines Committee. SAGES clinical spotlight review: endolumi-nal treatments for gastroeso phageal reflux disease (GERD). Surg Endosc. 2013;27(8):2658–2672.
Aziz AM, El-Khayat HR, Sadek A, et al. A pro-spective randomized trial of sham, single-dose Stretta, and double-dose Stretta for the treatment of gastroesophageal reflux disease. Surg Endosc. 2010;24(4):818–825. Borzechi AM, Pedrosa MC, Prashker MJ. Should noncardiac chest pain be treated empirically? A cost-effectiveness analysis. Arch Intern Med. 2000;160:844–852.
Brook RA, Wahlqvist P, Kleinman NL, et al. Cost of gastro-oesophageal reflux disease to the employer: a perspective from the United States. Aliment Pharmacol Ther. 2007;26(6):889–898.
Corley DA, Katz P, Wo JM, et al. Improvement of gastroesophageal reflux symptoms after radiofrequency energy: a randomized, sham-controlled trial. Gastroenterology. 2003;125(3):668–676.
Dughera L, Navino M, Cassolino P, et al. Long-term results of radiofrequency energy de-livery for the treatment of GERD: results of a prospective 48-month study. Diagn Ther Endosc. 2011;201:507157.
Dughera L, Rotondano G, De Cento M, et al. Durability of Stretta radiofrequency
experience of health plans serving smaller, regional populations. To this end, the authors encourage plans to use the structure of this analysis in conjunction with their own data to generate plan-specific results. Third, elongating the postprocedure tracking period to more than 1 year, along with limiting all of the cost categories in the analysis to GI-related procedures and diagnoses could be useful in further research. Fourth, while the structure of our analysis may imply that RFE is a strict substitute for GI surgical interventions, it should be noted that in rare cases, Nissen fundoplication can occur subsequent to RFE if the patient’s symptoms do not resolve within a few months after the proce-dure. Finally, since RFE is emerging as the best option for patients who suffer from GERD after bariatric surgery, an analysis that focuses on just the costs associated with bariatric GERD pa-tients would be of increasing interest to payers as they determine the best course of treatment for this growing patient population.
CONCLUSIONIn this era of health reform where key stakeholders are preparing to man-
Corresponding author David Gregory, MPA Phone: (201) 612-0561 Fax: (201) 632-0059 Email: [email protected]
Funding source: Mederi Therapeutics (Norwalk, Conn.)
Conflict disclosures: David Gregory and Daniel Buck are employees of Baker Tilly LLP, New York, N.Y. Dennis J. Scotti is a part-time consultant at Baker Tilly LLP. Baker Tilly LLP is a paid consultant to Mederi as a technical advisor and re-ceives indirect support from Mederi for secondary database acquisition. George Triadafilopoulos is a consulting clinical advisor to Mederi Therapeutics.
Acknowledgements: Keith Needham, consultant, Baker Tilly LLP

MAY 2016 / MANAGED CARE 51
T H E F O R M U L A R Y F I L E S
Rebates and coupons run rampant in diabetesU.S. spending on diabetes medi-cations galloped to $10.1 billion in 2015, a 30% increase over 2014 expenditures, according to the drug spending report that IMS Institute for Healthcare Informatics released last month. While there is rapid growth in the utilization of all diabetes medi-cations, especially insulins, the spend-ing figure might be misleading be-cause, according to IMS, manufactur-ers gave back $8.6 billion in rebates, discounts and other price concessions to health plans, PBMs, and consumers. IMS says as a result, the “net” spend-ing increase on diabetes medications was only $1.6 billion and less than the $2.5 billion increase in net spending between 2013 and 2014.
The machinations with prices, rebates, and discounts reflect the intense competition among me-too diabetes agents and manufacturers’ frantic attempts to develop market share for new drugs. The insulins are an example. Sticker-price expendi-tures on insulins increased by $4.8 billion from 2014 to 2015, but IMS Health says manufacturers gave back more than that in rebates and dis-counts to position themselves in the market.
Express Scripts and CVS Caremark have taken advantage of the thera-peutic similarity of insulins as well as their own purchasing power to obtain deep list price discounts by offering exclusivity on their standard formularies. The two giant PBMs have maximized their leverage with the two leading manufacturers, Eli Lilly and Novo Nordisk, by playing them off one another. The stakes are high: Annual sales of insulin approach $20 billion, although that’s the market based on sticker price. CVS Caremark has removed Eli Lilly’s Humalog and Humulin from its formulary in favor of Novo Nordisk’s NovoLog and Novolin. Ex-press Scripts has done the opposite, excluding NovoLog and Novolin in favor of Humalog and Humulin. The manufacturers collectively had to give back billions to get those exclu-sive arrangements, according to IMS.
The PBMs have also wielded their exclusion power in other classes of diabetes drugs. CVS Caremark has been more aggressive than Express Scripts with exclusions in the red hot SGLT-2 class. It nixed first-in-class Invokana in favor of Farxiga and Jard-iance. In the DPP-4 class, CVS gave
Diabetes spending growth (in billions of dollars)
Januvia and Tradjenta the nod over Onglyza and Nesina.
The two PBMs also take opposite stands with the GLP-1s. Express Scripts excludes Victoza and prefers Byetta and Bydureon, while CVS Care-mark does the opposite.
Competition has also led to in-creased use of couponing. Sanofi-Aventis’ Lantus Solostar, a long-acting insulin, is the top selling diabetes medication. Its 2014 invoice sales of $4.5 billion outdistanced Novo Nor-disk’s competing long-acting insulin, Levemir, which had 2014 sales of $1.3 billion. (For these individual insulin products, IMS reported only 2014 sales figures). Yet Sanofi-Aventis still offers a saving card that guarantees a maximum copayment of $25, which matches the coupon deal that Novo Nordisk offers for Levemir.
Coupons also exist in the SGLT-2 and popular DPP-4 classes, and they go a step further than the insulin products by offering deals that cover all of the patient’s out-of-pocket costs. They are advertised as “free,” although that means no out-of-pocket cost to the patient. The health or drug benefit plans are still on the hook for their share.
Source: IMS Institute for Healthcare Informatics, “Medicines Use and Spending in the U.S.,” April 2016
Net growth Invoice growth
2011 2012 2013 2014 2015
1.0 0.7 0.2
2.51.6
2.31.3
3.3
8.1
10.1


![§TATJE ((J)JF IlNDilANA€¦ · ~m~~~mMmm~mmmm~mm~mmmm~m~~mmmm~ ~ ~ ~ ~ ii §TATJE ((J)JF IlNDilANA ~ ~ ~, lEXlECUT[V]E lDlEPARTMENT ~ i1 ITNlDllANAJPOLIT§ ~ ~ ~ ~ EXECUTIVE ORDER](https://img.pdfslide.net/doc/110x75/5f50db60d3dbb53f6466e480/tatje-jjf-ilndilana-mmmmmmmmmmmmmmmmmmmm-ii-tatje-jjf.jpg)