Embed Size (px)
Citation preview

Managing Energy and Carbon
The farmer’s guide to energy audits
Save money
Reduce your carbon footprint

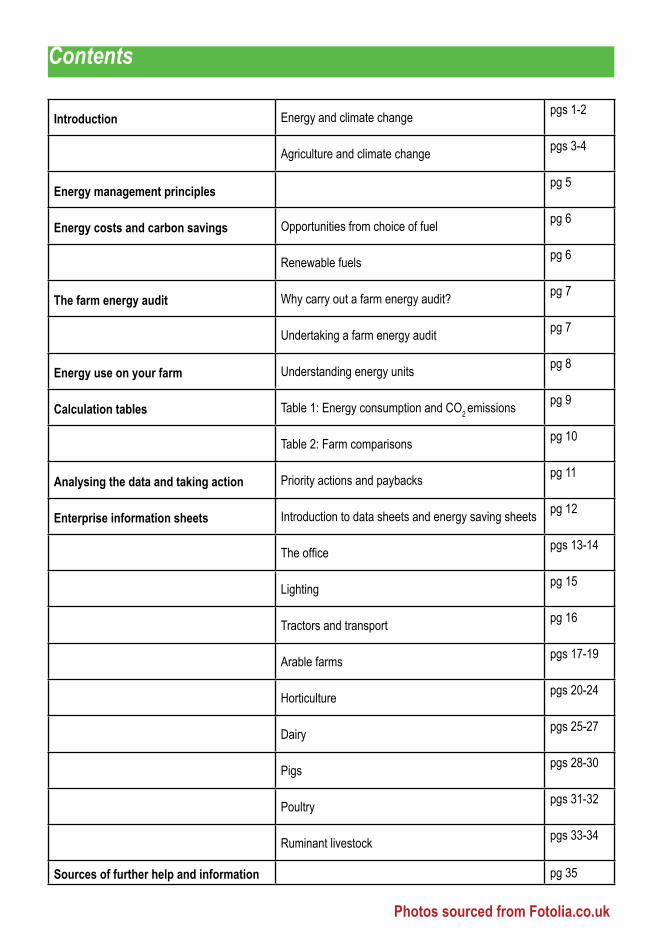
Contents
Introduction Energy and climate change pgs 1-2
Agriculture and climate change pgs 3-4
Energy management principles pg 5
Energy costs and carbon savings Opportunities from choice of fuel pg 6
Renewable fuels pg 6
The farm energy audit Why carry out a farm energy audit? pg 7
Undertaking a farm energy audit pg 7
Energy use on your farm Understanding energy units pg 8
Calculation tables Table 1: Energy consumption and CO2 emissions pg 9
Table 2: Farm comparisons pg 10
Analysing the data and taking action Priority actions and paybacks pg 11
Enterprise information sheets Introduction to data sheets and energy saving sheets pg 12
The office pgs 13-14
Lighting pg 15
Tractors and transport pg 16
Arable farms pgs 17-19
Horticulture pgs 20-24
Dairy pgs 25-27
Pigs pgs 28-30
Poultry pgs 31-32
Ruminant livestock pgs 33-34
Sources of further help and information pg 35
Photos sourced from Fotolia.co.uk
1.
Introduction
So why all the fuss?The earth’s climate has remained relatively stable since the end of last Ice Age, some 10,000 years ago. However, over recent years (since the early 1900’s) it has started changing at a faster rate than one might normally expect. The phenomenon of rising temperatures observed during this period referred to as “global warming”. The Intergovernmental Panel on Climate Change (which is comprised of scientists from 150 countries) concluded that these rapid changes in temperature are highly likely to have been caused to some extent by human activities, such as the burning of fossil fuels. Human activity over the last couple of centuries has lead to substantial increases in the levels of greenhouse gases in the atmosphere, and this in turn enhances the greenhouse effect. The main greenhouse gases include Carbon Dioxide (CO2), Methane (CH4), Nitrous Oxide (N2O) and various fluorocarbons.Carbon Dioxide is produced in large quanties as a result of activities such as the burning of fossil fuels. Methane is released in large quantities from landfill sites and farmed ruminant livestock and Nitrous Oxide levels have increased as a result of the use of nitrogen based fertilisers for example. Since the industrial revolution levels of Carbon Dioxide have risen by 31% .
Global temperatures have risen by more than 0.50C since 1900 and will continue to do so. Further temperature rises are almost inevitable, but by reducing greenhouse gases we can slow down the rate and extent of the temperature changes. For example under a “low emissions future scenario” temperatures may rise by 1.50C by 2100, whereas under a “high emissions future scenario” this temperature increase may be at least as high as 5.80C.
Predicting future climate is no easy task but changes are already being observed and are perhaps most noticeable when we consider extreme events. For example the 10 warmest years on record have occurred since 1990. 2006 is the warmest year so far followed by 1998 and 2005, and in the UK, the growing season length has increased by 2 weeks since the 1970’s. Looking at the climate change scenario for medium/high emissions of greenhouse gases in the future, the exceptionally warm spell we observed in the UK in the summer of 2003 could be considered an average summer by the 2040’s and, a cooler than average summer by the 2060’s.
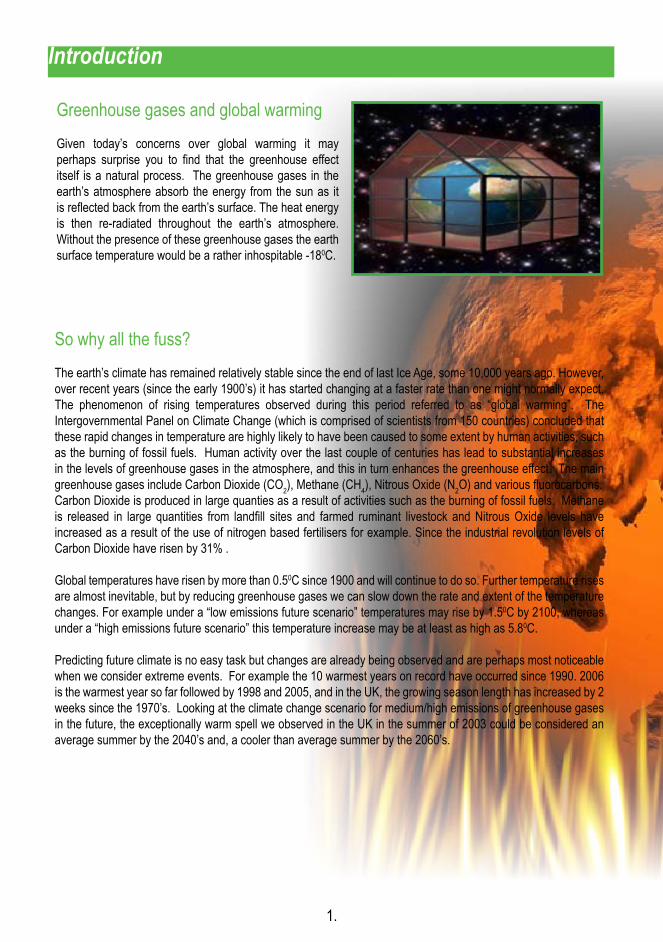
Greenhouse gases and global warmingGiven today’s concerns over global warming it may perhaps surprise you to find that the greenhouse effect itself is a natural process. The greenhouse gases in the earth’s atmosphere absorb the energy from the sun as it is reflected back from the earth’s surface. The heat energy is then re-radiated throughout the earth’s atmosphere. Without the presence of these greenhouse gases the earth surface temperature would be a rather inhospitable -180C.

Introduction
2.
ImpactsPossible impacts include the dramatic, such as melting of the polar ice caps, rising sea levels and an increase in extreme weather events such as drought, flooding and storms. It will also affect us in more subtle ways, for example in it may affect the way we manage our water resource, the crops we grow and the way that we grow them.
The governments in Wales, the UK and across the world are starting to act upon the messages that the climatologists have been giving us. The actions of our government will also have an impact on the way that we use energy in the future, though actions such as legislation, taxes as well as support measures for more sustainable fuels and the promotion of energy efficiency.
EnergyIn the UK in 2004 89.5% of our primary energy supply was provided by fossil fuels (gas, oil and coal). We cannot escape the fact that we live in an “energy world”. We are affected on a daily basis by energy supply and energy costs. Regardless of whether or not we agree that climate change is an issue, there is no escaping the fact that fossil fuel price and security of supply is becoming increasingly volatile. Availability and price of fuel is increasingly governing the success or failure of business economics. Energy can no longer be taken for granted, it is vitally important to us and it makes sense to use it wisely. In the past energy has been taken for granted and to some extent abused as though it were an infinite resource. Whether your concerns about energy are driven by costs, concern for the environment or a mixture of the two it is clear that our energy problem needs to be addressed. Ideally, the issues of energy security and the mitigation of the effects of climate change need to be tackled together.
There are 3 key principles that should govern the way we manage energy in the future:
Clean sustainable energy The generation of benign energy that doesn’t increase the levels of greenhouse gases in the atmosphere. Renewable energy technologies such as wind, solar and biomass/biofuel energy technologies can be adopted.
Energy conservation Energy efficiency, conserving energy as best we can and reducing energy wastage. Energy shouldn’t be use unnecessarily. We need to be more aware of the energy inputs and outputs of a given process.
Pollution penalties Polluters should pay for the cost of the energy as well as the damage it causes.
Energy conservation is something we can all act upon immediately, through auditing our current energy usage and making changes as necessary. Many of these changes will not only reduce our energy use, greenhouse gas emissions. but also reduce our spend on energy.
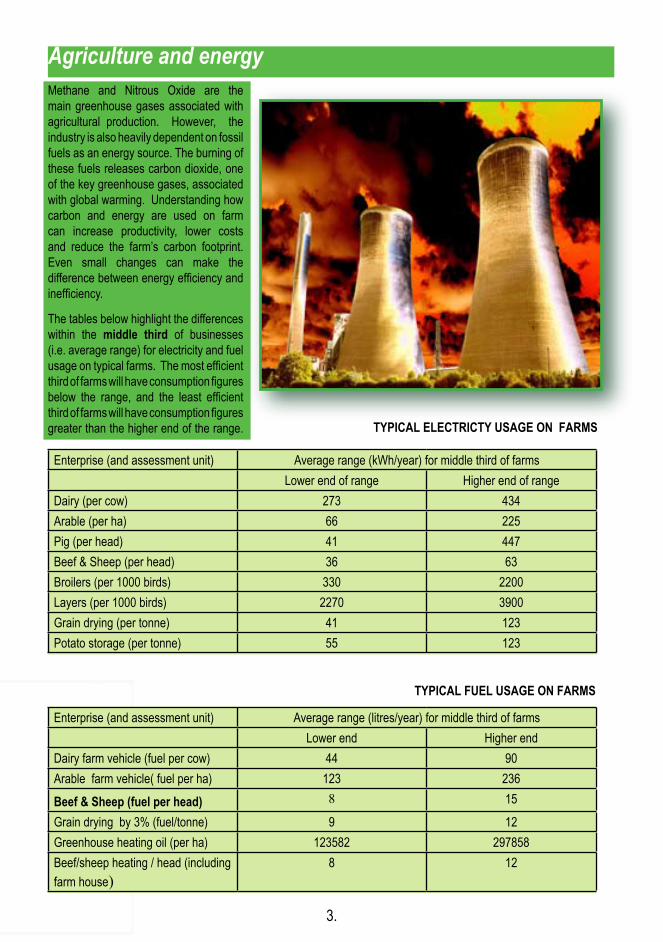
Enterprise (and assessment unit) Average range (kWh/year) for middle third of farmsLower end of range Higher end of range
Dairy (per cow) 273 434Arable (per ha) 66 225Pig (per head) 41 447Beef & Sheep (per head) 36 63Broilers (per 1000 birds) 330 2200Layers (per 1000 birds) 2270 3900Grain drying (per tonne) 41 123Potato storage (per tonne) 55 123
The table below highlights the differences between enterprises that are rated good or poor in terms of electricity usage on typical farms.
Agriculture and energyMethane and Nitrous Oxide are the main greenhouse gases associated with agricultural production. However, the industry is also heavily dependent on fossil fuels as an energy source. The burning of these fuels releases carbon dioxide, one of the key greenhouse gases, associated with global warming. Understanding how carbon and energy are used on farm can increase productivity, lower costs and reduce the farm’s carbon footprint. Even small changes can make the difference between energy efficiency and inefficiency.
The tables below highlight the differences within the middle third of businesses (i.e. average range) for electricity and fuel usage on typical farms. The most efficient third of farms will have consumption figures below the range, and the least efficient third of farms will have consumption figures greater than the higher end of the range.
Enterprise (and assessment unit) Average range (litres/year) for middle third of farmsLower end Higher end
Dairy farm vehicle (fuel per cow) 44 90Arable farm vehicle( fuel per ha) 123 236Beef & Sheep (fuel per head) 8 15Grain drying by 3% (fuel/tonne) 9 12Greenhouse heating oil (per ha) 123582 297858Beef/sheep heating / head (including farm house)
8 12
TYPICAL ELECTRICTY USAGE ON FARMS
TYPICAL FUEL USAGE ON FARMS
3.
If your farm is at poor end of the scale, or you don’t know how to look at your farm on unit/usage basis you are probably not managing your energy consumption in the most effective way. This booklet will lead you through the farm energy audit process, and help you focus on the key elements of energy costs. In addition it will prioritise cost-effective options that will reduce business costs and carbon emissions.
Energy Use in Agriculture
The energy used in agriculture can be classified as either “direct” or “indirect”. Direct energy usage includes the fuel oils, electricity and gas consumed on the farm, as well as fuel used by machinery and work rates for individual pieces of machinery. Indirect costs are easily overlooked but they include;
Energy used in the manufacture, packaging and storage of fertiliser and spray chemicals.
Energy used in the extraction of minerals, manufacture, transport and maintenance of machinery.
Road transport uses fuel directly, but also includes energy used in manufacture and maintenance.
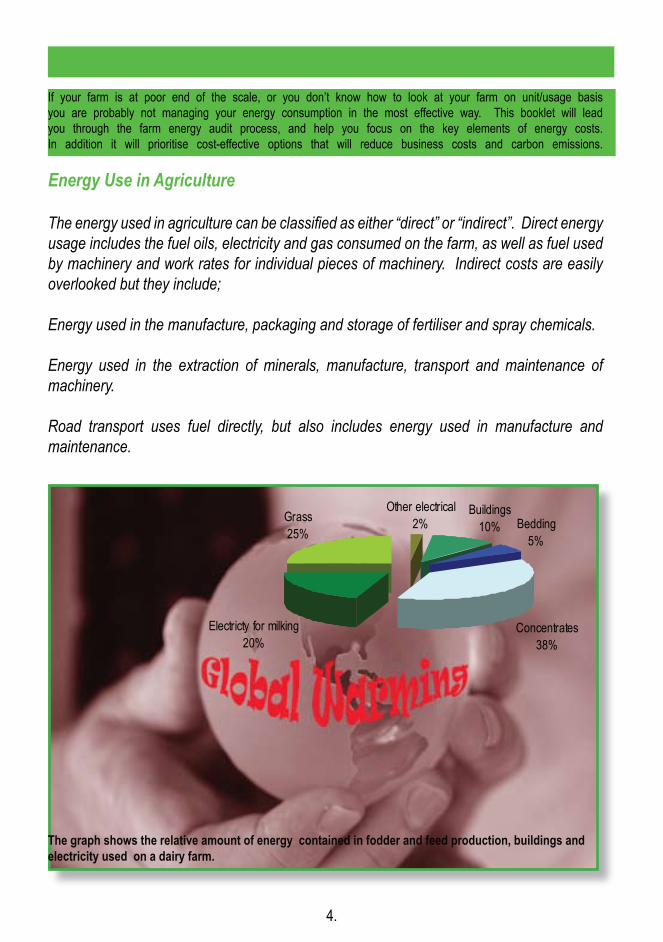
Concentrates38%
Bedding5%
Buildings10%
Other electrical2%Grass
25%
Electricty for milking20%
4.
The graph shows the relative amount of energy contained in fodder and feed production, buildings and electricity used on a dairy farm.
ENER
GY M
ANAG
EMEN
T CHE
CKLIS
T
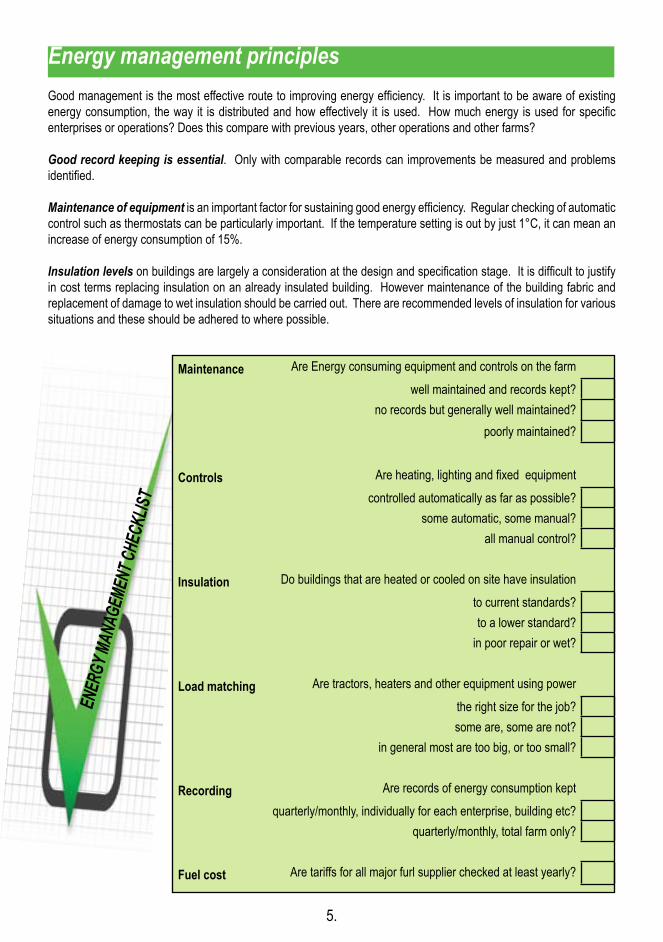
Maintenance Are Energy consuming equipment and controls on the farmwell maintained and records kept?
no records but generally well maintained?poorly maintained?
Controls Are heating, lighting and fixed equipmentcontrolled automatically as far as possible?
some automatic, some manual?all manual control?
Insulation Do buildings that are heated or cooled on site have insulationto current standards?to a lower standard?
in poor repair or wet?
Load matching Are tractors, heaters and other equipment using powerthe right size for the job?some are, some are not?
in general most are too big, or too small?
Recording Are records of energy consumption keptquarterly/monthly, individually for each enterprise, building etc?
quarterly/monthly, total farm only?
Fuel cost Are tariffs for all major furl supplier checked at least yearly?
Energy management principlesGood management is the most effective route to improving energy efficiency. It is important to be aware of existing energy consumption, the way it is distributed and how effectively it is used. How much energy is used for specific enterprises or operations? Does this compare with previous years, other operations and other farms?
Good record keeping is essential. Only with comparable records can improvements be measured and problems identified.
Maintenance of equipment is an important factor for sustaining good energy efficiency. Regular checking of automatic control such as thermostats can be particularly important. If the temperature setting is out by just 1°C, it can mean an increase of energy consumption of 15%.
Insulation levels on buildings are largely a consideration at the design and specification stage. It is difficult to justify in cost terms replacing insulation on an already insulated building. However maintenance of the building fabric and replacement of damage to wet insulation should be carried out. There are recommended levels of insulation for various situations and these should be adhered to where possible.
5.
Energy costs and carbon savingsOpportunities from choice of fuelThe cost of energy consumption can be significantly reduced by selection of fuel type, its supply method or the supplier.
High-grade energy supplies, such as electricity are easy to control and utilise compact and relatively inexpensive plant. However, they have a high unit energy cost. Other fuels may be less easily controlled and require large equipment to convert them, but they are much cheaper per unit of energy. For example renewable fuels like straw may require specialised boilers or burners but the energy cost could be 10% lower than that of the equivalent quantity of gas oil. However these energy cost savings need to be weighed against the higher capital costs associated with renewable fuel choices. High energy consumers in particular need to be aware of all the choices open to them and alternative energy supplies should certainly be considered.
Renewable fuels
Renewable fuels in an agricultural context are mainly crop residues or energy crops. Straw as a fuel for on farm heating applications can provide very large cost savings. When used on farm, and considering only the cost of baling and carting, straw can cost 90% less per unit of energy than class D fuel oil. The local market for straw for stock uses will also have a bearing on the relative value of the energy from this fuel.
In common with all solid fuels the equipment for combustion for renewable fuels is more expensive and the effect of capital and running costs on the overall cost of energy delivery should be considered.
In some locations the use of wind energy to supply electricity may be economic. From a consumer point of view considerations such as variability of supply and matching this to demand and disposal of the excess power generated are prevalent. Capital cost of the equipment is high however running costs are low. Most wind energy applications are orientated towards supply of electricity to the grid through a Renewables Obligation Contract. Planning implications should not be underestimated. An outline proposal, then a full feasibility study should be undertaken before proceeding with such projects.
Certain agricultural locations may be suitable for hydro-electricity power. Generally this will be of a modest capacity, with Renewables Obligation opportunities for disposal of excess. The planning and approvals process by the Environment Agency Wales though is complex and should not be underestimated.
Energy from waste presents some opportunities in agriculture and food related businesses. High-energy users such as protected crops enterprises can utilise waste heat from industrial processes and power stations. Producers of waste heat do not possess the necessary expertise and industry know-how to start up businesses. There are therefore opportunities for those currently in the industry to form business relationships for the establishment of production on these sites.
There is a companion booklet to this one entitled ‘Energy efficiency and energy generation on farm – a guide’ that gives an overview of renewable energy. It can be downloaded from the CALU website using the following link http://www.calu.bangor.ac.uk/energybooklet.
6.
The farm energy audit
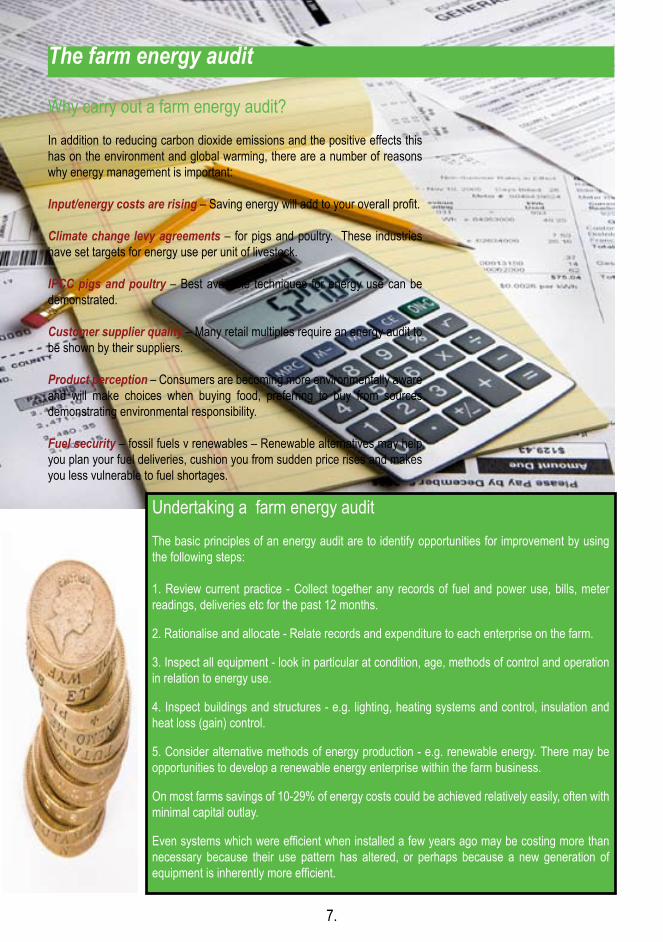
Why carry out a farm energy audit?In addition to reducing carbon dioxide emissions and the positive effects this has on the environment and global warming, there are a number of reasons why energy management is important:
Input/energy costs are rising – Saving energy will add to your overall profit.
Climate change levy agreements – for pigs and poultry. These industries have set targets for energy use per unit of livestock.
IPCC pigs and poultry – Best available techniques for energy use can be demonstrated.
Customer supplier quality – Many retail multiples require an energy audit to be shown by their suppliers.
Product perception – Consumers are becoming more environmentally aware and will make choices when buying food, preferring to buy from sources demonstrating environmental responsibility.
Fuel security – fossil fuels v renewables – Renewable alternatives may help you plan your fuel deliveries, cushion you from sudden price rises and makes you less vulnerable to fuel shortages.
Undertaking a farm energy auditThe basic principles of an energy audit are to identify opportunities for improvement by using the following steps:
1. Review current practice - Collect together any records of fuel and power use, bills, meter readings, deliveries etc for the past 12 months.
2. Rationalise and allocate - Relate records and expenditure to each enterprise on the farm.
3. Inspect all equipment - look in particular at condition, age, methods of control and operation in relation to energy use.
4. Inspect buildings and structures - e.g. lighting, heating systems and control, insulation and heat loss (gain) control.
5. Consider alternative methods of energy production - e.g. renewable energy. There may be opportunities to develop a renewable energy enterprise within the farm business.
On most farms savings of 10-29% of energy costs could be achieved relatively easily, often with minimal capital outlay.
Even systems which were efficient when installed a few years ago may be costing more than necessary because their use pattern has altered, or perhaps because a new generation of equipment is inherently more efficient.
7.
Energy use on your farm
Calculating your energy use and carbon dioxide emissions may seem daunting but the process is straightforward.
Collect and keep all your bills or usage records. Write the actual meter reading on the paid bills. Make a copy of each bill and keep two files - one file for originals, the other for copies. That way you will still have access to the information when your accountant requires the originals.
Two tables are provided (pages 9 and 10). The first looks at total energy consumption and carbon emissions. The second table compares your farm data against the energy ranges that can be reasonably expected from the middle third of similar farms. Each table needs to be completed in turn following the guidelines providied.
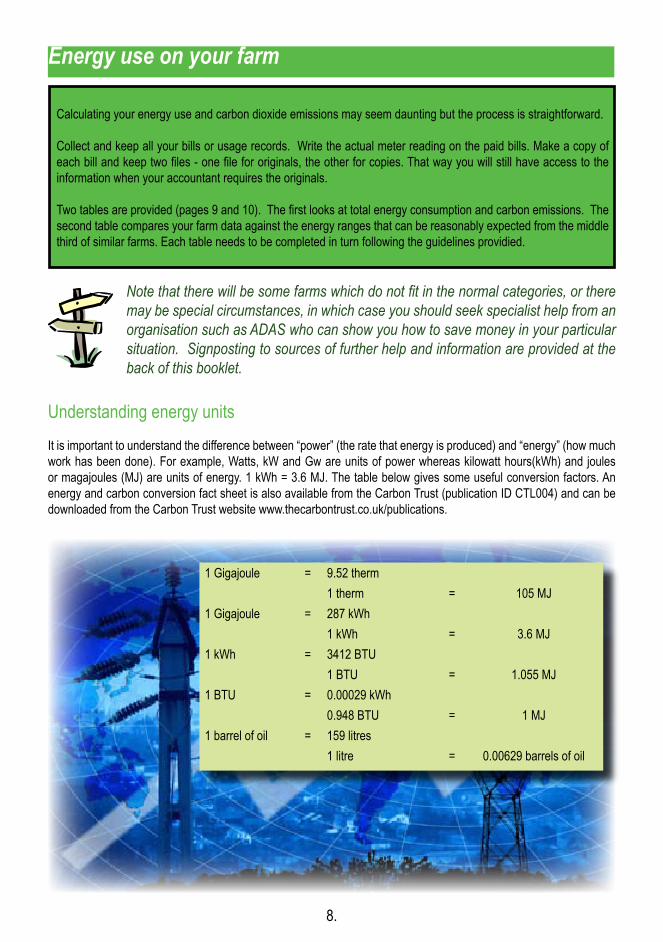
1 Gigajoule = 9.52 therm1 therm = 105 MJ
1 Gigajoule = 287 kWh1 kWh = 3.6 MJ
1 kWh = 3412 BTU1 BTU = 1.055 MJ
1 BTU = 0.00029 kWh0.948 BTU = 1 MJ
1 barrel of oil = 159 litres1 litre = 0.00629 barrels of oil
Note that there will be some farms which do not fit in the normal categories, or there may be special circumstances, in which case you should seek specialist help from an organisation such as ADAS who can show you how to save money in your particular situation. Signposting to sources of further help and information are provided at the back of this booklet.
Understanding energy unitsIt is important to understand the difference between “power” (the rate that energy is produced) and “energy” (how much work has been done). For example, Watts, kW and Gw are units of power whereas kilowatt hours(kWh) and joules or magajoules (MJ) are units of energy. 1 kWh = 3.6 MJ. The table below gives some useful conversion factors. An energy and carbon conversion fact sheet is also available from the Carbon Trust (publication ID CTL004) and can be downloaded from the Carbon Trust website www.thecarbontrust.co.uk/publications.
8.
(A)Annual fuel costs
(ex. VAT)
(B)Annual fuel
consumption
(C)MJ energyconsumed
(D)kg CO2
releasedStandard rate electricty £ kWh B x 3.6 B x 0.44
Night rate electricity £ kWh B x 3.6 B x 0.44
Mains gas (therms) £ therms B x 105 B x 5.50
Mains gas (m3) £ (m3) B x 10.99 B x 2.09
Mains gas (kWh) £ (kWh) B x 3.6 B x 0.19
Propane - bulk £ litres B x 25 B x 1.65
Propane - bottled £ kg B x 50 B x 3.30
ULSD (DERV) £ litres B x 38 B x 2.68
Petrol £ litres B x 36 B x 2.31
Farm vehicle fuel (Red diesel) £ litres B x 38 B x 2.68
Heating oil (gas oil) £ tonnes B x 38 B x 2.68
Coal £ tonnes B x 28000
B x 2419
Straw £ oven dry tonnes
B x 15000
neutral
Wood £ oven dry tonnes
B x 18000
neutral
Other £TOTALS £
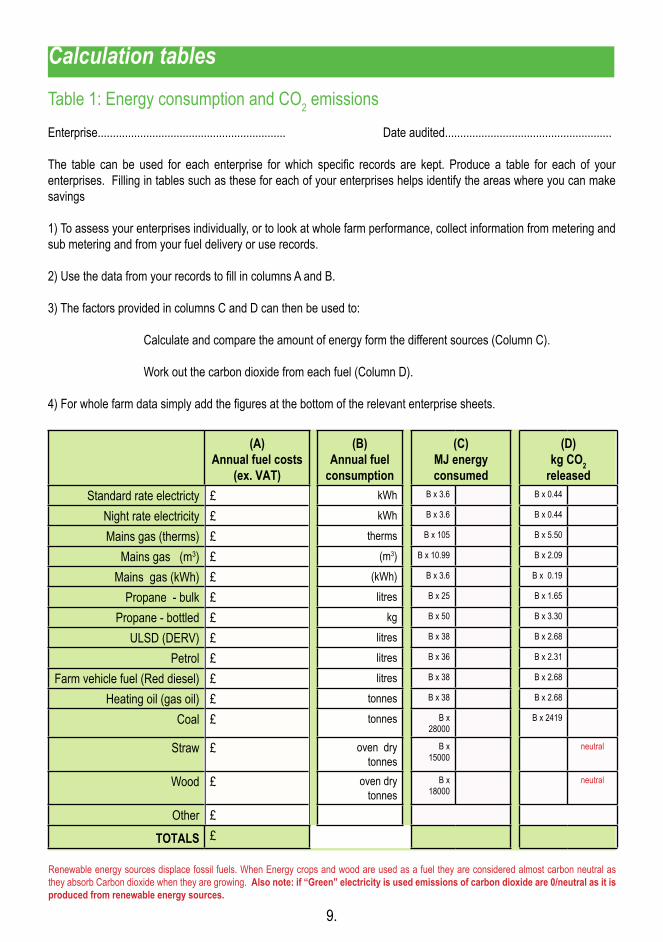
Calculation tablesTable 1: Energy consumption and CO2 emissionsEnterprise.............................................................. Date audited.......................................................
The table can be used for each enterprise for which specific records are kept. Produce a table for each of your enterprises. Filling in tables such as these for each of your enterprises helps identify the areas where you can make savings
1) To assess your enterprises individually, or to look at whole farm performance, collect information from metering and sub metering and from your fuel delivery or use records.
2) Use the data from your records to fill in columns A and B.
3) The factors provided in columns C and D can then be used to:
Calculate and compare the amount of energy form the different sources (Column C).
Work out the carbon dioxide from each fuel (Column D).
4) For whole farm data simply add the figures at the bottom of the relevant enterprise sheets.
Renewable energy sources displace fossil fuels. When Energy crops and wood are used as a fuel they are considered almost carbon neutral as they absorb Carbon dioxide when they are growing. Also note: if “Green” electricity is used emissions of carbon dioxide are 0/neutral as it is produced from renewable energy sources. 9.

Calculation tables
Table 2: Farm comparisonEnterprise.............................................................. Date audited.......................................................
1) Fill in the sizes of the relevant enterprises in column A of the table.
2) Using the relevant data information sheets provided in the enterprise section at the back of the booklet, decide which range category is applicable to each of your enterprises and enter in the sub columns under column B in the table. For example using the Energy data for dairy farms sheet (page25), you would enter 3428 to 4982 if you ran a unit of up to 88 head.
3) The total expected energy range can then be calculated by multiplying column A by column B1 to give the lower end of the range and A x B2 for the higher end of the range.
4) Total together at the bottom of the table for an estimate of the energy use expected on a farm like your own.
Type of operation (A)Enterprise
size (ie. total head
or ha’s)
(B)Energy range from data
sheets(MJ energy consumed/unit)
(C)Estimated energy range
(total MJ energy consumed)
Lower(c1)
Higher(c2)Lower
(b1)Higher
(b2)Farmhouse average farmhouse 86,420
SHOP/OFFICE (area m2)Vehicle use (arable)
Arable (cereals)Glasshouses
Potato/veg storage (tonnes)
Dairy unitPigs (breeding sows)
Poultry (broilers)Poultry (layers)
Ruminant livestockOther (estimated)0ther (estimated)
TOTALS
10.
Analysing the data and taking action
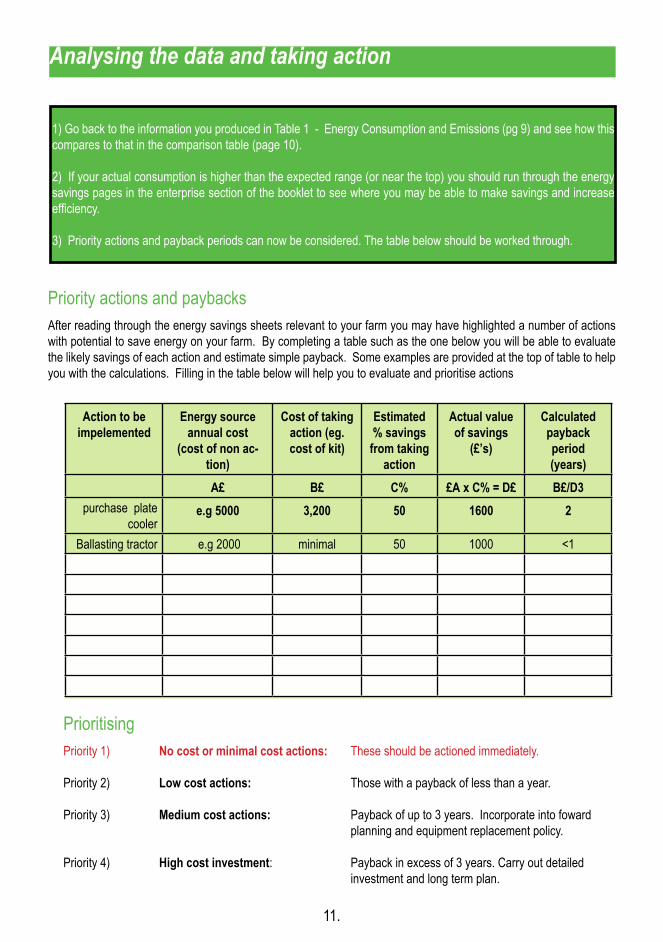
1) Go back to the information you produced in Table 1 - Energy Consumption and Emissions (pg 9) and see how this compares to that in the comparison table (page 10).
2) If your actual consumption is higher than the expected range (or near the top) you should run through the energy savings pages in the enterprise section of the booklet to see where you may be able to make savings and increase efficiency.
3) Priority actions and payback periods can now be considered. The table below should be worked through.
Priority actions and paybacksAfter reading through the energy savings sheets relevant to your farm you may have highlighted a number of actions with potential to save energy on your farm. By completing a table such as the one below you will be able to evaluate the likely savings of each action and estimate simple payback. Some examples are provided at the top of table to help you with the calculations. Filling in the table below will help you to evaluate and prioritise actions
Action to be impelemented
Energy source annual cost
(cost of non ac-tion)
Cost of taking action (eg. cost of kit)
Estimated % savings from taking
action
Actual value of savings
(£’s)
Calculated payback period(years)
A£ B£ C% £A x C% = D£ B£/D3purchase plate
coolere.g 5000 3,200 50 1600 2
Ballasting tractor e.g 2000 minimal 50 1000 <1
PrioritisingPriority 1) No cost or minimal cost actions: These should be actioned immediately.
Priority 2) Low cost actions: Those with a payback of less than a year.
Priority 3) Medium cost actions: Payback of up to 3 years. Incorporate into foward planning and equipment replacement policy.
Priority 4) High cost investment: Payback in excess of 3 years. Carry out detailed investment and long term plan.
11.
Enterprise information sheets
Data sheetsThe enterprise data sheets are compiled from statistics gathered from real farms over a four-year period and as a result they relate to real situations and therefore, should relate directly to most farms. However, they are based on accurate records of individual farm out goings, and may not be exactly comparable to your own situation. The spread of farms used to produce the data sheets should be sufficient to even out most discrepancies. The enterprise data sheets are compiled from statistics gathered from real farms over a four-year period and as a result they relate to real situations and therefore, the figures should relate directly to most farms. However, they are based on accurate records of individual farm out goings, and may not be exactly comparable to your own situation. The spread of farms used to produce the data sheets should be sufficient to even out most discrepancies.
Where insufficient records of a particular type of operation exist, categories may have been combined; e.g. beef and sheep are grouped together under ruminant livestock.
On many farms the cost of the energy consumption for the farmhouse cannot be separated from the rest of the farm enterprise costs. In most cases these additional costs will not alter the overall figures greatly and so these farms have been included in the statistics.
The ranges of energy consumption used are based upon the middle third of single use enterprises, and incorporates any advantages that single use or specialist farms may achieve. The overall annual cost figures include all fuels that have been used on those units to give a general picture.
Additional information is given where appropriate to indicate the typical breakdown of costs for the most common sources of energy e.g. electricity or gas, but this should not be confused with total predicted costs as most of the farms use more than one fuel and the main one may differ.
If your energy use is higher than the range suggests it should be, and there are no special circumstances you should look at your business more closely to assess where energy and cost savings can be made.
Please note that the figures used in the data sheets are indicative.
Energy Savings SheetsThese sheets will help you ‘audit’ energy opportunities and give a guide to potential savings. They are not exhaustive, but highlight ways in which energy consumption and costs can be reduced on single or mixed enterprise farms.
Specialist advice may be needed to fully analyse complex operations, but these sheets give a broad indication of where most energy is likely to be saved and enable you to become more energy savvy.
The measures illustrated are for example only as actual savings and costs must be evaluated for specific situations. Undertaking more than one suggestion may be beneficial but note that the cost savings quoted are not cumulative. A good way of comparing the most cost-effective changes to calculate the payback period this is done by dividing the cost by the annual saving to give payback periods in years. Remember to take into account additional costs, such as possible yield loss or reduced quality, which can easily outweigh capital costs.
12.
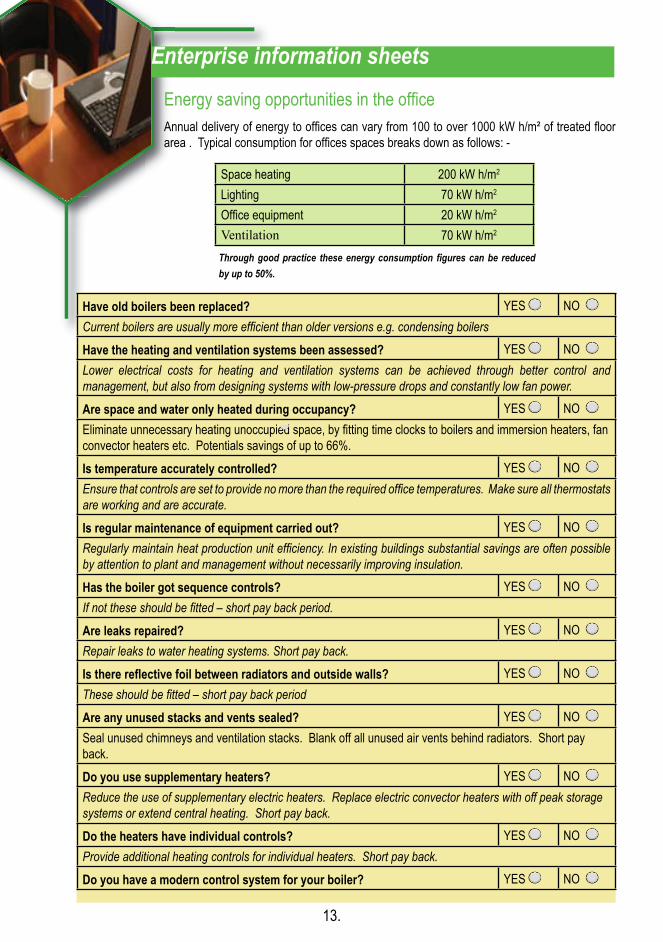
Enterprise information sheets Energy saving opportunities in the officeAnnual delivery of energy to offices can vary from 100 to over 1000 kW h/m² of treated floor area . Typical consumption for offices spaces breaks down as follows: -
Space heating 200 kW h/m2
Lighting 70 kW h/m2
Office equipment 20 kW h/m2
Ventilation 70 kW h/m2
Through good practice these energy consumption figures can be reduced by up to 50%.
Have old boilers been replaced? YES NO Current boilers are usually more efficient than older versions e.g. condensing boilers
Have the heating and ventilation systems been assessed? YES NO Lower electrical costs for heating and ventilation systems can be achieved through better control and management, but also from designing systems with low-pressure drops and constantly low fan power.
Are space and water only heated during occupancy? YES NO Eliminate unnecessary heating unoccupied space, by fitting time clocks to boilers and immersion heaters, fan convector heaters etc. Potentials savings of up to 66%.Is temperature accurately controlled? YES NO Ensure that controls are set to provide no more than the required office temperatures. Make sure all thermostats are working and are accurate.
Is regular maintenance of equipment carried out? YES NO Regularly maintain heat production unit efficiency. In existing buildings substantial savings are often possible by attention to plant and management without necessarily improving insulation.
Has the boiler got sequence controls? YES NO If not these should be fitted – short pay back period.
Are leaks repaired? YES NO Repair leaks to water heating systems. Short pay back.
Is there reflective foil between radiators and outside walls? YES NO These should be fitted – short pay back period
Are any unused stacks and vents sealed? YES NO Seal unused chimneys and ventilation stacks. Blank off all unused air vents behind radiators. Short pay back.Do you use supplementary heaters? YES NO Reduce the use of supplementary electric heaters. Replace electric convector heaters with off peak storage systems or extend central heating. Short pay back.
Do the heaters have individual controls? YES NO Provide additional heating controls for individual heaters. Short pay back.
Do you have a modern control system for your boiler? YES NO
13.
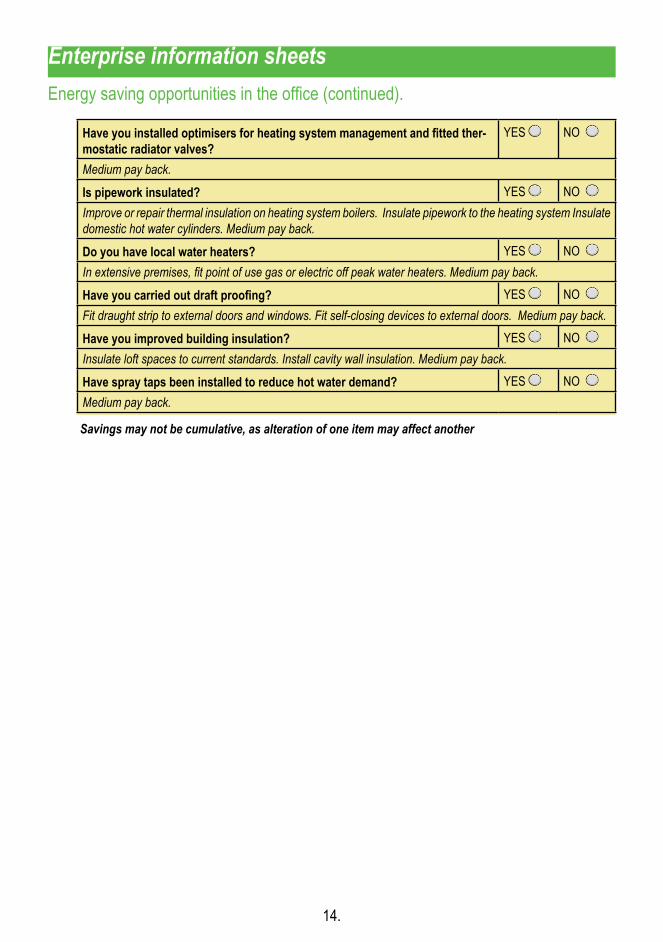
Have you installed optimisers for heating system management and fitted ther-mostatic radiator valves?
YES NO
Medium pay back.
Is pipework insulated? YES NO Improve or repair thermal insulation on heating system boilers. Insulate pipework to the heating system Insulate domestic hot water cylinders. Medium pay back.
Do you have local water heaters? YES NO In extensive premises, fit point of use gas or electric off peak water heaters. Medium pay back.
Have you carried out draft proofing? YES NO Fit draught strip to external doors and windows. Fit self-closing devices to external doors. Medium pay back.
Have you improved building insulation? YES NO Insulate loft spaces to current standards. Install cavity wall insulation. Medium pay back.
Have spray taps been installed to reduce hot water demand? YES NO Medium pay back.
Enterprise information sheets Energy saving opportunities in the office (continued).
Savings may not be cumulative, as alteration of one item may affect another
14.
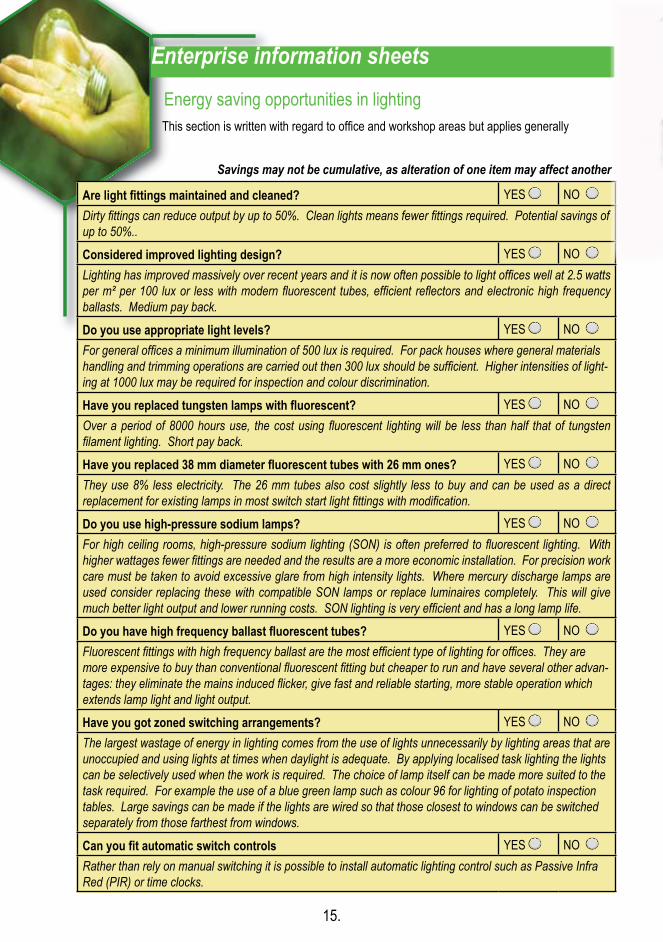
Enterprise information sheets Energy saving opportunities in lighting
Are light fittings maintained and cleaned? YES NO Dirty fittings can reduce output by up to 50%. Clean lights means fewer fittings required. Potential savings of up to 50%..
Considered improved lighting design? YES NO Lighting has improved massively over recent years and it is now often possible to light offices well at 2.5 watts per m² per 100 lux or less with modern fluorescent tubes, efficient reflectors and electronic high frequency ballasts. Medium pay back.
Do you use appropriate light levels? YES NO For general offices a minimum illumination of 500 lux is required. For pack houses where general materials handling and trimming operations are carried out then 300 lux should be sufficient. Higher intensities of light-ing at 1000 lux may be required for inspection and colour discrimination.
Have you replaced tungsten lamps with fluorescent? YES NO Over a period of 8000 hours use, the cost using fluorescent lighting will be less than half that of tungsten filament lighting. Short pay back.
Have you replaced 38 mm diameter fluorescent tubes with 26 mm ones? YES NO They use 8% less electricity. The 26 mm tubes also cost slightly less to buy and can be used as a direct replacement for existing lamps in most switch start light fittings with modification.
Do you use high-pressure sodium lamps? YES NO For high ceiling rooms, high-pressure sodium lighting (SON) is often preferred to fluorescent lighting. With higher wattages fewer fittings are needed and the results are a more economic installation. For precision work care must be taken to avoid excessive glare from high intensity lights. Where mercury discharge lamps are used consider replacing these with compatible SON lamps or replace luminaires completely. This will give much better light output and lower running costs. SON lighting is very efficient and has a long lamp life.
Do you have high frequency ballast fluorescent tubes? YES NO Fluorescent fittings with high frequency ballast are the most efficient type of lighting for offices. They are more expensive to buy than conventional fluorescent fitting but cheaper to run and have several other advan-tages: they eliminate the mains induced flicker, give fast and reliable starting, more stable operation which extends lamp light and light output.
Have you got zoned switching arrangements? YES NO The largest wastage of energy in lighting comes from the use of lights unnecessarily by lighting areas that are unoccupied and using lights at times when daylight is adequate. By applying localised task lighting the lights can be selectively used when the work is required. The choice of lamp itself can be made more suited to the task required. For example the use of a blue green lamp such as colour 96 for lighting of potato inspection tables. Large savings can be made if the lights are wired so that those closest to windows can be switched separately from those farthest from windows.
Can you fit automatic switch controls YES NO Rather than rely on manual switching it is possible to install automatic lighting control such as Passive Infra Red (PIR) or time clocks.
This section is written with regard to office and workshop areas but applies generally
Savings may not be cumulative, as alteration of one item may affect another
15.

Energy saving opportunities in tractors and transportApproximate savings calculated from a 75KW engine power tractor (range 50KW-100KW) assuming 50% rated power at 70% rated speed used with a specific fuel consumption of 0.27 litres/kW/hour and fuel at 34p/litre. Fuel consumption 10.1 litres/hour (75KW) Annual cost savings may be estimated if the total annual hours are known for performing a particular task. Higher savings may be made for tasks that use full rated power. Potential savings will of course vary with oil prices.
Enterprise information sheets
Are tractors matched to the job in hand particularly for PTO work? YES NO Use tractors with a high power/weight ratio. Potential savings of up to 4%.
Do you match engine speed to PTO speed? YES NO This increases engine efficiency. For PTO work in particular avoid using tractors overpowered for the job in hand. Potential savings of up to 30% .
Do you correctly ballast tractors to reduce wheel slip for heavy draught work? YES NO Correct tyre inflation essential. Potential Savings of up to 15%. Remove ballast when not needed.
Do you check fuel consumption figures when purchasing a tractor? YES NO Official tests reveal differences between best and worst but treat with caution. Variations exist between models for the same manufacturer. Potential savings of up to 13%.
Do your tractors have driver aids e.g. power shift transmissions? YES NO Driver aids cause power loss but can improve comfort and efficiency in the field. This could offset any savings achieved by not having these aids. Potential savings of up to 7%.
Do you correct tyres for both tractors and trailers to reduce rolling resistance? YES NO Small tyres are often overloaded with inflation pressures up to 4-5 bar. Larger tyres should be substituted with lower inflation pressures 1-1.5 bar. Potential savings of up to 30%.
Do you reduce implement width to reduce wheel slip? YES NO Maximum traction efficiency occurs at 10-15% wheel slip. Wheel slip is noticeable at 20% - if it can be seen it is too high. Reducing the number of furrow or tines on draught implements can enable wheel slip to be reduced. (Work rate should not suffer unduly if a higher gear is chosen). Potential savings of up to 15%.
Do you choose the best combination of gear/engine speed for heavy draught work?
YES NO
Speed 6-7 km/hour at rated engine speed (governor set at maximum setting). If optimum ballast and imple-ment width not possible, choose a higher gear and lower engine speed. Gear up + throttle down. Savings up to 30%.
Do you stop the engine rather than let idle? YES NO Switch off the engine when appropriate if long waits are anticipated.
Is tractor serviced according to the manufacturer’s maintenance schedule? YES NO Regular monitoring of tractor hours and fuel consumption required. Regular maintenance of the block air cleaner and radiator essential. Potential Savings of up to 10%.
Have you reviewed cultivation systems used? YES NO 50% saving possible on reduced compared to conventional cultivations. For example: direct drilling reduces fuel consumption to 20% of for that conventional cultivation techniques. Combination drills/cultivators and front/rear mounted implements all improve field efficiency and fuel efficiency.
Savings may not be cumulative, as alteration of one item may affect another
16.

Most of the energy used is from farm vehicle fuel. This breaks down as follows:
FARM VEHICLE FUEL ENERGY USED EACH YEARper hectare
SMALLER UNIT up to 250 ha Equivalent litres of fuel 123 to 149MEDIUM UNIT 250 to 400 ha Equivalent litres of fuel 150 to 263LARGER UNIT over 400 ha Equivalent litres of fuel 125 to 175
Electricty and DERV consumption can be summarised as follows:-
Electricity kWh/year/ha
DERV litres/year/ha
SMALLER UNIT up to 250 ha Equivalent energy 89 to 183 17 to 45MEDIUM UNIT 250 to 400 ha Equivalent energy 128 to 225 19 to 37LARGER UNIT over 400 ha Equivalent energy 6 to 95 6 to 7
Energy saving opportunities for arable farmsCULTIVATIONS AND CROP HUSBANDRYTypical fuel costs for field cultivations on a 200 hectare arable enterprise are £10,000 per year. Recording fuel and equipment use can provide accurate information on the relative fuel used by each operation and focus on the energy used.
Enterprise information sheets Energy data for arable farms
TOTAL ENERGY USED EACH YEAREnergy consumed
(MJ/ha)Cost/ha
SMALLER UNIT up to 250 ha 5640 to 8030 £72 to £100MEDIUM UNIT 250 to 400 ha 6883 to 11184 £80 to £90LARGER UNIT over 400 ha 5000 to 7258 £44 to £60
Can minimal cultivation techniques be used? YES NO Consider type of seedbeds required for the crops grown depth of cultivation, trash burial and the effective-ness of herbicides. Potential savings of up to 90 %.
Have you considered growing energy crops ? YES NO Energy crops reduce maintenance input and have net energy contribution. Saving 80 % of inputs. They can also be grown on set-aside.
Have you considered changing to lower input crops? YES NO Review profitability of each crop in the light of energy and other input costs.
Is each cultivation operation really necessary? YES NO Examine the soil and avoid ‘recreational cultivation’. Potential savings of up to 50 %.
17.
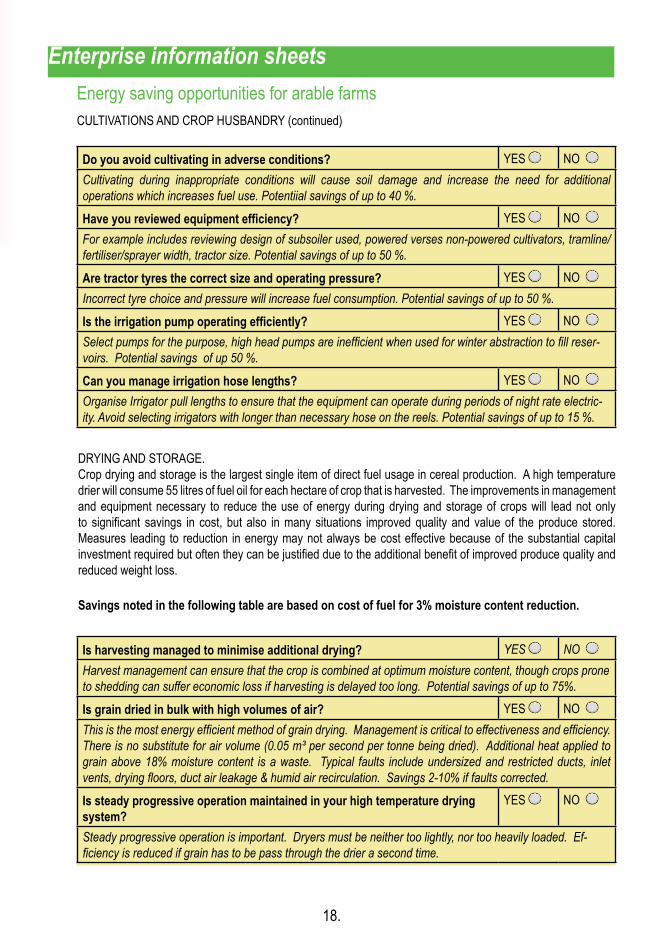
Enterprise information sheets
Do you avoid cultivating in adverse conditions? YES NO Cultivating during inappropriate conditions will cause soil damage and increase the need for additional operations which increases fuel use. Potentiial savings of up to 40 %.
Have you reviewed equipment efficiency? YES NO For example includes reviewing design of subsoiler used, powered verses non-powered cultivators, tramline/fertiliser/sprayer width, tractor size. Potential savings of up to 50 %.
Are tractor tyres the correct size and operating pressure? YES NO Incorrect tyre choice and pressure will increase fuel consumption. Potential savings of up to 50 %.
Is the irrigation pump operating efficiently? YES NO Select pumps for the purpose, high head pumps are inefficient when used for winter abstraction to fill reser-voirs. Potential savings of up 50 %.
Can you manage irrigation hose lengths? YES NO Organise Irrigator pull lengths to ensure that the equipment can operate during periods of night rate electric-ity. Avoid selecting irrigators with longer than necessary hose on the reels. Potential savings of up to 15 %.
DRYING AND STORAGE.Crop drying and storage is the largest single item of direct fuel usage in cereal production. A high temperature drier will consume 55 litres of fuel oil for each hectare of crop that is harvested. The improvements in management and equipment necessary to reduce the use of energy during drying and storage of crops will lead not only to significant savings in cost, but also in many situations improved quality and value of the produce stored. Measures leading to reduction in energy may not always be cost effective because of the substantial capital investment required but often they can be justified due to the additional benefit of improved produce quality and reduced weight loss.
Savings noted in the following table are based on cost of fuel for 3% moisture content reduction.
Energy saving opportunities for arable farmsCULTIVATIONS AND CROP HUSBANDRY (continued)
Is harvesting managed to minimise additional drying? YES NO Harvest management can ensure that the crop is combined at optimum moisture content, though crops prone to shedding can suffer economic loss if harvesting is delayed too long. Potential savings of up to 75%.
Is grain dried in bulk with high volumes of air? YES NO This is the most energy efficient method of grain drying. Management is critical to effectiveness and efficiency. There is no substitute for air volume (0.05 m³ per second per tonne being dried). Additional heat applied to grain above 18% moisture content is a waste. Typical faults include undersized and restricted ducts, inlet vents, drying floors, duct air leakage & humid air recirculation. Savings 2-10% if faults corrected.
Is steady progressive operation maintained in your high temperature drying system?
YES NO
Steady progressive operation is important. Dryers must be neither too lightly, nor too heavily loaded. Ef-ficiency is reduced if grain has to be pass through the drier a second time.
18.
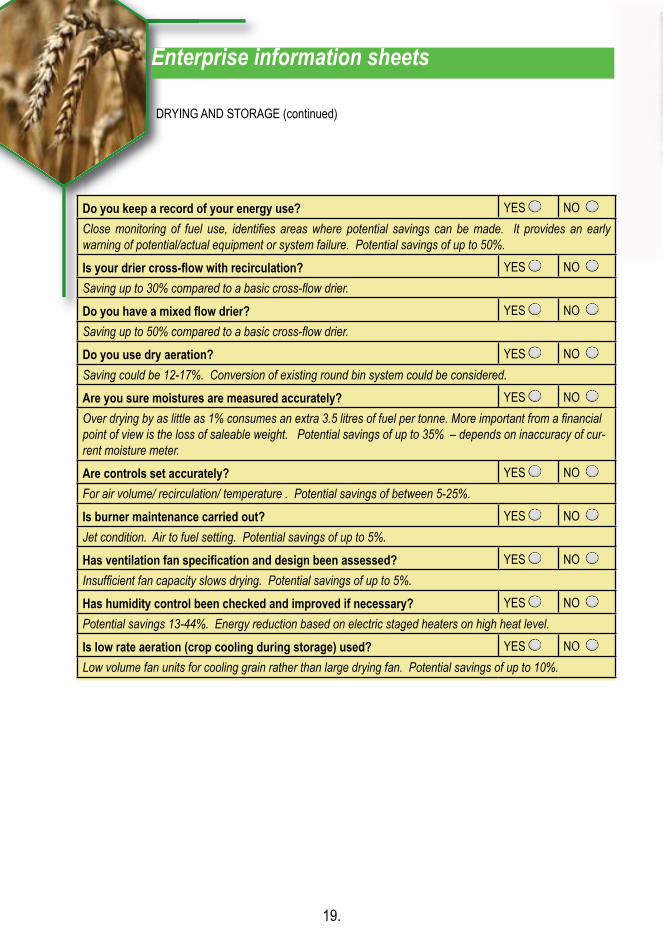
Enterprise information sheets
Do you keep a record of your energy use? YES NO Close monitoring of fuel use, identifies areas where potential savings can be made. It provides an early warning of potential/actual equipment or system failure. Potential savings of up to 50%.
Is your drier cross-flow with recirculation? YES NO Saving up to 30% compared to a basic cross-flow drier.
Do you have a mixed flow drier? YES NO Saving up to 50% compared to a basic cross-flow drier.
Do you use dry aeration? YES NO Saving could be 12-17%. Conversion of existing round bin system could be considered.
Are you sure moistures are measured accurately? YES NO Over drying by as little as 1% consumes an extra 3.5 litres of fuel per tonne. More important from a financial point of view is the loss of saleable weight. Potential savings of up to 35% – depends on inaccuracy of cur-rent moisture meter.
Are controls set accurately? YES NO For air volume/ recirculation/ temperature . Potential savings of between 5-25%.
Is burner maintenance carried out? YES NO Jet condition. Air to fuel setting. Potential savings of up to 5%.
Has ventilation fan specification and design been assessed? YES NO Insufficient fan capacity slows drying. Potential savings of up to 5%.
Has humidity control been checked and improved if necessary? YES NO Potential savings 13-44%. Energy reduction based on electric staged heaters on high heat level.
Is low rate aeration (crop cooling during storage) used? YES NO Low volume fan units for cooling grain rather than large drying fan. Potential savings of up to 10%.
DRYING AND STORAGE (continued)
19.
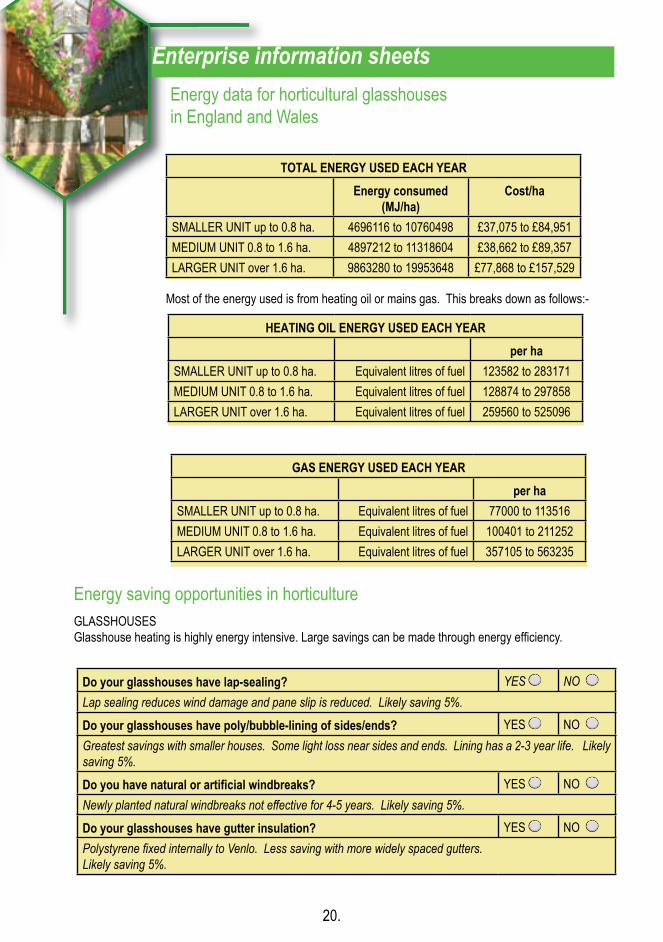
Enterprise information sheets Energy data for horticultural glasshousesin England and Wales
TOTAL ENERGY USED EACH YEAREnergy consumed
(MJ/ha)Cost/ha
SMALLER UNIT up to 0.8 ha. 4696116 to 10760498 £37,075 to £84,951MEDIUM UNIT 0.8 to 1.6 ha. 4897212 to 11318604 £38,662 to £89,357LARGER UNIT over 1.6 ha. 9863280 to 19953648 £77,868 to £157,529
Most of the energy used is from heating oil or mains gas. This breaks down as follows:-
HEATING OIL ENERGY USED EACH YEARper ha
SMALLER UNIT up to 0.8 ha. Equivalent litres of fuel 123582 to 283171MEDIUM UNIT 0.8 to 1.6 ha. Equivalent litres of fuel 128874 to 297858LARGER UNIT over 1.6 ha. Equivalent litres of fuel 259560 to 525096
GAS ENERGY USED EACH YEARper ha
SMALLER UNIT up to 0.8 ha. Equivalent litres of fuel 77000 to 113516MEDIUM UNIT 0.8 to 1.6 ha. Equivalent litres of fuel 100401 to 211252LARGER UNIT over 1.6 ha. Equivalent litres of fuel 357105 to 563235
Energy saving opportunities in horticulture GLASSHOUSESGlasshouse heating is highly energy intensive. Large savings can be made through energy efficiency.
Do your glasshouses have lap-sealing? YES NO Lap sealing reduces wind damage and pane slip is reduced. Likely saving 5%.
Do your glasshouses have poly/bubble-lining of sides/ends? YES NO Greatest savings with smaller houses. Some light loss near sides and ends. Lining has a 2-3 year life. Likely saving 5%.
Do you have natural or artificial windbreaks? YES NO Newly planted natural windbreaks not effective for 4-5 years. Likely saving 5%.
Do your glasshouses have gutter insulation? YES NO Polystyrene fixed internally to Venlo. Less saving with more widely spaced gutters.Likely saving 5%.
20.

Enterprise information sheets Energy saving opportunities in horticulture GLASSHOUSES (continued)
Do you use a temporary “fixed” screen? YES NO 35% savings when in use for first five weeks. Overall likely saving 10%.
Does your boiler have a flue damper? YES NO Likely saving 5%.
Is there secondary glazing on the ends/sides of glasshouse? YES NO There will be some light reduction but likely energy savings of 5%.
Is your glasshouse environment computer controlled? YES NO Gives much improved environmental control. Alarms and monitoring facilities provided. Likely saving 5%.
Do your greenhouses have thermal screens? YES NO Some light loss. Higher average night temperatures and humidity. Saving depends on material. Likely saving 20 to 35%.
Energy saving opportunities in horticulture AMBIENT STORAGE OPTIONS - POTATOES, REDBEET, ONIONS.The figures given below are based on the energy consumption of a reasonably economical potato store at 130 kWh to 160 kWh per tonne per annum. The figures are also broadly applicable to onions and redbeet storage also.
Have you considered improving insulation? YES NO Increasing insulation thickness by 25 mm can reduce fan hours and heat requirement for frost protection and condensation control. Potential savings of up to 10%.
Can you improve sealing of the store? YES NO Improve store sealing at doors, eaves, vents etc. Potential savings of between 5-10%.
Do you check system efficiency and integrity ? YES NO Typical faults include undersized and restricted ducts, inlet and recirculation vents, floors. Duct leakage gives uncontrolled warm air recirculation. Potential savings between 2-10%.
Have you reviewed the suitability of the fan used? YES NO A grain store specification fan could be replaced by low-pressure fan unit. Fan should operate 10-13% of the time. Save up to 60%.
Do you have automatic control for the system? YES NO A good automatic control system compared to poor manual control could save up to 60%
Are the temperature sensors accurate? YES NO Inaccuracies can result from poorly positioned and/or inaccurate sensors. Poor setting of controller can also cause problems. Saving up to 50%.
21.
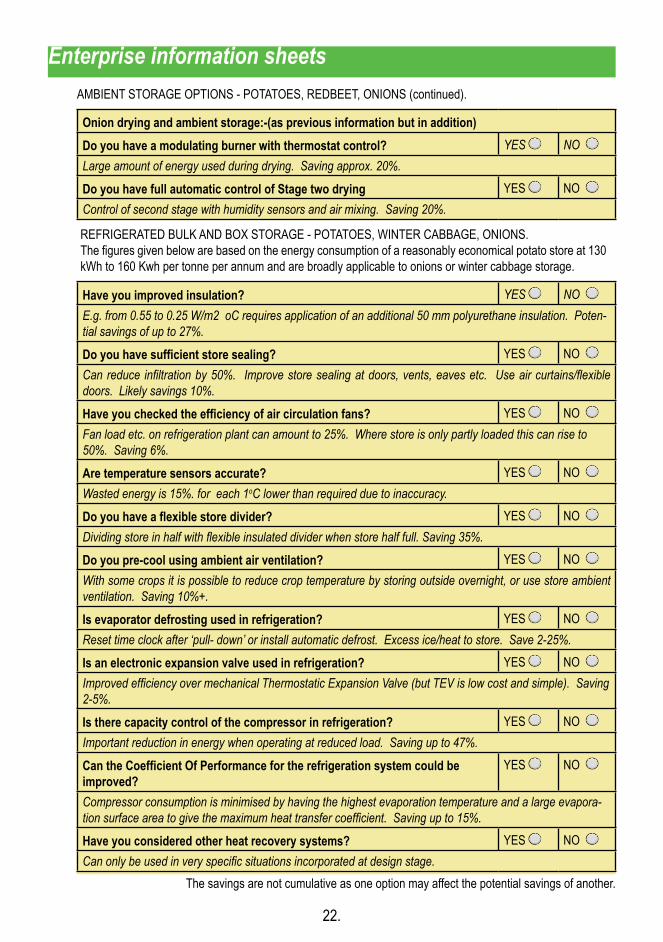
Onion drying and ambient storage:-(as previous information but in addition)Do you have a modulating burner with thermostat control? YES NO Large amount of energy used during drying. Saving approx. 20%.
Do you have full automatic control of Stage two drying YES NO Control of second stage with humidity sensors and air mixing. Saving 20%.
AMBIENT STORAGE OPTIONS - POTATOES, REDBEET, ONIONS (continued).
Enterprise information sheets
Have you improved insulation? YES NO E.g. from 0.55 to 0.25 W/m2 oC requires application of an additional 50 mm polyurethane insulation. Poten-tial savings of up to 27%.
Do you have sufficient store sealing? YES NO Can reduce infiltration by 50%. Improve store sealing at doors, vents, eaves etc. Use air curtains/flexible doors. Likely savings 10%.
Have you checked the efficiency of air circulation fans? YES NO Fan load etc. on refrigeration plant can amount to 25%. Where store is only partly loaded this can rise to 50%. Saving 6%.
Are temperature sensors accurate? YES NO Wasted energy is 15%. for each 1oC lower than required due to inaccuracy.
Do you have a flexible store divider? YES NO Dividing store in half with flexible insulated divider when store half full. Saving 35%.
Do you pre-cool using ambient air ventilation? YES NO With some crops it is possible to reduce crop temperature by storing outside overnight, or use store ambient ventilation. Saving 10%+.
Is evaporator defrosting used in refrigeration? YES NO Reset time clock after ‘pull- down’ or install automatic defrost. Excess ice/heat to store. Save 2-25%.
Is an electronic expansion valve used in refrigeration? YES NO Improved efficiency over mechanical Thermostatic Expansion Valve (but TEV is low cost and simple). Saving 2-5%.
Is there capacity control of the compressor in refrigeration? YES NO Important reduction in energy when operating at reduced load. Saving up to 47%.
Can the Coefficient Of Performance for the refrigeration system could be improved?
YES NO
Compressor consumption is minimised by having the highest evaporation temperature and a large evapora-tion surface area to give the maximum heat transfer coefficient. Saving up to 15%.
Have you considered other heat recovery systems? YES NO Can only be used in very specific situations incorporated at design stage.
REFRIGERATED BULK AND BOX STORAGE - POTATOES, WINTER CABBAGE, ONIONS. The figures given below are based on the energy consumption of a reasonably economical potato store at 130 kWh to 160 Kwh per tonne per annum and are broadly applicable to onions or winter cabbage storage.
The savings are not cumulative as one option may affect the potential savings of another.
22.

Enterprise information sheets Energy saving opportunities in horticulture LONG TERM FRUIT STORAGEFruit stores are normally of higher initial specification than vegetable stores but many of the options noted for vegetable storage also apply. These suggestions should be read in conjunction with the VEGETABLE STORAGE pages.
Is air circulation intermittent? YES NO Many stores run continuous fans with increased fuel use and reduced quality. Saving up to 15%.
Do you reset the time clock after ‘pull-down’? YES NO A common fault is not resetting the time clock after ‘pull-down’. Automatic defrost could be installed. Excess ice/heat to store. Saving about 2%.
Do you use ambient pre-cooling? YES NO Reduced energy use and quicker pull-down. Saving 10%+.
SHORT TERM FRUIT STORAGE FOR HEAT REMOVAL, COOL CHAIN TRANSIT ETC.,Low utilisation or frequent restocking increases consumption. Heat removal from ambient product etc. can increase consumption massively and % savings may not be proportionate.
Additional options to be noted:-Does the store have air curtains/flexible doors? YES NO Critical for this type of store with frequent access. Saving 5-10%.
Does the store have forced ventilation? YES NO More efficient cooling. Saving 5-10%.
PACK AREAS AND WORKSHOPS
Do you limit the space heated? YES NO Avoid unnecessarily heating of large areas that are sparsely staffed. Localised and radiant heating can save energy and provide better working conditions in large grading and washing operations. The use of partitioned enclosures increase staff comfort and retain heat. Savings up to 70%.
Do you avoid product heating? YES NO Unnecessary warming of produce as it passes through a warm pack house should be avoided, as energy will be required to re-cool the product. Saving up to 10%.
Do you only heat during occupancy? YES NO Space & water heating should be controlled to only operate during occupancy by staff (apart from frost protection). Saving up to 50%.
Is warm air recirculated? YES NO Warm air heating systems should be ducted with point outlet diffusers. These systems should always recirculate the air within the pack house area. Ventilation of the building should be controlled independently. Saving up to 50%.
23.
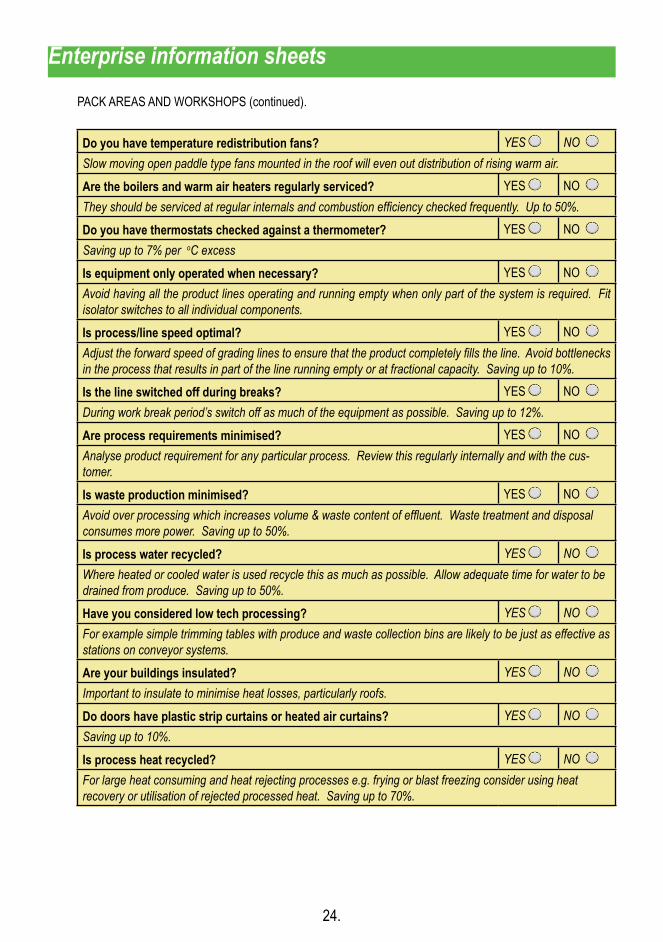
Do you have temperature redistribution fans? YES NO Slow moving open paddle type fans mounted in the roof will even out distribution of rising warm air.
Are the boilers and warm air heaters regularly serviced? YES NO They should be serviced at regular internals and combustion efficiency checked frequently. Up to 50%.
Do you have thermostats checked against a thermometer? YES NO Saving up to 7% per oC excess
Is equipment only operated when necessary? YES NO Avoid having all the product lines operating and running empty when only part of the system is required. Fit isolator switches to all individual components.
Is process/line speed optimal? YES NO Adjust the forward speed of grading lines to ensure that the product completely fills the line. Avoid bottlenecks in the process that results in part of the line running empty or at fractional capacity. Saving up to 10%.
Is the line switched off during breaks? YES NO During work break period’s switch off as much of the equipment as possible. Saving up to 12%.
Are process requirements minimised? YES NO Analyse product requirement for any particular process. Review this regularly internally and with the cus-tomer.
Is waste production minimised? YES NO Avoid over processing which increases volume & waste content of effluent. Waste treatment and disposal consumes more power. Saving up to 50%.
Is process water recycled? YES NO Where heated or cooled water is used recycle this as much as possible. Allow adequate time for water to be drained from produce. Saving up to 50%.
Have you considered low tech processing? YES NO For example simple trimming tables with produce and waste collection bins are likely to be just as effective as stations on conveyor systems.
Are your buildings insulated? YES NO Important to insulate to minimise heat losses, particularly roofs.
Do doors have plastic strip curtains or heated air curtains? YES NO Saving up to 10%.
Is process heat recycled? YES NO For large heat consuming and heat rejecting processes e.g. frying or blast freezing consider using heat recovery or utilisation of rejected processed heat. Saving up to 70%.
PACK AREAS AND WORKSHOPS (continued).
Enterprise information sheets
24.
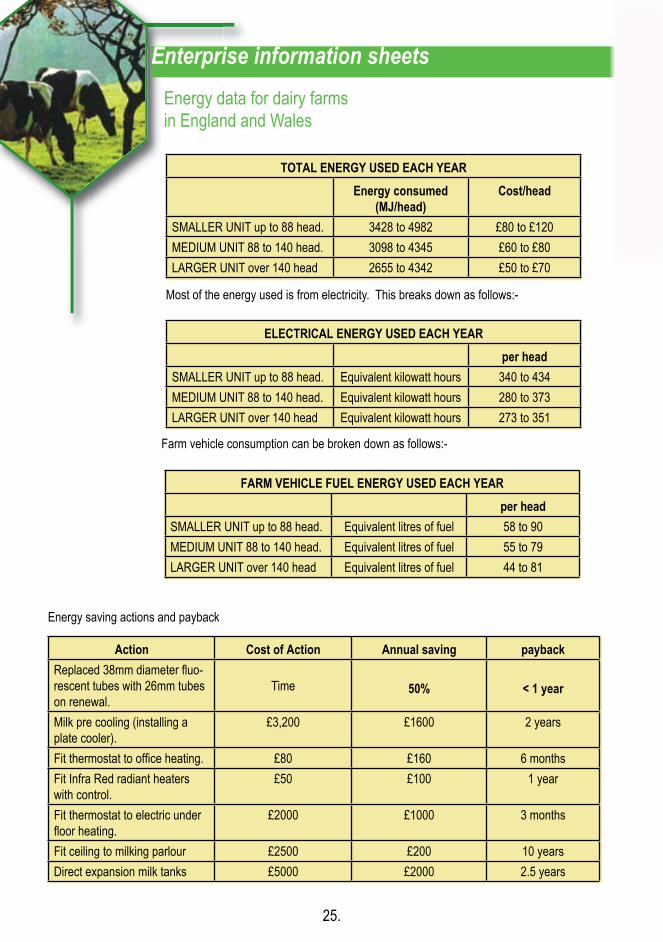
Enterprise information sheets Energy data for dairy farmsin England and Wales
TOTAL ENERGY USED EACH YEAREnergy consumed
(MJ/head)Cost/head
SMALLER UNIT up to 88 head. 3428 to 4982 £80 to £120MEDIUM UNIT 88 to 140 head. 3098 to 4345 £60 to £80LARGER UNIT over 140 head 2655 to 4342 £50 to £70
Most of the energy used is from electricity. This breaks down as follows:-
ELECTRICAL ENERGY USED EACH YEARper head
SMALLER UNIT up to 88 head. Equivalent kilowatt hours 340 to 434MEDIUM UNIT 88 to 140 head. Equivalent kilowatt hours 280 to 373LARGER UNIT over 140 head Equivalent kilowatt hours 273 to 351
Farm vehicle consumption can be broken down as follows:-
FARM VEHICLE FUEL ENERGY USED EACH YEARper head
SMALLER UNIT up to 88 head. Equivalent litres of fuel 58 to 90MEDIUM UNIT 88 to 140 head. Equivalent litres of fuel 55 to 79LARGER UNIT over 140 head Equivalent litres of fuel 44 to 81
Action Cost of Action Annual saving payback Replaced 38mm diameter fluo-rescent tubes with 26mm tubes on renewal.
Time 50% < 1 year
Milk pre cooling (installing a plate cooler).
£3,200 £1600 2 years
Fit thermostat to office heating. £80 £160 6 monthsFit Infra Red radiant heaters with control.
£50 £100 1 year
Fit thermostat to electric under floor heating.
£2000 £1000 3 months
Fit ceiling to milking parlour £2500 £200 10 yearsDirect expansion milk tanks £5000 £2000 2.5 years
Energy saving actions and payback
25.

Energy saving opportunities in dairyingDairy farms account for the highest overall energy cost per farm type. A typical breakdown of energy used is:
Enterprise information sheets
Do you hot wash once a day? YES NO Avoid unnecessary use and too high a temperature, but do not compromise hygiene. Check thermostat set-ting and for leaks. Potential savings of up to 50%.
Are heating appliances used prudently? YES NO Minimising and enclosing any heated areas and installing time switch controls and insulation etc. will save energy use.
Have you improved tank and pipe insulation? YES NO Good tank and pipe insulation significantly reduces heat loss and energy costs. Potential savings of up to 20%.
Is your tank thermostat accurate? YES NO Small inaccuracies, e.g. 1oC overcooling, can result in significant extra electricity costs. Potential savings of up to 50 %.
Do you have automatic lighting controls? YES NO Using time switches or photosensitive controls can cut out lighting at unnecessary times. Potential savings of up to 50 %
Are you using low-energy lighting? YES NO Replacement of conventional incandescent lighting with low energy fluorescent lighting is a low cost option. Potential savings of up to 80%.
Is your refrigeration condenser sufficiently ventilated? YES NO They run more efficiently in a location which gives adequate inlet and outlet ventilation. Clean regularly. Potential savings of up to 40%.
Do you pre-cool milk before the tank? YES NO Pre-cooling through a plate cooler can reduce milk to within 2-3 oC of cooling water temperature and reduce electricity demand. Potential savings of up to 50 %.
Do you have a heat recovery system? YES NO Heat recovery recycles some of the heat removed from the milk (eg. 36 Kwh per 1000 litres) to heat wash water. Potential savings of up to 50%.
Do you have a direct expansion tank? YES NO Direct expansion refrigeration bulk tanks are more efficient. Consider this when you need a new tank. Potential savings of up to 20 %.
Vacuum pump operation 15%Space heating 2%Milk plant cleaning hot water 30%Lighting 7%Udder washing 8%Milk cooling 35%
You can use the proportions to allocate your energy costs to energy saving measures in each area.
26.
Energy saving opportunities in dairying (continued)
Savings may not be cumulative, as alteration of one item may affect another.
Enterprise information sheets
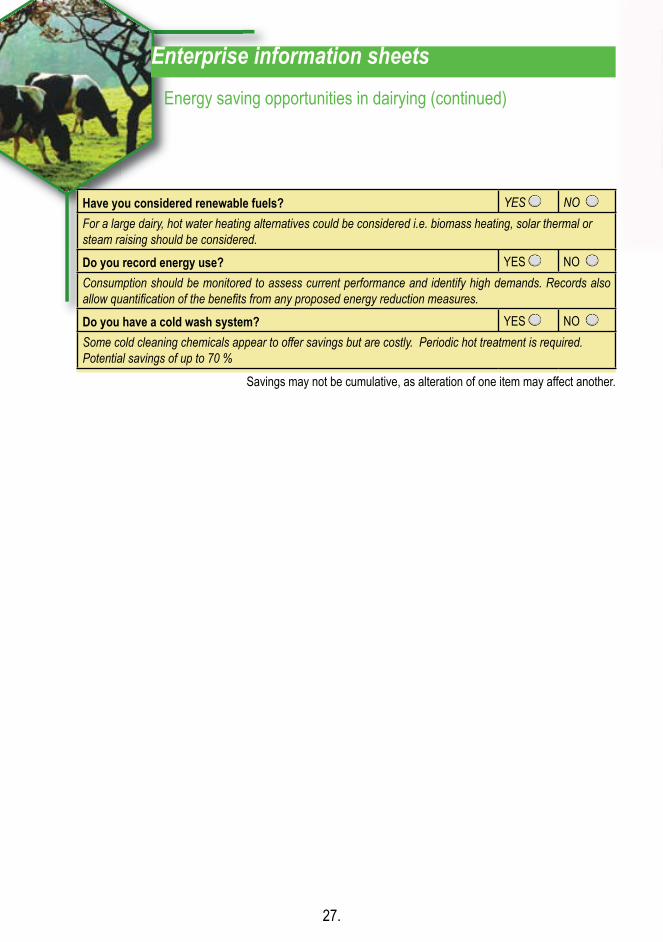
Have you considered renewable fuels? YES NO For a large dairy, hot water heating alternatives could be considered i.e. biomass heating, solar thermal or steam raising should be considered.
Do you record energy use? YES NO Consumption should be monitored to assess current performance and identify high demands. Records also allow quantification of the benefits from any proposed energy reduction measures.
Do you have a cold wash system? YES NO Some cold cleaning chemicals appear to offer savings but are costly. Periodic hot treatment is required. Potential savings of up to 70 %
27.

Enterprise information sheets
TOTAL ENERGY USED EACH YEAR BREEDING AND FINISHING PIGSEnergy consumed
(MJ/head)Cost/head
SMALLER UNIT up to 1200 head. 986 to 1609 £36 to £66MEDIUM UNIT 1200 to 2100 head. 184 to 285 £6 to £10LARGER UNIT over 2100 head 148 to 331 £4 to £12
Most of the energy used is from electricity. This breaks down as follows:-
ELECTRICAL ENERGY USED EACH YEARper head
SMALLER UNIT up to 1200 head. Equivalent kilowatt hours 274 to 447MEDIUM UNIT 1200 to 2100 head. Equivalent kilowatt hours 51 to 79LARGER UNIT over 2100 head Equivalent kilowatt hours 41 to 92
Energy data for pig farmsin England and Wales
28.
Energy saving opportunities in the pig unitThere is a vast range of different types of building used to house pigs. It is therefore impossible to generalise on typical energy costs. High-energy consumption in intensive pig units is usually associated with the use of heat. Apart from insulation, the greatest scope for saving energy is in fan and heater control, because most of the heat loss is through ventilation. Heaters should be interlocked with the fans so that heating is switched on only when the ventilation system is running at minimum.
Modulated heater output is more efficient than simple on/off switching.
Remember that all energy saving measures must take into account health, welfare and performance of the pigs. Feed costs average approximately 66% of production costs for breeding herds so energy saving should not be pursued at the expense of feed conversion.
Do your creeps have heating control? YES NO A carefully designed enclosed creep with an automatically control heater lamp could save up to 45%.
Are your creeps enclosed to reduce air leakage? YES NO As well as saving energy, enclosed creeps improve piglet comfort and help reduce the heating effect of lamps on the sow. Cooler sows have higher feed intakes and this helps milk production.
Are you creeps insulated? YES NO Insulation around the creep could save a further 13% if it is well sealed.
Do your creeps heater lamps have dimmer switches? YES NO Simple manual 50% dimmer switches are a very cost effective way of significantly reducing heating costs. With switches fitted the heater lamps can be operated at 50% for 2/3 of the creep period. Savings up to 30%.
Enterprise information sheets
Energy saving opportunities in the pig unit (continued)
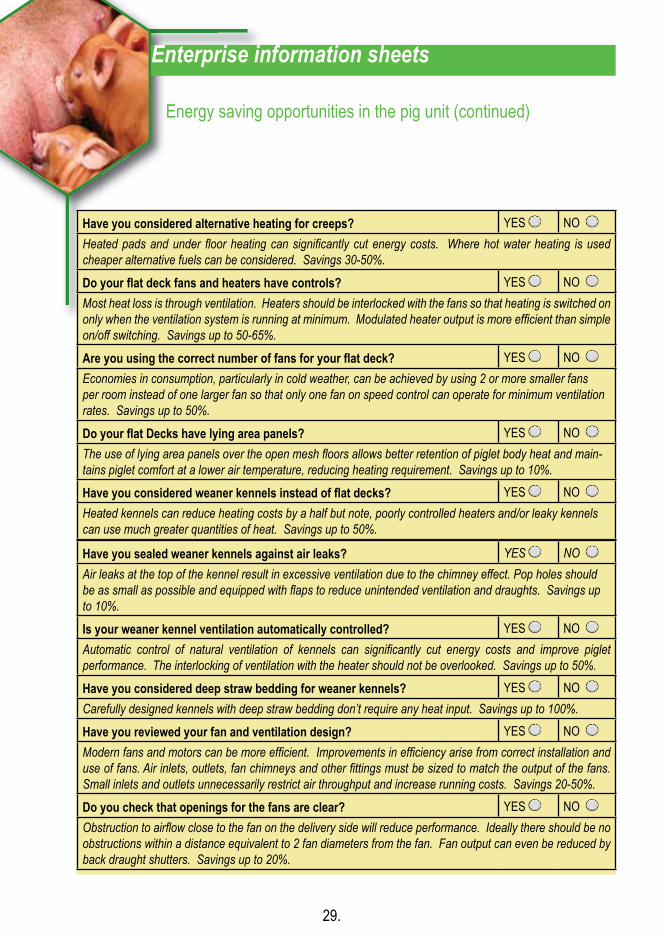
Have you considered alternative heating for creeps? YES NO Heated pads and under floor heating can significantly cut energy costs. Where hot water heating is used cheaper alternative fuels can be considered. Savings 30-50%.
Do your flat deck fans and heaters have controls? YES NO Most heat loss is through ventilation. Heaters should be interlocked with the fans so that heating is switched on only when the ventilation system is running at minimum. Modulated heater output is more efficient than simple on/off switching. Savings up to 50-65%.
Are you using the correct number of fans for your flat deck? YES NO Economies in consumption, particularly in cold weather, can be achieved by using 2 or more smaller fans per room instead of one larger fan so that only one fan on speed control can operate for minimum ventilation rates. Savings up to 50%.
Do your flat Decks have lying area panels? YES NO The use of lying area panels over the open mesh floors allows better retention of piglet body heat and main-tains piglet comfort at a lower air temperature, reducing heating requirement. Savings up to 10%.
Have you considered weaner kennels instead of flat decks? YES NO Heated kennels can reduce heating costs by a half but note, poorly controlled heaters and/or leaky kennels can use much greater quantities of heat. Savings up to 50%.
Have you sealed weaner kennels against air leaks? YES NO Air leaks at the top of the kennel result in excessive ventilation due to the chimney effect. Pop holes should be as small as possible and equipped with flaps to reduce unintended ventilation and draughts. Savings up to 10%.
Is your weaner kennel ventilation automatically controlled? YES NO Automatic control of natural ventilation of kennels can significantly cut energy costs and improve piglet performance. The interlocking of ventilation with the heater should not be overlooked. Savings up to 50%.
Have you considered deep straw bedding for weaner kennels? YES NO Carefully designed kennels with deep straw bedding don’t require any heat input. Savings up to 100%.
Have you reviewed your fan and ventilation design? YES NO Modern fans and motors can be more efficient. Improvements in efficiency arise from correct installation and use of fans. Air inlets, outlets, fan chimneys and other fittings must be sized to match the output of the fans. Small inlets and outlets unnecessarily restrict air throughput and increase running costs. Savings 20-50%.
Do you check that openings for the fans are clear? YES NO Obstruction to airflow close to the fan on the delivery side will reduce performance. Ideally there should be no obstructions within a distance equivalent to 2 fan diameters from the fan. Fan output can even be reduced by back draught shutters. Savings up to 20%.
29.
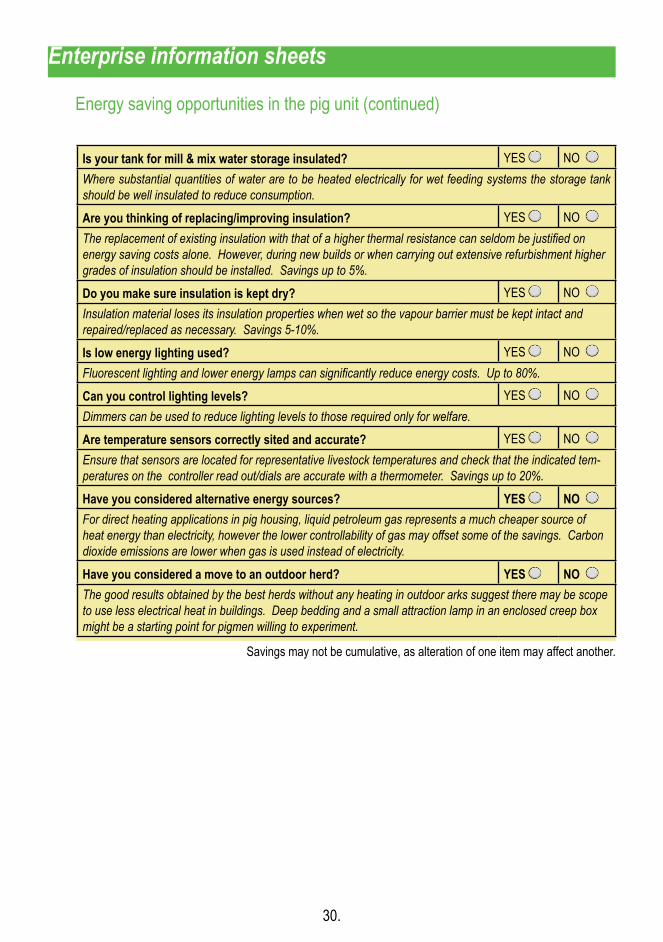
Is your tank for mill & mix water storage insulated? YES NO Where substantial quantities of water are to be heated electrically for wet feeding systems the storage tank should be well insulated to reduce consumption.
Are you thinking of replacing/improving insulation? YES NO The replacement of existing insulation with that of a higher thermal resistance can seldom be justified on energy saving costs alone. However, during new builds or when carrying out extensive refurbishment higher grades of insulation should be installed. Savings up to 5%.
Do you make sure insulation is kept dry? YES NO Insulation material loses its insulation properties when wet so the vapour barrier must be kept intact and repaired/replaced as necessary. Savings 5-10%.
Is low energy lighting used? YES NO Fluorescent lighting and lower energy lamps can significantly reduce energy costs. Up to 80%.
Can you control lighting levels? YES NO Dimmers can be used to reduce lighting levels to those required only for welfare.
Are temperature sensors correctly sited and accurate? YES NO Ensure that sensors are located for representative livestock temperatures and check that the indicated tem-peratures on the controller read out/dials are accurate with a thermometer. Savings up to 20%.
Have you considered alternative energy sources? YES NO For direct heating applications in pig housing, liquid petroleum gas represents a much cheaper source of heat energy than electricity, however the lower controllability of gas may offset some of the savings. Carbon dioxide emissions are lower when gas is used instead of electricity.
Have you considered a move to an outdoor herd? YES NO The good results obtained by the best herds without any heating in outdoor arks suggest there may be scope to use less electrical heat in buildings. Deep bedding and a small attraction lamp in an enclosed creep box might be a starting point for pigmen willing to experiment.
Enterprise information sheets
Energy saving opportunities in the pig unit (continued)
Savings may not be cumulative, as alteration of one item may affect another.
30.

Enterprise information sheets Energy data for poultry farmsin England and Wales
TOTAL ENERGY USED EACH YEAREnergy consumed
(MJ/head)Cost/head
SMALLER UNIT up to 200000 birds 2.1 to 7.9 £0.14 to £0.50LARGER UNIT over 200000 birds 1.2 to 1.4 £0.08 to £0.10
Most of the energy used is from electricity. This breaks down as follows:-
ELECTRICAL ENERGY USED EACH YEARper head
SMALLER UNIT up to 200000 birds Equivalent kilowatt hours 0.57 to 2.20LARGER UNIT over 200000 birds Equivalent kilowatt hours 0.33 to 0.38
TOTAL ENERGY USED EACH YEAR: LAYERS ONLY POULTRY FARMSEnergy consumed
(MJ/head)Cost/head
SMALLER UNIT up to 75000 birds 9.2 to 14.0 £0.34 to £0.52LARGER UNIT over 75000 birds 8.2 to 11.9 £0.30 to £0.38
Most of the energy used is from electricity. This breaks down as follows:-
ELECTRICAL ENERGY USED EACH YEARper head
SMALLER UNIT up to 75000 birds Equivalent kilowatt hours 2.56 to 3.90LARGER UNIT over 75000 birds Equivalent kilowatt hours 2.27 to 3.31
BROILERS
LAYERS
Energy saving opportunities in poultry unitsFeed costs represent up to 70% of production costs and fuel energy usually less than 5%. Therefore feed conversion must never be compromised in the pursuit of energy saving. Energy saving measures must also take into account health and welfare of poultry. Heating is required for brooder chicks and turkey poults, but is not needed for adult birds.
31.
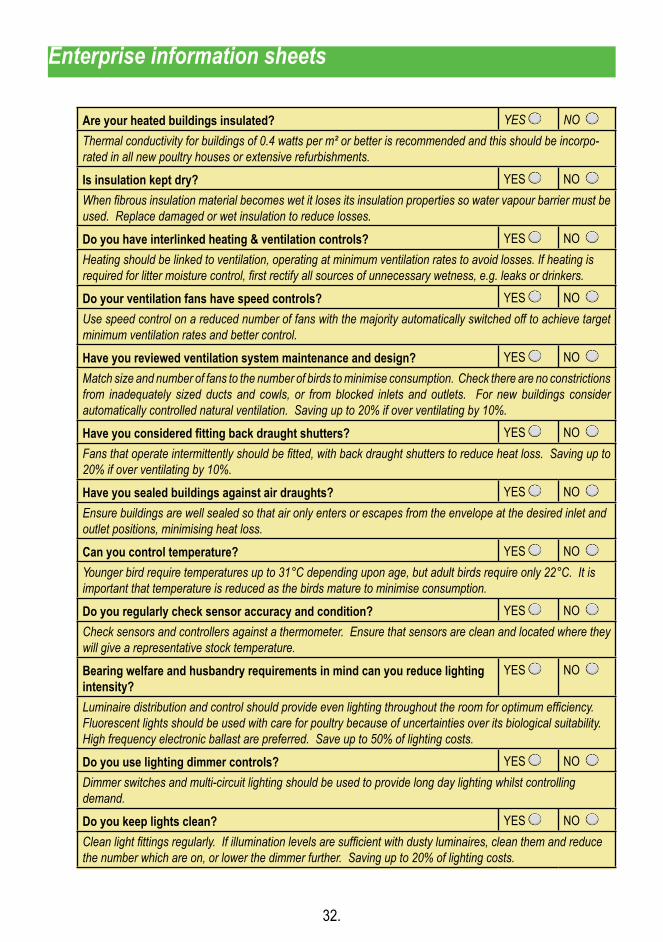
Are your heated buildings insulated? YES NO Thermal conductivity for buildings of 0.4 watts per m² or better is recommended and this should be incorpo-rated in all new poultry houses or extensive refurbishments.
Is insulation kept dry? YES NO When fibrous insulation material becomes wet it loses its insulation properties so water vapour barrier must be used. Replace damaged or wet insulation to reduce losses.
Do you have interlinked heating & ventilation controls? YES NO Heating should be linked to ventilation, operating at minimum ventilation rates to avoid losses. If heating is required for litter moisture control, first rectify all sources of unnecessary wetness, e.g. leaks or drinkers.
Do your ventilation fans have speed controls? YES NO Use speed control on a reduced number of fans with the majority automatically switched off to achieve target minimum ventilation rates and better control.
Have you reviewed ventilation system maintenance and design? YES NO Match size and number of fans to the number of birds to minimise consumption. Check there are no constrictions from inadequately sized ducts and cowls, or from blocked inlets and outlets. For new buildings consider automatically controlled natural ventilation. Saving up to 20% if over ventilating by 10%.
Have you considered fitting back draught shutters? YES NO Fans that operate intermittently should be fitted, with back draught shutters to reduce heat loss. Saving up to 20% if over ventilating by 10%.
Have you sealed buildings against air draughts? YES NO Ensure buildings are well sealed so that air only enters or escapes from the envelope at the desired inlet and outlet positions, minimising heat loss.
Can you control temperature? YES NO Younger bird require temperatures up to 31°C depending upon age, but adult birds require only 22°C. It is important that temperature is reduced as the birds mature to minimise consumption.
Do you regularly check sensor accuracy and condition? YES NO Check sensors and controllers against a thermometer. Ensure that sensors are clean and located where they will give a representative stock temperature.
Bearing welfare and husbandry requirements in mind can you reduce lighting intensity?
YES NO
Luminaire distribution and control should provide even lighting throughout the room for optimum efficiency. Fluorescent lights should be used with care for poultry because of uncertainties over its biological suitability. High frequency electronic ballast are preferred. Save up to 50% of lighting costs.
Do you use lighting dimmer controls? YES NO Dimmer switches and multi-circuit lighting should be used to provide long day lighting whilst controlling demand.
Do you keep lights clean? YES NO Clean light fittings regularly. If illumination levels are sufficient with dusty luminaires, clean them and reduce the number which are on, or lower the dimmer further. Saving up to 20% of lighting costs.
BROILERS
LAYERS
Enterprise information sheets
32.
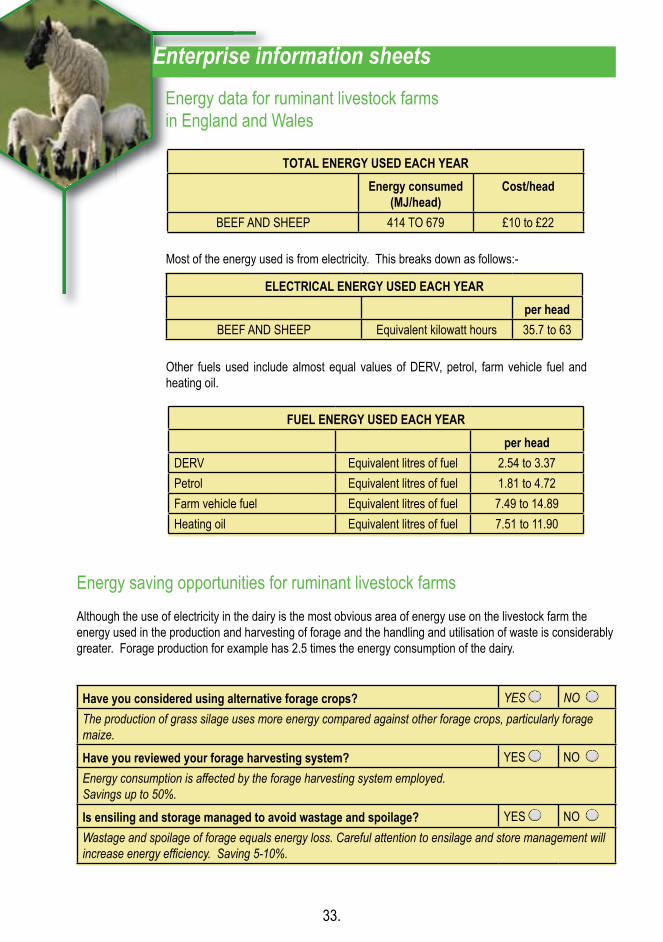
Enterprise information sheets Energy data for ruminant livestock farmsin England and Wales
TOTAL ENERGY USED EACH YEAREnergy consumed
(MJ/head)Cost/head
BEEF AND SHEEP 414 TO 679 £10 to £22
Most of the energy used is from electricity. This breaks down as follows:-
ELECTRICAL ENERGY USED EACH YEARper head
BEEF AND SHEEP Equivalent kilowatt hours 35.7 to 63
Other fuels used include almost equal values of DERV, petrol, farm vehicle fuel and heating oil.
FUEL ENERGY USED EACH YEARper head
DERV Equivalent litres of fuel 2.54 to 3.37Petrol Equivalent litres of fuel 1.81 to 4.72Farm vehicle fuel Equivalent litres of fuel 7.49 to 14.89Heating oil Equivalent litres of fuel 7.51 to 11.90
Energy saving opportunities for ruminant livestock farmsAlthough the use of electricity in the dairy is the most obvious area of energy use on the livestock farm the energy used in the production and harvesting of forage and the handling and utilisation of waste is considerably greater. Forage production for example has 2.5 times the energy consumption of the dairy.
Have you considered using alternative forage crops? YES NO The production of grass silage uses more energy compared against other forage crops, particularly forage maize.
Have you reviewed your forage harvesting system? YES NO Energy consumption is affected by the forage harvesting system employed. Savings up to 50%.
Is ensiling and storage managed to avoid wastage and spoilage? YES NO Wastage and spoilage of forage equals energy loss. Careful attention to ensilage and store management will increase energy efficiency. Saving 5-10%.
33.
Do you minimise the volume of slurry handled? YES NO Handling slurry can incur high-energy use. Minimise slurry volume by making sure that all clean water is diverted from the slurry store.
Do you use low rate irrigation for applying dirty water? YES NO Low rate irrigation uses less energy than tractor and tanker. Saving up to 60%. Minimise volume produced e.g. cover open yard, divert clean water.
When applying fertiliser do you also consider plant nutrients in any slurry or manures applied?
YES NO
Reducing fertiliser use reduces energy consumption.
Have you considered producing energy from slurry/manure? YES NO Anaerobic digestion can directly replace purchased energy in some circumstances. The size of the unit and the energy demand must be considered on an individual basis.
Is cereal moisture content optimised for rolling? YES NO Optimum moisture content is 17-18%. Avoid overdrying which wastes energy and makes roller milling more difficult. Saving up to 100%.
Enterprise information sheets
34.

35.
ADAS staff have completed hundreds of farm energy audits through Wales and the UK. ADAS Wales consultants can be contacted via CALU. In addition free energy advice, grant sources and further information can be found via the Energy Saving Trust (EST), your local energy agency or energy efficiency advice centre.
Forum for the Future also provides a spreadsheet enabling farms to calculate their overall energy use and greenhouse gas emissions. By assisting farmers in benchmarking their energy use, the tool can be used to identify where reductions are possible and to assess how energy use could be influenced by a change in practices.
Sources of further help and information
Centre for Alternative Land Use (CALU)Tel: 01284 680450e-mail [email protected]
ADAS WalesTel: 02920 899100www.adas.co.uk
The Carbon Trust in WalesTel: 01443 845944e-mail: [email protected]
Carmarthenshire Energy AgencyTel: 01944 230003www.ynnisirgar.org.uk
South East Wales Energy AgencyTel: 0800 512012www.sewenergy.org.uk
Energy Savings Trust Wales (EST)Tel: 01443 845930www.est.org.uk
Energy Efficiency Advice CentreTel: 0800 512012. (This will put you through to your nearest EACC.)e-mail [email protected]
Low Carbon Buildings ProgrammeTel: 0800 915 0990e-mail [email protected]
Forum for the FutureTel: 01242 262400contact Claire Skinner.e-mail [email protected]