Embed Size (px)
Citation preview

Managing Genetic Tests, Surveillance, and Preventive
Medicine Under a Public Health Insurance System
Lilia Filipova-Neumann
Faculty of Business Administration and Economics
University of Augsburg
Universitätsstr. 2, 86159 Augsburg, Deutschland
e-mail: [email protected]
Michael Hoy
Correponding Author
Department of Economics and Finance
University of Guelph
Guelph, Ontario, N1G 2W1, Canada
e-mail: [email protected]
telephone: +1-519-824-4120
fax: +1-519-763=8497
September, 2012
Abstract
There is a prospect in the medium to long term future of substantial advancements
in the understanding of the relationship between disease and genetics. We consider
the implications of increased information from genetic tests about predispostion to
diseases from the perspective of managing health care provision under a public health
insurance scheme. In particular, we consider how such information may potentially
improve the targeting of medical surveillance (or prevention) activities to improve
the chances of early detection of disease onset. We show that the moral hazard
implications inherent in surveillance and prevention decisions that are chosen to be
privately rather than socially optimal may be exacerbated by increased information
about person-speci�c predisposition to disease.
Keywords: genetic tests; medical surveillance; public health insurance
JEL Codes: D8, I12, I18

1 Introduction
It is fair to say that genomic science is now in its second phase since current research in-
volves not only the identi�cation of so-called �disease genes�or, more appropriately, �dis-
ease alleles�, but also the understanding of how speci�c sequences of genes interact with
each other and with environmental factors to a¤ect the onset and in�uence the treatment
of diseases. Claims in the scienti�c literature and the media suggest that advancements
made in genetic information will lead to signi�cant improvements in the e¤ectiveness of
prevention and treatment of disease. A rough road map of the human genome has been
available since 2003 and currently, according to the NIH-sponsored web site genetests.org,
there are over 1600 genetic tests used clinically. With the prospect of the so-called $1000
genome close to reality (see Davies, 2010), whole genome sequencing may soon become the
norm for developed countries. The information that can be gleaned from an individual�s
whole genome has the potential to revolutionize the practice of medicine with population
wide genome sequencing forming the basis of so-called P4 medicine (i.e., medicine that is
Predictive, Preventive, Personalized and Participatory). Although the future of P4 medi-
cine has many proponents, not least of whom is Leroy Hood through his P4 Medicine
Institute (p4mi.org), there is some controversy over the pace of its progress.1
Once the relationships between speci�c genes, environment, and diseases are better
understood, harnessing this information to create improved health outcomes in a cost
e¤ective manner requires a good understanding of how individuals will behave in the con-
text of such individualized informational change. We provide insight into this debate by
focusing on how individuals�incentives for use of surveillance (monitoring) technologies,
such as colonoscopies or mammograms, change in the presence of risk-type speci�c in-
formation about the likelihood of onset of disease. It has been debated in the literature
whether population wide screening for diseases such as colon cancer or breast cancer is
cost e¤ective and whether monitoring should be restricted to those at higher risk as iden-
ti�ed, for example, by family history. As genetic tests become more wide ranging and less
costly, there is the potential of substantial improvements to the targeting of surveillance
techniques such as colonoscopies with the potential of improved overall health outcomes
in a more cost e¤ective manner. However, we show that the usual moral hazard problems
associated with insurance coverage may interact with improved knowledge of individual
risks in a way that could blunt the potential for such improvements. Through the use
of simple models, we develop a series of results which characterize the possible outcomes
that could develop as more genetic information becomes available.
Many genetic tests continue to be expensive and so choosing which tests to make
1As noted by Roukos (2008), �although personalized medicine and oncology in clinical practice is still
a dream, some isolated �rst steps have been taken.�
1

available through health insurance plans, be they private or public, represents a challenge.
Insurance or health care providers are concerned about the possibility of escalating costs
due to the adoption of more genetic tests (e.g., see report by Miller, et al. (2002) funded
by the Ontario Ministry of Health and Long Term Care) while others believe improved
targeting of surveillance and preventive measures will ultimately reduce health care costs.2
It is this aspect or phase of growth in genetic testing and related knowledge that we address
here. In particular, we study the implications of improved genetic information about risk
of disease in terms of the socially optimal management of surveillance and related health
care strategies for public health insurance systems. The results of this exercise can be
used to help develop guidelines to use in determining which genetic tests to o¤er within
the coverage of the public health system. Some aspects of what we �nd could also be
applied to a population covered (or partly covered) by private health insurance, although
there are some important di¤erences to consider.
Many of the papers that model the e¤ects of improved information about risk classi�-
cation involve the private insurance market and exogenously speci�ed (�xed) probabilities
of loss/disease (e.g., Rothschild and Stiglitz, 1976; Wilson, 1977; Hoy, 1982, 1984; Crocker
and Snow, 1985, 1986; Tabarrock, 1994; Hoel and Iversen, 2002; and Rees and Apps,
2006).3 Although our model involves exogenously determined and di¤erential probability
of onset of disease, we allow for the possibility via surveillance of early or late detection of
disease. For many diseases, early detection leads to improved treatment and outcomes. In-
formation from genetic tests creates (or increases) di¤erential assessment of risk of disease
onset across individuals. Thus, although probability of onset may be �xed by genotype,
choice of level of surveillance creates endogenous determination of detection being late or
early (i.e., at least probablistically). The possible bene�t of a genetic test in this context
arises from potential improvements in targeting of surveillance strategies for early detec-
tion of onset of disease. The important management issue is in determining the extent to
which higher (lower) risks should increase (decrease) surveillance and then trying to en-
courage the appropriate responses from individuals. We show that a model of di¤erential
use of preventative medicine based on genotype is very similar and so determination of
the value of genetic tests follows a similar pattern relating to improved targeting of such
strategies. 4
2See, for example, Caul�eld, et al. (2008) for a critical evaluation of such claims.3See Hoy (1989), Doherty and Posey (1998), and Hoel and Iverson (2002) for examples of models where
self-protection (or prevention) can a¤ect the probability of loss/disease di¤erentially according to risk
(geno-) type.4See Filipova-Neumann and Hoy (2009) for a model describing the implications of genetic testing for
di¤erential prevention strategies as well as a discussion of the implications for private health insurance
plans.
2

It is well known that in the presence of health insurance, be it public or private,
individuals face incentives that lead to actions that are not necessarily socially optimal. In
our context, we presume that individuals do not pay for the �nancial costs of surveillance
or treatment, should onset of disease occur. The result is that individuals may either
over-use or under-use medical surveillance or prevention. The moral hazard problems due
to insurance are complicated by the introduction of information about di¤erential risk of
disease onset. We characterize how genetic testing can lead to changes in the pattern of
over- and under-use of surveillance. We �nd, under a broad range of scenarios, that at
least one group (i.e., the average, high or low risk types) will tend to want to over-use
surveillance relative to the socially optimal decision. The relative extent to which over-use
(or under-use when it occurs) of surveillance reduces social welfare can vary across the
groups in counter-intuitive ways. Overall e¢ ciency may fall as improved knowledge about
risk type interacts with the standard moral hazard implications of insurance leading to a
reduction in social welfare.
In the following section, we introduce a simple model of surveillance, which is also
referred to as screening or monitoring. The basic model describes the decision for intensity
of monitoring taken by the individual and compares that to the socially optimal decision.
In section 3, we present our results regarding the implications of introducing genetic tests
and then provide a discussion, conclusion, and suggestions for further research in the �nal
section 4.
2 Model of Medical Surveillance
The role of surveillance is to increase the likelihood of early detection of disease. One
key aspect of the model is the relationship between the intensity of surveillance and its
e¤ectiveness at early detection and also its �nancial cost. In the context of screening for
colon cancer, one can think of the use of FOBT - fecal occult blood test - as a low level
and low cost approach to screening; FSIG - �exible sigmoidoscopy - as an intermediate
level and intermediate cost approach; and CSCPY - standard colonoscopy - as a higher
intensity and higher cost method of screening. The relative unit costs of these approaches,
quoted in U.S. Congress report OTA-BP-H-146 (1995) are $10, $80, and $285 respectively
while the {sensitivity, speci�city} in regards to detection of cancer are {40%, 90%}, {90%,
98%}, and {90%, 100%}, respectively. FOBT is not very e¤ective at detecting polyps
(sensitivity of only 10%) compared to colonoscopy (sensitivity of 90%). One can then
think of an intensity of surveillance as a mixture of the various techniques that one can
apply with varying frequency starting at a particular age (e.g., FOBT once yearly with
CSCPY once every �ve years starting at age 50). We describe the relationship between the
3

intensity of surveillance and the probability of early detection of disease by the function
pED(s), with pED0(s) > 0 and pED00(s) < 0; that is, the probability of early detection of
disease increases (at a decreasing rate) with the intensity (and/or frequency) of surveillance
as measured by s. The �nancial cost to the health care system of providing an individual
with level of surveillance s is C(s), which we assume is increasing and convex in the level
of surveillance; i.e., C 0(s) > 0; C 00(s) > 0.5
The �nancial cost of treatment, for those who eventually have onset of disease, depends
on whether the disease is detected early or late. In our model we have in mind all future
lifetime medical costs conditional on stage of detection of disease. We refer to these as
CDE and CDL for cases of early and late detection, respectively. The cost may be higher in
either one or other detection stage depending on the disease and depending on the choice
of treatment. For simplicity we only model two stages while in many cases - especially
cancer - progression of disease is modeled for several stages. Importantly, whether CDE
is lower or higher than CDL is not always monotonic in the various possible stages of
disease. For example, in U.S. Congress report OTA-BP-H-146 (1995), lifetime cost of
treating colon cancer if detected early is estimated at $35,000 and $45,000 if detected
late. Brown, et al. (2002), on the other hand, break up possible detection stages into
�ve; in situ (cancer cells restricted to polyps) and cancer stages I through IV.6 They �nd
that lifetime cancer-related costs are lower if detection occurs in situ or stage I compared
to later stages of cancer while they are higher for cancers detected in stage II than any
other stage, including stage IV. The reason for this last outcome is that long-term costs
for stage II cases involve additional continuing care costs due to longer survival time. In
general, if su¢ ciently early detection leads to a su¢ ciently higher rate of cure than does
later detection, then it is possible for CDL to exceed CDE . It is common for the opposite
to hold and so in our analysis we allow for both CDL > CDE (e.g., for early detection
being in situ or stage I in our example of colon cancer) and CDL < CDE (e.g., for early
detection being stage II and late detection being stage IV).
The overall per capita cost of providing health care to an individual who experiences
onset of disease with probability � is, therefore, the cost of surveillance plus the expected
cost of treatment which depends on whether the disease is detected early or late. Thus,
the per capita health care costs are given by
TC(s) = �[pED(s)CDE + (1� pED(s))CDL] + C(s) (1)
It follows that TC 0(s) = ��pED0(s)(CDE�CDL)+C 0(s) > 0 if CDL < CDE . Increasing the
5Generally we may allow C00(s) = 0 and still satisfy conditions for an interior optimum. Linearity of
C(s) may re�ect more frequent (repeated) applications of a given monitoring technology.6Lansdorp-Vogelaar, et al. (2009) suggest that as chemotherapy costs increase for advanced colorectal
cancer, screening can become cost e¤ective in terms of overall costs of cancer treatment.
4
level of surveillance in this case increases per capita health care costs due to both the direct
cost of more surveillance and the fact that increasing the probability of early detection
leads to an increase in expected treatment costs for those who incur disease. If CDE <
CDL, an increase in surveillance leads to opposing e¤ects; the increase in surveillance costs
may be more than compensated by the savings in lifetime cost of treatment since early
detection leads to lower lifetime treatment costs. In this latter case, it is of course possible
that TC(s) may not be monontonic (i.e., it could be U-shaped). We allow for all of these
possibilities.
We now turn to the issue of individual behaviour. Individuals choose a level of sur-
veillance to maximize their utility. We assume individuals are homogeneous in terms of
their net income and basic preferences across all states of nature. Gross income of each
individual is y and each individual contributes an equal amount TC to account for the
average or per capita cost of the health care system. To highlight the fact that, by as-
sumption, there are no user payments required by the public health insurance plan and
so individuals do not internalize the cost of their decisions about health care use, we use
TC to denote per capita cost when determining the privately optimal use of health care
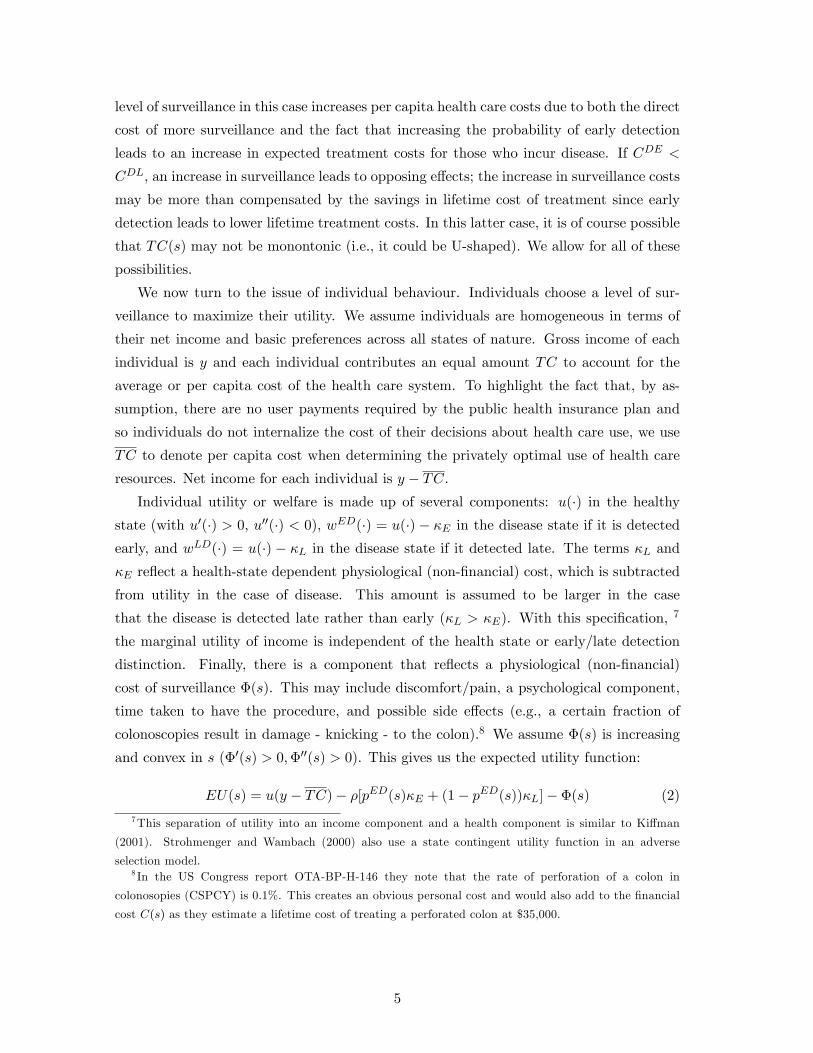
resources. Net income for each individual is y � TC.Individual utility or welfare is made up of several components: u(�) in the healthy
state (with u0(�) > 0; u00(�) < 0), wED(�) = u(�) � �E in the disease state if it is detectedearly, and wLD(�) = u(�) � �L in the disease state if it detected late. The terms �L and�E re�ect a health-state dependent physiological (non-�nancial) cost, which is subtracted
from utility in the case of disease. This amount is assumed to be larger in the case
that the disease is detected late rather than early (�L > �E). With this speci�cation, 7
the marginal utility of income is independent of the health state or early/late detection
distinction. Finally, there is a component that re�ects a physiological (non-�nancial)
cost of surveillance �(s). This may include discomfort/pain, a psychological component,
time taken to have the procedure, and possible side e¤ects (e.g., a certain fraction of
colonoscopies result in damage - knicking - to the colon).8 We assume �(s) is increasing
and convex in s (�0(s) > 0;�00(s) > 0). This gives us the expected utility function:
EU(s) = u(y � TC)� �[pED(s)�E + (1� pED(s))�L]� �(s) (2)
7This separation of utility into an income component and a health component is similar to Ki¤man
(2001). Strohmenger and Wambach (2000) also use a state contingent utility function in an adverse
selection model.8 In the US Congress report OTA-BP-H-146 they note that the rate of perforation of a colon in
colonosopies (CSPCY) is 0.1%. This creates an obvious personal cost and would also add to the �nancial
cost C(s) as they estimate a lifetime cost of treating a perforated colon at $35,000.
5

If one uses the more general speci�cation of expected utility of:
EU(s) = (1��)u(y�TC)+�[pED(s)wED(y�TC)+(1�pED(s))wLD(y�TC)]��(s) (3)
then one can allow for di¤ering marginal utilities of income in the various disease states
relative to the healthy state. As long as one assumes that wED0(�), wLD0(�) > 0, wED00(�),wLD00(�) � 0, and wED(�) > wLD(�), there are no qualitative di¤erences in our resultsand so we restrict our attention to the simpler speci�cation in this paper.9 In Filipova-
Neumann and Hoy (2009) we fully work out the relevant conditions for the more general
speci�cation of expected utility.
We assume the individual (freely) chooses her level of surveillance. As noted above, in a
public insurance system with no user fees, individuals do not take into account their use of
surveillance s on the �nancial cost of the health care system (i.e., @TC@s = 0). Homogeneity
of preferences implies that each individual�s optimal choice of surveillance, bs, will be thesame (conditional on �) and so each individual�s contribution to health care cost, TC will
equal TC(bs) - the equilibrium per capita health cost. Thus, we use the same symbol bsto denote both the individual�s privately optimal level of surveillance and the equilibrium
level of surveillance; which is characterized by the �rst order condition
FOC fbsg : � � pED0(s) � [�L � �E ]� �0(s) = 0 (4)
which equates the marginal personal (non-�nancial) bene�t of surveillance, i.e. the utility
gain resulting from early detection, �L � �E , multiplied by the probability of disease, �,as well as by the marginal increase in the probability of early detection, pED0(bs), to themarginal physiological cost of surveillance, �0(bs).
Our curvature assumptions, along with , �L > �E , ensure satisfaction of the second
order condition:
SOC fbsg : � � pED00(s) � [�L � �E ]� �00(s) < 0;8s: (5)
To re�ect the fact that the privately optimal level of surveillance depends on the probability
of disease � we write bs(�).10Applying the implicit function theorem to the FOC yields
ds
d�= � pED0(s)[�L � �E ]
� � pED00(s) � [�L � �E ]� �00(s)> 0 (6)
9Most associated empirical studies suggest, roughly speaking, that marginal utility of income is lower in
disease or illness states; e.g., see Viscusi and Evans (1990), Sloan, et al. (1998), and Finkelstein, Luttmer
and Notowidigdo (2008). Tengstam (2007), however, �nds the opposing result for the disability of having
both legs paralyzed. The relationship presumably depends on the particular disease.10One could de�ne lower and upper bounds on � which would imply upper and lower bounds on bs. For
the sake of simplicity, we restrict our attention to interior optima for bs.6

and so the implication of a genetic test on the demand for surveillance is clear. Tested
positives, for whom the probability of disease will be larger than before the test, will
demand more surveillance and tested negatives, for whom the reverse holds, will demand
less surveillance. It can also be seen that the demand for surveillance is larger the higher
is the marginal productivity of surveillance given the disease; i.e. the more sensitive is the
probability for early detection to the level of surveillance and the larger are the savings of
the physiological costs of disease when it is detected early, i.e., [�L � �E ].We now compare the privately optimal level of surveillance (bs(�)) with the socially
optimal level (s�(�)). It is useful �rst to consider how the value of s that minimizes the
per capita �nancial cost of providing health care, which we will refer to as es, changes as �changes. In the case where CDE > CDL, any increase in s leads to an increase in TC(s)
and so, in this case, es = 0 for any value of � (i.e., since TC(s) is monotonically increasing)and it follows that des
d� = 0. For the case where CDL > CDE , it follows that as long as
the cost of surveillance does not rise �too fast�as s rises (at low levels of s), then TC(s)
will be U-shaped or at least decreasing over some range of s.11 In this case, a similar
comparative statics exercise as for bs leads to the conclusion that an increase in probabilityof disease, �, leads to an increase in es; i.e.,
desd�= � pED0(es)[CDE � CDL]
� � pED00(es) � [CDE � CDL] + C 00(es) > 0 (7)
To characterize the socially optimal choice of surveillance, s�, requires that we account
for the e¤ect of choice of surveillance, s, on the cost of health care. Hence, we replace TC
in equation (3) with the actual cost as a function of s (i.e., TC(s) given in equation (1)).
This leads to the following �rst-order condition that characterizes s�.
FOC fs�g : u0(y � TC(s�)) � [�@TC@s
js� ] + � � pED0(s�) � (�L � �E)� �0(s�) = 0 (8)
The second order condition requires:
u00(y � TC(s�))��@TC@s
js��2+ u0(y � TC(s�))[� � pED00(s�)(CDL � CDE)� C 00(s�)]
(9)
+� � pED00(s�) � (�L � �E)� �00(s�) < 0
where@TC
@sjs� = �� � pED0(s�)(CDL � CDE) + C 0(s�): (10)
Rewriting equation (8) as
� � pED0(s�) � (�L � �E)� �0(s�) = u0(y � TC(s�)) � [@TC
@sjs� ] (11)
11A su¢ cient condition for this to be the case is � � pED0(s)(CDL � CDE) > C0(s) at s = 0.
7

and comparing to equation (4) makes it clear that s� is smaller (greater) than bs if @TC@s jbsis greater than (less than) zero. In the case that @TC@s > 0 we have the usual moral hazard
e¤ect that individuals over-utilize a health care service - in this case surveillance - since
they do not account for its �nancial cost. However, recall that if CDL > CDE , then it
is possible that an increase in surveillance (at level s = bs) could lower the overall cost ofhealth care since the increase in early detection reduces the cost of treatment for those
who incur the disease. This possibility of under-utilization of surveillance is illustrated in
Figure 1. Note that the condition CDL > CDE is required for, but does not guarantee,
such a result. If the minimum value of a U-shaped TC(s) curve occurs at a value s = eswhich is less than bs, then over-utilitzation occurs as illustrated in Figure 2.
Insert Figure 1 here
Insert Figure 2 here
We collect these results in the following proposition.
Proposition 1. The socially optimal use of surveillance (s�) is greater or less than the
privately optimal use of surveillance (bs) according to the following scenarios.1. Over-utilitzation of surveillance: If dTC(s)
ds > 0 at s = bs, then s� < bs. Asu¢ cient condition for this scenario is CDE > CDL. More generally, this relationship
will hold whenever es < bs (i.e., the cost-minimizing level of surveillance is less than theprivately optimal level).
2. Under-utilization of surveillance: If TC(s) is U-shaped, then s� > bs wheneveres > bs (i.e., the cost-minimizing level of surveillance is greater than the privately optimallevel). A necessary condition for this scenario is CDE < CDL.
A genetic test leads to the revelation for some individuals that the probability of disease
is greater than previously thought, while others realize it is smaller than they previously
thought. It is, therefore, of interest to understand how each of the critical values bs, es,and s� vary as the probability of disease (�) varies. We have already established that
(i) dbsd� > 0, (ii) desd� = 0 when CDE > CDL (since es = 0 for any value of � in this case), and(iii) desd� > 0 when TC(s) is U-shaped. In this last scenario, which requires that CDL > CDE(as a necessary condition), there is the possibility of a counter-intuitive result that the
health care costs for those who experience an increase in the perceived (and actual for
that matter) probability of disease will impose lower costs on the health care system than
those who discover they have a lower probability of disease than previously thought. The
intuition is simple. Those who realize they have a higher probability of disease increase
their surveillance intensity and so increase their chances of having the disease detected
early. If the impact of this increase in surveillance is su¢ ciently great, in conjunction
8

with CDL � CDE being su¢ ciently large, the overall health care cost for the higher riskgroup may be lower than it was before they realized their higher risk status.12 This result
demonstrates that the impact of genetic tests may not be what one expects.
The relationship between the socially e¢ cient level of surveillance and the probability
of disease is more complicated to understand. From the �rst-order condition for s�, we see
that the socially optimal level of surveillance equates the net marginal health bene�ts for
individuals (i.e., EU 0(s�) ignoring any e¤ect on �nancial cost implications for health care)
to the net marginal (�nancial) cost of providing health care.13 It is helpful to rewrite this
�rst-order condition as:
FOC�b : ��pED0(s�)��(�L � �E) + u0(y � TC(s�))(CDL � CDE)
�= �0(s�)+u0(y�TC(s�))C 0(s�)
FOC�b indicates that the socially optimal level of surveillance equates the marginal non-
�nancial health bene�ts plus �nancial bene�ts of surveillance to the marginal non�nancial
plus �nancial costs of surveillance. Consider �rst the case of risk neutrality (i.e., u0(y�TC)a constant). If CDL�CDE > 0, it follows that an increase in � leads to an increase in boththe marginal �nancial and non�nancial bene�ts of surveillance (LHS of FOC�b), while the
marginal cost of surveillance remains the same (RHS of FOC�b). It follows that an in-
crease in � will lead to an increase in s�. If CDL < CDE , then an increase in � would again
increase the marginal non�nancial bene�t of surveillance but would decrease the marginal
�nancial bene�t. On balance, for an interior optimum, the �rst e¤ect must dominate the
second and so there would be a net increase in the overall marginal bene�t of surveillance
as a result of an increase in �.14 An increase in � again leads to no change in the marginal
cost of surveillance (RHS of FOC�b) and so again, it follows that an increase in � implies
an increase in s�. However, if u00(y � TC) < 0, an increase in � leads to an increase in
TC(s�) and so an increase in u0(y � TC). This implies that in this latter case, the RHSof FOC�b rises and the LHS falls (since a higher value of u0(y � TC(s�)) is multiplied byCDL � CDE , which is negative).15 Therefore, in this scenario, an increase in � may notlead to an increase in s� due to the fact that the increased �nancial cost of surveillance
caused by the increase in � has greater impact due to the associated increase in marginal
utility of income. We have the following proposition and corollary:
12Of course the opposite could hold for those who discover they are a lower risk than previously thought.13The "�nancial part" is multiplied by the scale or conversion factor u0(y�TC(s�)) to re�ect the marginal
utility value of dollar costs. Under risk neutrality, this conversion factor is unchanged by any change in �
and hence any change in the level of TC.14For an interior optimum it must be that (�L��E) > u0(y�TC(s�))(CDE �CDL) when CDE > CDL
(since RHS of FOC�b is positive).15 In the former case, CDL�CDE > 0, the increase in u0(y�TC) that is associated with an increse in �
implies an even larger increase in the marginal bene�t of surveillance and so this reinforces the e¤ect that
s� increases as a result of an increase in �.
9

Proposition 2. For the relationship between the probability of disease and the socially
optimal level of surveillance we have that, under risk-aversion, i.e., u00(�) < 0:1. TC 0(s�) = C 0(s�) � � � pED0(s�)(CDL � CDE) � 0 is a su¢ cient condition for
ds�
d� > 0:
2. If TC 0(s�) = C 0(s�)� � � pED0(s�)(CDL � CDE) > 0; thends�
d� R 0, TC 0(s�) Q �;where
� =pED0(s�)[u0(y � TC�)(CDL � CDE) + (�L � �E)]�u00(y � TC�)[pED(s�)CDE + (1� pED(s�))CDL] (12)
=pED0(s�)[(CDL � CDE) + (�L��E)
u0(y�TC�) ]
A(y � TC�)[pED(s�)CDE + (1� pED(s�))CDL] > 0 (13)
and A(y � TC�) = �u00(y�TC�)u0(y�TC�) :
Corollary In the case of under-utilization we have ds�
d� > 0 for u00(�) � 0 while in
the case of over-utilization ds�
d� > 0 for u00(�) = 0 but the sign for ds�
d� is indeterminate if
u00(�) < 0.
3 Welfare Implications of Genetic Testing
We now develop the welfare implications of introducing information gained from a genetic
test. In order to compare the situation before a genetic test (GT) is conducted with the
situation after a genetic test, we denote the initially perceived probability of disease as
�0, which also is assumed equal to the true population average probability of disease.
A genetic test classi�es individuals (possibly imperfectly) into two risk groups: those
who test positive (negative) have, on average, a probability of disease �H (�L), where
�L < �0 < �H . The proportion of individuals who test negative is denoted by �L while the
proportion who test positive is �H = (1 � �L). For simplicity, we will presume that thefractions testing positive and negative are �xed and that a more precise test is associated
with lower rates of both false positives and false negatives as described below. Since the
population average probability of disease is �0, we have
�0 = �L � (�0 �"
�L)| {z }
�L
+ �H � (�0 +"
�H)| {z }
�H
; (14)
with " > 0 describing the �degree of accuracy� of the information. An increase in "
implies both greater sensitivity and speci�city (i.e., lower rates of false positives and false
negatives from the GT). In developing the intuition about the value of GTs, it turns out
to be convenient to consider the e¤ect of a marginal increase of information ("). A more
10

precise test implies the probabilities of disease for tested negatives and tested positives
become closer to the true probabilities of disease for low and high risk types (denote them
by �LT and �HT ), which need not even be known. Note that �
0 = �L�L + �H�
H holds
irrespective of the precision of the test.16
From our result that dbs(�)d� > 0, the implication of a genetic test on the demand for
surveillance is clear. Tested positives, for whom the probability of disease is perceived to be
higher than before the test, will demand more surveillance and tested negatives, for whom
the reverse holds, will demand less surveillance. It may seem natural to expect genetic tests
to lead to better targeting of surveillance and hence higher social welfare. However, since
individuals do not internalize the �nancial cost of either medical surveillance or treatment
of disease (should it occur), it is not clear that the resulting changes in surveillance will lead
to a welfare improvement since the degree to which each risk types alters her surveillance
level may not be in accordance with what is socially e¢ cient even if the �direction of
change�is consistent. To determine conditions under which a GT leads to a higher or lower
level of social welfare, we develop the value function v(�) = EU(s(�)) which determines
the individual�s utility conditional on the probability of disease, �, and hence her privately
optimal choice of surveillance, s(�). Although the individual ignores the implications of
the �nancial cost of her health care decisions in making her choice of surveillance, the
value function v(�) does take into account any such changes. Since a GT is essentially a
mean preserving spread in probabilities, the curvature of v(�) will determine whether a
GT leads to an increase in welfare (if v(�) is convex in �) or a decrease in welfare (if v(�)
is concave in �). We show below that the outcome depends (in part) on the shape of the
equilibrium cost function TCe(�), which in turn is determined by the function s(�).
Although the individual (correctly) does not perceive that his choice of s a¤ects his
per capita cost of health care, the fact that everyone adjusts s to any change in � means
this cost is a¤ected nonetheless. We write TCe(�) to re�ect the equilibrium per capita
cost of health care given probability of disease �, where
TCe(�) = �[pED(bs(�))CDE + (1� pED(bs(�)))CDL] + C(bs(�)) (15)
which implies
dTCed�
= pED(bs(�))CDE + (1� pED(bs(�)))CDL��[pED0(bs(�))[CDL � CDE ]]dbs
d�+dC(bs(�))dbs � dbs
d�(16)
16" has a maximum value, indicating perfect information about true risk type. This value satis�es both
" = �L(�0 � �TL) and " = �H(�TH � �0) since �0 = �L�TL + �H�TH and �L + �H = 1. This formulation allows
us to characterize the amount of information using one, rather than two, parameters.
11
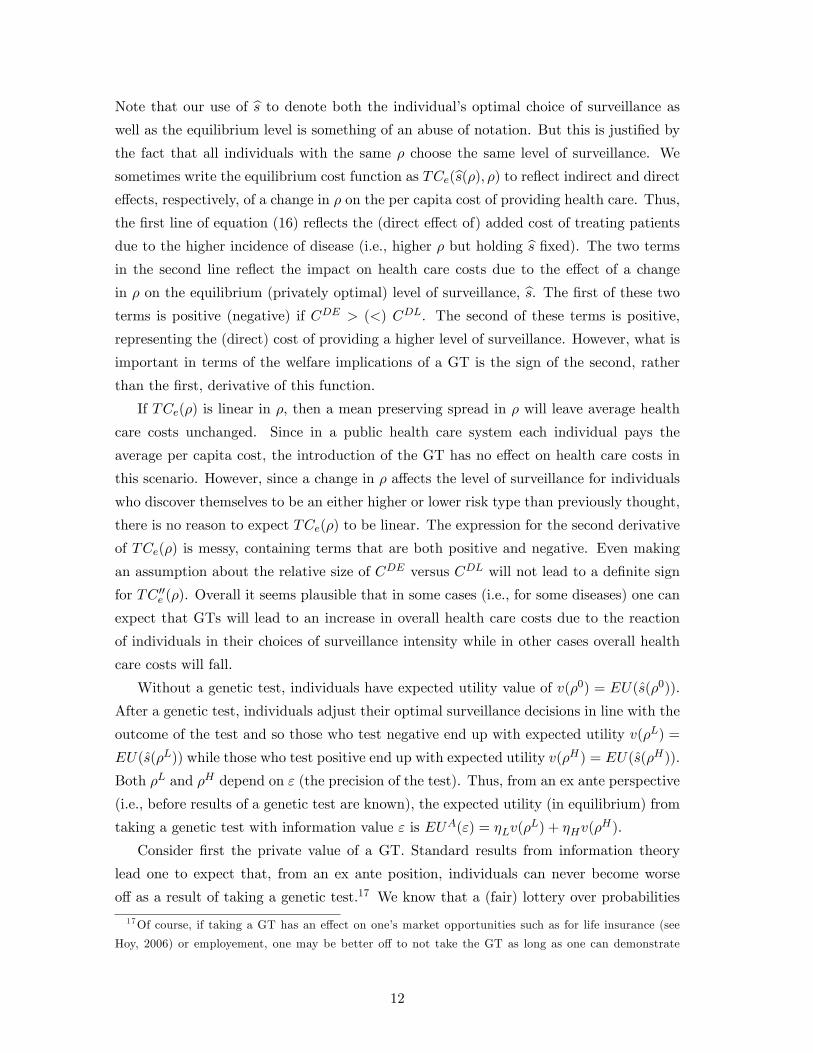
Note that our use of bs to denote both the individual�s optimal choice of surveillance aswell as the equilibrium level is something of an abuse of notation. But this is justi�ed by
the fact that all individuals with the same � choose the same level of surveillance. We
sometimes write the equilibrium cost function as TCe(bs(�); �) to re�ect indirect and directe¤ects, respectively, of a change in � on the per capita cost of providing health care. Thus,
the �rst line of equation (16) re�ects the (direct e¤ect of) added cost of treating patients
due to the higher incidence of disease (i.e., higher � but holding bs �xed). The two termsin the second line re�ect the impact on health care costs due to the e¤ect of a change
in � on the equilibrium (privately optimal) level of surveillance, bs. The �rst of these twoterms is positive (negative) if CDE > (<) CDL. The second of these terms is positive,
representing the (direct) cost of providing a higher level of surveillance. However, what is
important in terms of the welfare implications of a GT is the sign of the second, rather
than the �rst, derivative of this function.
If TCe(�) is linear in �, then a mean preserving spread in � will leave average health
care costs unchanged. Since in a public health care system each individual pays the
average per capita cost, the introduction of the GT has no e¤ect on health care costs in
this scenario. However, since a change in � a¤ects the level of surveillance for individuals
who discover themselves to be an either higher or lower risk type than previously thought,
there is no reason to expect TCe(�) to be linear. The expression for the second derivative
of TCe(�) is messy, containing terms that are both positive and negative. Even making
an assumption about the relative size of CDE versus CDL will not lead to a de�nite sign
for TC 00e (�). Overall it seems plausible that in some cases (i.e., for some diseases) one can
expect that GTs will lead to an increase in overall health care costs due to the reaction
of individuals in their choices of surveillance intensity while in other cases overall health
care costs will fall.
Without a genetic test, individuals have expected utility value of v(�0) = EU(s(�0)).
After a genetic test, individuals adjust their optimal surveillance decisions in line with the
outcome of the test and so those who test negative end up with expected utility v(�L) =
EU(s(�L)) while those who test positive end up with expected utility v(�H) = EU(s(�H)).
Both �L and �H depend on " (the precision of the test). Thus, from an ex ante perspective
(i.e., before results of a genetic test are known), the expected utility (in equilibrium) from
taking a genetic test with information value " is EUA(") = �Lv(�L) + �Hv(�
H).
Consider �rst the private value of a GT. Standard results from information theory
lead one to expect that, from an ex ante position, individuals can never become worse
o¤ as a result of taking a genetic test.17 We know that a (fair) lottery over probabilities
17Of course, if taking a GT has an e¤ect on one�s market opportunities such as for life insurance (see
Hoy, 2006) or employement, one may be better o¤ to not take the GT as long as one can demonstrate
12

has a neutral e¤ect on expected utility if an individual doesn�t change his behavior. This
follows from the property that expected utility is linear in probabilities. However, if the
individual would choose an alternative (optimal) decision for at least one outcome of the
lottery, then the information has positive value. In our model individuals do adjust their
privately optimal behavior (surveillance) conditional on either outcome of the signal (i.e.,
whether the genetic test indicates they are low or high risk). This suggests that the
signal has a positive private value and so the individual will accept the GT.18 However,
in determining the social value of such a costless test, there is an external e¤ect to be
considered in that changes in surveillance intensity by members of the insurance pool who
take a GT a¤ects the overall cost (to everyone) of health care. Since any single individual
cannot avoid these implications, it is privately optimal to accept a GT and change her
level of surveillance accordingly.19
To determine a useful expression that isolates the various aspects of the e¤ect of genetic
test information on social welfare, we consider an initial value of " > 0 and see how an
increase in " a¤ects expected utility and costs. Let TCAbe the average (�nancial) cost
of providing health care services to the insurance pool under the public health insurance
system. If individuals obtain GTs, then this becomes
TCA= �LTC
L+ �HTC
H
where TCtis the per capita cost of health care created by a type t individual, t = L;H.
Since all individuals pay the per capita cost of health care provision based on the weighted
average of the cost of provision for each risk type, the expected value function then becomes
EUA(") below, where TCLe and TCHe represent the equilibrium average (or actual) cost
generated by a person of type t = L;H, respectively.
EUA(") = �Lfu(y � TCAe )� �L[(1� pED(sL))�L + pED(sL)�E ]� �(sL)g
+�Hfu(y � TCAe )� �H [(1� pED(sH))�L + pED(sH)�E ]� �(sH)g (17)
For convenience, we drop theb notation on the variables sL and sH , giving:dEUA
d"= �L
dEUL
d"+ �H
dEUH
d"(18)
one�s decision.18See Hirshleifer and Riley (1992, pp. 170-185) for details of this argument.19From equation (11) we can derive v00(�) which includes the term pED0(bs)[�L��E ] dbsd� > 0, which re�ects
the private value of the test. However there are also terms involving derivatives of TCe(�), which cannot
be signed. Hence, the function v(�) isn�t necessarily convex.
13

with
dEU t
d"= u0(y � TCAe ) �
��dTC
Ae
d"
�� d�
t
d"[pED(st)�E + (1� pED(st))�L]
��t��dp
ED
dstdst
d�td�t
d"� (�L � �E)
�� d�(s
t)
dstdst
d�td�t
d"(19)
for t = L;H. Upon substituting d�L
d� = �1�L; d�
H
d" = 1�H, we obtain
dTCAed"
= �L �dTCLed�L
� d�L
d"+ �H �
dTCHed�H
� d�H
d"(20)
and this gives:
dEUA
d"= u0(y � TCAe ) �
�dTCLed�L
� dTCHe
d�H
�+[pED(sH)� pED(sL)] � [�L � �E ]
��LdpED
dsLdsL
d�L(�L � �E) +
d�
dsLdsL
d�L
+�HdpED
dsHdsH
d�H(�L � �E)�
d�
dsHdsH
d�H(21)
The �rst line in the above equation represents the �nancial implications of the genetic
test. People assigned to di¤erent risk classes choose di¤erent levels of surveillance and
face di¤erent probabilities of disease and so �nancial implications are measured by the
termhdTCLed�L
� dTCHed�H
i.20 If the cost function is linear in � this term disappears since
this would imply that the average per capita cost of providing health care is una¤ected
by a mean preserving spread in disease probabilities. If TCe(�) is strictly convex, thendTCL
d�L< dTCH
d�H(due to �L < �H) and the expected cost of health care provision in the
presence of information from genetic testing will rise and so the �rst term in equation (22)
will be negative, and vice versa if TCe(�) is strictly concave.
The expected disutility from onset of disease is greater if it is detected late than early
and high risk types adopt a higher level of surveillance (i.e., sH > sL and so pED(sH) >
pED(sL)). So line 2 re�ects the e¢ ciency gain of information from a genetic test in the use
of surveillance that arises from better targeting (i.e., more people who are high risk rather
than low risk now realize this and so adopt higher intensity of surveillance). This e¢ ciency
e¤ect is higher the greater is the di¤erence in the probabilities of early detection for the
two types, [pED(sH) � pED(sL)], and the greater the utility bene�ts of early detection,[�L��E ]. Lines 3 and 4 each represent the marginal e¤ect on the decisions regarding s ofL-types and H-types, respectively (i.e., their privately optimal decisions). The envelope
20Recall that it is possible even that dTCe
d�< 0. Let us assume here that it is positive, although it isn�t
important to do so.
14

theorem applies and each of these terms is zero. To see that is the case, rearrange lines 3
and 4 as:
�dbsLd�L
���LdpED
dbsL (�L � �E)� d�
dbsL�
(22)
dbsHd�H
���HdpED
dbsH (�L � �E)�d�
dbsH�
(23)
Thus, we have the following proposition.
Proposition 3. Under public insurance (no di¤erential pricing and full coverage of costs),
individuals will always voluntarily submit to a (costless) genetic test. However, due to
noninternalized cost implications, the resulting welfare implications may be positive or
negative.
1. If d2TCed�2
� 0 individuals�expected welfare will (unambiguously) increase as a resultof introducing GTs.
2. If d2TCed�2
> 0 there is a negative e¤ect on individuals� expected welfare due to a
resulting increase in the per capita cost of health care provision. Individuals will experience
an increase (decrease) in expected welfare if
[pED(sH)� pED(sL)] � [�L � �E ] > (<) � u0(y � TCAe ) ��dTCLed�L
� dTCHe
d�H
�(24)
4 Conclusions and Discussion
We have provided a model that characterizes moral hazard implications resulting from
an individual�s choice of surveillance/monitoring for disease (e.g., use of colonoscopies,
FOBT, and other techniques for detecting colon cancer). We have shown that, although a
higher predisposition to a disease will always lead to an increase in the privately optimal
level of surveillance chosen by individuals, this is not necessarily the case for the socially
optimal level. If the continuing lifetime costs of treatment for those incurring disease are
higher under early detection than under late detection, which is a common phenomenon,
then individuals will over-utilitze surveillance relative to what would be socially e¢ cient.
However, in some cases early detection of disease leads to a cure or preemption of disease
(e.g., detection and removal of polyps through colonoscopy) and this is not as costly
compared to the lifetime costs of treating the disease conditional on late detection. An
example would be detecting colon cancer in situ or at stage 1 rather than at a later stage.
In such a case, under-utilitzation of surveillance may occur. Given all of these possibilities,
it is clear that, in the context of genetic testing, careful attention must be paid to the
problem of which individuals should be encouraged to either decrease or increase their level
of surveillance. This relationship will depend on the speci�cs of the disease, including; (i)
15
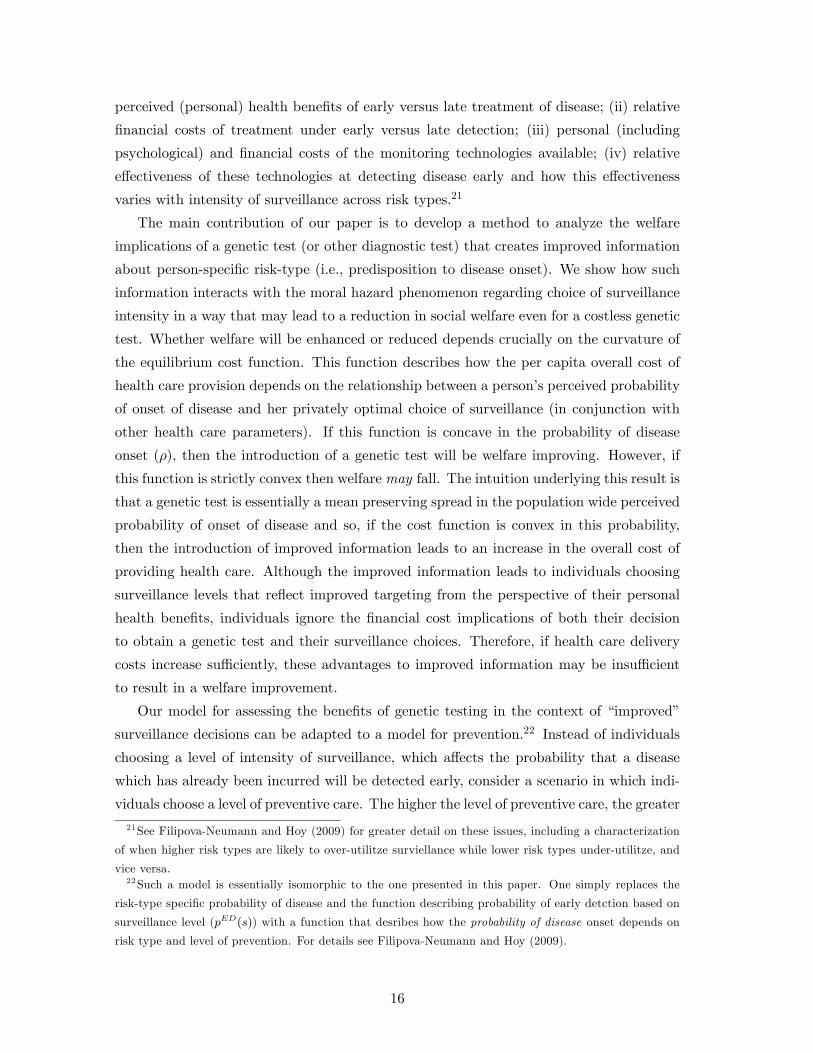
perceived (personal) health bene�ts of early versus late treatment of disease; (ii) relative
�nancial costs of treatment under early versus late detection; (iii) personal (including
psychological) and �nancial costs of the monitoring technologies available; (iv) relative
e¤ectiveness of these technologies at detecting disease early and how this e¤ectiveness
varies with intensity of surveillance across risk types.21
The main contribution of our paper is to develop a method to analyze the welfare
implications of a genetic test (or other diagnostic test) that creates improved information
about person-speci�c risk-type (i.e., predisposition to disease onset). We show how such
information interacts with the moral hazard phenomenon regarding choice of surveillance
intensity in a way that may lead to a reduction in social welfare even for a costless genetic
test. Whether welfare will be enhanced or reduced depends crucially on the curvature of
the equilibrium cost function. This function describes how the per capita overall cost of
health care provision depends on the relationship between a person�s perceived probability
of onset of disease and her privately optimal choice of surveillance (in conjunction with
other health care parameters). If this function is concave in the probability of disease
onset (�), then the introduction of a genetic test will be welfare improving. However, if
this function is strictly convex then welfare may fall. The intuition underlying this result is
that a genetic test is essentially a mean preserving spread in the population wide perceived
probability of onset of disease and so, if the cost function is convex in this probability,
then the introduction of improved information leads to an increase in the overall cost of
providing health care. Although the improved information leads to individuals choosing
surveillance levels that re�ect improved targeting from the perspective of their personal
health bene�ts, individuals ignore the �nancial cost implications of both their decision
to obtain a genetic test and their surveillance choices. Therefore, if health care delivery
costs increase su¢ ciently, these advantages to improved information may be insu¢ cient
to result in a welfare improvement.
Our model for assessing the bene�ts of genetic testing in the context of �improved�
surveillance decisions can be adapted to a model for prevention.22 Instead of individuals
choosing a level of intensity of surveillance, which a¤ects the probability that a disease
which has already been incurred will be detected early, consider a scenario in which indi-
viduals choose a level of preventive care. The higher the level of preventive care, the greater
21See Filipova-Neumann and Hoy (2009) for greater detail on these issues, including a characterization
of when higher risk types are likely to over-utilitze surviellance while lower risk types under-utilitze, and
vice versa.22Such a model is essentially isomorphic to the one presented in this paper. One simply replaces the
risk-type speci�c probability of disease and the function describing probability of early detction based on
surveillance level (pED(s)) with a function that desribes how the probability of disease onset depends on
risk type and level of prevention. For details see Filipova-Neumann and Hoy (2009).
16

the likelihood that there will be no onset of disease. There are a multitude of diseases for
which genetic tests can lead to potential improvements in choice of level of prevention (i.e.,
so-called multifactorial genetic diseases). For example, a woman who discovers she has the
BRCA1 gene may choose to have prophylactic surgery that can signi�cantly reduce the
probability of later onset of breast or ovarian cancer. There is a similar moral hazard phe-
nomenon associated with preventive activity and so over-utilization and under-utilization
are possibilities. Similar analyses follow in that the way decisions of individuals regarding
privately optimal levels of preventive care change as a result of information from genetic
tests and this may lead to either an increase or decrease in social welfare.
Our model could also be adapted to scenarios in which relevant health care strategies
involve both surveillance and prevention activities. Suppose an individual is diagnosed
with (relatively) early stage breast cancer and this occurs at an early age. A genetic test
may reveal whether this person has one of the so-called breast cancer genes (BRCA1/2).
If the test is positive, then the individual may choose an aggressive treatment for the
disease (e.g., double mastectomy) while if the test is negative the individual may choose
a less aggressive treatment (lumpectomy). The result of the genetic test may also a¤ect
the intensity of surveillance going forward in the individuals life in order to detect early
any reoccurrence of the disease. The continuing lifetime costs depend on both the per-
son�s genetic type and the treatment option where (current) treatment behaves also as a
preventive measure against reoccurrence.
A major challenge in organizing health care is to decide which programs of surveillance
and prevention are worthwhile. Cohen, et al. (2008) point out that there is often excessive
optimism about the ability of preventive health measures and technologies (including
screening programs) to reduce health care costs. This raises questions as to which measures
and technologies are reasonable investments. Our paper o¤ers a methodology to aid in
determining how speci�c preventive medicine programs may be improved through the use
of genetic tests in conjunction with targeted screening directives. As they note (Cohen, et
al., 2008, p. 661), for example, �the e¢ ciency of cancer screening can depend heavily on
both the frequency of the screening and the level of cancer risk in the screened population.�
Suppose, in the context of our model, that the existing level of screening that occurs for an
entire population with probability of disease �0 (i.e., without genetic testing) represents
over-utilitization. A genetic test will identify those at lower risk (�L), who are predicted
by the model to reduce surveillance, which in this scenario is likely to improve welfare.
Those who are discovered to be high risk (�H) will increase their intensity of surveillance
and since targeting surveillance to more risk prone individuals is often more e¢ cient, this
may lead to an improvement in welfare for this group as well. However, as our model
points out, whether or not these changes will represent an overall improvement in welfare
17

is not straightforward even though the �direction of change�seems to be appropriate for
both risk groups. Our model provides a starting point for conceptualizing a cost-bene�t
approach that includes behavioural responses to assess the value of the introduction of
any particular genetic test.
We also o¤er directions for future research. Our model presumes individuals are ultra-
rational in that they are expected utility maximizers who understand well the various
probabilities in the model (i.e., probability of onset of disease and probability of early de-
tection at various levels of intensity of surveillance). Applied studies need to consider how
individuals interpret risks such as genetic predispositions to disease (e.g., see O�Doherty
and Suthers, 2007) and how, conditional on genetic risk type, they understand how di¤er-
ent intensities of prevention and surveillance a¤ect the probability of onset of disease or
early detection. Non-EU or behavioural models of decision making also deserve attention
in the context we have described in this paper. It should be recognized that counselling
services from health care professionals may help individuals understand the outcomes of
tests and strategies but that in itself does not correct for the wedge between privately and
socially optimal decisions. For example, suppose many of those who perfectly understand
the extent of the increased risk of a disease resulting from a positive genetic test wish
to increase surveillance beyond what is socially optimal. This can be a perfectly rational
individual decision. Our model demonstrates that, in such a case, the health care system
should, in principle, respond to such pressures by denying the full demand for increased
surveillance. Doctors are often modeled as gatekeepers of medical services but such prac-
tices can sometimes be di¢ cult to carry out when patients�desires are in con�ict with
the socially optimal provision of services. In other instances, individuals under-use sur-
veillance - possibly only after a genetic test is received - and the socially optimal level of
surveillance can only be achieved by encouraging an individual to submit to a higher level
of surveillance than the individual wishes. This can also present a challenge to �doctors as
gatekeepers�. Doctor-patient trust can be eroded by such con�icts. Methods for dealing
with these problems are beyond the scope of this paper but certainly worthy of study.
We have ignored many potential sources of heterogeneity of individuals in our model.
Family history can often be used to create di¤erent subpopulations facing di¤erent like-
lihoods of receiving a positive genetic test result. This speci�c feature is not di¢ cult
to include in our analysis as it simply implies the relevant parameters vary across such
subgroups as would the value of a genetic test (e.g., see Hoy and Witt (2007) for such an
approach in a di¤erent context). A more problematic type of heterogeneity is the range of
di¤erent personal preferences one would expect over the physiological bene�ts and costs of
surveillance or prevention. For example, some people may simply have a higher disutility
from certain surveillance procedures. This makes it di¢ cult to determine, for example,
18

which individuals should receive higher surveillance levels and which lower surveillance
levels in order to obtain a social optimum. Such information about preferences is intrinsi-
cally private and so this represents a serious challenge to so-called one-size-�ts-all health
insurance/provision. But this feature, admittedly, is not unique to our problem.
Many countries with substantial coverage through private health insurance plans have
prohibitions on risk-rating of premiums as well as mandatory coverage of certain items.
Thus, our models and results can directly provide some guidance for such private schemes.
Private insurance regimes, however, are often more open to user fees and co-payments.
These features o¤er additional instruments for in�uencing private choices of surveillance
or prevention and so may o¤er some interesting avenues for future research. However,
since the burden of co-payments and user fees would fall di¤erentially across (genetic)
risk types, use of such instruments would create a phenomenon akin to premium risk.
It is also worth integrating models that highlight the risk premium problem or adverse
selection costs associated with genetic testing in related markets such as life insurance.
These models demonstrate such information may be welfare reducing (see, for example,
Hoy and Polborn (2000), Hoy and Ruse (2005) and Hoy (2006)) and such e¤ects can be
compared to the potential welfare improvements associated with improved health care
decisions.
19

Acknowledgements
An earlier version of this paper was presented at the CESifo Conference on Frontiers
of Microeconomic Theory and Policy, Symposium in Honour of Ray Rees, July, 2008. We
thank CESifo for �nancial support and attendees for useful suggestions. We especially
thank Hugh Gravelle who provided very useful advice regarding future developments of
this work. We also thank participants at seminars presented at Augsburg University,
Ryerson University, the University of Ottawa, the University of Waterloo, and in particular
Vincenzo Caponi, Ingela Alger, and Lutz-Alexander Busch for useful comments. Two
referees o¤ered very helpful suggestions that signi�cantly improved the substance and
style of the paper. The second author would like to thank SSHRC for �nancial support
and the Fondation Brocher for accommodation and �nancial support while he did some
of the work on this paper as a visiting researcher.
20

References
Brown, M. L. (2002), �Estimating Health Care Costs Related to Cancer Treatment from
SEER-Medicare Data,�Medical Care, vol. 40(8), pp. 104-117.
Caul�eld, T., J. Shelley, V. Alfonso, and T. Bubela (2008), �Nutrigenomics and the
Promise of Prevention: Representations and Realities,�Health Law Journal, Special Edi-
tion , pp. 41-65.
Cohen, J. T., P. J. Neumann, and M. C. Weinstein (2008), �Does Preventive Care
Save Money? Health Economics and the Presidential Candidates,�New England Journal
of Medicine, vol. 358(7), pp. 661-663.
Crocker, K. J., and A. Snow (1985), �A Simple Tax Structure for Competitive Equi-
librium and Redistribution in Insurance Markets with Asymmetric Information,� The
Southern Economic Journal, vol. 51, pp. 1142-1150.
Crocker, K. J., and A. Snow (1986), �The E¢ ciency E¤ects of Categorical Discrimi-
nation in the Insurance Industry,�The Journal of Political Economy, vol. 94, pp. 321-44.
Davies, K. (2010), The $1,000 Genome: The Revolution in DNA Sequencing and the
New Era of Personalized Medicine, Free Press, Simon and Schuster, Inc.
Doherty, N. A. and L. L. Posey, (1998), �On the Value of a Checkup: Adverse Selection,
Moral Hazard and the Value of Information,�The Journal of Risk and Insurance, vol. 65,
no. 2, 189-211.
Filipova-Neumann, L. and M. Hoy (2009), �Impact of Genetic testing on Surveillance
and Prevention,�University of Guelph, Department of Economics Discussion Paper no.
2009-4.
Finkelstein, A., E. F. P. Luttmer, M. J. Notowidigdo (2008), �What Good is Wealth
Without Health? The E¤ect of Health on the Marginal Utility of Consumption,�NBER
Working Paper 14089.
Hirshleifer, J. and J. G. Riley (1992), The Analytics of Uncertainty and Information,
Cambridge University Press, Cambridge, UK.
Hoel, M. and T. Iversen (2002), �Genetic Testing When There is a Mix of Compulsory
and Voluntary Health Insurance,�Journal of Health Economics, vol. 21, pp. 253-270.
Hoy, M. (1982), �Categorizing Risk in the Insurance Industry,�Quarterly Journal of
Economics, Vol. 97, pp. 321-336.
Hoy, M. (1984), �The Impact of Imperfectly Categorizing Risk on Income Inequality
and Social Welfare,�Canadian Journal of Economics, Vol. 17, 557-568.
21

Hoy, M. (1989), �The Value of Screening Mechanisms Under Alternative Insurance
Possibilities,�Journal of Public Economics, vol. 39, pp. 177-206.
Hoy, M. and M. Polborn, (2000), �The Value of Genetic Information in the Life Insur-
ance Market,�Journal of Public Economics, vol. 78, pp. 235-252.
Hoy, M. and M. Ruse (2005), �Regulating Genetic Information in Insurance Markets,�
Risk Management and Insurance Review, vol. 8, pp. 211-237.
Hoy, M. (2006), �Risk Classi�cation and Social Welfare,�The Geneva Papers on Risk
and Insurance: Issues and Practice, vol. 31, pp. 245-269.
Hoy, M. and J. Witt (2007), �Welfare E¤ects of Banning Genetic Information in the
Life Insurance Market: The Case of BRCA1/2 Genes,�Journal of Risk and Insurance, vol.
74, pp. 523-546.
Kifmann, M. (2001), �Premium Risk and Managed Care,�The Journal of Risk and
Uncertainty, vol. 22, pp. 277-293.
Lansdorp-Vogelaar, I., M. van Ballegooijen, A. G. Zauber, J. D. F. Babbema, E. J.
Kuipers (2009), �E¤ect of Rising Chemotherapy Costs on the Cost Savings of Colorectal
Cancer Screening,�Journal of the National Cancer Institute, vol. 101(20), pp. 1412-1422.
Miller, F., et al. (2002), �Predictive Genetic Tests and Health Care Costs: Final Report
Prepared for the Ontario Ministry of Health and Long Term Care,�www.health.gov.on.ca/
english/public/pub/ministry_report/geneticsrep02/chepa_rep.pdf
O�Doherty, K. and G. K. Suthers (2007), �Risky Communication: Pitfalls in Counseling
About Risk, and How to Avoid Them,� Journal of Genetic Counseling, vol. 16(4), pp.
409-417.
Rees, R. and P. Apps (2006), �Genetic Testing, Income Distribution, and Insurance
Markets,�Annales d�economie et de statistique, pp. 353-368.
Rothschild, M. and J. Stiglitz (1976), �Equilibrium in Competitive Insurance Markets:
An Essay on the Economics of Imperfect Information,�Quarterly Journal of Economics,
vol. 90, no. 4, pp. 630-49.
Roukos, D. H. (2008), �Genetics and Genome-wide Association Studies: Surgery-
guided Algorithm and Promise for Future Breast Cancer Personalized Surgery,�Expert
Review of Molecular Diagnostics, vol. 8(5), pp. 587-97.
Sloan, F. A., W. K. Viscusi, H. W. Chesson, C. J. Conover, K. Whetttn-Goldsteing
(1998), �Alternative Approaches to Valuing Intangible Health Losses: the Evidence for
Multiple Sclerosis,�Journal of Health Economics, vol. 17, pp. 475-497.
Strohmenger, R. and A. Wambach (2000), �Adverse Selection and Categorical Dis-
crimination in the Health Insurance Markets: the E¤ects of Genetic Tests," Journal of
Health Economics, vol. 19, pp. 197-218.
Tabarrok, A. (1994), �Genetic Testing: An Economic and Contractarian Analysis,�
22

Journal of Health Economics, vol. 13, pp. 75-81.
Tengstam, S. (2007), �Disability and Marginal Utility of Income,�Department of Eco-
nomics, University of Gothenburg, Working Paper 276.
Wilson, C. (1977), �A Model of Insurance with Incomplete Information,�Journal of
Economic Theory, vol. 16, pp. 167-207.
Viscusi, W. K. and W. N. Evans (1990), �Utility Functions That Depend on Health
Status: Estimates and Economic Implications,�American Economic Review, vol. 80(3),
pp. 353-374.
23

Appendix (for use of referees only)
Note regarding Proposition 2: The �rst part follows directly from the �rst or-
der condition for s� and the discussion in the paragraph preceding the statement of the
proposition.
For part 2, note that total di¤erentiation of the �rst-order condition for s� gives:
ds�
d�= �
8<: �u00(y � TC�) ��@TC�
@� js�����@TC
@s js��
+ pED0(s�)[u0(y � TC�)(CDL � CDE) + (�L � �E)]
9=;SOC�js=s�
(25)
where@TC�
@�js� = pED(s�)CDE + (1� pED(s�))CDL > 0; (26)
�@TC@s
js� = � � pED0(s�)(CDL � CDE)� C 0(s�); (27)
and SOC�js=s� is the expression in equation (9). Part 2 of the proposition then followsfrom the above expression upon making the substitution noted for �.
Note regarding shape of cost function: The expression for the second derivative
of TCe(�) is given below.
d2TCed�2
= pED0(bs(�))dbs
d�[CDE � CDL] + �[pED00
(bs(�))[CDE � CDL]] �dbsd�
�2(28)
+[pED0(bs(�))[CDE � CDL]]dbs
d�+ �[pED
0(bs(�))[CDE � CDL]]d2bs
d�2(29)
+d2C(bs(�))dbs2 �
�dbsd�
�2+dC(bs(�))dbs � d
2bsd�2
(30)
Of the six terms that make up the expression for d2TCed�2
, only the �fth term can be
signed (as positive) given our assumptions. If CDE > CDL, then three more terms can
be signed (the �rst and third being positive, the second being negative). The other terms
(fourth and sixth) depend on the sign of d2bsd�2
and there is no clear intuition why the functionbs(�) should be expected to be concave or convex.
24

s
TC
s s~
)(sEU
)(sTC
*s
EU
*)(' sEU
*)(' sTC
Figure 1: Underutilization of Surveillance
s
TC
ss~
)(sEU
)(sTC
*s
EU
*)(' sEU
*)(' sTC
Figure 2: Overutilization of Surveillance
25