Embed Size (px)
Citation preview

Managing in Turbulent Times
Investor MeetMumbai, 28 May 2009

© 2009, NIIT Technologies Limited Investor Meet 28th May 2009, Mumbai 2
Agenda
Environment Review
Operations Review
Growth Drivers
Financial Performance
Business Review
© 2009, NIIT Technologies Limited Investor Meet 28th May 2009, Mumbai 3
Environment Review
Operations Review
Growth Drivers
Financial Performance
Business Review

© 2009, NIIT Technologies Limited Investor Meet 28th May 2009, Mumbai 4
Environmental Challenges
Sub-prime Crisis
Credit Crisis
Economic Slowdown
Volatile Crude Prices
Exchange Rate Volatility
Financial Markets Melt-down
Global Recession & Uncertainty
© 2009, NIIT Technologies Limited Investor Meet 28th May 2009, Mumbai 5
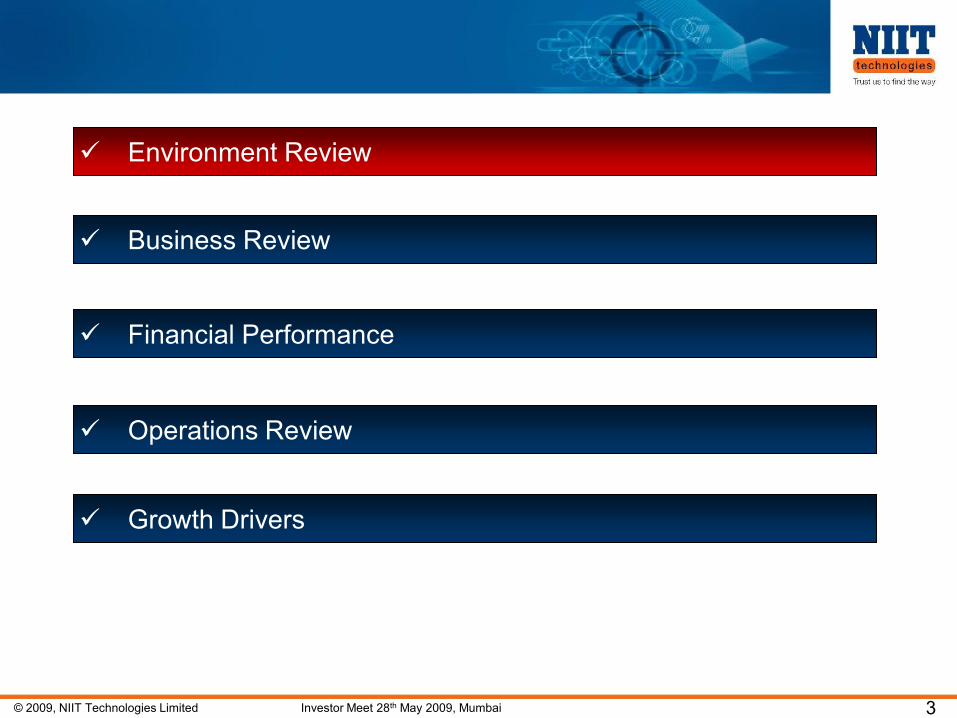
3.8%
12.6%
5.9%
0.6%
January August December May
Source: CLSA, IMF, Industry reporting
Reduced GDP growth
Entered 2008 with Uncertain Headwinds and High Volatility
Currency swings in the last two years have been approximately 30%
9.3% 7.9% 6.7%
2007 2008 2009
6,144
2,9904,238
Jan 1st 2008 Dec 31st 2008 May 25th 2009
Stock markets dipped
Inflation levels hit a 13 year high
93.7132.5
41.5 60
February July December May
Oil Prices (USD) swung dramatically

© 2009, NIIT Technologies Limited Investor Meet 28th May 2009, Mumbai 6
Fundamental Restructuring of Major Client Industries
Financial services consolidation
Auto sales free fall, consolidation, and bankruptcies
Retail drowning in debt and sales drop
Media business especially newspapers getting restructured
Real estate and construction free fall
Travel dropped 24% in Q4
Insurance and commercial real estate likely to be next
Entire contents © 2009 Forrester Research, Inc. All rights reserved.

© 2009, NIIT Technologies Limited Investor Meet 28th May 2009, Mumbai 7
“How do you expect the current global economic conditions will
impact your firms IT spending over the next 12 months?”
Entire contents © 2009 Forrester Research, Inc. All rights reserved.

© 2009, NIIT Technologies Limited Investor Meet 28th May 2009, Mumbai 8
What are the implications?
IT spending to drop 15% to 20%
Firms finally forced to let go of infrastructure
Vendors could lose 5-15% of revenue with the consolidation of
suppliers
$10-$12 billion of offshore spending could be in play
Firms finally have courage/desperation to rationalize application
portfolio as dust settles in 2010
Suppliers with specialist and very targeted service/value proposition
could gain access to accounts
Entire contents © 2009 Forrester Research, Inc. All rights reserved.

© 2009, NIIT Technologies Limited Investor Meet 28th May 2009, Mumbai 9
First half of 2008-09 on track with industry forecast; Second half
impacted by worldwide economic downturn.
Additional challenges are cross currency fluctuation, terror attacks,
corporate governance, US elections; protectionist sentiments
Some positive developments as well
Amendment of IT Act 2000
STPI extension till 2010
SEZ issue resolved
Lower inflation, wage moderation
An eventful year for the Indian IT-BPO industry

© 2009, NIIT Technologies Limited Investor Meet 28th May 2009, Mumbai 10
Overall GDM IT Services Preliminary Forecast
Entire contents © 2009 Forrester Research, Inc. All rights reserved.

© 2009, NIIT Technologies Limited Investor Meet 28th May 2009, Mumbai 11
Environment Review
Operations Review
Growth Drivers
Financial Performance
Business Review

© 2009, NIIT Technologies Limited Investor Meet 28th May 2009, Mumbai 12
Corporate Profile
Global IT Solutions Organization
Operations in North America, Europe, Asia and Australia
Strategy: Focus & Differentiate
Focused on select Industry Segments, globally
Banking, Financial Services & Insurance
Travel, Transportation and Logistics (TTL)
Retail & Distribution
Services
ADM
Package Implementation
Managed Services
BPO
Integrated (Platform) Solutions
High Maturity Processes
SEI CMMi Level 5 Ver. 1.2, PCMM Level 5, ISO 27001, ISO 20000

© 2009, NIIT Technologies Limited Investor Meet 28th May 2009, Mumbai 13
Contributes 43% to NIIT Technologies‟ revenues
Over 50 active accounts
3 new accounts added
Ranked # 3 in the Black Book of Outsourcing Insurance Industry
ACORD Accomplishment Awards
1% growth
Banking, Financial Services and Insurance
0
500
1000
1500
2000
2500
3000
3500
4000
4500
2004-05 2005-06 2006-07 2007-08 2008-09
Revenue in Rs‟ Million
Health
2% Life
21%
Non-Life
46%
Annuities,
Retirement Plans
31%
Securities and
Investments
34%
Retail Banking
27%
Others
9%
Risk and
Compliance
17%
Wholesale Banking
13%

© 2009, NIIT Technologies Limited Investor Meet 28th May 2009, Mumbai 14
Travel, Transportation & Logistics
0
500
1000
1500
2000
2500
3000
2004-05 2005-06 2006-07 2007-08 2008-09
Contributes 28% of revenues
Over 50 active accounts
7 new customers added
Ranked # 1 in the Black Book of Outsourcing: Travel Industry
IATA Strategic Partner
16% growth
Surface
Transport
15%Airports
2%
Airlines
50%
Travel
33%
Revenue in Rs‟ Million

© 2009, NIIT Technologies Limited Investor Meet 28th May 2009, Mumbai 15
Retail & Distribution
Contributes 13% of revenues
15+ active clients
2 new clients added
15% Growth
0
200
400
600
800
1000
1200
1400
2006-07 2007-08 2008-09
Revenue in Rs‟ Million

© 2009, NIIT Technologies Limited Investor Meet 28th May 2009, Mumbai 16
Acknowledgements
Ranked Number 1 : Black Book of Outsourcing 2008 Travel Industry survey.
Ranked No. 3 : Global ITO service providers in the Black Book of Outsourcing 2008 Insurance industry Survey.
Ranked amongst the 2008 Black Book Top 50 Best Managed Outsourcing Vendors.
Declared 'Business Superbrand' for 2008 by the Superbrands Council of India.
Awarded Distinguished Services Award for initiatives and efforts in promoting business with USA by Georgia Tech Center for International Business Education and Research.
Employer Branding Award for Excellence in HR through Technology and for Innovation in Career Development by the Asia Pacific HRM congress at the regional level.
Subsidiary ROOM Solutions Ltd UK. conferred with an Accomplishment Award at the ACORD LOMA Insurance Systems Forum.
Amongst the top 50 IT Innovators for the year 2008 by NASSCOM.
Amongst the Top 100 IT organizations ranked globally by IAOP. NIIT Technologies stands at 33rd overall and 7th in the Balanced Performance.
Ranked amongst the Global Services 100 - 2009 list. The list represents companies who have the maturity and capability to lead the next wave of services globalization
© 2009, NIIT Technologies Limited Investor Meet 28th May 2009, Mumbai 17
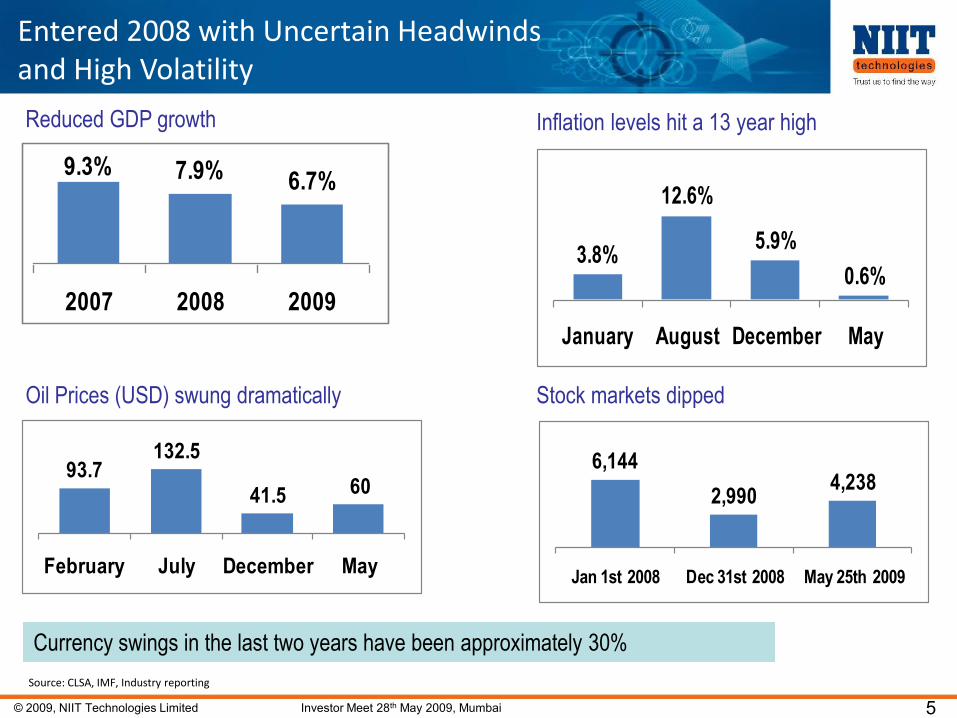
Quality of Work
Ven
do
r S
ize
Positioning
Ideal
Position
out
of
business
Small
Big
Enough
Big
Average Good Enough Best

© 2009, NIIT Technologies Limited Investor Meet 28th May 2009, Mumbai 18
Business Innovation
Linear Non -Linear
Value
innovation
Value delivered
Cost incurred
Headcount
Rev
enue
From our Perspective
Cost
Val
ue R
ecei
ved
From our Customers‟ Perspective
IT
Services
Industry Focus
Managed/
Integrated Services
Platform
based
SolutionsSaaS

© 2009, NIIT Technologies Limited Investor Meet 28th May 2009, Mumbai 19
Environment Review
Operations Review
Growth Drivers
Business Review
Financial Performance
© 2009, NIIT Technologies Limited Investor Meet 28th May 2009, Mumbai 20
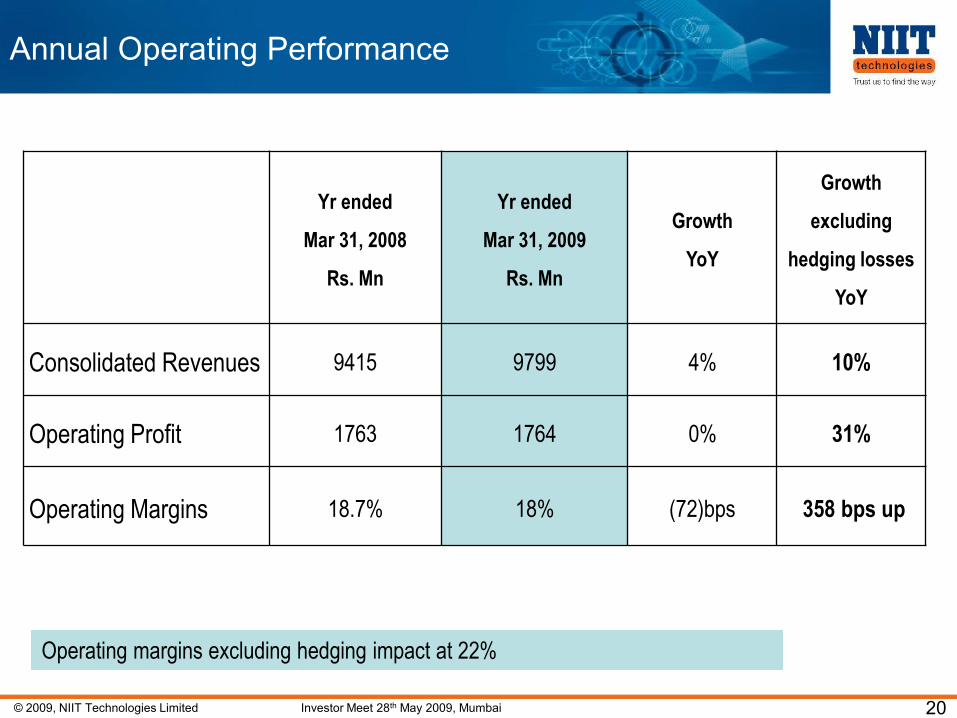
Annual Operating Performance
Yr ended
Mar 31, 2008
Rs. Mn
Yr ended
Mar 31, 2009
Rs. Mn
Growth
YoY
Growth
excluding
hedging losses
YoY
Consolidated Revenues 9415 9799 4% 10%
Operating Profit 1763 1764 0% 31%
Operating Margins 18.7% 18% (72)bps 358 bps up
Operating margins excluding hedging impact at 22%
© 2009, NIIT Technologies Limited Investor Meet 28th May 2009, Mumbai 21
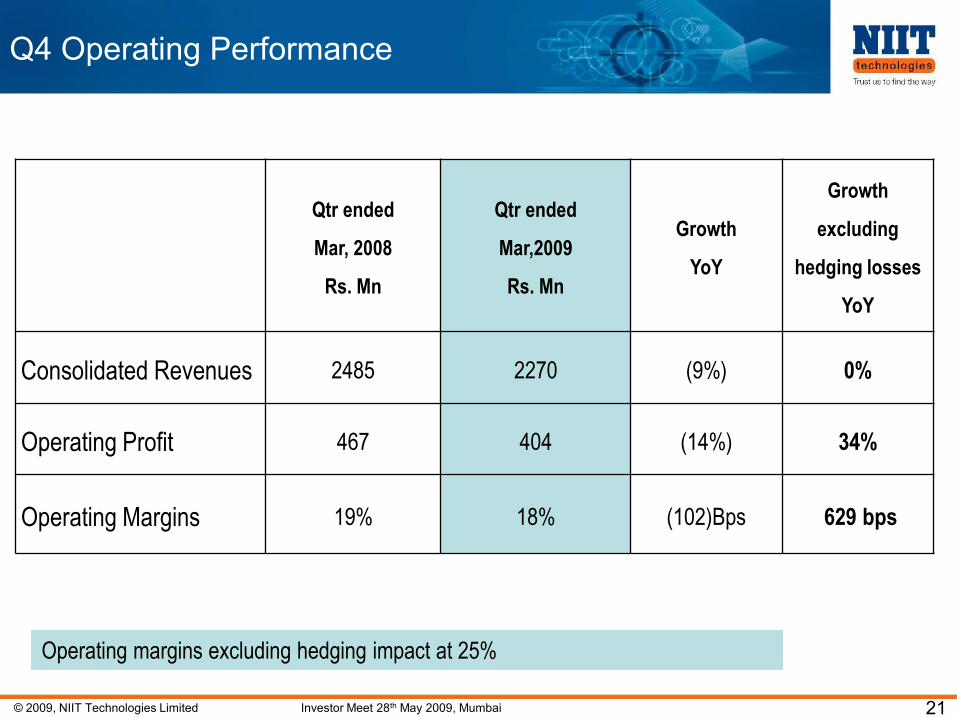
Q4 Operating Performance
Qtr ended
Mar, 2008
Rs. Mn
Qtr ended
Mar,2009
Rs. Mn
Growth
YoY
Growth
excluding
hedging losses
YoY
Consolidated Revenues 2485 2270 (9%) 0%
Operating Profit 467 404 (14%) 34%
Operating Margins 19% 18% (102)Bps 629 bps
Operating margins excluding hedging impact at 25%

© 2009, NIIT Technologies Limited Investor Meet 28th May 2009, Mumbai 22
Annual Income Statement
(Rs Mn) Q1’09 Q2’09 Q3’09 Q4’09 FY09 YoY
(%)
Revenues 2458 2587 2485 2270 9799 4%
Expenses 2002 2128 2039 1866 8035 5%
Operating Profit 456 458 446 404 1764 0%
OPM (%) 19% 18% 18% 18% 18% (72) bps
Depreciation 112 104 107 100 422 8%
Other Income (net of interest) 62 81 (101) 5 46 (66%)
Tax 51 65 69 40 224 63%
PAT after Minority
Interest
351 367 168 263 1148 (15)%
Net Margins (%) 14% 14% 7% 12% 12% (265) bps
EPS 5.99 6.25 2.85 4.48 19.56
• Operating margins stable across the year despite increasing hedging loss
• Other income reduced in Q3 & Q4 on account of loss on ineffective hedges and exchange rate losses
• Tax increased due to increase in onsite taxable income while offshore profit (tax free) was lower due to hedging losses

© 2009, NIIT Technologies Limited Investor Meet 28th May 2009, Mumbai 23
Balance Sheet
(Rs in mn) Mar 31, 2008 Mar 31, 2009 Mar 31,
2008
Mar 31, 2009
Equity 587 587 Net Block 1859 2105
Reserves & Surplus 3826 3289 Capital WIP 518 1052
Net worth 4413 3876 Debtors 2178 1935
Minority Interest 49 22 Cash & Equivalents 1972 1585
Loans 647 348 Other Current Assets 810 1086
Deferred tax Liability 0 0 Current Liabilities (2295) (3952)
Deferred tax Assets 67 435
5109 4246 5109 4246
-Reserves down primarily due to increased hedging losses
- Loans Reduced – NCD and UK loan repaid.
-Net block & CWIP increased due to capacity additions & GNIDA
campus
-DSO improves to 72 days. from 84 days LY
-Current Liabilities up due to increased Derivative Liability
now standing at 1990mn
- DTA increase due to hedging losses .

© 2009, NIIT Technologies Limited Investor Meet 28th May 2009, Mumbai 24
JFM‟09 Industry Performance
Operating Profit
Growth QoQ
Revenue
Growth QoQ
Wipro -2% -2%
TCS -5% -1%
Infosys -7% -3%
HCL-T (Axxon acquisition) 9% 15%
Polaris -18% -9%
Zensar -17% -14%
Hexaware -29% -14%
Mindtree -22% -7%
Patni -15% -7%
Tech Mahindra -11% -7%
NIIT Technologies -9% -9%
© 2009, NIIT Technologies Limited Investor Meet 28th May 2009, Mumbai 25
Environment Review
Growth Drivers
Financial Performance
Business Review
Operations Review

© 2009, NIIT Technologies Limited Investor Meet 28th May 2009, Mumbai 26
Geographic Revenue Mix
FY‟09
• USA down 1% due to hedging impact
• India up 1% due to stronger domestic demand
EMEA 50%
APAC
10%
India
9%
America
32%
EMEA 50%
APAC
10%
India
10%
America
31%
FY‟08

© 2009, NIIT Technologies Limited Investor Meet 28th May 2009, Mumbai 27
Vertical Revenue Mix
Others
19%BFS
16%
TTL
25%
Retail &
Distt.
12%
Insurance
28%
FY‟08Insurance
27%
Retail &
Distt.
13%
TTL
28%
BFS
16%
Others
16%
FY‟09
• Focused vertical contribute 84% (against 81% last year)• 54% in FY‟04, 62% in FY‟05, 75% in FY‟06, 79% in FY‟07

© 2009, NIIT Technologies Limited Investor Meet 28th May 2009, Mumbai 28
Managed Services
2006-07 2007-08 2008-09
YOY
Revenue
Growth 47%
YOY
Revenue
Growth 34%

© 2009, NIIT Technologies Limited Investor Meet 28th May 2009, Mumbai 29
Customer Mix
• 36 Million dollar+ customers
• Broad-basing of customer base
36%
47%
60%
40%
33%
45%
60%
40%
FY'08 FY'09
Top 10
Top 20
Top 5
Others

© 2009, NIIT Technologies Limited Investor Meet 28th May 2009, Mumbai 30
Order Intake
0
50
100
150
200
250
300
350
FY'08 Q1'09 Q2'09 Q3'09 Q4'09 FY'09
• 5 new significant customers added during the last quarter
• $312 mn intake during the year (LY- $229 mn), up 36% YoY

© 2009, NIIT Technologies Limited Investor Meet 28th May 2009, Mumbai 31
People
0
1000
2000
3000
4000
5000
6000
Mar'08 Jun'08 Sep'08 Dec'08 Mar'09
Onsite
Offshore
23%
77%
23%
77%
25%
75%
22%
78%
22%
78%
5,1184,888
4,6674,438
4,238
Annual attrition 14.9%
© 2009, NIIT Technologies Limited Investor Meet 28th May 2009, Mumbai 32
Environment Review
Operations Review
Financial Performance
Business Review
Growth Drivers

© 2009, NIIT Technologies Limited Investor Meet 28th May 2009, Mumbai 33
Changing Managerial Demands
Focus on Quality
Focus on Productivity, Cost
Focus on Cycle-time, Speed
Focus on Disruptive Business Models, Innovation
Focus on Volatility, Discontinuities
Build new capabilities
New value propositions
Leverage core competence, business process efficiencies
Training, systems, overhead analysis, restructuring
Training, TQM, empowerment
Prof. C K Prahalad, University of
Michigan, @ NASSCOM, 13th Feb 2009

© 2009, NIIT Technologies Limited Investor Meet 28th May 2009, Mumbai 34
Drivers for Growth
Impact on
Growth
and
Margins
Cost Pressures
Demand
Constraints
Business
Continuity:
• “More for Less”
Exploit
Discontinuities:
• Think Big. Act
Fast
Cash is King:
• Conserve Capital,
Reduce Costs
Vol
atili
ty
New
Paradigms

© 2009, NIIT Technologies Limited Investor Meet 28th May 2009, Mumbai 35
Operating Strategy
Secure business with existing customers
Exploit discontinuities with new value propositions
Improve cost structures
Accelerate transformation
© 2009, NIIT Technologies Limited Investor Meet 28th May 2009, Mumbai 36
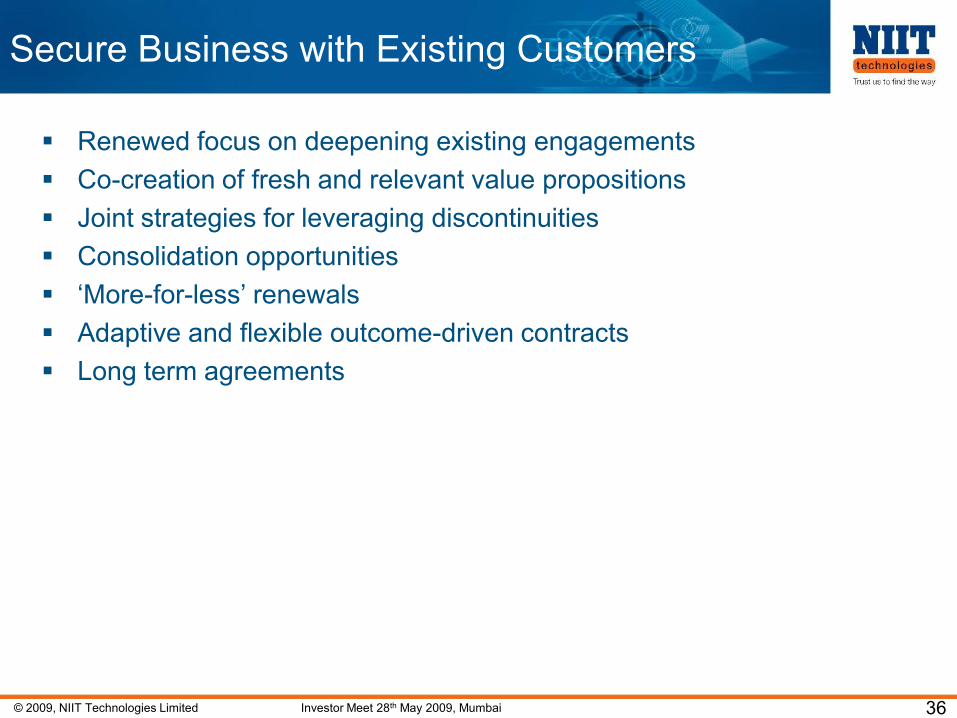
Secure Business with Existing Customers
Renewed focus on deepening existing engagements
Co-creation of fresh and relevant value propositions
Joint strategies for leveraging discontinuities
Consolidation opportunities
„More-for-less‟ renewals
Adaptive and flexible outcome-driven contracts
Long term agreements
© 2009, NIIT Technologies Limited Investor Meet 28th May 2009, Mumbai 37
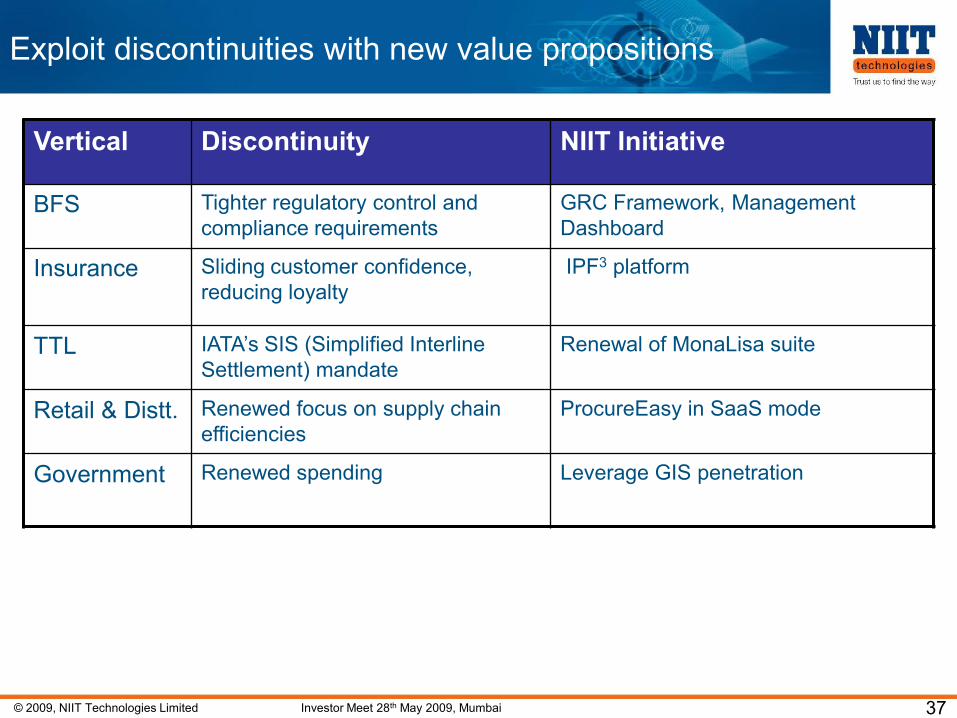
Exploit discontinuities with new value propositions
Vertical Discontinuity NIIT Initiative
BFS Tighter regulatory control and
compliance requirements
GRC Framework, Management
Dashboard
Insurance Sliding customer confidence,
reducing loyalty
IPF3 platform
TTL IATA‟s SIS (Simplified Interline
Settlement) mandate
Renewal of MonaLisa suite
Retail & Distt. Renewed focus on supply chain
efficiencies
ProcureEasy in SaaS mode
Government Renewed spending Leverage GIS penetration
© 2009, NIIT Technologies Limited Investor Meet 28th May 2009, Mumbai 38
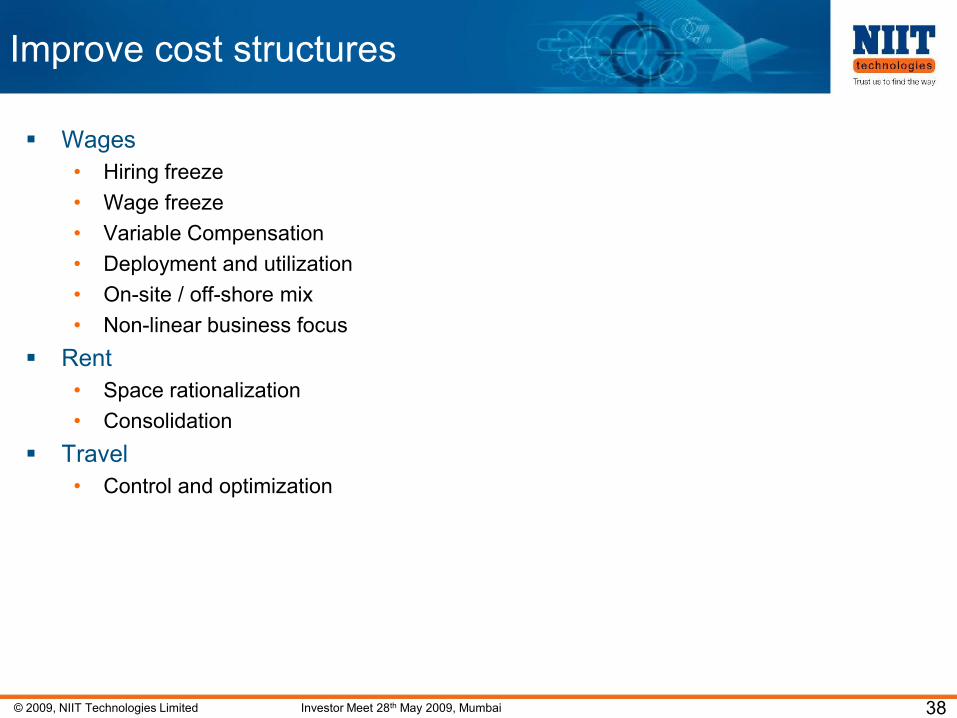
Improve cost structures
Wages
• Hiring freeze
• Wage freeze
• Variable Compensation
• Deployment and utilization
• On-site / off-shore mix
• Non-linear business focus
Rent
• Space rationalization
• Consolidation
Travel
• Control and optimization

© 2009, NIIT Technologies Limited Investor Meet 28th May 2009, Mumbai 39
Accelerate Transformation
Linear Non -Linear
IT
Services
Industry Focus
Managed/
Integrated Services
Platform
based
SolutionsSaaS
Linear
72%
Non-
Linear
28%
FY 2010E
Linear
60%
Non-
Linear
40%
FY 2012E
Linear
79%
Non-
Linear
21%
Linear
75%
Non-
Linear
25%
FY 2008 FY 2009
• Future growth engines around non-linear businesses
• Accelerated growth, margin expansion, on-target FY‟08, FY‟09

© 2009, NIIT Technologies Limited Investor Meet 28th May 2009, Mumbai 40
Changing Business Focus
Before 2000 Integrated within NIIT
Focused on Emerging technologies
2000 – 2004 Dotcom Bust
Enterprise and Legacy play
Focus to expand market and reach
2004 – 2008 De-merger to form NTL
Vertical Strategy
Focus and Differentiate
2008 – Volatility
Platform based
Focus on Non–Linear business

“Times are uncertain…
…trust us to find the way”