Embed Size (px)
Citation preview
Managing Intellectual Capital through Interactive Learning Environments based on System Dynamics and Accounting Models
The Dynamic Intellectual Capital Scorecard Carmine Bianchi (*), Enzo Bivona (**) Abstract This paper shows the potential impact of Interactive Learning Environments (ILEs) embodying System Dynamics (SD) and accounting models to support top management decisions in allocating business resources in a planning setting for Intellectual Capital (IC) management. Human resource training and organisational expenditures are often budgeted as discretionary costs and quite seldom their impact on business performance over time is properly investigated. The above issue provides the basis for an ILE portraying a “scorecard” including a quali-quantitative framework for IC monetary and non-monetary assessment. In the first section of the paper, an overview of the conceptual foundations of IC and different methods for its assessment is given. Main assumptions, strengths and weaknesses are remarked. A quali-quantitative evaluation approach for IC management is then proposed by the authors, and justification for applying the SD methodology is given. In the second section, the ILE is analysed with particular reference to: 1) its conceptual framework, 2) the case-study providing the background on which the simulator lies, 3) how to integrate the simulator into the planning context, and 4) what players can learn from it. Introduction Why the market value of a firm may significantly result higher than its book value? What are the
primary causes of success for a company against its competitors? How can one explain that firms
relying on large capitals are likely to achieve a lower performance, compared to those competitors
having bounded financial resources? What are the reasons of the sudden collapse of those
businesses identified as “pillars” of the economy, provided their perceived strong profitability and
image?
To answer the above questions an helpful concept is that of intellectual capital (IC). IC refers to a
knowledge system that can be both related to the individuals working in a firm, and to the business
organisation itself.
IC is likely to be assessed both in monetary (likewise other tangible assets commonly included in
financial statements) and non-monetary terms.
Its monetary evaluation is usually done according to different approaches, such as: cost, market, and
income. Furthermore, other “hybrid” methods have been proposed by the literature.
The approach that is adopted in this paper for IC monetary assessment combines both the cost and
income method. We propose to assess IC according to its potential impact on the future company
performance in achieving a sustainable growth.
(*) Full Professor of Business Management, University of Palermo (Italy), Faculty of Political Sciences, [email protected], http://www.unipa.it/~bianchi – CUSA-System Dynamics Group (**) Doctoral Student in Business Management, University of Catania (Italy), Master Phil. in System Dynamics, University of Bergen (Norway), [email protected], http://www.unipa.it/~bianchi – CUSA-System Dynamics Group
2
Such a monetary evaluation must be combined with a qualitative assessment, providing a
framework of those factors (i.e., policy levers, resources, drivers and performance indicators)
impacting on business knowledge.
According to this approach, a dynamic feedback view of IC accumulation and depletion processes
is adopted, to support the management of human and organisational capital development in a
planning setting. Such an approach is based on System Dynamics (SD).
By focusing stocks and flows affecting business strategic assets’ dynamics, the SD methodology is
adopted to frame and manage systems that are characterized by complex cause-and-effect
relationships. This paper proposes a “scorecard” based on Interactive Learning Environments
(ILEs) embodying both SD and accounting models to support decision makers’ learning processes
in IC management. An ILE is a computer-based model aiming to reproduce in a ‘virtual context’ the
system where decision makers operate. Playing an ILE allows one to simulate in a “safe”
environment decisions that would be made in the real world and test their consistency, according to
alternative scenarios (Davidsen, 2000; Maier & Grossler, 2000; Morecroft, 1994; Sterman, 1992).
The use of SD-based ILEs, supported by a learning facilitator, is likely to foster decision makers’
learning processes and question their mental models, with a view to the real feedback structure
driving key-variables’ behaviour.
The paper is divided into two main sections.
In the first section, an overview of the conceptual foundations of IC and different methods for its
assessment proposed by the literature is provided. Main assumptions, strengths and weaknesses are
remarked, to outline a synthetic framework for further analysis.
A quali-quantitative evaluation approach for IC management is then proposed, and justification for
applying the SD methodology is given.
In the second section, an ILE providing a Dynamic IC Scorecard to support decision makers, in
either a planning or education setting, is shown.
The ILE is discussed with particular reference to: 1) its conceptual framework, 2) the case-study
providing the background on which the simulator lies, 3) how to integrate the simulator into the
planning context, and 4) what players can learn from it.
The concept of Intellectual Capital In order to explore the conceptual context for IC assessment, it is worthwhile to firstly analyse the
concepts of “intellectual” and “capital”.
The term “intellectual” comes from the Latin intelligere, i.e. to understand, to learn.
3
The term “capital” refers to investments in tangible or intangible production factors, leading to an
expectation of future yields.
It follows that the concept of “Intellectual Capital” ought to be related to those investments done by
a firm in order to improve the capability of its people and the organisation itself to understand, i.e.
to better frame the system where decisions are made. Therefore, building IC means fostering the
learning capability of the firm to make sound decisions about ends/goals to achieve, and related
means. Such means refer to resources to acquire or build, coordinate and deploy for the
achievement of business ends/goals. Among such resources, the so called strategic assets (Amit &
Schoemaker, 1993; Dierickx & Cool, 1989; Mahoney & Pandian, 1992; Wernerfelt, 1984; Teece et
al, 1997) are particularly significant, as they provide the firm with the production factors from
whose exploitation it is possible to build a competitive advantage or achieve consensus with
stakeholders (Coda 1984; 1987).
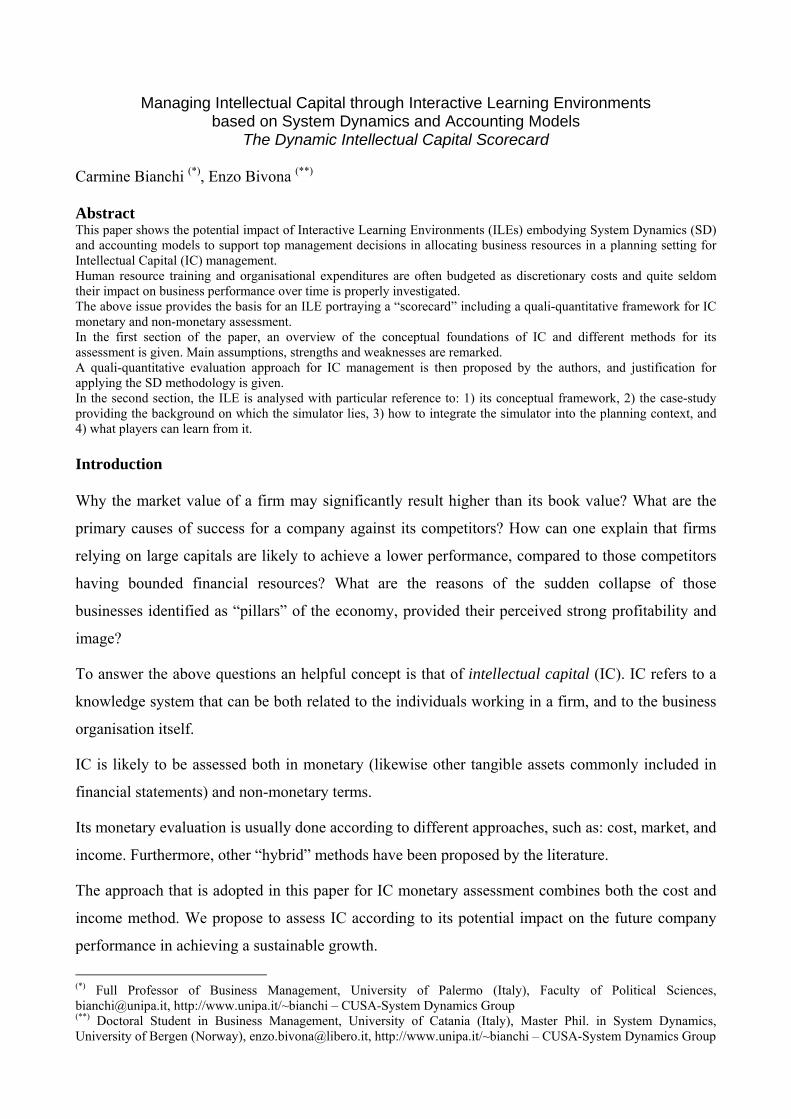
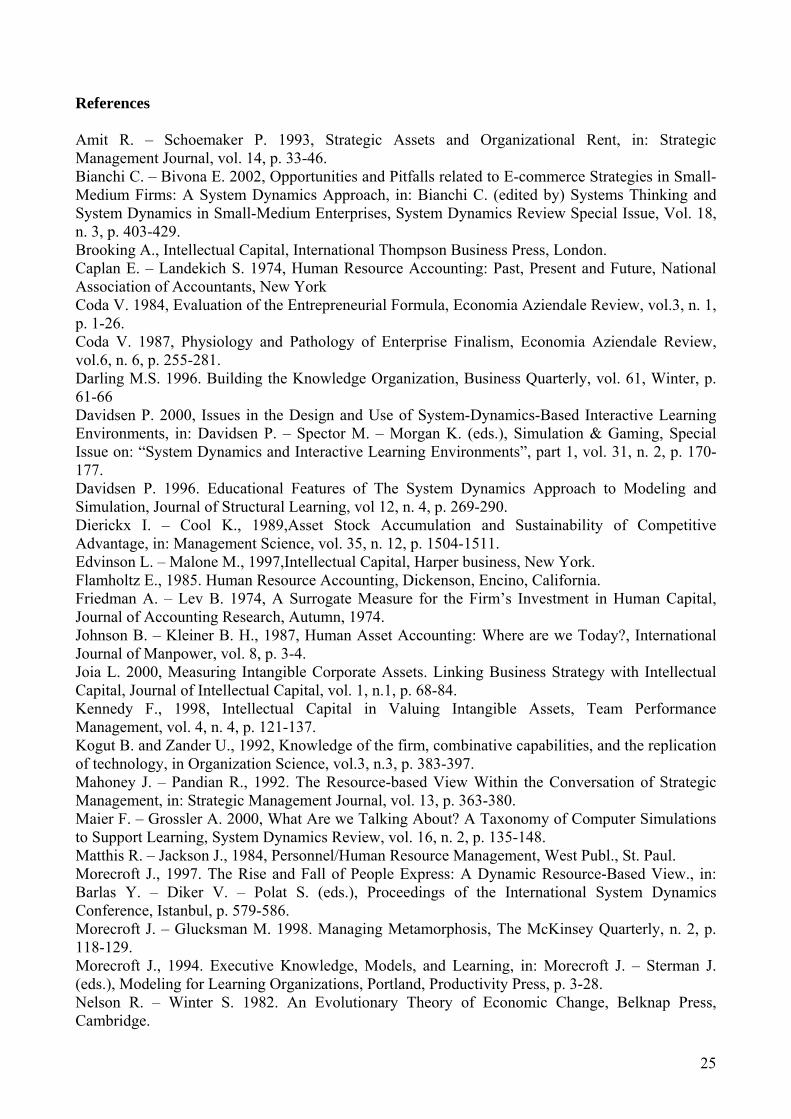
Strategic assets relate to the stock of available factors which are scarce, not easily tradable, difficult
to imitate and industry specific. They are gradually built through an inflow driven by current
routines (Nelson & Winter, 1982), and the interaction between the firm and its relevant
environment, which are a pre-condition for human resource and organisational learning. They are
also subject to an outflow associated to inertial depletion, resulting from either physical/technical
aspects (e.g. obsolescence) or shifts in the industry dominant logic 1 (see figure 1) (Prahalad &
Bettis, 1986; Morecroft, 1987; Glucksman & Morecroft, 1998).
--- FIGURE 1 ABOUT HERE ---
Most strategic assets are intangible and cannot be bought on the market (e.g. business image and
reputation, customer base, managers’ personal contacts). Others may also refer to tangible
resources, which can be purchased from suppliers (e.g. machinery and other technological
equipment, warehouses, product portfolio). However, their endowment cannot reach a satisfactory
level if the firm is not able to provide a knowledge system which allows people to deploy them
according to a common framework driven by pursued goals.
Without learning, leading to a significant knowledge stock, a firm is not able to build strategic
assets. Therefore, IC can be considered as a primary strategic asset for the acquisition and
deployment of others, to foster business growth. Organisational routines and the interaction 1 “In an evolving business environment, such a company must be adaptable; indeed its resource system may change out of all recognition from one competitive era to the next. To achieve this adaptability, a company must successfully manage its own metamorphosis from dependence on one source of sustainable advantage to dependence on another (Morecroft, 1998).
4
processes between the firm and its relevant environment, combined with the existing stock of
knowledge (i.e. IC), will be likely to build up new strategic assets (e.g. customer base, image).
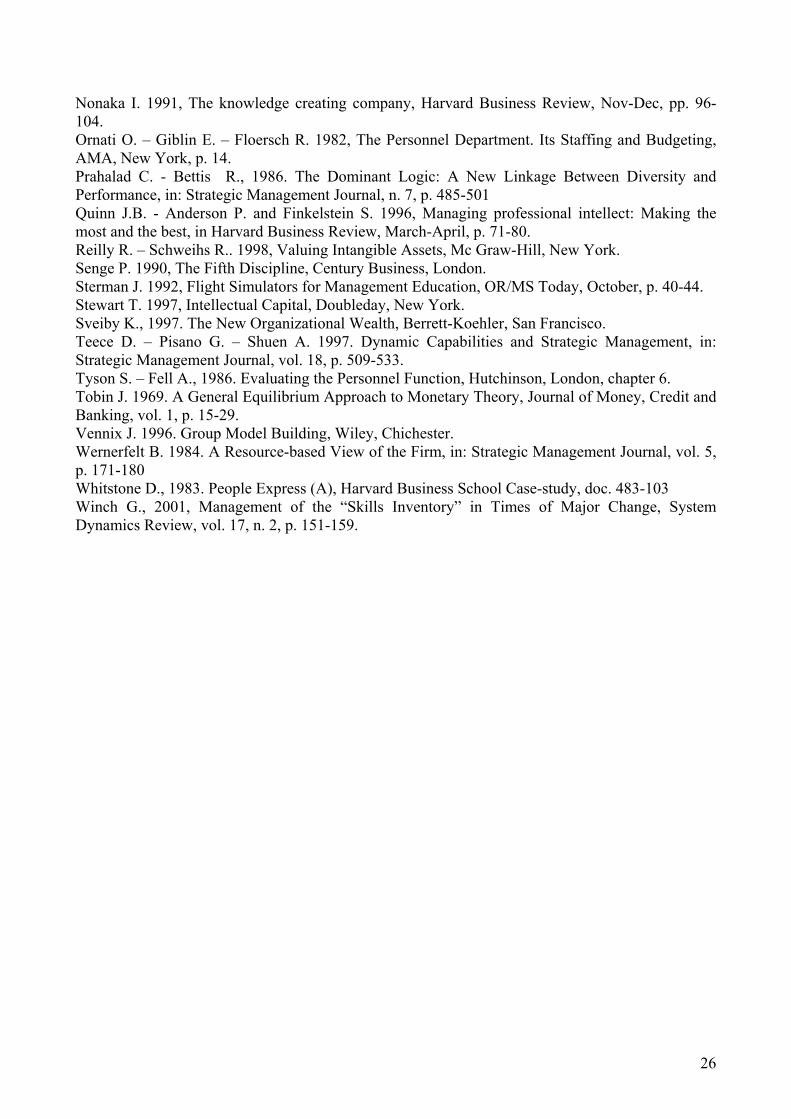
However, growth also implies the need to strengthen the body of knowledge on which the firm
relies. In fact, managing a higher level – and often wider scope – of strategic assets requires that the
company increases its effort to foster individual and organisational learning (see figure 2).
--- FIGURE 2 ABOUT HERE ---
One of the possible limits to IC development, related to the above pattern of behaviour injected by
business growth, can be associated to the current available technology. In fact, when a given
technology is being fully exploited, it is likely that IC reaches a threshold level, beyond which
further investments in the current body of knowledge will generate decreasing returns 2.
Furthermore, the above phenomenon will be likely to generate an inertial obsolescence outflow in
the IC stock, that will gradually increase, in spite of rising investments aimed to keep stable the
current knowledge domain.
The concept of knowledge is not only referred to individuals’ or business’ know-how, i.e., the
attitude to find proper means to achieve pursued goals. It can also be related to other two
dimensions: the what and why. The concept of know-what refers to the attitude to detect specific
subjects or issues on which to be focused (Kogut & Zander, 1992). The concept of know-why is,
instead, referred to the understanding of cause and effect relationships between issues and events
related to business performance, as a result of a learning process which shapes the way of thinking
of individuals and the company (Quinn et al, 1996; Nonaka, 1991).
The above said perspective shifts the research focus from the concept of intellectual property –
associated to the acquisition of patents, trade marks and other intangibles usually posted in a
financial statement – to that of intellectual resource, i.e., a production factor profiling a capability
to frame the relevant system and make proper decisions. Investing in IC impacts on the quality of
company decisions. Such decisions are related to the pursued goals and the acquisition,
coordination and deployment of different resources, according to a common frame provided by a
“business formula” which cannot be easily replicated in other contexts.
Investments in education and human resource development (leading to human capital
accumulation) are only a key-factor of IC. This also consists of structural capital, which results
2 “According to M. Darling, executive Vice-President of Human Resources for Canadian Imperial Bank of Commerce (CIBC), the rate of learning must equal or exceed the pace of change in the external environment, simply put, keeping one step ahead” (Darling 1996; Kennedy, 1998).
5
from the process of individual knowledge elicitation, in order to act on human capital as a lever to
build up business knowledge (Edvinson & Malone, 1997).
The individual knowledge elicitation process takes place in both internal and external activities. In
the first case, investments in organisational and information structures, and procedures generate the
so called organisational capital. In the second case, investments aimed to build strong and long
term relationships with external counterparts (e.g. customers, suppliers, competitors) give rise to a
shared knowledge system, which may relate to products, information, distribution systems, etc. This
is the so called customer or relational capital (Stewart, 1997).
The assessment of Intellectual Capital Such a shift of focus from the concept of property to that of resource implies a radical change of
perspective. In fact, the above said view suggests that IC cannot be defined as a physical resource
(or a “sum” of different physical assets), which can be financially measured and posted in a
financial statement. It is, rather, a system of intangible resources providing the company with a
know-how, know-what and know-why. Such an attribute of the business system is likely to be
assessed first of all, in qualitative terms and, only in a second step, as a synthetic monetary
indicator, according to the value of investments in human and organisational resources 3.
According to the literature, a monetary assessment of IC can be done through three main methods,
i.e.:
1. Cost approach;
2. Market approach;
3. Income approach.
The cost approach refers to either historical or replacement costs.
Historical costs take into account the actual expenditures done by the firm for the acquisition of
human and organisational resources.
Some examples are related to (Flamholtz, 1985; Caplan & Landekich, 1974):
- human resource hiring, education and training monetary costs;
- human resource on-the-job training (virtual) costs;
- monetary costs associated to various rewards (e.g. grants, house/car renting, medical care and
other fringe benefits), as well as services (e.g. canteen, library, nursery) provided to employees; 3 The term “organisational resources” is referred not only to organisational structure and procedures, but also to information and control systems.
6
- organisation design (monetary and virtual) costs;
- information and control systems (monetary and virtual) costs.
Replacement costs focus expenditures the firm ought to sustain if it would have to substitute its own
human and organisational resources, by either ‘purchasing’ them from the market or re-constructing
them. Such costs contemplate those aimed to recreate the utility of IC, also in a form or appearance
that may be quite different from an exact replica of the actual set of resources (Reilly & Schweihs,
1998; Brooking, 1996, p. 181).
The market approach focuses the current value (rather than cost) of IC resources.
Such value may be inferred, for instance, from:
- market-derived empirical transactional data regarding the sale of the asset itself or other
comparative resources (Reilly & Schweihs, 1998);
- a competitive bidding process involving different responsibility areas in a company negotiating
a given IC resource (Friedman & Lev, 1974);
- the difference between the market value of the company (price per share x total number of
shares outstanding) and its equity book value.
The income approach is based on the present value of expected monetary benefits (e.g. gross
operating margin or cash flows) a firm can earn from its IC investments in a definite or indefinite
future period.
Furthermore, there are some “hybrid” methods, combining different viewpoints of the above said
approaches.
For instance, Tobin (1969) proposed an assessment of IC based on the so called “q” method.
According to this approach, the “q” factor is defined as a ratio between the asset market value and
its replacement cost. If “q” is greater than 1, the asset is worth more than the cost of replacing it.
Such a method has been indicated as useful to measure both the value of a single asset and the
company as a whole.
An analytical framework (so called NCI, developed by the Kellogg School of Business at
Northwestern University) for the calculation of the above factor, refers to the replacement cost as a
sum of fixed assets and back accumulated depreciation, and inflation (Stewart, 1997; Joia, 2000).
A qualitative approach to IC assessment has been proposed by different scholars, implying the use
of indicators (referred to human, structural and relational capital) such as: knowledge worker
7
turnover rate, new product sales as a % of total sales, customer retention rate, customer satisfaction
(Stewart, 1997, p. 245; Sveiby, 1997; Edvinsson & Malone, 1997).
In order to develop an IC measurement system based on any of the above methods, four factors
ought to be taken into account (Kennedy, 1998): (1) the degree of human capital-intensity in the
organisation; (2) the organisation’s size and structure; (3) the firm’s existing human resource
capabilities; (4) the availability of human resource data (Johnson & Kleiner, 1987).
Each of all the above methods has some limitations, concerning the reliability of estimations it is
likely to provide.
For instance, the cost approach implies that reliable data on out-of-pocket and/or virtual costs are
available. Furthermore, it implies that cost is a valid measure for the value (i.e. the expected return)
related to investments done. Not always such hypotheses are true in the real world.
Furthermore, the market approach can be criticised for many other reasons. In fact: (a) the stock
market is volatile and often strongly affected by factors that are outside the control of the firm; (b)
both book and market values tend to be understated (Stewart, 1997, p. 225); (c) the difference
between the market value of the firm and its equity book value is far from being only related to IC.
According to Edvinsson and Malone (1997, p. 185) any list of measures can only be designed in
order to start a debate on what constitutes the value of IC in a company. Although we basically
agree on this statement, we also believe that a quantitative measurement can be afforded to enhance
something more than the start of a simple debate. Provided that any IC assessment cannot pretend to
focus an objective value, it is important to recognise the limitations of any of the above approaches,
and proceed towards a qualitative assessment of IC combined with a quantitative one. In fact, only
the understanding of the net of cause-and-effect relationships impacting on IC, and related delays
and non-linearities, can allow decision makers to manage – and, possibly, assess – IC resources.
We also believe that any monetary assessment, linked with a qualitative one, can be useful to foster
the planning process concerning investments in human and organisational resources. Such
investments are often budgeted on an incremental basis, as discretionary costs. They are planned
without a closer look on the impact they will be able to generate on the future business performance
and how, during the planning time horizon, resources (e.g. people knowledge) will be developed
and deployed in the different areas (Ornati et al, 1982; Tyson & Fell, 1986).
Our perspective implies, instead, a shift of focus in defining the role of the Personnel or
Organisation unit: rather than only focusing on short-term and operating issues, such function is
also asked to face strategic matters (Matthis & Jackson, 1984, chapters 1 and 2).
8
Particularly in those contexts where business knowledge is the main driver of success, the
Organisation function can play a coordinating role in the planning process. In fact, in order to adopt
a strategic approach to set IC policies in a given time horizon, it ought to involve line units in
reasoning about effects such investments will generate on performance, depending on how human
and organisational resources will be allocated and deployed by each unit.
A conceptual framework for intellectual capital assessment proposed in this paper As previously remarked, the method we propose for IC assessment combines a qualitative analysis
of key variables (i.e., policy levers, resources, drivers and performance indicators) impacting on
business knowledge with a synthetical monetary evaluation, based on the potential impact of IC
investments on future company performance.
In order to assess IC, it is not proper to add up single components, such as: human, structural and
customer capital. In fact, they are an attribute of the whole business system, rather than well
identified resources. This makes illusory any attempt to assess IC as a sum of the three above
components 4.
Therefore, relationships among human, structural and customer capital are not additive, but
multiplicative. This means that the focus of analysis ought to be shifted from a monetary evaluation
of the single parts to the understanding of the system of factors influencing IC.
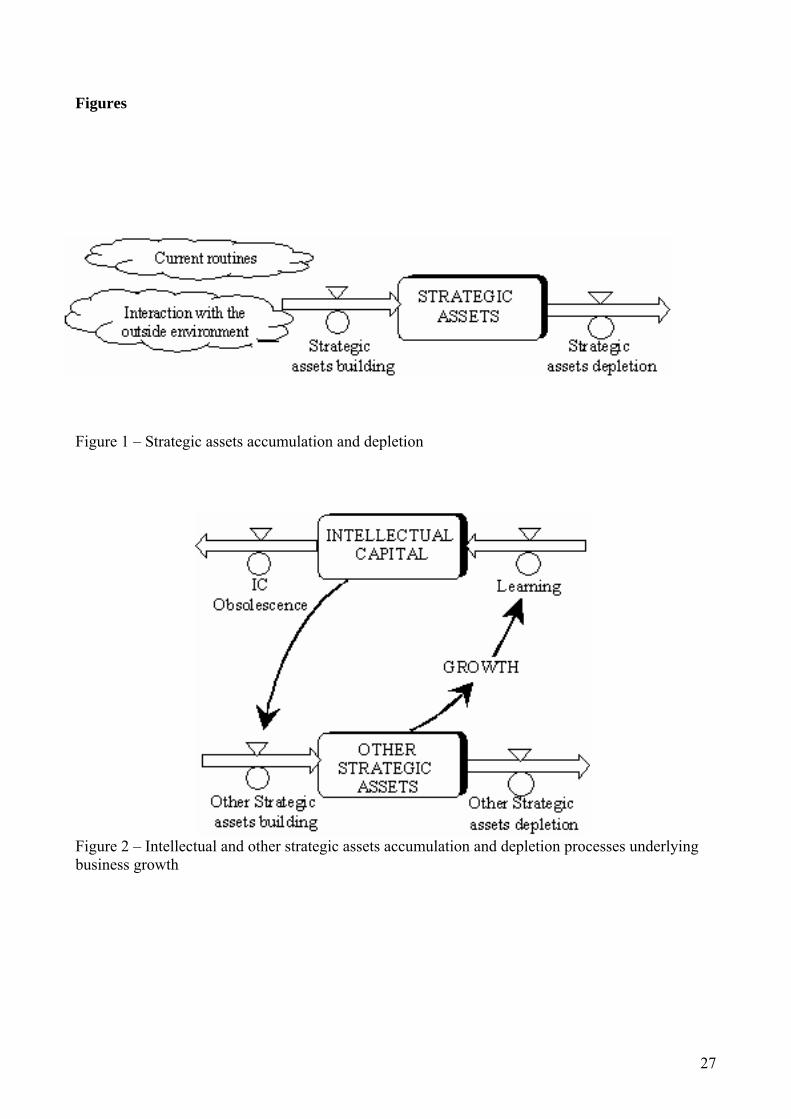
A framework for such analysis is provided in figure 3, depicting the building blocks of a scorecard
for IC quali-quantitative assessment.
--- FIGURE 3 ABOUT HERE --- Resources (i.e., personnel, human resources turnover, monetary investments) are built as an effect
of intellectual capital policies. They can be assessed on a qualitative point-of-view through two
main indexes associated to human resource knowledge and the quality of organisational structure.
Such resources define the knowledge of the company, in terms of know-how, know-what and know-
why.
The company knowledge impacts on performance drivers which are industry specific. For instance,
in the telecom industry they could be related to: time to fix customer requests and innovativeness.
4 “Edvinsson and Malone (1997, p. 187) propose that intellectual capital is the arithmetic mean of all capital components in play” (Joia, 2000, p. 72).
9
If we refer to the same industry, performance indicators related to the above drivers can be defined
concerning customer service, time to market and plan flexibility. Such drivers lead to four other
synthetic outcome measures, such as operating income, company image, ROI, and market share.
The above factors (i.e. policy levers and related indicators) allow one to make a qualitative analysis
of business knowledge.
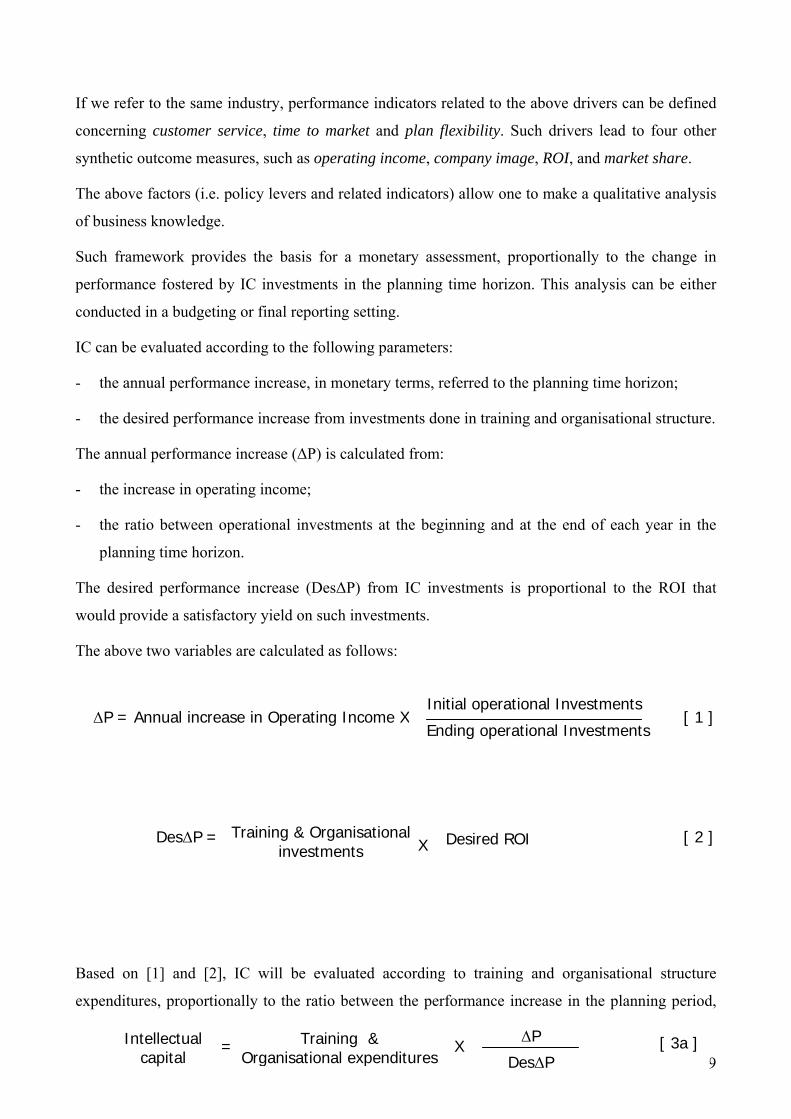
Such framework provides the basis for a monetary assessment, proportionally to the change in
performance fostered by IC investments in the planning time horizon. This analysis can be either
conducted in a budgeting or final reporting setting.
IC can be evaluated according to the following parameters:
- the annual performance increase, in monetary terms, referred to the planning time horizon;
- the desired performance increase from investments done in training and organisational structure.
The annual performance increase (ΔP) is calculated from:
- the increase in operating income;
- the ratio between operational investments at the beginning and at the end of each year in the
planning time horizon.
The desired performance increase (DesΔP) from IC investments is proportional to the ROI that
would provide a satisfactory yield on such investments.
The above two variables are calculated as follows:
Based on [1] and [2], IC will be evaluated according to training and organisational structure
expenditures, proportionally to the ratio between the performance increase in the planning period,
Initial operational Investments
Ending operational Investments ΔP = Annual increase in Operating Income X
XDesΔP = Training & Organisational investments
Desired ROI
[ 1 ]
[ 2 ]
Training & Organisational expenditures
Intellectual capital
= XΔP
DesΔP[ 3a ]
10
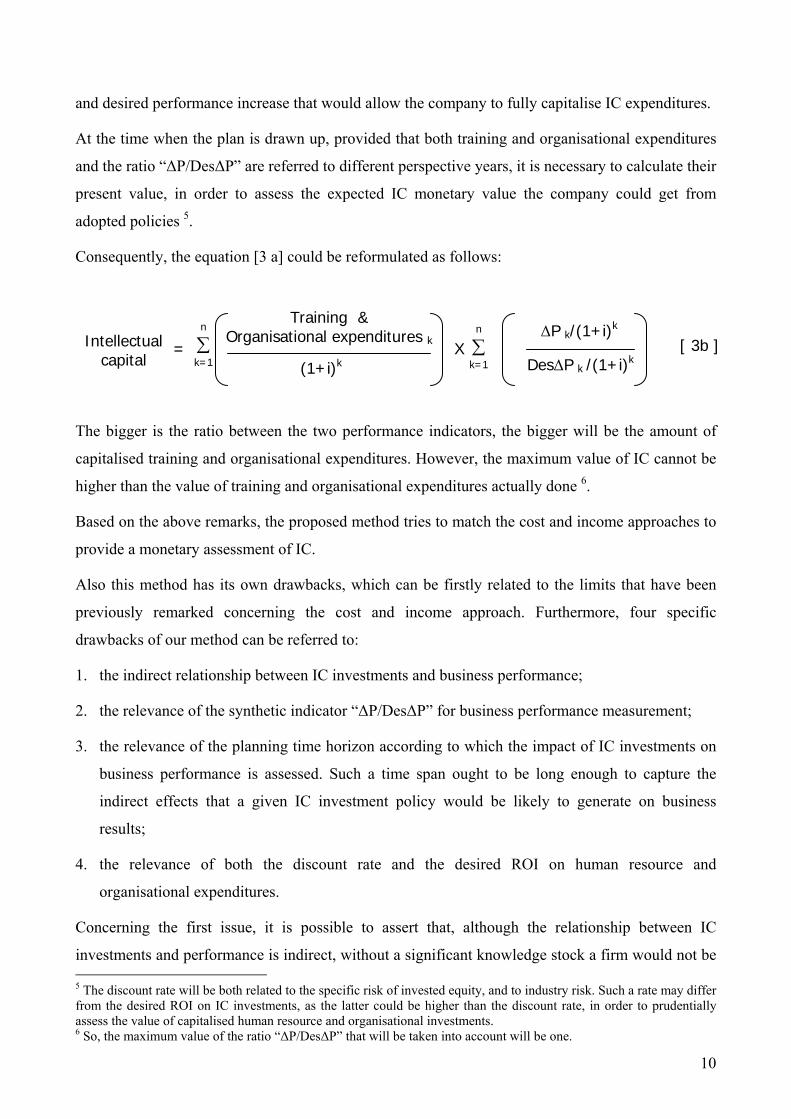
and desired performance increase that would allow the company to fully capitalise IC expenditures.
At the time when the plan is drawn up, provided that both training and organisational expenditures
and the ratio “ΔP/DesΔP” are referred to different perspective years, it is necessary to calculate their
present value, in order to assess the expected IC monetary value the company could get from
adopted policies 5.
Consequently, the equation [3 a] could be reformulated as follows:
The bigger is the ratio between the two performance indicators, the bigger will be the amount of
capitalised training and organisational expenditures. However, the maximum value of IC cannot be
higher than the value of training and organisational expenditures actually done 6.
Based on the above remarks, the proposed method tries to match the cost and income approaches to
provide a monetary assessment of IC.
Also this method has its own drawbacks, which can be firstly related to the limits that have been
previously remarked concerning the cost and income approach. Furthermore, four specific
drawbacks of our method can be referred to:
1. the indirect relationship between IC investments and business performance;
2. the relevance of the synthetic indicator “ΔP/DesΔP” for business performance measurement;
3. the relevance of the planning time horizon according to which the impact of IC investments on
business performance is assessed. Such a time span ought to be long enough to capture the
indirect effects that a given IC investment policy would be likely to generate on business
results;
4. the relevance of both the discount rate and the desired ROI on human resource and
organisational expenditures.
Concerning the first issue, it is possible to assert that, although the relationship between IC
investments and performance is indirect, without a significant knowledge stock a firm would not be 5 The discount rate will be both related to the specific risk of invested equity, and to industry risk. Such a rate may differ from the desired ROI on IC investments, as the latter could be higher than the discount rate, in order to prudentially assess the value of capitalised human resource and organisational investments. 6 So, the maximum value of the ratio “ΔP/DesΔP” that will be taken into account will be one.
n
∑ k=1
n
∑ k=1
Training & Organisational expenditures k Intellectual
capital = X
ΔP k/(1+i)k
DesΔP k /(1+i)k [ 3b ]
(1+i)k
11
able to build strategic assets, leading to an improvement of results. Therefore, an increase in
business performance over a relevant time horizon – except from unexpected external favourable
events – could not be achieved without any IC investment policy. Furthermore, it is possible to
remark that such method does not pretend to give an exact value of IC (if it ever exists). It only
aims to suggest managers a meaningful range of training and organisational expenditures that could
be capitalised. However, this value would not be assessed in order to be posted in the company
financial statement. The main reason to estimate the monetary value of IC investments is, instead, to
support a learning-oriented planning process, that is oriented to foster communication between line
and staff units and a better understanding of the impact of IC policies on future business growth.
If one considers the second issue, it is possible to observe that although the above synthetic
performance indicator is only related to a monetary parameter that is associated to profitability,
other performance measures linked to competitive and social success are captured by the qualitative
framework underlying IC monetary assessment.
Regarding the third issue, it is worth remarking that the planning time horizon cannot be pre-
defined. On the contrary, this method aims to stimulate managerial thinking about the cause-and-
effect relationships between IC investments, strategic assets acquisition and deployment, and
business performance. So, the planning period must be calibrated according to the decided
investment policy and the way human and organisational resources will be allocated and deployed
in each unit. The same remarks are also relevant about the setting of both desired ROI and the
discount rate.
The above considerations emphasise how the IC monetary assessment here suggested cannot be
conceived as a stand-alone method. It is rather a means to foster managerial debate over the
allocation of IC resources, in the light of a wider qualitative framework.
Provided that any IC assessment cannot pretend to focus an objective value, and the qualitative
framework suggested here aims to support decision makers to better frame the system of variables
impacting on business knowledge, there is still a major drawback in the static scorecard portrayed in
fig. 3. In fact, it does not capture neither the net of cause-and-effect relationships impacting on IC,
nor related delays and non-linearities.
Consequently, a feedback view of the relevant system ought to be adopted in order to better explore
the dynamics of IC investments.
A useful methodology to conduct this study can be referred to System Dynamics (SD).
A dynamic feedback view of Intellectual Capital accumulation and depletion processes
12
By focusing stocks and flows affecting business strategic assets’ dynamics, SD is adopted to frame
and manage systems that are characterized by complex cause-and-effect relationships. This is the
case of IC accumulation and depletion processes (Bianchi & Bivona, 2002).
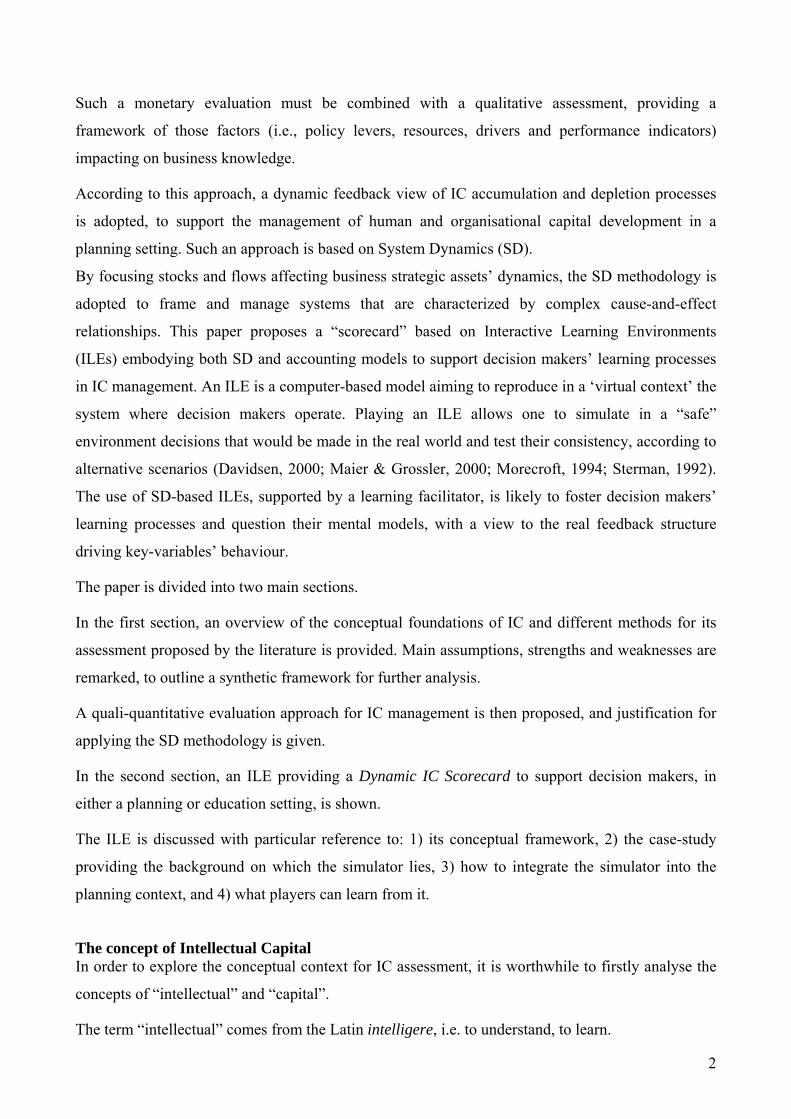
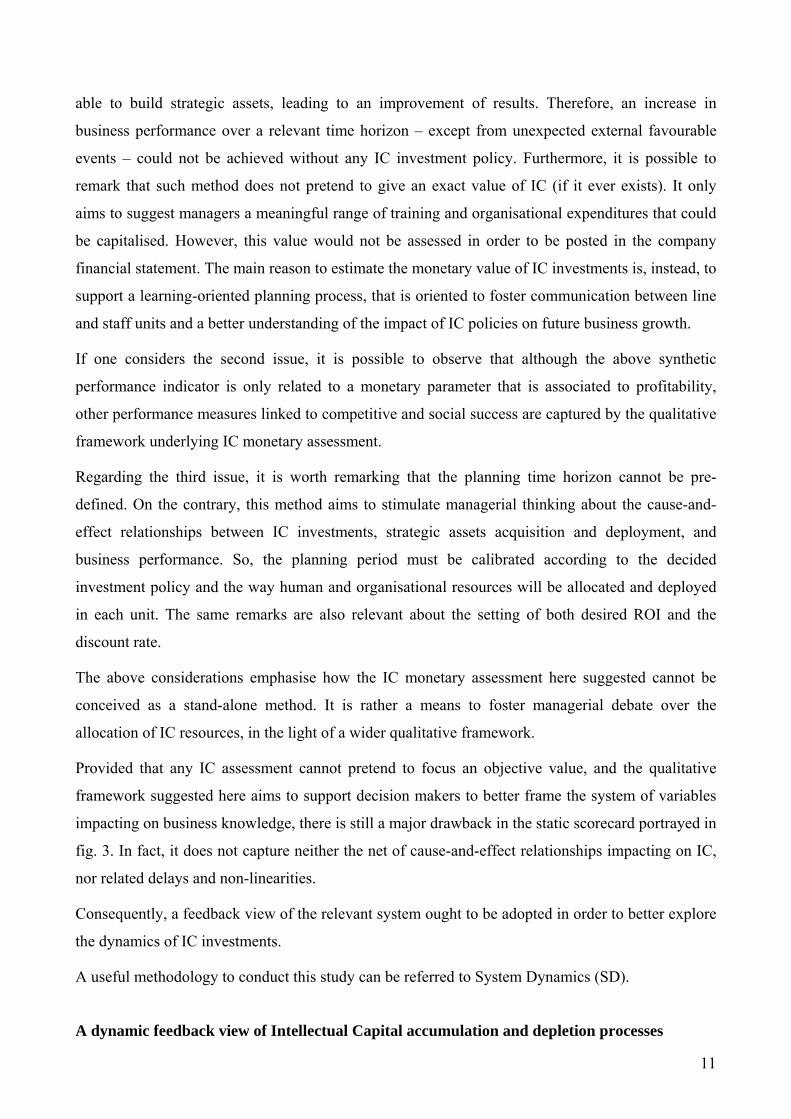
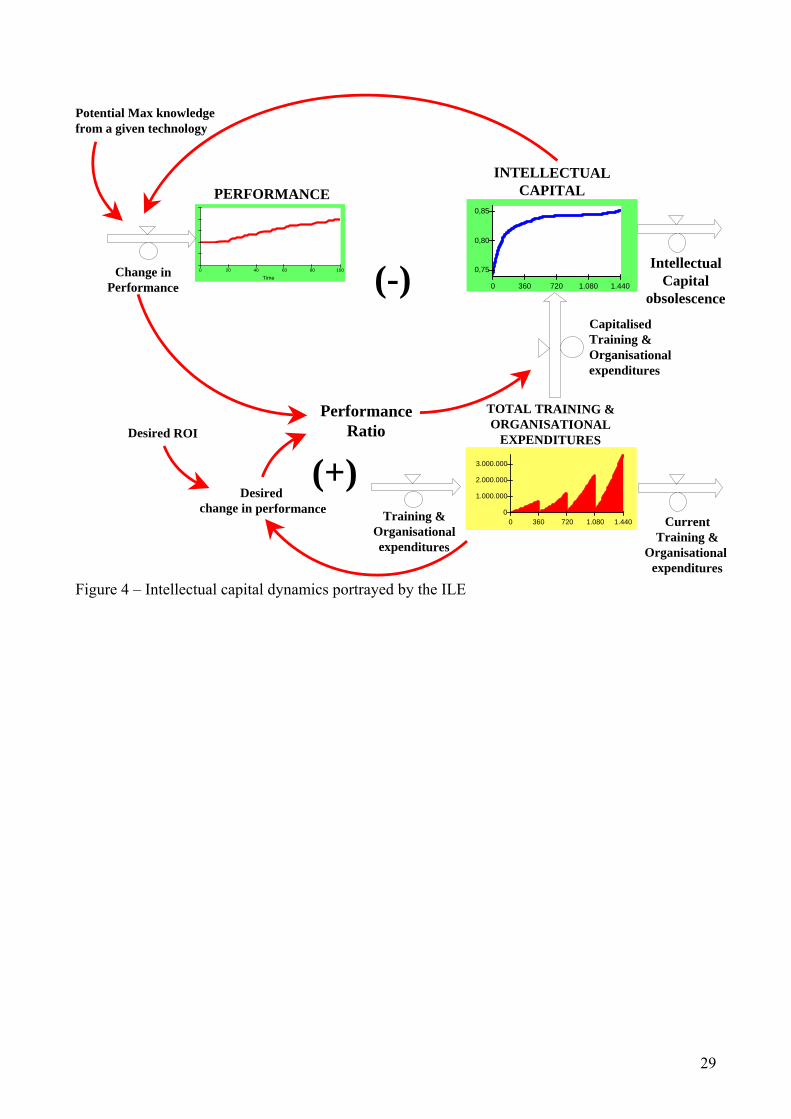
Figure 4 illustrates an aggregated feedback structure affecting the dynamics of IC.
--- FIGURE 4 ABOUT HERE ---
Training and organisational expenditures are an the inflow into the stock of total accumulated
investments in the different years included in the IC planning time horizon. The level of such
expenditures represents a potential inflow into the IC stock. However, this inflow also depends on
the actual performance ratio (“ΔP/DesΔP”). The higher is the performance produced by knowledge
built through the training and organisational expenditures, the higher the IC inflow will be. This
will also imply a lower rate of current training and organisational expenditures. In other words, all
the expenses that are not recognised as investments in IC can be considered as current costs.
Also the IC stock is affected by an outflow. As previously remarked, this is associated to business
knowledge obsolescence, which may depend on physical/technical issues or shifts in the industry
dominant logic.
There is a limit, however, to IC growth. This can be due, for instance, to the exploitation of a given
available technology, or a product/market mix, approaching the maturity or decline stage. In fact, as
far as IC reaches a threshold level, the change in business performance declines. This reduces the
performance ratio and, consequently, the capitalisation of human resources and organisational
expenditures.
The above relationships (“Intellectual Capital Change in performance Performance ratio
Capitalised Training and Organisational expenses Intellectual Capital”) originate a balancing (or
negative) feedback loop 7.
Another feedback loop can be detected in the relationship between: (“Total Training and
Organisational expenditures Desired change in performance Performance ratio Capitalised
Training and Organisational expenditures Total Training and Organisational expenditures”). The
effects produced by this loop on the system behaviour can be significant, for instance, if the firm
strongly reduces its training and organisational expenditures, relying on a satisfactory level of its
current IC stock. Such a myopic policy can generate in the short term illusory increasing returns, in
7 A balancing (or negative) loop may either show a limit to growth of a given resource or a policy aimed to fill a gap between an existing and desired level of a given resource.
13
terms of performance ratio on IC investments. In fact, a lower stock of total training and
organisational expenditures will reduce the desired change in performance (given a desired ROI).
This will increase the performance ratio 8. Consequently, a higher performance ratio will increase
the flow of capitalised training and organisational expenditures, which will drain the stock of total
expenditures done.
The above commented feedback loop can be defined as reinforcing, or positive 9.
In the medium-long term, however, the effects of such loop will become weak. In fact, both the
above said limits to IC growth, underlined by the balancing loop, and the draining effects generated
on IC by obsolescence will gradually reduce the level of company knowledge. This will imply
structural problems in the strategic capability of the firm to foster future growth.
It is worth remarking that a second balancing loop is associated to the relationship “Intellectual
Capital IC obsolescence Intellectual Capital”. The effects generated by such loop are difficult
to perceive by decision makers, due to the inertial depletion of IC. Quite often, both the human
mind and information systems are able to capture such effects when it is too late to promptly
recover a satisfactory level of company knowledge.
An Interactive Learning Environment embodying a System Dynamics and Accounting model to support Intellectual Capital Management in a planning setting: the Dynamic Intellectual Capital Scorecard The above commented dynamic feedback view of IC accumulation and depletion processes
provides the conceptual framework for an interactive learning environment (ILE), based on SD ad
accounting models, aiming to educate top management operating in a planning setting to better
frame and manage variables impacting on IC.
Based on a case-study of a telecommunication company (Nextcel) operating in the mobile industry,
the simulator was built around the concept of Dynamic Intellectual Capital Scorecard.
An Interactive Learning Environment (continued): Nextcel case-study In 1998, in San Diego (USA) a pool of entrepreneurs decided to start a telecommunication
company, Nextcel 10.
In a couple of years, Nextcel would have become a leader in the mobile telecommunication (GSM)
and Internet industries. 8 In fact, desired change in performance is the denominator of the performance ratio. 9 A reinforcing (or positive) loop represents a virtuous or vicious circle, related to a growth or decline process affecting a given resource in the relevant system. 10 The name of the firm has been intentionally disguised.
14
In order to effectively compete against the other two main companies, Nextcel aimed to build a
competitive advantage through its high technology broadcasting stations and a:
- timely customer service;
- reliable coverage;
- proper plan flexibility.
The strong relationships built up with an international cellular phone producer allowed Nextcel to
provide a high quality customer service level. This result was also well supported by effective
training programmes.
By the end of the first year of activities, Nextcel gained 5% of the national market.
The next two years showed a positive trend. The customer base increased from 2.4 million in 1999
(9% market share) up to 5 million by the end of 2000 (12% market share).
During this two years period, the mobile telecommunication industry showed an annual increase of
35%.
However, the year 2001 showed a strong decrease in both the customer base growth rate and
operating margin. Company market share was oscillating around 5%. In order to face such
unexpected phenomenon, Nextcel conducted an analysis of the “best practices” of high-tech leading
companies. After such analysis, the firm decided to strongly invest in both specialized training
programmes referred to different employee profiles, and organisational structure (procedures,
information and control systems). Such investments aimed to better develop and, in particular, use
company knowledge to build up a sustainable competitive advantage.
- What are the main processes behind IC dynamics?
- How to manage human resource knowledge, abilities and skills in order to allow the firm to
promptly face customer queries and generate new products?
- How to assess its intellectual capital?
Based on the above case-study, the ILE users are asked to draw up a four years plan and to outline
IC policies which can be compatible with Nextcel sustainable growth. They are also requested to
analyse and discuss expected results from adopted decisions, in the light of a dynamic feedback
view of IC accumulation and draining processes.
Through facilitated simulation sessions (Vennix 1996), users are supported to understand the hidden
feedback structure of the relevant system and to envisage what changes could be made to the
15
system’s structure, through different policies, in order to affect key-variables’ behaviour (Davidsen
1996).
Such an approach is intended to stimulate decision makers’ capability to better frame cause-and-
effect relationships underlying the dynamics of business knowledge and performance. It is also
aimed to match the SD view to the traditional accounting perspective, according to which human
and organisational expenditures are budgeted as discretionary costs, without a proper cross-
functional analysis of the IC policies’ impact on business performance over time.
An Interactive Learning Environment (continued): the structure of the simulator The simulator consists of five main sectors:
- a guided introduction, including the concept of IC and the Nextcel case-study;
- an input window, which allows the user to customise the simulator, according to different
issues, such as: the initial number of employees in each training stage (classroom vs. on-the-job
training) or knowledge level (trained vs. expert), normal training programme length in the
industry, normal organisational investments obsolescence time;
- a control panel embodying main policy levers (e.g. monthly employees to be hired, new hired
training programme length, organisational investments, network investments) and scenario
options (e.g. concerning market growth rate, customer mobility);
- reports including financial, income, and cash flow statements, as well as an IC monetary
assessment;
- graphs including main variables impacting on human capital, structural capital, IC drivers &
performance indicators, and customer capital.
An Interactive Learning Environment (continued): an analysis of two simulation scenarios In order to show how the simulator can improve top management learning processes in IC planning,
two scenarios will be commented now.
Scenario 1: a myopic IC policy The first scenario implies a medium customer mobility (i.e. about 2.5 years) as well as a medium
attractiveness of both major competitors.
According to this scenario, Nextcel monthly hires 30 employees on average.
16
In order to face the sharp annual market growth rate (35%), new hired personnel is primarily
allocated to deal with daily customer requests. This increases the average time to start training
programmes for new hired from 10 (i.e. the industry standard) to 30 days.
For the same reason, also the average frequency of training programmes for both trained employees
(180 days) and experts (360 days) is lower than the industry standard (i.e., 60 and 180 days,
respectively).
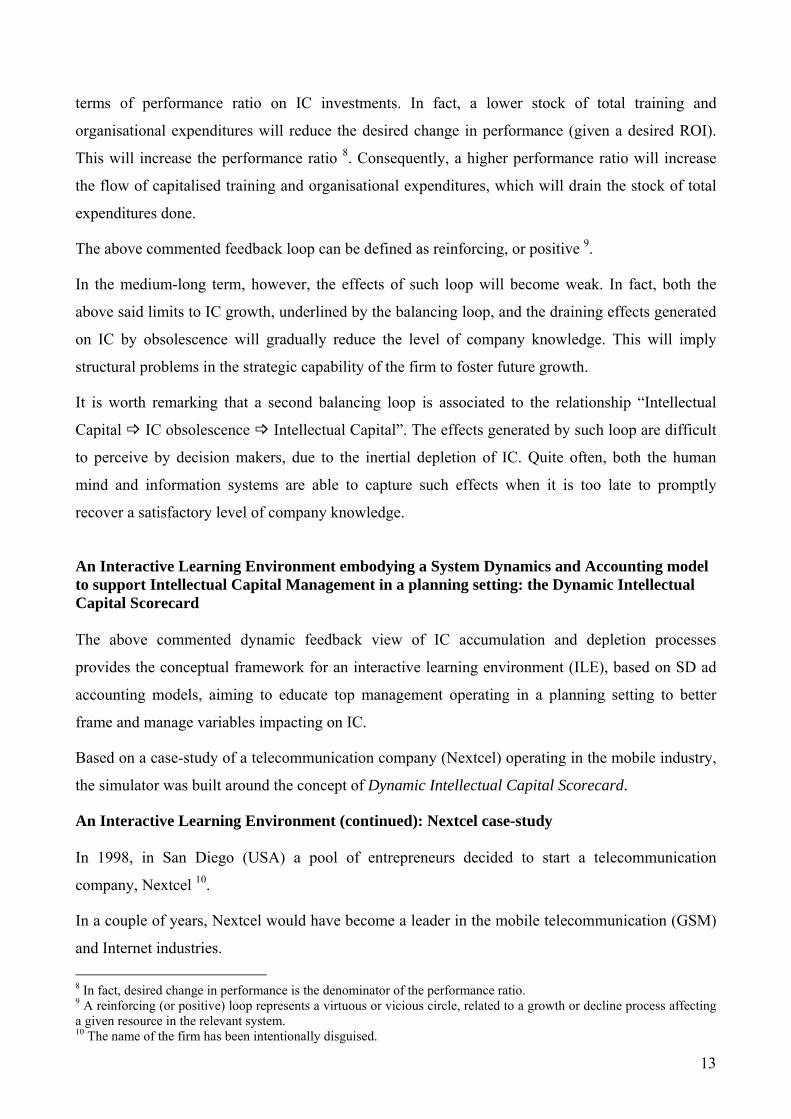
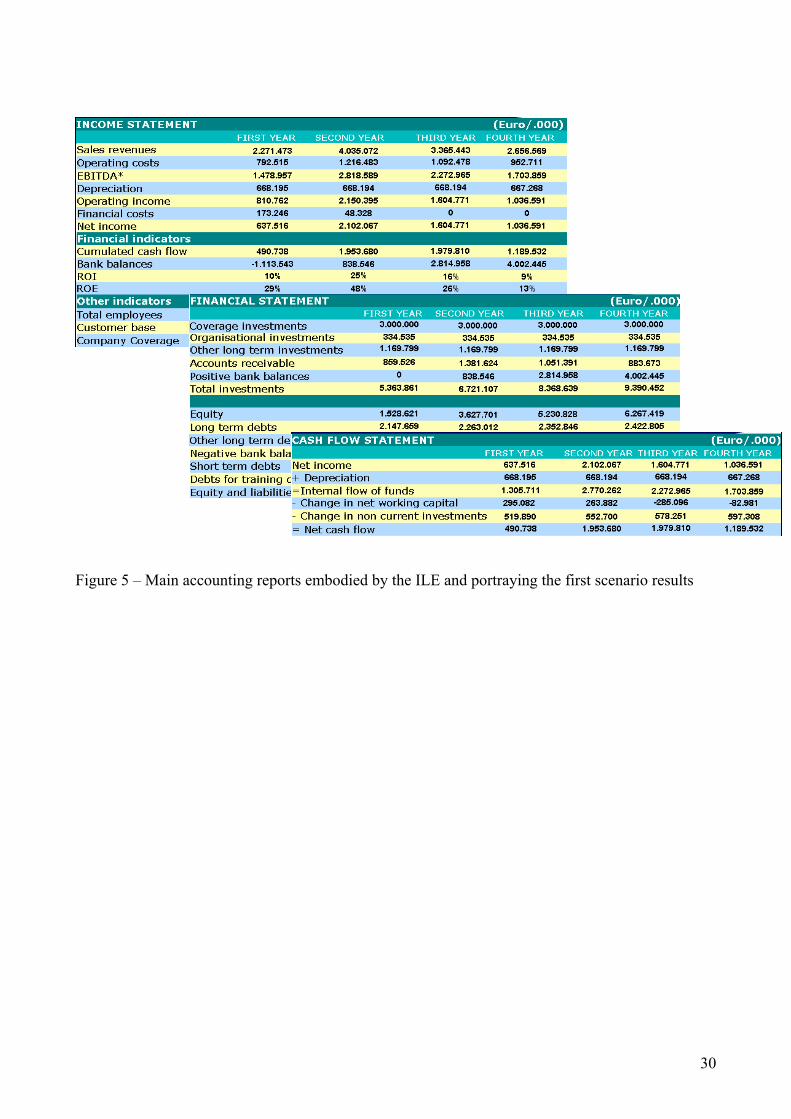
As shown in figure 5, the company investment policy is able to produce a satisfactory yield,
portrayed by positive EBITDA, ROI E ROE and growing bank balances.
--- FIGURE 5 ABOUT HERE ---
According to the adopted intellectual capital monetary evaluation method, the 95% of human
capital and organisational structure expenditures would be capitalised.
If one would have to evaluate this scenario only based on the monetary values portrayed by the
accounting reports, expected results could be considered as very satisfactory.
However, a dynamic analysis of non-monetary IC indicators can be useful to better understand the
meaning of the above accounting values.
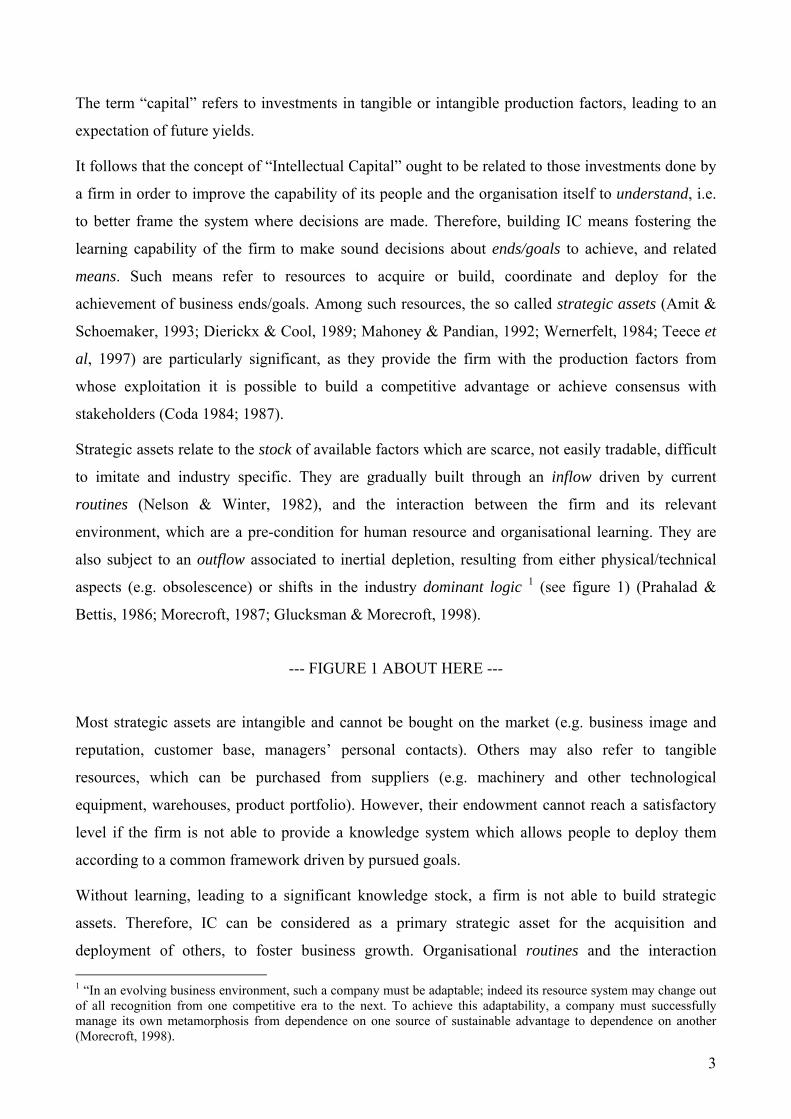
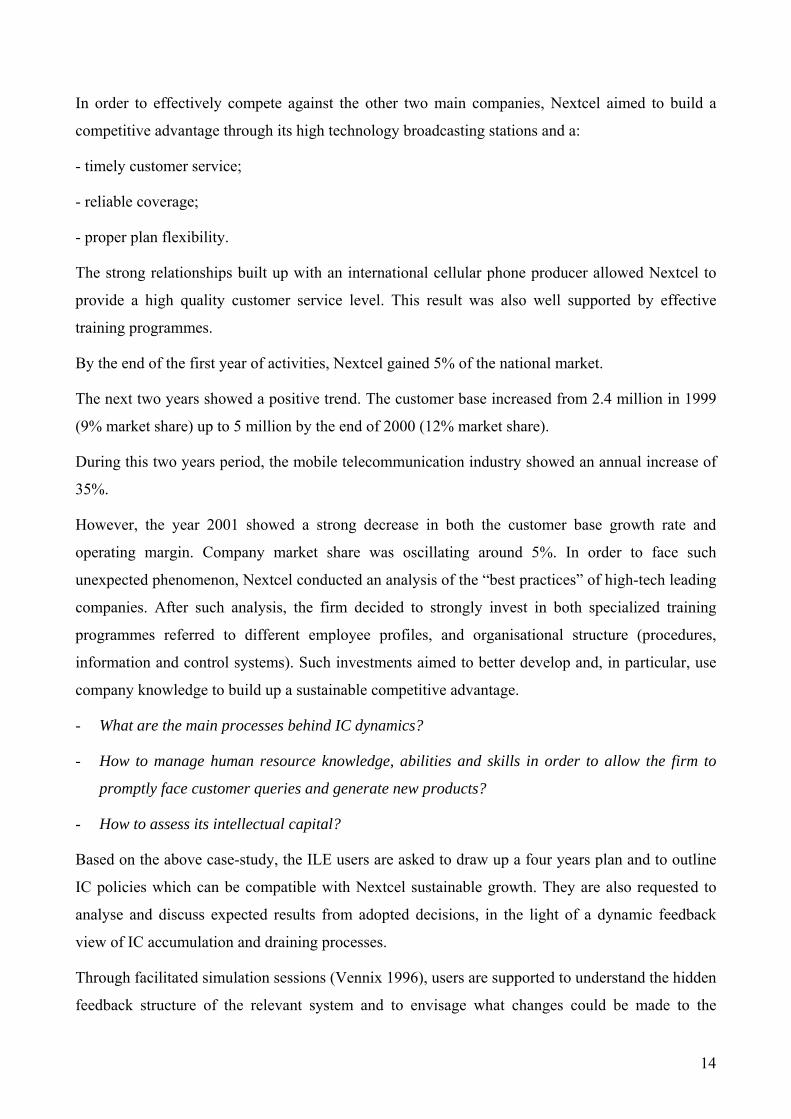
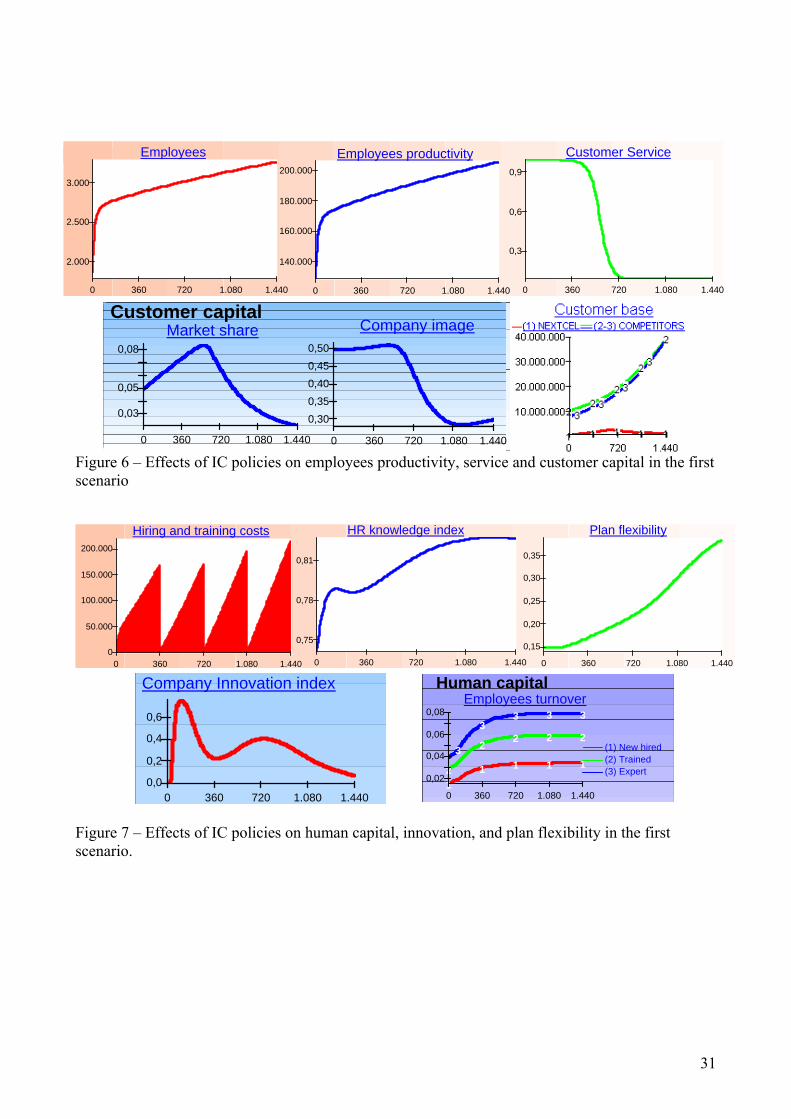
As shown in figure 6, in the first eighteen months, the company hiring policy would be able to
provide a reasonable customer service. However, from the second half of the simulation, customer
service significantly deteriorates. Consequently, both the company market share and image
dramatically decrease.
--- FIGURE 6 ABOUT HERE ---
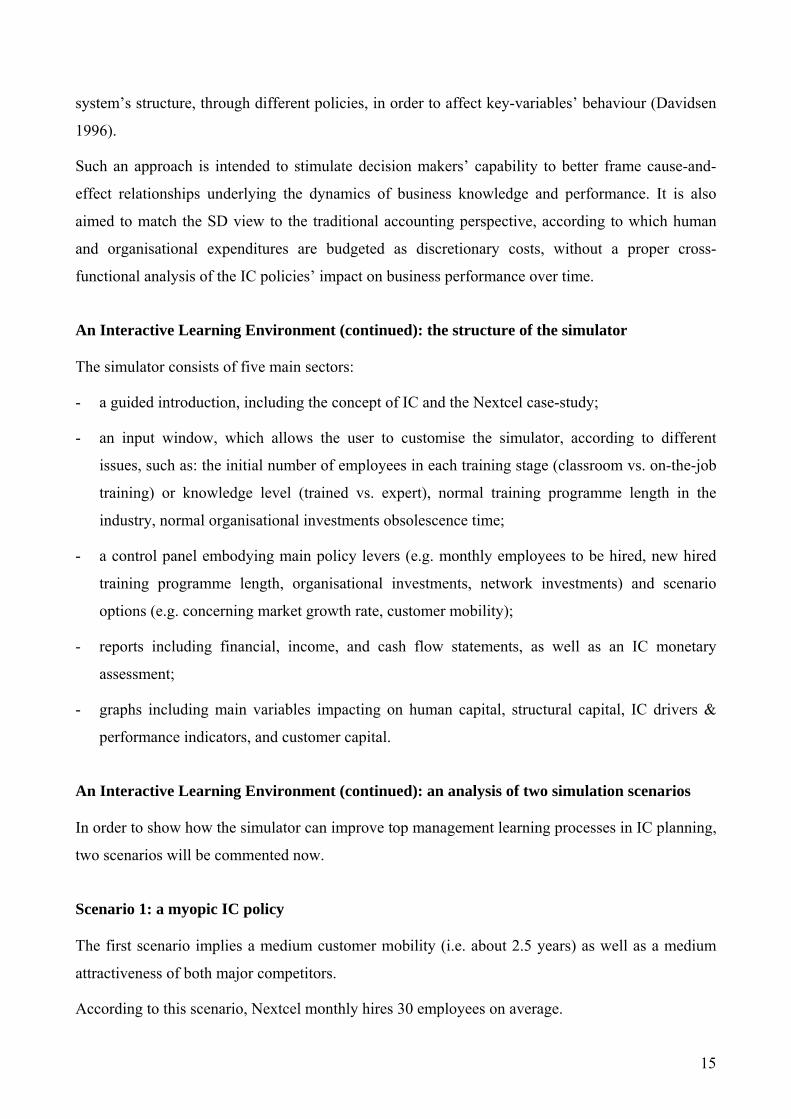
As shown in figure 7, although hiring and training expenditures are growing and organisational
investments are stable, this policy does not allow the company to foster a significant increase in
human resource knowledge.
Consequently, plan flexibility performance improvement is too weak to allow Nextcel to sustain its
market image.
Furthermore, the low training investments are a primary cause of turnover increase, due to
employees dissatisfaction.
--- FIGURE 7 ABOUT HERE ---
17
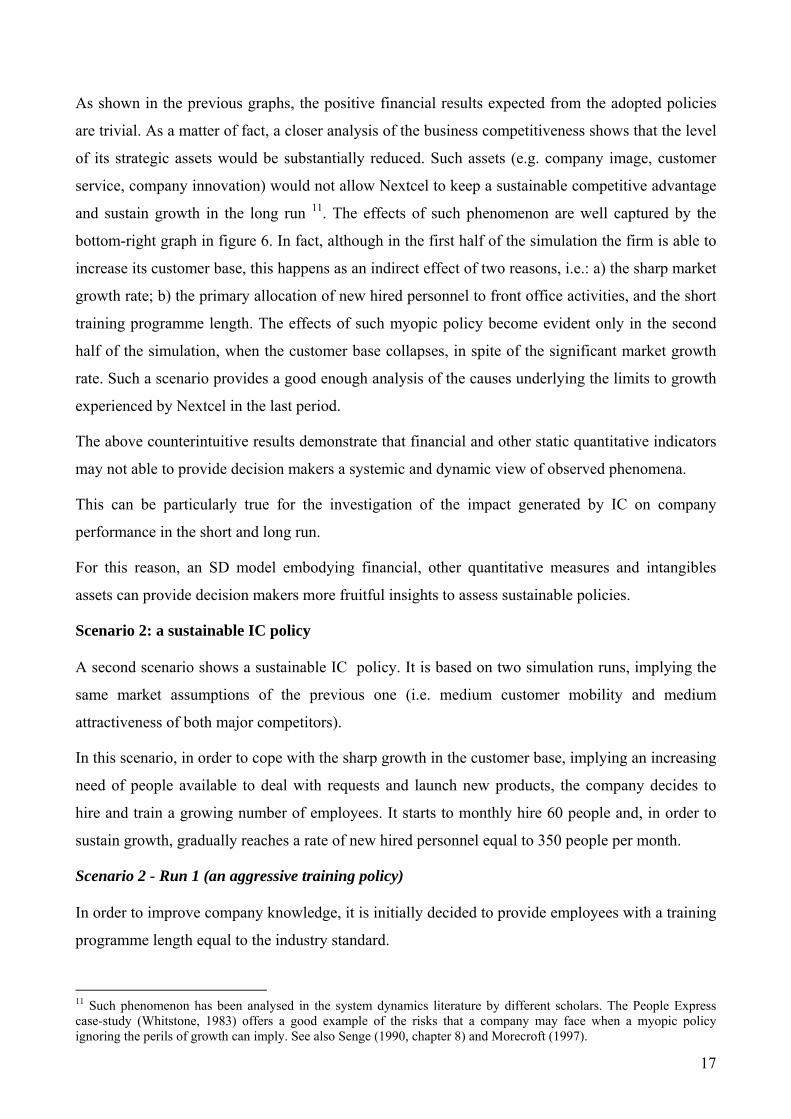
As shown in the previous graphs, the positive financial results expected from the adopted policies
are trivial. As a matter of fact, a closer analysis of the business competitiveness shows that the level
of its strategic assets would be substantially reduced. Such assets (e.g. company image, customer
service, company innovation) would not allow Nextcel to keep a sustainable competitive advantage
and sustain growth in the long run 11. The effects of such phenomenon are well captured by the
bottom-right graph in figure 6. In fact, although in the first half of the simulation the firm is able to
increase its customer base, this happens as an indirect effect of two reasons, i.e.: a) the sharp market
growth rate; b) the primary allocation of new hired personnel to front office activities, and the short
training programme length. The effects of such myopic policy become evident only in the second
half of the simulation, when the customer base collapses, in spite of the significant market growth
rate. Such a scenario provides a good enough analysis of the causes underlying the limits to growth
experienced by Nextcel in the last period.
The above counterintuitive results demonstrate that financial and other static quantitative indicators
may not able to provide decision makers a systemic and dynamic view of observed phenomena.
This can be particularly true for the investigation of the impact generated by IC on company
performance in the short and long run.
For this reason, an SD model embodying financial, other quantitative measures and intangibles
assets can provide decision makers more fruitful insights to assess sustainable policies.
Scenario 2: a sustainable IC policy A second scenario shows a sustainable IC policy. It is based on two simulation runs, implying the
same market assumptions of the previous one (i.e. medium customer mobility and medium
attractiveness of both major competitors).
In this scenario, in order to cope with the sharp growth in the customer base, implying an increasing
need of people available to deal with requests and launch new products, the company decides to
hire and train a growing number of employees. It starts to monthly hire 60 people and, in order to
sustain growth, gradually reaches a rate of new hired personnel equal to 350 people per month.
Scenario 2 - Run 1 (an aggressive training policy) In order to improve company knowledge, it is initially decided to provide employees with a training
programme length equal to the industry standard.
11 Such phenomenon has been analysed in the system dynamics literature by different scholars. The People Express case-study (Whitstone, 1983) offers a good example of the risks that a company may face when a myopic policy ignoring the perils of growth can imply. See also Senge (1990, chapter 8) and Morecroft (1997).
18
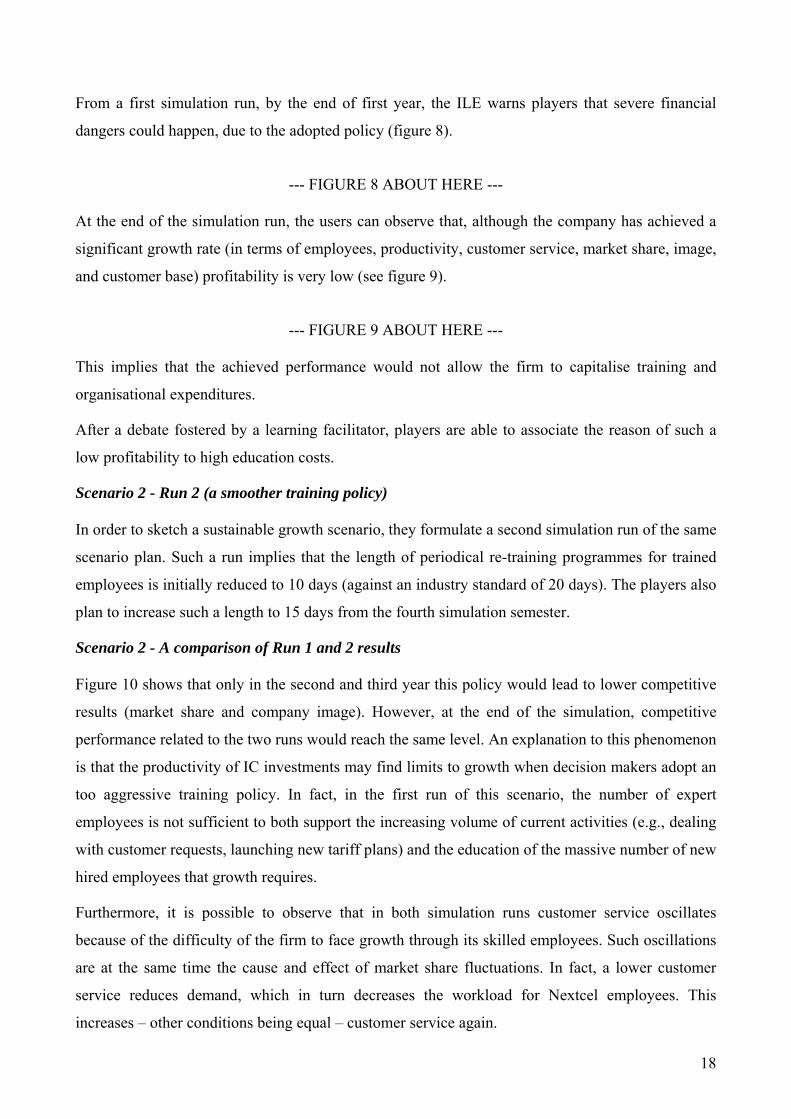
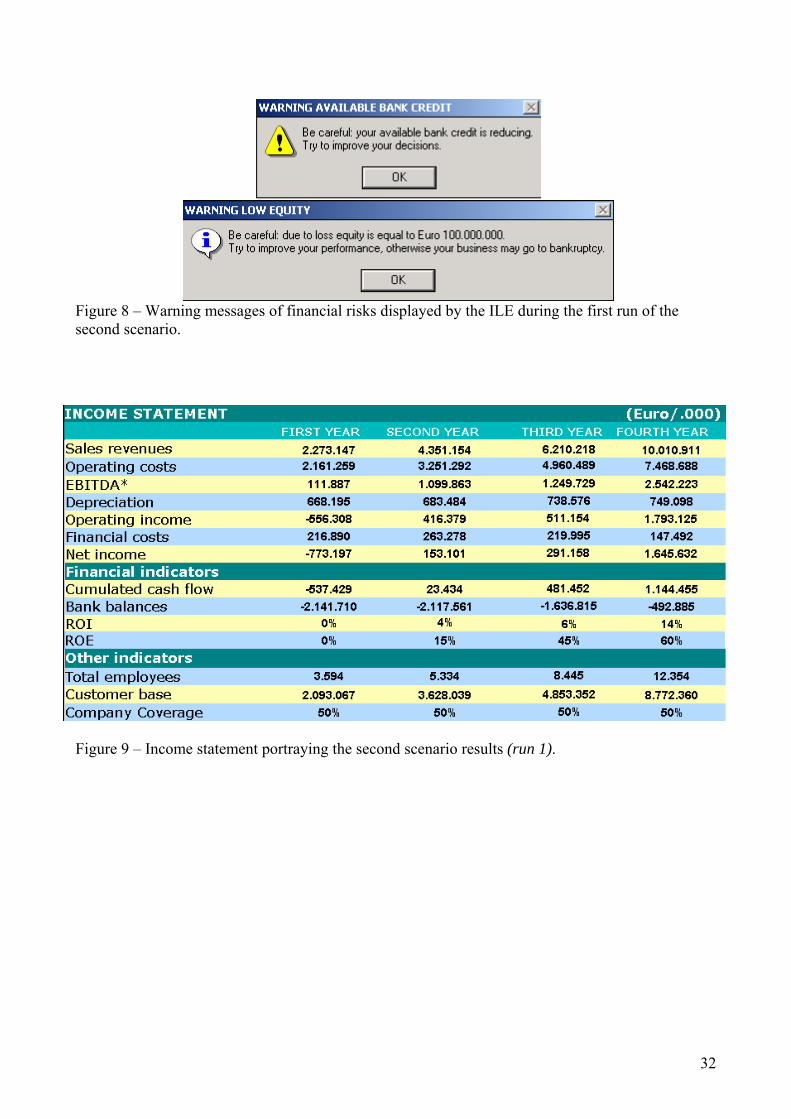
From a first simulation run, by the end of first year, the ILE warns players that severe financial
dangers could happen, due to the adopted policy (figure 8).
--- FIGURE 8 ABOUT HERE ---
At the end of the simulation run, the users can observe that, although the company has achieved a
significant growth rate (in terms of employees, productivity, customer service, market share, image,
and customer base) profitability is very low (see figure 9).
--- FIGURE 9 ABOUT HERE ---
This implies that the achieved performance would not allow the firm to capitalise training and
organisational expenditures.
After a debate fostered by a learning facilitator, players are able to associate the reason of such a
low profitability to high education costs.
Scenario 2 - Run 2 (a smoother training policy) In order to sketch a sustainable growth scenario, they formulate a second simulation run of the same
scenario plan. Such a run implies that the length of periodical re-training programmes for trained
employees is initially reduced to 10 days (against an industry standard of 20 days). The players also
plan to increase such a length to 15 days from the fourth simulation semester.
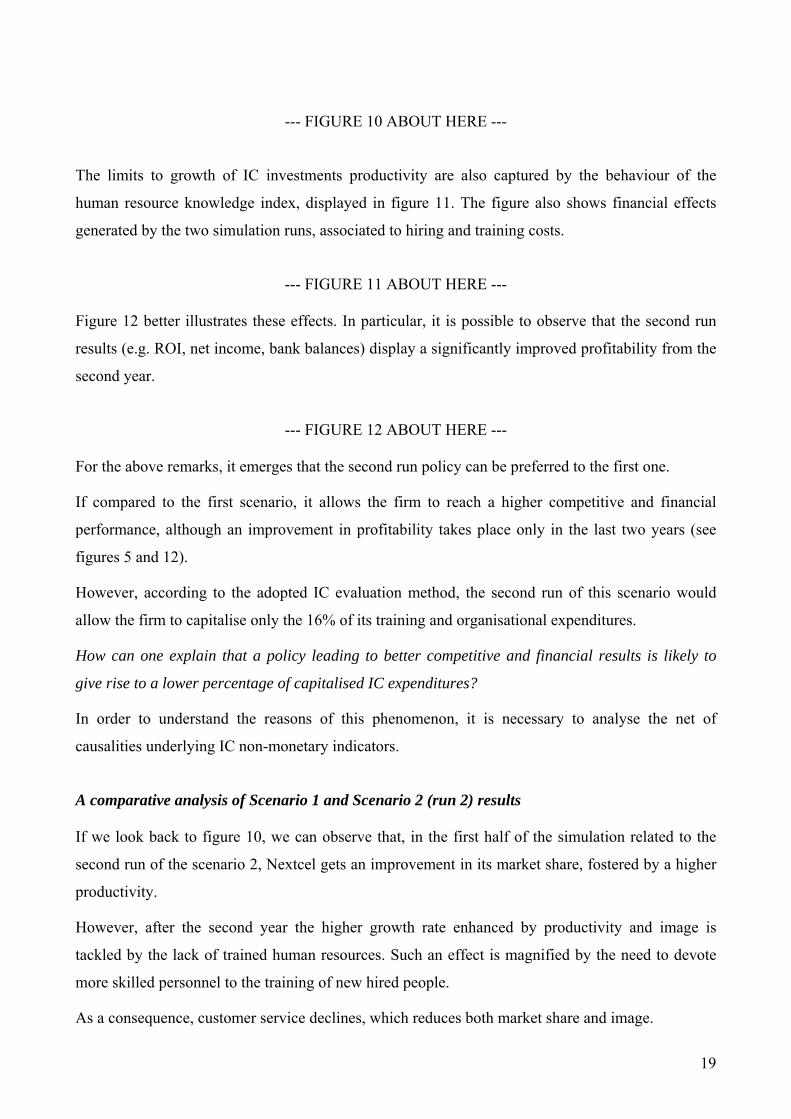
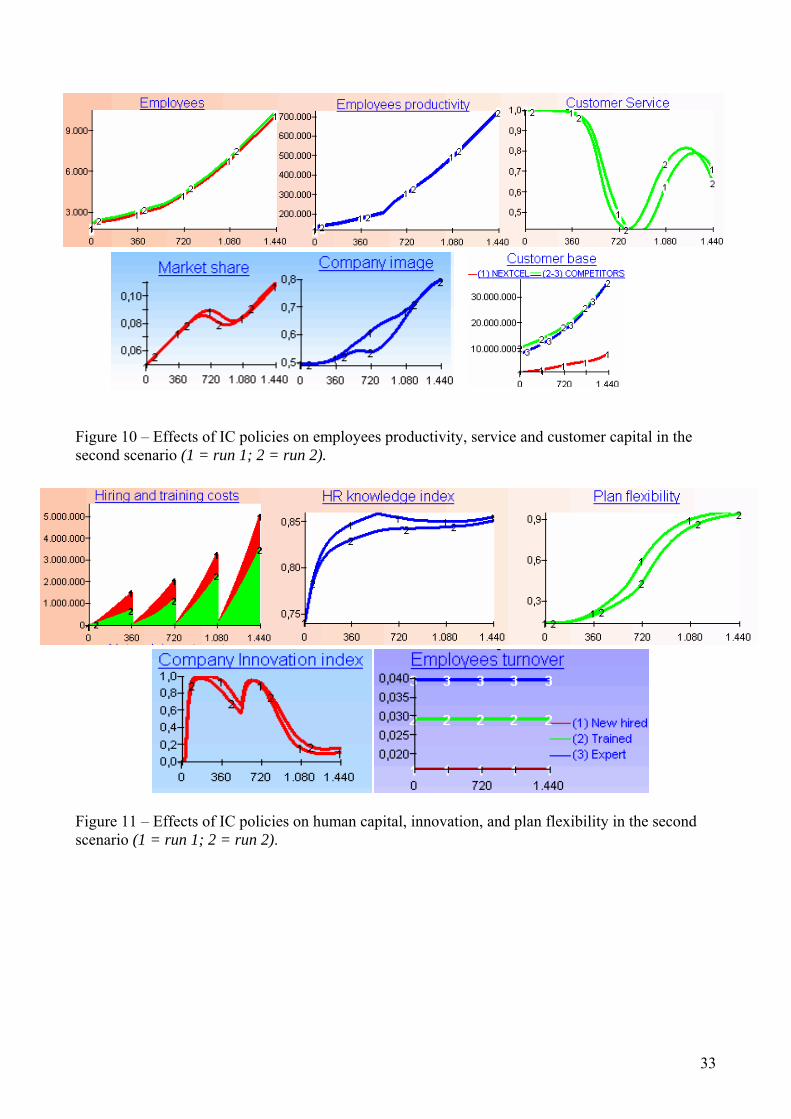
Scenario 2 - A comparison of Run 1 and 2 results Figure 10 shows that only in the second and third year this policy would lead to lower competitive
results (market share and company image). However, at the end of the simulation, competitive
performance related to the two runs would reach the same level. An explanation to this phenomenon
is that the productivity of IC investments may find limits to growth when decision makers adopt an
too aggressive training policy. In fact, in the first run of this scenario, the number of expert
employees is not sufficient to both support the increasing volume of current activities (e.g., dealing
with customer requests, launching new tariff plans) and the education of the massive number of new
hired employees that growth requires.
Furthermore, it is possible to observe that in both simulation runs customer service oscillates
because of the difficulty of the firm to face growth through its skilled employees. Such oscillations
are at the same time the cause and effect of market share fluctuations. In fact, a lower customer
service reduces demand, which in turn decreases the workload for Nextcel employees. This
increases – other conditions being equal – customer service again.
19
--- FIGURE 10 ABOUT HERE ---
The limits to growth of IC investments productivity are also captured by the behaviour of the
human resource knowledge index, displayed in figure 11. The figure also shows financial effects
generated by the two simulation runs, associated to hiring and training costs.
--- FIGURE 11 ABOUT HERE ---
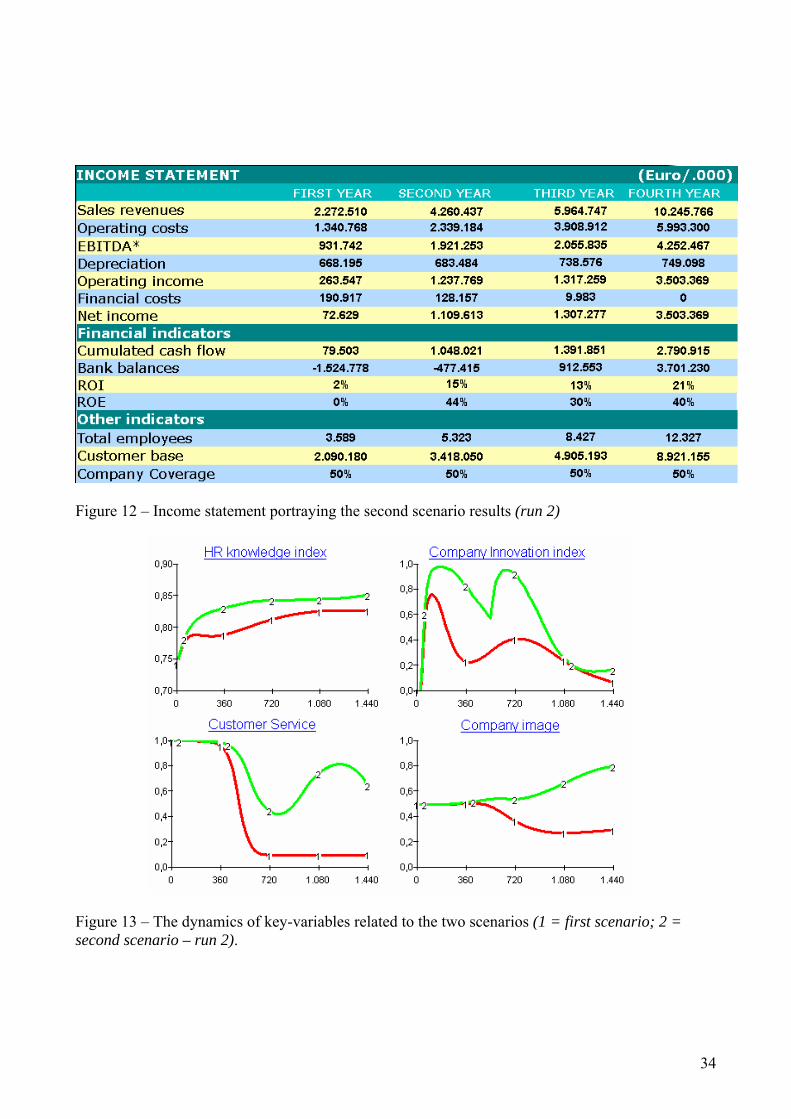
Figure 12 better illustrates these effects. In particular, it is possible to observe that the second run
results (e.g. ROI, net income, bank balances) display a significantly improved profitability from the
second year.
--- FIGURE 12 ABOUT HERE ---
For the above remarks, it emerges that the second run policy can be preferred to the first one.
If compared to the first scenario, it allows the firm to reach a higher competitive and financial
performance, although an improvement in profitability takes place only in the last two years (see
figures 5 and 12).
However, according to the adopted IC evaluation method, the second run of this scenario would
allow the firm to capitalise only the 16% of its training and organisational expenditures.
How can one explain that a policy leading to better competitive and financial results is likely to
give rise to a lower percentage of capitalised IC expenditures?
In order to understand the reasons of this phenomenon, it is necessary to analyse the net of
causalities underlying IC non-monetary indicators.
A comparative analysis of Scenario 1 and Scenario 2 (run 2) results If we look back to figure 10, we can observe that, in the first half of the simulation related to the
second run of the scenario 2, Nextcel gets an improvement in its market share, fostered by a higher
productivity.
However, after the second year the higher growth rate enhanced by productivity and image is
tackled by the lack of trained human resources. Such an effect is magnified by the need to devote
more skilled personnel to the training of new hired people.
As a consequence, customer service declines, which reduces both market share and image.
20
In order to counterbalance such phenomenon, the company progressively increases its labour force.
In the long run, this strategy allows Nextcel to increase service and recover market share.
As shown in figure 11, a balanced policy of growing investments in hiring/training and organisation
structure allows the firm to substantially increase its human resource knowledge.
As a result, both plan flexibility and company innovation grow. In particular, company innovation
reaches a higher level than in the first scenario, but eventually declines. In fact, the marginal
productivity of IC investments decreases as it reaches the potential maximum level that is
achievable from a given technology (see figures 7 and 11).
Figure 13 summarises main differences in key variables’ dynamics related to the two explored
scenarios.
--- FIGURE 13 ABOUT HERE ---
Concerning the first scenario, the above considerations suggest that although the performance
increase achieved in the four years gives a satisfactory yield, the endowment of strategic assets
would not be able to sustain future growth.
On the contrary, the second scenario (run 2) would imply:
- higher IC investments, leading to better financial results in the long run and lower yields;
- a higher endowment of strategic assets that would allow the firm to sustain future growth.
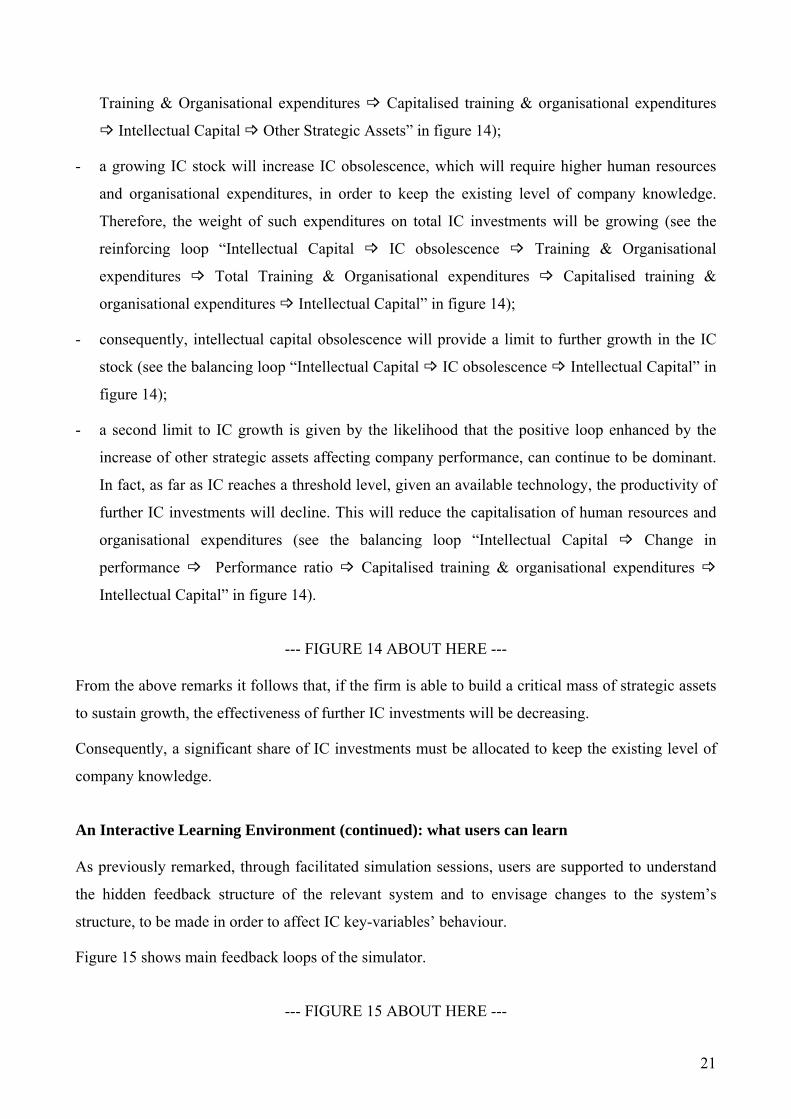
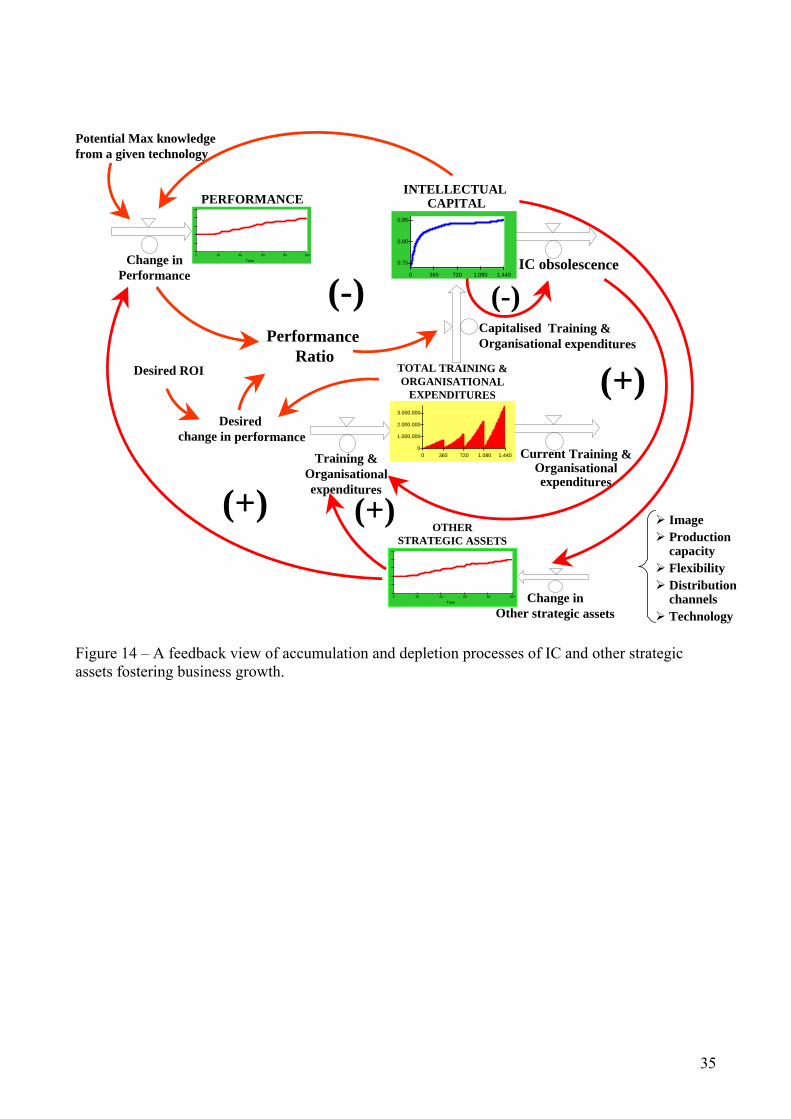
To summarise, the ILE embodying both SD and accounting models suggests the following remarks:
- the percentage of capitalised training and organisational expenditures refers to the flow of
results generated by investments done in a given time period. As a consequence, although a
small investment can give a satisfactory yield, it could not provide the firm the necessary stock
of strategic assets to sustain future growth;
- such investments in strategic assets will allow the company to achieve a performance increase.
This will make the capitalisation of training and organisational expenditures possible (see
reinforcing loop “Intellectual Capital Other Strategic Assets Change in performance
Performance Ratio Capitalised training & organisational expenditures Intellectual Capital”
in figure 14);
- the higher is the growth rate of the firm, the higher will be the stock of its strategic assets
needed to make growth sustainable. However, to build a higher level of strategic assets, larger
investments in IC will be necessary (see the reinforcing loop “Other Strategic Assets
21
Training & Organisational expenditures Capitalised training & organisational expenditures
Intellectual Capital Other Strategic Assets” in figure 14);
- a growing IC stock will increase IC obsolescence, which will require higher human resources
and organisational expenditures, in order to keep the existing level of company knowledge.
Therefore, the weight of such expenditures on total IC investments will be growing (see the
reinforcing loop “Intellectual Capital IC obsolescence Training & Organisational
expenditures Total Training & Organisational expenditures Capitalised training &
organisational expenditures Intellectual Capital” in figure 14);
- consequently, intellectual capital obsolescence will provide a limit to further growth in the IC
stock (see the balancing loop “Intellectual Capital IC obsolescence Intellectual Capital” in
figure 14);
- a second limit to IC growth is given by the likelihood that the positive loop enhanced by the
increase of other strategic assets affecting company performance, can continue to be dominant.
In fact, as far as IC reaches a threshold level, given an available technology, the productivity of
further IC investments will decline. This will reduce the capitalisation of human resources and
organisational expenditures (see the balancing loop “Intellectual Capital Change in
performance Performance ratio Capitalised training & organisational expenditures
Intellectual Capital” in figure 14).
--- FIGURE 14 ABOUT HERE ---
From the above remarks it follows that, if the firm is able to build a critical mass of strategic assets
to sustain growth, the effectiveness of further IC investments will be decreasing.
Consequently, a significant share of IC investments must be allocated to keep the existing level of
company knowledge.
An Interactive Learning Environment (continued): what users can learn As previously remarked, through facilitated simulation sessions, users are supported to understand
the hidden feedback structure of the relevant system and to envisage changes to the system’s
structure, to be made in order to affect IC key-variables’ behaviour.
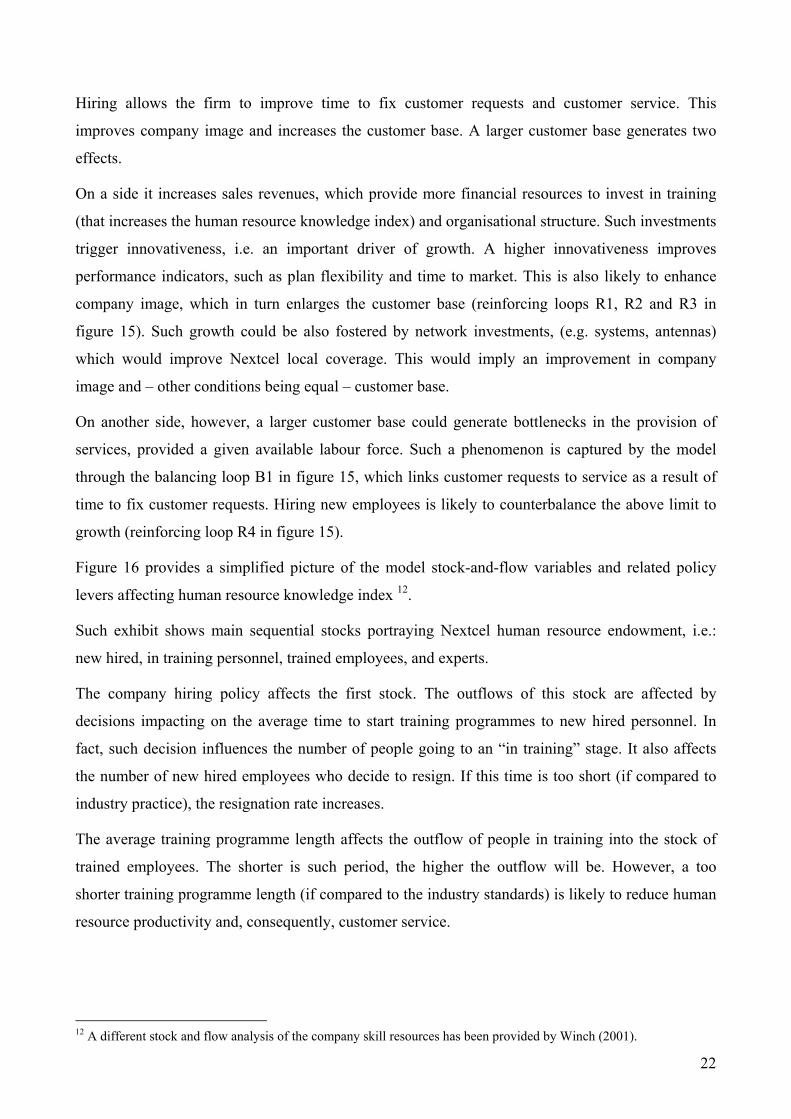
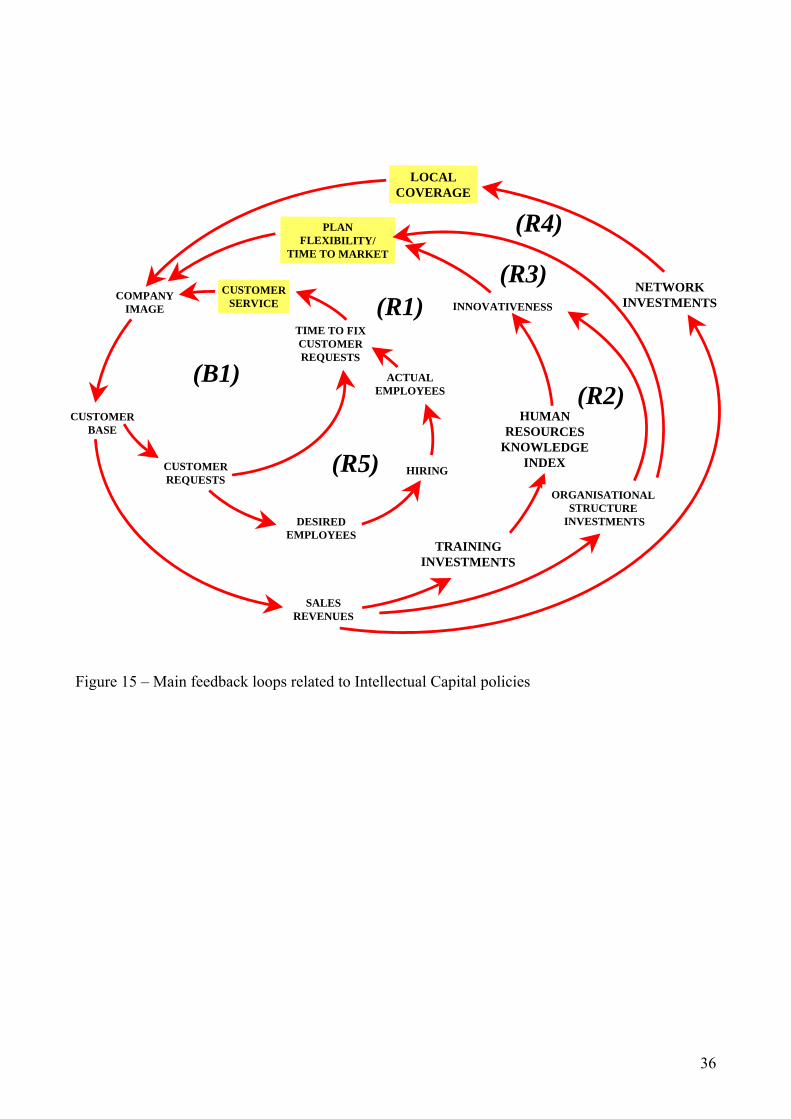
Figure 15 shows main feedback loops of the simulator.
--- FIGURE 15 ABOUT HERE ---
22
Hiring allows the firm to improve time to fix customer requests and customer service. This
improves company image and increases the customer base. A larger customer base generates two
effects.
On a side it increases sales revenues, which provide more financial resources to invest in training
(that increases the human resource knowledge index) and organisational structure. Such investments
trigger innovativeness, i.e. an important driver of growth. A higher innovativeness improves
performance indicators, such as plan flexibility and time to market. This is also likely to enhance
company image, which in turn enlarges the customer base (reinforcing loops R1, R2 and R3 in
figure 15). Such growth could be also fostered by network investments, (e.g. systems, antennas)
which would improve Nextcel local coverage. This would imply an improvement in company
image and – other conditions being equal – customer base.
On another side, however, a larger customer base could generate bottlenecks in the provision of
services, provided a given available labour force. Such a phenomenon is captured by the model
through the balancing loop B1 in figure 15, which links customer requests to service as a result of
time to fix customer requests. Hiring new employees is likely to counterbalance the above limit to
growth (reinforcing loop R4 in figure 15).
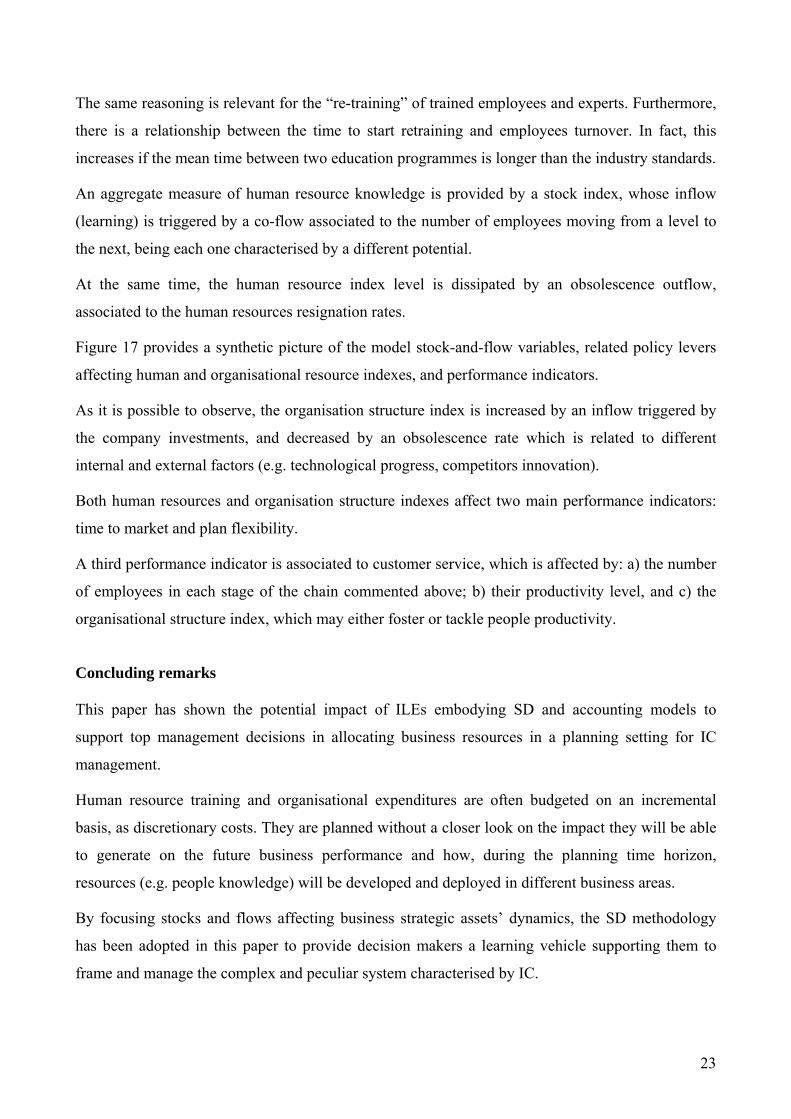
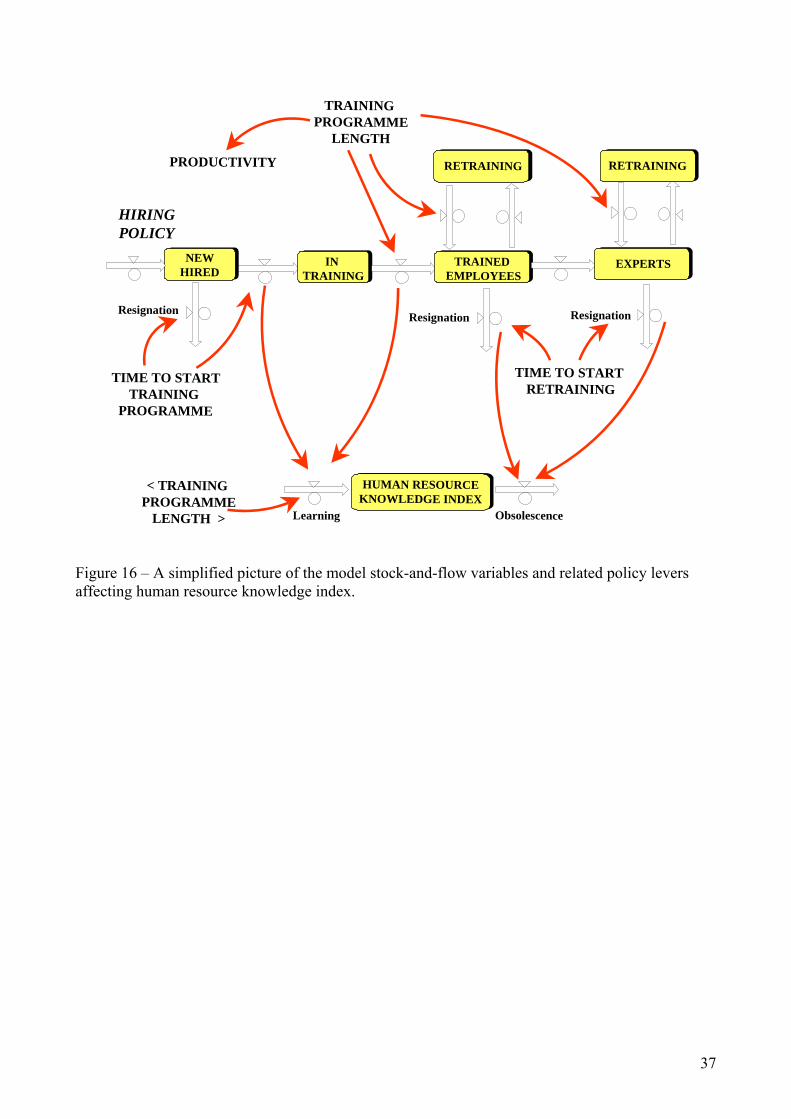
Figure 16 provides a simplified picture of the model stock-and-flow variables and related policy
levers affecting human resource knowledge index 12.
Such exhibit shows main sequential stocks portraying Nextcel human resource endowment, i.e.:
new hired, in training personnel, trained employees, and experts.
The company hiring policy affects the first stock. The outflows of this stock are affected by
decisions impacting on the average time to start training programmes to new hired personnel. In
fact, such decision influences the number of people going to an “in training” stage. It also affects
the number of new hired employees who decide to resign. If this time is too short (if compared to
industry practice), the resignation rate increases.
The average training programme length affects the outflow of people in training into the stock of
trained employees. The shorter is such period, the higher the outflow will be. However, a too
shorter training programme length (if compared to the industry standards) is likely to reduce human
resource productivity and, consequently, customer service.
12 A different stock and flow analysis of the company skill resources has been provided by Winch (2001).
23
The same reasoning is relevant for the “re-training” of trained employees and experts. Furthermore,
there is a relationship between the time to start retraining and employees turnover. In fact, this
increases if the mean time between two education programmes is longer than the industry standards.
An aggregate measure of human resource knowledge is provided by a stock index, whose inflow
(learning) is triggered by a co-flow associated to the number of employees moving from a level to
the next, being each one characterised by a different potential.
At the same time, the human resource index level is dissipated by an obsolescence outflow,
associated to the human resources resignation rates.
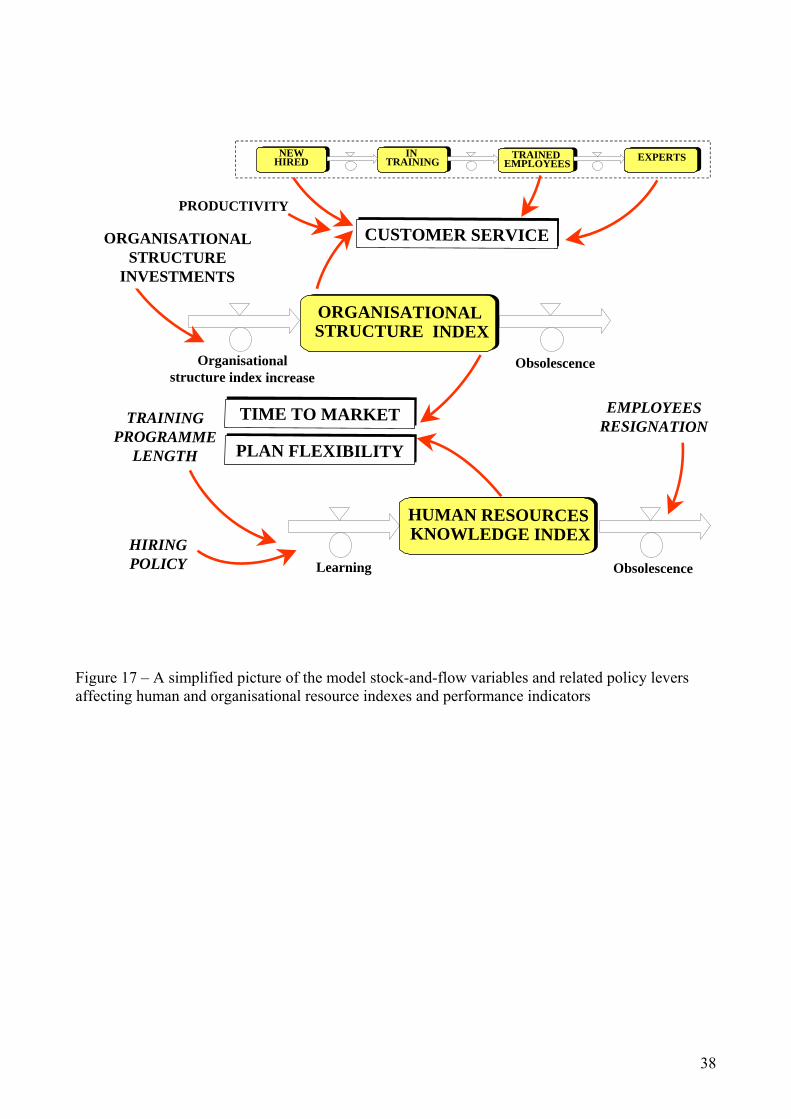
Figure 17 provides a synthetic picture of the model stock-and-flow variables, related policy levers
affecting human and organisational resource indexes, and performance indicators.
As it is possible to observe, the organisation structure index is increased by an inflow triggered by
the company investments, and decreased by an obsolescence rate which is related to different
internal and external factors (e.g. technological progress, competitors innovation).
Both human resources and organisation structure indexes affect two main performance indicators:
time to market and plan flexibility.
A third performance indicator is associated to customer service, which is affected by: a) the number
of employees in each stage of the chain commented above; b) their productivity level, and c) the
organisational structure index, which may either foster or tackle people productivity.
Concluding remarks This paper has shown the potential impact of ILEs embodying SD and accounting models to
support top management decisions in allocating business resources in a planning setting for IC
management.
Human resource training and organisational expenditures are often budgeted on an incremental
basis, as discretionary costs. They are planned without a closer look on the impact they will be able
to generate on the future business performance and how, during the planning time horizon,
resources (e.g. people knowledge) will be developed and deployed in different business areas.
By focusing stocks and flows affecting business strategic assets’ dynamics, the SD methodology
has been adopted in this paper to provide decision makers a learning vehicle supporting them to
frame and manage the complex and peculiar system characterised by IC.
24
The ILE that has been analysed has portrayed a “scorecard” providing a quali-quantitative
framework for IC monetary and non-monetary assessment.
The two simulation scenarios commented in the last section of the paper, suggest how managing IC
only based on a monetary and static approach is likely to lead decision makes to a myopic resource
allocation in the planning process. This may also happen when a qualitative analysis of IC
indicators is not supported by a dynamic view of the processes driving the accumulation and
depletion of strategic assets.
Further empirical research will be necessary to experiment the contribution our methodology and
the ILE are likely to give to top managers’ learning processes, in both educational and planning
contexts. We believe that such analysis will give us more insights for both including in the ILE
more relevant issues (or re-focusing existing ones) and developing new ILEs based on case-studies,
aimed to foster decision makers’ learning on other key-problems related to IC management.
25
References Amit R. – Schoemaker P. 1993, Strategic Assets and Organizational Rent, in: Strategic Management Journal, vol. 14, p. 33-46. Bianchi C. – Bivona E. 2002, Opportunities and Pitfalls related to E-commerce Strategies in Small-Medium Firms: A System Dynamics Approach, in: Bianchi C. (edited by) Systems Thinking and System Dynamics in Small-Medium Enterprises, System Dynamics Review Special Issue, Vol. 18, n. 3, p. 403-429. Brooking A., Intellectual Capital, International Thompson Business Press, London. Caplan E. – Landekich S. 1974, Human Resource Accounting: Past, Present and Future, National Association of Accountants, New York Coda V. 1984, Evaluation of the Entrepreneurial Formula, Economia Aziendale Review, vol.3, n. 1, p. 1-26. Coda V. 1987, Physiology and Pathology of Enterprise Finalism, Economia Aziendale Review, vol.6, n. 6, p. 255-281. Darling M.S. 1996. Building the Knowledge Organization, Business Quarterly, vol. 61, Winter, p. 61-66 Davidsen P. 2000, Issues in the Design and Use of System-Dynamics-Based Interactive Learning Environments, in: Davidsen P. – Spector M. – Morgan K. (eds.), Simulation & Gaming, Special Issue on: “System Dynamics and Interactive Learning Environments”, part 1, vol. 31, n. 2, p. 170-177. Davidsen P. 1996. Educational Features of The System Dynamics Approach to Modeling and Simulation, Journal of Structural Learning, vol 12, n. 4, p. 269-290. Dierickx I. – Cool K., 1989,Asset Stock Accumulation and Sustainability of Competitive Advantage, in: Management Science, vol. 35, n. 12, p. 1504-1511. Edvinson L. – Malone M., 1997,Intellectual Capital, Harper business, New York. Flamholtz E., 1985. Human Resource Accounting, Dickenson, Encino, California. Friedman A. – Lev B. 1974, A Surrogate Measure for the Firm’s Investment in Human Capital, Journal of Accounting Research, Autumn, 1974. Johnson B. – Kleiner B. H., 1987, Human Asset Accounting: Where are we Today?, International Journal of Manpower, vol. 8, p. 3-4. Joia L. 2000, Measuring Intangible Corporate Assets. Linking Business Strategy with Intellectual Capital, Journal of Intellectual Capital, vol. 1, n.1, p. 68-84. Kennedy F., 1998, Intellectual Capital in Valuing Intangible Assets, Team Performance Management, vol. 4, n. 4, p. 121-137. Kogut B. and Zander U., 1992, Knowledge of the firm, combinative capabilities, and the replication of technology, in Organization Science, vol.3, n.3, p. 383-397. Mahoney J. – Pandian R., 1992. The Resource-based View Within the Conversation of Strategic Management, in: Strategic Management Journal, vol. 13, p. 363-380. Maier F. – Grossler A. 2000, What Are we Talking About? A Taxonomy of Computer Simulations to Support Learning, System Dynamics Review, vol. 16, n. 2, p. 135-148. Matthis R. – Jackson J., 1984, Personnel/Human Resource Management, West Publ., St. Paul. Morecroft J., 1997. The Rise and Fall of People Express: A Dynamic Resource-Based View., in: Barlas Y. – Diker V. – Polat S. (eds.), Proceedings of the International System Dynamics Conference, Istanbul, p. 579-586. Morecroft J. – Glucksman M. 1998. Managing Metamorphosis, The McKinsey Quarterly, n. 2, p. 118-129. Morecroft J., 1994. Executive Knowledge, Models, and Learning, in: Morecroft J. – Sterman J. (eds.), Modeling for Learning Organizations, Portland, Productivity Press, p. 3-28. Nelson R. – Winter S. 1982. An Evolutionary Theory of Economic Change, Belknap Press, Cambridge.
26
Nonaka I. 1991, The knowledge creating company, Harvard Business Review, Nov-Dec, pp. 96-104. Ornati O. – Giblin E. – Floersch R. 1982, The Personnel Department. Its Staffing and Budgeting, AMA, New York, p. 14. Prahalad C. - Bettis R., 1986. The Dominant Logic: A New Linkage Between Diversity and Performance, in: Strategic Management Journal, n. 7, p. 485-501 Quinn J.B. - Anderson P. and Finkelstein S. 1996, Managing professional intellect: Making the most and the best, in Harvard Business Review, March-April, p. 71-80. Reilly R. – Schweihs R.. 1998, Valuing Intangible Assets, Mc Graw-Hill, New York. Senge P. 1990, The Fifth Discipline, Century Business, London. Sterman J. 1992, Flight Simulators for Management Education, OR/MS Today, October, p. 40-44. Stewart T. 1997, Intellectual Capital, Doubleday, New York. Sveiby K., 1997. The New Organizational Wealth, Berrett-Koehler, San Francisco. Teece D. – Pisano G. – Shuen A. 1997. Dynamic Capabilities and Strategic Management, in: Strategic Management Journal, vol. 18, p. 509-533. Tyson S. – Fell A., 1986. Evaluating the Personnel Function, Hutchinson, London, chapter 6. Tobin J. 1969. A General Equilibrium Approach to Monetary Theory, Journal of Money, Credit and Banking, vol. 1, p. 15-29. Vennix J. 1996. Group Model Building, Wiley, Chichester. Wernerfelt B. 1984. A Resource-based View of the Firm, in: Strategic Management Journal, vol. 5, p. 171-180 Whitstone D., 1983. People Express (A), Harvard Business School Case-study, doc. 483-103 Winch G., 2001, Management of the “Skills Inventory” in Times of Major Change, System Dynamics Review, vol. 17, n. 2, p. 151-159.
27
Figures
Figure 1 – Strategic assets accumulation and depletion
Figure 2 – Intellectual and other strategic assets accumulation and depletion processes underlying business growth
28
Figure 3 – The building blocks of a scorecard for IC quali-quantitative assessment
Monetary investments
in intellectualcapital
TIME TO FIXCUSTOMER REQUESTS
POLICY LEVERSPOLICY LEVERS
INNOVATIVE-NESS
TRAINING
ORGANISA-TIONAL
STRUCTURE
Change in performance
INFORMATION SYSTEMS
Kno
w-h
ow -
Kno
w-w
hat -
Kno
w-w
hy
Know-how - Know-what - Know-whyFinancial value
HIRING
DRIVERSDRIVERS
INDICATORSINDICATORS
PERFORMANCEPERFORMANCE
PERSONNEL
RESOURCESRESOURCES
MONETARY INVESTMENTS
TURNOVER
Inte
llect
ual C
apita
lm
onet
ary
asse
ssm
ent
Inte
llect
ual C
apita
lno
n-m
onet
ary
asse
ssm
ent
Org
anis
atio
nal
Stru
ctur
e in
dex
Hum
an R
esou
rces
kn
owle
dge
inde
x
OPERATINGINCOME
COMPANY IMAGE
ROI
MARKET SHAREPLAN
FLEXIBILITY
CUSTOMERSERVICE
TIME TO MARKET
29
Figure 4 – Intellectual capital dynamics portrayed by the ILE
IntellectualCapital
obsolescenceTime
0 20 40 60 80 100Change inPerformance
PERFORMANCE
CurrentTraining &
Organisational expenditures
PerformanceRatio
Desiredchange in performance
Desired ROI
(-)
Potential Max knowledgefrom a given technology
Capitalised Training & Organisational expenditures
INTELLECTUALCAPITAL
0 360 720 1.080 1.440
0,75
0,80
0,85
0 360 720 1.080 1.4400
1.000.000
2.000.000
3.000.000
Training &Organisationalexpenditures
TOTAL TRAINING &ORGANISATIONAL
EXPENDITURES
(+)
30
Figure 5 – Main accounting reports embodied by the ILE and portraying the first scenario results
31
Figure 6 – Effects of IC policies on employees productivity, service and customer capital in the first scenario
Figure 7 – Effects of IC policies on human capital, innovation, and plan flexibility in the first scenario.
Employees Customer Service
0 360 720 1.080 1.440
0,3
0,6
0,9
0 360 720 1.080 1.440
2.000
2.500
3.000
0 360 720 1.080 1.440
140.000
160.000
180.000
200.000
Employees productivity
0 360 720 1.080 1.440
0,03
0,05
0,08Market share
0 360 720 1.080 1.440
0,300,350,400,450,50
Company imageCustomer capital
0 360 720 1.080 1.440
0,75
0,78
0,81
0 360 720 1.080 1.440
0,15
0,20
0,25
0,30
0,35
Plan flexibilityHiring and training costs
0 360 720 1.080 1.4400
50.000
100.000
150.000
200.000
HR knowledge index
Employees turnover
0 360 720 1.080 1.440
0,02
0,04
0,06
0,08
12
3
1
2
3
1
2
3
1
2
3
1
2
3
(1) New hired(2) Trained(3) Expert
Human capital
112
Company Innovation index
0 360 720 1.080 1.4400,0
0,2
0,4
0,6
32
Figure 8 – Warning messages of financial risks displayed by the ILE during the first run of the second scenario.
Figure 9 – Income statement portraying the second scenario results (run 1).
33
Figure 10 – Effects of IC policies on employees productivity, service and customer capital in the second scenario (1 = run 1; 2 = run 2).
Figure 11 – Effects of IC policies on human capital, innovation, and plan flexibility in the second scenario (1 = run 1; 2 = run 2).
34
Figure 12 – Income statement portraying the second scenario results (run 2)
Figure 13 – The dynamics of key-variables related to the two scenarios (1 = first scenario; 2 = second scenario – run 2).
35
Figure 14 – A feedback view of accumulation and depletion processes of IC and other strategic assets fostering business growth.
Time0 20 40 60 80 100Change in
Performance
Current Training & Organisational expenditures
PerformanceRatio
Capitalised Training & Organisational expenditures
Desiredchange in performance
Desired ROI
Time0 20 40 60 80 100 Change in
Other strategic assets
OTHERSTRATEGIC ASSETS
Training &Organisationalexpenditures
TOTAL TRAINING &ORGANISATIONAL
EXPENDITURES (+)
(+)(+)ImageProductioncapacityFlexibilityDistributionchannelsTechnology
IC obsolescence
(-)(-)
Potential Max knowledgefrom a given technology
0 360 720 1.080 1.440
0,75
0,80
0,85
PERFORMANCEINTELLECTUAL
CAPITAL
0 360 720 1.080 1.4400
1.000.000
2.000.000
3.000.000
36
Figure 15 – Main feedback loops related to Intellectual Capital policies
NETWORKINVESTMENTS
LOCALCOVERAGE
TRAININGINVESTMENTS
COMPANYIMAGE
CUSTOMERBASE
SALESREVENUES
HUMANRESOURCES
KNOWLEDGEINDEX
INNOVATIVENESS
PLANFLEXIBILITY/
TIME TO MARKET
CUSTOMERREQUESTS
DESIREDEMPLOYEES
HIRING
ORGANISATIONALSTRUCTURE
INVESTMENTS
ACTUALEMPLOYEES
TIME TO FIXCUSTOMERREQUESTS
CUSTOMERSERVICE
(R2)
(R3)(R1)
(B1)
(R4)
(R5)
37
Figure 16 – A simplified picture of the model stock-and-flow variables and related policy levers affecting human resource knowledge index.
IN TRAINING
NEWHIRED
HIRINGPOLICY
TRAINED EMPLOYEES
RETRAINING
EXPERTS
TRAINING PROGRAMME
LENGTH
ResignationResignation
TIME TO STARTTRAINING
PROGRAMME
Resignation
TIME TO STARTRETRAINING
RETRAINING
HUMAN RESOURCEKNOWLEDGE INDEX
Learning Obsolescence
< TRAINING PROGRAMME
LENGTH >
PRODUCTIVITY
38
Figure 17 – A simplified picture of the model stock-and-flow variables and related policy levers affecting human and organisational resource indexes and performance indicators
PLAN FLEXIBILITYPLAN FLEXIBILITY
Obsolescence
TRAINING PROGRAMME
LENGTH
HUMAN RESOURCES KNOWLEDGE INDEX
LearningHIRING POLICY
Organisationalstructure index increase
Obsolescence
ORGANISATIONALSTRUCTURE
INVESTMENTS
IN TRAINING
TRAINED EMPLOYEES EXPERTSNEW
HIRED
TIME TO MARKETTIME TO MARKET EMPLOYEESRESIGNATION
CUSTOMER SERVICECUSTOMER SERVICE
ORGANISATIONAL STRUCTURE INDEX
PRODUCTIVITY


![MY - Cettina Bivona lifestyle newsletter [ 2 ]](https://img.pdfslide.net/doc/110x75/568c36b41a28ab0235990d8a/my-cettina-bivona-lifestyle-newsletter-2-.jpg)