Embed Size (px)
Citation preview

CALIFORNIA DEBT & INVESTMENT ADVISORY COMMISSION
MANAGING INTEREST RATE RISK IN A FIXED INCOME PORTFOLIO
SEPTEMBER 2008 ▪ CDIAC #08-11
1
INTRODUCTION California statute requires the governing body of local agencies investing public funds to act as trustees subject to a “prudent investor standard.”1 To meet this standard, investment officers must both (a) have knowledge about investing (“familiarity with [such] matters”) and (b) manage the funds in a responsible manner (“to safeguard the principal and maintain the liquidity needs of the agency”). By way of example, consider a hypothetical county investment portfolio (see Figure 1). The county held a combination of U.S. Treasury, federal agency and money market securities with an average maturity of about 9 months. The county’s securities pay interest periodically, and return principal either at the maturity or call date of the security or, in the case of LAIF and money market mutual funds, when the county decides to withdraw the funds. The county’s portfolio managers must decide which types of securities to purchase and how long to hold them. They condition their decisions on meeting statutory requirements and the agency’s investment policy, its financial condition and investment needs, and tolerance for risk.
FIGURE 1 COUNTY INVESTMENT PORTFOLIO (AS OF 6/30/08)
(DOLLARS IN THOUSANDS)
Type of InvestmentFair Market
ValueWeighted Average Maturity in Years
U.S. agency securities $525,920 1.21U.S. Treasury securities $302,165 0.66Negotiable certificates of deposit $217,904 0.38Money market mutual funds $112,955 0.00Commercial paper $106,005 0.10Local Agency Investment Fund $98,383 0.50
Total $1,363,332 0.72 There are various risks associated with the investment of public funds. One of the primary risks local agency investment officers must address is

“interest rate risk.”2 Interest rate risk (also known as “market risk”) is the risk that the market value of a security or of the portfolio will change as the general level of interest rates changes over time. Because “fixed income securities” (i.e., securities that provide scheduled interest payments on a periodic basis and return principal invested upon maturity) comprise a significant component of local agency portfolios and the value of these securities is directly affected by interest rate changes, local agencies must develop strategies for identifying and managing interest rate risk for their portfolios. The goal of this issue brief is to describe broadly the nature of interest rate risk and ways local governments can successfully manage its effects on their fixed income portfolios. The brief begins by describing key concepts and components of interest rate risk, in particular, the inverse relationship between price and yield of a fixed income security. Using this information, the issue brief then provides background on the components and types of interest rate risk, methods of measuring it, and an overview of common investment strategies and portfolio structures available to manage it. The brief concludes with an administrative checklist for assessing and managing interest rate risk exposure. INTEREST RATE RISK AND ITS EFFECT ON THE VALUE OF FIXED INCOME SECURITIES Interest rate risk affects a fixed income portfolio because changes in interest rates directly influence the price or value of securities held. Some of the ways that interest rate changes affect bond prices include:
• The price of a bond is inversely related to its yield; therefore, when yields rise, bond prices fall, and when yields fall, bond prices rise.
• The smaller the coupon on a bond, the greater will be the
change in price for a given change in the general level of interest rates.
• The greater the term or “duration” (which measures the
investment’s price sensitivity to interest rate changes) of a
2

3
security or portfolio, the greater will be the change in price for a given change in the general level of interest rates.
Expanding on this last point, a particular investment’s term to maturity affects a portfolio’s weighted average maturity or duration and, thus, its exposure to interest rate risk. More particularly,
• Figure 2 illustrates the effect of investment in securities with greater exposure to interest rate risk. It displays the growth of $1.00 for three portfolios of U.S. Treasury securities of differing average maturities or durations. Observe that, over this period of time, the 0-5 year Treasury portfolio, which has an average maturity of approximately 2.5 years, grows from $1.00 in value to over $1.60; the 0-3 Year Treasury portfolio, average maturity of approximately 1 year, grows to just over $1.50, while the 3-month Treasury bill portfolio grows the least—to approximately $1.44.
FIGURE 2
THE HIGHER THE DURATION, THE GREATER THE EXPECTED GROWTH
$1.00
$1.10
$1.20
$1.30
$1.40
$1.50
$1.60
$1.70
Jun-98Dec-98
Jun-99Dec-99
Jun-00Dec-00
Jun-01Dec-01
Jun-02Dec-0
2Jun-03
Dec-03Jun-04
Dec-04Jun-05
Dec-05Jun-06
Dec-06Jun-07
Dec-07Jun-08
Gro
wth
in m
illio
ns
3 mo T-Bill Benchmark0-3 Year Treasury Benchmark0-5 Year Treasury Benchmark
• Figure 3 illustrates the degree of price volatility associated
with interest rate fluctuations. It graphs the change in market value of each portfolio from quarter to quarter. The

4
CPN Bond Price =
Definitions:CPN = coupon paymentP
i = interest rate or required yield
n Σ t=1
= value at maturity or par value
(1+i)t+ P
(1+i)n
n = number of paymentst = time period
Coupon Cash Flows
Principal Repayment
FIGURE 4 - BOND PRICING FORMULA
longer the average maturity of a portfolio, the more its market value will change from quarter to quarter as the general level of interest rates changes.
FIGURE 3
THE HIGHER THE DURATION, THE GREATER THE PRICE VOLATILITY
Quarterly Change in Value
-1.50%-1.00%-0.50%0.00%0.50%1.00%1.50%2.00%
Jun-98
Dec-98
Jun-99
Dec-99
Jun-00
Dec-00
Jun-01
Dec-01
Jun-02
Dec-02
Jun-03
Dec-03
Jun-04
Dec-04
Jun-05
Dec-05
Jun-06
Dec-06
Jun-07
Dec-07
Jun-08Q
uart
erly
Tot
al R
ate
of R
etur
n
3 mo T-Bill Benchmark 0-3 Year Treasury Benchmark0-5 Year Treasury Benchmark
THE RELATIONSHIP BETWEEN BOND PRICING AND YIELD Before detailing the types of interest rate risk, consider some conceptual concerns and a few terms. To understand how interest rate risk affects the fixed income portfolio, it is important to understand the relationship between bond prices and yield. The price of a bond is equal to the present value of its “cash flows”, including periodic coupon payments and repayment of the principal (see Figure 4). The principal repayment amount is generally the bond’s face value. The calculation of the bond’s price involves discounting each

coupon cash flow and the principal repayment by the yield to maturity3 on the bond. Using the equation in Figure 4, a bond’s yield to maturity is the rate (i) that equates its current bond price to the present value of subsequent principal and coupon cash flows.4 For fixed income securities, as the yield to maturity rises in response to an increase in the general level of interest rates, the value of the bond declines. For example, if the yield to maturity on a five percent fixed coupon bond purchased at par increases to six percent due to a change in the general level of interest rates, the price of that bond would decline below par (that is, it would sell at a “discount” or at a price below its face value). Investors would not invest in a five percent fixed coupon bond at par if they can purchase the same bond and receive a six percent return, given the same level of risk. Because the five percent coupon rate is fixed, the price of the bond would have to decrease to reflect this increase in yield. A portfolio holding such a bond would decrease in value, assuming the value of other investments remained unchanged. The relationship between the yield to maturity of a security and its maturity can be displayed graphically. This graph, known as a “yield curve,” is a common device for capturing the relationship between maturity and yield for a specific type of security. Figure 5 shows a hypothetical “normal” yield curve for U.S. Treasury bonds. The yield to maturity for a particular class of securities rises with increasing maturity, reflecting the higher return received for the additional perceived interest rate risk associated with holding the bonds for longer maturities.
FIGURE 5 – NORMAL YIELD CURVE
The curve’s slope reflects market expectations for future economic growth and inflation. For example, if investors expect higher inflation, the slope of the yield curve might be steeper. The “shape”—the steepness of the
5
curve at any point along its expanse—may change with market conditions. More generally speaking, changes in the shape of the yield curve reflect investors’ future expectations of interest rates at differing maturities and their liquidity needs or preferences. In addition to the normal yield curve shown in Figure 5 , various economic and monetary environments can produce yield curves that are flat (i.e., yields at different maturities are approximately equal) or inverted (i.e., the slope of the yield curve is negative, therefore shorter term investments have higher yields than longer term securities). A yield curve can also reflect changes in the market which affect the relationship between yield and maturity for the entire spectrum of maturities. When the entire relationship changes, the curve is said to have “shifted.” There are two types of shifts—parallel shifts and nonparallel shifts. In a parallel shift, there are equal increases or decreases in the yields for all maturities. For example, if an economic event affects the yields for all U.S. Treasury securities by 100 basis points, the entire curve will shift up. With a nonparallel shift, yields for different maturities do not increase or decrease equally. For example, a 100 basis point shift may affect three-month U.S. Treasury securities while not affecting those at longer maturities. As the yield curve’s shape changes, it provides fixed income portfolio managers with information on the financial markets and future economic conditions such as inflationary expectations or recessions. Changes in the yield curve also affect the price or value of investments in a fixed income portfolio, thereby subjecting the portfolio to varying degrees of interest rate risk. THE TYPES OF INTEREST RATE RISK AFFECTING FIXED INCOME PORTFOLIOS Interest rate risk is a measure of the possibility that the price or value of a bond will decline due to an increase in interest rates. Three common types of interest rate risk include price risk, reinvestment risk and yield curve risk.
PRICE RISK. Price risk reflects the possibility that the value of a bond will change in the future. Because the value or price of a bond is
6
inversely related to changes in interest rates, a change in interest rates will cause the market price for the bond (i.e., the actual price) to change in the opposite direction. If interest rates increase, the price for the bond in the secondary market will decline; if interest rates decline, the price will rise.
REINVESTMENT RISK. Reinvestment risk arises because of the uncertainty of interest rates at which cash flows from bonds can be reinvested in the future. As interest rates change over the term of a bond, coupon payments made to a fixed income portfolio are likely to be reinvested at rates different than those prevailing at the time of the original bond purchase. As an example, if interest rates decline, coupon payments will be reinvested at lower rates than the yield to maturity of the bond at the time of purchase; alternatively, if interest rates increase, coupon payments will be reinvested at rates above the yield to maturity of the bond at the time of purchase.
YIELD CURVE RISK. Yield curve risk may occur when changing interest rates have varying effects on bonds with different maturities. Yield curve risk influences the shape and position of the yield curve, thereby affecting the price or value of bonds in a fixed income portfolio. For example, changes in the shape of the yield curve reflect investors’ future expectations of interest rates at differing maturities and their liquidity needs or preferences. To sum up, an agency’s exposure to interest rate risk is a function of the agency’s specific investments and of potential changing market conditions. An agency can manage its risk exposure to an acceptable level by assessing its portfolio for safety, liquidity and performance. In addition to following the prudent investor standard required in Government Code Section 53600.3, a portfolio manager may seek guidance from the governing board or its policies. Before the manager makes any decisions, he or she may wish to measure the portfolio’s interest rate risk and consider options for managing the risk, as described below.
7

8
Yield
Price
Duration Line
Convex relationship between price and yield
Difference captured by convexitymeasure
FIGURE 6 RELATIONSHIP BETWEEN BOND PRICE AND YIELD
MEASURING INTEREST RATE RISK Measuring interest rate risk involves estimating the effect a change in interest rates has on the value of a fixed income portfolio. A portfolio’s weighted average maturity (WAM) (as shown in Figure 1) provides a basic measure of overall risk because, in general, the longer the maturity, the greater market risk. WAM measures the average maturity of all individual investments weighted by their dollar values. Weighting investments by their values provides a better sense of the portfolio composition by maturity than if a simple average maturity is calculated. However, because WAM is based solely on an investment’s value, it does not measure risk associated with price volatility, varying cash flows, or embedded options (as occur with callable bonds). Two measures that provide a more complete assessment of interest rate risk are duration and full valuation measurement. DURATION.5 The primary measure of interest rate risk is duration; more specifically, either “modified” or “effective” duration. The choice of duration measure depends on the complexity of investments in the portfolio and the local agency’s preference for calculating the measure using one or more of the various financial management software packages available. When an analyst uses modified duration, he/she calculates the percent change in the value of a bond without embedded options (e.g., a callable bond), given an instantaneous 100 basis point change in yields. It provides a specific measure of exposure to interest rate risk. For example, if a portfolio’s duration value is 4, the portfolio’s market value will decline by 4 percent for an instantaneous 1 percent increase in interest rates. Effective duration calibrates the price volatility of a fixed income security that contains embedded options. It is a more accurate measure of price volatility when the cash flow characteristics of the
bond change due to, for example, an interest rate shift. Such an event may cause a callable security to move into or out of the interest rate range within which it would be called. The calculation of effective duration relies on a number of assumptions about the direction of interest rates and the level of volatility. The investment portfolio manager should understand these assumptions before relying on effective duration as an adequate measure of interest rate risk exposure. Duration is a useful tool for portfolio managers, though it is not without limitations. Duration is a “linear” measure; that is, it assumes the price of a bond will increase/decrease by the same percentage for an equivalent decrease/increase in yield basis points. Thus, if a 10 basis point drop in yield increases a bond’s price by 1 percent, a similar 10 basis point increase in yield should decrease its price by 1 percent. While this relationship may be true for small, incremental changes in yield, it is not true for large basis point shifts. A bond’s price behaves more as a curved or “convex” function of its yield (see Figure 6). The more “convex” the relationship, the more inaccurate duration is as a measure of interest rate sensitivity; thus, it is important to incorporate convexity measurement when assessing the effect of significant changes in yield. Convexity is generally insignificant for the five-year and under fixed maturity securities that most local agencies purchase. However, it is highly significant for bonds with embedded options, including callable bonds and mortgage-backed securities, both of which have negative convexity. FULL VALUATION. In the full-valuation approach (also known as “scenario analysis”), each bond in a portfolio is revalued for a range of possible interest rate changes. These changes then are summed to determine the effect on the portfolio. If a portfolio contains 10 bonds, the full-valuation approach would consider the effect on each bond of a variety of potential interest rate changes; for example, a 50 basis point, 100 basis point and 200 basis point instantaneous increase in interest rates.6 Once the loss in value to each bond is calculated for each basis point change, it is summed to determine the loss in value to the portfolio. The full-valuation approach benefits the user by providing an actual measure of change in the value of a portfolio resulting from a specified interest rate change. Its accuracy, however, is dependent on correctly selecting the appropriate interest rate changes for each bond in
9

the portfolio. For portfolios with complex securities (such as embedded options), this evaluation becomes more difficult because assumptions regarding if and when these options are exercised would need to be incorporated in the evaluation. For portfolios containing a large number of complex investments, the full-valuation approach would be quite time-consuming. MANAGING INTEREST RATE RISK The first step investment managers should take to manage interest rate risk is to establish and document their return objectives and the level of risk they are willing to undertake to achieve those objectives. This will differ significantly from agency to agency, as some are more able and/or willing to tolerate greater levels of interest rate risk in order to achieve higher returns in the long run. By establishing an acceptable risk tolerance level, the investment manager can then determine the best investment strategy for meeting the agency’s goals of safety, liquidity and yield. To manage interest rate risk, investment managers must assess its potential effect, have an investment strategy, and structure their investment portfolios in such a manner as to assume an appropriate level of risk exposure given their goals of safeguarding the principal and liquidity of their portfolios while obtaining a reasonable rate of return. Interest rate risk can be effectively managed using either passive or active portfolio management strategies. Passive portfolio management involves designing a portfolio that is evaluated against a predetermined “benchmark.” The benchmark might be chosen to achieve the return on a specified index or to accumulate sufficient dollars to satisfy a future liability stream. Interest rate risk is managed either through periodic rebalancing of the portfolio to maintain the risk profile, or by holding investments to maturity, and then reinvesting the proceeds to maintain the risk profile. Active portfolio management contrasts with passive portfolio management because the portfolio manager may choose to buy or sell investments before maturity based upon one or more strategies designed to enhance the performance of the portfolio.
10

In order to implement either a passive or active investment strategy, the investment manager must determine the appropriate portfolio structure that complements his/her strategy while meeting the local agency’s safety and liquidity needs. The selection of an appropriate portfolio structure is vital to effective risk management, as some structures are more effective than others depending on the yield curve environment and cashflow needs of the local agency. The following information provides a brief description of various strategies available for managing interest rate risk, ranging from purely passive to more active management strategies; these strategies may rely on portfolio structures such as bullets, barbells, and ladders to achieve desired results. PASSIVE INVESTMENT STRATEGIES BUY-AND-HOLD. The buy-and-hold strategy involves purchasing and managing investments until maturity. Portfolio managers using a buy-and-hold strategy do not attempt to earn additional returns through active trading or other strategies; rather they look for bonds with maturities or durations that match their investment horizon. While this strategy is passive, it still involves analytical and administrative effort to select the appropriate mix and maturity schedules for selected bond investments. Portfolio managers examine such factors as credit ratings, coupon levels, maturity term, call features and sinking funds. Of significant importance is the credit quality of such investments because investments are held to maturity when using a buy-and-hold strategy. Changes in current market value due to interest rate fluctuations are less important; interest income and the reinvestment of interest income are the only sources of return for this portfolio strategy. The portfolio manager can implement a buy-and-hold strategy using portfolio structures such as bullets and ladders.
BULLET PORTFOLIO STRUCTURE. In this structure, maturities of investments purchased at different times are centered at or around a single point on the yield curve. While this strategy may not be suitable for portfolios that rely on a regular stream of maturities for cash flow purposes, it is appropriate for investment of bond proceeds where there is a known future liability that will be repaid on a specified date. Therefore the portfolio targets the liability to ensure repayment and manages interest rate risk by holding investments to the target liability date. One disadvantage of this strategy is the lack of maturity diversification exposes the
11
12
portfolio to a relatively higher level of interest rate risk compared to other investment strategies in the event the liability date changes.
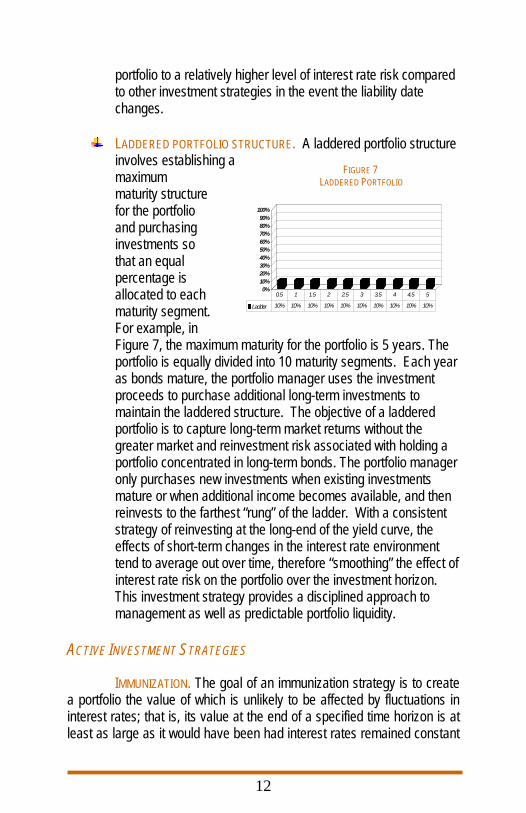
LADDERED PORTFOLIO STRUCTURE. A laddered portfolio structure
involves establishing a maximum maturity structure for the portfolio and purchasing investments so that an equal percentage is allocated to each maturity segment. For example, in Figure 7, the maximum maturity for the portfolio is 5 years. The portfolio is equally divided into 10 maturity segments. Each year as bonds mature, the portfolio manager uses the investment proceeds to purchase additional long-term investments to maintain the laddered structure. The objective of a laddered portfolio is to capture long-term market returns without the greater market and reinvestment risk associated with holding a portfolio concentrated in long-term bonds. The portfolio manager only purchases new investments when existing investments mature or when additional income becomes available, and then reinvests to the farthest “rung” of the ladder. With a consistent strategy of reinvesting at the long-end of the yield curve, the effects of short-term changes in the interest rate environment tend to average out over time, therefore “smoothing” the effect of interest rate risk on the portfolio over the investment horizon. This investment strategy provides a disciplined approach to management as well as predictable portfolio liquidity.
ACTIVE INVESTMENT STRATEGIES
IMMUNIZATION. The goal of an immunization strategy is to create a portfolio the value of which is unlikely to be affected by fluctuations in interest rates; that is, its value at the end of a specified time horizon is at least as large as it would have been had interest rates remained constant
FIGURE 7 LADDERED PORTFOLIO
0%10%20%30%40%50%60%70%80%90%
100%
Ladder 10% 10% 10% 10% 10% 10% 10% 10% 10% 10%
0.5 1 1.5 2 2.5 3 3.5 4 4.5 5
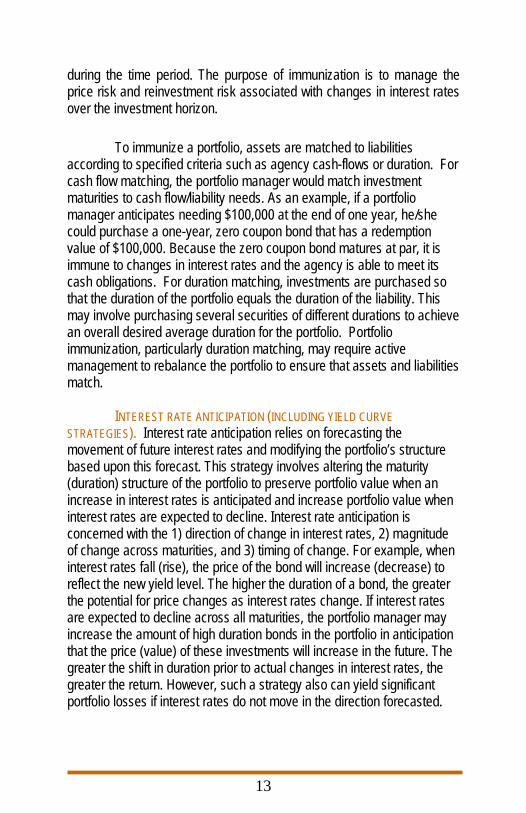
during the time period. The purpose of immunization is to manage the price risk and reinvestment risk associated with changes in interest rates over the investment horizon. To immunize a portfolio, assets are matched to liabilities according to specified criteria such as agency cash-flows or duration. For cash flow matching, the portfolio manager would match investment maturities to cash flow/liability needs. As an example, if a portfolio manager anticipates needing $100,000 at the end of one year, he/she could purchase a one-year, zero coupon bond that has a redemption value of $100,000. Because the zero coupon bond matures at par, it is immune to changes in interest rates and the agency is able to meet its cash obligations. For duration matching, investments are purchased so that the duration of the portfolio equals the duration of the liability. This may involve purchasing several securities of different durations to achieve an overall desired average duration for the portfolio. Portfolio immunization, particularly duration matching, may require active management to rebalance the portfolio to ensure that assets and liabilities match. INTEREST RATE ANTICIPATION (INCLUDING YIELD CURVE STRATEGIES). Interest rate anticipation relies on forecasting the movement of future interest rates and modifying the portfolio’s structure based upon this forecast. This strategy involves altering the maturity (duration) structure of the portfolio to preserve portfolio value when an increase in interest rates is anticipated and increase portfolio value when interest rates are expected to decline. Interest rate anticipation is concerned with the 1) direction of change in interest rates, 2) magnitude of change across maturities, and 3) timing of change. For example, when interest rates fall (rise), the price of the bond will increase (decrease) to reflect the new yield level. The higher the duration of a bond, the greater the potential for price changes as interest rates change. If interest rates are expected to decline across all maturities, the portfolio manager may increase the amount of high duration bonds in the portfolio in anticipation that the price (value) of these investments will increase in the future. The greater the shift in duration prior to actual changes in interest rates, the greater the return. However, such a strategy also can yield significant portfolio losses if interest rates do not move in the direction forecasted.
13

14
A yield curve strategy is a form of interest rate anticipation. It involves anticipating future changes in the shape/position of the yield curve. The yield curve can shift in various ways; two of the more common changes are 1) a downward shift combined with a steepening of the curve and 2) an upward shift combined with a flattening of the curve. If two portfolios can have similar durations but varying bond maturities, their portfolios’ values will respond differently to changes in the shape of the yield curve. Given this fact, a portfolio manager may select from a variety of portfolio structures to manage interest rate risk under a yield curve strategy, including bullets or laddered structures (see above discussion on these portfolio structures) or via a “barbell” structure.
BARBELL PORTFOLIO STRUCTURE. In this strategy, the portfolio contains investments concentrated at the short end and long end of the portfolio’s allowable investment horizon (see Figure 8). In a normal yield curve environment, longer-maturity investments allow the portfolio manager to lock in attractive long-term interest rates, while short-term investments provide liquidity and ensure that there will be an opportunity upon maturity to invest elsewhere if yields increase. Using a barbell portfolio structure is considered to be an active management strategy; that is, as the portfolio matures and investments that once were at the long-end of the yield curve now approach maturity, the portfolio manager may wish to sell these investments and reinvest once again at the long-end of the yield curve in order to maintain the barbell structure and the desired risk profile. A barbell strategy works best in an environment where a flatter yield curve is anticipated in the future because of the relative gain in value for holding investments at the longer-end of the yield curve.
Accurately forecasting future interest rates is difficult—a portfolio manager must be correct about timing not only the direction of an interest rate change, but also the magnitude and timing of the change. Therefore,
FIGURE 8 BARBELL PORTFOLIO
0%10%20%30%40%50%60%70%80%90%
100%
Barbell 60% 0% 0% 0% 0% 0% 0% 40% 0% 0%
0.5 1 1.5 2 2.5 3 3.5 4 4.5 5

interest rate anticipation strategies are unlikely to provide significant added return in the long run, relative to the portfolio’s market benchmark, although they may provide higher returns in a given month or quarter.
BENCHMARKING. The goal of benchmarking is to mirror the characteristics of a particular segment of the market or performance of a desired market index. For fixed income portfolios, the portfolio manager selects a subset of the securities that comprise the market segment or index. Periodically, the investment manager will review the portfolio and make adjustments (buying and/or selling investments) in order to maintain a relationship (e.g., duration, sector allocation of investments) with the desired benchmark or index.
Benchmarking is, at a minimum, a partially active management strategy, in that the portfolio manager may need to buy and sell securities to maintain the desired benchmark or index characteristics. To optimize the performance of this strategy, security sales should occur regardless of whether they are at a gain or at a loss from their purchase value. Thus, it is not a strategy for local agencies that are averse to realizing losses. Selecting the appropriate market index is an important decision that directs how that portfolio should be managed on an ongoing basis from the perspectives of both risk and return. Indexes should have certain minimum requirements to be an effective benchmark for the portfolio manager. The names and weights of securities comprising an index, along with current and historical returns should be available.7
ADMINISTRATIVE CHECKLIST FOR MANAGING INTEREST RATE RISK The fixed income portfolio manager is responsible for identifying and measuring the portfolio’s exposure to interest rate risk and developing an investment strategy that balances it against the portfolio’s safety, liquidity and performance goals. While this process will differ from agency to agency according to their overall goals and acceptable levels of risk tolerance, there are several general steps the agency and portfolio manager can take to ensure its objectives are met. These include:
15

Establish overall performance goals and risk tolerance levels. This includes assigning responsibility for managing exposure and establishing limits on acceptable levels of interest rate risk.
Identify short-term and long-term safety and liquidity needs so
that an appropriate portfolio structure may be employed.
Develop controls and clear guidelines for managing interest rate risk, including specific authorizations and restrictions regarding investment and trading activities, the use of securities with embedded options, and policies for realizing gains and losses. By doing so, the portfolio manager can determine which investment goals are feasible and make informed choices among investment strategies and portfolio structures.
Institute measurement tools/benchmarks for ensuring
performance goals are achieved and controls for determining that risk tolerance levels are not exceeded.
Establish processes for handling sudden, unanticipated
increases in interest rate risk exposure that exceed the agency’s acceptable risk tolerance levels. These include establishing procedures for directly managing the increased risk as well as communicating the potential risk exposure.
In addition, because statutory law imposes reporting and fiduciary duties on governing boards, a portfolio manager may wish to consult with counsel and executive management about the board’s investment and disclosure policies. CONCLUSION Fixed income portfolios, because of their reliance on interest bearing securities, face greater exposure to interest rate risk than do portfolios that rely on investments comprised of common stocks and variable rate securities. As such, fixed income portfolio managers must be familiar with the technical aspects of interest rate risk, including the relationship between bond prices and yield, the effect of movements in the yield curve on a portfolio’s value, and how to measure a portfolio’s exposure to interest rate risk. Portfolio managers may use either passive or active investment strategies to manage interest rate risk, including buy and hold,
16

immunization, interest rate anticipation, and benchmarking. To implement these strategies effectively, the portfolio manager also must determine the portfolio structure that best maximizes their safety, liquidity and yield goals given acceptable risk tolerance levels. These may include the use of bullet, barbell and/or laddered portfolio structures. Local agencies will differ in their methods for addressing interest rate risk depending on cashflow needs, investment policy restrictions, portfolio goals, staff resources, and risk tolerance. Nevertheless, local agencies that establish clear goals and guidelines along with detailed processes for assessing and managing interest rate risk substantially increase their probability of successfully mitigating unwanted exposure and losses to their portfolio’s value. For additional information on tools and techniques for managing interest rate risk, readers should consult the references provided below. Most of these publications, as well as others mentioned in this issue brief, are available on the California Debt and Investment Advisory Commission’s website, www.treasurer.ca.gov/cdiac.
17
REFERENCES California Debt and Investment Advisory Commission, California Debt Issuance Primer, 2004. California Debt and Investment Advisory Commission, Duration Basics, 2006. California Debt and Investment Advisory Commission, The Fundamentals of Interest Rate Swaps, 2004. California Debt and Investment Advisory Commission, Understanding Interest Rate Swap Math and Pricing, 2006. F. Fabozzi, editor, The Handbook of Fixed Income Securities (Seventh Edition), The McGraw-Hill Companies, 2005.
18

ENDNOTES 1 California Government Code Section 53600.3 provides the following guidance as to how this standard should be adhered to:
”…a trustee shall act with care, skill, prudence, and diligence under the circumstances then prevailing, including, but not limited to, the general economic conditions and the anticipated needs of the agency, that a prudent person acting in a like capacity and familiarity with those matters would use in the conduct of funds of a like character and with like aims, to safeguard the principal and maintain the liquidity needs of the agency.”
“Maintaining the liquidity needs” of the agency generally can be interpreted to mean that funds must be invested in a manner that provides adequate cash flow when needed. “Safeguarding the principal” generally can be interpreted to mean that the local agency manages portfolio risk so that its spending power is maintained throughout entire economic (or business) cycles. 2 The other primary risk that local agency investment officers must manage is credit risk, which is the risk that the principal and/or interest on the debt will not be repaid in full and/or on time. 3 For a bond with a semi-annual interest payment, the divisor is (1+ (i/2))n, and n= the total number of payments, rather than the total number of years of interest payments. 4 If coupon payments are semiannual, then the yield to maturity resulting from the formula in Figure 4 would be a semiannual measure. 5 CDIAC has published an issue brief, Duration Basics, which provides a comprehensive review of this risk measurement tool. It is available on the CDIAC website at www.treasurer.ca.gov/cdiac. 6 Generally, an increase in interest rates is considered because of the potential loss in value to the portfolio. 7 The most commonly used bond indexes include those created by large investment banking firms such as Lehman Brothers and Merrill Lynch. The major index publishers use specific, predetermined criteria, such as size and credit rating, to determine which securities are included in the index. Index methodologies, returns and other statistics are usually available through the index publisher’s website or through services such as Bloomberg LLP or Thomson Reuters.
19

20
ACKNOWLEDGEMENTS This issue brief was written by Doug Skarr, former CDIAC Research Program Specialist, and edited by John Decker, Executive Director, and Kristin Szakaly-Moore, Director of Policy Research. CDIAC gratefully acknowledges Kay Chandler, President, Chandler Asset Management, Inc.; Rod Dole, Treasurer-Tax Collector, County of Sonoma; Fred Keeley, Treasurer-Tax Collector, County of Santa Cruz; and David Zweig, Chief Investment Officer, County of Santa Cruz, for their valuable assistance with this issue brief.

CALIFORNIA DEBT & INVESTMENT ADVISORY COMMISSION
915 CAPITOL MALL, ROOM 400
SACRAMENTO, CALIFORNIA 95814
PHONE: 916.653.3269 FAX: 916.654.7440
EMAIL: [email protected] WEBSITE: WWW.TREASURER.CA.GOV/CDIAC
© All Rights Reserved. No part of this document may be reproduced without written credit given to the California Debt and Investment Advisory Commission.