Embed Size (px)
DESCRIPTION
Managing Local Energy and Environment Interfaces: AIM-Local Model Applications. P.R. Shukla. Introduction. Modeling the dilemma of providing energy services and protecting the environment in a local region. SO 2 , NO X , SPM, CO 2. Acid precipitation. Air pollutants. Energy Technology. - PowerPoint PPT Presentation
Citation preview

Managing Local Energy and Environment Interfaces:
AIM-Local Model Applications
P.R. Shukla

Energy Service DemandEnergy Technology
SO2, NOX, SPM, CO2
• Modeling the dilemma of providing energy services and protecting the environment in a local region
Air pollutants
Acid precipitation
Introduction

Linear programming
Total cost minimum
Service demand
ParametersVariables
Definitions
Constraints
Objective Function
Environmental target
Available energy supply
Operating capacity
Maximum shares of technologies
Maximum exchange of stock
Solver
AIM Local Model: Methodology
iplijlWpl
ijlij XADj
,,,,),(
,,,
Model Formulation
(1) Service demand constraint
Al,j,i : Service supply quantity by technologies and regions
Ψl,j,i : Social service efficiency by technologies and regions
Xl,p,i : Operating quantity by technology combinations (l,p) and regions

iplilipl SX ,,,,,
(2) Operating capacity constraint
Λl,i : Operating efficiency by technologies and regions
Sl,p,i : Stock quantity by technology combinations and regions

ki pl
pliplkilk EXE ˆ),(
,,,,,,
iplkE ,,,
(3) Energy supply constraint
: Energy consumption by fuels, technologies and regions
ξk,l,i : Energy efficiency improvement by operation style and maintenance

(4) Emission constraint
Emissions:
Emission factors:
dl,p,im : Pollutant release ratio by technology combinations and regions
),(
,,,,pl
miplipl
mi eXQ
mipliplkilk
mlk
k
ml
mipl dEffe ,,,,,,,,,0,,
mz
Ri
mi QQ
z
ˆ
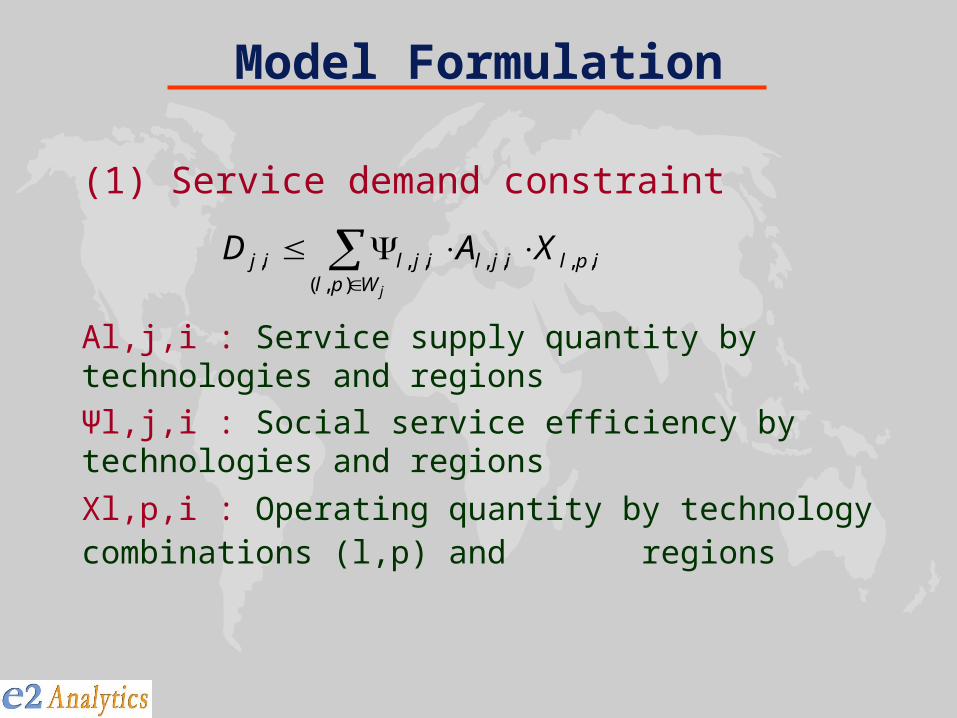
(5) Cost functions
Initial cost:
Operating cost:
Environmental cost:
),(,,,,,,
1
11
pl pipplppl
xiplpl MCrC
iplpl k
iplkilkikipl XEgg ,,),(
,,,,,,0
,, )(
m
mi
m Q

(6) Objective function
min )(),(
,,,,,,,,,,0
,,,,,,,,
1
11
i m
mi
m
plipl
kiplkilkiplkipl
pipplppl
xiplpl QXEggmCrCTC

SETS
PARAMETERS
VARIABLES
EQUATIONS
An Example of Transport Problem
Model Formulation in GAMS

Input Filefor GAMS
Output filefrom GAMS
Sum of Value Energy_Device Removal
CK1 CK2 COLBLR
Year NON NON NON SFGD
_bas e 4,700,000 1 ,300,000 24,528,000 1 ,752,000
1995 4,700,000 1 ,300,000 24,528,000 1 ,752,000
1996 6,000,000 26,134,533 1 ,664,400
1997 6,180,000 27,624,834 1 ,584,466
1998 6,365,400 29,010,707 1 ,510,876
1999 6,556,362 30,301,836 1 ,442,662
2000 6,753,053 31,506,418 1 ,379,091
2001 6,955,645 32,631,543 1 ,319,587
2002 7,164,314 33,683,447 1 ,263,694
2003 7,379,244 34,667,680 1 ,211,035
2004 7,600,621 35,589,232 1 ,161,300
2005 7,828,640 36,452,618 1 ,114,226
Input filefrom IDRISI
AIM-LocalDatabase System
AIM-Local modelGAMS version
GAMS
0.0012.5025.0037.5050.0062.5075.0087.50100.00112.50125.00137.50150.00162.50175.00187.50>=200.00
0.00
12.50
25.00
37.50
50.00
62.50
75.00
87.50
100.00
112.50
125.00
137.50
150.00
162.50
175.00
187.50
>=200.00
0.006.2512.5018.7525.0031.2537.5043.7550.0056.2562.5068.7575.0081.2587.5093.75>=100.00
IDRISI32
AIM workshop 2001AIM workshop 2001
AIM-Local Database System

Emission by point
Emission by City and Sector
Large Point Source
Area Source
Emission by City
3.Sector
Emission by Region and Sector
2.Region
Large Point Source and Area Source

5. Service
Service Demand( I J )
Share Potential( I L J T )
Energy service tech. (LT)& Air Pollution Control (P) - Energy Cons.(K L P T), - Service Supply (L J T) - Fixed Cost (L P T) - Removal Rate (L P T) etc.
6.Technology
Energy ConsumptionCO2 Emission
SO2/NO2 Emission( I L T )
Energy PriceEmission Factor
( K T )
Technology SelectionModule
(AIM-Local GAMS ver.)
Operating Rate( I L T )
Energy Service Tech.(L T)
Air Pollution Control(P)
Stock Quantity ( L T0 )
7.Stock
8.Share
9.Performance
4.Energy
10.Counter-measure
Tax( ME M T)
Regulation( ME M T)
Subsidy( I L T )
I : LPS or AreaL : Energy DeviceP : Removal PorcessJ : ServiceK : EnergyM : Gas (CO2, SO2, NO2) T : TimeME : Group on measure
Maintenance etc.
( I LT )
Structure of AIM-Local Database

Input and Output
Input:(1) Energy Fuel type, Fuel price, Emission factors by fuels and technologies Energy resource constraints
(2) Technology Initial cost, Operating cost Life-span, Capacity, Share Energy consumption by fuels for a unit production Pollutants removal technologies and combinations

(3) Service demand by regions and sectors Historical service data Future service demand forecast
Economic development plans from the local government
Development plans from the local industries
(4) Air pollutant emission constraints Current air pollutant emissions Local environmental protection policies

Output:(1) Aggregated results Total energy consumption by years Total costs by years Total CO2 emissions by years Total air pollutant emissions by years
(2) Technology options CO2 emissions by technologies and years Air pollutant emissions by technologies and years Energy consumption by technologies and years

(3) Service output Service output by regions, sectors, technologies
and years
(4) Energy balance table Energy balance table for the local region by years
(with energy information for sectors, technologies and fuel types)

Model Features
Simplified Structure Modeling local environmental constraints Direct benefit and co-benefit of counter
measures Flexible model structure to cope with various
practical situation in different regions GAMS programming GIS Interface

Geographical Information System (GIS)

Why GIS?
Capture location sensitivity Provide layered information Analyze time slices Integrate location and time information
in a consistent framework

Spatial Data Characteristics
Spatial data are characterized by information about position, connections with other features and details of non-spatial characteristics
latitude and longitude as a geographical reference connection details such as which service roads,
lifts and ski trails would allow the meteorologist access to the weather station
non-spatial (or attribute) data, for instance details of the amount of snowfall, temperature, wind speed and direction

Raster data Model
(sometimes referred to as grid)
Vector Data Model
(an entity is a component or
building block used to help data
organization)
Data Models

GIS Database
Integrated GIS Database

Examples of GIS Application to AIM-Local

Beijing City
Economic Features Per capita GDP: 3 times of the national level Industry > 60% of GDP Heavy Industry > 80% of industrial GDP

Beijing City: Regional Details

Population Density (person/km2)
28
38
9
28
64
2
28
96
4
37
23
2
39
76
34
52
48
13
36
10
17
6
37
3
44
4
52
9
70
8
52
2
33
9
11
9
19
3
12
5
72
1
05000
10000150002000025000300003500040000
Do
ng
ch
en
g
Xic
he
ng
Ch
on
gw
en
Xu
an
wu
Ch
ao
ya
ng
Fe
ng
tai
Sh
ijin
gsh
an
Ha
idia
n
Me
nto
ug
ou
Fa
ng
sh
an
Ch
an
gp
ing
Sh
un
yi
To
ng
zh
ou
Da
xin
g
Pin
gg
u
Hu
air
ou
Miy
un
Ya
nq
ing
Be
ijin
g C
ity
Center Outside
Source: Beijing Statistical Yearbook 2000.

per capita GDP (Yuan)
0
5000
10000
15000
20000
25000
30000
35000
40000D
ongcheng
Xic
heng
Chongw
en
Xuanw
u
Chaoyang
Fengta
i
Shijingshan
Haid
ian
Mento
ugou
Fangshan
Changpin
g
Shunyi
Tongzhou
Daxin
g
Pin
ggu
Huairou
Miy
un
Yanqin
g
Beijing C
ity
Center Outside
Source: Beijing Statistical Yearbook 2000.

0.00 5.00 10.00 15.00 20.00
1990
2000
2010
2020
( Million)
Permanent
Temporary
Sources:
(1) Beijing Municipal Statistics Bureau (1999).
(2) Beijing Municipal Government (1992).
(3) Beijing Municipal Planning Commission (2000b).

Sources:
(1) Beijing Municipal Statistics Bureau (2000).
(2) Beijing Municipal Planning Commission (2000).
(3) Beijing Municipal Government (1992).
0.00
5.00
10.00
15.00
20.00
25.00
30.00
35.00
40.00
45.00
50.00
1980 1990 2000 2010 2020
2000 – 2005: 9.5% 2006 – 2010: 9.0% 2011 – 2020: 8.5%

Large Point Sources data

Beijing Cement Plant
Technology: dry kiln with pre-decomposition processCapacity : 2000 t/d Production: 525# Portland cement, 0.74 Mt /aLocation: Changping District, Beijing City

Beijing Yanshan Petroleum and Chemical Group Corporations
Technology: heavy oil based refinery processCapacity : 6.0 Mt /a Location: Fangshan District, Beijing City
Refinery

Beijing Yanshan Petroleum and Chemical Group Corporations
Technology: Diesel oil based processCapacity : 0.45 Mt /a Location: Fangshan District, Beijing City
Ethylene

Beijing Shijingshan Thermal Power Plant
Technology: coal boilerCapacity : 4000 MW Location: Shijingshan District, Beijing City

Beijing Capital Steel Corporations
Capacity : 8.00 Mt Location: Shijingshan District, Beijing City
Residential sector Commercial sector Transportation sector Other sectors
Area source data

Results
Beijing Capital Steel Corporations
Beijing Shijingshan General Power Plant

1995
2020 (case 1) 2020 (case 8) 2020 (case 6)
SO2 intensity (t-SO2/km2)

1995
2020 (case 1) 2020 (case 6)
CO2 intensity (t-C/km2)

Ahmedabad City, India
High economic and demographic growth
Industrial base
Growing transport demand

India
Gujarat Ahmedabad

Ahmedabad Urban AreaAhmedaba
d District
Area PopulationHouseholds Sq. Km. Thousands Thousands
Gujarat 18509 184 196024 (3) 41310 (34) 7493 (36)Ahmedabad Dist. 648 7 8707 (6) 4802 (75) 920 (75)
Categories Villages Taluka
Ahmedabad District
Note: Figures in brackets show % Urban share
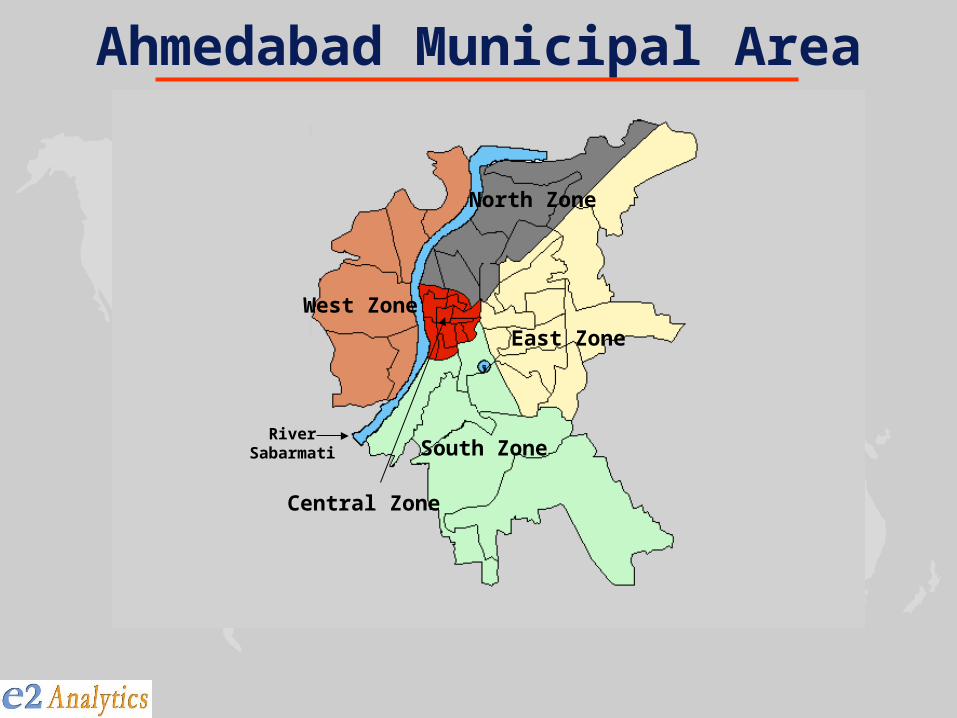
East Zone
Central Zone
North Zone
West Zone
South ZoneRiver
Sabarmati
Ahmedabad Municipal Area

Ahmedabad Municipal Area (South Zone)
Pirana Landfill
AEC GasPower plant
Vatva GIDC
Narol GIDC
Pirana MSP
Chandola Lake/Landfill
*GIDCs have many Textile processing and Chemical units

Ahmedabad – Area CO2 Emissions – 2030 (MT)

Ahmedabad – Area SO2 Emissions – 2030 (MT)

Ahmedabad – LPS CO2 Emissions – 2030 (kT)

Ahmedabad – LPS SO2 Emissions – 2030 (kT)