Embed Size (px)
Citation preview
William Chittenden edited and updated the PowerPoint slides for this edition.
MANAGING NONINTEREST INCOME & NONINTEREST EXPENSE
Chapter 3
Bank ManagementBank Management, 6th edition.6th edition.Timothy W. Koch and S. Scott MacDonaldTimothy W. Koch and S. Scott MacDonaldCopyright © 2006 by South-Western, a division of Thomson Learning
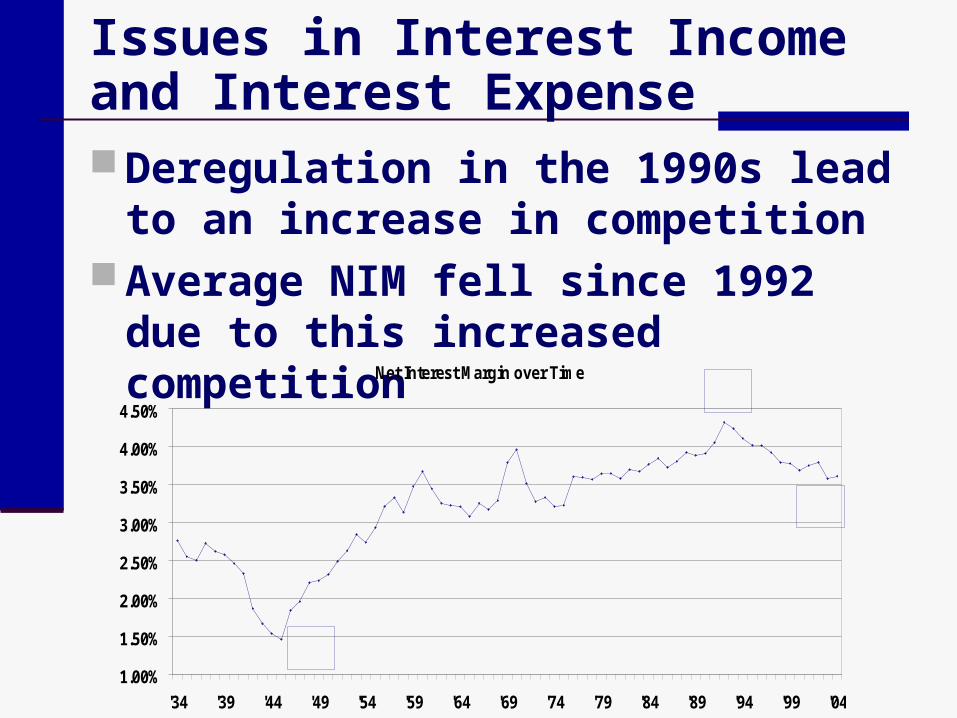
Issues in Interest Income and Interest Expense Deregulation in the 1990s lead to an
increase in competition Average NIM fell since 1992 due to this
increased competitionNet Interest Margin over Time
1.00%
1.50%
2.00%
2.50%
3.00%
3.50%
4.00%
4.50%
'34 '39 '44 '49 '54 '59 '64 '69 '74 '79 '84 '89 '94 '99 '04
19924.32%
20043.61%
19451.46%
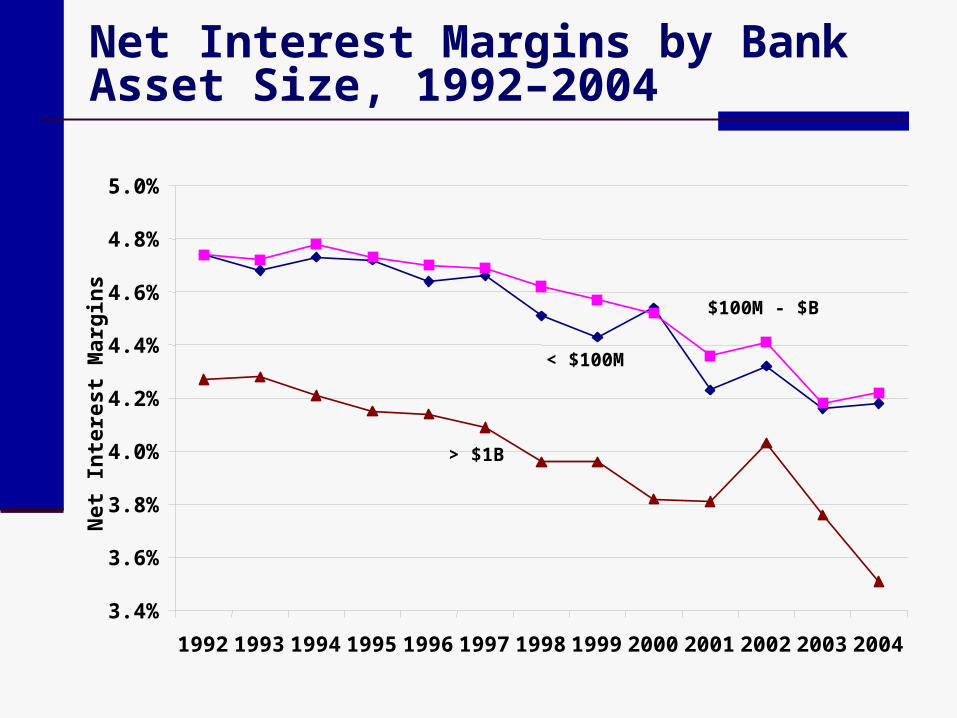
Net Interest Margins by Bank Asset Size, 1992–2004
3.4%
3.6%
3.8%
4.0%
4.2%
4.4%
4.6%
4.8%
5.0%
1992 1993 1994 1995 1996 1997 1998 1999 2000 2001 2002 2003 2004
Net
Inte
rest
Mar
gins $100M - $B
< $100M
> $1B
Issues in Interest Income and Interest Expense Core deposit growth has slowed due
to “disintermediation” Loan yields have fallen on a relative
basis due to credit scoring and increased competition among lenders
NIM is being squeezed, so banks must concentrate more on non-interest income to grow profits.
Issues in Non-Interest Income and Non-Interest Expense Banks must rely less on net interest
income and more on non-interest income to be more successful Banks must grow their non-interest
income relative to non-interest expense if they want to see net income grow.
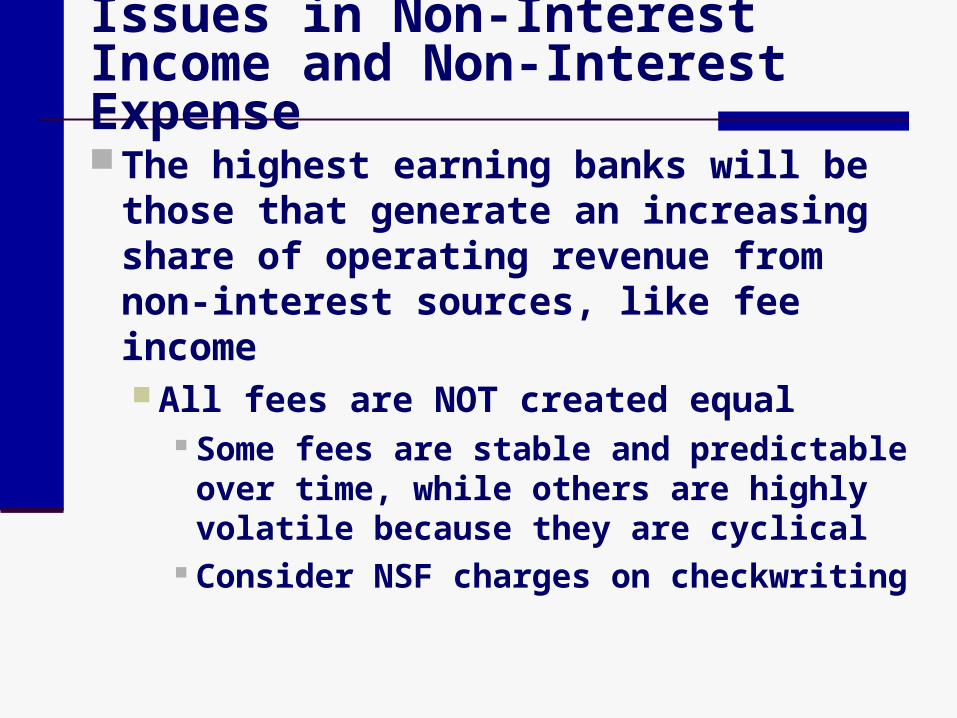
Issues in Non-Interest Income and Non-Interest Expense The highest earning banks will be
those that generate an increasing share of operating revenue from non-interest sources, like fee income All fees are NOT created equal
Some fees are stable and predictable over time, while others are highly volatile because they are cyclical
Consider NSF charges on checkwriting
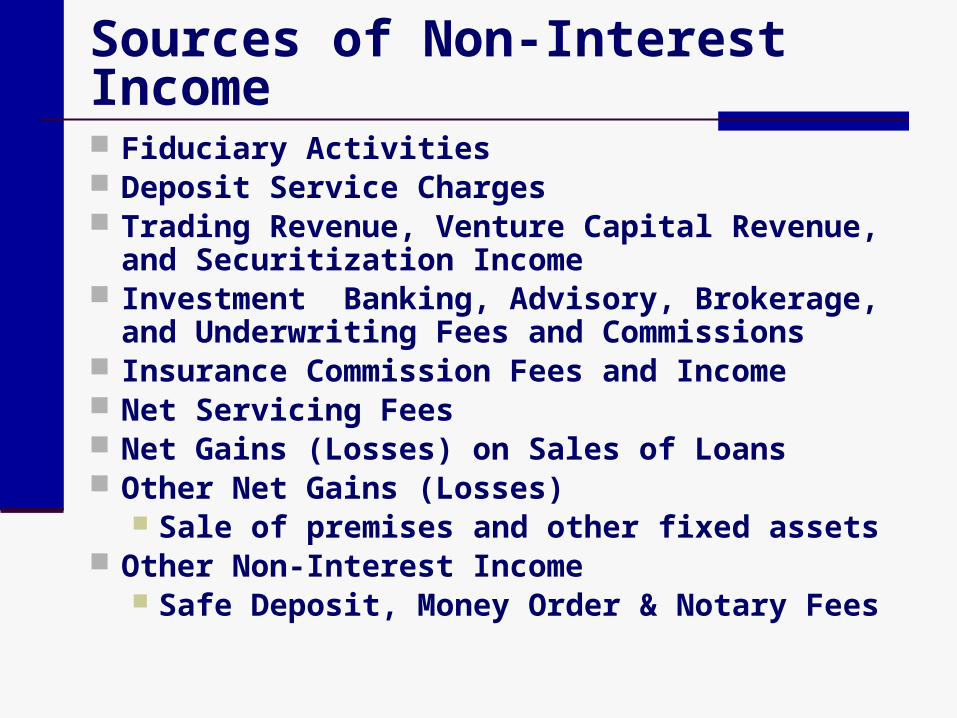
Sources of Non-Interest Income Fiduciary Activities Deposit Service Charges Trading Revenue, Venture Capital Revenue, and
Securitization Income Investment Banking, Advisory, Brokerage, and
Underwriting Fees and Commissions Insurance Commission Fees and Income Net Servicing Fees Net Gains (Losses) on Sales of Loans Other Net Gains (Losses)
Sale of premises and other fixed assets Other Non-Interest Income
Safe Deposit, Money Order & Notary Fees
Non-Interest Income is increasing as a proportion of net operating revenue
Largest contributors are deposit service charges and other non-interest income
Largest banks rely more on non-interest income than their smaller counterparts
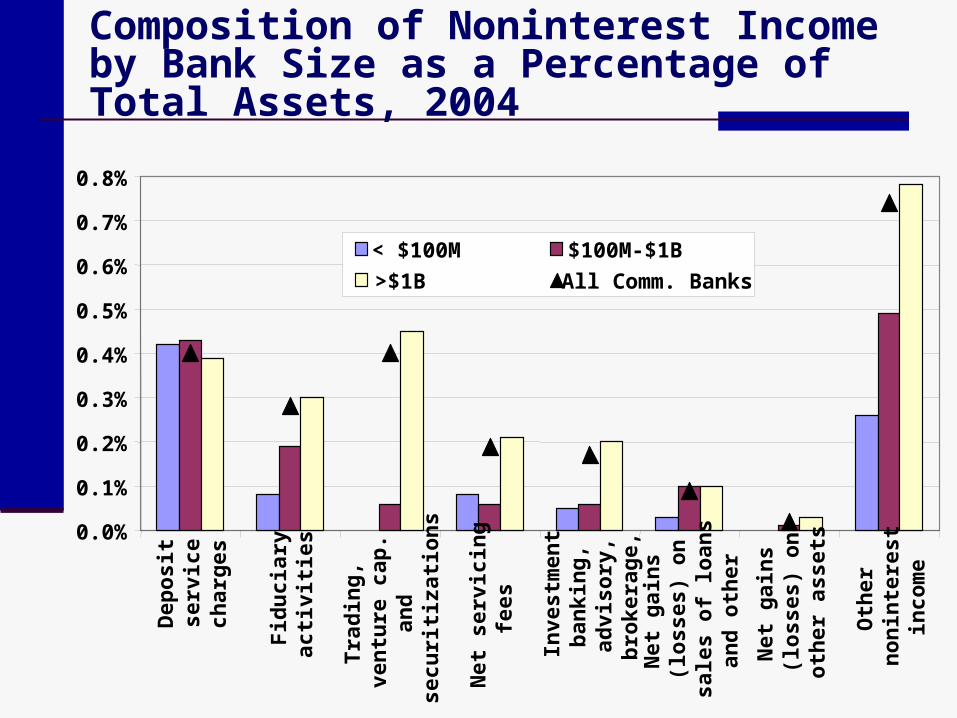
Composition of Noninterest Income by Bank Size as a Percentage of Total Assets, 2004
0.0%
0.1%
0.2%
0.3%
0.4%
0.5%
0.6%
0.7%
0.8%D
epos
itse
rvic
ech
arge
s
Fidu
ciar
yac
tiviti
es
Trad
ing,
vent
ure
cap.
and
secu
ritiz
atio
ns
Net
ser
vici
ngfe
es
Inve
stm
ent
bank
ing,
advi
sory
,br
oker
age,
Net
gai
ns(lo
sses
) on
sale
s of
loan
san
d ot
her
Net
gai
ns(lo
sses
) on
othe
r ass
ets
Oth
erno
nint
eres
tin
com
e
< $100M $100M-$1B>$1B All Comm. Banks
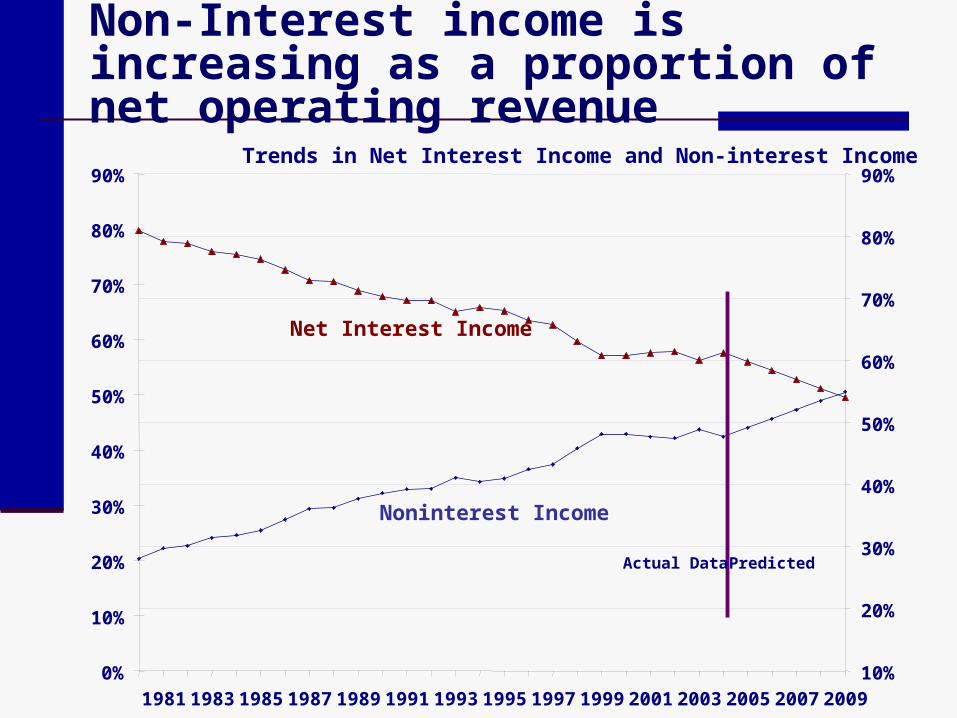
Non-Interest income is increasing as a proportion of net operating revenue
Trends in Net Interest Income and Non-interest Income
10%
20%
30%
40%
50%
60%
70%
80%
90%
2009200720052003200119991997199519931991198919871985198319810%
10%
20%
30%
40%
50%
60%
70%
80%
90%
Net Interest Income
Noninterest Income
Actual Data Predicted
Deposit Service Fees
Stable source of revenue Relatively price inelastic What level of fees is too high given a
bank’s desire for strong customer relationships?
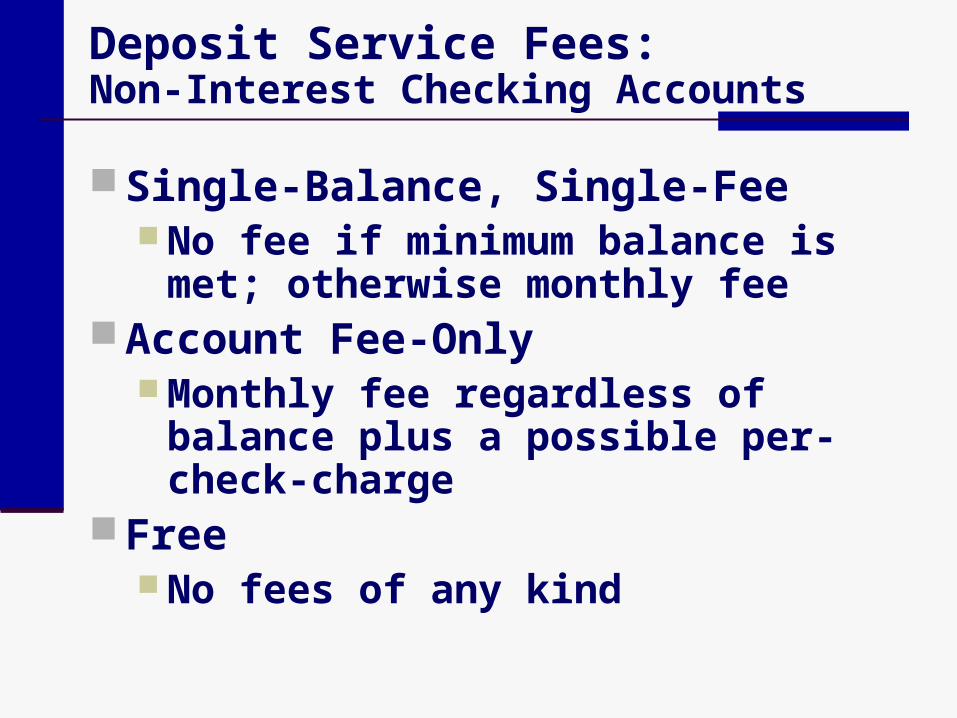
Deposit Service Fees:Non-Interest Checking Accounts
Single-Balance, Single-Fee No fee if minimum balance is met;
otherwise monthly fee Account Fee-Only
Monthly fee regardless of balance plus a possible per-check-charge
Free No fees of any kind
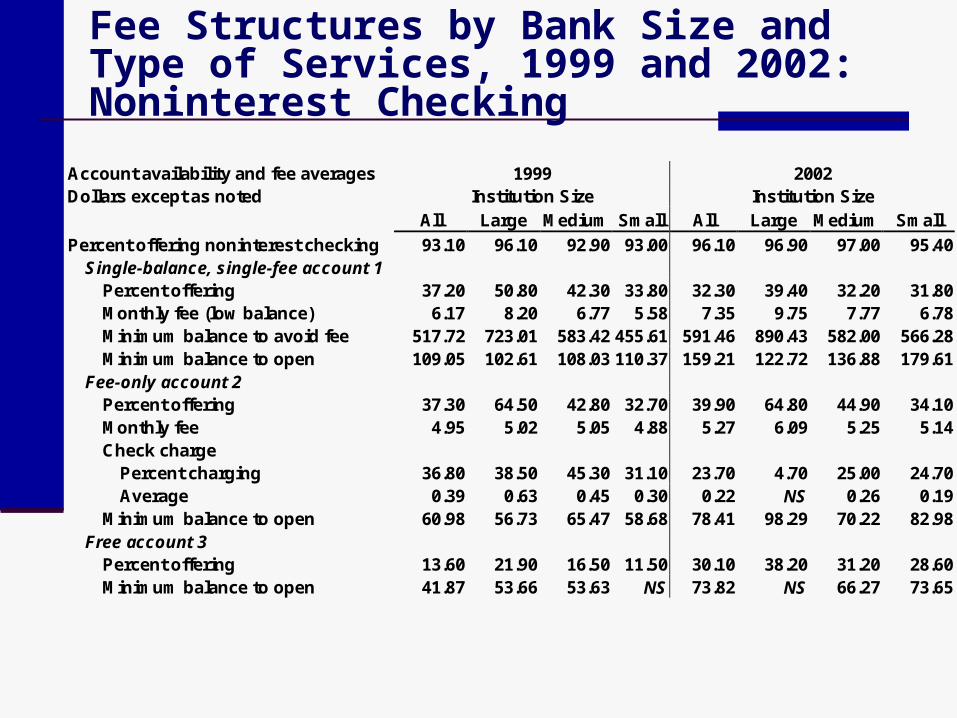
Fee Structures by Bank Size and Type of Services, 1999 and 2002: Noninterest Checking
Account availability and fee averages 1999 2002 Dollars except as noted Institution Size Institution Size All Large Medium Small All Large Medium Small Percent offering noninterest checking 93.10 96.10 92.90 93.00 96.10 96.90 97.00 95.40
Single-balance, single-fee account 1 Percent offering 37.20 50.80 42.30 33.80 32.30 39.40 32.20 31.80 Monthly fee (low balance) 6.17 8.20 6.77 5.58 7.35 9.75 7.77 6.78 Minimum balance to avoid fee 517.72 723.01 583.42 455.61 591.46 890.43 582.00 566.28 Minimum balance to open 109.05 102.61 108.03 110.37 159.21 122.72 136.88 179.61
Fee-only account 2 Percent offering 37.30 64.50 42.80 32.70 39.90 64.80 44.90 34.10 Monthly fee 4.95 5.02 5.05 4.88 5.27 6.09 5.25 5.14 Check charge
Percent charging 36.80 38.50 45.30 31.10 23.70 4.70 25.00 24.70 Average 0.39 0.63 0.45 0.30 0.22 NS 0.26 0.19
Minimum balance to open 60.98 56.73 65.47 58.68 78.41 98.29 70.22 82.98 Free account 3
Percent offering 13.60 21.90 16.50 11.50 30.10 38.20 31.20 28.60 Minimum balance to open 41.87 53.66 53.63 NS 73.82 NS 66.27 73.65
Deposit Service Fees:Interest-Bearing Checking Accounts
Single-Fee NOW Accounts No fee if minimum balance is met,
otherwise monthly fee Single-Fee, Single Check NOW
Account Monthly fee regardless of balance plus
a possible per-check-charge No-Fee NOW Accounts
No fees of any kind
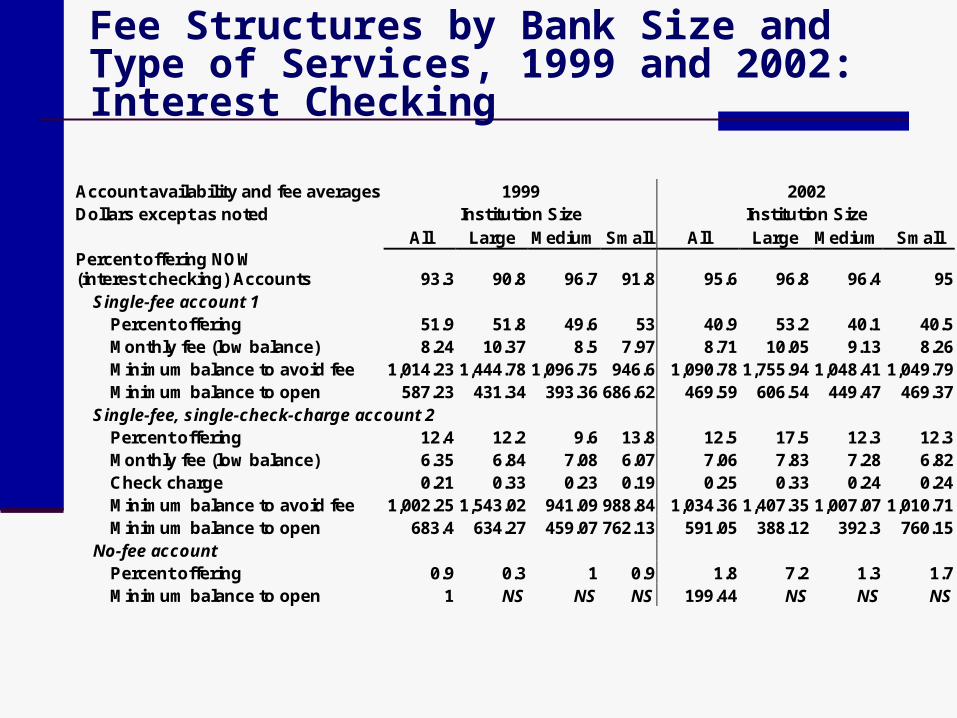
Fee Structures by Bank Size and Type of Services, 1999 and 2002: Interest Checking
Account availability and fee averages 1999 2002 Dollars except as noted Institution Size Institution Size All Large Medium Small All Large Medium Small Percent offering NOW (interest checking) Accounts 93.3 90.8 96.7 91.8 95.6 96.8 96.4 95
Single-fee account 1 Percent offering 51.9 51.8 49.6 53 40.9 53.2 40.1 40.5 Monthly fee (low balance) 8.24 10.37 8.5 7.97 8.71 10.05 9.13 8.26 Minimum balance to avoid fee 1,014.23 1,444.78 1,096.75 946.6 1,090.78 1,755.94 1,048.41 1,049.79 Minimum balance to open 587.23 431.34 393.36 686.62 469.59 606.54 449.47 469.37
Single-fee, single-check-charge account 2 Percent offering 12.4 12.2 9.6 13.8 12.5 17.5 12.3 12.3 Monthly fee (low balance) 6.35 6.84 7.08 6.07 7.06 7.83 7.28 6.82 Check charge 0.21 0.33 0.23 0.19 0.25 0.33 0.24 0.24 Minimum balance to avoid fee 1,002.25 1,543.02 941.09 988.84 1,034.36 1,407.35 1,007.07 1,010.71 Minimum balance to open 683.4 634.27 459.07 762.13 591.05 388.12 392.3 760.15
No-fee account Percent offering 0.9 0.3 1 0.9 1.8 7.2 1.3 1.7 Minimum balance to open 1 NS NS NS 199.44 NS NS NS
Deposit Service Fees:Special Fees
NSF Checks Check is returned
Overdrafts Check is honored
Deposit Items Returned Stop-Payment Order
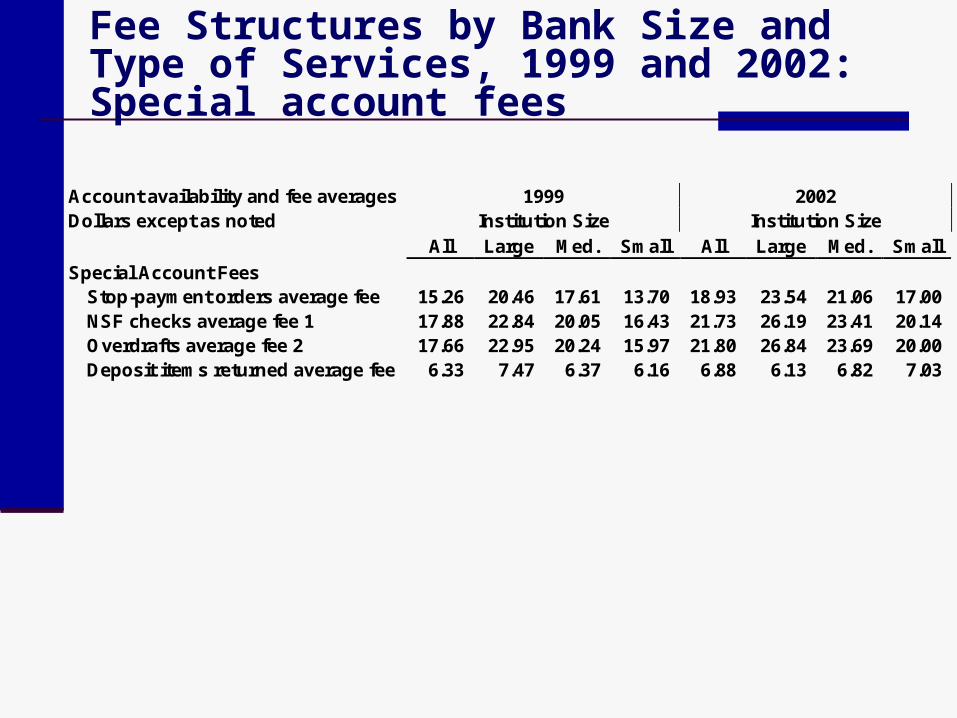
Fee Structures by Bank Size and Type of Services, 1999 and 2002: Special account fees
Account availability and fee averages 1999 2002 Dollars except as noted Institution Size Institution Size All Large Med. Small All Large Med. Small Special Account Fees
Stop-payment orders average fee 15.26 20.46 17.61 13.70 18.93 23.54 21.06 17.00 NSF checks average fee 1 17.88 22.84 20.05 16.43 21.73 26.19 23.41 20.14 Overdrafts average fee 2 17.66 22.95 20.24 15.97 21.80 26.84 23.69 20.00 Deposit items returned average fee 6.33 7.47 6.37 6.16 6.88 6.13 6.82 7.03
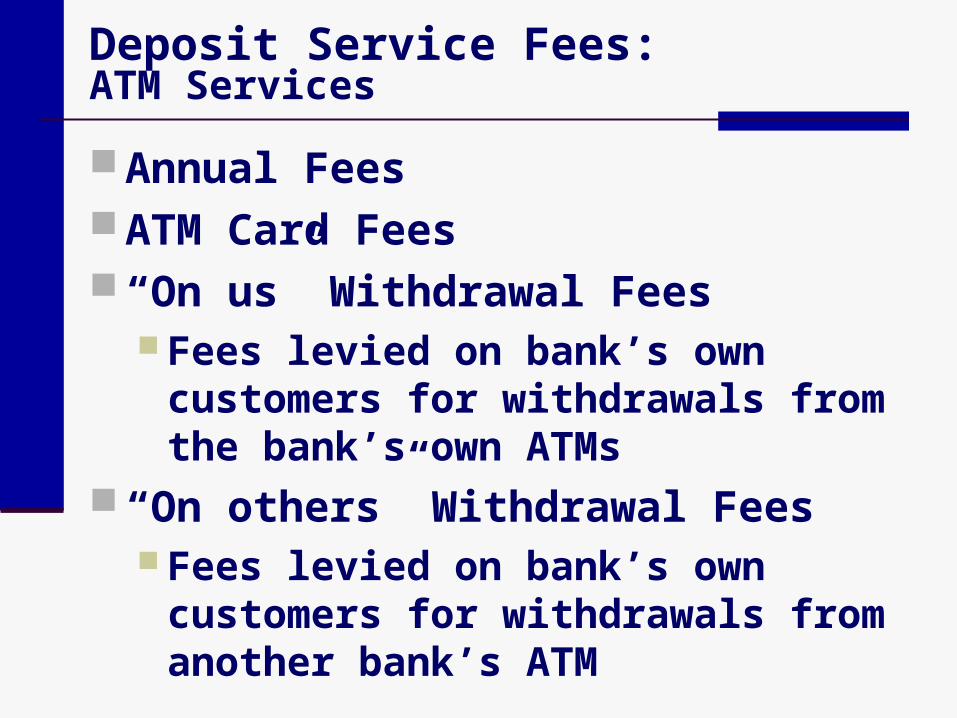
Deposit Service Fees:ATM Services
Annual Fees ATM Card Fees “On us” Withdrawal Fees
Fees levied on bank’s own customers for withdrawals from the bank’s own ATMs
“On others” Withdrawal Fees Fees levied on bank’s own customers
for withdrawals from another bank’s ATM
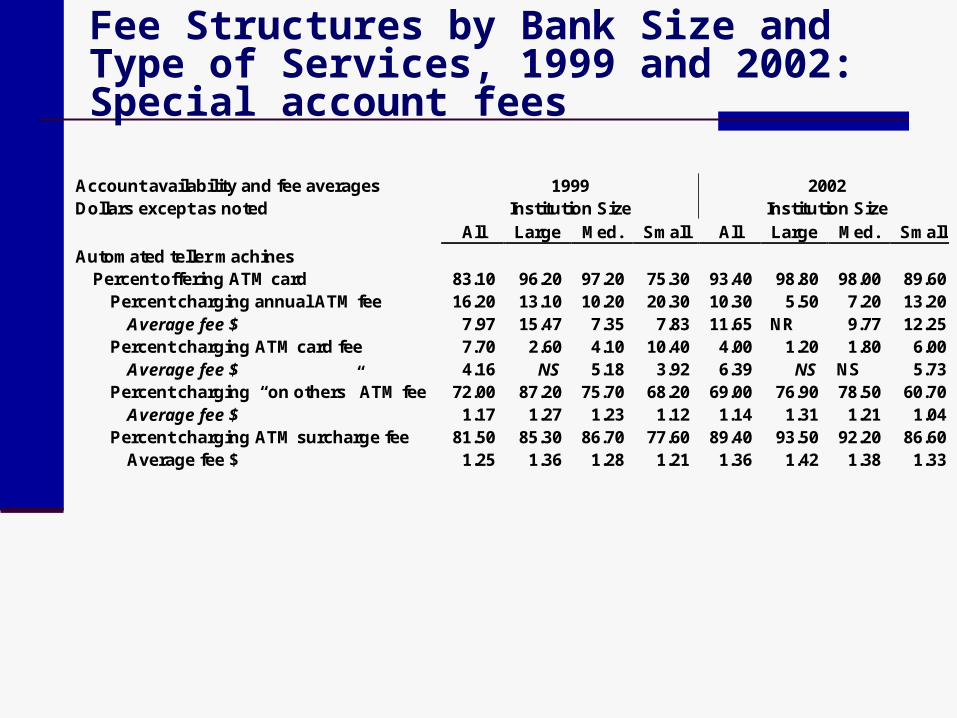
Fee Structures by Bank Size and Type of Services, 1999 and 2002: Special account fees
Account availability and fee averages 1999 2002 Dollars except as noted Institution Size Institution Size All Large Med. Small All Large Med. Small Automated teller machines
Percent offering ATM card 83.10 96.20 97.20 75.30 93.40 98.80 98.00 89.60 Percent charging annual ATM fee 16.20 13.10 10.20 20.30 10.30 5.50 7.20 13.20
Average fee $ 7.97 15.47 7.35 7.83 11.65 NR 9.77 12.25 Percent charging ATM card fee 7.70 2.60 4.10 10.40 4.00 1.20 1.80 6.00
Average fee $ 4.16 NS 5.18 3.92 6.39 NS NS 5.73 Percent charging “on others” ATM fee 72.00 87.20 75.70 68.20 69.00 76.90 78.50 60.70
Average fee $ 1.17 1.27 1.23 1.12 1.14 1.31 1.21 1.04 Percent charging ATM surcharge fee 81.50 85.30 86.70 77.60 89.40 93.50 92.20 86.60
Average fee $ 1.25 1.36 1.28 1.21 1.36 1.42 1.38 1.33
The UBPR lists five components of non-interest expense:
Personnel Expense Occupancy Expense Goodwill Impairment Other Intangible Amortization Other Operating Expense
Cost savings in these areas oftendrive bank mergers
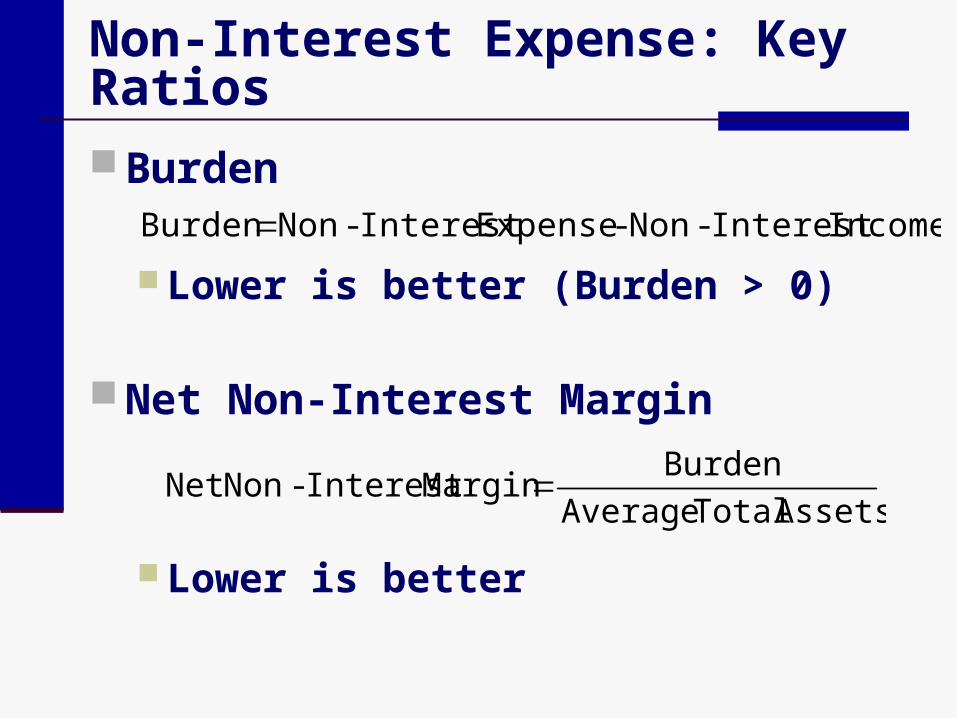
Non-Interest Expense: Key Ratios
Burden
Lower is better (Burden > 0)
Net Non-Interest Margin
Lower is better
Income Interest-Non - Expense Interest-Non Burden
Assets Total AverageBurden Margin Interest-Non Net
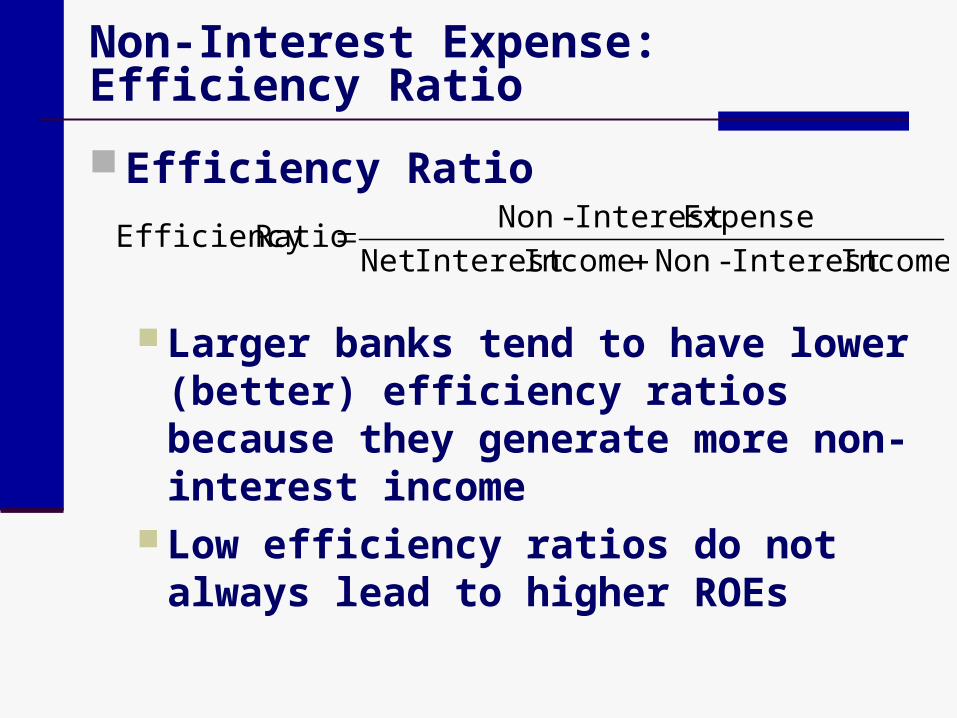
Non-Interest Expense: Efficiency Ratio
Efficiency Ratio
Larger banks tend to have lower (better) efficiency ratios because they generate more non-interest income
Low efficiency ratios do not always lead to higher ROEs
Income Interest-Non Income Interest NetExpense Interest-Non Ratio Efficiency

Efficiency Ratios of U.S. Commercial Banks, 1992–2004
50.0%
55.0%
60.0%
65.0%
70.0%
75.0%
Dec
-92
Dec
-93
Dec
-94
Dec
-95
Dec
-96
Dec
-97
Dec
-98
Dec
-99
Dec
-00
Dec
-01
Dec
-02
Dec
-03
Dec
-04
<$100M
$100M-$1B
>$1B
Effic
ienc
y R
atio
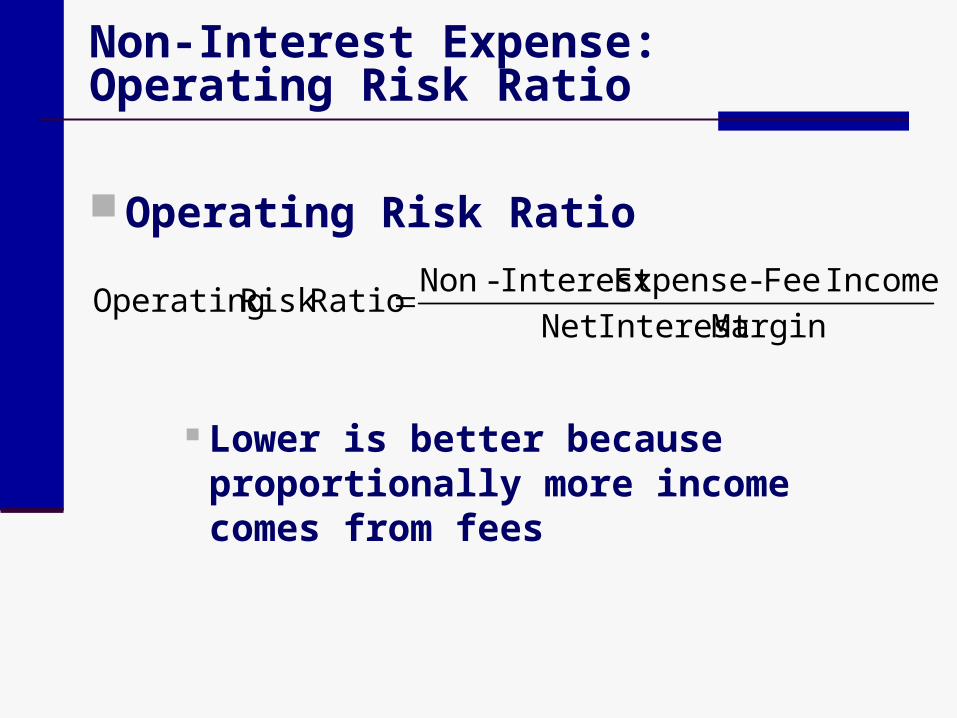
Non-Interest Expense: Operating Risk Ratio
Operating Risk Ratio
Lower is better because proportionally more income comes from fees
Margin Interest NetIncome Fee - Expense Interest-Non Ratio Risk Operating
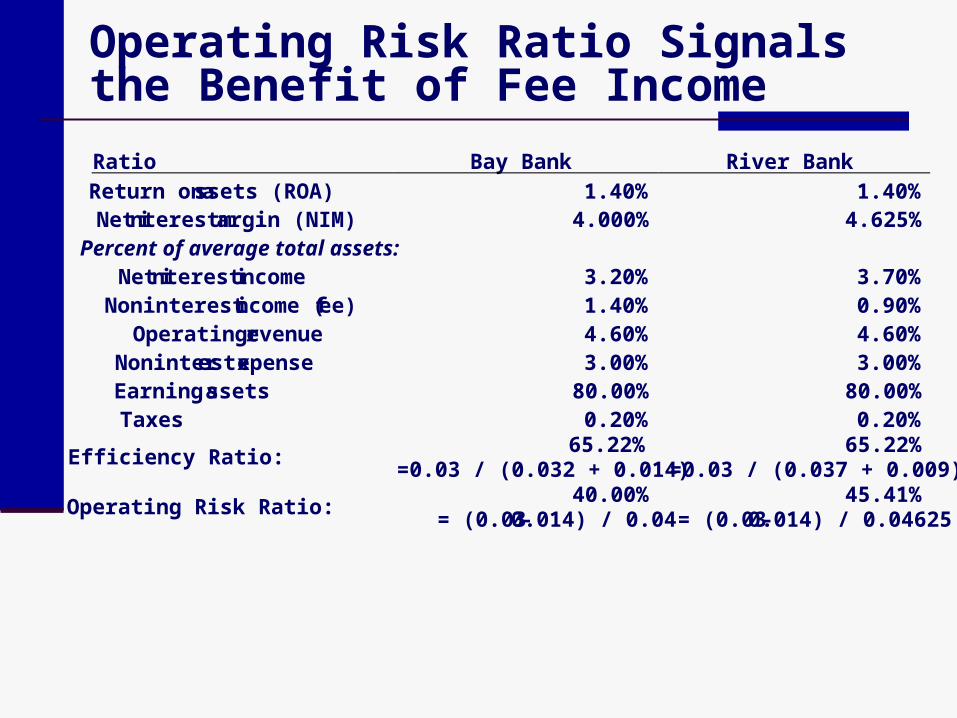
Operating Risk Ratio Signals the Benefit of Fee Income
Ratio Bay Bank River Bank Return on assets (ROA) 1.40% 1.40% Net interest margin (NIM) 4.000% 4.625% Percent of average total assets:
Net interest income 3.20% 3.70% Noninterest income (fee) 1.40% 0.90%
Operating revenue 4.60% 4.60% Noninterest expense 3.00% 3.00% Earning assets 80.00% 80.00% Taxes 0.20% 0.20%
Efficiency Ratio: 65.22% =0.03 / (0.032 + 0.014)
65.22% =0.03 / (0.037 + 0.009)
Operating Risk Ratio: 40.00% = (0.03 - 0.014) / 0.04
45.41% = (0.03 - 0.014) / 0.04625
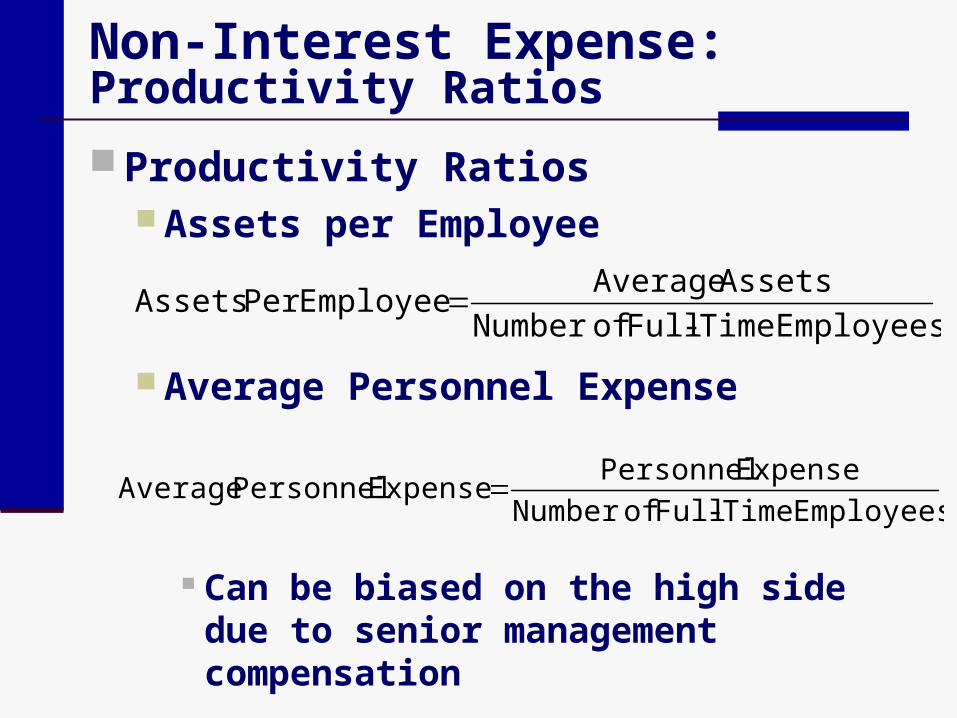
Non-Interest Expense:Productivity Ratios Productivity Ratios
Assets per Employee
Average Personnel Expense
Can be biased on the high side due to senior management compensation
Employees Time-Full of NumberAssets Average Employee Per Assets
Employees Time-Full of NumberExpense Personnel Expense Personnel Average
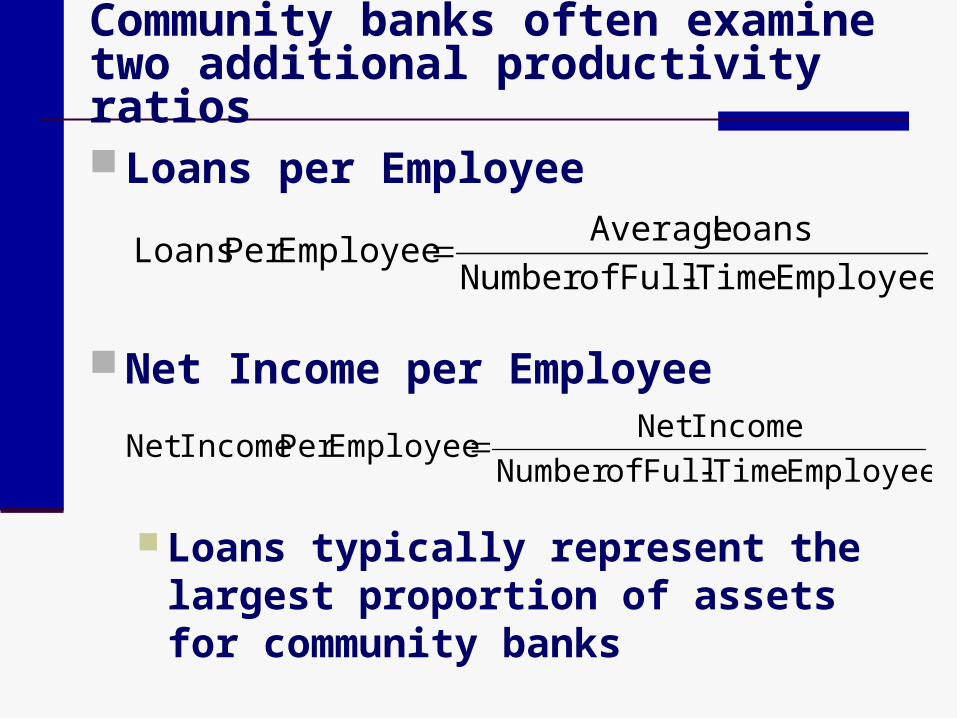
Community banks often examine two additional productivity ratios
Loans per Employee
Net Income per Employee
Loans typically represent the largest proportion of assets for community banks
Employees Time-Full ofNumber Loans Average EmployeePer Loans
Employees Time-Full ofNumber IncomeNet EmployeePer IncomeNet
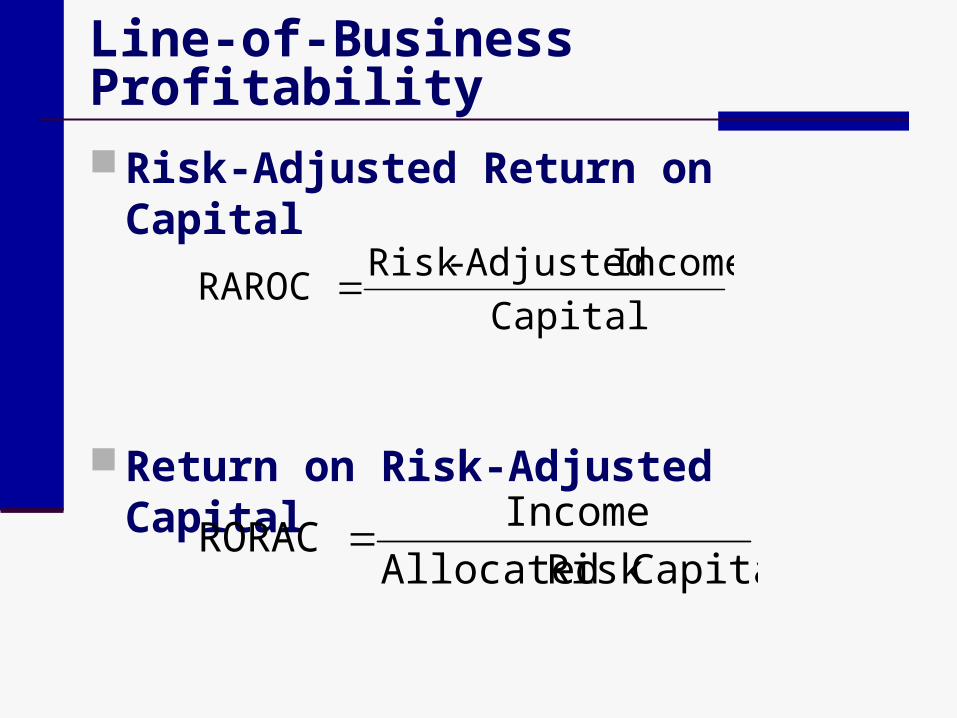
Line-of-Business Profitability
Risk-Adjusted Return on Capital
Return on Risk-Adjusted Capital
CapitalIncome Adjusted -Risk RAROC
CapitalRisk AllocatedIncome RORAC
Customer Profitability
Analyses of customer profitability profiles suggest that banks make most of their profit from a relatively small fraction of customers. View is that 20% of a bank’s customers
account for 80% of profits. This supports the increase in fees
assessed by most banks over the past few years.
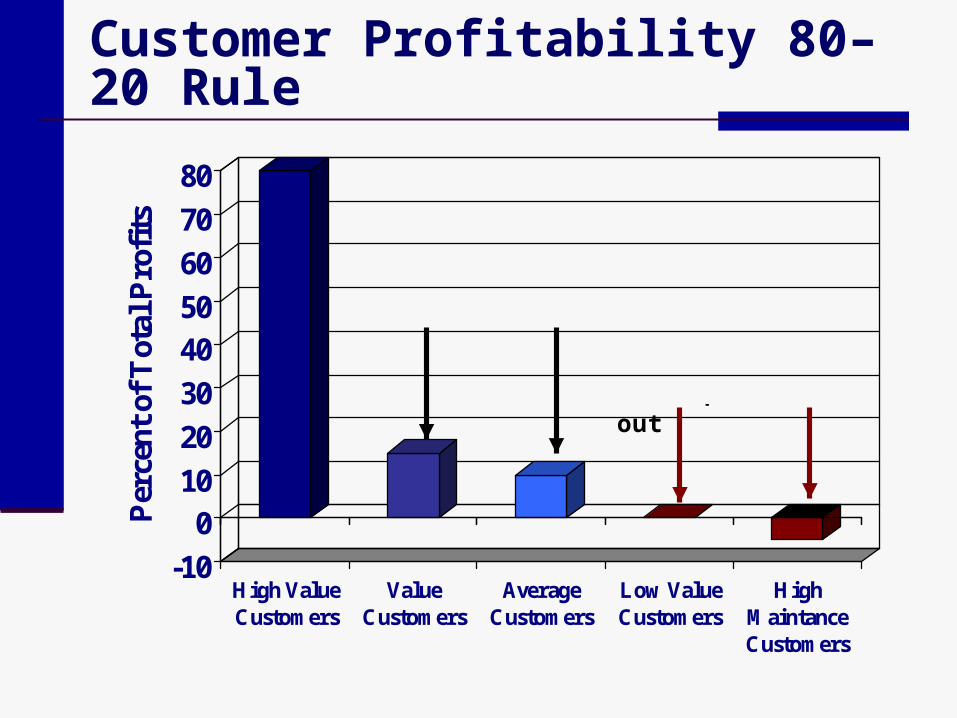
Customer Profitability 80–20 Rule
-100
1020304050607080Pe
rcen
t of T
otal
Pro
fits
High ValueCustomers
ValueCustomers
AverageCustomers
Low ValueCustomers
HighMaintanceCustomers
Who are they, what do they need?
How do you move them up?
Move up or move out
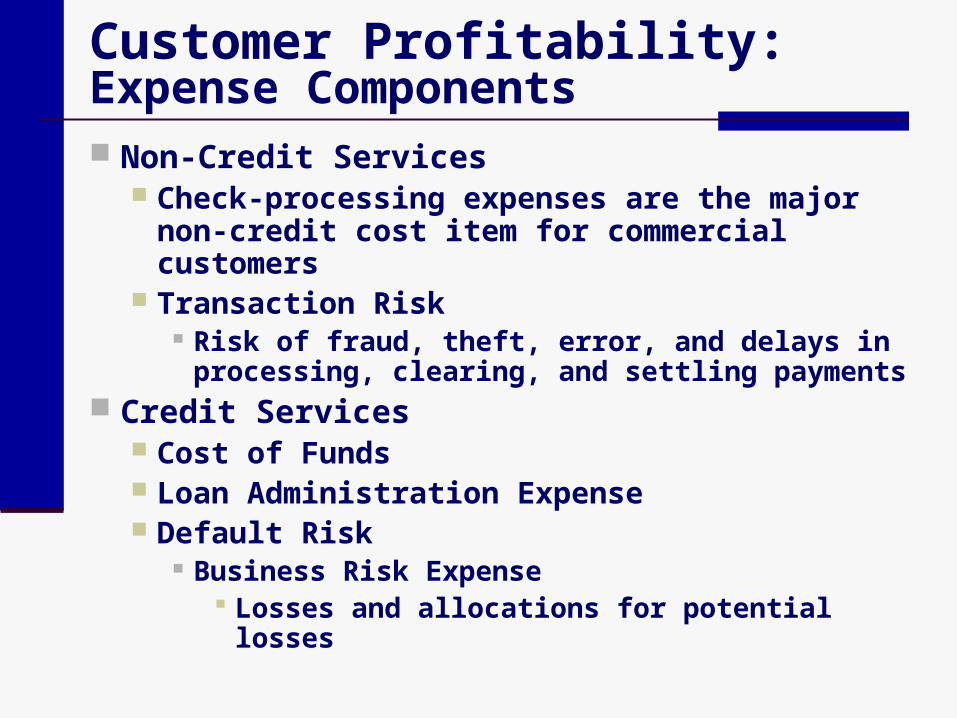
Customer Profitability: Expense Components Non-Credit Services
Check-processing expenses are the major non-credit cost item for commercial customers
Transaction Risk Risk of fraud, theft, error, and delays in
processing, clearing, and settling payments Credit Services
Cost of Funds Loan Administration Expense Default Risk
Business Risk Expense Losses and allocations for potential losses
Customer Profitability:Revenue Components
Investment Income from Deposit Balances Earnings Credit
Non-Interest Income Fee Income
Loan Interest
Customer Profitability:Aggregate Profitability Results
Profitable customers maintain multiple relationships with the bank
Unprofitable customers tend to “shop” for the lowest price and do not use multiple products
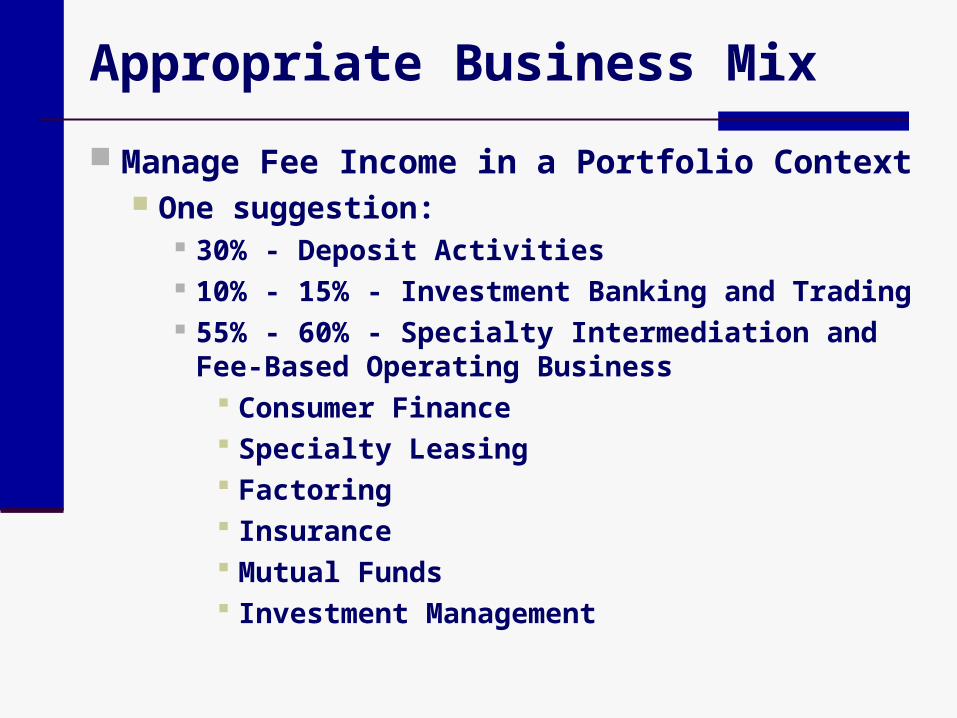
Appropriate Business Mix
Manage Fee Income in a Portfolio Context One suggestion:
30% - Deposit Activities 10% - 15% - Investment Banking and Trading 55% - 60% - Specialty Intermediation and Fee-
Based Operating Business Consumer Finance Specialty Leasing Factoring Insurance Mutual Funds Investment Management
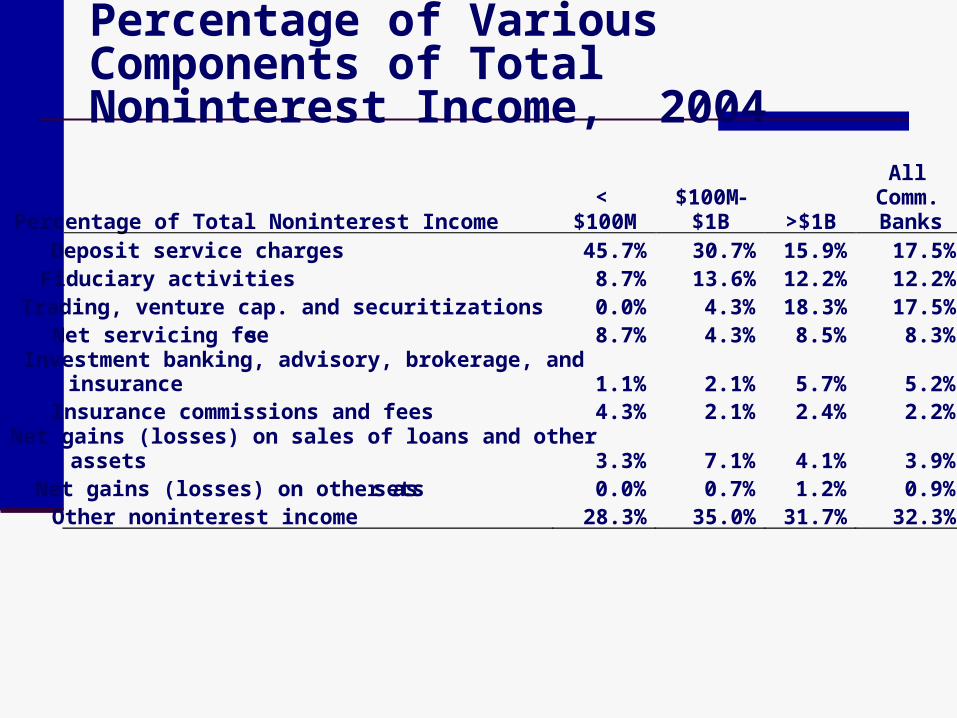
Percentage of Various Components of Total Noninterest Income, 2004
Percentage of Total Noninterest Income <
$100M $100M-
$1B >$1B
All Comm. Banks
Deposit service charges 45.7% 30.7% 15.9% 17.5% Fiduciary activities 8.7% 13.6% 12.2% 12.2% Trading, venture cap. and securitizations 0.0% 4.3% 18.3% 17.5% Net servicing fees 8.7% 4.3% 8.5% 8.3% Investment banking, advisory, brokerage, and insurance 1.1% 2.1% 5.7% 5.2% Insurance commissions and fees 4.3% 2.1% 2.4% 2.2% Net gains (losses) on sales of loans and other assets 3.3% 7.1% 4.1% 3.9% Net gains (losses) on other assets 0.0% 0.7% 1.2% 0.9% Other noninterest income 28.3% 35.0% 31.7% 32.3%
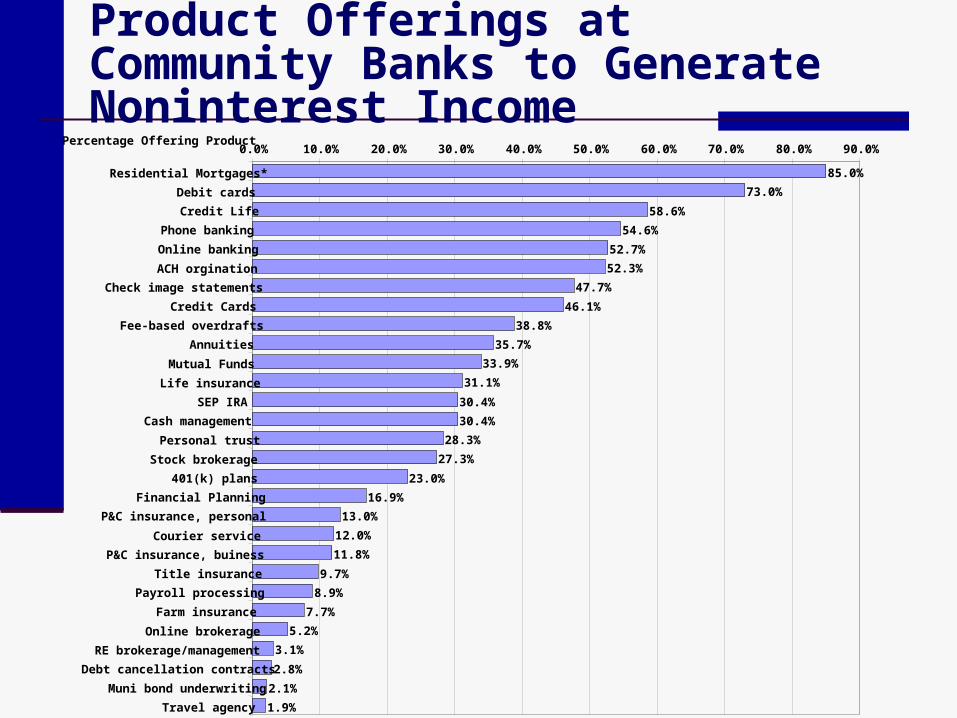
Product Offerings at Community Banks to Generate Noninterest Income
Percentage Offering Product
85.0%73.0%
58.6%54.6%
52.7%52.3%
47.7%46.1%
38.8%35.7%
33.9%31.1%
30.4%30.4%
28.3%27.3%
23.0%16.9%
13.0%12.0%11.8%
9.7%8.9%
7.7%5.2%
3.1%2.8%
2.1%1.9%
0.0% 10.0% 20.0% 30.0% 40.0% 50.0% 60.0% 70.0% 80.0% 90.0%
Residential Mortgages*Debit cardsCredit Life
Phone bankingOnline bankingACH orgination
Check image statementsCredit Cards
Fee-based overdraftsAnnuities
Mutual FundsLife insurance
SEP IRACash management
Personal trustStock brokerage
401(k) plansFinancial Planning
P&C insurance, personalCourier service
P&C insurance, buinessTitle insurance
Payroll processingFarm insurance
Online brokerageRE brokerage/managementDebt cancellation contracts
Muni bond underwritingTravel agency
Strategies to Manage Non-Interest Expense
Cost Management Strategies Expense Reduction Operating Efficiencies Revenue Enhancement
Cost Management StrategiesExpense Reduction Be careful not to just focus on reducing
costs, rather, move them in line with strategic objectives.
Begin by identifying excessive expenses and eliminating them Largest non-interest expenses are personnel,
occupancy, and data processing costs. These are often the areas where cuts are initially made.
Outsourcing
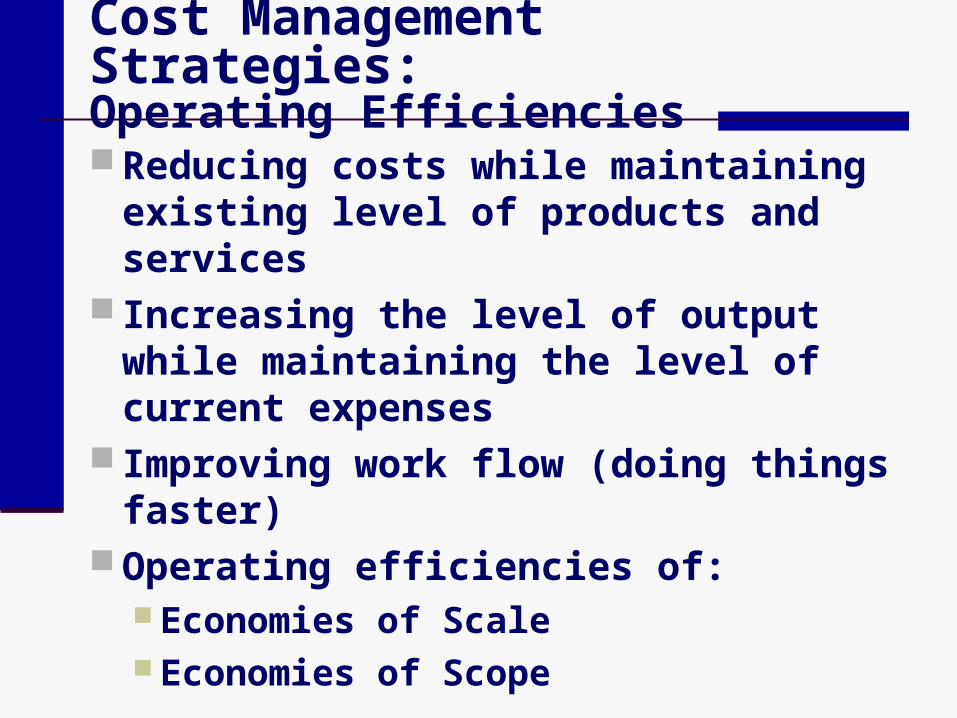
Cost Management Strategies:Operating Efficiencies Reducing costs while maintaining
existing level of products and services Increasing the level of output while
maintaining the level of current expenses
Improving work flow (doing things faster)
Operating efficiencies of: Economies of Scale Economies of Scope
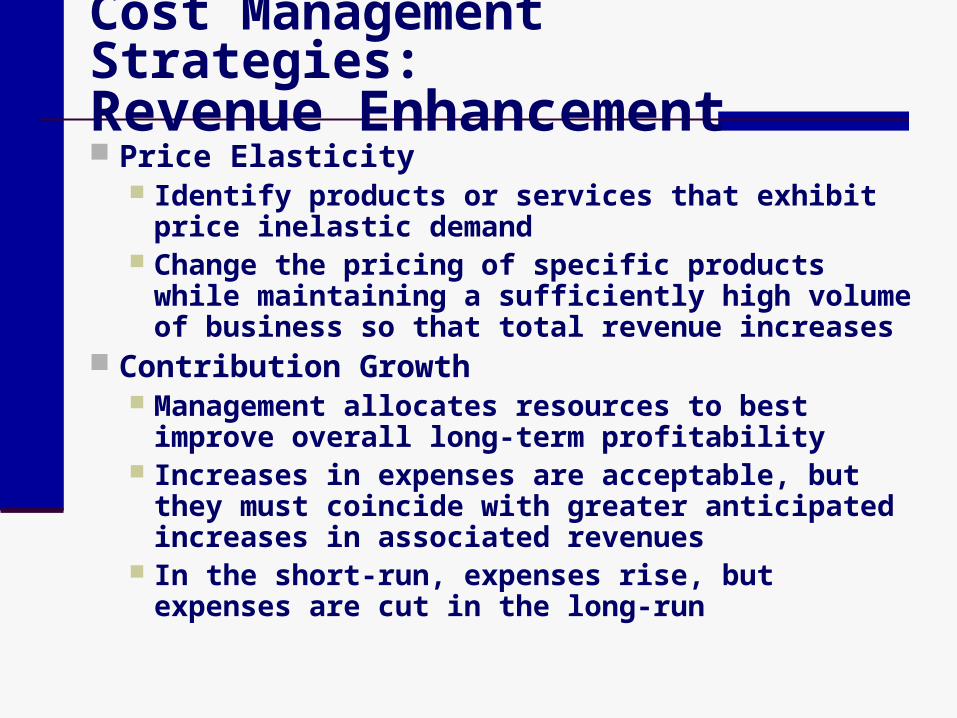
Cost Management Strategies:Revenue Enhancement Price Elasticity
Identify products or services that exhibit price inelastic demand
Change the pricing of specific products while maintaining a sufficiently high volume of business so that total revenue increases
Contribution Growth Management allocates resources to best improve
overall long-term profitability Increases in expenses are acceptable, but they must
coincide with greater anticipated increases in associated revenues
In the short-run, expenses rise, but expenses are cut in the long-run

William Chittenden edited and updated the PowerPoint slides for this edition.
MANAGING NONINTEREST INCOME & NONINTEREST EXPENSE
Chapter 3
Bank ManagementBank Management, 6th edition.6th edition.Timothy W. Koch and S. Scott MacDonaldTimothy W. Koch and S. Scott MacDonaldCopyright © 2006 by South-Western, a division of Thomson Learning