Embed Size (px)
Citation preview
SOCIETY FOR MINING, METALLURGY, AND EXPLORATION VOL. 316 • TRANSACTIONS 200443
Managing risk and waste mining in long-termproduction scheduling of open-pit mines
M. Godoy and R. DimitrakopoulosPh.D. researcher, and professor and director, respectively, W.H. Bryan Mining Geology
Research Centre, The University of Queensland, Brisbane, Queensland, Australia
AbstractOpen pit mine design and production scheduling deals with the quest for the most profitable mining sequenceover the life of a mine. The dynamics of mining ore and waste and the spatial grade uncertainty makepredictions of the optimal mining sequence a challenging task. A new optimization approach to productionscheduling based on the effective management of waste mining and orebody grade uncertainty is presented.The approach considers an economic model, mining specifics including production equipment and theintegration of multiple equally possible representations of an orebody. The utilization of grade uncertaintyand optimal mining rates leads to production schedules that meet targets whilst being risk resilient andgenerating substantial improvements in project net present value. A case study from a large gold minedemonstrates the approach.
IntroductionValuation and related decision-making in surface miningprojects require the assessment and management of orebodyrisk in the generation of a pit design and a long-term produc-tion schedule. As the most profitable mining sequence overthe life of a mine determines both the economic outcome of aproject and the technical plan to be followed from minedevelopment to mine closure, the effect of orebody risk onperformance is critical (Ravenscroft, 1992; Dowd, 1994;Rendu, 2002). Geological risk is a major contributor in notmeeting expectations in the early stages of a project (Vallee,2000), when repayment of development capital is vital, aswell as to production shortfalls in later years of operation(Rossi and Parker, 1994).
The adverse effects of orebody uncertainty on the tradi-tional optimization of pit designs and corresponding keyproject performance indicators are documented in variousstudies (e.g., Dowd, 1997; Dimitrakopoulos et al., 2002;Farrelly, 2002). These past efforts deal with the use of stochas-tic simulation methods in assessing project risk for a givenmine design and mining sequence. They do not, however,address the generation of optimal conditions under uncer-tainty, long-term production schedules or operational issuesand interactions of ore and waste within the orebody spaceover the life of the mine. New integrated approaches can bedeveloped to effectively deal with orebody uncertainty inproduction scheduling while maximizing cash flows, and maybe based on two elements. The first element is the ability torepresent orebody uncertainty through the stochastic simula-tion of multiple, equally probable deposit models. Althoughthe technologies are available (e.g., Dimitrakopoulos, 2002),the use of multiple orebody models for production scheduling,instead of a single model, is not a trivial exercise. Generally,traditional optimization formulations are not compatible withstochastic modeling approaches. The second element in deal-
ing with risk is a modified optimization framework that, whilecompatible with orebody uncertainty, integrates a variety ofmining issues, particularly management of waste, equipmentutilization, mill demand, and technological, financial andenvironmental constraints.
This paper presents a novel optimization approach that isshown to effectively integrate grade uncertainty into theoptimization of long-term production scheduling in open pitmines. The approach is founded on the following two keyelements:
• a framework for long-term production scheduling basedon the concept of a “stable solution domain” and
• a new scheduling algorithm based on simulated an-nealing.
The approach generates “100% confidence” in the con-tained ore reserves, given the understanding of the orebodyand minimizes deviations from production targets to accept-able ranges.
Related to the approach presented herein are concepts inTan and Ramani (1992) and in Rzhenevisky (1968), whereopen pit production scheduling is seen as the determination ofa sequence of depletion schedules in which at least two typesof products, ore and waste, are removed to meet the mine’sdemand. The optimal schedule maximizes the net presentvalue (NPV) of the project subject to constraints, including:
• feasible combinations of ore and waste production(stripping ratio) and
• ore production rates that meet mill feed requirements.
At the same time, an optimal schedule defers waste miningas long as possible and, in doing so, considers the miningequipment and capacity available. This approach is limited in
Nonmeeting paper number 03-327. Original manuscript submitted for review August 2003 and accepted for publicationJanuary 2004. Discussion of this peer-reviewed and approved paper is invited and must be submitted to SME PublicationsDept. prior to Sept 30, 2005. Copyright 2004, Society for Mining, Metallurgy, and Exploration, Inc.
TRANSACTIONS 2004 • VOL. 316 SOCIETY FOR MINING, METALLURGY, AND EXPLORATION44
that no physical mining schedule is produced and issues ofuncertainty are not addressed, as they are in the approachpresented herein. Godoy (2003) provides a detailed review ofpast work and new applications in the context of the nestedLerchs-Grossman algorithm and nested pits that can be minedindependently (Whittle and Rozman, 1991; Hustrulid andKuchta, 1995).
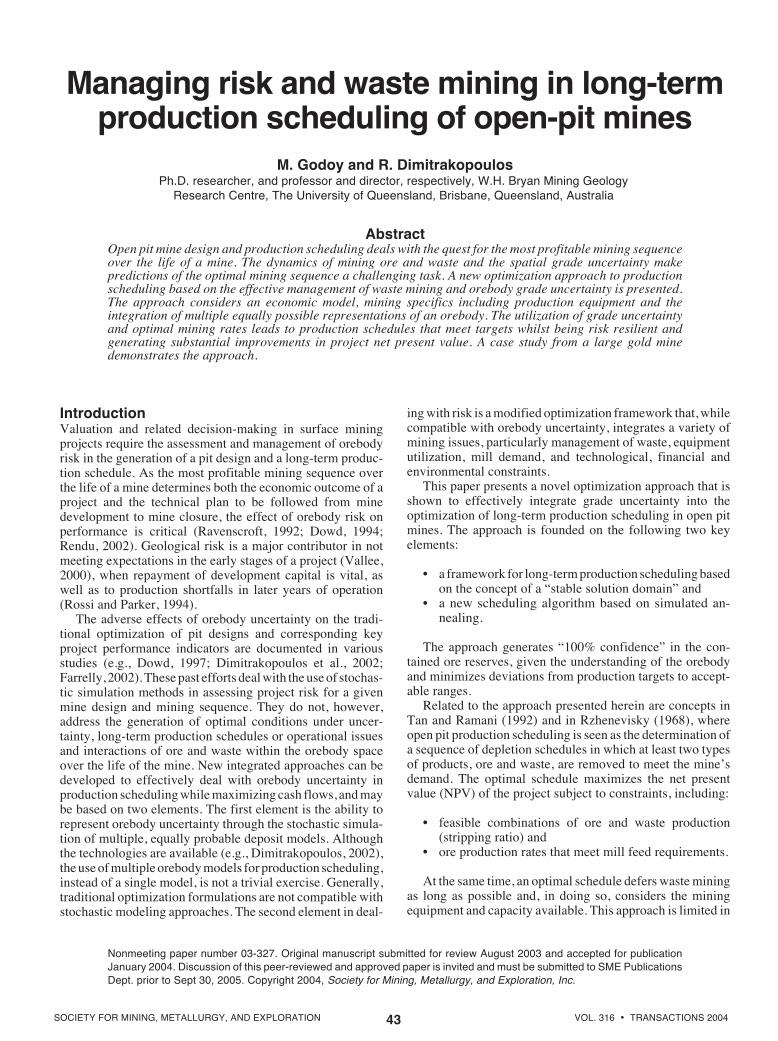
It should be noted that an optimal long-term mine produc-tion schedule can be found within a “domain of feasiblesolutions,” that is, within combinations of ore and waste thatcan be produced from a specific orebody. The nested pitoptimization framework, mentioned above, establishes thisdomain based on two extreme cases of mining waste defer-ment. The worst mining case (Fig. 1 (a)), where a bench ismined out before starting the next, is producing the maximumquantity of waste from the pit needed to recover a certain
amount of ore (highest stripping ratio). This schedule showsa poor NPV as the expense for mining waste at the peripheryof the pit is incurred early, and thus discounted little, whereasthe income from mining ore at the bottom of the pit is delayedfor later periods and, thus, is heavily discounted. The oppositehappens in the best mining case (Fig. 1 (b)), corresponding tothe sequential mining of the independent nested pits, wheremining occurs in each successive bench of the smallest pit andthen each successive bench of the next pit and so on. Thisschedule has the lowest stripping ratio and highest NPV,whilst providing the necessary working room and safetyconditions for mining operations. The intermediate miningschedule in Fig. 1 (c) shows mining of the first bench leadingto the commencement of mining in the next cutback.
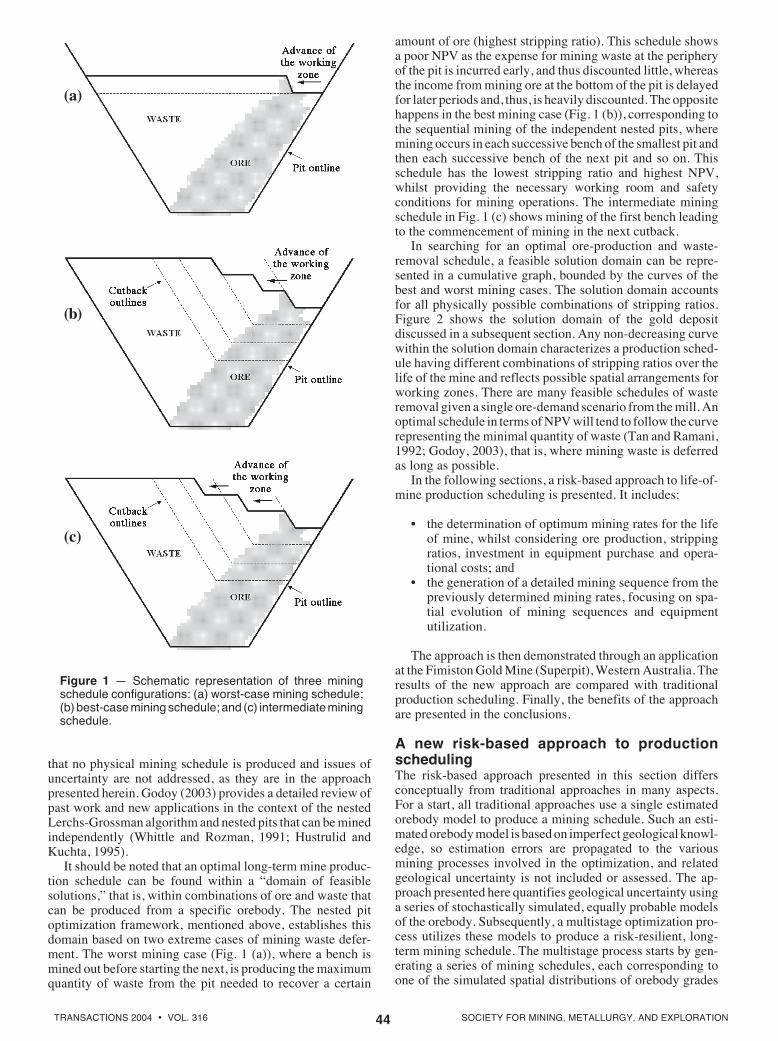
In searching for an optimal ore-production and waste-removal schedule, a feasible solution domain can be repre-sented in a cumulative graph, bounded by the curves of thebest and worst mining cases. The solution domain accountsfor all physically possible combinations of stripping ratios.Figure 2 shows the solution domain of the gold depositdiscussed in a subsequent section. Any non-decreasing curvewithin the solution domain characterizes a production sched-ule having different combinations of stripping ratios over thelife of the mine and reflects possible spatial arrangements forworking zones. There are many feasible schedules of wasteremoval given a single ore-demand scenario from the mill. Anoptimal schedule in terms of NPV will tend to follow the curverepresenting the minimal quantity of waste (Tan and Ramani,1992; Godoy, 2003), that is, where mining waste is deferredas long as possible.
In the following sections, a risk-based approach to life-of-mine production scheduling is presented. It includes:
• the determination of optimum mining rates for the lifeof mine, whilst considering ore production, strippingratios, investment in equipment purchase and opera-tional costs; and
• the generation of a detailed mining sequence from thepreviously determined mining rates, focusing on spa-tial evolution of mining sequences and equipmentutilization.
The approach is then demonstrated through an applicationat the Fimiston Gold Mine (Superpit), Western Australia. Theresults of the new approach are compared with traditionalproduction scheduling. Finally, the benefits of the approachare presented in the conclusions.
A new risk-based approach to productionschedulingThe risk-based approach presented in this section differsconceptually from traditional approaches in many aspects.For a start, all traditional approaches use a single estimatedorebody model to produce a mining schedule. Such an esti-mated orebody model is based on imperfect geological knowl-edge, so estimation errors are propagated to the variousmining processes involved in the optimization, and relatedgeological uncertainty is not included or assessed. The ap-proach presented here quantifies geological uncertainty usinga series of stochastically simulated, equally probable modelsof the orebody. Subsequently, a multistage optimization pro-cess utilizes these models to produce a risk-resilient, long-term mining schedule. The multistage process starts by gen-erating a series of mining schedules, each corresponding toone of the simulated spatial distributions of orebody grades
Figure 1 — Schematic representation of three miningschedule configurations: (a) worst-case mining schedule;(b) best-case mining schedule; and (c) intermediate miningschedule.
(a)
(c)
(b)
SOCIETY FOR MINING, METALLURGY, AND EXPLORATION VOL. 316 • TRANSACTIONS 200445
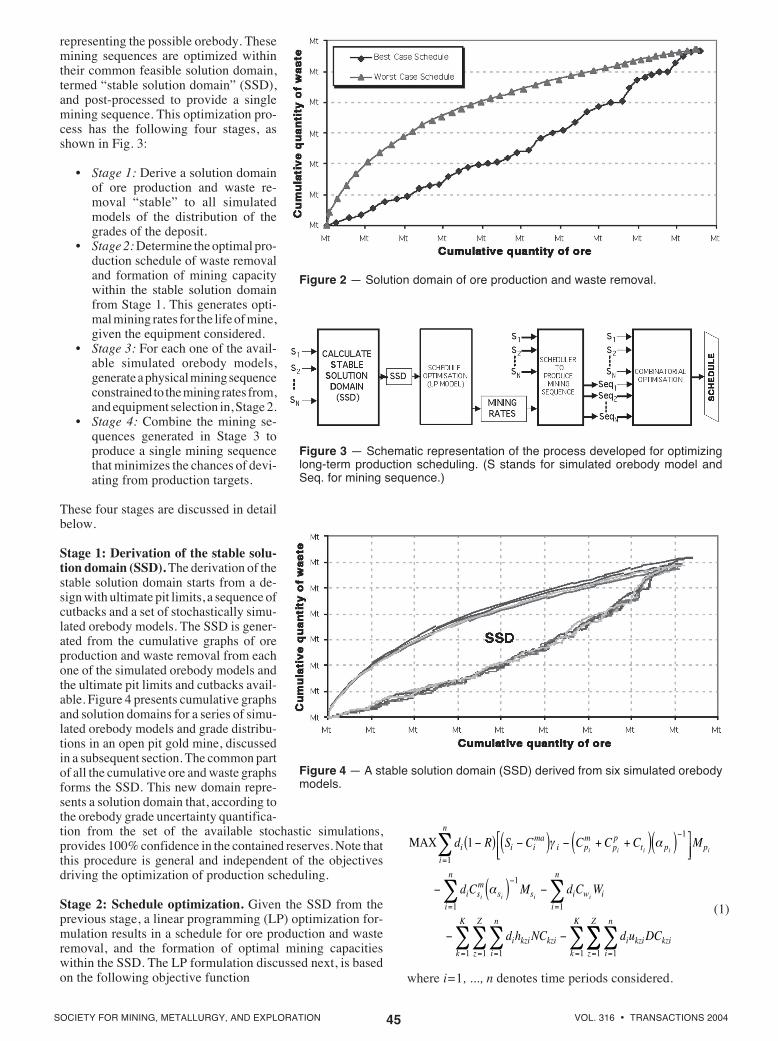
representing the possible orebody. Thesemining sequences are optimized withintheir common feasible solution domain,termed “stable solution domain” (SSD),and post-processed to provide a singlemining sequence. This optimization pro-cess has the following four stages, asshown in Fig. 3:
• Stage 1: Derive a solution domainof ore production and waste re-moval “stable” to all simulatedmodels of the distribution of thegrades of the deposit.
• Stage 2: Determine the optimal pro-duction schedule of waste removaland formation of mining capacitywithin the stable solution domainfrom Stage 1. This generates opti-mal mining rates for the life of mine,given the equipment considered.
• Stage 3: For each one of the avail-able simulated orebody models,generate a physical mining sequenceconstrained to the mining rates from,and equipment selection in, Stage 2.
• Stage 4: Combine the mining se-quences generated in Stage 3 toproduce a single mining sequencethat minimizes the chances of devi-ating from production targets.
These four stages are discussed in detailbelow.
Stage 1: Derivation of the stable solu-tion domain (SSD). The derivation of thestable solution domain starts from a de-sign with ultimate pit limits, a sequence ofcutbacks and a set of stochastically simu-lated orebody models. The SSD is gener-ated from the cumulative graphs of oreproduction and waste removal from eachone of the simulated orebody models andthe ultimate pit limits and cutbacks avail-able. Figure 4 presents cumulative graphsand solution domains for a series of simu-lated orebody models and grade distribu-tions in an open pit gold mine, discussedin a subsequent section. The common partof all the cumulative ore and waste graphsforms the SSD. This new domain repre-sents a solution domain that, according tothe orebody grade uncertainty quantifica-tion from the set of the available stochastic simulations,provides 100% confidence in the contained reserves. Note thatthis procedure is general and independent of the objectivesdriving the optimization of production scheduling.
Stage 2: Schedule optimization. Given the SSD from theprevious stage, a linear programming (LP) optimization for-mulation results in a schedule for ore production and wasteremoval, and the formation of optimal mining capacitieswithin the SSD. The LP formulation discussed next, is basedon the following objective function
MAX d R S C C C C M
d C M d C W
d h NC d u DC
i i ima
i pm
pp
t p p
i
n
i sm
s s i w i
i
n
i
n
i kzi kzi i kzi kzii
n
z
Z
i i i i i
i i i i
11
1
1
11
11
−( ) −( ) − + +( )( )
− ( ) −
− −
−
=
−
==
==
∑
∑∑
∑
γ α
α
∑∑∑∑∑∑==== k
K
i
n
z
Z
k
K
1111
(1)
where i=1, ..., n denotes time periods considered.
Figure 4 — A stable solution domain (SSD) derived from six simulated orebodymodels.
Figure 3 — Schematic representation of the process developed for optimizinglong-term production scheduling. (S stands for simulated orebody model andSeq. for mining sequence.)
Figure 2 — Solution domain of ore production and waste removal.

TRANSACTIONS 2004 • VOL. 316 SOCIETY FOR MINING, METALLURGY, AND EXPLORATION46
Definitions of constants and variables in the objectivefunction and constraints are given in Tables 1 and 2.
The objective function Eq. (1) corresponds to the schedule’seconomic outcome on the basis of discounted cash flowanalysis, before taxation and without treatment of relateddepreciation and depletion allowances. The objective func-tion represents a mining operation where the secondary ore isonly stockpiled. The main variables of the optimization modelare the time-related primary ore metal, secondary ore metaland waste. While the variables corresponding to the wastequantities allow for the ore-waste relation to be optimizedover time, the metal variables allow for the metal quantities tobe optimized. The metal optimization accounts for the orequality at different parts of the orebody. The remainingvariables of the optimization model are the added capacity anddecreased capacity of each type and model of the mineequipment, which deals with the stabilization of the mining
rate over time as a function of capacity.Mining rates are also stabilized through
the economic parameters of unit purchaseand ownership costs of each type andmodel of equipment. The unit purchasecost is determined by the value of theequipment divided by its production ca-pacity. The unit ownership cost is deter-mined by the ownership cost of the equip-ment divided by the production capacity.Thus, the penalty for decreased capacityis defined as being equivalent to the own-ership cost, which reflects a penalty forhaving idle equipment. In this context,the stabilization of the mining rate overtime is determined as a search for thebalance between the purchase and owner-ship costs of the production capacity andrepresents a direct incorporation of thecapital investments in the optimization.As noted above, although developed in adifferent context, the LP formulation re-lates conceptually to that in Tan andRamani (1992). It is also analyzed indetail in Godoy (2003).
Figure 5 displays the SSD and a typi-cal solution produced by the LP model.This optimum solution corresponds to aproduction schedule that maximizes theNPV within the SSD. This is unique in thesense that the geological uncertainty hasbeen effectively integrated into the opti-mization process.
Stage 3: Mining sequencing. The LP inStage 2 generates a set of optimal miningrates. The third stage uses these miningrates to produce a series of physical pro-duction schedules that describe the de-tailed spatial evolution of the workingzones in the pit over the life of the mine.The sequencing needs to obey slope con-straints, needs to consider equipment uti-lization and needs to meet mill require-ments while matching the mining ratespreviously derived. Any scheduling algo-rithm that accommodates these criteriamay be used.
This stage generates multiple mining sequences, one foreach simulated grade model representing the orebody. Thealternative mining sequences present two characteristics thatallow the derivation of a single mining sequence. Thesecharacteristics are that all schedules are technically feasiblesolutions that maximize the project’s NPV within a commonsolution domain; and that all schedules are based on distinctbut equally probable models of the spatial distribution ofgrades within the deposit.
Stage 4: Combinatorial optimization. The fourth stageconsiders the production schedules generated in Stage 3 andderives a single mining sequence. A combinatorial optimiza-tion algorithm based on simulated annealing has been devel-oped and is outlined here. The basic idea in simulated anneal-ing is to continuously perturb a suboptimal configuration untilit matches some prespecified characteristics coded into an
Primary and secondary ore metal
Secondary ore metal
Waste quantity to be removed
Added capacity for k-th type, z-th model of production equipment
Decreased capacity for k-th type, z-th model of production equipment
Mpi
Msi
Wi
NCkzi
DCkzi
Constant Definition
Table 1 — LP model variables in objective function Eq. (1).
Number of time periods to be considered
Number of types of mining equipments
Number of total types of equipment
Number of models of production equipment
Discount factor di = (1+r)-i, where r is the interest rate
Selling price of metal
Unit mining costs of primary and secondary ore
Unit processing costs; primary and secondary ore
Unit mining cost of waste removal
Marketing cost per unit payable metal
Royalty as percent of the net revenue
Primary and secondary ore metal grade
Total recovery of the payable metal
Time costs for operating support services
Capacity limit of k-th type and j-th model of production equipment
Unit purchase cost of k-th type, z-th model of mine equipment
Unit ownership cost of k-th type, z-th model of mine equipment
n
Z
K
J
di
Si
C Cpm
sm
i i,
C Cpp
sp
i i,
Cwi
Cima
R
α αp si i,
γi
Cti
Ckjmax
hkzi
ukzi
Constant Definition
Table 2 — LP model constants in objective function Eq. (1).

SOCIETY FOR MINING, METALLURGY, AND EXPLORATION VOL. 316 • TRANSACTIONS 200447
objective function (Kirkpatrick et al.,1983). Each perturbation is accepted ornot depending on whether it carries theobjective function value towards a pre-defined minimum. To avoid local minima,some unfavorable perturbations maybeaccepted based on a probability distribu-tion (Metropolis et al., 1953).
The annealing formulation first se-lects an initial mining sequence, whereblocks with maximum probability (e.g.,95%) of belonging to a given miningperiod are frozen to that period and notconsidered further in the combinatorialoptimization process. Block probabilitiesare calculated from the results of Stage 3.The initial sequence is perturbed by ran-dom swapping of (nonfrozen) blocks be-tween the candidate mining periods. Fa-vorable perturbations lower the objectivefunction and are accepted; unfavorableperturbations are accepted using an exponential probabilitydistribution. Annealing stops when perturbations no longerlower the objective function or when a specified minimumobjective function value is reached.
The objective function is a measure of the differencebetween the desired characteristics and those of a candidatemining sequence. Consider, for example, the objective ofmeeting a series of optimal mining rates derived in Stage 2,i.e., the prescription of ore production and waste removal forthe life of the mine. If a mining sequence achieves thatobjective for all the equally probable simulated orebodymodels, there is a 100% chance that the production targets willbe met, given the knowledge of the orebody as represented inthe simulations. An objective function is built to measure theaverage deviation from the production targets for a givenmining sequence over a series of simulated orebody grademodels. The objective function is defined as the sum ofcomponents representing mining periods
O On
n
N
==∑
1(2)
whereOn, n=1,…,N are component objective functions andN is the total number of production schedule periods.
For each n component (period), the objective functionmeasures the average deviation of ore and waste production
θn s*( ) and ωn s*( )of the perturbed mining sequence from thetarget productions θn(s) and ωn(s) over the S simulated grademodels, with s=1, …, S
OS
s sS
s sn n n n n
s
S
s
S
= ( ) − ( ) + ( ) − ( )==∑∑1 1
11
θ θ ω ω* *(3)
The decision to accept or reject a perturbation is based onthe change to the objective function,
∆ ∆O On
n
N
==∑
1(4)
The resulting sequence meets the production target foreach period with minimum chance of deviation. That is, this
mining sequence will achieve the production targets, withinthe prescribed mining rates, given any of the simulatedorebodies. None of the individual mining sequences fromStep 3 will meet these requirements. Note that the objectivefunction can be modified to include other production targets,such as head grade, metal quantities and blending require-ments. An important aspect of the procedure is the mechanismof swapping blocks. To ensure the final solution avoidsphysically inaccessible blocks in any period, the perturbationmechanism must be set to recognize the spatial evolution ofthe mining sequence. To achieve this, the perturbation mecha-nism is defined so as to restrict the candidate periods, of anygiven block, to only those having physical access to the blockwithout violating slope constraints (Godoy, 2003).
Application in a large open pit gold mineThe practical aspects of the proposed method were tested in acase study using data from the Fimiston open pit (Superpit) inWestern Australia. Fimiston is operated by Kalgoorlie Con-solidated Gold Mines. The gold deposit is an intensely miner-alized shear system developed largely within the so-calledGolden Mile dolerite. The mineralization is localized in mainlysteeply dipping, NNW to NW striking lodes, consisting of ahigh-grade lode shear zone and a lower-grade alteration halo.Gold lodes can be up to 1,800 m (5,900 ft) long, have verticalextents of 1,200 m (3,900 ft) and be up to 10 m (33 ft) wide.The Fimiston pit is a conventional open pit, truck-and-loaderoperation. It has a mining rate of approximately 85 Mt (94million st) per year, making it the single largest open pitoperation in Australia, on a tons per year basis. Of this, some12 Mt (13 million st) of ore are produced and milled throughthe Fimiston mill. The mill currently consists of a grind-floatcircuit for processing refractory sulfide ore, electrowinning,smelting and then pouring of gold bullion.
The orebody block model used in this application included648 individual mineralized lodes discretized into 321,937 oreblocks. Block grades were simulated 20 times using the directblock sequential simulation method (Godoy, 2003). For sched-uling, all models were reblocked to 20 x 20 x 20-m blocks.
It is important to note that the determination of the ultimatepit limits and cutbacks is outside the scope of this application.The risk-based schedule developed was based on predefinedultimate pit limits and sequence of cutbacks, which werederived using the traditional block model of the deposit and
Figure 5 — Optimal solution (green curve) obtained inside the SSD, derived froma series of simulated resource models.
TRANSACTIONS 2004 • VOL. 316 SOCIETY FOR MINING, METALLURGY, AND EXPLORATION48
production and waste removal (Fig. 5).The schedule of ore production was iden-tified with the mill demand over 15 pro-duction periods and is shown by the dottedline in Fig. 6. It is important to note that thefluctuations in ore production do not indi-cate a variable mill production rate. Themill production rate is constant over thelife of the mine. Periods characterized by areduction in ore demand only indicate in-put of ore from other sources, such asunderground operations.
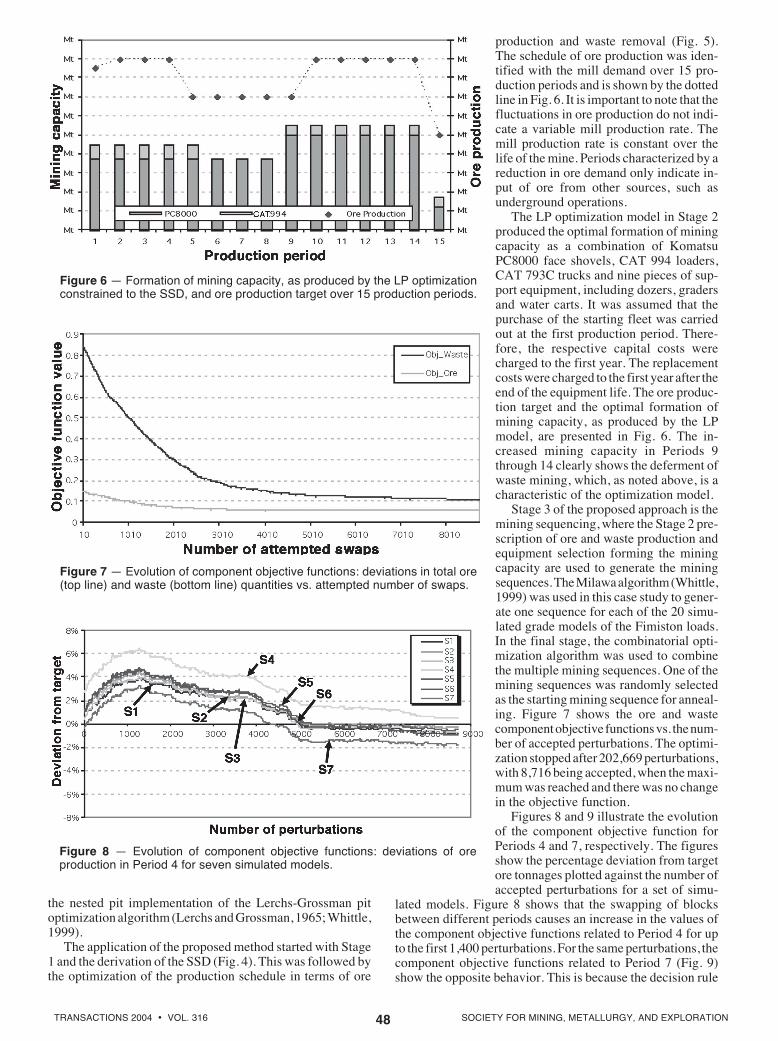
The LP optimization model in Stage 2produced the optimal formation of miningcapacity as a combination of KomatsuPC8000 face shovels, CAT 994 loaders,CAT 793C trucks and nine pieces of sup-port equipment, including dozers, gradersand water carts. It was assumed that thepurchase of the starting fleet was carriedout at the first production period. There-fore, the respective capital costs werecharged to the first year. The replacementcosts were charged to the first year after theend of the equipment life. The ore produc-tion target and the optimal formation ofmining capacity, as produced by the LPmodel, are presented in Fig. 6. The in-creased mining capacity in Periods 9through 14 clearly shows the deferment ofwaste mining, which, as noted above, is acharacteristic of the optimization model.
Stage 3 of the proposed approach is themining sequencing, where the Stage 2 pre-scription of ore and waste production andequipment selection forming the miningcapacity are used to generate the miningsequences. The Milawa algorithm (Whittle,1999) was used in this case study to gener-ate one sequence for each of the 20 simu-lated grade models of the Fimiston loads.In the final stage, the combinatorial opti-mization algorithm was used to combinethe multiple mining sequences. One of themining sequences was randomly selectedas the starting mining sequence for anneal-ing. Figure 7 shows the ore and wastecomponent objective functions vs. the num-ber of accepted perturbations. The optimi-zation stopped after 202,669 perturbations,with 8,716 being accepted, when the maxi-mum was reached and there was no changein the objective function.
Figures 8 and 9 illustrate the evolutionof the component objective function forPeriods 4 and 7, respectively. The figuresshow the percentage deviation from targetore tonnages plotted against the number ofaccepted perturbations for a set of simu-
lated models. Figure 8 shows that the swapping of blocksbetween different periods causes an increase in the values ofthe component objective functions related to Period 4 for upto the first 1,400 perturbations. For the same perturbations, thecomponent objective functions related to Period 7 (Fig. 9)show the opposite behavior. This is because the decision rule
the nested pit implementation of the Lerchs-Grossman pitoptimization algorithm (Lerchs and Grossman, 1965; Whittle,1999).
The application of the proposed method started with Stage1 and the derivation of the SSD (Fig. 4). This was followed bythe optimization of the production schedule in terms of ore
Figure 6 — Formation of mining capacity, as produced by the LP optimizationconstrained to the SSD, and ore production target over 15 production periods.
Figure 7 — Evolution of component objective functions: deviations in total ore(top line) and waste (bottom line) quantities vs. attempted number of swaps.
Figure 8 — Evolution of component objective functions: deviations of oreproduction in Period 4 for seven simulated models.
SOCIETY FOR MINING, METALLURGY, AND EXPLORATION VOL. 316 • TRANSACTIONS 200449
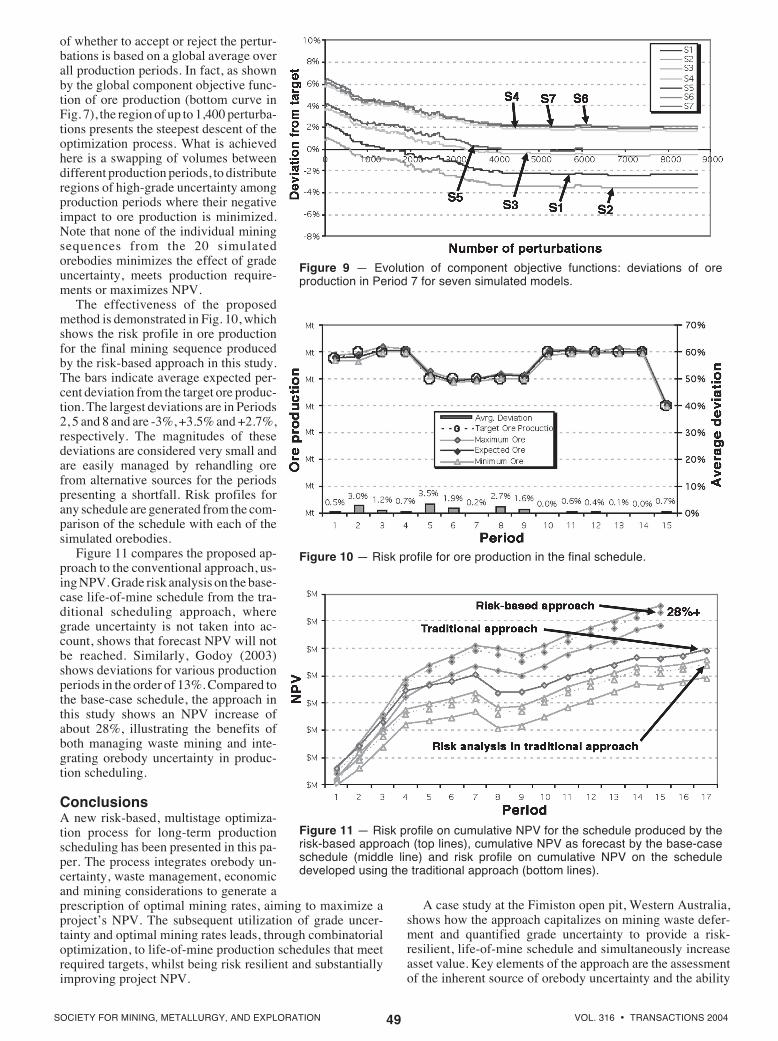
of whether to accept or reject the pertur-bations is based on a global average overall production periods. In fact, as shownby the global component objective func-tion of ore production (bottom curve inFig. 7), the region of up to 1,400 perturba-tions presents the steepest descent of theoptimization process. What is achievedhere is a swapping of volumes betweendifferent production periods, to distributeregions of high-grade uncertainty amongproduction periods where their negativeimpact to ore production is minimized.Note that none of the individual miningsequences from the 20 simulatedorebodies minimizes the effect of gradeuncertainty, meets production require-ments or maximizes NPV.
The effectiveness of the proposedmethod is demonstrated in Fig. 10, whichshows the risk profile in ore productionfor the final mining sequence producedby the risk-based approach in this study.The bars indicate average expected per-cent deviation from the target ore produc-tion. The largest deviations are in Periods2, 5 and 8 and are -3%, +3.5% and +2.7%,respectively. The magnitudes of thesedeviations are considered very small andare easily managed by rehandling orefrom alternative sources for the periodspresenting a shortfall. Risk profiles forany schedule are generated from the com-parison of the schedule with each of thesimulated orebodies.
Figure 11 compares the proposed ap-proach to the conventional approach, us-ing NPV. Grade risk analysis on the base-case life-of-mine schedule from the tra-ditional scheduling approach, wheregrade uncertainty is not taken into ac-count, shows that forecast NPV will notbe reached. Similarly, Godoy (2003)shows deviations for various productionperiods in the order of 13%. Compared tothe base-case schedule, the approach inthis study shows an NPV increase ofabout 28%, illustrating the benefits ofboth managing waste mining and inte-grating orebody uncertainty in produc-tion scheduling.
ConclusionsA new risk-based, multistage optimiza-tion process for long-term productionscheduling has been presented in this pa-per. The process integrates orebody un-certainty, waste management, economicand mining considerations to generate aprescription of optimal mining rates, aiming to maximize aproject’s NPV. The subsequent utilization of grade uncer-tainty and optimal mining rates leads, through combinatorialoptimization, to life-of-mine production schedules that meetrequired targets, whilst being risk resilient and substantiallyimproving project NPV.
A case study at the Fimiston open pit, Western Australia,shows how the approach capitalizes on mining waste defer-ment and quantified grade uncertainty to provide a risk-resilient, life-of-mine schedule and simultaneously increaseasset value. Key elements of the approach are the assessmentof the inherent source of orebody uncertainty and the ability
Figure 10 — Risk profile for ore production in the final schedule.
Figure 9 — Evolution of component objective functions: deviations of oreproduction in Period 7 for seven simulated models.
Figure 11 — Risk profile on cumulative NPV for the schedule produced by therisk-based approach (top lines), cumulative NPV as forecast by the base-caseschedule (middle line) and risk profile on cumulative NPV on the scheduledeveloped using the traditional approach (bottom lines).

TRANSACTIONS 2004 • VOL. 316 SOCIETY FOR MINING, METALLURGY, AND EXPLORATION50
to drive the mining sequence through zones where the risk ofnot achieving the target ore production is minimized.
Comparison of results with those of the traditional sched-uling practices shows the potential to considerably improvethe valuation and forecasts for life-of-mine schedules.
AcknowledgmentsThe work in this paper was funded from the AustralianResearch Council under Grant #C89804477 to R.Dimitrakopoulos, “General optimization and uncertainty as-sessment of open pit design and production scheduling.”Support from Kalgoorlie Consolidated Gold Mines Pty Ltd.,WMC Resources Ltd and Whittle Programming Pty Ltd. isgratefully acknowledged. Thanks to P. de Vries, K.Karunaratna, W. Li and C. Reardon, KCGM, for facilitatingresearch, providing data and comments.
ReferencesDimitrakopoulos, R., 1998, “Conditional simulation algorithms for modelling
orebody uncertainty in open pit optimization,” International Journal ofSurface Mining, Reclamation and Environment, Vol. 12, pp. 173-179.
Dimitrakopoulos, R., Farrelly, C., and Godoy, M.C., 2002, “Moving forward fromtraditional optimization: Grade uncertainty and risk effects in open pit minedesign,” Transactions of the IMM, Section A Mining Industry, Vol. 111, pp.A82-A89.
Dimitrakopoulos, R., 2002, “Orebody uncertainty, risk assessment and profit-ability in recoverable reserves, ore selection, and mine planning,” Shortcourse notes, SME Annual Meeting & Exhibit, Phoenix, Arizona, February,22-24, 355 pp.
Dowd, P.A., 1994, “Risk assessment in reserve estimation and open pitplanning,” Transcript of the IMM, Section A: Minerals Industry, Vol. 103, pp.A148-A154.
Dowd, P.A., 1997, “Risk in minerals projects: Analysis, perception and man-agement,” Transcript of the IMM, Section A: Minerals Industry, Vol. 106,pp. A9-18.
Farrelly, C.T., 2002, “Risk Quantification in Ore Reserve Estimation and Open PitMine Planning,” MSc Thesis, University of Queensland, Brisbane, 150 pp.
Godoy, M.C., 2003, “The Effective Management of Geological Risk in Long-term Production Scheduling of Open Pit Mines,” PhD thesis, The Universityof Queensland, Brisbane, 256 pp.
Hustrulid, W., and Kuchta, M., 1995, “Open Pit Mining Planning and Design,”A.A. Balkema, Rotterdam, 636 pp.
Kirkpatrick, S., Gelatt, C.D., and Vecchi, M.P., 1983, “Optimization by simu-lated annealing,” Science, Vol. 220, pp. 671-680.
Lerchs, H., and Grossman, L., 1965, “Optimum design of open-pit mines,”Trans. CIM, Vol. LXVII, pp. 17-24.
Metropolis, N., Rosenbluth, A.W., Rosenbluth, M.N., Teller, A.H., and Teller,E., 1953, “Equations of state calculations by fast computing machines,”Journal of Chemical Physics, Vol. 21, pp. 1087-1092.
Ravenscroft , P.J., 1992, “Risk analysis for mine scheduling by conditionalsimulation,” Transcript of the IMM, Section A: Minerals Industry, pp. A104-A108.
Rendu, J-M., 2002, “Geostatistical simulations for risk assessment and deci-sion making: The mining industry perspective,” International Journal ofSurface Mining Reclamation and Environment, Vol. 16, pp. 122-133.
Rossi, M.E., and Parker, H.M., 1994, “Estimating recoverable reserves: Is ithopeless?” in Geostatistics for the Next Century, R. Dimitrakopoulos, ed.,Kluwer Academic Publishers, pp. 259-276.
Rzhenevisky, V.V., 1968, Open Pit Mining, Nedra Publications, Leningrad,USSR (in Russian), 312 pp.
Tan, S., and Ramani, R.V., 1992, “Optimization models for scheduling ore andwaste production in open pit mines,” 23rd APCOM Symposium, SME-AIME, Littleton, Colorado, pp. 781-791.
Vallee, M., 2000, “Mineral resource + engineering, economic and legal feasi-bility = ore reserve,” CIM Bulletin, Vol. 90, pp. 53-61.
Whittle, J., and Rozman, L., 1991, “Open pit design in 90’s,” ProceedingsMining Industry Optimization Conference, AusIMM, Sydney, Australia.
Whittle, J., 1999, “A decade of open pit mine planning and optimization — Thecraft of turning algorithms into packages,” 28th APCOM Symposium, SME-AIME, Golden, Colorado, pp. 15-24.