Embed Size (px)
Citation preview

FOR DISCLOSURES AND OTHER IMPORTANT INFORMATION, PLEASE REFER TO THE BACK OF THIS REPORT.
January 15, 2015
Authors
Michael J. Mauboussin
Dan Callahan, CFA
David Rones, CFA
Sean Burns
A key part of successful investing is the ability to keep emotions in check
in the face of adversity.
A particularly challenging situation is when a stock in your portfolio drops
sharply, an event that precipitates what has been called a “man overboard”
moment.
This report provides analytical guidance if one of your stocks declines 10
percent or more in one day. Such drops tend to evoke strong emotional
reactions and make sound decision-making difficult.
We provide the base rates for more than 5,400 such events in the past
quarter century. We refine the base rates by separating earnings
announcements from non-earnings announcements and by introducing
factors including momentum, valuation, and quality.
We provide a checklist to guide you as you decide whether to buy, hold, or
sell the stock.
GLOBAL FINANCIAL STRATEGIES
www.credit-suisse.com
Managing the Man Overboard Moment Making an Informed Decision After a Large Price Drop

January 15, 2015
Managing the Man Overboard Moment 2
Introduction
A key part of successful investing is the ability to keep emotions in check in the face of adversity. One
example, the focus of this report, is when one of the stocks in your portfolio drops sharply. If you are the
portfolio manager, you might feel frustrated, upset about the hit to returns, and worried about the business
implications. If you are the analyst, you might feel anger, disappointment, and shame. None of those feelings
are conducive to good decision making.
This kind of event precipitates what has been called a “man overboard” moment.1 These moments demand
immediate attention, are stressful, and require swift action. In an investment firm it is common for a number of
professionals to stop what they are doing in order to discern a suitable course of action.
The use of a checklist is one approach to making good decisions under pressure. In his superb book, The
Checklist Manifesto, Dr. Atul Gawande describes two types of checklists.2 The first is called DO-CONFIRM.
Here you do your job from memory but pause periodically to make sure that you have done everything you’re
supposed to do. The second is called READ-DO. Here, you simply read the checklist and do what it says.
READ-DO checklists are particularly helpful in stressful situations because they prevent you from being
overcome by emotion as you decide how to act.
You can think of your emotional state and the ability to make good decisions as sitting on opposite sides of a
seesaw. If your state of emotional arousal is high, your capacity to decide well is low. A checklist helps take
out the emotion and moves you toward a proper choice. It also keeps you from succumbing to decision
paralysis. A psychologist studying emergency checklists in aviation said the goal is to “minimize the need for a
lot of effortful analysis when time may be limited and workload is high.”3
The goal of this report is to provide you with analytical guidance if one of your stocks declines 10 percent or
more in one day. More directly, we want to answer the question of whether you should buy, hold, or sell the
stock following one of these big down moves.
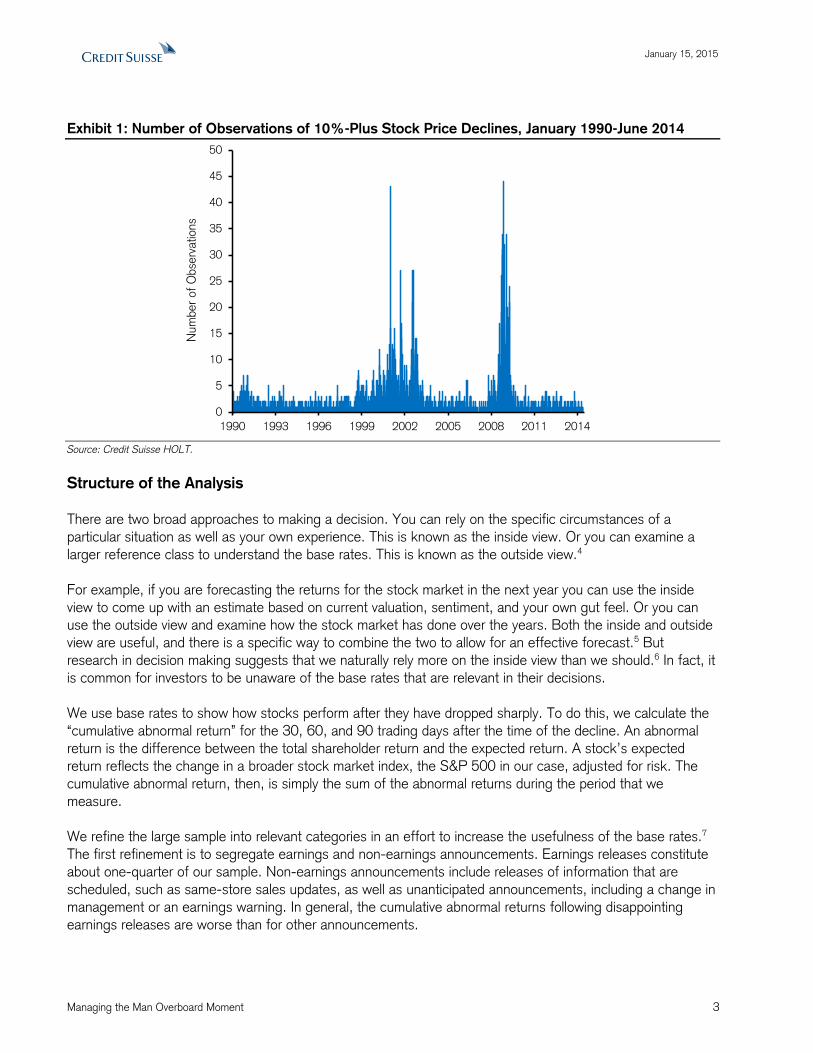
Exhibit 1 shows the number of such observations from January 1990 through mid-2014. There were more
than 5,400 occurrences in all, with clusters around the deflating of the dot-com bubble in the early 2000s and
the financial crisis in 2008-2009. The bubble periods contain about 40 percent of the observations. These
sharp drops happen frequently enough that they deserve a thoughtful process to deal with them but
infrequently enough that few investment firms have developed such a process.
January 15, 2015
Managing the Man Overboard Moment 3
Exhibit 1: Number of Observations of 10%-Plus Stock Price Declines, January 1990-June 2014
Source: Credit Suisse HOLT.
Structure of the Analysis
There are two broad approaches to making a decision. You can rely on the specific circumstances of a
particular situation as well as your own experience. This is known as the inside view. Or you can examine a
larger reference class to understand the base rates. This is known as the outside view.4
For example, if you are forecasting the returns for the stock market in the next year you can use the inside
view to come up with an estimate based on current valuation, sentiment, and your own gut feel. Or you can
use the outside view and examine how the stock market has done over the years. Both the inside and outside
view are useful, and there is a specific way to combine the two to allow for an effective forecast.5 But
research in decision making suggests that we naturally rely more on the inside view than we should.6 In fact, it
is common for investors to be unaware of the base rates that are relevant in their decisions.
We use base rates to show how stocks perform after they have dropped sharply. To do this, we calculate the
“cumulative abnormal return” for the 30, 60, and 90 trading days after the time of the decline. An abnormal
return is the difference between the total shareholder return and the expected return. A stock’s expected
return reflects the change in a broader stock market index, the S&P 500 in our case, adjusted for risk. The
cumulative abnormal return, then, is simply the sum of the abnormal returns during the period that we
measure.
We refine the large sample into relevant categories in an effort to increase the usefulness of the base rates.7
The first refinement is to segregate earnings and non-earnings announcements. Earnings releases constitute
about one-quarter of our sample. Non-earnings announcements include releases of information that are
scheduled, such as same-store sales updates, as well as unanticipated announcements, including a change in
management or an earnings warning. In general, the cumulative abnormal returns following disappointing
earnings releases are worse than for other announcements.
0
5
10
15
20
25
30
35
40
45
50
1990 1993 1996 1999 2002 2005 2008 2011 2014
Num
ber
of
Obse
rvat
ions
January 15, 2015
Managing the Man Overboard Moment 4
The second refinement is the introduction of three factors—momentum, valuation, and quality—that consider
corporate fundamentals and stock market measures. All companies receive a score for each factor. The
scores are relative to a company’s peers in the same sector. You can find a detailed definition of the factors in
Appendix A, but here’s a quick summary:
Momentum predominately considers two drivers, change in cash flow return on investment (CFROI®) as
the result of earnings revisions, and stock price momentum. Good momentum is associated with rising
CFROI and strong stock price appreciation.
Valuation reflects the gap between the current stock price and the warranted value in the HOLT® model.
Valuation also incorporates adjusted measures of price-to-earnings and price-to-book ratios. Together,
these metrics help assess whether a stock is relatively cheap or expensive.
Quality captures the company’s recent level of CFROI and whether the company has been able to
consistently make investments that create value. Firms with high CFROIs and strong value creation score
well on quality.
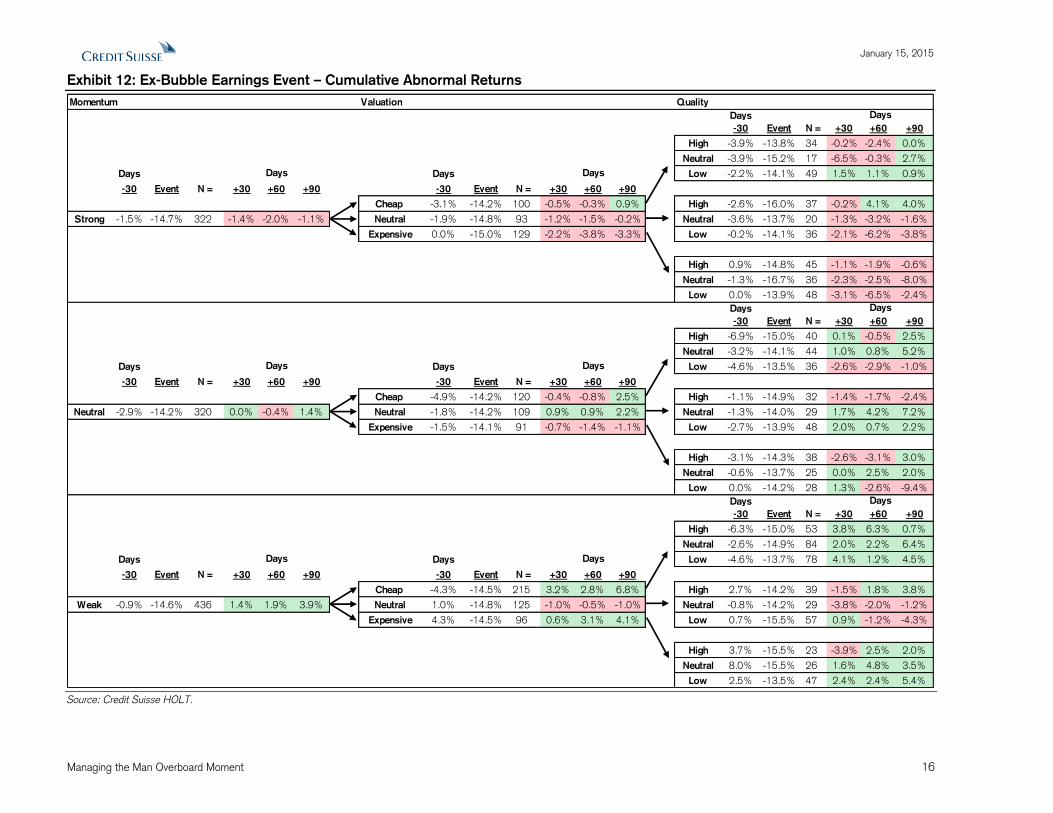
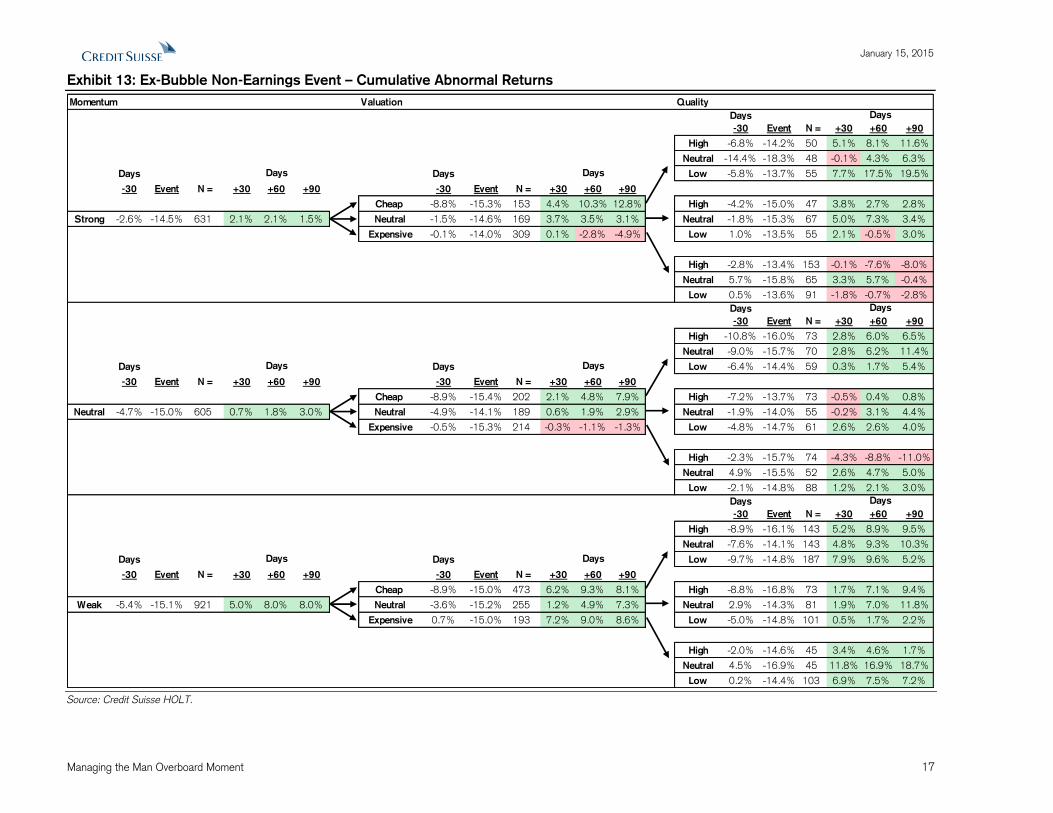
The final refinement is a separation between the full sample and the periods excluding the bubbles. We show
the full sample including all events in exhibits 2 and 3, and the narrower sample excluding the bubble periods
in exhibits 12 and 13. The bubble periods correlate with high volatility in the market, as measured by the
Chicago Board Options Exchange Market Volatility Index (VIX). When you compare the full sample to the ex-
bubble sample for earnings announcements, you will see that the average stock price changes for the
equivalent branches are directionally the same more than 80 percent of the time. For the other events, the
directional overlap is close to 90 percent.
The upside of adding refinements is that you can find a base rate that closely matches the case you are
considering. The downside is that the sample size (N) shrinks with each refinement. We have tried to maintain
healthy sample sizes even in the end branches, and we display the Ns along the way so that you can assess
the trade-off between fit and prior occurrences.
We are almost ready to turn to the checklist and numbers, but we need to cover one additional item. All of our
summary exhibits show the average, or mean, stock price return. That average represents a full distribution of
results. For most of the distributions, the median return—the return that separates the top half from the
bottom half of the sample—is less than the mean, which suggests the distributions have a right skew.
Further, the standard deviations of most of the distributions are in the range of 35-45 percent. While our
summary figures show a tidy average, recognize that the figure belies a rich distribution. Appendix B shows
the distributions for a handful of events. The base rate data can be extremely helpful in making a sound
decision even if the outcome is probabilistic.
We’re now ready to turn to the checklist and the numbers that show the base rates.
CFROI
®
is a registered trademark in the United States and other countries (excluding the United Kingdom) of Credit Suisse
Group AG or its affiliates.
January 15, 2015
Managing the Man Overboard Moment 5
The Checklist
You come into the office and one of the stocks in your portfolio is down 10 percent or more. Here’s what you
do:
Earnings or non-earnings. Determine whether the precipitating announcement is an earnings release or
a non-earnings disclosure and go to the appropriate exhibit;
Momentum. Check the HOLT Lens™ screen to determine if the stock had strong, weak, or neutral
momentum going into the announcement. You can either go to the momentum section of the exhibit or
continue;
Valuation. Check to see if the valuation is cheap, expensive, or neutral. You can either go to the section in
the exhibit that combines momentum and valuation or continue;
Quality. Check to see if the quality is high, low, or neutral. Go to section in the exhibit that incorporates all
of the factors.
We have two detailed case studies that we’ll present in a moment, but let’s run through an example to see
how this works. The first item is to determine whether the announcement was a scheduled earnings release or
not. Let’s say it was an earnings event. That means we would refer to the data in exhibit 2.
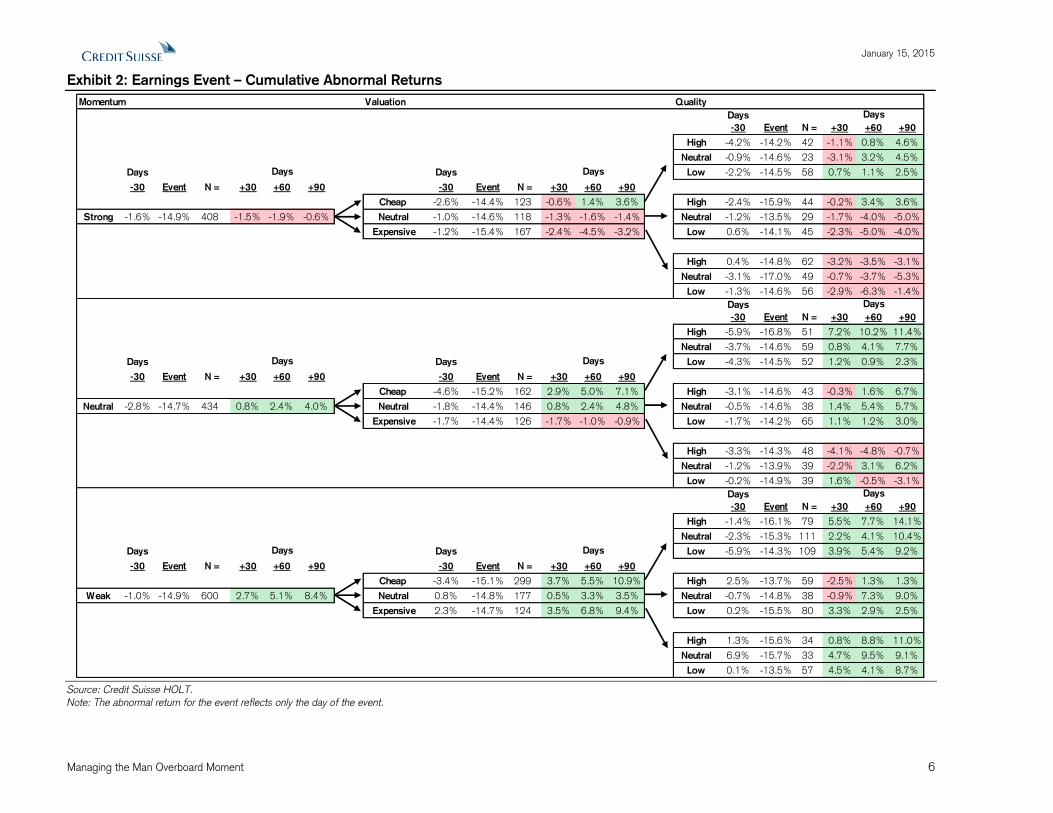
Step two is to assess the momentum. We’ll assume that momentum is strong. If you look at the left side of
the exhibit you’ll see the section that reflects momentum. If you focus on the results of the companies with
strong momentum, you’ll see a few figures. You’ll notice that the 408 stocks in that reference class declined
14.9 percent, on average, the day of the event. You’ll also see that those stocks modestly underperformed
the market, with a cumulative abnormal return of -1.6 percent, in the prior 30 trading days.
You’ll also see that the stocks in that class struggled in the subsequent quarter, with cumulative abnormal
returns of -1.5 percent in the next 30 trading days, -1.9 percent in 60 trading days, and -0.6 percent in 90
trading days. We selected 90 trading days as the extent of this analysis because we felt it is a sufficient
amount of time for an investment team to thoroughly reassess the stock’s merit. We designed the READ-DO
checklist to provide immediate guidance.
We now turn to valuation, which you can find in the middle of the exhibit, to see if we can sharpen the analysis.
Let’s assume the valuation was expensive. If we look 60 days out, we see that the 167 stocks in this group
have an average cumulative abnormal return of -4.5 percent.
As a final check, we consider quality, which you can find on the right of the exhibit. Let’s say quality is high.
We’ve now shrunk our sample size to 62, and see that the 60-day cumulative abnormal return is -3.5 percent.
January 15, 2015
Managing the Man Overboard Moment 6
Exhibit 2: Earnings Event – Cumulative Abnormal Returns
Source: Credit Suisse HOLT.
Note: The abnormal return for the event reflects only the day of the event.
Momentum Valuation Quality
Days
-30 Event N = +30 +60 +90
High -4.2% -14.2% 42 -1.1% 0.8% 4.6%
Neutral -0.9% -14.6% 23 -3.1% 3.2% 4.5%
Days Days Low -2.2% -14.5% 58 0.7% 1.1% 2.5%
-30 Event N = +30 +60 +90 -30 Event N = +30 +60 +90
Cheap -2.6% -14.4% 123 -0.6% 1.4% 3.6% High -2.4% -15.9% 44 -0.2% 3.4% 3.6%
Strong -1.6% -14.9% 408 -1.5% -1.9% -0.6% Neutral -1.0% -14.6% 118 -1.3% -1.6% -1.4% Neutral -1.2% -13.5% 29 -1.7% -4.0% -5.0%
Expensive -1.2% -15.4% 167 -2.4% -4.5% -3.2% Low 0.6% -14.1% 45 -2.3% -5.0% -4.0%
High 0.4% -14.8% 62 -3.2% -3.5% -3.1%
Neutral -3.1% -17.0% 49 -0.7% -3.7% -5.3%
Low -1.3% -14.6% 56 -2.9% -6.3% -1.4%
Days
-30 Event N = +30 +60 +90
High -5.9% -16.8% 51 7.2% 10.2% 11.4%
Neutral -3.7% -14.6% 59 0.8% 4.1% 7.7%
Days Days Low -4.3% -14.5% 52 1.2% 0.9% 2.3%
-30 Event N = +30 +60 +90 -30 Event N = +30 +60 +90
Cheap -4.6% -15.2% 162 2.9% 5.0% 7.1% High -3.1% -14.6% 43 -0.3% 1.6% 6.7%
Neutral -2.8% -14.7% 434 0.8% 2.4% 4.0% Neutral -1.8% -14.4% 146 0.8% 2.4% 4.8% Neutral -0.5% -14.6% 38 1.4% 5.4% 5.7%
Expensive -1.7% -14.4% 126 -1.7% -1.0% -0.9% Low -1.7% -14.2% 65 1.1% 1.2% 3.0%
High -3.3% -14.3% 48 -4.1% -4.8% -0.7%
Neutral -1.2% -13.9% 39 -2.2% 3.1% 6.2%
Low -0.2% -14.9% 39 1.6% -0.5% -3.1%
Days
-30 Event N = +30 +60 +90
High -1.4% -16.1% 79 5.5% 7.7% 14.1%
Neutral -2.3% -15.3% 111 2.2% 4.1% 10.4%
Days Days Low -5.9% -14.3% 109 3.9% 5.4% 9.2%
-30 Event N = +30 +60 +90 -30 Event N = +30 +60 +90
Cheap -3.4% -15.1% 299 3.7% 5.5% 10.9% High 2.5% -13.7% 59 -2.5% 1.3% 1.3%
Weak -1.0% -14.9% 600 2.7% 5.1% 8.4% Neutral 0.8% -14.8% 177 0.5% 3.3% 3.5% Neutral -0.7% -14.8% 38 -0.9% 7.3% 9.0%
Expensive 2.3% -14.7% 124 3.5% 6.8% 9.4% Low 0.2% -15.5% 80 3.3% 2.9% 2.5%
High 1.3% -15.6% 34 0.8% 8.8% 11.0%
Neutral 6.9% -15.7% 33 4.7% 9.5% 9.1%
Low 0.1% -13.5% 57 4.5% 4.1% 8.7%
Days
Days Days
Days
Days Days
Days
Days Days
January 15, 2015
Managing the Man Overboard Moment 7
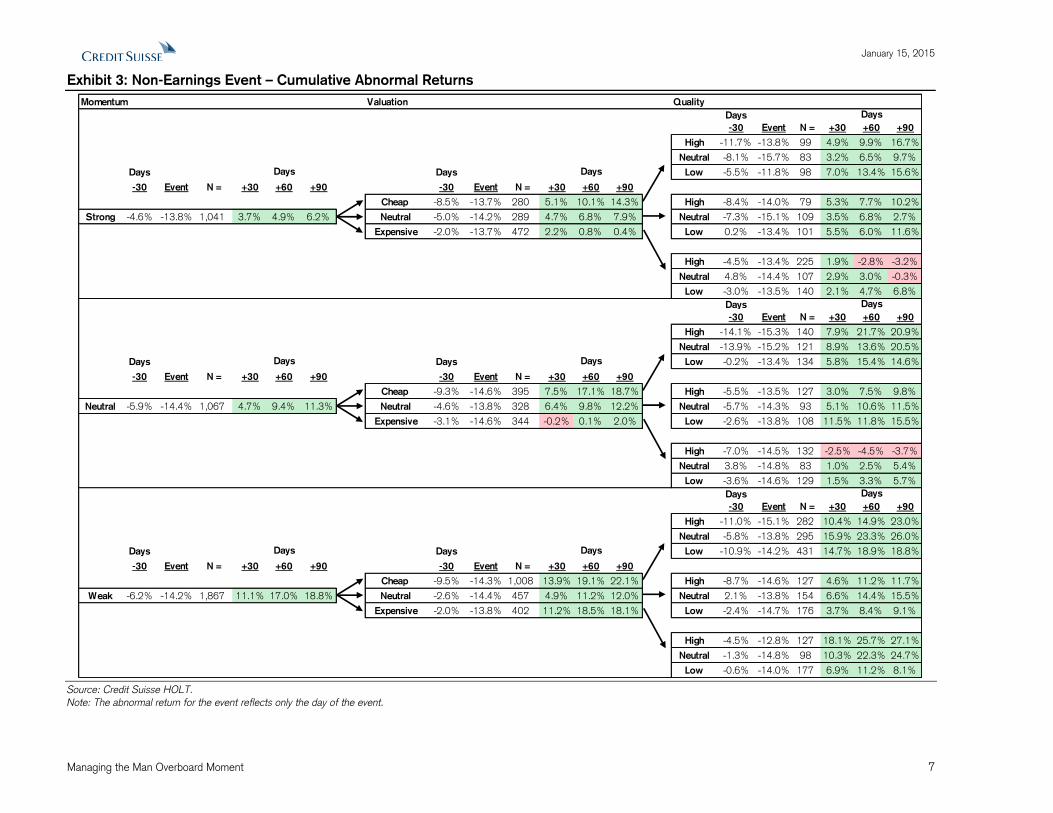
Exhibit 3: Non-Earnings Event – Cumulative Abnormal Returns
Source: Credit Suisse HOLT.
Note: The abnormal return for the event reflects only the day of the event.
Momentum Valuation Quality
Days
-30 Event N = +30 +60 +90
High -11.7% -13.8% 99 4.9% 9.9% 16.7%
Neutral -8.1% -15.7% 83 3.2% 6.5% 9.7%
Days Days Low -5.5% -11.8% 98 7.0% 13.4% 15.6%
-30 Event N = +30 +60 +90 -30 Event N = +30 +60 +90
Cheap -8.5% -13.7% 280 5.1% 10.1% 14.3% High -8.4% -14.0% 79 5.3% 7.7% 10.2%
Strong -4.6% -13.8% 1,041 3.7% 4.9% 6.2% Neutral -5.0% -14.2% 289 4.7% 6.8% 7.9% Neutral -7.3% -15.1% 109 3.5% 6.8% 2.7%
Expensive -2.0% -13.7% 472 2.2% 0.8% 0.4% Low 0.2% -13.4% 101 5.5% 6.0% 11.6%
High -4.5% -13.4% 225 1.9% -2.8% -3.2%
Neutral 4.8% -14.4% 107 2.9% 3.0% -0.3%
Low -3.0% -13.5% 140 2.1% 4.7% 6.8%
Days
-30 Event N = +30 +60 +90
High -14.1% -15.3% 140 7.9% 21.7% 20.9%
Neutral -13.9% -15.2% 121 8.9% 13.6% 20.5%
Days Days Low -0.2% -13.4% 134 5.8% 15.4% 14.6%
-30 Event N = +30 +60 +90 -30 Event N = +30 +60 +90
Cheap -9.3% -14.6% 395 7.5% 17.1% 18.7% High -5.5% -13.5% 127 3.0% 7.5% 9.8%
Neutral -5.9% -14.4% 1,067 4.7% 9.4% 11.3% Neutral -4.6% -13.8% 328 6.4% 9.8% 12.2% Neutral -5.7% -14.3% 93 5.1% 10.6% 11.5%
Expensive -3.1% -14.6% 344 -0.2% 0.1% 2.0% Low -2.6% -13.8% 108 11.5% 11.8% 15.5%
High -7.0% -14.5% 132 -2.5% -4.5% -3.7%
Neutral 3.8% -14.8% 83 1.0% 2.5% 5.4%
Low -3.6% -14.6% 129 1.5% 3.3% 5.7%
Days
-30 Event N = +30 +60 +90
High -11.0% -15.1% 282 10.4% 14.9% 23.0%
Neutral -5.8% -13.8% 295 15.9% 23.3% 26.0%
Days Days Low -10.9% -14.2% 431 14.7% 18.9% 18.8%
-30 Event N = +30 +60 +90 -30 Event N = +30 +60 +90
Cheap -9.5% -14.3% 1,008 13.9% 19.1% 22.1% High -8.7% -14.6% 127 4.6% 11.2% 11.7%
Weak -6.2% -14.2% 1,867 11.1% 17.0% 18.8% Neutral -2.6% -14.4% 457 4.9% 11.2% 12.0% Neutral 2.1% -13.8% 154 6.6% 14.4% 15.5%
Expensive -2.0% -13.8% 402 11.2% 18.5% 18.1% Low -2.4% -14.7% 176 3.7% 8.4% 9.1%
High -4.5% -12.8% 127 18.1% 25.7% 27.1%
Neutral -1.3% -14.8% 98 10.3% 22.3% 24.7%
Low -0.6% -14.0% 177 6.9% 11.2% 8.1%
Days
Days Days
Days
Days Days
Days
Days Days
January 15, 2015
Managing the Man Overboard Moment 8
Case Studies
We now turn to two case studies that provide detail about the analysis.
Symantec Corporation
Symantec Corporation announced that it fired its president and chief executive officer, Steve Bennett, after the
stock market closed on March 20, 2014. The following day, March 21, the stock declined from $20.905 to
$18.20, or 12.9 percent. This was a non-earnings event.
Since we use cumulative abnormal return (CAR) for all of the stock performance data, it is worth taking a moment
to explain the methodology. We calculate daily abnormal return using a simplified market model, which compares
the actual return of a stock to its expected return. The expected return equals the total shareholder return of the
benchmark, the S&P 500, times the stock’s beta. The abnormal return is the difference between the actual return
and the expected return.
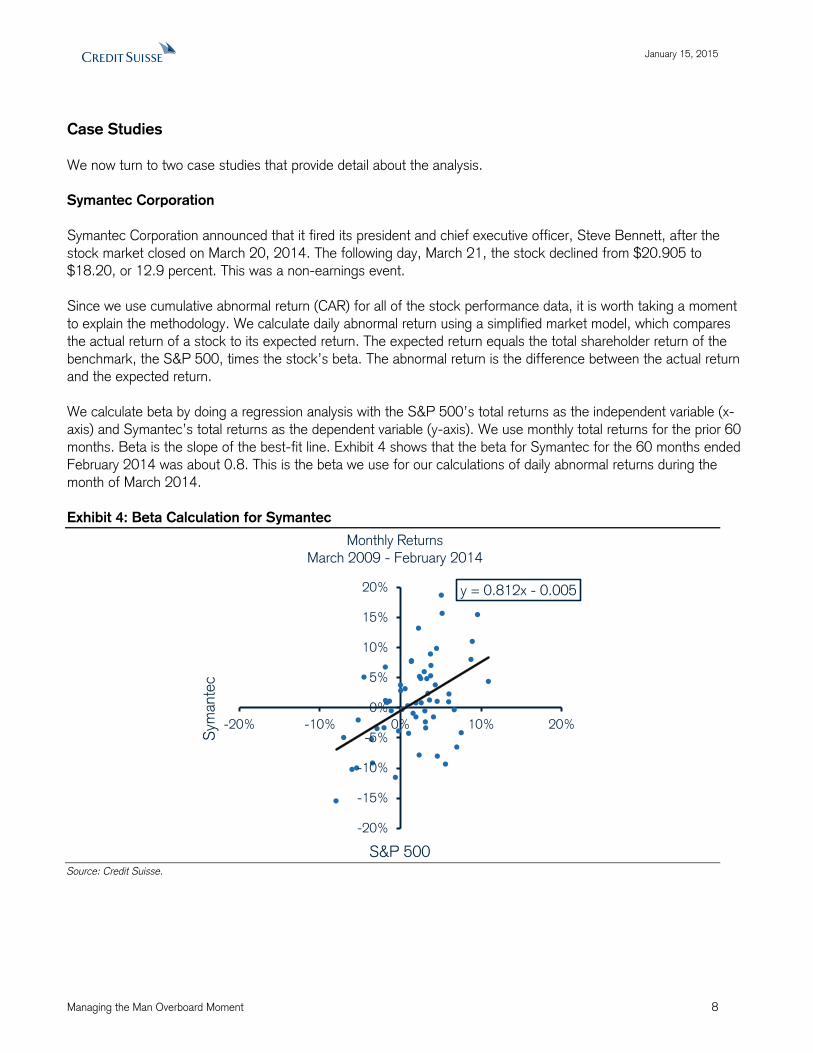
We calculate beta by doing a regression analysis with the S&P 500’s total returns as the independent variable (x-
axis) and Symantec’s total returns as the dependent variable (y-axis). We use monthly total returns for the prior 60
months. Beta is the slope of the best-fit line. Exhibit 4 shows that the beta for Symantec for the 60 months ended
February 2014 was about 0.8. This is the beta we use for our calculations of daily abnormal returns during the
month of March 2014.
Exhibit 4: Beta Calculation for Symantec
Source: Credit Suisse.
y = 0.812x - 0.005
-20%
-15%
-10%
-5%
0%
5%
10%
15%
20%
-20% -10% 0% 10% 20%
Sym
ante
c
S&P 500
Monthly ReturnsMarch 2009 - February 2014
January 15, 2015
Managing the Man Overboard Moment 9
Using the 30 trading days following the event, we calculate a CAR of 9.3 percent as follows:
CAR = Actual return – expected return
= 10.3% - (Beta * Market Return)
= 10.3% - (0.8 * 1.2%)
CAR = 10.3% - 1.0% = 9.3%
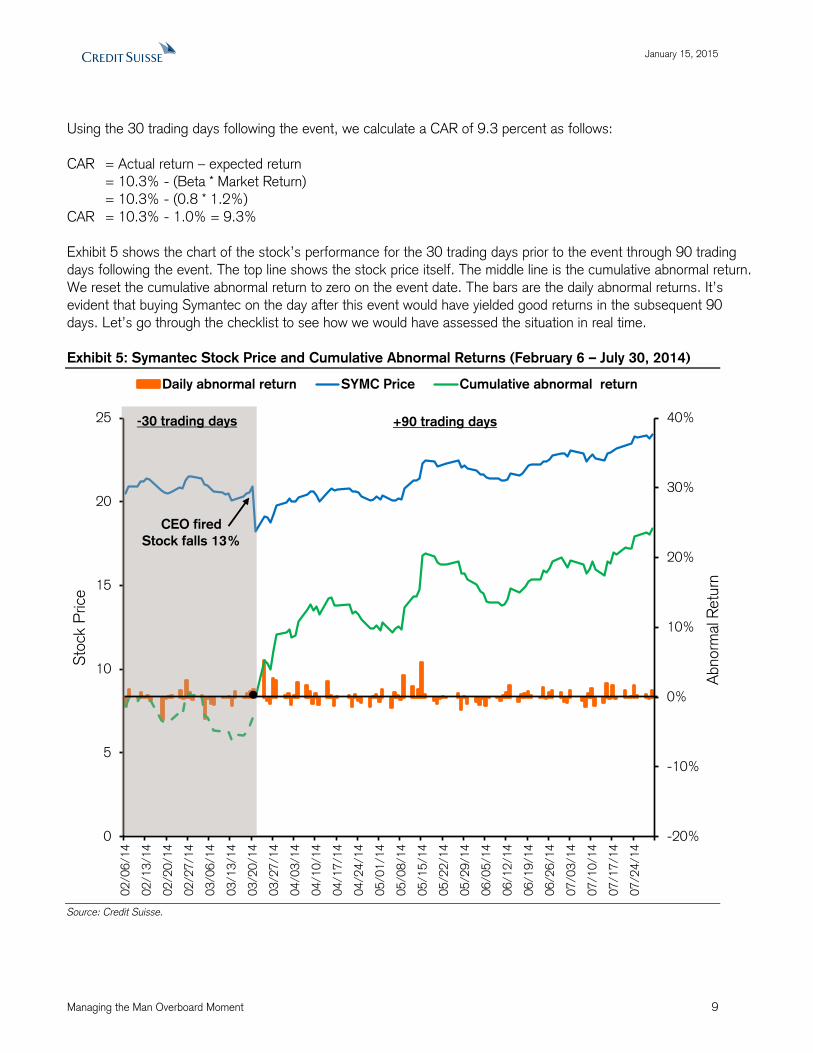
Exhibit 5 shows the chart of the stock’s performance for the 30 trading days prior to the event through 90 trading
days following the event. The top line shows the stock price itself. The middle line is the cumulative abnormal return.
We reset the cumulative abnormal return to zero on the event date. The bars are the daily abnormal returns. It’s
evident that buying Symantec on the day after this event would have yielded good returns in the subsequent 90
days. Let’s go through the checklist to see how we would have assessed the situation in real time.
Exhibit 5: Symantec Stock Price and Cumulative Abnormal Returns (February 6 – July 30, 2014)
Source: Credit Suisse.
-20%
-10%
0%
10%
20%
30%
40%
0
5
10
15
20
25
02/0
6/1
4
02/1
3/1
4
02/2
0/1
4
02/2
7/1
4
03/0
6/1
4
03/1
3/1
4
03/2
0/1
4
03/2
7/1
4
04/0
3/1
4
04/1
0/1
4
04/1
7/1
4
04/2
4/1
4
05/0
1/1
4
05/0
8/1
4
05/1
5/1
4
05/2
2/1
4
05/2
9/1
4
06/0
5/1
4
06/1
2/1
4
06/1
9/1
4
06/2
6/1
4
07/0
3/1
4
07/1
0/1
4
07/1
7/1
4
07/2
4/1
4
Abnorm
al R
etu
rn
Sto
ck P
rice
Daily abnormal return SYMC Price Cumulative abnormal return
-30 trading days +90 trading days
CEO fired
Stock falls 13%
January 15, 2015
Managing the Man Overboard Moment 10
The first item on the checklist is the determination of whether the event was a scheduled earnings release. We
know that this is an event not related directly to an earnings announcement, so we refer to exhibit 3 for guidance.
The next step is determining how the stock scores with regard to momentum, valuation, and quality through HOLT
Lens. (Please contact your HOLT or Credit Suisse representative if you do not have access to Lens and would like
to use it.) At the welcome page, search for the company of the stock under consideration. This takes you to the
homepage for that company, which includes a Relative Wealth Chart. Toward the top of the page you will find a link
called “Scorecard Percentile.” If you click on it, you will see numerical scores, from 0 to 100, on momentum,
valuation, and operational quality, among other items. For the purposes of this analysis, a score of 66 or more
reflects strong momentum, cheap valuation, and high quality. A score of 33 or less means weak momentum,
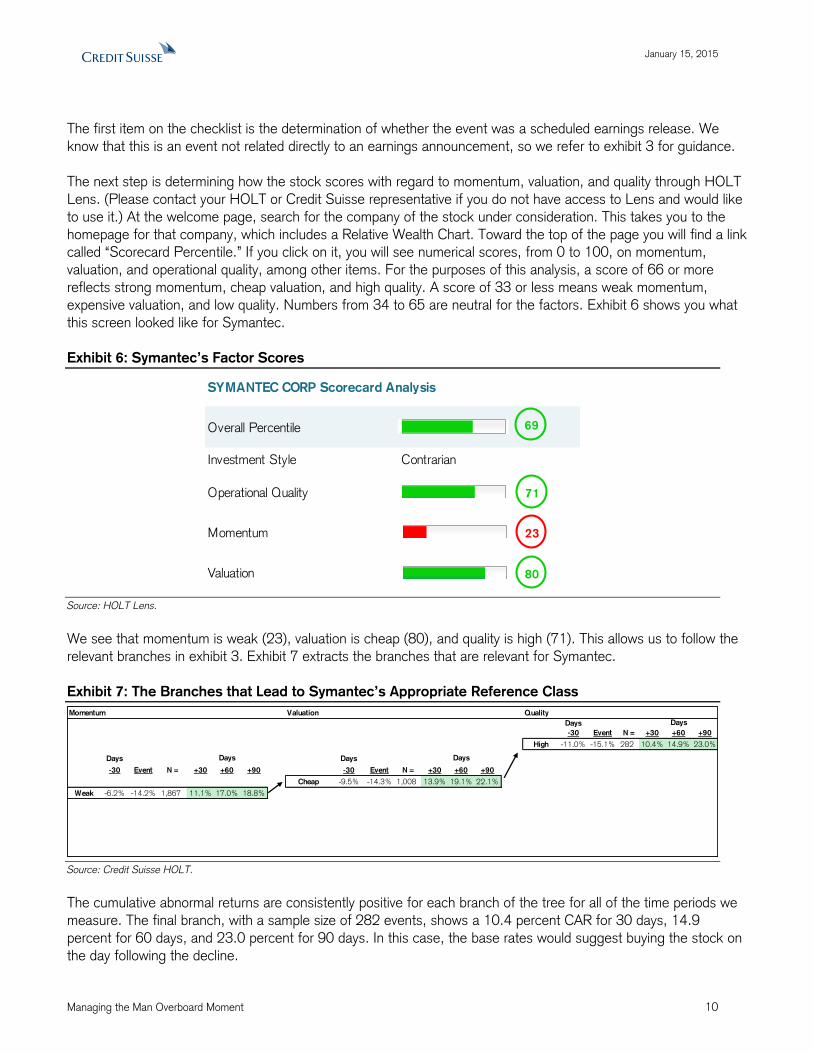
expensive valuation, and low quality. Numbers from 34 to 65 are neutral for the factors. Exhibit 6 shows you what
this screen looked like for Symantec.
Exhibit 6: Symantec’s Factor Scores
Source: HOLT Lens.
We see that momentum is weak (23), valuation is cheap (80), and quality is high (71). This allows us to follow the
relevant branches in exhibit 3. Exhibit 7 extracts the branches that are relevant for Symantec.
Exhibit 7: The Branches that Lead to Symantec’s Appropriate Reference Class
Source: Credit Suisse HOLT.
The cumulative abnormal returns are consistently positive for each branch of the tree for all of the time periods we
measure. The final branch, with a sample size of 282 events, shows a 10.4 percent CAR for 30 days, 14.9
percent for 60 days, and 23.0 percent for 90 days. In this case, the base rates would suggest buying the stock on
the day following the decline.
SYMANTEC CORP Scorecard Analysis
Overall Percentile
Investment Style Contrarian
Operational Quality
Momentum
Valuation
69
71
23
80
Momentum Valuation Quality
Days
-30 Event N = +30 +60 +90
High -11.0% -15.1% 282 10.4% 14.9% 23.0%
Days Days
-30 Event N = +30 +60 +90 -30 Event N = +30 +60 +90
Cheap -9.5% -14.3% 1,008 13.9% 19.1% 22.1%
Weak -6.2% -14.2% 1,867 11.1% 17.0% 18.8%
Days
Days Days

January 15, 2015
Managing the Man Overboard Moment 11
We can compare those base rates with what actually happened. The CAR for Symantec shares was 9.3 percent in
the 30 trading days following the event, 15.4 percent for 60 days, and 24.2 percent for 90 days. The line for CAR
in exhibit 5 also shows these returns.
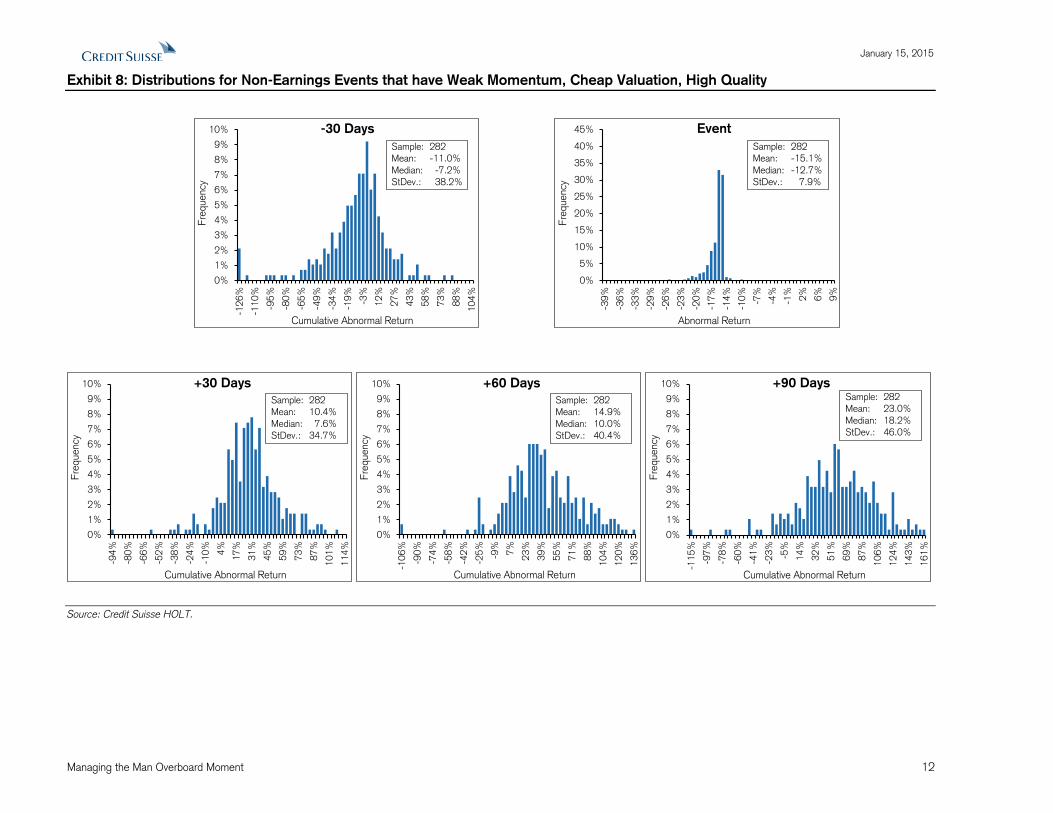
While the results are consistent with the base rate, we must reiterate that the averages belie a more complex
distribution. Exhibit 8 shows the distribution of stock price returns for the 282 companies in Symantec’s
reference class. For each of the return distributions that follow the event (+30, +60, and +90 days), the mean,
or average, was greater than the median. The standard deviations are high at about 35 percent for 30 days,
40 percent for 60 days, and 45 percent for 90 days.
January 15, 2015
Managing the Man Overboard Moment 12
Exhibit 8: Distributions for Non-Earnings Events that have Weak Momentum, Cheap Valuation, High Quality
Source: Credit Suisse HOLT.
0%
1%
2%
3%
4%
5%
6%
7%
8%
9%
10%
-12
6%
-11
0%
-95
%
-80
%
-65
%
-49
%
-34
%
-19
%
-3%
12
%
27
%
43
%
58
%
73
%
88
%
10
4%
Fre
quency
Cumulative Abnormal Return
-30 Days
Sample: 282
Mean: -11.0%
Median: -7.2%
StDev.: 38.2%
0%
5%
10%
15%
20%
25%
30%
35%
40%
45%
-39
%
-36
%
-33
%
-29
%
-26
%
-23
%
-20
%
-17
%
-14
%
-10
%
-7%
-4%
-1%
2%
6%
9%
Fre
quency
Abnormal Return
Event
Sample: 282
Mean: -15.1%
Median: -12.7%
StDev.: 7.9%
0%
1%
2%
3%
4%
5%
6%
7%
8%
9%
10%
-94
%
-80
%
-66
%
-52
%
-38
%
-24
%
-10
%
4%
17
%
31
%
45
%
59
%
73
%
87
%
10
1%
11
4%
Fre
quency
Cumulative Abnormal Return
+30 Days
Sample: 282
Mean: 10.4%
Median: 7.6%
StDev.: 34.7%
0%
1%
2%
3%
4%
5%
6%
7%
8%
9%
10%
-10
6%
-90
%
-74
%
-58
%
-42
%
-25
%
-9%
7%
23
%
39
%
55
%
71
%
88
%
10
4%
12
0%
13
6%
Fre
quency
Cumulative Abnormal Return
+60 Days
Sample: 282
Mean: 14.9%
Median: 10.0%
StDev.: 40.4%
0%
1%
2%
3%
4%
5%
6%
7%
8%
9%
10%
-11
5%
-97
%
-78
%
-60
%
-41
%
-23
%
-5%
14
%
32
%
51
%
69
%
87
%
10
6%
12
4%
14
3%
16
1%
Fre
quency
Cumulative Abnormal Return
+90 DaysSample: 282
Mean: 23.0%
Median: 18.2%
StDev.: 46.0%
January 15, 2015
Managing the Man Overboard Moment 13
Tenet Healthcare Corporation
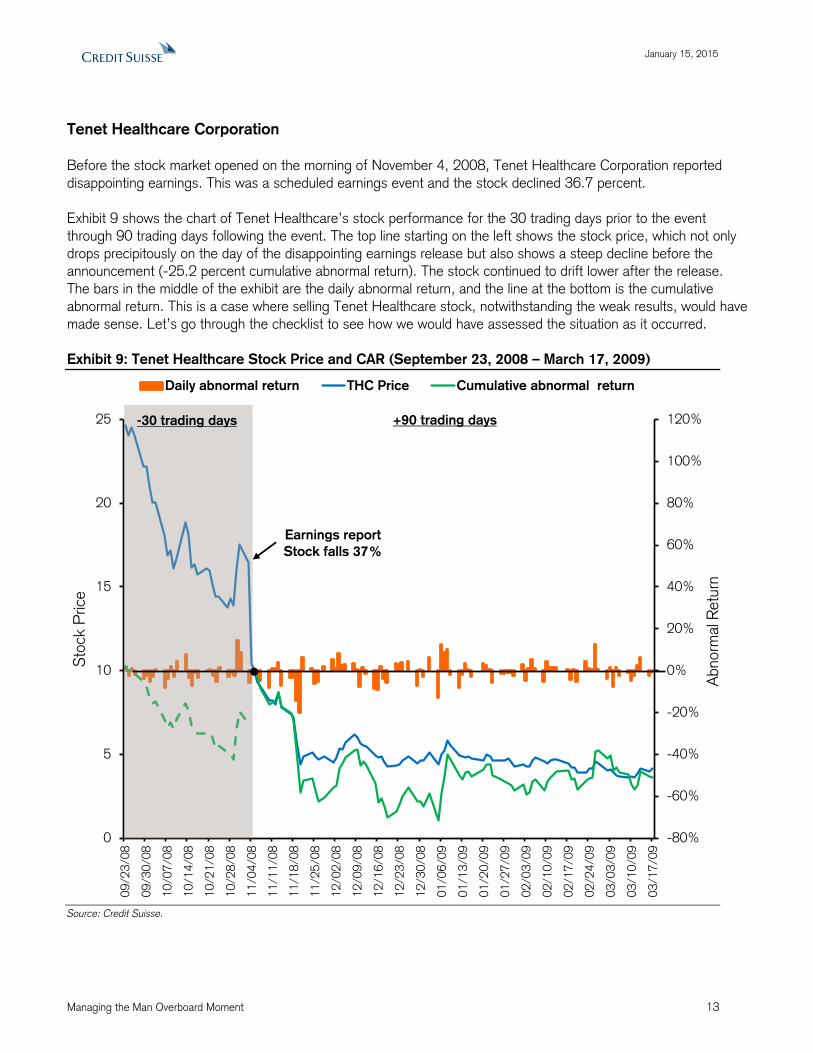
Before the stock market opened on the morning of November 4, 2008, Tenet Healthcare Corporation reported
disappointing earnings. This was a scheduled earnings event and the stock declined 36.7 percent.
Exhibit 9 shows the chart of Tenet Healthcare’s stock performance for the 30 trading days prior to the event
through 90 trading days following the event. The top line starting on the left shows the stock price, which not only
drops precipitously on the day of the disappointing earnings release but also shows a steep decline before the
announcement (-25.2 percent cumulative abnormal return). The stock continued to drift lower after the release.
The bars in the middle of the exhibit are the daily abnormal return, and the line at the bottom is the cumulative
abnormal return. This is a case where selling Tenet Healthcare stock, notwithstanding the weak results, would have
made sense. Let’s go through the checklist to see how we would have assessed the situation as it occurred.
Exhibit 9: Tenet Healthcare Stock Price and CAR (September 23, 2008 – March 17, 2009)
Source: Credit Suisse.
-80%
-60%
-40%
-20%
0%
20%
40%
60%
80%
100%
120%
0
5
10
15
20
25
09/2
3/0
8
09/3
0/0
8
10/0
7/0
8
10/1
4/0
8
10/2
1/0
8
10/2
8/0
8
11/0
4/0
8
11/1
1/0
8
11/1
8/0
8
11/2
5/0
8
12/0
2/0
8
12/0
9/0
8
12/1
6/0
8
12/2
3/0
8
12/3
0/0
8
01/0
6/0
9
01/1
3/0
9
01/2
0/0
9
01/2
7/0
9
02/0
3/0
9
02/1
0/0
9
02/1
7/0
9
02/2
4/0
9
03/0
3/0
9
03/1
0/0
9
03/1
7/0
9
Abnorm
al R
etu
rn
Sto
ck P
rice
Daily abnormal return THC Price Cumulative abnormal return
-30 trading days +90 trading days
Earnings report
Stock falls 37%
January 15, 2015
Managing the Man Overboard Moment 14
The first item on the checklist is the determination of whether the event was an earnings release. We know that it
was scheduled, so we refer to exhibit 2 for guidance.
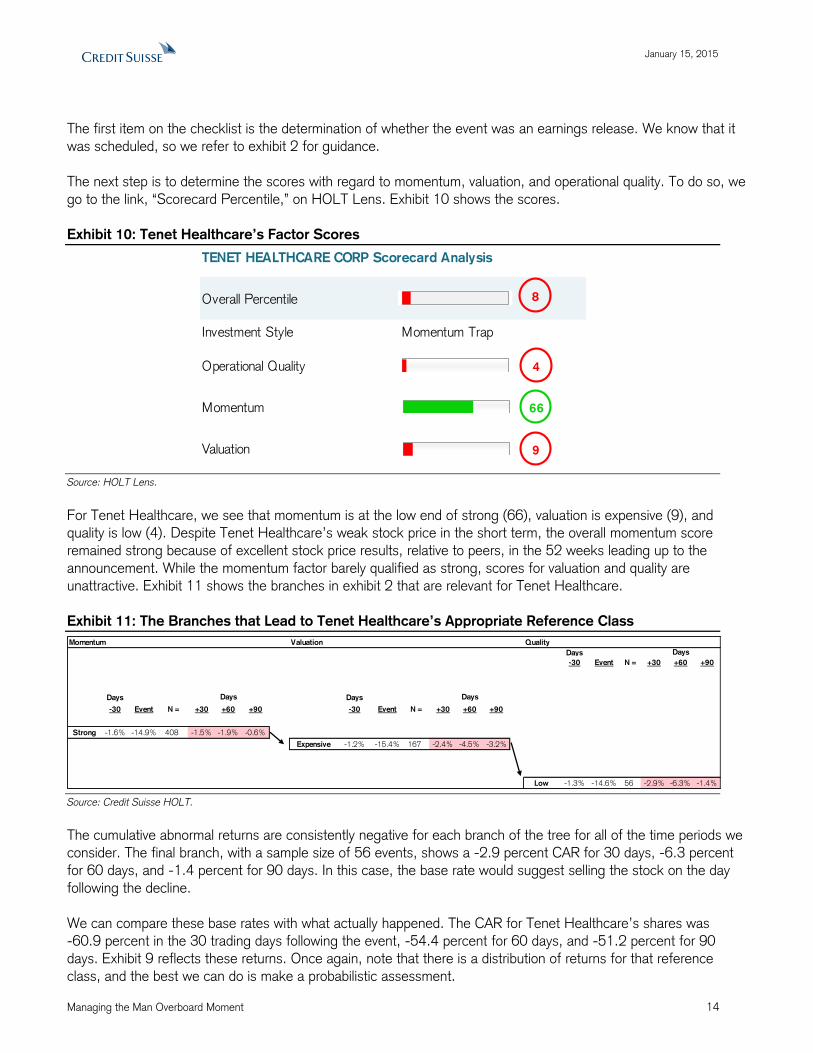
The next step is to determine the scores with regard to momentum, valuation, and operational quality. To do so, we
go to the link, “Scorecard Percentile,” on HOLT Lens. Exhibit 10 shows the scores.
Exhibit 10: Tenet Healthcare’s Factor Scores
Source: HOLT Lens.
For Tenet Healthcare, we see that momentum is at the low end of strong (66), valuation is expensive (9), and
quality is low (4). Despite Tenet Healthcare’s weak stock price in the short term, the overall momentum score
remained strong because of excellent stock price results, relative to peers, in the 52 weeks leading up to the
announcement. While the momentum factor barely qualified as strong, scores for valuation and quality are
unattractive. Exhibit 11 shows the branches in exhibit 2 that are relevant for Tenet Healthcare.
Exhibit 11: The Branches that Lead to Tenet Healthcare’s Appropriate Reference Class
Source: Credit Suisse HOLT.
The cumulative abnormal returns are consistently negative for each branch of the tree for all of the time periods we
consider. The final branch, with a sample size of 56 events, shows a -2.9 percent CAR for 30 days, -6.3 percent
for 60 days, and -1.4 percent for 90 days. In this case, the base rate would suggest selling the stock on the day
following the decline.
We can compare these base rates with what actually happened. The CAR for Tenet Healthcare’s shares was
-60.9 percent in the 30 trading days following the event, -54.4 percent for 60 days, and -51.2 percent for 90
days. Exhibit 9 reflects these returns. Once again, note that there is a distribution of returns for that reference
class, and the best we can do is make a probabilistic assessment.
TENET HEALTHCARE CORP Scorecard Analysis
Overall Percentile
Investment Style Momentum Trap
Operational Quality
Momentum
Valuation
8
4
66
9
Momentum Valuation Quality
Days
-30 Event N = +30 +60 +90
Days Days
-30 Event N = +30 +60 +90 -30 Event N = +30 +60 +90
Strong -1.6% -14.9% 408 -1.5% -1.9% -0.6%
Expensive -1.2% -15.4% 167 -2.4% -4.5% -3.2%
Low -1.3% -14.6% 56 -2.9% -6.3% -1.4%
Days
Days Days
January 15, 2015
Managing the Man Overboard Moment 15
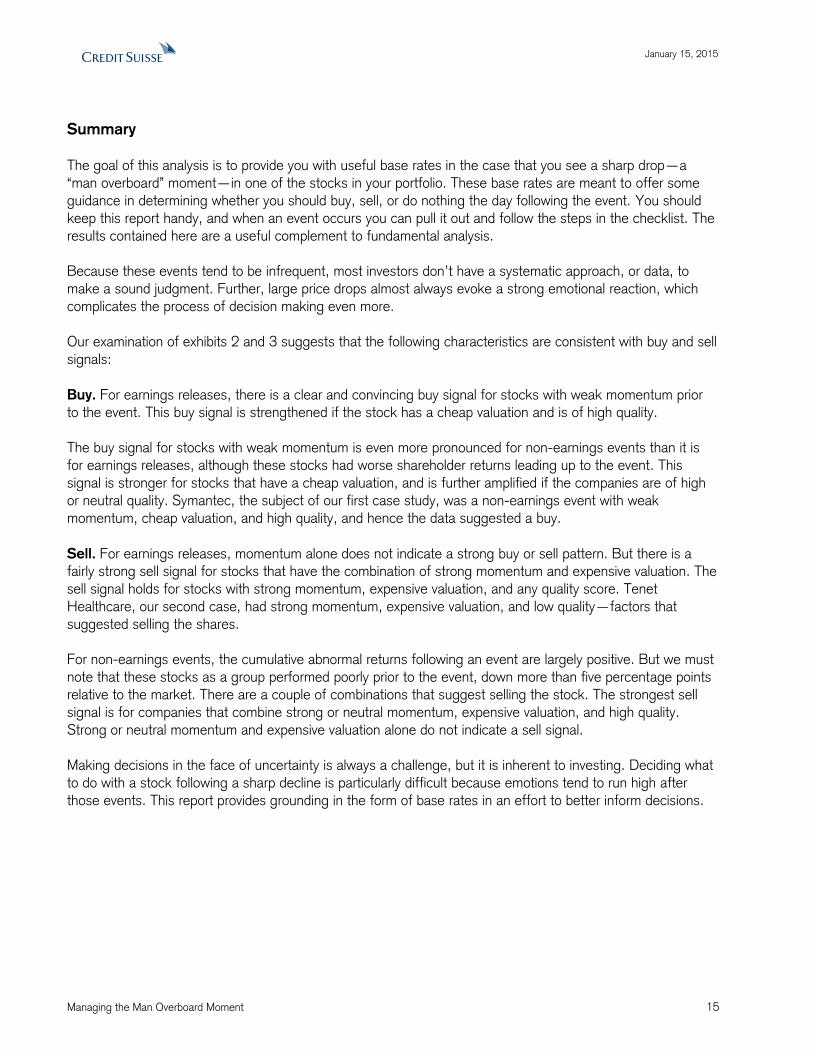
Summary
The goal of this analysis is to provide you with useful base rates in the case that you see a sharp drop—a
“man overboard” moment—in one of the stocks in your portfolio. These base rates are meant to offer some
guidance in determining whether you should buy, sell, or do nothing the day following the event. You should
keep this report handy, and when an event occurs you can pull it out and follow the steps in the checklist. The
results contained here are a useful complement to fundamental analysis.
Because these events tend to be infrequent, most investors don’t have a systematic approach, or data, to
make a sound judgment. Further, large price drops almost always evoke a strong emotional reaction, which
complicates the process of decision making even more.
Our examination of exhibits 2 and 3 suggests that the following characteristics are consistent with buy and sell
signals:
Buy. For earnings releases, there is a clear and convincing buy signal for stocks with weak momentum prior
to the event. This buy signal is strengthened if the stock has a cheap valuation and is of high quality.
The buy signal for stocks with weak momentum is even more pronounced for non-earnings events than it is
for earnings releases, although these stocks had worse shareholder returns leading up to the event. This
signal is stronger for stocks that have a cheap valuation, and is further amplified if the companies are of high
or neutral quality. Symantec, the subject of our first case study, was a non-earnings event with weak
momentum, cheap valuation, and high quality, and hence the data suggested a buy.
Sell. For earnings releases, momentum alone does not indicate a strong buy or sell pattern. But there is a
fairly strong sell signal for stocks that have the combination of strong momentum and expensive valuation. The
sell signal holds for stocks with strong momentum, expensive valuation, and any quality score. Tenet
Healthcare, our second case, had strong momentum, expensive valuation, and low quality—factors that
suggested selling the shares.
For non-earnings events, the cumulative abnormal returns following an event are largely positive. But we must
note that these stocks as a group performed poorly prior to the event, down more than five percentage points
relative to the market. There are a couple of combinations that suggest selling the stock. The strongest sell
signal is for companies that combine strong or neutral momentum, expensive valuation, and high quality.
Strong or neutral momentum and expensive valuation alone do not indicate a sell signal.
Making decisions in the face of uncertainty is always a challenge, but it is inherent to investing. Deciding what
to do with a stock following a sharp decline is particularly difficult because emotions tend to run high after
those events. This report provides grounding in the form of base rates in an effort to better inform decisions.
January 15, 2015
Managing the Man Overboard Moment 16
Exhibit 12: Ex-Bubble Earnings Event – Cumulative Abnormal Returns
Source: Credit Suisse HOLT.
Momentum Valuation Quality
Days
-30 Event N = +30 +60 +90
High -3.9% -13.8% 34 -0.2% -2.4% 0.0%
Neutral -3.9% -15.2% 17 -6.5% -0.3% 2.7%
Days Days Low -2.2% -14.1% 49 1.5% 1.1% 0.9%
-30 Event N = +30 +60 +90 -30 Event N = +30 +60 +90
Cheap -3.1% -14.2% 100 -0.5% -0.3% 0.9% High -2.6% -16.0% 37 -0.2% 4.1% 4.0%
Strong -1.5% -14.7% 322 -1.4% -2.0% -1.1% Neutral -1.9% -14.8% 93 -1.2% -1.5% -0.2% Neutral -3.6% -13.7% 20 -1.3% -3.2% -1.6%
Expensive 0.0% -15.0% 129 -2.2% -3.8% -3.3% Low -0.2% -14.1% 36 -2.1% -6.2% -3.8%
High 0.9% -14.8% 45 -1.1% -1.9% -0.6%
Neutral -1.3% -16.7% 36 -2.3% -2.5% -8.0%
Low 0.0% -13.9% 48 -3.1% -6.5% -2.4%
Days
-30 Event N = +30 +60 +90
High -6.9% -15.0% 40 0.1% -0.5% 2.5%
Neutral -3.2% -14.1% 44 1.0% 0.8% 5.2%
Days Days Low -4.6% -13.5% 36 -2.6% -2.9% -1.0%
-30 Event N = +30 +60 +90 -30 Event N = +30 +60 +90
Cheap -4.9% -14.2% 120 -0.4% -0.8% 2.5% High -1.1% -14.9% 32 -1.4% -1.7% -2.4%
Neutral -2.9% -14.2% 320 0.0% -0.4% 1.4% Neutral -1.8% -14.2% 109 0.9% 0.9% 2.2% Neutral -1.3% -14.0% 29 1.7% 4.2% 7.2%
Expensive -1.5% -14.1% 91 -0.7% -1.4% -1.1% Low -2.7% -13.9% 48 2.0% 0.7% 2.2%
High -3.1% -14.3% 38 -2.6% -3.1% 3.0%
Neutral -0.6% -13.7% 25 0.0% 2.5% 2.0%
Low 0.0% -14.2% 28 1.3% -2.6% -9.4%
Days
-30 Event N = +30 +60 +90
High -6.3% -15.0% 53 3.8% 6.3% 0.7%
Neutral -2.6% -14.9% 84 2.0% 2.2% 6.4%
Days Days Low -4.6% -13.7% 78 4.1% 1.2% 4.5%
-30 Event N = +30 +60 +90 -30 Event N = +30 +60 +90
Cheap -4.3% -14.5% 215 3.2% 2.8% 6.8% High 2.7% -14.2% 39 -1.5% 1.8% 3.8%
Weak -0.9% -14.6% 436 1.4% 1.9% 3.9% Neutral 1.0% -14.8% 125 -1.0% -0.5% -1.0% Neutral -0.8% -14.2% 29 -3.8% -2.0% -1.2%
Expensive 4.3% -14.5% 96 0.6% 3.1% 4.1% Low 0.7% -15.5% 57 0.9% -1.2% -4.3%
High 3.7% -15.5% 23 -3.9% 2.5% 2.0%
Neutral 8.0% -15.5% 26 1.6% 4.8% 3.5%
Low 2.5% -13.5% 47 2.4% 2.4% 5.4%
Days
Days Days
Days
Days Days
Days
Days Days
January 15, 2015
Managing the Man Overboard Moment 17
Exhibit 13: Ex-Bubble Non-Earnings Event – Cumulative Abnormal Returns
Source: Credit Suisse HOLT.
Momentum Valuation Quality
Days
-30 Event N = +30 +60 +90
High -6.8% -14.2% 50 5.1% 8.1% 11.6%
Neutral -14.4% -18.3% 48 -0.1% 4.3% 6.3%
Days Days Low -5.8% -13.7% 55 7.7% 17.5% 19.5%
-30 Event N = +30 +60 +90 -30 Event N = +30 +60 +90
Cheap -8.8% -15.3% 153 4.4% 10.3% 12.8% High -4.2% -15.0% 47 3.8% 2.7% 2.8%
Strong -2.6% -14.5% 631 2.1% 2.1% 1.5% Neutral -1.5% -14.6% 169 3.7% 3.5% 3.1% Neutral -1.8% -15.3% 67 5.0% 7.3% 3.4%
Expensive -0.1% -14.0% 309 0.1% -2.8% -4.9% Low 1.0% -13.5% 55 2.1% -0.5% 3.0%
High -2.8% -13.4% 153 -0.1% -7.6% -8.0%
Neutral 5.7% -15.8% 65 3.3% 5.7% -0.4%
Low 0.5% -13.6% 91 -1.8% -0.7% -2.8%
Days
-30 Event N = +30 +60 +90
High -10.8% -16.0% 73 2.8% 6.0% 6.5%
Neutral -9.0% -15.7% 70 2.8% 6.2% 11.4%
Days Days Low -6.4% -14.4% 59 0.3% 1.7% 5.4%
-30 Event N = +30 +60 +90 -30 Event N = +30 +60 +90
Cheap -8.9% -15.4% 202 2.1% 4.8% 7.9% High -7.2% -13.7% 73 -0.5% 0.4% 0.8%
Neutral -4.7% -15.0% 605 0.7% 1.8% 3.0% Neutral -4.9% -14.1% 189 0.6% 1.9% 2.9% Neutral -1.9% -14.0% 55 -0.2% 3.1% 4.4%
Expensive -0.5% -15.3% 214 -0.3% -1.1% -1.3% Low -4.8% -14.7% 61 2.6% 2.6% 4.0%
High -2.3% -15.7% 74 -4.3% -8.8% -11.0%
Neutral 4.9% -15.5% 52 2.6% 4.7% 5.0%
Low -2.1% -14.8% 88 1.2% 2.1% 3.0%
Days
-30 Event N = +30 +60 +90
High -8.9% -16.1% 143 5.2% 8.9% 9.5%
Neutral -7.6% -14.1% 143 4.8% 9.3% 10.3%
Days Days Low -9.7% -14.8% 187 7.9% 9.6% 5.2%
-30 Event N = +30 +60 +90 -30 Event N = +30 +60 +90
Cheap -8.9% -15.0% 473 6.2% 9.3% 8.1% High -8.8% -16.8% 73 1.7% 7.1% 9.4%
Weak -5.4% -15.1% 921 5.0% 8.0% 8.0% Neutral -3.6% -15.2% 255 1.2% 4.9% 7.3% Neutral 2.9% -14.3% 81 1.9% 7.0% 11.8%
Expensive 0.7% -15.0% 193 7.2% 9.0% 8.6% Low -5.0% -14.8% 101 0.5% 1.7% 2.2%
High -2.0% -14.6% 45 3.4% 4.6% 1.7%
Neutral 4.5% -16.9% 45 11.8% 16.9% 18.7%
Low 0.2% -14.4% 103 6.9% 7.5% 7.2%
Days
Days Days
Days
Days Days
Days
Days Days
January 15, 2015
Managing the Man Overboard Moment 18
Appendix A: Definition of the Factors
Momentum: Momentum is a gauge of market sentiment. Stocks that score well have rising levels of expected
CFROI as the result of upward earnings revisions, positive stock price momentum, and good liquidity.
CFROI Key Momentum, 13-week (60%) - CFROI Key Momentum measures change in the level of
expected CFROI following revisions in consensus earnings per share.
Price Momentum (52-week) (30%) - Price Momentum is based on the percentage change in market
value over the past 52 weeks.
Daily Liquidity Average (10%) - Daily Liquidity Average reflects the number of shares traded in the last
quarter, divided by 63 trading days, multiplied by the stock price at the end of the most recent week,
divided by market capitalization.
Valuation: Valuation assesses the difference between the stock’s warranted value, based on the HOLT
framework®, and the stock’s current market price. Stocks with the most upside are cheap, and those with the least
upside, or downside, are expensive.
Percentage Change to Best Price (50%) - Percentage Change to Best Price measures the difference
between HOLT’s warranted value and the current stock price. By using a discounted cash flow approach
that standardizes financial figures, the HOLT model generates values that allow for the comparison of firms
across regions, sectors, and accounting standards.
Economic P/E (30%) – Economic P/E is HOLT’s version of a price-to-earnings ratio. You can compare
Economic P/E across companies and industries because the value-to-cost ratio is divided by CFROI,
normalizing results. Specifically, Economic P/E = (Enterprise Value / Inflation Adjusted Net Assets) /
CFROI
Value-to-Cost Ratio (10%) – Value-to-Cost Ratio is analogous to price/book value, but reflects a
number of adjustments that reduce volatility and better reflect firm value. These include inflation
adjustments for old plant and inventory in gross investment, capitalized research and development (R&D),
capitalized operating leases, the reflection of the contingent claim for stock options in debt, pension debt,
preferred stock, and liabilities related to capitalized operating leases. The Value-to-Cost Ratio = (Market
Value of Equity + Minority Interest + HOLT Debt) / Inflation Adjusted Net Assets
Dividend Yield (10%) – Dividend Yield is the dividends paid in the last 12 months divided by the most
recent share price.
Quality: Quality measures a company’s record of generating cash and managing growth, independent of
expectations about the future. Firms that score well have high CFROIs and have shown the ability to grow profitable
businesses or the willingness to shrink unprofitable ones.
CFROI Last Fiscal Year (50%) - CFROI Last Fiscal Year is the ratio of gross cash flow to gross
investment and is expressed as an internal rate of return. We use the CFROI for the last reported fiscal
year.
Managing for Value (30%) - Managing for Value equals the spread between CFROI and the Discount
Rate, multiplied by the inflation-adjusted gross investment. This allows us to determine whether the
company’s growth creates value and is sustainable. Growth in businesses that earn a CFROI in excess of
the cost of capital is value creating, while growth in businesses with a negative spread destroys value.
Change in Value Creation (20%) - Change in Value Creation measures the improvement in “economic
profit” in the most recent fiscal year. A positive value indicates that the company either increased the
spread between CFROI and the discount rate, or grew in a business with a positive spread. Change in
Value Creation = (CFROI – Discount Rate * Growth Rate) – Prior Fiscal Year Spread.
January 15, 2015
Managing the Man Overboard Moment 19
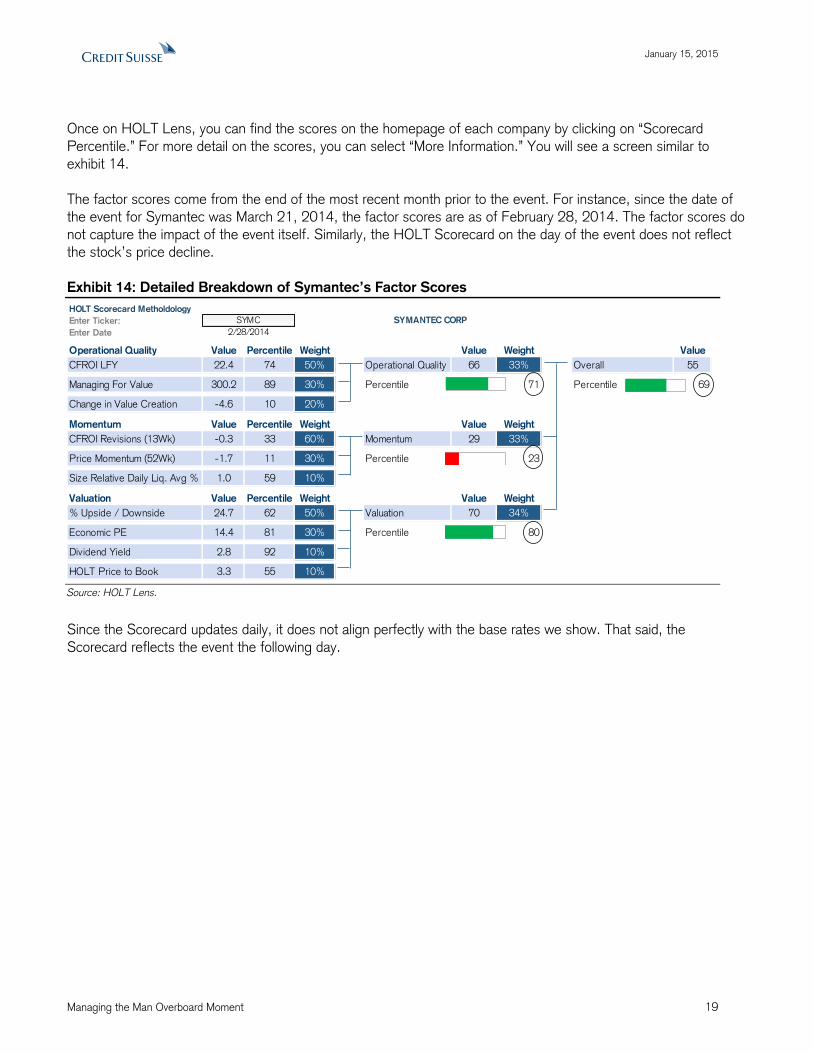
Once on HOLT Lens, you can find the scores on the homepage of each company by clicking on “Scorecard
Percentile.” For more detail on the scores, you can select “More Information.” You will see a screen similar to
exhibit 14.
The factor scores come from the end of the most recent month prior to the event. For instance, since the date of
the event for Symantec was March 21, 2014, the factor scores are as of February 28, 2014. The factor scores do
not capture the impact of the event itself. Similarly, the HOLT Scorecard on the day of the event does not reflect
the stock’s price decline.
Exhibit 14: Detailed Breakdown of Symantec’s Factor Scores
Source: HOLT Lens.
Since the Scorecard updates daily, it does not align perfectly with the base rates we show. That said, the
Scorecard reflects the event the following day.
HOLT Scorecard Metholdology
Enter Ticker:
Enter DateSYMANTEC CORP41698Operational Quality Value Percentile Weight Lens Scorecard: Regional Quality Percentile [REGIONSC_NONBR_OPS_SCORE]Value Weight Lens Scorecard: Regional Overall Percentile [REGIONSC_NONBR_OVERALL_SCORE]Value
CFROI LFY 22.4 74 50% Operational Quality 66 33% Overall 55
Managing For Value 300.2 89 30% Percentile 71% 71 Percentile 69% 69
Change in Value Creation -4.6 10 20%-4.588886Momentum Value Percentile Weight Lens Scorecard: Regional Momentum Percentile [REGIONSC_MOM_SCORE]Value Weight
CFROI Revisions (13Wk) -0.3 33 60% Momentum 29 33%
Price Momentum (52Wk) -1.7 11 30% Percentile 23% 23
Size Relative Daily Liq. Avg % 1.0 59 10%0.989809Valuation Value Percentile Weight Lens Scorecard: Regional Valuation Percentile [REGIONSC_VAL_SCORE]Value Weight
% Upside / Downside 24.7 62 50% Valuation 70 34%
Economic PE 14.4 81 30% Percentile 80% 80
Dividend Yield 2.8 92 10%
HOLT Price to Book 3.3 55 10%
SYMC SYMANTEC CORP
2/28/2014

January 15, 2015
Managing the Man Overboard Moment 20
Appendix B: Distributions of Stock Price Changes
This appendix reviews the distributions that apply to Symantec, one of our case studies. These distributions
reflect non-earnings announcements and contain all events, including the bubble periods. We also provide
some statistical properties for each distribution, including the sample size, mean, median, and standard
deviation.
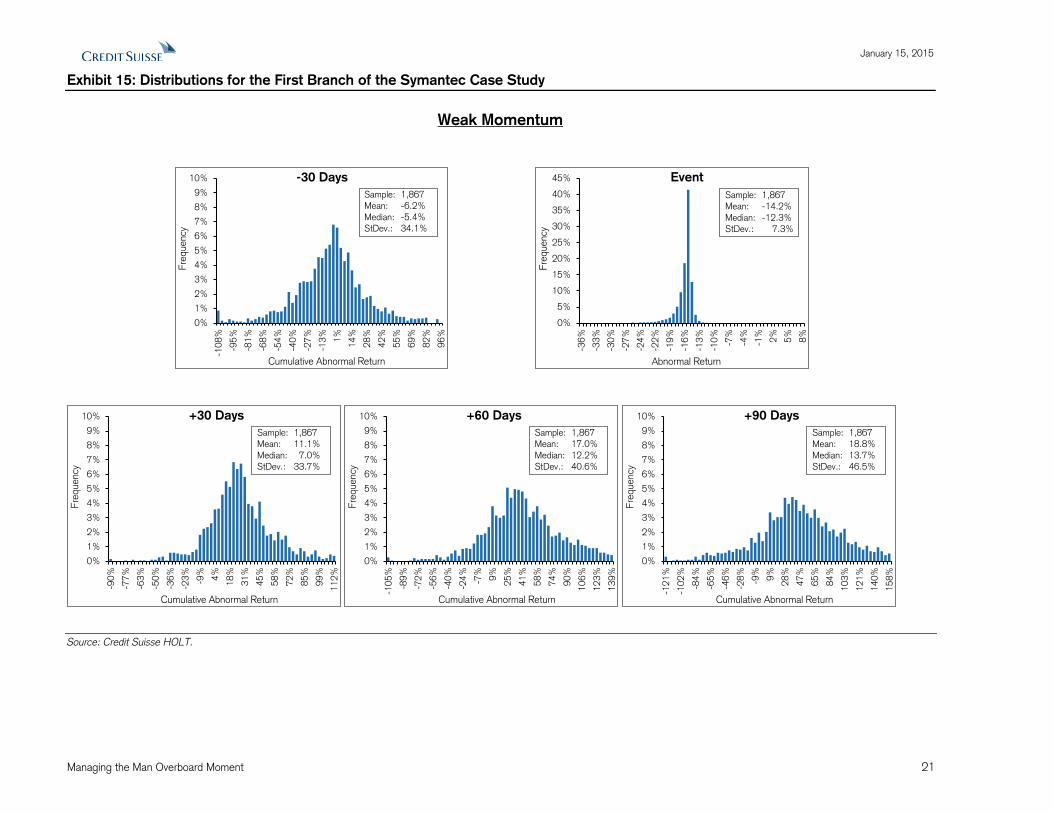
Exhibit 15 shows all the cases with weak momentum and displays five distributions of cumulative abnormal
returns, including the 30 trading days prior to the event, the event itself, and the cumulative abnormal returns
for the 30, 60, and 90 trading days subsequent to the event. This is the first branch of the Symantec case
study.
Exhibit 16 shows weak momentum and cheap valuation, which trims the sample size by nearly one-half. Here
again we include the 30 trading days prior to the event, the event itself, and the cumulative abnormal returns
for the 30, 60, and 90 trading days after the event. This is the second branch of the Symantec case study.
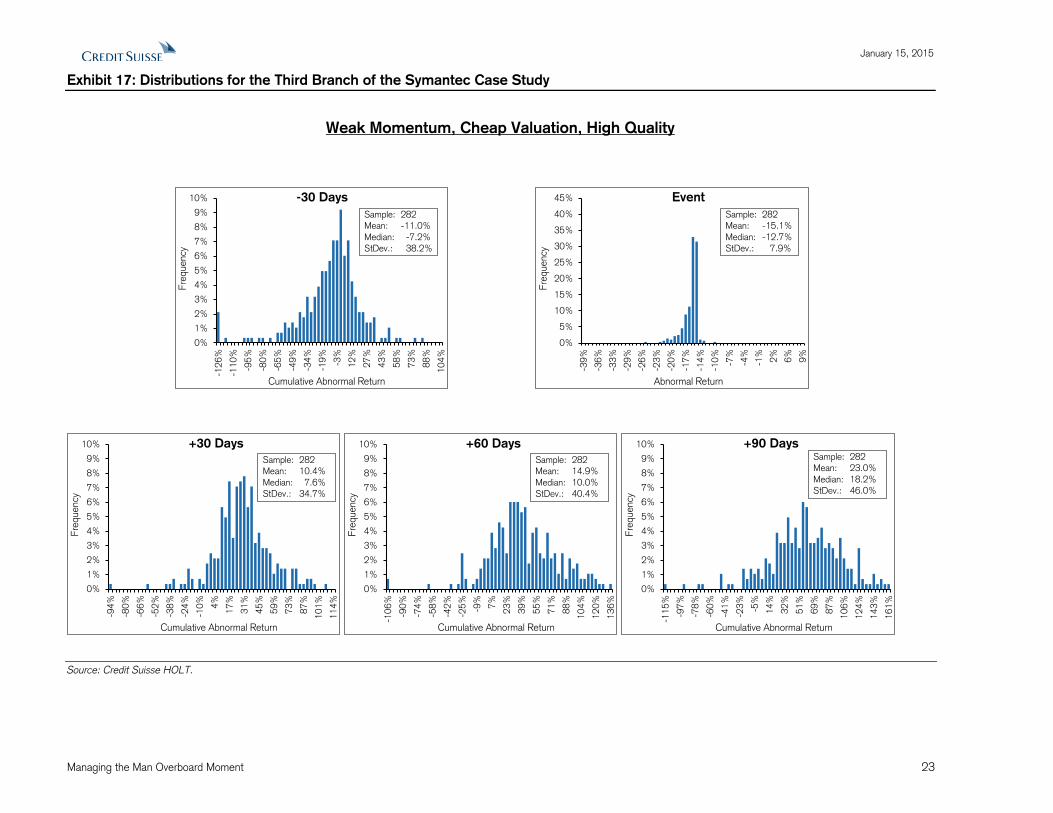
Exhibit 17 shows the final branch in the Symantec case study: weak momentum, cheap valuation, and high
quality. The sample size is just over one-quarter of the prior branch. You can see the 30 trading days prior to
the event, the event itself, and the cumulative abnormal returns for the 30, 60, and 90 trading days after the
event.
Please contact us if there are any other distributions and statistical properties you would like to see.
January 15, 2015
Managing the Man Overboard Moment 21
Exhibit 15: Distributions for the First Branch of the Symantec Case Study
Weak Momentum
Source: Credit Suisse HOLT.
0%
1%
2%
3%
4%
5%
6%
7%
8%
9%
10%
-10
8%
-95
%
-81
%
-68
%
-54
%
-40
%
-27
%
-13
%
1%
14
%
28
%
42
%
55
%
69
%
82
%
96
%
Fre
quency
Cumulative Abnormal Return
-30 Days
Sample: 1,867
Mean: -6.2%
Median: -5.4%
StDev.: 34.1%
0%
5%
10%
15%
20%
25%
30%
35%
40%
45%
-36
%
-33
%
-30
%
-27
%
-24
%
-22
%
-19
%
-16
%
-13
%
-10
%
-7%
-4%
-1%
2%
5%
8%
Fre
quency
Abnormal Return
Event
Sample: 1,867
Mean: -14.2%
Median: -12.3%
StDev.: 7.3%
0%
1%
2%
3%
4%
5%
6%
7%
8%
9%
10%
-90
%
-77
%
-63
%
-50
%
-36
%
-23
%
-9%
4%
18
%
31
%
45
%
58
%
72
%
85
%
99
%
11
2%
Fre
quency
Cumulative Abnormal Return
+30 Days
Sample: 1,867
Mean: 11.1%
Median: 7.0%
StDev.: 33.7%
0%
1%
2%
3%
4%
5%
6%
7%
8%
9%
10%
-10
5%
-89
%
-72
%
-56
%
-40
%
-24
%
-7%
9%
25
%
41
%
58
%
74
%
90
%
10
6%
12
3%
13
9%
Fre
quency
Cumulative Abnormal Return
+60 Days
Sample: 1,867
Mean: 17.0%
Median: 12.2%
StDev.: 40.6%
0%
1%
2%
3%
4%
5%
6%
7%
8%
9%
10%
-12
1%
-10
2%
-84
%
-65
%
-46
%
-28
%
-9%
9%
28
%
47
%
65
%
84
%
10
3%
12
1%
14
0%
15
8%
Fre
quency
Cumulative Abnormal Return
+90 Days
Sample: 1,867
Mean: 18.8%
Median: 13.7%
StDev.: 46.5%

January 15, 2015
Managing the Man Overboard Moment 22
Exhibit 16: Distributions for the Second Branch of the Symantec Case Study
Weak Momentum, Cheap Valuation
Source: Credit Suisse HOLT.
0%
1%
2%
3%
4%
5%
6%
7%
8%
9%
10%
-11
8%
-10
3%
-89
%
-74
%
-60
%
-46
%
-31
%
-17
%
-2%
12
%
27
%
41
%
55
%
70
%
84
%
99
%
Fre
quency
Cumulative Abnormal Return
-30 Days
Sample: 1,008
Mean: -9.5%
Median: -8.4%
StDev.: 36.0%
0%
5%
10%
15%
20%
25%
30%
35%
40%
45%
-37
%
-34
%
-31
%
-28
%
-25
%
-22
%
-19
%
-16
%
-13
%
-10
%
-7%
-4%
-1%
2%
5%
8%
Fre
quency
Abnormal Return
Event
Sample: 1,008
Mean: -14.3%
Median: -12.3%
StDev.: 7.5%
0%
1%
2%
3%
4%
5%
6%
7%
8%
9%
10%
-94
%
-80
%
-66
%
-51
%
-37
%
-22
%
-8%
7%
21
%
36
%
50
%
64
%
79
%
93
%
10
8%
12
2%
Fre
quency
Cumulative Abnormal Return
+30 Days
Sample: 1,008
Mean: 13.9%
Median: 9.6%
StDev.: 36.1%
0%
1%
2%
3%
4%
5%
6%
7%
8%
9%
10%
-11
4%
-96
%
-78
%
-61
%
-43
%
-25
%
-7%
10
%
28
%
46
%
63
%
81
%
99
%
11
6%
13
4%
15
2%
Fre
quency
Cumulative Abnormal Return
+60 Days
Sample: 1,008
Mean: 19.1%
Median: 12.6%
StDev.: 44.2%
0%
1%
2%
3%
4%
5%
6%
7%
8%
9%
10%
-12
9%
-10
9%
-89
%
-69
%
-49
%
-28
%
-8%
12
%
32
%
52
%
73
%
93
%
11
3%
13
3%
15
3%
17
3%
Fre
quency
Cumulative Abnormal Return
+90 Days
Sample: 1,008
Mean: 22.1%
Median: 17.1%
StDev.: 50.4%
January 15, 2015
Managing the Man Overboard Moment 23
Exhibit 17: Distributions for the Third Branch of the Symantec Case Study
Weak Momentum, Cheap Valuation, High Quality
Source: Credit Suisse HOLT.
0%
1%
2%
3%
4%
5%
6%
7%
8%
9%
10%
-12
6%
-11
0%
-95
%
-80
%
-65
%
-49
%
-34
%
-19
%
-3%
12
%
27
%
43
%
58
%
73
%
88
%
10
4%
Fre
quency
Cumulative Abnormal Return
-30 Days
Sample: 282
Mean: -11.0%
Median: -7.2%
StDev.: 38.2%
0%
5%
10%
15%
20%
25%
30%
35%
40%
45%
-39
%
-36
%
-33
%
-29
%
-26
%
-23
%
-20
%
-17
%
-14
%
-10
%
-7%
-4%
-1%
2%
6%
9%
Fre
quency
Abnormal Return
Event
Sample: 282
Mean: -15.1%
Median: -12.7%
StDev.: 7.9%
0%
1%
2%
3%
4%
5%
6%
7%
8%
9%
10%
-94
%
-80
%
-66
%
-52
%
-38
%
-24
%
-10
%
4%
17
%
31
%
45
%
59
%
73
%
87
%
10
1%
11
4%
Fre
quency
Cumulative Abnormal Return
+30 Days
Sample: 282
Mean: 10.4%
Median: 7.6%
StDev.: 34.7%
0%
1%
2%
3%
4%
5%
6%
7%
8%
9%
10%
-10
6%
-90
%
-74
%
-58
%
-42
%
-25
%
-9%
7%
23
%
39
%
55
%
71
%
88
%
10
4%
12
0%
13
6%
Fre
quency
Cumulative Abnormal Return
+60 Days
Sample: 282
Mean: 14.9%
Median: 10.0%
StDev.: 40.4%
0%
1%
2%
3%
4%
5%
6%
7%
8%
9%
10%
-11
5%
-97
%
-78
%
-60
%
-41
%
-23
%
-5%
14
%
32
%
51
%
69
%
87
%
10
6%
12
4%
14
3%
16
1%
Fre
quency
Cumulative Abnormal Return
+90 DaysSample: 282
Mean: 23.0%
Median: 18.2%
StDev.: 46.0%

January 15, 2015
Managing the Man Overboard Moment 24
Appendix C: A Quick Survey of the Academic Literature
There is a rich literature on abnormal price changes following large stock price moves. Much of this academic
work was done in the mid-1980s through the mid-1990s. We found no papers that trace the steps we follow:
1. Observe price declines of 10 percent or more;
2. Sort based on scheduled earnings and non-earnings events;
3. Introduce factors to refine the reference classes;
4. Observe cumulative abnormal returns by reference class.
These studies are equivocal. Most do show statistically significant reversals after sharp one-day drops. But
some of the potential explanations for the rebound, including stock market seasonality, changing risk, size
effects, and the role of bid-ask spreads, call into question whether the price action reflects a true inefficiency.
The papers we consulted include the following:
Atkins, Allen B., and Edward A. Dyl, “Price Reversals, Bid-Ask Spreads, and Market Efficiency,” Journal of
Financial and Quantitative Analysis, Vol. 25, No. 4, December 1990, 535-547.
Bremer, Marc, Takato Hiraki, and Richard J. Sweeney, “Predictable Patterns after Large Stock Price Changes on
the Tokyo Stock Exchange,” Journal of Financial and Quantitative Analysis, Vol. 32, No. 3, September 1997, 345-
365.
Bremer, Marc, and Richard J. Sweeney, “The Reversal of Large Stock-Price Decreases,” Journal of Finance, Vol.
46, No. 2, June 1991, 747-754.
Brown, Keith C., W.V. Harlow, and Seha M. Tinic, “Risk Aversion, Uncertain Information, and Market Efficiency,”
Journal of Financial Economics, Vol. 22, No. 2, December 1998, 355-385.
Cox, Don R., and David R. Peterson, “Stock Returns following Large One-Day Declines: Evidence on Short-Term
Reversals and Longer-Term Performance,” Journal of Finance, Vol. 49, No. 1, March 1994, 255-267.
De Bondt, Werner F.M., and Richard Thaler, “Does the Stock Market Overreact?” Journal of Finance, Vol. 40, No.
3, July 1985, 793-805.
Jegadeesh, Narasimhan, “Evidence of Predictable Behavior of Security Returns,” Journal of Finance, Vol. 49, No.
1, March 1994, 255-267.
Jegadeesh, Narasimhan, and Sheridan Titman, “Returns to Buying Winners and Selling Losers: Implications for
Stock Market Efficiency,” Journal of Finance, Vol. 48, No. 1, March 1993, 65-91.
Lehmann, Bruce N., “Fads, Martingales, and Market Efficiency,” Quarterly Journal of Economics, Vol. 105, No. 1,
February 1990, 1-27.
Savor, Pavel G., “Stock returns after major price shocks: The impact of information,” Journal of Financial
Economics, Vol. 106, No. 3, December 2012, 635-659.

January 15, 2015
Managing the Man Overboard Moment 25
Endnotes
1 Thanks to Ian McKinnon of Sandia Holdings LLC, the first person we heard use this phrase, for allowing us to
use it in the title of this report. 2 Atul Gawande, The Checklist Manifesto: How to Get Things Right (New York: Metropolitan Books, 2009), 122-
128. For checklists related to investing, see Mohnish Pabrai, Guy Spier, and Michael Shearn, “Keynote Q&A
Session on Investment Checklists,” Best Ideas 2014, Hosted by John and Oliver Mihaljevic, January 7, 2014. See
http://www.valueconferences.com/wp-content/uploads/2014/12/ideas14-pabrai-spier-shearn-transcript.pdf. 3 Barbara K. Burian, “Emergency and Abnormal Checklist Design Factors Influencing Flight Crew Response:
A Case Study,” Proceedings of the International Conference on Human–Computer Interaction in Aeronautics,
2004. 4 Daniel Kahneman and Dan Lovallo, “Timid Choices and Bold Forecasts: A Cognitive Perspective on Risk
Taking,” Management Science, Vol. 39, No. 1, January 1993, 17-31. 5 Daniel Kahneman and Amos Tversky, “On the Psychology of Prediction,” Psychological Review, Vol. 80, No.
4, July 1973, 237-251. 6 Maya Bar-Hillel, “The Base-Rate Fallacy in Probability Judgments,” Acta Psychologica, Vol. 44, No. 3, May
1980, 211-233. 7 Dan Lovallo, Carmina Clarke, and Colin Camerer, “Robust Analogizing and the Outside View: Two Empirical
Tests of Case-Based Decision Making,” Strategic Management Journal, Vol. 33, No. 5, May 2012, 496-512.
Important information
This document was produced by and the opinions expressed are those of Credit Suisse as of the date of writing and are subject to change. It has been prepared
solely for information purposes and for the use of the recipient. It does not constitute an offer or an invitation by or on behalf of Credit Suisse to any person to buy or sell any security. Nothing in this material constitutes investment, legal, accounting or tax advice, or a representation that any investment or strategy is suitable
or appropriate to your individual circumstances, or otherwise constitutes a personal recommendation to you. The price and value of investments mentioned and
any income that might accrue may fluctuate and may fall or rise. Any reference to past performance is not a guide to the future.
The information and analysis contained in this publication have been compiled or arrived at from sources believed to be reliable but Credit Suisse does not make
any representation as to their accuracy or completeness and does not accept liability for any loss arising from the use hereof. A Credit Suisse Group company
may have acted upon the information and analysis contained in this publication before being made available to clients of Credit Suisse. Investments in emerging markets are speculative and considerably more volatile than investments in established markets. Some of the main risks are political risks, economic risks, credit
risks, currency risks and market risks. Investments in foreign currencies are subject to exchange rate fluctuations. Before entering into any transaction, you should consider the suitability of the transaction to your particular circumstances and independently review (with your professional advisers as necessary) the
specific financial risks as well as legal, regulatory, credit, tax and accounting consequences. This document is issued and distributed in the United States by
Credit Suisse Securities (USA) LLC, a U.S. registered broker-dealer; in Canada by Credit Suisse Securities (Canada), Inc.; and in Brazil by Banco de Investimentos Credit Suisse (Brasil) S.A.
This document is distributed in Switzerland by Credit Suisse AG, a Swiss bank. Credit Suisse is authorized and regulated by the Swiss Financial Market
Supervisory Authority (FINMA). This document is issued and distributed in Europe (except Switzerland) by Credit Suisse (UK) Limited and Credit Suisse Securities (Europe) Limited, London. Credit Suisse Securities (Europe) Limited, London and Credit Suisse (UK) Limited, authorised by the Prudential Regulation Authority
(PRA) and regulated by the Financial Conduct Authority (FCA) and PRA, are associated but independent legal and regulated entities within Credit Suisse. The protections made available by the UK‘s Financial Services Authority for private customers do not apply to investments or services provided by a person outside the
UK, nor will the Financial Services Compensation Scheme be available if the issuer of the investment fails to meet its obligations. This document is distributed in
Guernsey by Credit Suisse (Guernsey) Limited, an independent legal entity registered in Guernsey under 15197, with its registered address at Helvetia Court, Les Echelons, South Esplanade, St Peter Port, Guernsey. Credit Suisse (Guernsey) Limited is wholly owned by Credit Suisse and is regulated by the Guernsey
Financial Services Commission. Copies of the latest audited accounts are available on request. This document is distributed in Jersey by Credit Suisse (Guernsey)
Limited, Jersey Branch, which is regulated by the Jersey Financial Services Commission. The business address of Credit Suisse (Guernsey) Limited, Jersey Branch, in Jersey is: TradeWind House, 22 Esplanade, St Helier, Jersey JE2 3QA. This document has been issued in Asia-Pacific by whichever of the following
is the appropriately authorised entity of the relevant jurisdiction: in Hong Kong by Credit Suisse (Hong Kong) Limited, a corporation licensed with the Hong Kong Securities and Futures Commission or Credit Suisse Hong Kong branch, an Authorized Institution regulated by the Hong Kong Monetary Authority and a
Registered Institution regulated by the Securities and Futures Ordinance (Chapter 571 of the Laws of Hong Kong); in Japan by Credit Suisse Securities (Japan)
Limited; elsewhere in Asia/Pacific by whichever of the following is the appropriately authorized entity in the relevant jurisdiction: Credit Suisse Equities (Australia) Limited, Credit Suisse Securities (Thailand) Limited, Credit Suisse Securities (Malaysia) Sdn Bhd, Credit Suisse AG,Singapore Branch,and elsewhere in the world
by the relevant authorized affiliate of the above.
This document may not be reproduced either in whole, or in part, without the written permission of the authors and CREDIT SUISSE.
HOLT®
With respect to the analysis in this report based on the Credit Suisse HOLT methodology, Credit Suisse certifies that (1) the views expressed in this
report accurately reflect the Credit Suisse HOLT methodology and (2) no part of the Firm's compensation was, is, or will be directly related to the
specific views disclosed in this report.
The Credit Suisse HOLT methodology does not assign recommendations to a security. It is an analytical tool that involves use of a set of proprietary
quantitative algorithms and warranted value calculations, collectively called the Credit Suisse HOLT valuation model, that are consistently applied to all
the companies included in its database. Third-party data (including consensus earnings estimates) are systematically translated into a number of default
variables and incorporated into the algorithms available in the Credit Suisse HOLT valuation model. The source financial statement, pricing, and
earnings data provided by outside data vendors are subject to quality control and may also be adjusted to more closely measure the underlying
economics of firm performance. These adjustments provide consistency when analyzing a single company across time, or analyzing multiple companies
across industries or national borders. The default scenario that is produced by the Credit Suisse HOLT valuation model establishes the baseline
valuation for a security, and a user then may adjust the default variables to produce alternative scenarios, any of which could occur. Additional
information about the Credit Suisse HOLT methodology is available on request.
The Credit Suisse HOLT methodology does not assign a price target to a security. The default scenario that is produced by the Credit Suisse HOLT
valuation model establishes a warranted price for a security, and as the third-party data are updated, the warranted price may also change. The default
variables may also be adjusted to produce alternative warranted prices, any of which could occur. Additional information about the Credit Suisse HOLT
methodology is available on request.
© 2015 CREDIT SUISSE GROUP AG and/or its affiliates. All rights reserved