Embed Size (px)
Citation preview

Manchester: A City of TreesA Survey of Street Trees in
Manchester, New HampshireImplemented by the NH Community Tree Steward Program
Sponsored by UNH Cooperative Extensionin partnership with the NH Division of Forests and Lands
and the Society for the Protection of NH Forests
1998

Table of Contents
Acknowledgments ________________________________ 3Tree Survey Highlights ____________________________ 4Introduction______________________________________ 5Manchester Survey Zone ___________________________ 6Tree Survey Pre-sample ____________________________ 72,000 Tree Survey Method __________________________ 7Manchester Tree Survey Results ____________________ 8Tree Species Conditions by Zone ____________________ 9Tree Size Class by Zone ____________________________ 11Species Composition _____________________________ 12Maintenance Needs ______________________________ 17Planting Sites Throughout the City _________________ 18Planting Recommendations _______________________ 191989 Tree Survey Comparison _____________________ 19
Appendices _____________________________________ 21Tree Conditions by Zone
Business District __________________________ 22Center City and West Side Areas ____________ 23North End ________________________________ 24Outer Neighborhoods ______________________ 25
Size Class by ZoneBusiness District __________________________ 27Center City and West Side Areas ____________ 28North End ________________________________ 29Outer Neighborhoods ______________________ 30

3
AcknowledgmentThe New Community Tree Steward Program wishes to thank the Norwin S. and Elizabeth N.Bean Foundation in cooperation with the New Hampshire Charitable Foundation. They providedthe New Hampshire Community Tree Steward Program with funding for the Manchester StreetTree Survey project and for the resulting report and brochure, Manchester: A City of Trees.
Special thanks to Jane L. Calvin, Community Action Forester, of the Massachusetts Department ofEnvironmental Management. Her patience, assistance, and time providing training and guidanceto the Tree Steward Program throughout the survey process and data analysis (including herwork on determining tree values) are very much appreciated.
Thank you to the City of Manchester Parks and Recreation Department for its support, knowl-edge, and time given to the Tree Steward Program. Thank you to the City of Manchester PlanningDepartment for the development of the Tree Survey Zone map and use of its facilities.
This project would not have been accomplished without the many dedicated volunteers who gavefreely hours of their time to complete this project. Deep appreciation and thanks to the followinggroups:
New Community Tree StewardsBruce Anderson Pearly Deneault Frank RiceJane Beaulieu Bob Hughes Ed SmithSusan Bixby Bill Kucharski Sr. Judy StephensMary Ann Croker Dottie LarkinNancy Currier Dee Dee O’Rourke
New Hampshire Parks Americorps Service MembersSean Coleman Nate Lengacher Holly RadiceMartha Schulman Silas Mathes
Special thanks to Saint Anselm College Intern Christopher Allaire for his attention to detail, timeand effort in developing the data entry program, and collecting and entering data.
For their guidance and support in all phases of this project the Tree Steward Program is verygrateful to:
Daniel Sundquist, Society for the Protection of NH Forest,Mary Ellen Boelhower, University of NH (formerly with the Society for the Protection of NH Forest)Karen Bennett, UNH Cooperative ExtensionHolly Young, UNH Cooperative ExtensionRobert Edmonds, UNH Cooperative ExtensionStanley Knowles, NH Division of Forests and LandsJ.B. Cullen, NH Division of Forests and Lands
Mary P. Tebo, Community Forestry CoordinatorUNH Cooperative Extension

4
Tree Survey Highlights• Manchester has 50,000 street trees with an estimated value of $128 million dollars.
• Seventy one per cent of all the street trees throughout the city are in good to excellent condi-tion. The survey shows, however, that the condition of trees varies greatly among the follow-ing four zones studied: Business District, Center City and West Side Areas, the North End, andOuter Neighborhoods.
• Street trees in the Outer Neighborhoods are in the best condition with 81% in the good toexcellent category. The Center City, West Side Areas, and Business District have less than 50%of their trees in good to excellent condition.
• Based on their current health, over half the trees in the Center City, West Side Areas, and theBusiness District won’t survive for more than ten years. A long-term management programneeds to be established immediately to help them survive.
• Fifty per cent of all street trees throughout Manchester are 1-8 inches in diameter. In theBusiness District, 81% of all street trees are also 1-8 inches in diameter. Of these smaller trees,61% were only in fair to poor condition. It appears there may be problems getting young treesestablished in the Business District.
• The North End had the greatest number of mature trees. Fifty nine per cent were 9 inches orgreater. Many of these trees have grown from seed and lack desirable characteristics of nurs-ery-grown trees. The North End has the greatest need for mature tree care.
• There are 61 species of street trees represented throughout the city. Red maple, a nativespecies, has the greatest amount at 13%. Norway maple, an exotic and invasive species, has12%. These two species exceed the recommended 5%-10% limit of any single tree specieswithin a community.
• Throughout the city, there are an estimated 14,731 good to excellent planting sites along citystreets. The Business District, the only area with limited sites, may have to consider thefollowing options: plant smaller tree species where space is limited, improve the plantingbeds, plant fewer trees, and/or require future planting beds meet a set standards.
• An estimated 2,000 public and private street trees are in poor condition and will need to beremoved in the next five years. Planting 250 street trees each year for the next ten years canreplace anticipated losses.
• In comparison to a 1989 survey, the amount of street trees in Manchester has decreased byapproximately 10,000, and the conditions of street trees have deteriorated from approximately86% (in healthy condition) to 71%. This coincides with the decrease in the tree maintenancebudget due to city budget constraints in the 1980’s and 90’s.
5
IntroductionDuring 1997, the New Hampshire Community Tree Steward Program, in partnership withManchester Parks and Recreation Department, conducted a statistical survey of the street trees inthe City of Manchester to determine the overall health, species distribution, and maintenancerequirements of Manchester’s Urban Forest. The survey also included collection of data pertain-ing to available planting sites for trees.
RationaleThis survey is a statistically accurate method of estimating the species composition of an urbanstreet tree population quickly, and accurately, with an acceptable level of error. A complete stem-by-stem tree inventory is expensive and time consuming. Furthermore, managing a full databaseand updating it over the years requires additional resource allocation. This partial inventorybased on stratified random sampling, is an affordable and practical way of establishing a databaseof urban street tree information for a community.
For Manchester, a city with a minimal tree budget, this type of inventory can provide informationessential to develop a citywide tree management plan. This method provides the followinginformation: species composition, diameter class, health, total number of street trees, and numberof potential planting sites. Data collected provides a means for statistically accurate detection ofgeneral patterns and trends in street tree populations, such as overplanting of a particular species.
MethodA Statistical Method for the Accurate and Rapid Sampling of Urban Street Tree Populations published byR. Jaenson, N. Bassuk, S. Schwager, and D. Headley (Journal of Arboriculture, July 1992) was thesurvey model used. This method used published and peer-reviewed research which was demon-strated as accurate in research conducted in four New York cities of varying sizes. The methodconsists of four steps:
1) establishing zones2) surveying a pre-sample of trees3) surveying at least 2000 trees (distribution based on pre-sample)4) data analysis.
ZonesThe City of Manchester was divided into four zones based on land use patterns, canopy cover,and development patterns (Table 1). Many neighborhoods were distributed within these zoneclassifications but no neighborhood crossed zone boundaries. The zones were designated asfollows:

6
Table 1: Manchester Tree Inventory Zones
# Zones Areas Covered1. Business District Downtown (west of Pine Street), and the South Willow Street area.2. Center City and West
Side AreasNorth of Cilley Road to Orange Street, and west of Belmont to PineStreet, On the West Side: east of Main and Dubuque Streets.
3. North End Webster Street north, and north and west of Derryfield Park.4. Outer Neighborhoods Surrounding neighborhoods on both the East and West Sides.

7
Tree Survey Pre-sampleThe pre-sample estimated the number of trees in each zone and throughout the city. A boundaryof twenty feet from the edge of the street was established. Both publicly owned and privatelyowned trees were included in the pre-sample and the full survey. (Twenty feet was chosen be-cause Manchester has no standard right-of-way setbacks which varied from street to street.) Inthe pre-sample, trees were counted to determine the number of trees per block. Species were notrecorded in the pre-sample. Data collected in the pre-sample helped determine how many blocksto count in each zone for the full 2,000 tree survey.
MethodEvery block in each zone was numbered on a map and several blocks in each zone were randomlychosen (random number generation) to be surveyed. Blocks were surveyed by driving aroundthe block and counting the street trees on the interior of the block. (This same windshield methodwas used in the full 2,000-tree survey, except more data was collected.) From this pre-sample, anaverage number of trees per block were determined and this was extrapolated to estimate howmany trees were in each zone and thus, the city.
ResultsApproximately 1311 trees were surveyed in the pre-sample of 64 blocks throughout the city ofManchester (Table 2). Results from this pre-survey determined an estimate of 38,658 trees in thetwenty-foot setback. To conduct a full 2,000-tree survey, 64 blocks needed to be surveyed.
Table 2: Pre-sample Results by Zone
Zones Pre-Sample Need to Sample
# Blocks#Blocks
(Pre)# Trees(Pre)
#Trees/Block
Est. #Trees % Trees # Trees #Blocks
Business District 92 10 156 15.60 1,435.2 3.7% 80 5Center City/West Side Areas 290 10 125 12.50 3,625 9.3% 180 14North End 223 10 679 67.90 15,141.7 39.1% 780 12OuterNeighborhoods 631 12 351 29.25 18,456.75 47.7% 960 33
1,236 42 125.25 — 38,658.65 100% 2,000 64
2,000 Tree Survey MethodData collected in the pre-sample showed the number of blocks to be surveyed in each zone.Again, these blocks were chosen through a random number generation computer program devel-oped by Tree Steward, Ed Smith. The interior circumference of each block was surveyed and datacollected on a tally sheet. Species were identified, along with their diameter class and overallcondition. Table 3 shows how condition classes were categorized. Condition was represented byclassifying trees into four condition classes (excellent, good, fair, and poor). Potential tree plantingsites were also tallied, along with their size and condition. Vacant sites were identified within 20feet from the edge of the pavement. Potential tree planting sites are described further beginningon page 18.

8
Table 3: Conditions of Trees
Condition Description
Excellent:
Good:
Fair:
Poor:
Dead/Dying:
Perfect specimen. Excellent form and vigor for species. No pest problems ormechanical injuries. No corrective work required. Minimum life expectancy - 30years.
Healthy and vigorous. No apparent signs of insect, disease, or mechanical injury.Little or no corrective work required. Representative of the species. Minimum lifeexpectancy - 20 years.
Average condition and vigor for area. May need corrective pruning or repair. Maylack desirable, characteristic form. May show minor insect, disease or physiologicalproblems. Minimum life expectancy - 10 years.
General state of decline. May show severe mechanical, insect, or disease injury, butdeath is not imminent. May require major repair or renovation. Minimum lifeexpectancy - 5 years.
Dead, or death imminent within 5 years.
A total of 2,977 trees or 6.4% of the street trees within 20 feet from the edge of the pavement weresampled in 64 city blocks. Table 4 reflects the numbers of trees sampled.
Table 4: Number of Trees Surveyed by Zone
# of trees % of total
Business District 363 12.2Center City, West Side Areas 185 6.2North End 744 24.9Outer Neighborhoods 1,685 56.6
Total 2,977 100
Manchester Tree Survey Results
Value of Manchester’s Street TreesBased on the data collected, the total estimated number of trees within 20 feet from the edge ofpavement was 46,924, with a total value of $127,875,000. This dollar figure is based on replace-ment cost, the size of each tree, and the species distribution. Jane Calvin, Action Forester of theMassachusetts Department of Environmental Management, compiled the data to determine theestimated dollar value. The program used for calculations was the Tree Inventory System devel-oped by the University of Nebraska and the Nebraska Forest Service Community Forestry Program.
Overall Tree ConditionsThroughout the city, 71% of trees were in good to excellent condition. Twenty nine per cent of thetrees were in fair to poor condition and need immediate attention. Although this statistic looksreasonably good, there are wide disparities throughout the city (Table 5).

9
In two zones, the Center City/West Side Areas, and the Business District, over half of the trees(52 - 55%) were in fair to poor condition and not likely to survive for more than ten years. Estab-lishing an immediate care and long term maintenance program will help ensure their survival.While many Business District and Center City trees were in distress, the Outer Neighborhoodshad the healthiest trees with 81% in good to excellent condition, followed by the North End with65% in good to excellent condition.
Table 5: Tree Condition Totals
Categories
Zones
# and %of TreesObserved
#Excellent
%Excellent
#Good
%Good Fair
%Fair
#Poor
%Poor
Business District185 1 0.5% 83 44.9% 87 47.0% 14 7.6
Center City/West Side Areas 363 11 3.0% 161 44.4% 146 40.2% 45 12.4
North End 744 132 17.7% 357 48.0% 207 27.8% 48 6.5OuterNeighborhoods 1685 505 30.0% 858 50.9% 263 15.6% 59 3.5Total TreesObserved
2977(100%)
649 21.8% 1459 49.0% 703 23.6% 166 5.6
Developing a Management PlanManchester does not currently have a tree management plan. The information from this surveycan help the city to develop a city-wide management plan for its trees. According to a 1989 USDAForest Service report, a management plan supports budget requests by linking expenditures tospecific management activities such as identifying specific locations scheduled for tree planting,pruning, and removals. A management plan is critical for developing, sustaining, and maintain-ing the urban forest.
Tree Species Condition by Zone
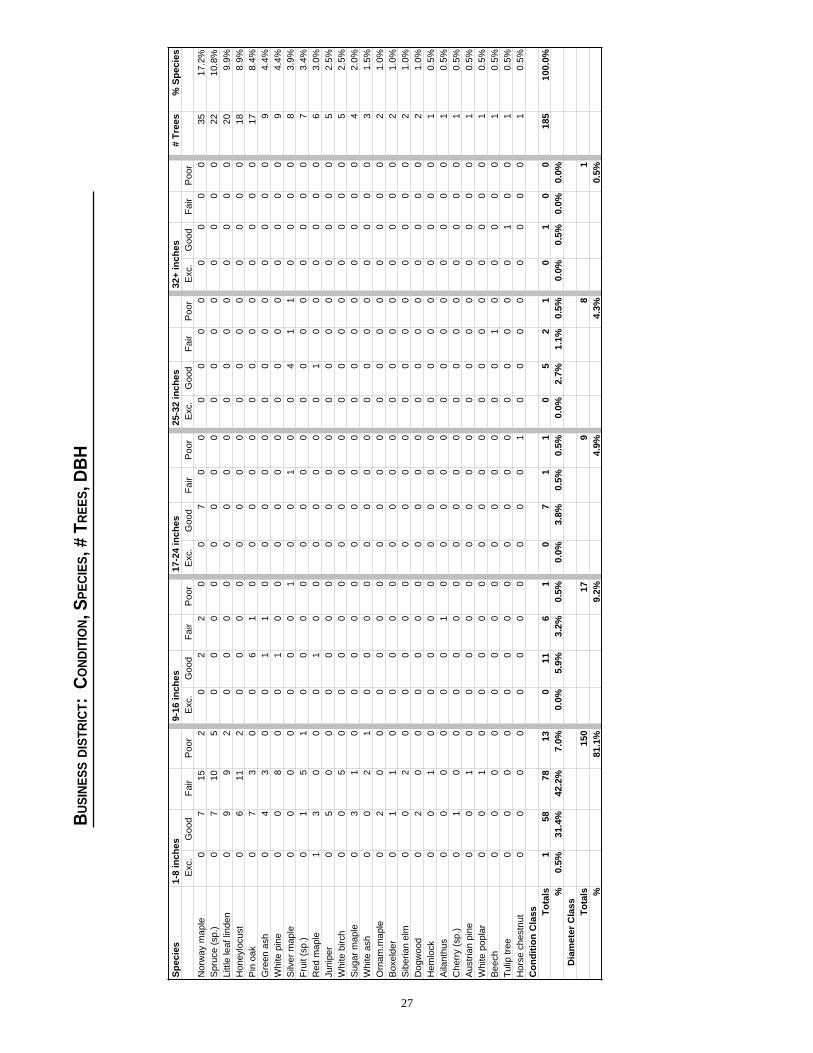
Business DistrictThe Business District had the largest percentage of trees in fair or poor condition with only 44%in good condition and .05% in excellent condition. Norway maple was the most common speciesfound in the Business District. Of 35 individual trees sampled, only 16 were in good condition.Other species were in better condition. Table 6 shows those species with more than 50% of theirpopulation in good condition.
Table 6: Business District Trees Species in Good to Excellent Condition
Species %red maple 100pin oak 76.5green ash 60.5

10
Table 7 shows trees with 50% or more in fair to poor condition. This does not include all treespecies that might do poorly, but only those species viewed in the inventory in sufficient quanti-ties to be measured.
Table 7: Business District Trees Species in Fair to Poor Condition
Species %white birch 100white pine 88.9honey locust 72.2Norway maple 54.3silver maple 50.0
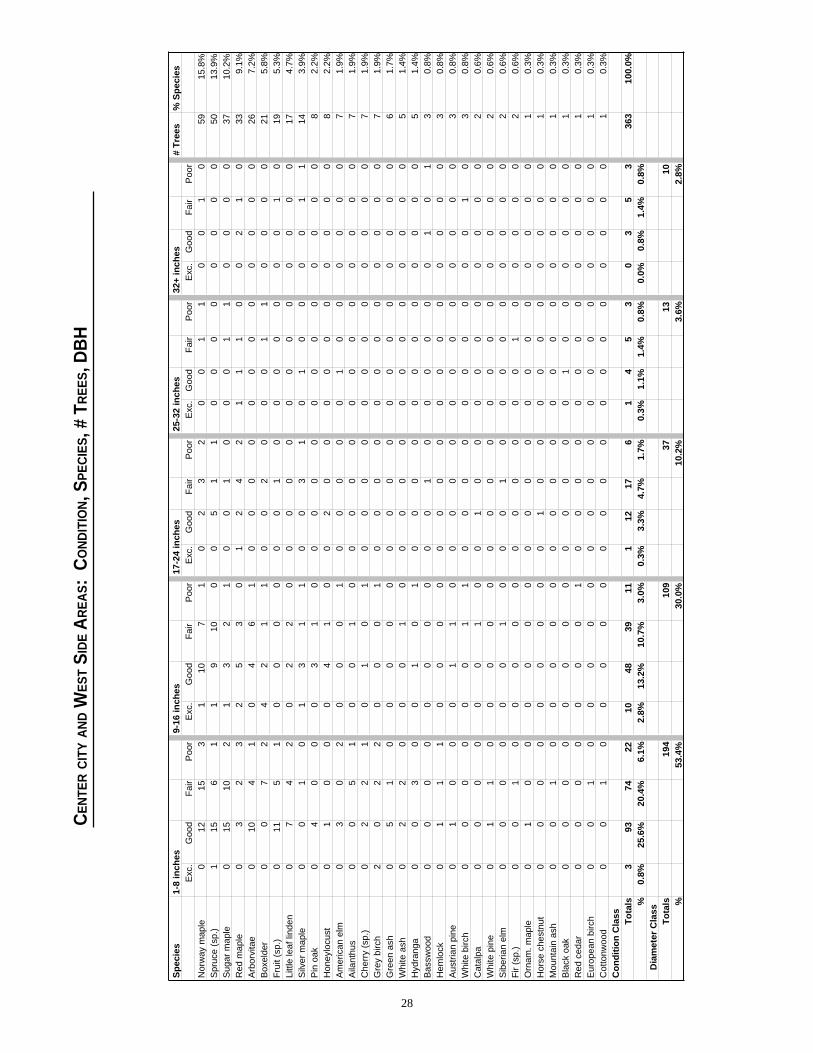
Center City/West Side AreasTree species in the Center City/West Side Areas also had a large percentage of trees in fair or poorcondition, at 52%. Again, Norway maple was the most common species found in this zone with57% in fair or poor condition. Table 8 shows those species with 50% or more in good condition.
Table 8: Center City and West Side Area Tree Species in Good to Excellent Condition
Species %pin oak 87.5honey locust 87.5green ash 83.3spruce 62.0fruit 57.9American elm 57.1arborvitae 53.8little leaf linden 52.9
Table 9 indicates those species with 50% or more of the trees in fair to poor condition. This doesnot include all species that might do poorly, but only those observed in the sufficient quantities tobe measured.
Table 9: Center City and West Side Area Tree Species in Fair to Poor Condition
Species %ailanthus 100white birch 100boxelder 90.4gray birch 71.5silver maple 64.3white ash 60.0cherry 57.2Norway maple 56.1red maple 51.6

11
North EndIn Manchester’s North End, 66% of the trees were in good to excellent condition. Trees in theNorth End had more growing space than those in the previous two zones. Improved growingconditions was the likely reason why all tree species observed were doing well with the exceptionof white birch. Reasons for the poorer health of the white birch were not documented. However,it is significant that in three of the four zones, white birch was not doing as well as other species.
Outer NeighborhoodTrees in Manchester’s Outer Neighborhoods were in the best condition with 81% of the trees ingood to excellent condition. Less stress factors seemed to be present in this area of the city and alltree species observed were doing well with the exception of willows. The reason for the poorercondition of the willows was not documented. The Outer Neighborhoods was the only zone thathad willows in significant enough numbers to record.
Tree Size Class by Zone
City-WideFifty per cent of all street trees in the city were from one to eight inches in diameter (Table 10).Forty two per cent of all street trees were beginning to reach maturity and were between 9 and 24inches in diameter. Seven per cent of street trees were in the larger size classes of 25 inches indiameter or greater. Of this 7%, about 2% will need to be carefully monitored for potential haz-ards since they were in fair or poor condition.
Business DistrictIn the Business District, 81% of the trees were one to eight inches in diameter. Of these smallertrees, 61% were in fair or poor condition, and 38% in good condition. There appears to be aproblem establishing young trees. If trees survived and increased in size, their condition wouldlikely improve.
Nineteen per cent of the trees in the Business District had grown beyond eight inches in diameter.These larger trees included silver maple, Norway maple, green ash, pin oak, and red maple. Withso few trees in the larger size classes, there needs to be more attention given to young trees.Improving site conditions such as larger planting beds, and providing protection from soil com-paction and mechanical injury are needed. Young trees also require regular care during their firstyears. With minimal training, residents and businesses could provide this type of care for trees inclose proximity.
Center City/West Side AreasIn the Center City/West Side Areas, 54% of the trees were one to eight inches in diameter, and30% were 9 to 16 inches in diameter. Of the smallest trees, 49% were in fair or poor condition, andof the trees 9 to 16 inches in diameter, 80% were in fair to poor condition. More than half the treesin the larger size classes were also in fair to poor condition.
The youngest trees in the Center City/West Side Areas are comparatively in the best conditionwith 48% in good condition and 1.5% in excellent condition. Approximately one-half of theyoung trees will survive for more than 10 years. The predicted rate of survival decreases for treesin the larger size classes with the average of only 29% of trees surviving for 10 or more years.

12
These large percentages of trees in fair or poor condition in the Center City/West Side Areassuggests the need to establish volunteer and city maintenance programs for trees in all class sizes.Improving site conditions, such as larger planting beds and protection from soil compaction andmechanical injury, is needed.
North EndThe North End had the greatest percentage of mature trees with about 59% greater than one toeight inches. Of these trees, many are native species. Trees which have self-seeded (and somethat have not) have desirable characteristics of nursery grown trees. Therefore, the North End hasa great need for mature tree care. Much of this type of care needs to be provided by trained andinsured tree care professionals who have the experience and equipment to deal with largebranches and tree removal.
Outer NeighborhoodsThe Outer Neighborhoods had the second greatest percentage of mature trees with 50% having adiameter of 9 inches or above. A professional maintenance program is needed for these maturetrees, while property owners or volunteers can be trained to care for the smaller trees.
Table 10: Tree Size Class by Zone and Diameter
Zones 1-8 inches 9-16 inches 17-24 inches 25-32 inches 32+ inches Totals
Business District 150 17 9 8 1 185Center City &West Side 194 109 37 13 10 363North End 303 244 165 28 5 744OuterNeighborhoods 850 438 250 97 50 1685Totals 1497 808 461 146 66 2977
% Totals 49.9% 27.1% 15.4% 4.9% 2.2% 100%
Species Composition
Species Composition — City-WideThroughout the city, the street tree population was represented by 61 species. Red maple, a nativespecies, was found in the greatest number totaling 13% of the total species observed. The secondhighest, at 12%, was Norway maple, an exotic species which is invasive to natural areas. Al-though 11% of the trees were in the spruce family, this percentage included several individualspecies, such as Colorado blue, Norway, and the native species - white and red spruce (Table 11).
Although there was good diversity of trees in the city, urban forestry professionals recommend a5 – 10% ceiling of any single tree species. Red maple and Norway maple have exceeded this limit.Spruce doesn’t exceed the recommendations since the 11% total represents more than one species.Another recommendation designed to promote a healthy, diverse urban forest is that no familymake up more than about 30% of the total population. Of the 2977 trees sampled, 33% of all thestreet trees were in the maple family. The maple family is the only family to exceed the 30%ceiling. Other families fall far below the 30% limit (Table 12).

13
Table 11: Individual Tree Species that Represent the Largest Populations Throughout the City
red maple 13%Norway maple 12%spruce (sp.) 11%red/black oak 7%fruit (sp.) 5%white pine 5%arborvitae 5%sugar maple 4%silver maple 4%Note: All other species observed were in numbers of less than 4%.
Fifty-four percent of the total trees observed were in the three genus, maple, spruce, and oak andrepresented approximately 12 species out of the 61 total.
Table 12: Genus of Species in the Greatest Numbers.
Maple Genusred 13%Norway 12%sugar 4%silver 4%Total 33% Maple Genus
Spruce Genus
The inventory did not distinguish between individual species of spruce. Individual species thatwere observed but not noted separately include Colorado blue, Norway, white, and red.
Total 11% Spruce Genus
Oak Genusred/black 7%white 2%pin 1%Total 10% Oak Genus
Species Composition within ZonesSpecies composition was found to be different within each zone. For example, although redmaple had the greatest number of trees throughout the city, it was not the dominant species ineach zone. In fact, red maple was only found to make up 3% of the street tree population in theBusiness District, while in the Outer Neighborhoods it was the most dominant species at 15%. Bylooking at the species composition in each zone, specific recommendations can be given for futureplantings on a zone by zone basis.

14
� Species Composition – Business DistrictThe data in Table 13 shows which species have reached or are near the 10% limit in the BusinessDistrict. Norway maple, the most dominant tree, is an exotic species with invasive tendencies innatural areas.
Table 13: Dominant Species in the Business District
Species % in zone % in good to excellent conditionNorway maple 17 45.7little leaf linden 10 45.0honey locust 09 27.8pin oak 08 76.5
Table 14 lists recommended species that could be used in future plantings in the Business District.These recommendations for the Business District are based on the species condition data inconjunction with species composition. The recommended trees are not the only species that should beplanted in the Business District but have shown the best results in the area and have not reached the 10%limit.
Table 14: Recommended Trees to be Planted in the Business District
red maplegreen ash*Consult publication for others
*For an extensive list of species that could adapt well to stressful conditions present in the Busi-ness District, consult the publication: Selecting Trees for Urban Landscape Ecosystems by Mary K.Reynolds and Raymond M. Boivin. Contact the NH Division of Forests and Lands, P.O. Box 1856,Concord, NH 03301.
Table 15 lists trees that should not be planted in the Business District due to over-planting, or poorcondition of existing trees of this species. This doesn’t include all species that would do poorly,but only those observed in sufficient quantities to measure.
Table 15: Species Not Recommended for Further Planting in the Business District
Deciduous Species EvergreensNorway maples white pinehoney locust hemlocklittle leaf lindenwhite birch

15
� Species Composition – Center City/West Side AreasTable 16 shows which species have reached or are near the 10% limit in the Center City/West SideAreas. Norway maple is the most dominant tree. Table 18 lists trees that shouldn’t be planted inthe Center City or West Side Areas due to over planting, or the poor condition of existing trees ofthis species. This doesn’t include all species that would do poorly, but only those observed insufficient quantities to measure.
Table 16: Dominant Species in the Center City/West Side Areas
Species % in zone % in good to excellent conditionNorway maple 16 44spruce sp. 14 62sugar maple 10 51red maple 09 49arborvitae 07 54
Table 17 shows recommended species that could be used in future plantings in the Center City/West Side Areas. These recommendations are based on the species condition data in conjunctionwith species composition. The recommended trees are not the only species that should beplanted, but have shown the best results in the Center City/West Side Areas and have not reachedthe 10% saturation limit.
Table 17: Recommended Trees to be Planted in the Center City/West Side Areas
Deciduous Species Evergreenspin oak Austrian pinelittle leaf Lindengreen ashhoney locust
Table 18: Trees That Should not be Planted in the Center City/West Side Areas
Deciduous Species EvergreensNorway maple hemlocksugar maple white pinesilver maplewhite birchgray birchboxelderailanthuswhite ashcherry
16
� Species Composition — North EndThe species composition in the North End is different from the Business District and Center City/West Side Areas. Native species such as red and black oak, white pine and red maple dominatethe area. Many of these trees weren’t planted but were part of the existing landscape. The fourthmost abundant species, however, was Norway maple, an exotic species that can be invasive.Since it has reached 10% saturation in this zone and because of its invasive tendency, this is theone tree species not recommended for further planting.
Based on the inventory figures in conjunction with overall species composition most tree speciesthat are hardy for northern New England should do well in Manchester’s North End, (assumingthe trees have adequate growing conditions).
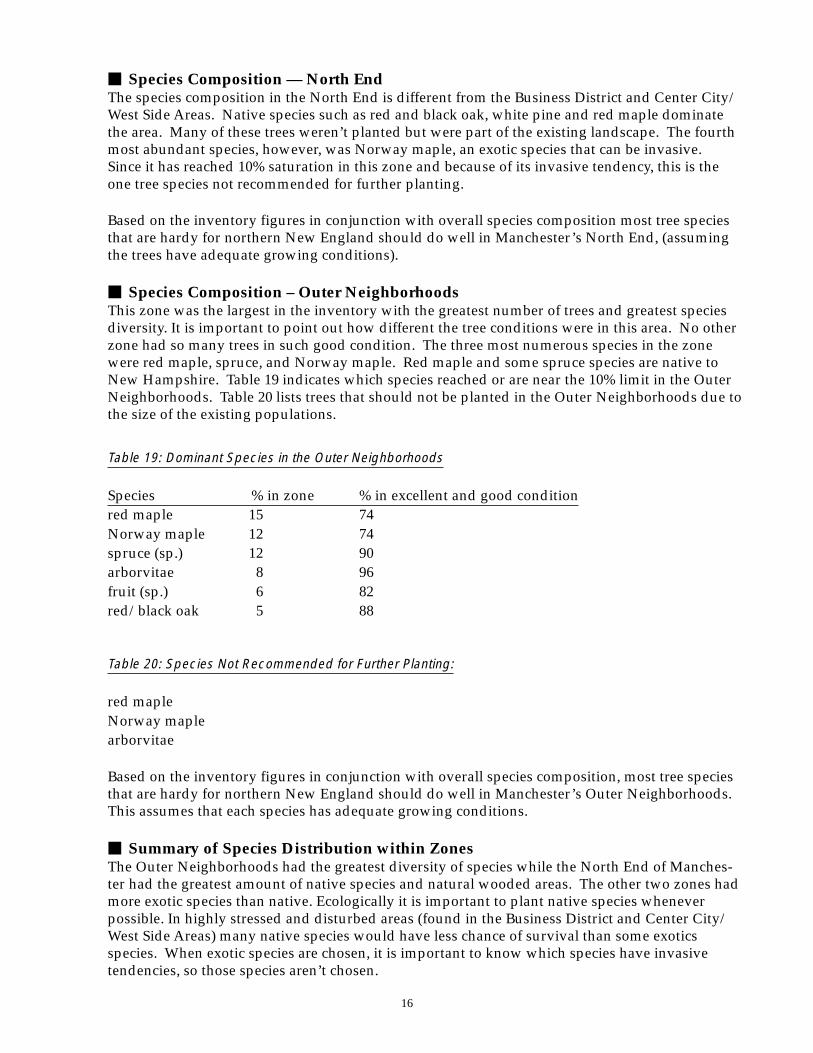
� Species Composition – Outer NeighborhoodsThis zone was the largest in the inventory with the greatest number of trees and greatest speciesdiversity. It is important to point out how different the tree conditions were in this area. No otherzone had so many trees in such good condition. The three most numerous species in the zonewere red maple, spruce, and Norway maple. Red maple and some spruce species are native toNew Hampshire. Table 19 indicates which species reached or are near the 10% limit in the OuterNeighborhoods. Table 20 lists trees that should not be planted in the Outer Neighborhoods due tothe size of the existing populations.
Table 19: Dominant Species in the Outer Neighborhoods
Species % in zone % in excellent and good conditionred maple 15 74Norway maple 12 74spruce (sp.) 12 90arborvitae 8 96fruit (sp.) 6 82red/black oak 5 88
Table 20: Species Not Recommended for Further Planting:
red mapleNorway maplearborvitae
Based on the inventory figures in conjunction with overall species composition, most tree speciesthat are hardy for northern New England should do well in Manchester’s Outer Neighborhoods.This assumes that each species has adequate growing conditions.
� Summary of Species Distribution within ZonesThe Outer Neighborhoods had the greatest diversity of species while the North End of Manches-ter had the greatest amount of native species and natural wooded areas. The other two zones hadmore exotic species than native. Ecologically it is important to plant native species wheneverpossible. In highly stressed and disturbed areas (found in the Business District and Center City/West Side Areas) many native species would have less chance of survival than some exoticsspecies. When exotic species are chosen, it is important to know which species have invasivetendencies, so those species aren’t chosen.

17
Due to overplanting and the invasive nature of Norway maple, this species is not recommendedfor planting in any area of Manchester. White birch, a native species, is struggling in three zonesout of four. It is a species sensitive to urban stresses including poor air quality. Proper site selec-tion and extra care should be given for any future planting of this species. Willow species wereonly found in measurable numbers in the Outer Neighborhoods. It was the only species in thiszone that had the majority of trees in fair condition. Willow grows naturally in wet areas. It hasbrittle wood and breakage occurs frequently. It is not recommended to plant in streetscapes.
Of the 61 species found in the city, many have not been discussed in this report due to their smallnumbers. Many of these species would be suitable for future plantings and would increase thediversity of the urban forest. The appendices lists all species found by zone and their condition.For future plantings, consult these species lists and compare with recommendations set forth inSelecting Trees for Urban Landscape Ecosystems: Hardy Species for Northern New England Communities,by Mary K. Reynolds and Raymond M. Boivin. This publication lists both native and exoticspecies suitable for planting in Manchester.
The condition of many species varied within the zone. Many species such as white pine andhemlock were found to do well in the North End and Outer Neighborhoods while they were inpoorer condition within the Business District, and Center City/West Side Areas. Through obser-vation of the overall growing conditions within each zone, there are significant differences. Treesin the Business District and Center City/West Side Areas have less space, and tend to be undermore stress. Trees in the Outer Neighborhoods and the North End typically have more space andas a result are in better condition. These environmental and site condition factors absolutely needto be considered when choosing species for future plantings in all areas of the city.
Maintenance NeedsThere is a great need to concentrate on the care and maintenance of trees within all city zones.Twenty nine per cent, or an estimated 13,600 trees, require early intervention to avoid futureremoval costs and pedestrian hazards. Without immediate intervention, the amount of treeremoval alone will cost the public and private sectors many thousands of dollars. To managesuch great numbers it is necessary to review the amount of maintenance required in each zoneand prioritize them as vast differences were found between zones.
In all, an estimated 2,500 trees throughout the city (5.5% of the public or privately owned streettrees) were in poor condition and need monitored carefully for hazards. They will probably needto be removed within the next five years. Fortunately, of these trees only, less than one per cent(or an estimated 27 trees) have a diameter greater than 25 inches. When large trees need to beremoved, the cost is greater.
Center City/West Side AreasAccording to the percentages of poorer quality trees per zone, top priority should be given totrees in the Center City/West Side Areas where 52% of the trees were in fair or poor condition.Trees in this zone tend to receive the least amount of attention. The two-person city tree crew hastime to deal only with city-wide tree emergencies.
Business DistrictTrees in the Business District were in need of care and maintenance since 55% were in fair or poorcondition. Fortunately, trees in the Business District are coming to the attention of the businesscommunity through the efforts of Intown Manchester Incorporated and the For Manchester

18
organization. At this time there still is no management plan developed for tree care and mainte-nance. It is recommended that the business community work with the Manchester Tree Commit-tee and Manchester Parks and Recreation to develop a plan.
North EndIn the North End, 27% of the trees observed were in fair condition and need immediate care inorder to survive the next ten years. This is an estimate of 3,167 trees under public and privateownership.
Outer NeighborhoodsIn the Outer Neighborhoods, 15.7% of all trees observed were in fair condition. (This estimates4170 trees under public and private ownership.) Immediate care is needed to avoid excessiveremoval and replanting costs.
Planting Sites Throughout the CityAn estimated 2,300 public and private trees in poor condition will need to be removed within thenext five years. The removal of these trees needs to be arranged through a management plan.Planting 250 trees each year for the next ten years can replace the anticipated losses. The surveyincluded a count of vacant planting sites. Table 21 describes planting sites and Table 22 indicatesthe distribution and condition of vacant planting sites within each city zone.
Table 21: Planting Site Description
Condition DescriptionExcellent: For vacant planting spaces no overhead wires or sidewalks.
Good: For vacant planting spaces sidewalk present, but no overheadwires.
Fair: For vacant planting spaces both wires and sidewalks present.Poor: For vacant planting spaces, requires cement cutter, otherwise in
good condition (no overhead wires).
Table 22: Planting Spaces Within 20 ′ of Streets
ZonesExc.-GoodSites
Spaces/Block
Blocks/Zone
Spaces/Zone
Fair-PoorSites
Spaces/Block
Blocks/Zone
Spaces/Zone
TotalSpaces
North End 93 7.75 223 1728.25 5 .4 223 89.2OuterNeighborhoods
524 1.8 631 9969.8 53 1.6 631 1009.6
Business District 23 4.6 92 423.2 24 4.8 92 441.6West Side Areas &Center City 127 9.0 290 2610 32 2.2 290 638Totals 14,731.25 + 2178.4 16,909.65

19
Planting RecommendationsThe total number of excellent to good planting sites is estimated at 14,731. With the exception of theBusiness District, each zone has several good to excellent planting sites available. Therefore it isunnecessary at this time to consider planting trees in poorer quality sites. In the Business Districtthere are more fair to poor sites than good to excellent sites. Therefore the following options must beconsidered for future planting in the Business District:
• Improve planting sites when possible.
• Plant small trees instead of large trees where space is limited. (While smaller trees provideless shade, many have attractive flowers and fruits and provide food for urban wildlife.)
• Plant fewer trees, and consider other aesthetic features where possible such as flower plantersor benches.
• Require future planting spaces meet minimal standards.
The Business District lacks adequate planting space and is limited in comparison with the otherzones in the city. To insure a healthy urban forest, it is vital to plant the right tree in the rightspace. Large trees planted under wires or in small pits will increase maintenance costs when treesdie early due to their environment.
Manchester’s Green Streets Program currently plants only medium to large shade trees. Smallertrees need to be planted where there are overhead wires or low soil volume. Small trees providebenefits such as wildlife habitat and aesthetic qualities and it is recommended that they be in-cluded in the Green Streets Program.
Over several years the Manchester Green Streets Program has enabled residents and businesses toplant trees. This program should continue and reviewed to increase its effectiveness. Suggestionsinclude:
• Focus the program in areas of the city with fewer trees.
• Develop a component that would allow low-income residents to plant trees.
• Earmark funding for maintenance, perhaps by establishing a maintenance fund in initial costs.
• Develop a plan for maintenance.
• Have an official contract that includes tree care with owners.
• Provide educational information on care, maintenance, and the importance of healthy trees.
1989 Tree Survey ComparisonThe NH Division of Forests and Lands completed a brief street tree survey of Manchester in 1989.Although these two surveys used different data collection methods, comparing the results showsa decline in both the numbers and quality condition of Manchester’s street trees. The 1989 surveyestimated 64,000 street trees. The 1998 survey shows a decrease in the number of trees by 10,000.Conditions of street trees have also deteriorated. Approximately 86% of the street trees were inhealthy condition in 1989, while 1998 shows only 71% in healthy condition. Coincidentally thiscoincides with the decrease in Manchester’s tree maintenance budget. Due to city budget con-straints in the 80’s and 90’s, a tree maintenance crew of two was only able to manage emergencysituations and was not able do any preventative maintenance.

20
Notes

21
Appendices

22
BU
SIN
ES
S D
ISTR
ICT :
NU
MB
ER
S O
F TR
EE
S B
Y S
PE
CIE
S A
ND C
ON
DIT
ION
Sp
ecie
s#
Tre
es%
Sp
ecie
s in
are
a#
Exc
elle
nt
% E
xcel
len
t#G
oo
d%
Go
od
#Fai
r%
Fai
r#P
oo
r
%P
oo
rN
orw
ay m
aple
3518
.9%
00.
0%16
45.7
%17
48.6
%2
5.7%
Spr
uce
sp.
2211
.9%
00.
0%7
31.8
%10
45.5
%5
22.7
%Li
ttle
leaf
lind
en20
10.8
%0
0.0%
945
.0%
945
.0%
210
.0%
Hon
ey lo
cust
189.
7%0
0.0%
633
.3%
1161
.1%
211
.1%
Pin
oak
179.
2%0
0.0%
1376
.5%
423
.5%
00/
17G
reen
ash
94.
9%0
0.0%
555
.6%
444
.4%
00.
0%W
hite
pin
e9
4.9%
00.
0%1
11.1
%8
88.9
%0
0.0%
Silv
er m
aple
84.
3%0
0.0%
450
.0%
225
.0%
225
.0%
Fru
it sp
.7
3.8%
00.
0%1
14.3
%5
71.4
%1
14.3
%R
ed m
aple
63.
2%1
16.7
%5
83.3
%0
0.0%
00.
0%Ju
nipe
r5
2.7%
00.
0%5
100.
0%0
0.0%
00.
0%W
hite
birc
h5
2.7%
00.
0%0
0.0%
510
0.0%
00.
0%S
ugar
map
le4
2.2%
00.
0%3
75.0
%1
25.0
%0
0.0%
Whi
te a
sh3
1.6%
00.
0%0
0.0%
310
0.0%
00.
0%O
rnam
ent.
Map
le2
1.1%
00.
0%2
100.
0%0
0.0%
00.
0%B
oxel
der
21.
1%0
0.0%
150
.0%
150
.0%
00.
0%S
iber
ian
elm
21.
1%0
0.0%
00.
0%2
100.
0%0
0.0%
Dog
woo
d2
1.1%
00.
0%2
100.
0%0
0.0%
00.
0%H
emlo
ck1
0.5%
00.
0%0
0.0%
110
0.0%
00.
0%A
ilant
hus
10.
5%0
0.0%
00.
0%1
100.
0%0
0.0%
Che
rry
sp.
10.
3%0
0.0%
110
0.0%
00.
0%0
0.0%
Aus
tria
n pi
ne1
0.5%
00.
0%0
0.0%
110
0.0%
00.
0%W
hite
pop
lar
10.
5%0
0.0%
00.
0%1
100.
0%0
0.0%
Bee
ch1
0.5%
00.
0%1
100.
0%0
0.0%
00.
0%T
ulip
tree
10.
5%0
0.0%
110
0.0%
00.
0%0
0.0%
Hor
se c
hest
nut
10.
5%0
0.0%
00.
0%1
100.
0%0
0.0%
To
tals
185
183
8714
%10
0%0.
5%44
.9%
47.0
%7.
6%

23
CE
NTE
R C
ITY A
ND W
ES
T S
IDE A
RE
AS:
NU
MB
ER
S O
F T R
EE
S B
Y S
PE
CIE
S A
ND C
ON
DIT
ION
Sp
ecie
s #
Tre
es%
Sp
ecie
s in
are
a#E
xcel
len
t%
Exc
elle
nt
#Go
od
%G
oo
d#F
air
%F
air
#Po
or
%P
oo
rN
orw
ay m
aple
5916
.3%
11.
7%24
40.7
%26
44.1
%8
13.6
%S
pruc
e (s
p.)
5013
.8%
24.
0%29
58.0
%17
34.0
%2
4.0%
Sug
ar m
aple
3710
.2%
12.
7%18
48.6
%14
37.8
%4
10.8
%R
ed m
aple
339.
1%4
12.1
%12
36.4
%12
36.4
%5
15.2
%A
rbor
vita
e26
7.2%
00.
0%14
53.8
%10
38.5
%2
7.7%
Box
elde
r21
5.8%
00.
0%2
9.5%
1571
.4%
419
.0%
Fru
it (s
p.)
195.
2%0
0.0%
1157
.9%
736
.8%
15.
3%Li
ttle
leaf
lind
en17
4.7%
00.
0%9
52.9
%6
35.3
%2
11.8
%S
ilver
map
le14
3.9%
17.
1%4
28.6
%6
42.9
%3
21.4
%P
in o
ak8
2.2%
00.
0%7
87.5
%1
12.5
%0
0.0%
Am
eric
an e
lm7
1.9%
00.
0%4
57.1
%0
0.0%
342
.9%
Aila
nthu
s7
1.9%
00.
0%0
0.0%
685
.7%
114
.3%
Che
rry
(sp.
)7
1.9%
00.
0%3
42.9
%2
28.6
%2
28.6
%G
rey
birc
h7
1.9%
228
.6%
00.
0%2
28.6
%3
42.9
%G
reen
ash
61.
7%0
0.0%
583
.3%
116
.7%
00.
0%W
hite
ash
51.
4%0
0.0%
240
.0%
360
.0%
00.
0%H
oney
locu
st8
2.2%
00.
0%7
87.5
%1
12.5
%0
0.0%
Hyd
rang
a5
1.4%
00.
0%1
20.0
%3
60.0
%1
20.0
%B
assw
ood
30.
8%0
0.0%
133
.3%
133
.3%
133
.3%
Hem
lock
30.
8%0
0.0%
133
.3%
133
.3%
133
.3%
Aus
tria
n pi
ne3
0.8%
00.
0%2
66.7
%1
33.3
%0
0.0%
Whi
te b
irch
30.
8%0
0.0%
00.
0%2
66.7
%1
33.3
%C
atal
pa2
0.6%
00.
0%1
50.0
%1
50.0
%0
0.0%
Whi
te p
ine
20.
6%0
0.0%
150
.0%
150
.0%
00.
0%S
iber
ian
elm
20.
6%0
0.0%
00.
0%2
100.
0%0
0.0%
Fir
(sp.
)2
0.6%
00.
0%0
0.0%
210
0.0%
00.
0%O
rnam
ent.
Map
le1
0.3%
00.
0%1
100.
0%0
0.0%
00.
0%H
orse
che
stnu
t1
0.3%
00.
0%1
100.
0%0
0.0%
00.
0%M
t. as
h1
0.3%
00.
0%0
0.0%
110
0.0%
00.
0%B
lack
oak
10.
3%0
0.0%
110
0.0%
00.
0%0
0.0%
Red
ced
ar1
0.3%
00.
0%0
0.0%
00.
0%1
100.
0%E
urop
ean
birc
h1
0.3%
00.
0%0
0.0%
110
0.0%
00.
0%C
otto
nwoo
d1
0.3%
00.
0%0
0.0%
110
0.0%
00.
0%
To
tals
363
1116
114
645
%10
0%3.
0%44
.4%
40.2
%12
.4%

24
Sp
ecie
s#T
rees
%S
pec
ies
in a
rea
#Exc
elle
nt
%E
xelle
nt
#Go
od
%G
oo
d#F
air
%F
air
#Po
or
%P
oo
rR
ed/B
lack
oak
119
16.0
%12
10%
6353
%33
28%
119%
Whi
te p
ine
103
13.9
%19
18%
5452
%30
29%
00%
Red
map
le99
13.3
%14
14%
4242
%31
31%
1212
%N
orw
ay m
aple
7410
.0%
1926
%33
45%
1622
%6
8%S
pruc
e (s
p.)
516.
9%15
29%
1122
%24
47%
12%
Red
pin
e32
4.3%
1547
%12
38%
39%
26%
Silv
er m
aple
304.
0%1
3%16
53%
1343
%0
0%W
hite
oak
304.
0%4
13%
1550
%8
27%
310
%S
ugar
map
le30
4.0%
517
%16
53%
620
%3
10%
Whi
te b
irch
293.
9%2
7%7
24%
2069
%0
0%F
ruit
(sp.
)27
3.6%
726
%15
56%
519
%0
0%W
hite
ash
263.
5%3
12%
1454
%6
23%
312
%H
emlo
ck19
2.6%
526
%13
68%
15%
00%
Gra
y bi
rch
121.
6%2
17%
650
%3
25%
18%
Arb
orvi
tae
101.
3%0
0%10
100%
00%
00%
Bla
ck lo
cust
60.
8%0
0%5
83%
117
%0
0%C
hine
se e
lm5
0.7%
00%
480
%1
20%
00%
Whi
te p
opla
r4
0.5%
00%
00%
250
%2
50%
Dog
woo
d4
0.5%
00%
375
%1
25%
00%
Box
elde
r3
0.4%
00%
00%
133
%2
67%
Am
eric
an e
lm3
0.4%
00%
267
%1
33%
00%
Che
rry
(sp.
)3
0.4%
133
%1
33%
00%
133
%Ja
pane
se m
aple
20.
3%2
100%
00%
00%
00%
Mt.
ash
20.
3%0
0%2
100%
00%
00%
Hic
kory
20.
3%0
0%2
100%
00%
00%
Tul
ip tr
ee2
0.3%
00%
210
0%0
0%0
0%Li
ttle
leaf
lind
en2
0.3%
150
%1
50%
00%
00%
Red
ced
ar2
0.3%
150
%1
50%
00%
00%
Tre
mbl
ing
aspe
n2
0.3%
150
%1
50%
00%
00%
Am
er. H
ornb
eam
20.
3%0
0%1
50%
150
%0
0%R
iver
birc
h1
0.1%
00%
110
0%0
0%0
0%La
rge
toot
h po
p.1
0.1%
110
0%0
0%0
0%0
0%H
oney
locu
st1
0.1%
110
0%0
0%0
0%0
0%B
lack
wal
nut
10.
1%0
0%1
100%
00%
00%
Whi
te fi
r1
0.1%
00%
110
0%0
0%0
0%P
urpl
e le
af p
lum
b1
0.1%
00%
110
0%0
0%0
0%R
ed m
ulbe
rry
10.
1%0
0%1
100%
00%
00%
Cat
alpa
10.
1%1
100%
00%
00%
00%
Eur
opea
n bi
rch
10.
1%0
0%0
0%0
0%1
100%
To
tals
744
132
357
207
4810
0%17
.7%
48.0
%27
.8%
6.3%
NO
RTH
EN
D:
NU
MB
ER
S O
F TR
EE
S B
Y S
PE
CIE
S A
ND C
ON
DIT
ION

25
OU
TER N
EIG
HB
OR
HO
OD
S:
NU
MB
ER
S O
F TR
EE
S B
Y S
PE
CIE
S A
ND C
ON
DIT
ION
CO
NTI
NU
ED...
Sp
ecie
s #
Tre
es%
Sp
ecie
s in
Are
a#E
xcel
len
t%
Exc
elle
nt
#Go
od
%
Go
od
#F
air
%F
air
#Po
or
%P
oo
rR
ed m
aple
255
15.1
%42
16.5
%14
757
.6%
5822
.7%
83.
1%S
pruc
e (s
p.)
209
12.4
%10
148
.3%
8842
.1%
209.
6%0
0.0%
Nor
way
map
le20
412
.1%
7134
.8%
8139
.7%
3316
.2%
199.
3%A
rbor
vita
e13
37.
9%54
40.6
%74
55.6
%4
3.0%
10.
8%F
ruit
(sp.
)10
16.
0%32
31.7
%51
50.5
%18
17.8
%0
0.0%
Red
oak
895.
3%28
31.5
%50
56.2
%9
10.1
%2
2.2%
Silv
er m
aple
583.
4%11
19.0
%28
48.3
%16
27.6
%3
5.2%
Bla
ck lo
cust
452.
7%27
60.0
%17
37.8
%1
2.2%
00.
0%S
ugar
map
le43
2.5%
818
.6%
2455
.8%
818
.6%
37.
0%C
herr
y (s
p.)
432.
5%3
7.0%
3581
.4%
37.
0%2
4.7%
Whi
te p
ine
432.
5%11
25.6
%28
65.1
%3
7.0%
12.
3%W
hite
oak
382.
2%16
42.1
%19
50.0
%2
5.3%
12.
6%D
ogw
ood
332.
0%9
27.3
%20
60.6
%4
12.1
%0
0.0%
Whi
te b
irch
321.
9%14
43.8
%12
37.5
%4
12.5
%2
6.3%
Fir
(sp.
)32
1.9%
412
.5%
2578
.1%
39.
4%0
0.0%
Sco
tch
pine
261.
5%1
3.8%
2284
.6%
13.
8%2
7.7%
Am
eric
an e
lm28
1.7%
414
.3%
2175
.0%
27.
1%1
3.6%
Whi
te a
sh28
1.7%
517
.9%
1657
.1%
621
.4%
13.
6%F
low
erin
g cr
ab23
1.4%
14.
3%11
47.8
%11
47.8
%0
0.0%
Hem
lock
211.
2%6
28.6
%7
33.3
%6
28.6
%2
9.5%
Red
ced
ar18
1.1%
1055
.6%
633
.3%
15.
6%1
5.6%
Box
elde
r18
1.1%
15.
6%8
44.4
%8
44.4
%1
5.6%
Aila
nthi
s18
1.1%
211
.1%
1266
.7%
15.
6%3
16.7
%G
rey
birc
h17
1.0%
635
.3%
847
.1%
317
.6%
00.
0%R
ed p
ine
160.
9%6
37.5
%4
25.0
%4
25.0
%2
12.5
%T
rem
blin
g as
pen
150.
9%13
86.7
%1
6.7%
16.
7%0
0.0%
Will
ow (
sp.)
130.
8%0
0.0%
215
.4%
1184
.6%
00.
0%C
atal
pa12
0.7%
18.
3%8
66.7
%3
25.0
%0
0.0%
Littl
e le
af li
nden
110.
7%3
27.3
%6
54.5
%2
18.2
%0
0.0%
Bla
ck b
irch
60.
4%0
0.0%
466
.7%
00.
0%2
33.3
%P
in o
ak6
0.4%
116
.7%
466
.7%
116
.7%
00.
0%H
op h
ornb
eam
40.
2%0
0.0%
410
0.0%
00.
0%0
0.0%
Red
bud
40.
2%2
50.0
%0
0.0%
250
.0%
00.
0%M
agno
lia4
0.2%
375
.0%
00.
0%1
25.0
%0
0.0%
Juni
per
30.
2%1
33.3
%0
0.0%
133
.3%
133
.3%

26
OU
TER N
EIG
HB
OR
HO
OD
S:
NU
MB
ER
S O
F T R
EE
S B
Y S
PE
CIE
S A
ND C
ON
DIT
ION
C
ON
TIN
UED
Sp
ecie
s #
Tre
es%
Sp
ecie
s in
Are
a#E
xcel
len
t%
Exc
elle
nt
#Go
od
%
Go
od
#F
air
%F
air
#Po
or
%P
oo
rH
oney
locu
st3
0.2%
00.
0%1
33.3
%2
66.7
%0
0.0%
Hyd
rang
a3
0.2%
00.
0%2
66.7
%0
0.0%
133
.3%
Gre
en a
sh2
0.1%
00.
0%0
0.0%
210
0.0%
00.
0%H
icko
ry2
0.1%
00.
0%2
100.
0%0
0.0%
00.
0%La
rge
toot
h po
p.2
0.1%
00.
0%0
0.0%
210
0.0%
00.
0%H
orse
che
stnu
t2
0.1%
150
.0%
150
.0%
00.
0%0
0.0%
Hyb
rid e
lm2
0.1%
00.
0%0
0.0%
210
0.0%
00.
0%H
awth
orne
20.
1%0
0.0%
210
0.0%
00.
0%0
0.0%
Am
er. h
ornb
eam
20.
1%0
0.0%
210
0.0%
00.
0%0
0.0%
Pur
ple
leaf
plu
m2
0.1%
210
0.0%
00.
0%0
0.0%
00.
0%S
carle
t oak
20.
1%0
0.0%
150
.0%
150
.0%
00.
0%B
assw
ood
10.
1%0
0.0%
00.
0%1
100.
0%0
0.0%
Syc
amor
e1
0.1%
110
0.0%
00.
0%0
0.0%
00.
0%M
t. as
h1
0.1%
00.
0%0
0.0%
110
0.0%
00.
0%E
urop
ean
larc
h1
0.1%
00.
0%0
0.0%
110
0.0%
00.
0%Ja
pane
se m
aple
10.
1%1
100.
0%0
0.0%
00.
0%0
0.0%
Aus
tria
n pi
ne1
0.1%
110
0.0%
00.
0%0
0.0%
00.
0%E
urop
ean
birc
h1
0.1%
110
0.0%
00.
0%0
0.0%
00.
0%T
ulip
tree
10.
1%0
0.0%
110
0.0%
00.
0%0
0.0%
Orn
amen
t. m
aple
10.
1%1
100.
0%0
0.0%
00.
0%0
0.0%
Yew
10.
1%0
0.0%
110
0.0%
00.
0%0
0.0%
Pig
nut
10.
1%0
0.0%
110
0.0%
00.
0%0
0.0%
Rus
sian
mul
berr
y1
0.1%
00.
0%1
100.
0%0
0.0%
00.
0%
To
tals
1685
505
858
263
59%
100%
30.0
%50
.9%
15.6
%3.
5%
27
BU
SIN
ES
S D
ISTR
ICT :
CO
ND
ITIO
N, S
PE
CIE
S, #
TR
EE
S, D
BH
Sp
ecie
s1-
8 in
ches
9-16
inch
es17
-24
inch
es25
-32
inch
es32
+ in
ches
# T
rees
% S
pec
ies
Exc
.G
ood
Fai
rP
oor
Exc
.G
ood
Fai
rP
oor
Exc
. G
ood
Fai
r P
oor
Exc
.G
ood
Fai
rP
oor
Exc
.G
ood
Fai
rP
oor
Nor
way
map
le0
715
20
22
00
70
00
00
00
00
035
17.2
%S
pruc
e (s
p.)
07
105
00
00
00
00
00
00
00
00
2210
.8%
Littl
e le
af li
nden
09
92
00
00
00
00
00
00
00
00
209.
9%H
oney
locu
st0
611
20
00
00
00
00
00
00
00
018
8.9%
Pin
oak
07
30
06
10
00
00
00
00
00
00
178.
4%G
reen
ash
04
30
01
10
00
00
00
00
00
00
94.
4%W
hite
pin
e0
08
00
10
00
00
00
00
00
00
09
4.4%
Silv
er m
aple
00
00
00
01
00
10
04
11
00
00
83.
9%F
ruit
(sp.
)0
15
10
00
00
00
00
00
00
00
07
3.4%
Red
map
le1
30
00
10
00
00
00
10
00
00
06
3.0%
Juni
per
05
00
00
00
00
00
00
00
00
00
52.
5%W
hite
birc
h0
05
00
00
00
00
00
00
00
00
05
2.5%
Sug
ar m
aple
03
10
00
00
00
00
00
00
00
00
42.
0%W
hite
ash
00
21
00
00
00
00
00
00
00
00
31.
5%O
rnam
.map
le0
20
00
00
00
00
00
00
00
00
02
1.0%
Box
elde
r0
11
00
00
00
00
00
00
00
00
02
1.0%
Sib
eria
n el
m0
02
00
00
00
00
00
00
00
00
02
1.0%
Dog
woo
d0
20
00
00
00
00
00
00
00
00
02
1.0%
Hem
lock
00
10
00
00
00
00
00
00
00
00
10.
5%A
ilant
hus
00
00
00
10
00
00
00
00
00
00
10.
5%C
herr
y (s
p.)
01
00
00
00
00
00
00
00
00
00
10.
5%A
ustr
ian
pine
00
10
00
00
00
00
00
00
00
00
10.
5%W
hite
pop
lar
00
10
00
00
00
00
00
00
00
00
10.
5%B
eech
00
00
00
00
00
00
00
10
00
00
10.
5%T
ulip
tree
00
00
00
00
00
00
00
00
01
00
10.
5%H
orse
che
stnu
t0
00
00
00
00
00
10
00
00
00
01
0.5%
Co
nd
itio
n C
lass T
ota
ls1
5878
130
116
10
71
10
52
10
10
018
510
0.0%
%0.
5%31
.4%
42.2
%7.
0%0.
0%5.
9%3.
2%0.
5%0.
0%3.
8%0.
5%0.
5%0.
0%2.
7%1.
1%0.
5%0.
0%0.
5%0.
0%0.
0%D
iam
eter
Cla
ssT
ota
ls15
017
98
1%
81.1
%9.
2%4.
9%4.
3%0.
5%
28
CE
NTE
R C
ITY A
ND W
ES
T S
IDE A
RE
AS:
CO
ND
ITIO
N, S
PE
CIE
S, #
TR
EE
S, D
BH
Sp
ecie
s1-
8 in
ches
9-
16 in
ches
17-2
4 in
ches
25-3
2 in
ches
32+
inch
es#
Tre
es%
Sp
ecie
sE
xc.
Goo
dF
air
Poo
rE
xc.
Goo
dF
air
Poo
rE
xc.
Goo
dF
air
Poo
rE
xc.
Goo
dF
air
Poo
rE
xc.
Goo
dF
air
Poo
rN
orw
ay m
aple
012
153
110
71
02
32
00
11
00
10
5915
.8%
Spr
uce
(sp.
)1
156
11
910
00
51
10
00
00
00
050
13.9
%S
ugar
map
le0
1510
21
32
10
01
00
01
10
00
037
10.2
%R
ed m
aple
03
23
25
30
12
42
11
10
02
10
339.
1%A
rbor
vita
e0
104
10
46
10
00
00
00
00
00
026
7.2%
Box
elde
r0
07
24
21
10
02
00
01
10
00
021
5.8%
Fru
it (s
p.)
011
51
00
00
00
10
00
00
00
10
195.
3%Li
ttle
leaf
lind
en0
74
20
22
00
00
00
00
00
00
017
4.7%
Silv
er m
aple
00
10
13
11
00
31
01
00
00
11
143.
9%P
in o
ak0
40
00
31
00
00
00
00
00
00
08
2.2%
Hon
eylo
cust
01
00
04
10
02
00
00
00
00
00
82.
2%A
mer
ican
elm
03
02
00
01
00
00
01
00
00
00
71.
9%A
ilant
hus
00
51
00
10
00
00
00
00
00
00
71.
9%C
herr
y (s
p.)
02
21
01
01
00
00
00
00
00
00
71.
9%G
rey
birc
h2
02
20
00
10
00
00
00
00
00
07
1.9%
Gre
en a
sh0
51
00
00
00
00
00
00
00
00
06
1.7%
Whi
te a
sh0
22
00
01
00
00
00
00
00
00
05
1.4%
Hyd
rang
a0
03
00
10
10
00
00
00
00
00
05
1.4%
Bas
swoo
d0
00
00
00
00
01
00
00
00
10
13
0.8%
Hem
lock
01
11
00
00
00
00
00
00
00
00
30.
8%A
ustr
ian
pine
01
00
01
10
00
00
00
00
00
00
30.
8%W
hite
birc
h0
00
00
01
10
00
00
00
00
01
03
0.8%
Cat
alpa
00
00
00
10
01
00
00
00
00
00
20.
6%W
hite
pin
e0
11
00
00
00
00
00
00
00
00
02
0.6%
Sib
eria
n el
m0
00
00
01
00
01
00
00
00
00
02
0.6%
Fir
(sp.
)0
01
00
00
00
00
00
01
00
00
02
0.6%
Orn
am. m
aple
01
00
00
00
00
00
00
00
00
00
10.
3%H
orse
che
stnu
t0
00
00
00
00
10
00
00
00
00
01
0.3%
Mou
ntai
n as
h0
01
00
00
00
00
00
00
00
00
01
0.3%
Bla
ck o
ak0
00
00
00
00
00
00
10
00
00
01
0.3%
Red
ced
ar0
00
00
00
10
00
00
00
00
00
01
0.3%
Eur
opea
n bi
rch
00
10
00
00
00
00
00
00
00
00
10.
3%C
otto
nwoo
d0
01
00
00
00
00
00
00
00
00
01
0.3%
Co
nd
itio
n C
lass
To
tals
393
7422
1048
3911
112
176
14
53
03
53
363
100.
0%%
0.8%
25.6
%20
.4%
6.1%
2.8%
13.2
%10
.7%
3.0%
0.3%
3.3%
4.7%
1.7%
0.3%
1.1%
1.4%
0.8%
0.0%
0.8%
1.4%
0.8%
Dia
met
er C
lass
To
tals
194
109
3713
10%
53.4
%30
.0%
10.2
%3.
6%2.
8%

29
NO
RTH
EN
D:
CO
ND
ITIO
N, S
PE
CIE
S, #
TR
EE
S, D
BH
Sp
ecie
s1-
8 in
ches
9-16
inch
es17
-24
inch
es25
-32
inch
es32
+ in
ches
#Tre
es%
Sp
ecie
sE
xc.
Goo
dF
air
Poo
rE
xc.
Goo
dF
air
Poo
rE
xc.
Goo
dF
air
Poo
rE
xc.
Goo
dF
air
Poo
rE
xc.
Goo
dF
air
Poo
rR
ed/B
lack
oak
37
124
529
145
321
71
16
111
916
.0%
Whi
te p
ine
111
1011
212
728
111
103
13.8
%R
ed m
aple
1016
157
415
84
48
26
`99
13.3
%N
orw
ay m
aple
1415
42
1012
42
72
11
749.
9%S
pruc
e sp
.10
819
23
51
351
6.8%
Red
pin
e1
11
66
18
52
132
4.3%
Silv
er m
aple
210
111
32
130
4.0%
Whi
te o
ak1
76
36
12
11
11
304.
0%S
ugar
map
le3
42
62
11
41
11
21
130
4.0%
Whi
te b
irch
419
12
11
129
3.9%
Fru
it (s
p.)
511
32
42
273.
6%W
hite
ash
27
53
14
13
263.
5%H
emlo
ck3
112
21
192.
6%G
ray
birc
h3
22
11
11
112
1.6%
Arb
orvi
tae
73
101.
3%B
lack
locu
st5
16
0.8%
Chi
nese
elm
11
12
50.
7%W
hite
pop
lar
22
40.
5%D
ogw
ood
31
40.
5%B
oxel
der
21
30.
4%A
mer
ican
elm
21
30.
4%C
herr
y (s
p.)
11
13
0.4%
Japa
n. m
aple
22
0.3%
Mt.
ash
11
20.
3%H
icko
ry1
12
0.3%
Tul
ip tr
ee1
12
0.3%
Lit.
leaf
lind
en1
12
0.3%
Red
ced
ar1
12
0.3%
Tre
mbl
. asp
en
11
20.
3%A
m. h
ornb
eam
11
20.
3%R
iver
birc
h1
10.
1%La
r. to
oth
pop.
11
0.1%
Hon
ey lo
cust
11
0.1%
Bla
ck w
alnu
t1
10.
1%W
hite
fir
11
0.1%
Pur
.-le
af p
lum
11
0.1%
Red
mul
berr
y1
10.
1%C
atal
pa1
10.
1%E
urop
e. b
irch
11
0.1%
Co
nd
itio
n C
lass T
ota
ls56
123
100
2339
128
6118
3092
356
518
32
22
10
744
100.
0%%
7.5%
16.5
%13
.4%
3.1%
5.2%
17.2
%8.
2%2.
4%4.
0%12
.4%
4.7%
0.8%
0.7%
2.4%
0.4%
0.3%
0.3%
0.3%
0.1%
0.0%
Dia
met
er C
lass
To
tals
303
244
165
285
%40
.7%
32.8
%22
.2%
3.8%
0.7%

30
CO
NTI
NU
ED...
OU
TER N
EIG
HB
OR
HO
OD
S:
CO
ND
ITIO
N, S
PE
CIE
S, #
TR
EE
S, D
BH
Sp
ecie
s1-
8 in
ches
9-16
inch
es17
-24
inch
es25
-32
inch
es32
+ in
ches
#tre
es/r
o%
Sp
ecie
sE
xc.
Goo
dF
air
Poo
rE
xc.
Goo
dF
air
Poo
rE
xc.
Goo
dF
air
Poo
rE
xc.
Goo
dF
air
Poo
rE
xc.
Goo
dF
air
Poo
rR
ed m
aple
2248
68
4316
27
3525
53
136
22
75
255
14.9
%S
pruc
e (s
p.)
5130
729
4211
2013
23
120
912
.2%
Nor
way
map
le36
256
530
3114
54
1910
61
33
23
120
411
.9%
Arb
orvi
tae
4572
21
52
22
11
133
7.8%
Fru
it (s
p.)
2833
252
84
110
15.
9%R
ed o
ak17
306
37
22
42
43
26
189
5.2%
Silv
er m
aple
12
13
415
51
36
62
26
158
3.4%
Bla
ck lo
cust
177
19
101
452.
6%S
ugar
map
le2
12
13
64
12
101
16
21
432.
5%C
herr
y (s
p.)
322
21
111
11
143
2.5%
Whi
te p
ine
214
11
61
53
11
11
24
432.
5%W
hite
oak
27
27
21
81
21
41
382.
2%D
ogw
ood
820
31
133
1.9%
Whi
te b
irch
138
31
12
11
232
1.9%
Fir
(sp.
)4
233
232
1.9%
Am
eric
an e
lm3
125
13
11
228
1.6%
Whi
te a
sh4
83
11
11
62
128
1.6%
Sco
tch
pine
141
81
11
261.
5%F
low
erin
g cr
ab10
91
12
231.
3%H
emlo
ck5
23
13
12
31
211.
2%R
ed c
edar
64
11
22
218
1.1%
Box
elde
r6
21
31
11
11
118
1.1%
Aila
nthi
s1
43
14
11
318
1.1%
Gre
y bi
rch
53
15
21
171.
0%R
ed p
ine
44
41
316
0.9%
Tre
mbl
ing
aspe
n12
11
115
0.9%
Will
ow (
sp.)
51
31
12
130.
8%C
atal
pa1
32
21
11
112
0.7%
Littl
e le
af li
nden
32
32
111
0.6%
Bla
ck b
irch
42
60.
4%P
in o
ak4
11
60.
4%H
op h
ornb
eam
12
14
0.2%
Red
bud
22
40.
2%M
agno
lia2
11
40.
2%Ju
nipe
r1
11
30.
2%H
oney
locu
st1
23
0.2%
Hyd
rang
a2
13
0.2%
Hic
kory
22
0.1%
Gre
en a
sh2
20.
1%

31
OU
TER N
EIG
HB
OR
HO
OD
S:
CO
ND
ITIO
N, S
PE
CIE
S, #
TR
EE
S, D
BH
C
ON
TIN
UED
Sp
ecie
s1-
8 in
ches
9-16
inch
es17
-24
inch
es25
-32
inch
es32
+ in
ches
#tre
es/r
o%
Sp
ecie
sE
xc.
Goo
dF
air
Poo
rE
xc.
Goo
dF
air
Poo
rE
xc.
Goo
dF
air
Poo
rE
xc.
Goo
dF
air
Poo
rE
xc.
Goo
dF
air
Poo
rLa
rge
toot
h po
p.1
12
0.1%
Hor
se c
hest
nut
11
20.
1%H
ybrid
elm
22
0.1%
Haw
thor
ne1
12
0.1%
Am
er. h
ornb
eam
11
20.
1%P
urpl
e le
af p
lum
22
0.1%
Sca
rlet o
ak1
12
0.1%
Bas
swoo
d1
10.
1%S
ycam
ore
11
0.1%
Mt.
ash
11
0.1%
Eur
opea
n la
rch
11
0.1%
Japa
nese
map
le1
10.
1%A
ustr
ian
pine
11
0.1%
Eur
opea
n bi
rch
11
0.1%
Tul
ip tr
ee1
10.
1%O
rnam
. map
le1
10.
1%Y
ew1
10.
1%P
ignu
t1
10.
1%R
ussi
an m
ulbe
r.1
10.
1%C
on
dti
on
cla
ss To
tals
301
427
104
1812
021
981
1849
128
5815
1944
268
1824
80
1685
100.
0%%
17.9
%25
.3%
6.2%
1.1%
7.1%
13.0
%4.
8%1.
1%2.
9%7.
6%3.
4%0.
9%1.
1%2.
6%1.
5%0.
5%1.
1%1.
4%0.
5%0.
0%10
0.0%
Dia
met
er C
lass T
ota
ls85
043
825
097
50 %
50.4
%26
.0%
14.8
%5.
8%3.
0%