Embed Size (px)
DESCRIPTION
Faculdade de Medicina da Universidade do Porto. Manchester Triage System. Analysing Waiting Times: Theory vs. Practice. Introdução à Medicina Ano lectivo 2009/2010. SUMMARY. INTRODUCTION Background and Justification RESEARCH QUESTION Objectives METHODS Study Sample and Variables - PowerPoint PPT Presentation
Citation preview
MANCHESTER TRIAGE SYSTEMAnalysing Waiting Times:Theory vs. Practice
Faculdade de Medicina da Universidade do Porto
Introdução à Medicina Ano lectivo 2009/2010
SUMMARY INTRODUCTION Background and Justification
RESEARCH QUESTION Objectives
METHODS Study Sample and Variables
RESULTSStatistics
DISCUSSION

INTRODUCTION BACKGROUND AND JUSTIFICATION
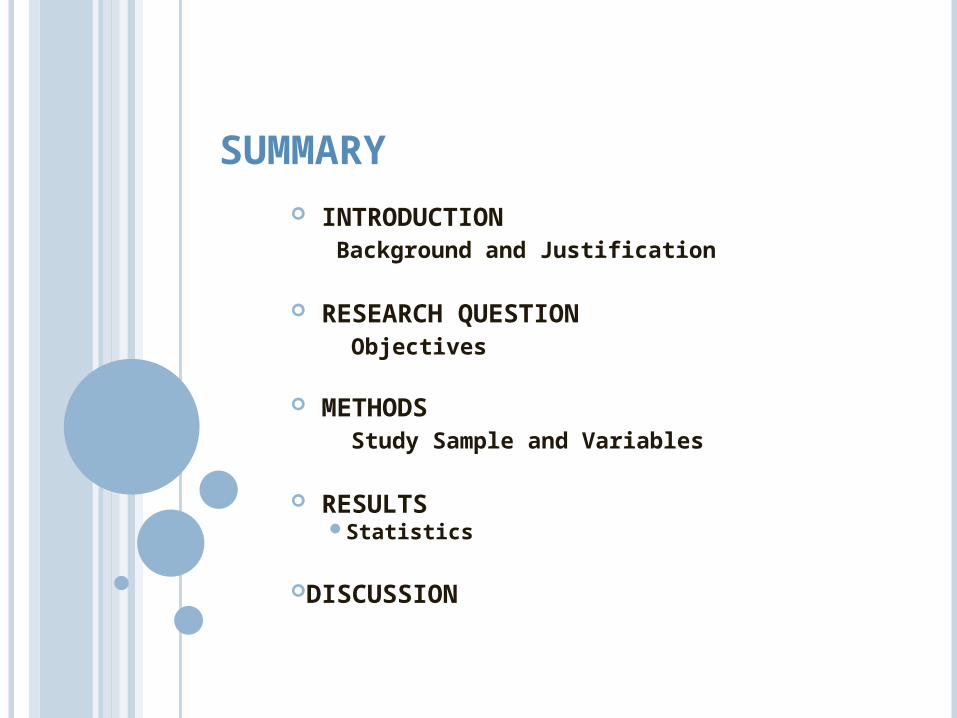
[1] Mackway-Jones K: Emergency Triage, Manchester Triage Group. London: BMJ Publishing Group; 1997.
Figure 1 – Time Growth of Triage System. [1]

TRIAGE SYSTEM THE MANCHESTER TRIAGE SYSTEM
The aim of the Manchester Triage System is to determine the clinical priority of patients based on their signs and symptoms
There are five urgency categories differentiated by colours, with a maximum waiting time[2] :
Immediate - Red - 0 minutes Very Urgent - Orange - 10 minutes Urgent - Yellow- 60 minutes Standard - Green - 120 minutes Non-urgent - Blue - 240 minutes
Manchester Triage System must be always adjusted, kept on permanent mutation and dynamism, by studying its sensitivity and specificity levels [3]
[2] Mackway-Jones K: Emergency Triage, Manchester Triage Group. London: BMJ Publishing Group; 1997.[3] Hardern RD: Critical appraisal of papers describing triage systems. Acad Emerg Med 1999, 6(11):1166-1171
MANCHESTER TRIAGE SYSTEM OTHER STUDIES
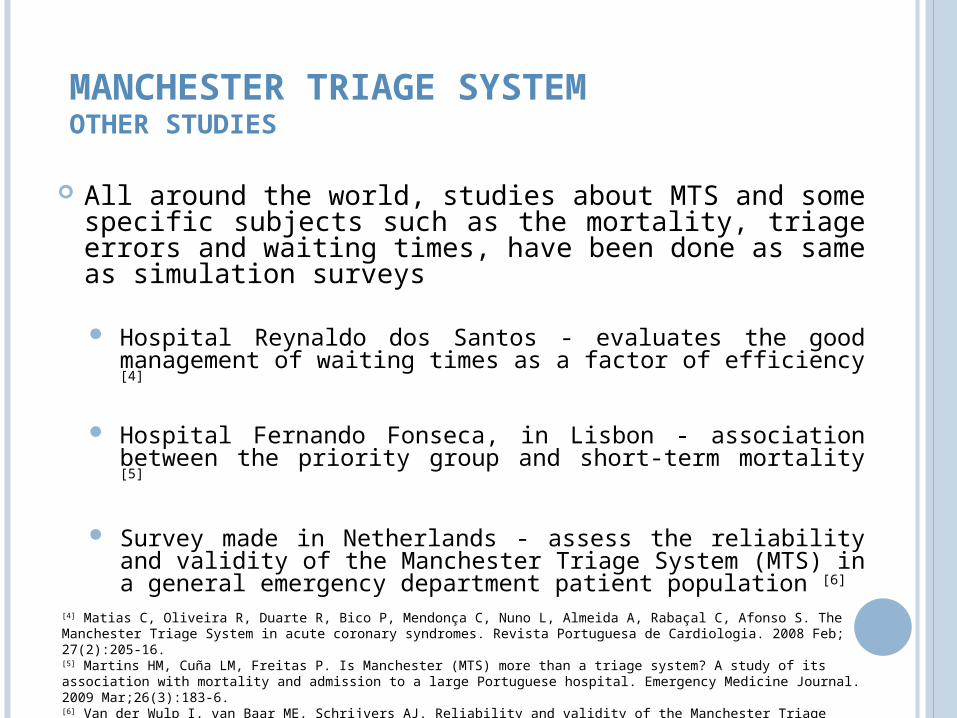
All around the world, studies about MTS and some specific subjects such as the mortality, triage errors and waiting times, have been done as same as simulation surveys
Hospital Reynaldo dos Santos - evaluates the good management of waiting times as a factor of efficiency [4]
Hospital Fernando Fonseca, in Lisbon - association between the priority group and short-term mortality [5]
Survey made in Netherlands - assess the reliability and validity of the Manchester Triage System (MTS) in a general emergency department patient population [6]
[4] Matias C, Oliveira R, Duarte R, Bico P, Mendonça C, Nuno L, Almeida A, Rabaçal C, Afonso S. The Manchester Triage System in acute coronary syndromes. Revista Portuguesa de Cardiologia. 2008 Feb; 27(2):205-16.[5] Martins HM, Cuña LM, Freitas P. Is Manchester (MTS) more than a triage system? A study of its association with mortality and admission to a large Portuguese hospital. Emergency Medicine Journal. 2009 Mar;26(3):183-6.[6] Van der Wulp I, van Baar ME, Schrijvers AJ. Reliability and validity of the Manchester Triage System in a general emergency department patient population in the Netherlands: results of a simulation study. Emergency Medicine Journal. 2008 Jul; 25(7):431-4.
RESEARCH QUESTION
In Manchester Triage, is the specific waiting time of each urgency
category being respected?
OBJECTIVES
The aim of this study is to evaluate the Manchester Triage system:
Analyse waiting times at an hospital’s emergency service where it is applied
Analyse the outcome of the patients who waited more time than what was expected
Confirm the correspondence between the colour assigned and the waiting time
OBJECTIVES
Clarify the differences between theory and practice on the maximum waiting time
Understand if the rate of death is superior in the patients who waited more time in the Urgency
See if there are any differences in the results along the time.
METHODS
Our analyze starts on pre-collected data
METHODSSTUDY DESIGN
Study is:
-Retrospective
-Observational
METHODSSTUDY PARTICIPANTS
Target population - all the patients who had entered in the emergency care that uses the Manchester Triage System
Inclusion Criteria:- Initially patients with more than 18 years old but now the age 16 was chosen as a criteria because in hospital’s terms people are considered adults since this age.- Had gone to emergency care between the 1st October 2005 to September 2008
No exclusion criteria
Sample – the target population
The whole data that might be considered on our study derives from the registry of characteristics of all urgency episodes, including many variables likely to be studied and deeply analyzed, that were already present on the SPSS database:
Date of Birth Sex Date and hour of triage Priority – recodified into the variable Colour Date and hour of the medical observation Date of discharge
METHODS VARIABLESALREADY EXISTENT VARIABLES
METHODS VARIABLESVARIABLES CREATED
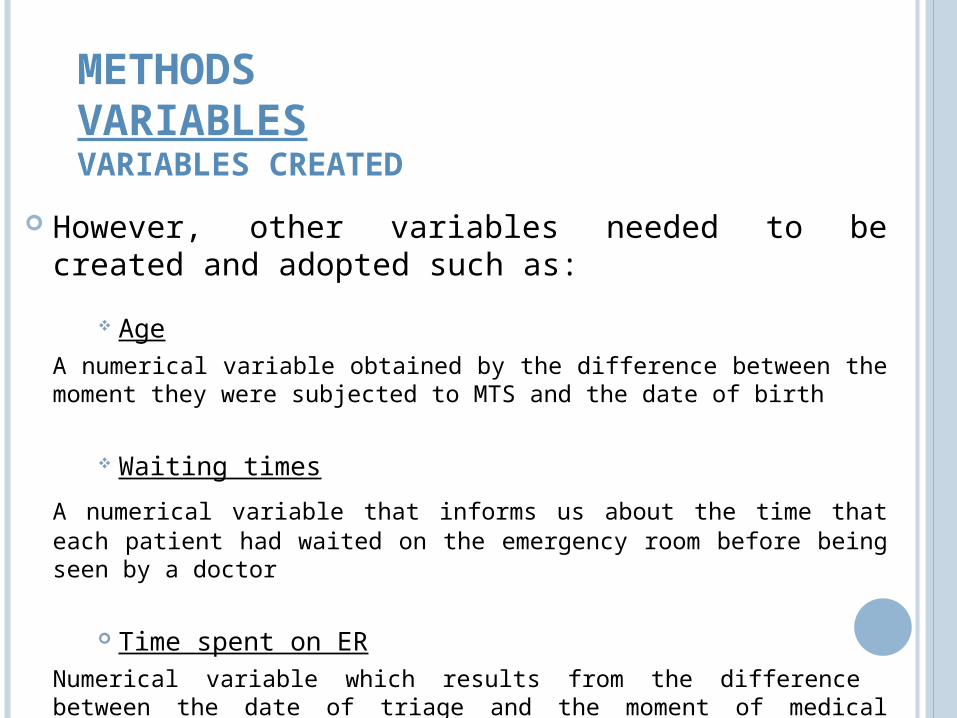
However, other variables needed to be created and adopted such as:
AgeA numerical variable obtained by the difference between the
moment they were subjected to MTS and the date of birth
Waiting times
A numerical variable that informs us about the time that each patient had waited on the emergency room before being seen by a doctor
Time spent on ERNumerical variable which results from the difference
between the date of triage and the moment of medical permission to return home

Exceeded TimeNominal categorical variable which results from the relation
between Waiting Times and the time assigned to each colour, due to the priority of patient, reporting if the time was respected or not
Registration of Medical Observation
Categorical and nominal variable that informs us if the doctor has registered the moment when he saw the patient
Death
Categorical and nominal variable which, from the result of the ER episode, notices if the patient ended up dead or alive
METHODS VARIABLESVARIABLES CREATED
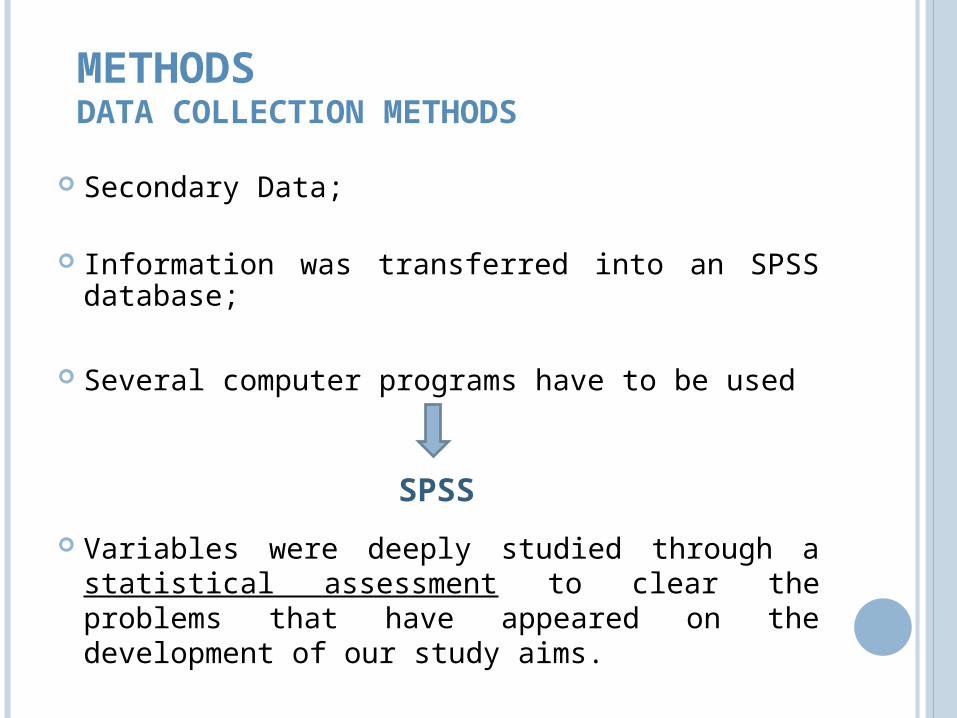
Secondary Data;
Information was transferred into an SPSS database;
Several computer programs have to be used
Variables were deeply studied through a statistical assessment to clear the problems that have appeared on the development of our study aims.
SPSS
METHODSDATA COLLECTION METHODS
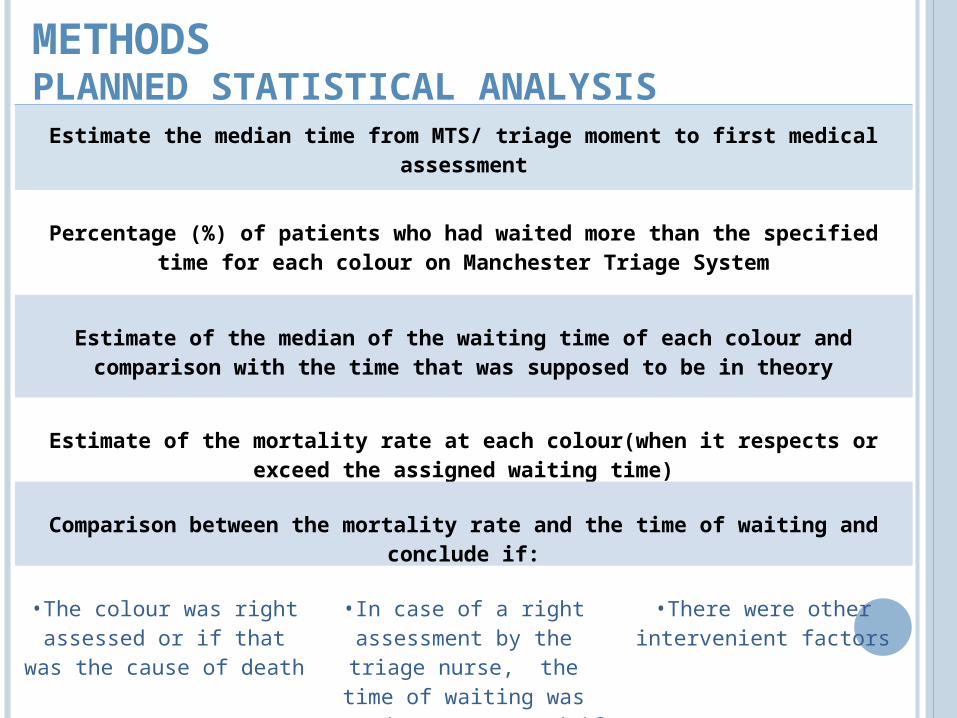
Estimate the median time from MTS/ triage moment to first medical assessment
Percentage (%) of patients who had waited more than the specified time for each colour on Manchester Triage System
Estimate of the median of the waiting time of each colour and comparison with the time that was supposed to be in theory
Estimate of the mortality rate at each colour(when it respects or exceed the assigned waiting time)
Comparison between the mortality rate and the time of waiting and conclude if:
•The colour was right assessed or if that was the cause of death
•In case of a right assessment by the triage nurse, the time of
waiting was not the correct and if that might have been the
death cause
•There were other intervenient factors
METHODSPLANNED STATISTICAL ANALYSIS
RESULTSSTATISTICS

Feminine 57,9%Masculine 42,1%
Cases without colour
STATISTICSGENERAL STATISTICS
Table 1 – Total of cases
Table 2 – Total of cases with a colour
STATISTICSGENERAL STATISTICS
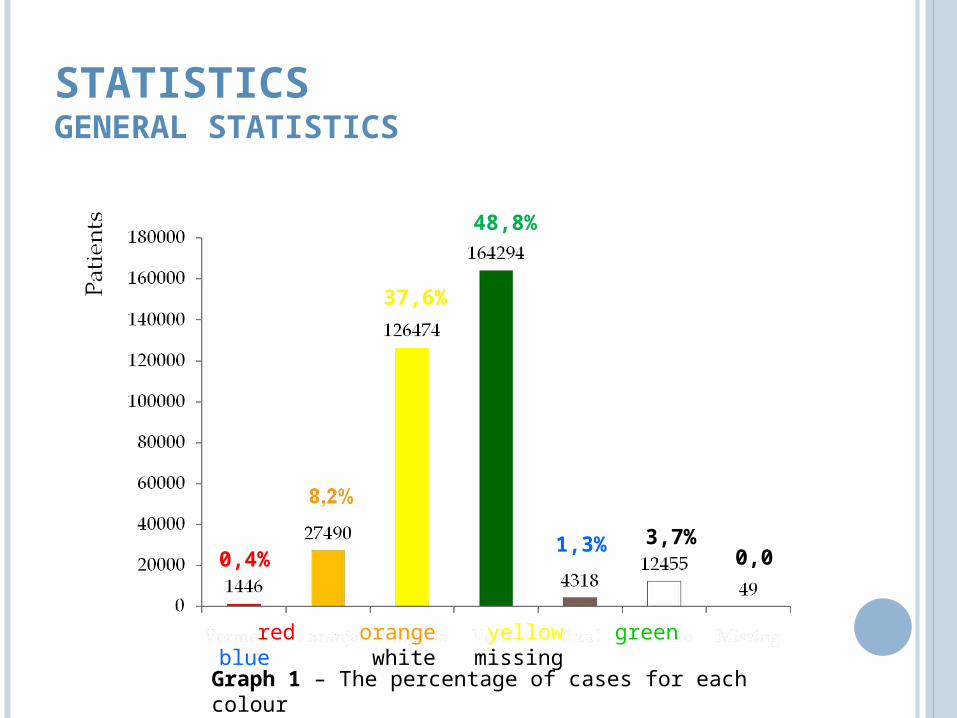
red orange yellow green blue white missing
0,4%
37,6%
48,8%
1,3% 3,7%0,0
Graph 1 – The percentage of cases for each colour
Analyse waiting times at an hospital’s emergency service where it is applied
STATISTICSRESPONSE TO THE OBJECTIVES
Clarify the differences between theory and practice on the maximum waiting time
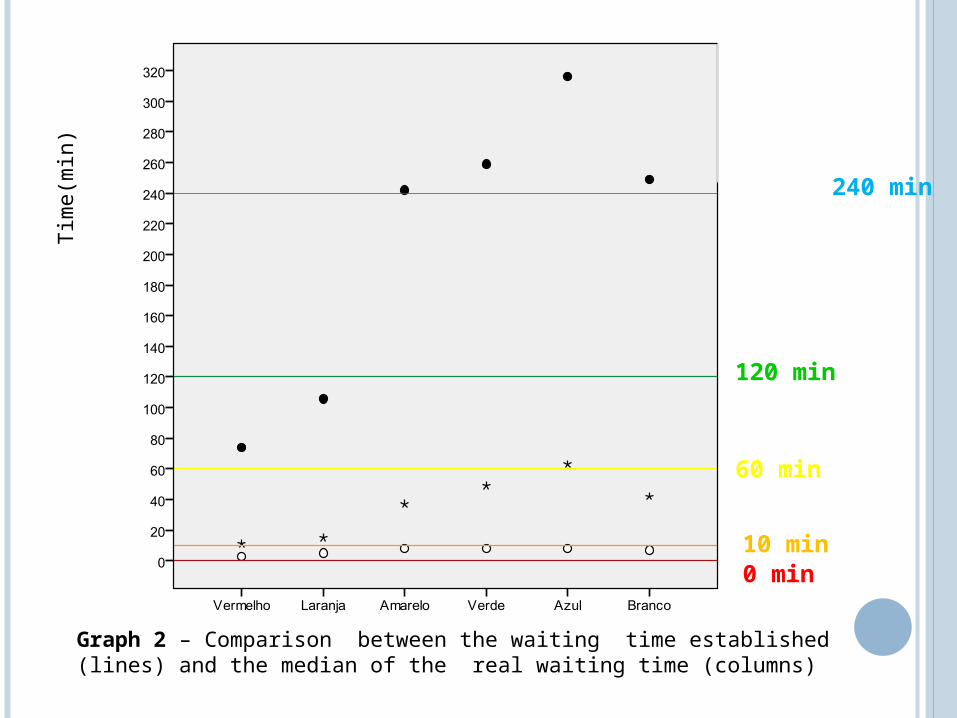
240 min
Tim
e(m
in)
120 min
60 min
10 min0 min
Graph 2 – Comparison between the waiting time established (lines) and the median of the real waiting time (columns)
STATISTICSRESPONSE TO THE OBJECTIVES
Confirm the correspondence between the colour assigned and the waiting time, if the mean time from MTS to first medical assessment determined in theory is being done sucessfully in practice
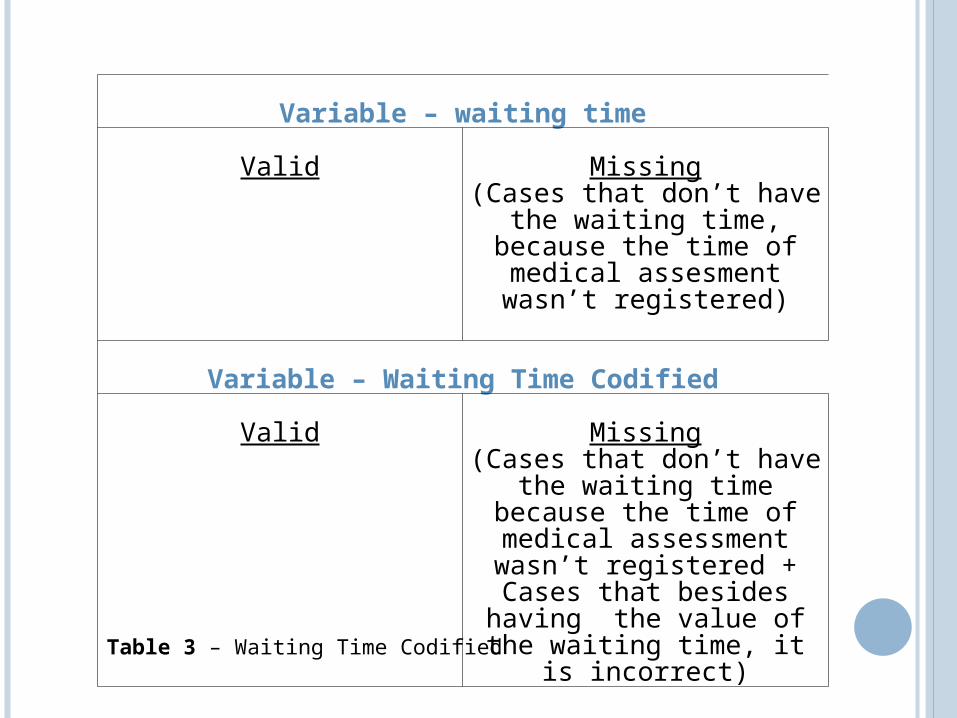
Variable – waiting time
Valid Missing(Cases that don’t have
the waiting time, because the time of medical assesment wasn’t
registered)
Variable – Waiting Time Codified
Valid Missing(Cases that don’t have
the waiting time because the time of medical assessment wasn’t
registered + Cases that besides having the value of the waiting time, it is
incorrect)Table 3 – Waiting Time Codified
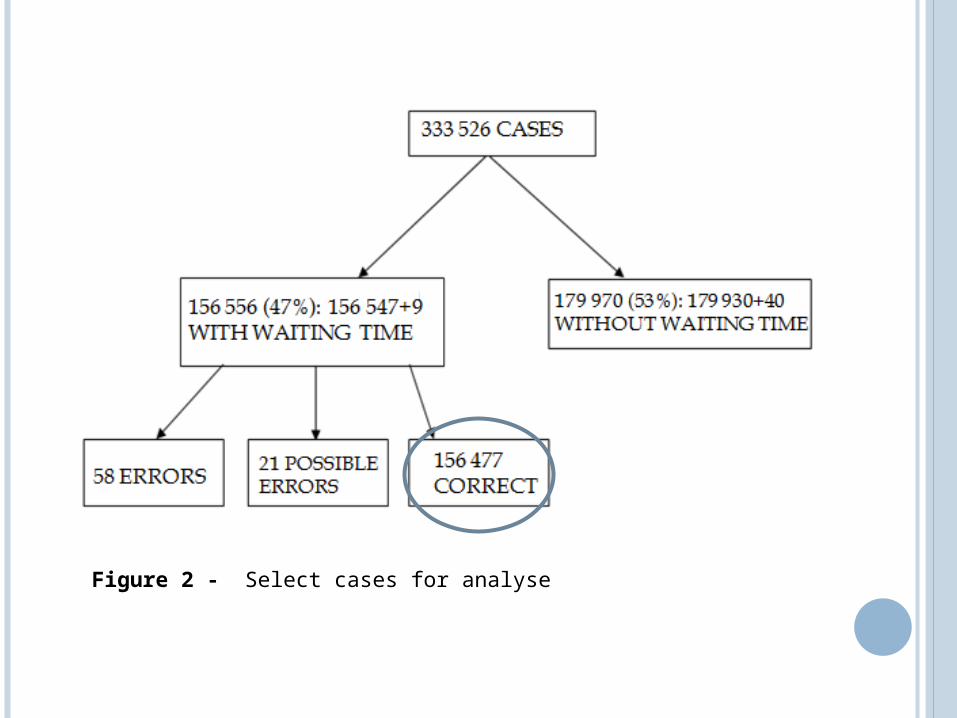
Figure 2 - Select cases for analyse

Colour Percentage
Red 25,2%
Orange 34,3%
Yellow 38,1%
Green 66,3%
Blue 80,3%
White 76,7%
Medical AssessmentWithout the time of the medical assessmentWith the time og the medical assessment
Table 4 – Percentage of cases without the time of the medical assessment
Graph3 – Percentage of cases without the time of the medical assessment
Red orange yellow green blue white
Percentage
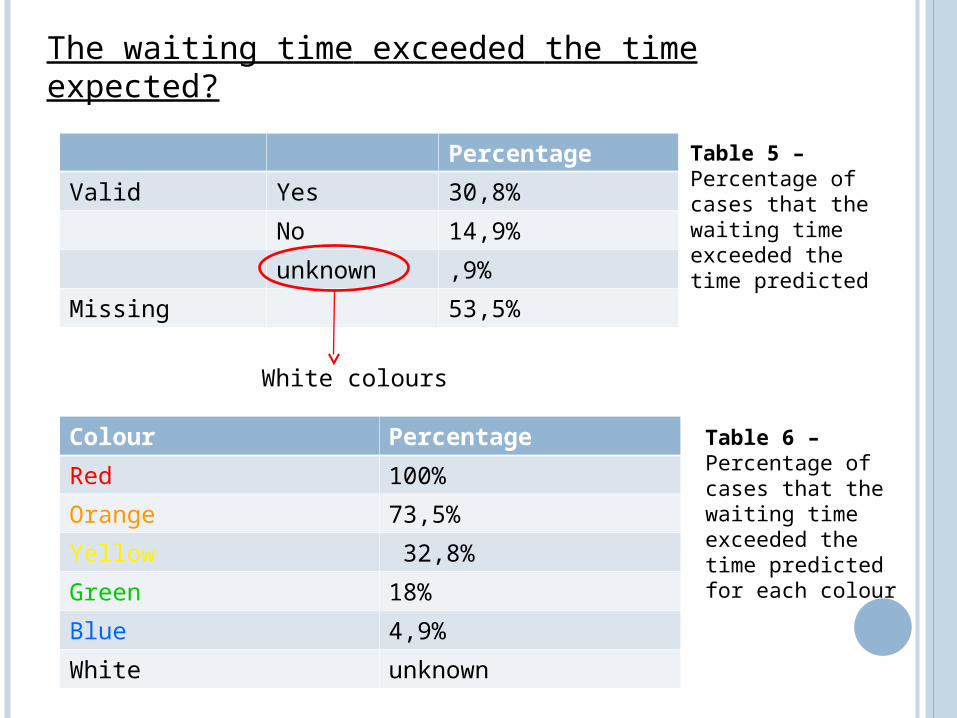
Valid Yes 30,8%
No 14,9%
unknown ,9%
Missing 53,5%
White colours
Colour Percentage
Red 100%
Orange 73,5%
Yellow 32,8%
Green 18%
Blue 4,9%
White unknown
The waiting time exceeded the time expected?
Table 5 – Percentage of cases that the waiting time exceeded the time predicted
Table 6 – Percentage of cases that the waiting time exceeded the time predicted for each colour
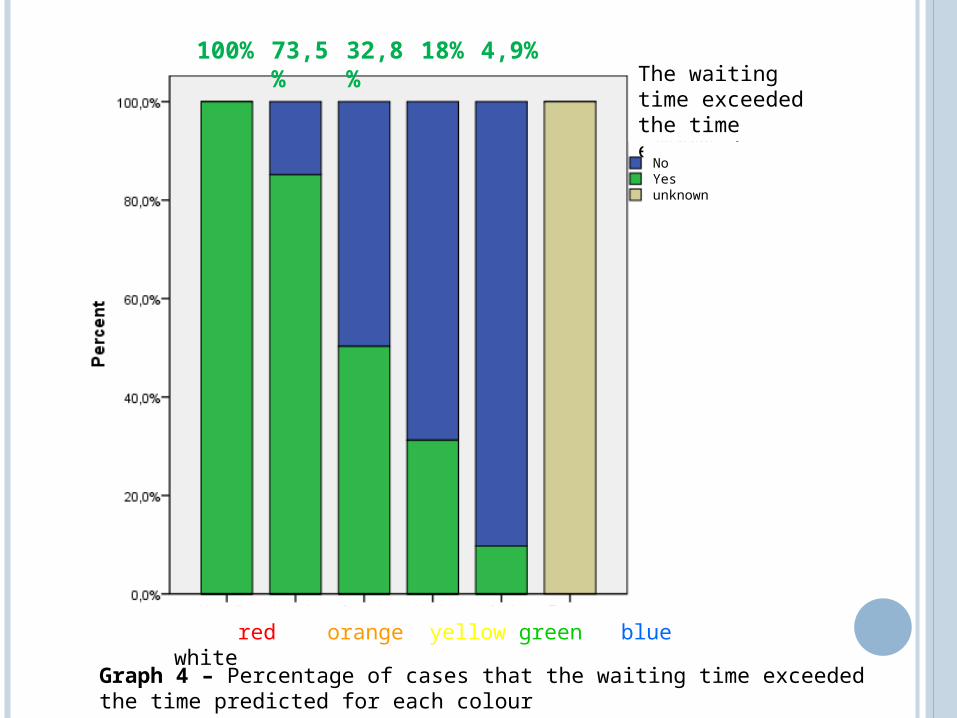
The waiting time exceeded the time expected?
NoYesunknown
100% 32,8% 18% 4,9% 73,5%
Graph 4 – Percentage of cases that the waiting time exceeded the time predicted for each colour
red orange yellow green blue white
STATISTICSRESPONSE TO THE OBJECTIVES
Analyse the outcome of the patients who waited more time than what was expected
Understand if the rate of death is superior in the patients who waited more time in the Urgency
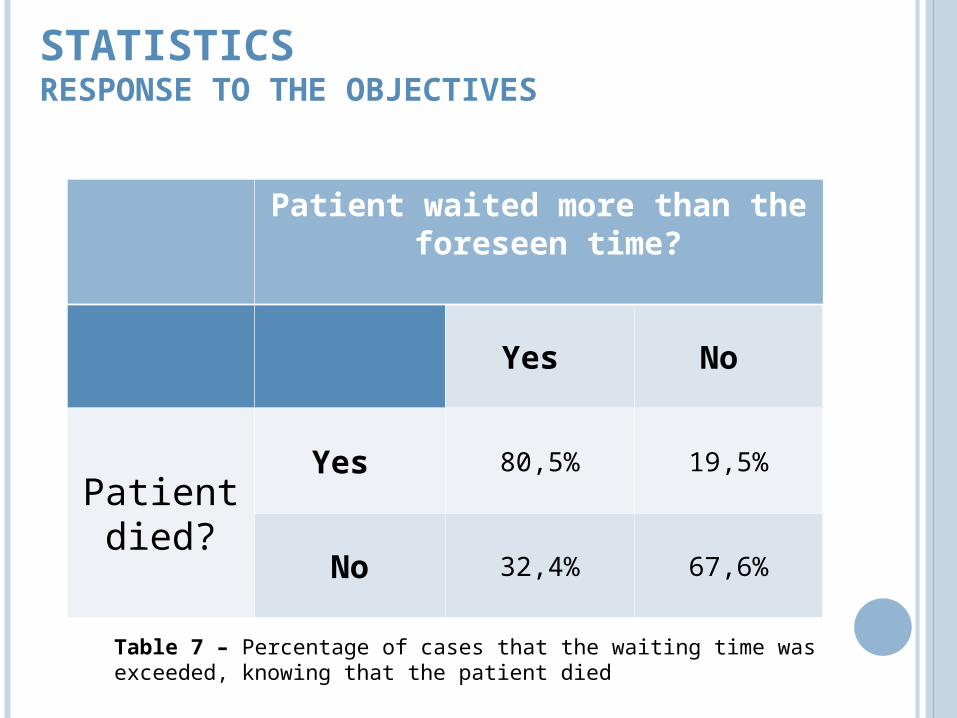
Patient waited more than the foreseen time?
Yes No
Patient died?
Yes 80,5% 19,5%
No 32,4% 67,6%
STATISTICSRESPONSE TO THE OBJECTIVES
Table 7 – Percentage of cases that the waiting time was exceeded, knowing that the patient died

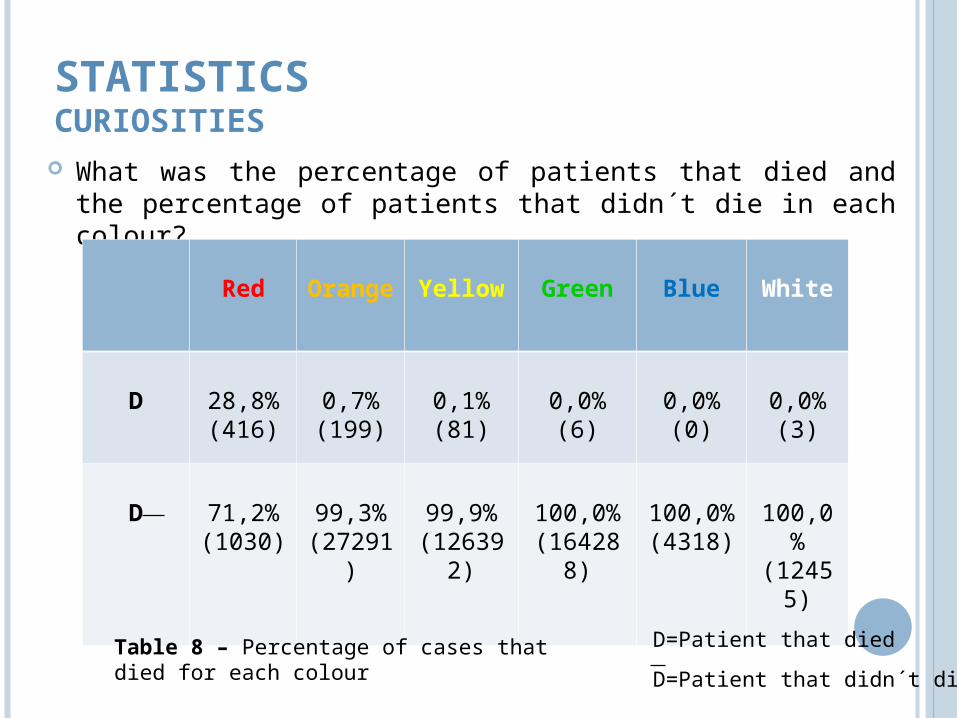
STATISTICSCURIOSITIES
What was the percentage of patients that died and the percentage of patients that didn´t die in each colour?
Red Orange
Yellow Green Blue White
D 28,8%(416)
0,7%(199)
0,1%(81)
0,0%(6)
0,0%(0)
0,0%(3)
D 71,2%(1030)
99,3%(27291
)
99,9%(12639
2)
100,0%(16428
8)
100,0%(4318)
100,0%
(12455)
D=Patient that died
D=Patient that didn´t die
Table 8 – Percentage of cases that died for each colour
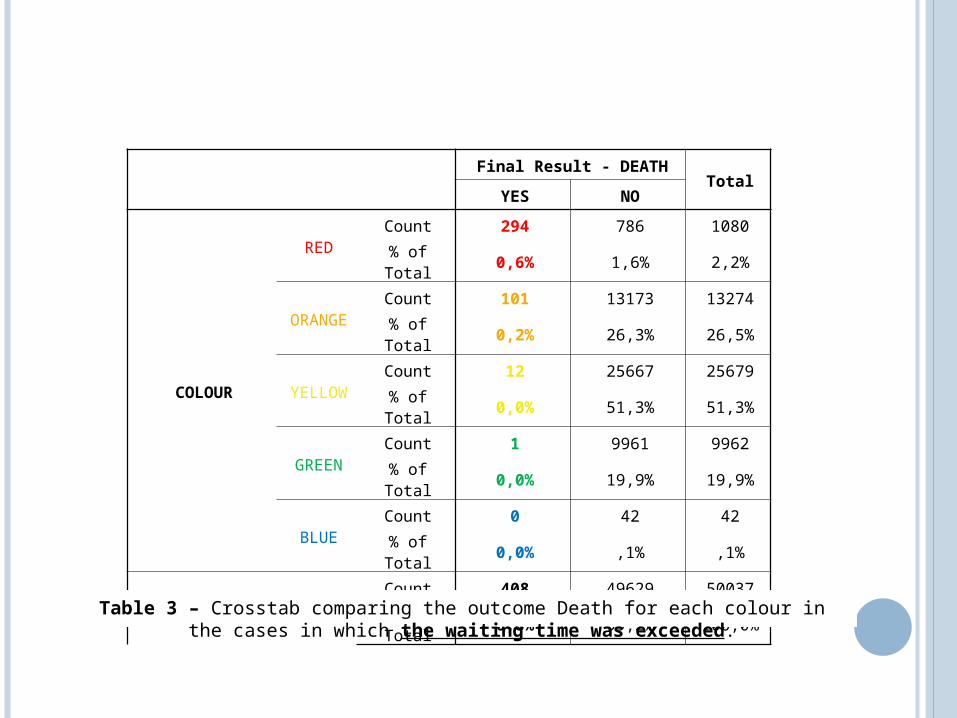
Final Result - DEATHTotal
YES NO
COLOUR
REDCount 294 786 1080
% of Total 0,6% 1,6% 2,2%
ORANGECount 101 13173 13274
% of Total 0,2% 26,3% 26,5%
YELLOWCount 12 25667 25679
% of Total 0,0% 51,3% 51,3%
GREENCount 1 9961 9962
% of Total 0,0% 19,9% 19,9%
BLUECount 0 42 42
% of Total 0,0% ,1% ,1%
TotalCount 408 49629 50037
% of Total 0,8% 99,2% 100,0%
Table 3 – Crosstab comparing the outcome Death for each colour in the cases in which the waiting time was exceeded.
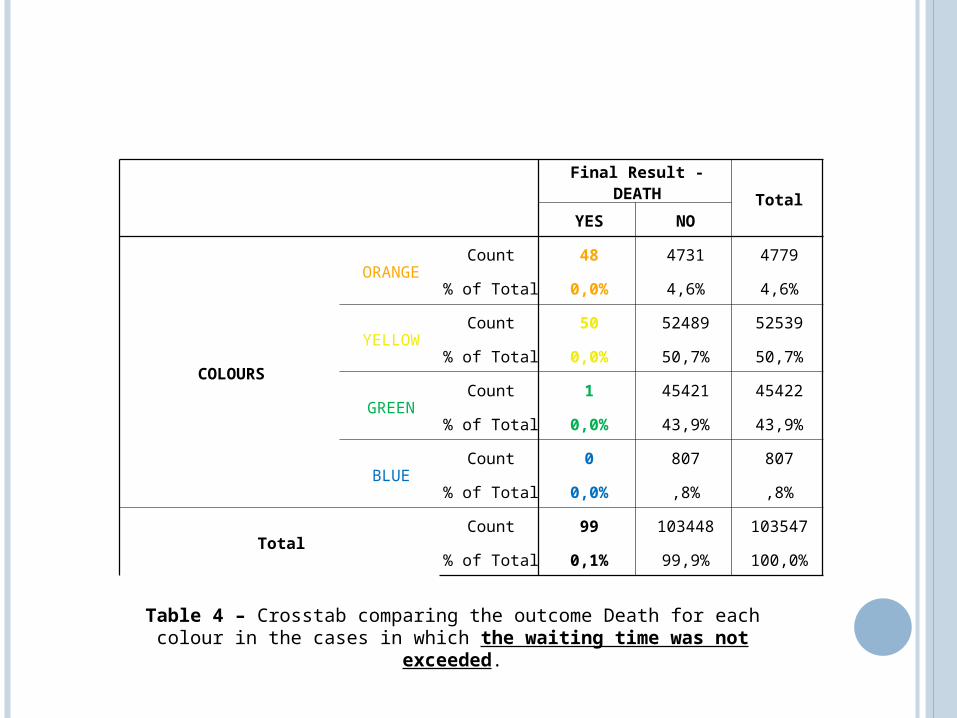
Final Result - DEATHTotal
YES NO
COLOURS
ORANGECount 48 4731 4779
% of Total 0,0% 4,6% 4,6%
YELLOWCount 50 52489 52539
% of Total 0,0% 50,7% 50,7%
GREENCount 1 45421 45422
% of Total 0,0% 43,9% 43,9%
BLUECount 0 807 807
% of Total 0,0% ,8% ,8%
TotalCount 99 103448 103547
% of Total 0,1% 99,9% 100,0%
Table 4 – Crosstab comparing the outcome Death for each colour in the cases in which the waiting time was not exceeded.
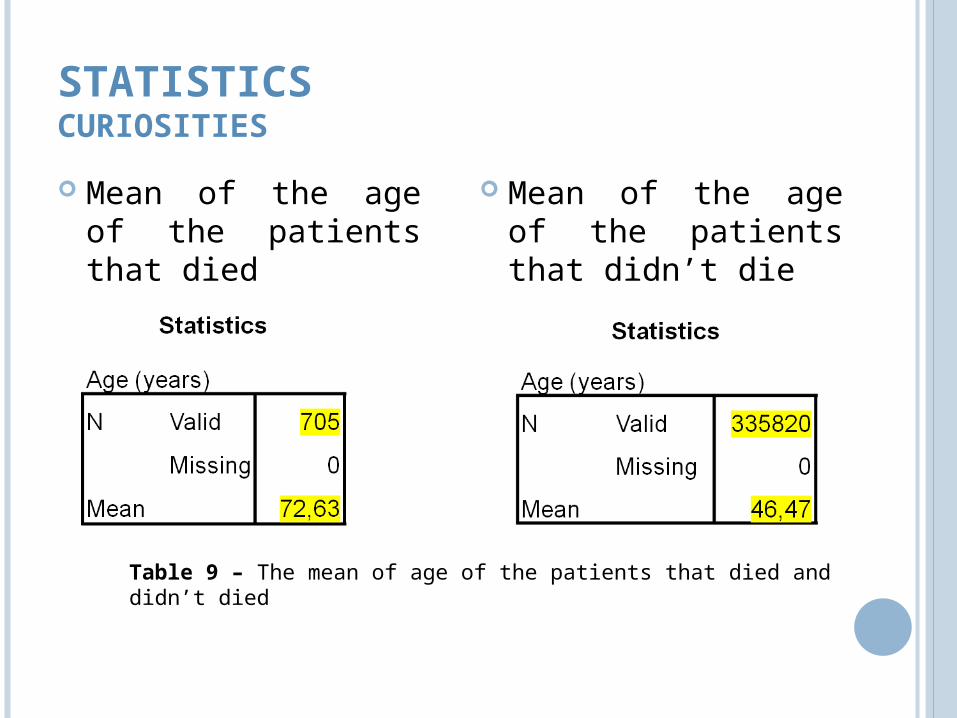
Mean of the age of the patients that died
Mean of the age of the patients that didn’t die
STATISTICSCURIOSITIES
Table 9 – The mean of age of the patients that died and didn’t died

See if there are any differences in the results along the time.
STATISTICSRESPONSE TO THE OBJECTIVES
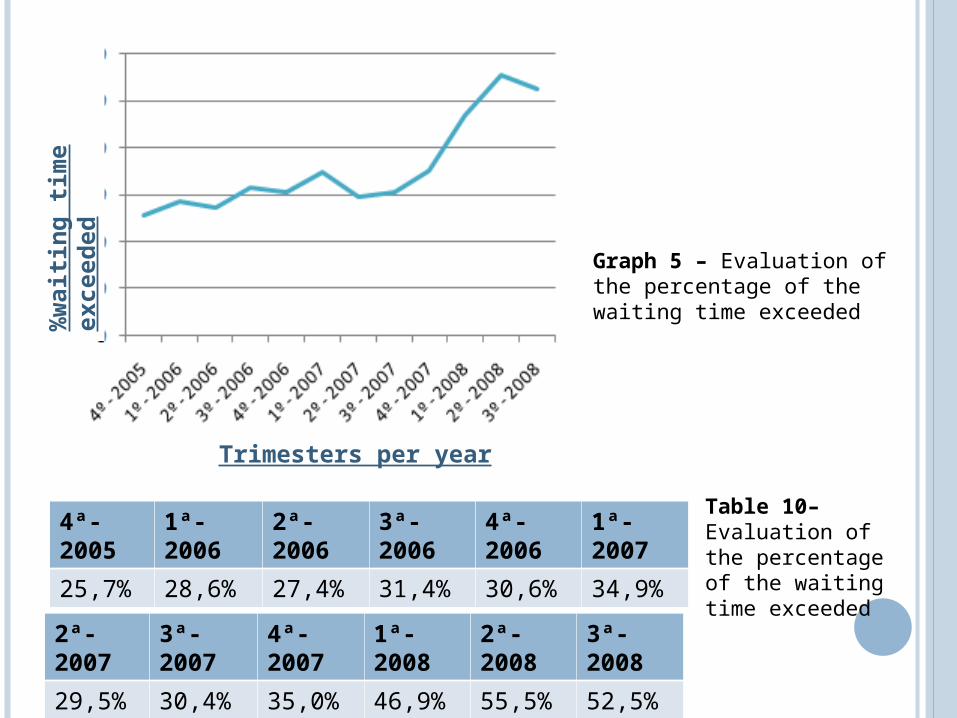
Graph 5 – Evaluation of the percentage of the waiting time exceeded
Trimesters per year
%w
aiti
ng
tim
e ex
ceed
ed
4ª-2005
1ª-2006
2ª-2006
3ª-2006
4ª-2006
1ª-2007
25,7% 28,6% 27,4% 31,4% 30,6% 34,9%
2ª-2007
3ª-2007
4ª-2007
1ª-2008
2ª-2008
3ª-2008
29,5% 30,4% 35,0% 46,9% 55,5% 52,5%
Table 10– Evaluation of the percentage of the waiting time exceeded
STATISTICS CURIOSITIES
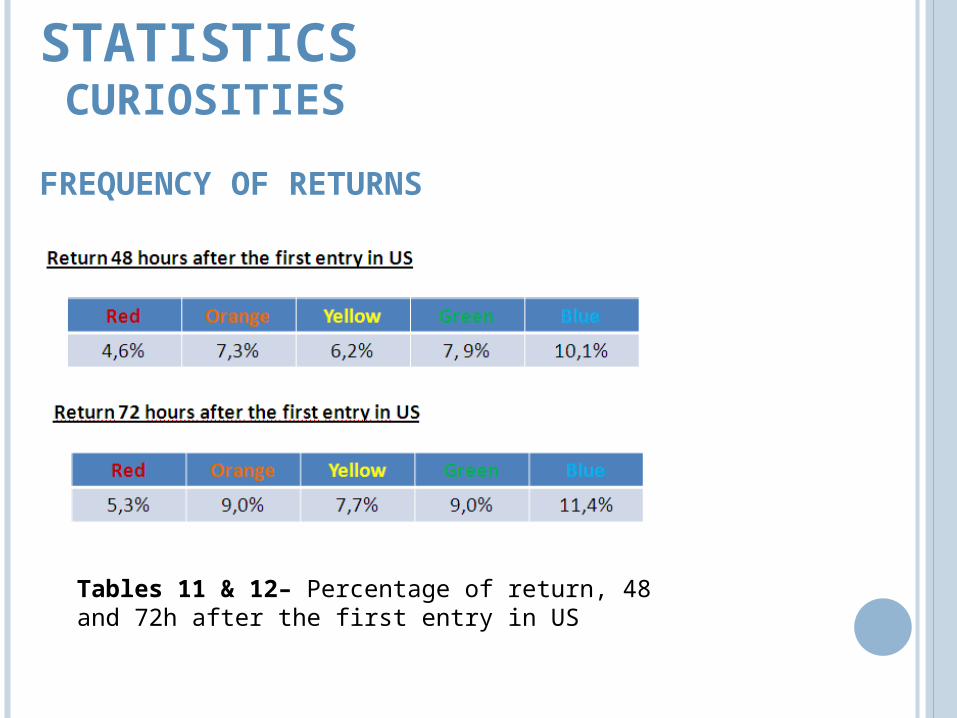
Frequency of returns
Analyzing the frequency of returns after 48 and 72 hours for each colour we observed that the less serious cases such as blue and green have a higher rate of patients that return to US. In contrast, the red colour had the lowest percentage of return.
STATISTICS CURIOSITIES
FREQUENCY OF RETURNS
Tables 11 & 12– Percentage of return, 48 and 72h after the first entry in US

DISCUSSION
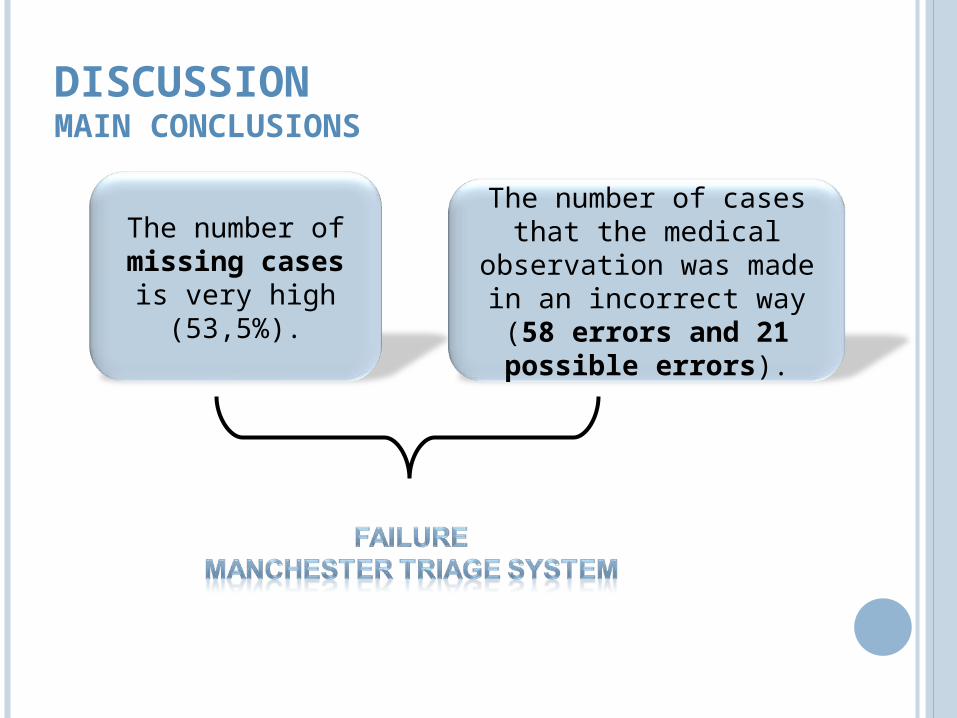
DISCUSSIONMAIN CONCLUSIONS
The number of missing cases is
very high (53,5%).
The number of cases that the medical
observation was made in an incorrect way (58
errors and 21 possible errors).
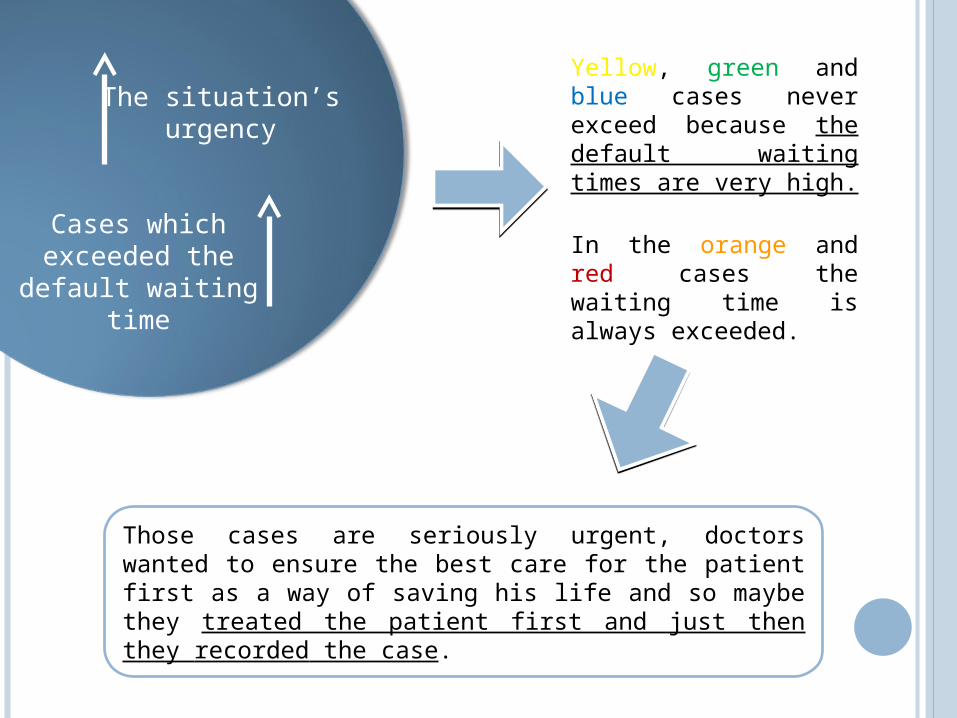
Cases which exceeded the
default waiting time
The situation’s urgency
Yellow, green and blue cases never exceed because the default waiting times are very high.
In the orange and red cases the waiting time is always exceeded.
Those cases are seriously urgent, doctors wanted to ensure the best care for the patient first as a way of saving his life and so maybe they treated the patient first and just then they recorded the case.

DISCUSSIONMAIN CONCLUSIONS
• Urgency of casesThe rate of death increases as the situation’s urgency increases too.
• Waiting timeThe behaviour is similar when we talk about the time patients waited and frequency they die.
However for instant: RED CASES
The high rate of death in red colour:
related to the urgency of the cases; not to the waiting time.
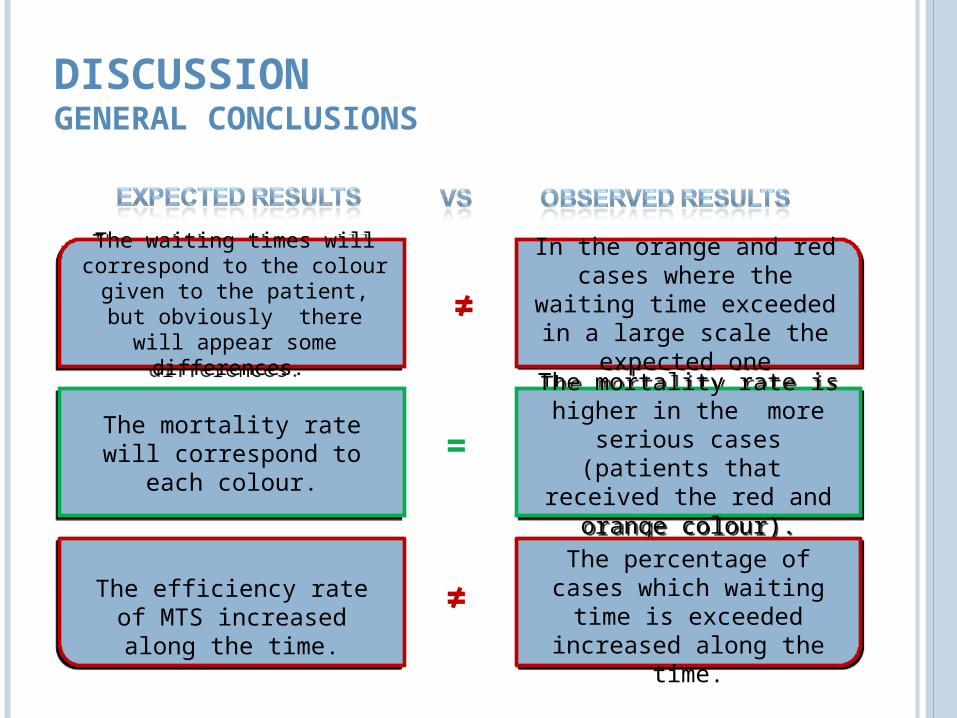
DISCUSSIONGENERAL CONCLUSIONS
The waiting times will correspond to the colour given to the patient, but
obviously there will appear some differences.
The waiting times will correspond to the colour given to the patient, but
obviously there will appear some differences.
The mortality rate will correspond to each colour.
The mortality rate will correspond to each colour.
In the orange and red cases where the waiting time exceeded in a large scale the expected one
In the orange and red cases where the waiting time exceeded in a large scale the expected one
The mortality rate is higher in the more serious
cases (patients that received the red and
orange colour).
The mortality rate is higher in the more serious
cases (patients that received the red and
orange colour).
=
≠The efficiency rate of MTS increased along the
time.
The percentage of cases which waiting time is exceeded increased
along the time.
≠
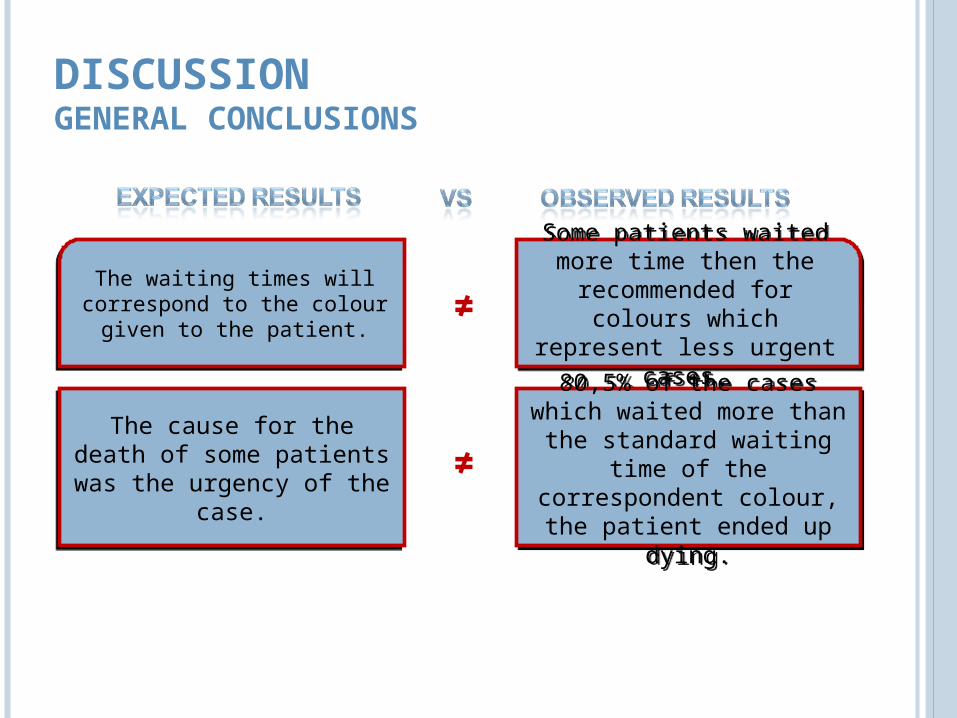
DISCUSSIONGENERAL CONCLUSIONS
The waiting times will correspond to the colour
given to the patient.
The waiting times will correspond to the colour
given to the patient.
The cause for the death of some patients was the urgency of the case.
The cause for the death of some patients was the urgency of the case.
Some patients waited more time then the
recommended for colours which represent less
urgent cases.
Some patients waited more time then the
recommended for colours which represent less
urgent cases.
80,5% of the cases which waited more than the
standard waiting time of the correspondent colour,
the patient ended up dying.
80,5% of the cases which waited more than the
standard waiting time of the correspondent colour,
the patient ended up dying.
≠
≠
DISCUSSIONFINAL CONCLUSION
As a general conclusion, we think that in theory, MTS could really be very useful, but these triage system
presents some limitations, such as the lack of information about medical observation which means a
great number of missing cases in the DB.
In spite of having all the advantages already experimented, we think that MTS is still possible to improve and even explore the effects of social status and gender on the colour assigned and the time spent waiting before being seen by a doctor.
ABOUT OUR WORK…
Finally, we could give an answer to the main aims of our work and so we were able to
evaluate what we proposed to – The efficiency of MTS, namely the waiting times
that correspond to each colour of this system.

PRODUCED BY:TURMA 8
Ana Pinho [email protected] Costa [email protected] Sofia Pereira [email protected] Marinho [email protected] Gonçalves [email protected] Brandão [email protected] Inês André [email protected] José Magalhães [email protected] Morais [email protected] Soares [email protected] Costa [email protected]