Embed Size (px)
Citation preview

Mandatory Disclosure, Internal Information Asymmetry, and
Insider Trading: Evidence from FAS 131
Chang-Mo Kangt Donghyun Kim:j Youngdeok Lim§
August 12, 2020
Abstract
We examine whether/how mandatory reporting enhancements influence insider trading in
the presence of information asymmetry between headquarters executives (HQEXs) and
divisional managers (DMs). Stricter reporting mandates discipline HQEXs from
overstating firm performance, but then they can promote informed share purchases of DMs
who fail to convince HQEXs to disclose positive divisional information. We test this
prediction using the adoption of Financial Accounting Standards No. 131 (FAS 131) as a
regulatory shock that enhances HQEXs’ segment reporting obligations. The adoption of
FAS 131 increases DMs’ purchases but not HQEXs’. DMs’ increased purchases are
negatively associated with reporting quality. We also examine the timing of DMs’
purchases around segment reporting releases, the impact of business concentration within
conglomerates and the role of institutional investors. Our study provides novel policy
implications for financial reporting and insider trading.
JEL classification: G14, G34, M41, M48
Keywords: internal information asymmetry, insider trading, conglomerates, mandatory
disclosure, FAS 131.
* We thank Hyunsoo Choi, Martin Dierker, Inmoo Lee, Kwangwoo Park, Woochan Kim and seminar participants
at KAIST and Korea University.
tHanyang University, School of Business, Department of Finance, [email protected]
:jChung-Ang University, School of Business Administration, [email protected]
§UNSW Sydney, UNSW Business School, School of Accounting, [email protected]

2
1 Introduction
Corporate insider trading has been a long-standing issue in finance and accounting literature.
Insiders’ private access to firm information raises a regulatory concern about their trading
activities as an instrument to expropriate outside investors.1 Among various efforts to address
the information asymmetry, financial reporting mandates have been considered a central policy
that aims to improve investors’ access to firm information by limiting manipulative disclosures,
in particular, overly optimistic ones. This regulatory effect, however, relies heavily on the
internal information asymmetry (IIA) within a firm. Specifically, financial reporting prepared
by top managers, who have limited knowledge about divisions, may fail to disclose material
information held by divisional managers.
We examine whether and how mandatory reporting enhancements affect insider trading in
the presence of IIA between headquarters executives (HQEXs) and divisional managers (DMs)
of conglomerates. Without IIA, stricter reporting standards reduce insiders’ informed trading
opportunities by improving the reporting transparency. Reduced noise in the report will increase
the elasticity and accuracy of stock prices and reduce opportunities for insiders to trade with
superior information after the report. However, the prediction may not sustain if HQEXs have
limited access to divisional information held by DMs. In this circumstance, underperforming
DMs may convey inflated information about divisional performance or prospect to HQEXs.
Stricter reporting mandates would induce HQEXs to avoid overstating firm performance and to
interpret divisional reports more conservatively by considering the manipulation incentives of
underperforming DMs. The disciplined reporting practices can then promote share purchases of
the DMs who fail to convince the conservative HQEXs of truly positive divisional information.
By purchasing shares, these privately informed DMs can gain trading profits while sending a
signal to HQEXs.
We test this prediction using the changes in accounting standards for conglomerates’
segment disclosures. The information structure between conglomerates’ HQEXs and their
segment DMs provides an excellent empirical setting for our tests. Relative to HQEXs, DMs
tend to have private information about their own business segments.2 For instance, Graham et
1 Previous studies (e.g., Lakonishok and Lee 2001) report ample evidence of informed insider trading even in the developed financial markets in which insiders are disallowed to trade their firms’ securities in the possession of material non-public information. 2 Goldstein and Yang (2015) points out conglomerates’ informational complexity that arises from their
3
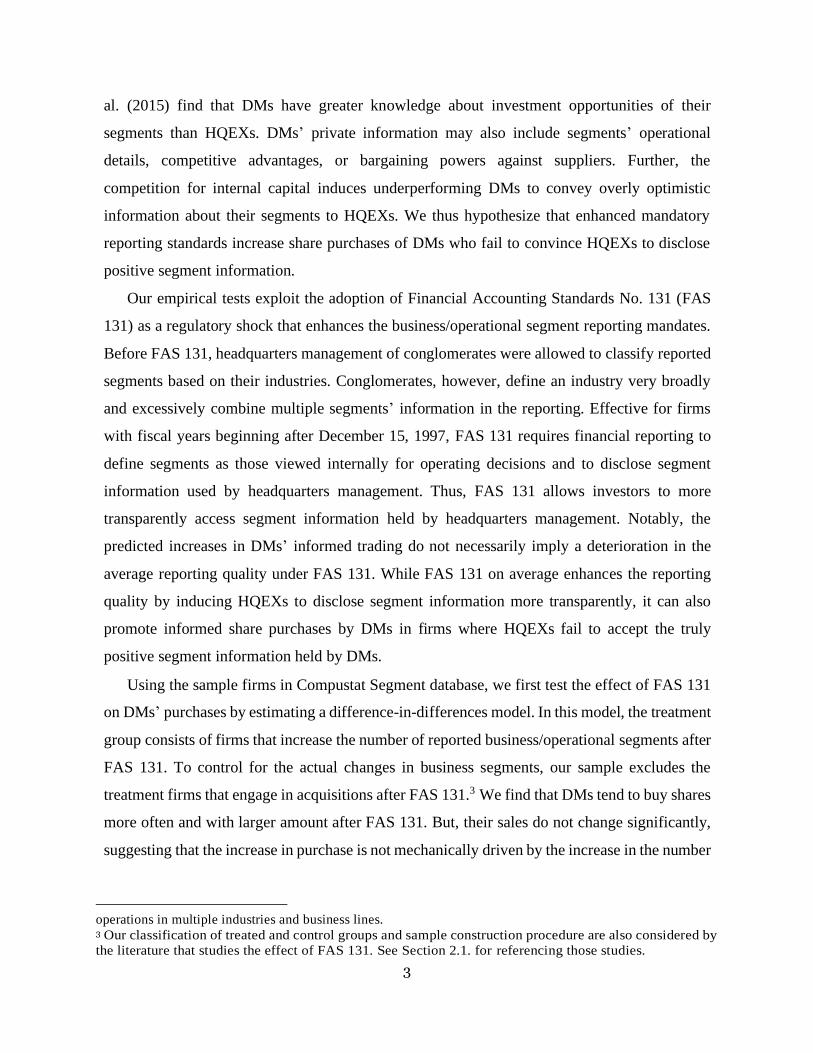
al. (2015) find that DMs have greater knowledge about investment opportunities of their
segments than HQEXs. DMs’ private information may also include segments’ operational
details, competitive advantages, or bargaining powers against suppliers. Further, the
competition for internal capital induces underperforming DMs to convey overly optimistic
information about their segments to HQEXs. We thus hypothesize that enhanced mandatory
reporting standards increase share purchases of DMs who fail to convince HQEXs to disclose
positive segment information.
Our empirical tests exploit the adoption of Financial Accounting Standards No. 131 (FAS
131) as a regulatory shock that enhances the business/operational segment reporting mandates.
Before FAS 131, headquarters management of conglomerates were allowed to classify reported
segments based on their industries. Conglomerates, however, define an industry very broadly
and excessively combine multiple segments’ information in the reporting. Effective for firms
with fiscal years beginning after December 15, 1997, FAS 131 requires financial reporting to
define segments as those viewed internally for operating decisions and to disclose segment
information used by headquarters management. Thus, FAS 131 allows investors to more
transparently access segment information held by headquarters management. Notably, the
predicted increases in DMs’ informed trading do not necessarily imply a deterioration in the
average reporting quality under FAS 131. While FAS 131 on average enhances the reporting
quality by inducing HQEXs to disclose segment information more transparently, it can also
promote informed share purchases by DMs in firms where HQEXs fail to accept the truly
positive segment information held by DMs.
Using the sample firms in Compustat Segment database, we first test the effect of FAS 131
on DMs’ purchases by estimating a difference-in-differences model. In this model, the treatment
group consists of firms that increase the number of reported business/operational segments after
FAS 131. To control for the actual changes in business segments, our sample excludes the
treatment firms that engage in acquisitions after FAS 131.3 We find that DMs tend to buy shares
more often and with larger amount after FAS 131. But, their sales do not change significantly,
suggesting that the increase in purchase is not mechanically driven by the increase in the number
operations in multiple industries and business lines. 3 Our classification of treated and control groups and sample construction procedure are also considered by
the literature that studies the effect of FAS 131. See Section 2.1. for referencing those studies.

4
of DMs in the treatment firms. Further, if FAS 131 does not expand DMs’ trading opportunities,
the increased purchases would be accompanied with a reduction in their profitability. The
profitability of DMs’ purchases, however, does not decline after FAS 131.
We then test whether the DMs’ increased purchases are driven by their private information
that HQEXs fail to process and disclose in segment reporting. To begin with, we examine
HQEXs’ purchases and do not find a significant change after FAS 131. We also identify DMs’
purchases that are likely driven by internally shared information and test whether this type of
purchases increase after FAS 131. Specifically, we single out DMs’ cluster purchases, namely,
those jointly placed with HQEXs’ purchases on the same date or consecutive trading days. After
FAS 131, cluster purchases do not increase, but they become significantly less profitable. On
the other hand, non-cluster purchases by DMs become more frequent with similar profits after
FAS 131. Overall, our findings suggest that FAS 131 reduces the profitability of DMs’
purchases that exploit internally shared information while providing DMs with new trading
opportunities to use private information uncaptured by HQEXs.
DMs’ increased purchases may lead to a regulatory concern about the effectiveness of FAS
131 in firms in which HQEXs have limited access to segment information. Specifically, in these
firms, FAS 131 may fail to improve segment reporting. We find supportive evidence in the next
three sets of tests. First, following Ettredge et al. (2005), we use Forward Earnings Response
Coefficient (FERC) as a proxy for financial reporting quality and test the change in 10-K filing
quality after FAS 131. FERC of 10-K filings is enhanced in firms in which DMs do not purchase
shares after FAS 131, but not among the firms in which DMs execute non-cluster purchases.
Second, following Chen et al. (2018), we use the return difference between DMs’ and HQEXs’
purchases as a proxy for IIA and do not find evidence of its resolution under FAS 131. In the
last test, we find that DMs’ purchases increase significantly between earning announcement and
10-K filing dates. Huddart and Ke (2007) point out that informed insider trading tends to occur
during this time window because insiders can use foreknowledge of 10-K filings while avoiding
litigation risks. HQEXs’ purchases in this window, however, do not change significantly,
implying that the DMs’ purchases are not driven by the segment information contained in the
upcoming 10-K filings. Rather, DMs could use the stock market mispricing from imprecise
segment information disclosed in the earnings announcements. Overall, our findings confirm
that DMs’ increased purchases are negatively associated with the financial reporting quality.

5
Third, we check whether DMs’ purchases increase more in conglomerates in which IIA is
more severe. Fama and Jensen (1983) point out that business complexity of a firm is a source of
information asymmetry between stakeholders. Motivated by this insight, we test whether the
adoption of FAS 131 increases DMs’ share purchases more in the treated firms in which the
capital allocation is more dispersed across business segments and find supportive empirical
evidence.
Finally, we examine whether DMs’ increased purchases and poor reporting quality under
FAS 131 are mitigated in firms in which institutional investors hold sufficiently large ownership.
We find that DM’s non-cluster purchases increase after FAS 131 if institutional investors hold
less than a majority of ownership. Consistent with the severity of IIA, these firms do not exhibit
significant increases in HQEX’s purchases nor substantial reporting quality improvements after
FAS 131. On the other hand, Firms with large institutional ownership exhibit significant
reporting enhancements, but no change in DM’s non-cluster purchases.
This paper contributes to the existing literature in several ways. First, to our best knowledge,
this study is the first to contribute to the FAS 131 literature by exploring the internal information
structure. The findings of prior studies suggest that analysts and investors have access to more
segment data, which has improved information environment by reducing the information
asymmetry between insiders and outsiders. Although these studies have demonstrated an
improved information environment, none has provided direct evidence of the impact of FAS131
on the internal information structure between DMs and HQEXs. Our findings do not support the
premises that enhanced segment reporting requirements under FAS 131 alleviates IIA. FAS 131
has not affected the internal information asymmetry between DMs and HQEXs but has imposed
a pressure on HQEXs to provide the detailed segment information to external users.
Interestingly, the enhanced segment information disclosure can be used as a trading opportunity
for DMs with private information unknown to HQEXs.
Second, our findings provide a novel policy implication with respect to the effectiveness of
FAS 131. FAS 131 may not improve the transparency of segment information disclosures and
rather promotes DMs’ informed insider trading in conglomerates with severe IIA. Our findings
suggest that the regulatory effect of FAS 131 relies crucially on the internal information
structure. Further, DMs’ informed trading under FAS 131 provides mixed regulatory
implications. On one hand, the informed trading may need to be restrained for the purpose of

6
investor protection. On the other hand, it can contribute to market efficiency when HQEXs fail
to incorporate true divisional information in the report despite the enhanced accounting
standards. Regulators may need to consider this trade-off when devising new reporting standards
if they find it infeasible to resolve IIA within a firm.
The remainder of the paper is structured as follows: In Section 2 we provide the background
of FAS 131, review the relevant prior research, and develop our hypotheses. Section 3 provides
research design with empirical model. In Section 4, we describe our sample selection and present
descriptive statistics and a univariate comparison. Sections 5 and 6 provide the results of our
multivariate tests and additional analyses. Section 7 concludes.
2 Related Literature and Hypothesis Development
2.1 The impact of FAS 131
FAS 131 is preceded by the Financial Accounting Standards 14 (FAS 14), which required firms
provide information about their lines of business and geographic segments separately, with no
required disclosure on how to reconcile the two types of segment information. FAS 14 also used
a loose definition of industry, which allowed managers of diversified firms to report highly
aggregated segments. However, FAS 131 that was adopted starting from December 15, 1997
adopts the management approach to define a firm’s operating segments. In this approach,
segmentation is based on how management organizes the segments within a firm for the
purposes of decision making and performance assessment. Segment information that is based
on a firm’s internal organizational structure allows financial reporting users to see the firm
through the eyes of management, thus enhancing their ability to predict that firm’s future cash
flows. Moreover, segment information reported using the management approach specified by
the new standard is less subject to manipulation, as firms have less discretion about segment
definition. As this segment reporting is based on the internal units used by top executives to
make operating decisions and evaluate firm performance, the information provided is more
consistent with the disclosures made in the other parts of the firm’s annual report.
Prior FAS 131 studies report a significant improvement in the disclosure of segment
information after the standard was implemented. More specifically, these studies document
increases in the number of reported segments (Herrmann and Thomas 2000, Berger and Hann

7
2003), more line items for business segments (Street et al. 2000), improved analyst forecasts
(Berger and Hann 2003, Botosan and Stanford 2005), improved stock market ability to
anticipate future earnings (Ettredge et al. 2005), improved capital allocation efficiency (Cho
2015), and a stronger impact of industrial diversification on bond yields (Franco et al. 2016).
Herrmann and Thomas (2000) examine the reporting behavior of a sample of firms drawn
from the largest of the Fortune 500 following the advent of FAS No. 131. They conclude that
FAS No. 131 improved segment reporting based on an assessment of changes in the number of
reportable segments and the consistency between segment disclosures and the rest of the annual
report. Street et al. (2000) find similar improvements for a sample of Global 1000 firms. In
addition, 49 percent of the firms in their sample that reported no segment data under FAS No.
14 initiated segment disclosures under FAS No. 131. Both studies focus on how FAS No. 131
impacted the segment disclosures firms provide; neither investigates managers’ motives to
withhold segment information or the impact of FAS No. 131 adoption on analysts’ information
environment.
Berger and Hann (2003) find that newly disclosed segment data provide additional
information that improves analyst forecasts of multi-segment firm earnings. Botosan and
Stanford (2005) conclude that analysts are more dependent upon public information by
considering changes in the weight of the public and private information included in analyst
forecasts. This finding implies that more segment information became publicly available after
the new standard was put in place and that analysts seem to use that information to predict firm
earnings.
Using the FERC, Ettredge et al. (2005) find that the stock market was able to predict the
future earnings of treatment firms early on in the post-131 era. They conjecture that if the newly
disclosed segment data are useful in predicting future earnings, then current stock prices
impound more information about those earnings, and thus the association between current stock
prices and the FERC should improve. Their empirical results confirm their conjecture and
demonstrate that the speed with which future earnings information is incorporated into current
stock prices was accelerated in the three years after the adoption of FAS 131.
FAS 131 also influences the firm value. Cho (2015) finds that diversified firms that
improved segment disclosure transparency by changing segment definitions upon adoption of
FAS 131 experienced an improvement in capital allocation efficiency in internal capital markets

8
after the adoption of FAS 131. Jayaraman and Wu (2019), by contrast, report a reduction in
corporate investment efficiency after FAS 131. Franco et al. (2016) document that bonds issued
by industrially diversified firms with high-quality segment disclosures have significantly lower
yields than bonds issued by diversified firms with low quality segment disclosures. They also
find that the negative relation between industrial diversification and bond yields becomes
stronger when firms improve segment disclosures as a result of FAS 131.
While the positive impact of FAS 131 on external decision makers (e.g., analysts, stock and
bond investors) is well-documented, there is a dearth of academic research as to whether a
similar effect can be found on internal decision makers (e.g., HQEXs and DMs). Our study will
fill the important research gap in the prior literature.
2.2 Hypothesis development
Previous studies link DMs to overall internal firm information environments, based on the
premise that the amount of information managers at different ranks possess varies among firms.
For example, Graham et al. (2015) report that CEOs describe the opinion of a DM as one of the
most important factors in key business decisions. Duchin and Sosyura (2013) find that divisional
information sharing between DMs and the CEO influences investment efficiency of
conglomerates.
Divisional information sharing within a conglomerate are hindered by several factors. DMs
compete internally for resources (Harris and Raviv 1996), which can affect their incentives for
transferring information transparently to the headquarters. HQEXs may find it hard to verify the
truthfulness of DMs’ report because it is too costly for them to aggregate divisional information
from various sources (Aghion and Tirole 1997) or because the information tends to be soft (Stein
2002). Other factors that can constrain HQEXs’ accessibility to divisional information include
geographic dispersion, business complexity and inadequate internal control systems (Chen et al.
2018). Alternatively, HQEXs may have superior ability to process aggregate firm information
acquired from divisions (Chen et al. 2018).
The “disclose or abstain” rule precludes insiders from trading while in possession of material
nonpublic information but does not provide explicit guidelines for disclosure content. As a
result, managers wishing to trade have incentives to disclose something but maintain discretion
over the quality of their disclosure. Under FAS131, HQEXs are obliged to report the segment

9
information that they use for operating decisions. As discussed in Section 2.1, enhanced
reporting mandates induce the HQEXs to avoid overstating firm performances and, thus, to
interpret DMs’ segment report conservatively in consideration to the underperforming DMs’
manipulation. This managerial disciplinary effect, in turn, facilitates share purchases of DMs
who fail to convince HQEXs to disclose truly positive divisional information. Based on the
discussion above, we formulate the following hypothesis:
Hypothesis 1. FAS 131 is positively associated with share purchases of DMs but not those of
HQEXs.
FAS 131 is intended to help investors better understand a firm’s performance, and better
assess future net cash flows, in order to make more informed judgments about the firm as a
whole. Cho (2015) argues that FAS 131 improves the transparency of managerial actions in
internal capital allocation and that more transparent segment information can help resolve
agency conflicts in the internal capital markets of diversified firms. However, if DMs’ private
information is not accepted by HQEXs and thus leads to DMs’ informed trading in the post
FAS131 period, FAS 131 would not meet the standard’s intended qualitative effects.
Specifically, we hypothesize that FAS 131 enhances the reporting quality only in conglomerates
in which the new accounting standard does not lead to DMs’ share purchases. The second
hypothesis follows in a null form:
Hypothesis 2. FAS 131 does not improve the segment reporting in conglomerates in which
DMs’ share purchases increase after its adoption.
3 Research Design
3.1 Informed insider trading
Measuring information structure among corporate insiders is a challenging task. Researchers do
not observe the information privately held by insiders even ex-post unless the relevant corporate
disclosure is enforced by court rulings or regulations. Previous studies attempt to back out the

10
information embedded in insider trades. Lakonishok and Lee (2001) find that insider purchases
exhibit significantly positive stock return predictability, suggesting that these trades tend to be
driven by inside information. Insider sales, on the other hand, do not predict future stock returns.
Following the literature, we use all purchases of insiders as a (noisy) proxy for informed
purchases. In the robustness checks, we also consider opportunistic trades proposed by Cohen
et al. (2012) as a refined measure of informed insider trades.
We then identify DMs’ purchases that are likely to be driven by internally shared
information, namely, cluster purchases. Specifically, cluster purchases are defined as the
purchases placed by multiple insiders on the same day or in consecutive days. Insiders, who
have shared information, must trade in a similar period to gain trading profits, particularly if the
shared information is scheduled to be publicly disclosed soon. As discussed in Section 2.1, FAS
131 enhances the financial reporting about divisional information. We thus expect that cluster
purchases of DMs and HQEXs around corporate financial reporting capture the effect of FAS
131 on their shared information-driven trading especially well. Notably, cluster purchases
measure internal information sharing only partially because they are influenced by insiders’
trading strategies as well.
As a proxy for internal information asymmetry between DMs and HQEXs, we use the
measure proposed by Chen et al. (2018), which is the relative stock return subsequent to DMs’
trades when compared to HQEXs’ trades. They provide empirical evidence of this return gap as
a reliable measure for DMs’ informational advantage relative to HQEXs. Using this measure,
we test whether FAS 131 changes information sharing within a conglomerate.
3.2 Model specification
We test the hypotheses by estimating a difference-in-differences model, which identifies the
effect of FAS 131 on DMs’ trading activities and returns. Following the previous studies (e.g.,
Ettredge et al. 2005), we set the treatment group to include conglomerates that increase the
number of reported business segments after FAS 131 and the control group to contain other
conglomerates (i.e., those which do not increase the number of business segments after FAS
131).4 Formally, we estimate the following fixed effect regression model: for firm i in year t,
4 As a robustness check, we run the analysis after excluding the conglomerates that report fewer business
segments under FAS 131 and find qualitatively consistent results.

11
𝑌𝑖𝑡 = 𝛽0 + 𝛽1𝑃𝑜𝑠𝑡𝑡 × 𝑇𝑟𝑒𝑎𝑡𝑖 + Γ(𝐶𝑜𝑛𝑡𝑟𝑜𝑙𝑠) + 𝜂𝑖 + 𝜈𝑡 + 𝜀𝑖𝑡 , (1)
where the dependent variable includes various insider trading measures, Postt is a post-131
period indicator (i.e., equals 1 if year t is in the post-FAS 131 period and 0, otherwise), and
Treati is a treatment group indicator (i.e., equals 1 if firm i is a conglomerate that increases the
number of reported segments under FAS 131 and 0, otherwise). Firm fixed effects ηi and year
fixed effects νt, which subsume the partial effect of Treati and FAS131t, respectively, are
controlled. Details about the sample construction are provided in Section 4.2 below.
We also test whether FAS 131 fails to improve segment disclosures if DMs hold private
segment information unaccepted by HQEXs (Hypothesis 2). Following Ettredge et al. (2005),
we measure the informativeness of financial reports using Forward Earnings Response
Coefficient (FERC), defined as the coefficient estimate b2 in the following regression: for firm
i and period t,
𝑅𝑖𝑡 = 𝑎 + 𝑏0𝐸𝑖𝑡−1 + 𝑏1𝐸𝑖𝑡 + 𝑏2𝐸𝑖𝑡+1 + 𝑏3𝑅𝑖𝑡+1 + 𝜀𝑖𝑡 , (2)
where (i) Eit−1, Eit, and Eit+1 are EPS scaled by price in the prior, the current and the next period,
respectively, and (ii) Rit and Rit+1 are the stock return of the current and the next period,
respectively. We expand the regression model to examine the relative change in treatment firms’
FERC relative to that of control firms after FAS 131: for firm i and period t,
𝑅𝑖𝑡 = 𝑎 + 𝑏0𝐸𝑖𝑡−1 + 𝑏1𝐸𝑖𝑡 + 𝑏2𝐸𝑖𝑡+1 + 𝑏3𝑅𝑖𝑡+1
+𝑃𝑜𝑠𝑡𝑡 × (𝑐 + 𝑑0𝐸𝑖𝑡−1 + 𝑑1𝐸𝑖𝑡 + 𝑑2𝐸𝑖𝑡+1 + 𝑑3𝑅𝑖𝑡+1)
+𝑃𝑜𝑠𝑡𝑡 × (𝑒 + 𝑓0𝐸𝑖𝑡−1 + 𝑓1𝐸𝑖𝑡 + 𝑓2𝐸𝑖𝑡+1 + 𝑓3𝑅𝑖𝑡+1)
+𝑃𝑜𝑠𝑡𝑡 × 𝑇𝑟𝑒𝑎𝑡𝑖 × (𝑔 + ℎ0𝐸𝑖𝑡−1 + ℎ1𝐸𝑖𝑡 + ℎ2𝐸𝑖𝑡+1 + ℎ3𝑅𝑖𝑡+1) + 𝜀𝑖𝑡 ,
(3)
The key coefficient estimate is h2. We predict that h2 > 0 (i.e., the financial reporting of treatment
firms’ financial reporting becomes more informative after FAS 131) only if DM does not
purchase shares after FAS 131.
4 Data and Sample Selection
4.1 Data
We obtain insider trading information for corporate executives from the Thompson-Reuters

12
Insider Filing (TRIF) database. TRIF collects the data in Forms 3, 4, and 5, in which insiders
submit ownership of a company stock to the SEC according to Section 16 of the Securities and
Exchange Act of 1934. We obtain the segment level accounting data from the Compustat
Segment database. We only use the business segments (stype = BUSSEG or OPSEG) since the
reported geographic segments (which correspond to global regions) decrease substantially
during the period. We acquire firm level accounting variables from Compustat database, stock
returns from the Center for Research in Security Prices (CRSP) database, financial analyst
information from I/B/E/S, and institutional ownership from Thomson-Reuters Institutional
Holdings (13F) database.
Now we describe the procedure to classify treatment and control groups. FAS 131 is
effective from the fiscal year (FY) starting after December 15, 1997. Following the literature
(see Section 2.1 above), we exclude the first year of adoption, i.e., the reports of FYs ending in
December 1998 through November 1999. We then compare the number of business/operating
segments between the pre-131 period (FYs ending in December 1997 through November 1998)
and the post-131 period (FYs ending in December, 1999 through November, 2001). FAS 131
allows restatements of previous fiscal years and Compustat provides up to 3 restatements for
each fiscal year. The restatement ratio increases gradually in 1998 starting from 5% in January
to over 40% in October. It remains around 40–45% afterwards. For the pre-131 period, we use
the original statement since the restatements may reclassify the segments based on FAS131. For
post-131 period, we consider the largest number of segments among all (re)statements in each
FY. Using the information, we define the treatment group as the firms which reported more
business segments in both post-131 FYs than those in the pre-131 FY. All other firms in the
Compustat segment database are classified as the control group.
Finally, following Chen et al. (2018), we identify DMs from TRIF, if (i) the relationship
code is the divisional officer (relationship code=OX) or the officer of subsidiary company (OS),
or (ii) the relationship code is a non-top executive, and mailing address is not in the headquarters
state or is at least 500 km away from the headquarters location. Following Kang et al. (2019),
we define insider cluster trades as the same directional trades in which multiple insiders trade
for the same stock on the same day or over the consecutive trading days.
4.2 Sample selection

13
Table 1 shows the sample selection process. We begin with 16,711 firms in Compustat from
fiscal year of 1996 to 2001. We remove the firms without stock return data, then there are 11,847
firms for which stock returns are available in CRSP database. We drop 1,801 firms for which
segment data are not available from Compustat Segment database. We restrict our sample of
firms to fiscal year end of December, leaving 6,832 companies after the screening process. Next,
we exclude 1,164 firms for which insider trading data is not available in TRIF, then delete 104
firms and 626 firm-year observation for which no insider trading exists in the previous three
years. At this stage, the sample contains 5,564 firms and observation for 21,172 firm-years. We
remove 2,623 firms that do not have at least one observation in the pre-131 period and one
observation in the post-131 period, then there are 2,941 companies. We delete 61 firms for which
acquisitions or divestitures occur during any year of the sample period. Following Berger and
Ofek (1995), we require that the difference between the sum of sales (assets) in its segments and
total sales (assets) at the firm level is less than 1% (25%). This requirement leaves 1,904 firms
and 9,228 firm-year observations as a final sample.
[Insert Table 1 here]
4.3 Descriptive statistics
Table 2 panel A presents the descriptive statistics and segment classification status of treated
and control firms. We divide the time periods into pre- and post-FAS 131, where pre-period is
from fiscal year 1996 to 1998 and post-period is from 1999 to 2001.5 There are total 480 treated
firms and 1,424 control firms. Treated companies have more segments than control ones, and
the gap widens after FAS 131. Compared to control companies, the treated companies are larger,
have more growth, and are more owned by institutions. Changes in these firm characteristics
are mostly parallel in both groups after FAS 131. Treated firms are followed by more analysts
both before and after FAS 131.
[Insert Table 2 here]
During the pre- and post-periods, the pattern and amount of insider trading are not
significantly different between treated firms and control firms. The average number of insider
5 As Section 404 started after the Sarbanes-Oxley Act of 2002 (see Feng et al. 2009), there is no significant change in internal control system due to the regulation on disclosures of internal control deficiencies.

14
purchases is 3.28 for treated firms and 3.37 for control firms before FAS 131, and they become
4.998 and 5.036 after FAS 131, respectively. Insider purchases occur 63.1% for treated
companies and 55.7% for control companies in the previous period, and the occurrence becomes
72.8% and 67.6%, respectively. In pre-131 period, the observed probability of DMs’ purchases
in a year is 12.2% and 11.7%, respectively. However, in the post-131 period, there are more
purchases by the DM for the treated firms. The difference in probability of occurrence increases
from 0.5% to 4.2%. Most of the increase comes from non-cluster purchases. In contrast,
purchase patterns of HQEXs are very similar in both groups, and we do not observe significant
changes in differences after FAS 131.
Panel B shows the segment classification status during the pre- and post-131 period. The
561 single segment companies remain standalone after 131, and 91 have more segments after
FAS 131. For multi-segment firms, 315 are unchanged, while 258 add more segments.
5 Empirical Analyses
5.1 FAS 131 and insider trades
5.1.1 Divisional managers’ trades
We first test whether FAS 131 provides DMs with more trading opportunities in which they can
exploit segment information uncaptured by HQEXs. Specifically, we run the difference-in-
differences estimation model (1) for six dependent variables that measure DMs’ share purchase
patterns. As control variables, we consider logarithm of book asset value (Log Size), the book
value to market value ratio (Book-to-Market), logarithm of number of analysts (Log Num
Analysts), the fraction of institutional ownership (Institutional Ownership), firm fixed effects,
and year fixed effects. In all estimations, standard errors are clustered at firm level. Definition
of variables are provided in Appendix.
[Insert Table 3 here]
Table 3 presents the estimation results. In column (1), the dependent variable is a dummy
variable (DM Purchases) which equals 1 if DMs purchase shares during the firm-year and 0
otherwise. After FAS 131, the treatment conglomerates exhibit larger increment in the
probability of DMs’ shares purchases (4.2%) than the control firms do. The difference between

15
the two groups’ probability changes is statistically significant at 5% level. We then examine
whether this result is driven by cluster purchases, which are likely to be driven by information
commonly shared with other executives, or by non-cluster purchases. In column (2), the
dependent variable is a dummy variable (DM Cluster Purchases) that assigns 1 if the firm year
has DMs’ cluster purchases and 0 otherwise. The two groups of firms do not exhibit a significant
difference in the changes of DMs’ cluster purchase probability. In column (3), we use a dummy
variable (DMs’ Non-cluster Purchases), which assigns 1 if the firm year has DMs’ non-cluster
purchases and 0 otherwise, as dependent variable. After FAS 131, the treatment conglomerates
present larger increase in the probability of DMs’ non-cluster purchases (4.9%) than the control
firms. These results suggest that FAS 131 facilitates the DMs’ trades that exploit private
segment information uncaptured by other executives.
We then examine the changes in dollar amounts of DMs’ purchases after FAS 131. In
columns (4)–(6), dependent variables are logarithm of one plus the dollar amount of DMs’
purchases, cluster purchases, and non-cluster purchases, respectively. We find that, after FAS
131, DMs of treatment conglomerates increase share purchases more than those of control firms.
This change in DMs’ purchases is entirely driven by their non-cluster purchases. Our findings
show that DMs invest more in their firms’ shares via non-cluster purchases rather than simply
splitting their purchases and trading more frequently after FAS 131, which supports Hypothesis
1.
As a robustness check, we also test whether DMs’ sales increase under FAS 131. One may
concern that DMs’ increased purchases result mechanically from the changes in the number of
DMs. After FAS 131, the treatment conglomerates report more segments and thus possibly
classify more insiders as DMs. This alternative channel however should also increase DMs’
sales. We thus exploit the analysis of DMs’ sales changes as a falsification test for the alternative
explanation.
[Insert Table 4 here]
Table 4 presents the estimation results. We run the difference-in-differences regressions in
Table 3 by replacing the dependent variables with the corresponding DMs’ sales measures.
Column (1) shows that the two groups of firms do not exhibit significant differences in the
changes of DMs’ share sales probability after FAS 131. Further, columns (2) and (3) present
that the two groups do not differ in cluster and non-cluster sales probabilities, respectively. The

16
estimation results with respect to the dollar amount of DMs’ sales, cluster sales, non-cluster
sales, presented in columns (4)–(6), respectively, are also consistent. These findings suggest that
the increased purchases of DMs are not driven by some mechanical changes in the number of
DMs, which would also influence DMs’ sales.
5.1.2 Headquarters executives’ purchases
Next, we test whether FAS 131 also facilitates HQEXs’ purchases. Specifically, we use the same
estimation models in Table 3 while replacing dependent variables with the corresponding
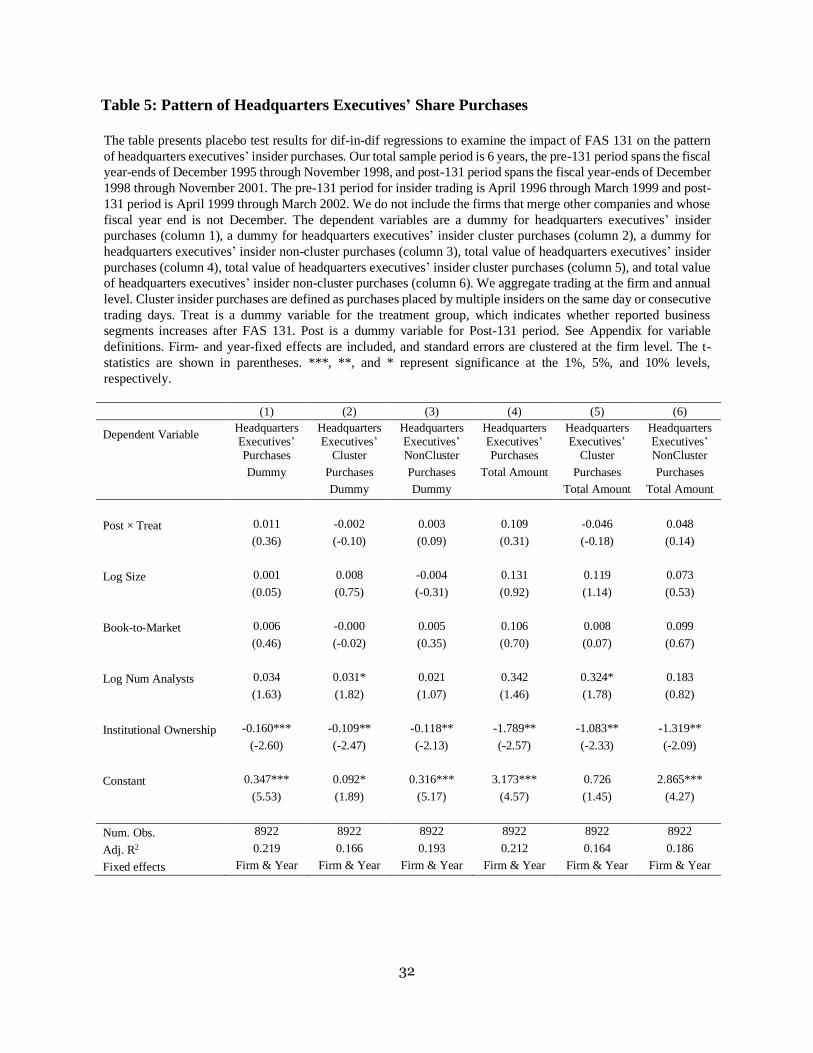
measures of HQEXs’ purchases. The estimation results are presented in Table 5.
[Insert Table 5 here]
Column (1) shows that, after FAS 131, treatment and control firms do not differ significantly
in the changes of their HQEXs’ purchase probability. Columns (2) and (3) present that the
similarity between the two groups of firms is observed in both the probability of HQEXs’ cluster
purchases and the probability of their non-cluster purchases. Likewise, columns (4)–(6) show
that the two groups do not significantly differ in the changes of HQEXs’ share purchase value,
both cluster and non-cluster purchases. Overall, these findings confirm that the increase in DMs’
purchases after FAS 131 is driven by the segment information uncaptured by HQEXs, but not
by commonly shared information or unobservable firm characteristics that influence all insiders’
trades.
5.1.3 Returns from insiders’ purchases
Finally, we examine how FAS 131 influences returns of DMs’ and HQEXs’ share purchases,
respectively. We predict that, if FAS 131 does not expand trading opportunities of DMs, the
increase in their purchase amount after FAS 131 would reduce the trading returns. To test this
prediction, we estimate the difference-in-differences model where the dependent variable is the
mean of 6-month stock returns following DMs’ purchases (and their cluster/non-cluster
purchases) executed in each firm-year. The stock returns are adjusted for characteristics-based
benchmarks proposed by Daniel et al. (1997). We also control for year fixed effect and cluster
standard errors at the firm level.
[Insert Table 6 here]

17
Table 6 presents the estimation results. Column (1) shows that the change in DMs’ purchase
returns after FAS 131 is lower by 9.4% in treatment conglomerates, but the difference between
the two groups is not statistically significant. The relatively lower return in treatment
conglomerates under FAS 131 could be associated with the enhanced transparency of segment
information disclosures. We further examine this possibility by testing the changes in DMs’
cluster purchase returns after FAS 131. Column (2) shows that DMs’ cluster purchases in
treatment firms is reduced more (by 24.6%) and the difference between the two groups are
marginally significant at 10% level. In column (3), we also examine the changes in DMs’ non-
cluster purchase returns and do not find significant difference between treatment and control
firms. Given that headquarters is responsible for corporate disclosures, the significantly lower
return of cluster purchases suggests that the improved corporate disclosure under FAS 131
reduces the profitability of DMs’ trades that exploit segment information shared with
headquarters.
We run several robustness checks. First, we examine the change in returns of DMs’
opportunistic purchases, proposed by Cohen et al. (2012) as an informed insider trading
measure, in order to reduce the effect of non-information driven purchases. Column (4) shows
that the change in DMs’ opportunistic purchase returns is rather higher by 8% in treatment
conglomerates, though the difference between the two groups is statistically insignificant.
Second, we examine the change in HQEXs’ purchase returns after FAS 131. Columns (5)–(7)
present that treatment and control groups do not differ significantly in the return change of
HQEXs’ purchases, cluster purchases, and non-cluster purchases, respectively. Finally, we test
whether the internal information asymmetry (IIA) between HQEXs and DMs changes after FAS
131. Chen et al. (2018) propose DMs’ trading returns less HQEXs’ trading returns as a measure
for IIA. Column (8) shows that the two groups of firms do not differ significantly in the change
of IIA after FAS 131. This result suggests that FAS 131 does not alleviate IIA effectively.
5.2 Analyses of reporting quality (FERC)
Our empirical tests, so far, show that FAS 131 provides DMs with trading opportunities to
exploit segment information uncaptured by a headquarters. The findings lead to a regulatory
concern about the effectiveness of FAS 131 in conglomerates in which headquarters
management suffers severe asymmetric information problems against DMs. We test this

18
prediction by estimating the difference-in-differences regression model (3), which compares the
changes in FERC after FAS 131 between treatment and control conglomerates.
[Insert Table 7 here]
Table 7 presents the estimation results. Column (1) shows that, in the full sample, treatment
conglomerates exhibit larger increase in FERC after FAS 131 than control firms do. The
difference-in-differences estimate of FERC (the coefficient of Post×Treat× Et+1) is 0.408, which
is statistically significant at 10% level. This result is consistent with the findings of Ettredge et
al. (2005). Column (2) presents that the reporting quality improvement of treatment firms is
more pronounced in the subsample in which DMs do not purchase shares after FAS 131. The
difference-in-differences estimate of FERC is 0.61, which is statistically significant at 5% level.
In column (3), on the other hand, the two groups of firms do not differ in reporting quality
enhancement in the subsample in which DMs purchase shares after FAS 131. The estimate is
negative and statistically insignificant. We also run the analysis using the firms that have DMs’
non-cluster purchases after FAS 131. Column (4) shows that, in this subsample, the coefficient
estimate is still statistically insignificant. Overall, the results provide an important policy
implication in that the mandatory accounting standard improves the financial reporting quality
only if the internal information asymmetry is well addressed, which supports Hypothesis 2.
6 Additional analyses
6.1. The timing of trades around corporate disclosure dates
We then examine the timing of DMs’ purchases around financial reporting. Insiders often
strategically choose disclosure policies and the timing of trades jointly to utilize their inside
trading, which makes it difficult to test the impact of increased disclosure on DMs trading
activities. Huddart and Ke (2007) find that informed insider trading tends to occur between
earnings announcement dates and 10-K filing release dates because they can use foreknowledge
of financial reporting while avoiding litigation risks. This period could also be the optimal
trading timing for DMs if HQEXs disclose imprecise segment information during the earning
announcement and thus leads to mispricing in the stock market. We thus test whether DMs’

19
purchases increase in this period after FAS 131. For comparison, we also examine DMs’ trades
after 10-K filings and HQEXs’ trades in both periods.
[Insert Table 8 here]
Table 8 presents the estimation results. In panel A, we estimate the difference-in-differences
model reported in Table 3 except that the dependent variables are constructed based on DMs’
purchases between the earnings announcement and the 10-K filing dates. Column (1) shows that
treatment firms exhibit larger increase in the probability of DMs’ purchases after FAS 131 than
control firms during this period. The difference between the two groups’ probability changes,
2.2%, is statistically significant at 5% level. Columns (2) and (3) show that this difference is
pronounced only in DMs’ non-cluster purchases. Specifically, the difference-in-differences
coefficient estimates of DMs’ cluster and non-cluster purchases are 0.5% and 1.9%,
respectively, and only the latter is statistically significant at 5% level. Columns (4)–(6) report
that treatment firms also exhibit larger increase in the dollar amount of DMs’ purchases, in
particular, their non-cluster purchases during this period after FAS 131 than control firms do.
In panel B, columns (1)–(3), we also test whether FAS 131 increases probabilities of DMs’
share purchases, cluster purchases, and non-cluster purchases after the 10-K filing dates,
respectively. Treatment and control firms do not differ in DMs’ purchases, both cluster and non-
cluster purchases, during this period after FAS 131. These results, together with the findings in
panel A, may be interpreted as evidence about an alternative source of DMs’ informed trading,
namely, the foreknowledge about segments contained in 10-K filings. If this alternative
explanation is correct, HQEXs’ purchases before 10-K filings should increase under FAS 131
because 10-K filings include the segment information that headquarters uses for operational and
management decision making. To test this prediction, we examine whether treatment firms
exhibit larger increases in HQEXs’ purchases placed before 10-K filing dates than control firms
do. Columns (4)–(6) show that, after FAS 131, the two groups of firms do not differ significantly
in the probability changes of their HQEXs’ purchases, cluster purchases, and non-cluster
purchases placed between earnings announcement and 10-K filing dates. Overall, our findings
suggest that, after FAS 131, DMs are more likely to purchase shares between earnings
announcement and 10-K filing dates, to exploit the private information undisclosed or
misreported in the upcoming 10-K segment filings.

20
6.2. The effect of business concentration
We now study the effect of business concentration within conglomerates. We predict FAS 131
is less influential in the treated firms in which businesses are more concentrated in a segment.
To illustrate the intuition, consider two conglomerates which have the same business types of
segments but differ in their internal capital allocation. Specifically, the first firm allocates 99%
of capital to one segment while the other firm distributes evenly to all segments. If both firms
report combined segment information before FAS 131, the investors would find FAS 131
improve the reporting quality of the second firm more substantially because the first firm’s
combined report already discloses its dominant segment’s information quite closely (i.e., the
small segment’s information is not material). Further, in the first firm, HQEXs will give more
attention to the dominant segment and reduce the potential information asymmetry against its
DM. Even though the small segment’s DM has private information, the associated stock
mispricing would be small in proportion to the segment’s relative size within a firm. From these
insights, we examine whether DMs’ share purchases will increase more after FAS 131 as its
capital allocation is more dispersed across segments.
In each firm year, we measure the concentration of resource allocations across segments by
Herfindahl-Hirschman Index (HHI) of segments’ net sales: for firm i and year t,
𝐻𝐻𝐼𝑖,𝑡 = ∑ 𝑠𝑘,{𝑖,𝑡}
2
𝐾
𝑘=1
, (4)
where 𝑠𝑘,{𝑖,𝑡} =Net sales of segment k of the firm year
Total net sales of all segments of the firm year and K is the total number of reported
segments of the firm year.
Higher HHI implies more business concentration among segments. The treated firms, which
report more business segments after FAS 131, are more likely to exhibit decreases in the HHI
after FAS 131 than control firms (77% vs. 32%). As discussed above, FAS 131 may not be
influential in the treated firms in which HHI rises after its adoption because the increase in HHI
implies that the business becomes focused even more than offsetting the effect of the increased
number of reported segments. We thus test whether the DMs’ purchases increase more in the
treated firms in which HHI decreases after the adoption of FAS 131. HHI in the pre-FAS 131

21
(post-FAS 131) period is calculated in 1997 (as an average of 1999 and 2000), to be consistent
with the definition of treated firms.
[Insert Table 9 here]
Table 9, Panel A (Panel B), presents the estimation results of the subsample firms in which
HHI (does not) decreases after the adoption of FAS 131. In each panel, we estimate the
difference-in-differences models presented in Table 3. Panel A, column (1), shows that DMs of
treated firms become more likely to purchase shares after the adoption of FAS 131 than those
of control firms. All else being equal, the difference in probability of DMs’ purchases between
the two groups increases by 6.7%, which is significant at 5% level. Columns (2) and (3) present
that this difference in changes is almost entirely driven by DMs’ non-cluster purchases.
Likewise, columns (4)–(6) show that the dollar amounts of DMs’ purchases of treated firms, in
particular, non-cluster purchases, increase more than those of control firms in this subsample.
Panel B shows that the two groups do not exhibit a significant difference in the changes of
DMs’ purchases in the subsample in which HHI does not decrease after the adoption of FAS
131. The magnitude of coefficient estimates of FAS131 × Treat is also much smaller than those
in Panel A above. Overall, our results confirm that FAS 131 is less effective and, thus, increases
DMs’ purchases less in the conglomerates in which the businesses are more focused.
6.3. The role of institutional investors
Finally, we examine the management disciplinary role of institutional investors in the
circumstance in which firms may suffer internal information asymmetry. Previous studies show
that institutional investors have strong incentives and capacity to monitor managerial
performance (e.g., Shleifer and Vishny 1986, Chung et al. 2002, Hartzell and Starks 2003, Desai
and Dharmapala 2009, Kang et al. 2018). Institutional investors can put pressure on management
and board of directors to enhance the internal corporate governance structure including the
information sharing between headquarters and divisions. Further, institutional investors can
reduce informed trading opportunities of insiders by obtaining firm information quickly and
trading shares efficiently.
[Insert Table 10 here]

22
Table 10 presents how the effect of FAS 131 on DM’s informed trading is associated with
institutional ownership of a firm. Using subsamples sorted by institutional ownership, we
estimate the difference-in-differences model in which the dependent variable is an indicator of
DMs’ non-cluster purchases (i.e. 1 if the firm year has DMs’ non-cluster purchases and 0,
otherwise).6 The explanatory variables are the same as those in Table 3. Column (1) shows that,
in the subsample of firm-years in which the total institutional investors hold less than 50% of
total outstanding shares, treatment conglomerates exhibit significantly larger increases in DM’s
non-cluster purchases after FAS 131 than control firms do. The difference-in-difference
coefficient estimate is 7.2% which is statistically significant at 1% level. Column (2) shows that,
in the other subsample in which institutional investors hold more than or equal to 50% of total
outstanding shares, the two groups do not significantly differ in the changes of DMs’ non-cluster
purchases after FAS 131. In columns (3) and (4), we define each subsample as the firm-years in
which institutional ownership is below and above (or equal to) the sample median, respectively.
The significantly larger increase in DMs’ non-cluster purchases of treatment conglomerates is
only observed in the subsample in which institutional ownership is below the sample median.
Overall, our findings show that institutional investors restrain the DMs’ informed trading after
FAS 131.
[Insert Table 11 here]
Table 11 reports how the segment reporting improvement under FAS 131 is influenced by
institutional ownership. We estimate the difference-in-differences model of FERC using
subsamples sorted by institutional ownership and DMs’ non-cluster purchases. Column (1)
show that, in the subsample in which institutional ownership is less than 50%, treatment and
control firms do not differ in the changes of FERC after FAS131. The difference-in-differences
estimate is 0.119, which is statistically insignificant. Treatment firms, however, exhibit
substantial reporting quality improvement relative to control firms in the other subsample in
which institutional investors hold more than or equal to 50% of outstanding shares. In column
(2), the difference-in-differences coefficient estimate is 1.746, which is statistically significant
at 10% level. Columns (3) and (4) present the estimation results for the subsample in which
institutional ownership is below and above the sample median, respectively. The difference-in-
6 Institutional ownership is defined as the proportion of outstanding shares held by institutional investors at the end of the fiscal year.

23
differences coefficient estimates of FERC are larger in the above-median subsample though
both estimates are not statistically significant. The weaker result suggests that institutional
investors are able or incentivized to address the internal information asymmetry and put pressure
on management to implement mandatory accounting standards effectively only if they have
sufficiently large ownership.
7 Concluding Remarks
In this paper, we examine how insider trading is influenced by mandatory financial reporting in
the presence of information asymmetry between HQEX and DMs. Financial reporting prepared
by HQEXs may fail to disclose the divisional information that DMs do not share with HQEXs.
The stock market mispricing that occurs in response to the low quality reporting about divisions
could provide DMs with informed trading opportunities. Using a difference-in-differences
estimation method, we test whether DMs have more trading opportunities to exploit divisional
information uncaptured by HQEXs after the adoption of FAS 131, which enhances the
mandatory segment reporting of conglomerates.
Our key findings are summarized as follows: First, under FAS 131, treatment firms exhibit
larger increase in DMs’ purchases (i.e., informed trades), but not in their sales, than control
firms do. Next, the two groups of firms do not differ in the changes of HQEXs’ purchases,
suggesting that DMs’ increased purchases are driven by information uncaptured by HQEXs.
Third, DMs’ increased purchases are negatively associated with the reporting quality
improvement under FAS 131 and, furthermore, they are placed optimally before 10-K filings
dates. Fourth, FAS 131 is less associated with DMs’ purchases for the conglomerates in which
the businesses are more focused. Finally, institutional investors alleviate internal information
asymmetry and, thus, reduce informed trading opportunities of DMs.
The results provide several policy implications. First, our analysis sheds light on a new
economic channel through which IIA impairs the investor protection function of mandatory
financial reporting. Previous studies (e.g., Chen et al. 2018) shows that IIA lowers the financial
reporting quality. We find that, under IIA, the mandatory reporting would rather expand
informed trading opportunities of some insiders.
Next, our findings show that, to achieve the regulatory goals, mandatory accounting

24
standards must be accompanied with proper information sharing among corporate insiders.
While FAS 131 improves the segment reporting quality on average, it fails to do so in
conglomerates in which the segment information is not fully captured by the headquarters.
Extending Section 302 of the Sarbanes-Oxley Act of 2002, Securities and Exchange
Commission (SEC) may need to establish and maintain adequate internal controls for public
disclosure of segment reporting to minimize the trading opportunities of DMs.7
Finally, we show that institutional investors can complement mandatory financial reporting
by mitigating the internal information asymmetry and insiders’ informed trading opportunities.
We expect that the future research explores the role of organizational structures or other
governance mechanisms in addressing the internal information asymmetry for conglomerates.
7 The main purpose behind Section 302 of the Sarbanes-Oxley Act of 2002 is to ensure that CEOs and CFOs take a proactive role in their firms’ public disclosure and to give investors more confidence in the accuracy, quality and reliability of SEC periodic reports of their firms.

25
References
Aghion, Philippe, and Jean Tirole, 1997, Formal and Real Authority in Organizations,
Journal of Political Economy 105, 1–29.
Berger, Philip G., and Rebecca Hann, 2003, The Impact of SFAS No. 131 on Information and
Monitoring, Journal of Accounting Research 41, 163–223.
Berger, Philip G., and Eli Ofek, 1995, Diversification’s Effect on Firm Value, Journal of
Financial Economics 37, 39 – 65.
Botosan, Christine A., and Mary Stanford, 2005, Managers’ Motives to Withhold Segment
Disclosures and the Effect of SFAS No. 131 on Analysts’ Information Environment,
Accounting Review 80, 751–771.
Chen, Chen, Xiumin Martin, Sugata Roychowdhury, Xin Wang, and Matthew T. Billett, 2018,
Clarity Begins at Home: Internal Information Asymmetry and External Communication
Quality, Accounting Review 93, 71–101.
Cho, Young Jun, 2015, Segment Disclosure Transparency and Internal Capital Market
Efficiency: Evidence from SFAS No. 131, Journal of Accounting Research 53, 669–723.
Chung, Richard, Michael Firth, and Jeong-Bon Kim, 2002, Institutional Monitoring and
Opportunistic Earnings Management, Journal of Corporate Finance 8, 29 – 48.
Cohen, Lauren, Christopher Malloy, and Lukasz Pomorski, 2012, Decoding Inside Information,
Journal of Finance 67, 1009–1043.
Daniel, Kent, Mark Grinblatt, Sheridan Titman, and Russ Wermers, 1997, Measuring Mutual
Fund Performance with Characteristic-Based Benchmarks, Journal of Finance 52, 1035–
1058.
Desai, Mihir A., and Dhammika Dharmapala, 2009, Corporate Tax Avoidance and Firm Value,
Review of Economics and Statistics 91, 537–546.
Duchin, Ran, and Denis Sosyura, 2013, Divisional Managers and Internal Capital Markets,
Journal of Finance 68, 387–429.
Ettredge, Michael L., Soo Young Kwon, David B. Smith, and Paul A. Zarowin, 2005, The
Impact of SFAS No. 131 Business Segment Data on the Market’s Ability to Anticipate Future
Earnings, Accounting Review 80, 773–804.
Fama, Eugene F., and Michael C. Jensen, 1983, Separation of ownership and control, The
journal of law and Economics 26, 301–325.
Feng, Mei, Chan Li, and Sarah McVay, 2009, Internal Control and Management Guidance,
Journal of Accounting and Economics 48, 190–209.
Franco, Francesca, Oktay Urcan, and Florin P. Vasvari, 2016, Corporate Diversification and the

26
Cost of Debt: The Role of Segment Disclosures, Accounting Review 91, 1139– 1165.
Goldstein, Itay, and Liyan Yang, 2015, Information Diversity and Complementarities in Trading
and Information Acquisition, Journal of Finance 70, 1723–1765.
Graham, John R., Campbell R. Harvey, and Manju Puri, 2015, Capital Allocation and
Delegation of Decision-making Authority within Firms, Journal of Financial Economics 115,
449 – 470.
Harris, Milton, and Artur Raviv, 1996, The Capital Budgeting Process: Incentives and
Information, Journal of Finance 51, 1139–1174.
Hartzell, Jay C., and Laura T. Starks, 2003, Institutional Investors and Executive Compensation,
Journal of Finance 58, 2351–2374.
Herrmann, Don, and Wayne B. Thomas, 2000, An Analysis of Segment Disclosures under
SFAS No. 131 and SFAS No. 14, Accounting Horizons 14, 287–302.
Huddart, Steven J., and Bin Ke, 2007, Information Asymmetry and Cross-sectional Variation
in Insider Trading, Contemporary Accounting Research 24, 195–232.
Jayaraman, Sudarshan, and Joanna Shuang Wu, 2019, Is Silence Golden? Real Effects of
Mandatory Disclosure, Review of Financial Studies 32, 2225–2259.
Kang, Chang-Mo, Donghyun Kim, and Qinghai Wang, 2019, Cluster Trading of Corporate
Insiders, Working Paper.
Kang, Jun-Koo, Juan Luo, and Hyunseung Na, 2018, Are Institutional Investors with Multiple
Blockholdings Effective Monitors? Journal of Financial Economics 128, 576– 602.
Lakonishok, Josef, and Inmoo Lee, 2001, Are Insider Trades Informative? Review of Financial
Studies 14, 79–111.
Shleifer, Andrei, and Robert W. Vishny, 1986, Large Shareholders and Corporate Control,
Journal of Political Economy 94, 461–488.
Stein, Jeremy C., 2002, Information Production and Capital Allocation: Decentralized versus
Hierarchical Firms, Journal of Finance 57, 1891–1921.
Street, Donna L., Nancy B. Nichols, and Sidney J. Gray, 2000, Segment Disclosures under
SFAS No. 131: Has Business Segment Reporting Improved? Accounting Horizons 14, 259–
285.

27
Appendix: Definition of variables
This table presents the definition of variables.
Variable Definition
Log Size The natural log of market capital
Book-to-Market Book to Market ratio
Log Num Analysts Ln(1+number of analysts following)
Institutional Ownership Percentage of market capitalization held by institutional investors
DIFRET
the difference between the insider purchase profitability of managers of the
specific division and the average insider purchase profitability of headquarters
managers.
Et−1 prior period EPS (last year) scaled by the share price at the beginning of the current year
Et current period EPS (this year) scaled by the share price at the beginning of the
current year
Et+1 realized next period EPS (next year) scaled by the share price at the beginning of
the current year
Cluster purchases Share purchases that multiple insiders within a firm place on the same date or consecutive trading dates
Treat A dummy variable for the treatment group, which indicates whether reported
business segments increase after FAS 131
Post A dummy variable for Post-131 period, from the fiscal year-ends of December
1998

28
Table 1: Sample Selection
The table shows the sample selection process. The numbers in each row represent the number of firms
and the number of firm-year observation after the corresponding selection criteria are applied.
Number of Number of
Sample Selection Criteria Firms Firm-Years
Listed firms available from Compustat (1996-2001) 16,711 73,825
Return data available (CRSP) 11,847 48,866
Segment data available 10,046 40,229
December fiscal year end 6,832 26,447
Insider trading data available 5,668 21,798
Insider trading in the previous three years 5,564 21,172
At least one pre- and one post-131 insider trading 2,941 15,484
No acquisitions or divestitures during any year of the sample period 2,880 15,287
Sales and assets of segment data are matched with those of 10K filings 1,904 9,228

29
Table 2: Descriptive Statistics in the Pre- and Post-FAS 131 Periods
The table presents the descriptive statistics and segment classified status of sample firms. “Treated firms”
refers the firms whose number of segments has increased after FAS 131, and “Control firms” refers the
firms whose number of segments has been equal or decreased since FAS 131. Panel A shows the annual
mean and mean differences of firm characteristics and firm insider trading between “Treated firms” and
“Control firms”. All variables are defined at firm-year level. The detail of the variables is reported in the
appendix. Panel B presents a shift in segment reporting in accordance with FAS 131 for different groups
of firms sorted by number of segments. The table shows the number of firms corresponding to the
classification.
Panel A. Descriptive statistics
Pre-FAS 131 Period Post-FAS 131 Period
Treated
Firms
Control
Firms
Treated
Firms
Control
Firms (N=480) (N=1,424) (N=480) (N=1,424)
Mean Mean Mean Mean
Number of Segments 2.257 1.655 2.959 1.632 Log Size 5.760 5.131 5.800 5.205 Book-to-Market 0.617 0.542 0.892 0.789
1 year stock return 0.283 0.322 0.074 0.282
Institutional Ownership 0.398 0.331 0.437 0.375
Log Num Analysts 1.404 1.072 1.546 1.248 No. of Insider Trade 9.715 9.623 10.000 12.363
No. of Insider Purchase 3.282 3.371 4.998 5.036
Insider Trade Dummy 0.829 0.772 0.907 0.900 Insider Purchase Dummy 0.631 0.557 0.728 0.676
Div. Mangers Purchase Dummy 0.122 0.117 0.142 0.100
Div. Mangers Cluster Purchase Dummy 0.046 0.048 0.052 0.038
Div. Mangers Non-cluster Purchase Dummy 0.094 0.086 0.110 0.073 HQ. Executives’ Purchase Dummy 0.402 0.419 0.389 0.392
HQ. Executives’ Cluster Purchase Dummy 0.176 0.200 0.160 0.173
HQ. Executives’ Non-cluster Purchase Dummy 0.338 0.335 0.327 0.325
Panel B. Segment Classified Status
Post-131
Pre-131 No Change Increase Decrease
Single-segment 561 91 8 Multi-segment 315 258 18
2 Segments 166 115 8 3 Segments 99 78 5 4 Segments 35 42 3 5 Segments 15 23 2

30
Table 3: Pattern of Divisional Managers’ Share Purchases
The table presents results for dif-in-dif regressions to examine the impact of FAS 131 on the pattern of
divisional managers’ share purchases. Our total sample period is 6 years, the pre-131 period spans the
fiscal year-ends of December 1995 through November 1998, and post-131 period spans the fiscal year-
ends of December 1998 through November 2001. The pre-131 period for insider trading is April 1996
through March 1999 and post-131 period is April 1999 through March 2002. We do not include the firms
that merge other companies and whose fiscal year end is not December. The dependent variables are a
dummy for divisional managers’ insider purchases (column 1), a dummy for divisional managers’ insider
cluster purchases (column 2), a dummy for divisional managers’ insider non-cluster purchases (column
3), total value of divisional managers’ insider purchases (column 4), total value of divisional managers’
insider cluster purchases (column 5), and total value of divisional managers’ insider non-cluster
purchases (column 6). We aggregate trading at the firm and annual level. Cluster insider purchases are
defined as purchases placed by multiple insiders on the same day or consecutive trading days. Treat is a
dummy variable for the treatment group, which indicates whether reported business segments increases
after FAS 131. Post is a dummy variable for Post-131 period. See Appendix for variable definitions.
Firm- and year-fixed effects are included, and standard errors are clustered at the firm level. The t-
statistics are shown in parentheses. ***, **, and * represent significance at the 1%, 5%, and 10% levels,
respectively. (1) (2) (3) (4) (5) (6)
Dependent Variable Div.
Managers’ Div.
Managers’ Div.
Managers’ Div.
Managers’ Div.
Managers’ Div.
Managers’ Purchases Cluster NonCluster Purchases Cluster NonCluster Dummy Purchases Purchases Total Amount Purchases Purchases Dummy Dummy Total Amount Total Amount
Post × Treat 0.042** 0.003 0.049** 0.379* 0.013 0.439** (1.99) (0.25) (2.53) (1.80) (0.10) (2.27)
Log Size 0.014 0.003 0.012 0.143* 0.027 0.126* (1.63) (0.52) (1.53) (1.75) (0.53) (1.67)
Book-to-Market 0.006 0.000 0.007 0.032 -0.005 0.049 (0.62) (0.06) (0.75) (0.35) (-0.10) (0.55)
Log Num Analysts 0.006 0.012 -0.002 0.014 0.096 -0.050 (0.42) (1.25) (-0.13) (0.10) (1.11) (-0.38)
Institutional Ownership -0.078** -0.021 -0.072** -0.726** -0.192 -0.681** (-2.19) (-0.96) (-2.24) (-2.07) (-0.93) (-2.14)
Constant 0.076* 0.014 0.068* 0.777* 0.154 0.680* (1.78) (0.51) (1.75) (1.88) (0.62) (1.79)
Num. Obs. 8922 8922 8922 8922 8922 8922
Adj. R2 0.132 0.101 0.101 0.122 0.098 0.088
Fixed effects Firm & Year Firm & Year Firm & Year Firm & Year Firm & Year Firm & Year

31
Table 4: Pattern of Divisional Managers’ Share Sales
The table presents results for dif-in-dif regressions to examine the impact of FAS 131 on the pattern of
divisional managers’ insider sales. Our total sample period is 6 years, the pre-131 period spans the fiscal
year-ends of December 1995 through November 1998, and post-131 period spans the fiscal year-ends of
December 1998 through November 2001. The pre-131 period for insider trading is April 1996 through
March 1999 and post-131 period is April 1999 through March 2002. We do not include the firms that
merge other companies and whose fiscal year end is not December. The dependent variables are a dummy
for divisional managers’ insider sales (column 1), a dummy for divisional managers’ insider cluster sales
(column 2), a dummy for divisional managers’ insider non-cluster sales (column 3), total value of
divisional managers’ insider sales (column 4), total value of divisional managers’ insider cluster sales
(column 5), and total value of divisional managers’ insider non-cluster sales (column 6). We aggregate
trading at the firm and annual level. Cluster insider sales are defined as sales placed by multiple insiders
on the same day or consecutive trading days. Treat is a dummy variable for the treatment group, which
indicates whether reported business segments increases after FAS 131. Post is a dummy variable for
Post-131 period. Other control variables are available in Appendix. Firm- and year-fixed effects are
included, and standard errors are clustered at the firm level. The t-statistics are shown in parentheses.
***, **, and * represent significance at the 1%, 5%, and 10% levels, respectively.
(1) (2) (3) (4) (5) (6)
Dependent Variable Div.
Managers’ Div.
Managers’ Div.
Managers’ Div.
Managers’ Div.
Managers’ Div.
Managers’ Sales Cluster NonCluster Sales Cluster NonCluster
Dummy Sales Sales Total Amount Sales Sales
Dummy Dummy
Total Amount Total Amount
Post × Treat 0.027 0.004 0.024 0.257 0.013 0.241
(1.12) (0.23) (0.99) (0.88) (0.05) (0.87)
Log Size 0.028 0.012 0.028 0.400 0.171 0.386
(1.50) (0.82) (1.66) (1.56) (0.87) (1.70)
Book-to-Market -0.018** -0.013 -0.011* -0.182* -0.158 -0.095
(-2.64) (-1.75) (-2.07) (-2.15) (-1.74) (-1.56)
Log Num Analysts -0.021 -0.019 -0.017 -0.327* -0.255* -0.253
(-1.65) (-1.81) (-1.03) (-2.10) (-2.04) (-1.09)
Institutional Ownership 0.252*** 0.264*** 0.206*** 3.789*** 3.592*** 2.911***
(5.22) (4.42) (4.56) (5.68) (4.76) (5.06)
Constant 0.104 0.022 0.059 0.881 0.125 0.401
(0.91) (0.21) (0.63) (0.56) (0.09) (0.33)
Num. Obs. 8922 8922 8922 8922 8922 8922
Adj. R2 0.255 0.197 0.219 0.279 0.211 0.236
Fixed effects Firm & Year Firm & Year Firm & Year Firm & Year Firm & Year Firm & Year
32
Table 5: Pattern of Headquarters Executives’ Share Purchases
The table presents placebo test results for dif-in-dif regressions to examine the impact of FAS 131 on the pattern
of headquarters executives’ insider purchases. Our total sample period is 6 years, the pre-131 period spans the fiscal
year-ends of December 1995 through November 1998, and post-131 period spans the fiscal year-ends of December
1998 through November 2001. The pre-131 period for insider trading is April 1996 through March 1999 and post-
131 period is April 1999 through March 2002. We do not include the firms that merge other companies and whose
fiscal year end is not December. The dependent variables are a dummy for headquarters executives’ insider
purchases (column 1), a dummy for headquarters executives’ insider cluster purchases (column 2), a dummy for
headquarters executives’ insider non-cluster purchases (column 3), total value of headquarters executives’ insider
purchases (column 4), total value of headquarters executives’ insider cluster purchases (column 5), and total value
of headquarters executives’ insider non-cluster purchases (column 6). We aggregate trading at the firm and annual
level. Cluster insider purchases are defined as purchases placed by multiple insiders on the same day or consecutive
trading days. Treat is a dummy variable for the treatment group, which indicates whether reported business
segments increases after FAS 131. Post is a dummy variable for Post-131 period. See Appendix for variable
definitions. Firm- and year-fixed effects are included, and standard errors are clustered at the firm level. The t-
statistics are shown in parentheses. ***, **, and * represent significance at the 1%, 5%, and 10% levels,
respectively.
(1) (2) (3) (4) (5) (6)
Dependent Variable Headquarters Executives’
Headquarters Executives’
Headquarters Executives’
Headquarters Executives’
Headquarters Executives’
Headquarters Executives’
Purchases Cluster NonCluster Purchases Cluster NonCluster
Dummy Purchases Purchases Total Amount Purchases Purchases
Dummy Dummy
Total Amount Total Amount
Post × Treat 0.011 -0.002 0.003 0.109 -0.046 0.048
(0.36) (-0.10) (0.09) (0.31) (-0.18) (0.14)
Log Size 0.001 0.008 -0.004 0.131 0.119 0.073
(0.05) (0.75) (-0.31) (0.92) (1.14) (0.53)
Book-to-Market 0.006 -0.000 0.005 0.106 0.008 0.099
(0.46) (-0.02) (0.35) (0.70) (0.07) (0.67)
Log Num Analysts 0.034 0.031* 0.021 0.342 0.324* 0.183
(1.63) (1.82) (1.07) (1.46) (1.78) (0.82)
Institutional Ownership -0.160*** -0.109** -0.118** -1.789** -1.083** -1.319**
(-2.60) (-2.47) (-2.13) (-2.57) (-2.33) (-2.09)
Constant 0.347*** 0.092* 0.316*** 3.173*** 0.726 2.865***
(5.53) (1.89) (5.17) (4.57) (1.45) (4.27)
Num. Obs. 8922 8922 8922 8922 8922 8922
Adj. R2 0.219 0.166 0.193 0.212 0.164 0.186
Fixed effects Firm & Year Firm & Year Firm & Year Firm & Year Firm & Year Firm & Year

33
Table 6: Profit of Divisional Managers’ and Headquarters Executives’ Share Purchases
The table presents results for dif-in-dif regressions to examine the impact of FAS 131 on the profit of
divisional managers’ and headquarters executives’ insider purchases. Our total sample period is 6 years,
the pre-131 period spans the fiscal year-ends of December 1995 through November 1998, and post-131
period spans the fiscal year-ends of December 1998 through November 2001. The pre-131 period for
insider trading is April 1996 through March 1999 and post-131 period is April 1999 through March 2002.
We do not include the firms that merge other companies and whose fiscal year end is not December. The
dependent variables are annual mean return of divisional managers’ insider purchases (column 1), mean
return of divisional managers’ insider cluster purchases (column 2), mean return of divisional managers’
insider non-cluster purchases (column 3), mean return of divisional managers’ insider opportunistic
purchases (column 4), mean return of headquarters executives’ insider purchases (column 5), mean return
of headquarters executives’ insider cluster purchases (column 6), mean return of headquarters
executives’ insider non-cluster purchases (column 7), and the difference between the insider purchase
profitability of divisional managers and headquarters managers (column 8). We average the trading
profits at the firm and annual level. (For column 8, we average the trading profits at the firm and pre-and
post-period level.) Insider purchase return is measured by the DGTW adjusted return over 6 months from
the trading day. Cluster insider purchases are defined as purchases placed by multiple insiders on the
same day or consecutive trading days. Opportunistic insider trading is defined following Cohen et al.
(2012). Treat is a dummy variable for the treatment group, which indicates whether reported business
segments increase after FAS 131. Post is a dummy variable for Post-131 period. Year-fixed effect is
included, and standard errors are clustered at the firm level. The t-statistics are shown in parentheses.
***, **, and * represent significance at the 1%, 5%, and 10% levels, respectively.
(1) (2) (3) (4) (5) (6) (7) (8)
Dependent Return of Return of Return of Return of Return of Return of Return of DIFRET
Variable Div.
Managers’ Div.
Managers’ Div.
Managers’ Div.
Managers’ HQ.
Executives’ HQ
Executives’ HQ
Executives’
Purchases Cluster NonCluster Opportunistic Purchases Cluster NonCluster
Purchases Purchases Purchases Purchases Purchases
Treat 0.028 0.083 0.003 -0.073 -0.002 -0.084* 0.036 0.099 (0.45) (0.76) (0.04) (-0.62) (-0.07) (-1.94) (1.11) (1.04)
Post × Treat -0.094 -0.246* -0.050 0.088 -0.010 0.033 -0.043 0.044 (-1.08) (-1.69) (-0.48) (0.58) (-0.20) (0.37) (-0.80) (0.43)
Constant 0.086*** 0.102*** 0.076** 0.095** 0.089*** 0.128*** 0.066*** -0.072** (3.34) (2.76) (2.42) (2.54) (6.23) (5.36) (4.48) (-1.99)
Num. Obs. 857 327 642 247 3054 1310 2482 545
Adj. R2 0.005 0.019 0.001 0.000 0.007 0.007 0.008 0.009
Fixed effects Year Year Year Year Year Year Year Period

34
Table 7: Forward Earnings Response Coefficient (FERC)
The table presents results for dif-in-dif regressions to examine the impact of FAS 131 on stock price
informativeness. Following Ettredge et al. (2005), we measure stock price informativeness about the
firms’ earnings by the following regression:
𝑅𝑡 = 𝑎 + 𝑏0𝐸𝑡−1 + 𝑏1𝐸𝑡 + 𝑏2𝐸𝑡+1 + 𝑏3𝑅𝑡+1 + 𝜀𝑡 ,
where Et−1is prior period EPS scaled by price, Et is current period EPS scaled by price, Et+1is realized
next period EPS scaled by price. b2 is the forward earnings response coefficient (FERC), which proxies
for informativeness. Our total sample period is 6 years, the pre-131 period spans the fiscal year-ends of
December 1995 through November 1998, and post-131 period spans the fiscal year-ends of December
1998 through November 2001. The pre-131 period for insider trading is April 1996 through March 1999
and post-131 period is April 1999 through March 2002. We do not include the firms that merge other
companies and whose fiscal year end is not December. The samples for each model are a full sample
(column 1), the firms without divisional managers’ purchases after FAS131 (column 2), the firms with
divisional managers’ purchases after FAS131 (column 3), and the firms with divisional managers’ non-
cluster purchases after FAS131 (column 4). Cluster insider purchases are defined as purchases placed by
multiple insiders on the same day or consecutive trading days. Treat is a dummy variable for the
treatment group, which indicates whether reported business segments increases after FAS 131. Post is a
dummy variable for Post-131 period. See Appendix for variable definitions. See Appendix for variable
definitions. The t-statistics are shown in parentheses. ***, **, and * represent significance at the 1%,
5%, and 10% levels, respectively.

35
(1) (2) (3) (4)
Sample Full Firms without Firms with Firms with Div. managers’ Div. managers’ Div. managers’ Purchases Purchases Noncluster after FAS131 after FAS131 Purchases after FAS131
E t-1 -0.150 -0.146 -0.331 -0.400 (-1.60) (-1.45) (-1.11) (-1.24)
E t 0.054 0.234** 0.040 -0.001 (0.79) (2.01) (0.60) (-0.02)
E t+1 0.941*** 1.121*** 0.321 0.541** (6.30) (6.24) (1.47) (2.20)
R t+1 -0.006 -0.002 -0.042 -0.042 (-0.42) (-0.10) (-1.14) (-1.00)
Post 0.239*** 0.252*** 0.176** 0.130 (5.71) (5.31) (2.30) (1.56)
Post×E t-1 -0.675*** -0.635*** -1.210*** -1.083*** (-5.80) (-5.04) (-3.51) (-2.77)
Post×E t -0.288** -0.513*** 1.086*** 1.038** (-2.45) (-3.31) (3.30) (2.42)
Post×E t+1 -0.384** -0.579*** 0.165 -0.305 (-2.14) (-2.72) (0.54) (-0.82)
Post×R t+1 -0.591*** -0.623*** -0.379*** -0.417*** (-13.87) (-12.59) (-5.07) (-4.51)
Post×Treat -0.109 -0.152 0.129 0.213 (-1.31) (-1.58) (0.93) (1.42)
Post×Treat×E t-1 0.200 0.124 0.964 0.825 (1.07) (0.61) (1.60) (1.31)
Post×Treat×E t -0.060 0.201 -2.355** -2.262** (-0.22) (0.66) (-2.47) (-2.24)
Post×Treat×E t+1 0.408* 0.610** -0.287 0.258 (1.74) (2.29) (-0.29) (0.25)
Post×Treat×R t+1 0.019 -0.023 -0.153 -0.164 (0.20) (-0.20) (-1.03) (-1.00)
Treat -0.024 -0.016 -0.077 -0.055 (-0.41) (-0.23) (-0.77) (-0.51)
Treat ×E t-1 0.146 0.143 0.294 0.370 (1.56) (1.42) (0.69) (0.83)
Treat ×E t 0.292 0.076 0.617 0.575 (1.15) (0.26) (0.81) (0.75)
Treat ×E t+1 -0.966*** -1.153*** 1.169 0.822 (-4.55) (-4.80) (1.32) (0.90)
Treat ×R t+1 -0.011 -0.009 -0.020 -0.024 (-0.30) (-0.21) (-0.27) (-0.31)
Constant 0.227*** 0.230*** 0.199*** 0.180*** (7.63) (6.82) (3.54) (2.95)
Num. Obs. 6241 5218 1023 850
Adj. R2 0.082 0.081 0.139 0.125

36
Table 8: 10K Filings and Insider Purchases
In this table, we examine the impact of FAS 131 on the pattern of divisional managers’ and headquarters
executives’ insider purchases before 10K filing dates but after earnings announcement dates. The dif-in-
dif regression results for divisional managers’ insider purchases is displayed in panel A and those for
headquarters executives’ insider purchases is presented in panel B. The pre-131 period for 10K filing is
fiscal year of 1996 through 1998 and post-131 period is fiscal year of 1999 through 2001. We do not
include the firms that merge other companies and whose fiscal year end is not December. The dependent
variables are a dummy for insider purchases (column 1), a dummy for insider cluster purchases (column
2), a dummy for insider non-cluster purchases (column 3), total value of insider purchases (column 4),
total value of insider cluster purchases (column 5), and total value of insider non-cluster purchases
(column 6). We aggregate trading at the firm and annual level. Cluster insider purchases are defined as
purchases placed by multiple insiders on the same day or consecutive trading days. We aggregate trading
at the firm and annual level. Treat is a dummy variable for the treatment group, which indicates whether
reported business segments increases after FAS 131. Post is a dummy variable for Post-131 period. See
Appendix for variable definitions. Firm- and year-fixed effects are included, and standard errors are
clustered at the firm level. The t-statistics are shown in parentheses. ***, **, and * represent significance
at the 1%, 5%, and 10% levels, respectively.
Panel A. divisional managers’ purchases after earnings announcement and before 10K Filings (1) (2) (3) (4) (5) (6)
Dependent Div. Managers’ Div. Managers’ Div. Managers’ Div. Managers’ Div. Managers’ Div. Managers’
Variable Purchases Cluster NonCluster Purchases Cluster NonCluster Dummy Purchases Purchases Total Amount Purchases Purchases Dummy Dummy Total Amount Total Amount
Post×Treat 0.022** 0.005 0.019** 0.214** 0.039 0.188** (2.40) (0.97) (2.37) (2.32) (0.81) (2.30)
Log Size 0.009** 0.002 0.007** 0.078** 0.017 0.060* (2.31) (0.73) (2.24) (2.05) (0.69) (1.96)
Book-to-Market 0.003 -0.002 0.005 0.025 -0.017 0.039 (0.72) (-0.82) (1.16) (0.60) (-0.86) (1.04)
Log Num -0.007 0.003 -0.011* -0.077 0.020 -0.104*
Analysts (-1.01) (0.75) (-1.84) (-1.20) (0.63) (-1.85)
Institutional 0.005 0.003 0.008 0.087 0.031 0.110
Ownership (0.26) (0.33) (0.57) (0.51) (0.34) (0.76)
Constant -0.018 -0.009 -0.008 -0.132 -0.071 -0.048 (-0.99) (-0.67) (-0.56) (-0.75) (-0.58) (-0.34)
Num. Obs. 8922 8922 8922 8922 8922 8922
Adj. R2 0.027 0.039 0.002 0.019 0.031 -0.003
Fixed effects Firm & Year Firm & Year Firm & Year Firm & Year Firm & Year Firm & Year
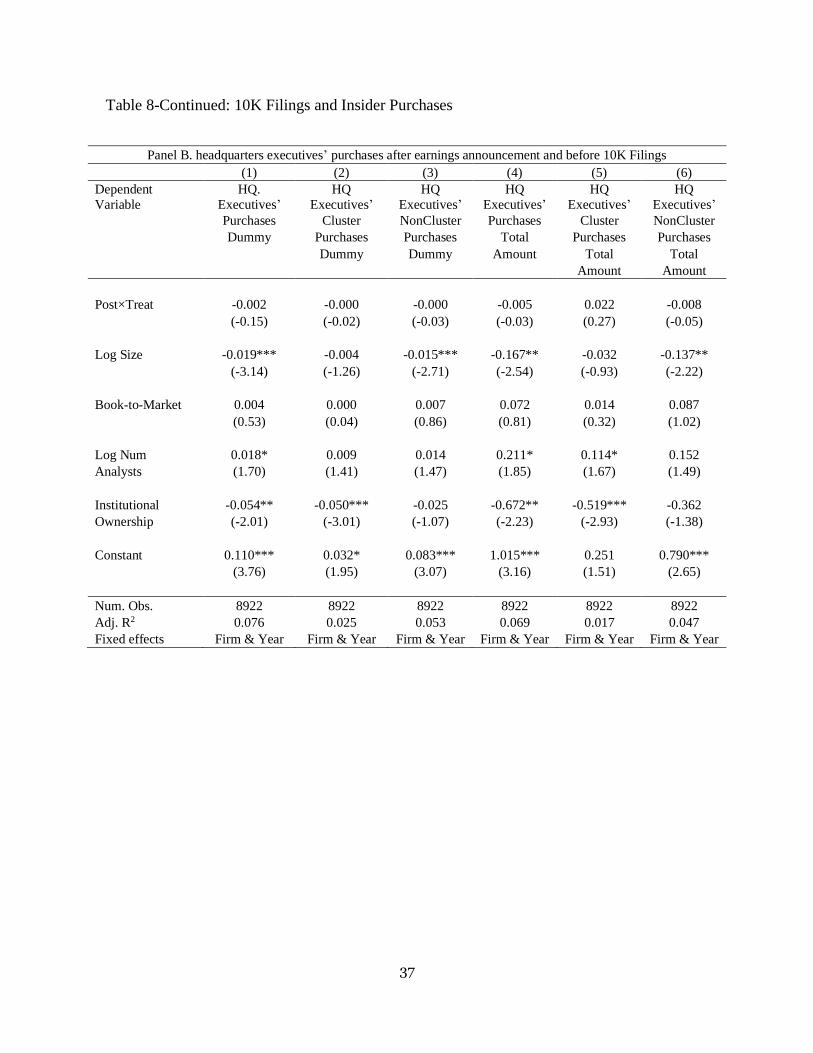
37
Table 8-Continued: 10K Filings and Insider Purchases
Panel B. headquarters executives’ purchases after earnings announcement and before 10K Filings (1) (2) (3) (4) (5) (6)
Dependent
Variable
HQ.
Executives’
HQ
Executives’
HQ
Executives’
HQ
Executives’
HQ
Executives’
HQ
Executives’ Purchases Cluster NonCluster Purchases Cluster NonCluster Dummy Purchases Purchases Total Purchases Purchases
Dummy Dummy Amount Total Total Amount Amount
Post×Treat -0.002 -0.000 -0.000 -0.005 0.022 -0.008 (-0.15) (-0.02) (-0.03) (-0.03) (0.27) (-0.05)
Log Size -0.019*** -0.004 -0.015*** -0.167** -0.032 -0.137** (-3.14) (-1.26) (-2.71) (-2.54) (-0.93) (-2.22)
Book-to-Market 0.004 0.000 0.007 0.072 0.014 0.087 (0.53) (0.04) (0.86) (0.81) (0.32) (1.02)
Log Num 0.018* 0.009 0.014 0.211* 0.114* 0.152
Analysts (1.70) (1.41) (1.47) (1.85) (1.67) (1.49)
Institutional -0.054** -0.050*** -0.025 -0.672** -0.519*** -0.362
Ownership (-2.01) (-3.01) (-1.07) (-2.23) (-2.93) (-1.38)
Constant 0.110*** 0.032* 0.083*** 1.015*** 0.251 0.790*** (3.76) (1.95) (3.07) (3.16) (1.51) (2.65)
Num. Obs. 8922 8922 8922 8922 8922 8922
Adj. R2 0.076 0.025 0.053 0.069 0.017 0.047
Fixed effects Firm & Year Firm & Year Firm & Year Firm & Year Firm & Year Firm & Year

38
Table 9: Sales Concentration Changes and Divisional Managers’ Purchases
This table shows a sub-sample analysis to examine the heterogeneous effect of FAS 131 on the pattern
of divisional managers’ insider purchases conditional on sales concentration changes among business
segments. The sales concentration is measured by Herfindahl-Hirschman Index (HHI) of segment sales.
Panel A presents the results of a subsample of firms whose sales concentration fall after FAS131 and
Panel B shows the results of the other firms. We do not include the firms that merge other companies
and whose fiscal year end is not December. The dependent variables are a dummy for divisional
managers’ insider purchases (column 1), a dummy for divisional managers’ insider cluster purchases
(column 2), a dummy for divisional managers’ insider non-cluster purchases (column 3), total value of
divisional managers’ insider purchases (column 4), total value of divisional managers’ insider cluster
purchases (column 5), and total value of divisional managers’ insider non-cluster purchases (column 6).
We aggregate trading at the firm and annual level. Cluster insider purchases are defined as purchases
placed by multiple insiders on the same day or consecutive trading days. Treat is a dummy variable for
the treatment group, which indicates whether reported business segments increases after FAS 131. Post
is a dummy variable for Post-131 period. See Appendix for variable definitions. Firm- and year-fixed
effects are included, and standard errors are clustered at the firm level. The t-statistics are shown in
parentheses. ***, **, and * represent significance at the 1%, 5%, and 10% levels, respectively.
Panel A. Subsample of Firms with Decreased Sales Concentration after FAS131 (1) (2) (3) (4) (5) (6)
Dependent Div. Managers’ Div. Managers’ Div. Managers’ Div. Managers’ Div. Managers’ Div. Managers’
Variable Purchases Cluster NonCluster Purchases Cluster NonCluster Dummy Purchases Purchases Total Amount Purchases Purchases Dummy Dummy Total Amount Total Amount
Post×Treat 0.067** 0.009 0.068*** 0.581** 0.043 0.600** (2.39) (0.48) (2.62) (2.09) (0.25) (2.33)
Log Size 0.013 0.009 0.006 0.139 0.087 0.081 (0.93) (1.01) (0.49) (1.02) (1.00) (0.64)
Book-to-Market -0.006 0.001 -0.005 -0.082 0.006 -0.080 (-0.36) (0.07) (-0.34) (-0.58) (0.07) (-0.61)
Log Num Analysts -0.004 0.006 -0.006 -0.099 0.035 -0.108 (-0.19) (0.41) (-0.31) (-0.43) (0.25) (-0.52)
Institutional -0.018 0.012 -0.033 -0.131 0.123 -0.303
Ownership (-0.30) (0.34) (-0.57) (-0.21) (0.37) (-0.54)
Constant 0.086 -0.016 0.105 0.868 -0.153 1.039* (1.25) (-0.34) (1.62) (1.28) (-0.35) (1.66)
Num. Obs. 3565 3565 3565 3565 3565 3565
Adj. R2 0.107 0.069 0.081 0.109 0.080 0.076
Fixed effects Firm & Year Firm & Year Firm & Year Firm & Year Firm & Year Firm & Year
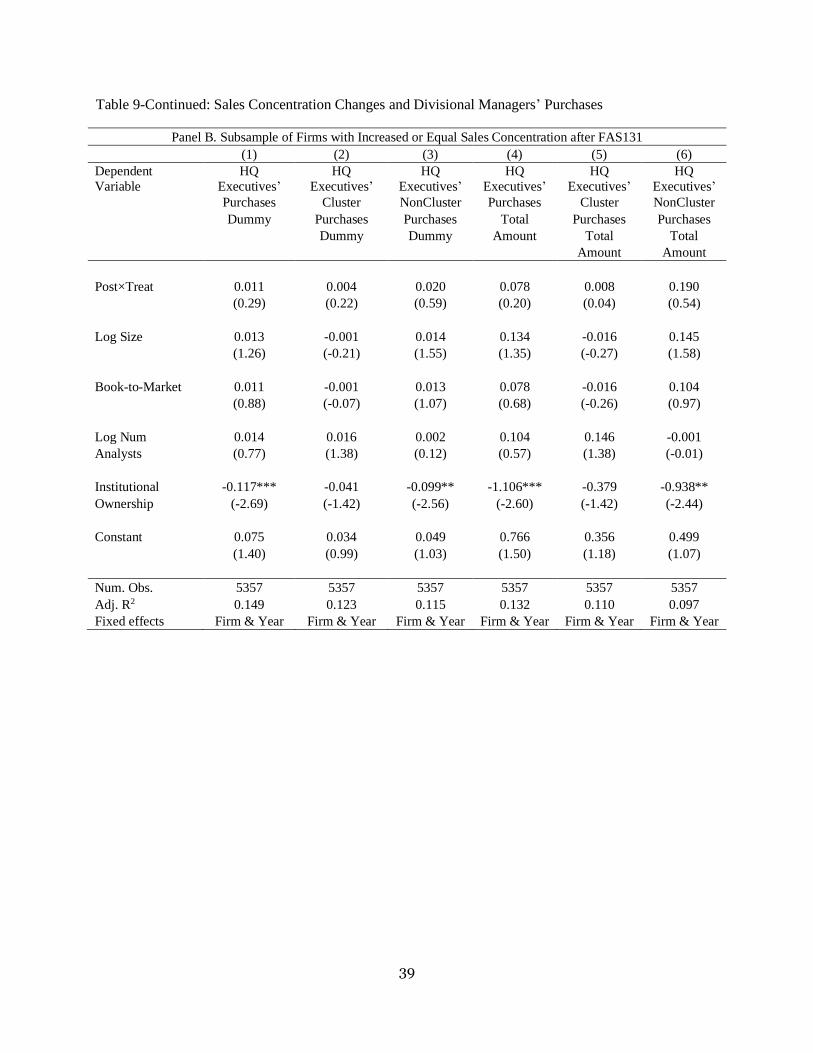
39
Table 9-Continued: Sales Concentration Changes and Divisional Managers’ Purchases
Panel B. Subsample of Firms with Increased or Equal Sales Concentration after FAS131 (1) (2) (3) (4) (5) (6)
Dependent
Variable
HQ
Executives’
HQ
Executives’
HQ
Executives’
HQ
Executives’
HQ
Executives’
HQ
Executives’ Purchases Cluster NonCluster Purchases Cluster NonCluster Dummy Purchases Purchases Total Purchases Purchases
Dummy Dummy Amount Total Total Amount Amount
Post×Treat 0.011 0.004 0.020 0.078 0.008 0.190 (0.29) (0.22) (0.59) (0.20) (0.04) (0.54)
Log Size 0.013 -0.001 0.014 0.134 -0.016 0.145 (1.26) (-0.21) (1.55) (1.35) (-0.27) (1.58)
Book-to-Market 0.011 -0.001 0.013 0.078 -0.016 0.104 (0.88) (-0.07) (1.07) (0.68) (-0.26) (0.97)
Log Num 0.014 0.016 0.002 0.104 0.146 -0.001
Analysts (0.77) (1.38) (0.12) (0.57) (1.38) (-0.01)
Institutional -0.117*** -0.041 -0.099** -1.106*** -0.379 -0.938**
Ownership (-2.69) (-1.42) (-2.56) (-2.60) (-1.42) (-2.44)
Constant 0.075 0.034 0.049 0.766 0.356 0.499 (1.40) (0.99) (1.03) (1.50) (1.18) (1.07)
Num. Obs. 5357 5357 5357 5357 5357 5357
Adj. R2 0.149 0.123 0.115 0.132 0.110 0.097
Fixed effects Firm & Year Firm & Year Firm & Year Firm & Year Firm & Year Firm & Year

40
Table 10: Institutional Ownership and Divisional Managers’ Purchases
This table shows a sub-sample analysis to examine the heterogeneous effect of FAS 131 on the pattern
of divisional managers’ insider purchases by institutional ownership. Firms are divided using majority
(50% of institutional ownership) as the threshold in columns 1-2 and the median of institutional
ownership as the threshold in columns 3-4. The pre-131 period for insider trading is April 1996 through
March 1999 and post-131 period is April 1999 through March 2002. We do not include the firms that
merge other companies and whose fiscal year end is not December. The samples for each model are the
firms with institutional ownership less than the threshold (column 1 and 3) and the firms with institutional
ownership more than the threshold (column 2 and 4). The dependent variables are a dummy for divisional
managers’ insider non-cluster purchases. Cluster insider purchases are defined as purchases placed by
multiple insiders on the same day or consecutive trading days. We aggregate trading at the firm and
annual level. Treat is a dummy variable for the treatment group, which indicates whether reported
business segments increase after FAS 131. Post is a dummy variable for Post-131 period. See Appendix
for variable definitions. Firm- and year-fixed effects are included, and standard errors are clustered at
the firm level. The t-statistics are shown in parentheses. ***, **, and * represent significance at the 1%,
5%, and 10% levels, respectively.
(1) (2) (3) (4)
Sample Inst. Own. Inst. Own. Inst. Own. Inst. Own. < 50% ≥ 50% < Median ≥ Median
Post×Treat 0.072*** -0.015 0.064** 0.033 (2.88) (-0.39) (2.05) (1.19)
Log Size 0.006 0.033* 0.023* 0.013 (0.66) (1.74) (1.94) (0.85)
Book-to-Market 0.002 0.028 0.011 0.007 (0.17) (1.11) (0.83) (0.34)
Log Num Analysts 0.011 -0.050 0.018 -0.030 (0.72) (-1.51) (0.93) (-1.26)
Institutional -0.034 -0.071 -0.143 -0.064
Ownership (-0.42) (-1.23) (-1.17) (-1.44)
Constant 0.066 0.033 -0.002 0.119 (1.49) (0.28) (-0.03) (1.35)
Num. Obs. 6179 2743 4422 4500
Adj. R2 0.114 0.066 0.129 0.119
Fixed effects Firm &
Year
Firm &
Year
Firm &
Year
Firm &
Year

41
Table 11: Institutional Ownership and FERC
This table shows a sub-sample analysis to examine the heterogeneous effect of FAS 131 on stock price
informativeness by institutional ownership. Firms are divided using (50% of institutional ownership) as
the threshold in columns 1-2 and the median of institutional ownership as the threshold in columns 3-4.
The forward earnings response coefficient (FERC) proxies for stock price informativeness. The pre-131
period for insider trading is April 1996 through March 1999 and post-131 period is April 1999 through
March 2002. We do not include the firms that merge other companies and whose fiscal year end is not
December. The samples for each model are the firms with institutional ownership less than the threshold
(column 1 and 3) and the firms with institutional ownership more than the threshold (column 2 and 4).
Cluster insider purchases are defined as purchases placed by multiple insiders on the same day or
consecutive trading days. Treat is a dummy variable for the treatment group, which indicates whether
reported business segments increases after FAS 131. Post is a dummy variable for Post-131 period. See
Appendix for variable definitions. The t-statistics are shown in parentheses. ***, **, and * represent
significance at the 1%, 5%, and 10% levels, respectively.
(1) (2) (3) (4)
Sample Inst. Own. Inst. Own. Inst. Own. Inst. Own.
< 50% ≥ 50% < Median ≥ Median
Post×Treat×Et−1 0.444 -0.010 0.613 -0.655
(1.32) (-0.01) (1.39) (-1.10)
Post×Treat×Et 0.334 -0.715 0.315 0.919
(0.57) (-0.51) (0.35) (1.20)
Post×Treat×Et+1 0.119 1.746* 0.352 0.806
(0.19) (1.82) (0.46) (1.22)
Post×Treat×Rt+1 0.146 0.239 0.056 0.215
(0.93) (1.21) (0.27) (1.50)
Num. Obs. 2971 1379 2175 2175
Adj. R2 0.099 0.142 0.100 0.106

42
Table A1: Institutional Ownership and Headquarters Executives’ Purchases
This table shows a sub-sample analysis to examine the heterogeneous effect of FAS 131 on the pattern
of headquarters executives’ insider purchases by institutional ownership. Firms are divided using
majority (50% of institutional ownership) as the threshold in columns 1-2 and the median of institutional
ownership as the threshold in columns 3-4. The pre-131 period for insider trading is April 1996 through
March 1999 and post-131 period is April 1999 through March 2002. We do not include the firms that
merge other companies and whose fiscal year end is not December. The samples for each model are the
firms with institutional ownership less than the threshold (column 1 and 3) and the firms with institutional
ownership more than the threshold (column 2 and 4). The dependent variables is a dummy for
headquarters executives’ insider non-cluster purchases. Cluster insider purchases are defined as
purchases placed by multiple insiders on the same day or consecutive trading days. We aggregate trading
at the firm and annual level. Treat is a dummy variable for the treatment group, which indicates whether
reported business segments increase after FAS 131. Post is a dummy variable for Post-131 period. See
Appendix for variable definitions. Firm- and year-fixed effects are included, and standard errors are
clustered at the firm level. The t-statistics are shown in parentheses. ***, **, and * represent significance
at the 1%, 5%, and 10% levels, respectively.
(1) (2) (3) (4)
Sample Inst. Own. Inst. Own. Inst. Own. Inst. Own. < 50% ≥ 50% < Median ≥ Median
Post×Treat 0.008 -0.003 0.004 0.003 (0.20) (-0.06) (0.09) (0.07)
Log Size -0.001 0.007 -0.002 0.013 (-0.04) (0.25) (-0.08) (0.65)
Book-to-Market -0.009 0.060* -0.005 0.041* (-0.48) (1.90) (-0.24) (1.95)
Log Num Analysts 0.009 0.055 0.005 0.020 (0.38) (1.26) (0.16) (0.60)
Institutional
Ownership -0.217* -0.095 -0.101 -0.090 (-1.73) (-0.85) (-0.50) (-1.15)
Constant 0.354*** 0.120 0.333*** 0.171 (4.76) (0.63) (3.87) (1.45)
Num. Obs. 6179 2743 4422 4500
Adj. R2 0.186 0.179 0.203 0.178
Fixed effects Firm &
Year
Firm &
Year
Firm &
Year
Firm &
Year

43
Table A2: 10K Filings and Divisional Managers’ Purchases In this table, we examine the impact of FAS 131 on the pattern of divisional managers’ insider purchases
over three months before and after 10K filing dates, respectively. The dif-in-dif regression results for
pre-filing is displayed in panel A and those for post-filing is presented in panel B. The pre-131 period
for 10K filing is fiscal year of 1996 through 1998 and post-131 period is fiscal year of 1999 through
2001. We do not include the firms that merge other companies and whose fiscal year end is not
December. The dependent variables are a dummy for divisional managers’ insider purchases (column
1), a dummy for divisional managers’ insider cluster purchases (column 2), a dummy for divisional
managers’ insider non-cluster purchases (column 3), total value of divisional managers’ insider
purchases (column 4), total value of divisional managers’ insider cluster purchases (column 5), and total
value of divisional managers’ insider non-cluster purchases (column 6). We aggregate trading at the firm
and annual level. Cluster insider purchases are defined as purchases placed by multiple insiders on the
same day or consecutive trading days. We aggregate trading at the firm and annual level. Treat is a
dummy variable for the treatment group, which indicates whether reported business segments increase
after FAS 131. Post is a dummy variable for Post-131 period. See Appendix for variable definitions.
Firm- and year-fixed effects are included, and standard errors are clustered at the firm level. The t-
statistics are shown in parentheses. ***, **, and * represent significance at the 1%, 5%, and 10% levels,
respectively.
Panel A. divisional managers’ purchases before 10K Filings (1) (2) (3) (4) (5) (6)
Dependent Div. Managers’ Div. Managers’ Div. Managers’ Div. Managers’ Div. Managers’ Div. Managers’
Variable Purchases Cluster NonCluster Purchases Cluster NonCluster Dummy Purchases Purchases Total Amount Purchases Purchases Dummy Dummy Total Amount Total Amount
Post×Treat 0.022** 0.005 0.019** 0.214** 0.039 0.188** (2.40) (0.97) (2.37) (2.32) (0.81) (2.30)
Log Size 0.009** 0.002 0.007** 0.078** 0.017 0.060* (2.31) (0.73) (2.24) (2.05) (0.69) (1.96)
Book-to-Market 0.003 -0.002 0.005 0.025 -0.017 0.039 (0.72) (-0.82) (1.16) (0.60) (-0.86) (1.04)
Log Num Analysts -0.007 0.003 -0.011* -0.077 0.020 -0.104* (-1.01) (0.75) (-1.84) (-1.20) (0.63) (-1.85)
Institutional 0.005 0.003 0.008 0.087 0.031 0.110
Ownership (0.26) (0.33) (0.57) (0.51) (0.34) (0.76)
Constant -0.018 -0.009 -0.008 -0.132 -0.071 -0.048 (-0.99) (-0.67) (-0.56) (-0.75) (-0.58) (-0.34)
Num. Obs. 8922 8922 8922 8922 8922 8922
Adj. R2 0.027 0.039 0.002 0.019 0.031 -0.003
Fixed effects Firm & Year Firm & Year Firm & Year Firm & Year Firm & Year Firm & Year

44
Table A2-Continued: 10K Filings and Divisional Managers’ Purchases
Panel B. divisional managers’ purchases after 10K Filings (1) (2) (3) (4) (5) (6)
Dependent Variable Div.
Managers’
Div.
Managers’
Div.
Managers’
Div.
Managers’
Div.
Managers’
Div.
Managers’ Purchases Cluster NonCluster Purchases Cluster NonCluster Dummy Purchases Purchases Total Purchases Purchases
Dummy Dummy Amount Total Total Amount Amount
Post×Treat 0.004 -0.005 0.009 0.035 -0.051 0.083 (0.36) (-0.70) (0.99) (0.31) (-0.72) (0.92)
Log Size 0.010** 0.001 0.009** 0.103** 0.018 0.091*** (2.20) (0.39) (2.54) (2.48) (0.64) (2.70)
Book-to-Market 0.000 0.001 -0.001 0.012 0.012 -0.006 (0.10) (0.31) (-0.37) (0.35) (0.52) (-0.21)
Log Num Analysts 0.005 0.004 0.000 0.040 0.039 -0.003 (0.65) (1.03) (0.02) (0.52) (0.95) (-0.05)
Institutional
Ownership 0.025 0.018 0.007 0.255 0.182 0.074
(1.16) (1.19) (0.47) (1.19) (1.28) (0.45)
Constant -0.036 -0.010 -0.027 -0.400* -0.134 -0.288 (-1.54) (-0.78) (-1.35) (-1.77) (-1.04) (-1.47)
Num. Obs. 8922 8922 8922 8922 8922 8922
Adj. R2 0.008 0.015 -0.011 0.002 0.020 -0.017
Fixed effects Firm &
Year
Firm &
Year
Firm &
Year
Firm &
Year
Firm &
Year
Firm &
Year

45
Table A3: 10K Filings and Headquarters Executives’ Purchases In this table, we examine the impact of FAS 131 on the pattern of headquarters executives’ insider
purchases over three months before and after 10K filing dates, respectively. The dif-in-dif regression
results for pre-filing is displayed in panel A and those for post-filing is presented in panel B. The pre-
131 period for 10K filing is fiscal year of 1996 through 1998 and post-131 period is fiscal year of 1999
through 2001. We do not include the firms that merge other companies and whose fiscal year end is not
December. The dependent variables are a dummy for headquarters executives’ insider purchases (column
1), a dummy for headquarters executives’ insider cluster purchases (column 2), a dummy for
headquarters executives’ insider non-cluster purchases (column 3), total value of headquarters
executives’ insider purchases (column 4), total value of headquarters executives’ insider cluster
purchases (column 5), and total value of headquarters executives’ insider non-cluster purchases (column
6). We aggregate trading at the firm and annual level. Cluster insider purchases are defined as purchases
placed by multiple insiders on the same day or consecutive trading days. We aggregate trading at the
firm and annual level. Treat is a dummy variable for the treatment group, which indicates whether
reported business segments increase after FAS 131. Post is a dummy variable for Post-131 period. See
Appendix for variable definitions. Firm- and year-fixed effects are included, and standard errors are
clustered at the firm level. The t-statistics are shown in parentheses. ***, **, and * represent significance
at the 1%, 5%, and 10% levels, respectively.
Panel A. headquarters executives’ purchases before 10K Filings (1) (2) (3) (4) (5) (6)
Dependent
Variable
HQ
Executives’
HQ
Executives’
HQ
Executives’
HQ
Executives’
HQ
Executives’
HQ
Executives’ Purchases Cluster NonCluster Purchases Cluster NonCluster Dummy Purchases Purchases Total Amount Purchases Purchases
Dummy Dummy Total Total Amount Amount
Post×Treat 0.017 0.004 0.013 0.183 0.038 0.171 (0.89) (0.34) (0.75) (0.92) (0.33) (0.95)
Log Size 0.004 0.004 0.002 0.058 0.046 0.040 (0.51) (0.85) (0.38) (0.75) (0.94) (0.60)
Book-to-Market -0.002 -0.002 0.001 -0.012 -0.023 0.018 (-0.20) (-0.49) (0.19) (-0.14) (-0.47) (0.24)
Log Num 0.010 0.004 0.006 0.087 0.038 0.057
Analysts (0.74) (0.54) (0.52) (0.62) (0.48) (0.45)
Institutional -0.029 -0.006 -0.011 -0.237 -0.008 -0.106
Ownership (-0.89) (-0.28) (-0.39) (-0.66) (-0.03) (-0.34)
Constant 0.033 -0.006 0.027 0.222 -0.107 0.191 (0.93) (-0.28) (0.88) (0.60) (-0.48) (0.59)
Num. Obs. 8922 8922 8922 8922 8922 8922
Adj. R2 0.088 0.038 0.062 0.076 0.019 0.054
Fixed effects Firm & Year Firm & Year Firm & Year Firm & Year Firm & Year Firm & Year
Table A3-Continued: 10K Filings and Headquarters Executives’ Purchases

46
Panel B. headquarters executives’ purchases after 10K Filings (1) (2) (3) (4) (5) (6)
Dependent Variable HQ
Executives’
HQ
Executives’
HQ
Executives’
HQ
Executives’
HQ
Executives’
HQ
Executives’ Purchases Cluster NonCluster Purchases Cluster NonCluster Dummy Purchases Purchases Total Purchases Purchases
Dummy Dummy Amount Total Total Amount Amount
Post×Treat 0.032 0.013 0.019 0.296 0.119 0.197 (1.46) (1.06) (0.99) (1.29) (0.95) (0.96)
Log Size 0.018** 0.010* 0.011 0.220** 0.119** 0.132* (2.22) (1.77) (1.51) (2.56) (2.22) (1.74)
Book-to-Market 0.002 -0.002 -0.003 0.012 -0.013 -0.035 (0.17) (-0.25) (-0.33) (0.12) (-0.19) (-0.38)
Log Num Analysts 0.009 -0.006 0.011 0.077 -0.066 0.096 (0.68) (-0.72) (0.89) (0.53) (-0.74) (0.72)
Institutional 0.005 0.002 -0.005 0.111 0.027 -0.000
Ownership (0.15) (0.09) (-0.16) (0.28) (0.11) (-0.00)
Constant 0.019 -0.000 0.032 0.043 -0.110 0.241 (0.47) (-0.01) (0.89) (0.10) (-0.40) (0.64)
Num. Obs. 8922 8922 8922 8922 8922 8922
Adj. R2 0.089 0.038 0.065 0.079 0.025 0.055
Fixed effects Firm &
Year
Firm &
Year
Firm &
Year
Firm &
Year
Firm &
Year
Firm &
Year