Embed Size (px)
Citation preview

Mandatory Retirement and Labor-Force Participation of Respondents in the
Retirement History Study by David T. Barker and Robert L. Clark*
The Age Discrimination in Employment Act (ADEA) was amended in 1978 to prohibit mandatory retirement before age 70 in most occupations. The impact of this legislation on the probability of older persons remaining in the labor force is the primary concern of this article. Specifically, questions con- cerning which older workers are affected by mandatory- retirement provisions and the extent to which they are forced to retire and leave the labor force are examined. Tabular analysis of data from the Retirement History Study on persons aged 62- 63 in 1969 shows significant variation in mandatory-retirement coverage between the public and private sectors and across industries, occupations, and demographic groups. Until age 65, the labor-force participation rate of those facing compulsory retirement is higher than or equal to that of those not covered but it drops significantly below the noncovered rate after age 65. Logit analysis of the labor-force participation of persons before and after age 65 indicates that mandatory retirement at that age reduces the probability of retirement by approximately 16.7 percentage points for white men wage earners. This results in a decline in the labor-force participation rate of all men aged 66-67 of approximately 4 percentage points.
Mandatory retirement is a personnel policy adopted by firms to remove older employees from their work- force. Mandatory-retirement provisions require that, upon reaching a specified age, individuals are com- pelled to retire even if they wish to remain on the job.1 Researchers have identified a number of rationales for
* Barker is an assistant professor, Department of Economics, George Fox College, and Clark is an associate professor, Department of Economics and Business, North Carolina State University. This research was partially funded by Administration on Aging Grant No. 90-A-l 738. Bulletin policy limits publication to studies carried out or funded by the Social Security Administration. An exception has been made in this instance because the subject matter is of special interest to Bulletin readers and the research was funded by a Department of Health and Human Services component.
1 The Bureau of Labor Statistics identifies two types of mandatory- retirement provisions. The compulsory retirement age is the age at which the employee can be retired for age alone. The employee, however, may be retained on a year-by-year basis at the employer’s discretion. Automatic retirement age is the age at which the employee must cease employment. In this article the terms mandatory, com- pulsory, and forced retirement are used interchangeably.
the establishment of such an aged-based personnel policy. They include the relationship between age and productivity, the greater cost of older workers, the use of age as an impersonal screening device, and the inflexibility of work assignments because of work rules, seniority, and pay scales.2 In addition, the authors of several recent studies have argued that mandatory retirement should be viewed as part of a long-term contract between a firm and its workers that alters the age-productivity profile through on-the-job training and also changes the life-cycle pattern of compensations
The use of mandatory retirement has been regulated by the Age Discrimination in Employment Act
a James Schulz, The Economics of Aging, Wadsworth Publishing Co., Inc., 1980.
3 John Lapp, “An Economic Model of Mandatory Retirement,” in Outlawing Age Discrimination (Final Report, Administration on Aging Grant No. 90-A-1738), January 1980, pages 39-62; and Edward Lazear, “Why Is There Mandatory Retirement?,” Journal of Political Economy, December 1979, pages 1261-1284.
20 Social Security Bulletin, November 198O/Vol. 43, No. 11

( ADEA), which until 1978 precluded discrimination against workers aged 40-65 on the basis of their age. In 1978, Congress amended the act by raising the upper age to 70. Thus, most private employers are now prohibited from imposing mandatory retirement before the worker reaches age 70. The outlawing of forced retirement may have far-reaching effects on the person- nel policies of many firms. This article focuses solely on the influence of mandatory retirement on labor-force participation and attempts to measure the effect of the 1978 amendments on labor-force participation.4
Although mandatory retirement requires that a per- son terminate employment, he or she is not forced to withdraw from the labor force. A dislocated older worker, however, may elect to leave the labor force upon mandatory retirement because of the search cost required to find a new job and the reluctance of firms to hire a new employee in his or her midsixties. Another important factor is that wage offers may be substantially below the person’s previous wage because of firm- specific skills and seniority that are lost with a job change. For these reasons, withdrawal from the labor force frequently coincides with mandatory retirement.
The separate and independent effect of mandatory retirement on labor-force participation cannot be deter- mined by simply noting that more people covered by forced-retirement provisions leave the labor force than those who are not covered. This direct relationship is complicated by the high correlation between mandatory retirement and eligibility for pension benefits, which also influences retirement.5 This article employs data from the Social Security Administration’s Retirement History Study (RHS) to estimate the effect of manda- tory retirement on labor-force participation. The RHS is a national longitudinal survey of married men, nonmarried men, and nonmarried women aged 58-63 in 1969. It is a IO-year study in which the respondents were interviewed every 2 years between 1969 and 1979.6 Information from the 1969, 1971, and 1973 surveys is used to follow individuals as they approach and pass the age of mandatory retirement. Several methods are employed to determine the effect of mandatory retirement on the labor-force participation rate of older persons. The results consistently indicate that mandatory retirement lowers the labor-force participation of men wage earners at age 65 by approxi-
4 Mandatory-retirement provisions have not been an unchanging part of the personnel policy of companies. Between 1965 and 1976, more than 20 percent of the firms with pension plans included in a Bureau of Labor Statistics review altered some aspects of their mandatory-retirement requirements.
5 Virginia Reno, “Why Men Stop Working At or Before Age 65,” Social Security Bulletin, June 1971, pages 3-17; and Frederick Slavick, Compulsory and Flexible Retirement in the American F,cono- my, Cornell University, State School of Industrial and Labor Rela- tions, 1966.
6 For more information on the RHS, see Lola Irelan, *‘Retirement History Study: Introduction,” Social Security Bulletin, November 1972, pages 3-8.
mately 5 percentage points and by 4 percentage points for all men.
Mandatory Retirement Coverage The incidence of mandatory retirement coverage
varies by race, sex, industry, and occupation. The extent of compulsory retirement is calculated for these characteristics from the RHS. Table 1 indicates that 29.9 percent of all workers interviewed in 1971 were facing compulsory retirement.7 Self-employed persons rarely will be in a work situation that includes manda- tory retirement. With these persons excluded from the sample, the incidence of compulsory retirement for wage earners was 36.9 percent. The coverage rate for all working men was 3 1.2 percent; for men wage earners it was 40.6 percent. The estimates for all workers are comparable to the incidence of mandatory retirement from the Social Security Administration’s Survey of Newly Entitled Beneficiaries and, for men, are slightly lower than the coverage rates based on the sample of men in the National Longitudinal Survey (NLS) who were aged 45-59 in 1966.8 Thus, the
‘This sample includes married men, nonmarried men, and nonmarried women who were aged 60-65 in 1971. Also included in the sample are the wives of the married men.
a The NLS sample of older men was begun in 1966 with more than 5,000 respondents aged 44-59. Several subsequent surveys have followed these men as they have approached retirement. See Department of Labor, Pre-Retirement Years (Manpower Research Monograph No. 15, Vol. I ). 1970.
Table l.-Extent of compulsory retirement provisions: Percent of employed persons, by survey’
Survey and demographlc
group
Retirement Hiwxy Study ( 197 I ):* Respondents and wives:
Wage earners and self-employed ._..... .._._....._._._
Wage earners .._....._........ Men:
Wage earners and self-employed
Wage earners .._..............._........... Natmnal Longitudinal Survey
( 1971 ):a All men .._..._._._............................ Men wage earners .._..._....
Survey of Newly Entitled Beneti ciaries ( 1969 ):5 .._.............
r c
L
Percent on lobs
With compulsory retirement pnI”lsK~“a
29 9 36.9
31.2 40.6
38. I 448 7
30 0
With no :ompulsory retirement prowsIons
69 2 62.0
6R.3 58.7
57.1 451.3
60.0
Who do not know etlrement
btatus
0.9 I.1
.5
.7
4.R
10.0
1 Compulsory retwement status based on current employment or prewoua job. * IntervIew respondenta were nonmarrled men and women and married men.
Percentages represent those worktng m 1971. a Percentagea represent those working m 1971. 4 Represents those who know whether or not they have compulsory retire-
ment proviswns on their current or prewuus Joh 5Sample for persons recewing lnmal awards between July and December
1969. Data based on compulsory retirement prows~ons on the most recent Job.
Source: Janice Halpern. “Ralalng the Mandatory Retirement Age: Its effect on the Employment of Older Workers.” New England Economic Review, May/ June pages 27-2R: Renrement History Study: and the Natwnal Longitudinal Survey.
Social Security Bulletin, November 198O/Vol. 43, No. I I 21

evidence from these national surveys indicates that approximately 30 percent of all workers and more than 40 percent of all men wage earners aged 60-65 had mandatory-retirement regulations on their current jobs.
Demographic Differences in Incidence of Mandatory Retirement Considerable variation is evident in the incidence of
mandatory retirement by race and sex, and this in- cidence is substantially greater in the public than the private sector. Table 2 shows that white men wage earners had a coverage rate of 42.0 percent in 197 1, compared with 3 1.1 percent for other men. White men had a greater coverage rate only in the private sector; men of other races were more likely to face compulsory retirement in the public sector. Women were less likely to be covered by forced retirement than were men. White women had a higher coverage rate than did women of other races, but this situation was also reversed for public employment.
In private employment, age 65 was the mandatory- retirement age for 7 1.5 percent of those workers facing compulsory retirement; for 17.5 percent of the workers, the age was 70. Almost the reverse situation was found in the public sector where 76.1 percent of covered workers faced compulsory retirement at age 70 and 18.2 percent at age 65. Thus, at the beginning of the 1970’s, public employment was much more likely to include a mandatory-retirement provision. This age restriction was typically imposed at age 70, however, rather than at age 65, the most prevalent age in private employ- ment.
Pensions and Mandatory Retirement
The provision of pension benefits is a personnel policy that influences the continued employment of older workers. For this reason, it might be expected that some of the factors conducive to the establishment of pension programs are similar to those that lead to the adoption of mandatory-retirement policies. Table 3 illustrates the high correlation between pensions and
Table 2.-Percent of wage earners on jobs with com- pulsory retirement provisions, by type of employment, sex, and race, 197 1
Type of employment
Sex and race Wage earner Private
Men . . . . . . . . . . . . . . . . . . . . . . . . . . . . . . . . . . . . . . . . . . . . . ______. 38.4 White ___.....,..,.._.....................,. 42.0 39.6 Minority _....._,.,......,,.,,,...,..,..... 31.1 28.6
Women __..._._,.,_,.,__..,......,............ ._._._. 31.1 White . . . . . . . . . . .._......................... 34. I 32.4 Mmority . . . . . .._........._._______________ 20.3 18.8
Source: Retirement History Study, 1971 interviews.
Government
71.9 71.5 76.2 67.2 66.9 70.0
Table 3.-Percent of wage earners on jobs with com- pulsory retirement and pension provisions, by race and sex, 1971
Percent on jobs with-
Neither Both pension pension nor Compulsory and compulsory Penslon rettrement
Demographic compulsory
retirement provisions provisions retirement group provisions only only provisions
Men ._._........._._._ 38. I 21.1 6.6 34.3 White ..___.._ 36.6 21.5 6.5 35.5 Minority .._._._. 51.3 17.6 7.1 24.0
Women _._._._._,.._ 53.2 14.0 7.4 25.4 White .._..._ 51.0 14.9 7.2 26.9 Minority .._. 72.5 1.2 6.3 14.1
Source: Retirement History Study, 1971 interwews.
mandatory-retirement coverage. Almost 41 percent of the men wage earners interviewed in 197 1 were covered by mandatory-retirement provisions; of these workers, 84 percent were also covered by pension plans. All women and minority men were less likely to be covered either by mandatory-retirement provisions or by a pension. In addition, a smaller percentage of those covered by compulsory-retirement provisions were also in a pension plan.
Coverage by Industry and Occupation
The incidence of mandatory retirement varied consid- erably across the broad industry and occupational groups available in the RHS. Table 4 shows that the highest coverage rates were in public administration and transportation and public utilities. Mandatory retirement was least prevalent in agriculture, household service, and retail trade. The coverage rates by occupa- tion are reported in table 5. The highest incidence among the occupations was for teachers, professional and technical workers, and clerical employees. The lowest rates were recorded for farm laborers, farm
Table 4.-Percent of wage earners on jobs with com- pulsory retirement provisions, by industry, 1971
I Men 1
Industry White Minority
Agriculture . . . . . . . . . . . . . . . . . . . . . . . . . . . . . . . . . . . . . . . . . . . . Mining . . . . . . . . . . . . . . . . . .._.............................. Construction . . . . . . . .._.............................. Manufacturing:
3.1 0 45.0 0 24.4 16.7
Durable goods ____._._......,.,___.....,.,.. 51.0 Nondurable goods __.__.,..._.___.___..... 47.7
Transportation and public utilities ____.. 58.7
Wholesale trade . . ..__..........._._............... 25.7 Retail trade ___.........______......................... 13.9 Finance, insurance, and real estate __,__ 27. I Private household service ___._....._,___.____ 4.2 Other service, except forestry and
fisheries ..____._._._..._..__........,.,.............. 54.4 Forestry and fisheries . . . . . . . . . . . . . . . . . . . . . 25.0 Public administration .________,_..,.,...._______ 71.5
43.9 41.6 64.7 30.4 32.4 61.4 18.2 19.0 15.2 14.9 13.6 35.6
8.3 1.6
33.9 46.4 25.0 100.0 16.2 61.2
Source: Retirement History Study, 1971 interviews.
i
Women
5.3 0
23.3
22 Social Security Bulletin, November 198O/Vol. 43, No. 11
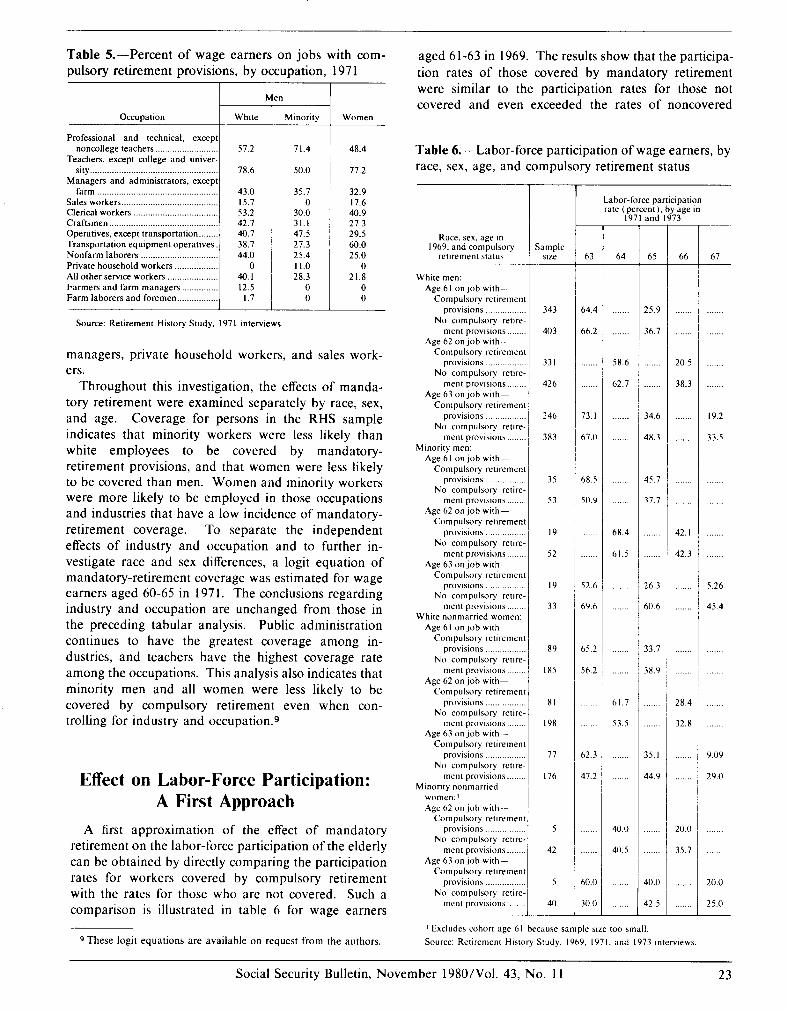
Table S.-Percent of wage earners on jobs with com- pulsory retirement provisions, by occupation, 197 1
aged 6 l-63 in 1969. The results show that the participa- tion rates of those covered by mandatory retirement were similar to the participation rates for those not covered and even exceeded the rates of noncovered
Table 6.-Labor-force participation of wage earners, by race, sex, age, and compulsory retirement status
I- I MelI
Occupation r White Minority Women
t
57.2 71.4 48.4
78.6 50.0 77.2
43.0 15.7 53.2 42.7 40.7
Transportation equipment operatrves ./ 38.7 Nonfarm laborers _.._._._____._._................ i 44.0 Private household workers ._.__._._.._.._._, All other service workers .._....._. I O 40. I Farmers and farm managers .._._.__.____. 12.5 Farm laborers and foremen _._.__.______.___ 1.7
35.7 32.9 0 17.6
30.0 40.9 31.1 27.3 47.5 29.5 27.3 60.0 25.4 25.0 11.0 0
28.3 21.8 0 0 0 0
Professional and technical, except noncollege teachers ________._.._._.____......
Teachers, except college and univer- sity
Managers and administrators, except farm __._.__._._________...............................
Sales workers _______._.__._,_.._.....,..,.,.......... Clerical workers .._................. Craftsmen .._._._____._._.._.......................... Operatives, except transportation ._,..,_,~
Labor-force particlpatlon rate (percent). by age in
1971 and 1973
63 Sample
Slix 64 65 66 67
343 64.4 25.9
403 66.2 36.7
331 58.6 20.5
426 62.7 38.3
246 73. I 34.6
67.0 48.3
19.2
3x3 33.5
35
53
68.5
50.9
45.7
37.7
19
52
68.4
61.5
42.1
42.3
I9
33
52.6 5.26
69.6
26.3
60.6 45.4
89
I85
65.2
56 2
33.7
38.9
81
I98
61.7 28.4
32.8
77
53.5
I76
b2.3
47.2
35.1
44.9
9.09
29.0
5
42
40.0
40.5
20.0
35.7
5
40
60.0 40.0 20.0
30.0 42.5 L 25.0
Race, sex, age III 1969, and compulsory
retirement status
White men: Age 61 onJob with-
Compulsory retirement prowsmns .._._..._.
No compulsory retxe- merit pr”“lslo”s
Age 62 on job with- Compulsory retirement
provisions .._........... No compulsory retire-
ment provwons _._._._. Age 63 on job wth-
Compulsory retirement provislons ._..._._._._...
No compulsory retjre- ment provisions .._..._.
Minority men: Age 61 on job with-
Compulsory retwement provisions .,....._._..._...
No compulsory retire- ment prowswns .._.....
Age 62 on job with- Compulsory retwement
prowsIons .._._..._._..._._ No compulsory retIre-
ment prowions .._.... Age 63 on job wth-
Compulsory retmment prowsions .._..._._._._._._
No compulsory retire- ment provismns
White nonmarrled women: Age61 onJob with-
Compulsory retirement provisIon .._......._....._
No compulsory retxe- merit provislons.
Age 62 on job with- Compulsory retirement
provisions No compulsory retwe-
merit prows,ons Age 63 OnJob wth-
Compulsory retirement provirlons .._..._._._..._.
No compulsory retIre- merit prows,ons
Mmonty nonmarrled women:’ Age 62 onJob with--
Compulsory retirement provisions ._._._..._._....
No compulsory retwz- merit prows~ons _._._._.
Age 63 onJob with- Compulsory retirement
prowswna ._....._._..._.. No compulsory retwe-
merit prowsIons
Source: Retirement History Study, 1971 interviews
managers, private household workers, and sales work- ers.
Throughout this investigation, the effects of manda- tory retirement were examined separately by race, sex, and age. Coverage for persons in the RHS sample indicates that minority workers were less likely than white employees to be covered by mandatory- retirement provisions, and that women were less likely to be covered than men. Women and minority workers were more likely to be employed in those occupations and industries that have a low incidence of mandatory- retirement coverage. To separate the independent effects of industry and occupation and to further in- vestigate race and sex differences, a logit equation of mandatory-retirement coverage was estimated for wage earners aged 60-65 in 1971. The conclusions regarding industry and occupation are unchanged from those in the preceding tabular analysis. Public administration continues to have the greatest coverage among in- dustries, and teachers have the highest coverage rate among the occupations. This analysis also indicates that minority men and all women were less likely to be covered by compulsory retirement even when con- trolling for industry and occupation.9
Effect on Labor-Force Participation: A First Approach
A first approximation of the effect of mandatory retirement on the labor-force participation of the elderly can be obtained by directly comparing the participation rates for workers covered by compulsory retirement with the rates for those who are not covered. Such a comparison is illustrated in table 6 for wage earners
9 These logit equations are available on request from the authors.
’ Excludes cohort age 61 because sample sue too small.
Source: Retirement HIstory Study. 1969, I97 I, and I973 mterwews.
Social Security Bulletin, November 198O/Vol. 43, No. 11 23

workers before age 65. At age 65, the participation rate for those covered fell relative to those not covered, however. For white men aged 65, there was an average total difference of 12 percentage points in participation rates between the two groups. Since 42 percent of the wage earners and 30 percent of the labor force in this age group are covered by mandatory retirement, a 12- percentage-point decline in the retirement rate among workers previously facing mandatory retirement in re- sponse to the elimination of all compulsory retirement would increase labor-force participation among white men wage earners at age 65 by 5.0 percentage points and raise the labor-force participation rate of all men aged 65 by 3.6 percentage points.‘0
The other demographic groups show substantially the same relationship, although with smaller sample sizes the range of the estimates is much wider. Analysis of these demographic groups indicates that there is a negative effect of mandatory retirement on labor-force participation at age 65 but that the variability of the estimates reduces the confidence in any point estimate of the effects of mandatory retirement.
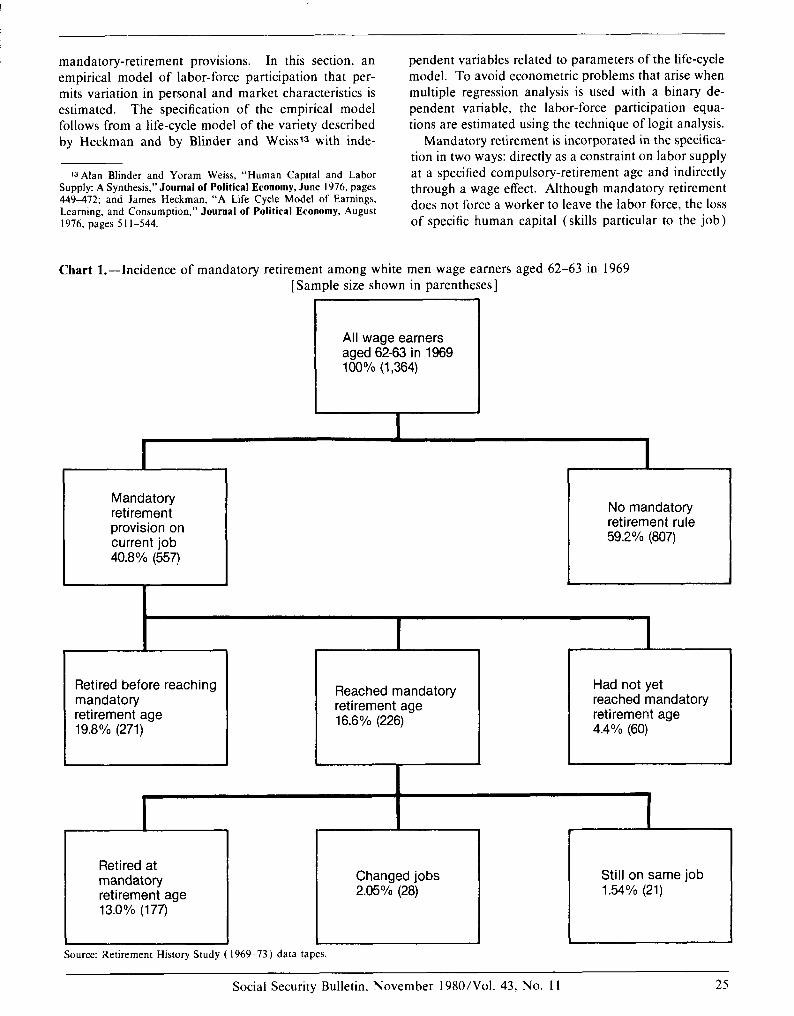
A comparable estimate of the labor-supply effect of mandatory retirement for white men wage earners is obtained from observing the behavior of individuals within a cohort as they approach and pass the age of compulsory retirement. Chart 1 illustrates the incidence of mandatory retirement among workers aged 62-63 in the 1969 RHS interview. By the time of the 1973 interview, the members of this cohort were 66-67 years of age and had passed age 65, the most prevalent age for compulsory retirement. By observing their work history between 1969 and 1973, one is able to determine the effect of mandatory retirement on the age of retire- ment for most persons.
Mandatory retirement provisions were part of the employment contract for 40.8 percent of these men. Almost half of those covered (or 19.8 percent of the entire cohort shown in chart 1) retired before reaching the age of compulsory retirement, and about two-fifths of the covered workers ( 16.6 percent of the entire cohort) retired at the mandatory-retirement age. About one-tenth of the covered workers (4.4 percent of the entire cohort) faced mandatory retirement at older ages and, therefore, had not yet reached that age. Thus, between 40.6 percent and 5 1.4 percent of those covered by mandatory-retirement provisions will retire at the age of compulsory retirement. This represents between 16.6 percent and 21 percent of the’ entire cohort de- scribed in chart 1. This finding is consistent with Schulz’s conclusions based on the Survey of Newly
10 The change of 5.0 percentage points is calculated by multiplying the 12-percentage-point decline by the 42 percent of the labor force that is covered by mandatory retirement [ (.12) (.42) = ,051. Similarly, the 3.6.percentage-point change is calculated as follows: (.l2) (.30) = ,036.
Entitled Beneficiaries (SNEB). Of those persons who retired between the ages of 62 and 65 in 1968, he observes, 45 percent of those covered by mandatory- retirement rules left the labor force at the age of mandatory retirement.11
From these data, crude estimates can be made con- cerning the change in labor-force participation resulting from the 1978 ADEA amendments. The short-run changes can be ascertained directly by asking persons who left the labor force at the mandatory-retirement age on their job if they would have continued working had they not been required to leave their job. Both the 1968 and 1969 SNEB data show that roughly 60 percent of those workers who were mandatorily retired left their jobs unwillingly. Only 40 percent of the total, however, actually left the labor force, desired to remain at work, and were physicially able to continue working. For the cohort of men wage earners from the RHS described in chart 1, only 13 percent of the group left the labor force upon reaching the age of mandatory retirement. If 40 percent of them were able and willing to remain in the labor force, the removal of mandatory retirement as a work restriction would increase the labor-force participation of the cohort at age 65 by 5.2 percent. This estimate is similar to that reported by Schulz and Halpern using data from the 1968 and 1969 SNEB.12 These estimates probably overestimate the effect of outlawing mandatory retirement in 1978. Be- cause of the continued decline in labor-force participa- tion in the 1970’s, fewer persons are likely to be employed at the age of mandatory retirement.
The above agreement in findings from different sources and types of information provides evidence for stating that the likely effect of the elimination of manda- tory retirement is to increase labor-force participation at age 65 by approximately 5 percentage points for men wage earners. This methodology, however, implicitly assumes that only differences in mandatory-retirement coverage are responsible for differences in participation rates. Other factors that influence retirement may be more likely to exist on a job with mandatory-retirement coverage-for example, pensions, higher wages, and longer tenure. Therefore, a more complex specification that controls for other factors associated with labor- force participation is analyzed below.
Logit Analysis of Labor-Force Participation
In the preceding analysis, the labor-supply behavior of individuals was examined by observing differences in market activity of those covered and not covered by
‘1 James Schulz, op. cit. ‘ZIbid., and Janice Halpern, “Raising the Mandatory Retirement
Age: Its Effect on the Employment of Older Workers,” New England Economic Review, May/June 1978, pages 23-35.
24 Social Security Bulletin, November 198O/Vol. 43, No. 11
mandatory-retirement provisions. In this section, an empirical model of labor-force participation that per- mits variation in personal and market characteristics is estimated. The specification of the empirical model follows from a life-cycle model of the variety described by Heckman and by Blinder and Weiss’3 with inde-
Ia Alan Blinder and Yoram Weiss, “Human Capital and Labor Supply: A Synthesis,” Journal of Political Economy, June 1976, pages 449472; and James Heckman, “A Life Cycle Model of Earnings, Learning, and Consumption,” Journal of Political Economy, August 1976, pages 5 1 l-544.
pendent variables related to parameters of the life-cycle model. To avoid econometric problems that arise when multiple regression analysis is used with a binary de- pendent variable, the labor-force participation equa- tions are estimated using the technique of logit analysis.
Mandatory retirement is incorporated in the specifica- tion in two ways: directly as a constraint on labor supply at a specified compulsory-retirement age and indirectly through a wage effect. Although mandatory retirement does not force a worker to leave the labor force, the loss of specific human capital (skills particular to the job)
Chart l.-Incidence of mandatory retirement among white men wage earners aged 62-63 in 1969 [Sample size shown in parentheses]
All wage earners aged 62-63 in 1969 100% (1,364)
I
Mandatory retirement provision on current job 40.8 % (557)
I
No mandatory retirement rule 59.2% (807)
Retired before reaching mandatory retirement age 19.8% (271)
Reached mandatory retirement age 16.6% (226)
Had not yet reached mandatory retirement age 4.4% (60)
Retired at I-- mandatory retirement age 13.0% (177)
I I
Changed jobs 2.05% (28)
Source: Retirement History Study ( 1969-73) data tapes.
Still on same job 1.54% (21)
Social Security Bulletin, November 198O/Vol. 43, No. 11 25

and search costs seem to be large enough to discourage participation. The effect of a mandatory-retirement provision on wages is included since recent studies indicate that compulsory retirement is part of a long- term contract for which the worker receives com- pensation in the form of higher wages before reaching the age of mandatory retirement.14 Indicator variables for mandatory retirement at ages 65 on current or previous job and for mandatory retirement at ages after 65 on current or previous job are included in the equation used to impute the wage in 1969 and 197 1. The mandatory retirement variables were multiplied by the tenure variable in the wage equation to model the long-term contractual nature of mandatory retirement. The variables for mandatory retirement at age 65 are
eliminated from the wage equation in 1973 because members of this cohort were then aged 66-67 and past that age of compulsory retirement.
In addition to mandatory retirement, labor-force participation is hypothesized to be a function of im- puted wages, pension and social security benefits, assets, health, and other personal characteristics. These vari- ables are defined in the technical note to this article.15
Estimation of Wage Equation
One problem is the lack of observed wage offers for persons currently outside the labor force. In this analysis, potential wages are imputed based on esti- mates from the wage equation for those persons who were working. Wages are estimated as a function of education, health, job tenure, size of the labor market, mandatory retirement coverage, and mandatory retirement-tenure interaction terms. Although tenure is potentially endogenous, it is used as a measure of whether the worker is participating in an implicit long- term contract that may have altered life-cycle in- vestment in human capital. The imputation of a wage for persons not in the labor force poses a difficulty in determining the potential wage that is being rejected. Persons out of the labor market are assumed to be facing a wage net of specific human capital accumulated in the past-that is, their wages are estimated with zero tenure.
The estimates of the wage equation for white men wage earners for 1969, 1971, and 1973 are shown in table 7. The variables are described in the technical note to this article. The influence of mandatory- retirement coverage is estimated by the mandatory retirement and the tenure-mandatory retirement inter- action variables. The interaction coefficient is signifi-
14 John Lapp, op. cit.; and Edward Lazear, op. cit.
1s A more detailed discussion of these variables can be found in the technical note to Robert L. Clark, Thomas Johnson, and Ann Archibald McDermed, “Allocation of Time and Resources by Mar- ried Couples Approaching Retirement,” Social Security Bulletin, April 1980, pages 3-16.
cant and implies that increased tenure in a job covered by a compulsory-retirement provision raises wages more rapidly than in noncovered employment. Although the coefficient on the mandatory-retirement variable is in- significant, the combined effect of the two variables at the mean tenure for these workers of 17.6 years is to raise the hourly wage by 30 cents per hour in 1969.
After a worker is forced to leave his job, the wage gain from coverage by a compulsory-retirement provi- sion is eliminated and the worker’s best offer from other firms is based on his skills that are useful to all firms. This anticipated wage decline cannot be estimated for 1973 because virtually everyone who was mandatorily retired also left the labor force. This fact may also pose a problem in the wage estimates for 1971 when the sample includes some persons who have already been forced to retire.
The wages of individuals do not significantly differ by the single year variation in age. The human capital variables of tenure and education are important determinants of wages throughout the sample period. In 1969 and 197 1, wages were significantly higher in the larger metropolitan areas. Finally, among this group of older workers, the coefficients on health limitations are always negative but are significant only in 1969.
Table 7.-Wage equations for white men wage earners aged 62-63 in 19691
-I- Varlablcs I969
Intercept ........................................................
Age 63 4. ........................................................
Tenure ..........................................................
Tenure times compulsory relwement at ag, 65 ...............................................................
Tenure times compulsory retirement greate than age 65 ...............................................
Education .....................................................
Compulsory retirement at age 65 ................
Compulsory retirement greater than age 65
3 0.9286 (.3543) -.2360 (.1737)
5 .OlSO ( .0092 )
Mild health hmlfation ..................................
Moderate-severe health limitanon ..............
Urban ...........................................................
Rural .............................................................
r
6.0255 (.0154)
.0002 (.0192) 3.2402 ( .2463 ) -. I46 I (.382 I )
.I084 (.4258) m.2406 (.395 I ) -.8030 (.4051) = .4667 ( .2298) -.0932 ( .2404)
N’.......................................................... 1015 R2 .......................................................... 0 I56
1 Wages in all years m 1969 dollars. 2 Standard errors shown m parentheses. ...
I973
3.3312 0.2900 (.3836) (.9472) -.0968 -.3495 ( ,205s ) ( .4747 ) 3.0384 .0229 (.0091) (.l981)
-.0086 (.0184)
.Ol83 ( .02 I I ) 3.295 I (.0279)
.5265 (.4898)
.I046 (.4544) -.4131 (.4246) -. I302 (.5284) 3.9599 ( .2449) -.I978 (.2585)
-
597 0.298
,083 I (.0557)
3.4257 (.0664)
-1.191 I (.1464) -1.408 (.9105) -.5608 ( .8092 ) -.5325 (.6317) m.5992 (.6444)
F=
255 0.194
3 Significant at I-percenr level ol conhdence. 4 Variable has value of I if person IS age 65 in 1971 and is age 67 m 1973. 5 Slgnilicant at 5-percent level of confidence. 6 Stgnilicant at IO-percent level of confidence. 7 Equals the number of observations used m the esttmation.
26 Social Security Bulletin, November 198O/Vol. 43, No. 11

Estimation of Labor-Force Participation Equation
In the labor-force participation equations, four vari- ables model the wealth position of the household: The value of equity in the home; income from assets held in stocks, bonds, checking and savings accounts, and rent from other property; pension wealth of both the re- spondent and spouse; and social security wealth of the respondent and spouse. Equity in the home is assumed to be proportional to total assets held in the form of consumer durables, and income from assets is assumed to be proportional to total financial assets. Calculated separately because of their conditional nature are pen- sion wealth and social security wealth.
Pension wealth is calculated as the present discounted value of the annual pension benefits of both husband and wife. An g-percent interest rate is used to discount future benefits after the expected age of receipt of the pension (assuming a 3-percent real interest rate, a 5- percent expected rate of inflation, and that pensions are not adjusted for inflation). The value of the future flow of benefits is further discounted by 3 percent per year from the expected retirement age (or age 65) to the current age.
Social security wealth is the present discounted value of future benefits of the respondent and spouse if the benefits are to be received in the current period (ex- cluding the earnings test effect). For social security wealth, a 3-percent real interest rate is used to discount benefits since it is assumed that persons perceive ben- efits to be implicitly adjusted for inflation by Con- gress. 16
An additional pension variable included in the model is pension eligibility. The pension eligibility variable captures the effects of current availability of pension income. Eligibility should affect labor-force participa- tion only if real wealth is altered due to capital market constraints on borrowing. A social security eligibility variable is not included since virtually all of the individ- uals are eligible for benefits at age 62 and the estima- tion of labor-force participation in this article includes only persons aged 62 and older.
The health variables measure direct inability to work and the loss of human capital. The measure of health is derived from the Duke Health Index.17 The physical health scale has health ratings from 1 for excellent to 5 for severely impaired. In the regressions, ratings 1 and 2 have been combined and used to indicate a baseline level of health status. The rating 3, which indicates mildly impaired functioning, and ratings of 4 and 5,
16 Social security benefits are now indexed explicitly by the con- sumer price index but were not during the period 1969-73.
17 G.G. Fillenbaum and George Maddox, Assessing the Functional Status of LRHS Participants (Technical Report No. 2). Center for the Study of Aging and Human Development, Duke University, September 1975.
which indicate moderate to severe health limitations, are employed to illustrate the effects of health limita- tions of varying degrees. The advantage of using the Duke Health Index is that it has been shown to be comparable to physicians’ ratings, and thus it should be a more objective measure of health status than a single subjective evaluation.
Several other variables added to control for charac- teristics of the labor market include government em- ployment, education, and the size of the labor market. The variables used to control for the demand for goods and services and household production time include marital status, number of dependent children, and number of parents living in the household.
The last two variables included in the empirical model are the spouse’s labor-force participation and her wage. Since the spouse’s pension and social security wealth is combined with that of the respondent and, similarly, home equity and asset income are related to total family income, the spouse’s labor-force panicipa- tion and wage are included so that substitution effects will not be mixed with wealth effects.
This model of labor supply was estimated for white men aged 62 and 63 in 1969 for each of the survey years. Table 8 shows the effects of coverage by mandatory-retirement provisions at age 65 on the probability of an individual being in the labor force. With a mean tenure of 17.6 years, the coefficients of the two mandatory-retirement variables in the 1969 wage equation imply that coverage by compulsory retirement results in a wage increase of 30 cents per hour. This produces an increase in the probability of labor-force participation of 5.7 percent. Thus, before the age of compulsory retirement, this personnel policy is associ- ated with a higher wage and raises the labor-force participation rate. The labor-force participation equa- tion also allows for a direct effect of mandatory retire- ment. It is sometimes argued that persons withdraw from the labor force before the age of compulsory retirement because they know that their years of work on the job are limited. The coefficient estimate of coverage is negative but is statistically insignificant. The combination of the wage and direct effects of com- pulsory retirement is to increase the participation rate of those aged 62-63 by approximately 0.7 percentage points. j8
By 1973, this cohort was aged 66-67 and past the age of mandatory retirement for many in the sample. At this point, there is no wage effect of mandatory retire- ment because workers have passed the termination age of their employment contract. The direct effect of
Ia Of the two wage variables and the direct effect in the labor-force participation equation, only the tenure/mandatory retirement inter- action term is statistically significant. If only this term is used to determine the pre-65 effect, the participation rate of the cohort is increased by 8.5 percentage points.
Social Security Bulletin, November 198O/Vol. 43, No. 11 27

Table 8.-Effect of mandatory retirement on labor- force participation of wage earners, by sex and race
Chanae in labor-force 1 participakn rate bc :ca
lcompulso Sex and race
Aged 62-63
in 1969
Men: White:
Total effect _._._..._..._...._._.......................... 0.66 Wage effect* _._._........_..._._........................ 5.74 Direct effect .._._._._._........................ -4.98
Minority: Total effect: .._._._.___.._._........................... -I 1.66 Wage effect _._._._._.________._.........,.....,......... -I 8.40 Direct effect ._.____________.___......................... 6.14
Women:3 White:
Total effect _.__________._._._._.......................... 9.15 Wage effect ._.__.___._._._._............................ 32.56 Direct effect ____._._._._..._............................ -23.41
Minority: Total effect ._._.............._........................... -13.94 Wage effect .._._._._._._._._......................... ( 3.33 Direct effect .,_._._,_..___._._._........................ 1 -1 1.21
/
etiremenl
Aged 64-65
n 1971’
-13.25 -16.73 6.1 I
-19.36 -16.73
-8.44 ’ -48.45 -5.89 -2.55 -48.45
-5.28 -15.72 -7.44
2.16 -15.72
116.9 -19.35 4 95.9
21.0 -19.35
.use of revisions
Aged 66-67
in 1973
1 Wage effects are difficult to interpret because some members of the cohort have already been mandatorily retired and thus should not have their wages altered because of current compulsory retwement coverage.
2 Wage effect is determmed by calculatmg the wage change because of mandatory retirement coverage at the mean tenure of the group. This increase IS then multiplied by the change m the probability of labor-force participation associated with a $ I change in wages. For example, in 1969 the mean tenure for white men was 17.6 years. The estimated wage change in using the two compulsory retirement coefficients in the wage equatmn is ( 17.6 X 0.0255) 0.1461 = $0.3027. This wage change results m an mcrease m the probability of labor-force participation of 5.74 percentage pomts. The 1969 mean tenure is then increased by 2 years for the 1971 calculation and 4 years for the 1973 estimate.
3 Estimates based on ordinary least squares (OLS) regressions for both the wage and labor-force paniclpatmn equatmns. OLS was used in the labor-force participation equations because the logit model failed to converge or because there was no one remaining in the labor force who had been mandatorily rewed.
4 The 1971 estimates for minority women are unreasonably large. These estimates suffer from the problems described m footnotes I and 3. In addition, these numbers are based on a small sample we. The primary problem arises in the wage equation (based on 36 observations) where the coefficients on both the compulsory retirement variables are quite large compared with the esumates for other demographlc groups and for these women in other years. Both these coefficients are imprecisely estimated wth standard errors three times as large as the coefficient, and the coefficients are statistically insignificant.
forced retirement at age 65 on a job is to reduce the probability of labor-force participation by 16.7 per- centage points.
The logit model indicates that mandatory retirement at age 65 increases the likelihood of remaining in the labor force before age 65 through the wage effect and then decreases the probability of participation after age 65 through the direct-work constraint. On the basis of these estimates, the 1978 ADEA amendments are ex- pected to increase the labor-force participation rate at age 65 by 4.5 percentage points.19 In addition, the participation rate before age 65 is expected to decline slightly in the longer run after firms have had the
1s This estimate is calculated by multiplying the increase in partici- pation by covered workers ( 16.7 percentage points) by the proportion of persons in the labor force in their mid-60’s covered by compulsory retirement (0.27).
28 Social Security Bulletin, November 198O/Vol. 43, No. 11
opportunity to adjust the life-cycle profile of wages. Although the primary focus of this article is the effect
of mandatory retirement, several other findings are briefly described and estimates for the labor-supply model are shown in table 9. Current eligibility for an employer pension lowered the probability of being in the labor force by 9.2 percentage points in 1973. The estimated effect of eligibility was greater in the earlier years. The pension wealth coefficient is always nega- tive, small in absolute value, and insignificant. The social security wealth coefficient is positive, small, and significant in each of the years. This positive relation- ship probably results from the correlation between past market work and the size of social security benefits.
The estimated effects of the health variables are generally highly significant and imply substantial reduc- tions in the probability of participation with a decline in health status. Before reaching age 65, individuals are responsive to higher wages. The estimated wage elasti- cities are 1 .O in 1969 and 1.4 in 197 1 before they decline to an insignificant 0.08 in 1973. Other personal charac- teristics such as the presence of dependents, education, spouse labor-marker characteristics, and residence are important before age 65 but not after.
Similar analyses have been performed for other demographic groups but the level of confidence is much lower in these estimates.20 Coverage by mandatory- retirement provisions at age 65 in 1969 is associated with a $1.73 per hour higher level of wages, which decreases the likelihood of labor-force participation by 18.4 percentage points. The direct effect of mandatory retirement when the sample is aged 66-67 is to reduce participation among minority men by 48.5 percentage points. This effect at age 65 is almost three times as large as that for white men. With 17.4 percent of minority workers covered, the 1978 ADEA amendments were likely to increase participation by 8.3 percentage points among minority men wage earners. The analysis shows that the change in mandatory retirement will benefit older minority men to a greater extent than it will elderly white men. Overall, however, it will only slightly increase participation rates at age 65 because 90 percent of the men in the labor force of this age are white.
The direct effect of mandatory-retirement provisions on the labor-force participation of women is closer to that for white men. In 1973, compulsory retirement is estimated to have reduced the participation rate of white women wage earners by 15.7 percentage points and the rate of minority women wage earners by 19.4 percentage points (table 8). With 10.2 percent of white women wage earners and 4.9 percent of minority wom-
mSome reported coefficients for minority men are estimates from ordinary least squares regressions in cases where the logit analysis did not converge. Tables for minority men and for women are available from the authors.

Table 9.-Logit estimates of labor-force participation for white men ages 62 and 63 in 1969
Derivative of probability
Variables I969 1971 1973
Imputed wage ................................................ ‘0.1897 Spouse LFP .................................................... 2. I843 Spouse wage ................................................... ’ m.0877 Pension eltgibdity ........................................... 1 m.2669 Pension wealth ............................................... .0003 Social security wealth ..................................... 1.0085 Home value .................................................... .0007 Assets income ................................................. 2 -.0125 Mild health limitation .................................... -.0525 Moderate-severe health limitation ................ 1 -.6180 Not marrled .................................................... * -. 1259 Numberof-
Parents .................................................... 3 -. I883 Children.. ................................................ 2.0563
Education ....................................................... ’ -.0398 Government jobs ........................................... ‘.I977 Urban ............................................................. * -_ 1272 Rural ............................................................... .0032 Compulsory retirement at age 65 .................. -.4983 Compulsory retirement greater than age 65 .0047 Age 63 4 .......................................................... -.0140
‘0.1701 0.0047 .0756 .0970 .0036 .0032
‘-.I696 ’ -.0916 .oooo -.0009
1.0098 2.0025 -.002 .0003
-.Ol I6 -.005 I l-.2152 ’ -.2037 ’ -.3942 ‘-.I290
3.1139 .0399
-. I867 .0092 .0382 .Ol93
’ -.0360 .Ol28 1.245 I .Ol93
1 -.2645 -.0354 .0035 .0376
’ -.I936 ’ -. 1673 .0203 a.0802
’ -.2208 2 -.0566
N5.. ...................................................... 1394 L6 ........................................................ -554.7918
1024 944 533.7722 441.7248
1 Slgniticant at l~percent level of confidence. * Stgntficant at 5-percent level of confidence.
t mean 1
3 Sigmficant at IO-percent level of confidence. 4 Variable has value of I if person is age 65 m 1971 and age 67 in 1973. 5 Equals the number of observations used in the estimate. 6 Log likelihood of equation.
en wage earners covered by mandatory retirement, the increase in the labor-force participation rate resulting from the change in the law will be much smaller at age 65 for women than for men-l.0 percentage point and 1.5 percentage points, respectively.
Conclusion In 1978, Congress passed legislation prohibiting the
use of mandatory retirement before age 70 for most jobs in the private sector*’ and eliminating its use in most Federal jobs. In addition, a number of States have also abolished mandatory retirement in State employment. This legislation is expected to increase the labor-force participation rate of all men at age 65 by about 3.6 percentage points.22 This estimate is based on RHS surveys conducted from 1969 to 1973. In 1970, the labor-force participation rate of men aged 65-69 was 39.3 percent. If 3.6 percent of the population is now
21 The amendments excluded executives entitled to substantial pension benefits, tenured employees of universities and colleges (until July 1982). and persons covered under collectively bargained agree- ments until the agreement terminated or January 1980, whichever occurred first.
22 In the previous analysis, based on a sample of wage earners, the size of the effect was determined to be between 4.5 and 8.3 percentage points for white and minority men. Therefore, for all men wage earners, the size of the effect is 5 percentage points. When this figure is adjusted to account for the number of self-employed, the total effect is 3.6 percentage points.
assumed to remain in the labor force until age 70, the elimination of mandatory-retirement provisions would have increased labor-force participation to 42.9 per- cent-an increase of 112,000 men workers. For 1979, the participation rate for men aged 65-69 was 29.6 percent. If workers had fully adjusted to the removal of compulsory retirement, 136,000 would have remained in the labor force rather than retiring at age 65. This number of additional workers amounts to 0.13 percent of the total labor force aged 16 and over.
The participation rate for women aged 65-69 in 1979 was 15.3 percent. An increase in this figure of 1.3 percentage points because of the elimination of the mandatory-retirement restriction would have involved 61,600 workers, or 0.06 percent of the labor force.23
Even this rather small number of workers overstates the number likely to remain in the labor force. The overestimate occurs because many workers who initially remain on the job will retire between the ages of 65 and 69. Also, the decline in the labor-force participation of men between 1973 and 1980 has been substantial, and this factor probably has reduced the positive effect of the abolition of mandatory retirement.
The estimated effect of compulsory retirement report- ed in this article holds other employment and com- pensation factors constant. Whether older workers continue their careers will depend, in part, on the responses of employers to the ban on compulsory retirement. They may seek to facilitate the use of older workers by providing more flexible schedules, job retraining, and reassignment of tasks. On the other hand, employers prohibited from forcing workers to leave may attempt to entice them out. This could be accomplished by changing the characteristics of pension plans to decrease the gain from continued employment. Thus, the final effect of eliminating mandatory retire- ment will depend on employer responses as well as on the direct effect on labor-force participation examined here.
Technical Note Definitions of the variables used in analyzing labor-
force participation follow. Labor-force participation: 1 if individual was work-
ing, currently employed but not at work, or looking for work; 0 otherwise.
Imputed wage: individual’s imputed hourly wage from wage equation estimations in 1969 dollars.
Spouse labor-force participation: 1 if spouse was
(Continued on page 55)
*sThe figure 1.3 is derived by using the estimates for white and minority women wage earners, aggregating and adjusting for self- employment.
Social Security Bulletin, November 198O/Vol. 43, No. 11 29

Table M-27.--Supplemental security income for the aged, blind, and disabled: Number of persons receiving State- administered State supplementation only and total and average amount, by reason for eligibility and State, May 1980 1
Number of persons -r Tmal amount ( ir t thousands) ayment
Blind
j127.11
63.2 1 (5) (5)
138.50 99.58
64.25 96.8 I
107.80 (7)
28.79 16 1.06
67.29
I i
I 171.33
56.40 46.61
............
............
: D.
t Aged Blind
31,441 829
i
4,392 41 128 2 195 I
8,104 8 2,881 43
Aged
$2,495
257 IO 24
833 359
26 103 164
(71 56
212 30
A
Disabled
L
Aged
$79.36 I
58.48 79.22
124.76 102.83 124.55
61.52 79.67
116.68 (7)
113.63 37.53 45.20
132.86 (5)
56.95 39.15
. . -
Total Bhnd State Total Disabled Total
592.74
59.13 SO.29
112.62 110.65 134.65
66.05 121.62 118.34 103.32 106.22 47.44 71.37
(5) 132.20
15) 56.02 40.92 .
Disabled
$1 II.99
60.86 79.92 44.21
158.81 140.42
72.82 132.06 124.47
(7) 103.54
50.03 91.48
15) 128.52
15) 53.71 43.05
.
. . . . .
Total ...............................
Alabama.. ......................................... Alaskaa.. ........................................... Arizona ............................................ Colorado .......................................... Connecticut .................................... Flondae ............................................ Idaho.. .............................................. Illinms.. ................ ........................... Kentucky .......................................... Maryland .......................................... Minnesota ........................................ Missouri.. .......................................... Nebraska.. ........................................ New Mexico ..................................... North Carolma.. ............... .............. North Dakota ..................................
.I 2 52,853 ! $4,902 s 105 S2.253
1,545 130
34 I.311 5,308
292 5,309
390 17)
823 I,33 I
875 1
692 I
1,172 906
354 21 26
1,043 1,108 .
48 809 213 2 48 142 355 III
3 (4) (4)
I 4
5,984 260 230
9,423 8,232
94 10
2 208 745
21 701
49 17)
85 67 80
(1) 89
14) 63 39
432 1,289 1,405 (71 497
5,647 670
I.507 1
8 54
5 (7)
19 475
17
40 . . . . .
15 95
. _,....
732 6,652 1,800
I 5 I
(71 I
77 I
‘463 1,339
7,453 1.562
1 2,239
2
(41 296 200
(4) (4) 229 165
98 55 .
.
Oklahoma ........................................... Oregon ............................................... , South Carohna~. ................................ Utah6
:“r ................................................. ...........
West Virginia6 ................................... Wyoming6 .........................................
1
2,898 I.395
7 Data reported IO the Social Security Administration by individual States. 3 Represents data for March 1980; data not available for May
All data subject to rew,on. Excludes data for mandatory and optional 4 Less than $500 programs in New Hampshire, South Dakota. and Virginia; for optional 5 Not computed on base of less than S5CQ.
programs in North Dakota. 6 No persons receiving State supplementation only. 2 Includes data not distributed by reason for eligibihty. 7 Data not available.
Mandatory Retirement (Continued from page 29)
(moderate OK severe health limitation); 0 otherwise. Not married: 1 if individual is single, divorced, or
widowed; 0 otherwise. working, with a job but not at work, or looking for Number of parents: number of parents living in the work; 0 otherwise. household.
Spouse wage: spouse’s wage, if in labor force, in 1969 Number of children: number of children supported dollars; 0 otherwise. completely.
Pension eligibility: 1 if eligible for a pension in current period; 0 otherwise.
Pension wealth: the present discounted value of pension benefits of family in thousands of 1969 dollars.
Social security wealth: the present discounted value of all social security retired-worker, dependent, and survivor benefits in thousands of 1969 dollars.
Home value: market value of home minus the size of home mortgage in thousands of 1969 dollars.
Asset income: combined family income from assets in thousands of 1969 dollars.
Education: years of education completed. Government job: 1 if individual is employed by the
government; 0 otherwise.
Mild health limitation: 1 if individual received a 3 on Duke Health Index (mild health limitation); 0 other- wise.
Urban: 1 if individual lives in an urban area of more than 250,000 persons; 0 otherwise.
Rural: I if individual lives in a rural area with a population of less than 10,000; 0 otherwise.
Mandatory retirement, age 65: 1 if individual is covered by a mandatory-retirement provision at age 65 on current or previous job; 0 otherwise.
Mandatory retirement, age > 65: 1 if individual is covered by a mandatory-retirement provision at an older age than 65 on current or previous job; 0 other- wise.
Moderate to severe health limitation: 1 if individual Tenure: years on current job. The variable is equal to received a 4, 5, or .P on the Duke Health Index 0 for everyone currently outside the labor force.
Social Security Bulletin, November 198O/Vol. 43, No. 11 55