Embed Size (px)
Citation preview
Mangroves-A Sustainable Future
Grade 7:
Learning Outcomes: Living World: 7L4-7, 7P4 - 6Inquiry Learning Outcomes: Q1 – 10Scientific Investigation Learning Outcomes: S7, 8, 10, 11(See Rubrics below)
Big Question: “Why should we try and help restore the Mangroves on the New Island?”Scenario: A new, as yet unnamed island was created through dredging on Yas Island, this has impacted on the health of the mangrove ecosystem. Natural regeneration can be encouraged by creating small canals around the mangroves. This allows tidal movement which then carries the mangrove seeds to a new environment.
Grade 7 ADEC science students could have an important role in helping this to occur and monitor the health of the Mangrove forest ecosystem.
The New Island and canals
Vocabulary
MangroveFood chain Food web
Ecosystem (terrestrial and aquatic)Living factorNon-living factor
AdaptationProducerConsumerHerbivore

Carnivore Omnivore
Ideally this inquiry lends itself to an excursion to the Abu Dhabi mangroves. Visits to the mangroves are ideally made in light boats, such as a dinghy or kayak.
Photographs courtesy of the Noukhada Adventure Company, Abu Dhabi.
Student Hand-out – Presentation Instructions

Task
Your team has been asked to create a presentation for your peers outlining how to help reduce the impact of man and ensure future sustainability of the mangroves.
Title: “Why should we help to restore the Mangroves on the New Island?”
How? You can choose how your team will do this but some possibilities are:
A poster A TV advertisement A video using members of your team, you could be TV journalists interviewing
experts and interested locals. A blog/web site A puppet show/role play A PowerPoint presentation Cartoon software
Deadline: Each team has three to four weeks to complete the assignment – or an alternate teacher defined date.
What has to be included in the presentation?Team Information
Team #
Team Name Student Names Role
123
Key Ideas
Key Idea 1: Mangroves introduction
Research some background information about mangroves including:o what they look likeo where they are located in the UAEo the range of plants and animals that live in the mangroves
State that plants are producers and animals are consumers
Recommended Resource: http://www.environmentalatlas.ae/
Key Idea 2:Mangroves and energy (7L4, 7L5)
Outline some food chains in the mangrove community Explain how energy flows from the mangrove plants as the producer through to
consumers in the food chains Expand the food chains to food webs and show energy flow in the food webs. Explain, using an example, why a change in the number of one organism in a food
chain can affect other organisms
Key Idea 3:Survival in the mangroves (7L6)
Identify predators and prey from the identified animals Identify and describe the adaptations of the predators and prey Compare the adaptations described of the predators and prey
Key Idea 4:Variation in the mangroves (7L7)
List, and describe, some of the variations, within a species, of one plant and one animal in mangrove communities
What has caused these variations e.g. inherited, living factors, non-living factors etc. Explain the effect that human activity, over the past 40 years, has had on the
mangrove environment
Key Idea 6:Staying afloat (7P5, 7P6)
Carry out experiments/ activities with modelling clay to investigate floating. Create different shapes, solid and hollow; measure their displaced volume and mass and then calculate density. Rank the densities and test the floatation of each. Your teacher will help with these activities.
Draw diagrams that show the forces acting for each shape during floatation testing, clearly showing balanced and unbalanced forces by the length of the arrows. Ensure forces are labelled.
Explain why forces are balanced or unbalanced taking into consideration floatation in
Key Idea 6 (continued): Staying afloat (7P5, 7P6)
State the relationship between floatation and density. Explain how life jackets work to keep you afloat, using the findings of your
investigations

Resources:
http://www.environmentalatlas.ae (UAE Mangroves)http://bit.ly/1aYuFSH (Mangroves Change over Time)http://abudhabi.maps.arcgis.com/home/index.html (Mangroves Map 2013/2014)http://oceanservice.noaa.gov/facts/mangroves.html (Florida Mangroves)http://www.nrc.govt.nz/for-schools/school-information-packs/mangroves/ (New Zealand Mangroves)http://puzzling.caret.cam.ac.uk/game.php?game=foodchain (Food Chain game)TextbooksLibrary and books
Key Idea 7:FIELD TRIP TO MANGROVES YAS ISLAND Mangrove community health on the ‘New Island’ (E3)
On your trip to the new island you will be shown a 10m x10m square. Your team is to record a number - 1, 2 or 3 - for each of the seven categories on a Bulls Eye, reflecting attributes of the square allocated to you. ‘Three’ is green and considered healthy. You may be in a developing (pioneer) mangrove area or mature mangrove area
You may do this on paper, with a pencil to mark, or, if you use the supplied iPad, follow the instructions for the App, ‘Collector’, and the drop down menus to mark the value for each category

Newspapers and magazines (home and school)Internet sitesPeople you can ask, in person, phone, txt, e-mail/blog The Environmental Agency Abu DhabiKayaking and data collection
GIS LabUse these labs to help you gather the knowledge you need for use in your inquiry.
Lesson 1: Introduction to Mapping of the Mangroves
Prior Knowledge:
1. Copy this chart into your team book. Fill in the KWL chart for the Mangroves.
2. Copy this chart into your team book again. Fill in the KWL chart for Maps.
Using the GIS:
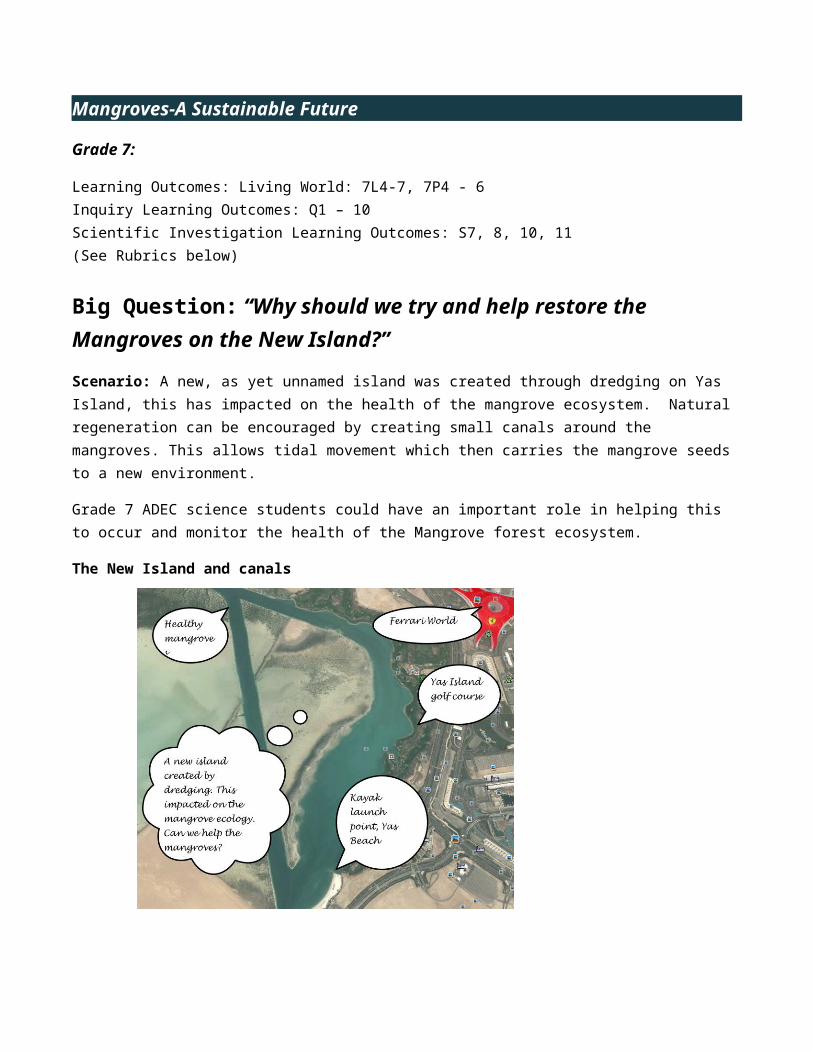
Click on the link
Team Number
Team NameStudentNames

http://bit.ly/1aYuFSH to open the “Mangroves Change Over Time” map
1. How are these types of digital maps different from a paper map?
_____________________________________________________________________________
_____________________________________________________________________________
_____________________________________________________________________________
2. What does this map show? ______________________________________________________
Now, try to find these places:
Ferrari World Yas Island Your school Marina Mall
3. What are the green areas showing?___________________________
4. In what year were you born?__________________
How many were you able to find?_________

5. Do you think we have more mangroves now than in the year you were born? (yes/no) ________________
6. Explain your answer. (Take a guess as to why there has been a change)_____________________________________________________________________________
_____________________________________________________________________________
Homework:
Find pictures of at least 3 organisms that live in the Mangroves for your class display. Learn a few facts about them. Bring in to your next science lesson and be prepared to present your findings to the class.
Research on the internet OR ask your parents about the Mangroves. Write anything you learn in your notebooks and bring in for the next class.
Here is a website for you to use: https://www.environmentalatlas.ae/seaToSummit/mangroveForests
Lesson 2 - Importance of mangroves to the United Arab Emirates
Estuaries are places where rivers or springs enter the sea. When areas like these are covered by trees they are called mangroves and when they are covered by grasses they are called marshes.
Now, you will use the local mangroves map to see where mangroves have grown in the UAE as well as in the Abu Dhabi Emirate.
Click on the link, or copy and paste into a browser, (http://bit.ly/1aYuFSH ) to open the “Mangroves Change Over Time” map.
You will see a map with the Mangroves in the Abu Dhabi Study Area turned on or showing.
Click on the “Content” button.
Check the box in front of the “Developed Urban Areas” layer to show the layer on the map, as shown above.
1. How do the “Mangroves” and “Developed Urban Area” layers compare to each other?

2. Do you think the mangroves or the urban areas came first?
3. What do mangroves “provide” to people that might make them want to live here?
4. What are some “benefits” (good) we get from mangroves?
5. What are the “negative” (bad) sides to mangroves?
6. For you, are there more “benefits” than “negatives”?
7. Do you feel the mangroves are still “important” to people in cities today? Why or why not?

Learning Outcome RubricsYou will be assessed using the following rubrics
Outcome Emerging Developing Mastery Teacher
Peer Self
7L4Describe the flow of energy in food chains and food webs.
Identify the components of food chains and food webs.
Describe the flow of energy in food chains.
Describe the flow of energy in food chains and food webs.
7L5Explain why a change in the number of one organism in a food web can affect other organisms.
Describe how a change in the number of one organism can affect other organisms.
Describe how a change in the number of one organism can affect other organisms in a food web.
Explain why a change in the number of one organism in a food web can affect other organisms.
7L6Compare the adaptations specific to predators and prey.
Identify some adaptations of predators and prey.
Describe the adaptations of predators and prey.
Compare the adaptations specific to predators and prey.
7L7Identify the cause of a range of variations.
Identify variations within a species.
Describe the variations within a species.
Identify the cause of a range of variations.
7L4Describe the flow of energy in food chains and food webs.
Identify the components of food chains and food webs.
Describe the flow of energy in food chains.
Describe the flow of energy in food chains and food webs.
7P4 Describe the effect of balanced and unbalanced forces.
Identify situations involving balanced or unbalanced forces.
Identify situations involving balanced and unbalanced forces.
Describe the effect of balanced and unbalanced forces.
7P5 Determine the relative density of different solids.
Determine the mass and volume of solids.
Determine the density of a solid from its mass and volume.
Determine the relative density of different solids.

7P6 Describe the relationship between floatation and density.
Predict whether an object will float or sink.
Use the arrow model to explain sinking or floating.
Describe the relationship between floatation and density.

Outcome Emerging Developing Mastery Teacher
Peer
Self
Q1 Collects information to answer all the key questions.
Collects some relevant information.
Collects information to answer most of the key questions.
Collects information to answer all of the key questions.
Q2 All information is appropriate.
Some information is appropriate.
Most information is appropriate. All information is appropriate.
Q3 Uses three or more eLearning techniques to gather knowledge.
Uses one eLearning technique to gather knowledge.
Uses two eLearning techniques to gather knowledge.
Uses three or more eLearning techniques to gather knowledge.
Q4 Explains how all of the answers to the key questions relate to the big question.
Explains how some of the answers to the key questions relate to the big question.
Explains how most of the answers to the key questions relate to the big question.
Explains how all of the answers to the key questions relate to the big question.
Q5 Acknowledges all sources of information.
Acknowledges some sources of information.
Acknowledges most sources of information.
Acknowledges all sources of information.
Q6 Each team member contributes to all team activities.
Each team member contributes to some team activities.
Each team member contributes to most team activities.
Each team member contributes to all team activities.
Q7 The team requires a very little supervision or encouragement.
The team requires frequent supervision or encouragement.
The team requires some supervision or encouragement.
The team requires a very little supervision or encouragement.
Q8 Presents almost all information clearly.
Presents some information clearly.
Presents most information clearly.
Presents almost all information clearly.
Q9 Shows considerable originality/imagination.
Shows little originality/imagination
Shows some originality/imagination
Shows considerable originality/imagination
Q10 Makes effective use of digital technology to present information.
Makes any use of digital technology to present information.
Makes satisfactory use of digital technology to present information.
Makes effective use of digital technology to present information.

Outcome Emerging Developing Mastery Teacher
Peer
Self
S7 Make at least three observations/ measurements
Make at least one observation/measurement.
Make at least two observations/ measurements.
Make at least three observations/ measurements.
S8 Record observations/ data in a simple table
Data/observations obtained but not recorded.
Record observations/data in some kind of systematic way.
Record observations/data in a simple table.
S10 Identify, describe and begin to interpret patterns in data.
Describe some observations.
Describe observations and simple patterns in recorded measurements, with support.
Identify, describe and begin to interpret patterns in data.
S11 Draw conclusions from patterns in data related to scientific knowledge and understanding
Draw conclusions for the experiment
Draw conclusions from patterns in data.
Draw conclusions from patterns in data related to scientific question.