Embed Size (px)
Citation preview

mns.com
Manhattan Rental Market ReportNovember 2015
page 2
Manhattan Rental Market Report November 2015
mns.comWilliamsburg
TABLE OF CONTENTS
12 Neighborhood Price Trends
27 The Report Explained
03 Introduction04 A Quick Look07 Mean Manhattan Rental Prices11 Manhattan Price Trends
12 Battery Park City13 Chelsea14 East Village15 Financial District16 Gramercy Park 17 Greenwich Village18 Harlem19 Lower East Side20 Midtown East21 Midtown West22 Murray Hill23 SoHo24 TriBeCa25 Upper East Side26 Upper West Side
page 3
Manhattan Rental Market Report November 2015
mns.com mns.comWilliamsburg
INTRODUCTIONAverage rent across Manhattan increased by 1.25% compared to this time last month, from $3,896 in October 2015 to $3,945 in November 2015.
page 4
Manhattan Rental Market Report November 2015
mns.comWilliamsburg
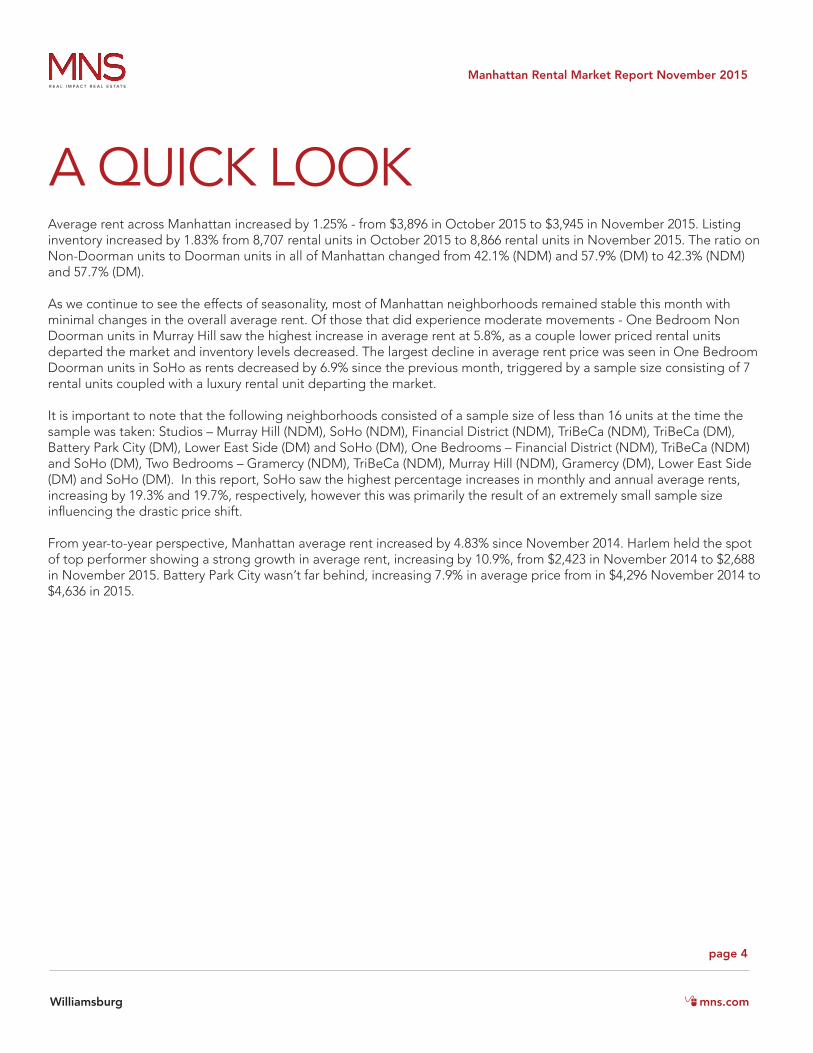
Average rent across Manhattan increased by 1.25% - from $3,896 in October 2015 to $3,945 in November 2015. Listing inventory increased by 1.83% from 8,707 rental units in October 2015 to 8,866 rental units in November 2015. The ratio on Non-Doorman units to Doorman units in all of Manhattan changed from 42.1% (NDM) and 57.9% (DM) to 42.3% (NDM) and 57.7% (DM).
As we continue to see the effects of seasonality, most of Manhattan neighborhoods remained stable this month with minimal changes in the overall average rent. Of those that did experience moderate movements - One Bedroom Non Doorman units in Murray Hill saw the highest increase in average rent at 5.8%, as a couple lower priced rental units departed the market and inventory levels decreased. The largest decline in average rent price was seen in One Bedroom Doorman units in SoHo as rents decreased by 6.9% since the previous month, triggered by a sample size consisting of 7 rental units coupled with a luxury rental unit departing the market.
It is important to note that the following neighborhoods consisted of a sample size of less than 16 units at the time the sample was taken: Studios – Murray Hill (NDM), SoHo (NDM), Financial District (NDM), TriBeCa (NDM), TriBeCa (DM), Battery Park City (DM), Lower East Side (DM) and SoHo (DM), One Bedrooms – Financial District (NDM), TriBeCa (NDM) and SoHo (DM), Two Bedrooms – Gramercy (NDM), TriBeCa (NDM), Murray Hill (NDM), Gramercy (DM), Lower East Side (DM) and SoHo (DM). In this report, SoHo saw the highest percentage increases in monthly and annual average rents, increasing by 19.3% and 19.7%, respectively, however this was primarily the result of an extremely small sample size influencing the drastic price shift.
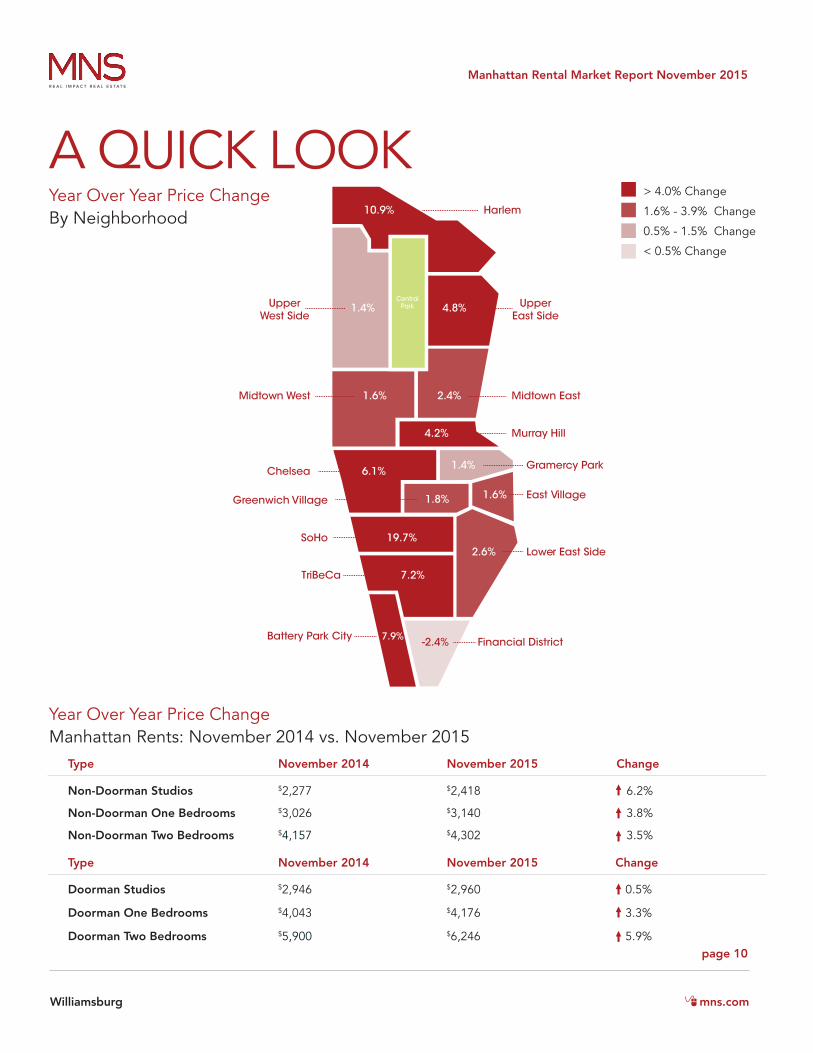
From year-to-year perspective, Manhattan average rent increased by 4.83% since November 2014. Harlem held the spot of top performer showing a strong growth in average rent, increasing by 10.9%, from $2,423 in November 2014 to $2,688 in November 2015. Battery Park City wasn’t far behind, increasing 7.9% in average price from in $4,296 November 2014 to $4,636 in 2015.
A QUICK LOOK
page 5
Manhattan Rental Market Report November 2015
mns.com mns.comWilliamsburg
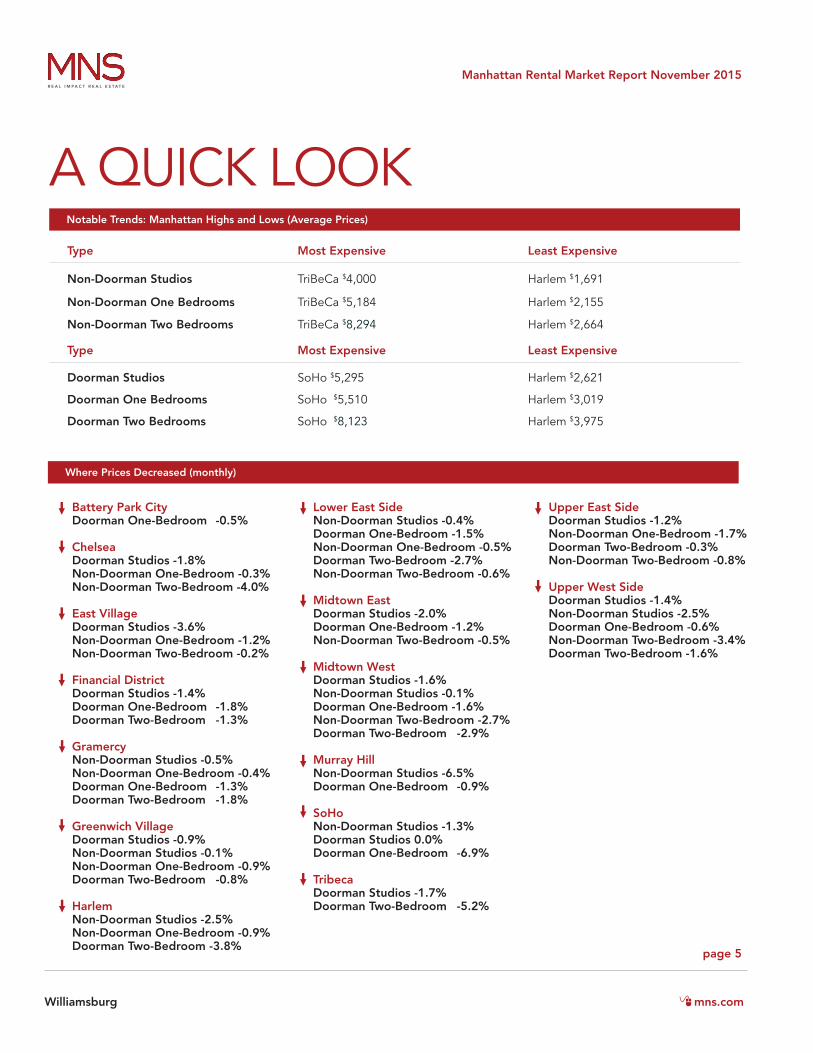
A QUICK LOOKType Most Expensive Least Expensive
Non-Doorman Studios TriBeCa $4,000 Harlem $1,691
Non-Doorman One Bedrooms TriBeCa $5,184 Harlem $2,155
Non-Doorman Two Bedrooms TriBeCa $8,294 Harlem $2,664
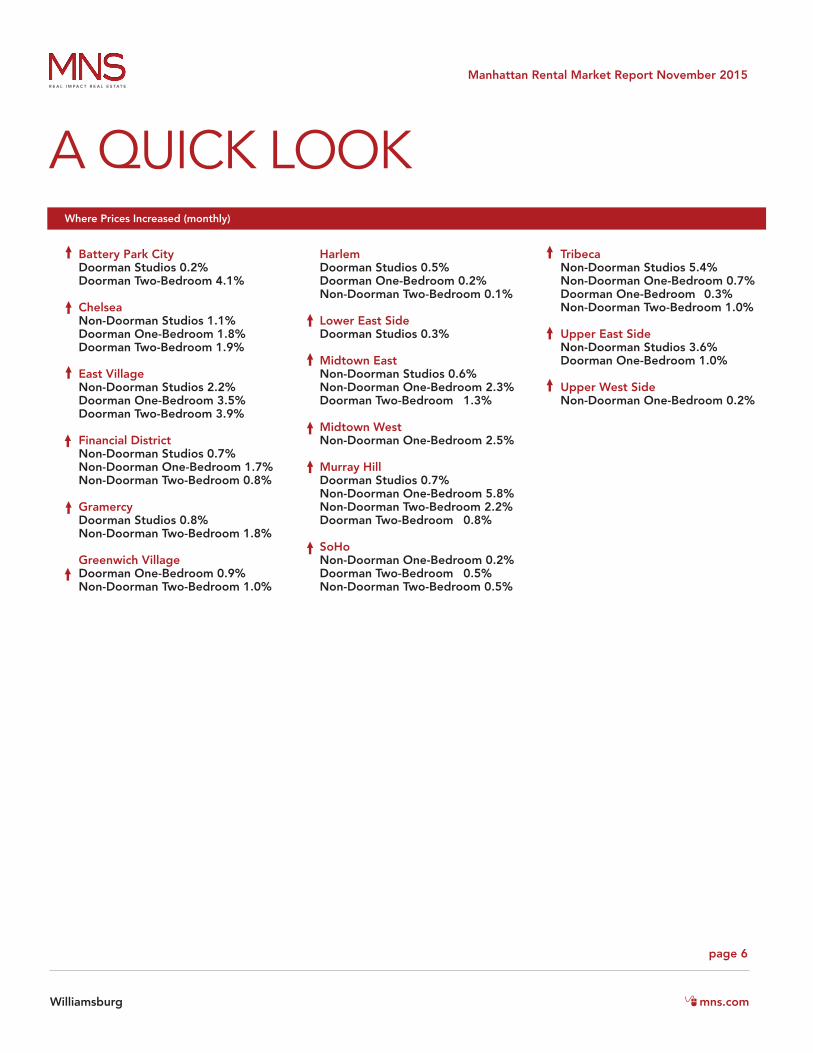
Battery Park City Doorman One-Bedroom -0.5% Chelsea Doorman Studios -1.8%Non-Doorman One-Bedroom -0.3%Non-Doorman Two-Bedroom -4.0% East Village Doorman Studios -3.6%Non-Doorman One-Bedroom -1.2%Non-Doorman Two-Bedroom -0.2% Financial District Doorman Studios -1.4%Doorman One-Bedroom -1.8%Doorman Two-Bedroom -1.3% Gramercy Non-Doorman Studios -0.5%Non-Doorman One-Bedroom -0.4%Doorman One-Bedroom -1.3%Doorman Two-Bedroom -1.8% Greenwich Village Doorman Studios -0.9%Non-Doorman Studios -0.1%Non-Doorman One-Bedroom -0.9%Doorman Two-Bedroom -0.8% Harlem Non-Doorman Studios -2.5%Non-Doorman One-Bedroom -0.9%Doorman Two-Bedroom -3.8%
Lower East Side Non-Doorman Studios -0.4%Doorman One-Bedroom -1.5%Non-Doorman One-Bedroom -0.5%Doorman Two-Bedroom -2.7%Non-Doorman Two-Bedroom -0.6% Midtown East Doorman Studios -2.0%Doorman One-Bedroom -1.2%Non-Doorman Two-Bedroom -0.5% Midtown West Doorman Studios -1.6%Non-Doorman Studios -0.1%Doorman One-Bedroom -1.6%Non-Doorman Two-Bedroom -2.7%Doorman Two-Bedroom -2.9% Murray Hill Non-Doorman Studios -6.5%Doorman One-Bedroom -0.9% SoHo Non-Doorman Studios -1.3%Doorman Studios 0.0%Doorman One-Bedroom -6.9% Tribeca Doorman Studios -1.7%Doorman Two-Bedroom -5.2%
Upper East Side Doorman Studios -1.2%Non-Doorman One-Bedroom -1.7%Doorman Two-Bedroom -0.3%Non-Doorman Two-Bedroom -0.8% Upper West Side Doorman Studios -1.4%Non-Doorman Studios -2.5%Doorman One-Bedroom -0.6%Non-Doorman Two-Bedroom -3.4%Doorman Two-Bedroom -1.6%
Where Prices Decreased (monthly)
Notable Trends: Manhattan Highs and Lows (Average Prices)
Type Most Expensive Least Expensive
Doorman Studios SoHo $5,295 Harlem $2,621
Doorman One Bedrooms SoHo $5,510 Harlem $3,019
Doorman Two Bedrooms SoHo $8,123 Harlem $3,975
page 6
Manhattan Rental Market Report November 2015
mns.comWilliamsburg
A QUICK LOOK
Battery Park City Doorman Studios 0.2%Doorman Two-Bedroom 4.1% Chelsea Non-Doorman Studios 1.1%Doorman One-Bedroom 1.8%Doorman Two-Bedroom 1.9% East Village Non-Doorman Studios 2.2%Doorman One-Bedroom 3.5%Doorman Two-Bedroom 3.9% Financial District Non-Doorman Studios 0.7%Non-Doorman One-Bedroom 1.7%Non-Doorman Two-Bedroom 0.8% Gramercy Doorman Studios 0.8%Non-Doorman Two-Bedroom 1.8% Greenwich Village Doorman One-Bedroom 0.9%Non-Doorman Two-Bedroom 1.0%
Harlem Doorman Studios 0.5%Doorman One-Bedroom 0.2%Non-Doorman Two-Bedroom 0.1% Lower East Side Doorman Studios 0.3% Midtown East Non-Doorman Studios 0.6%Non-Doorman One-Bedroom 2.3%Doorman Two-Bedroom 1.3% Midtown West Non-Doorman One-Bedroom 2.5% Murray Hill Doorman Studios 0.7%Non-Doorman One-Bedroom 5.8%Non-Doorman Two-Bedroom 2.2%Doorman Two-Bedroom 0.8% SoHo Non-Doorman One-Bedroom 0.2%Doorman Two-Bedroom 0.5%Non-Doorman Two-Bedroom 0.5%
Tribeca Non-Doorman Studios 5.4%Non-Doorman One-Bedroom 0.7%Doorman One-Bedroom 0.3%Non-Doorman Two-Bedroom 1.0% Upper East Side Non-Doorman Studios 3.6%Doorman One-Bedroom 1.0% Upper West Side Non-Doorman One-Bedroom 0.2%
Where Prices Increased (monthly)

page 7
Manhattan Rental Market Report November 2015
mns.com mns.comWilliamsburg
A QUICK LOOK STUDIOS
Harlem
UpperWest Side
UpperEast Side
MidtownWest
MidtownEast
Murray Hill
Chelsea
GramercyPark
GreenwichVillage
East Village
SoHoLower
EastSide
TriBeCa
BatteryPark City
FinancialDistrict
CentralPark
$1,691`
$2,621
$2,192
$2,808
$2,193
$2,909
$2,474
$3,347
$2,570
$5,295
$4,000
$3,648
N/A
$3,028
$2,163
$2,689
$2,220
$2,689
$2,140
$2,735
$2,381
$2,912
$2,244
$3,180
$2,178
$2,713
$2,691
$3,037
$2,718
$3,120
Greatest ChangesSince October
East Village Gramercy & TriBeCa
TriBeCa Midtown East
49 1785 15DAYS DAYSDAYS DAYS
Upper EastSide
TriBeCaFiDi
FiDi SoHo
Days on Market High Days on Market Low
Market Inventory Low
Market Inventory High
Doorman Non-Doorman
262 04187 01
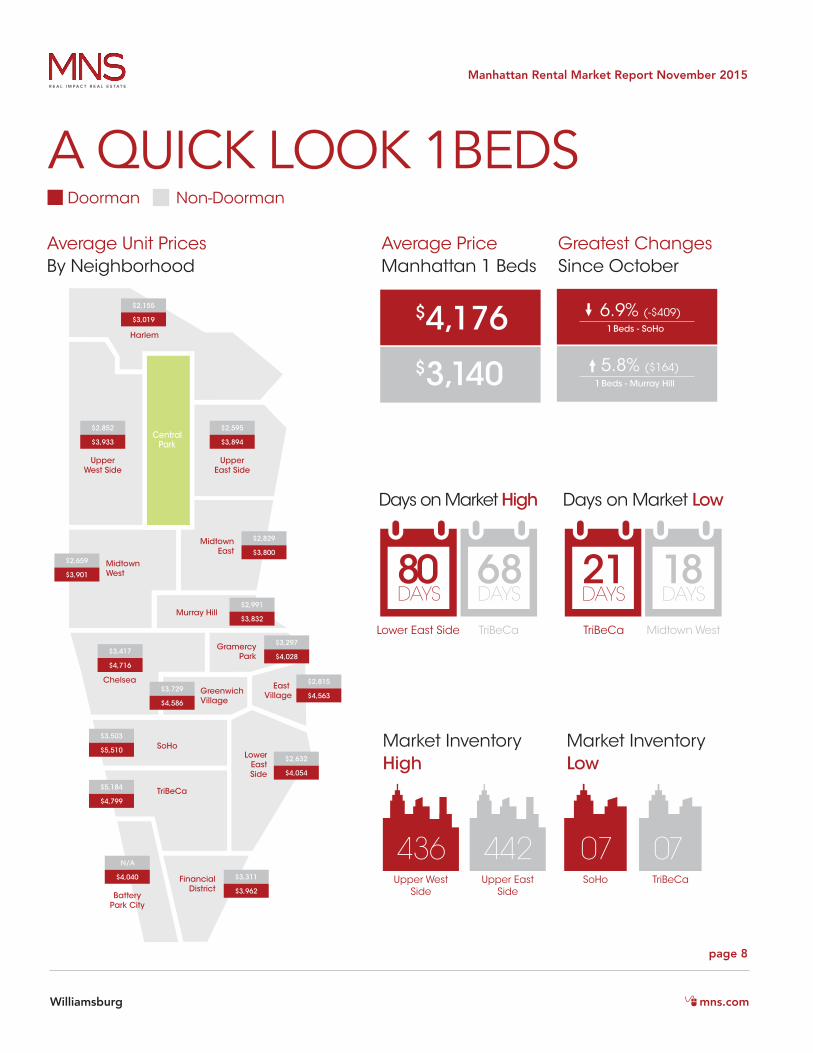
Average Unit Prices By Neighborhood
Average PriceManhattan Studios
3.6% (-$118)Studios - East Village
6.5% (-$148)Studios - Murray Hill
$2,960$2,418
page 8
Manhattan Rental Market Report November 2015
mns.comWilliamsburg
A QUICK LOOK 1BEDS
Harlem
UpperWest Side
UpperEast Side
MidtownWest
MidtownEast
Murray Hill
Chelsea
GramercyPark
GreenwichVillage
East Village
SoHoLower
EastSide
TriBeCa
BatteryPark City
FinancialDistrict
CentralPark
$2,155
$3,019
$2,852
$3,933
$2,659
$3,901
$3,417
$4,716
$3,503
$5,510
$5,184
$4,799
N/A
$4,040
$2,595
$3,894
$2,829
$3,800
$2,991
$3,832
$3,297
$4,028
$2,815
$4,563
$2,632
$4,054
$3,311
$3,962
$3,729
$4,586
Greatest ChangesSince October
Lower East Side TriBeCaTriBeCa Midtown West
80 2168 18DAYS DAYSDAYS DAYS
TriBeCaSoHo
Days on Market High Days on Market Low
Doorman Non-Doorman
442 07436 07
Average Unit Prices By Neighborhood
Average PriceManhattan 1 Beds
6.9% (-$409)1 Beds - SoHo
5.8% ($164)1 Beds - Murray Hill
$4,176$3,140
Market Inventory Low
Market Inventory High
Upper EastSide
Upper West Side

page 9
Manhattan Rental Market Report November 2015
mns.com mns.comWilliamsburg
A QUICK LOOK 2 BEDS
Harlem
UpperWest Side
UpperEast Side
MidtownWest
MidtownEast
Murray Hill
Chelsea
GramercyPark
GreenwichVillage
East Village
SoHoLower
EastSide
TriBeCa
BatteryPark City
FinancialDistrict
CentralPark
$2,664
$3,975
$3,773
$6,191
$3,390
$5,946
$4,658
$7,265
$5,448
$8,123
$8,294
$6,479
N/A
$6,841
$3,365
$6,139
$3,752
$5,664
$3,717
$5,627
$3,695
$6,534
$3,589
$6,486
$3,758
$6,084
$5,107
$5,643
$5,021
$6,690
Greatest ChangesSince October
50 2050 14DAYS DAYSDAYS DAYS
Murray HillSoHo
Days on Market High Days on Market Low
Doorman Non-Doorman
276 03299 04
Average Unit Prices By Neighborhood
Average PriceManhattan 2 Beds
5.2% ($357)2 Beds - TriBeCa
4.0% ($193)2 Beds - Chelsea
$6,246$4,302
Market Inventory Low
Market Inventory High
HarlemUpper WestSide
FiDi TriBeCaSoHo TriBeCa
page 10
Manhattan Rental Market Report November 2015
mns.comWilliamsburg
Type November 2014 November 2015 Change
Non-Doorman Studios $2,277 $2,418 6.2%
Non-Doorman One Bedrooms $3,026 $3,140 3.8%
Non-Doorman Two Bedrooms $4,157 $4,302 3.5%
Type November 2014 November 2015 Change
Doorman Studios $2,946 $2,960 0.5%
Doorman One Bedrooms $4,043 $4,176 3.3%
Doorman Two Bedrooms $5,900 $6,246 5.9%
A QUICK LOOK10.9%
UpperWest Side
4.8%
1.6% 2.4%
4.2%
6.1% 1.4%
1.8% 1.6%
19.7%
-2.4%
2.6%
7.2%
Battery Park City Financial District
CentralPark
Harlem
UpperEast Side
1.4%
Midtown West Midtown East
Murray Hill
Chelsea Gramercy Park
Greenwich Village East Village
Lower East SideSoHo
TriBeCa
7.9%
Year Over Year Price Change By Neighborhood
Year Over Year Price Change Manhattan Rents: November 2014 vs. November 2015
> 4.0% Change
1.6% - 3.9% Change
0.5% - 1.5% Change
< 0.5% Change
page 11
Manhattan Rental Market Report November 2015
mns.com mns.comWilliamsburg
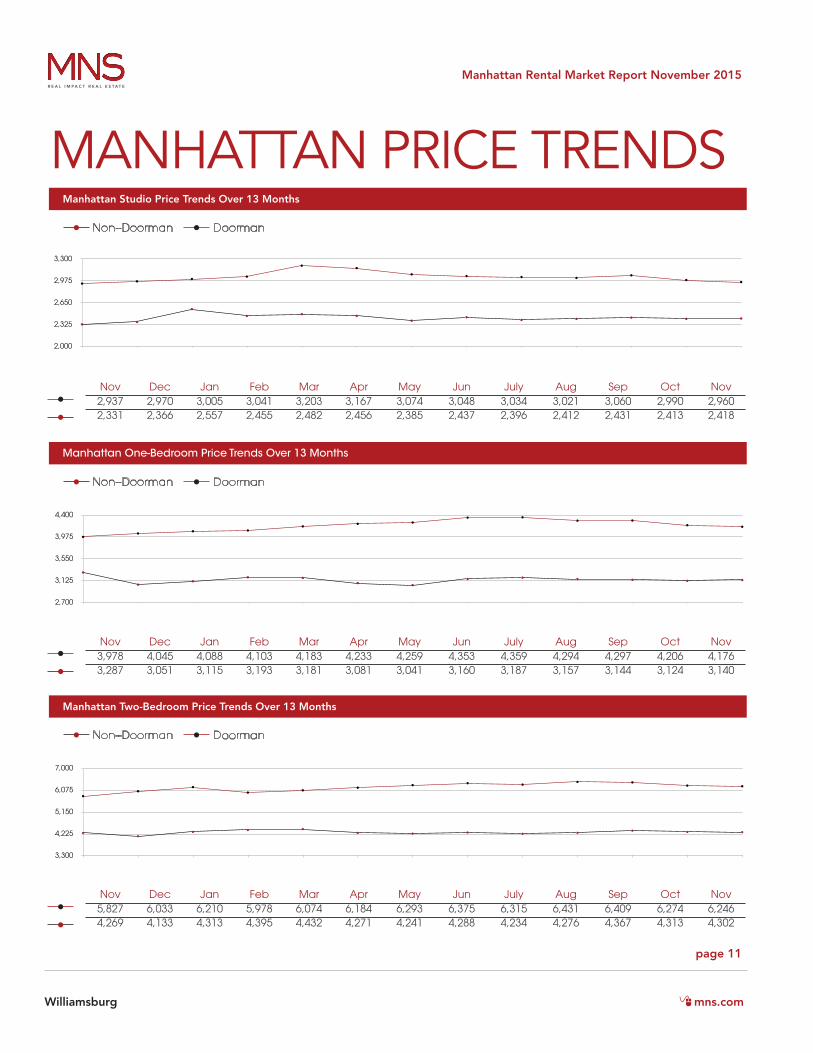
MANHATTAN PRICE TRENDSManhattan Studio Price Trends Over 13 Months
Manhattan One-Bedroom Price Trends Over 13 Months
Manhattan Two-Bedroom Price Trends Over 13 Months
Doorman
Doorman
Doorman
Non--Doorman
Non--Doorman
Non--Doorman
3,300
4,225
5,150
6,075
7,000
2,700
3,125
3,550
3,975
4,400
2,000
2,325
2,650
2,975
3,300
Nov Dec Jan Feb Mar Apr May Jun July Aug Sep Oct Nov2,937 2,970 3,005 3,041 3,203 3,167 3,074 3,048 3,034 3,021 3,060 2,990 2,9602,331 2,366 2,557 2,455 2,482 2,456 2,385 2,437 2,396 2,412 2,431 2,413 2,418
Nov Dec Jan Feb Mar Apr May Jun July Aug Sep Oct Nov3,978 4,045 4,088 4,103 4,183 4,233 4,259 4,353 4,359 4,294 4,297 4,206 4,1763,287 3,051 3,115 3,193 3,181 3,081 3,041 3,160 3,187 3,157 3,144 3,124 3,140
Nov Dec Jan Feb Mar Apr May Jun July Aug Sep Oct Nov5,827 6,033 6,210 5,978 6,074 6,184 6,293 6,375 6,315 6,431 6,409 6,274 6,2464,269 4,133 4,313 4,395 4,432 4,271 4,241 4,288 4,234 4,276 4,367 4,313 4,302
page 12
Manhattan Rental Market Report November 2015
mns.comWilliamsburg
BATTERY PARK CITY
Battery Park City Studio Price Trends Over 13 Months
Battery Park City One-Bedroom Price Trends Over 13 Months
Battery Park City Two-Bedroom Price Trends Over 13 Months
Doorman
Doorman
Doorman
Non--Doorman
Non--Doorman
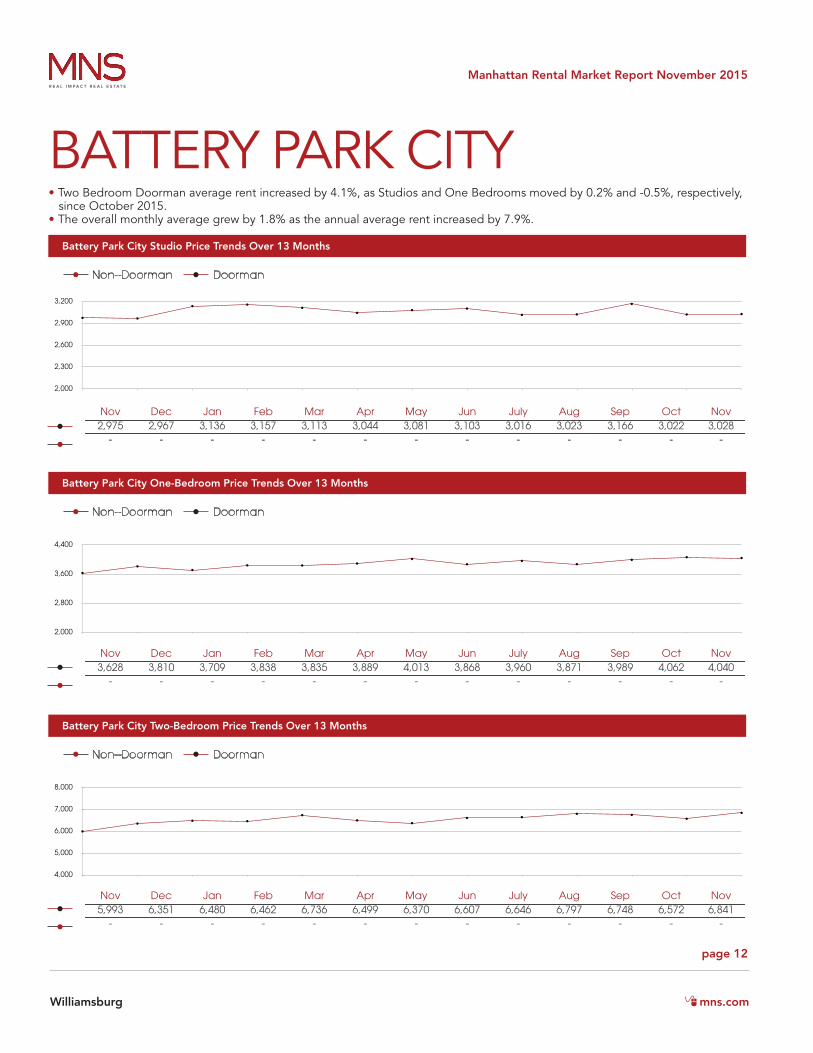
• Two Bedroom Doorman average rent increased by 4.1%, as Studios and One Bedrooms moved by 0.2% and -0.5%, respectively, since October 2015.• The overall monthly average grew by 1.8% as the annual average rent increased by 7.9%.
Non--Doorman
4,000
5,000
6,000
7,000
8,000
2,000
2,800
3,600
4,400
2,000
2,300
2,600
2,900
3,200
Nov Dec Jan Feb Mar Apr May Jun July Aug Sep Oct Nov2,975 2,967 3,136 3,157 3,113 3,044 3,081 3,103 3,016 3,023 3,166 3,022 3,028
- - - - - - - - - - - - -
Nov Dec Jan Feb Mar Apr May Jun July Aug Sep Oct Nov3,628 3,810 3,709 3,838 3,835 3,889 4,013 3,868 3,960 3,871 3,989 4,062 4,040
- - - - - - - - - - - - -
Nov Dec Jan Feb Mar Apr May Jun July Aug Sep Oct Nov5,993 6,351 6,480 6,462 6,736 6,499 6,370 6,607 6,646 6,797 6,748 6,572 6,841
- - - - - - - - - - - - -
page 13
Manhattan Rental Market Report November 2015
mns.com mns.comWilliamsburg
CHELSEA
Chelsea Studio Price Trends Over 13 Months
Chelsea One-Bedroom Price Trends Over 13 Months
Chelsea Two-Bedroom Price Trends Over 13 Months
Doorman
Doorman
Doorman
Non--Doorman
Non--Doorman
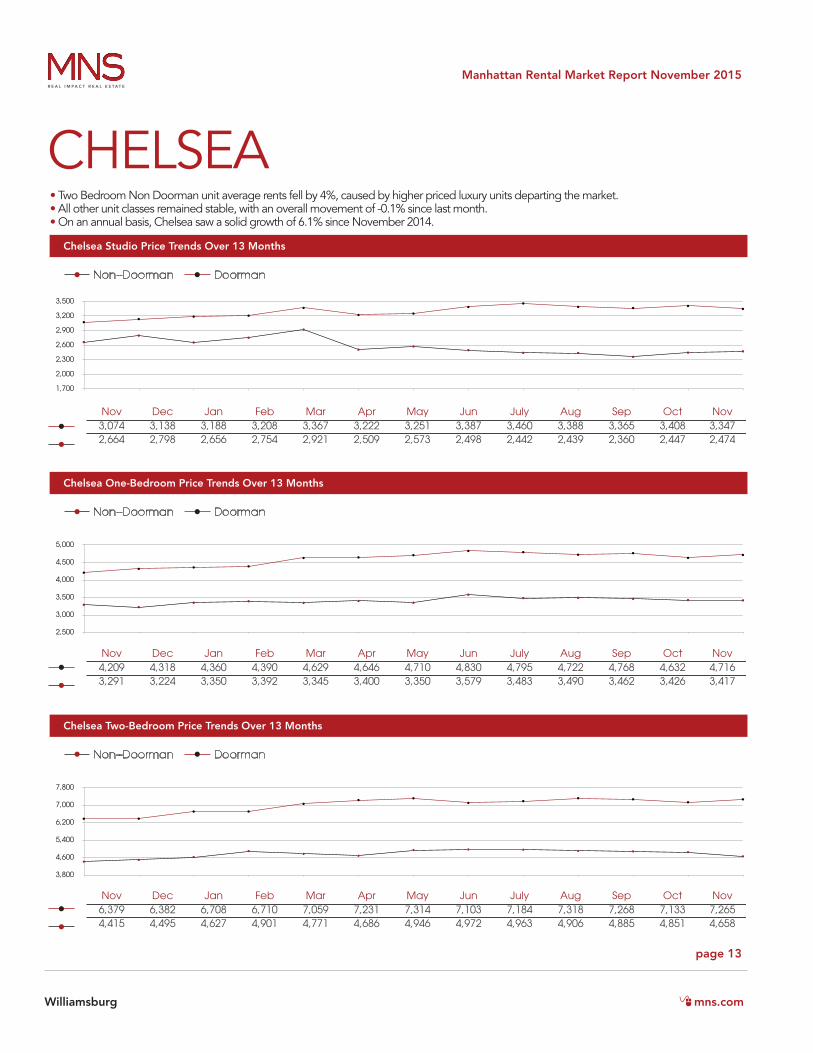
• Two Bedroom Non Doorman unit average rents fell by 4%, caused by higher priced luxury units departing the market. • All other unit classes remained stable, with an overall movement of -0.1% since last month. • On an annual basis, Chelsea saw a solid growth of 6.1% since November 2014.
Non--Doorman
3,800
4,600
5,400
6,200
7,000
7,800
2,500
3,000
3,500
4,000
4,500
5,000
1,700
2,000
2,300
2,600
2,900
3,200
3,500
Nov Dec Jan Feb Mar Apr May Jun July Aug Sep Oct Nov3,074 3,138 3,188 3,208 3,367 3,222 3,251 3,387 3,460 3,388 3,365 3,408 3,3472,664 2,798 2,656 2,754 2,921 2,509 2,573 2,498 2,442 2,439 2,360 2,447 2,474
Nov Dec Jan Feb Mar Apr May Jun July Aug Sep Oct Nov4,209 4,318 4,360 4,390 4,629 4,646 4,710 4,830 4,795 4,722 4,768 4,632 4,7163,291 3,224 3,350 3,392 3,345 3,400 3,350 3,579 3,483 3,490 3,462 3,426 3,417
Nov Dec Jan Feb Mar Apr May Jun July Aug Sep Oct Nov6,379 6,382 6,708 6,710 7,059 7,231 7,314 7,103 7,184 7,318 7,268 7,133 7,2654,415 4,495 4,627 4,901 4,771 4,686 4,946 4,972 4,963 4,906 4,885 4,851 4,658
page 14
Manhattan Rental Market Report November 2015
mns.comWilliamsburg
EAST VILLAGE
East Village Studio Price Trends Over 13 Months
East Village One-Bedroom Price Trends Over 13 Months
East Village Two-Bedroom Price Trends Over 13 Months
Doorman
Doorman
Doorman
Non--Doorman
Non--Doorman
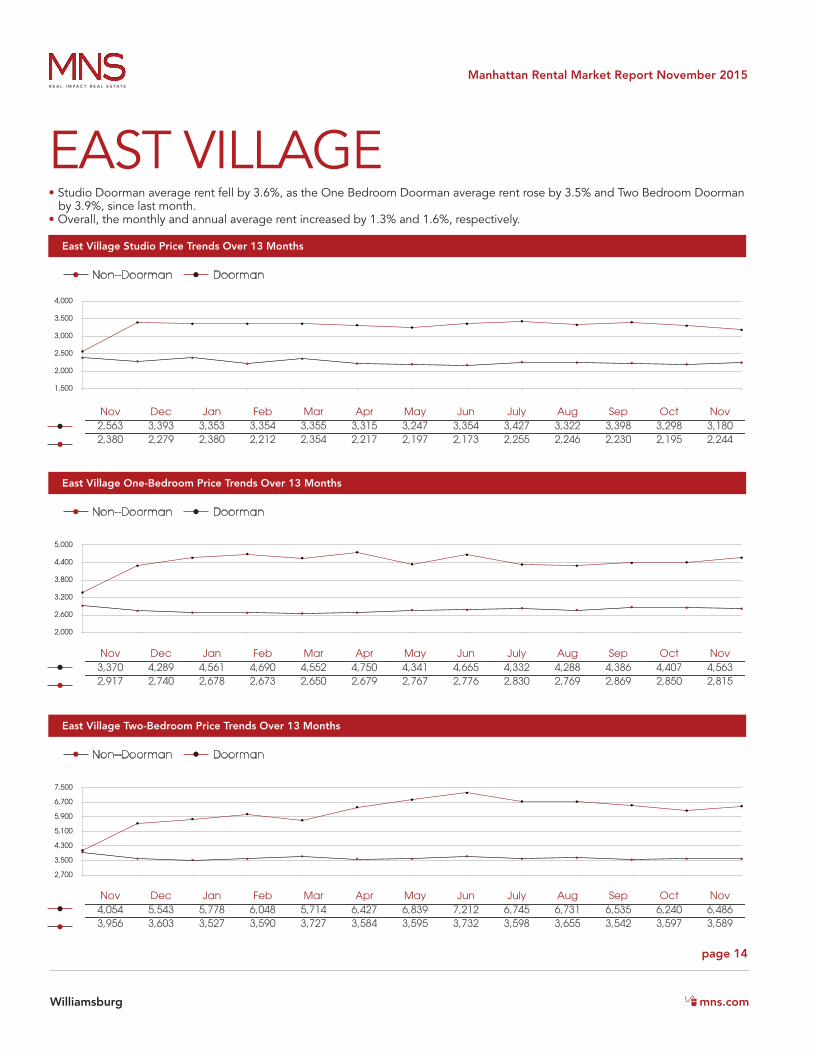
• Studio Doorman average rent fell by 3.6%, as the One Bedroom Doorman average rent rose by 3.5% and Two Bedroom Doorman by 3.9%, since last month.• Overall, the monthly and annual average rent increased by 1.3% and 1.6%, respectively.
Non--Doorman
2,700
3,500
4,300
5,100
5,900
6,700
7,500
2,000
2,600
3,200
3,800
4,400
5,000
1,500
2,000
2,500
3,000
3,500
4,000
Nov Dec Jan Feb Mar Apr May Jun July Aug Sep Oct Nov2,563 3,393 3,353 3,354 3,355 3,315 3,247 3,354 3,427 3,322 3,398 3,298 3,1802,380 2,279 2,380 2,212 2,354 2,217 2,197 2,173 2,255 2,246 2,230 2,195 2,244
Nov Dec Jan Feb Mar Apr May Jun July Aug Sep Oct Nov3,370 4,289 4,561 4,690 4,552 4,750 4,341 4,665 4,332 4,288 4,386 4,407 4,5632,917 2,740 2,678 2,673 2,650 2,679 2,767 2,776 2,830 2,769 2,869 2,850 2,815
Nov Dec Jan Feb Mar Apr May Jun July Aug Sep Oct Nov4,054 5,543 5,778 6,048 5,714 6,427 6,839 7,212 6,745 6,731 6,535 6,240 6,4863,956 3,603 3,527 3,590 3,727 3,584 3,595 3,732 3,598 3,655 3,542 3,597 3,589
page 15
Manhattan Rental Market Report November 2015
mns.com mns.comWilliamsburg
FINANCIAL DISTRICT
Financial District Studio Price Trends Over 13 Months
Financial District One-Bedroom Price Trends Over 13 Months
Financial District Two-Bedroom Price Trends Over 13 Months
Doorman
Doorman
Doorman
Non--Doorman
Non--Doorman
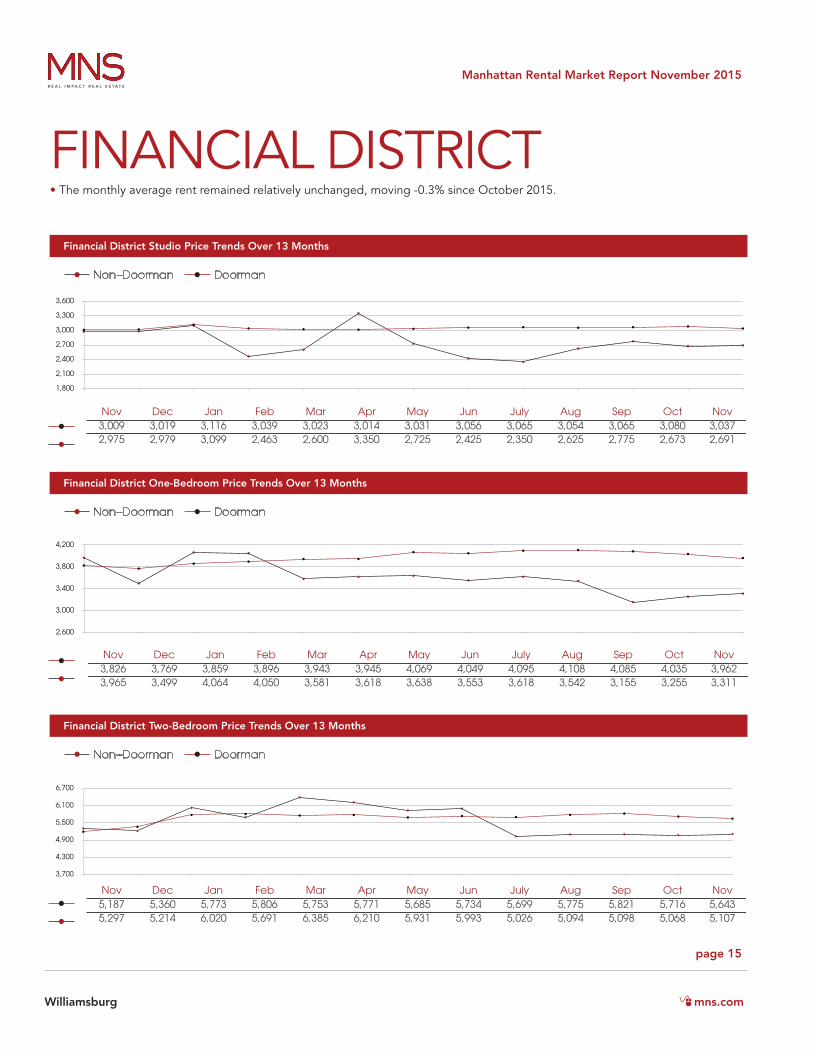
• The monthly average rent remained relatively unchanged, moving -0.3% since October 2015.
Non--Doorman
3,700
4,300
4,900
5,500
6,100
6,700
2,600
3,000
3,400
3,800
4,200
1,800
2,100
2,400
2,700
3,000
3,300
3,600
Nov Dec Jan Feb Mar Apr May Jun July Aug Sep Oct Nov3,009 3,019 3,116 3,039 3,023 3,014 3,031 3,056 3,065 3,054 3,065 3,080 3,0372,975 2,979 3,099 2,463 2,600 3,350 2,725 2,425 2,350 2,625 2,775 2,673 2,691
Nov Dec Jan Feb Mar Apr May Jun July Aug Sep Oct Nov3,826 3,769 3,859 3,896 3,943 3,945 4,069 4,049 4,095 4,108 4,085 4,035 3,9623,965 3,499 4,064 4,050 3,581 3,618 3,638 3,553 3,618 3,542 3,155 3,255 3,311
Nov Dec Jan Feb Mar Apr May Jun July Aug Sep Oct Nov5,187 5,360 5,773 5,806 5,753 5,771 5,685 5,734 5,699 5,775 5,821 5,716 5,6435,297 5,214 6,020 5,691 6,385 6,210 5,931 5,993 5,026 5,094 5,098 5,068 5,107

page 16
Manhattan Rental Market Report November 2015
mns.comWilliamsburg
GRAMERCY PARK
Gramercy Park Studio Price Trends Over 13 Months
Gramercy Park One-Bedroom Price Trends Over 13 Months
Gramercy Park Two-Bedroom Price Trends Over 13 Months
Doorman
Doorman
Doorman
Non--Doorman
Non--Doorman
• The monthly average rent remained relatively unchanged, moving -0.5% since October 2015.
Non--Doorman
3,500
4,500
5,500
6,500
7,500
2,500
3,100
3,700
4,300
4,900
1,900
2,200
2,500
2,800
3,100
3,400
Nov Dec Jan Feb Mar Apr May Jun July Aug Sep Oct Nov3,038 3,041 2,860 2,896 2,831 2,898 2,872 2,906 2,871 2,906 2,895 2,890 2,9122,406 2,370 2,372 2,462 2,480 2,341 2,379 2,407 2,317 2,329 2,389 2,392 2,381
Nov Dec Jan Feb Mar Apr May Jun July Aug Sep Oct Nov4,083 4,024 4,385 4,324 4,309 4,270 4,249 4,212 4,149 4,087 4,181 4,082 4,0283,100 2,964 2,897 2,921 2,983 2,753 2,748 3,249 3,332 3,300 3,357 3,309 3,297
Nov Dec Jan Feb Mar Apr May Jun July Aug Sep Oct Nov6,416 5,474 6,327 6,402 5,950 6,329 6,240 6,826 6,764 6,999 6,929 6,656 6,5344,291 3,901 4,293 4,830 4,877 3,783 3,862 3,888 3,637 3,592 3,682 3,629 3,695
page 17
Manhattan Rental Market Report November 2015
mns.com mns.comWilliamsburg
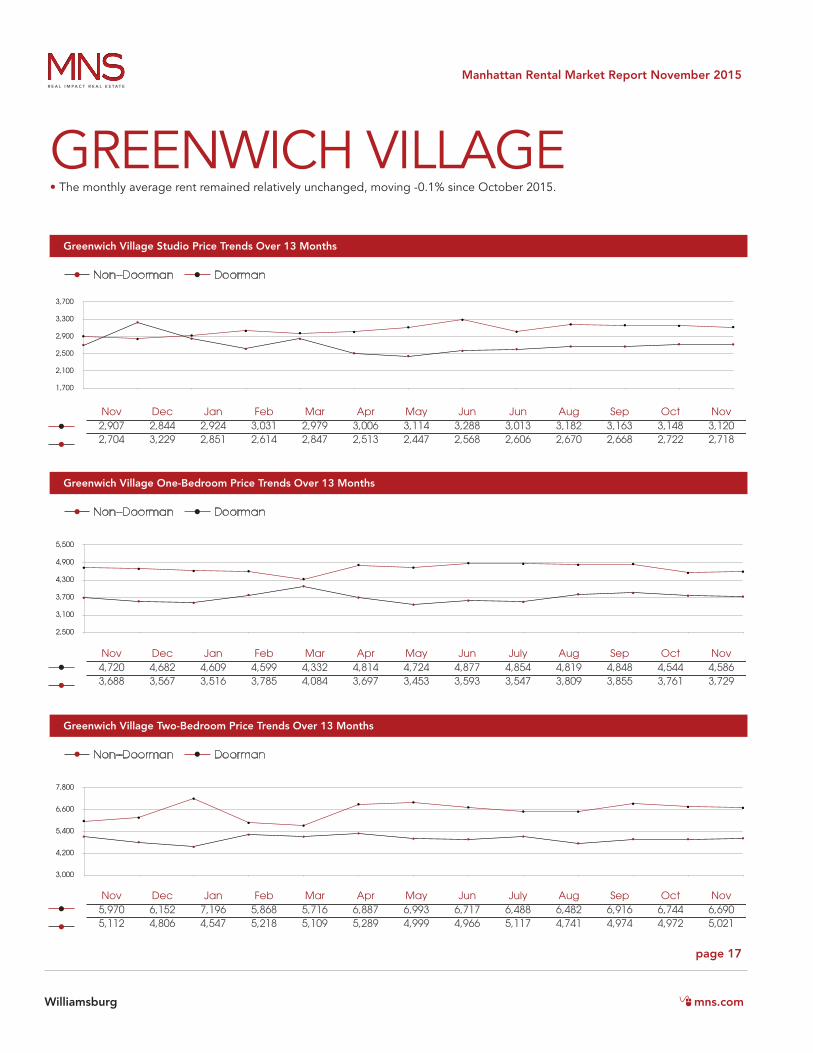
GREENWICH VILLAGE
Greenwich Village Studio Price Trends Over 13 Months
Greenwich Village One-Bedroom Price Trends Over 13 Months
Greenwich Village Two-Bedroom Price Trends Over 13 Months
Doorman
Doorman
Doorman
Non--Doorman
Non--Doorman
• The monthly average rent remained relatively unchanged, moving -0.1% since October 2015.
Non--Doorman
3,000
4,200
5,400
6,600
7,800
2,500
3,100
3,700
4,300
4,900
5,500
1,700
2,100
2,500
2,900
3,300
3,700
Nov Dec Jan Feb Mar Apr May Jun Jun Aug Sep Oct Nov2,907 2,844 2,924 3,031 2,979 3,006 3,114 3,288 3,013 3,182 3,163 3,148 3,1202,704 3,229 2,851 2,614 2,847 2,513 2,447 2,568 2,606 2,670 2,668 2,722 2,718
Nov Dec Jan Feb Mar Apr May Jun July Aug Sep Oct Nov4,720 4,682 4,609 4,599 4,332 4,814 4,724 4,877 4,854 4,819 4,848 4,544 4,5863,688 3,567 3,516 3,785 4,084 3,697 3,453 3,593 3,547 3,809 3,855 3,761 3,729
Nov Dec Jan Feb Mar Apr May Jun July Aug Sep Oct Nov5,970 6,152 7,196 5,868 5,716 6,887 6,993 6,717 6,488 6,482 6,916 6,744 6,6905,112 4,806 4,547 5,218 5,109 5,289 4,999 4,966 5,117 4,741 4,974 4,972 5,021
page 18
Manhattan Rental Market Report November 2015
mns.comWilliamsburg
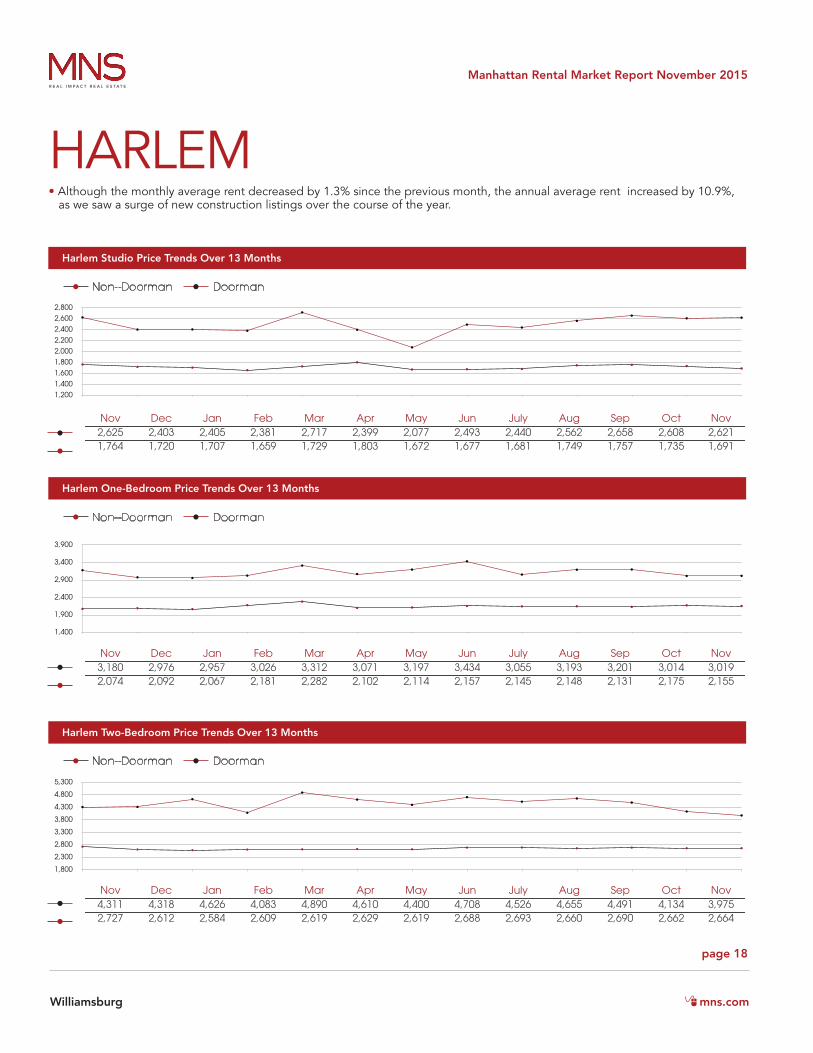
HARLEM
Harlem Studio Price Trends Over 13 Months
Harlem One-Bedroom Price Trends Over 13 Months
Harlem Two-Bedroom Price Trends Over 13 Months
Doorman
Doorman
Doorman
Non--Doorman
Non--Doorman
• Although the monthly average rent decreased by 1.3% since the previous month, the annual average rent increased by 10.9%, as we saw a surge of new construction listings over the course of the year.
Non--Doorman
1,800
2,300
2,800
3,300
3,800
4,300
4,800
5,300
1,400
1,900
2,400
2,900
3,400
3,900
1,2001,4001,6001,8002,0002,2002,4002,6002,800
Nov Dec Jan Feb Mar Apr May Jun July Aug Sep Oct Nov2,625 2,403 2,405 2,381 2,717 2,399 2,077 2,493 2,440 2,562 2,658 2,608 2,6211,764 1,720 1,707 1,659 1,729 1,803 1,672 1,677 1,681 1,749 1,757 1,735 1,691
Nov Dec Jan Feb Mar Apr May Jun July Aug Sep Oct Nov3,180 2,976 2,957 3,026 3,312 3,071 3,197 3,434 3,055 3,193 3,201 3,014 3,0192,074 2,092 2,067 2,181 2,282 2,102 2,114 2,157 2,145 2,148 2,131 2,175 2,155
Nov Dec Jan Feb Mar Apr May Jun July Aug Sep Oct Nov4,311 4,318 4,626 4,083 4,890 4,610 4,400 4,708 4,526 4,655 4,491 4,134 3,9752,727 2,612 2,584 2,609 2,619 2,629 2,619 2,688 2,693 2,660 2,690 2,662 2,664
page 19
Manhattan Rental Market Report November 2015
mns.com mns.comWilliamsburg
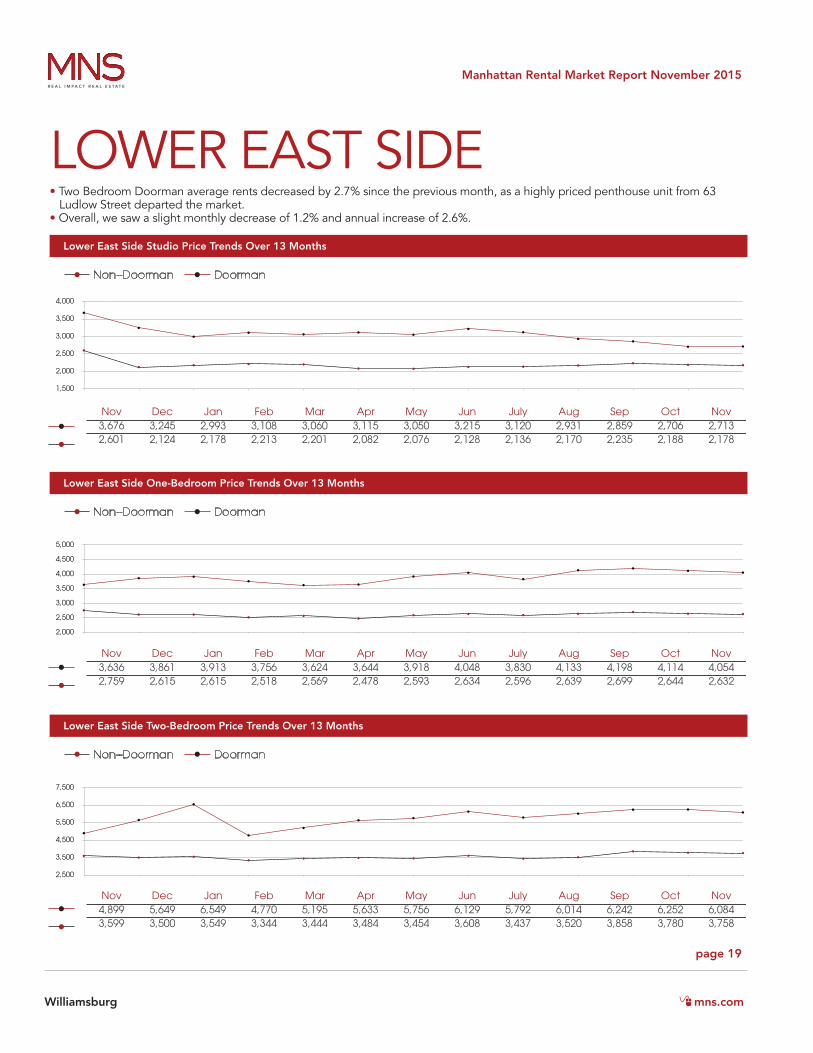
LOWER EAST SIDE
Lower East Side Studio Price Trends Over 13 Months
Lower East Side One-Bedroom Price Trends Over 13 Months
Lower East Side Two-Bedroom Price Trends Over 13 Months
Doorman
Doorman
Doorman
Non--Doorman
Non--Doorman
• Two Bedroom Doorman average rents decreased by 2.7% since the previous month, as a highly priced penthouse unit from 63 Ludlow Street departed the market. • Overall, we saw a slight monthly decrease of 1.2% and annual increase of 2.6%.
Non--Doorman
2,500
3,500
4,500
5,500
6,500
7,500
2,000
2,500
3,000
3,500
4,000
4,500
5,000
1,500
2,000
2,500
3,000
3,500
4,000
Nov Dec Jan Feb Mar Apr May Jun July Aug Sep Oct Nov3,676 3,245 2,993 3,108 3,060 3,115 3,050 3,215 3,120 2,931 2,859 2,706 2,7132,601 2,124 2,178 2,213 2,201 2,082 2,076 2,128 2,136 2,170 2,235 2,188 2,178
Nov Dec Jan Feb Mar Apr May Jun July Aug Sep Oct Nov3,636 3,861 3,913 3,756 3,624 3,644 3,918 4,048 3,830 4,133 4,198 4,114 4,0542,759 2,615 2,615 2,518 2,569 2,478 2,593 2,634 2,596 2,639 2,699 2,644 2,632
Nov Dec Jan Feb Mar Apr May Jun July Aug Sep Oct Nov4,899 5,649 6,549 4,770 5,195 5,633 5,756 6,129 5,792 6,014 6,242 6,252 6,0843,599 3,500 3,549 3,344 3,444 3,484 3,454 3,608 3,437 3,520 3,858 3,780 3,758
page 20
Manhattan Rental Market Report November 2015
mns.comWilliamsburg
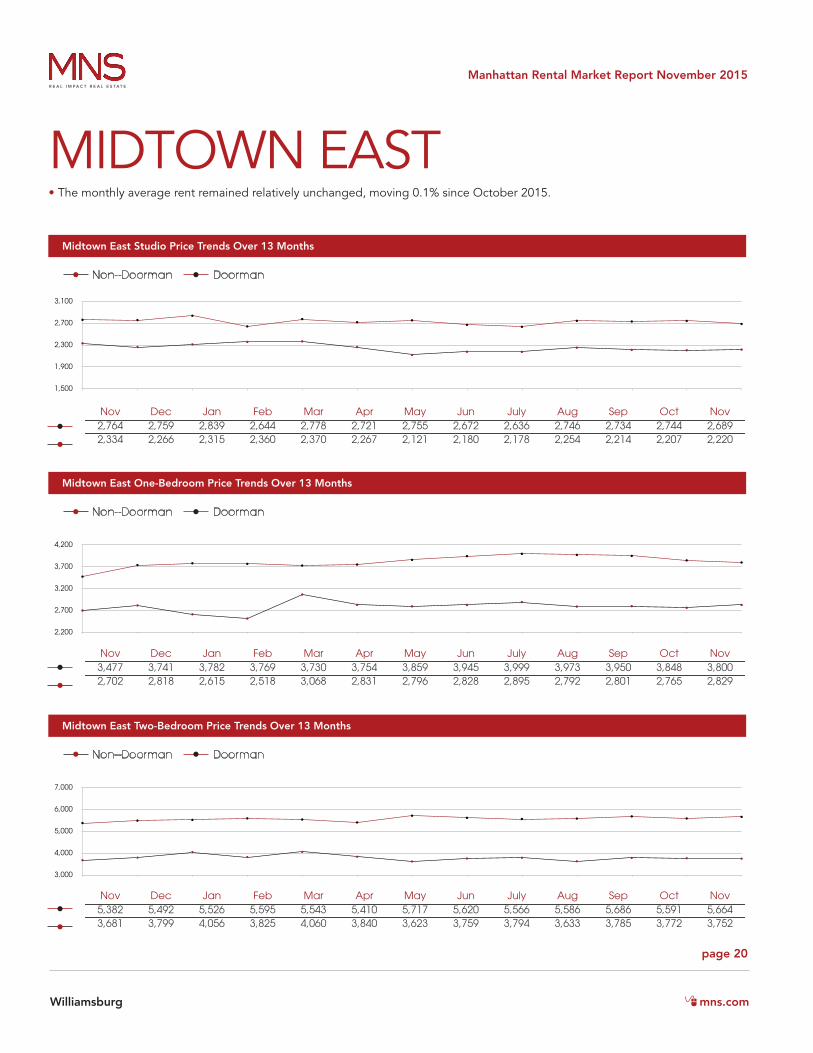
MIDTOWN EAST
Midtown East Studio Price Trends Over 13 Months
Midtown East One-Bedroom Price Trends Over 13 Months
Midtown East Two-Bedroom Price Trends Over 13 Months
Doorman
Doorman
Doorman
Non--Doorman
Non--Doorman
• The monthly average rent remained relatively unchanged, moving 0.1% since October 2015.
Non--Doorman
3,000
4,000
5,000
6,000
7,000
2,200
2,700
3,200
3,700
4,200
1,500
1,900
2,300
2,700
3,100
Nov Dec Jan Feb Mar Apr May Jun July Aug Sep Oct Nov2,764 2,759 2,839 2,644 2,778 2,721 2,755 2,672 2,636 2,746 2,734 2,744 2,6892,334 2,266 2,315 2,360 2,370 2,267 2,121 2,180 2,178 2,254 2,214 2,207 2,220
Nov Dec Jan Feb Mar Apr May Jun July Aug Sep Oct Nov3,477 3,741 3,782 3,769 3,730 3,754 3,859 3,945 3,999 3,973 3,950 3,848 3,8002,702 2,818 2,615 2,518 3,068 2,831 2,796 2,828 2,895 2,792 2,801 2,765 2,829
Nov Dec Jan Feb Mar Apr May Jun July Aug Sep Oct Nov5,382 5,492 5,526 5,595 5,543 5,410 5,717 5,620 5,566 5,586 5,686 5,591 5,6643,681 3,799 4,056 3,825 4,060 3,840 3,623 3,759 3,794 3,633 3,785 3,772 3,752

page 21
Manhattan Rental Market Report November 2015
mns.com mns.comWilliamsburg
MIDTOWN WEST
Midtown West Studio Price Trends Over 13 Months
Midtown West One-Bedroom Price Trends Over 13 Months
Midtown West Two-Bedroom Price Trends Over 13 Months
Doorman
Doorman
Doorman
Non--Doorman
Non--Doorman
• As the One Bedroom Non Doorman average rent rose by 2.5%, all other unit classes dropped between -0.1% to -2.9%.• Although the overall monthly average fell slightly at 1.5% as a result of these downward movements, the annual average rent increased by 1.6% since November 2014.
Non--Doorman
2,400
3,400
4,400
5,400
6,400
2,100
2,600
3,100
3,600
4,100
4,600
1,600
2,000
2,400
2,800
3,200
Nov Dec Jan Feb Mar Apr May Jun July Aug Sep Oct Nov2,928 2,982 2,908 2,877 2,903 2,914 2,933 3,021 3,021 3,063 3,024 2,955 2,9092,166 2,145 2,212 2,165 2,187 2,310 2,193 2,184 2,245 2,295 2,315 2,195 2,193
Nov Dec Jan Feb Mar Apr May Jun July Aug Sep Oct Nov3,890 3,887 3,915 3,940 4,001 4,029 4,062 4,002 4,033 4,026 4,034 3,964 3,9012,681 2,676 2,757 2,742 2,676 2,706 2,785 2,698 2,694 2,660 2,651 2,594 2,659
July Aug Sep Oct Nov Dec Jan Feb Mar Apr May Jun July5,977 5,690 5,778 5,891 6,032 5,813 5,982 5,951 5,918 5,915 5,868 5,926 6,2873,414 3,298 3,337 3,393 3,393 3,399 3,539 3,641 3,559 3,413 3,419 3,590 3,586
Nov Dec Jan Feb Mar Apr May Jun July Aug Sep Oct Nov6,032 5,813 5,982 5,951 5,918 5,915 5,868 5,926 6,287 6,158 6,041 6,126 5,9463,393 3,399 3,539 3,641 3,559 3,413 3,419 3,590 3,586 3,649 3,625 3,484 3,390
page 22
Manhattan Rental Market Report November 2015
mns.comWilliamsburg
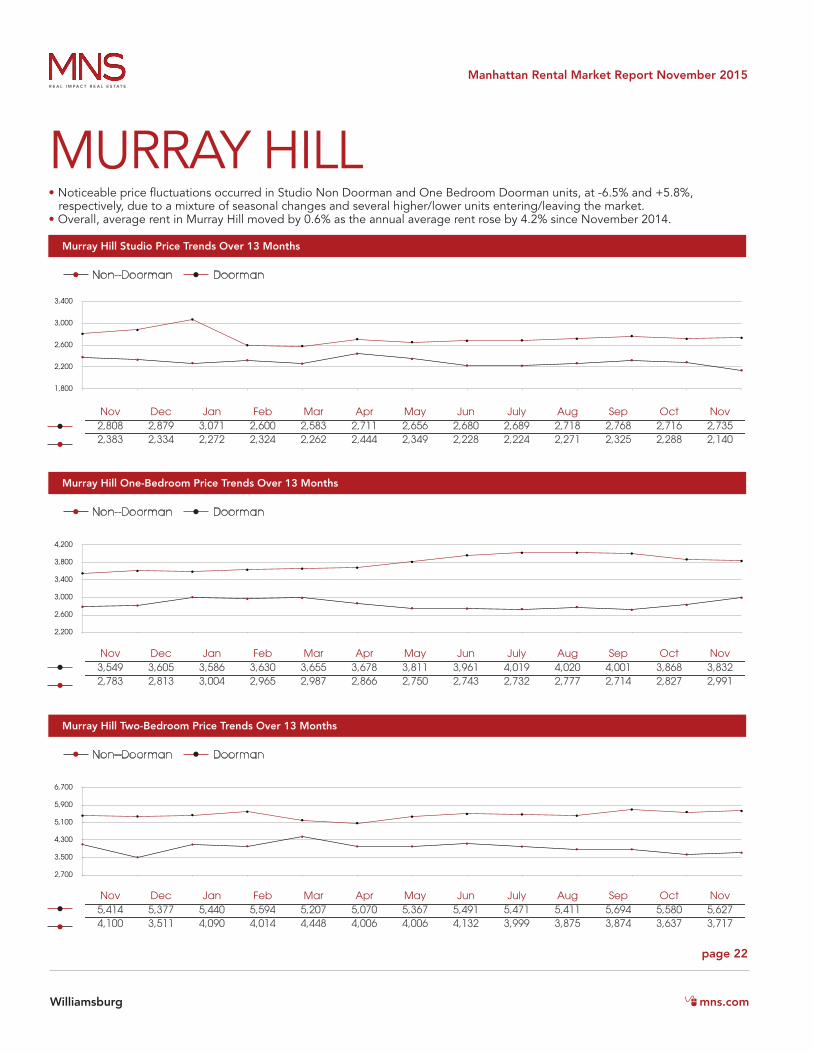
MURRAY HILL
Murray Hill Studio Price Trends Over 13 Months
Murray Hill One-Bedroom Price Trends Over 13 Months
Murray Hill Two-Bedroom Price Trends Over 13 Months
Doorman
Doorman
Doorman
Non--Doorman
Non--Doorman
• Noticeable price fluctuations occurred in Studio Non Doorman and One Bedroom Doorman units, at -6.5% and +5.8%, respectively, due to a mixture of seasonal changes and several higher/lower units entering/leaving the market.• Overall, average rent in Murray Hill moved by 0.6% as the annual average rent rose by 4.2% since November 2014.
Non--Doorman
2,700
3,500
4,300
5,100
5,900
6,700
2,200
2,600
3,000
3,400
3,800
4,200
1,800
2,200
2,600
3,000
3,400
Nov Dec Jan Feb Mar Apr May Jun July Aug Sep Oct Nov2,808 2,879 3,071 2,600 2,583 2,711 2,656 2,680 2,689 2,718 2,768 2,716 2,7352,383 2,334 2,272 2,324 2,262 2,444 2,349 2,228 2,224 2,271 2,325 2,288 2,140
Nov Dec Jan Feb Mar Apr May Jun July Aug Sep Oct Nov3,549 3,605 3,586 3,630 3,655 3,678 3,811 3,961 4,019 4,020 4,001 3,868 3,8322,783 2,813 3,004 2,965 2,987 2,866 2,750 2,743 2,732 2,777 2,714 2,827 2,991
Nov Dec Jan Feb Mar Apr May Jun July Aug Sep Oct Nov5,414 5,377 5,440 5,594 5,207 5,070 5,367 5,491 5,471 5,411 5,694 5,580 5,6274,100 3,511 4,090 4,014 4,448 4,006 4,006 4,132 3,999 3,875 3,874 3,637 3,717
page 23
Manhattan Rental Market Report November 2015
mns.com mns.comWilliamsburg
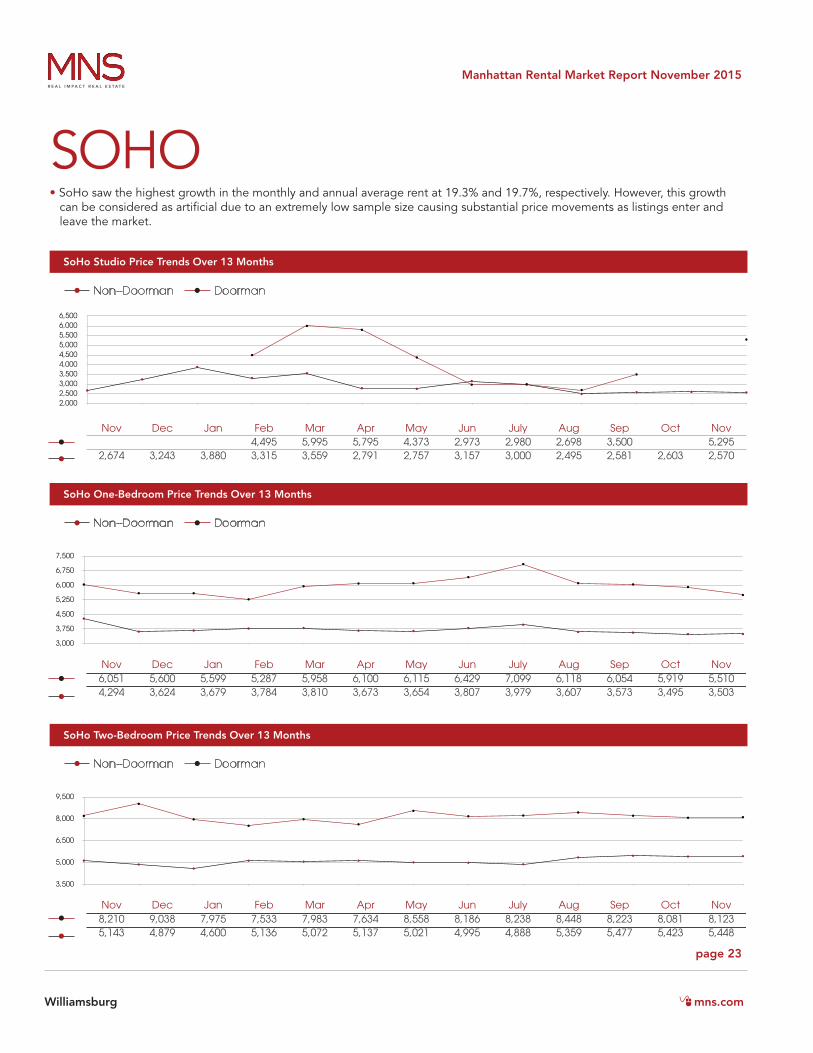
SOHO
SoHo Studio Price Trends Over 13 Months
SoHo One-Bedroom Price Trends Over 13 Months
SoHo Two-Bedroom Price Trends Over 13 Months
Doorman
Doorman
Doorman
Non--Doorman
Non--Doorman
• SoHo saw the highest growth in the monthly and annual average rent at 19.3% and 19.7%, respectively. However, this growth can be considered as artificial due to an extremely low sample size causing substantial price movements as listings enter and leave the market.
Non--Doorman
3,500
5,000
6,500
8,000
9,500
3,000
3,750
4,500
5,250
6,000
6,750
7,500
2,0002,5003,0003,5004,0004,5005,0005,5006,0006,500
Nov Dec Jan Feb Mar Apr May Jun July Aug Sep Oct Nov4,495 5,995 5,795 4,373 2,973 2,980 2,698 3,500 5,295
2,674 3,243 3,880 3,315 3,559 2,791 2,757 3,157 3,000 2,495 2,581 2,603 2,570
Nov Dec Jan Feb Mar Apr May Jun July Aug Sep Oct Nov6,051 5,600 5,599 5,287 5,958 6,100 6,115 6,429 7,099 6,118 6,054 5,919 5,5104,294 3,624 3,679 3,784 3,810 3,673 3,654 3,807 3,979 3,607 3,573 3,495 3,503
Nov Dec Jan Feb Mar Apr May Jun July Aug Sep Oct Nov8,210 9,038 7,975 7,533 7,983 7,634 8,558 8,186 8,238 8,448 8,223 8,081 8,1235,143 4,879 4,600 5,136 5,072 5,137 5,021 4,995 4,888 5,359 5,477 5,423 5,448
page 24
Manhattan Rental Market Report November 2015
mns.comWilliamsburg
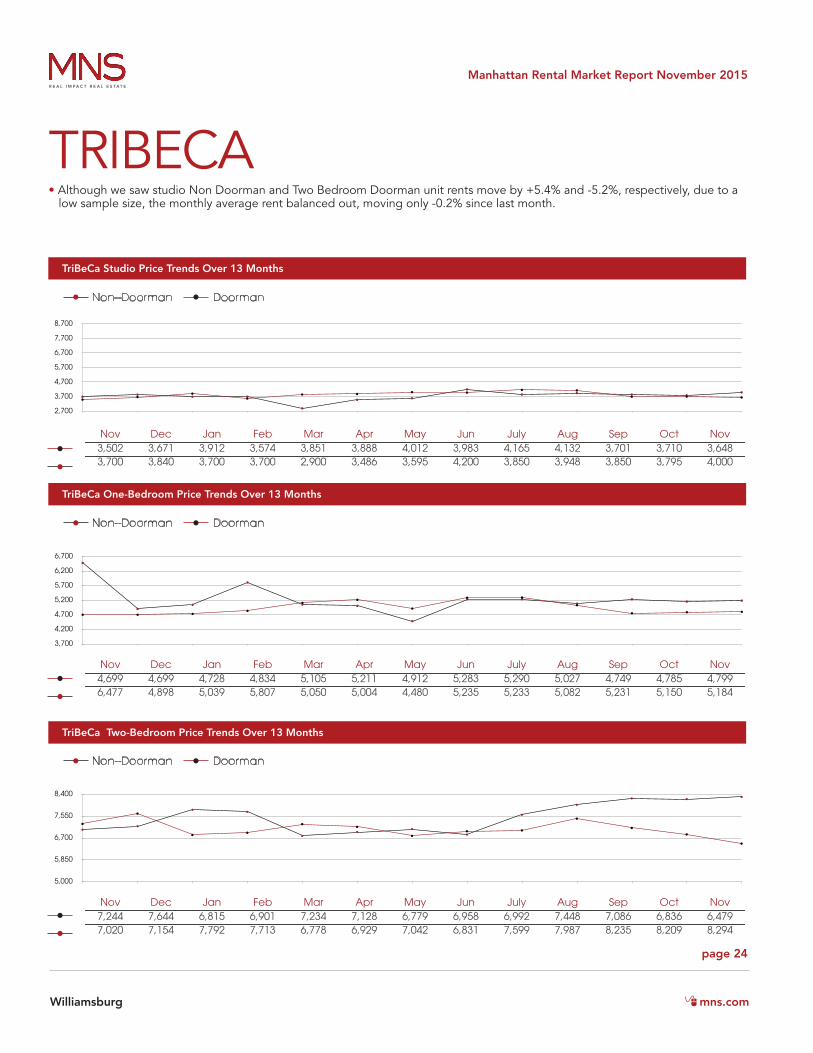
TRIBECA
TriBeCa Studio Price Trends Over 13 Months
TriBeCa One-Bedroom Price Trends Over 13 Months
TriBeCa Two-Bedroom Price Trends Over 13 Months
Doorman
Doorman
Doorman
Non--Doorman
Non--Doorman
• Although we saw studio Non Doorman and Two Bedroom Doorman unit rents move by +5.4% and -5.2%, respectively, due to a low sample size, the monthly average rent balanced out, moving only -0.2% since last month.
Non--Doorman
5,000
5,850
6,700
7,550
8,400
3,700
4,200
4,700
5,200
5,700
6,200
6,700
2,700
3,700
4,700
5,700
6,700
7,700
8,700
Nov Dec Jan Feb Mar Apr May Jun July Aug Sep Oct Nov3,502 3,671 3,912 3,574 3,851 3,888 4,012 3,983 4,165 4,132 3,701 3,710 3,6483,700 3,840 3,700 3,700 2,900 3,486 3,595 4,200 3,850 3,948 3,850 3,795 4,000
Nov Dec Jan Feb Mar Apr May Jun July Aug Sep Oct Nov4,699 4,699 4,728 4,834 5,105 5,211 4,912 5,283 5,290 5,027 4,749 4,785 4,7996,477 4,898 5,039 5,807 5,050 5,004 4,480 5,235 5,233 5,082 5,231 5,150 5,184
Nov Dec Jan Feb Mar Apr May Jun July Aug Sep Oct Nov7,244 7,644 6,815 6,901 7,234 7,128 6,779 6,958 6,992 7,448 7,086 6,836 6,4797,020 7,154 7,792 7,713 6,778 6,929 7,042 6,831 7,599 7,987 8,235 8,209 8,294
page 25
Manhattan Rental Market Report November 2015
mns.com mns.comWilliamsburg
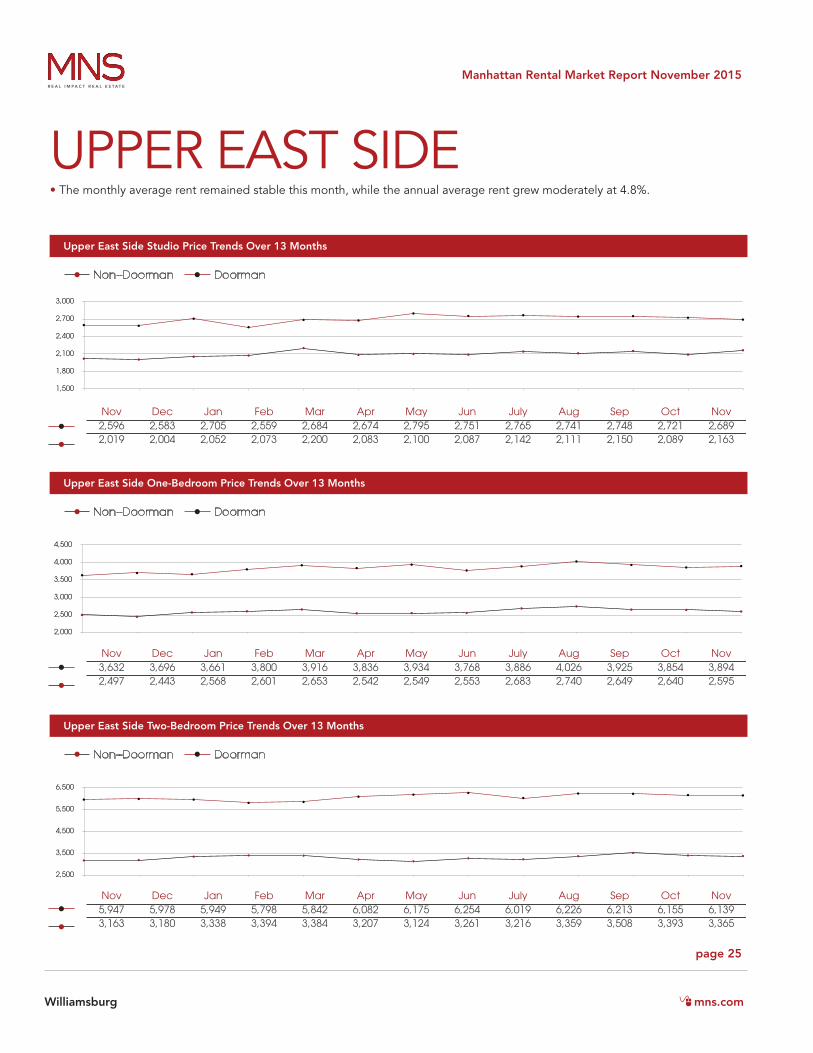
UPPER EAST SIDE
Upper East Side Studio Price Trends Over 13 Months
Upper East Side One-Bedroom Price Trends Over 13 Months
Upper East Side Two-Bedroom Price Trends Over 13 Months
Doorman
Doorman
Doorman
Non--Doorman
Non--Doorman
• The monthly average rent remained stable this month, while the annual average rent grew moderately at 4.8%.
Non--Doorman
2,500
3,500
4,500
5,500
6,500
2,000
2,500
3,000
3,500
4,000
4,500
1,500
1,800
2,100
2,400
2,700
3,000
Nov Dec Jan Feb Mar Apr May Jun July Aug Sep Oct Nov2,596 2,583 2,705 2,559 2,684 2,674 2,795 2,751 2,765 2,741 2,748 2,721 2,6892,019 2,004 2,052 2,073 2,200 2,083 2,100 2,087 2,142 2,111 2,150 2,089 2,163
Nov Dec Jan Feb Mar Apr May Jun July Aug Sep Oct Nov3,632 3,696 3,661 3,800 3,916 3,836 3,934 3,768 3,886 4,026 3,925 3,854 3,8942,497 2,443 2,568 2,601 2,653 2,542 2,549 2,553 2,683 2,740 2,649 2,640 2,595
Nov Dec Jan Feb Mar Apr May Jun July Aug Sep Oct Nov5,947 5,978 5,949 5,798 5,842 6,082 6,175 6,254 6,019 6,226 6,213 6,155 6,1393,163 3,180 3,338 3,394 3,384 3,207 3,124 3,261 3,216 3,359 3,508 3,393 3,365

page 26
Manhattan Rental Market Report November 2015
mns.comWilliamsburg
UPPER WEST SIDE
Upper West Side Studio Price Trends Over 13 Months
Upper West Side One-Bedroom Price Trends Over 13 Months
Upper West Side Two-Bedroom Price Trends Over 13 Months
Doorman
Doorman
Doorman
Non--Doorman
Non--Doorman
• Non Doorman Studio and Two Bedroom average rents experienced decreases at 2.5% and 3.4%, respectively. • Overall, the monthly average rent fell by 1.6% as the annual average rent grew by 1.4% since November 2014.
Non--Doorman
2,500
3,700
4,900
6,100
7,300
2,200
2,600
3,000
3,400
3,800
4,200
1,600
1,900
2,200
2,500
2,800
3,100
Nov Dec Jan Feb Mar Apr May Jun July Aug Sep Oct Nov2,651 2,659 2,653 2,695 2,812 2,792 2,868 2,842 2,844 2,848 2,850 2,848 2,8082,195 2,161 2,126 2,063 2,145 2,188 2,208 2,202 2,122 2,163 2,181 2,248 2,192
Nov Dec Jan Feb Mar Apr May Jun July Aug Sep Oct Nov3,723 3,726 3,698 3,773 3,842 3,851 3,965 3,924 3,988 3,995 4,080 3,956 3,9332,788 2,743 2,765 2,769 2,796 2,784 2,894 2,835 2,849 2,848 2,872 2,845 2,852
Nov Dec Jan Feb Mar Apr May Jun July Aug Sep Oct Nov5,961 5,926 6,024 6,146 6,366 6,131 6,333 6,154 6,301 6,414 6,239 6,294 6,1913,863 3,816 3,818 3,620 3,819 3,601 3,739 3,621 3,723 3,838 3,910 3,904 3,773
page 27
Manhattan Rental Market Report November 2015
mns.com mns.comWilliamsburg
THE REPORT EXPLAINED
Author: MNS has been helping Manhattan & Brooklyn landlords and renters navigate the rental market since 1999. From large companies to individuals, MNS tailors services to meet your needs. Contact us today to see how we can help.
Contact Us Now: 212.475.9000
Note: All market data is collected and compiled by MNS’s marketing department. The information presented here is intended for instructive purposes only and has been gathered from sources deemed reliable, though it may be subject to errors, omissions, changes or withdrawal without notice.
If you would like to republish this report on the web, please be sure to source it as the “Manhattan Rental Market Report” with a link back to its original location
http://www.mns.com/manhattan_rental_market_report
The Manhattan Rental Market Report™ compares fluctuation in the city’s rental data on a monthly basis. It is an essential tool for potential renters seeking transparency in the NYC apartment market and a benchmark for landlords to efficiently and fairly adjust individual property rents in Manhattan.
The Manhattan Rental Market Report™ is based on data cross-sectioned from over 10,000 currently available listings located below 125th Street and priced under $10,000, with ultra-luxury property omitted to obtain a true monthly rental average. Our data is aggregated from the MNS proprietary database and sampled from a specific mid-month point to record current rental rates offered by landlords during that particular month. It is then combined with information from the REBNY Real Estate Listings Source (RLS), OnLine Residential (OLR. com) and R.O.L.E.X. (Real Plus).

mns.comWilliamsburg