Embed Size (px)
Citation preview
International Journal of Scientific & Engineering Research, Volume 7, Issue 1, January-2016 16 ISSN 2229-5518
IJSER © 2016 http://www.ijser.org
Population stabilization and Demographic dividend in India.
Manjul Mayank Pandey
Abstract: India is the second most populous country in the world with 1277 million population (in 2015). It is projected that India will surpass China by 2022. Population of China currently grows about 7 million per year while India’s about 18 million. Population growth rate of India is 1.2%, ranking 94th in the world in 2013. In India, 31.2% population is below the age of 14 years, 50% population is below the age of 25 years and more than 65%, below the age of 35 years. It is expected that in 2020, the average age of an Indian will be 29 years, compared to 37 for China and 48 for Japan by 2030.
The National Population Policy (NPP)-2000, clearly fixed the goal of replacement level before 2010, deadline for the country. According to a recently-released health ministry report, only, 11 states and three union territories have attained the goal of replacement level (TFR 2.1) before the 2010 deadline. EAG states are facing higher illiteracy rate, poor health services, deprived status of women in decision making and higher fertility rate which create pressure on resources and majority of the population deprived from basic amenities, still there is sign of progress. As per Census of India-2011, 45.9% population of the country belongs to EAG states, in which 52.1% females belongs to child bearing age group (15-49) years, with T FR 3.0. Among E AG states, two states, Bihar and U.P. having 25.1% population of the country, with highest TFR 3.5 and 3.3, and lowest female literacy rates, 51.5 & 57.2, respectively. Thus, future of India’s population stabilization depends mainly on EAG states’ effective population control and women empowerment through skill development schemes.
Population momentum (continue population growth after a fall in birth rates) accounts for a significant portion of population growth, even though fertility rate declined. As a result, a “bulge” or baby boom, generation distinctly larger than those preceding or following it is moving through the age structure of population. These large cohorts create both opportunities and challenges for society. As this cohort moves into working age group; it will be potentially higher share of workers as compared with dependent population. This working age’s population is called demographic dividend. If this population can be employed productively, according to their age structure with skilled development, economic growth of India will be accelerated.
The objective of this paper is to determine main constraints of population stabilization in India, its solution for demographic dividend. In this paper, it has been also established “How different educational levels of women and their different working groups affect fertility (ASFR and TFRs) pattern, in rural and urban areas of India.
To achieve the goal of population stabilization for demographic dividend, we should reconsider our population policy and its implementation for complete literacy rate, especial drive for female education beyond the threshold level (Up to Higher Secondary) and provide incentive to stop drop out of girl students, improved proportion of women in work participation, along with effective family planning-policies and its successful implementation, health and other welfare program for empowerment of women. Special attention must be given in E AG States, especially, in Uttar Pradesh and Bihar.
Index Terms: Population Dynamics, Age composition, Birth rates, Death rates, Total Fertility rates (T FR), Age Specific Fertility rates (A SFR), Immigration and Emigration, Chronic disease, Baby boom, Demographic transition, Population momentum, Cohorts, Policy reform, Boom, Bust, logistic curve, Economic dividend, Fecundity, Dependency ratio, Life expectancy and Replacement level, Demographic dividend.
—————————— ——————————
INTRODUCTION India is a developing country; overpopulation is one of the most basic causes of underdevelopment. This country is now facing with this acute problem, which tends to nullify most of the efforts of development. India was the first country in the world to launch family planning, in 1952 to the extent necessary for reducing birth rates to stabilize the population at a level consistent with the requirement of National economy. The National Health Policy 1983 failed to achieve the goal of replacement level, by the year 2000. Mr Srinivasan, put it as “a saga of great expec-tations and poor performance”. The new National Population Policy (NPP)-2000 declared and its documents clearly fixed the goal of re-placement level before 2010, deadline for the country. Due to regional imbalance in TFRs in Indian States, country is passing through phase III of demographic transition and birth rate approaching towards the replacement level (TFR 2.1).
Government along with non-governmental organizations and world bodies, are trying to solve this problem by declaring National Population Policy (NPP), establishment of National Population Commission under chairmanship of the Prime Minister and State Population Commis-
IJSER
International Journal of Scientific & Engineering Research, Volume 7, Issue 1, January-2016 17 ISSN 2229-5518
IJSER © 2016 http://www.ijser.org
sions under chairmanship of the Chief Ministers and declaring family planning and health policies and other welfare schemes, especially for women, etc. Fertility rates in all states are not uniform; it remains very high in some Empowered Action Group (E AG) States like, UP., Bihar, M. P., Rajasthan etc. These states having highest illiteracy and poverty. But some southern states, like Kerala, Tamil Nadu, A.P., Karnataka, Maharashtra etc., controlled it in a planned way and achieved the goal of replacement level.
The objective of this paper is to determine, main constraints of population stabilization in India, its solution for demographic dividend. In this paper, it has been also established “How different educational levels of women and their different working groups affect fertility (ASFR.and TFRs) pattern, in rural and urban areas of India.
India is the second most populous country of the world, with 1277 million population in 2015. It is projected that India will surpass China by 2022. Population of China currently grows about 7 million per year while India’s about 18 million. Population growth rate of India is 1.2%, ranking 94th in the world in 2013.In India, 31.2% population is below the age of 14 years, 50% population is below the age of 25 years and more than 65%, below the age of 35 years. It is expected that, in 2020, the average age of an Indian will be 29 years, compared to 37 for China and 48 for Japan by 2030.Global population has increased three times, during this century from 2 billion to 6 billion. The population of India has increased nearly five times from 238 million (23.8 crores) to 1 billion in the same period. About 17.5% population of the world reside in 2.4% global land area, in India.
However, early marriages and negligence of birth control measures in EAG states and its populous states like, Uttar Pradesh, Bihar and Madhya Pradesh, keep India's fertility rate high. These states will need at least 15-20 years additional to achieve the goal of replacement lev-el. A lag in decline in fertility in relation to mortality has resulted in the sizeable growth of India’s population, which will continue in the coming several decades. Decline in population growth process has been witnessed since 1980. The National population policy (N PP)-2000 documents clearly stated that population growth in India continues to be high on account of demographic momentum (estimated contribution 58%), higher unwanted fertility due to unmet need of contraception (estimated contribution 20%). To achieve the goal of population stabilization for demographic dividend, we should reconsider our population policy and its effective im-plementation for 100% literacy rate, especial drive for female education beyond the threshold level (Up to Higher Secondary) and provide incentive to stop drop out of girl students, improved proportion of women in work participation, along with effective family planning-policies and its successful implementation, health and other welfare program for empowerment of women. Special attention must be given in EAG States, especially, in Uttar Pradesh and Bihar.TFR of U. P., Bihar, MP and Rajasthan are 3.1, 3.4, 2.9 and 2.8, respectively, as per SRS report 2013. These states are far away from the goal of replacement level.Due to regional imbalance in TFRs of Indian States, country is passing through phase III of demographic transition and birth rate approaching towards the replacement level . Birth and death rates are the most important determinants of population growth; in some countries net migration is also important in this re-gards .Until the mid-19th century birth rates were slightly higher than death rates, so population grew very slowly. After mid-19th century, industrialization altered population growth rate, very sharply and its main component was agricultural mechanization, which increased agri-cultural productivity. As food supplies expanded, average level of nourishment rose and vulnerability to chronic and contagious disease de-clined over succeeding generations. Improvement in medical facilities and public health services also helped people to live longer, so death rates fell and life expectancy increased. After several decades of lower death rates, specially declining infant and child mortality and im-provement in women literacy rate helped to decline fertility, effectively population momentum resulting in a baby boom. This phased reduc-tion in death and birth rates is a process called the demographic transition, which affects population growth rates in different stages, differ-ently. Developed Nations have passed through the demographic transition and developing counties (like India) are at some point in the pro-cess. Population momentum (continue population growth after a fall in birth rates) accounts for a significant portion of population growth, even though fertility rate declined. As a result, a “bulge” or baby boom, generation distinctly larger than those preceding or following it is moving through the age structure of population. These large cohorts create both opportunities and challenges for society. As this cohort moves into working age group; it will be potentially higher share of workers as compared with dependent population. This working age population is called demographic dividend. If this population can be employed productively, according to their age structure with skilled development, economic growth of India will be accelerated. EAG states are facing higher illiteracy rate, poor health services, deprived status of women in decision making and higher fertility rate which create pressure on resources and majority of the population deprived from basic amenities, still there is sign of progress. As per Census of India-2011, EAG states having 45.9% population of the country, in which 52.1% females belong to child bearing age group (15-49) years, with highest T FR 3.0. Two states, Bihar and U. P. having 25.1 % population of the country, with highest T FR 3.5 and 3.3, and lowest female literacy rates, 51.5 & 57.2, respectively. These EAG states are far away from the goal of replacement level. Thus, future of India’s population stabilization depends mainly on EAG states’ effective population control and women empowerment through skill development schemes. The most populous state Uttar Pradesh is most concern to stabilize population. National Commission on Population estimated that by 2026, population of Uttar Pradesh alone will be 22% population of India while Bihar, Rajasthan and Madhya Pradesh together will account for 22%. The four southern states of Andhra Pradesh, Karnataka, Kerala and Tamil Nadu will account for only 13%. According to a recently-released Health Ministry Report, only, 11 states and three union territories have attained the goal of replacement level (TFR 2.1) before the 2010 deadline.It is expected that four states, Assam, Haryana, Madhya Pradesh, and Rajasthan may attain replacement level by 2020. But for Uttar Pradesh and Bihar, it may take another decade. To achieve the goal of population stabilization for demographic dividend, we should reconsider our population policy and its implementation for 100% literacy rate, Special drive for female education beyond the threshold level (Up to Higher Secondary) and provide incentive to stop drop out of girl students, improved proportion of women in work participation, along with effective family planning-policies and its success-ful implementation, health and other welfare program for empowerment of women. Special attention must be given in E AG States, especial-ly, in Uttar Pradesh and Bihar.
IJSER
International Journal of Scientific & Engineering Research, Volume 7, Issue 1, January-2016 18 ISSN 2229-5518
IJSER © 2016 http://www.ijser.org
Determinants of Fertility. Education plays a very important role in population control; especially, women education is a prominent factor to control T FR and elimina-tion of poverty. Education of girls at least up to the age of 14 can help to stop early marriages, prevalent in rural areas. It has been shown that wherever girl’s literacy has been taken care of a significant improvement in population control observed. Women education affects social-economic and demographic indicators which are essential for population stabilisation. The Task Force of the National Commission on Popu-lation (NCP) has been already identified the following key social, economic and demographic indicators for population stabilisation in India. 1. Total Fertility Rate. 2. Sex ratio. 3. Percentage of couples using family planning methods. 4. Child mortality up to the age of 2. 5. Maternal Mortality Rate. 6. Percentage of Women receiving skilled attention during deliveries. 7. Percentage of children (12-24 months) getting complete immunization. 8. Nutritional status of children below 6 years. 9. Percentage of girls marrying below 18 years of age. 10. Percentage of births, deaths and marriages registered. 11. Literacy rate-males and females. 12. Enrolment of children in schools up to the age of 14 and the rate of dropouts. 13. Percentage of households with safe drinking water. 14. Percentage of villages connected by pucca roads. Among, above mentioned fourteen indicators, first thirteen indicators are directly or indirectly affected by women education level. Education as a Determinant of Fertility. Education, especially female education is the most prominent determinant of fertility. Directly or indirectly it affects other determinants of fertility. Among various socio economic and demographic determinants of fertility, education, especially female education, is the most domi-nant factor to reduce TFR. But due to all efforts female literacy rate of the country is only 64.6% and in EAG states it is 56.6%.
“Educate one man, you educate one person, but educate a woman and you educate a whole civilisation”. -Mahatma Gandhi.
IJSER
International Journal of Scientific & Engineering Research, Volume 7, Issue 1, January-2016 19 ISSN 2229-5518
IJSER © 2016 http://www.ijser.org
Literacy trend in India:
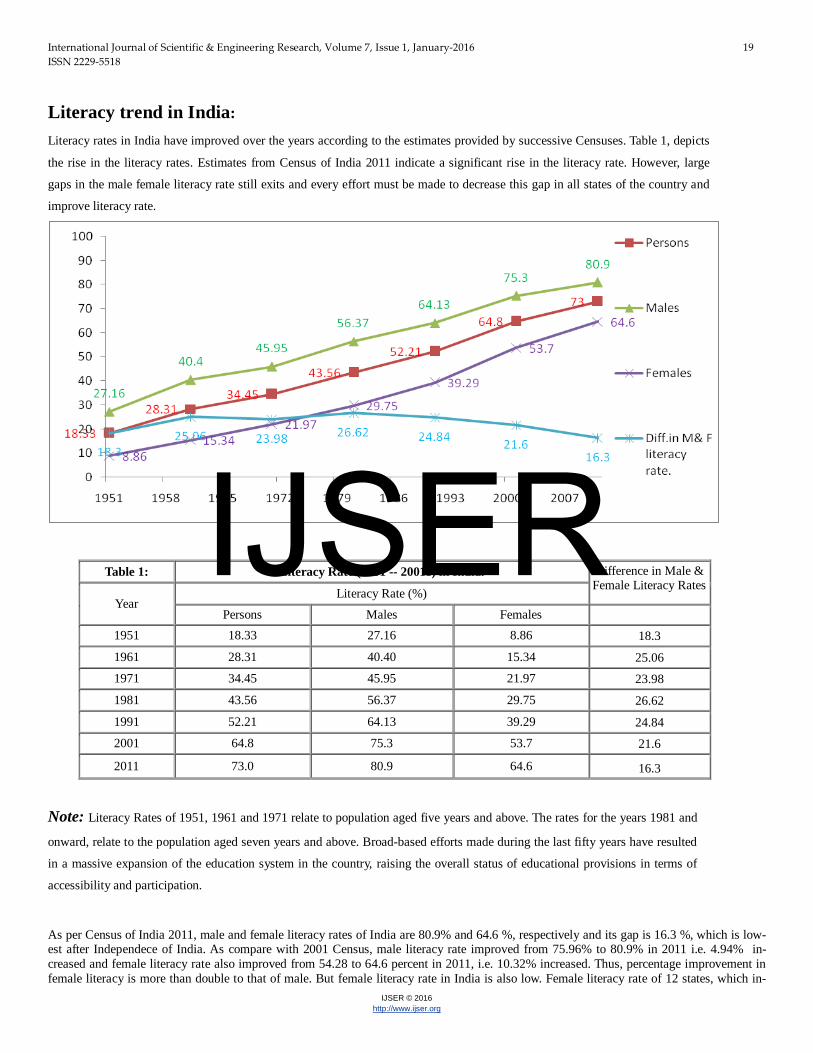
Literacy rates in India have improved over the years according to the estimates provided by successive Censuses. Table 1, depicts
the rise in the literacy rates. Estimates from Census of India 2011 indicate a significant rise in the literacy rate. However, large
gaps in the male female literacy rate still exits and every effort must be made to decrease this gap in all states of the country and
improve literacy rate.
Table 1: Literacy Rate (1951 -- 20011) in India. Difference in Male & Female Literacy Rates
Year Literacy Rate (%)
Persons Males Females 1951 18.33 27.16 8.86 18.3
1961 28.31 40.40 15.34 25.06 1971 34.45 45.95 21.97 23.98
1981 43.56 56.37 29.75 26.62
1991 52.21 64.13 39.29 24.84 2001 64.8 75.3 53.7 21.6
2011 73.0 80.9 64.6 16.3
Note: Literacy Rates of 1951, 1961 and 1971 relate to population aged five years and above. The rates for the years 1981 and
onward, relate to the population aged seven years and above. Broad-based efforts made during the last fifty years have resulted
in a massive expansion of the education system in the country, raising the overall status of educational provisions in terms of
accessibility and participation. As per Census of India 2011, male and female literacy rates of India are 80.9% and 64.6 %, respectively and its gap is 16.3 %, which is low-est after Independece of India. As compare with 2001 Census, male literacy rate improved from 75.96% to 80.9% in 2011 i.e. 4.94% in-creased and female literacy rate also improved from 54.28 to 64.6 percent in 2011, i.e. 10.32% increased. Thus, percentage improvement in female literacy is more than double to that of male. But female literacy rate in India is also low. Female literacy rate of 12 states, which in-
IJSER
International Journal of Scientific & Engineering Research, Volume 7, Issue 1, January-2016 20 ISSN 2229-5518
IJSER © 2016 http://www.ijser.org
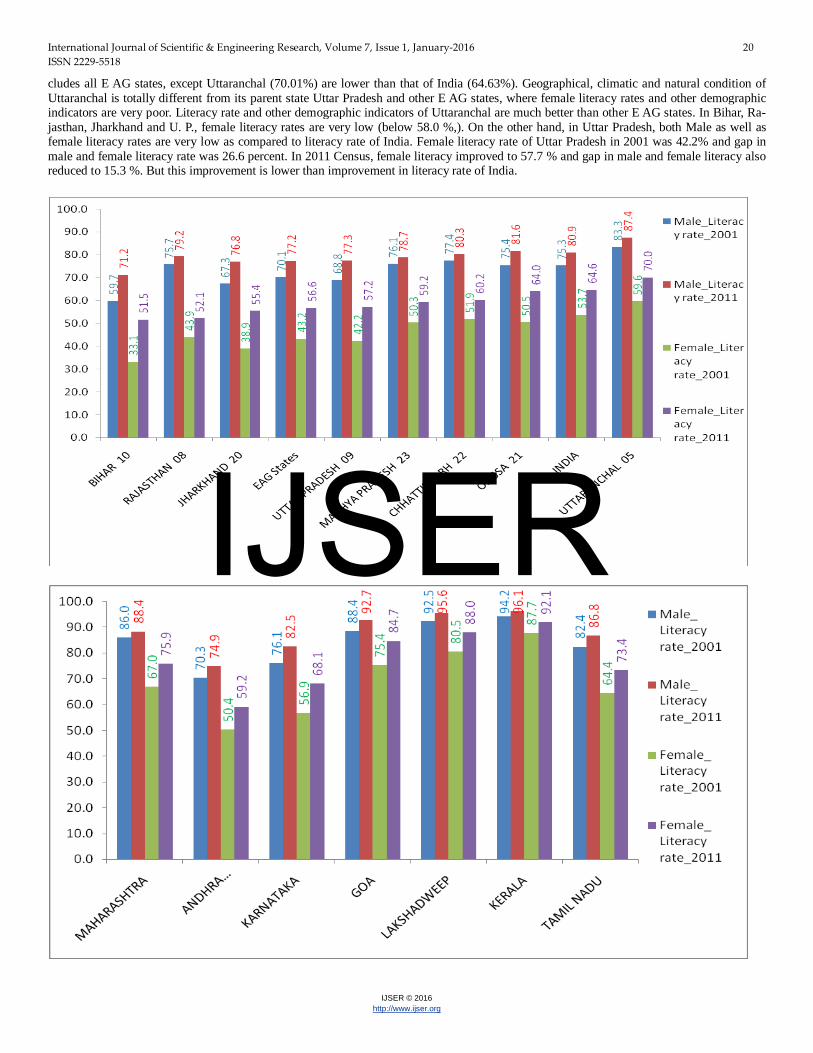
cludes all E AG states, except Uttaranchal (70.01%) are lower than that of India (64.63%). Geographical, climatic and natural condition of Uttaranchal is totally different from its parent state Uttar Pradesh and other E AG states, where female literacy rates and other demographic indicators are very poor. Literacy rate and other demographic indicators of Uttaranchal are much better than other E AG states. In Bihar, Ra-jasthan, Jharkhand and U. P., female literacy rates are very low (below 58.0 %,). On the other hand, in Uttar Pradesh, both Male as well as female literacy rates are very low as compared to literacy rate of India. Female literacy rate of Uttar Pradesh in 2001 was 42.2% and gap in male and female literacy rate was 26.6 percent. In 2011 Census, female literacy improved to 57.7 % and gap in male and female literacy also reduced to 15.3 %. But this improvement is lower than improvement in literacy rate of India.
IJSER
International Journal of Scientific & Engineering Research, Volume 7, Issue 1, January-2016 21 ISSN 2229-5518
IJSER © 2016 http://www.ijser.org
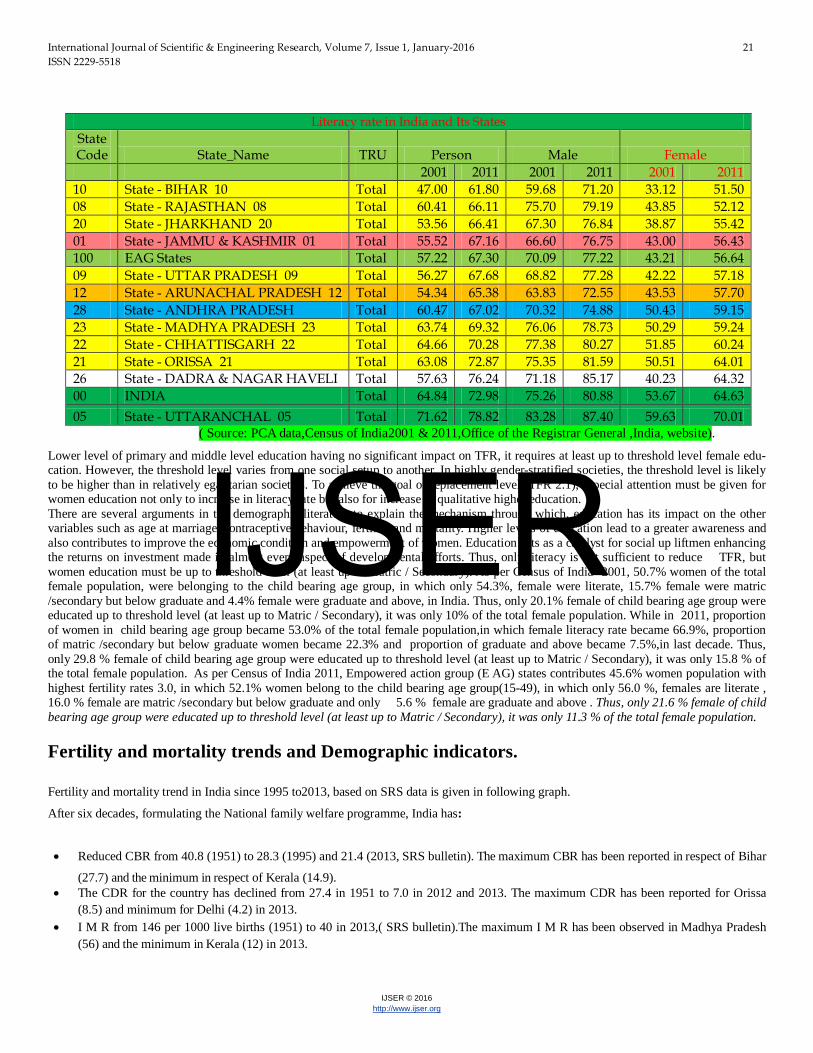
Literacy rate in India and Its States State Code State_Name TRU Person Male Female 2001 2011 2001 2011 2001 2011 10 State - BIHAR 10 Total 47.00 61.80 59.68 71.20 33.12 51.50 08 State - RAJASTHAN 08 Total 60.41 66.11 75.70 79.19 43.85 52.12 20 State - JHARKHAND 20 Total 53.56 66.41 67.30 76.84 38.87 55.42 01 State - JAMMU & KASHMIR 01 Total 55.52 67.16 66.60 76.75 43.00 56.43 100 EAG States Total 57.22 67.30 70.09 77.22 43.21 56.64 09 State - UTTAR PRADESH 09 Total 56.27 67.68 68.82 77.28 42.22 57.18 12 State - ARUNACHAL PRADESH 12 Total 54.34 65.38 63.83 72.55 43.53 57.70 28 State - ANDHRA PRADESH Total 60.47 67.02 70.32 74.88 50.43 59.15 23 State - MADHYA PRADESH 23 Total 63.74 69.32 76.06 78.73 50.29 59.24 22 State - CHHATTISGARH 22 Total 64.66 70.28 77.38 80.27 51.85 60.24 21 State - ORISSA 21 Total 63.08 72.87 75.35 81.59 50.51 64.01 26 State - DADRA & NAGAR HAVELI Total 57.63 76.24 71.18 85.17 40.23 64.32 00 INDIA Total 64.84 72.98 75.26 80.88 53.67 64.63 05 State - UTTARANCHAL 05 Total 71.62 78.82 83.28 87.40 59.63 70.01
( Source: PCA data,Census of India2001 & 2011,Office of the Registrar General ,India, website).
Lower level of primary and middle level education having no significant impact on TFR, it requires at least up to threshold level female edu-cation. However, the threshold level varies from one social setup to another. In highly gender-stratified societies, the threshold level is likely to be higher than in relatively egalitarian societies. To achieve the goal of replacement level (TFR 2.1), especial attention must be given for women education not only to increase in literacy rate but also for increase in qualitative higher education. There are several arguments in the demographic literature to explain the mechanism through which, education has its impact on the other variables such as age at marriage, contraceptive behaviour, fertility and mortality. Higher levels of education lead to a greater awareness and also contributes to improve the economic condition and empowerment of women. Education acts as a catalyst for social up liftmen enhancing the returns on investment made in almost every aspect of developmental efforts. Thus, only literacy is not sufficient to reduce TFR, but women education must be up to threshold level (at least up to Matric / Secondary). As per Census of India- 2001, 50.7% women of the total female population, were belonging to the child bearing age group, in which only 54.3%, female were literate, 15.7% female were matric /secondary but below graduate and 4.4% female were graduate and above, in India. Thus, only 20.1% female of child bearing age group were educated up to threshold level (at least up to Matric / Secondary), it was only 10% of the total female population. While in 2011, proportion of women in child bearing age group became 53.0% of the total female population,in which female literacy rate became 66.9%, proportion of matric /secondary but below graduate women became 22.3% and proportion of graduate and above became 7.5%,in last decade. Thus, only 29.8 % female of child bearing age group were educated up to threshold level (at least up to Matric / Secondary), it was only 15.8 % of the total female population. As per Census of India 2011, Empowered action group (E AG) states contributes 45.6% women population with highest fertility rates 3.0, in which 52.1% women belong to the child bearing age group(15-49), in which only 56.0 %, females are literate , 16.0 % female are matric /secondary but below graduate and only 5.6 % female are graduate and above . Thus, only 21.6 % female of child bearing age group were educated up to threshold level (at least up to Matric / Secondary), it was only 11.3 % of the total female population.
Fertility and mortality trends and Demographic indicators.
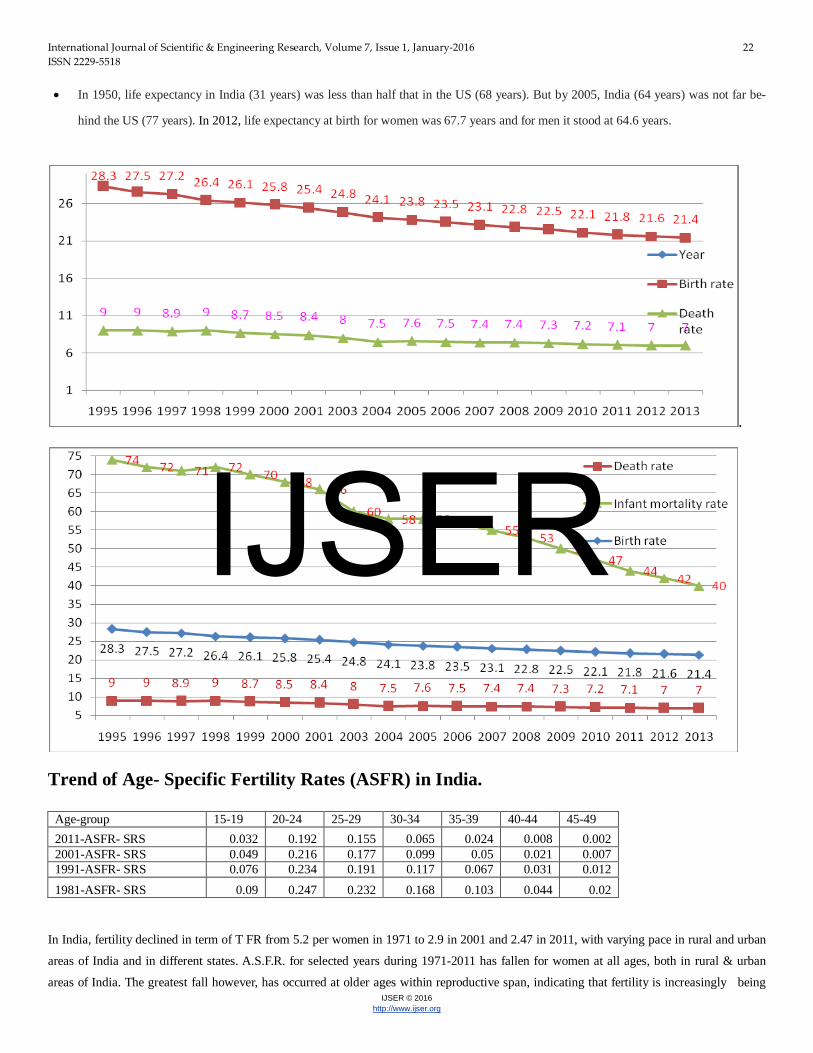
Fertility and mortality trend in India since 1995 to2013, based on SRS data is given in following graph.
After six decades, formulating the National family welfare programme, India has: • Reduced CBR from 40.8 (1951) to 28.3 (1995) and 21.4 (2013, SRS bulletin). The maximum CBR has been reported in respect of Bihar
(27.7) and the minimum in respect of Kerala (14.9). • The CDR for the country has declined from 27.4 in 1951 to 7.0 in 2012 and 2013. The maximum CDR has been reported for Orissa
(8.5) and minimum for Delhi (4.2) in 2013. • I M R from 146 per 1000 live births (1951) to 40 in 2013,( SRS bulletin).The maximum I M R has been observed in Madhya Pradesh
(56) and the minimum in Kerala (12) in 2013.
IJSER
International Journal of Scientific & Engineering Research, Volume 7, Issue 1, January-2016 22 ISSN 2229-5518
IJSER © 2016 http://www.ijser.org
• In 1950, life expectancy in India (31 years) was less than half that in the US (68 years). But by 2005, India (64 years) was not far be-
hind the US (77 years). In 2012, life expectancy at birth for women was 67.7 years and for men it stood at 64.6 years.
.
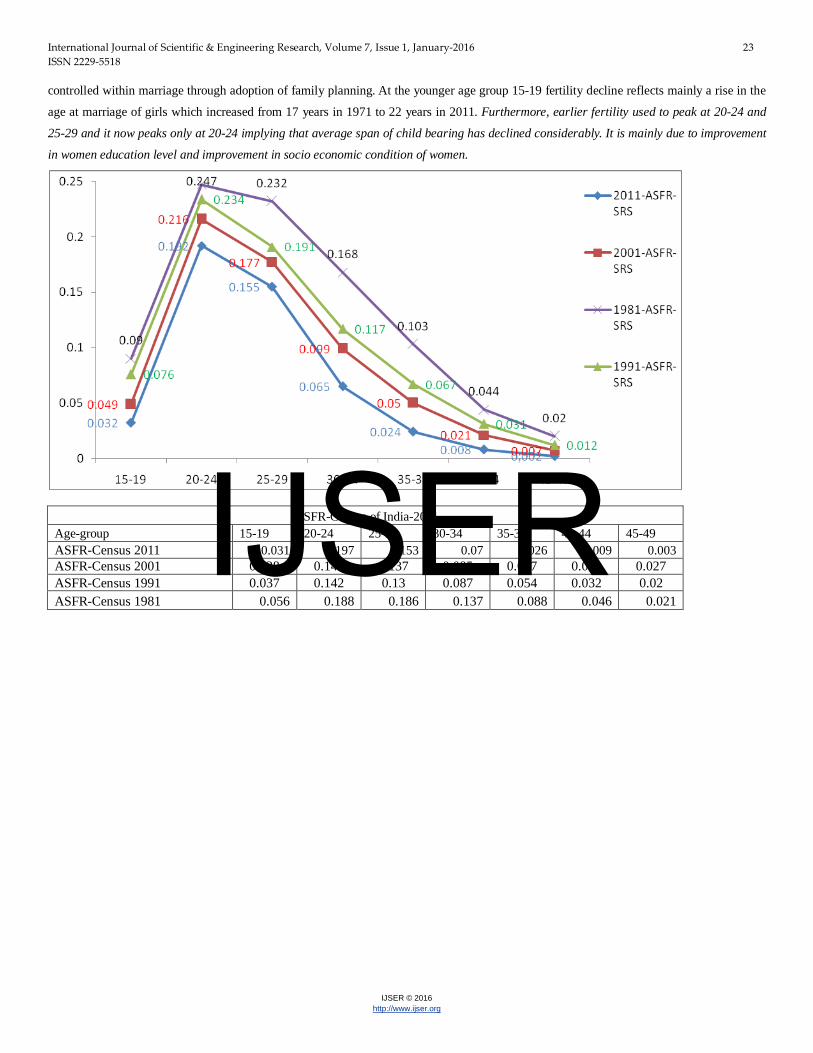
Trend of Age- Specific Fertility Rates (ASFR) in India.
Age-group 15-19 20-24 25-29 30-34 35-39 40-44 45-49 2011-ASFR- SRS 0.032 0.192 0.155 0.065 0.024 0.008 0.002 2001-ASFR- SRS 0.049 0.216 0.177 0.099 0.05 0.021 0.007 1991-ASFR- SRS 0.076 0.234 0.191 0.117 0.067 0.031 0.012 1981-ASFR- SRS 0.09 0.247 0.232 0.168 0.103 0.044 0.02
In India, fertility declined in term of T FR from 5.2 per women in 1971 to 2.9 in 2001 and 2.47 in 2011, with varying pace in rural and urban
areas of India and in different states. A.S.F.R. for selected years during 1971-2011 has fallen for women at all ages, both in rural & urban
areas of India. The greatest fall however, has occurred at older ages within reproductive span, indicating that fertility is increasingly being
IJSER
International Journal of Scientific & Engineering Research, Volume 7, Issue 1, January-2016 23 ISSN 2229-5518
IJSER © 2016 http://www.ijser.org
controlled within marriage through adoption of family planning. At the younger age group 15-19 fertility decline reflects mainly a rise in the
age at marriage of girls which increased from 17 years in 1971 to 22 years in 2011. Furthermore, earlier fertility used to peak at 20-24 and
25-29 and it now peaks only at 20-24 implying that average span of child bearing has declined considerably. It is mainly due to improvement
in women education level and improvement in socio economic condition of women.
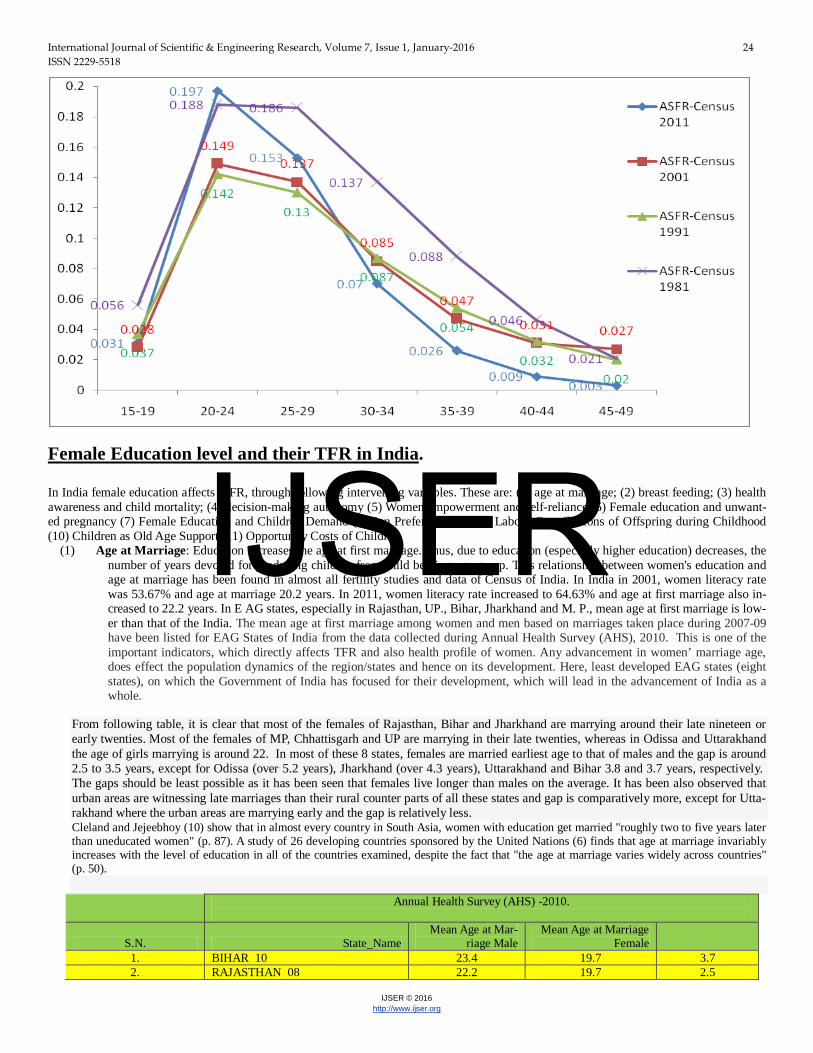
A SFR-Census of India-2011 Age-group 15-19 20-24 25-29 30-34 35-39 40-44 45-49 ASFR-Census 2011 0.031 0.197 0.153 0.07 0.026 0.009 0.003 ASFR-Census 2001 0.028 0.149 0.137 0.085 0.047 0.031 0.027 ASFR-Census 1991 0.037 0.142 0.13 0.087 0.054 0.032 0.02 ASFR-Census 1981 0.056 0.188 0.186 0.137 0.088 0.046 0.021
IJSER
International Journal of Scientific & Engineering Research, Volume 7, Issue 1, January-2016 24 ISSN 2229-5518
IJSER © 2016 http://www.ijser.org
Female Education level and their TFR in India. In India female education affects T FR, through following intervening variables. These are: (1) age at marriage; (2) breast feeding; (3) health awareness and child mortality; (4) decision-making autonomy (5) Women empowerment and self-reliance (6) Female education and unwant-ed pregnancy (7) Female Education and Children Demand (8) Son Preference (9) The Labour Contributions of Offspring during Childhood (10) Children as Old Age Support (11) Opportunity Costs of Children.
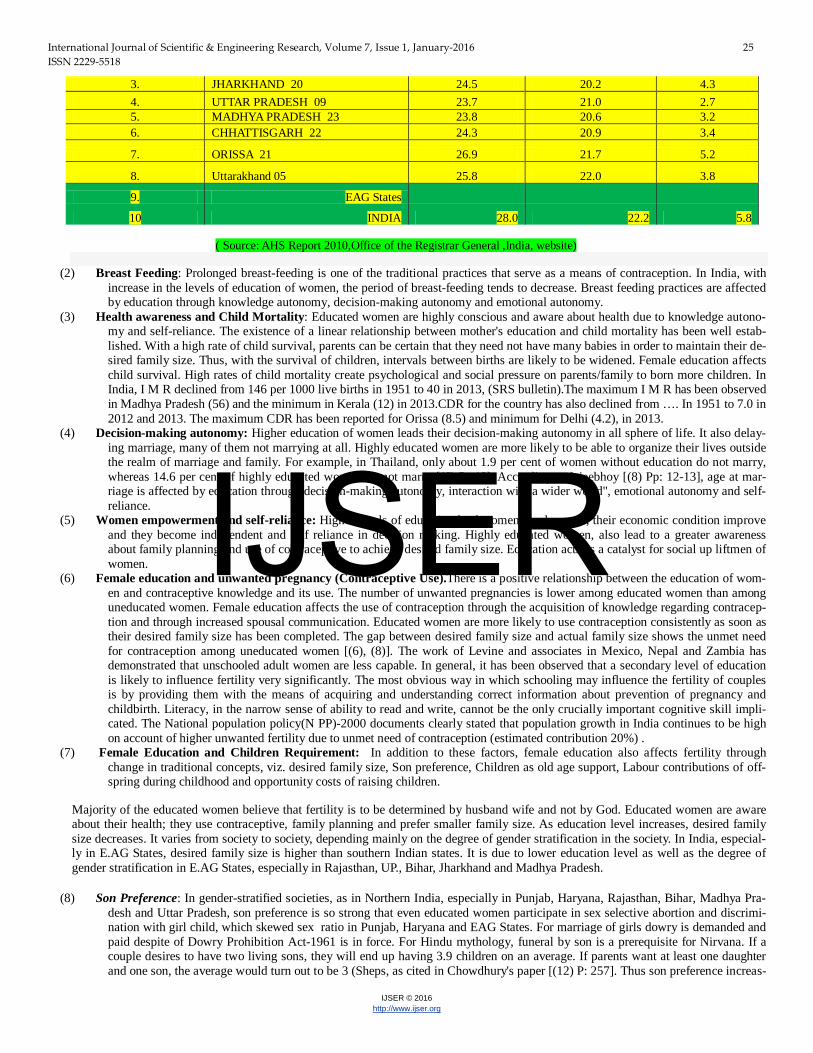
(1) Age at Marriage: Education increases the age at first marriage. Thus, due to education (especially higher education) decreases, the number of years devoted for producing children from child bearing age group. This relationship between women's education and age at marriage has been found in almost all fertility studies and data of Census of India. In India in 2001, women literacy rate was 53.67% and age at marriage 20.2 years. In 2011, women literacy rate increased to 64.63% and age at first marriage also in-creased to 22.2 years. In E AG states, especially in Rajasthan, UP., Bihar, Jharkhand and M. P., mean age at first marriage is low-er than that of the India. The mean age at first marriage among women and men based on marriages taken place during 2007-09 have been listed for EAG States of India from the data collected during Annual Health Survey (AHS), 2010. This is one of the important indicators, which directly affects TFR and also health profile of women. Any advancement in women’ marriage age, does effect the population dynamics of the region/states and hence on its development. Here, least developed EAG states (eight states), on which the Government of India has focused for their development, which will lead in the advancement of India as a whole.
From following table, it is clear that most of the females of Rajasthan, Bihar and Jharkhand are marrying around their late nineteen or early twenties. Most of the females of MP, Chhattisgarh and UP are marrying in their late twenties, whereas in Odissa and Uttarakhand the age of girls marrying is around 22. In most of these 8 states, females are married earliest age to that of males and the gap is around 2.5 to 3.5 years, except for Odissa (over 5.2 years), Jharkhand (over 4.3 years), Uttarakhand and Bihar 3.8 and 3.7 years, respectively. The gaps should be least possible as it has been seen that females live longer than males on the average. It has been also observed that urban areas are witnessing late marriages than their rural counter parts of all these states and gap is comparatively more, except for Utta-rakhand where the urban areas are marrying early and the gap is relatively less. Cleland and Jejeebhoy (10) show that in almost every country in South Asia, women with education get married "roughly two to five years later than uneducated women" (p. 87). A study of 26 developing countries sponsored by the United Nations (6) finds that age at marriage invariably increases with the level of education in all of the countries examined, despite the fact that "the age at marriage varies widely across countries" (p. 50).
Annual Health Survey (AHS) -2010.
S.N. State_Name Mean Age at Mar-
riage Male Mean Age at Marriage
Female 1. BIHAR 10 23.4 19.7 3.7
2. RAJASTHAN 08 22.2 19.7 2.5
IJSER
International Journal of Scientific & Engineering Research, Volume 7, Issue 1, January-2016 25 ISSN 2229-5518
IJSER © 2016 http://www.ijser.org
3. JHARKHAND 20 24.5 20.2 4.3 4. UTTAR PRADESH 09 23.7 21.0 2.7 5. MADHYA PRADESH 23 23.8 20.6 3.2 6. CHHATTISGARH 22 24.3 20.9 3.4
7. ORISSA 21 26.9 21.7 5.2
8. Uttarakhand 05 25.8 22.0 3.8
9. EAG States 10 INDIA 28.0 22.2 5.8
( Source: AHS Report 2010,Office of the Registrar General ,India, website)
(2) Breast Feeding: Prolonged breast-feeding is one of the traditional practices that serve as a means of contraception. In India, with increase in the levels of education of women, the period of breast-feeding tends to decrease. Breast feeding practices are affected by education through knowledge autonomy, decision-making autonomy and emotional autonomy.
(3) Health awareness and Child Mortality: Educated women are highly conscious and aware about health due to knowledge autono-my and self-reliance. The existence of a linear relationship between mother's education and child mortality has been well estab-lished. With a high rate of child survival, parents can be certain that they need not have many babies in order to maintain their de-sired family size. Thus, with the survival of children, intervals between births are likely to be widened. Female education affects child survival. High rates of child mortality create psychological and social pressure on parents/family to born more children. In India, I M R declined from 146 per 1000 live births in 1951 to 40 in 2013, (SRS bulletin).The maximum I M R has been observed in Madhya Pradesh (56) and the minimum in Kerala (12) in 2013.CDR for the country has also declined from …. In 1951 to 7.0 in 2012 and 2013. The maximum CDR has been reported for Orissa (8.5) and minimum for Delhi (4.2), in 2013.
(4) Decision-making autonomy: Higher education of women leads their decision-making autonomy in all sphere of life. It also delay-ing marriage, many of them not marrying at all. Highly educated women are more likely to be able to organize their lives outside the realm of marriage and family. For example, in Thailand, only about 1.9 per cent of women without education do not marry, whereas 14.6 per cent of highly educated women do not marry [(6) P: 46]. According to Jejeebhoy [(8) Pp: 12-13], age at mar-riage is affected by education through decision-making autonomy, interaction with a wider world", emotional autonomy and self-reliance.
(5) Women empowerment and self-reliance: Higher levels of education lead women employment, their economic condition improve and they become independent and self reliance in decision making. Highly educated women, also lead to a greater awareness about family planning and use of contraceptive to achieve desired family size. Education acts as a catalyst for social up liftmen of women.
(6) Female education and unwanted pregnancy (Contraceptive Use).There is a positive relationship between the education of wom-en and contraceptive knowledge and its use. The number of unwanted pregnancies is lower among educated women than among uneducated women. Female education affects the use of contraception through the acquisition of knowledge regarding contracep-tion and through increased spousal communication. Educated women are more likely to use contraception consistently as soon as their desired family size has been completed. The gap between desired family size and actual family size shows the unmet need for contraception among uneducated women [(6), (8)]. The work of Levine and associates in Mexico, Nepal and Zambia has demonstrated that unschooled adult women are less capable. In general, it has been observed that a secondary level of education is likely to influence fertility very significantly. The most obvious way in which schooling may influence the fertility of couples is by providing them with the means of acquiring and understanding correct information about prevention of pregnancy and childbirth. Literacy, in the narrow sense of ability to read and write, cannot be the only crucially important cognitive skill impli-cated. The National population policy(N PP)-2000 documents clearly stated that population growth in India continues to be high on account of higher unwanted fertility due to unmet need of contraception (estimated contribution 20%) .
(7) Female Education and Children Requirement: In addition to these factors, female education also affects fertility through change in traditional concepts, viz. desired family size, Son preference, Children as old age support, Labour contributions of off-spring during childhood and opportunity costs of raising children.
Majority of the educated women believe that fertility is to be determined by husband wife and not by God. Educated women are aware about their health; they use contraceptive, family planning and prefer smaller family size. As education level increases, desired family size decreases. It varies from society to society, depending mainly on the degree of gender stratification in the society. In India, especial-ly in E.AG States, desired family size is higher than southern Indian states. It is due to lower education level as well as the degree of gender stratification in E.AG States, especially in Rajasthan, UP., Bihar, Jharkhand and Madhya Pradesh.
(8) Son Preference: In gender-stratified societies, as in Northern India, especially in Punjab, Haryana, Rajasthan, Bihar, Madhya Pra-desh and Uttar Pradesh, son preference is so strong that even educated women participate in sex selective abortion and discrimi-nation with girl child, which skewed sex ratio in Punjab, Haryana and EAG States. For marriage of girls dowry is demanded and paid despite of Dowry Prohibition Act-1961 is in force. For Hindu mythology, funeral by son is a prerequisite for Nirvana. If a couple desires to have two living sons, they will end up having 3.9 children on an average. If parents want at least one daughter and one son, the average would turn out to be 3 (Sheps, as cited in Chowdhury's paper [(12) P: 257]. Thus son preference increas-
IJSER
International Journal of Scientific & Engineering Research, Volume 7, Issue 1, January-2016 26 ISSN 2229-5518
IJSER © 2016 http://www.ijser.org
es the family size and T FR significantly in the long run. Chowdhury (12) finds that in Bangladesh son preference is so strong that even education above primary level cannot counteract it. Cleland and Jejeebhoy [(10) P: 94] suggest that very high levels of edu-cation are required in order to counter the preference for sons in such societies. The higher education of women, through provid-ing them self reliance, social and economic autonomy, probably has a negative impact on son preference [(8) P: 12-13].In India, concept of son preference and discrimination with girl child declined with increase in education level of women. Central Gov-ernment and many states Governments have started welfare programme for Girl child, viz. (Ladali yojana of MP. Government), which discouraged son preference and discrimination with girl child.
(9) The Labour Contributions of Offspring during Childhood: Highly educated women never like their children to use as a labour while uneducated women, engage their children in labour work and in other economic activities. It depends mainly economic condition of the family. The study reveals that expected and actual levels of support from sons diminished as women's education-al levels increased. For girls the decline is relatively modest, as more emphasis is placed on sons' schooling. Overall, the chil-dren of women with secondary education only contribute about 60 per cent of the labour that is contributed by the children of un-educated women. Jejeebhoy [(8) P:131] cites evidence from a study carried out in Maharashtra, India. Cleland and Jejeebhoy [(10) P: 96] also mention several other similar studies. Effects of female education on child labour are channelled through self-reliance and social and economic autonomy [(8) P: 12-13].
(10) Children as Old Age Support: Traditionally, in India, generally, parents live with their children and rely for their support in old age, which is one of the most important reasons for son preference. But with increasing levels of women education, make self re-liance and independent to women and they rely less on their children for support in old age and for economic help and housing [(8) P: 129]. However, the effect of education varies with the intensity of gender stratification in the society. In highly gender-stratified societies, a higher level of education is required in order to have a significant impact. Women's education affects the ex-tent to which children are perceived as sources of support in old age through social and economic autonomy and self-reliance [(8) P: 12-13].
(11) Opportunity Costs of Children: Educated women having aspiration for better qualified children. Level of education of mother has a direct impact on education of children. Thus, raising equality of nurturing to children raises cost of living of children, hence re-ducing the number of desired children and fertility. Highly educated women are more likely to be employed, for paid services. An educated woman is likely to take into account the loss of income that will result from having more children and may therefore de-cide not to have large numbers of children. Besides this opportunity cost, better educated women also feel it necessary to spend more time with children and are less likely to leave young children in the care of older siblings. Education affects the perceptions of mothers’ in terms of economic and opportunity cost of children through knowledge autonomy, decision-making autonomy and self-reliance [(8) P: 12-13].
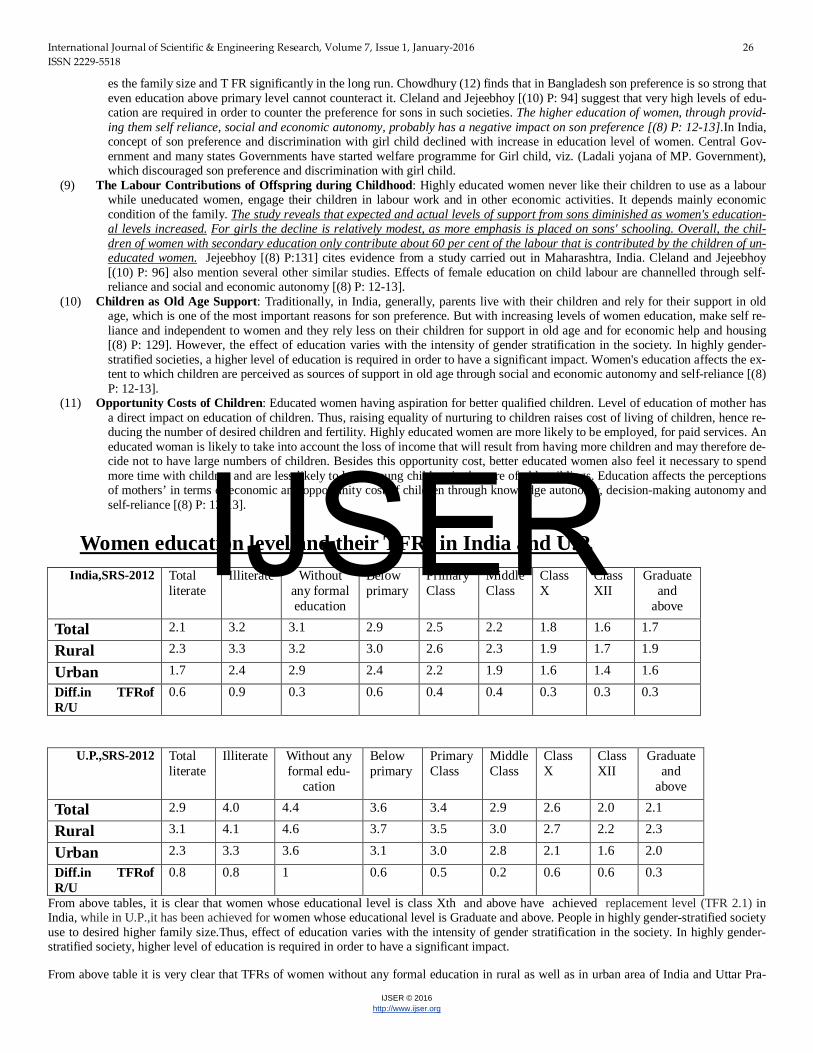
Women education level and their TFRs in India and U.P.
India,SRS-2012 Total literate
Illiterate Without any formal education
Below primary
Primary Class
Middle Class
Class X
Class XII
Graduate and
above
Total 2.1 3.2 3.1 2.9 2.5 2.2 1.8 1.6 1.7
Rural 2.3 3.3 3.2 3.0 2.6 2.3 1.9 1.7 1.9
Urban 1.7 2.4 2.9 2.4 2.2 1.9 1.6 1.4 1.6
Diff.in TFRof R/U
0.6 0.9 0.3 0.6 0.4 0.4 0.3 0.3 0.3
U.P.,SRS-2012 Total
literate Illiterate Without any
formal edu-cation
Below primary
Primary Class
Middle Class
Class X
Class XII
Graduate and
above
Total 2.9 4.0 4.4 3.6 3.4 2.9 2.6 2.0 2.1
Rural 3.1 4.1 4.6 3.7 3.5 3.0 2.7 2.2 2.3
Urban 2.3 3.3 3.6 3.1 3.0 2.8 2.1 1.6 2.0
Diff.in TFRof R/U
0.8 0.8 1 0.6 0.5 0.2 0.6 0.6 0.3
From above tables, it is clear that women whose educational level is class Xth and above have achieved replacement level (TFR 2.1) in India, while in U.P.,it has been achieved for women whose educational level is Graduate and above. People in highly gender-stratified society use to desired higher family size.Thus, effect of education varies with the intensity of gender stratification in the society. In highly gender-stratified society, higher level of education is required in order to have a significant impact.
From above table it is very clear that TFRs of women without any formal education in rural as well as in urban area of India and Uttar Pra-
IJSER
International Journal of Scientific & Engineering Research, Volume 7, Issue 1, January-2016 27 ISSN 2229-5518
IJSER © 2016 http://www.ijser.org
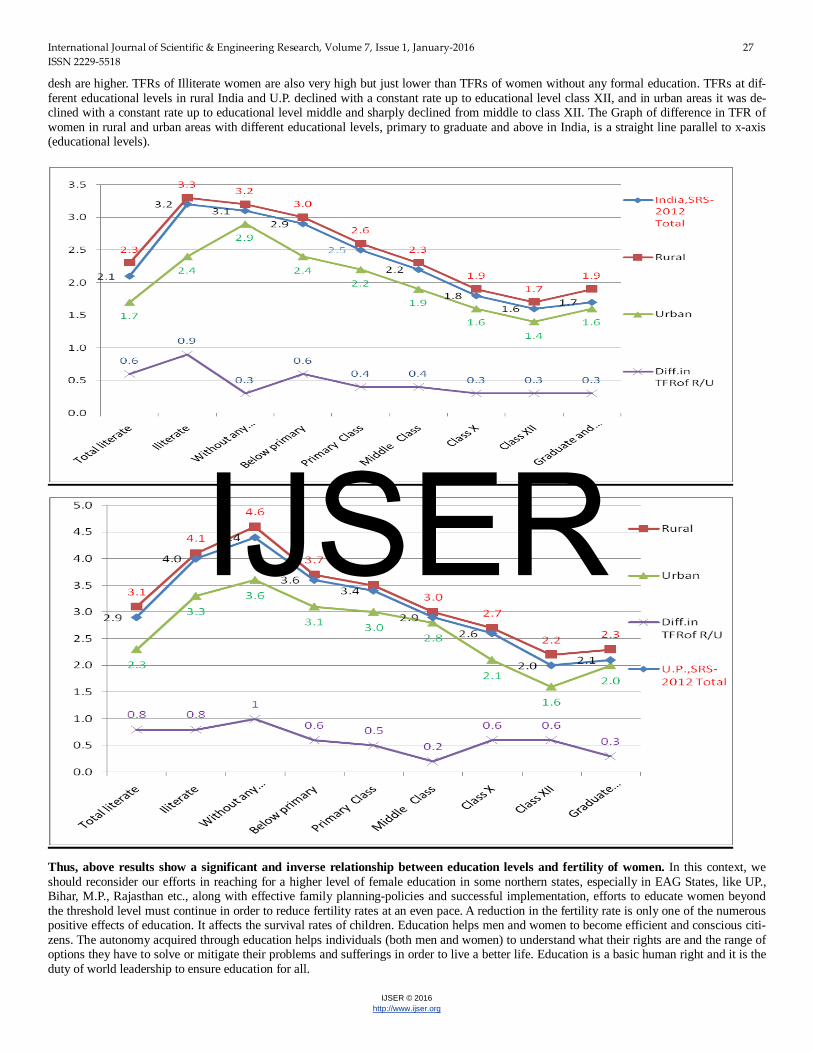
desh are higher. TFRs of Illiterate women are also very high but just lower than TFRs of women without any formal education. TFRs at dif-ferent educational levels in rural India and U.P. declined with a constant rate up to educational level class XII, and in urban areas it was de-clined with a constant rate up to educational level middle and sharply declined from middle to class XII. The Graph of difference in TFR of women in rural and urban areas with different educational levels, primary to graduate and above in India, is a straight line parallel to x-axis (educational levels).
Thus, above results show a significant and inverse relationship between education levels and fertility of women. In this context, we should reconsider our efforts in reaching for a higher level of female education in some northern states, especially in EAG States, like UP., Bihar, M.P., Rajasthan etc., along with effective family planning-policies and successful implementation, efforts to educate women beyond the threshold level must continue in order to reduce fertility rates at an even pace. A reduction in the fertility rate is only one of the numerous positive effects of education. It affects the survival rates of children. Education helps men and women to become efficient and conscious citi-zens. The autonomy acquired through education helps individuals (both men and women) to understand what their rights are and the range of options they have to solve or mitigate their problems and sufferings in order to live a better life. Education is a basic human right and it is the duty of world leadership to ensure education for all.
IJSER
International Journal of Scientific & Engineering Research, Volume 7, Issue 1, January-2016 28 ISSN 2229-5518
IJSER © 2016 http://www.ijser.org
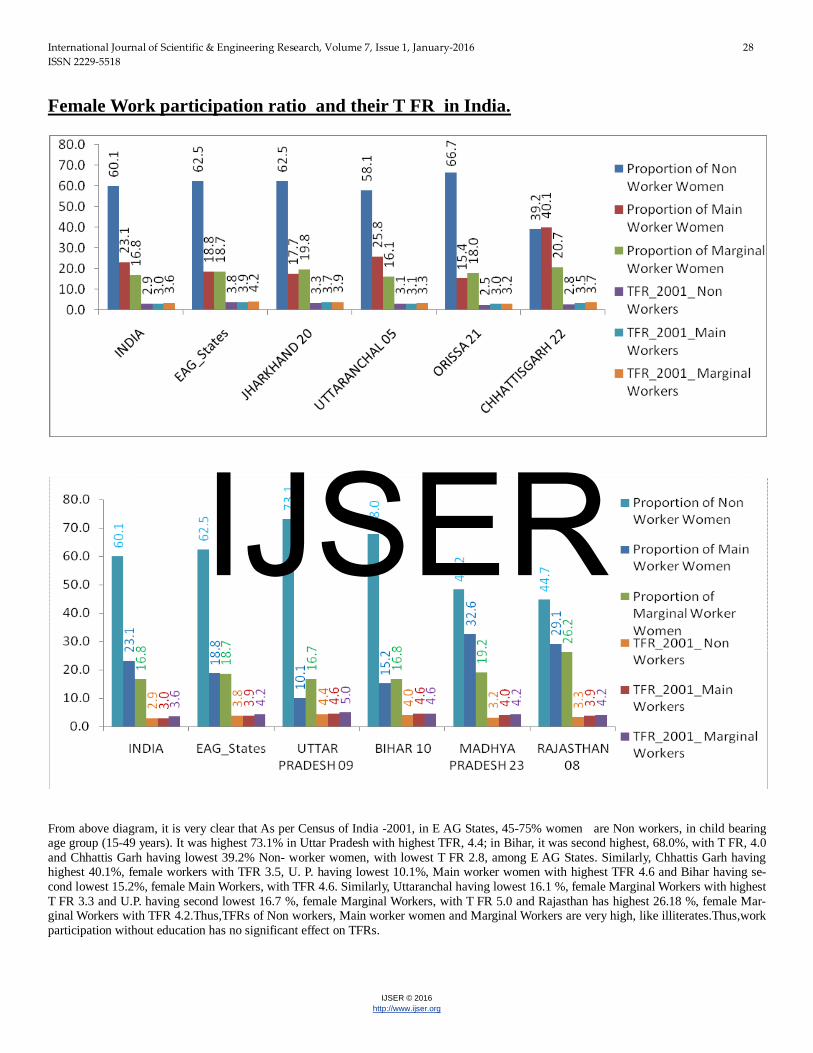
Female Work participation ratio and their T FR in India.
From above diagram, it is very clear that As per Census of India -2001, in E AG States, 45-75% women are Non workers, in child bearing age group (15-49 years). It was highest 73.1% in Uttar Pradesh with highest TFR, 4.4; in Bihar, it was second highest, 68.0%, with T FR, 4.0 and Chhattis Garh having lowest 39.2% Non- worker women, with lowest T FR 2.8, among E AG States. Similarly, Chhattis Garh having highest 40.1%, female workers with TFR 3.5, U. P. having lowest 10.1%, Main worker women with highest TFR 4.6 and Bihar having se-cond lowest 15.2%, female Main Workers, with TFR 4.6. Similarly, Uttaranchal having lowest 16.1 %, female Marginal Workers with highest T FR 3.3 and U.P. having second lowest 16.7 %, female Marginal Workers, with T FR 5.0 and Rajasthan has highest 26.18 %, female Mar-ginal Workers with TFR 4.2.Thus,TFRs of Non workers, Main worker women and Marginal Workers are very high, like illiterates.Thus,work participation without education has no significant effect on TFRs.
IJSER
International Journal of Scientific & Engineering Research, Volume 7, Issue 1, January-2016 29 ISSN 2229-5518
IJSER © 2016 http://www.ijser.org
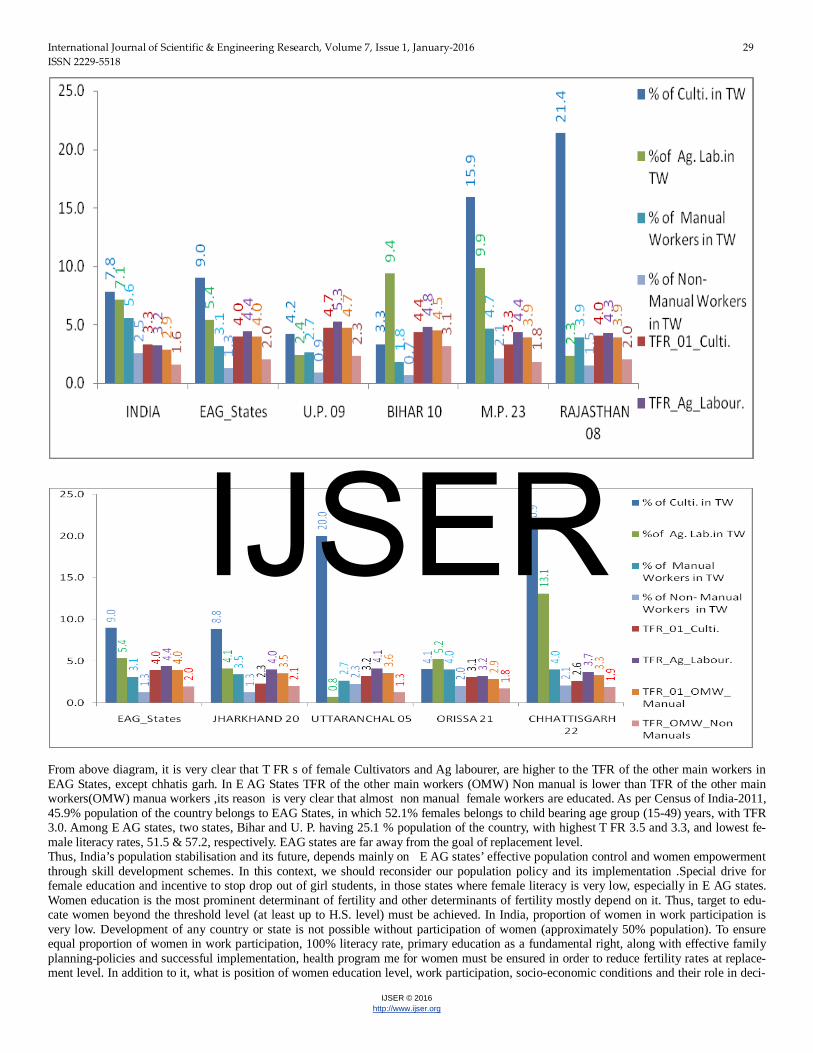
From above diagram, it is very clear that T FR s of female Cultivators and Ag labourer, are higher to the TFR of the other main workers in EAG States, except chhatis garh. In E AG States TFR of the other main workers (OMW) Non manual is lower than TFR of the other main workers(OMW) manua workers ,its reason is very clear that almost non manual female workers are educated. As per Census of India-2011, 45.9% population of the country belongs to EAG States, in which 52.1% females belongs to child bearing age group (15-49) years, with TFR 3.0. Among E AG states, two states, Bihar and U. P. having 25.1 % population of the country, with highest T FR 3.5 and 3.3, and lowest fe-male literacy rates, 51.5 & 57.2, respectively. EAG states are far away from the goal of replacement level. Thus, India’s population stabilisation and its future, depends mainly on E AG states’ effective population control and women empowerment through skill development schemes. In this context, we should reconsider our population policy and its implementation .Special drive for female education and incentive to stop drop out of girl students, in those states where female literacy is very low, especially in E AG states. Women education is the most prominent determinant of fertility and other determinants of fertility mostly depend on it. Thus, target to edu-cate women beyond the threshold level (at least up to H.S. level) must be achieved. In India, proportion of women in work participation is very low. Development of any country or state is not possible without participation of women (approximately 50% population). To ensure equal proportion of women in work participation, 100% literacy rate, primary education as a fundamental right, along with effective family planning-policies and successful implementation, health program me for women must be ensured in order to reduce fertility rates at replace-ment level. In addition to it, what is position of women education level, work participation, socio-economic conditions and their role in deci-
IJSER

International Journal of Scientific & Engineering Research, Volume 7, Issue 1, January-2016 30 ISSN 2229-5518
IJSER © 2016 http://www.ijser.org
sion making? Thus, women education is the most prominent determinant of fertility and other determinants of fertility mostly depend on it.
State_ Name % Female& their TFR_ in_
Age Group(15-49) Illiterate in_ Age Group (15-49)
Literate in_ Age Group (15-49)
Literate but below Primary
% Female TFR % Female TFR % Female TFR % Female TFR
2001 2011 2001 2011 2001 2011 2001 2001 2011 2001 2001 2011 2001
INDIA 50.7 53.0 3.1 2.5 45.8 33.1 3.8 54.3 66.9 2.4 9.8 9.4 3.0 EAG_States 49.3 52.1 3.9 3.0 58.6 44.0 4.4 41.4 56.0 3.0 8.6 7.9 3.6 UTT. 05 50.0 53.4 3.2 2.3 39.1 25.0 4.2 60.9 75.0 2.4 5.9 4.5 3.6 RAJASTHAN 08 47.2 51.1 3.8 3.0 58.3 49.0 4.2 41.7 51.0 3.0 13.7 7.9 1.4 U.P. 46.2 49.9 4.5 3.3 60.6 43.4 5.1 39.4 56.6 3.4 5.2 5.2 4.6 BIHAR 10 46.0 46.3 4.3 3.5 68.2 51.7 4.5 31.9 48.3 3.4 5.7 9.0 4.2 JHARKH.20 48.2 49.7 3.6 3.0 63.3 46.7 4.0 36.8 53.3 2.7 5.8 8.0 1.8 ORISSA 21 75.5 79.6 2.8 2.0 53.6 37.7 3.3 46.4 62.4 2.2 11.3 12.7 1.7 CHHATTISG. 22 48.9 52.8 3.4 2.4 48.1 37.7 3.9 51.9 62.3 2.8 16.4 8.8 1.6 M.P. 48.0 51.6 3.7 2.8 50.6 41.0 4.3 49.4 59.0 2.9 13.1 9.0 1.7
MAHARAS. 27 51.9 54.9 2.5 2.1 29.6 18.5 3.2 70.4 81.5 2.2 12.7 12.7 1.7 A.P. 28 53.3 55.6 2.3 2.0 51.2 37.7 2.6 48.9 62.3 2.0 9.1 8.4 1.8 KARNAT. 29 53.3 56.0 2.4 2.1 43.0 27.6 2.9 57.0 72.4 2.0 8.8 11.1 2.0 GOA 30 57.2 56.1 1.6 1.6 18.8 9.5 2.4 81.2 90.5 1.5 9.9 13.6 1.6 KERALA 32 55.8 53.7 1.8 1.6 6.5 3.1 2.1 93.6 96.9 1.8 9.4 10.1 1.9 TAMIL NADU 33 56.1 56.9 2.0 1.7 32.2 20.5 2.4 67.8 79.5 1.8 14.0 7.7 1.9
State_ Name Primary but below
Middle Middle but below Matric or HS
Matric/ Secondary but below Graduate Graduate & above
% Female TFR % Female TFR % Female TFR % Female TFR
2001 2011 2001 2001 2011 2001 2001 2011 2001 2001 2011 2001
INDIA 14.0 14.3 2.7 10.4 13.2 2.4 15.7 22.3 1.9 4.4 7.5 1.4 EAG_States 11.5 13.7 3.4 7.8 12.6 3.0 10.2 16.0 2.4 3.3 5.6 1.6
UTT. 05 15.0 14.3 1.6 14.0 17.4 1.4 8.8 25.1 2.0 7.8 13.6 1.3 RAJASTHAN 08 10.7 14.0 1.5 7.0 11.0 1.4 4.7 12.5 2.1 2.8 5.3 1.3
U.P. 10.2 12.4 2.0 9.3 13.5 2.0 3.7 18.6 2.8 3.5 6.7 1.8 BIHAR 10 9.8 11.5 2.0 5.2 9.1 2.0 6.6 15.4 2.9 1.9 2.9 2.1
JHARKH.20 9.8 12.7 1.7 7.1 11.0 1.7 4.1 16.9 2.3 3.0 4.8 1.7 ORISSA 21 15.8 17.6 1.6 5.7 12.0 1.6 3.6 13.9 1.8 3.7 6.1 1.3
CHHATTISG. 22 13.8 16.2 1.5 9.7 17.5 1.5 5.1 14.7 2.0 3.1 4.9 1.3 M.P. 13.2 15.3 1.7 9.2 14.8 1.6 10.1 14.0 2.2 4.0 5.8 1.5
MAHARAS. 27 17.4 15.1 1.6 12.2 14.1 1.5 5.5 29.0 1.8 6.4 10.2 1.3
A.P. 28 15.7 15.5 1.6 4.8 5.8 1.8 9.4 24.6 1.8 3.7 7.6 1.5 KARNAT. 29 15.3 14.8 1.8 8.2 9.5 1.9 19.8 28.6 1.8 4.7 8.3 1.5
GOA 30 12.7 10.4 1.5 14.2 13.8 1.4 5.9 36.9 1.4 10.7 15.4 1.1 KERALA 32 16.4 9.7 1.7 26.1 18.1 1.4 9.6 45.5 1.3 7.4 13.3 1.0
TAMIL NADU 33 17.4 15.1 1.8 13.2 14.7 1.7 15.1 31.3 1.7 4.2 10.5 1.4 In Bihar and Uttar Pradesh, literacy rates are very low as compared to that of India. Female literacy rate of Bihar and Uttar Pradesh in 2001
IJSER
International Journal of Scientific & Engineering Research, Volume 7, Issue 1, January-2016 31 ISSN 2229-5518
IJSER © 2016 http://www.ijser.org
were 33.1 %and 42.2% and gap in male and female literacy rate was 26.6 %, in both states .It was highest 31.9%, in Rajasthan. As per Census of India-2011, in last decade (2001-2011), female literacy improved to 51.5 and 57.2%, in Bihar and Uttar Pradesh, respectively and gap in male and female literacy rates also reduced to 19.7% and 20.1%, respectively. But this improvement is lower than improvement in literacy rate of India
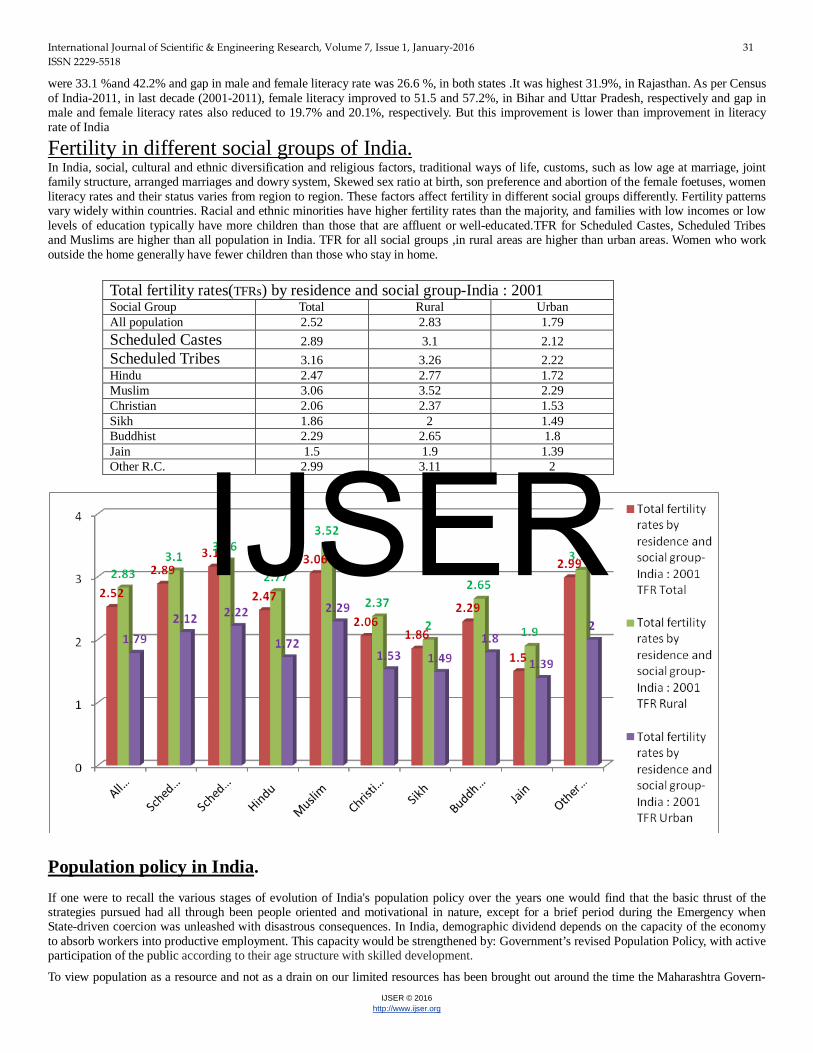
Fertility in different social groups of India. In India, social, cultural and ethnic diversification and religious factors, traditional ways of life, customs, such as low age at marriage, joint family structure, arranged marriages and dowry system, Skewed sex ratio at birth, son preference and abortion of the female foetuses, women literacy rates and their status varies from region to region. These factors affect fertility in different social groups differently. Fertility patterns vary widely within countries. Racial and ethnic minorities have higher fertility rates than the majority, and families with low incomes or low levels of education typically have more children than those that are affluent or well-educated.TFR for Scheduled Castes, Scheduled Tribes and Muslims are higher than all population in India. TFR for all social groups ,in rural areas are higher than urban areas. Women who work outside the home generally have fewer children than those who stay in home.
Total fertility rates(TFRs) by residence and social group-India : 2001 Social Group Total Rural Urban All population 2.52 2.83 1.79 Scheduled Castes 2.89 3.1 2.12 Scheduled Tribes 3.16 3.26 2.22 Hindu 2.47 2.77 1.72 Muslim 3.06 3.52 2.29 Christian 2.06 2.37 1.53 Sikh 1.86 2 1.49 Buddhist 2.29 2.65 1.8 Jain 1.5 1.9 1.39 Other R.C. 2.99 3.11 2
Population policy in India. If one were to recall the various stages of evolution of India's population policy over the years one would find that the basic thrust of the strategies pursued had all through been people oriented and motivational in nature, except for a brief period during the Emergency when State-driven coercion was unleashed with disastrous consequences. In India, demographic dividend depends on the capacity of the economy to absorb workers into productive employment. This capacity would be strengthened by: Government’s revised Population Policy, with active participation of the public according to their age structure with skilled development.
To view population as a resource and not as a drain on our limited resources has been brought out around the time the Maharashtra Govern-
IJSER
International Journal of Scientific & Engineering Research, Volume 7, Issue 1, January-2016 32 ISSN 2229-5518
IJSER © 2016 http://www.ijser.org
ment announced its decision to deny a number of benefits, including rationed food and even healthcare, to families comprising more than two children. This is meant as a disincentive for parents who do not adopt the small family norm. The underlying intention is understandable and it has given positive result, in maharastra. However, this goes counter to one of the lessons learnt over the past six decades of implementation of the population control programme that disincentives not only work but can also be counterproductive. That is why the latest Population Policy-2000, avoids any disincentives, though it envisages some incentives by way of rewarding the panchayats and the families adopting the small family norm. Its focus is on a range of programmes covering different sectors like strengthening the primary healthcare service, reduc-ing maternal and child mortality, development of the girl child, improving access to education for all and meeting the unmet needs of contra-ception to motivate people in favour of the small family norm. Conclusion. From above discussion and analysis, author concludes that complexity of the India’s population fertility is at some point of demographic tran-sition, in the process and moving to its final stage. It varies from state to state of the India. All southern states, Andhra Pradesh, Goa, Karna-taka, Kerala, Maharashtra, Tamil Nadu and two union territories (Pondicherry and Andaman and Nicobar Islands.) have already attained the goal of replacement level (T FR 2.1) before the 2010 deadline while it remains very high in some northern Indian states, especially, Empow-ered Action Group (E AG) States like, UP., Bihar, M. P., Rajasthan etc. These states having highest illiteracy rate and poverty. India has ac-complished the first phase and second phase of demographic transition, namely reduction of crude death rate (7.0) and crude birth rate (21.4) per thousand and passing from third phase to fourth(or last)phase(achieve replacement level). SRS result of 2013, clearly signify that country is very close to achieve replacement level with present T FR 2.4. In last two decades (1991-2011) fertility rates in non developed states (es-pecially E A G States) also declined ,but due to population momentum, a “bulge” or baby boom, generated distinctly larger than those preced-ing or following it, is moving through the age structure of population. These large cohorts create both opportunities and challenges for socie-ty. As this cohort moves into working age group; it will be potentially higher share of workers as compared with dependents population. If working ages population can be productively employed according to their age structure with skilled development, economic growth of India may be accelerated. These population cohorts will create demographic dividend for the country. If this demographic dividend will be em-ployed with skill development, it may result as economic dividend for the country. Failure to take advantage of the opportunities inherent in demographic change can lead to economic stagnation of the country. Acknowledgment I would like to thanks my wife Mrs Indira Pandey, who motivated and inspired me with her innovative ideas to write this paper; I would also
like to thanks Dr Pradeep Misra(Additional director) Population Research Centre , Lucknow university,who guided me to write this Research
Paper,I also thanks Mr A.K.Singh, DRG, (Retired), office of the Registrar General of India who supported with her innovative ideas for writ-
ing this Research Paper. I would like to thanks, Dr Rupam Tiwari (Assistant Professor, in Don Bosco Institute of Management & Research,
Mumbai),in last but not least thanks Mr Gopal Mehato(assistant Director),DCO,Jharkhand,,who always motivated to write research paper.
REFERENCES.
(1) International Journal of Scientific & Engineering Research, Volume 4, Issue1, January 2013, ISSN2229-5518, “Modification in P/F Ratio Technique due to change in assumptions”. By Manjul Mayank Pandey & Dr. Rupam Tiwari. (2) Published report of ‘National Commission on population’ of India. (3) U.N. Manual, estimation of fertility. UNO, published data, on sex ratio of countries. (4) Instruction manuals and published data of Census of India-2001 & 2011 of India and SRS published data. (5) Population analysis spreed sheet (PAS) of U.S. Census Bureau, International Program Centre, with some modifications. (6) “Women education level and their TFR in Uttar Pradesh.” by Manjul Mayank Pandey& Dr Rupam Tiwari. International Journal of Scientific & Engineering Research, Volume 4, Issue 11, November-2013 (7) Bulatao, Rodolfo A. and Ronald Lee (1983). "Overview of Determinants of Fertility in Developing Countries. Determinants of Fertility in Developing Countries. Vol. II, New York; London: Academic Press. Pp. 757-787. (8) Simmons, George B. (1985). "Research on the Determinants of Fertility". In Fertility in Developing Countries: An Economic Perspective on Research and Policy Issues. Ghazi Farooq and George B. Simmons (eds.). London: Macmillan. Pp. 67-108. (9) Sandhu, Jasmeet (1996). Sociology of Fertility. Jaipur and New Delhi: Rawat Publications. (10) Chandrasekhar, C.P., Jayati Ghosh and Anamitra Roy chowdhary (2006). “The Demographic Dividend’ and Young India’s Economic Future”. Economic and political WeeklyDec.9.Vol. 41, No.49.5055-5064. (11) Jejeebhoy, Shireen J. (1995). Women's Education, Autonomy, and Reproduction Behaviour: Experience from Developing Countries. Oxford: Clarendon Press. (12)United Nations. Department for Economic and Social Information and Policy Analysis, Population Division (1995). Women's Education and Fertility Behaviour. New York: United Nations. (13) Chaudhury, R. H. (1977). "Education and Fertility in Bangladesh". Bangladesh Development Studies (Jan.). (14) Amin, Sajeda (1996). "Female Education and Fertility in Bangladesh: The Influence of Marriage and Family". Girl's Schooling and Au-
IJSER
International Journal of Scientific & Engineering Research, Volume 7, Issue 1, January-2016 33 ISSN 2229-5518
IJSER © 2016 http://www.ijser.org
tonomy and Fertility Change in South Asia. Roger Jeffery and Alaka M. Basu (eds.). Thousand Oaks, C.A.: Sage Publications.
(15) SRS, Bulletins and executive summary, data on migration and SRS Statistical report published by ORGI, New Delhi. (16) Population Dynamics in India, by Manjul Mayank Pandey Dr Rupam Tiwari and Dr Anupama Tiwari, International Journal of Scientific & Engineering Research Volume 6, Issue 1, January-2015
(17) Chowdhury, Mridul K. (1994). "Mother's Education and Effect of Son Preference on Fertility in Matlab, Bangladesh." Population Re-
search and Policy Review. Vol. 13: 257-273
(18) Human Population Dynamics by David E. Bloom.
(19) Lant Pritchett,” Desired Fertility and impact of Population Policies”, Population and Development Review, Vol.1, No. 20, March 1994,
pp.1-55.
(20) “Population Dynamics in India and Implications for Economic Growth”, by David E. Bloom. (21)Bloom, David E, David Canning and G Fink,(2008).”Urbanization and the Wealth of Nations”, Science, February, 772-775.
(22). Population-The Ultimate Resource:by Barun S.mitra. (23). John Cleland, “Education and future fertility trends, with special reference to mid-transitional countries.”
IJSER