Embed Size (px)
Citation preview

CHAPTER 7 Economic Growth I slide 0
Economic Growth

CHAPTER 7 Economic Growth I slide 1
The lessons of growth theory
…can make a positive difference in the
lives of hundreds of millions of people.
These lessons help us
understand why poor countries are poor
design policies that can help them grow
learn how our own growth rate is affected by shocks and our government’s policies

CHAPTER 7 Economic Growth I slide 2
The Solow Model
due to Robert Solow, won Nobel Prize for contributions to the study of economic growth
a major paradigm:
– widely used in policy making
– benchmark against which most recent growth theories are compared
looks at the determinants of economic growth and the standard of living in the long run

CHAPTER 7 Economic Growth I slide 3
How Solow model is different from other models
1. _______________________
investment causes it to grow,
depreciation causes it to shrink.
2. _________________________
population growth causes it to grow.
3. The consumption function is simpler.

CHAPTER 7 Economic Growth I slide 4
How Solow model is different from other model
4. No G or T (only to simplify presentation;
we can still do fiscal policy experiments)
5. Cosmetic differences.

CHAPTER 7 Economic Growth I slide 5
The production function
In aggregate terms: Y = F (K, L )
Define: y = _______________
k = _______________
Assume ____________________:
zY = F (zK, zL ) for any z > 0
Pick z = 1/L. Then
Y/L = F (K/L , 1)
y = F (k, 1)
y = f(k) where f(k) = F (k, 1)

CHAPTER 7 Economic Growth I slide 6
The production function
Output per worker, y
Capital per worker, k
f(k)
Note: this production function exhibits ________ MPK.
1 MPK =_________
CHAPTER 7 Economic Growth I slide 7
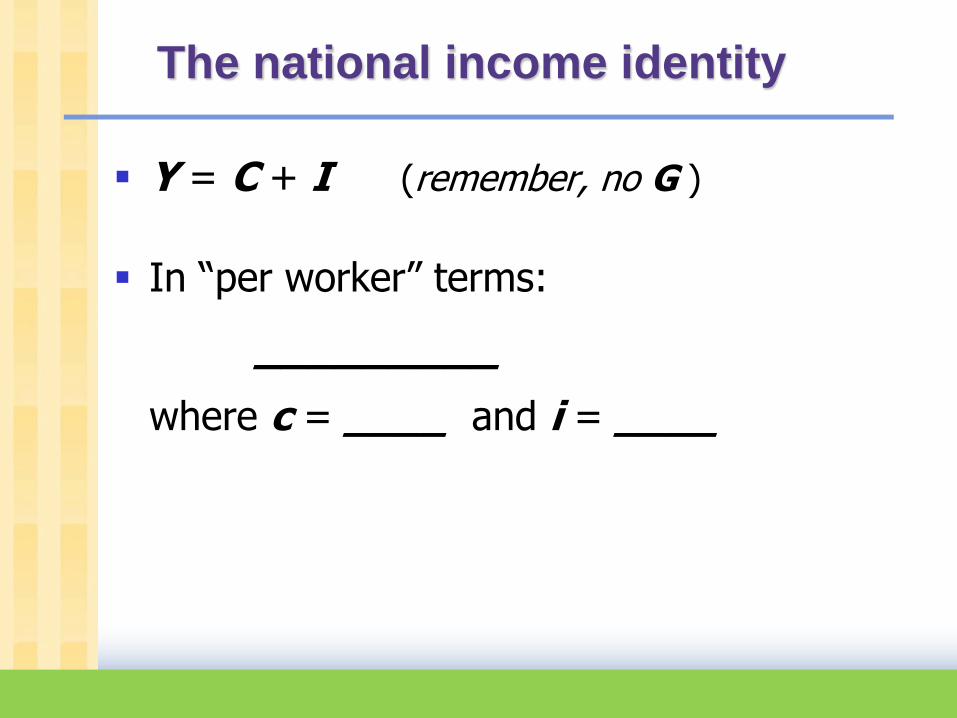
The national income identity
Y = C + I (remember, no G )
In “per worker” terms:
_________
where c = ____ and i = ____

CHAPTER 7 Economic Growth I slide 8
The consumption function
s = the saving rate,
________________________
(s is an exogenous parameter)
Note: s is the only lowercase variable that is not equal to
its uppercase version divided by L
Consumption function: __________ (per worker)

CHAPTER 7 Economic Growth I slide 9
Saving and investment
saving (per worker) = y – c
= _____
National income identity is y = c + i
Rearrange to get: __________
(investment = saving, like in chap. 3!)
Using the results above,
_____________

CHAPTER 7 Economic Growth I slide 10
Output, consumption, and investment
Output per worker, y
Capital per worker, k
___
___
k1
__
__
__

CHAPTER 7 Economic Growth I slide 11
Depreciation
Depreciation per worker, k
Capital per worker, k
k
= the rate of depreciation
=_________________________
1 _

CHAPTER 7 Economic Growth I slide 12
Capital accumulation
The basic idea:
Investment makes
the capital stock bigger,
depreciation makes it smaller

CHAPTER 7 Economic Growth I slide 13
Capital accumulation
Change in capital stock = investment – depreciation k = _i_ – k
Since i = sf(k) , this becomes:
k = s f(k) – k

CHAPTER 7 Economic Growth I slide 14
The equation of motion for k
the Solow model’s central equation
Determines behavior of capital over time…
…which, in turn, determines behavior of
all of the other endogenous variables
because they all depend on k.
k = s f(k) – k
CHAPTER 7 Economic Growth I slide 15
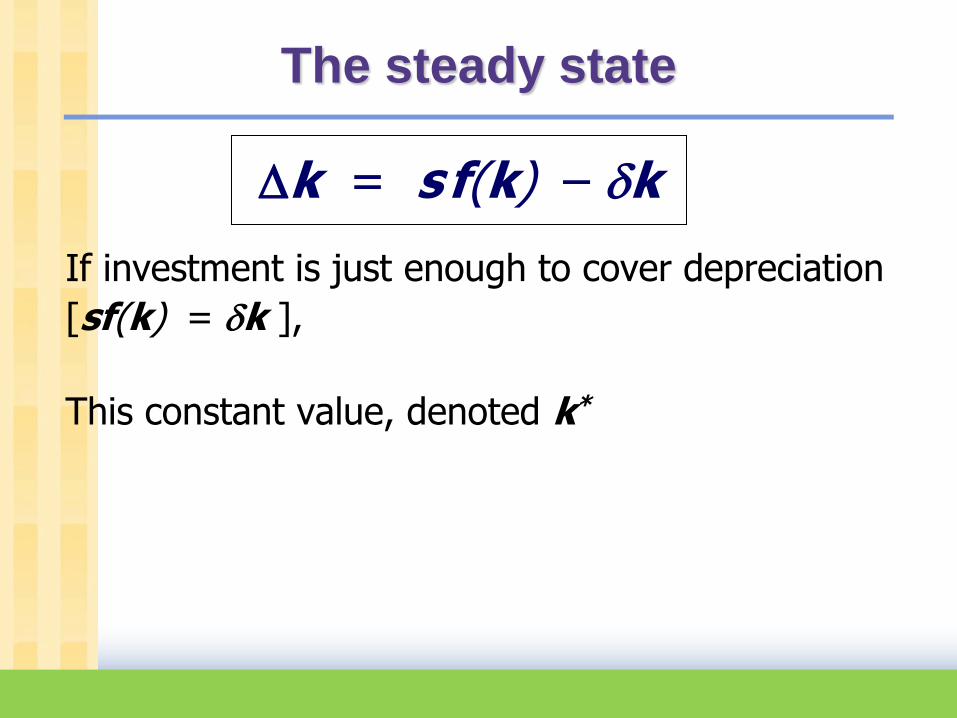
The steady state
If investment is just enough to cover depreciation
[sf(k) = k ],
This constant value, denoted k*
k = s f(k) – k

CHAPTER 7 Economic Growth I slide 16
Moving toward the steady state
Investment and
depreciation
Capital per
worker, k
sf(k)
k
k*
k = sf(k) k
k

CHAPTER 7 Economic Growth I slide 17
An increase in the saving rate
Investment
and
depreciation
k
k
*k1
An increase in the saving rate raises investment…
…causing the capital stock to grow toward a new steady state:
*k2

CHAPTER 7 Economic Growth I slide 18
Prediction:
Thus, the Solow model predicts that countries
with higher rates of saving and investment
will have higher levels of capital and income
per worker in the long run.

CHAPTER 7 Economic Growth I slide 19 19
Investment, break even investment
Capital/worker per pekerja, k
k*1
Investment, s f(k)
( + n1)k
k*2
( + n2)k
Population increase from n1 to n2 will reduce capital stock at steadt state from
k*1 to k*2.
CHAPTER 7 Economic Growth I slide 20 20
Interaction of technology with other variables influence economic growth

CHAPTER 7 Economic Growth I slide 21
Chapter Summary
1. The Solow growth model shows that, in the
long run, a country’s standard of living depends
positively on its saving rate.
negatively on its population growth rate.
2. An increase in the saving rate leads to
higher output in the long run
faster growth temporarily
but not faster steady state growth.


![Structural Change and Economic Growth Abstract: This … · Recent work by Mankiw, Romer, and Weil [1992], Islam [1995 ... Engel's law predicts a ... Historical statistics for the](https://img.pdfslide.net/doc/110x75/5b9f65e509d3f2385c8bae25/structural-change-and-economic-growth-abstract-this-recent-work-by-mankiw.jpg)