Embed Size (px)
Citation preview
Full file at http://testbanksinstant.eu/ Solution-Manual-for-The-Macro-Economy-Today---Schiller---11e
Chapter 01 Economics--The Core Issues1. Which of the following is not one of the three core economic issues that must be resolved?
A. How to produce the goods and services we select.B. What to produce with unlimited resources.C. Who should get the goods and services we produce.D. What to produce with limited resources.
2. "The economy" refers to the sum of all our:
A. Production activities.B. Production, consumption and leisure activities.C. Production and consumption activities.D. Consumption and leisure activities.
3. Because resources are scarce society must make decisions about all of the following except:
A. What to produce.B. Whether scarcity exists or not.C. How to produce the selected goods and services.D. For whom the goods and services are produced.
4. Because resources are scarce, how many key issues must society resolve?
A. Multiple.B. Two.C. Four.D. Three.
5. The fundamental problem of economics is:
A. The law of increasing opportunity costs.B. The scarcity of resources relative to human wants.C. How to get government to operate efficiently.D. How to create employment for everyone.
1

Full file at http://testbanksinstant.eu/ Solution-Manual-for-The-Macro-Economy-Today---Schiller---11e6. In economics, scarcity means that:
A. A shortage of a particular good will cause the price to fall.B. A production-possibilities curve cannot accurately represent the tradeoff between two goods.C. Society's desires exceed the want-satisfying capability of the resources available to satisfy those desires.D. The market mechanism has failed.
7. To an economist, scarcity means that:
A. Shortages will always exist.B. The market mechanism cannot be relied upon.C. A production-possibilities curve cannot accurately represent the tradeoff between two goods.D. There are not enough resources available to satisfy all our desires.
8. Given that resources are scarce:
A. A "free lunch" is possible but only for a limited number of people.B. Opportunity costs are experienced whenever choices are made.C. Poor countries must make choices but rich countries with abundant resources do not have to make
choices.D. Some choices involve opportunity costs while other choices do not.
9. The best description of the origin of the economic problem of scarcity is that humans have:
A. Limited wants for goods and services and resources are also limited.B. Limited wants for goods and services and resources are unlimited.C. Unlimited wants for goods and services but resources are limited.D. Unlimited wants for goods and services and resources are also unlimited.
10. A consequence of the economic problem of scarcity is that:
A. Choices have to be made about how resources are used.B. There is never too much of any good or service produced.C. The production of goods and services must be controlled by the government.D. The production-possibilities curve is bowed outward.
2

Full file at http://testbanksinstant.eu/ Solution-Manual-for-The-Macro-Economy-Today---Schiller---11e11. The basic factors of production include:
A. Land, labor, money, and capital.B. Land, labor, money, and inputs.C. Labor and capital.D. Land, labor, capital, and entrepreneurship.
12. Factors of production are:
A. Scarce in every society.B. Scarce only in United States.C. Scarce only in the poorest countries of the world.D. Unlimited in quantity.
13. Which of the following is not a factor of production?
A. A psychiatrist.B. The $100,000 used to start a new business.C. A bulldozer.D. Six thousand acres of farmland.
14. With respect to factors of production, which of the following statements is not true?
A. Factors of production are also known as resources.B. In order to produce anything, it is necessary to have factors of production.C. Factors of production include land, labor, capital, and entrepreneurship.D. Only those resources that are privately owned are counted as factors of production.
15. Which of the following is the best example of land?
A. The ethanol refined from corn.B. A factory that produces new goods and services.C. The river water used to float a riverboat casino.D. A barber's chair.
3

Full file at http://testbanksinstant.eu/ Solution-Manual-for-The-Macro-Economy-Today---Schiller---11e16. Capital, as economists use the term, refers to:
A. The money needed to start a new business.B. The costs of operating a business.C. Shares of stock issued by businesses.D. Final goods that are used to produce other goods and services.
17. Which of the following is the best example of capital and no other factor of production?
A. Clean air.B. Money in a savings account.C. A computer used by an insurance agent to service her customers.D. The property on which a landfill has been established.
18. Which economist argued that free markets unleashed the "animal spirits" of entrepreneurs, propelling innovation, technology and growth?
A. Lord Kelvin.B. Kenneth Olsen.C. Irving Fisher.D. Joseph Schumpeter.
19. When free markets unleash the "animal spirits" of entrepreneurs, we can expect to see:
A. A reliance on traditional techniques.B. Economic growth.C. A concentration of wealth.D. Economic decline.
20. The role of the entrepreneur in an economy is to:
A. Bring the factors of production together and assume the risk of production.B. Work with government planners to determine what goods are produced.C. Arrange bank financing for the owners of new businesses.D. Ensure full employment of labor.
4
Full file at http://testbanksinstant.eu/ Solution-Manual-for-The-Macro-Economy-Today---Schiller---11e21. Economics is the study of how:
A. Best to use society's scarce resources.B. Society spends the income of individuals.C. Society purchases resources, given its macroeconomic goals.D. Individual market participants decide what to produce given fixed resource constraints.
22. Economics can be defined as the study of:
A. For whom resources are allocated to increase efficiency.B. How society spends the income of individuals.C. How scarce resources are allocated to fulfill society's goals.D. What scarce resources are used to produce goods and services.
23. Opportunity cost is:
A. Only measured in dollars and cents.B. The dollar cost to society of producing the goods.C. The difficulty associated with using one good in place of another.D. The alternative that must be given up in order to get something else.
24. Every time we use scarce resources in one way:
A. We always use them in the best way possible.B. We forgo the opportunity to use them in other ways.C. A free lunch is created.D. This use implies that no other uses were possible.
25. Opportunity cost may be defined as the:
A. Goods or services that are forgone in order to obtain something else.B. Dollar prices paid for final goods and services.C. Dollar cost of producing a particular product.D. Difference between wholesale and retail prices.
5
Full file at http://testbanksinstant.eu/ Solution-Manual-for-The-Macro-Economy-Today---Schiller---11e26. The opportunity cost of studying for an economics test is:
A. Negative, since it may improve your grade.B. Zero, because you knew when you registered for the class that studying would be required.C. The money you spent on tuition for the class.D. The best alternative use of your time.
27. The concept of opportunity cost would become irrelevant if:
A. The market mechanism functioned to allocate resources fairly.B. The government allocated resources.C. The production-possibilities curve bowed outward.D. Resources were no longer scarce.
28. The "guns versus butter" dilemma that all nations confront is that:
A. Guns and butter cannot be produced using the same resources.B. An increase in national defense implies still more sacrifices of civilian goods and services.C. An increase in national defense is only possible if we produce less butter.D. Butter is scarce, while guns are not.
29. A production-possibilities curve indicates the:
A. Combinations of goods and services an economy is actually producing.B. Maximum combinations of goods and services an economy can produce given its available resources
and technology.C. Maximum combinations of goods and services an economy can produce given unlimited resources.D. Average combinations of goods and services an economy can produce given its available resources and
technology.
30. The alternative combinations of goods and services that can be produced in a given time period with all available resources and technology is referred to as:
A. Opportunity cost.B. Factors of production.C. Production possibilities.D. Capital.
6

Full file at http://testbanksinstant.eu/ Solution-Manual-for-The-Macro-Economy-Today---Schiller---11e31. Which of the following is an assumption under which the production-possibilities curve is drawn?
A. There is significant unemployment.B. The supply of resources is fixed.C. The price level is changing.D. Technology is changing.
32. Which of the following is an assumption under which the production-possibilities curve is drawn?
A. All goods sell for the same price.B. The supply of resources is growing.C. Resources are equally well suited for production of all outputs.D. Technology is fixed.
33. Production-possibilities curves demonstrate that:
A. Producing more of one good implies a reduction in the potential production of another good.B. It is always possible to produce more of one good.C. It is always possible to produce more of one good without producing less of another.D. It is never possible to produce zero output.
34. A point on a nation's production-possibilities curve represents:
A. An undesirable combination of goods and services.B. Combinations of production that are unattainable, given current technology and resources.C. Levels of production that will cause both unemployment and inflation.D. The full employment of resources to achieve a particular combination of goods and services.
35. Which of the following correctly characterizes the shape of a production-possibilities curve?
A. A straight line indicating the law of increasing opportunity costs applies.B. A straight line when there are constant opportunity costs.C. A line that curves outward when resources are perfectly adaptable in the production of different goods.D. A line that curves inward when resources are perfectly adaptable in the production of different goods.
7

Full file at http://testbanksinstant.eu/ Solution-Manual-for-The-Macro-Economy-Today---Schiller---11e36. If an economy is producing on its production-possibilities curve, then producing:
A. More of one good implies producing more of another good.B. More of one good implies producing less of another good.C. Less of one good implies producing less of another good.D. More of one good implies shifting the curve toward the origin.
37. The production-possibilities curve illustrates:
A. The limitations that exist because of scarce resources.B. That there is no limit to what an economy can produce.C. That there is no limit to the level of output.D. The existence of unlimited wants and resources.
38. The production-possibilities curve illustrates that:
A. Society can always produce more of all goods simultaneously.B. Constant opportunity costs always exist.C. There are no opportunity costs in a wealthy economy.D. If society is efficient, it can produce more of one good only if it reduces output of another good.
39. According to the law of increasing opportunity costs:
A. The more one is willing to pay for resources, the larger will be the possible level of production.B. Increasing the production of a particular good will cause the price of the good to rise.C. In order to produce additional units of a particular good, it is necessary for society to sacrifice
increasingly larger amounts of alternative goods.D. Only by keeping production constant can rising prices be avoided.
40. The law of increasing opportunity costs explains:
A. How everything becomes more expensive as the economy grows.B. The shape of the production-possibilities curve.C. Inflation.D. The position of the production-possibilities curve.
8
Full file at http://testbanksinstant.eu/ Solution-Manual-for-The-Macro-Economy-Today---Schiller---11e41. According to the law of increasing opportunity costs:
A. Greater production leads to greater inefficiency.B. Greater production means factor prices rise.C. Greater production of one good requires increasingly larger sacrifices of other goods.D. Higher opportunity costs induce higher output per unit of input.
42. If an economy experiences increasing opportunity costs with respect to two goods, then the production-possibilities curve between the two goods will be:
A. Bowed outward.B. A straight, downward-sloping line.C. Bowed inward.D. Bowed outward until the two goods are equal, and then bowed inward.
43. The production-possibilities curve bows outward because:
A. Resources are used inefficiently as more of a good is produced.B. In order to get more of a particular good, increasing quantities of other goods must be given up.C. Resources move easily from the production of one good to the production of another.D. Resources are scarce and choices must be made.
44. If the United States decides to convert automobile factories to tank production, as it did during World War II, but finds that some auto manufacturing facilities are not well suited to tank production, then:
A. The production-possibilities curve between tanks and automobiles will appear as a straight line.B. The production-possibilities curve between tanks and automobiles will shift outward.C. Decreasing opportunity costs will occur with greater automobile production.D. Increasing opportunity costs will occur with greater tank production.
45. If Korea increases the size of its military, then, as long as nothing else changes, its:
A. Production-possibilities curve will shift outward.B. Production-possibilities curve will shift inward.C. Production of non-military goods will increase.D. Production of non-military goods will decrease.
9

Full file at http://testbanksinstant.eu/ Solution-Manual-for-The-Macro-Economy-Today---Schiller---11e46. If China decreases the size of its military, then, as long as nothing else changes, its:
A. Production-possibilities curve will shift outward.B. Production-possibilities curve will shift inward.C. Production of non-military goods will increase.D. Production of non-military goods will decrease.
47. Korea's inability to feed itself is partly due to the fact that:
A. Resources used for the military aren't available for food production.B. It does not own resources that are useful for food production.C. Other nations hesitate to trade with Korea.D. Korea operates significantly below its production-possibilities curve.
48. Efficiency can be defined as the:
A. Maximum resources used in producing a given output level.B. Maximum output of a good produced from the available resources.C. Minimum output of a good produced from the available resources.D. Maximum output of a good produced if all resources are devoted to its production.
49. When an economy is producing efficiently it is:
A. Producing a combination of goods and services beyond the production-possibilities curve.B. Getting the most goods and services from the available resources.C. Experiencing decreasing opportunity costs.D. Producing equal amounts of all goods.
50. Which of the following is true when an economy is producing efficiently?
A. The economy is producing on the production-possibilities curve.B. Goods and services are being produced using the most resources.C. The economy is getting the fewest goods and services from the available resources.D. Everyone in the economy is happy.
10

Full file at http://testbanksinstant.eu/ Solution-Manual-for-The-Macro-Economy-Today---Schiller---11e51. Every point on the production-possibilities curve is considered to be:
A. Efficient.B. An optimal level of output.C. Equally desirable.D. Undesirable.
52. The points on a production-possibilities curve show:
A. Desired output.B. Actual output.C. Potential output.D. All of the above.
53. In terms of the production-possibilities curve, inefficiency is represented by:
A. All points on the curve.B. All points outside the curve.C. All points inside the curve.D. A rightward shift of the curve.
54. If an economy is producing inside the production-possibilities curve, then:
A. It does not have enough resources to be efficient.B. It must give up some of one good to produce more of another good.C. The curve needs to shift inward.D. It is using its resources inefficiently.
55. If an economy is producing inside the production-possibilities curve, then:
A. There is full employment of resources.B. It is operating efficiently.C. It can produce more of one good without giving up some of another good.D. There are not enough resources available to produce more output.
11

Full file at http://testbanksinstant.eu/ Solution-Manual-for-The-Macro-Economy-Today---Schiller---11e56. When technological change allows a smaller amount of a resource to be used in producing two goods
shown on a production-possibilities curve, there will be:
A. A movement along the production-possibilities curve.B. An inward shift of the production-possibilities curve.C. An outward shift of the production-possibilities curve.D. No change in the production-possibilities curve.
57. A technological advance would best be represented by:
A. A shift outward of the production-possibilities curve.B. A shift inward of the production-possibilities curve.C. A movement from inside the production-possibilities curve to a point on the production-possibilities
curve.D. A movement from the production-possibilities curve to a point inside the production-possibilities curve.
58. Which of the following events would allow the production-possibilities curve to shift outward?
A. The economy's capital stock declines.B. More teenagers enter the labor force.C. Technology is lost.D. People begin to retire at earlier ages.
59. Which of the following events would allow the production-possibilities curve to shift outward?
A. More people retire before the traditional retirement age of 65.B. People take less vacation time.C. Hail storms and tornadoes strike a number of states.D. People decide that they prefer more food and less of other goods.
60. The production-possibilities curve shifts outward in response to:
A. Better technology or fewer resources or both.B. Better technology or more resources or both.C. Declining technology or fewer resources or both.D. Declining technology or more resources or both.
12

Full file at http://testbanksinstant.eu/ Solution-Manual-for-The-Macro-Economy-Today---Schiller---11e61. Economic growth would best be represented by a:
A. Shift outward of the production-possibilities curve.B. Shift inward of the production-possibilities curve.C. Movement from inside the production-possibilities curve to a point on the production-possibilities curve.D. Movement from the production-possibilities curve to a point inside the production-possibilities curve.
62. Which of the following events would cause the production-possibilities curve to shift outward?
A. A labor strike.B. The full employment of resources.C. Increased efficiency in the use of resources.D. A decrease in available resources.
63. Which of the following events would cause the production-possibilities curve to shift inward?
A. A decrease in the supply of labor.B. An increase in the number of factories.C. A technological breakthrough occurs that makes production of all goods more efficient.D. An increase in the unemployment rate.
64. Which of the following will cause the production-possibilities curve to shift inward?
A. An increase in population.B. A decrease in the size of the labor force.C. A technological advance.D. An increase in knowledge.
65. A decrease in available resources would cause:
A. An economy to move inside its production-possibilities curve.B. The production-possibilities curve to shift inward.C. Opportunity costs to increase.D. The unemployment of resources.
13
Full file at http://testbanksinstant.eu/ Solution-Manual-for-The-Macro-Economy-Today---Schiller---11e66. The availability of fewer resources can be represented by:
A. An inward shift of the production-possibilities curve.B. No change in the production-possibilities curve.C. A movement along the production-possibilities curve.D. An outward shift of the production-possibilities curve.
67. Which of the following is not a basic decision that all nations must confront?
A. Should we have economic growth?B. How should we produce goods and services?C. For whom should goods and services be produced?D. What goods and services should we produce?
68. In a market economy, the question of WHAT to produce is answered by:
A. Direct negotiations between consumers and producers.B. Producer profits and sales.C. Government directives.D. A democratic vote of all producers.
69. In a market economy, the question of HOW to produce is determined by:
A. Government planners.B. The production possibilities curve.C. The least-cost method of production.D. The method of production which uses the least amount of labor.
70. In a market economy, the people who receive the goods and services that are produced are those who:
A. Need the goods and services the most.B. Have the most political power.C. Want the goods and services the most.D. Are willing to pay the highest price.
14

Full file at http://testbanksinstant.eu/ Solution-Manual-for-The-Macro-Economy-Today---Schiller---11e71. The market mechanism may best be defined as:
A. The use of market prices and sales to signal desired output.B. The use of market signals and government directives to select economic outcomes.C. The process by which the production-possibilities curve shifts inward.D. Price regulation by government.
72. The market mechanism:
A. Allows buyers to communicate with producers indirectly.B. Is directed by the government in order to promote efficiency.C. Results in the misallocation of resources because producers seek to maximize profits.D. Allocates goods in an equitable manner.
73. The market mechanism:
A. Is not a very efficient means of communicating consumer demand to the producers of goods and services.
B. Works through central planning by government.C. Eliminates market failures created by government.D. Works because prices serve as a means of communication between consumers and producers.
74. The invisible hand refers to:
A. Intervention in the economy by the government bureaucrats we do not see and over whom we have no control.
B. Undiscovered natural resources.C. The allocation of resources by market forces.D. The person who has the responsibility to coordinate all the markets in a market economy.
75. The doctrine of laissez faire is based on the belief that:
A. Markets are likely to do a better job of allocating resources than government directives.B. Government directives are likely to do a better job of allocating resources than markets.C. Government failure does not exist.D. Markets result in an unfair distribution of income.
15

Full file at http://testbanksinstant.eu/ Solution-Manual-for-The-Macro-Economy-Today---Schiller---11e76. Which of the following would advocate a laissez faire economic policy?
A. Karl Marx.B. John Maynard Keynes.C. Adam Smith.D. President Franklin Roosevelt.
77. A city's decision to limit smoking in public areas is an example of:
A. The invisible hand at work.B. The market mechanism at work.C. Market failure.D. Government intervention.
78. Karl Marx believed that the best use of resources would result from:
A. Government directives.B. Laissez faire policies.C. Production decisions based on costs alone.D. A mixture of government directives and market signals.
79. Karl Marx wrote:
A. The Wealth of Nations, which provided the rationale for centrally-planned economies.B. The Wealth of Nations, which described the virtues of market-based economies.C. Das Kapital, which provided the rationale for centrally-planned economies.D. Das Kapital, which described the virtues of market-based economies.
80. In a mixed economy like that in the United States, the question of WHAT to produce is determined by:
A. Government directives only.B. Price signals and sales in markets only.C. Both government directives, and price signals and sales in markets.D. The invisible hand only.
16

Full file at http://testbanksinstant.eu/ Solution-Manual-for-The-Macro-Economy-Today---Schiller---11e81. A mixed economy:
A. Is justified by the superiority of laissez faire over government intervention.B. Utilizes both market and nonmarket signals to allocate goods and services.C. Relies on the use of central planning by private firms rather than the government.D. Is one that allows trade with other countries.
82. Which of the following is the most appropriate way to match different economic systems with their corresponding failures?
A. Market failures with command economies.B. Government failures with market economies.C. Market failures and government failures with mixed economies.D. Neither market nor government failure in a purely capitalist economy.
83. Which of the following can be used to correct market failure?
A. The market mechanism.B. Laws and regulations.C. Laissez-faire price policies.D. Government failure.
84. When the invisible hand does not produce optimal outcomes for the economy, there is evidence of:
A. Market failure.B. Government failure.C. Macroeconomic failure.D. Scarcity.
85. Government intervention may achieve a more optimal outcome than the market mechanism when addressing:
A. Inefficient bureaucracy.B. Consumption of cigarettes.C. Lack of incentive to try new products or technologies.D. Inefficient bureaucracy, consumption of cigarettes, and lack of incentive to try new products or
technologies.
17

Full file at http://testbanksinstant.eu/ Solution-Manual-for-The-Macro-Economy-Today---Schiller---11e86. If market signals result in pollution beyond the optimal level then:
A. The economy experiences government failure.B. A laissez-faire approach will reduce the level of pollution.C. The market mechanism has failed.D. The government is allocating resources inefficiently.
87. Pollution is an example of:
A. Inefficient operation by the firm that is polluting.B. Market failure.C. The ability of central planning to provide the optimal quantities of goods.D. Government failure.
88. The collapse of communism is evidence of:
A. Ceteris paribus.B. Government failure.C. Market failure.D. The failure of a mixed economy.
89. When government directives do not produce better economic outcomes, which of the following has occurred?
A. Government failure.B. Market failure.C. Macroeconomic failure.D. Scarcity.
90. Which of the following is an example of government failure?
A. Bureaucratic delays.B. Required use of pollution-control technologies that are obsolete.C. Inefficient incentives.D. Bureaucratic delays, required use of pollution-control technologies that are obsolete, and inefficient
incentives.
18

Full file at http://testbanksinstant.eu/ Solution-Manual-for-The-Macro-Economy-Today---Schiller---11e91. Macroeconomics focuses on the performance of:
A. Individual consumers.B. Government agencies.C. The overall economy.D. All of the above.
92. Macroeconomics focuses on the performance of:
A. Individual firms.B. Particular government agencies.C. Specific consumers.D. The entire economy.
93. Which of the following is not a macroeconomic statement?
A. The unemployment rate for the United States rose to 5 percent in the last quarter.B. The price of corn rose to a ten year low in August.C. Congress increased the minimum wage rate in January.D. Jenny's wage rate rose and, in response, she decided to work more hours.
94. Which of the following are classified as microeconomic goals?
A. Full employment, price stability, growth in output.B. The welfare of individual consumers and business firms.C. Production, pricing, and purchasing.D. Land, labor, and capital.
95. The study of microeconomic theory focuses on the:
A. Structure and performance of markets and the operation of the price system.B. Operation of the entire economy.C. Role of the banking system in the economy.D. Interaction of international trade and domestic production of goods and services.
19

Full file at http://testbanksinstant.eu/ Solution-Manual-for-The-Macro-Economy-Today---Schiller---11e96. Microeconomics is concerned with issues such as:
A. The demand for bottled water by individuals.B. The level of inflation in the economy.C. Maintaining a strong level of economic growth.D. All of the above.
97. Economic models are used by economists to:
A. Predict economic behavior.B. Develop economic policies.C. Explain economic behavior.D. Predict economic behavior, develop economic policies, and explain economic behavior.
98. The Latin phrase ceteris paribus means:
A. The production-possibilities curve never shifts.B. Laissez faire.C. Other things remain equal.D. The invisible hand.
Figure 1.1Production-possibilities curve
20

Full file at http://testbanksinstant.eu/ Solution-Manual-for-The-Macro-Economy-Today---Schiller---11e99. At which point is society employing some of its available technology but not all of it? (See Figure 1.1.)
A. A.B. B.C. C.D. D.
100.At which point is society not able to produce either good because it is so inefficient? (See Figure 1.1.)
A. A.B. B.C. C.D. D.
101.At which point is society producing the most output possible with the available resources and technology? (See Figure 1.1.)
A. A.B. B.C. C.D. D.
102.At which point is society producing some of each type of structure but still producing inefficiently? (See Figure 1.1.)
A. A.B. B.C. C.D. D.
103.At which point is society achieving productive efficiency? (See Figure 1.1.)
A. A.B. B.C. C.D. D.
21
Full file at http://testbanksinstant.eu/ Solution-Manual-for-The-Macro-Economy-Today---Schiller---11e104.At which point might society be able to produce this combination if new resources were discovered but
cannot produce at with current resources? (See Figure 1.1.)
A. A.B. B.C. C.D. D.
105.At which point is society not able to produce with existing resources and technology? (See Figure 1.1.)
A. A.B. B.C. C.D. D.
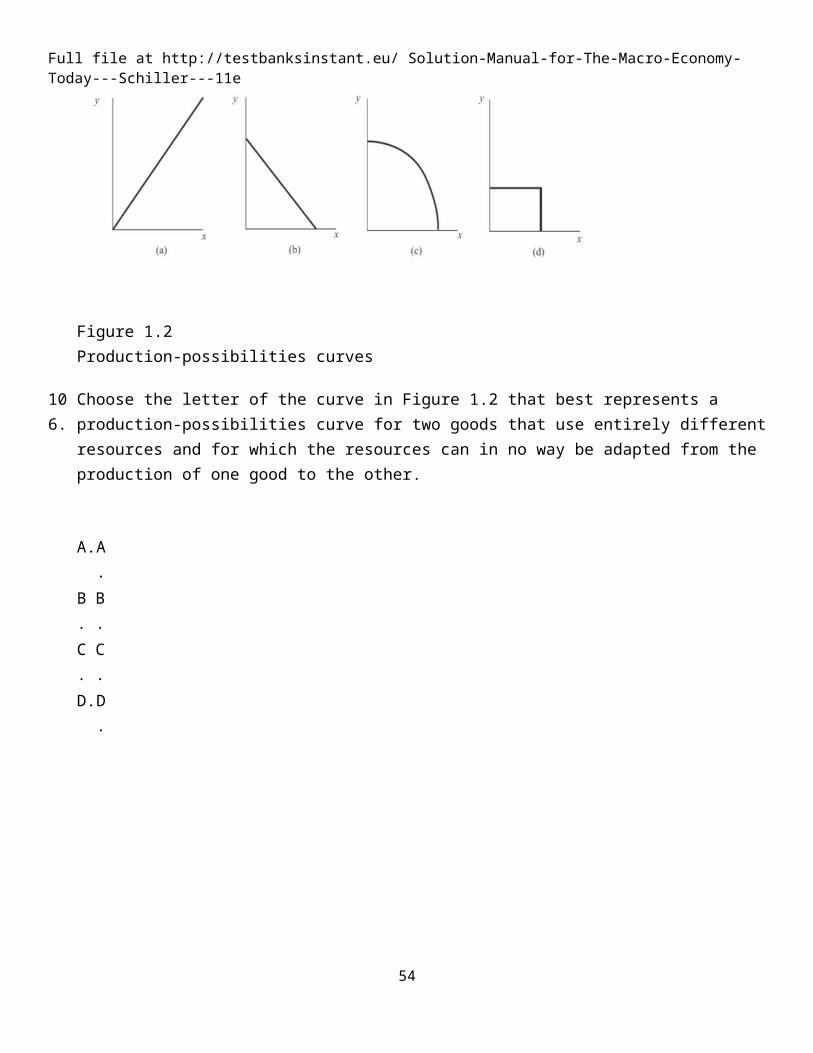
Figure 1.2Production-possibilities curves
106.Choose the letter of the curve in Figure 1.2 that best represents a production-possibilities curve for two goods that use entirely different resources and for which the resources can in no way be adapted from the production of one good to the other.
A. A.B. B.C. C.D. D.
22

Full file at http://testbanksinstant.eu/ Solution-Manual-for-The-Macro-Economy-Today---Schiller---11e107.Choose the letter of the curve in Figure 1.2 that best represents a production-possibilities curve for two
goods that obey the law of increasing opportunity costs.
A. A.B. B.C. C.D. D.
108.Choose the letter of the curve in Figure 1.2 that best represents a production-possibilities curve for two goods for which there are constant opportunity costs.
A. A.B. B.C. C.D. D.
Figure 1.3
109.Using Figure 1.3, an increase in the capacity to produce can be represented by a movement from:
A. Point A to point B.B. Point A to point C.C. Point B to point C.D. Point C to point F.
23

Full file at http://testbanksinstant.eu/ Solution-Manual-for-The-Macro-Economy-Today---Schiller---11e110.Using Figure 1.3, at point A:
A. There is inefficient use of available resources.B. The available technology keeps production inside PP1.C. All available resources are being used efficiently.D. An increase in the production of mops would definitely require a decrease in the production of brooms.
111.Which of the following is true about the combination of mops and brooms represented by point E in Figure 1.3?
A. This economy will never be able to reach point E.B. Point E is attainable if this economy uses more of its available resources.C. Point E is attainable if this economy becomes more efficient.D. Point E is attainable only if more resources become available or technological advances are made.
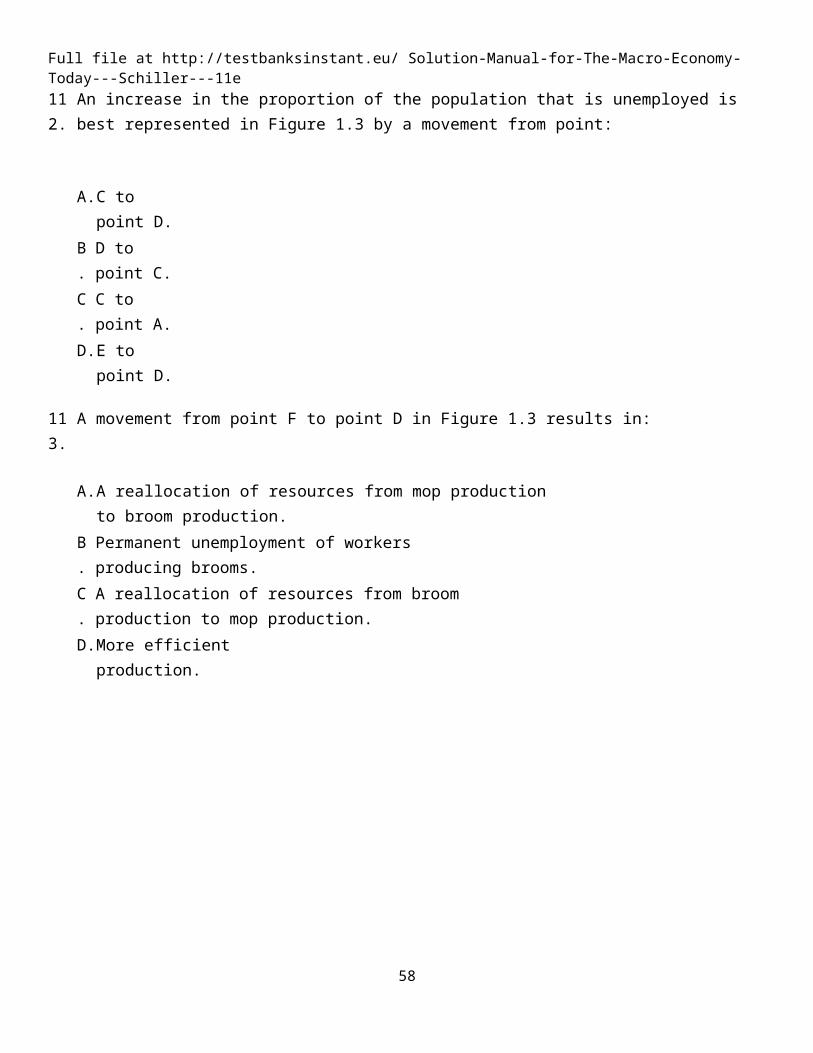
112.An increase in the proportion of the population that is unemployed is best represented in Figure 1.3 by a movement from point:
A. C to point D.B. D to point C.C. C to point A.D. E to point D.
113.A movement from point F to point D in Figure 1.3 results in:
A. A reallocation of resources from mop production to broom production.B. Permanent unemployment of workers producing brooms.C. A reallocation of resources from broom production to mop production.D. More efficient production.
114.In Figure 1.3, a shift of the production possibilities curve from PP1 to PP2 could be caused by:
A. A decrease in the quantity of raw materials available.B. A decline in the production skills of workers.C. The use of improved production technology.D. All of the above could cause the shift.
24

Full file at http://testbanksinstant.eu/ Solution-Manual-for-The-Macro-Economy-Today---Schiller---11e
Figure 1.4
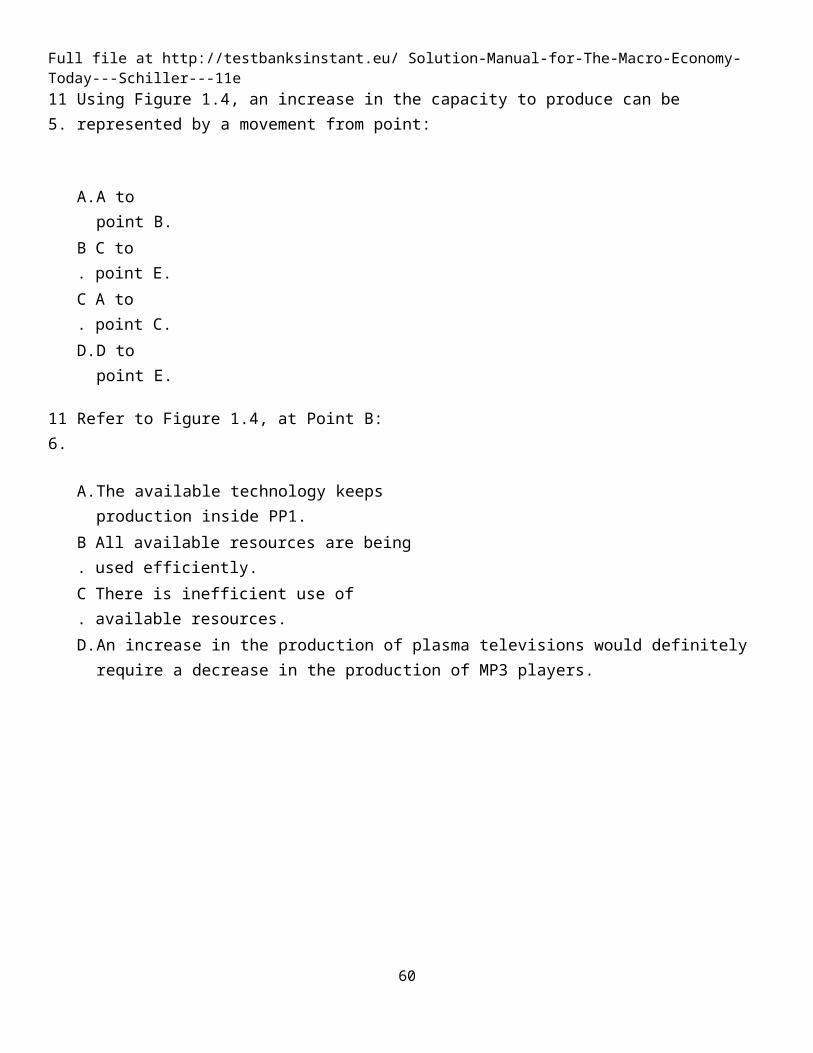
115.Using Figure 1.4, an increase in the capacity to produce can be represented by a movement from point:
A. A to point B.B. C to point E.C. A to point C.D. D to point E.
116.Refer to Figure 1.4, at Point B:
A. The available technology keeps production inside PP1.B. All available resources are being used efficiently.C. There is inefficient use of available resources.D. An increase in the production of plasma televisions would definitely require a decrease in the production
of MP3 players.
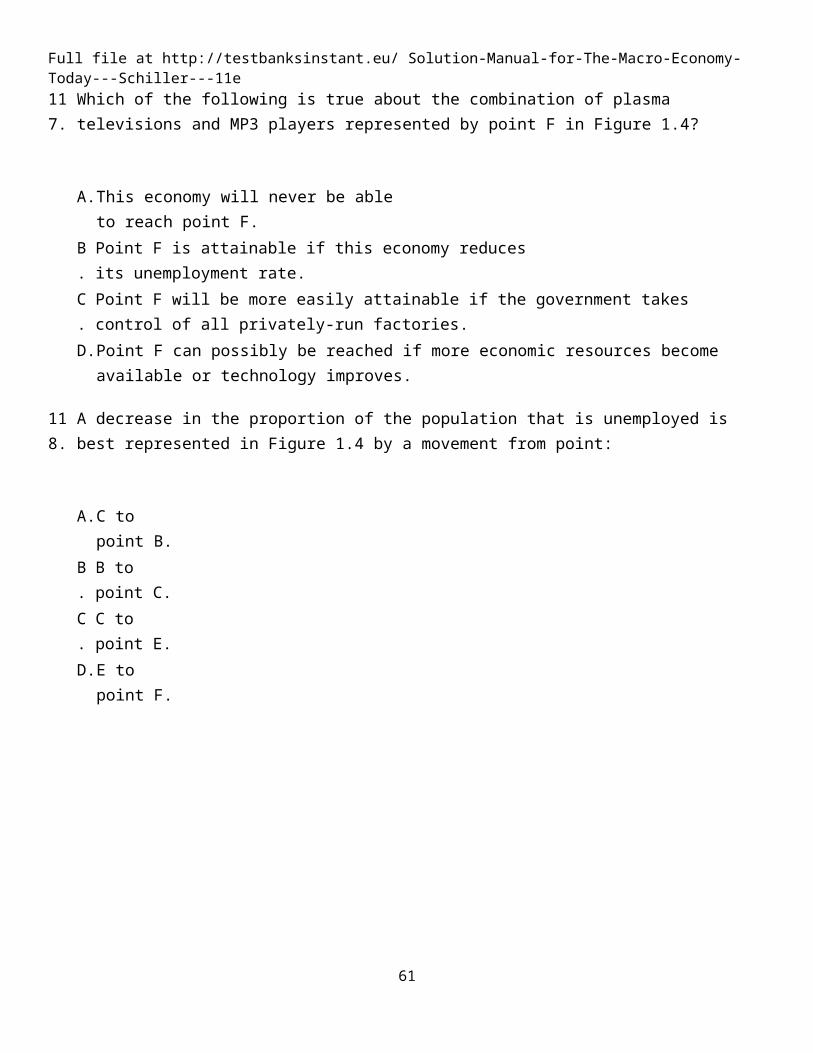
117.Which of the following is true about the combination of plasma televisions and MP3 players represented by point F in Figure 1.4?
A. This economy will never be able to reach point F.B. Point F is attainable if this economy reduces its unemployment rate.C. Point F will be more easily attainable if the government takes control of all privately-run factories.D. Point F can possibly be reached if more economic resources become available or technology improves.
25

Full file at http://testbanksinstant.eu/ Solution-Manual-for-The-Macro-Economy-Today---Schiller---11e118.A decrease in the proportion of the population that is unemployed is best represented in Figure 1.4 by a
movement from point:
A. C to point B.B. B to point C.C. C to point E.D. E to point F.
119.A movement from point C to point A in Figure 1.4 results in:
A. More efficient production.B. Permanent unemployment of workers producing plasma televisions.C. A reallocation of resources from MP3 player production to plasma television production.D. A reallocation of resources from plasma television production to MP3 player production.
120.In Figure 1.4, a shift of the production-possibilities curve from PP1 to PP2 could be caused by:
A. An increase in the unemployment rate.B. Implementation of training programs which improve the skills of workers.C. Better use of existing technology.D. Tougher pollution controls for the producers of plasma televisions and MP3 players.
Figure 1.5
26

Full file at http://testbanksinstant.eu/ Solution-Manual-for-The-Macro-Economy-Today---Schiller---11e121.Using Figure 1.5, if an economy has the capacity to produce represented by PP2 then point E represents:
A. A constant tradeoff between lattes and milkshakes.B. A combination of lattes and milkshakes that is not attainable.C. An efficient use of resources.D. The unemployment of resources.
122.Using Figure 1.5, if an economy is currently producing on PP2, which of the following would shift the production-possibilities curve toward PP1?
A. An increase in the quantity of labor available.B. A decrease in the amount of capital available.C. An increase in the level of unemployment.D. An advancement in technology.
123.In Figure 1.5, if the opportunity cost of producing milkshakes was zero at all levels of production, the production-possibilities curve would best be represented by a:
A. Vertical straight line.B. 45-degree line starting at the origin.C. Horizontal straight line.D. Circle.
124.In Figure 1.5, at which of the following points would the opportunity cost of producing another latte be greatest?
A. D.B. E.C. B.D. C.
27

Full file at http://testbanksinstant.eu/ Solution-Manual-for-The-Macro-Economy-Today---Schiller---11e125.In Figure 1.5, at which of the following points would the opportunity cost of producing another milkshake
be greatest?
A. F.B. E.C. B.D. C.
Figure 1.6
126.Using Figure 1.6, if an economy has the capacity to produce represented by PP1 then point E represents:
A. A combination of cars and SUVs that is not attainable.B. A constant tradeoff between cars and SUVs.C. The unemployment of resources.D. An efficient use of resources.
127.In Figure 1.6, if the opportunity cost of producing cars was zero at all levels of production, the production-possibilities curve would be best be represented by a:
A. Vertical straight line.B. 45-degree line starting at the origin.C. Horizontal straight line.D. Circle.
28
Full file at http://testbanksinstant.eu/ Solution-Manual-for-The-Macro-Economy-Today---Schiller---11e128.In Figure 1.6, at which of the following points would the opportunity cost of producing an additional SUV
be the lowest?
A. B.B. E.C. A.D. F.
129.In Figure 1.6, at which of the following points would the opportunity cost of producing one more car be the lowest?
A. F.B. E.C. B.D. C.
130.In Figure 1.6, at which of the following points would the opportunity cost of producing one more SUV be the highest?
A. C.B. B.C. A.D. F.
Figure 1.7
29
Full file at http://testbanksinstant.eu/ Solution-Manual-for-The-Macro-Economy-Today---Schiller---11e131.Refer to Figure 1.7. This economy will achieve efficiency in production at:
A. Point D only.B. Point G only.C. Point J only.D. Points D, G, and J.
132.Refer to Figure 1.7. The cost of producing at point G rather than point D is:
A. OA units of food.B. KL units of clothing.C. AB units of food.D. OL units of clothing.
133.Refer to Figure 1.7. The benefit of producing at point G rather than point D is:
A. OA units of food.B. KL units of clothing.C. AB units of food.D. OL units of clothing.
134.Refer to Figure 1.7. The cost of producing at point D rather than point J is:
A. KM units of clothing.B. AC units of food.C. OM units of clothing.D. OA units of food.
135.Refer to Figure 1.7. The benefit of producing at point D rather than point J is:
A. KM units of clothing.B. OA units of food.C. OM units of clothing.D. AC units of food.
30

Full file at http://testbanksinstant.eu/ Solution-Manual-for-The-Macro-Economy-Today---Schiller---11e136.Refer to Figure 1.7. If this economy is currently producing at point F, then by employing more resources
this economy:
A. Can move to point D, but not points G or J.B. Can move to points D, G or J.C. Can move to point G, but not points D or J.D. Will remain at point F.
137.Refer to Figure 1.7. Which of the following points are considered to be inefficient?
A. D.B. E.C. G.D. D, G, and J.
138.Refer to Figure 1.7. Which of the following points are unattainable?
A. G.B. F.C. N.D. E.
139.Refer to Figure 1.7. Which of the following points show unemployment of resources?
A. H.B. J.C. N.D. D.
Figure 1.8
31

Full file at http://testbanksinstant.eu/ Solution-Manual-for-The-Macro-Economy-Today---Schiller---11e140.Refer to Figure 1.8. Assume that Point X is associated with production of 500 cars and 1,000 trucks while
Point Y is associated with production of 600 cars and 950 trucks. If Point Z is associated with production of 700 cars, then it is most reasonable to assume that Point Z is also associated with production of:
A. 1,100 trucks.B. 950 trucks.C. 900 trucks.D. 812 trucks.
141.Refer to Figure 1.8. Assume that Point Z is associated with production of 10,000 cars and 10,000 trucks while Point Y is associated with production of 8,000 cars and 9,000 trucks. If Point Z is associated with production of 700 cars, then it is most reasonable to assume that Point Z is also associated with production of:
A. 7,300 cars.B. 7,600 cars.C. 8,000 cars.D. 8,800 cars.
Table 1.1 shows the hypothetical tradeoff between different combinations of Stealth bombers and B-1 bombers that might be produced in a year with the limited U.S. capacity, ceteris paribus. Complete the table by calculating the required opportunity costs for both the B-1 and Stealth bombers. Then answer the indicated questions.
Table 1.1Production possibilities for bombers
32

Full file at http://testbanksinstant.eu/ Solution-Manual-for-The-Macro-Economy-Today---Schiller---11e142.On the basis of your calculations in Table 1.1, you may infer that the law of increasing opportunity costs
applies to:
A. Stealth bombers but not to B-1 bombers.B. B-1 bombers but not to Stealth bombers.C. Both B-1 bombers and Stealth bombers.D. Neither B-1 bombers nor Stealth bombers.
143.On the basis of your calculations in Table 1.1, what is the opportunity cost of producing at point S rather than point T?
A. 1 Stealth bomber.B. 1 B-1 bomber.C. 10 Stealth bombers.D. 0.9 Stealth bombers.
144.On the basis of your calculations in Table 1.1, what is gained by producing at point S rather than point T?
A. 1 Stealth bomber.B. 1 B-1 bomber.C. 10 Stealth bombers.D. 0.9 Stealth bombers.
145.On the basis of your calculations in Table 1.1, what is the opportunity cost of producing at point V rather than point U?
A. 3 B-1 bombers.B. 1 B-1 bomber.C. 4 Stealth bombers.D. 3 Stealth bombers.
146.On the basis of your calculations in Table 1.1, what is gained by producing at point V rather than point U?
A. 3 B-1 bombers.B. 1 B-1 bomber.C. 4 Stealth bombers.D. 3 Stealth bombers.
33

Full file at http://testbanksinstant.eu/ Solution-Manual-for-The-Macro-Economy-Today---Schiller---11e147.In Table 1.1, the opportunity cost of increasing the production of B-1s from 1 to 2 i terms of Stealth
bombers is:
A. 1.B. 2.C. 0.33.D. 2.
148.Refer to Table 1.1. In the production range of 7 to 9 Stealths, the opportunity cost of producing 1 more Stealth bomber in terms of B-1s is:
A. 0.B. 3.C. 0.5.D. 2.
149.The highest opportunity cost anywhere in Table 1.1 for Stealth bombers in terms of B-1 bombers is:
A. 1 B-1 per Stealth bomber.B. 3 B-1s per Stealth bomber.C. 2 B-1s per Stealth bomber.D. 0.5 B-1 per Stealth bomber.
150.The lowest opportunity cost anywhere in Table 1.1 for Stealth bombers in terms of B-1 bombers is:
A. 0.1 B-1 per Stealth bomber.B. 0.5 B-1 per Stealth bomber.C. 2 B-1s per Stealth bomber.D. 0.33 B-1 per Stealth bomber.
151.The highest opportunity cost anywhere in Table 1.1 for B-1 bombers in terms of Stealth bombers is:
A. 1 Stealth per B-1 bomber.B. 3 Stealths per B-1 bomber.C. 2 Stealths per B-1 bomber.D. 0.5 Stealth per B-1 bomber.
34

Full file at http://testbanksinstant.eu/ Solution-Manual-for-The-Macro-Economy-Today---Schiller---11e152.The lowest opportunity cost anywhere in Table 1.1 for B-1 bombers in terms of Stealth bombers is:
A. 0 Stealth per B-1 bomber.B. 2 Stealths per B-1 bomber.C. 1 Stealths per B-1 bomber.D. 0.5 Stealth per B-1 bomber.
153.What is the relationship between the opportunity cost of Stealth bombers and the opportunity cost of B-1 bombers in Table 1.1?
A. They are reciprocals of each other.B. As one increases the other increases.C. Neither conform to the law of increasing opportunity cost.D. They are reciprocals of each other and neither conforms to the law of increasing opportunity cost.
Table 1.2 shows the hypothetical tradeoff between different combinations of Stealth bombers and B-1 bombers that might be produced in a year with the limited U.S. capacity, ceteris paribus. Complete the table by calculating the required opportunity costs for both the B-1 and Stealth bombers. Then answer the indicated questions.
Table 1.2Production possibilities for bombers
154.On the basis of your calculations in Table 1.2, the law of increasing opportunity costs applies to:
A. Both B-1 and Stealth bombers.B. B-1 bombers but not to Stealth bombers.C. Stealth bombers but not to B-1 bombers.D. Neither bomber.
35

Full file at http://testbanksinstant.eu/ Solution-Manual-for-The-Macro-Economy-Today---Schiller---11e155.On the basis of your calculations in Table 1.2, what is the opportunity cost of producing at point B rather
than point C?
A. 45 B-1 bombers.B. 35 Stealth bombers.C. 180 Stealth bombers.D. 10 B-1 bombers.
156.On the basis of your calculations in Table 1.2, what is gained by producing at point B rather than point C?
A. 45 B-1 bombers.B. 30 Stealth bombers.C. 180 Stealth bombers.D. 10 B-1 bombers.
157.On the basis of your calculations in Table 1.2, what is the opportunity cost of producing at point B rather than point A?
A. 15 Stealth bombers.B. 15 B-1 bombers.C. 195 Stealth bombers.D. 20 B-1 bombers.
158.On the basis of your calculations in Table 1.2, what is gained by producing at point B rather than point A?
A. 35 B-1 bombers.B. 195 Stealth bombers.C. 15 B-1 bombers.D. 15 Stealth bombers.
159.Refer to Table 1.2. In the production range of 20 to 35 B-1s, the opportunity cost of producing 1 more B-1 bomber in terms of Stealth bombers is:
A. 195/20.B. 35/20.C. 15.D. 1.
36

Full file at http://testbanksinstant.eu/ Solution-Manual-for-The-Macro-Economy-Today---Schiller---11e160.Refer to Table 1.2. In the production range of 180 to 195 Stealth bombers, the opportunity cost of
producing 1 more Stealth bomber in terms of B-1 bombers is:
A. 15.B. 1.C. 195/20.D. 195/180.
161.The highest opportunity cost anywhere in Table 1.2 for B-1 bombers in terms of Stealth bombers is:
A. 10 Stealths per B-1 bomber.B. .33 B-1 per Stealth bomber.C. .10 B-1 bomber per Stealth bomber.D. .10 Stealth per B-1 bomber.
162.The lowest opportunity cost anywhere in Table 1.2 for Stealth bombers in terms of B-1 bombers is:
A. 3 B-1s per Stealth bomber.B. .33 B-1 per Stealth bomber.C. 10 B-1s per Stealth bomber.D. .10 B-1 per Stealth bomber.
163.In Table 1.2, what is the relationship between the opportunity cost of Stealth bombers and the opportunity cost of B-1 bombers?
A. They are reciprocals of each other.B. As one increases the other increases.C. Neither conforms to the law of increasing opportunity cost.D. They are multiples of each other.
37

Full file at http://testbanksinstant.eu/ Solution-Manual-for-The-Macro-Economy-Today---Schiller---11eTable 1.3 shows the hypothetical tradeoff between different combinations of brushes and combs that might be produced in a year with the limited capacity for Country X, ceteris paribus. Complete the table by calculating the required opportunity costs for brushes and combs. Then answer the indicated questions.
Table 1.3Production possibilities for brushes and combs
164.On the basis of your calculations in Table 1.3, what is the opportunity cost of producing at point M rather than point N?
A. 23 combs.B. 21 combs.C. 1 brush.D. 2 combs.
165.On the basis of your calculations in Table 1.3, what is gained by producing at point M rather than point N?
A. 23 combs.B. 21 combs.C. 1 brush.D. 2 combs.
166.On the basis of your calculations in Table 1.3, what is the opportunity cost of producing at point L rather than point K?
A. 17 combs.B. 2 brushes.C. 1 brush.D. 7 combs.
38

Full file at http://testbanksinstant.eu/ Solution-Manual-for-The-Macro-Economy-Today---Schiller---11e167.On the basis of your calculations in Table 1.3, what is gained from producing at point L rather than point
K?
A. 17 combs.B. 10 combs.C. 1 brush.D. 7 combs.
168.On the basis of your calculations in Table 1.3, the law of increasing opportunity costs applies to:
A. Both brushes and combs.B. Combs but not brushes.C. Brushes but not combs.D. Neither brushes nor combs.
169.On the basis of your calculations in Table 1.3, in the production range of 2 to 3 brushes the opportunity cost of producing 1 more brush in terms of combs is:
A. 3. 33.B. 7. 0.C. 0. 67.D. 0. 14.
170.On the basis of your calculations in Table 1.3, in the production range of 21 to 23 combs the opportunity cost of producing more comb in terms of brushes is:
A. 1/21.B. 21/23.C. 1/2.D. 4.
39
Full file at http://testbanksinstant.eu/ Solution-Manual-for-The-Macro-Economy-Today---Schiller---11e171.On the basis of your calculations in Table 1.3, in the production range of 1 to 2 brushes the opportunity cost
of producing 1 more brush in terms of combs is:
A. 4.B. 1/2.C. 2/17.D. 1/7.
172.On the basis of your calculations in Table 1.3, the highest opportunity cost for combs in terms of brushes is:
A. 0.10 combs per brush.B. 23 combs per brush.C. 0.50 combs per brush.D. 0.29 combs per brush.
173.On the basis of your calculations in Table 1.3, the lowest opportunity cost for brushes in terms of combs is:
A. 10 brushes per comb.B. 2 brushes per comb.C. 0.33 brushes per comb.D. 8.5 brushes per comb.
174.One World View article is titled "Food Shortages Plague N. Korea." On a production-possibilities curve between private and public goods, a decrease in military spending in an effort to increase food production could be represented as:
A. A movement along the production-possibilities curve toward public goods.B. A movement along the production-possibilities curve toward private goods.C. A shift outward of the production-possibilities curve.D. A shift inward of the production-possibilities curve.
40
Full file at http://testbanksinstant.eu/ Solution-Manual-for-The-Macro-Economy-Today---Schiller---11e175.One World View article is titled "Food Shortages Plague N. Korea." If North Korea reduces the size of its
military and produces more food, this is most consistent with:
A. A movement along the economy's production-possibilities curve.B. Privatization.C. A laissez faire policy.D. The law of increasing opportunity costs.
176.One World View article states that China's leaders favor private ownership of property versus government ownership. This illustrates the success of:
A. Incentives from a centrally planned economy.B. The theme of Das Kapital.C. Laissez faire policy.D. All of the above.
177.One World View article states that NASA plans to spend $100 billion to establish a manned station on the moon, then continue on to Mars. This is an example of an activity that:
A. Will move the U.S.'s production possibilities curve inward.B. Has no opportunity cost.C. Will move the U.S. from one point on its production possibilities curve to another point.D. Has a negative opportunity cost.
Figure 1.8Relating grades and hours studied
41

Full file at http://testbanksinstant.eu/ Solution-Manual-for-The-Macro-Economy-Today---Schiller---11e178.In Figure 1.8, a grade-point average of 3. 0 is associated with how many hours of study time per week?
A. 5.B. 10.C. 15.D. 20.
179.The slope of the line between grade-point averages of 1.0 and 3.0 in Figure 1.8 is:
A. -2.0.B. 1/10.C. 1/5.D. 5.
180.Figure 1.8 suggests that the relationship between the variables is:
A. Negative after 30 hours of study.B. Everywhere linear.C. Linear at places and nonlinear at places.D. Linear at places and nonlinear at places but always negatively sloped.
181.Figure 1.8 suggests that:
A. The law of increasing opportunity cost does not apply.B. Resources can be perfectly adapted between study time and grade-point average.C. The relationship between study time and grade-point average is first linear, then nonlinear.D. The relationship between study time and grade-point average is constant.
182.Figure 1.8 suggests that if a student wants to achieve a grade-point average of 2.0, he or she should study:
A. An average of 5 hours per week.B. An average of 10 hours per week.C. An average of 15 hours per week.D. More than 15 hours per week because he or she is a C student.
42

Full file at http://testbanksinstant.eu/ Solution-Manual-for-The-Macro-Economy-Today---Schiller---11e183.In Figure 1.8, as you move from Point B closer to point C the slope:
A. Becomes negative.B. Remains constant.C. Decreases.D. Increases.
184.Refer to Figure 1.8. If the university decides to lower grading standards, then:
A. This curve will shift rightward.B. This curve will shift leftward.C. The curve will begin to bend downward at an earlier point.D. We will slide up the curve from point B to point C.
Figure 1.9
185.In Figure 1.9, as you move up the curve from Point J toward Point M, the slope:
A. Increases.B. Remains constant.C. Decreases.D. Becomes negative.
43
Full file at http://testbanksinstant.eu/ Solution-Manual-for-The-Macro-Economy-Today---Schiller---11e186.In Figure 1.9, the slope of the line between Points L and M is:
A. 1.20.B. 0.80.C. 0.75.D. 0.67.
187.In Figure 1.9, the slope of the line between Points K and L is:
A. 1.25.B. 0.80.C. 0.75.D. 0.60.
188.In Figure 1.9 the slope of the line is:
A. Greater at Point K than Point L.B. Equal to zero at all points.C. The same at Points J and K.D. Greater at Point M than Point L.
189.In Figure 1.9 the slope of the line is:
A. Between zero and 1 at all points and decreasing as you move from Point J toward Point M.B. Negative and increasing as you move from Point J toward Point M.C. Positive and decreasing as you move from Point J toward Point M.D. Positive and increasing as you move from Point J toward Point M.
190.The slope of a curve at any point is given by the formula, the:
A. Change in y coordinates between two points divided by the change in their x coordinates.B. Change in x coordinates between two points divided by the change in their y coordinates.C. Percentage change in y coordinates between two points divided by the percentage change in their x
coordinates.D. Percentage change in x coordinates between two points divided by the percentage change in their y
coordinates.
44

Full file at http://testbanksinstant.eu/ Solution-Manual-for-The-Macro-Economy-Today---Schiller---11e191.A linear curve that slopes downward from left to right has a:
A. Negative slope.B. Positive slope.C. Slope that changes as you move along the curve.D. Slope of zero.
192.A linear curve can be distinguished by:
A. The continuous change in its slope.B. The same slope throughout the curve.C. The changing relationship between the two variables.D. A shift in the curve.
193.A linear curve with a positive slope:
A. Is drawn downward from left to right.B. Implies that there is a negative relationship between the two variables.C. Implies that there is a positive relationship between the two variables.D. Is drawn as a horizontal line.
194.When the relationship between two variables changes:
A. There is movement from one point on the curve to another point on the curve.B. The curve becomes linear.C. The entire curve shifts.D. All of the above.
195.Goods are not scarce in the United States since people drive nice cars and have plenty to eat. True False
196.Scarcity results when available resources cannot satisfy all desired uses of those resources. True False
45

Full file at http://testbanksinstant.eu/ Solution-Manual-for-The-Macro-Economy-Today---Schiller---11e197.Critics of government regulation argue that government interference in the marketplace stifles the animal
spirits of entrepreneurship. True False
198.Opportunity cost is a theoretical concept with no practical application. True False
199.The economic choices we make today about the use of scarce resources will impact the economy in the future. True False
200.Every time we use scarce resources in one way, we give up the opportunity to use them in other ways. True False
201.Opportunity costs only occur if the choices we make damage the environment. True False
202.All output combinations that lie outside a production-possibilities curve are attainable with available resources and technology. True False
203.Output combinations that lie inside the production-possibilities curve are characterized by efficient use of resources. True False
204.Efficiency in production means getting the most output possible from the available resources. True False
205.All of the choices on the production possibilities curve are equally desirable. True False
206.If the economy is inside the production-possibilities curve, then more output can be produced using existing resources. True False
46

Full file at http://testbanksinstant.eu/ Solution-Manual-for-The-Macro-Economy-Today---Schiller---11e207.Technological advance shifts the production-possibilities curve inward.
True False
208.For a market economy, the decision about what to produce is made by the government. True False
209.All economies must make decisions concerning what to produce, how to produce it, and for whom to produce. True False
210.Adam Smith observed how government directives can lead to the best allocation of resources. True False
211.Price signals direct the answers to the WHAT, HOW, and FOR WHOM questions in a laissez-faire economy. True False
212.The essential feature of the market mechanism is the price signal. True False
213.In the U.S. market system, the government gives the signals for deciding how to use the majority of the resources. True False
214.In a market economy, if a factory pollutes the air, the situation is referred to as government failure. True False
215.Government failure occurs when government intervention fails to improve economic outcomes. True False
216.Economists formulate an economy's objectives. True False
47
Full file at http://testbanksinstant.eu/ Solution-Manual-for-The-Macro-Economy-Today---Schiller---11e217.Macroeconomics addresses the economy as a whole.
True False
218.Microeconomics is concerned with individual performance as well as the economy as a whole. True False
219.The Latin phrase ceteris paribus refers to holding other variables constant. True False
220.To calculate the slope of a line, find the vertical distance between two points and divide it by the horizontal distance between the same two points. True False
221.The slope of a production-possibilities curve is positive. True False
222.When a curve shifts, the underlying relationship between the two variables shown on the graph has changed. True False
223.Explain why an economist would say "There is no such thing as a free lunch."
48

Full file at http://testbanksinstant.eu/ Solution-Manual-for-The-Macro-Economy-Today---Schiller---11e224.Describe the shape of the typical production-possibilities curve and explain why it has this shape.
225.Why do opportunity costs increase as society produces more of a good?
226.Explain the concept of inefficiency in terms of a production possibilities curve.
227.Explain the difference between macroeconomics and microeconomics. Give examples of each.
49

Full file at http://testbanksinstant.eu/ Solution-Manual-for-The-Macro-Economy-Today---Schiller---11e228.How does the market mechanism answer the WHAT, HOW, and FOR WHOM questions?
50
Full file at http://testbanksinstant.eu/ Solution-Manual-for-The-Macro-Economy-Today---Schiller---11e
01 Key 1.(p. 1)
Which of the following is not one of the three core economic issues that must be resolved?
A. How to produce the goods and services we select.B. What to produce with unlimited resources.C. Who should get the goods and services we produce.D. What to produce with limited resources.
AACSB: ReflectiveBT: ComprehensionLearning Objective: 1-2Schiller - Chapter 01 #1
2.(p. 2)
"The economy" refers to the sum of all our:
A. Production activities.B. Production, consumption and leisure activities.C. Production and consumption activities.D. Consumption and leisure activities.
AACSB: AnalyticBT: KnowledgeLearning Objective: 1-3Schiller - Chapter 01 #2Topic: THE ECONOMY IS US
3.(p. 4)
Because resources are scarce society must make decisions about all of the following except:
A. What to produce.B. Whether scarcity exists or not.C. How to produce the selected goods and services.D. For whom the goods and services are produced.
AACSB: ReflectiveBT: ComprehensionLearning Objective: 1-1Schiller - Chapter 01 #3Topic: SCARCITY: THE CORE PROBLEM
51

Full file at http://testbanksinstant.eu/ Solution-Manual-for-The-Macro-Economy-Today---Schiller---11e4.(p. 4)
Because resources are scarce, how many key issues must society resolve?
A. Multiple.B. Two.C. Four.D. Three.
AACSB: ReflectiveBT: ComprehensionLearning Objective: 1-1Schiller - Chapter 01 #4Topic: SCARCITY: THE CORE PROBLEM
5.(p. 4)
The fundamental problem of economics is:
A. The law of increasing opportunity costs.B. The scarcity of resources relative to human wants.C. How to get government to operate efficiently.D. How to create employment for everyone.
AACSB: AnalyticBT: KnowledgeLearning Objective: 1-1Schiller - Chapter 01 #5Topic: SCARCITY: THE CORE PROBLEM
6.(p. 4)
In economics, scarcity means that:
A. A shortage of a particular good will cause the price to fall.B. A production-possibilities curve cannot accurately represent the tradeoff between two goods.C. Society's desires exceed the want-satisfying capability of the resources available to satisfy those
desires.D. The market mechanism has failed.
AACSB: AnalyticBT: KnowledgeLearning Objective: 1-1Schiller - Chapter 01 #6Topic: SCARCITY: THE CORE PROBLEM
52

Full file at http://testbanksinstant.eu/ Solution-Manual-for-The-Macro-Economy-Today---Schiller---11e7.(p. 4)
To an economist, scarcity means that:
A. Shortages will always exist.B. The market mechanism cannot be relied upon.C. A production-possibilities curve cannot accurately represent the tradeoff between two goods.D. There are not enough resources available to satisfy all our desires.
AACSB: AnalyticBT: KnowledgeLearning Objective: 1-1Schiller - Chapter 01 #7Topic: SCARCITY: THE CORE PROBLEM
8.(p. 4)
Given that resources are scarce:
A. A "free lunch" is possible but only for a limited number of people.B. Opportunity costs are experienced whenever choices are made.C. Poor countries must make choices but rich countries with abundant resources do not have to make
choices.D. Some choices involve opportunity costs while other choices do not.
AACSB: ReflectiveBT: ComprehensionLearning Objective: 1-1Schiller - Chapter 01 #8Topic: SCARCITY: THE CORE PROBLEM
9.(p. 4)
The best description of the origin of the economic problem of scarcity is that humans have:
A. Limited wants for goods and services and resources are also limited.B. Limited wants for goods and services and resources are unlimited.C. Unlimited wants for goods and services but resources are limited.D. Unlimited wants for goods and services and resources are also unlimited.
AACSB: ReflectiveBT: ComprehensionLearning Objective: 1-1Schiller - Chapter 01 #9Topic: SCARCITY: THE CORE PROBLEM
53
Full file at http://testbanksinstant.eu/ Solution-Manual-for-The-Macro-Economy-Today---Schiller---11e10.(p. 4)
A consequence of the economic problem of scarcity is that:
A. Choices have to be made about how resources are used.B. There is never too much of any good or service produced.C. The production of goods and services must be controlled by the government.D. The production-possibilities curve is bowed outward.
AACSB: ReflectiveBT: ComprehensionLearning Objective: 1-1Schiller - Chapter 01 #10Topic: SCARCITY: THE CORE PROBLEM
11.(p. 4)
The basic factors of production include:
A. Land, labor, money, and capital.B. Land, labor, money, and inputs.C. Labor and capital.D. Land, labor, capital, and entrepreneurship.
AACSB: ReflectiveBT: ComprehensionLearning Objective: 1-1Schiller - Chapter 01 #11Topic: SCARCITY: THE CORE PROBLEM
12.(p. 4)
Factors of production are:
A. Scarce in every society.B. Scarce only in United States.C. Scarce only in the poorest countries of the world.D. Unlimited in quantity.
AACSB: ReflectiveBT: ComprehensionLearning Objective: 1-1Schiller - Chapter 01 #12Topic: SCARCITY: THE CORE PROBLEM
54

Full file at http://testbanksinstant.eu/ Solution-Manual-for-The-Macro-Economy-Today---Schiller---11e13.(p. 4)
Which of the following is not a factor of production?
A. A psychiatrist.B. The $100,000 used to start a new business.C. A bulldozer.D. Six thousand acres of farmland.
AACSB: ReflectiveBT: ComprehensionLearning Objective: 1-1Schiller - Chapter 01 #13Topic: SCARCITY: THE CORE PROBLEM
14.(p. 4)
With respect to factors of production, which of the following statements is not true?
A. Factors of production are also known as resources.B. In order to produce anything, it is necessary to have factors of production.C. Factors of production include land, labor, capital, and entrepreneurship.D. Only those resources that are privately owned are counted as factors of production.
AACSB: ReflectiveBT: ComprehensionLearning Objective: 1-1Schiller - Chapter 01 #14Topic: SCARCITY: THE CORE PROBLEM
15.(p. 4)
Which of the following is the best example of land?
A. The ethanol refined from corn.B. A factory that produces new goods and services.C. The river water used to float a riverboat casino.D. A barber's chair.
AACSB: ReflectiveBT: ComprehensionLearning Objective: 1-1Schiller - Chapter 01 #15Topic: SCARCITY: THE CORE PROBLEM
55

Full file at http://testbanksinstant.eu/ Solution-Manual-for-The-Macro-Economy-Today---Schiller---11e16.(p. 4)
Capital, as economists use the term, refers to:
A. The money needed to start a new business.B. The costs of operating a business.C. Shares of stock issued by businesses.D. Final goods that are used to produce other goods and services.
AACSB: AnalyticBT: KnowledgeLearning Objective: 1-1Schiller - Chapter 01 #16Topic: SCARCITY: THE CORE PROBLEM
17.(p. 4)
Which of the following is the best example of capital and no other factor of production?
A. Clean air.B. Money in a savings account.C. A computer used by an insurance agent to service her customers.D. The property on which a landfill has been established.
AACSB: ReflectiveBT: ComprehensionLearning Objective: 1-1Schiller - Chapter 01 #17Topic: SCARCITY: THE CORE PROBLEM
18.(p. 5)
Which economist argued that free markets unleashed the "animal spirits" of entrepreneurs, propelling innovation, technology and growth?
A. Lord Kelvin.B. Kenneth Olsen.C. Irving Fisher.D. Joseph Schumpeter.
AACSB: ReflectiveBT: ComprehensionLearning Objective: 1-1Schiller - Chapter 01 #18Topic: SCARCITY: THE CORE PROBLEM
56

Full file at http://testbanksinstant.eu/ Solution-Manual-for-The-Macro-Economy-Today---Schiller---11e19.(p. 5)
When free markets unleash the "animal spirits" of entrepreneurs, we can expect to see:
A. A reliance on traditional techniques.B. Economic growth.C. A concentration of wealth.D. Economic decline.
AACSB: ReflectiveBT: ComprehensionLearning Objective: 1-1Schiller - Chapter 01 #19Topic: SCARCITY: THE CORE PROBLEM
20.(p. 5)
The role of the entrepreneur in an economy is to:
A. Bring the factors of production together and assume the risk of production.B. Work with government planners to determine what goods are produced.C. Arrange bank financing for the owners of new businesses.D. Ensure full employment of labor.
AACSB: ReflectiveBT: ComprehensionLearning Objective: 1-1Schiller - Chapter 01 #20Topic: SCARCITY: THE CORE PROBLEM
21.(p. 5)
Economics is the study of how:
A. Best to use society's scarce resources.B. Society spends the income of individuals.C. Society purchases resources, given its macroeconomic goals.D. Individual market participants decide what to produce given fixed resource constraints.
AACSB: AnalyticBT: KnowledgeLearning Objective: 1-1Schiller - Chapter 01 #21Topic: SCARCITY: THE CORE PROBLEM
57
Full file at http://testbanksinstant.eu/ Solution-Manual-for-The-Macro-Economy-Today---Schiller---11e22.(p. 5)
Economics can be defined as the study of:
A. For whom resources are allocated to increase efficiency.B. How society spends the income of individuals.C. How scarce resources are allocated to fulfill society's goals.D. What scarce resources are used to produce goods and services.
AACSB: AnalyticBT: KnowledgeLearning Objective: 1-1Schiller - Chapter 01 #22Topic: SCARCITY: THE CORE PROBLEM
23.(p. 5)
Opportunity cost is:
A. Only measured in dollars and cents.B. The dollar cost to society of producing the goods.C. The difficulty associated with using one good in place of another.D. The alternative that must be given up in order to get something else.
AACSB: AnalyticBT: KnowledgeLearning Objective: 1-1Schiller - Chapter 01 #23Topic: SCARCITY: THE CORE PROBLEM
24.(p. 5)
Every time we use scarce resources in one way:
A. We always use them in the best way possible.B. We forgo the opportunity to use them in other ways.C. A free lunch is created.D. This use implies that no other uses were possible.
AACSB: ReflectiveBT: ComprehensionLearning Objective: 1-1Schiller - Chapter 01 #24Topic: SCARCITY: THE CORE PROBLEM
58

Full file at http://testbanksinstant.eu/ Solution-Manual-for-The-Macro-Economy-Today---Schiller---11e25.(p. 5)
Opportunity cost may be defined as the:
A. Goods or services that are forgone in order to obtain something else.B. Dollar prices paid for final goods and services.C. Dollar cost of producing a particular product.D. Difference between wholesale and retail prices.
AACSB: AnalyticBT: KnowledgeLearning Objective: 1-1Schiller - Chapter 01 #25Topic: SCARCITY: THE CORE PROBLEM
26.(p. 5)
The opportunity cost of studying for an economics test is:
A. Negative, since it may improve your grade.B. Zero, because you knew when you registered for the class that studying would be required.C. The money you spent on tuition for the class.D. The best alternative use of your time.
AACSB: ReflectiveBT: ComprehensionLearning Objective: 1-1Schiller - Chapter 01 #26Topic: SCARCITY: THE CORE PROBLEM
27.(p. 5)
The concept of opportunity cost would become irrelevant if:
A. The market mechanism functioned to allocate resources fairly.B. The government allocated resources.C. The production-possibilities curve bowed outward.D. Resources were no longer scarce.
AACSB: ReflectiveBT: ComprehensionLearning Objective: 1-1Schiller - Chapter 01 #27Topic: SCARCITY: THE CORE PROBLEM
59
Full file at http://testbanksinstant.eu/ Solution-Manual-for-The-Macro-Economy-Today---Schiller---11e28.(p. 6)
The "guns versus butter" dilemma that all nations confront is that:
A. Guns and butter cannot be produced using the same resources.B. An increase in national defense implies still more sacrifices of civilian goods and services.C. An increase in national defense is only possible if we produce less butter.D. Butter is scarce, while guns are not.
AACSB: ReflectiveBT: ComprehensionLearning Objective: 1-1Schiller - Chapter 01 #28Topic: SCARCITY: THE CORE PROBLEM
29.(p. 6)
A production-possibilities curve indicates the:
A. Combinations of goods and services an economy is actually producing.B. Maximum combinations of goods and services an economy can produce given its available resources
and technology.C. Maximum combinations of goods and services an economy can produce given unlimited resources.D. Average combinations of goods and services an economy can produce given its available resources
and technology. AACSB: AnalyticBT: KnowledgeLearning Objective: 1-1Schiller - Chapter 01 #29Topic: PRODUCTION POSSIBILITIES
30.(p. 6)
The alternative combinations of goods and services that can be produced in a given time period with all available resources and technology is referred to as:
A. Opportunity cost.B. Factors of production.C. Production possibilities.D. Capital.
AACSB: AnalyticBT: KnowledgeLearning Objective: 1-1Schiller - Chapter 01 #30Topic: PRODUCTION POSSIBILITIES
60
Full file at http://testbanksinstant.eu/ Solution-Manual-for-The-Macro-Economy-Today---Schiller---11e31.(p. 6)
Which of the following is an assumption under which the production-possibilities curve is drawn?
A. There is significant unemployment.B. The supply of resources is fixed.C. The price level is changing.D. Technology is changing.
AACSB: ReflectiveBT: ComprehensionLearning Objective: 1-1Schiller - Chapter 01 #31Topic: PRODUCTION POSSIBILITIES
32.(p. 7)
Which of the following is an assumption under which the production-possibilities curve is drawn?
A. All goods sell for the same price.B. The supply of resources is growing.C. Resources are equally well suited for production of all outputs.D. Technology is fixed.
AACSB: ReflectiveBT: ComprehensionLearning Objective: 1-1Schiller - Chapter 01 #32Topic: PRODUCTION POSSIBILITIES
33.(p. 7)
Production-possibilities curves demonstrate that:
A. Producing more of one good implies a reduction in the potential production of another good.B. It is always possible to produce more of one good.C. It is always possible to produce more of one good without producing less of another.D. It is never possible to produce zero output.
AACSB: ReflectiveBT: ComprehensionLearning Objective: 1-1Schiller - Chapter 01 #33Topic: PRODUCTION POSSIBILITIES
61

Full file at http://testbanksinstant.eu/ Solution-Manual-for-The-Macro-Economy-Today---Schiller---11e34.(p. 7)
A point on a nation's production-possibilities curve represents:
A. An undesirable combination of goods and services.B. Combinations of production that are unattainable, given current technology and resources.C. Levels of production that will cause both unemployment and inflation.D. The full employment of resources to achieve a particular combination of goods and services.
AACSB: ReflectiveBT: ComprehensionLearning Objective: 1-1Schiller - Chapter 01 #34Topic: PRODUCTION POSSIBILITIES
35.(p. 7)
Which of the following correctly characterizes the shape of a production-possibilities curve?
A. A straight line indicating the law of increasing opportunity costs applies.B. A straight line when there are constant opportunity costs.C. A line that curves outward when resources are perfectly adaptable in the production of different
goods.D. A line that curves inward when resources are perfectly adaptable in the production of different
goods. AACSB: ReflectiveBT: ComprehensionLearning Objective: 1-1Schiller - Chapter 01 #35Topic: PRODUCTION POSSIBILITIES
36.(p. 7)
If an economy is producing on its production-possibilities curve, then producing:
A. More of one good implies producing more of another good.B. More of one good implies producing less of another good.C. Less of one good implies producing less of another good.D. More of one good implies shifting the curve toward the origin.
AACSB: ReflectiveBT: ComprehensionLearning Objective: 1-1Schiller - Chapter 01 #36Topic: PRODUCTION POSSIBILITIES
62

Full file at http://testbanksinstant.eu/ Solution-Manual-for-The-Macro-Economy-Today---Schiller---11e37.(p. 7)
The production-possibilities curve illustrates:
A. The limitations that exist because of scarce resources.B. That there is no limit to what an economy can produce.C. That there is no limit to the level of output.D. The existence of unlimited wants and resources.
AACSB: AnalyticBT: KnowledgeLearning Objective: 1-1Schiller - Chapter 01 #37Topic: PRODUCTION POSSIBILITIES
38.(p. 7)
The production-possibilities curve illustrates that:
A. Society can always produce more of all goods simultaneously.B. Constant opportunity costs always exist.C. There are no opportunity costs in a wealthy economy.D. If society is efficient, it can produce more of one good only if it reduces output of another good.
AACSB: AnalyticBT: KnowledgeLearning Objective: 1-1Schiller - Chapter 01 #38Topic: PRODUCTION POSSIBILITIES
39.(p. 8)
According to the law of increasing opportunity costs:
A. The more one is willing to pay for resources, the larger will be the possible level of production.B. Increasing the production of a particular good will cause the price of the good to rise.C. In order to produce additional units of a particular good, it is necessary for society to sacrifice
increasingly larger amounts of alternative goods.D. Only by keeping production constant can rising prices be avoided.
AACSB: ReflectiveBT: ComprehensionLearning Objective: 1-1Schiller - Chapter 01 #39Topic: PRODUCTION POSSIBILITIES
63

Full file at http://testbanksinstant.eu/ Solution-Manual-for-The-Macro-Economy-Today---Schiller---11e40.(p. 8)
The law of increasing opportunity costs explains:
A. How everything becomes more expensive as the economy grows.B. The shape of the production-possibilities curve.C. Inflation.D. The position of the production-possibilities curve.
AACSB: ReflectiveBT: ComprehensionLearning Objective: 1-1Schiller - Chapter 01 #40Topic: PRODUCTION POSSIBILITIES
41.(p. 8)
According to the law of increasing opportunity costs:
A. Greater production leads to greater inefficiency.B. Greater production means factor prices rise.C. Greater production of one good requires increasingly larger sacrifices of other goods.D. Higher opportunity costs induce higher output per unit of input.
AACSB: ReflectiveBT: ComprehensionLearning Objective: 1-1Schiller - Chapter 01 #41Topic: PRODUCTION POSSIBILITIES
42.(p. 8)
If an economy experiences increasing opportunity costs with respect to two goods, then the production-possibilities curve between the two goods will be:
A. Bowed outward.B. A straight, downward-sloping line.C. Bowed inward.D. Bowed outward until the two goods are equal, and then bowed inward.
AACSB: ReflectiveBT: ComprehensionLearning Objective: 1-1Schiller - Chapter 01 #42Topic: PRODUCTION POSSIBILITIES
64

Full file at http://testbanksinstant.eu/ Solution-Manual-for-The-Macro-Economy-Today---Schiller---11e43.(p. 8)
The production-possibilities curve bows outward because:
A. Resources are used inefficiently as more of a good is produced.B. In order to get more of a particular good, increasing quantities of other goods must be given up.C. Resources move easily from the production of one good to the production of another.D. Resources are scarce and choices must be made.
AACSB: ReflectiveBT: ComprehensionLearning Objective: 1-1Schiller - Chapter 01 #43Topic: PRODUCTION POSSIBILITIES
44.(p. 8)
If the United States decides to convert automobile factories to tank production, as it did during World War II, but finds that some auto manufacturing facilities are not well suited to tank production, then:
A. The production-possibilities curve between tanks and automobiles will appear as a straight line.B. The production-possibilities curve between tanks and automobiles will shift outward.C. Decreasing opportunity costs will occur with greater automobile production.D. Increasing opportunity costs will occur with greater tank production.
AACSB: ReflectiveBT: ComprehensionLearning Objective: 1-1Schiller - Chapter 01 #44Topic: PRODUCTION POSSIBILITIES
45.(p. 8)
If Korea increases the size of its military, then, as long as nothing else changes, its:
A. Production-possibilities curve will shift outward.B. Production-possibilities curve will shift inward.C. Production of non-military goods will increase.D. Production of non-military goods will decrease.
AACSB: ReflectiveBT: ComprehensionLearning Objective: 1-1Schiller - Chapter 01 #45Topic: PRODUCTION POSSIBILITIES
65
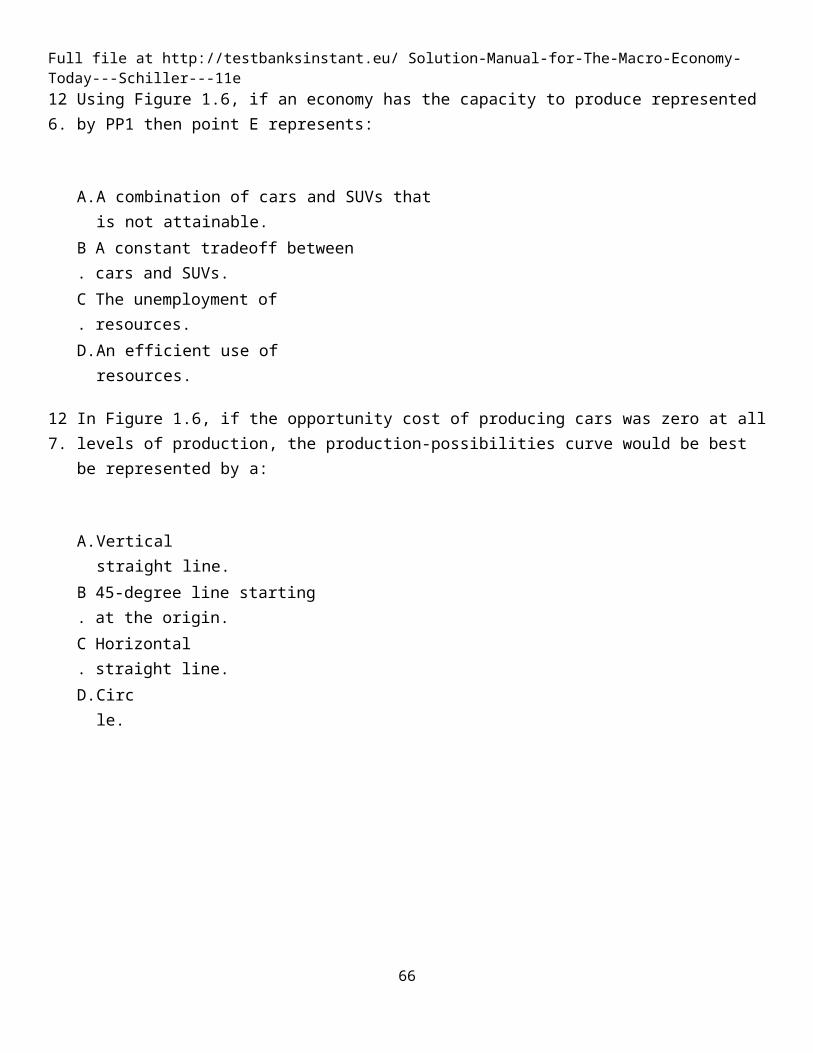
Full file at http://testbanksinstant.eu/ Solution-Manual-for-The-Macro-Economy-Today---Schiller---11e46.(p. 8)
If China decreases the size of its military, then, as long as nothing else changes, its:
A. Production-possibilities curve will shift outward.B. Production-possibilities curve will shift inward.C. Production of non-military goods will increase.D. Production of non-military goods will decrease.
AACSB: ReflectiveBT: ComprehensionLearning Objective: 1-1Schiller - Chapter 01 #46Topic: PRODUCTION POSSIBILITIES
47.(p. 9)
Korea's inability to feed itself is partly due to the fact that:
A. Resources used for the military aren't available for food production.B. It does not own resources that are useful for food production.C. Other nations hesitate to trade with Korea.D. Korea operates significantly below its production-possibilities curve.
AACSB: ReflectiveBT: ComprehensionLearning Objective: 1-1Schiller - Chapter 01 #47Topic: PRODUCTION POSSIBILITIES
48.(p. 10)
Efficiency can be defined as the:
A. Maximum resources used in producing a given output level.B. Maximum output of a good produced from the available resources.C. Minimum output of a good produced from the available resources.D. Maximum output of a good produced if all resources are devoted to its production.
AACSB: AnalyticBT: KnowledgeLearning Objective: 1-1Schiller - Chapter 01 #48Topic: PRODUCTION POSSIBILITIES
66

Full file at http://testbanksinstant.eu/ Solution-Manual-for-The-Macro-Economy-Today---Schiller---11e49.(p. 10)
When an economy is producing efficiently it is:
A. Producing a combination of goods and services beyond the production-possibilities curve.B. Getting the most goods and services from the available resources.C. Experiencing decreasing opportunity costs.D. Producing equal amounts of all goods.
AACSB: ReflectiveBT: ComprehensionLearning Objective: 1-1Schiller - Chapter 01 #49Topic: PRODUCTION POSSIBILITIES
50.(p. 10)
Which of the following is true when an economy is producing efficiently?
A. The economy is producing on the production-possibilities curve.B. Goods and services are being produced using the most resources.C. The economy is getting the fewest goods and services from the available resources.D. Everyone in the economy is happy.
AACSB: ReflectiveBT: ComprehensionLearning Objective: 1-1Schiller - Chapter 01 #50Topic: PRODUCTION POSSIBILITIES
51.(p. 10)
Every point on the production-possibilities curve is considered to be:
A. Efficient.B. An optimal level of output.C. Equally desirable.D. Undesirable.
AACSB: ReflectiveBT: ComprehensionLearning Objective: 1-1Schiller - Chapter 01 #51Topic: PRODUCTION POSSIBILITIES
67
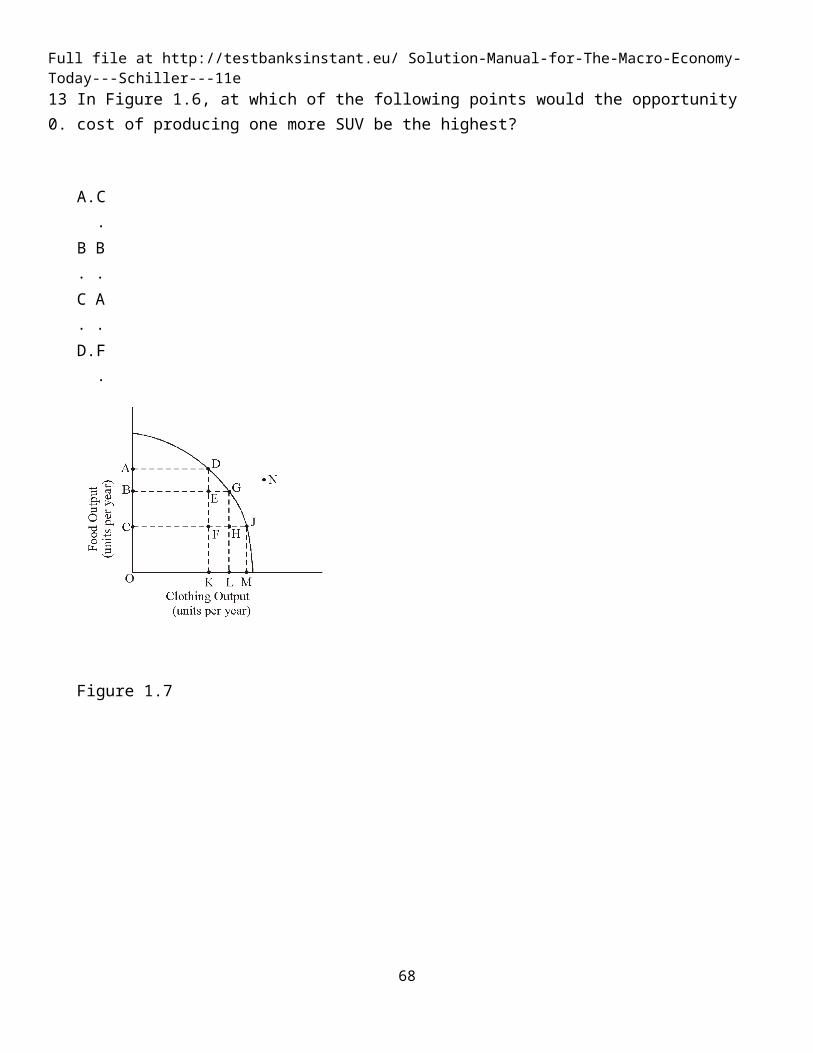
Full file at http://testbanksinstant.eu/ Solution-Manual-for-The-Macro-Economy-Today---Schiller---11e52.(p. 10)
The points on a production-possibilities curve show:
A. Desired output.B. Actual output.C. Potential output.D. All of the above.
AACSB: ReflectiveBT: ComprehensionLearning Objective: 1-1Schiller - Chapter 01 #52Topic: PRODUCTION POSSIBILITIES
53.(p. 10)
In terms of the production-possibilities curve, inefficiency is represented by:
A. All points on the curve.B. All points outside the curve.C. All points inside the curve.D. A rightward shift of the curve.
AACSB: ReflectiveBT: ComprehensionLearning Objective: 1-1Schiller - Chapter 01 #53Topic: PRODUCTION POSSIBILITIES
54.(p. 10)
If an economy is producing inside the production-possibilities curve, then:
A. It does not have enough resources to be efficient.B. It must give up some of one good to produce more of another good.C. The curve needs to shift inward.D. It is using its resources inefficiently.
AACSB: ReflectiveBT: ComprehensionLearning Objective: 1-1Schiller - Chapter 01 #54Topic: PRODUCTION POSSIBILITIES
68

Full file at http://testbanksinstant.eu/ Solution-Manual-for-The-Macro-Economy-Today---Schiller---11e55.(p. 10)
If an economy is producing inside the production-possibilities curve, then:
A. There is full employment of resources.B. It is operating efficiently.C. It can produce more of one good without giving up some of another good.D. There are not enough resources available to produce more output.
AACSB: ReflectiveBT: ComprehensionLearning Objective: 1-1Schiller - Chapter 01 #55Topic: PRODUCTION POSSIBILITIES
56.(p. 11)
When technological change allows a smaller amount of a resource to be used in producing two goods shown on a production-possibilities curve, there will be:
A. A movement along the production-possibilities curve.B. An inward shift of the production-possibilities curve.C. An outward shift of the production-possibilities curve.D. No change in the production-possibilities curve.
AACSB: ReflectiveBT: ComprehensionLearning Objective: 1-1Schiller - Chapter 01 #56Topic: PRODUCTION POSSIBILITIES
57.(p. 11)
A technological advance would best be represented by:
A. A shift outward of the production-possibilities curve.B. A shift inward of the production-possibilities curve.C. A movement from inside the production-possibilities curve to a point on the production-possibilities
curve.D. A movement from the production-possibilities curve to a point inside the production-possibilities
curve. AACSB: ReflectiveBT: ComprehensionLearning Objective: 1-1Schiller - Chapter 01 #57Topic: PRODUCTION POSSIBILITIES
69

Full file at http://testbanksinstant.eu/ Solution-Manual-for-The-Macro-Economy-Today---Schiller---11e58.(p. 11)
Which of the following events would allow the production-possibilities curve to shift outward?
A. The economy's capital stock declines.B. More teenagers enter the labor force.C. Technology is lost.D. People begin to retire at earlier ages.
AACSB: ReflectiveBT: ComprehensionLearning Objective: 1-1Schiller - Chapter 01 #58Topic: PRODUCTION POSSIBILITIES
59.(p. 11)
Which of the following events would allow the production-possibilities curve to shift outward?
A. More people retire before the traditional retirement age of 65.B. People take less vacation time.C. Hail storms and tornadoes strike a number of states.D. People decide that they prefer more food and less of other goods.
AACSB: ReflectiveBT: ComprehensionLearning Objective: 1-1Schiller - Chapter 01 #59Topic: PRODUCTION POSSIBILITIES
60.(p. 11)
The production-possibilities curve shifts outward in response to:
A. Better technology or fewer resources or both.B. Better technology or more resources or both.C. Declining technology or fewer resources or both.D. Declining technology or more resources or both.
AACSB: ReflectiveBT: ComprehensionLearning Objective: 1-1Schiller - Chapter 01 #60Topic: PRODUCTION POSSIBILITIES
70

Full file at http://testbanksinstant.eu/ Solution-Manual-for-The-Macro-Economy-Today---Schiller---11e61.(p. 11)
Economic growth would best be represented by a:
A. Shift outward of the production-possibilities curve.B. Shift inward of the production-possibilities curve.C. Movement from inside the production-possibilities curve to a point on the production-possibilities
curve.D. Movement from the production-possibilities curve to a point inside the production-possibilities
curve. AACSB: ReflectiveBT: ComprehensionLearning Objective: 1-1Schiller - Chapter 01 #61Topic: PRODUCTION POSSIBILITIES
62.(p. 11)
Which of the following events would cause the production-possibilities curve to shift outward?
A. A labor strike.B. The full employment of resources.C. Increased efficiency in the use of resources.D. A decrease in available resources.
AACSB: ReflectiveBT: ComprehensionLearning Objective: 1-1Schiller - Chapter 01 #62Topic: PRODUCTION POSSIBILITIES
63.(p. 11)
Which of the following events would cause the production-possibilities curve to shift inward?
A. A decrease in the supply of labor.B. An increase in the number of factories.C. A technological breakthrough occurs that makes production of all goods more efficient.D. An increase in the unemployment rate.
AACSB: ReflectiveBT: ComprehensionLearning Objective: 1-1Schiller - Chapter 01 #63Topic: PRODUCTION POSSIBILITIES
71

Full file at http://testbanksinstant.eu/ Solution-Manual-for-The-Macro-Economy-Today---Schiller---11e64.(p. 11)
Which of the following will cause the production-possibilities curve to shift inward?
A. An increase in population.B. A decrease in the size of the labor force.C. A technological advance.D. An increase in knowledge.
AACSB: ReflectiveBT: ComprehensionLearning Objective: 1-1Schiller - Chapter 01 #64Topic: PRODUCTION POSSIBILITIES
65.(p. 11)
A decrease in available resources would cause:
A. An economy to move inside its production-possibilities curve.B. The production-possibilities curve to shift inward.C. Opportunity costs to increase.D. The unemployment of resources.
AACSB: ReflectiveBT: ComprehensionLearning Objective: 1-1Schiller - Chapter 01 #65Topic: PRODUCTION POSSIBILITIES
66.(p. 11)
The availability of fewer resources can be represented by:
A. An inward shift of the production-possibilities curve.B. No change in the production-possibilities curve.C. A movement along the production-possibilities curve.D. An outward shift of the production-possibilities curve.
AACSB: ReflectiveBT: ComprehensionLearning Objective: 1-1Schiller - Chapter 01 #66Topic: PRODUCTION POSSIBILITIES
72
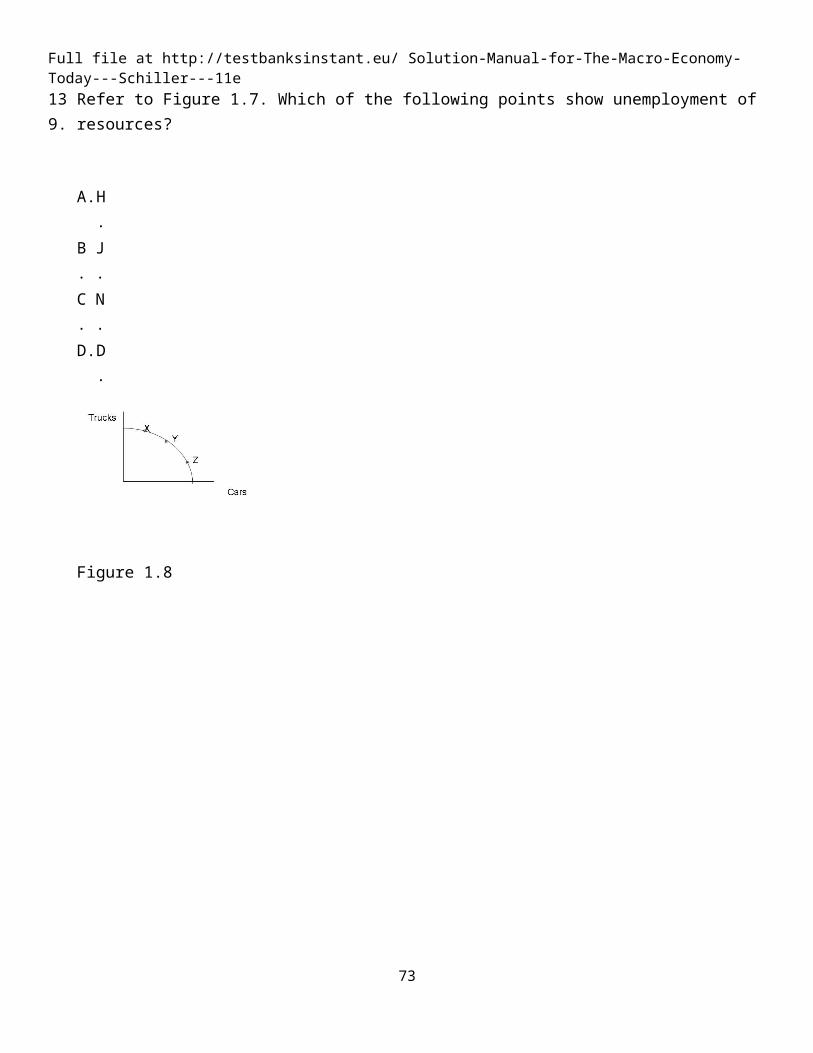
Full file at http://testbanksinstant.eu/ Solution-Manual-for-The-Macro-Economy-Today---Schiller---11e67.(p. 12)
Which of the following is not a basic decision that all nations must confront?
A. Should we have economic growth?B. How should we produce goods and services?C. For whom should goods and services be produced?D. What goods and services should we produce?
AACSB: ReflectiveBT: ComprehensionLearning Objective: 1-1Schiller - Chapter 01 #67Topic: BASIC DECISIONS
68.(p. 12)
In a market economy, the question of WHAT to produce is answered by:
A. Direct negotiations between consumers and producers.B. Producer profits and sales.C. Government directives.D. A democratic vote of all producers.
AACSB: ReflectiveBT: ComprehensionLearning Objective: 1-1Schiller - Chapter 01 #68Topic: BASIC DECISIONS
69.(p. 12)
In a market economy, the question of HOW to produce is determined by:
A. Government planners.B. The production possibilities curve.C. The least-cost method of production.D. The method of production which uses the least amount of labor.
AACSB: ReflectiveBT: ComprehensionLearning Objective: 1-1Schiller - Chapter 01 #69Topic: BASIC DECISIONS
73

Full file at http://testbanksinstant.eu/ Solution-Manual-for-The-Macro-Economy-Today---Schiller---11e70.(p. 12)
In a market economy, the people who receive the goods and services that are produced are those who:
A. Need the goods and services the most.B. Have the most political power.C. Want the goods and services the most.D. Are willing to pay the highest price.
AACSB: ReflectiveBT: ComprehensionLearning Objective: 1-1Schiller - Chapter 01 #70Topic: BASIC DECISIONS
71.(p. 12)
The market mechanism may best be defined as:
A. The use of market prices and sales to signal desired output.B. The use of market signals and government directives to select economic outcomes.C. The process by which the production-possibilities curve shifts inward.D. Price regulation by government.
AACSB: AnalyticBT: KnowledgeLearning Objective: 1-3Schiller - Chapter 01 #71Topic: THE MECHANISMS OF CHOICE
72.(p. 12)
The market mechanism:
A. Allows buyers to communicate with producers indirectly.B. Is directed by the government in order to promote efficiency.C. Results in the misallocation of resources because producers seek to maximize profits.D. Allocates goods in an equitable manner.
AACSB: ReflectiveBT: ComprehensionLearning Objective: 1-3Schiller - Chapter 01 #72Topic: THE MECHANISMS OF CHOICE
74
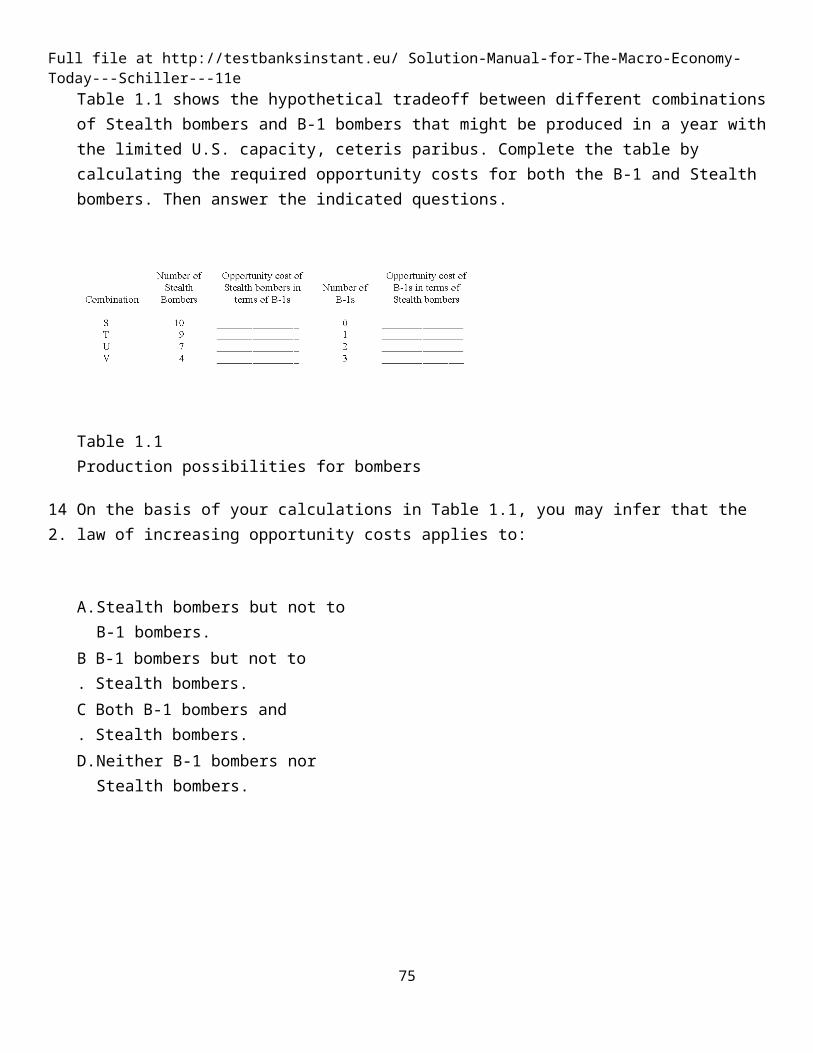
Full file at http://testbanksinstant.eu/ Solution-Manual-for-The-Macro-Economy-Today---Schiller---11e73.(p. 12)
The market mechanism:
A. Is not a very efficient means of communicating consumer demand to the producers of goods and services.
B. Works through central planning by government.C. Eliminates market failures created by government.D. Works because prices serve as a means of communication between consumers and producers.
AACSB: ReflectiveBT: ComprehensionLearning Objective: 1-3Schiller - Chapter 01 #73Topic: THE MECHANISMS OF CHOICE
74.(p. 12)
The invisible hand refers to:
A. Intervention in the economy by the government bureaucrats we do not see and over whom we have no control.
B. Undiscovered natural resources.C. The allocation of resources by market forces.D. The person who has the responsibility to coordinate all the markets in a market economy.
AACSB: ReflectiveBT: ComprehensionLearning Objective: 1-3Schiller - Chapter 01 #74Topic: THE MECHANISMS OF CHOICE
75.(p. 13)
The doctrine of laissez faire is based on the belief that:
A. Markets are likely to do a better job of allocating resources than government directives.B. Government directives are likely to do a better job of allocating resources than markets.C. Government failure does not exist.D. Markets result in an unfair distribution of income.
AACSB: ReflectiveBT: ComprehensionLearning Objective: 1-3Schiller - Chapter 01 #75Topic: THE MECHANISMS OF CHOICE
75

Full file at http://testbanksinstant.eu/ Solution-Manual-for-The-Macro-Economy-Today---Schiller---11e76.(p. 13)
Which of the following would advocate a laissez faire economic policy?
A. Karl Marx.B. John Maynard Keynes.C. Adam Smith.D. President Franklin Roosevelt.
AACSB: ReflectiveBT: ComprehensionLearning Objective: 1-3Schiller - Chapter 01 #76Topic: THE MECHANISMS OF CHOICE
77.(p. 13)
A city's decision to limit smoking in public areas is an example of:
A. The invisible hand at work.B. The market mechanism at work.C. Market failure.D. Government intervention.
AACSB: ReflectiveBT: AnalysisLearning Objective: 1-3Schiller - Chapter 01 #77Topic: THE MECHANISMS OF CHOICE
78.(p. 13)
Karl Marx believed that the best use of resources would result from:
A. Government directives.B. Laissez faire policies.C. Production decisions based on costs alone.D. A mixture of government directives and market signals.
AACSB: ReflectiveBT: ComprehensionLearning Objective: 1-3Schiller - Chapter 01 #78Topic: THE MECHANISMS OF CHOICE
76

Full file at http://testbanksinstant.eu/ Solution-Manual-for-The-Macro-Economy-Today---Schiller---11e79.(p. 14)
Karl Marx wrote:
A. The Wealth of Nations, which provided the rationale for centrally-planned economies.B. The Wealth of Nations, which described the virtues of market-based economies.C. Das Kapital, which provided the rationale for centrally-planned economies.D. Das Kapital, which described the virtues of market-based economies.
AACSB: ReflectiveBT: ComprehensionLearning Objective: 1-3Schiller - Chapter 01 #79Topic: THE MECHANISMS OF CHOICE
80.(p. 15)
In a mixed economy like that in the United States, the question of WHAT to produce is determined by:
A. Government directives only.B. Price signals and sales in markets only.C. Both government directives, and price signals and sales in markets.D. The invisible hand only.
AACSB: ReflectiveBT: ComprehensionLearning Objective: 1-3Schiller - Chapter 01 #80Topic: THE MECHANISMS OF CHOICE
81.(p. 15)
A mixed economy:
A. Is justified by the superiority of laissez faire over government intervention.B. Utilizes both market and nonmarket signals to allocate goods and services.C. Relies on the use of central planning by private firms rather than the government.D. Is one that allows trade with other countries.
AACSB: AnalyticBT: KnowledgeLearning Objective: 1-3Schiller - Chapter 01 #81Topic: THE MECHANISMS OF CHOICE
77

Full file at http://testbanksinstant.eu/ Solution-Manual-for-The-Macro-Economy-Today---Schiller---11e82.(p. 15)
Which of the following is the most appropriate way to match different economic systems with their corresponding failures?
A. Market failures with command economies.B. Government failures with market economies.C. Market failures and government failures with mixed economies.D. Neither market nor government failure in a purely capitalist economy.
AACSB: ReflectiveBT: AnalysisLearning Objective: 1-3Schiller - Chapter 01 #82Topic: THE MECHANISMS OF CHOICE
83.(p. 16)
Which of the following can be used to correct market failure?
A. The market mechanism.B. Laws and regulations.C. Laissez-faire price policies.D. Government failure.
AACSB: ReflectiveBT: AnalysisLearning Objective: 1-3Schiller - Chapter 01 #83Topic: THE MECHANISMS OF CHOICE
84.(p. 16)
When the invisible hand does not produce optimal outcomes for the economy, there is evidence of:
A. Market failure.B. Government failure.C. Macroeconomic failure.D. Scarcity.
AACSB: ReflectiveBT: ComprehensionLearning Objective: 1-3Schiller - Chapter 01 #84Topic: THE MECHANISMS OF CHOICE
78

Full file at http://testbanksinstant.eu/ Solution-Manual-for-The-Macro-Economy-Today---Schiller---11e85.(p. 16)
Government intervention may achieve a more optimal outcome than the market mechanism when addressing:
A. Inefficient bureaucracy.B. Consumption of cigarettes.C. Lack of incentive to try new products or technologies.D. Inefficient bureaucracy, consumption of cigarettes, and lack of incentive to try new products or
technologies. AACSB: ReflectiveBT: AnalysisLearning Objective: 1-3Schiller - Chapter 01 #85Topic: THE MECHANISMS OF CHOICE
86.(p. 16)
If market signals result in pollution beyond the optimal level then:
A. The economy experiences government failure.B. A laissez-faire approach will reduce the level of pollution.C. The market mechanism has failed.D. The government is allocating resources inefficiently.
AACSB: ReflectiveBT: ComprehensionLearning Objective: 1-3Schiller - Chapter 01 #86Topic: THE MECHANISMS OF CHOICE
87.(p. 16)
Pollution is an example of:
A. Inefficient operation by the firm that is polluting.B. Market failure.C. The ability of central planning to provide the optimal quantities of goods.D. Government failure.
AACSB: ReflectiveBT: ApplicationLearning Objective: 1-3Schiller - Chapter 01 #87Topic: THE MECHANISMS OF CHOICE
79

Full file at http://testbanksinstant.eu/ Solution-Manual-for-The-Macro-Economy-Today---Schiller---11e88.(p. 16)
The collapse of communism is evidence of:
A. Ceteris paribus.B. Government failure.C. Market failure.D. The failure of a mixed economy.
AACSB: ReflectiveBT: ApplicationLearning Objective: 1-3Schiller - Chapter 01 #88Topic: THE MECHANISMS OF CHOICE
89.(p. 16)
When government directives do not produce better economic outcomes, which of the following has occurred?
A. Government failure.B. Market failure.C. Macroeconomic failure.D. Scarcity.
AACSB: ReflectiveBT: ComprehensionLearning Objective: 1-3Schiller - Chapter 01 #89Topic: THE MECHANISMS OF CHOICE
90.(p. 16)
Which of the following is an example of government failure?
A. Bureaucratic delays.B. Required use of pollution-control technologies that are obsolete.C. Inefficient incentives.D. Bureaucratic delays, required use of pollution-control technologies that are obsolete, and inefficient
incentives. AACSB: ReflectiveBT: ApplicationLearning Objective: 1-3Schiller - Chapter 01 #90Topic: THE MECHANISMS OF CHOICE
80

Full file at http://testbanksinstant.eu/ Solution-Manual-for-The-Macro-Economy-Today---Schiller---11e91.(p. 17)
Macroeconomics focuses on the performance of:
A. Individual consumers.B. Government agencies.C. The overall economy.D. All of the above.
AACSB: ReflectiveBT: ComprehensionLearning Objective: 1-3Schiller - Chapter 01 #91Topic: WHAT ECONOMICS IS ALL ABOUT
92.(p. 17)
Macroeconomics focuses on the performance of:
A. Individual firms.B. Particular government agencies.C. Specific consumers.D. The entire economy.
AACSB: ReflectiveBT: ComprehensionLearning Objective: 1-3Schiller - Chapter 01 #92Topic: WHAT ECONOMICS IS ALL ABOUT
93.(p. 17)
Which of the following is not a macroeconomic statement?
A. The unemployment rate for the United States rose to 5 percent in the last quarter.B. The price of corn rose to a ten year low in August.C. Congress increased the minimum wage rate in January.D. Jenny's wage rate rose and, in response, she decided to work more hours.
AACSB: ReflectiveBT: AnalysisLearning Objective: 1-3Schiller - Chapter 01 #93Topic: WHAT ECONOMICS IS ALL ABOUT
81

Full file at http://testbanksinstant.eu/ Solution-Manual-for-The-Macro-Economy-Today---Schiller---11e94.(p. 17)
Which of the following are classified as microeconomic goals?
A. Full employment, price stability, growth in output.B. The welfare of individual consumers and business firms.C. Production, pricing, and purchasing.D. Land, labor, and capital.
AACSB: ReflectiveBT: ComprehensionLearning Objective: 1-3Schiller - Chapter 01 #94Topic: WHAT ECONOMICS IS ALL ABOUT
95.(p. 17)
The study of microeconomic theory focuses on the:
A. Structure and performance of markets and the operation of the price system.B. Operation of the entire economy.C. Role of the banking system in the economy.D. Interaction of international trade and domestic production of goods and services.
AACSB: ReflectiveBT: ComprehensionLearning Objective: 1-3Schiller - Chapter 01 #95Topic: WHAT ECONOMICS IS ALL ABOUT
96.(p. 17)
Microeconomics is concerned with issues such as:
A. The demand for bottled water by individuals.B. The level of inflation in the economy.C. Maintaining a strong level of economic growth.D. All of the above.
AACSB: ReflectiveBT: AnalysisLearning Objective: 1-3Schiller - Chapter 01 #96Topic: WHAT ECONOMICS IS ALL ABOUT
82
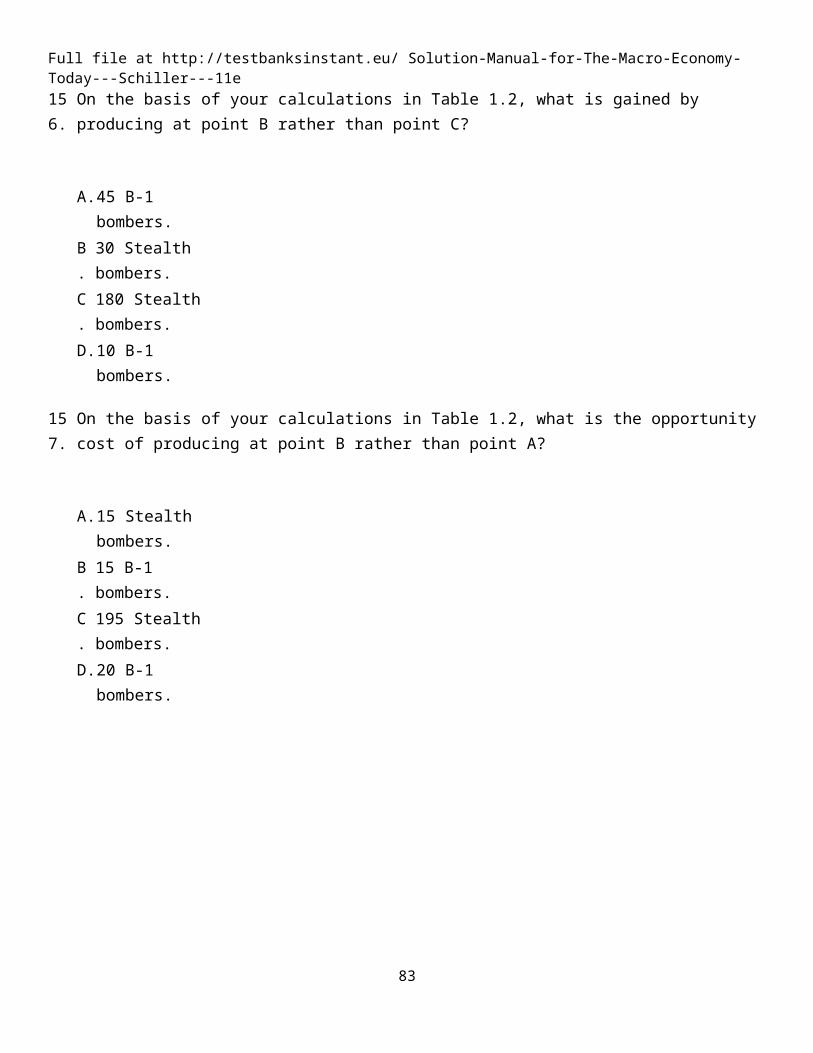
Full file at http://testbanksinstant.eu/ Solution-Manual-for-The-Macro-Economy-Today---Schiller---11e97.(p. 18)
Economic models are used by economists to:
A. Predict economic behavior.B. Develop economic policies.C. Explain economic behavior.D. Predict economic behavior, develop economic policies, and explain economic behavior.
AACSB: ReflectiveBT: ComprehensionLearning Objective: 1-3Schiller - Chapter 01 #97Topic: WHAT ECONOMICS IS ALL ABOUT
98.(p. 18)
The Latin phrase ceteris paribus means:
A. The production-possibilities curve never shifts.B. Laissez faire.C. Other things remain equal.D. The invisible hand.
AACSB: AnalyticBT: KnowledgeLearning Objective: 1-3Schiller - Chapter 01 #98Topic: WHAT ECONOMICS IS ALL ABOUT
Figure 1.1Production-possibilities curve
Schiller - Chapter 01
83

Full file at http://testbanksinstant.eu/ Solution-Manual-for-The-Macro-Economy-Today---Schiller---11e99.(p. 10)
At which point is society employing some of its available technology but not all of it? (See Figure 1.1.)
A. A.B. B.C. C.D. D.
AACSB: ReflectiveBT: ApplicationLearning Objective: 1-1Schiller - Chapter 01 #99Topic: WHAT ECONOMICS IS ALL ABOUT
100.(p. 10)
At which point is society not able to produce either good because it is so inefficient? (See Figure 1.1.)
A. A.B. B.C. C.D. D.
AACSB: ReflectiveBT: ApplicationLearning Objective: 1-1Schiller - Chapter 01 #100Topic: WHAT ECONOMICS IS ALL ABOUT
101.(p. 10)
At which point is society producing the most output possible with the available resources and technology? (See Figure 1.1.)
A. A.B. B.C. C.D. D.
AACSB: ReflectiveBT: ApplicationLearning Objective: 1-1Schiller - Chapter 01 #101Topic: WHAT ECONOMICS IS ALL ABOUT
84

Full file at http://testbanksinstant.eu/ Solution-Manual-for-The-Macro-Economy-Today---Schiller---11e102.(p. 10)
At which point is society producing some of each type of structure but still producing inefficiently? (See Figure 1.1.)
A. A.B. B.C. C.D. D.
AACSB: ReflectiveBT: ApplicationLearning Objective: 1-1Schiller - Chapter 01 #102Topic: WHAT ECONOMICS IS ALL ABOUT
103.(p. 10)
At which point is society achieving productive efficiency? (See Figure 1.1.)
A. A.B. B.C. C.D. D.
AACSB: ReflectiveBT: ApplicationLearning Objective: 1-1Schiller - Chapter 01 #103Topic: WHAT ECONOMICS IS ALL ABOUT
104.(p. 10)
At which point might society be able to produce this combination if new resources were discovered but cannot produce at with current resources? (See Figure 1.1.)
A. A.B. B.C. C.D. D.
AACSB: ReflectiveBT: ApplicationLearning Objective: 1-1Schiller - Chapter 01 #104Topic: WHAT ECONOMICS IS ALL ABOUT
85

Full file at http://testbanksinstant.eu/ Solution-Manual-for-The-Macro-Economy-Today---Schiller---11e105.(p. 10)
At which point is society not able to produce with existing resources and technology? (See Figure 1.1.)
A. A.B. B.C. C.D. D.
AACSB: ReflectiveBT: ApplicationLearning Objective: 1-1Schiller - Chapter 01 #105Topic: WHAT ECONOMICS IS ALL ABOUT
Figure 1.2Production-possibilities curves
Schiller - Chapter 01
106.(p. 7)
Choose the letter of the curve in Figure 1.2 that best represents a production-possibilities curve for two goods that use entirely different resources and for which the resources can in no way be adapted from the production of one good to the other.
A. A.B. B.C. C.D. D.
AACSB: ReflectiveBT: ApplicationLearning Objective: 1-1Schiller - Chapter 01 #106Topic: WHAT ECONOMICS IS ALL ABOUT
86

Full file at http://testbanksinstant.eu/ Solution-Manual-for-The-Macro-Economy-Today---Schiller---11e107.(p. 7)
Choose the letter of the curve in Figure 1.2 that best represents a production-possibilities curve for two goods that obey the law of increasing opportunity costs.
A. A.B. B.C. C.D. D.
AACSB: ReflectiveBT: ApplicationLearning Objective: 1-1Schiller - Chapter 01 #107Topic: WHAT ECONOMICS IS ALL ABOUT
108.(p. 7)
Choose the letter of the curve in Figure 1.2 that best represents a production-possibilities curve for two goods for which there are constant opportunity costs.
A. A.B. B.C. C.D. D.
AACSB: ReflectiveBT: ApplicationLearning Objective: 1-1Schiller - Chapter 01 #108Topic: WHAT ECONOMICS IS ALL ABOUT
Figure 1.3 Schiller - Chapter 01
87

Full file at http://testbanksinstant.eu/ Solution-Manual-for-The-Macro-Economy-Today---Schiller---11e109.(p. 11)
Using Figure 1.3, an increase in the capacity to produce can be represented by a movement from:
A. Point A to point B.B. Point A to point C.C. Point B to point C.D. Point C to point F.
AACSB: ReflectiveBT: ApplicationLearning Objective: 1-1Schiller - Chapter 01 #109Topic: WHAT ECONOMICS IS ALL ABOUT
110.(p. 10)
Using Figure 1.3, at point A:
A. There is inefficient use of available resources.B. The available technology keeps production inside PP1.C. All available resources are being used efficiently.D. An increase in the production of mops would definitely require a decrease in the production of
brooms. AACSB: ReflectiveBT: ApplicationLearning Objective: 1-1Schiller - Chapter 01 #110Topic: WHAT ECONOMICS IS ALL ABOUT
111.(p. 10)
Which of the following is true about the combination of mops and brooms represented by point E in Figure 1.3?
A. This economy will never be able to reach point E.B. Point E is attainable if this economy uses more of its available resources.C. Point E is attainable if this economy becomes more efficient.D. Point E is attainable only if more resources become available or technological advances are made.
AACSB: ReflectiveBT: ApplicationLearning Objective: 1-1Schiller - Chapter 01 #111Topic: WHAT ECONOMICS IS ALL ABOUT
88

Full file at http://testbanksinstant.eu/ Solution-Manual-for-The-Macro-Economy-Today---Schiller---11e112.(p. 10)
An increase in the proportion of the population that is unemployed is best represented in Figure 1.3 by a movement from point:
A. C to point D.B. D to point C.C. C to point A.D. E to point D.
AACSB: ReflectiveBT: ApplicationLearning Objective: 1-1Schiller - Chapter 01 #112Topic: WHAT ECONOMICS IS ALL ABOUT
113.(p. 10)
A movement from point F to point D in Figure 1.3 results in:
A. A reallocation of resources from mop production to broom production.B. Permanent unemployment of workers producing brooms.C. A reallocation of resources from broom production to mop production.D. More efficient production.
AACSB: ReflectiveBT: ApplicationLearning Objective: 1-1Schiller - Chapter 01 #113Topic: WHAT ECONOMICS IS ALL ABOUT
114.(p. 10)
In Figure 1.3, a shift of the production possibilities curve from PP1 to PP2 could be caused by:
A. A decrease in the quantity of raw materials available.B. A decline in the production skills of workers.C. The use of improved production technology.D. All of the above could cause the shift.
AACSB: ReflectiveBT: ApplicationLearning Objective: 1-1Schiller - Chapter 01 #114Topic: WHAT ECONOMICS IS ALL ABOUT
89

Full file at http://testbanksinstant.eu/ Solution-Manual-for-The-Macro-Economy-Today---Schiller---11e
Figure 1.4 Schiller - Chapter 01
115.(p. 11)
Using Figure 1.4, an increase in the capacity to produce can be represented by a movement from point:
A. A to point B.B. C to point E.C. A to point C.D. D to point E.
AACSB: ReflectiveBT: ApplicationLearning Objective: 1-1Schiller - Chapter 01 #115Topic: WHAT ECONOMICS IS ALL ABOUT
116.(p. 10)
Refer to Figure 1.4, at Point B:
A. The available technology keeps production inside PP1.B. All available resources are being used efficiently.C. There is inefficient use of available resources.D. An increase in the production of plasma televisions would definitely require a decrease in the
production of MP3 players. AACSB: ReflectiveBT: ApplicationLearning Objective: 1-1Schiller - Chapter 01 #116Topic: WHAT ECONOMICS IS ALL ABOUT
90

Full file at http://testbanksinstant.eu/ Solution-Manual-for-The-Macro-Economy-Today---Schiller---11e117.(p. 11)
Which of the following is true about the combination of plasma televisions and MP3 players represented by point F in Figure 1.4?
A. This economy will never be able to reach point F.B. Point F is attainable if this economy reduces its unemployment rate.C. Point F will be more easily attainable if the government takes control of all privately-run factories.D. Point F can possibly be reached if more economic resources become available or technology
improves. AACSB: ReflectiveBT: ApplicationLearning Objective: 1-1Schiller - Chapter 01 #117Topic: WHAT ECONOMICS IS ALL ABOUT
118.(p. 11)
A decrease in the proportion of the population that is unemployed is best represented in Figure 1.4 by a movement from point:
A. C to point B.B. B to point C.C. C to point E.D. E to point F.
AACSB: ReflectiveBT: ApplicationLearning Objective: 1-1Schiller - Chapter 01 #118Topic: WHAT ECONOMICS IS ALL ABOUT
119.(p. 7)
A movement from point C to point A in Figure 1.4 results in:
A. More efficient production.B. Permanent unemployment of workers producing plasma televisions.C. A reallocation of resources from MP3 player production to plasma television production.D. A reallocation of resources from plasma television production to MP3 player production.
AACSB: ReflectiveBT: ApplicationLearning Objective: 1-1Schiller - Chapter 01 #119Topic: WHAT ECONOMICS IS ALL ABOUT
91
Full file at http://testbanksinstant.eu/ Solution-Manual-for-The-Macro-Economy-Today---Schiller---11e120.(p. 11)
In Figure 1.4, a shift of the production-possibilities curve from PP1 to PP2 could be caused by:
A. An increase in the unemployment rate.B. Implementation of training programs which improve the skills of workers.C. Better use of existing technology.D. Tougher pollution controls for the producers of plasma televisions and MP3 players.
AACSB: ReflectiveBT: ApplicationLearning Objective: 1-1Schiller - Chapter 01 #120Topic: WHAT ECONOMICS IS ALL ABOUT
Figure 1.5 Schiller - Chapter 01
121.(p. 10)
Using Figure 1.5, if an economy has the capacity to produce represented by PP2 then point E represents:
A. A constant tradeoff between lattes and milkshakes.B. A combination of lattes and milkshakes that is not attainable.C. An efficient use of resources.D. The unemployment of resources.
AACSB: ReflectiveBT: ApplicationLearning Objective: 1-1Schiller - Chapter 01 #121Topic: WHAT ECONOMICS IS ALL ABOUT
92

Full file at http://testbanksinstant.eu/ Solution-Manual-for-The-Macro-Economy-Today---Schiller---11e122.(p. 11)
Using Figure 1.5, if an economy is currently producing on PP2, which of the following would shift the production-possibilities curve toward PP1?
A. An increase in the quantity of labor available.B. A decrease in the amount of capital available.C. An increase in the level of unemployment.D. An advancement in technology.
AACSB: ReflectiveBT: ApplicationLearning Objective: 1-1Schiller - Chapter 01 #122Topic: WHAT ECONOMICS IS ALL ABOUT
123.(p. 7)
In Figure 1.5, if the opportunity cost of producing milkshakes was zero at all levels of production, the production-possibilities curve would best be represented by a:
A. Vertical straight line.B. 45-degree line starting at the origin.C. Horizontal straight line.D. Circle.
AACSB: ReflectiveBT: ApplicationLearning Objective: 1-1Schiller - Chapter 01 #123Topic: WHAT ECONOMICS IS ALL ABOUT
124.(p. 8)
In Figure 1.5, at which of the following points would the opportunity cost of producing another latte be greatest?
A. D.B. E.C. B.D. C.
AACSB: ReflectiveBT: ApplicationLearning Objective: 1-1Schiller - Chapter 01 #124Topic: WHAT ECONOMICS IS ALL ABOUT
93

Full file at http://testbanksinstant.eu/ Solution-Manual-for-The-Macro-Economy-Today---Schiller---11e125.(p. 8)
In Figure 1.5, at which of the following points would the opportunity cost of producing another milkshake be greatest?
A. F.B. E.C. B.D. C.
AACSB: ReflectiveBT: ApplicationLearning Objective: 1-1Schiller - Chapter 01 #125Topic: WHAT ECONOMICS IS ALL ABOUT
Figure 1.6 Schiller - Chapter 01
126.(p. 10)
Using Figure 1.6, if an economy has the capacity to produce represented by PP1 then point E represents:
A. A combination of cars and SUVs that is not attainable.B. A constant tradeoff between cars and SUVs.C. The unemployment of resources.D. An efficient use of resources.
AACSB: ReflectiveBT: ApplicationLearning Objective: 1-1Schiller - Chapter 01 #126Topic: WHAT ECONOMICS IS ALL ABOUT
94

Full file at http://testbanksinstant.eu/ Solution-Manual-for-The-Macro-Economy-Today---Schiller---11e127.(p. 7)
In Figure 1.6, if the opportunity cost of producing cars was zero at all levels of production, the production-possibilities curve would be best be represented by a:
A. Vertical straight line.B. 45-degree line starting at the origin.C. Horizontal straight line.D. Circle.
AACSB: ReflectiveBT: ApplicationLearning Objective: 1-1Schiller - Chapter 01 #127Topic: WHAT ECONOMICS IS ALL ABOUT
128.(p. 8)
In Figure 1.6, at which of the following points would the opportunity cost of producing an additional SUV be the lowest?
A. B.B. E.C. A.D. F.
AACSB: ReflectiveBT: ApplicationLearning Objective: 1-1Schiller - Chapter 01 #128Topic: WHAT ECONOMICS IS ALL ABOUT
129.(p. 8)
In Figure 1.6, at which of the following points would the opportunity cost of producing one more car be the lowest?
A. F.B. E.C. B.D. C.
AACSB: ReflectiveBT: ApplicationLearning Objective: 1-1Schiller - Chapter 01 #129Topic: WHAT ECONOMICS IS ALL ABOUT
95

Full file at http://testbanksinstant.eu/ Solution-Manual-for-The-Macro-Economy-Today---Schiller---11e130.(p. 8)
In Figure 1.6, at which of the following points would the opportunity cost of producing one more SUV be the highest?
A. C.B. B.C. A.D. F.
AACSB: ReflectiveBT: ApplicationLearning Objective: 1-1Schiller - Chapter 01 #130Topic: WHAT ECONOMICS IS ALL ABOUT
Figure 1.7 Schiller - Chapter 01
131.(p. 10)
Refer to Figure 1.7. This economy will achieve efficiency in production at:
A. Point D only.B. Point G only.C. Point J only.D. Points D, G, and J.
AACSB: ReflectiveBT: ApplicationLearning Objective: 1-1Schiller - Chapter 01 #131Topic: WHAT ECONOMICS IS ALL ABOUT
96

Full file at http://testbanksinstant.eu/ Solution-Manual-for-The-Macro-Economy-Today---Schiller---11e132.(p. 8)
Refer to Figure 1.7. The cost of producing at point G rather than point D is:
A. OA units of food.B. KL units of clothing.C. AB units of food.D. OL units of clothing.
AACSB: ReflectiveBT: ApplicationLearning Objective: 1-1Schiller - Chapter 01 #132Topic: WHAT ECONOMICS IS ALL ABOUT
133.(p. 8)
Refer to Figure 1.7. The benefit of producing at point G rather than point D is:
A. OA units of food.B. KL units of clothing.C. AB units of food.D. OL units of clothing.
AACSB: ReflectiveBT: ApplicationLearning Objective: 1-1Schiller - Chapter 01 #133Topic: WHAT ECONOMICS IS ALL ABOUT
134.(p. 8)
Refer to Figure 1.7. The cost of producing at point D rather than point J is:
A. KM units of clothing.B. AC units of food.C. OM units of clothing.D. OA units of food.
AACSB: ReflectiveBT: ApplicationLearning Objective: 1-1Schiller - Chapter 01 #134Topic: WHAT ECONOMICS IS ALL ABOUT
97

Full file at http://testbanksinstant.eu/ Solution-Manual-for-The-Macro-Economy-Today---Schiller---11e135.(p. 8)
Refer to Figure 1.7. The benefit of producing at point D rather than point J is:
A. KM units of clothing.B. OA units of food.C. OM units of clothing.D. AC units of food.
AACSB: ReflectiveBT: ApplicationLearning Objective: 1-1Schiller - Chapter 01 #135Topic: WHAT ECONOMICS IS ALL ABOUT
136.(p. 12)
Refer to Figure 1.7. If this economy is currently producing at point F, then by employing more resources this economy:
A. Can move to point D, but not points G or J.B. Can move to points D, G or J.C. Can move to point G, but not points D or J.D. Will remain at point F.
AACSB: ReflectiveBT: ApplicationLearning Objective: 1-1Schiller - Chapter 01 #136Topic: WHAT ECONOMICS IS ALL ABOUT
137.(p. 11)
Refer to Figure 1.7. Which of the following points are considered to be inefficient?
A. D.B. E.C. G.D. D, G, and J.
AACSB: ReflectiveBT: ApplicationLearning Objective: 1-1Schiller - Chapter 01 #137Topic: WHAT ECONOMICS IS ALL ABOUT
98

Full file at http://testbanksinstant.eu/ Solution-Manual-for-The-Macro-Economy-Today---Schiller---11e138.(p. 10)
Refer to Figure 1.7. Which of the following points are unattainable?
A. G.B. F.C. N.D. E.
AACSB: ReflectiveBT: ApplicationLearning Objective: 1-1Schiller - Chapter 01 #138Topic: WHAT ECONOMICS IS ALL ABOUT
139.(p. 11)
Refer to Figure 1.7. Which of the following points show unemployment of resources?
A. H.B. J.C. N.D. D.
AACSB: ReflectiveBT: ApplicationLearning Objective: 1-1Schiller - Chapter 01 #139Topic: WHAT ECONOMICS IS ALL ABOUT
Figure 1.8 Schiller - Chapter 01
99
Full file at http://testbanksinstant.eu/ Solution-Manual-for-The-Macro-Economy-Today---Schiller---11e140.(p. 8)
Refer to Figure 1.8. Assume that Point X is associated with production of 500 cars and 1,000 trucks while Point Y is associated with production of 600 cars and 950 trucks. If Point Z is associated with production of 700 cars, then it is most reasonable to assume that Point Z is also associated with production of:
A. 1,100 trucks.B. 950 trucks.C. 900 trucks.D. 812 trucks.
AACSB: ReflectiveBT: ApplicationLearning Objective: 1-1Schiller - Chapter 01 #140Topic: WHAT ECONOMICS IS ALL ABOUT
141.(p. 8)
Refer to Figure 1.8. Assume that Point Z is associated with production of 10,000 cars and 10,000 trucks while Point Y is associated with production of 8,000 cars and 9,000 trucks. If Point Z is associated with production of 700 cars, then it is most reasonable to assume that Point Z is also associated with production of:
A. 7,300 cars.B. 7,600 cars.C. 8,000 cars.D. 8,800 cars.
AACSB: ReflectiveBT: ApplicationLearning Objective: 1-1Schiller - Chapter 01 #141Topic: WHAT ECONOMICS IS ALL ABOUT
100
Full file at http://testbanksinstant.eu/ Solution-Manual-for-The-Macro-Economy-Today---Schiller---11eTable 1.1 shows the hypothetical tradeoff between different combinations of Stealth bombers and B-1 bombers that might be produced in a year with the limited U.S. capacity, ceteris paribus. Complete the table by calculating the required opportunity costs for both the B-1 and Stealth bombers. Then answer the indicated questions.
Table 1.1Production possibilities for bombers
Schiller - Chapter 01
142.(p. 8)
On the basis of your calculations in Table 1.1, you may infer that the law of increasing opportunity costs applies to:
A. Stealth bombers but not to B-1 bombers.B. B-1 bombers but not to Stealth bombers.C. Both B-1 bombers and Stealth bombers.D. Neither B-1 bombers nor Stealth bombers.
AACSB: ReflectiveBT: ApplicationLearning Objective: 1-1Schiller - Chapter 01 #142Topic: WHAT ECONOMICS IS ALL ABOUT
143.(p. 8)
On the basis of your calculations in Table 1.1, what is the opportunity cost of producing at point S rather than point T?
A. 1 Stealth bomber.B. 1 B-1 bomber.C. 10 Stealth bombers.D. 0.9 Stealth bombers.
AACSB: ReflectiveBT: ApplicationLearning Objective: 1-1Schiller - Chapter 01 #143
101

Full file at http://testbanksinstant.eu/ Solution-Manual-for-The-Macro-Economy-Today---Schiller---11eTopic: WHAT ECONOMICS IS ALL ABOUT
144.(p. 8)
On the basis of your calculations in Table 1.1, what is gained by producing at point S rather than point T?
A. 1 Stealth bomber.B. 1 B-1 bomber.C. 10 Stealth bombers.D. 0.9 Stealth bombers.
AACSB: ReflectiveBT: ApplicationLearning Objective: 1-1Schiller - Chapter 01 #144Topic: WHAT ECONOMICS IS ALL ABOUT
145.(p. 8)
On the basis of your calculations in Table 1.1, what is the opportunity cost of producing at point V rather than point U?
A. 3 B-1 bombers.B. 1 B-1 bomber.C. 4 Stealth bombers.D. 3 Stealth bombers.
AACSB: ReflectiveBT: ApplicationLearning Objective: 1-1Schiller - Chapter 01 #145Topic: WHAT ECONOMICS IS ALL ABOUT
146.(p. 8)
On the basis of your calculations in Table 1.1, what is gained by producing at point V rather than point U?
A. 3 B-1 bombers.B. 1 B-1 bomber.C. 4 Stealth bombers.D. 3 Stealth bombers.
AACSB: ReflectiveBT: ApplicationLearning Objective: 1-1Schiller - Chapter 01 #146Topic: WHAT ECONOMICS IS ALL ABOUT
102

Full file at http://testbanksinstant.eu/ Solution-Manual-for-The-Macro-Economy-Today---Schiller---11e147.(p. 8)
In Table 1.1, the opportunity cost of increasing the production of B-1s from 1 to 2 i terms of Stealth bombers is:
A. 1.B. 2.C. 0.33.D. 2.
AACSB: ReflectiveBT: ApplicationLearning Objective: 1-1Schiller - Chapter 01 #147Topic: WHAT ECONOMICS IS ALL ABOUT
148.(p. 8)
Refer to Table 1.1. In the production range of 7 to 9 Stealths, the opportunity cost of producing 1 more Stealth bomber in terms of B-1s is:
A. 0.B. 3.C. 0.5.D. 2.
AACSB: ReflectiveBT: ApplicationLearning Objective: 1-1Schiller - Chapter 01 #148Topic: WHAT ECONOMICS IS ALL ABOUT
149.(p. 8)
The highest opportunity cost anywhere in Table 1.1 for Stealth bombers in terms of B-1 bombers is:
A. 1 B-1 per Stealth bomber.B. 3 B-1s per Stealth bomber.C. 2 B-1s per Stealth bomber.D. 0.5 B-1 per Stealth bomber.
AACSB: ReflectiveBT: ApplicationLearning Objective: 1-1Schiller - Chapter 01 #149Topic: WHAT ECONOMICS IS ALL ABOUT
103

Full file at http://testbanksinstant.eu/ Solution-Manual-for-The-Macro-Economy-Today---Schiller---11e150.(p. 8)
The lowest opportunity cost anywhere in Table 1.1 for Stealth bombers in terms of B-1 bombers is:
A. 0.1 B-1 per Stealth bomber.B. 0.5 B-1 per Stealth bomber.C. 2 B-1s per Stealth bomber.D. 0.33 B-1 per Stealth bomber.
AACSB: ReflectiveBT: ApplicationLearning Objective: 1-1Schiller - Chapter 01 #150Topic: WHAT ECONOMICS IS ALL ABOUT
151.(p. 8)
The highest opportunity cost anywhere in Table 1.1 for B-1 bombers in terms of Stealth bombers is:
A. 1 Stealth per B-1 bomber.B. 3 Stealths per B-1 bomber.C. 2 Stealths per B-1 bomber.D. 0.5 Stealth per B-1 bomber.
AACSB: ReflectiveBT: ApplicationLearning Objective: 1-1Schiller - Chapter 01 #151Topic: WHAT ECONOMICS IS ALL ABOUT
152.(p. 8)
The lowest opportunity cost anywhere in Table 1.1 for B-1 bombers in terms of Stealth bombers is:
A. 0 Stealth per B-1 bomber.B. 2 Stealths per B-1 bomber.C. 1 Stealths per B-1 bomber.D. 0.5 Stealth per B-1 bomber.
AACSB: ReflectiveBT: ApplicationLearning Objective: 1-1Schiller - Chapter 01 #152Topic: WHAT ECONOMICS IS ALL ABOUT
104
Full file at http://testbanksinstant.eu/ Solution-Manual-for-The-Macro-Economy-Today---Schiller---11e153.(p. 8)
What is the relationship between the opportunity cost of Stealth bombers and the opportunity cost of B-1 bombers in Table 1.1?
A. They are reciprocals of each other.B. As one increases the other increases.C. Neither conform to the law of increasing opportunity cost.D. They are reciprocals of each other and neither conforms to the law of increasing opportunity cost.
AACSB: ReflectiveBT: ApplicationLearning Objective: 1-1Schiller - Chapter 01 #153Topic: WHAT ECONOMICS IS ALL ABOUT
Table 1.2 shows the hypothetical tradeoff between different combinations of Stealth bombers and B-1 bombers that might be produced in a year with the limited U.S. capacity, ceteris paribus. Complete the table by calculating the required opportunity costs for both the B-1 and Stealth bombers. Then answer the indicated questions.
Table 1.2Production possibilities for bombers
Schiller - Chapter 01
154.(p. 8)
On the basis of your calculations in Table 1.2, the law of increasing opportunity costs applies to:
A. Both B-1 and Stealth bombers.B. B-1 bombers but not to Stealth bombers.C. Stealth bombers but not to B-1 bombers.D. Neither bomber.
AACSB: ReflectiveBT: ApplicationLearning Objective: 1-1Schiller - Chapter 01 #154Topic: WHAT ECONOMICS IS ALL ABOUT
105

Full file at http://testbanksinstant.eu/ Solution-Manual-for-The-Macro-Economy-Today---Schiller---11e155.(p. 8)
On the basis of your calculations in Table 1.2, what is the opportunity cost of producing at point B rather than point C?
A. 45 B-1 bombers.B. 35 Stealth bombers.C. 180 Stealth bombers.D. 10 B-1 bombers.
AACSB: ReflectiveBT: ApplicationLearning Objective: 1-1Schiller - Chapter 01 #155Topic: WHAT ECONOMICS IS ALL ABOUT
156.(p. 8)
On the basis of your calculations in Table 1.2, what is gained by producing at point B rather than point C?
A. 45 B-1 bombers.B. 30 Stealth bombers.C. 180 Stealth bombers.D. 10 B-1 bombers.
AACSB: ReflectiveBT: ApplicationLearning Objective: 1-1Schiller - Chapter 01 #156Topic: WHAT ECONOMICS IS ALL ABOUT
157.(p. 8)
On the basis of your calculations in Table 1.2, what is the opportunity cost of producing at point B rather than point A?
A. 15 Stealth bombers.B. 15 B-1 bombers.C. 195 Stealth bombers.D. 20 B-1 bombers.
AACSB: ReflectiveBT: ApplicationLearning Objective: 1-1Schiller - Chapter 01 #157Topic: WHAT ECONOMICS IS ALL ABOUT
106

Full file at http://testbanksinstant.eu/ Solution-Manual-for-The-Macro-Economy-Today---Schiller---11e158.(p. 8)
On the basis of your calculations in Table 1.2, what is gained by producing at point B rather than point A?
A. 35 B-1 bombers.B. 195 Stealth bombers.C. 15 B-1 bombers.D. 15 Stealth bombers.
AACSB: ReflectiveBT: ApplicationLearning Objective: 1-1Schiller - Chapter 01 #158Topic: WHAT ECONOMICS IS ALL ABOUT
159.(p. 8)
Refer to Table 1.2. In the production range of 20 to 35 B-1s, the opportunity cost of producing 1 more B-1 bomber in terms of Stealth bombers is:
A. 195/20.B. 35/20.C. 15.D. 1.
AACSB: ReflectiveBT: ApplicationLearning Objective: 1-1Schiller - Chapter 01 #159Topic: WHAT ECONOMICS IS ALL ABOUT
160.(p. 8)
Refer to Table 1.2. In the production range of 180 to 195 Stealth bombers, the opportunity cost of producing 1 more Stealth bomber in terms of B-1 bombers is:
A. 15.B. 1.C. 195/20.D. 195/180.
AACSB: ReflectiveBT: ApplicationLearning Objective: 1-1Schiller - Chapter 01 #160Topic: WHAT ECONOMICS IS ALL ABOUT
107

Full file at http://testbanksinstant.eu/ Solution-Manual-for-The-Macro-Economy-Today---Schiller---11e161.(p. 8)
The highest opportunity cost anywhere in Table 1.2 for B-1 bombers in terms of Stealth bombers is:
A. 10 Stealths per B-1 bomber.B. .33 B-1 per Stealth bomber.C. .10 B-1 bomber per Stealth bomber.D. .10 Stealth per B-1 bomber.
AACSB: ReflectiveBT: ApplicationLearning Objective: 1-1Schiller - Chapter 01 #161Topic: WHAT ECONOMICS IS ALL ABOUT
162.(p. 8)
The lowest opportunity cost anywhere in Table 1.2 for Stealth bombers in terms of B-1 bombers is:
A. 3 B-1s per Stealth bomber.B. .33 B-1 per Stealth bomber.C. 10 B-1s per Stealth bomber.D. .10 B-1 per Stealth bomber.
AACSB: ReflectiveBT: ApplicationLearning Objective: 1-1Schiller - Chapter 01 #162Topic: WHAT ECONOMICS IS ALL ABOUT
163.(p. 8)
In Table 1.2, what is the relationship between the opportunity cost of Stealth bombers and the opportunity cost of B-1 bombers?
A. They are reciprocals of each other.B. As one increases the other increases.C. Neither conforms to the law of increasing opportunity cost.D. They are multiples of each other.
AACSB: ReflectiveBT: ApplicationLearning Objective: 1-1Schiller - Chapter 01 #163Topic: WHAT ECONOMICS IS ALL ABOUT
108

Full file at http://testbanksinstant.eu/ Solution-Manual-for-The-Macro-Economy-Today---Schiller---11eTable 1.3 shows the hypothetical tradeoff between different combinations of brushes and combs that might be produced in a year with the limited capacity for Country X, ceteris paribus. Complete the table by calculating the required opportunity costs for brushes and combs. Then answer the indicated questions.
Table 1.3Production possibilities for brushes and combs
Schiller - Chapter 01
164.(p. 8)
On the basis of your calculations in Table 1.3, what is the opportunity cost of producing at point M rather than point N?
A. 23 combs.B. 21 combs.C. 1 brush.D. 2 combs.
AACSB: ReflectiveBT: ApplicationLearning Objective: 1-1Schiller - Chapter 01 #164Topic: WHAT ECONOMICS IS ALL ABOUT
165.(p. 8)
On the basis of your calculations in Table 1.3, what is gained by producing at point M rather than point N?
A. 23 combs.B. 21 combs.C. 1 brush.D. 2 combs.
AACSB: ReflectiveBT: Application
109
Full file at http://testbanksinstant.eu/ Solution-Manual-for-The-Macro-Economy-Today---Schiller---11eLearning Objective: 1-1Schiller - Chapter 01 #165Topic: WHAT ECONOMICS IS ALL ABOUT
166.(p. 8)
On the basis of your calculations in Table 1.3, what is the opportunity cost of producing at point L rather than point K?
A. 17 combs.B. 2 brushes.C. 1 brush.D. 7 combs.
AACSB: ReflectiveBT: ApplicationLearning Objective: 1-1Schiller - Chapter 01 #166Topic: WHAT ECONOMICS IS ALL ABOUT
167.(p. 8)
On the basis of your calculations in Table 1.3, what is gained from producing at point L rather than point K?
A. 17 combs.B. 10 combs.C. 1 brush.D. 7 combs.
AACSB: ReflectiveBT: ApplicationLearning Objective: 1-1Schiller - Chapter 01 #167Topic: WHAT ECONOMICS IS ALL ABOUT
168.(p. 8)
On the basis of your calculations in Table 1.3, the law of increasing opportunity costs applies to:
A. Both brushes and combs.B. Combs but not brushes.C. Brushes but not combs.D. Neither brushes nor combs.
AACSB: ReflectiveBT: ApplicationLearning Objective: 1-1Schiller - Chapter 01 #168Topic: WHAT ECONOMICS IS ALL ABOUT
110

Full file at http://testbanksinstant.eu/ Solution-Manual-for-The-Macro-Economy-Today---Schiller---11e169.(p. 8)
On the basis of your calculations in Table 1.3, in the production range of 2 to 3 brushes the opportunity cost of producing 1 more brush in terms of combs is:
A. 3. 33.B. 7. 0.C. 0. 67.D. 0. 14.
AACSB: ReflectiveBT: ApplicationLearning Objective: 1-1Schiller - Chapter 01 #169Topic: WHAT ECONOMICS IS ALL ABOUT
170.(p. 8)
On the basis of your calculations in Table 1.3, in the production range of 21 to 23 combs the opportunity cost of producing more comb in terms of brushes is:
A. 1/21.B. 21/23.C. 1/2.D. 4.
AACSB: ReflectiveBT: ApplicationLearning Objective: 1-1Schiller - Chapter 01 #170Topic: WHAT ECONOMICS IS ALL ABOUT
171.(p. 8)
On the basis of your calculations in Table 1.3, in the production range of 1 to 2 brushes the opportunity cost of producing 1 more brush in terms of combs is:
A. 4.B. 1/2.C. 2/17.D. 1/7.
AACSB: ReflectiveBT: ApplicationLearning Objective: 1-1Schiller - Chapter 01 #171Topic: WHAT ECONOMICS IS ALL ABOUT
111
Full file at http://testbanksinstant.eu/ Solution-Manual-for-The-Macro-Economy-Today---Schiller---11e172.(p. 8)
On the basis of your calculations in Table 1.3, the highest opportunity cost for combs in terms of brushes is:
A. 0.10 combs per brush.B. 23 combs per brush.C. 0.50 combs per brush.D. 0.29 combs per brush.
AACSB: ReflectiveBT: ApplicationLearning Objective: 1-1Schiller - Chapter 01 #172Topic: WHAT ECONOMICS IS ALL ABOUT
173.(p. 8)
On the basis of your calculations in Table 1.3, the lowest opportunity cost for brushes in terms of combs is:
A. 10 brushes per comb.B. 2 brushes per comb.C. 0.33 brushes per comb.D. 8.5 brushes per comb.
AACSB: ReflectiveBT: ApplicationLearning Objective: 1-1Schiller - Chapter 01 #173Topic: WHAT ECONOMICS IS ALL ABOUT
174.(p. 9)
One World View article is titled "Food Shortages Plague N. Korea." On a production-possibilities curve between private and public goods, a decrease in military spending in an effort to increase food production could be represented as:
A. A movement along the production-possibilities curve toward public goods.B. A movement along the production-possibilities curve toward private goods.C. A shift outward of the production-possibilities curve.D. A shift inward of the production-possibilities curve.
AACSB: AnalyticBT: KnowledgeLearning Objective: 1-1Schiller - Chapter 01 #174
112

Full file at http://testbanksinstant.eu/ Solution-Manual-for-The-Macro-Economy-Today---Schiller---11e175.(p. 9)
One World View article is titled "Food Shortages Plague N. Korea." If North Korea reduces the size of its military and produces more food, this is most consistent with:
A. A movement along the economy's production-possibilities curve.B. Privatization.C. A laissez faire policy.D. The law of increasing opportunity costs.
AACSB: AnalyticBT: KnowledgeLearning Objective: 1-1Schiller - Chapter 01 #175
176.(p. 17)
One World View article states that China's leaders favor private ownership of property versus government ownership. This illustrates the success of:
A. Incentives from a centrally planned economy.B. The theme of Das Kapital.C. Laissez faire policy.D. All of the above.
AACSB: AnalyticBT: KnowledgeLearning Objective: 1-1Schiller - Chapter 01 #176
177.(p. 2)
One World View article states that NASA plans to spend $100 billion to establish a manned station on the moon, then continue on to Mars. This is an example of an activity that:
A. Will move the U.S.'s production possibilities curve inward.B. Has no opportunity cost.C. Will move the U.S. from one point on its production possibilities curve to another point.D. Has a negative opportunity cost.
AACSB: ReflectiveBT: ApplicationLearning Objective: 1-1Schiller - Chapter 01 #177
113

Full file at http://testbanksinstant.eu/ Solution-Manual-for-The-Macro-Economy-Today---Schiller---11e
Figure 1.8Relating grades and hours studied
Schiller - Chapter 01
178.(p. 22)
In Figure 1.8, a grade-point average of 3. 0 is associated with how many hours of study time per week?
A. 5.B. 10.C. 15.D. 20.
AACSB: ReflectiveBT: ApplicationLearning Objective: 1-1Schiller - Chapter 01 #178Topic: APPENDIX
179.(p. 22)
The slope of the line between grade-point averages of 1.0 and 3.0 in Figure 1.8 is:
A. -2.0.B. 1/10.C. 1/5.D. 5.
AACSB: ReflectiveBT: ApplicationLearning Objective: 1-1Schiller - Chapter 01 #179Topic: APPENDIX
114

Full file at http://testbanksinstant.eu/ Solution-Manual-for-The-Macro-Economy-Today---Schiller---11e180.(p. 22)
Figure 1.8 suggests that the relationship between the variables is:
A. Negative after 30 hours of study.B. Everywhere linear.C. Linear at places and nonlinear at places.D. Linear at places and nonlinear at places but always negatively sloped.
AACSB: ReflectiveBT: ApplicationLearning Objective: 1-1Schiller - Chapter 01 #180Topic: APPENDIX
181.(p. 22)
Figure 1.8 suggests that:
A. The law of increasing opportunity cost does not apply.B. Resources can be perfectly adapted between study time and grade-point average.C. The relationship between study time and grade-point average is first linear, then nonlinear.D. The relationship between study time and grade-point average is constant.
AACSB: ReflectiveBT: ApplicationLearning Objective: 1-1Schiller - Chapter 01 #181Topic: APPENDIX
182.(p. 22)
Figure 1.8 suggests that if a student wants to achieve a grade-point average of 2.0, he or she should study:
A. An average of 5 hours per week.B. An average of 10 hours per week.C. An average of 15 hours per week.D. More than 15 hours per week because he or she is a C student.
AACSB: ReflectiveBT: ApplicationLearning Objective: 1-1Schiller - Chapter 01 #182Topic: APPENDIX
115

Full file at http://testbanksinstant.eu/ Solution-Manual-for-The-Macro-Economy-Today---Schiller---11e183.(p. 22)
In Figure 1.8, as you move from Point B closer to point C the slope:
A. Becomes negative.B. Remains constant.C. Decreases.D. Increases.
AACSB: ReflectiveBT: ApplicationLearning Objective: 1-1Schiller - Chapter 01 #183Topic: APPENDIX
184.(p. 23)
Refer to Figure 1.8. If the university decides to lower grading standards, then:
A. This curve will shift rightward.B. This curve will shift leftward.C. The curve will begin to bend downward at an earlier point.D. We will slide up the curve from point B to point C.
AACSB: ReflectiveBT: ApplicationLearning Objective: 1-1Schiller - Chapter 01 #184Topic: APPENDIX
Figure 1.9 Schiller - Chapter 01
116

Full file at http://testbanksinstant.eu/ Solution-Manual-for-The-Macro-Economy-Today---Schiller---11e185.(p. 22)
In Figure 1.9, as you move up the curve from Point J toward Point M, the slope:
A. Increases.B. Remains constant.C. Decreases.D. Becomes negative.
AACSB: ReflectiveBT: ApplicationLearning Objective: 1-1Schiller - Chapter 01 #185Topic: APPENDIX
186.(p. 23)
In Figure 1.9, the slope of the line between Points L and M is:
A. 1.20.B. 0.80.C. 0.75.D. 0.67.
AACSB: ReflectiveBT: ApplicationLearning Objective: 1-1Schiller - Chapter 01 #186Topic: APPENDIX
187.(p. 23)
In Figure 1.9, the slope of the line between Points K and L is:
A. 1.25.B. 0.80.C. 0.75.D. 0.60.
AACSB: ReflectiveBT: ApplicationLearning Objective: 1-1Schiller - Chapter 01 #187Topic: APPENDIX
117

Full file at http://testbanksinstant.eu/ Solution-Manual-for-The-Macro-Economy-Today---Schiller---11e188.(p. 23)
In Figure 1.9 the slope of the line is:
A. Greater at Point K than Point L.B. Equal to zero at all points.C. The same at Points J and K.D. Greater at Point M than Point L.
AACSB: ReflectiveBT: ApplicationLearning Objective: 1-1Schiller - Chapter 01 #188Topic: APPENDIX
189.(p. 23)
In Figure 1.9 the slope of the line is:
A. Between zero and 1 at all points and decreasing as you move from Point J toward Point M.B. Negative and increasing as you move from Point J toward Point M.C. Positive and decreasing as you move from Point J toward Point M.D. Positive and increasing as you move from Point J toward Point M.
AACSB: ReflectiveBT: ApplicationLearning Objective: 1-1Schiller - Chapter 01 #189Topic: APPENDIX
190.(p. 23)
The slope of a curve at any point is given by the formula, the:
A. Change in y coordinates between two points divided by the change in their x coordinates.B. Change in x coordinates between two points divided by the change in their y coordinates.C. Percentage change in y coordinates between two points divided by the percentage change in their x
coordinates.D. Percentage change in x coordinates between two points divided by the percentage change in their y
coordinates. AACSB: ReflectiveBT: ApplicationLearning Objective: 1-1Schiller - Chapter 01 #190
118

Full file at http://testbanksinstant.eu/ Solution-Manual-for-The-Macro-Economy-Today---Schiller---11e191.(p. 23)
A linear curve that slopes downward from left to right has a:
A. Negative slope.B. Positive slope.C. Slope that changes as you move along the curve.D. Slope of zero.
AACSB: ReflectiveBT: ApplicationLearning Objective: 1-1Schiller - Chapter 01 #191
192.(p. 24)
A linear curve can be distinguished by:
A. The continuous change in its slope.B. The same slope throughout the curve.C. The changing relationship between the two variables.D. A shift in the curve.
AACSB: ReflectiveBT: ApplicationLearning Objective: 1-1Schiller - Chapter 01 #192
193.(p. 24)
A linear curve with a positive slope:
A. Is drawn downward from left to right.B. Implies that there is a negative relationship between the two variables.C. Implies that there is a positive relationship between the two variables.D. Is drawn as a horizontal line.
AACSB: ReflectiveBT: ApplicationLearning Objective: 1-1Schiller - Chapter 01 #193
194.(p. 24)
When the relationship between two variables changes:
A. There is movement from one point on the curve to another point on the curve.B. The curve becomes linear.C. The entire curve shifts.D. All of the above.
AACSB: Reflective
119
Full file at http://testbanksinstant.eu/ Solution-Manual-for-The-Macro-Economy-Today---Schiller---11eBT: ApplicationLearning Objective: 1-1Schiller - Chapter 01 #194
195.(p. 4)
Goods are not scarce in the United States since people drive nice cars and have plenty to eat. FALSE
AACSB: ReflectiveBT: ComprehensionLearning Objective: 1-1Schiller - Chapter 01 #195Topic: SCARCITY: THE CORE PROBLEM
196.(p. 4)
Scarcity results when available resources cannot satisfy all desired uses of those resources. TRUE
AACSB: ReflectiveBT: ComprehensionLearning Objective: 1-1Schiller - Chapter 01 #196Topic: SCARCITY: THE CORE PROBLEM
197.(p. 5)
Critics of government regulation argue that government interference in the marketplace stifles the animal spirits of entrepreneurship. TRUE
AACSB: ReflectiveBT: ComprehensionLearning Objective: 1-1Schiller - Chapter 01 #197Topic: SCARCITY: THE CORE PROBLEM
198.(p. 5)
Opportunity cost is a theoretical concept with no practical application. FALSE
AACSB: ReflectiveBT: ComprehensionLearning Objective: 1-1Schiller - Chapter 01 #198Topic: SCARCITY: THE CORE PROBLEM
199.(p. 5)
The economic choices we make today about the use of scarce resources will impact the economy in the future. TRUE
AACSB: ReflectiveBT: ComprehensionLearning Objective: 1-1Schiller - Chapter 01 #199
120
Full file at http://testbanksinstant.eu/ Solution-Manual-for-The-Macro-Economy-Today---Schiller---11eTopic: SCARCITY: THE CORE PROBLEM
200.(p. 5)
Every time we use scarce resources in one way, we give up the opportunity to use them in other ways. TRUE
AACSB: ReflectiveBT: ComprehensionLearning Objective: 1-1Schiller - Chapter 01 #200Topic: SCARCITY: THE CORE PROBLEM
201.(p. 5)
Opportunity costs only occur if the choices we make damage the environment. FALSE
AACSB: ReflectiveBT: ComprehensionLearning Objective: 1-1Schiller - Chapter 01 #201Topic: SCARCITY: THE CORE PROBLEM
202.(p. 10)
All output combinations that lie outside a production-possibilities curve are attainable with available resources and technology. FALSE
AACSB: ReflectiveBT: ComprehensionLearning Objective: 1-1Schiller - Chapter 01 #202Topic: PRODUCTION POSSIBILITIES
203.(p. 10)
Output combinations that lie inside the production-possibilities curve are characterized by efficient use of resources. FALSE
AACSB: ReflectiveBT: ComprehensionLearning Objective: 1-1Schiller - Chapter 01 #203Topic: PRODUCTION POSSIBILITIES
204.(p. 10)
Efficiency in production means getting the most output possible from the available resources. TRUE
AACSB: AnalyticBT: KnowledgeLearning Objective: 1-1Schiller - Chapter 01 #204Topic: PRODUCTION POSSIBILITIES
121

Full file at http://testbanksinstant.eu/ Solution-Manual-for-The-Macro-Economy-Today---Schiller---11e205.(p. 10)
All of the choices on the production possibilities curve are equally desirable. FALSE
AACSB: ReflectiveBT: ComprehensionLearning Objective: 1-1Schiller - Chapter 01 #205Topic: PRODUCTION POSSIBILITIES
206.(p. 11)
If the economy is inside the production-possibilities curve, then more output can be produced using existing resources. TRUE
AACSB: ReflectiveBT: ComprehensionLearning Objective: 1-1Schiller - Chapter 01 #206Topic: PRODUCTION POSSIBILITIES
207.(p. 11)
Technological advance shifts the production-possibilities curve inward. FALSE
AACSB: ReflectiveBT: ComprehensionLearning Objective: 1-1Schiller - Chapter 01 #207Topic: PRODUCTION POSSIBILITIES
208.(p. 12)
For a market economy, the decision about what to produce is made by the government. FALSE
AACSB: ReflectiveBT: ComprehensionLearning Objective: 1-1Schiller - Chapter 01 #208Topic: BASIC DECISIONS
209.(p. 11)
All economies must make decisions concerning what to produce, how to produce it, and for whom to produce. TRUE
AACSB: ReflectiveBT: ComprehensionLearning Objective: 1-1Schiller - Chapter 01 #209Topic: BASIC DECISIONS
122
Full file at http://testbanksinstant.eu/ Solution-Manual-for-The-Macro-Economy-Today---Schiller---11e210.(p. 13)
Adam Smith observed how government directives can lead to the best allocation of resources. FALSE
AACSB: ReflectiveBT: ComprehensionLearning Objective: 1-3Schiller - Chapter 01 #210Topic: THE MECHANISMS OF CHOICE
211.(p. 13)
Price signals direct the answers to the WHAT, HOW, and FOR WHOM questions in a laissez-faire economy. TRUE
AACSB: ReflectiveBT: ComprehensionLearning Objective: 1-3Schiller - Chapter 01 #211Topic: THE MECHANISMS OF CHOICE
212.(p. 12)
The essential feature of the market mechanism is the price signal. TRUE
AACSB: ReflectiveBT: ComprehensionLearning Objective: 1-3Schiller - Chapter 01 #212Topic: THE MECHANISMS OF CHOICE
213.(p. 15)
In the U.S. market system, the government gives the signals for deciding how to use the majority of the resources. FALSE
AACSB: ReflectiveBT: ComprehensionLearning Objective: 1-3Schiller - Chapter 01 #213Topic: THE MECHANISMS OF CHOICE
214.(p. 16)
In a market economy, if a factory pollutes the air, the situation is referred to as government failure. FALSE
AACSB: ReflectiveBT: ComprehensionLearning Objective: 1-3Schiller - Chapter 01 #214Topic: THE MECHANISMS OF CHOICE
123
Full file at http://testbanksinstant.eu/ Solution-Manual-for-The-Macro-Economy-Today---Schiller---11e215.(p. 16)
Government failure occurs when government intervention fails to improve economic outcomes. TRUE
AACSB: ReflectiveBT: ComprehensionLearning Objective: 1-3Schiller - Chapter 01 #215Topic: THE MECHANISMS OF CHOICE
216.(p. 16)
Economists formulate an economy's objectives. FALSE
AACSB: ReflectiveBT: ComprehensionLearning Objective: 1-3Schiller - Chapter 01 #216Topic: WHAT ECONOMICS IS ALL ABOUT
217.(p. 17)
Macroeconomics addresses the economy as a whole. TRUE
AACSB: ReflectiveBT: ComprehensionLearning Objective: 1-3Schiller - Chapter 01 #217Topic: WHAT ECONOMICS IS ALL ABOUT
218.(p. 17)
Microeconomics is concerned with individual performance as well as the economy as a whole. FALSE
AACSB: ReflectiveBT: ComprehensionLearning Objective: 1-3Schiller - Chapter 01 #218Topic: WHAT ECONOMICS IS ALL ABOUT
219.(p. 18)
The Latin phrase ceteris paribus refers to holding other variables constant. TRUE
AACSB: AnalyticBT: KnowledgeLearning Objective: 1-3Schiller - Chapter 01 #219Topic: WHAT ECONOMICS IS ALL ABOUT
124
Full file at http://testbanksinstant.eu/ Solution-Manual-for-The-Macro-Economy-Today---Schiller---11e220.(p. 23)
To calculate the slope of a line, find the vertical distance between two points and divide it by the horizontal distance between the same two points. TRUE
AACSB: AnalyticBT: KnowledgeLearning Objective: 1-1Schiller - Chapter 01 #220Topic: APPENDIX
221.(p. 23)
The slope of a production-possibilities curve is positive. FALSE
AACSB: ReflectiveBT: ComprehensionLearning Objective: 1-1Schiller - Chapter 01 #221Topic: APPENDIX
222.(p. 23)
When a curve shifts, the underlying relationship between the two variables shown on the graph has changed. TRUE
AACSB: ReflectiveBT: ComprehensionLearning Objective: 1-1Schiller - Chapter 01 #222Topic: APPENDIX
223.(p. 5)
Explain why an economist would say "There is no such thing as a free lunch."
All resources are scarce. Any time a scarce resource is used in one way, the opportunity to use the resource in other ways is given up. The resources used to produce a "free lunch" could have been used to produce other goods and/or services so an opportunity cost is incurred.
AACSB: ReflectiveBT: AnalysisLearning Objective: 1-1Schiller - Chapter 01 #223
125

Full file at http://testbanksinstant.eu/ Solution-Manual-for-The-Macro-Economy-Today---Schiller---11e224.(p. 7)
Describe the shape of the typical production-possibilities curve and explain why it has this shape.
The typical production-possibilities curve bends or bows outward. It has this shape because opportunity costs increase as society produces more of a good. In order to get more of a particular good, increasing quantities of other goods must be given up. This is known as the law of increasing opportunity costs.
AACSB: ReflectiveBT: ComprehensionLearning Objective: 1-1Schiller - Chapter 01 #224
225.(p. 8)
Why do opportunity costs increase as society produces more of a good?
As society produces more of a good, ever-increasing quantities of other goods and services must be sacrificed or given up. This occurs mostly because there is difficulty experienced in moving resources from one industry to another. The mix of factor inputs also has an impact and may restrict output capabilities.
AACSB: ReflectiveBT: ComprehensionLearning Objective: 1-1Schiller - Chapter 01 #225
226.(p. 11)
Explain the concept of inefficiency in terms of a production possibilities curve.
A production-possibilities curve shows potential output using all available resources and technology. If an economy does not use all the resources or technology available to it, then it will produce inside the production-possibilities curve. This incomplete use of resources and/or technology is referred to as inefficiency.
AACSB: ReflectiveBT: ComprehensionLearning Objective: 1-1Schiller - Chapter 01 #226
126
Full file at http://testbanksinstant.eu/ Solution-Manual-for-The-Macro-Economy-Today---Schiller---11e227.(p. 17)
Explain the difference between macroeconomics and microeconomics. Give examples of each.
Macroeconomics focuses on aggregate economic behavior. Full employment, price stability and economic growth are macroeconomic issues. Microeconomics is concerned with the smaller components that actually contribute to the macroeconomy such as individuals, particular business firms and industries, and government agencies.
AACSB: ReflectiveBT: ComprehensionLearning Objective: 1-1Schiller - Chapter 01 #227
228.(p. 13)
How does the market mechanism answer the WHAT, HOW, and FOR WHOM questions?
The market mechanism answers the WHAT question through the indirect interactions of producers and consumers. Market prices and sales signal the desired output. Producers desire to maximize profits and look for the least-cost method of production. This answers the HOW question. The market distributes output to the highest bidder and in doing so answers the FOR WHOM question.
AACSB: ReflectiveBT: ComprehensionLearning Objective: 1-1Schiller - Chapter 01 #228
127