Embed Size (px)
Citation preview
This document is not an API Standard; it is under consideration within an API technical committee but has not received all approvals required to become an API Standard. It shall not be reproduced or circulated or quoted, in whole or in part, outside of API committee activities except with the approval of the Chairman of the committee having jurisdiction and staff of the API Standards Dept. Copyright API. All rights reserved.
Manual of Petroleum Measurement Standards Chapter 14—Natural Gas Fluids Measurement Section 13—Recommended Practice for Fuel Gas
Measurement and Meter Selection in Non-Custody
Applications FIRST EDITION, XXX 20XX

2 CHAPTER 14—NATURAL GAS MEASUREMENT
This document is not an API Standard; it is under consideration within an API technical committee but has not received all approvals required to become an API Standard. It shall not be reproduced or circulated or quoted, in whole or in part, outside of API committee activities except with the approval of the Chairman of the committee having jurisdiction and staff of the API Standards Dept. Copyright API. All rights reserved.
Foreword
Nothing contained in any API publication is to be construed as granting any right, by implication or otherwise, for the manufacture, sale, or use of any method, apparatus, or product covered by letters patent. Neither should anything contained in the publication be construed as insuring anyone against liability for infringement of letters patent.
Suggested revisions are invited and should be submitted to the Standards Department, API, 1220 L Street, NW, Washington, DC 20005, [email protected].
FUEL GAS MEASUREMENT 3
This document is not an API Standard; it is under consideration within an API technical committee but has not received all approvals required to become an API Standard. It shall not be reproduced or circulated or quoted, in whole or in part, outside of API committee activities except with the approval of the Chairman of the committee having jurisdiction and staff of the API Standards Dept. Copyright API. All rights reserved.
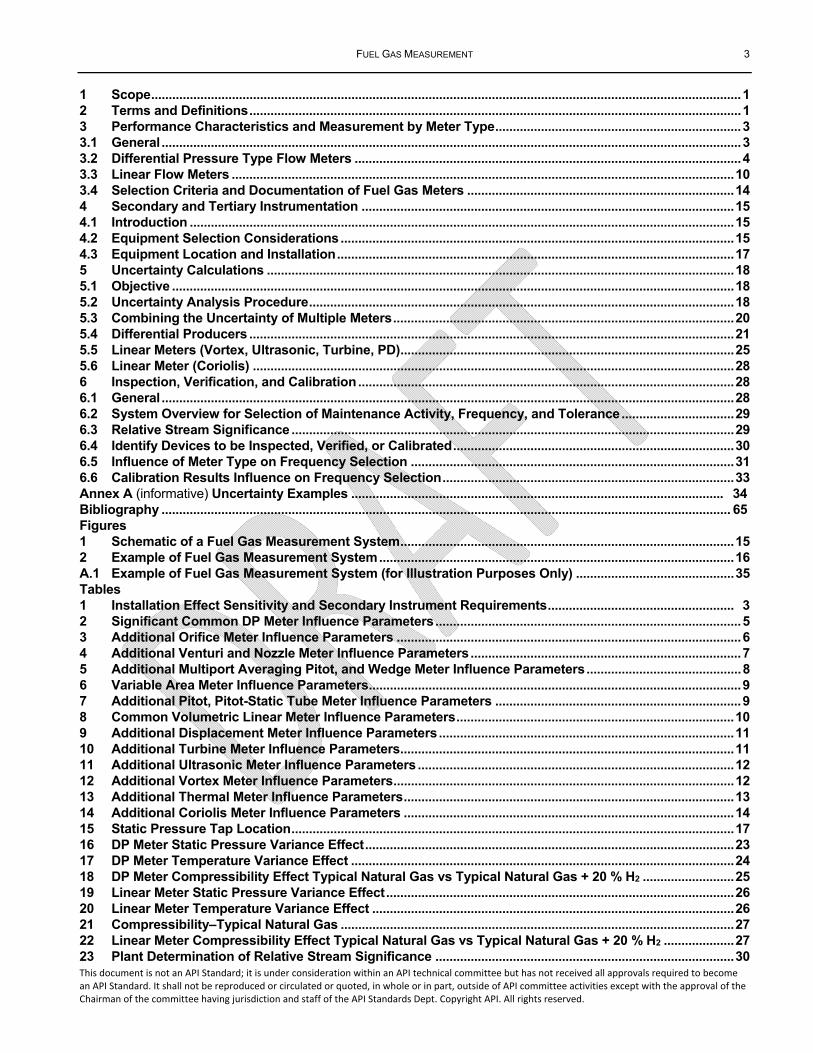
1 Scope ........................................................................................................................................................................ 1 2 Terms and Definitions ............................................................................................................................................ 1 3 Performance Characteristics and Measurement by Meter Type ...................................................................... 3 3.1 General ..................................................................................................................................................................... 3 3.2 Differential Pressure Type Flow Meters .............................................................................................................. 4 3.3 Linear Flow Meters ............................................................................................................................................... 10 3.4 Selection Criteria and Documentation of Fuel Gas Meters ............................................................................ 14 4 Secondary and Tertiary Instrumentation .......................................................................................................... 15 4.1 Introduction ........................................................................................................................................................... 15 4.2 Equipment Selection Considerations ................................................................................................................ 15 4.3 Equipment Location and Installation ................................................................................................................. 17 5 Uncertainty Calculations ..................................................................................................................................... 18 5.1 Objective ................................................................................................................................................................ 18 5.2 Uncertainty Analysis Procedure ......................................................................................................................... 18 5.3 Combining the Uncertainty of Multiple Meters ................................................................................................. 20 5.4 Differential Producers .......................................................................................................................................... 21 5.5 Linear Meters (Vortex, Ultrasonic, Turbine, PD) ............................................................................................... 25 5.6 Linear Meter (Coriolis) ......................................................................................................................................... 28 6 Inspection, Verification, and Calibration ........................................................................................................... 28 6.1 General ................................................................................................................................................................... 28 6.2 System Overview for Selection of Maintenance Activity, Frequency, and Tolerance ................................ 29 6.3 Relative Stream Significance .............................................................................................................................. 29 6.4 Identify Devices to be Inspected, Verified, or Calibrated ................................................................................ 30 6.5 Influence of Meter Type on Frequency Selection ............................................................................................ 31 6.6 Calibration Results Influence on Frequency Selection ................................................................................... 33 Annex A (informative) Uncertainty Examples .......................................................................................................... 34 Bibliography .................................................................................................................................................................. 65 Figures 1 Schematic of a Fuel Gas Measurement System ............................................................................................... 15 2 Example of Fuel Gas Measurement System ..................................................................................................... 16 A.1 Example of Fuel Gas Measurement System (for Illustration Purposes Only) ............................................. 35 Tables 1 Installation Effect Sensitivity and Secondary Instrument Requirements ..................................................... 3 2 Significant Common DP Meter Influence Parameters ....................................................................................... 5 3 Additional Orifice Meter Influence Parameters .................................................................................................. 6 4 Additional Venturi and Nozzle Meter Influence Parameters ............................................................................. 7 5 Additional Multiport Averaging Pitot, and Wedge Meter Influence Parameters ............................................ 8 6 Variable Area Meter Influence Parameters .......................................................................................................... 9 7 Additional Pitot, Pitot-Static Tube Meter Influence Parameters ...................................................................... 9 8 Common Volumetric Linear Meter Influence Parameters ............................................................................... 10 9 Additional Displacement Meter Influence Parameters .................................................................................... 11 10 Additional Turbine Meter Influence Parameters............................................................................................... 11 11 Additional Ultrasonic Meter Influence Parameters .......................................................................................... 12 12 Additional Vortex Meter Influence Parameters ................................................................................................. 12 13 Additional Thermal Meter Influence Parameters .............................................................................................. 13 14 Additional Coriolis Meter Influence Parameters .............................................................................................. 14 15 Static Pressure Tap Location .............................................................................................................................. 17 16 DP Meter Static Pressure Variance Effect ......................................................................................................... 23 17 DP Meter Temperature Variance Effect ............................................................................................................. 24 18 DP Meter Compressibility Effect Typical Natural Gas vs Typical Natural Gas + 20 % H2 .......................... 25 19 Linear Meter Static Pressure Variance Effect ................................................................................................... 26 20 Linear Meter Temperature Variance Effect ....................................................................................................... 26 21 Compressibility–Typical Natural Gas ................................................................................................................ 27 22 Linear Meter Compressibility Effect Typical Natural Gas vs Typical Natural Gas + 20 % H2 .................... 27 23 Plant Determination of Relative Stream Significance ..................................................................................... 30

4 CHAPTER 14—NATURAL GAS MEASUREMENT
This document is not an API Standard; it is under consideration within an API technical committee but has not received all approvals required to become an API Standard. It shall not be reproduced or circulated or quoted, in whole or in part, outside of API committee activities except with the approval of the Chairman of the committee having jurisdiction and staff of the API Standards Dept. Copyright API. All rights reserved.
24 Inspection, Verification, and Calibration Summary ......................................................................................... 31 25 Meter Station F101: Initial Calibration Program ............................................................................................... 32 26 Meter Station F101: Revised Calibration Program ........................................................................................... 33 A.1 Instrumentation on Meter Types ...................................................................................................................... 34
FUEL GAS MEASUREMENT 5
This document is not an API Standard; it is under consideration within an API technical committee but has not received all approvals required to become an API Standard. It shall not be reproduced or circulated or quoted, in whole or in part, outside of API committee activities except with the approval of the Chairman of the committee having jurisdiction and staff of the API Standards Dept. Copyright API. All rights reserved.
Introduction
This document provides a performance-based methodology for gas measurement and reporting. Specifically, considerations are provided for measurement device selection, installation, maintenance, calibration and documentation to achieve the targeted performance in terms of availability and uncertainty. If the performance of any installed measurement device is determined not to be in compliance with an acceptable level of uncertainty, the measurement device, its installation, or maintenance practices, etc. can be upgraded. The emphasis of this document focuses on fuel gas measurement in a non-custody application. Techniques are described to assess the uncertainty contribution of individual components of fuel gas measurement systems and the overall facility fuel gas measurement uncertainty. By following the guidance and calculation procedures of this document, cost effective fuel gas measurements of appropriate quality can be achieved. For this document, a fuel gas system in a facility could be comprised of multiple fuel gas meters or a single meter.
This document addresses the more common fuel gas measurement devices. This does not advocate the use of these devices or preclude the utilization of other types of devices, provided the targeted performance is achieved.
This document includes a brief description of the working principles of different types of fuel gas meters and their influence parameters, installation recommendations, a uniform method to ascertain the measurement uncertainty, a recommended method to determine the frequency of maintenance, performance verification or calibration of the meter and secondary instruments, and other relevant and necessary information. These differing principles are inherent to the specific technology and apply in both non-custody as well as custody applications. The selection methodology is applicable to a gas measurement application. The reader should consult other applicable API standards which may contain more stringent requirements when employing any measurement device for custody measurement applications.
Fuel gas can be measured by different types of flow meters. The selection of a meter typically depends on several factors such as:
— desired accuracy for the application;
— desired accuracy verification capability (i.e. calibration, inspection, replacement);
— life expectancy;
— operating conditions and their variability—flow rate, pressure, temperature, gas composition/density, etc.;
— cost of initial installation;
— operational requirements;
— regulatory requirements.
Listed below are different flow meters that are typically installed to measure the fuel gas flows in the industry. The selection of the fuel gas meter by the user may include other types of meters not included in this list:
— differential-pressure or head-type flow meters;
— displacement flow meters;
— turbine flow meters;
— thermal dispersion flow meters;
— Coriolis force flow meters;
— ultrasonic flow meters;
— vortex flow meter.

6 CHAPTER 14—NATURAL GAS MEASUREMENT
This document is not an API Standard; it is under consideration within an API technical committee but has not received all approvals required to become an API Standard. It shall not be reproduced or circulated or quoted, in whole or in part, outside of API committee activities except with the approval of the Chairman of the committee having jurisdiction and staff of the API Standards Dept. Copyright API. All rights reserved.
FUEL GAS MEASUREMENT 7
This document is not an API Standard; it is under consideration within an API technical committee but has not received all approvals required to become an API Standard. It shall not be reproduced or circulated or quoted, in whole or in part, outside of API committee activities except with the approval of the Chairman of the committee having jurisdiction and staff of the API Standards Dept. Copyright API. All rights reserved.
Fuel Gas Measurement
1 Scope
This recommended practice provides guidance in the following areas to allow the user to achieve a targeted uncertainty of measurement:
— selection of flow meter type; differential pressure (DP), displacement, ultrasonic, Coriolis, vortex, turbine, thermal, and others;
— associated instrumentation for measuring fluid properties and flowing conditions, such as pressure and temperature transmitters, densitometers, gas chromatographs;
— obtaining and use of gas composition or other analytical data;
— design and installation requirements of the measurement system;
— inspection, verification and calibration practices of flow meters and their associated accessory instrumentation; and
— simplified uncertainty calculations with examples to illustrate the methodology.
2 Terms and Definitions
For the purposes of this document, the following definitions apply.
2.1 accuracy The ability of a measurement instrument to indicate values closely approximating the true value, within acceptable tolerances, of the quantity measured.
2.2 bias Any influence on a result that produces an incorrect approximation of the true value of the variable being measured. Bias is the result of a predictable systematic error.
2.3 calibration The process or procedure of adjusting an instrument so that its indication or registration is in satisfactorily close agreement, within acceptable tolerances, with a reference standard.
2.4 carbon content The fraction of carbon in the fluid expressed as percent by weight.
2.5 compensation The adjustment of the measured value to reference conditions (e.g. pressure compensation).
2.6 fuel gas Typically, a mixture of light hydrocarbon and other molecules (e.g. H2, N2) in a gaseous state that are consumed in operations. Fuel gas is often a mixture of recovered gaseous molecules from plant operations and purchased natural gas.
8 CHAPTER 14—NATURAL GAS MEASUREMENT
This document is not an API Standard; it is under consideration within an API technical committee but has not received all approvals required to become an API Standard. It shall not be reproduced or circulated or quoted, in whole or in part, outside of API committee activities except with the approval of the Chairman of the committee having jurisdiction and staff of the API Standards Dept. Copyright API. All rights reserved.
2.7 flowing density The density of the fluid at actual flowing temperature and pressure.
2.8 flowing compressibility The compressibility of the fluid at actual flowing temperature and pressure.
2.9 higher heating value The high or gross heat content of the fuel with the heat of vaporization included. The water is assumed to be in a liquid state.
2.10 influence parameter Any factor that impacts the performance of the measuring device, hence the uncertainty and accuracy of the measurement. Examples are process temperature, pressure, fluid composition, upstream straight length, etc.
2.11 inspection A visual assessment or mechanical activity (e.g. instrument lead line blow down or orifice plate cleanliness) that does not include comparison or adjustment to a reference standard.
2.12 metering or measurement system A combination of primary, secondary and/or tertiary measurement components necessary to determine the flow rate.
2.13 meter condition factor An estimate of additional uncertainty based on engineering judgment of the physical condition of the meter in lieu of the ability to inspect.
2.14 performance The response of a measurement device to influence parameters such as operating conditions, installation effects, and fluid properties.
2.15 range of uncertainty The range or interval within which the true value is expected to lie with a stated degree of confidence.
2.16 verification The process or procedure of comparing an instrument to a reference standard to ensure its indication or registration is in satisfactorily close agreement, without making an adjustment.
2.17 uncertainty Describes the range of deviation between a measured value and the true value, expressed as a percentage. For example, a device with an accuracy of 2 % would have an uncertainty of ±2 %.
FUEL GAS MEASUREMENT 9
This document is not an API Standard; it is under consideration within an API technical committee but has not received all approvals required to become an API Standard. It shall not be reproduced or circulated or quoted, in whole or in part, outside of API committee activities except with the approval of the Chairman of the committee having jurisdiction and staff of the API Standards Dept. Copyright API. All rights reserved.
3 Performance Characteristics and Measurement by Meter Type
3.1 General
The primary purpose of a fuel gas meter for any application is to measure the flow. The uncertainty of measurement depends on the measurement equipment selected for the application, proper installation of the equipment, the ability to inspect, verify, or calibrate the various measurement system components, and the frequency of those maintenance activities. The performance of the meter may also depend on the piping configuration and compensation for variability of operating pressure, temperature, and fluid composition. It is important to recognize individual influence parameters and their effect on the measurement. Since the principle of operation and differing influence parameters have varying degrees of influence by meter type, it is important to identify and define the significant influence factors for the meter to determine the total or combined measurement uncertainty. Gas measurement is based on single phase flow. At any point that multiphase flow exists, such as the inclusion of liquids from the gas source or a phase change inside the meter assembly, measurement accuracy will be compromised.
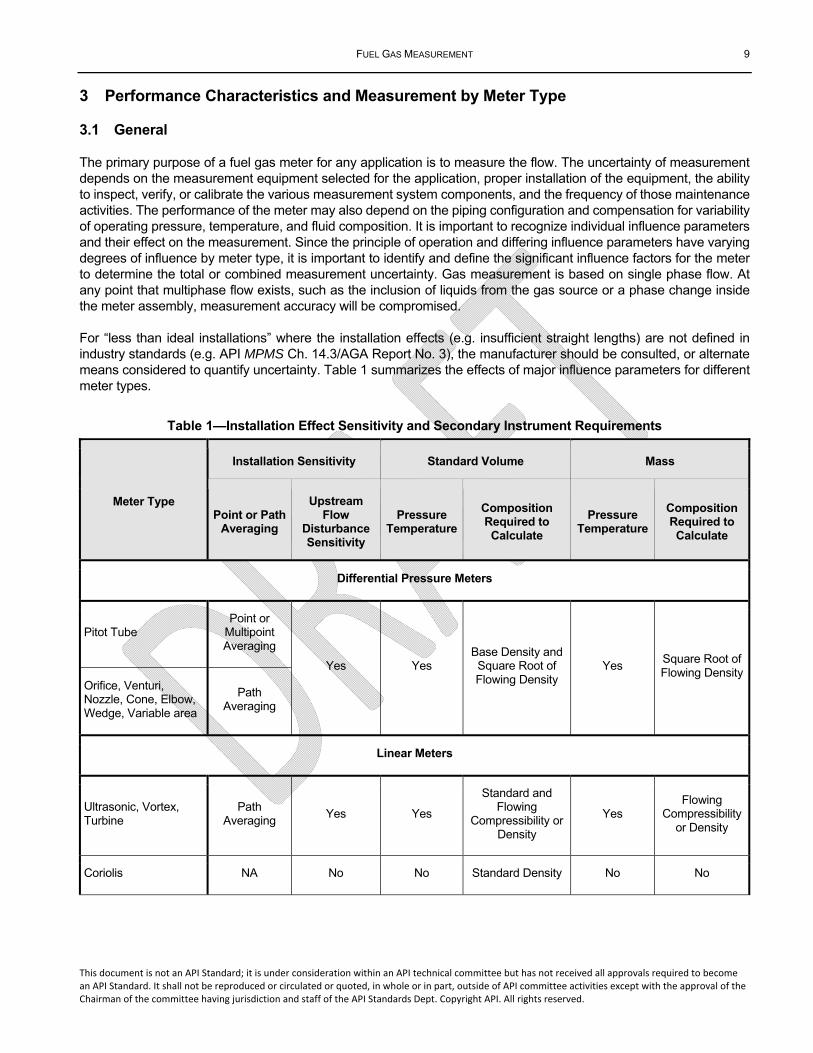
For “less than ideal installations” where the installation effects (e.g. insufficient straight lengths) are not defined in industry standards (e.g. API MPMS Ch. 14.3/AGA Report No. 3), the manufacturer should be consulted, or alternate means considered to quantify uncertainty. Table 1 summarizes the effects of major influence parameters for different meter types.
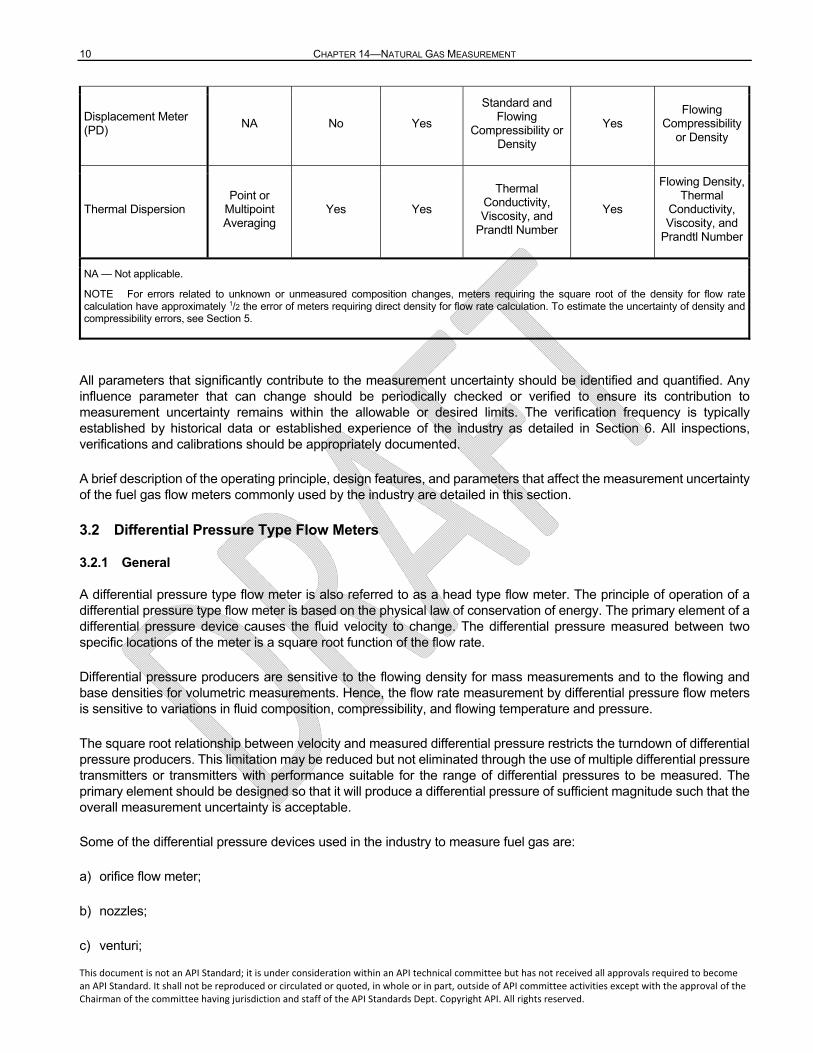
Table 1—Installation Effect Sensitivity and Secondary Instrument Requirements
Meter Type
Installation Sensitivity Standard Volume Mass
Point or Path Averaging
Upstream Flow
Disturbance Sensitivity
Pressure Temperature
Composition Required to Calculate
Pressure Temperature
Composition Required to Calculate
Differential Pressure Meters
Pitot Tube Point or
Multipoint Averaging
Yes Yes Base Density and Square Root of Flowing Density
Yes Square Root of Flowing Density
Orifice, Venturi, Nozzle, Cone, Elbow, Wedge, Variable area
Path Averaging
Linear Meters
Ultrasonic, Vortex, Turbine
Path Averaging
Yes Yes
Standard and Flowing
Compressibility or Density
Yes Flowing
Compressibility or Density
Coriolis NA No No Standard Density No No
10 CHAPTER 14—NATURAL GAS MEASUREMENT
This document is not an API Standard; it is under consideration within an API technical committee but has not received all approvals required to become an API Standard. It shall not be reproduced or circulated or quoted, in whole or in part, outside of API committee activities except with the approval of the Chairman of the committee having jurisdiction and staff of the API Standards Dept. Copyright API. All rights reserved.
Displacement Meter (PD)
NA No Yes
Standard and Flowing
Compressibility or Density
Yes Flowing
Compressibility or Density
Thermal Dispersion Point or
Multipoint Averaging
Yes Yes
Thermal Conductivity, Viscosity, and
Prandtl Number
Yes
Flowing Density, Thermal
Conductivity, Viscosity, and
Prandtl Number
NA — Not applicable.
NOTE For errors related to unknown or unmeasured composition changes, meters requiring the square root of the density for flow rate calculation have approximately 1/2 the error of meters requiring direct density for flow rate calculation. To estimate the uncertainty of density and compressibility errors, see Section 5.
All parameters that significantly contribute to the measurement uncertainty should be identified and quantified. Any influence parameter that can change should be periodically checked or verified to ensure its contribution to measurement uncertainty remains within the allowable or desired limits. The verification frequency is typically established by historical data or established experience of the industry as detailed in Section 6. All inspections, verifications and calibrations should be appropriately documented.
A brief description of the operating principle, design features, and parameters that affect the measurement uncertainty of the fuel gas flow meters commonly used by the industry are detailed in this section.
3.2 Differential Pressure Type Flow Meters
3.2.1 General
A differential pressure type flow meter is also referred to as a head type flow meter. The principle of operation of a differential pressure type flow meter is based on the physical law of conservation of energy. The primary element of a differential pressure device causes the fluid velocity to change. The differential pressure measured between two specific locations of the meter is a square root function of the flow rate.
Differential pressure producers are sensitive to the flowing density for mass measurements and to the flowing and base densities for volumetric measurements. Hence, the flow rate measurement by differential pressure flow meters is sensitive to variations in fluid composition, compressibility, and flowing temperature and pressure.
The square root relationship between velocity and measured differential pressure restricts the turndown of differential pressure producers. This limitation may be reduced but not eliminated through the use of multiple differential pressure transmitters or transmitters with performance suitable for the range of differential pressures to be measured. The primary element should be designed so that it will produce a differential pressure of sufficient magnitude such that the overall measurement uncertainty is acceptable.
Some of the differential pressure devices used in the industry to measure fuel gas are:
a) orifice flow meter;
b) nozzles;
c) venturi;
FUEL GAS MEASUREMENT 11
This document is not an API Standard; it is under consideration within an API technical committee but has not received all approvals required to become an API Standard. It shall not be reproduced or circulated or quoted, in whole or in part, outside of API committee activities except with the approval of the Chairman of the committee having jurisdiction and staff of the API Standards Dept. Copyright API. All rights reserved.
d) cone;
e) multiport averaging pitot;
f) wedge;
g) variable area meter;
h) pitot and pitot-static tube.
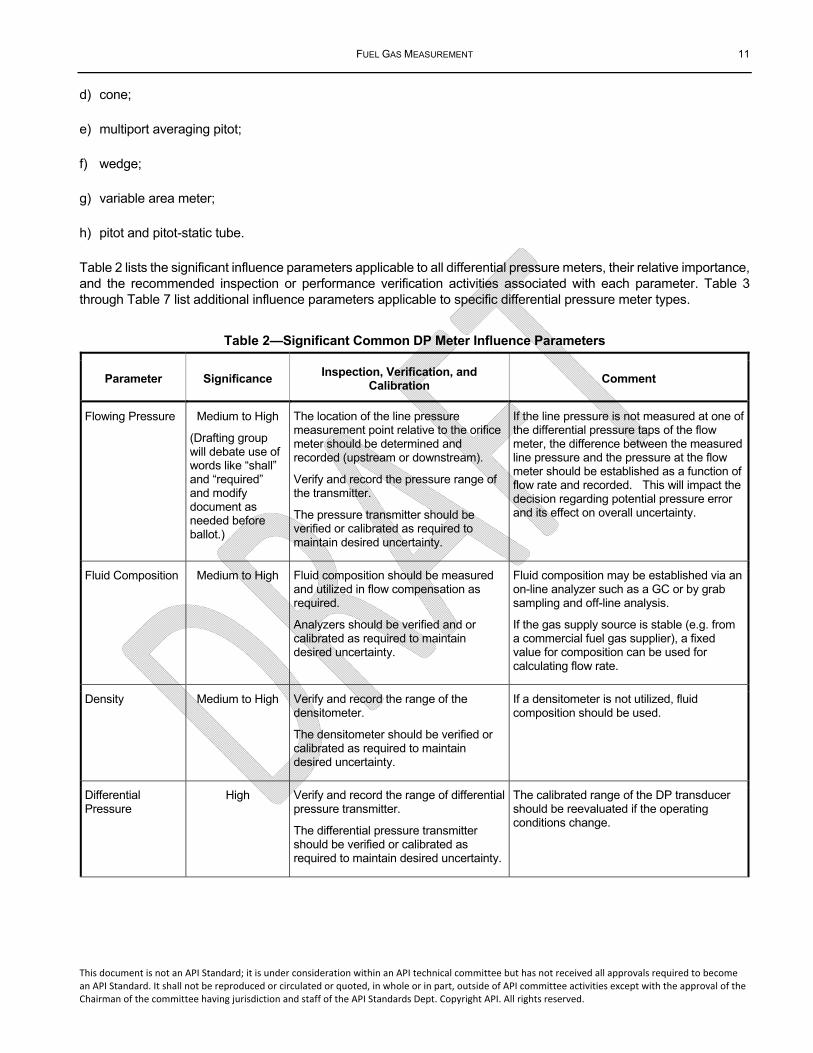
Table 2 lists the significant influence parameters applicable to all differential pressure meters, their relative importance, and the recommended inspection or performance verification activities associated with each parameter. Table 3 through Table 7 list additional influence parameters applicable to specific differential pressure meter types.
Table 2—Significant Common DP Meter Influence Parameters
Parameter Significance Inspection, Verification, and
Calibration Comment
Flowing Pressure Medium to High
(Drafting group will debate use of words like “shall” and “required” and modify document as needed before ballot.)
The location of the line pressure measurement point relative to the orifice meter should be determined and recorded (upstream or downstream).
Verify and record the pressure range of the transmitter.
The pressure transmitter should be verified or calibrated as required to maintain desired uncertainty.
If the line pressure is not measured at one of the differential pressure taps of the flow meter, the difference between the measured line pressure and the pressure at the flow meter should be established as a function of flow rate and recorded. This will impact the decision regarding potential pressure error and its effect on overall uncertainty.
Fluid Composition Medium to High Fluid composition should be measured and utilized in flow compensation as required.
Analyzers should be verified and or calibrated as required to maintain desired uncertainty.
Fluid composition may be established via an on-line analyzer such as a GC or by grab sampling and off-line analysis.
If the gas supply source is stable (e.g. from a commercial fuel gas supplier), a fixed value for composition can be used for calculating flow rate.
Density Medium to High Verify and record the range of the densitometer.
The densitometer should be verified or calibrated as required to maintain desired uncertainty.
If a densitometer is not utilized, fluid composition should be used.
Differential Pressure
High Verify and record the range of differential pressure transmitter.
The differential pressure transmitter should be verified or calibrated as required to maintain desired uncertainty.
The calibrated range of the DP transducer should be reevaluated if the operating conditions change.
12 CHAPTER 14—NATURAL GAS MEASUREMENT
This document is not an API Standard; it is under consideration within an API technical committee but has not received all approvals required to become an API Standard. It shall not be reproduced or circulated or quoted, in whole or in part, outside of API committee activities except with the approval of the Chairman of the committee having jurisdiction and staff of the API Standards Dept. Copyright API. All rights reserved.
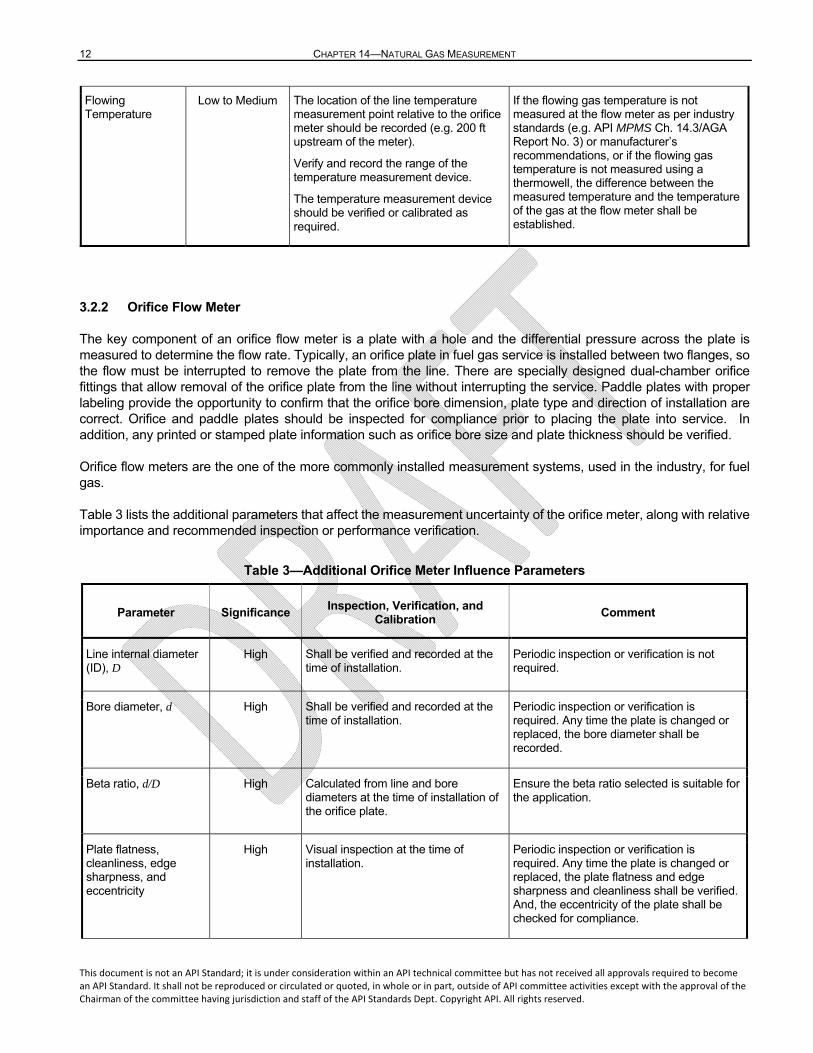
Flowing Temperature
Low to Medium The location of the line temperature measurement point relative to the orifice meter should be recorded (e.g. 200 ft upstream of the meter).
Verify and record the range of the temperature measurement device.
The temperature measurement device should be verified or calibrated as required.
If the flowing gas temperature is not measured at the flow meter as per industry standards (e.g. API MPMS Ch. 14.3/AGA Report No. 3) or manufacturer’s recommendations, or if the flowing gas temperature is not measured using a thermowell, the difference between the measured temperature and the temperature of the gas at the flow meter shall be established.
3.2.2 Orifice Flow Meter
The key component of an orifice flow meter is a plate with a hole and the differential pressure across the plate is measured to determine the flow rate. Typically, an orifice plate in fuel gas service is installed between two flanges, so the flow must be interrupted to remove the plate from the line. There are specially designed dual-chamber orifice fittings that allow removal of the orifice plate from the line without interrupting the service. Paddle plates with proper labeling provide the opportunity to confirm that the orifice bore dimension, plate type and direction of installation are correct. Orifice and paddle plates should be inspected for compliance prior to placing the plate into service. In addition, any printed or stamped plate information such as orifice bore size and plate thickness should be verified.
Orifice flow meters are the one of the more commonly installed measurement systems, used in the industry, for fuel gas.
Table 3 lists the additional parameters that affect the measurement uncertainty of the orifice meter, along with relative importance and recommended inspection or performance verification.
Table 3—Additional Orifice Meter Influence Parameters
Parameter Significance Inspection, Verification, and
Calibration Comment
Line internal diameter (ID), D
High Shall be verified and recorded at the time of installation.
Periodic inspection or verification is not required.
Bore diameter, d High Shall be verified and recorded at the time of installation.
Periodic inspection or verification is required. Any time the plate is changed or replaced, the bore diameter shall be recorded.
Beta ratio, d/D High Calculated from line and bore diameters at the time of installation of the orifice plate.
Ensure the beta ratio selected is suitable for the application.
Plate flatness, cleanliness, edge sharpness, and eccentricity
High Visual inspection at the time of installation.
Periodic inspection or verification is required. Any time the plate is changed or replaced, the plate flatness and edge sharpness and cleanliness shall be verified. And, the eccentricity of the plate shall be checked for compliance.
FUEL GAS MEASUREMENT 13
This document is not an API Standard; it is under consideration within an API technical committee but has not received all approvals required to become an API Standard. It shall not be reproduced or circulated or quoted, in whole or in part, outside of API committee activities except with the approval of the Chairman of the committee having jurisdiction and staff of the API Standards Dept. Copyright API. All rights reserved.
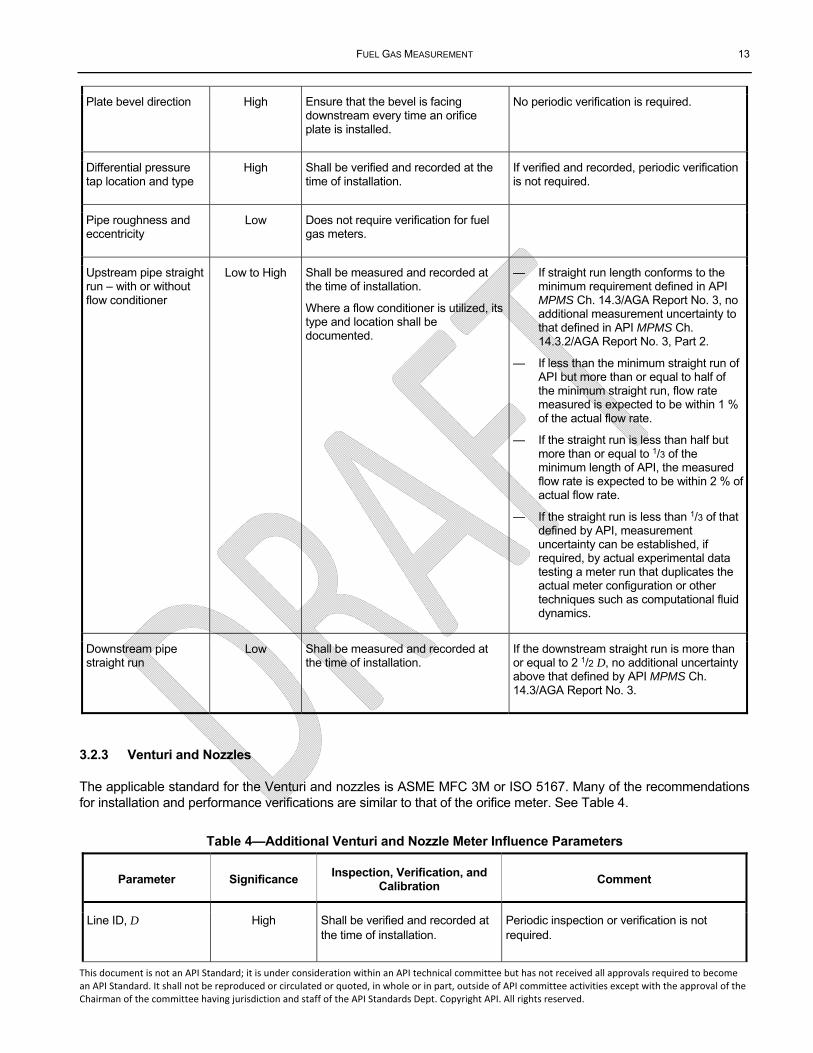
Plate bevel direction High Ensure that the bevel is facing downstream every time an orifice plate is installed.
No periodic verification is required.
Differential pressure tap location and type
High Shall be verified and recorded at the time of installation.
If verified and recorded, periodic verification is not required.
Pipe roughness and eccentricity
Low Does not require verification for fuel gas meters.
Upstream pipe straight run – with or without flow conditioner
Low to High Shall be measured and recorded at the time of installation.
Where a flow conditioner is utilized, its type and location shall be documented.
— If straight run length conforms to the minimum requirement defined in API MPMS Ch. 14.3/AGA Report No. 3, no additional measurement uncertainty to that defined in API MPMS Ch. 14.3.2/AGA Report No. 3, Part 2.
— If less than the minimum straight run of API but more than or equal to half of the minimum straight run, flow rate measured is expected to be within 1 % of the actual flow rate.
— If the straight run is less than half but more than or equal to 1/3 of the minimum length of API, the measured flow rate is expected to be within 2 % of actual flow rate.
— If the straight run is less than 1/3 of that defined by API, measurement uncertainty can be established, if required, by actual experimental data testing a meter run that duplicates the actual meter configuration or other techniques such as computational fluid dynamics.
Downstream pipe straight run
Low Shall be measured and recorded at the time of installation.
If the downstream straight run is more than or equal to 2 1/2 D, no additional uncertainty above that defined by API MPMS Ch. 14.3/AGA Report No. 3.
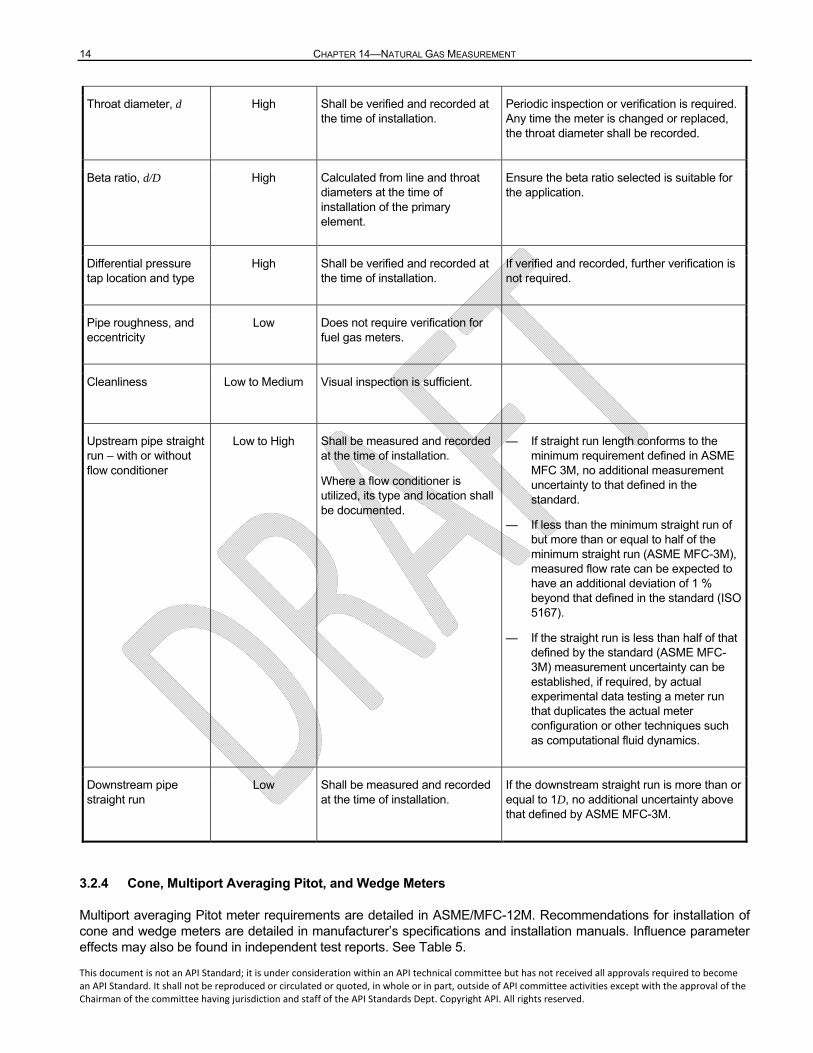
3.2.3 Venturi and Nozzles
The applicable standard for the Venturi and nozzles is ASME MFC 3M or ISO 5167. Many of the recommendations for installation and performance verifications are similar to that of the orifice meter. See Table 4.
Table 4—Additional Venturi and Nozzle Meter Influence Parameters
Parameter Significance Inspection, Verification, and
Calibration Comment
Line ID, D High Shall be verified and recorded at the time of installation.
Periodic inspection or verification is not required.
14 CHAPTER 14—NATURAL GAS MEASUREMENT
This document is not an API Standard; it is under consideration within an API technical committee but has not received all approvals required to become an API Standard. It shall not be reproduced or circulated or quoted, in whole or in part, outside of API committee activities except with the approval of the Chairman of the committee having jurisdiction and staff of the API Standards Dept. Copyright API. All rights reserved.
Throat diameter, d High Shall be verified and recorded at the time of installation.
Periodic inspection or verification is required. Any time the meter is changed or replaced, the throat diameter shall be recorded.
Beta ratio, d/D High Calculated from line and throat diameters at the time of installation of the primary element.
Ensure the beta ratio selected is suitable for the application.
Differential pressure tap location and type
High Shall be verified and recorded at the time of installation.
If verified and recorded, further verification is not required.
Pipe roughness, and eccentricity
Low Does not require verification for fuel gas meters.
Cleanliness Low to Medium Visual inspection is sufficient.
Upstream pipe straight run – with or without flow conditioner
Low to High Shall be measured and recorded at the time of installation.
Where a flow conditioner is utilized, its type and location shall be documented.
— If straight run length conforms to the minimum requirement defined in ASME MFC 3M, no additional measurement uncertainty to that defined in the standard.
— If less than the minimum straight run of but more than or equal to half of the minimum straight run (ASME MFC-3M), measured flow rate can be expected to have an additional deviation of 1 % beyond that defined in the standard (ISO 5167).
— If the straight run is less than half of that defined by the standard (ASME MFC-3M) measurement uncertainty can be established, if required, by actual experimental data testing a meter run that duplicates the actual meter configuration or other techniques such as computational fluid dynamics.
Downstream pipe straight run
Low Shall be measured and recorded at the time of installation.
If the downstream straight run is more than or equal to 1D, no additional uncertainty above that defined by ASME MFC-3M.
3.2.4 Cone, Multiport Averaging Pitot, and Wedge Meters
Multiport averaging Pitot meter requirements are detailed in ASME/MFC-12M. Recommendations for installation of cone and wedge meters are detailed in manufacturer’s specifications and installation manuals. Influence parameter effects may also be found in independent test reports. See Table 5.
FUEL GAS MEASUREMENT 15
This document is not an API Standard; it is under consideration within an API technical committee but has not received all approvals required to become an API Standard. It shall not be reproduced or circulated or quoted, in whole or in part, outside of API committee activities except with the approval of the Chairman of the committee having jurisdiction and staff of the API Standards Dept. Copyright API. All rights reserved.
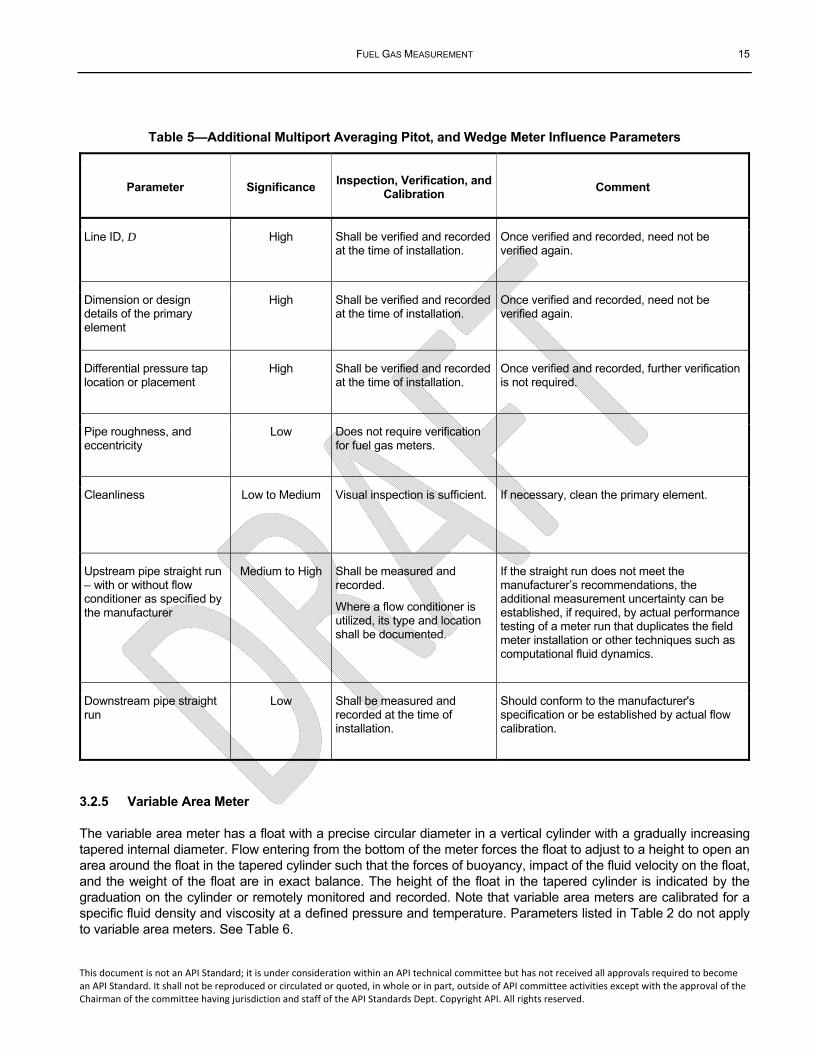
Table 5—Additional Multiport Averaging Pitot, and Wedge Meter Influence Parameters
Parameter Significance Inspection, Verification, and
Calibration Comment
Line ID, D High Shall be verified and recorded at the time of installation.
Once verified and recorded, need not be verified again.
Dimension or design details of the primary element
High Shall be verified and recorded at the time of installation.
Once verified and recorded, need not be verified again.
Differential pressure tap location or placement
High Shall be verified and recorded at the time of installation.
Once verified and recorded, further verification is not required.
Pipe roughness, and eccentricity
Low Does not require verification for fuel gas meters.
Cleanliness Low to Medium Visual inspection is sufficient. If necessary, clean the primary element.
Upstream pipe straight run – with or without flow conditioner as specified by the manufacturer
Medium to High Shall be measured and recorded.
Where a flow conditioner is utilized, its type and location shall be documented.
If the straight run does not meet the manufacturer’s recommendations, the additional measurement uncertainty can be established, if required, by actual performance testing of a meter run that duplicates the field meter installation or other techniques such as computational fluid dynamics.
Downstream pipe straight run
Low Shall be measured and recorded at the time of installation.
Should conform to the manufacturer's specification or be established by actual flow calibration.
3.2.5 Variable Area Meter
The variable area meter has a float with a precise circular diameter in a vertical cylinder with a gradually increasing tapered internal diameter. Flow entering from the bottom of the meter forces the float to adjust to a height to open an area around the float in the tapered cylinder such that the forces of buoyancy, impact of the fluid velocity on the float, and the weight of the float are in exact balance. The height of the float in the tapered cylinder is indicated by the graduation on the cylinder or remotely monitored and recorded. Note that variable area meters are calibrated for a specific fluid density and viscosity at a defined pressure and temperature. Parameters listed in Table 2 do not apply to variable area meters. See Table 6.
16 CHAPTER 14—NATURAL GAS MEASUREMENT
This document is not an API Standard; it is under consideration within an API technical committee but has not received all approvals required to become an API Standard. It shall not be reproduced or circulated or quoted, in whole or in part, outside of API committee activities except with the approval of the Chairman of the committee having jurisdiction and staff of the API Standards Dept. Copyright API. All rights reserved.
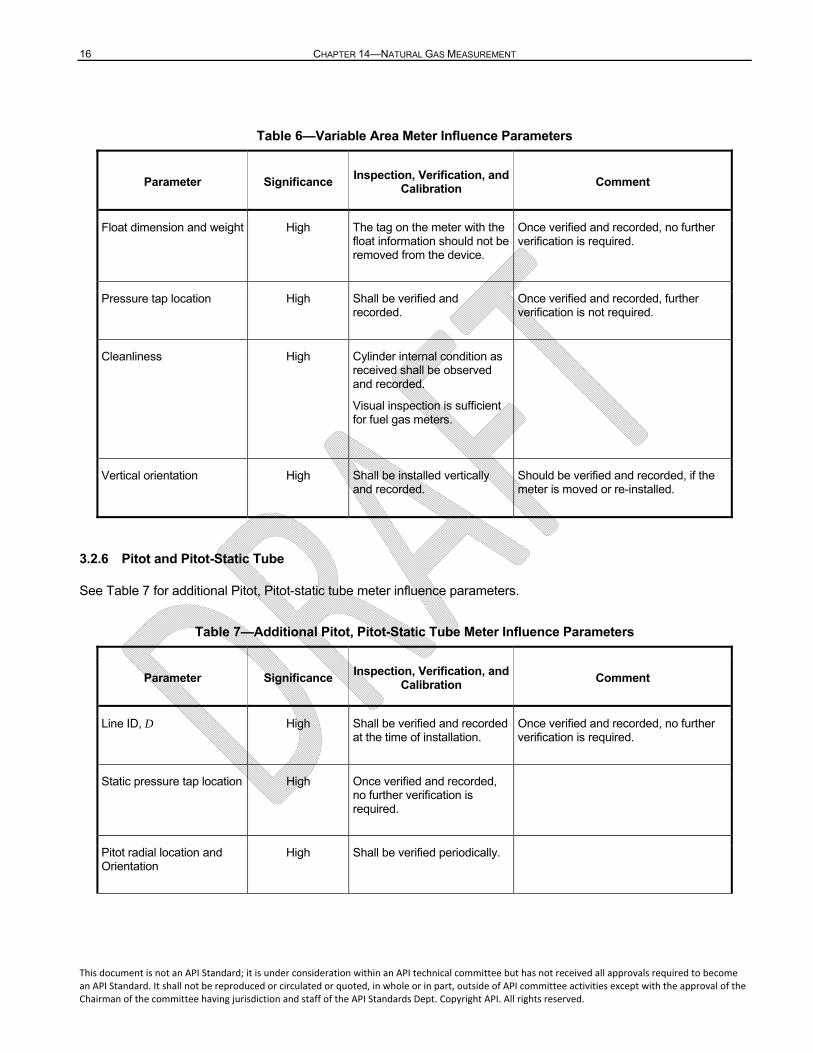
Table 6—Variable Area Meter Influence Parameters
Parameter Significance Inspection, Verification, and
Calibration Comment
Float dimension and weight High The tag on the meter with the float information should not be removed from the device.
Once verified and recorded, no further verification is required.
Pressure tap location High Shall be verified and recorded.
Once verified and recorded, further verification is not required.
Cleanliness High Cylinder internal condition as received shall be observed and recorded.
Visual inspection is sufficient for fuel gas meters.
Vertical orientation High Shall be installed vertically and recorded.
Should be verified and recorded, if the meter is moved or re-installed.
3.2.6 Pitot and Pitot-Static Tube
See Table 7 for additional Pitot, Pitot-static tube meter influence parameters.
Table 7—Additional Pitot, Pitot-Static Tube Meter Influence Parameters
Parameter Significance Inspection, Verification, and
Calibration Comment
Line ID, D High Shall be verified and recorded at the time of installation.
Once verified and recorded, no further verification is required.
Static pressure tap location High Once verified and recorded, no further verification is required.
Pitot radial location and Orientation
High Shall be verified periodically.
FUEL GAS MEASUREMENT 17
This document is not an API Standard; it is under consideration within an API technical committee but has not received all approvals required to become an API Standard. It shall not be reproduced or circulated or quoted, in whole or in part, outside of API committee activities except with the approval of the Chairman of the committee having jurisdiction and staff of the API Standards Dept. Copyright API. All rights reserved.
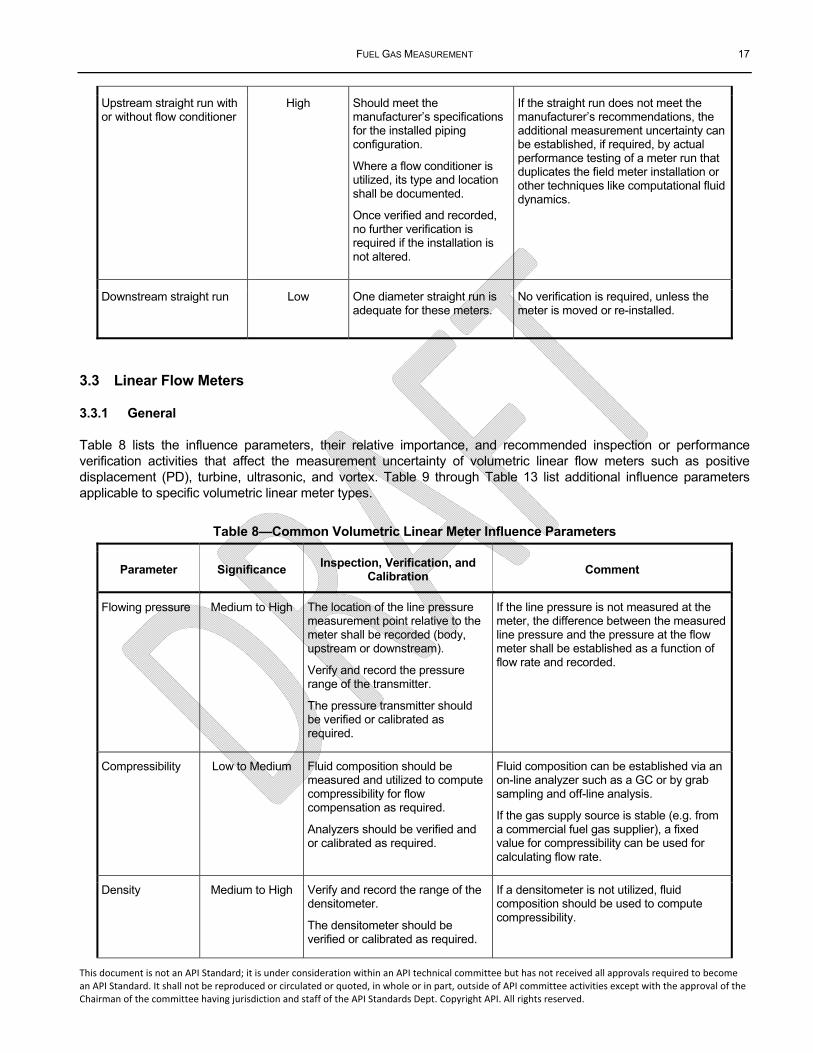
Upstream straight run with or without flow conditioner
High Should meet the manufacturer’s specifications for the installed piping configuration.
Where a flow conditioner is utilized, its type and location shall be documented.
Once verified and recorded, no further verification is required if the installation is not altered.
If the straight run does not meet the manufacturer’s recommendations, the additional measurement uncertainty can be established, if required, by actual performance testing of a meter run that duplicates the field meter installation or other techniques like computational fluid dynamics.
Downstream straight run Low One diameter straight run is adequate for these meters.
No verification is required, unless the meter is moved or re-installed.
3.3 Linear Flow Meters
3.3.1 General
Table 8 lists the influence parameters, their relative importance, and recommended inspection or performance verification activities that affect the measurement uncertainty of volumetric linear flow meters such as positive displacement (PD), turbine, ultrasonic, and vortex. Table 9 through Table 13 list additional influence parameters applicable to specific volumetric linear meter types.
Table 8—Common Volumetric Linear Meter Influence Parameters
Parameter Significance Inspection, Verification, and
Calibration Comment
Flowing pressure Medium to High The location of the line pressure measurement point relative to the meter shall be recorded (body, upstream or downstream).
Verify and record the pressure range of the transmitter.
The pressure transmitter should be verified or calibrated as required.
If the line pressure is not measured at the meter, the difference between the measured line pressure and the pressure at the flow meter shall be established as a function of flow rate and recorded.
Compressibility Low to Medium Fluid composition should be measured and utilized to compute compressibility for flow compensation as required.
Analyzers should be verified and or calibrated as required.
Fluid composition can be established via an on-line analyzer such as a GC or by grab sampling and off-line analysis.
If the gas supply source is stable (e.g. from a commercial fuel gas supplier), a fixed value for compressibility can be used for calculating flow rate.
Density Medium to High Verify and record the range of the densitometer.
The densitometer should be verified or calibrated as required.
If a densitometer is not utilized, fluid composition should be used to compute compressibility.
18 CHAPTER 14—NATURAL GAS MEASUREMENT
This document is not an API Standard; it is under consideration within an API technical committee but has not received all approvals required to become an API Standard. It shall not be reproduced or circulated or quoted, in whole or in part, outside of API committee activities except with the approval of the Chairman of the committee having jurisdiction and staff of the API Standards Dept. Copyright API. All rights reserved.
Flowing temperature
Low to Medium The location of the line temperature measurement point relative to the meter shall be recorded.
Verify and record the range of the temperature measurement device.
The temperature measurement device should be verified or calibrated as required.
If the flowing gas temperature is not measured at the flow meter as per industry standards, or if the flowing gas temperature is not measured using a thermowell, the difference between the measured temperature and the temperature of the gas at the flow meter shall be established.
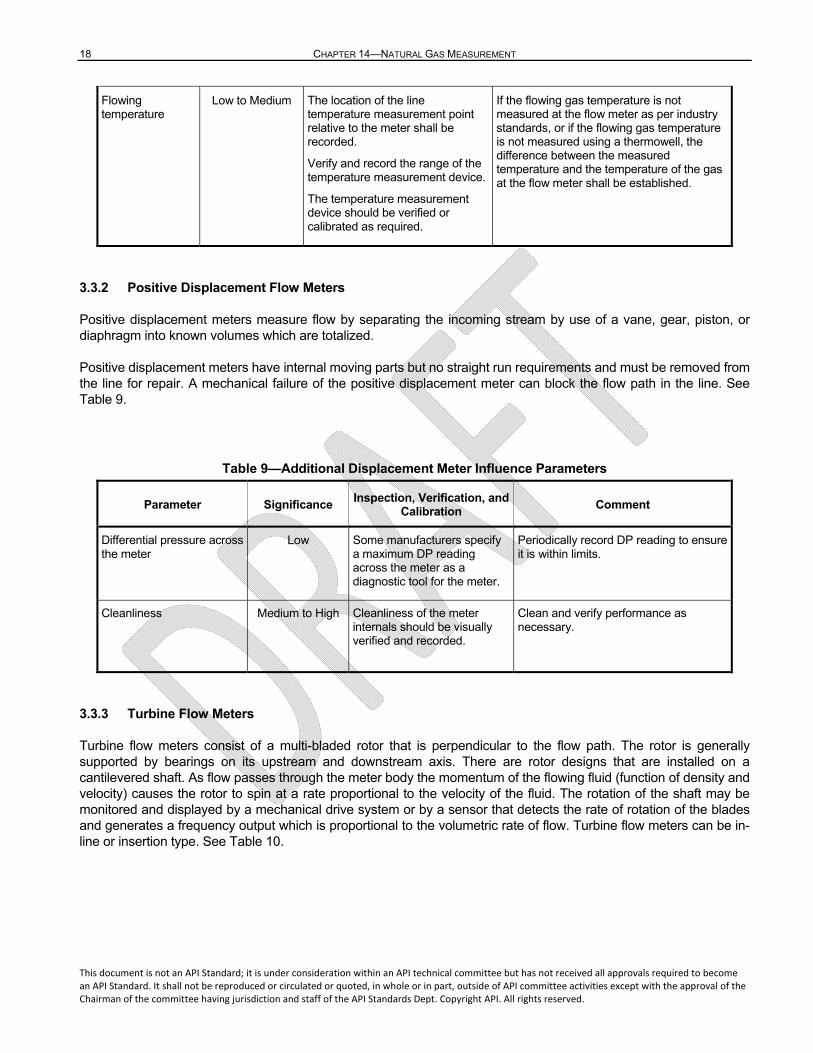
3.3.2 Positive Displacement Flow Meters
Positive displacement meters measure flow by separating the incoming stream by use of a vane, gear, piston, or diaphragm into known volumes which are totalized.
Positive displacement meters have internal moving parts but no straight run requirements and must be removed from the line for repair. A mechanical failure of the positive displacement meter can block the flow path in the line. See Table 9.
Table 9—Additional Displacement Meter Influence Parameters
Parameter Significance Inspection, Verification, and
Calibration Comment
Differential pressure across the meter
Low Some manufacturers specify a maximum DP reading across the meter as a diagnostic tool for the meter.
Periodically record DP reading to ensure it is within limits.
Cleanliness Medium to High Cleanliness of the meter internals should be visually verified and recorded.
Clean and verify performance as necessary.
3.3.3 Turbine Flow Meters
Turbine flow meters consist of a multi-bladed rotor that is perpendicular to the flow path. The rotor is generally supported by bearings on its upstream and downstream axis. There are rotor designs that are installed on a cantilevered shaft. As flow passes through the meter body the momentum of the flowing fluid (function of density and velocity) causes the rotor to spin at a rate proportional to the velocity of the fluid. The rotation of the shaft may be monitored and displayed by a mechanical drive system or by a sensor that detects the rate of rotation of the blades and generates a frequency output which is proportional to the volumetric rate of flow. Turbine flow meters can be in-line or insertion type. See Table 10.
FUEL GAS MEASUREMENT 19
This document is not an API Standard; it is under consideration within an API technical committee but has not received all approvals required to become an API Standard. It shall not be reproduced or circulated or quoted, in whole or in part, outside of API committee activities except with the approval of the Chairman of the committee having jurisdiction and staff of the API Standards Dept. Copyright API. All rights reserved.
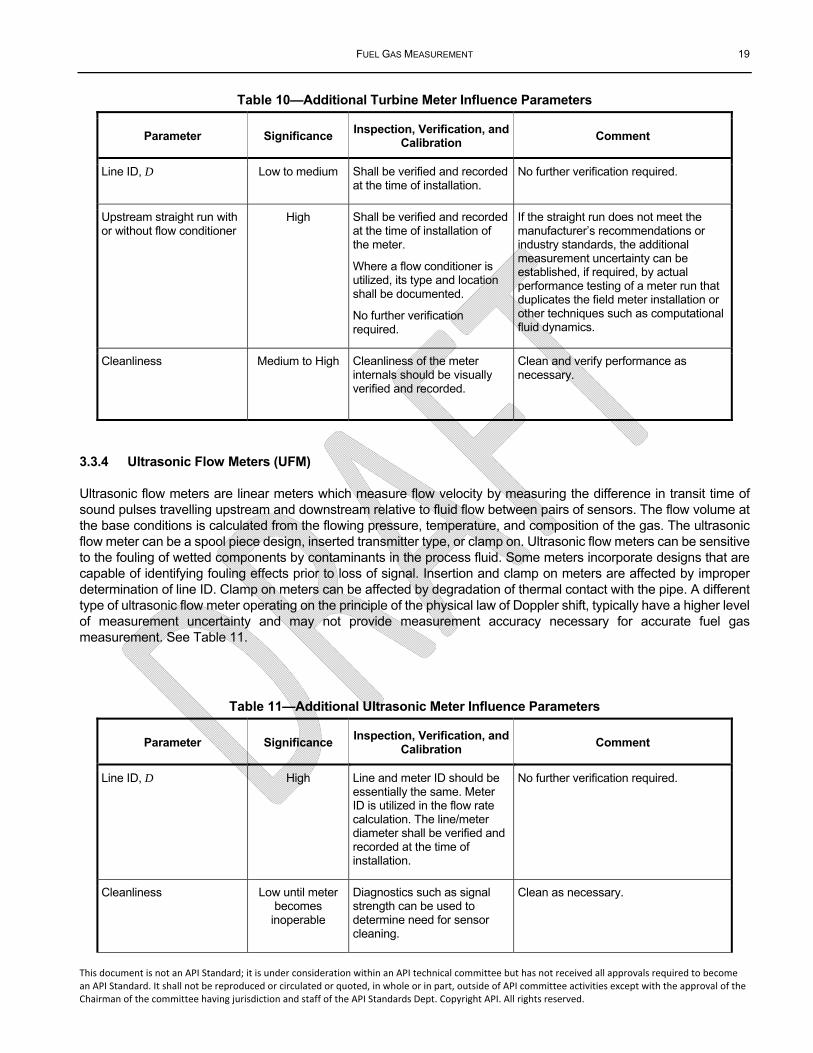
Table 10—Additional Turbine Meter Influence Parameters
Parameter Significance Inspection, Verification, and
Calibration Comment
Line ID, D Low to medium Shall be verified and recorded at the time of installation.
No further verification required.
Upstream straight run with or without flow conditioner
High Shall be verified and recorded at the time of installation of the meter.
Where a flow conditioner is utilized, its type and location shall be documented.
No further verification required.
If the straight run does not meet the manufacturer’s recommendations or industry standards, the additional measurement uncertainty can be established, if required, by actual performance testing of a meter run that duplicates the field meter installation or other techniques such as computational fluid dynamics.
Cleanliness Medium to High Cleanliness of the meter internals should be visually verified and recorded.
Clean and verify performance as necessary.
3.3.4 Ultrasonic Flow Meters (UFM)
Ultrasonic flow meters are linear meters which measure flow velocity by measuring the difference in transit time of sound pulses travelling upstream and downstream relative to fluid flow between pairs of sensors. The flow volume at the base conditions is calculated from the flowing pressure, temperature, and composition of the gas. The ultrasonic flow meter can be a spool piece design, inserted transmitter type, or clamp on. Ultrasonic flow meters can be sensitive to the fouling of wetted components by contaminants in the process fluid. Some meters incorporate designs that are capable of identifying fouling effects prior to loss of signal. Insertion and clamp on meters are affected by improper determination of line ID. Clamp on meters can be affected by degradation of thermal contact with the pipe. A different type of ultrasonic flow meter operating on the principle of the physical law of Doppler shift, typically have a higher level of measurement uncertainty and may not provide measurement accuracy necessary for accurate fuel gas measurement. See Table 11.
Table 11—Additional Ultrasonic Meter Influence Parameters
Parameter Significance Inspection, Verification, and
Calibration Comment
Line ID, D High Line and meter ID should be essentially the same. Meter ID is utilized in the flow rate calculation. The line/meter diameter shall be verified and recorded at the time of installation.
No further verification required.
Cleanliness Low until meter becomes
inoperable
Diagnostics such as signal strength can be used to determine need for sensor cleaning.
Clean as necessary.
20 CHAPTER 14—NATURAL GAS MEASUREMENT
This document is not an API Standard; it is under consideration within an API technical committee but has not received all approvals required to become an API Standard. It shall not be reproduced or circulated or quoted, in whole or in part, outside of API committee activities except with the approval of the Chairman of the committee having jurisdiction and staff of the API Standards Dept. Copyright API. All rights reserved.
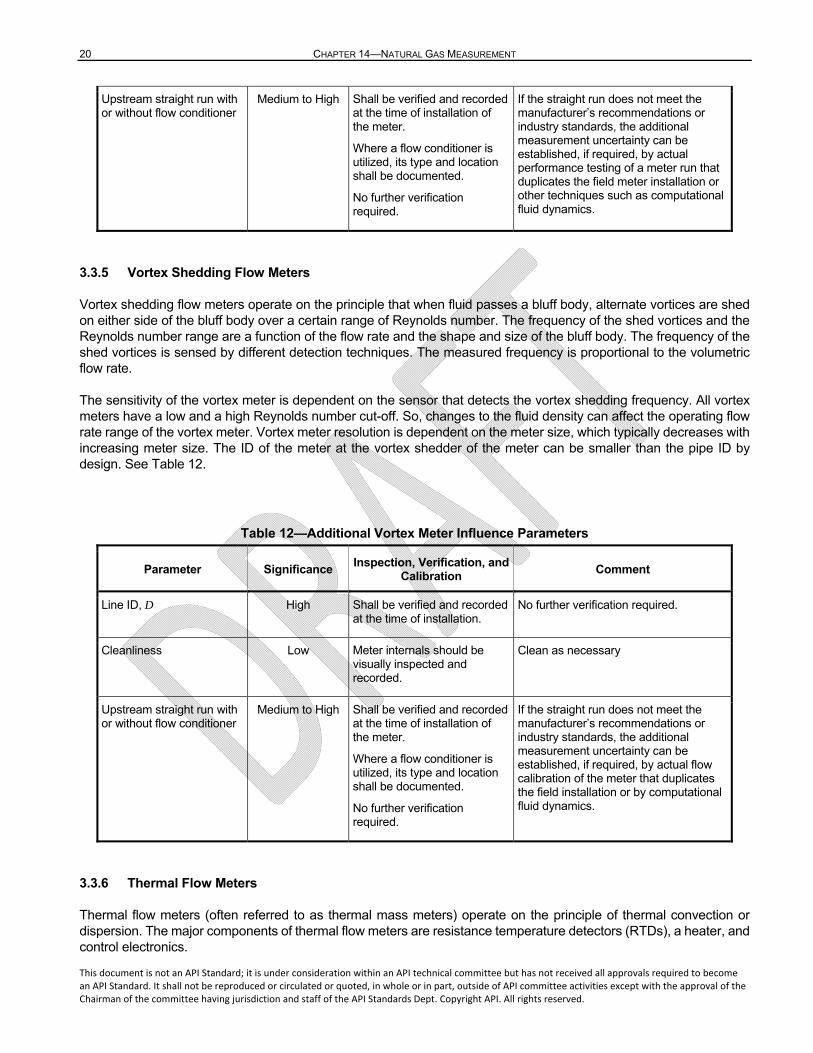
Upstream straight run with or without flow conditioner
Medium to High Shall be verified and recorded at the time of installation of the meter.
Where a flow conditioner is utilized, its type and location shall be documented.
No further verification required.
If the straight run does not meet the manufacturer’s recommendations or industry standards, the additional measurement uncertainty can be established, if required, by actual performance testing of a meter run that duplicates the field meter installation or other techniques such as computational fluid dynamics.
3.3.5 Vortex Shedding Flow Meters
Vortex shedding flow meters operate on the principle that when fluid passes a bluff body, alternate vortices are shed on either side of the bluff body over a certain range of Reynolds number. The frequency of the shed vortices and the Reynolds number range are a function of the flow rate and the shape and size of the bluff body. The frequency of the shed vortices is sensed by different detection techniques. The measured frequency is proportional to the volumetric flow rate.
The sensitivity of the vortex meter is dependent on the sensor that detects the vortex shedding frequency. All vortex meters have a low and a high Reynolds number cut-off. So, changes to the fluid density can affect the operating flow rate range of the vortex meter. Vortex meter resolution is dependent on the meter size, which typically decreases with increasing meter size. The ID of the meter at the vortex shedder of the meter can be smaller than the pipe ID by design. See Table 12.
Table 12—Additional Vortex Meter Influence Parameters
Parameter Significance Inspection, Verification, and
Calibration Comment
Line ID, D High Shall be verified and recorded at the time of installation.
No further verification required.
Cleanliness Low Meter internals should be visually inspected and recorded.
Clean as necessary
Upstream straight run with or without flow conditioner
Medium to High Shall be verified and recorded at the time of installation of the meter.
Where a flow conditioner is utilized, its type and location shall be documented.
No further verification required.
If the straight run does not meet the manufacturer’s recommendations or industry standards, the additional measurement uncertainty can be established, if required, by actual flow calibration of the meter that duplicates the field installation or by computational fluid dynamics.
3.3.6 Thermal Flow Meters
Thermal flow meters (often referred to as thermal mass meters) operate on the principle of thermal convection or dispersion. The major components of thermal flow meters are resistance temperature detectors (RTDs), a heater, and control electronics.
FUEL GAS MEASUREMENT 21
This document is not an API Standard; it is under consideration within an API technical committee but has not received all approvals required to become an API Standard. It shall not be reproduced or circulated or quoted, in whole or in part, outside of API committee activities except with the approval of the Chairman of the committee having jurisdiction and staff of the API Standards Dept. Copyright API. All rights reserved.
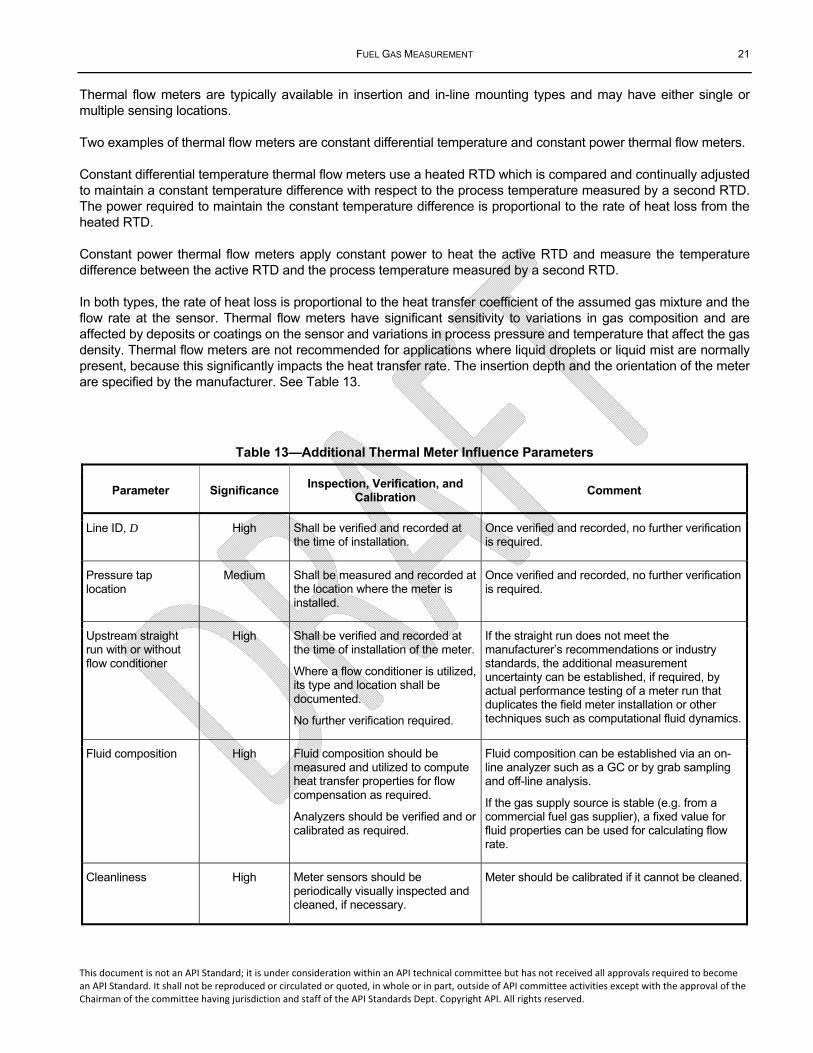
Thermal flow meters are typically available in insertion and in-line mounting types and may have either single or multiple sensing locations.
Two examples of thermal flow meters are constant differential temperature and constant power thermal flow meters.
Constant differential temperature thermal flow meters use a heated RTD which is compared and continually adjusted to maintain a constant temperature difference with respect to the process temperature measured by a second RTD. The power required to maintain the constant temperature difference is proportional to the rate of heat loss from the heated RTD.
Constant power thermal flow meters apply constant power to heat the active RTD and measure the temperature difference between the active RTD and the process temperature measured by a second RTD.
In both types, the rate of heat loss is proportional to the heat transfer coefficient of the assumed gas mixture and the flow rate at the sensor. Thermal flow meters have significant sensitivity to variations in gas composition and are affected by deposits or coatings on the sensor and variations in process pressure and temperature that affect the gas density. Thermal flow meters are not recommended for applications where liquid droplets or liquid mist are normally present, because this significantly impacts the heat transfer rate. The insertion depth and the orientation of the meter are specified by the manufacturer. See Table 13.
Table 13—Additional Thermal Meter Influence Parameters
Parameter Significance Inspection, Verification, and
Calibration Comment
Line ID, D High Shall be verified and recorded at the time of installation.
Once verified and recorded, no further verification is required.
Pressure tap location
Medium Shall be measured and recorded at the location where the meter is installed.
Once verified and recorded, no further verification is required.
Upstream straight run with or without flow conditioner
High Shall be verified and recorded at the time of installation of the meter.
Where a flow conditioner is utilized, its type and location shall be documented.
No further verification required.
If the straight run does not meet the manufacturer’s recommendations or industry standards, the additional measurement uncertainty can be established, if required, by actual performance testing of a meter run that duplicates the field meter installation or other techniques such as computational fluid dynamics.
Fluid composition High Fluid composition should be measured and utilized to compute heat transfer properties for flow compensation as required.
Analyzers should be verified and or calibrated as required.
Fluid composition can be established via an on-line analyzer such as a GC or by grab sampling and off-line analysis.
If the gas supply source is stable (e.g. from a commercial fuel gas supplier), a fixed value for fluid properties can be used for calculating flow rate.
Cleanliness High Meter sensors should be periodically visually inspected and cleaned, if necessary.
Meter should be calibrated if it cannot be cleaned.
22 CHAPTER 14—NATURAL GAS MEASUREMENT
This document is not an API Standard; it is under consideration within an API technical committee but has not received all approvals required to become an API Standard. It shall not be reproduced or circulated or quoted, in whole or in part, outside of API committee activities except with the approval of the Chairman of the committee having jurisdiction and staff of the API Standards Dept. Copyright API. All rights reserved.
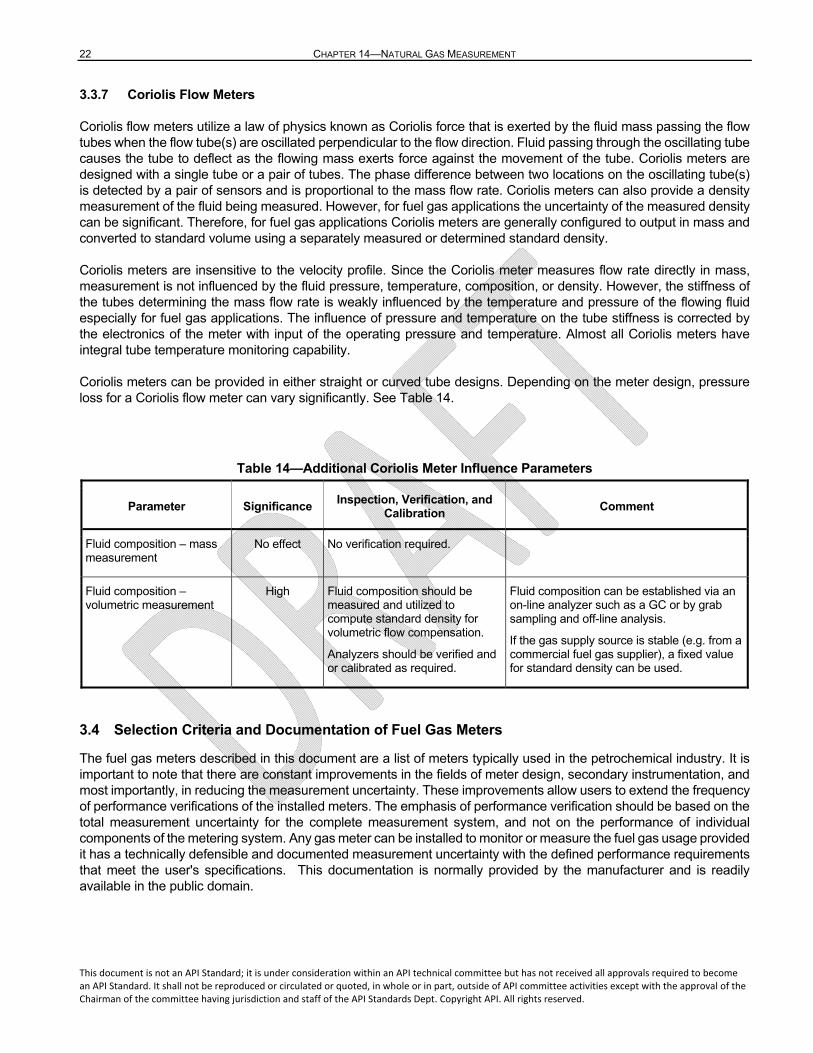
3.3.7 Coriolis Flow Meters
Coriolis flow meters utilize a law of physics known as Coriolis force that is exerted by the fluid mass passing the flow tubes when the flow tube(s) are oscillated perpendicular to the flow direction. Fluid passing through the oscillating tube causes the tube to deflect as the flowing mass exerts force against the movement of the tube. Coriolis meters are designed with a single tube or a pair of tubes. The phase difference between two locations on the oscillating tube(s) is detected by a pair of sensors and is proportional to the mass flow rate. Coriolis meters can also provide a density measurement of the fluid being measured. However, for fuel gas applications the uncertainty of the measured density can be significant. Therefore, for fuel gas applications Coriolis meters are generally configured to output in mass and converted to standard volume using a separately measured or determined standard density.
Coriolis meters are insensitive to the velocity profile. Since the Coriolis meter measures flow rate directly in mass, measurement is not influenced by the fluid pressure, temperature, composition, or density. However, the stiffness of the tubes determining the mass flow rate is weakly influenced by the temperature and pressure of the flowing fluid especially for fuel gas applications. The influence of pressure and temperature on the tube stiffness is corrected by the electronics of the meter with input of the operating pressure and temperature. Almost all Coriolis meters have integral tube temperature monitoring capability.
Coriolis meters can be provided in either straight or curved tube designs. Depending on the meter design, pressure loss for a Coriolis flow meter can vary significantly. See Table 14.
Table 14—Additional Coriolis Meter Influence Parameters
Parameter Significance Inspection, Verification, and
Calibration Comment
Fluid composition – mass measurement
No effect No verification required.
Fluid composition – volumetric measurement
High Fluid composition should be measured and utilized to compute standard density for volumetric flow compensation.
Analyzers should be verified and or calibrated as required.
Fluid composition can be established via an on-line analyzer such as a GC or by grab sampling and off-line analysis.
If the gas supply source is stable (e.g. from a commercial fuel gas supplier), a fixed value for standard density can be used.
3.4 Selection Criteria and Documentation of Fuel Gas Meters
The fuel gas meters described in this document are a list of meters typically used in the petrochemical industry. It is important to note that there are constant improvements in the fields of meter design, secondary instrumentation, and most importantly, in reducing the measurement uncertainty. These improvements allow users to extend the frequency of performance verifications of the installed meters. The emphasis of performance verification should be based on the total measurement uncertainty for the complete measurement system, and not on the performance of individual components of the metering system. Any gas meter can be installed to monitor or measure the fuel gas usage provided it has a technically defensible and documented measurement uncertainty with the defined performance requirements that meet the user's specifications. This documentation is normally provided by the manufacturer and is readily available in the public domain.
FUEL GAS MEASUREMENT 23
This document is not an API Standard; it is under consideration within an API technical committee but has not received all approvals required to become an API Standard. It shall not be reproduced or circulated or quoted, in whole or in part, outside of API committee activities except with the approval of the Chairman of the committee having jurisdiction and staff of the API Standards Dept. Copyright API. All rights reserved.
4 Secondary and Tertiary Instrumentation
4.1 Introduction
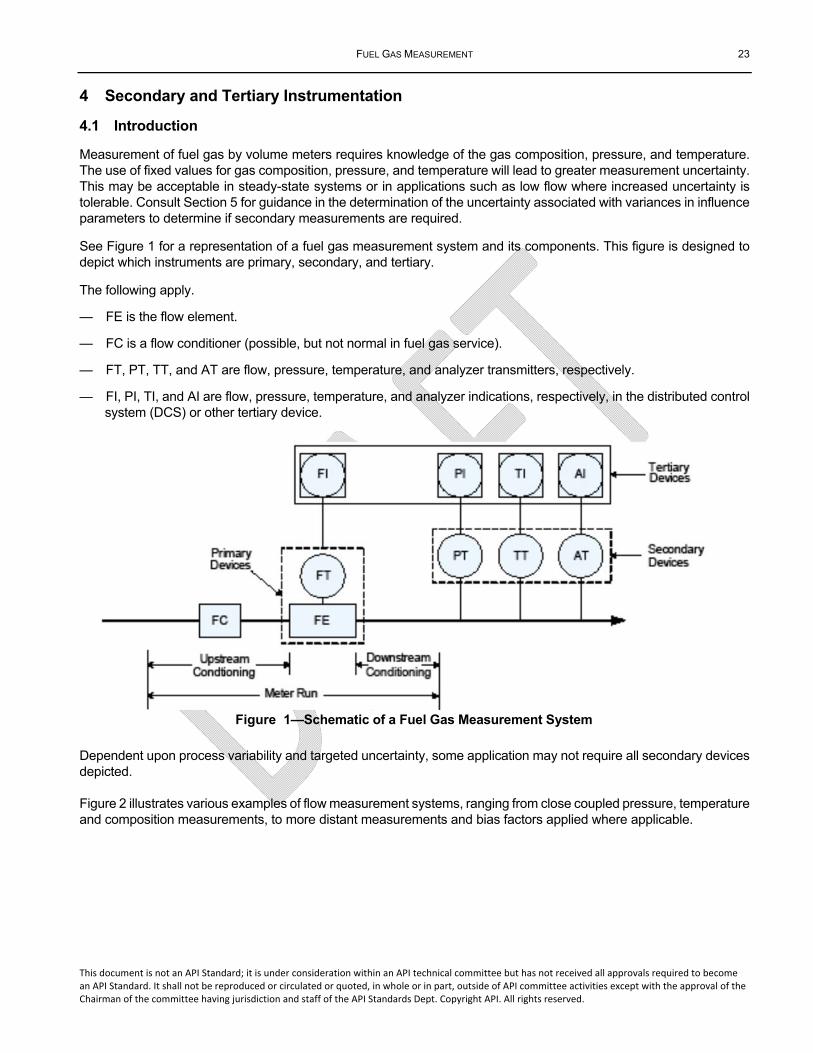
Measurement of fuel gas by volume meters requires knowledge of the gas composition, pressure, and temperature. The use of fixed values for gas composition, pressure, and temperature will lead to greater measurement uncertainty. This may be acceptable in steady-state systems or in applications such as low flow where increased uncertainty is tolerable. Consult Section 5 for guidance in the determination of the uncertainty associated with variances in influence parameters to determine if secondary measurements are required.
See Figure 1 for a representation of a fuel gas measurement system and its components. This figure is designed to depict which instruments are primary, secondary, and tertiary.
The following apply.
— FE is the flow element.
— FC is a flow conditioner (possible, but not normal in fuel gas service).
— FT, PT, TT, and AT are flow, pressure, temperature, and analyzer transmitters, respectively.
— FI, PI, TI, and AI are flow, pressure, temperature, and analyzer indications, respectively, in the distributed control system (DCS) or other tertiary device.
Figure 1—Schematic of a Fuel Gas Measurement System
Dependent upon process variability and targeted uncertainty, some application may not require all secondary devices depicted.
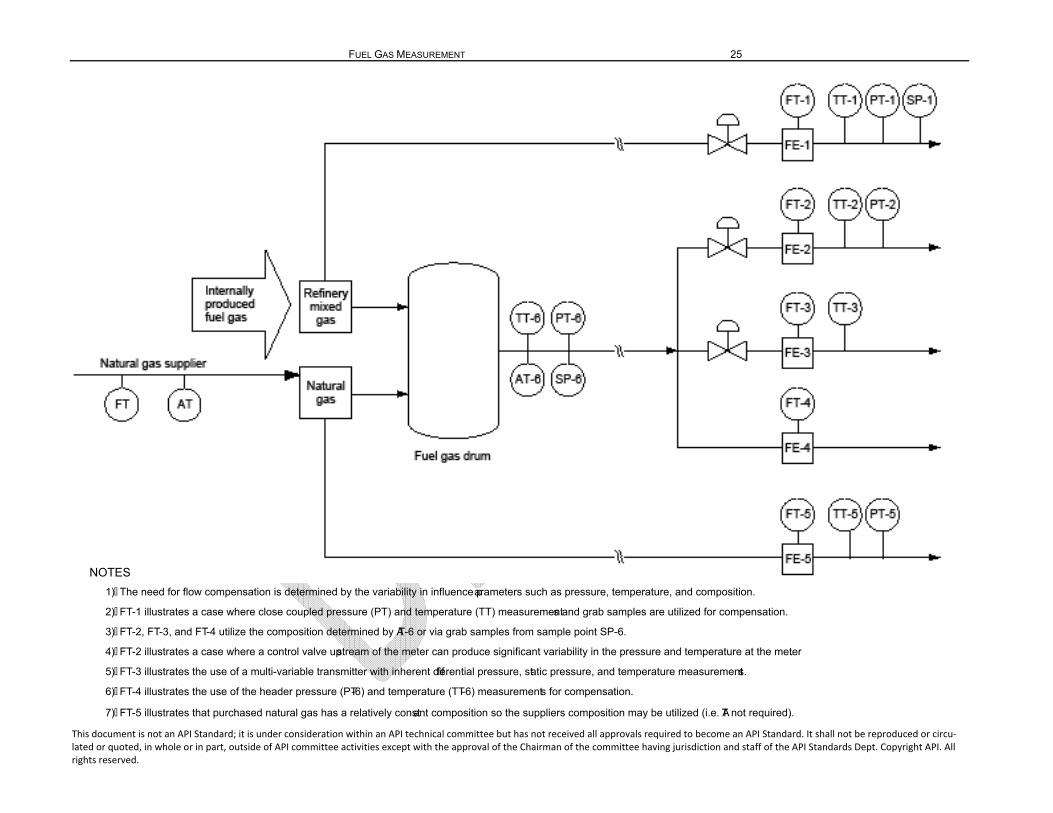
Figure 2 illustrates various examples of flow measurement systems, ranging from close coupled pressure, temperature and composition measurements, to more distant measurements and bias factors applied where applicable.

This document is not an API Standard; it is under consideration within an API technical committee but has not received all approvals required to become an API Standard. It shall not be reproduced or circu‐lated or quoted, in whole or in part, outside of API committee activities except with the approval of the Chairman of the committee having jurisdiction and staff of the API Standards Dept. Copyright API. All rights reserved.
FUEL GAS MEASUREMENT 25
This document is not an API Standard; it is under consideration within an API technical committee but has not received all approvals required to become an API Standard. It shall not be reproduced or circu‐lated or quoted, in whole or in part, outside of API committee activities except with the approval of the Chairman of the committee having jurisdiction and staff of the API Standards Dept. Copyright API. All rights reserved.
NOTES
1) The need for flow compensation is determined by the variability in influence parameters such as pressure, temperature, and composition.
2) FT-1 illustrates a case where close coupled pressure (PT) and temperature (TT) measurements and grab samples are utilized for compensation.
3) FT-2, FT-3, and FT-4 utilize the composition determined by AT-6 or via grab samples from sample point SP-6.
4) FT-2 illustrates a case where a control valve upstream of the meter can produce significant variability in the pressure and temperature at the meter.
5) FT-3 illustrates the use of a multi-variable transmitter with inherent differential pressure, static pressure, and temperature measurements.
6) FT-4 illustrates the use of the header pressure (PT-6) and temperature (TT-6) measurements for compensation.
7) FT-5 illustrates that purchased natural gas has a relatively constant composition so the suppliers composition may be utilized (i.e. AT not required).
26 CHAPTER 14—NATURAL GAS MEASUREMENT
This document is not an API Standard; it is under consideration within an API technical committee but has not received all approvals required to become an API Standard. It shall not be reproduced or circu‐lated or quoted, in whole or in part, outside of API committee activities except with the approval of the Chairman of the committee having jurisdiction and staff of the API Standards Dept. Copyright API. All rights reserved.
Figure 2—Example of Fuel Gas Measurement System
FUEL GAS MEASUREMENT 27
This document is not an API Standard; it is under consideration within an API technical committee but has not received all approvals required to become an API Standard. It shall not be reproduced or circulated or quoted, in whole or in part, outside of API committee activities except with the approval of the Chairman of the committee having jurisdiction and staff of the API Standards Dept. Copyright API. All rights reserved.
4.2 Equipment Selection Considerations
Pressure, temperature, density and gas composition measurement instruments purchased for fuel gas applications are typically no different than those used in standard petrochemical applications. Manufacturers of such instruments generally have demonstrated acceptable tolerances with test data traceable to NIST or other national standards bodies.
Multi-variable transmitters measuring pressure, temperature and differential pressure are generally acceptable for fuel gas measurement. Pipe skin temperature elements (properly insulated) add additional uncertainty compared to thermowell-based temperature measurements but can be utilized provided the contribution to the overall uncertainty is acceptable.
For differential pressure type meters, the accuracy of the measured line pressure is more critical when the ratio of the differential pressure to the line pressure is more than 0.1.
For fuel gas measurement applications, the tertiary device used to collect data and perform computations can be any of the following: DCS, programmable logic controller (PLC), multi-variable transmitter, or flow computer.
Fuel gas composition and/or density can be determined by on-line analyzers, such as gas chromatographs, or by manual or automatic sampling and off-line analysis. Relative stream size, composition variability, and cost of on-line analyzers will influence the decision whether on-line analyzers or periodic manual sampling and analysis are used. Compensation of natural gas meters for composition changes will often utilize the supplier's measurements (i.e. use the suppliers certificate of analysis or on-line chromatograph).
4.3 Equipment Location and Installation
Depending upon the flow meter technology selected, the ideal location of process connections for secondary devices (pressure, temperature and analytical sampling) may vary. In general, temperature and analytical connections (e.g. sample probes) should be downstream of all primary fuel gas measurement system components, unless the upstream location does not cause significant disturbance of the flow profile or the device is insensitive to upstream profile disturbances (e.g. Coriolis, positive displacement). For example, ISO 5167-2:2003 states that thermowells should be located at distances 5D or greater upstream of an orifice plate provided the diameter of the thermowell is less than 0.03D, and at distances 20D or greater for thermowells with a diameter between 0.03D and 0.13D. Consult industry standards or with equipment manufacturers on recommendations for proper meter run piping configuration.
If the flowing gas temperature is not measured at the flow meter, as per industry standards or manufacturer’s recommendations, or if the flowing gas temperature is not measured using a thermowell, the difference between the measured temperature and the temperature of the gas at the flow meter shall be established. If the line pressure is not measured at the meter, the difference between the measured line pressure and the pressure at the flow meter shall be established as a function of flow rate and recorded.
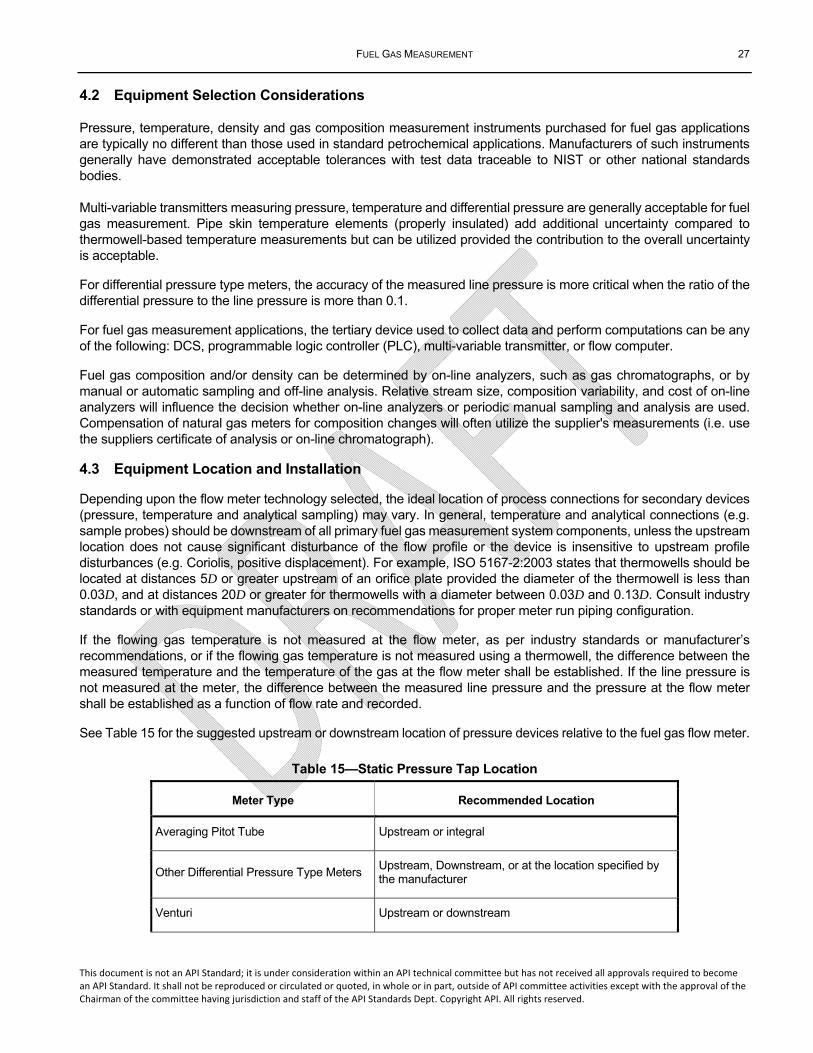
See Table 15 for the suggested upstream or downstream location of pressure devices relative to the fuel gas flow meter.
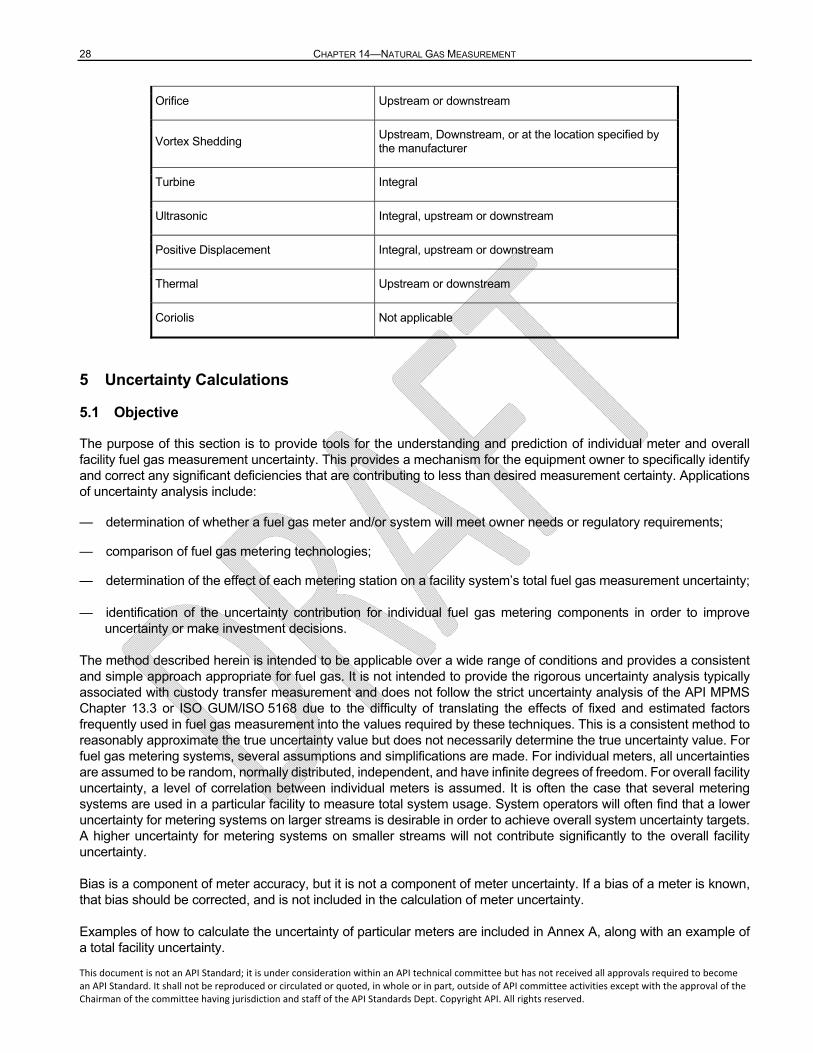
Table 15—Static Pressure Tap Location
Meter Type Recommended Location
Averaging Pitot Tube Upstream or integral
Other Differential Pressure Type Meters Upstream, Downstream, or at the location specified by the manufacturer
Venturi Upstream or downstream
28 CHAPTER 14—NATURAL GAS MEASUREMENT
This document is not an API Standard; it is under consideration within an API technical committee but has not received all approvals required to become an API Standard. It shall not be reproduced or circulated or quoted, in whole or in part, outside of API committee activities except with the approval of the Chairman of the committee having jurisdiction and staff of the API Standards Dept. Copyright API. All rights reserved.
Orifice Upstream or downstream
Vortex Shedding Upstream, Downstream, or at the location specified by the manufacturer
Turbine Integral
Ultrasonic Integral, upstream or downstream
Positive Displacement Integral, upstream or downstream
Thermal Upstream or downstream
Coriolis Not applicable
5 Uncertainty Calculations
5.1 Objective
The purpose of this section is to provide tools for the understanding and prediction of individual meter and overall facility fuel gas measurement uncertainty. This provides a mechanism for the equipment owner to specifically identify and correct any significant deficiencies that are contributing to less than desired measurement certainty. Applications of uncertainty analysis include:
— determination of whether a fuel gas meter and/or system will meet owner needs or regulatory requirements;
— comparison of fuel gas metering technologies;
— determination of the effect of each metering station on a facility system’s total fuel gas measurement uncertainty;
— identification of the uncertainty contribution for individual fuel gas metering components in order to improve uncertainty or make investment decisions.
The method described herein is intended to be applicable over a wide range of conditions and provides a consistent and simple approach appropriate for fuel gas. It is not intended to provide the rigorous uncertainty analysis typically associated with custody transfer measurement and does not follow the strict uncertainty analysis of the API MPMS Chapter 13.3 or ISO GUM/ISO 5168 due to the difficulty of translating the effects of fixed and estimated factors frequently used in fuel gas measurement into the values required by these techniques. This is a consistent method to reasonably approximate the true uncertainty value but does not necessarily determine the true uncertainty value. For fuel gas metering systems, several assumptions and simplifications are made. For individual meters, all uncertainties are assumed to be random, normally distributed, independent, and have infinite degrees of freedom. For overall facility uncertainty, a level of correlation between individual meters is assumed. It is often the case that several metering systems are used in a particular facility to measure total system usage. System operators will often find that a lower uncertainty for metering systems on larger streams is desirable in order to achieve overall system uncertainty targets. A higher uncertainty for metering systems on smaller streams will not contribute significantly to the overall facility uncertainty.
Bias is a component of meter accuracy, but it is not a component of meter uncertainty. If a bias of a meter is known, that bias should be corrected, and is not included in the calculation of meter uncertainty.
Examples of how to calculate the uncertainty of particular meters are included in Annex A, along with an example of a total facility uncertainty.
FUEL GAS MEASUREMENT 29
This document is not an API Standard; it is under consideration within an API technical committee but has not received all approvals required to become an API Standard. It shall not be reproduced or circulated or quoted, in whole or in part, outside of API committee activities except with the approval of the Chairman of the committee having jurisdiction and staff of the API Standards Dept. Copyright API. All rights reserved.
5.2 Uncertainty Analysis Procedure
The typical uncertainty analysis for an individual metering system consists of the steps listed below:
Step 1: Determine the measurement model.
The equation is dependent on the meter technology and should be supplied either by the vendor, applicable standards, or reference material. In this document, the uncertainties will focus on standard volume flow rate, energy flow rate, and carbon flow rate. For energy and carbon content uncertainty determination, additional influence parameters will be included.
Step 2: Set up a primary uncertainty table.
An uncertainty table serves to organize the numerical values that make up the analysis. A spreadsheet is a common tool. The table is constructed such that each uncertainty component or equation variable occupies a row.
For optimum performance and accuracy, industry standards and equipment manufacturers recommend a minimum length of pipe upstream and downstream for many meter types. Because fuel gas meters are most often installed to non-custody transfer standards, these minimum length recommendations are frequently not achieved. The uncertainty table includes a row item termed “Installation Effect Factor” that will enable the owner to estimate the possible uncertainty contribution for non-optimum meter run lengths (or other piping effects).
In many fuel gas applications, inspection of meter internals or primary elements at recommended intervals for fiscal measurement is not practical. In these cases, it is necessary to introduce a component of uncertainty to account for the unknown condition of the meter or primary element. Thus, the “Meter Condition Factor” is included in the table. The value of the uncertainty associated with this term is determined by engineering judgment and is most often a function of:
— inspection interval and history of findings,
— cleanliness of the flowing gas and likelihood of fouling contributing to increased uncertainty,
— and the possibility of unknown damage or wear contributing to increased uncertainty.
For some meter types, it is advisable to consult the manufacturer for assistance in determination of the Meter Condition Factor.
The following column values are to be included in the table:
— flow equation variable or component,
— units of measure,
— nominal value,
— standard uncertainty in units of measurement,
— standard uncertainty in percent,
— sensitivity coefficient.
30 CHAPTER 14—NATURAL GAS MEASUREMENT
This document is not an API Standard; it is under consideration within an API technical committee but has not received all approvals required to become an API Standard. It shall not be reproduced or circulated or quoted, in whole or in part, outside of API committee activities except with the approval of the Chairman of the committee having jurisdiction and staff of the API Standards Dept. Copyright API. All rights reserved.
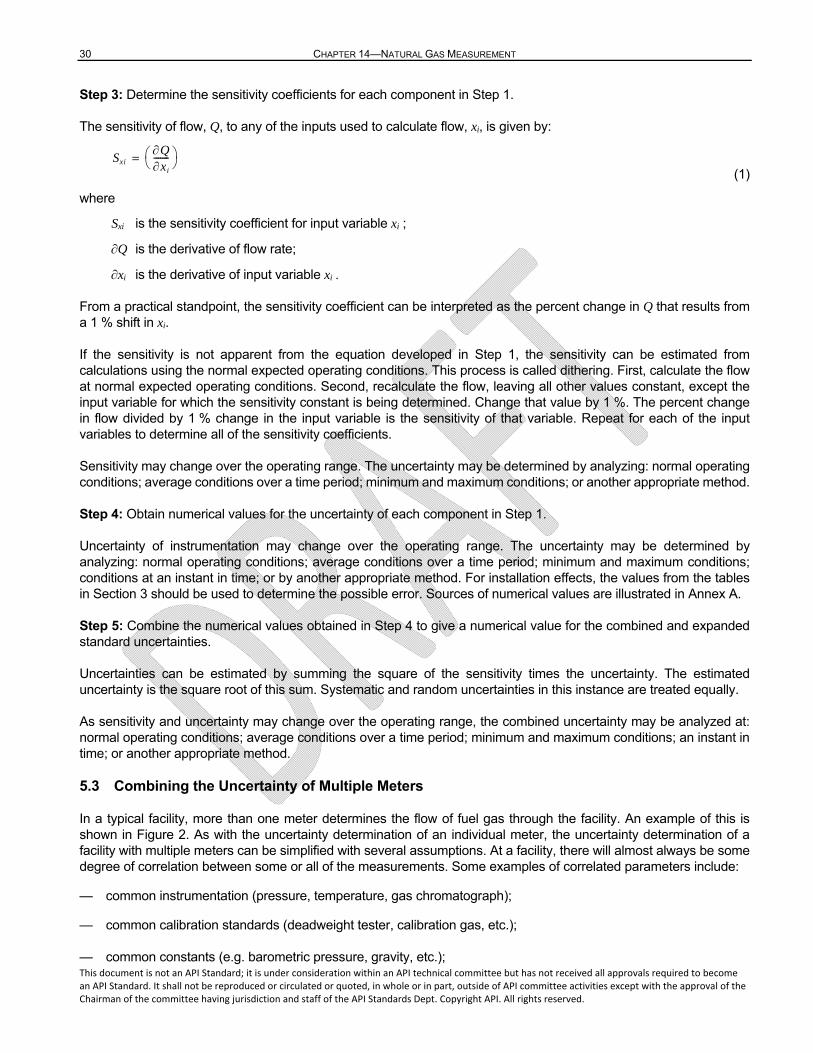
Step 3: Determine the sensitivity coefficients for each component in Step 1.
The sensitivity of flow, Q, to any of the inputs used to calculate flow, xi, is given by:
(1)
where
Sxi is the sensitivity coefficient for input variable xi ;
Q is the derivative of flow rate;
xi is the derivative of input variable xi .
From a practical standpoint, the sensitivity coefficient can be interpreted as the percent change in Q that results from a 1 % shift in xi.
If the sensitivity is not apparent from the equation developed in Step 1, the sensitivity can be estimated from calculations using the normal expected operating conditions. This process is called dithering. First, calculate the flow at normal expected operating conditions. Second, recalculate the flow, leaving all other values constant, except the input variable for which the sensitivity constant is being determined. Change that value by 1 %. The percent change in flow divided by 1 % change in the input variable is the sensitivity of that variable. Repeat for each of the input variables to determine all of the sensitivity coefficients.
Sensitivity may change over the operating range. The uncertainty may be determined by analyzing: normal operating conditions; average conditions over a time period; minimum and maximum conditions; or another appropriate method.
Step 4: Obtain numerical values for the uncertainty of each component in Step 1.
Uncertainty of instrumentation may change over the operating range. The uncertainty may be determined by analyzing: normal operating conditions; average conditions over a time period; minimum and maximum conditions; conditions at an instant in time; or by another appropriate method. For installation effects, the values from the tables in Section 3 should be used to determine the possible error. Sources of numerical values are illustrated in Annex A.
Step 5: Combine the numerical values obtained in Step 4 to give a numerical value for the combined and expanded standard uncertainties.
Uncertainties can be estimated by summing the square of the sensitivity times the uncertainty. The estimated uncertainty is the square root of this sum. Systematic and random uncertainties in this instance are treated equally.
As sensitivity and uncertainty may change over the operating range, the combined uncertainty may be analyzed at: normal operating conditions; average conditions over a time period; minimum and maximum conditions; an instant in time; or another appropriate method.
5.3 Combining the Uncertainty of Multiple Meters
In a typical facility, more than one meter determines the flow of fuel gas through the facility. An example of this is shown in Figure 2. As with the uncertainty determination of an individual meter, the uncertainty determination of a facility with multiple meters can be simplified with several assumptions. At a facility, there will almost always be some degree of correlation between some or all of the measurements. Some examples of correlated parameters include:
— common instrumentation (pressure, temperature, gas chromatograph);
— common calibration standards (deadweight tester, calibration gas, etc.);
— common constants (e.g. barometric pressure, gravity, etc.);
SxiQxi
------- =
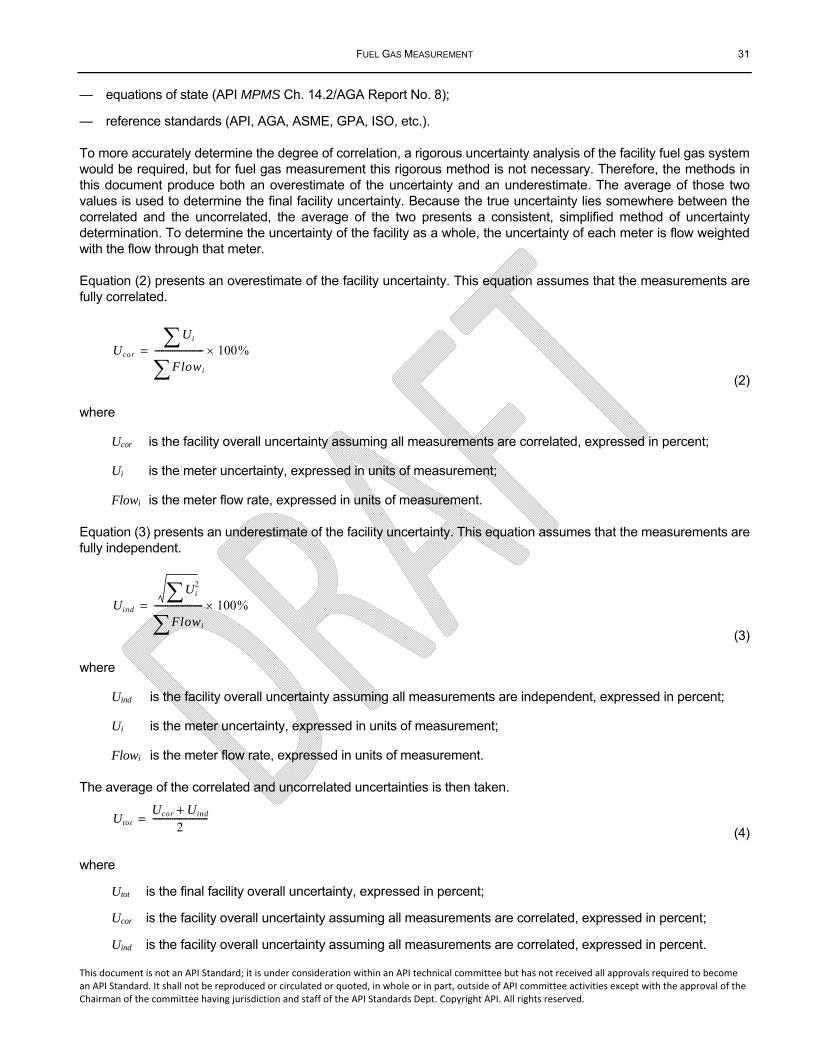
FUEL GAS MEASUREMENT 31
This document is not an API Standard; it is under consideration within an API technical committee but has not received all approvals required to become an API Standard. It shall not be reproduced or circulated or quoted, in whole or in part, outside of API committee activities except with the approval of the Chairman of the committee having jurisdiction and staff of the API Standards Dept. Copyright API. All rights reserved.
— equations of state (API MPMS Ch. 14.2/AGA Report No. 8);
— reference standards (API, AGA, ASME, GPA, ISO, etc.).
To more accurately determine the degree of correlation, a rigorous uncertainty analysis of the facility fuel gas system would be required, but for fuel gas measurement this rigorous method is not necessary. Therefore, the methods in this document produce both an overestimate of the uncertainty and an underestimate. The average of those two values is used to determine the final facility uncertainty. Because the true uncertainty lies somewhere between the correlated and the uncorrelated, the average of the two presents a consistent, simplified method of uncertainty determination. To determine the uncertainty of the facility as a whole, the uncertainty of each meter is flow weighted with the flow through that meter.
Equation (2) presents an overestimate of the facility uncertainty. This equation assumes that the measurements are fully correlated.
(2)
where
Ucor is the facility overall uncertainty assuming all measurements are correlated, expressed in percent;
Ui is the meter uncertainty, expressed in units of measurement;
Flowi is the meter flow rate, expressed in units of measurement.
Equation (3) presents an underestimate of the facility uncertainty. This equation assumes that the measurements are fully independent.
(3)
where
Uind is the facility overall uncertainty assuming all measurements are independent, expressed in percent;
Ui is the meter uncertainty, expressed in units of measurement;
Flowi is the meter flow rate, expressed in units of measurement.
The average of the correlated and uncorrelated uncertainties is then taken.
(4)
where
Utot is the final facility overall uncertainty, expressed in percent;
Ucor is the facility overall uncertainty assuming all measurements are correlated, expressed in percent;
Uind is the facility overall uncertainty assuming all measurements are correlated, expressed in percent.
Ucor
UiFlowi
---------------------- 100%=
Uind
Ui2
Flowi---------------------- 100%=
Utot
Ucor Uind+2
-------------------------=
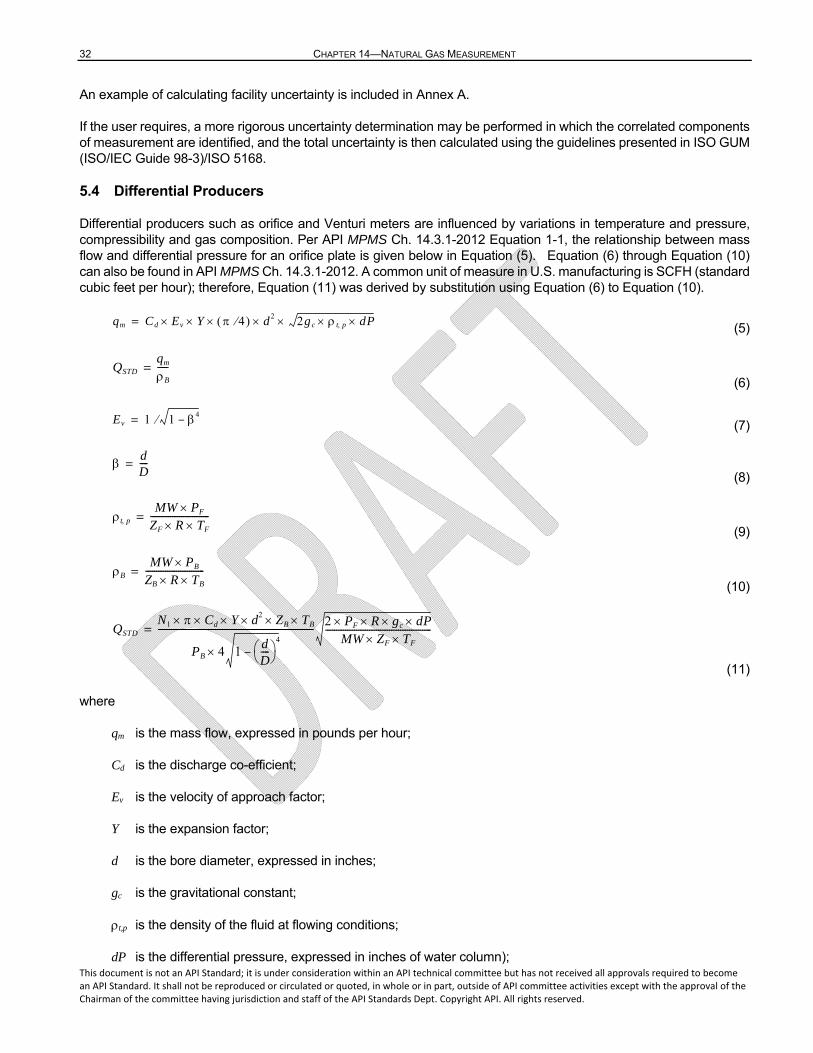
32 CHAPTER 14—NATURAL GAS MEASUREMENT
This document is not an API Standard; it is under consideration within an API technical committee but has not received all approvals required to become an API Standard. It shall not be reproduced or circulated or quoted, in whole or in part, outside of API committee activities except with the approval of the Chairman of the committee having jurisdiction and staff of the API Standards Dept. Copyright API. All rights reserved.
An example of calculating facility uncertainty is included in Annex A.
If the user requires, a more rigorous uncertainty determination may be performed in which the correlated components of measurement are identified, and the total uncertainty is then calculated using the guidelines presented in ISO GUM (ISO/IEC Guide 98-3)/ISO 5168.
5.4 Differential Producers
Differential producers such as orifice and Venturi meters are influenced by variations in temperature and pressure, compressibility and gas composition. Per API MPMS Ch. 14.3.1-2012 Equation 1-1, the relationship between mass flow and differential pressure for an orifice plate is given below in Equation (5). Equation (6) through Equation (10) can also be found in API MPMS Ch. 14.3.1-2012. A common unit of measure in U.S. manufacturing is SCFH (standard cubic feet per hour); therefore, Equation (11) was derived by substitution using Equation (6) to Equation (10).
(5)
(6)
(7)
(8)
(9)
(10)
(11)
where
qm is the mass flow, expressed in pounds per hour;
Cd is the discharge co-efficient;
Ev is the velocity of approach factor;
Y is the expansion factor;
d is the bore diameter, expressed in inches;
gc is the gravitational constant;
t,p is the density of the fluid at flowing conditions;
dP is the differential pressure, expressed in inches of water column);
qm Cd Ev Y 4 d2 2gc t p dP=
QSTD
qm
B
-----=
Ev 1 1 4–=
dD----=
t pMW PF
ZF R TF---------------------------=
B
MW PBZB R TB---------------------------=
QSTD
N1 Cd Y d2 ZB TB
PB 4 1dD----
4
–
----------------------------------------------------------------------- 2 PF R gc dPMW ZF TF
------------------------------------------------=
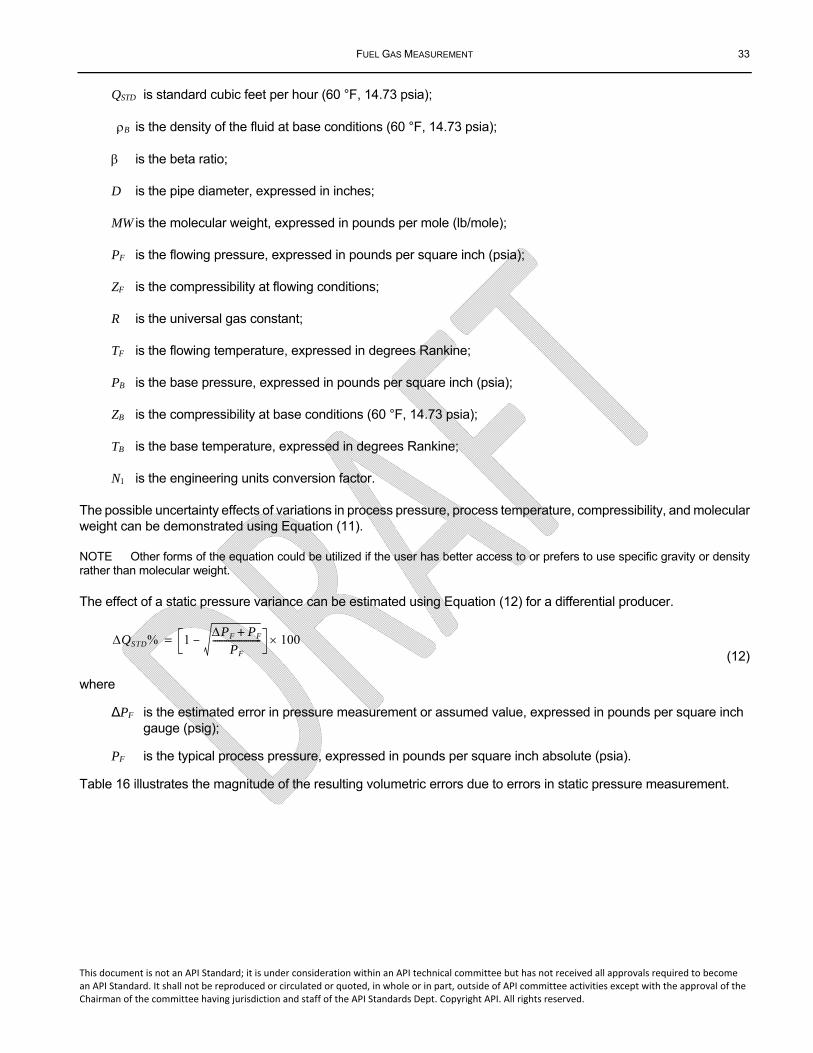
FUEL GAS MEASUREMENT 33
This document is not an API Standard; it is under consideration within an API technical committee but has not received all approvals required to become an API Standard. It shall not be reproduced or circulated or quoted, in whole or in part, outside of API committee activities except with the approval of the Chairman of the committee having jurisdiction and staff of the API Standards Dept. Copyright API. All rights reserved.
QSTD is standard cubic feet per hour (60 °F, 14.73 psia);
B is the density of the fluid at base conditions (60 °F, 14.73 psia);
is the beta ratio;
D is the pipe diameter, expressed in inches;
MW is the molecular weight, expressed in pounds per mole (lb/mole);
PF is the flowing pressure, expressed in pounds per square inch (psia);
ZF is the compressibility at flowing conditions;
R is the universal gas constant;
TF is the flowing temperature, expressed in degrees Rankine;
PB is the base pressure, expressed in pounds per square inch (psia);
ZB is the compressibility at base conditions (60 °F, 14.73 psia);
TB is the base temperature, expressed in degrees Rankine;
N1 is the engineering units conversion factor.
The possible uncertainty effects of variations in process pressure, process temperature, compressibility, and molecular weight can be demonstrated using Equation (11).
NOTE Other forms of the equation could be utilized if the user has better access to or prefers to use specific gravity or density rather than molecular weight.
The effect of a static pressure variance can be estimated using Equation (12) for a differential producer.
(12)
where
ΔPF is the estimated error in pressure measurement or assumed value, expressed in pounds per square inch gauge (psig);
PF is the typical process pressure, expressed in pounds per square inch absolute (psia).
Table 16 illustrates the magnitude of the resulting volumetric errors due to errors in static pressure measurement.
QSTD% 1PF PF+
PF
----------------------– 100=
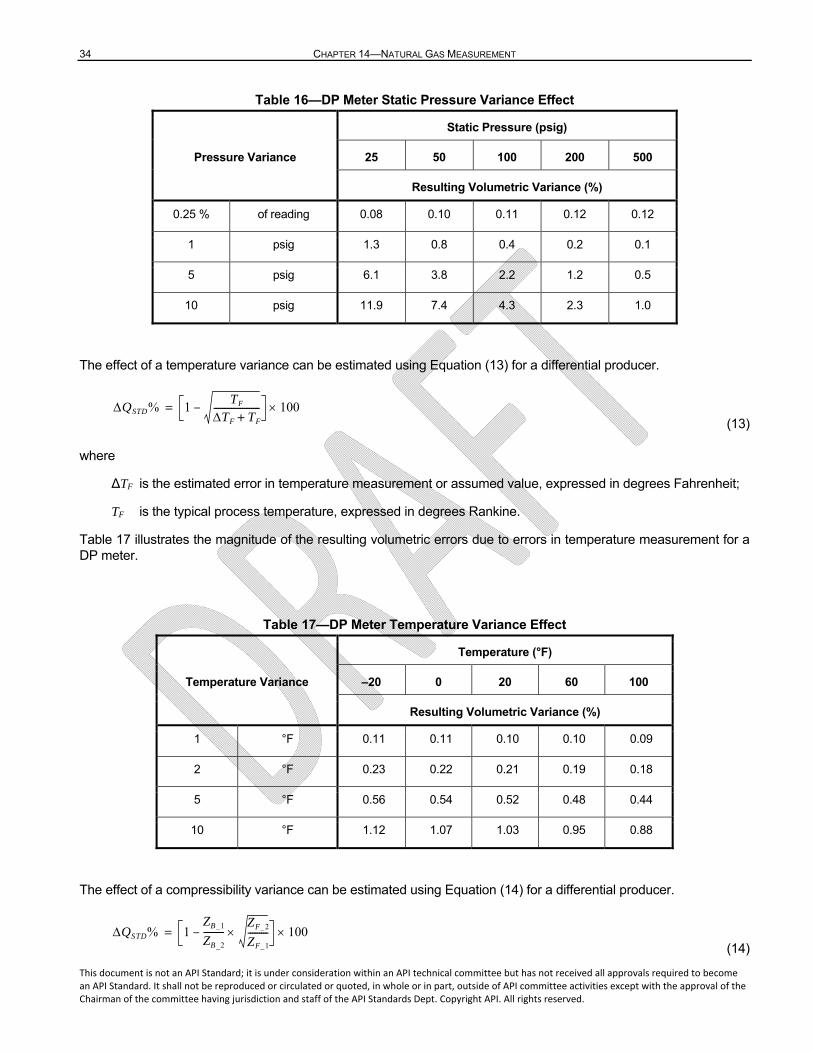
34 CHAPTER 14—NATURAL GAS MEASUREMENT
This document is not an API Standard; it is under consideration within an API technical committee but has not received all approvals required to become an API Standard. It shall not be reproduced or circulated or quoted, in whole or in part, outside of API committee activities except with the approval of the Chairman of the committee having jurisdiction and staff of the API Standards Dept. Copyright API. All rights reserved.
Table 16—DP Meter Static Pressure Variance Effect
Pressure Variance
Static Pressure (psig)
25 50 100 200 500
Resulting Volumetric Variance (%)
0.25 % of reading 0.08 0.10 0.11 0.12 0.12
1 psig 1.3 0.8 0.4 0.2 0.1
5 psig 6.1 3.8 2.2 1.2 0.5
10 psig 11.9 7.4 4.3 2.3 1.0
The effect of a temperature variance can be estimated using Equation (13) for a differential producer.
(13)
where
ΔTF is the estimated error in temperature measurement or assumed value, expressed in degrees Fahrenheit;
TF is the typical process temperature, expressed in degrees Rankine.
Table 17 illustrates the magnitude of the resulting volumetric errors due to errors in temperature measurement for a DP meter.
Table 17—DP Meter Temperature Variance Effect
Temperature Variance
Temperature (°F)
–20 0 20 60 100
Resulting Volumetric Variance (%)
1 °F 0.11 0.11 0.10 0.10 0.09
2 °F 0.23 0.22 0.21 0.19 0.18
5 °F 0.56 0.54 0.52 0.48 0.44
10 °F 1.12 1.07 1.03 0.95 0.88
The effect of a compressibility variance can be estimated using Equation (14) for a differential producer.
(14)
QSTD% 1TF
TF TF+---------------------– 100=
QSTD% 1ZB_1
ZB_2
---------ZF_2
ZF_1
---------– 100=
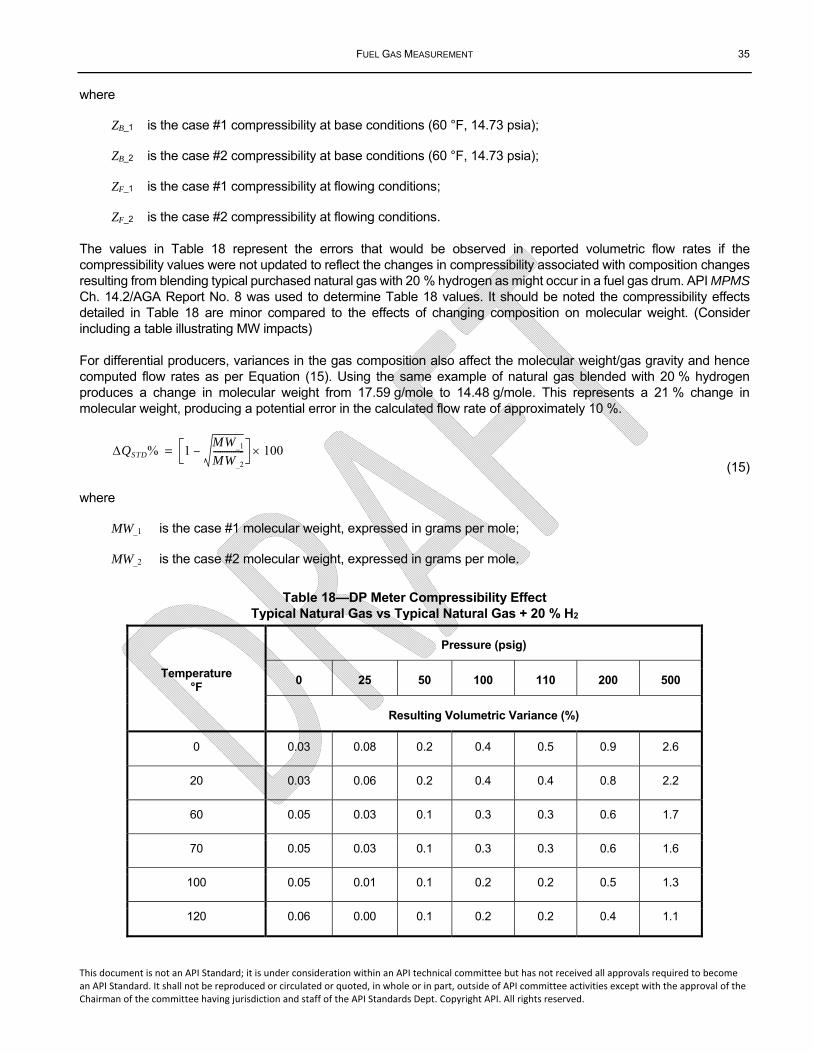
FUEL GAS MEASUREMENT 35
This document is not an API Standard; it is under consideration within an API technical committee but has not received all approvals required to become an API Standard. It shall not be reproduced or circulated or quoted, in whole or in part, outside of API committee activities except with the approval of the Chairman of the committee having jurisdiction and staff of the API Standards Dept. Copyright API. All rights reserved.
where
ZB_1 is the case #1 compressibility at base conditions (60 °F, 14.73 psia);
ZB_2 is the case #2 compressibility at base conditions (60 °F, 14.73 psia);
ZF_1 is the case #1 compressibility at flowing conditions;
ZF_2 is the case #2 compressibility at flowing conditions.
The values in Table 18 represent the errors that would be observed in reported volumetric flow rates if the compressibility values were not updated to reflect the changes in compressibility associated with composition changes resulting from blending typical purchased natural gas with 20 % hydrogen as might occur in a fuel gas drum. API MPMS Ch. 14.2/AGA Report No. 8 was used to determine Table 18 values. It should be noted the compressibility effects detailed in Table 18 are minor compared to the effects of changing composition on molecular weight. (Consider including a table illustrating MW impacts)
For differential producers, variances in the gas composition also affect the molecular weight/gas gravity and hence computed flow rates as per Equation (15). Using the same example of natural gas blended with 20 % hydrogen produces a change in molecular weight from 17.59 g/mole to 14.48 g/mole. This represents a 21 % change in molecular weight, producing a potential error in the calculated flow rate of approximately 10 %.
(15)
where
MW_1 is the case #1 molecular weight, expressed in grams per mole;
MW_2 is the case #2 molecular weight, expressed in grams per mole.
Table 18—DP Meter Compressibility Effect Typical Natural Gas vs Typical Natural Gas + 20 % H2
Temperature °F
Pressure (psig)
0 25 50 100 110 200 500
Resulting Volumetric Variance (%)
0 0.03 0.08 0.2 0.4 0.5 0.9 2.6
20 0.03 0.06 0.2 0.4 0.4 0.8 2.2
60 0.05 0.03 0.1 0.3 0.3 0.6 1.7
70 0.05 0.03 0.1 0.3 0.3 0.6 1.6
100 0.05 0.01 0.1 0.2 0.2 0.5 1.3
120 0.06 0.00 0.1 0.2 0.2 0.4 1.1
QSTD% 1MW_1
MW_2
--------------– 100=
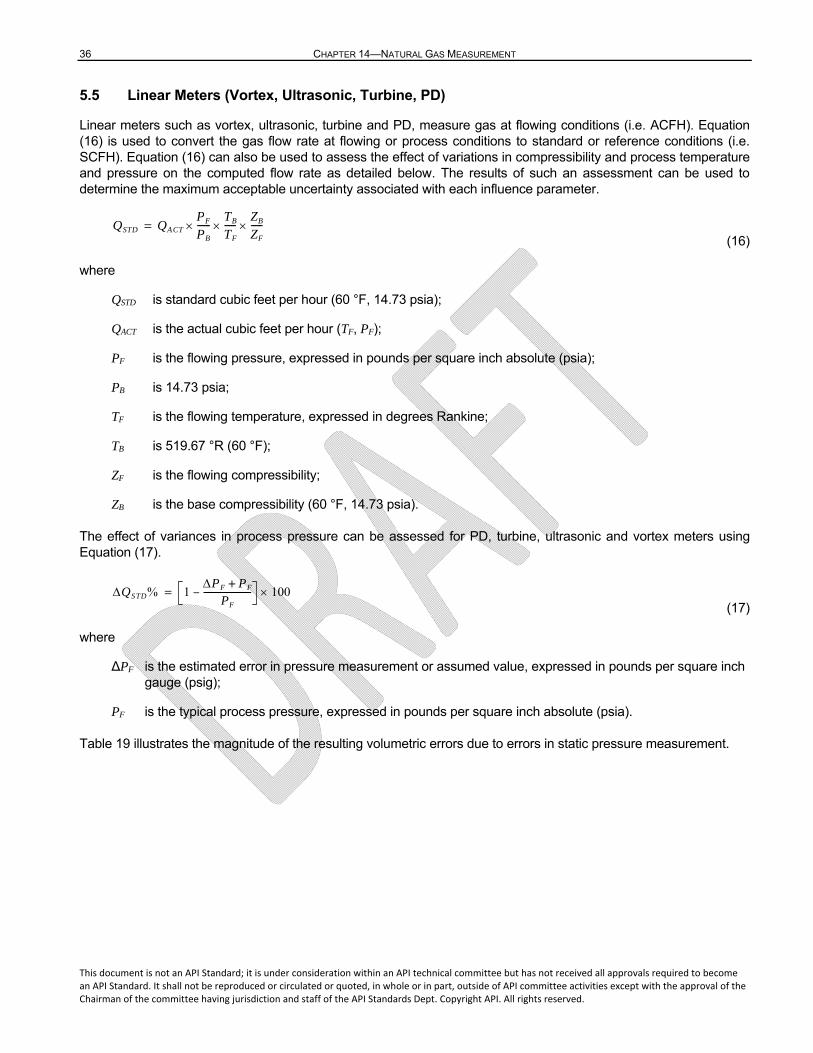
36 CHAPTER 14—NATURAL GAS MEASUREMENT
This document is not an API Standard; it is under consideration within an API technical committee but has not received all approvals required to become an API Standard. It shall not be reproduced or circulated or quoted, in whole or in part, outside of API committee activities except with the approval of the Chairman of the committee having jurisdiction and staff of the API Standards Dept. Copyright API. All rights reserved.
5.5 Linear Meters (Vortex, Ultrasonic, Turbine, PD)
Linear meters such as vortex, ultrasonic, turbine and PD, measure gas at flowing conditions (i.e. ACFH). Equation (16) is used to convert the gas flow rate at flowing or process conditions to standard or reference conditions (i.e. SCFH). Equation (16) can also be used to assess the effect of variations in compressibility and process temperature and pressure on the computed flow rate as detailed below. The results of such an assessment can be used to determine the maximum acceptable uncertainty associated with each influence parameter.
(16)
where
QSTD is standard cubic feet per hour (60 °F, 14.73 psia);
QACT is the actual cubic feet per hour (TF, PF);
PF is the flowing pressure, expressed in pounds per square inch absolute (psia);
PB is 14.73 psia;
TF is the flowing temperature, expressed in degrees Rankine;
TB is 519.67 °R (60 °F);
ZF is the flowing compressibility;
ZB is the base compressibility (60 °F, 14.73 psia).
The effect of variances in process pressure can be assessed for PD, turbine, ultrasonic and vortex meters using Equation (17).
(17)
where
ΔPF is the estimated error in pressure measurement or assumed value, expressed in pounds per square inch gauge (psig);
PF is the typical process pressure, expressed in pounds per square inch absolute (psia).
Table 19 illustrates the magnitude of the resulting volumetric errors due to errors in static pressure measurement.
QSTD QACT
PF
PB
------TB
TF
-----ZB
ZF
-----=
QSTD% 1PF PF+
PF
----------------------– 100=
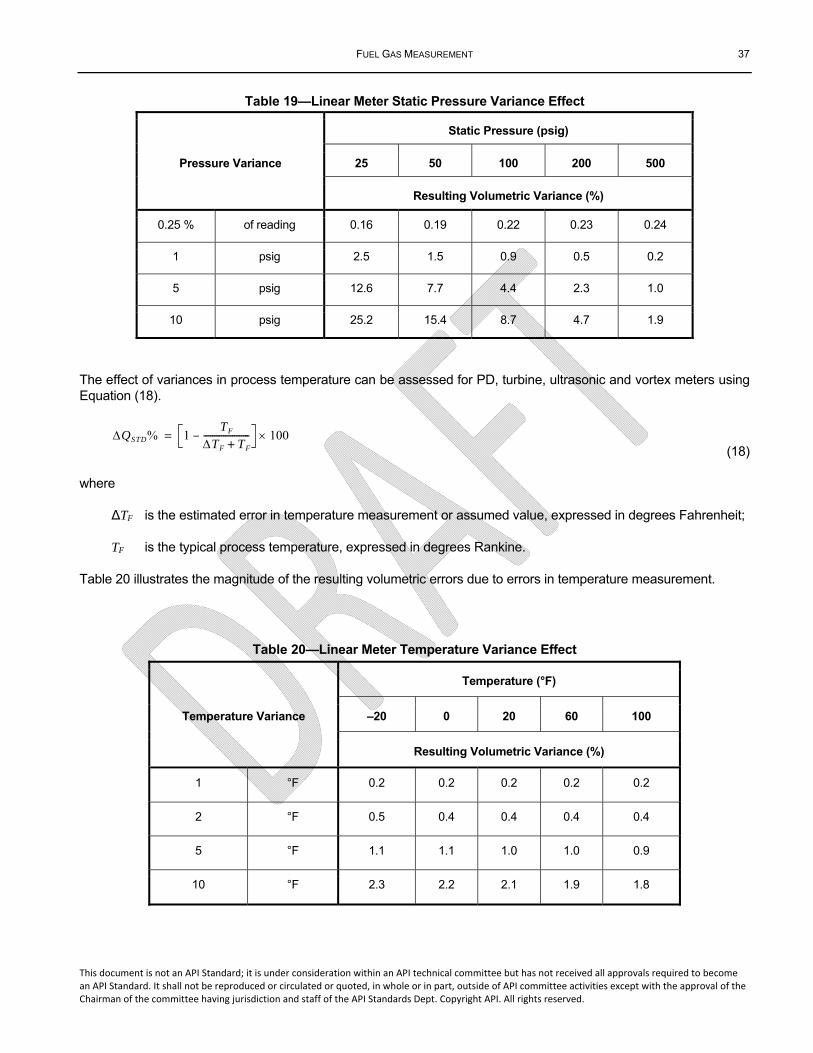
FUEL GAS MEASUREMENT 37
This document is not an API Standard; it is under consideration within an API technical committee but has not received all approvals required to become an API Standard. It shall not be reproduced or circulated or quoted, in whole or in part, outside of API committee activities except with the approval of the Chairman of the committee having jurisdiction and staff of the API Standards Dept. Copyright API. All rights reserved.
Table 19—Linear Meter Static Pressure Variance Effect
Pressure Variance
Static Pressure (psig)
25 50 100 200 500
Resulting Volumetric Variance (%)
0.25 % of reading 0.16 0.19 0.22 0.23 0.24
1 psig 2.5 1.5 0.9 0.5 0.2
5 psig 12.6 7.7 4.4 2.3 1.0
10 psig 25.2 15.4 8.7 4.7 1.9
The effect of variances in process temperature can be assessed for PD, turbine, ultrasonic and vortex meters using Equation (18).
(18)
where
ΔTF is the estimated error in temperature measurement or assumed value, expressed in degrees Fahrenheit;
TF is the typical process temperature, expressed in degrees Rankine.
Table 20 illustrates the magnitude of the resulting volumetric errors due to errors in temperature measurement.
Table 20—Linear Meter Temperature Variance Effect
Temperature Variance
Temperature (°F)
–20 0 20 60 100
Resulting Volumetric Variance (%)
1 °F 0.2 0.2 0.2 0.2 0.2
2 °F 0.5 0.4 0.4 0.4 0.4
5 °F 1.1 1.1 1.0 1.0 0.9
10 °F 2.3 2.2 2.1 1.9 1.8
QSTD% 1TF
TF TF+---------------------– 100=
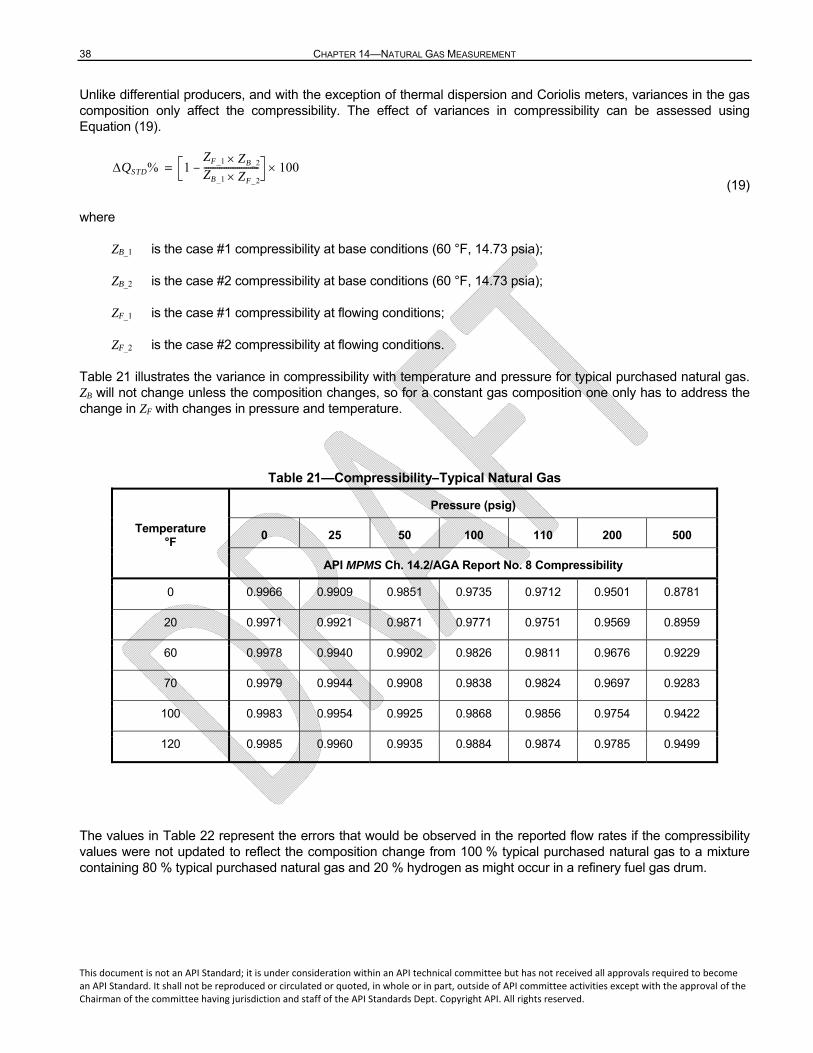
38 CHAPTER 14—NATURAL GAS MEASUREMENT
This document is not an API Standard; it is under consideration within an API technical committee but has not received all approvals required to become an API Standard. It shall not be reproduced or circulated or quoted, in whole or in part, outside of API committee activities except with the approval of the Chairman of the committee having jurisdiction and staff of the API Standards Dept. Copyright API. All rights reserved.
Unlike differential producers, and with the exception of thermal dispersion and Coriolis meters, variances in the gas composition only affect the compressibility. The effect of variances in compressibility can be assessed using Equation (19).
(19)
where
ZB_1 is the case #1 compressibility at base conditions (60 °F, 14.73 psia);
ZB_2 is the case #2 compressibility at base conditions (60 °F, 14.73 psia);
ZF_1 is the case #1 compressibility at flowing conditions;
ZF_2 is the case #2 compressibility at flowing conditions.
Table 21 illustrates the variance in compressibility with temperature and pressure for typical purchased natural gas. ZB will not change unless the composition changes, so for a constant gas composition one only has to address the change in ZF with changes in pressure and temperature.
Table 21—Compressibility–Typical Natural Gas
Temperature °F
Pressure (psig)
0 25 50 100 110 200 500
API MPMS Ch. 14.2/AGA Report No. 8 Compressibility
0 0.9966 0.9909 0.9851 0.9735 0.9712 0.9501 0.8781
20 0.9971 0.9921 0.9871 0.9771 0.9751 0.9569 0.8959
60 0.9978 0.9940 0.9902 0.9826 0.9811 0.9676 0.9229
70 0.9979 0.9944 0.9908 0.9838 0.9824 0.9697 0.9283
100 0.9983 0.9954 0.9925 0.9868 0.9856 0.9754 0.9422
120 0.9985 0.9960 0.9935 0.9884 0.9874 0.9785 0.9499
The values in Table 22 represent the errors that would be observed in the reported flow rates if the compressibility values were not updated to reflect the composition change from 100 % typical purchased natural gas to a mixture containing 80 % typical purchased natural gas and 20 % hydrogen as might occur in a refinery fuel gas drum.
QSTD% 1ZF_1 ZB_2ZB_1 ZF_2-------------------------– 100=
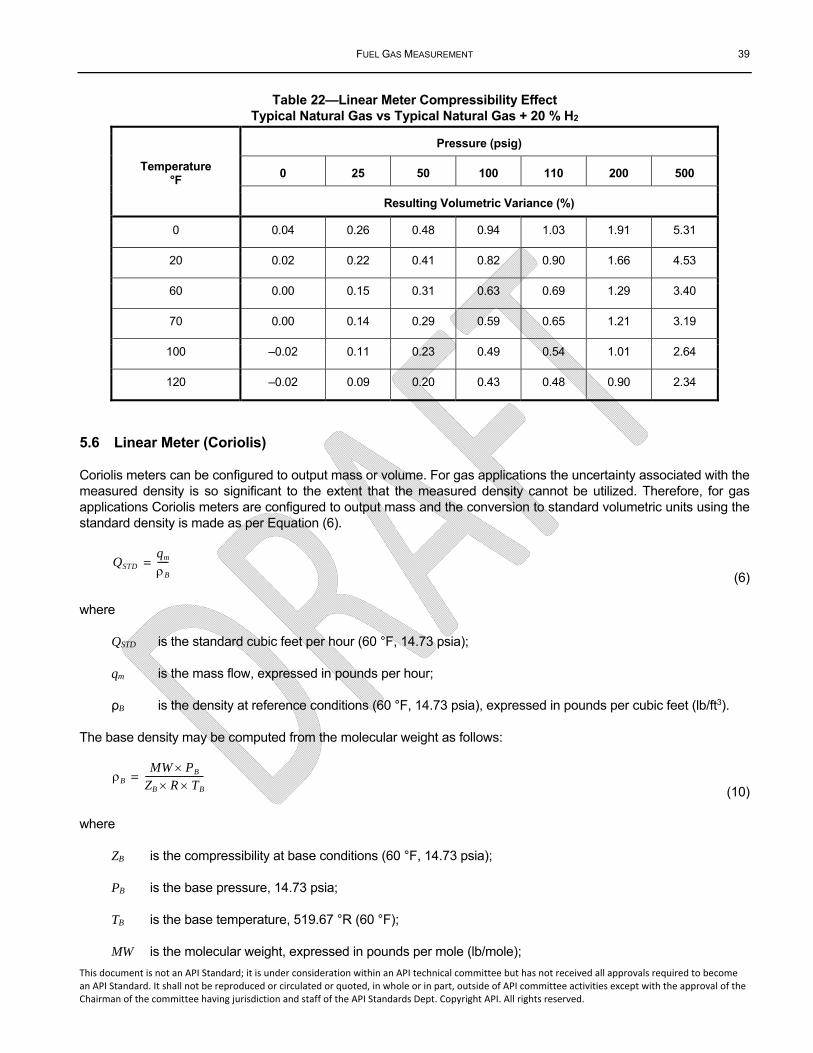
FUEL GAS MEASUREMENT 39
This document is not an API Standard; it is under consideration within an API technical committee but has not received all approvals required to become an API Standard. It shall not be reproduced or circulated or quoted, in whole or in part, outside of API committee activities except with the approval of the Chairman of the committee having jurisdiction and staff of the API Standards Dept. Copyright API. All rights reserved.
Table 22—Linear Meter Compressibility Effect Typical Natural Gas vs Typical Natural Gas + 20 % H2
Temperature °F
Pressure (psig)
0 25 50 100 110 200 500
Resulting Volumetric Variance (%)
0 0.04 0.26 0.48 0.94 1.03 1.91 5.31
20 0.02 0.22 0.41 0.82 0.90 1.66 4.53
60 0.00 0.15 0.31 0.63 0.69 1.29 3.40
70 0.00 0.14 0.29 0.59 0.65 1.21 3.19
100 –0.02 0.11 0.23 0.49 0.54 1.01 2.64
120 –0.02 0.09 0.20 0.43 0.48 0.90 2.34
5.6 Linear Meter (Coriolis)
Coriolis meters can be configured to output mass or volume. For gas applications the uncertainty associated with the measured density is so significant to the extent that the measured density cannot be utilized. Therefore, for gas applications Coriolis meters are configured to output mass and the conversion to standard volumetric units using the standard density is made as per Equation (6).
(6)
where
QSTD is the standard cubic feet per hour (60 °F, 14.73 psia);
qm is the mass flow, expressed in pounds per hour;
ρB is the density at reference conditions (60 °F, 14.73 psia), expressed in pounds per cubic feet (lb/ft3).
The base density may be computed from the molecular weight as follows:
(10)
where
ZB is the compressibility at base conditions (60 °F, 14.73 psia);
PB is the base pressure, 14.73 psia;
TB is the base temperature, 519.67 °R (60 °F);
MW is the molecular weight, expressed in pounds per mole (lb/mole);
QSTD
qm
B
-----=
B
MW PBZB R TB---------------------------=
40 CHAPTER 14—NATURAL GAS MEASUREMENT
This document is not an API Standard; it is under consideration within an API technical committee but has not received all approvals required to become an API Standard. It shall not be reproduced or circulated or quoted, in whole or in part, outside of API committee activities except with the approval of the Chairman of the committee having jurisdiction and staff of the API Standards Dept. Copyright API. All rights reserved.
R is 10.73151: the universal gas constant (1545.33 ft-lbf/lb mol °R) divided by 122 for proper unit conversion.
From Equation (10) one can see that the base density is only influenced by the gas composition, which can be assessed by on-line sampling and analysis (e.g. GC) or by grab sampling and analysis. Errors in volumetric flow rate for Coriolis meters are proportional to uncorrected errors in molecular weight.
6 Inspection, Verification, and Calibration
6.1 General
There are numerous factors that influence a fuel gas meter's measurement uncertainty and overall accuracy. Periodic instrument inspection, verification, and as needed calibration, will lessen the contribution of possible instrument error to the flow measurement uncertainty determination.
Equipment owners are responsible for determining the frequency and method of instrument inspection, verification, and calibration. The equipment manufacturer should be consulted as needed to offer specific guidance regarding equipment performance verification.
6.2 System Overview for Selection of Maintenance Activity, Frequency, and Tolerance
The determination of instrument calibration or verification frequency is not an exact science, but the following offers some guidance.
The typical steps involved are as follows.
1) Define the individual streams' relative significance within the plant's fuel gas system.
2) For each stream, define the specific instruments or devices associated with the flow measurement that have to be inspected, verified, or calibrated at some frequency.
3) Determine the initial frequency of maintenance activity for each device or flow element based on:
a) regulatory requirements;
b) the stream's relative significance within the system;
c) the contribution to measurement uncertainty by the components (e.g. pressure transmitter, orifice plate, etc.) of the measurement system;
d) performance history of similar devices in similar or same service.
4) Determine the method and/or reference device with which the instrument or device will be inspected, verified, or calibrated.
5) Determine the acceptable tolerances for equipment inspection, verification, and calibration.
6) Utilize the documented findings to optimize (increase or decrease) the selected frequencies and/or activities.
Where available and appropriate, fuel gas mass balance data and statistical meter performance evaluation methods can be used to adjust verification requirements.
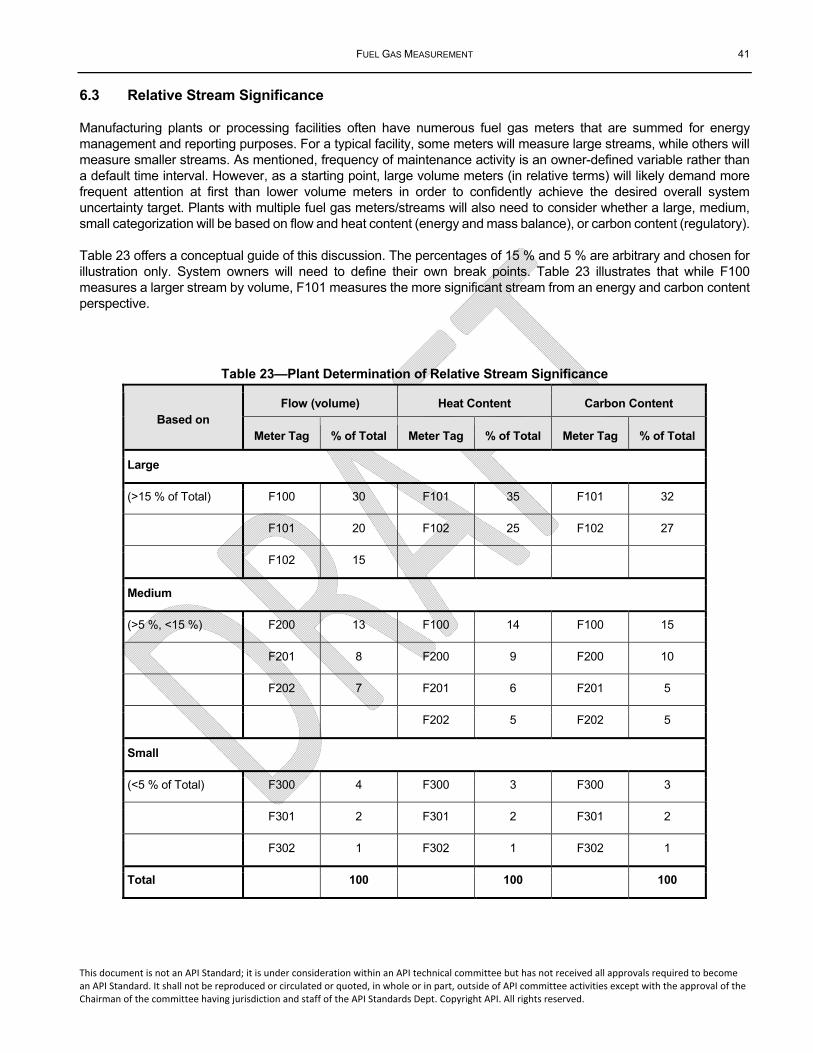
FUEL GAS MEASUREMENT 41
This document is not an API Standard; it is under consideration within an API technical committee but has not received all approvals required to become an API Standard. It shall not be reproduced or circulated or quoted, in whole or in part, outside of API committee activities except with the approval of the Chairman of the committee having jurisdiction and staff of the API Standards Dept. Copyright API. All rights reserved.
6.3 Relative Stream Significance
Manufacturing plants or processing facilities often have numerous fuel gas meters that are summed for energy management and reporting purposes. For a typical facility, some meters will measure large streams, while others will measure smaller streams. As mentioned, frequency of maintenance activity is an owner-defined variable rather than a default time interval. However, as a starting point, large volume meters (in relative terms) will likely demand more frequent attention at first than lower volume meters in order to confidently achieve the desired overall system uncertainty target. Plants with multiple fuel gas meters/streams will also need to consider whether a large, medium, small categorization will be based on flow and heat content (energy and mass balance), or carbon content (regulatory).
Table 23 offers a conceptual guide of this discussion. The percentages of 15 % and 5 % are arbitrary and chosen for illustration only. System owners will need to define their own break points. Table 23 illustrates that while F100 measures a larger stream by volume, F101 measures the more significant stream from an energy and carbon content perspective.
Table 23—Plant Determination of Relative Stream Significance
Based on Flow (volume) Heat Content Carbon Content
Meter Tag % of Total Meter Tag % of Total Meter Tag % of Total
Large
(>15 % of Total) F100 30 F101 35 F101 32
F101 20 F102 25 F102 27
F102 15
Medium
(>5 %, <15 %) F200 13 F100 14 F100 15
F201 8 F200 9 F200 10
F202 7 F201 6 F201 5
F202 5 F202 5
Small
(<5 % of Total) F300 4 F300 3 F300 3
F301 2 F301 2 F301 2
F302 1 F302 1 F302 1
Total 100 100 100
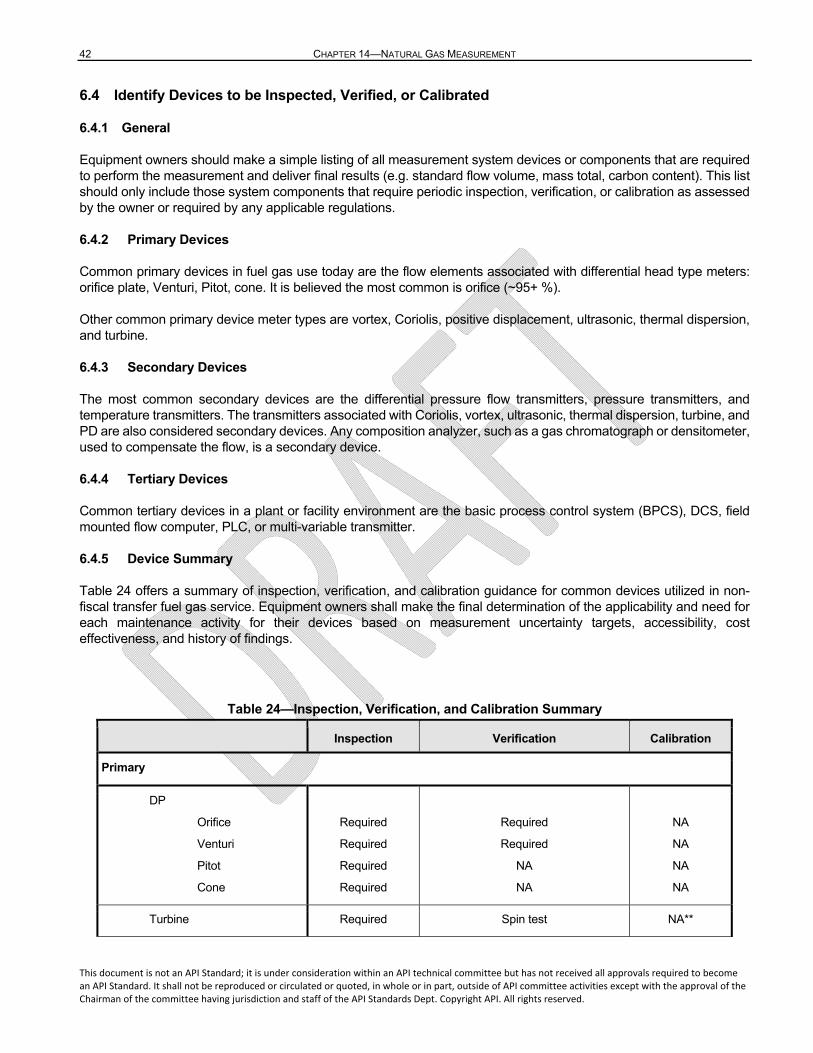
42 CHAPTER 14—NATURAL GAS MEASUREMENT
This document is not an API Standard; it is under consideration within an API technical committee but has not received all approvals required to become an API Standard. It shall not be reproduced or circulated or quoted, in whole or in part, outside of API committee activities except with the approval of the Chairman of the committee having jurisdiction and staff of the API Standards Dept. Copyright API. All rights reserved.
6.4 Identify Devices to be Inspected, Verified, or Calibrated
6.4.1 General
Equipment owners should make a simple listing of all measurement system devices or components that are required to perform the measurement and deliver final results (e.g. standard flow volume, mass total, carbon content). This list should only include those system components that require periodic inspection, verification, or calibration as assessed by the owner or required by any applicable regulations.
6.4.2 Primary Devices
Common primary devices in fuel gas use today are the flow elements associated with differential head type meters: orifice plate, Venturi, Pitot, cone. It is believed the most common is orifice (~95+ %).
Other common primary device meter types are vortex, Coriolis, positive displacement, ultrasonic, thermal dispersion, and turbine.
6.4.3 Secondary Devices
The most common secondary devices are the differential pressure flow transmitters, pressure transmitters, and temperature transmitters. The transmitters associated with Coriolis, vortex, ultrasonic, thermal dispersion, turbine, and PD are also considered secondary devices. Any composition analyzer, such as a gas chromatograph or densitometer, used to compensate the flow, is a secondary device.
6.4.4 Tertiary Devices
Common tertiary devices in a plant or facility environment are the basic process control system (BPCS), DCS, field mounted flow computer, PLC, or multi-variable transmitter.
6.4.5 Device Summary
Table 24 offers a summary of inspection, verification, and calibration guidance for common devices utilized in non-fiscal transfer fuel gas service. Equipment owners shall make the final determination of the applicability and need for each maintenance activity for their devices based on measurement uncertainty targets, accessibility, cost effectiveness, and history of findings.
Table 24—Inspection, Verification, and Calibration Summary
Inspection Verification Calibration
Primary
DP
Orifice
Venturi
Pitot
Cone
Required
Required
Required
Required
Required
Required
NA
NA
NA
NA
NA
NA
Turbine Required Spin test NA**
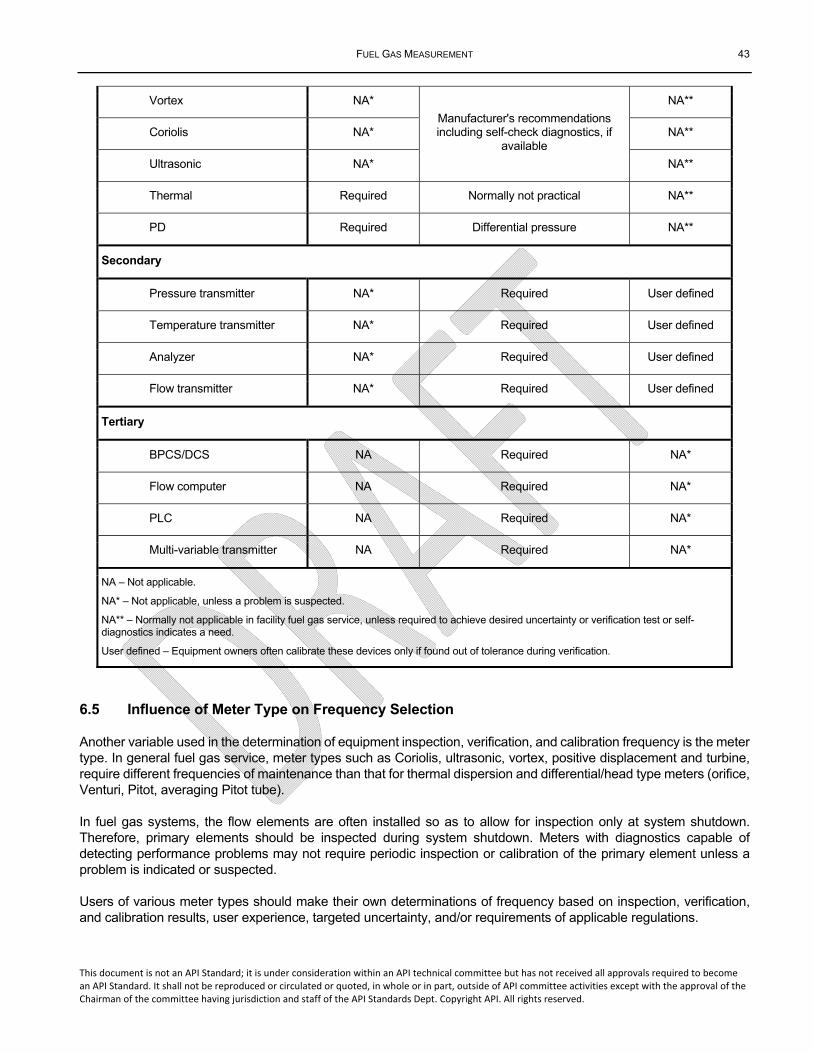
FUEL GAS MEASUREMENT 43
This document is not an API Standard; it is under consideration within an API technical committee but has not received all approvals required to become an API Standard. It shall not be reproduced or circulated or quoted, in whole or in part, outside of API committee activities except with the approval of the Chairman of the committee having jurisdiction and staff of the API Standards Dept. Copyright API. All rights reserved.
Vortex NA*
Manufacturer's recommendations including self-check diagnostics, if
available
NA**
Coriolis NA* NA**
Ultrasonic NA* NA**
Thermal Required Normally not practical NA**
PD Required Differential pressure NA**
Secondary
Pressure transmitter NA* Required User defined
Temperature transmitter NA* Required User defined
Analyzer NA* Required User defined
Flow transmitter NA* Required User defined
Tertiary
BPCS/DCS NA Required NA*
Flow computer NA Required NA*
PLC NA Required NA*
Multi-variable transmitter NA Required NA*
NA – Not applicable.
NA* – Not applicable, unless a problem is suspected.
NA** – Normally not applicable in facility fuel gas service, unless required to achieve desired uncertainty or verification test or self-diagnostics indicates a need.
User defined – Equipment owners often calibrate these devices only if found out of tolerance during verification.
6.5 Influence of Meter Type on Frequency Selection
Another variable used in the determination of equipment inspection, verification, and calibration frequency is the meter type. In general fuel gas service, meter types such as Coriolis, ultrasonic, vortex, positive displacement and turbine, require different frequencies of maintenance than that for thermal dispersion and differential/head type meters (orifice, Venturi, Pitot, averaging Pitot tube).
In fuel gas systems, the flow elements are often installed so as to allow for inspection only at system shutdown. Therefore, primary elements should be inspected during system shutdown. Meters with diagnostics capable of detecting performance problems may not require periodic inspection or calibration of the primary element unless a problem is indicated or suspected.
Users of various meter types should make their own determinations of frequency based on inspection, verification, and calibration results, user experience, targeted uncertainty, and/or requirements of applicable regulations.
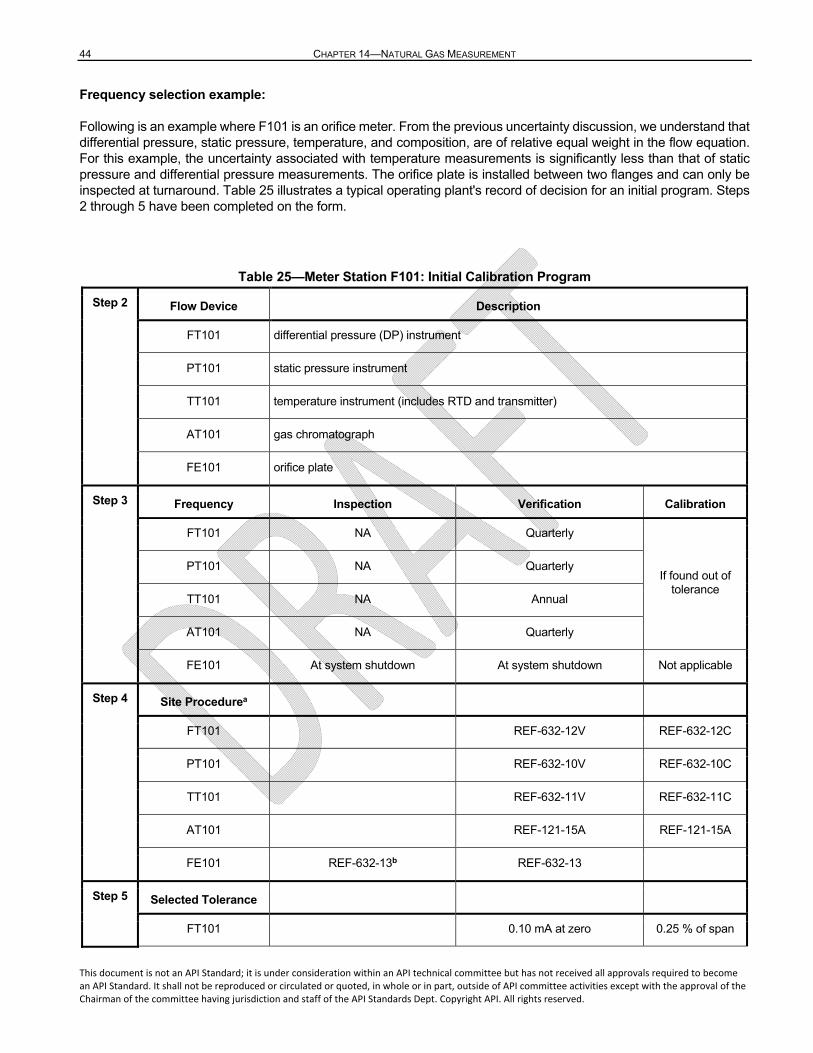
44 CHAPTER 14—NATURAL GAS MEASUREMENT
This document is not an API Standard; it is under consideration within an API technical committee but has not received all approvals required to become an API Standard. It shall not be reproduced or circulated or quoted, in whole or in part, outside of API committee activities except with the approval of the Chairman of the committee having jurisdiction and staff of the API Standards Dept. Copyright API. All rights reserved.
Frequency selection example:
Following is an example where F101 is an orifice meter. From the previous uncertainty discussion, we understand that differential pressure, static pressure, temperature, and composition, are of relative equal weight in the flow equation. For this example, the uncertainty associated with temperature measurements is significantly less than that of static pressure and differential pressure measurements. The orifice plate is installed between two flanges and can only be inspected at turnaround. Table 25 illustrates a typical operating plant's record of decision for an initial program. Steps 2 through 5 have been completed on the form.
Table 25—Meter Station F101: Initial Calibration Program
Step 2 Flow Device Description
FT101 differential pressure (DP) instrument
PT101 static pressure instrument
TT101 temperature instrument (includes RTD and transmitter)
AT101 gas chromatograph
FE101 orifice plate
Step 3 Frequency Inspection Verification Calibration
FT101 NA Quarterly
If found out of tolerance
PT101 NA Quarterly
TT101 NA Annual
AT101 NA Quarterly
FE101 At system shutdown At system shutdown Not applicable
Step 4 Site Procedurea
FT101 REF-632-12V REF-632-12C
PT101 REF-632-10V REF-632-10C
TT101 REF-632-11V REF-632-11C
AT101 REF-121-15A REF-121-15A
FE101 REF-632-13b REF-632-13
Step 5 Selected Tolerance
FT101 0.10 mA at zero 0.25 % of span
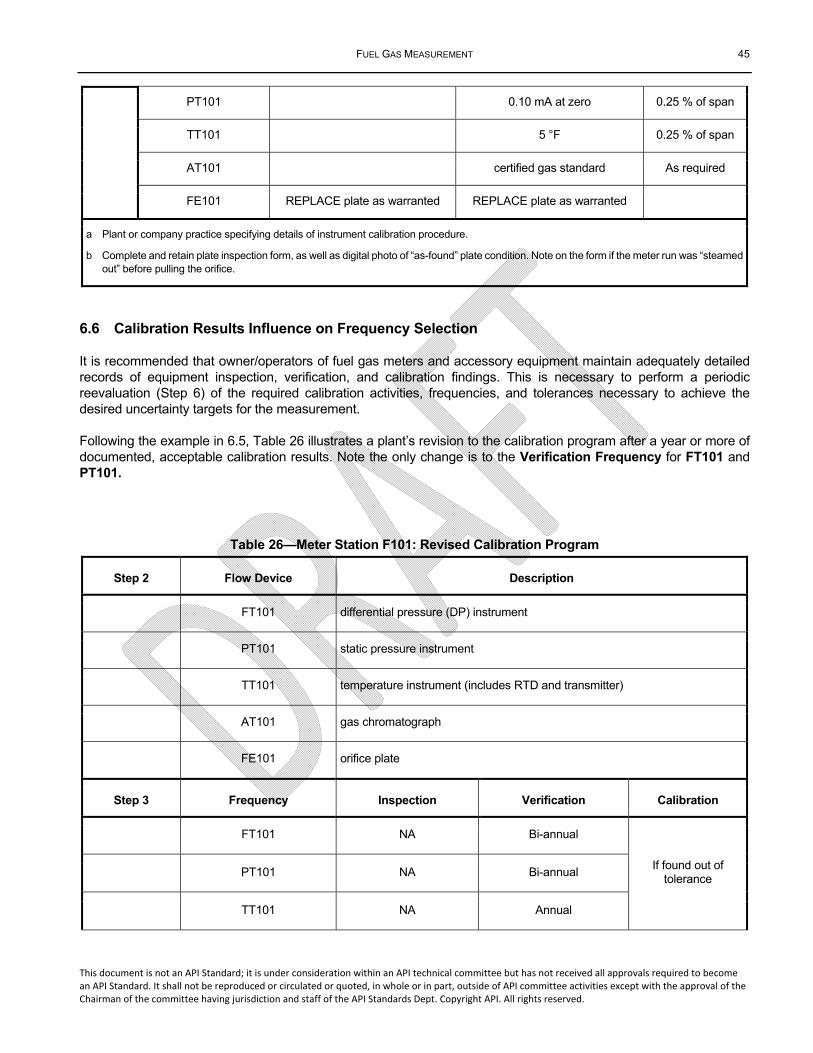
FUEL GAS MEASUREMENT 45
This document is not an API Standard; it is under consideration within an API technical committee but has not received all approvals required to become an API Standard. It shall not be reproduced or circulated or quoted, in whole or in part, outside of API committee activities except with the approval of the Chairman of the committee having jurisdiction and staff of the API Standards Dept. Copyright API. All rights reserved.
PT101 0.10 mA at zero 0.25 % of span
TT101 5 °F 0.25 % of span
AT101 certified gas standard As required
FE101 REPLACE plate as warranted REPLACE plate as warranted
a Plant or company practice specifying details of instrument calibration procedure.
b Complete and retain plate inspection form, as well as digital photo of “as-found” plate condition. Note on the form if the meter run was “steamed out” before pulling the orifice.
6.6 Calibration Results Influence on Frequency Selection
It is recommended that owner/operators of fuel gas meters and accessory equipment maintain adequately detailed records of equipment inspection, verification, and calibration findings. This is necessary to perform a periodic reevaluation (Step 6) of the required calibration activities, frequencies, and tolerances necessary to achieve the desired uncertainty targets for the measurement.
Following the example in 6.5, Table 26 illustrates a plant’s revision to the calibration program after a year or more of documented, acceptable calibration results. Note the only change is to the Verification Frequency for FT101 and PT101.
Table 26—Meter Station F101: Revised Calibration Program
Step 2 Flow Device Description
FT101 differential pressure (DP) instrument
PT101 static pressure instrument
TT101 temperature instrument (includes RTD and transmitter)
AT101 gas chromatograph
FE101 orifice plate
Step 3 Frequency Inspection Verification Calibration
FT101 NA Bi-annual
If found out of tolerance
PT101 NA Bi-annual
TT101 NA Annual
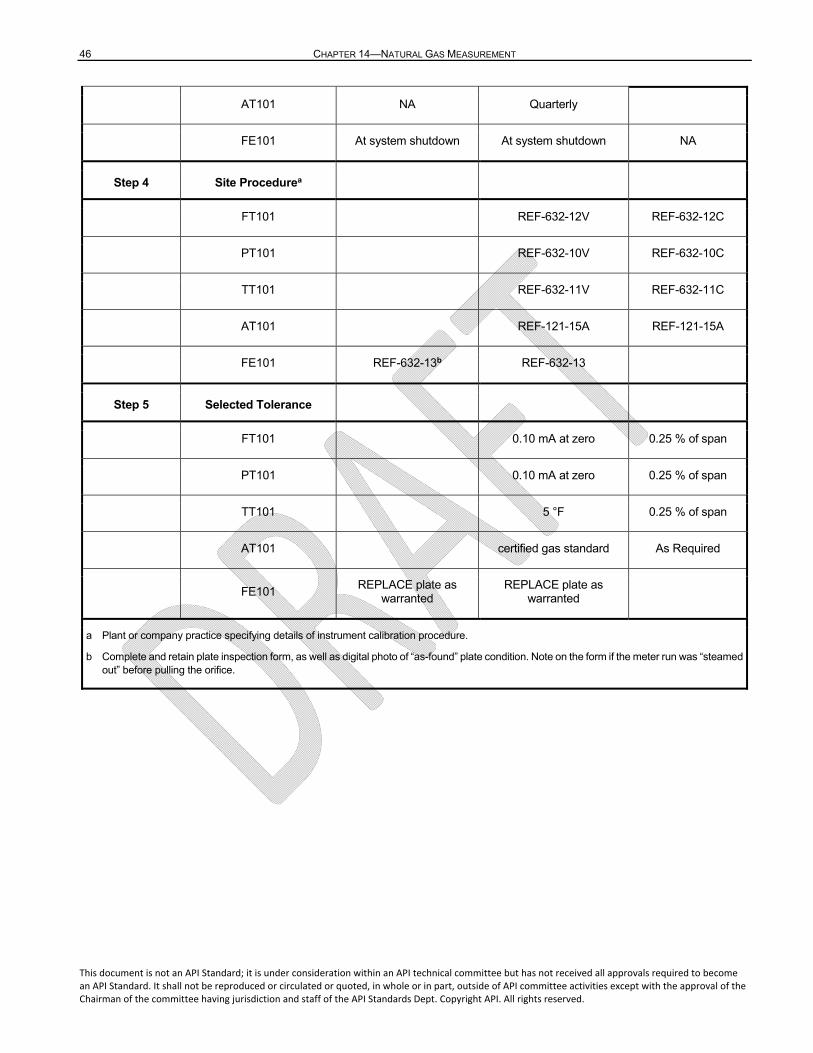
46 CHAPTER 14—NATURAL GAS MEASUREMENT
This document is not an API Standard; it is under consideration within an API technical committee but has not received all approvals required to become an API Standard. It shall not be reproduced or circulated or quoted, in whole or in part, outside of API committee activities except with the approval of the Chairman of the committee having jurisdiction and staff of the API Standards Dept. Copyright API. All rights reserved.
AT101 NA Quarterly
FE101 At system shutdown At system shutdown NA
Step 4 Site Procedurea
FT101 REF-632-12V REF-632-12C
PT101 REF-632-10V REF-632-10C
TT101 REF-632-11V REF-632-11C
AT101 REF-121-15A REF-121-15A
FE101 REF-632-13b REF-632-13
Step 5 Selected Tolerance
FT101 0.10 mA at zero 0.25 % of span
PT101 0.10 mA at zero 0.25 % of span
TT101 5 °F 0.25 % of span
AT101 certified gas standard As Required
FE101 REPLACE plate as
warranted REPLACE plate as
warranted
a Plant or company practice specifying details of instrument calibration procedure.
b Complete and retain plate inspection form, as well as digital photo of “as-found” plate condition. Note on the form if the meter run was “steamed out” before pulling the orifice.
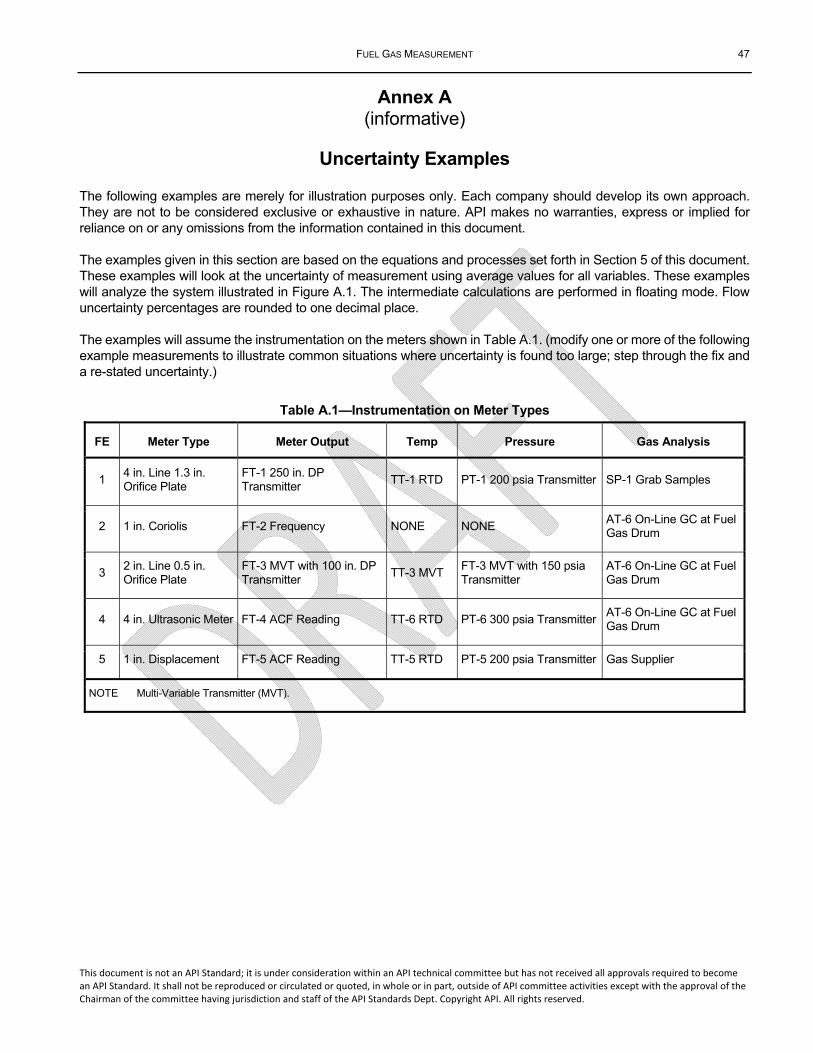
FUEL GAS MEASUREMENT 47
This document is not an API Standard; it is under consideration within an API technical committee but has not received all approvals required to become an API Standard. It shall not be reproduced or circulated or quoted, in whole or in part, outside of API committee activities except with the approval of the Chairman of the committee having jurisdiction and staff of the API Standards Dept. Copyright API. All rights reserved.
Annex A (informative)
Uncertainty Examples
The following examples are merely for illustration purposes only. Each company should develop its own approach. They are not to be considered exclusive or exhaustive in nature. API makes no warranties, express or implied for reliance on or any omissions from the information contained in this document.
The examples given in this section are based on the equations and processes set forth in Section 5 of this document. These examples will look at the uncertainty of measurement using average values for all variables. These examples will analyze the system illustrated in Figure A.1. The intermediate calculations are performed in floating mode. Flow uncertainty percentages are rounded to one decimal place.
The examples will assume the instrumentation on the meters shown in Table A.1. (modify one or more of the following example measurements to illustrate common situations where uncertainty is found too large; step through the fix and a re-stated uncertainty.)
Table A.1—Instrumentation on Meter Types
FE Meter Type Meter Output Temp Pressure Gas Analysis
1 4 in. Line 1.3 in. Orifice Plate
FT-1 250 in. DP Transmitter
TT-1 RTD PT-1 200 psia Transmitter SP-1 Grab Samples
2 1 in. Coriolis FT-2 Frequency NONE NONE AT-6 On-Line GC at Fuel Gas Drum
3 2 in. Line 0.5 in. Orifice Plate
FT-3 MVT with 100 in. DP Transmitter
TT-3 MVT FT-3 MVT with 150 psia Transmitter
AT-6 On-Line GC at Fuel Gas Drum
4 4 in. Ultrasonic Meter FT-4 ACF Reading TT-6 RTD PT-6 300 psia Transmitter AT-6 On-Line GC at Fuel Gas Drum
5 1 in. Displacement FT-5 ACF Reading TT-5 RTD PT-5 200 psia Transmitter Gas Supplier
NOTE Multi-Variable Transmitter (MVT).
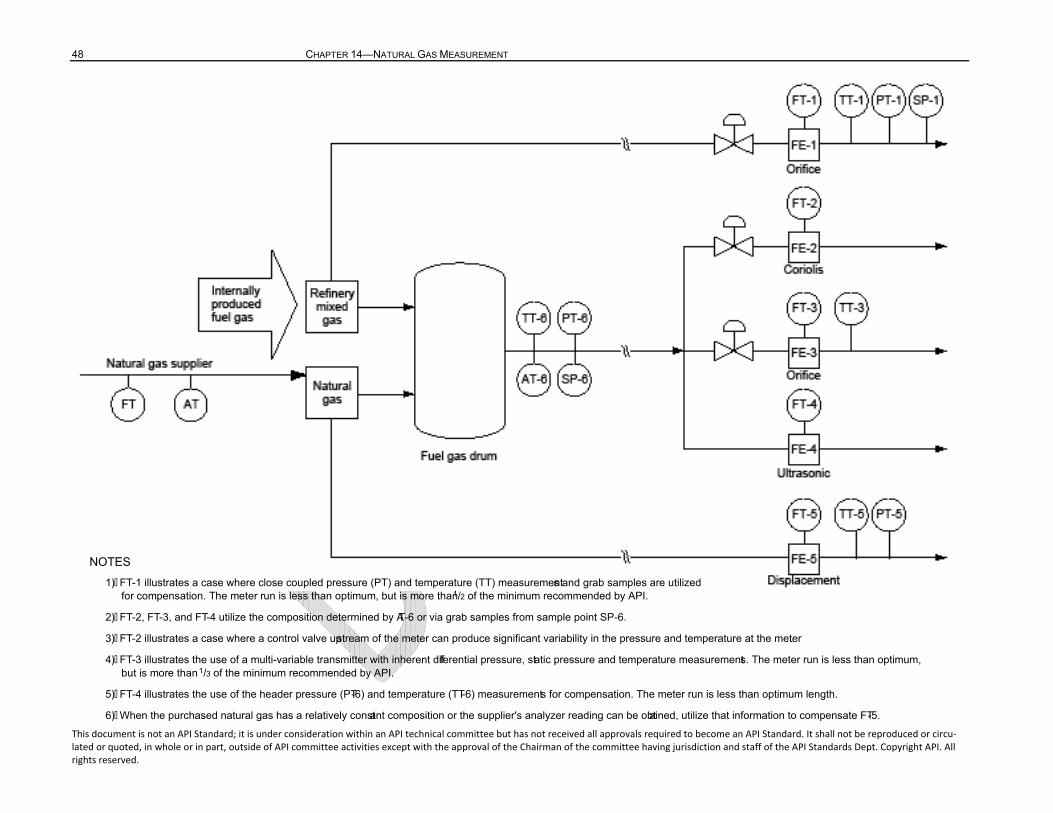
48 CHAPTER 14—NATURAL GAS MEASUREMENT
This document is not an API Standard; it is under consideration within an API technical committee but has not received all approvals required to become an API Standard. It shall not be reproduced or circu‐lated or quoted, in whole or in part, outside of API committee activities except with the approval of the Chairman of the committee having jurisdiction and staff of the API Standards Dept. Copyright API. All rights reserved.
NOTES
1) FT-1 illustrates a case where close coupled pressure (PT) and temperature (TT) measurements and grab samples are utilizedfor compensation. The meter run is less than optimum, but is more than1/2 of the minimum recommended by API.
2) FT-2, FT-3, and FT-4 utilize the composition determined by AT-6 or via grab samples from sample point SP-6.
3) FT-2 illustrates a case where a control valve upstream of the meter can produce significant variability in the pressure and temperature at the meter.
4) FT-3 illustrates the use of a multi-variable transmitter with inherent differential pressure, static pressure and temperature measurements. The meter run is less than optimum,but is more than1/3 of the minimum recommended by API.
5) FT-4 illustrates the use of the header pressure (PT-6) and temperature (TT-6) measurements for compensation. The meter run is less than optimum length.
6) When the purchased natural gas has a relatively constant composition or the supplier's analyzer reading can be obtained, utilize that information to compensate FT-5.
FUEL GAS MEASUREMENT 49
This document is not an API Standard; it is under consideration within an API technical committee but has not received all approvals required to become an API Standard. It shall not be reproduced or circu‐lated or quoted, in whole or in part, outside of API committee activities except with the approval of the Chairman of the committee having jurisdiction and staff of the API Standards Dept. Copyright API. All rights reserved.
Figure A.1—Example of Fuel Gas Measurement System (for Illustration Purposes Only)
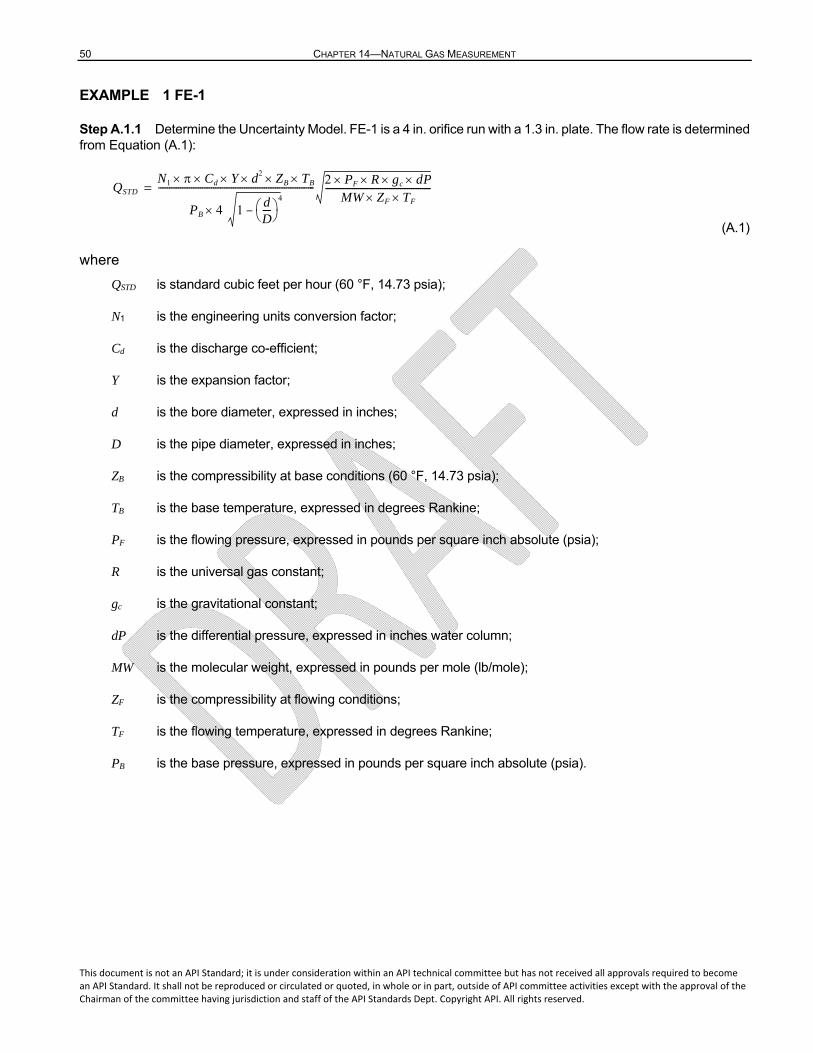
50 CHAPTER 14—NATURAL GAS MEASUREMENT
This document is not an API Standard; it is under consideration within an API technical committee but has not received all approvals required to become an API Standard. It shall not be reproduced or circulated or quoted, in whole or in part, outside of API committee activities except with the approval of the Chairman of the committee having jurisdiction and staff of the API Standards Dept. Copyright API. All rights reserved.
EXAMPLE 1 FE-1
Step A.1.1 Determine the Uncertainty Model. FE-1 is a 4 in. orifice run with a 1.3 in. plate. The flow rate is determined from Equation (A.1):
(A.1)
where
QSTD is standard cubic feet per hour (60 °F, 14.73 psia);
N1 is the engineering units conversion factor;
Cd is the discharge co-efficient;
Y is the expansion factor;
d is the bore diameter, expressed in inches;
D is the pipe diameter, expressed in inches;
ZB is the compressibility at base conditions (60 °F, 14.73 psia);
TB is the base temperature, expressed in degrees Rankine;
PF is the flowing pressure, expressed in pounds per square inch absolute (psia);
R is the universal gas constant;
gc is the gravitational constant;
dP is the differential pressure, expressed in inches water column;
MW is the molecular weight, expressed in pounds per mole (lb/mole);
ZF is the compressibility at flowing conditions;
TF is the flowing temperature, expressed in degrees Rankine;
PB is the base pressure, expressed in pounds per square inch absolute (psia).
QSTD
N1 Cd Y d2 ZB TB
PB 4 1dD----
4
–
----------------------------------------------------------------------- 2 P F R gc dPMW ZF TF
------------------------------------------------=
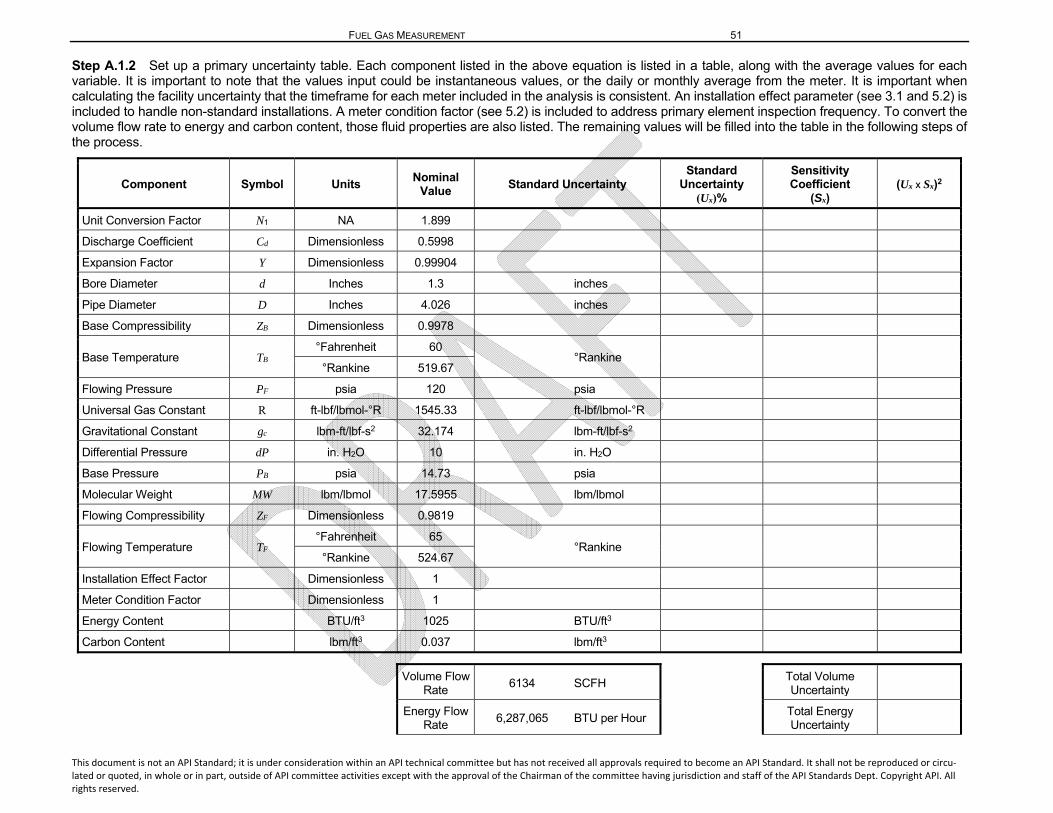
FUEL GAS MEASUREMENT 51
This document is not an API Standard; it is under consideration within an API technical committee but has not received all approvals required to become an API Standard. It shall not be reproduced or circu‐lated or quoted, in whole or in part, outside of API committee activities except with the approval of the Chairman of the committee having jurisdiction and staff of the API Standards Dept. Copyright API. All rights reserved.
Step A.1.2 Set up a primary uncertainty table. Each component listed in the above equation is listed in a table, along with the average values for each variable. It is important to note that the values input could be instantaneous values, or the daily or monthly average from the meter. It is important when calculating the facility uncertainty that the timeframe for each meter included in the analysis is consistent. An installation effect parameter (see 3.1 and 5.2) is included to handle non-standard installations. A meter condition factor (see 5.2) is included to address primary element inspection frequency. To convert the volume flow rate to energy and carbon content, those fluid properties are also listed. The remaining values will be filled into the table in the following steps of the process.
Component Symbol Units Nominal
Value Standard Uncertainty
Standard Uncertainty
(Ux)%
Sensitivity Coefficient
(Sx)(Ux x Sx)2
Unit Conversion Factor N1 NA 1.899
Discharge Coefficient Cd Dimensionless 0.5998
Expansion Factor Y Dimensionless 0.99904
Bore Diameter d Inches 1.3 inches
Pipe Diameter D Inches 4.026 inches
Base Compressibility ZB Dimensionless 0.9978
Base Temperature TB °Fahrenheit 60
°Rankine °Rankine 519.67
Flowing Pressure PF psia 120 psia
Universal Gas Constant R ft-lbf/lbmol-°R 1545.33 ft-lbf/lbmol-°R
Gravitational Constant gc lbm-ft/lbf-s2 32.174 lbm-ft/lbf-s2
Differential Pressure dP in. H2O 10 in. H2O
Base Pressure PB psia 14.73 psia
Molecular Weight MW lbm/lbmol 17.5955 lbm/lbmol
Flowing Compressibility ZF Dimensionless 0.9819
Flowing Temperature TF °Fahrenheit 65
°Rankine °Rankine 524.67
Installation Effect Factor Dimensionless 1
Meter Condition Factor Dimensionless 1
Energy Content BTU/ft3 1025 BTU/ft3
Carbon Content lbm/ft3 0.037 lbm/ft3
Volume Flow Rate
6134 SCFH
Total Volume Uncertainty
Energy Flow Rate
6,287,065 BTU per Hour Total Energy Uncertainty
52 CHAPTER 14—NATURAL GAS MEASUREMENT
This document is not an API Standard; it is under consideration within an API technical committee but has not received all approvals required to become an API Standard. It shall not be reproduced or circu‐lated or quoted, in whole or in part, outside of API committee activities except with the approval of the Chairman of the committee having jurisdiction and staff of the API Standards Dept. Copyright API. All rights reserved.
Carbon Flow Rate
0.113 Tons per Hour Total Carbon Uncertainty
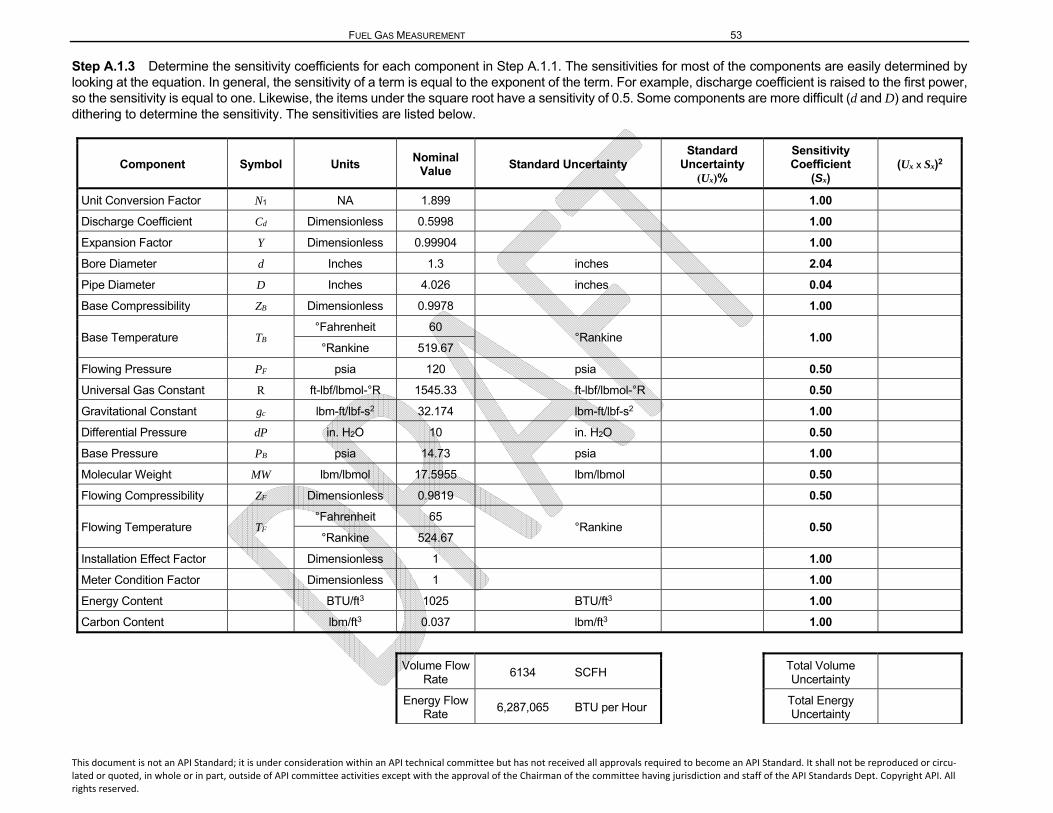
FUEL GAS MEASUREMENT 53
This document is not an API Standard; it is under consideration within an API technical committee but has not received all approvals required to become an API Standard. It shall not be reproduced or circu‐lated or quoted, in whole or in part, outside of API committee activities except with the approval of the Chairman of the committee having jurisdiction and staff of the API Standards Dept. Copyright API. All rights reserved.
Step A.1.3 Determine the sensitivity coefficients for each component in Step A.1.1. The sensitivities for most of the components are easily determined by looking at the equation. In general, the sensitivity of a term is equal to the exponent of the term. For example, discharge coefficient is raised to the first power, so the sensitivity is equal to one. Likewise, the items under the square root have a sensitivity of 0.5. Some components are more difficult (d and D) and require dithering to determine the sensitivity. The sensitivities are listed below.
Component Symbol Units Nominal
Value Standard Uncertainty
Standard Uncertainty
(Ux)%
Sensitivity Coefficient
(Sx)(Ux x Sx)2
Unit Conversion Factor N1 NA 1.899 1.00
Discharge Coefficient Cd Dimensionless 0.5998 1.00
Expansion Factor Y Dimensionless 0.99904 1.00
Bore Diameter d Inches 1.3 inches 2.04
Pipe Diameter D Inches 4.026 inches 0.04
Base Compressibility ZB Dimensionless 0.9978 1.00
Base Temperature TB °Fahrenheit 60
°Rankine 1.00 °Rankine 519.67
Flowing Pressure PF psia 120 psia 0.50
Universal Gas Constant R ft-lbf/lbmol-°R 1545.33 ft-lbf/lbmol-°R 0.50
Gravitational Constant gc lbm-ft/lbf-s2 32.174 lbm-ft/lbf-s2 1.00
Differential Pressure dP in. H2O 10 in. H2O 0.50
Base Pressure PB psia 14.73 psia 1.00
Molecular Weight MW lbm/lbmol 17.5955 lbm/lbmol 0.50
Flowing Compressibility ZF Dimensionless 0.9819 0.50
Flowing Temperature TF °Fahrenheit 65
°Rankine 0.50 °Rankine 524.67
Installation Effect Factor Dimensionless 1 1.00
Meter Condition Factor Dimensionless 1 1.00
Energy Content BTU/ft3 1025 BTU/ft3 1.00
Carbon Content lbm/ft3 0.037 lbm/ft3 1.00
Volume Flow Rate
6134 SCFH
Total Volume Uncertainty
Energy Flow Rate
6,287,065 BTU per Hour Total Energy Uncertainty
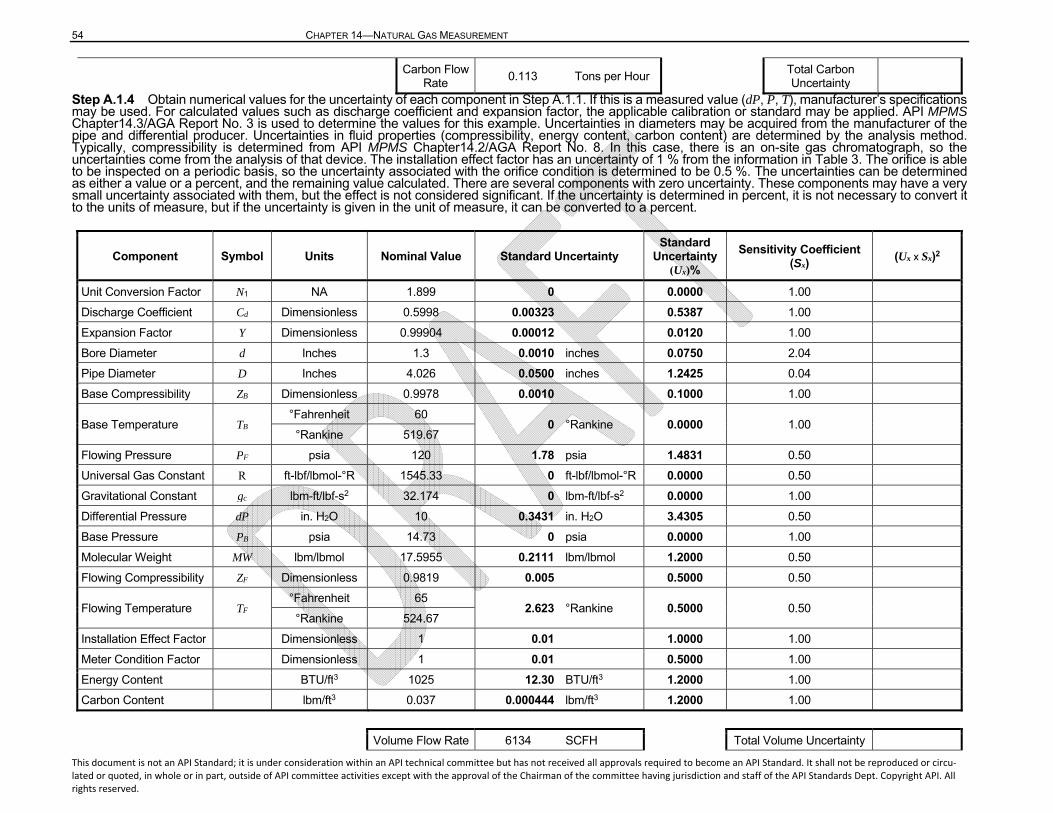
54 CHAPTER 14—NATURAL GAS MEASUREMENT
This document is not an API Standard; it is under consideration within an API technical committee but has not received all approvals required to become an API Standard. It shall not be reproduced or circu‐lated or quoted, in whole or in part, outside of API committee activities except with the approval of the Chairman of the committee having jurisdiction and staff of the API Standards Dept. Copyright API. All rights reserved.
Carbon Flow Rate
0.113 Tons per Hour Total Carbon Uncertainty
Step A.1.4 Obtain numerical values for the uncertainty of each component in Step A.1.1. If this is a measured value (dP, P, T), manufacturer’s specifications may be used. For calculated values such as discharge coefficient and expansion factor, the applicable calibration or standard may be applied. API MPMS Chapter14.3/AGA Report No. 3 is used to determine the values for this example. Uncertainties in diameters may be acquired from the manufacturer of the pipe and differential producer. Uncertainties in fluid properties (compressibility, energy content, carbon content) are determined by the analysis method. Typically, compressibility is determined from API MPMS Chapter14.2/AGA Report No. 8. In this case, there is an on-site gas chromatograph, so the uncertainties come from the analysis of that device. The installation effect factor has an uncertainty of 1 % from the information in Table 3. The orifice is able to be inspected on a periodic basis, so the uncertainty associated with the orifice condition is determined to be 0.5 %. The uncertainties can be determined as either a value or a percent, and the remaining value calculated. There are several components with zero uncertainty. These components may have a very small uncertainty associated with them, but the effect is not considered significant. If the uncertainty is determined in percent, it is not necessary to convert it to the units of measure, but if the uncertainty is given in the unit of measure, it can be converted to a percent.
Component Symbol Units Nominal Value Standard Uncertainty Standard
Uncertainty (Ux)%
Sensitivity Coefficient (Sx)
(Ux x Sx)2
Unit Conversion Factor N1 NA 1.899 0 0.0000 1.00
Discharge Coefficient Cd Dimensionless 0.5998 0.00323 0.5387 1.00
Expansion Factor Y Dimensionless 0.99904 0.00012 0.0120 1.00
Bore Diameter d Inches 1.3 0.0010 inches 0.0750 2.04
Pipe Diameter D Inches 4.026 0.0500 inches 1.2425 0.04
Base Compressibility ZB Dimensionless 0.9978 0.0010 0.1000 1.00
Base Temperature TB °Fahrenheit 60
0 °Rankine 0.0000 1.00 °Rankine 519.67
Flowing Pressure PF psia 120 1.78 psia 1.4831 0.50
Universal Gas Constant R ft-lbf/lbmol-°R 1545.33 0 ft-lbf/lbmol-°R 0.0000 0.50
Gravitational Constant gc lbm-ft/lbf-s2 32.174 0 lbm-ft/lbf-s2 0.0000 1.00
Differential Pressure dP in. H2O 10 0.3431 in. H2O 3.4305 0.50
Base Pressure PB psia 14.73 0 psia 0.0000 1.00
Molecular Weight MW lbm/lbmol 17.5955 0.2111 lbm/lbmol 1.2000 0.50
Flowing Compressibility ZF Dimensionless 0.9819 0.005 0.5000 0.50
Flowing Temperature TF °Fahrenheit 65
2.623 °Rankine 0.5000 0.50 °Rankine 524.67
Installation Effect Factor Dimensionless 1 0.01 1.0000 1.00
Meter Condition Factor Dimensionless 1 0.01 0.5000 1.00
Energy Content BTU/ft3 1025 12.30 BTU/ft3 1.2000 1.00
Carbon Content lbm/ft3 0.037 0.000444 lbm/ft3 1.2000 1.00
Volume Flow Rate 6134 SCFH Total Volume Uncertainty
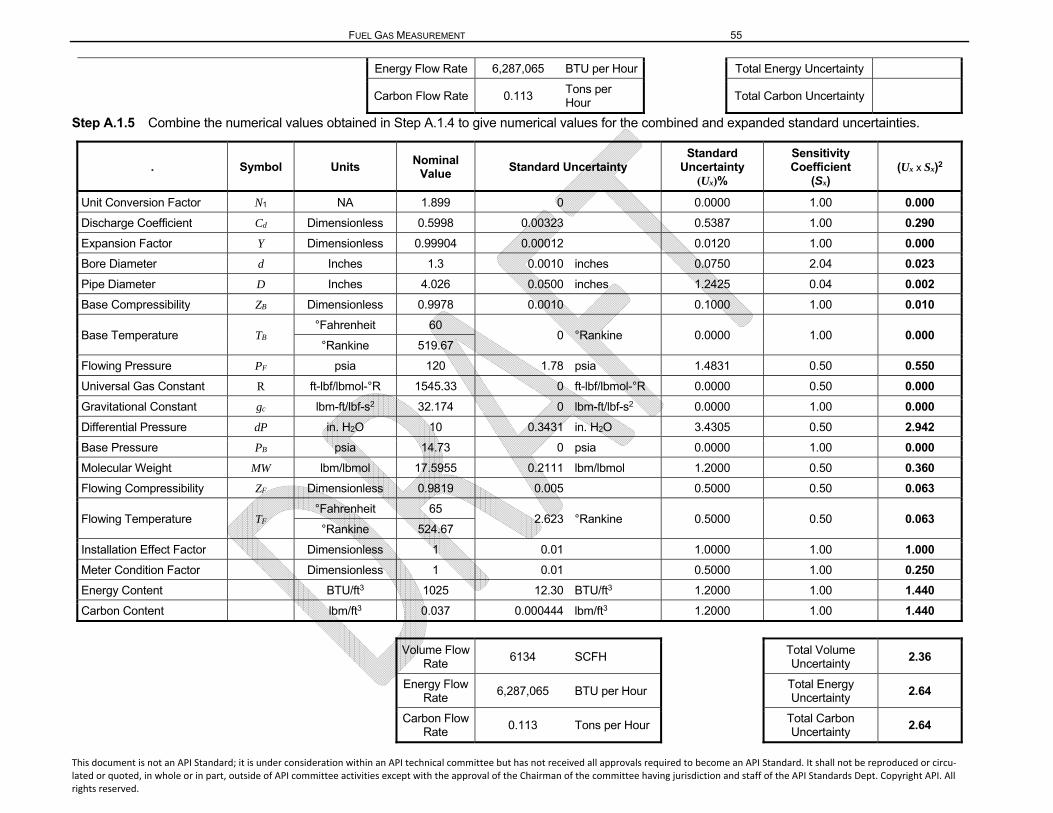
FUEL GAS MEASUREMENT 55
This document is not an API Standard; it is under consideration within an API technical committee but has not received all approvals required to become an API Standard. It shall not be reproduced or circu‐lated or quoted, in whole or in part, outside of API committee activities except with the approval of the Chairman of the committee having jurisdiction and staff of the API Standards Dept. Copyright API. All rights reserved.
Energy Flow Rate 6,287,065 BTU per Hour Total Energy Uncertainty
Carbon Flow Rate 0.113 Tons per Hour
Total Carbon Uncertainty
Step A.1.5 Combine the numerical values obtained in Step A.1.4 to give numerical values for the combined and expanded standard uncertainties.
. Symbol Units Nominal
Value Standard Uncertainty
Standard Uncertainty
(Ux)%
Sensitivity Coefficient
(Sx)(Ux x Sx)2
Unit Conversion Factor N1 NA 1.899 0 0.0000 1.00 0.000
Discharge Coefficient Cd Dimensionless 0.5998 0.00323 0.5387 1.00 0.290
Expansion Factor Y Dimensionless 0.99904 0.00012 0.0120 1.00 0.000
Bore Diameter d Inches 1.3 0.0010 inches 0.0750 2.04 0.023
Pipe Diameter D Inches 4.026 0.0500 inches 1.2425 0.04 0.002
Base Compressibility ZB Dimensionless 0.9978 0.0010 0.1000 1.00 0.010
Base Temperature TB °Fahrenheit 60
0 °Rankine 0.0000 1.00 0.000 °Rankine 519.67
Flowing Pressure PF psia 120 1.78 psia 1.4831 0.50 0.550
Universal Gas Constant R ft-lbf/lbmol-°R 1545.33 0 ft-lbf/lbmol-°R 0.0000 0.50 0.000
Gravitational Constant gc lbm-ft/lbf-s2 32.174 0 lbm-ft/lbf-s2 0.0000 1.00 0.000
Differential Pressure dP in. H2O 10 0.3431 in. H2O 3.4305 0.50 2.942
Base Pressure PB psia 14.73 0 psia 0.0000 1.00 0.000
Molecular Weight MW lbm/lbmol 17.5955 0.2111 lbm/lbmol 1.2000 0.50 0.360
Flowing Compressibility ZF Dimensionless 0.9819 0.005 0.5000 0.50 0.063
Flowing Temperature TF °Fahrenheit 65
2.623 °Rankine 0.5000 0.50 0.063 °Rankine 524.67
Installation Effect Factor Dimensionless 1 0.01 1.0000 1.00 1.000
Meter Condition Factor Dimensionless 1 0.01 0.5000 1.00 0.250
Energy Content BTU/ft3 1025 12.30 BTU/ft3 1.2000 1.00 1.440
Carbon Content lbm/ft3 0.037 0.000444 lbm/ft3 1.2000 1.00 1.440
Volume Flow Rate
6134 SCFH
Total Volume Uncertainty
2.36
Energy Flow Rate
6,287,065 BTU per Hour Total Energy Uncertainty
2.64
Carbon Flow Rate
0.113 Tons per Hour Total Carbon Uncertainty
2.64
56 CHAPTER 14—NATURAL GAS MEASUREMENT
This document is not an API Standard; it is under consideration within an API technical committee but has not received all approvals required to become an API Standard. It shall not be reproduced or circu‐lated or quoted, in whole or in part, outside of API committee activities except with the approval of the Chairman of the committee having jurisdiction and staff of the API Standards Dept. Copyright API. All rights reserved.
The total uncertainty is determined by summing the individual combined uncertainties (Ux x Sx)2 and taking the square root of that sum. Because this example looks at three different uncertainties (volume, energy, and carbon), the calculation is performed three different ways. To calculate the volume uncertainty, all components are included with the exception of energy content and carbon content. To calculate the energy uncertainty, all components are included with the exception of the carbon content. To calculate the carbon uncertainty, all components are included with the exception of the energy content. Note that in this case, the Energy Uncertainty and the Carbon Uncertainty are equivalent, because the uncertainty in Energy and Carbon Content is the same.
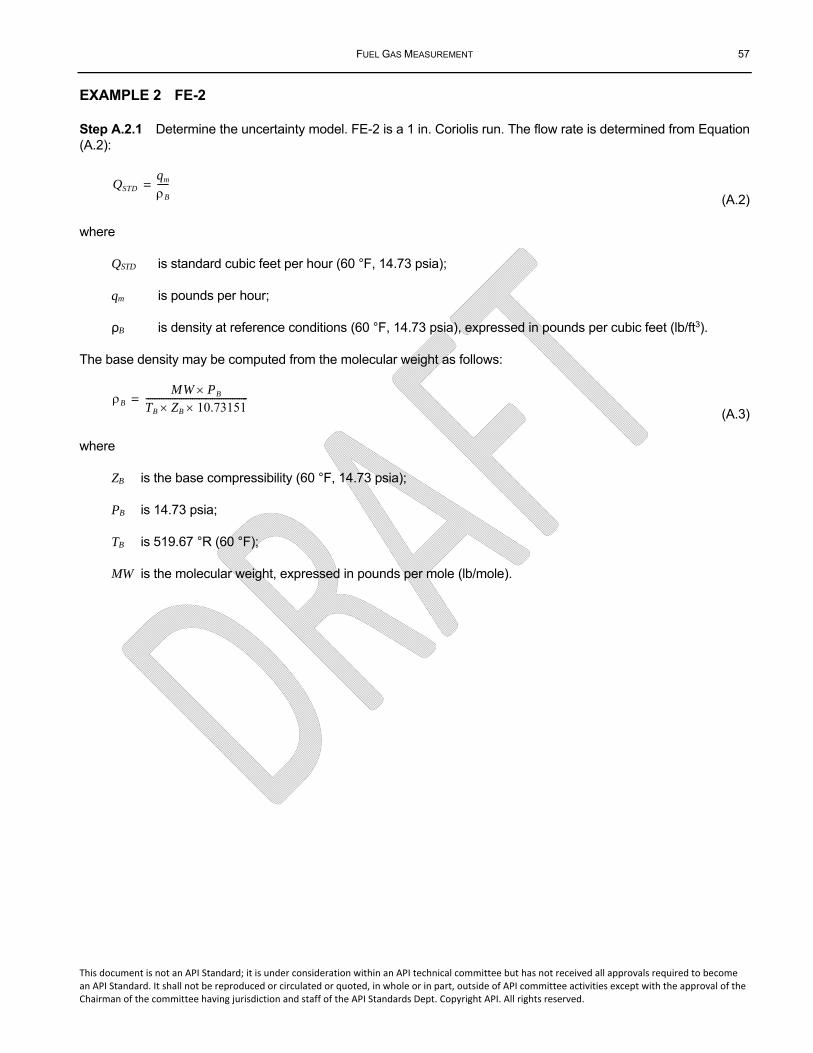
FUEL GAS MEASUREMENT 57
This document is not an API Standard; it is under consideration within an API technical committee but has not received all approvals required to become an API Standard. It shall not be reproduced or circulated or quoted, in whole or in part, outside of API committee activities except with the approval of the Chairman of the committee having jurisdiction and staff of the API Standards Dept. Copyright API. All rights reserved.
EXAMPLE 2 FE-2
Step A.2.1 Determine the uncertainty model. FE-2 is a 1 in. Coriolis run. The flow rate is determined from Equation (A.2):
(A.2)
where
QSTD is standard cubic feet per hour (60 °F, 14.73 psia);
qm is pounds per hour;
ρB is density at reference conditions (60 °F, 14.73 psia), expressed in pounds per cubic feet (lb/ft3).
The base density may be computed from the molecular weight as follows:
(A.3)
where
ZB is the base compressibility (60 °F, 14.73 psia);
PB is 14.73 psia;
TB is 519.67 °R (60 °F);
MW is the molecular weight, expressed in pounds per mole (lb/mole).
QSTD
qm
B
-----=
B
MW PBTB ZB 10.73151----------------------------------------------=
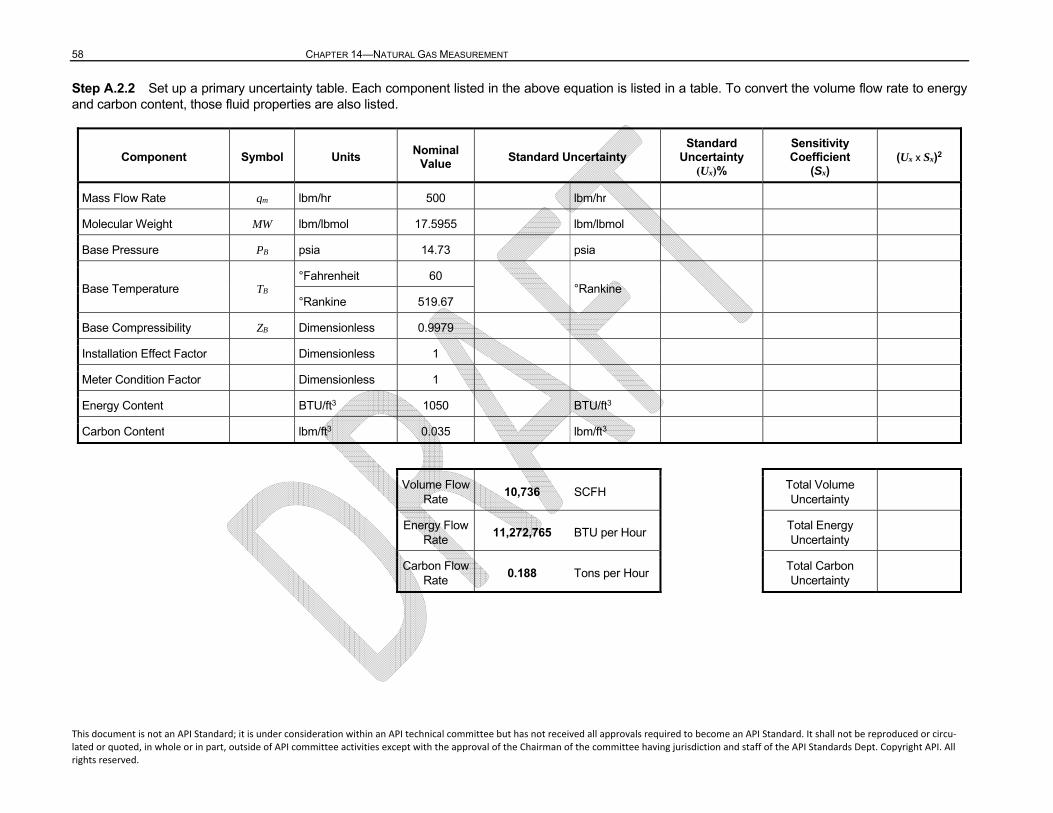
58 CHAPTER 14—NATURAL GAS MEASUREMENT
This document is not an API Standard; it is under consideration within an API technical committee but has not received all approvals required to become an API Standard. It shall not be reproduced or circu‐lated or quoted, in whole or in part, outside of API committee activities except with the approval of the Chairman of the committee having jurisdiction and staff of the API Standards Dept. Copyright API. All rights reserved.
Step A.2.2 Set up a primary uncertainty table. Each component listed in the above equation is listed in a table. To convert the volume flow rate to energy and carbon content, those fluid properties are also listed.
Component Symbol Units Nominal
Value Standard Uncertainty
Standard Uncertainty
(Ux)%
Sensitivity Coefficient
(Sx)(Ux x Sx)2
Mass Flow Rate qm lbm/hr 500 lbm/hr
Molecular Weight MW lbm/lbmol 17.5955 lbm/lbmol
Base Pressure PB psia 14.73 psia
Base Temperature TB °Fahrenheit 60
°Rankine °Rankine 519.67
Base Compressibility ZB Dimensionless 0.9979
Installation Effect Factor Dimensionless 1
Meter Condition Factor Dimensionless 1
Energy Content BTU/ft3 1050 BTU/ft3
Carbon Content lbm/ft3 0.035 lbm/ft3
Volume Flow Rate
10,736 SCFH
Total Volume Uncertainty
Energy Flow Rate
11,272,765 BTU per Hour Total Energy Uncertainty
Carbon Flow Rate
0.188 Tons per Hour Total Carbon Uncertainty
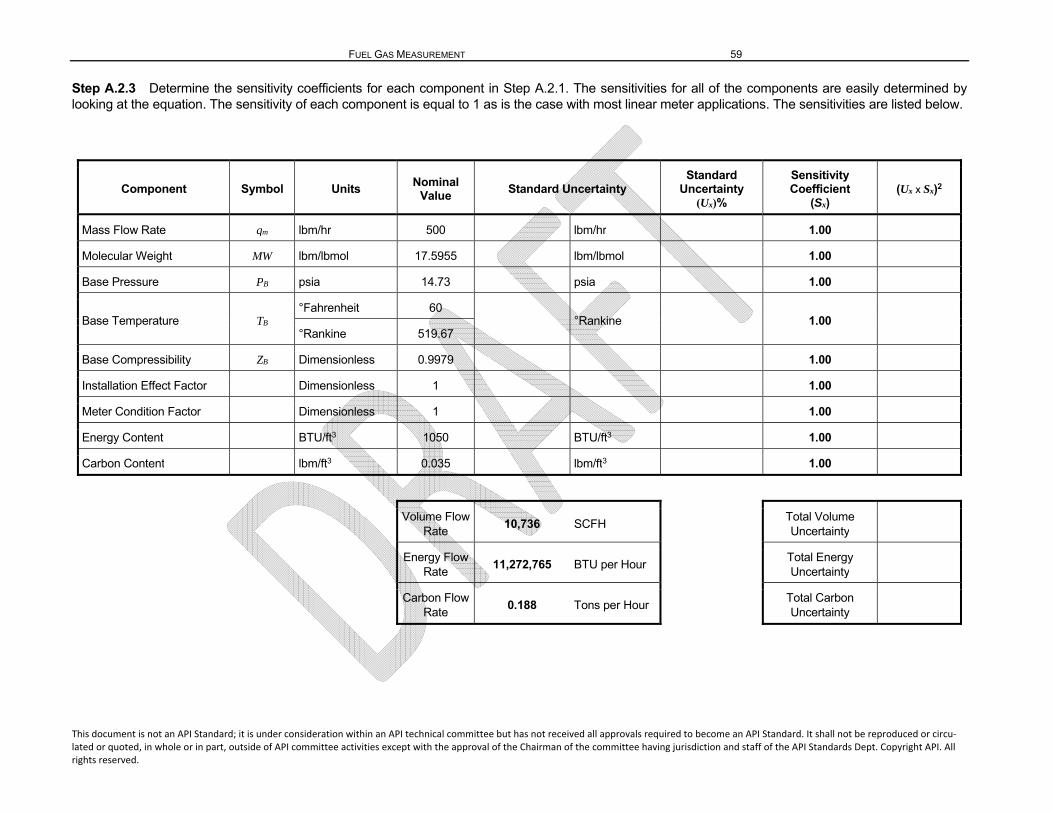
FUEL GAS MEASUREMENT 59
This document is not an API Standard; it is under consideration within an API technical committee but has not received all approvals required to become an API Standard. It shall not be reproduced or circu‐lated or quoted, in whole or in part, outside of API committee activities except with the approval of the Chairman of the committee having jurisdiction and staff of the API Standards Dept. Copyright API. All rights reserved.
Step A.2.3 Determine the sensitivity coefficients for each component in Step A.2.1. The sensitivities for all of the components are easily determined by looking at the equation. The sensitivity of each component is equal to 1 as is the case with most linear meter applications. The sensitivities are listed below.
Component Symbol Units Nominal
Value Standard Uncertainty
Standard Uncertainty
(Ux)%
Sensitivity Coefficient
(Sx)(Ux x Sx)2
Mass Flow Rate qm lbm/hr 500 lbm/hr 1.00
Molecular Weight MW lbm/lbmol 17.5955 lbm/lbmol 1.00
Base Pressure PB psia 14.73 psia 1.00
Base Temperature TB °Fahrenheit 60
°Rankine 1.00 °Rankine 519.67
Base Compressibility ZB Dimensionless 0.9979 1.00
Installation Effect Factor Dimensionless 1 1.00
Meter Condition Factor Dimensionless 1 1.00
Energy Content BTU/ft3 1050 BTU/ft3 1.00
Carbon Content lbm/ft3 0.035 lbm/ft3 1.00
Volume Flow Rate
10,736 SCFH
Total Volume Uncertainty
Energy Flow Rate
11,272,765 BTU per Hour Total Energy Uncertainty
Carbon Flow Rate
0.188 Tons per Hour Total Carbon Uncertainty
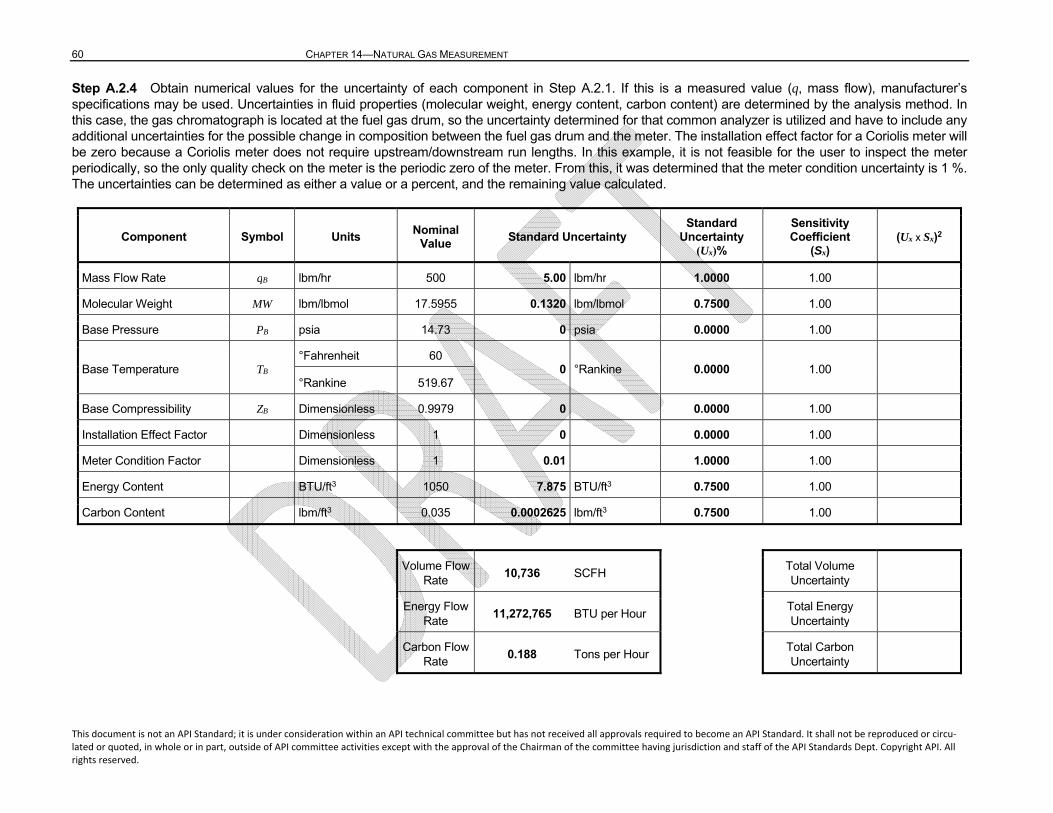
60 CHAPTER 14—NATURAL GAS MEASUREMENT
This document is not an API Standard; it is under consideration within an API technical committee but has not received all approvals required to become an API Standard. It shall not be reproduced or circu‐lated or quoted, in whole or in part, outside of API committee activities except with the approval of the Chairman of the committee having jurisdiction and staff of the API Standards Dept. Copyright API. All rights reserved.
Step A.2.4 Obtain numerical values for the uncertainty of each component in Step A.2.1. If this is a measured value (q, mass flow), manufacturer’s specifications may be used. Uncertainties in fluid properties (molecular weight, energy content, carbon content) are determined by the analysis method. In this case, the gas chromatograph is located at the fuel gas drum, so the uncertainty determined for that common analyzer is utilized and have to include any additional uncertainties for the possible change in composition between the fuel gas drum and the meter. The installation effect factor for a Coriolis meter will be zero because a Coriolis meter does not require upstream/downstream run lengths. In this example, it is not feasible for the user to inspect the meter periodically, so the only quality check on the meter is the periodic zero of the meter. From this, it was determined that the meter condition uncertainty is 1 %. The uncertainties can be determined as either a value or a percent, and the remaining value calculated.
Component Symbol Units Nominal
Value Standard Uncertainty
Standard Uncertainty
(Ux)%
Sensitivity Coefficient
(Sx)(Ux x Sx)2
Mass Flow Rate qB lbm/hr 500 5.00 lbm/hr 1.0000 1.00
Molecular Weight MW lbm/lbmol 17.5955 0.1320 lbm/lbmol 0.7500 1.00
Base Pressure PB psia 14.73 0 psia 0.0000 1.00
Base Temperature TB °Fahrenheit 60
0 °Rankine 0.0000 1.00 °Rankine 519.67
Base Compressibility ZB Dimensionless 0.9979 0 0.0000 1.00
Installation Effect Factor Dimensionless 1 0 0.0000 1.00
Meter Condition Factor Dimensionless 1 0.01 1.0000 1.00
Energy Content BTU/ft3 1050 7.875 BTU/ft3 0.7500 1.00
Carbon Content lbm/ft3 0.035 0.0002625 lbm/ft3 0.7500 1.00
Volume Flow Rate
10,736 SCFH
Total Volume Uncertainty
Energy Flow Rate
11,272,765 BTU per Hour Total Energy Uncertainty
Carbon Flow Rate
0.188 Tons per Hour Total Carbon Uncertainty
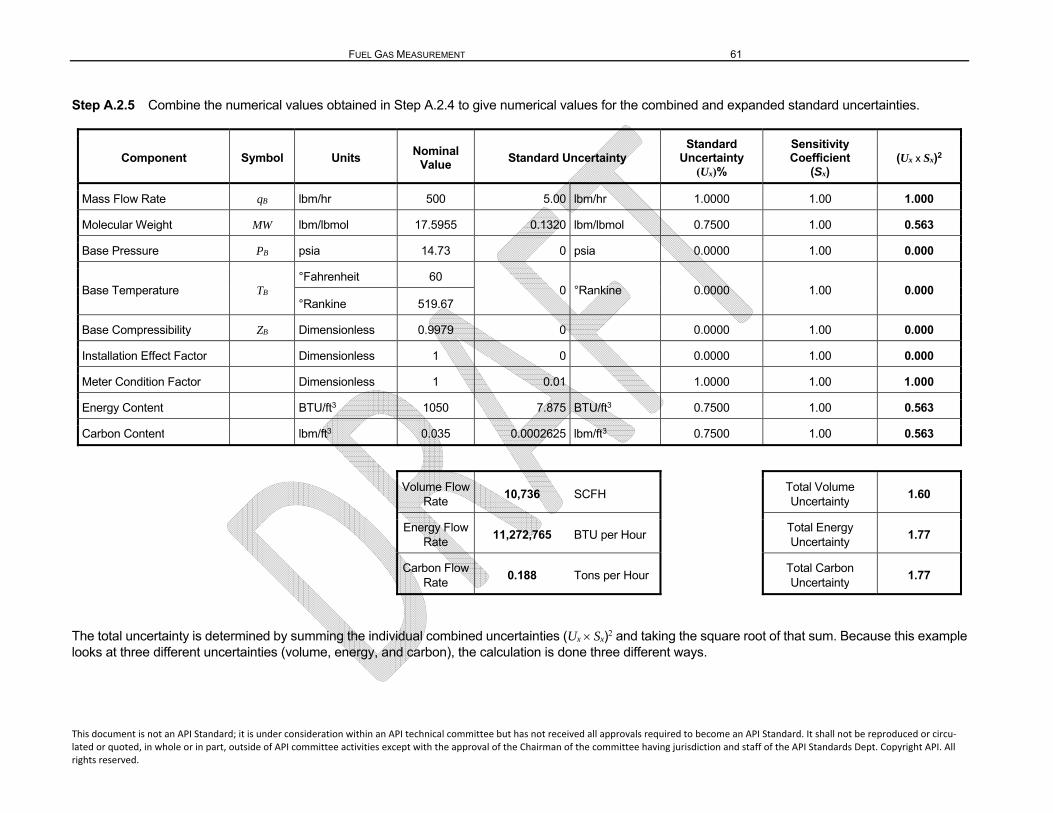
FUEL GAS MEASUREMENT 61
This document is not an API Standard; it is under consideration within an API technical committee but has not received all approvals required to become an API Standard. It shall not be reproduced or circu‐lated or quoted, in whole or in part, outside of API committee activities except with the approval of the Chairman of the committee having jurisdiction and staff of the API Standards Dept. Copyright API. All rights reserved.
Step A.2.5 Combine the numerical values obtained in Step A.2.4 to give numerical values for the combined and expanded standard uncertainties.
Component Symbol Units Nominal
Value Standard Uncertainty
Standard Uncertainty
(Ux)%
Sensitivity Coefficient
(Sx)(Ux x Sx)2
Mass Flow Rate qB lbm/hr 500 5.00 lbm/hr 1.0000 1.00 1.000
Molecular Weight MW lbm/lbmol 17.5955 0.1320 lbm/lbmol 0.7500 1.00 0.563
Base Pressure PB psia 14.73 0 psia 0.0000 1.00 0.000
Base Temperature TB °Fahrenheit 60
0 °Rankine 0.0000 1.00 0.000 °Rankine 519.67
Base Compressibility ZB Dimensionless 0.9979 0 0.0000 1.00 0.000
Installation Effect Factor Dimensionless 1 0 0.0000 1.00 0.000
Meter Condition Factor Dimensionless 1 0.01 1.0000 1.00 1.000
Energy Content BTU/ft3 1050 7.875 BTU/ft3 0.7500 1.00 0.563
Carbon Content lbm/ft3 0.035 0.0002625 lbm/ft3 0.7500 1.00 0.563
Volume Flow Rate
10,736 SCFH
Total Volume Uncertainty
1.60
Energy Flow Rate
11,272,765 BTU per Hour Total Energy Uncertainty
1.77
Carbon Flow Rate
0.188 Tons per Hour Total Carbon Uncertainty
1.77
The total uncertainty is determined by summing the individual combined uncertainties (Ux Sx)2 and taking the square root of that sum. Because this example looks at three different uncertainties (volume, energy, and carbon), the calculation is done three different ways.
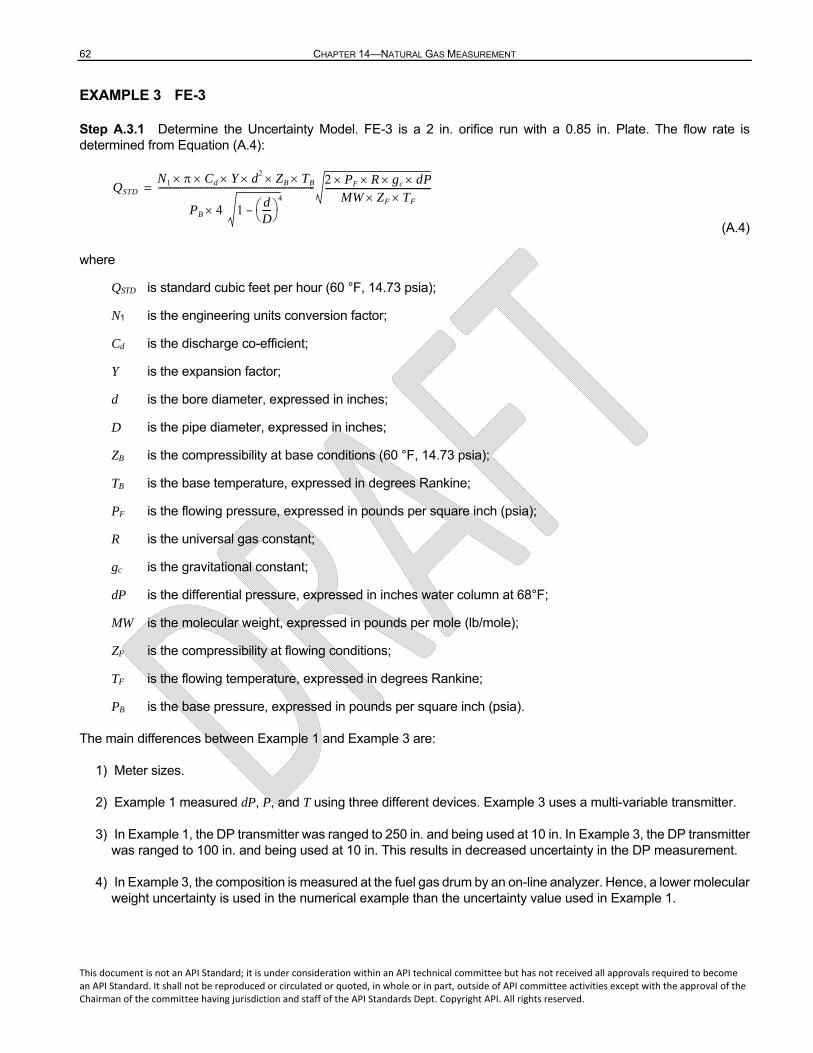
62 CHAPTER 14—NATURAL GAS MEASUREMENT
This document is not an API Standard; it is under consideration within an API technical committee but has not received all approvals required to become an API Standard. It shall not be reproduced or circulated or quoted, in whole or in part, outside of API committee activities except with the approval of the Chairman of the committee having jurisdiction and staff of the API Standards Dept. Copyright API. All rights reserved.
EXAMPLE 3 FE-3
Step A.3.1 Determine the Uncertainty Model. FE-3 is a 2 in. orifice run with a 0.85 in. Plate. The flow rate is determined from Equation (A.4):
(A.4)
where
QSTD is standard cubic feet per hour (60 °F, 14.73 psia);
N1 is the engineering units conversion factor;
Cd is the discharge co-efficient;
Y is the expansion factor;
d is the bore diameter, expressed in inches;
D is the pipe diameter, expressed in inches;
ZB is the compressibility at base conditions (60 °F, 14.73 psia);
TB is the base temperature, expressed in degrees Rankine;
PF is the flowing pressure, expressed in pounds per square inch (psia);
R is the universal gas constant;
gc is the gravitational constant;
dP is the differential pressure, expressed in inches water column at 68°F;
MW is the molecular weight, expressed in pounds per mole (lb/mole);
ZF is the compressibility at flowing conditions;
TF is the flowing temperature, expressed in degrees Rankine;
PB is the base pressure, expressed in pounds per square inch (psia).
The main differences between Example 1 and Example 3 are:
1) Meter sizes.
2) Example 1 measured dP, P, and T using three different devices. Example 3 uses a multi-variable transmitter.
3) In Example 1, the DP transmitter was ranged to 250 in. and being used at 10 in. In Example 3, the DP transmitter was ranged to 100 in. and being used at 10 in. This results in decreased uncertainty in the DP measurement.
4) In Example 3, the composition is measured at the fuel gas drum by an on-line analyzer. Hence, a lower molecular weight uncertainty is used in the numerical example than the uncertainty value used in Example 1.
QSTD
N1 Cd Y d2 ZB TB
PB 4 1dD----
4
–
----------------------------------------------------------------------- 2 P F R gc dPMW ZF TF
------------------------------------------------=
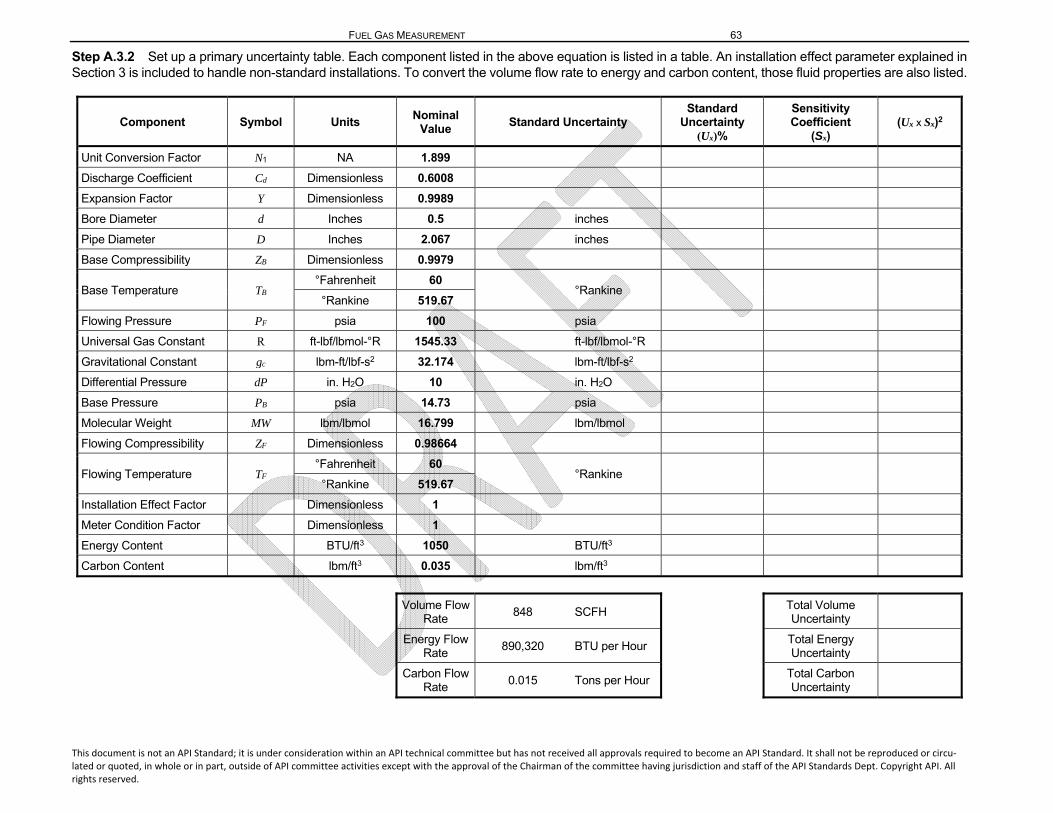
FUEL GAS MEASUREMENT 63
This document is not an API Standard; it is under consideration within an API technical committee but has not received all approvals required to become an API Standard. It shall not be reproduced or circu‐lated or quoted, in whole or in part, outside of API committee activities except with the approval of the Chairman of the committee having jurisdiction and staff of the API Standards Dept. Copyright API. All rights reserved.
Step A.3.2 Set up a primary uncertainty table. Each component listed in the above equation is listed in a table. An installation effect parameter explained in Section 3 is included to handle non-standard installations. To convert the volume flow rate to energy and carbon content, those fluid properties are also listed.
Component Symbol Units Nominal
Value Standard Uncertainty
Standard Uncertainty
(Ux)%
Sensitivity Coefficient
(Sx)(Ux x Sx)2
Unit Conversion Factor N1 NA 1.899
Discharge Coefficient Cd Dimensionless 0.6008
Expansion Factor Y Dimensionless 0.9989
Bore Diameter d Inches 0.5 inches
Pipe Diameter D Inches 2.067 inches
Base Compressibility ZB Dimensionless 0.9979
Base Temperature TB °Fahrenheit 60
°Rankine °Rankine 519.67
Flowing Pressure PF psia 100 psia
Universal Gas Constant R ft-lbf/lbmol-°R 1545.33 ft-lbf/lbmol-°R
Gravitational Constant gc lbm-ft/lbf-s2 32.174 lbm-ft/lbf-s2
Differential Pressure dP in. H2O 10 in. H2O
Base Pressure PB psia 14.73 psia
Molecular Weight MW lbm/lbmol 16.799 lbm/lbmol
Flowing Compressibility ZF Dimensionless 0.98664
Flowing Temperature TF °Fahrenheit 60
°Rankine °Rankine 519.67
Installation Effect Factor Dimensionless 1
Meter Condition Factor Dimensionless 1
Energy Content BTU/ft3 1050 BTU/ft3
Carbon Content lbm/ft3 0.035 lbm/ft3
Volume Flow Rate
848 SCFH
Total Volume Uncertainty
Energy Flow Rate
890,320 BTU per Hour Total Energy Uncertainty
Carbon Flow Rate
0.015 Tons per Hour Total Carbon Uncertainty
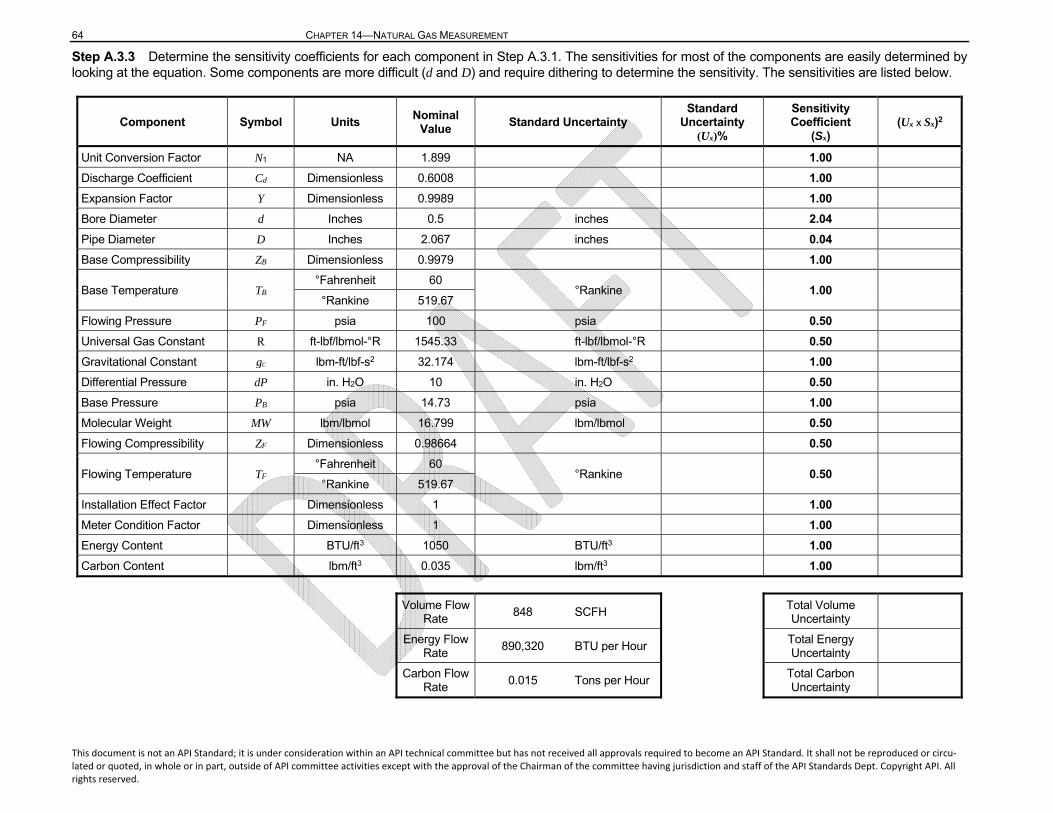
64 CHAPTER 14—NATURAL GAS MEASUREMENT
This document is not an API Standard; it is under consideration within an API technical committee but has not received all approvals required to become an API Standard. It shall not be reproduced or circu‐lated or quoted, in whole or in part, outside of API committee activities except with the approval of the Chairman of the committee having jurisdiction and staff of the API Standards Dept. Copyright API. All rights reserved.
Step A.3.3 Determine the sensitivity coefficients for each component in Step A.3.1. The sensitivities for most of the components are easily determined by looking at the equation. Some components are more difficult (d and D) and require dithering to determine the sensitivity. The sensitivities are listed below.
Component Symbol Units Nominal
Value Standard Uncertainty
Standard Uncertainty
(Ux)%
Sensitivity Coefficient
(Sx)(Ux x Sx)2
Unit Conversion Factor N1 NA 1.899 1.00
Discharge Coefficient Cd Dimensionless 0.6008 1.00
Expansion Factor Y Dimensionless 0.9989 1.00
Bore Diameter d Inches 0.5 inches 2.04
Pipe Diameter D Inches 2.067 inches 0.04
Base Compressibility ZB Dimensionless 0.9979 1.00
Base Temperature TB °Fahrenheit 60
°Rankine 1.00 °Rankine 519.67
Flowing Pressure PF psia 100 psia 0.50
Universal Gas Constant R ft-lbf/lbmol-°R 1545.33 ft-lbf/lbmol-°R 0.50
Gravitational Constant gc lbm-ft/lbf-s2 32.174 lbm-ft/lbf-s2 1.00
Differential Pressure dP in. H2O 10 in. H2O 0.50
Base Pressure PB psia 14.73 psia 1.00
Molecular Weight MW lbm/lbmol 16.799 lbm/lbmol 0.50
Flowing Compressibility ZF Dimensionless 0.98664 0.50
Flowing Temperature TF °Fahrenheit 60
°Rankine 0.50 °Rankine 519.67
Installation Effect Factor Dimensionless 1 1.00
Meter Condition Factor Dimensionless 1 1.00
Energy Content BTU/ft3 1050 BTU/ft3 1.00
Carbon Content lbm/ft3 0.035 lbm/ft3 1.00
Volume Flow Rate
848 SCFH
Total Volume Uncertainty
Energy Flow Rate
890,320 BTU per Hour Total Energy Uncertainty
Carbon Flow Rate
0.015 Tons per Hour Total Carbon Uncertainty
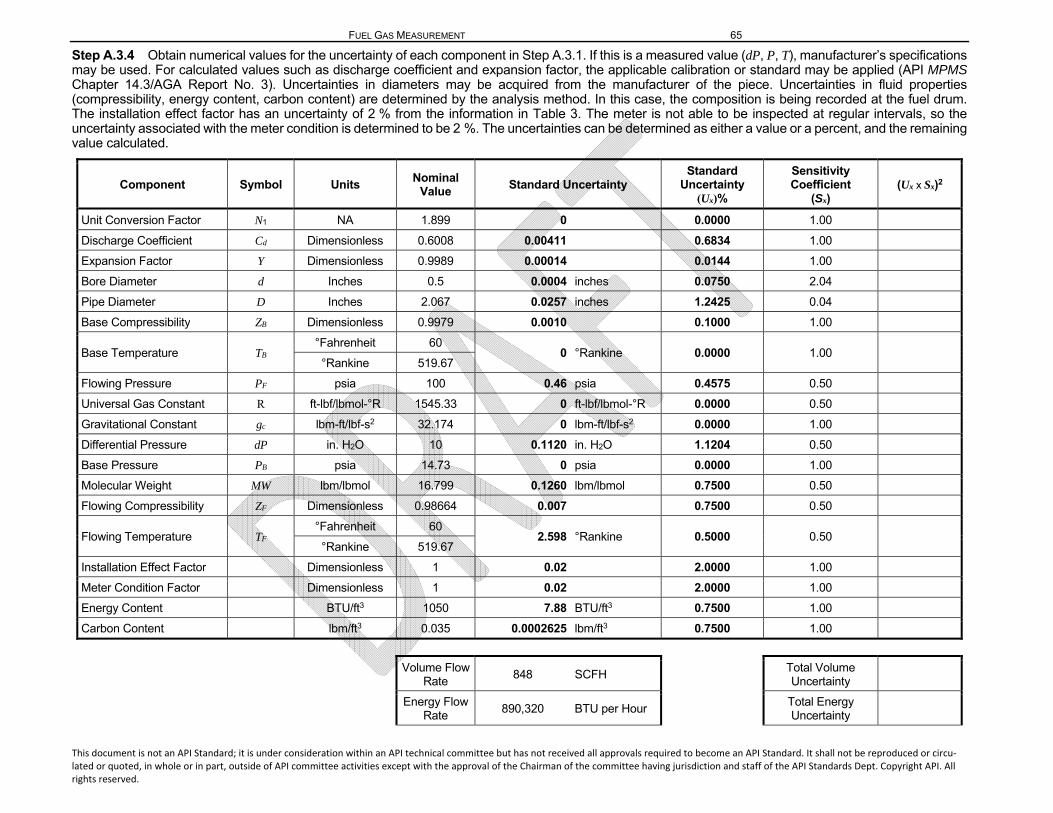
FUEL GAS MEASUREMENT 65
This document is not an API Standard; it is under consideration within an API technical committee but has not received all approvals required to become an API Standard. It shall not be reproduced or circu‐lated or quoted, in whole or in part, outside of API committee activities except with the approval of the Chairman of the committee having jurisdiction and staff of the API Standards Dept. Copyright API. All rights reserved.
Step A.3.4 Obtain numerical values for the uncertainty of each component in Step A.3.1. If this is a measured value (dP, P, T), manufacturer’s specifications may be used. For calculated values such as discharge coefficient and expansion factor, the applicable calibration or standard may be applied (API MPMS Chapter 14.3/AGA Report No. 3). Uncertainties in diameters may be acquired from the manufacturer of the piece. Uncertainties in fluid properties (compressibility, energy content, carbon content) are determined by the analysis method. In this case, the composition is being recorded at the fuel drum. The installation effect factor has an uncertainty of 2 % from the information in Table 3. The meter is not able to be inspected at regular intervals, so the uncertainty associated with the meter condition is determined to be 2 %. The uncertainties can be determined as either a value or a percent, and the remaining value calculated.
Component Symbol Units Nominal
Value Standard Uncertainty
Standard Uncertainty
(Ux)%
Sensitivity Coefficient
(Sx)(Ux x Sx)2
Unit Conversion Factor N1 NA 1.899 0 0.0000 1.00
Discharge Coefficient Cd Dimensionless 0.6008 0.00411 0.6834 1.00
Expansion Factor Y Dimensionless 0.9989 0.00014 0.0144 1.00
Bore Diameter d Inches 0.5 0.0004 inches 0.0750 2.04
Pipe Diameter D Inches 2.067 0.0257 inches 1.2425 0.04
Base Compressibility ZB Dimensionless 0.9979 0.0010 0.1000 1.00
Base Temperature TB °Fahrenheit 60
0 °Rankine 0.0000 1.00 °Rankine 519.67
Flowing Pressure PF psia 100 0.46 psia 0.4575 0.50
Universal Gas Constant R ft-lbf/lbmol-°R 1545.33 0 ft-lbf/lbmol-°R 0.0000 0.50
Gravitational Constant gc lbm-ft/lbf-s2 32.174 0 lbm-ft/lbf-s2 0.0000 1.00
Differential Pressure dP in. H2O 10 0.1120 in. H2O 1.1204 0.50
Base Pressure PB psia 14.73 0 psia 0.0000 1.00
Molecular Weight MW lbm/lbmol 16.799 0.1260 lbm/lbmol 0.7500 0.50
Flowing Compressibility ZF Dimensionless 0.98664 0.007 0.7500 0.50
Flowing Temperature TF °Fahrenheit 60
2.598 °Rankine 0.5000 0.50 °Rankine 519.67
Installation Effect Factor Dimensionless 1 0.02 2.0000 1.00
Meter Condition Factor Dimensionless 1 0.02 2.0000 1.00
Energy Content BTU/ft3 1050 7.88 BTU/ft3 0.7500 1.00
Carbon Content lbm/ft3 0.035 0.0002625 lbm/ft3 0.7500 1.00
Volume Flow Rate
848 SCFH
Total Volume Uncertainty
Energy Flow Rate
890,320 BTU per Hour Total Energy Uncertainty
66 CHAPTER 14—NATURAL GAS MEASUREMENT
This document is not an API Standard; it is under consideration within an API technical committee but has not received all approvals required to become an API Standard. It shall not be reproduced or circu‐lated or quoted, in whole or in part, outside of API committee activities except with the approval of the Chairman of the committee having jurisdiction and staff of the API Standards Dept. Copyright API. All rights reserved.
Carbon Flow Rate
0.015 Tons per Hour Total Carbon Uncertainty
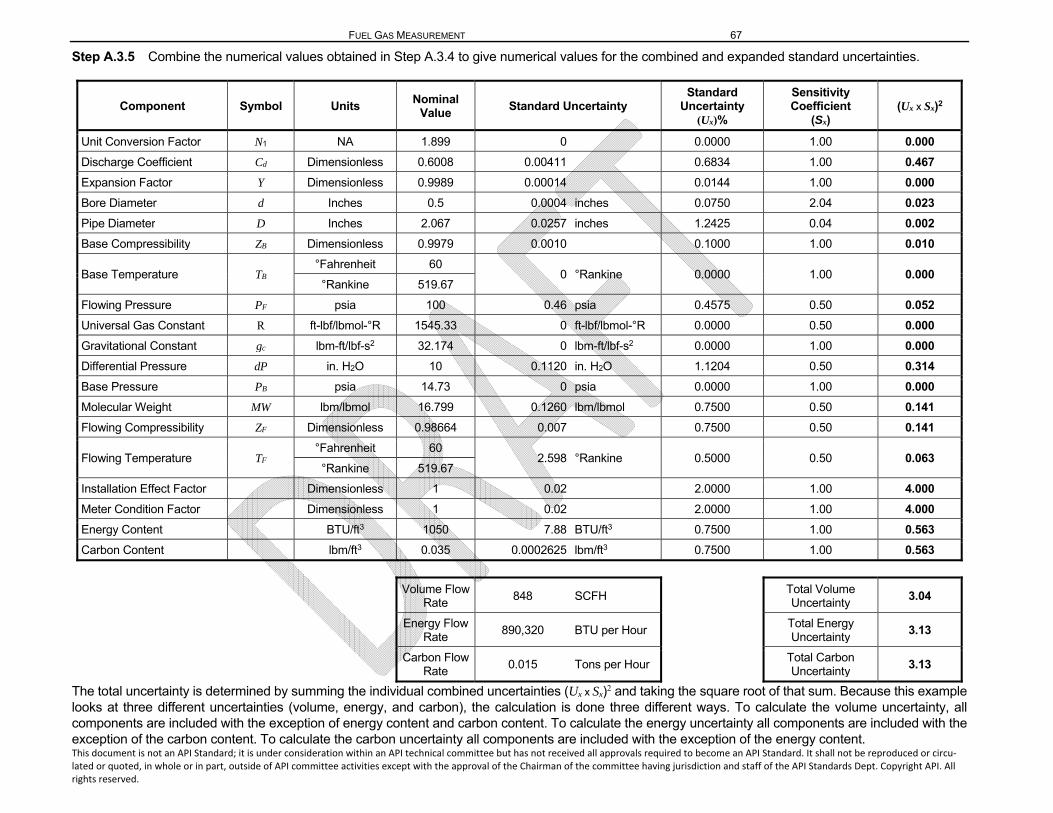
FUEL GAS MEASUREMENT 67
This document is not an API Standard; it is under consideration within an API technical committee but has not received all approvals required to become an API Standard. It shall not be reproduced or circu‐lated or quoted, in whole or in part, outside of API committee activities except with the approval of the Chairman of the committee having jurisdiction and staff of the API Standards Dept. Copyright API. All rights reserved.
Step A.3.5 Combine the numerical values obtained in Step A.3.4 to give numerical values for the combined and expanded standard uncertainties.
Component Symbol Units Nominal
Value Standard Uncertainty
Standard Uncertainty
(Ux)%
Sensitivity Coefficient
(Sx)(Ux x Sx)2
Unit Conversion Factor N1 NA 1.899 0 0.0000 1.00 0.000
Discharge Coefficient Cd Dimensionless 0.6008 0.00411 0.6834 1.00 0.467
Expansion Factor Y Dimensionless 0.9989 0.00014 0.0144 1.00 0.000
Bore Diameter d Inches 0.5 0.0004 inches 0.0750 2.04 0.023
Pipe Diameter D Inches 2.067 0.0257 inches 1.2425 0.04 0.002
Base Compressibility ZB Dimensionless 0.9979 0.0010 0.1000 1.00 0.010
Base Temperature TB °Fahrenheit 60
0 °Rankine 0.0000 1.00 0.000 °Rankine 519.67
Flowing Pressure PF psia 100 0.46 psia 0.4575 0.50 0.052
Universal Gas Constant R ft-lbf/lbmol-°R 1545.33 0 ft-lbf/lbmol-°R 0.0000 0.50 0.000
Gravitational Constant gc lbm-ft/lbf-s2 32.174 0 lbm-ft/lbf-s2 0.0000 1.00 0.000
Differential Pressure dP in. H2O 10 0.1120 in. H2O 1.1204 0.50 0.314
Base Pressure PB psia 14.73 0 psia 0.0000 1.00 0.000
Molecular Weight MW lbm/lbmol 16.799 0.1260 lbm/lbmol 0.7500 0.50 0.141
Flowing Compressibility ZF Dimensionless 0.98664 0.007 0.7500 0.50 0.141
Flowing Temperature TF °Fahrenheit 60
2.598 °Rankine 0.5000 0.50 0.063 °Rankine 519.67
Installation Effect Factor Dimensionless 1 0.02 2.0000 1.00 4.000
Meter Condition Factor Dimensionless 1 0.02 2.0000 1.00 4.000
Energy Content BTU/ft3 1050 7.88 BTU/ft3 0.7500 1.00 0.563
Carbon Content lbm/ft3 0.035 0.0002625 lbm/ft3 0.7500 1.00 0.563
Volume Flow Rate
848 SCFH
Total Volume Uncertainty
3.04
Energy Flow Rate
890,320 BTU per Hour Total Energy Uncertainty
3.13
Carbon Flow Rate
0.015 Tons per Hour Total Carbon Uncertainty
3.13
The total uncertainty is determined by summing the individual combined uncertainties (Ux x Sx)2 and taking the square root of that sum. Because this example looks at three different uncertainties (volume, energy, and carbon), the calculation is done three different ways. To calculate the volume uncertainty, all components are included with the exception of energy content and carbon content. To calculate the energy uncertainty all components are included with the exception of the carbon content. To calculate the carbon uncertainty all components are included with the exception of the energy content.
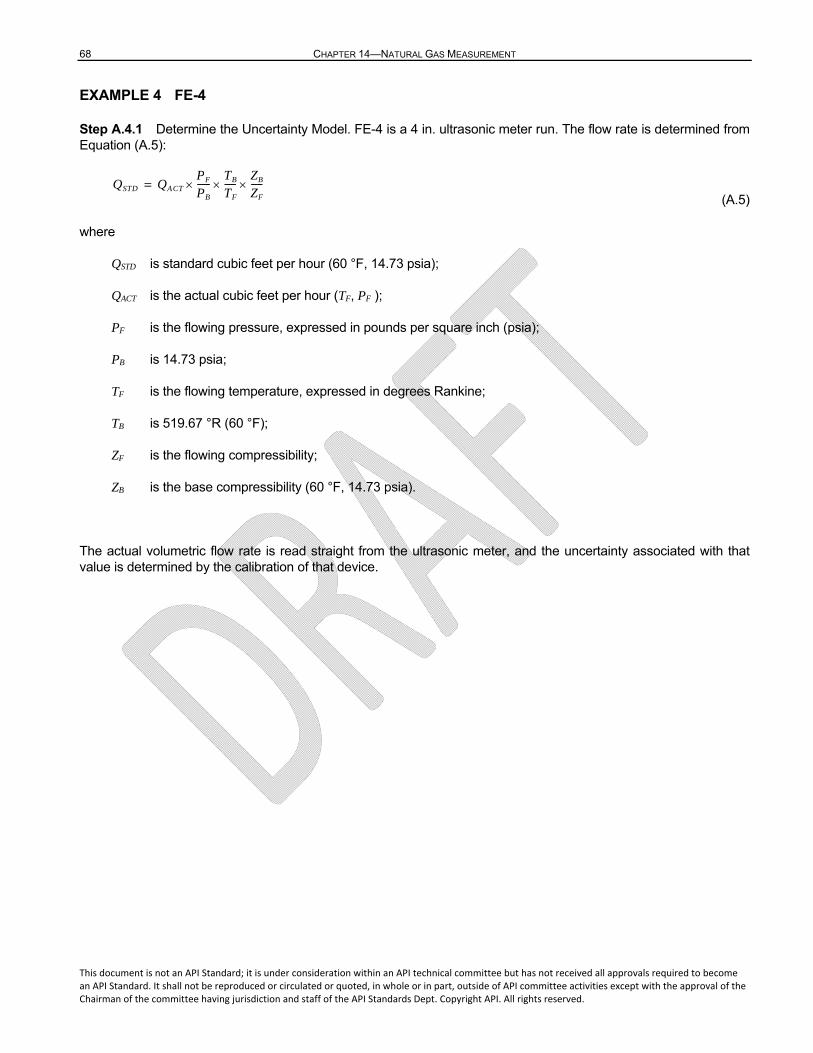
68 CHAPTER 14—NATURAL GAS MEASUREMENT
This document is not an API Standard; it is under consideration within an API technical committee but has not received all approvals required to become an API Standard. It shall not be reproduced or circulated or quoted, in whole or in part, outside of API committee activities except with the approval of the Chairman of the committee having jurisdiction and staff of the API Standards Dept. Copyright API. All rights reserved.
EXAMPLE 4 FE-4
Step A.4.1 Determine the Uncertainty Model. FE-4 is a 4 in. ultrasonic meter run. The flow rate is determined from Equation (A.5):
(A.5)
where
QSTD is standard cubic feet per hour (60 °F, 14.73 psia);
QACT is the actual cubic feet per hour (TF, PF );
PF is the flowing pressure, expressed in pounds per square inch (psia);
PB is 14.73 psia;
TF is the flowing temperature, expressed in degrees Rankine;
TB is 519.67 °R (60 °F);
ZF is the flowing compressibility;
ZB is the base compressibility (60 °F, 14.73 psia).
The actual volumetric flow rate is read straight from the ultrasonic meter, and the uncertainty associated with that value is determined by the calibration of that device.
QSTD QACT
PF
PB
------TB
TF
-----ZB
ZF
-----=
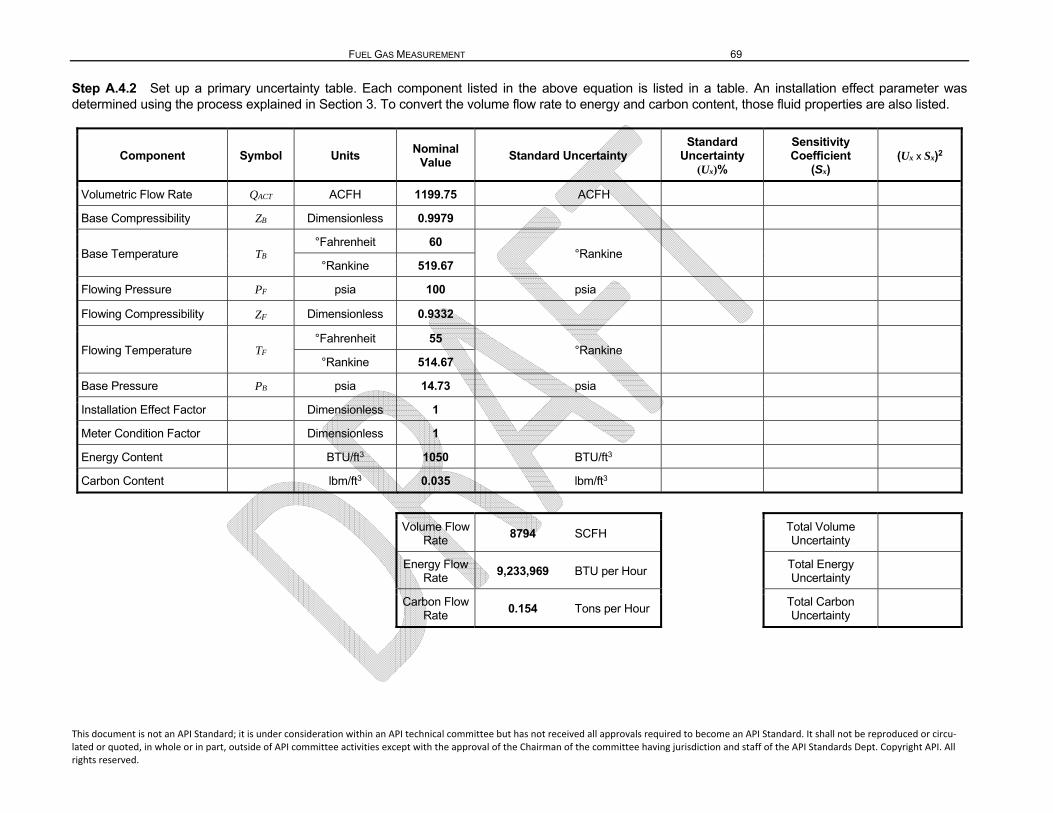
FUEL GAS MEASUREMENT 69
This document is not an API Standard; it is under consideration within an API technical committee but has not received all approvals required to become an API Standard. It shall not be reproduced or circu‐lated or quoted, in whole or in part, outside of API committee activities except with the approval of the Chairman of the committee having jurisdiction and staff of the API Standards Dept. Copyright API. All rights reserved.
Step A.4.2 Set up a primary uncertainty table. Each component listed in the above equation is listed in a table. An installation effect parameter was determined using the process explained in Section 3. To convert the volume flow rate to energy and carbon content, those fluid properties are also listed.
Component Symbol Units Nominal
Value Standard Uncertainty
Standard Uncertainty
(Ux)%
Sensitivity Coefficient
(Sx)(Ux x Sx)2
Volumetric Flow Rate QACT ACFH 1199.75 ACFH
Base Compressibility ZB Dimensionless 0.9979
Base Temperature TB °Fahrenheit 60
°Rankine °Rankine 519.67
Flowing Pressure PF psia 100 psia
Flowing Compressibility ZF Dimensionless 0.9332
Flowing Temperature TF °Fahrenheit 55
°Rankine °Rankine 514.67
Base Pressure PB psia 14.73 psia
Installation Effect Factor Dimensionless 1
Meter Condition Factor Dimensionless 1
Energy Content BTU/ft3 1050 BTU/ft3
Carbon Content lbm/ft3 0.035 lbm/ft3
Volume Flow Rate
8794 SCFH
Total Volume Uncertainty
Energy Flow Rate
9,233,969 BTU per Hour Total Energy Uncertainty
Carbon Flow Rate
0.154 Tons per Hour Total Carbon Uncertainty
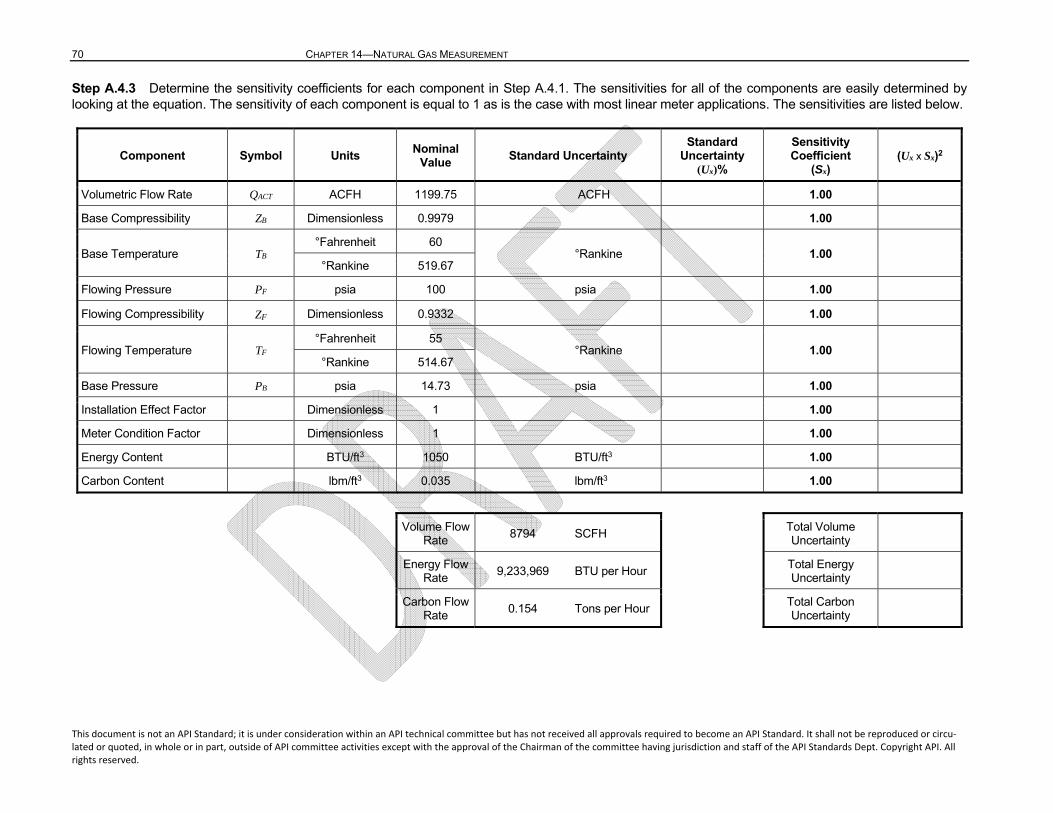
70 CHAPTER 14—NATURAL GAS MEASUREMENT
This document is not an API Standard; it is under consideration within an API technical committee but has not received all approvals required to become an API Standard. It shall not be reproduced or circu‐lated or quoted, in whole or in part, outside of API committee activities except with the approval of the Chairman of the committee having jurisdiction and staff of the API Standards Dept. Copyright API. All rights reserved.
Step A.4.3 Determine the sensitivity coefficients for each component in Step A.4.1. The sensitivities for all of the components are easily determined by looking at the equation. The sensitivity of each component is equal to 1 as is the case with most linear meter applications. The sensitivities are listed below.
Component Symbol Units Nominal
Value Standard Uncertainty
Standard Uncertainty
(Ux)%
Sensitivity Coefficient
(Sx)(Ux x Sx)2
Volumetric Flow Rate QACT ACFH 1199.75 ACFH 1.00
Base Compressibility ZB Dimensionless 0.9979 1.00
Base Temperature TB °Fahrenheit 60
°Rankine 1.00 °Rankine 519.67
Flowing Pressure PF psia 100 psia 1.00
Flowing Compressibility ZF Dimensionless 0.9332 1.00
Flowing Temperature TF °Fahrenheit 55
°Rankine 1.00 °Rankine 514.67
Base Pressure PB psia 14.73 psia 1.00
Installation Effect Factor Dimensionless 1 1.00
Meter Condition Factor Dimensionless 1 1.00
Energy Content BTU/ft3 1050 BTU/ft3 1.00
Carbon Content lbm/ft3 0.035 lbm/ft3 1.00
Volume Flow Rate
8794 SCFH
Total Volume Uncertainty
Energy Flow Rate
9,233,969 BTU per Hour Total Energy Uncertainty
Carbon Flow Rate
0.154 Tons per Hour Total Carbon Uncertainty
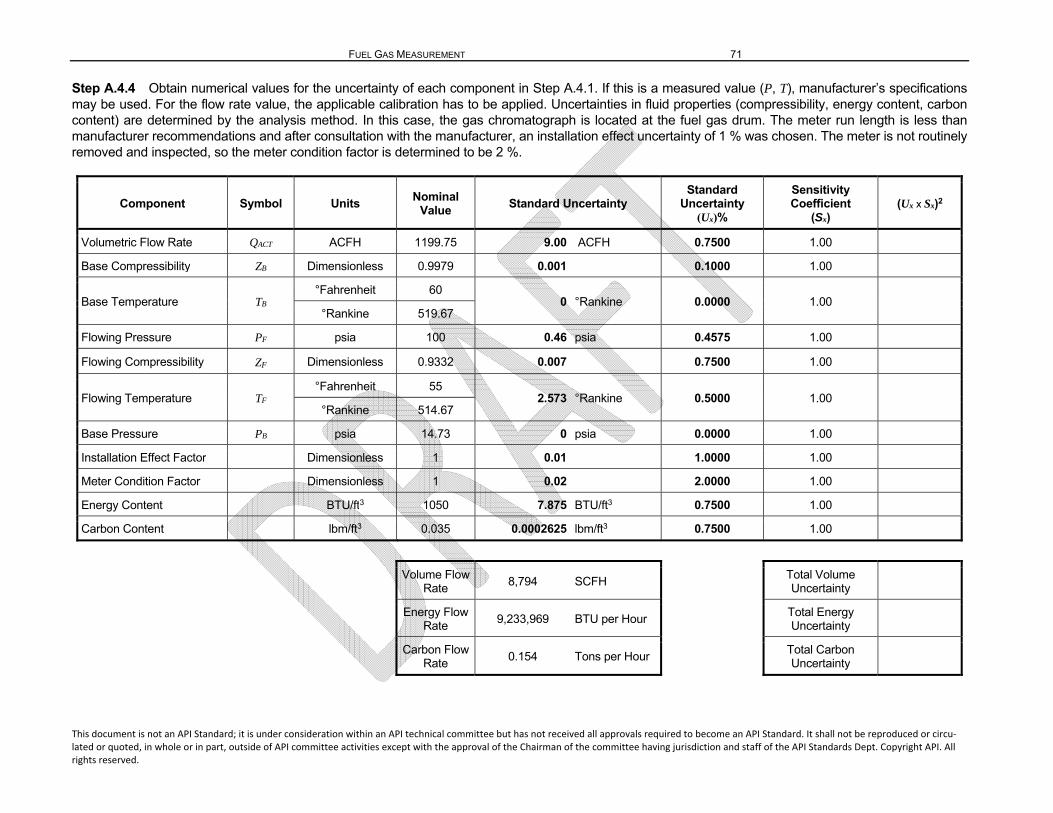
FUEL GAS MEASUREMENT 71
This document is not an API Standard; it is under consideration within an API technical committee but has not received all approvals required to become an API Standard. It shall not be reproduced or circu‐lated or quoted, in whole or in part, outside of API committee activities except with the approval of the Chairman of the committee having jurisdiction and staff of the API Standards Dept. Copyright API. All rights reserved.
Step A.4.4 Obtain numerical values for the uncertainty of each component in Step A.4.1. If this is a measured value (P, T), manufacturer’s specifications may be used. For the flow rate value, the applicable calibration has to be applied. Uncertainties in fluid properties (compressibility, energy content, carbon content) are determined by the analysis method. In this case, the gas chromatograph is located at the fuel gas drum. The meter run length is less than manufacturer recommendations and after consultation with the manufacturer, an installation effect uncertainty of 1 % was chosen. The meter is not routinely removed and inspected, so the meter condition factor is determined to be 2 %.
Component Symbol Units Nominal
Value Standard Uncertainty
Standard Uncertainty
(Ux)%
Sensitivity Coefficient
(Sx)(Ux x Sx)2
Volumetric Flow Rate QACT ACFH 1199.75 9.00 ACFH 0.7500 1.00
Base Compressibility ZB Dimensionless 0.9979 0.001 0.1000 1.00
Base Temperature TB °Fahrenheit 60
0 °Rankine 0.0000 1.00 °Rankine 519.67
Flowing Pressure PF psia 100 0.46 psia 0.4575 1.00
Flowing Compressibility ZF Dimensionless 0.9332 0.007 0.7500 1.00
Flowing Temperature TF °Fahrenheit 55
2.573 °Rankine 0.5000 1.00 °Rankine 514.67
Base Pressure PB psia 14.73 0 psia 0.0000 1.00
Installation Effect Factor Dimensionless 1 0.01 1.0000 1.00
Meter Condition Factor Dimensionless 1 0.02 2.0000 1.00
Energy Content BTU/ft3 1050 7.875 BTU/ft3 0.7500 1.00
Carbon Content lbm/ft3 0.035 0.0002625 lbm/ft3 0.7500 1.00
Volume Flow Rate
8,794 SCFH
Total Volume Uncertainty
Energy Flow Rate
9,233,969 BTU per Hour Total Energy Uncertainty
Carbon Flow Rate
0.154 Tons per Hour Total Carbon Uncertainty
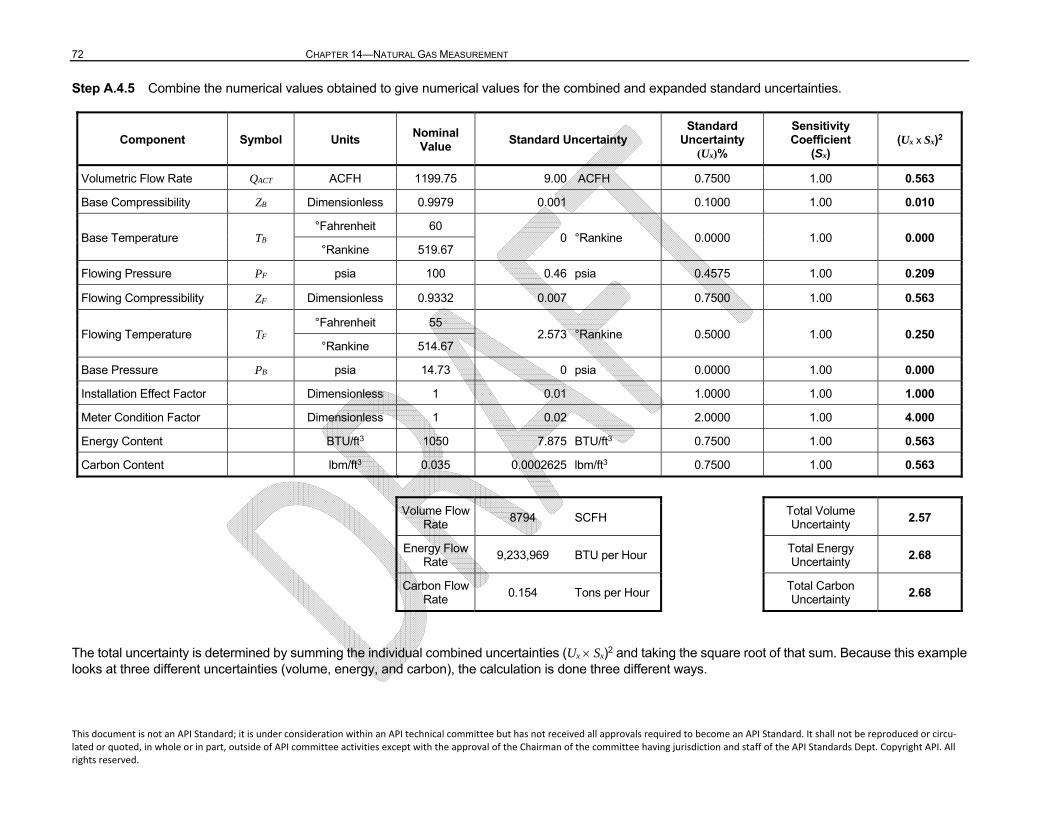
72 CHAPTER 14—NATURAL GAS MEASUREMENT
This document is not an API Standard; it is under consideration within an API technical committee but has not received all approvals required to become an API Standard. It shall not be reproduced or circu‐lated or quoted, in whole or in part, outside of API committee activities except with the approval of the Chairman of the committee having jurisdiction and staff of the API Standards Dept. Copyright API. All rights reserved.
Step A.4.5 Combine the numerical values obtained to give numerical values for the combined and expanded standard uncertainties.
Component Symbol Units Nominal
Value Standard Uncertainty
Standard Uncertainty
(Ux)%
Sensitivity Coefficient
(Sx)(Ux x Sx)2
Volumetric Flow Rate QACT ACFH 1199.75 9.00 ACFH 0.7500 1.00 0.563
Base Compressibility ZB Dimensionless 0.9979 0.001 0.1000 1.00 0.010
Base Temperature TB °Fahrenheit 60
0 °Rankine 0.0000 1.00 0.000 °Rankine 519.67
Flowing Pressure PF psia 100 0.46 psia 0.4575 1.00 0.209
Flowing Compressibility ZF Dimensionless 0.9332 0.007 0.7500 1.00 0.563
Flowing Temperature TF °Fahrenheit 55
2.573 °Rankine 0.5000 1.00 0.250 °Rankine 514.67
Base Pressure PB psia 14.73 0 psia 0.0000 1.00 0.000
Installation Effect Factor Dimensionless 1 0.01 1.0000 1.00 1.000
Meter Condition Factor Dimensionless 1 0.02 2.0000 1.00 4.000
Energy Content BTU/ft3 1050 7.875 BTU/ft3 0.7500 1.00 0.563
Carbon Content lbm/ft3 0.035 0.0002625 lbm/ft3 0.7500 1.00 0.563
Volume Flow Rate
8794 SCFH
Total Volume Uncertainty
2.57
Energy Flow Rate
9,233,969 BTU per Hour Total Energy Uncertainty
2.68
Carbon Flow Rate
0.154 Tons per Hour Total Carbon Uncertainty
2.68
The total uncertainty is determined by summing the individual combined uncertainties (UxSx)2 and taking the square root of that sum. Because this example looks at three different uncertainties (volume, energy, and carbon), the calculation is done three different ways.
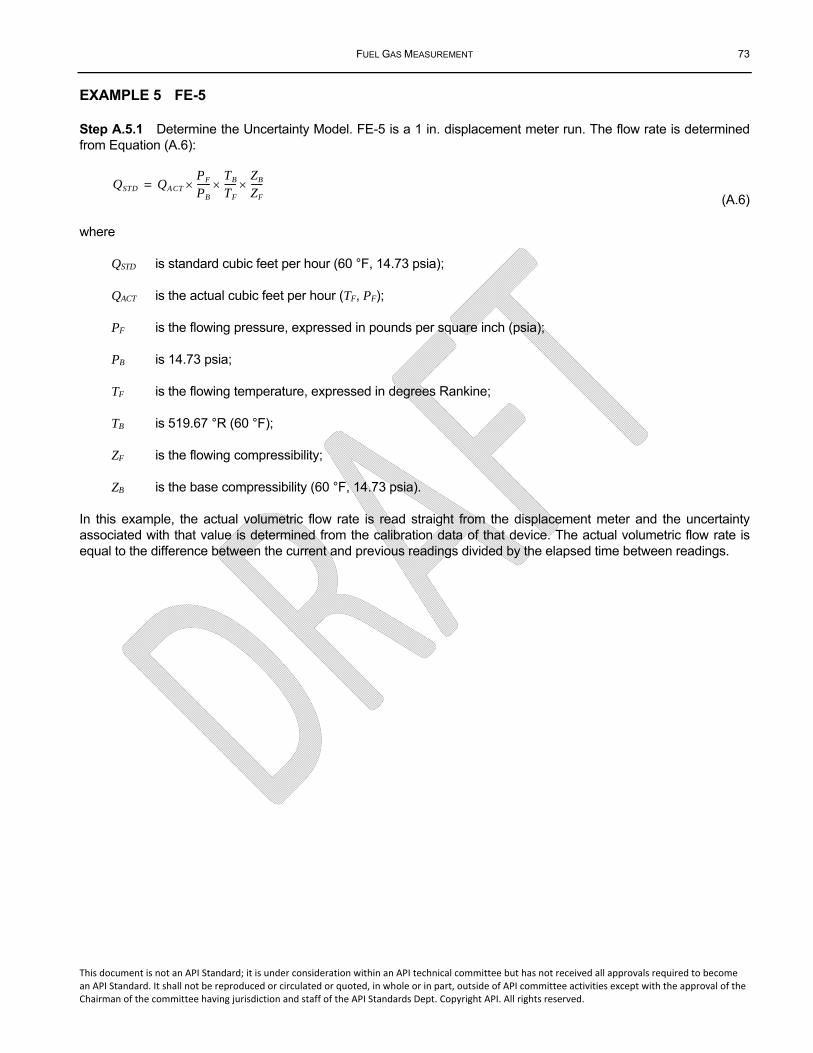
FUEL GAS MEASUREMENT 73
This document is not an API Standard; it is under consideration within an API technical committee but has not received all approvals required to become an API Standard. It shall not be reproduced or circulated or quoted, in whole or in part, outside of API committee activities except with the approval of the Chairman of the committee having jurisdiction and staff of the API Standards Dept. Copyright API. All rights reserved.
EXAMPLE 5 FE-5
Step A.5.1 Determine the Uncertainty Model. FE-5 is a 1 in. displacement meter run. The flow rate is determined from Equation (A.6):
(A.6)
where
QSTD is standard cubic feet per hour (60 °F, 14.73 psia);
QACT is the actual cubic feet per hour (TF, PF);
PF is the flowing pressure, expressed in pounds per square inch (psia);
PB is 14.73 psia;
TF is the flowing temperature, expressed in degrees Rankine;
TB is 519.67 °R (60 °F);
ZF is the flowing compressibility;
ZB is the base compressibility (60 °F, 14.73 psia).
In this example, the actual volumetric flow rate is read straight from the displacement meter and the uncertainty associated with that value is determined from the calibration data of that device. The actual volumetric flow rate is equal to the difference between the current and previous readings divided by the elapsed time between readings.
QSTD QACT
PF
PB
------TB
TF
-----ZB
ZF
-----=

74 CHAPTER 14—NATURAL GAS MEASUREMENT
This document is not an API Standard; it is under consideration within an API technical committee but has not received all approvals required to become an API Standard. It shall not be reproduced or circu‐lated or quoted, in whole or in part, outside of API committee activities except with the approval of the Chairman of the committee having jurisdiction and staff of the API Standards Dept. Copyright API. All rights reserved.
Step A.5.2 Set up a primary uncertainty table. Each component listed in the above equation is listed in a table. A positive displacement meter does not have an installation effect. To convert the volume flow rate to energy and carbon content, those fluid properties are also listed.
Component Symbol Units Nominal
Value Standard Uncertainty
Standard Uncertainty
(Ux)%
Sensitivity Coefficient
(Sx)(Ux x Sx)2
Volumetric Flow Rate QACT ACFH 160.8 ACFH
Base Compressibility ZB Dimensionless 0.9979
Base Temperature TB °Fahrenheit 60
°Rankine °Rankine 519.67
Flowing Pressure PF psia 25 psia
Flowing Compressibility ZF Dimensionless 0.9332
Flowing Temperature TF °Fahrenheit 55
°Rankine °Rankine 514.67
Base Pressure PB psia 14.73 psia
Installation Effect Factor Dimensionless 1
Meter Condition Factor Dimensionless 1
Energy Content BTU/ft3 1000 BTU/ft3
Carbon Content lbm/ft3 0.035 lbm/ft3
Volume Flow Rate
295 SCFH
Total Volume Uncertainty
Energy Flow Rate
294,669 BTU per Hour Total Energy Uncertainty
Carbon Flow Rate
0.005 Tons per Hour Total Carbon Uncertainty
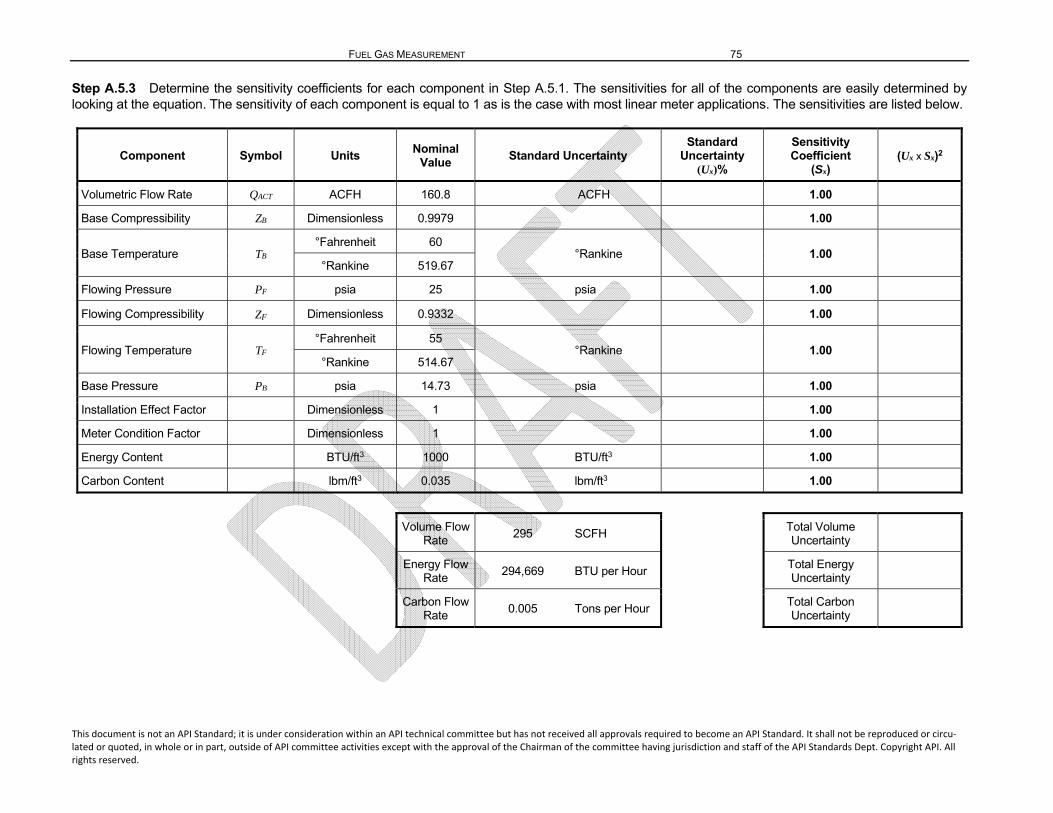
FUEL GAS MEASUREMENT 75
This document is not an API Standard; it is under consideration within an API technical committee but has not received all approvals required to become an API Standard. It shall not be reproduced or circu‐lated or quoted, in whole or in part, outside of API committee activities except with the approval of the Chairman of the committee having jurisdiction and staff of the API Standards Dept. Copyright API. All rights reserved.
Step A.5.3 Determine the sensitivity coefficients for each component in Step A.5.1. The sensitivities for all of the components are easily determined by looking at the equation. The sensitivity of each component is equal to 1 as is the case with most linear meter applications. The sensitivities are listed below.
Component Symbol Units Nominal
Value Standard Uncertainty
Standard Uncertainty
(Ux)%
Sensitivity Coefficient
(Sx)(Ux x Sx)2
Volumetric Flow Rate QACT ACFH 160.8 ACFH 1.00
Base Compressibility ZB Dimensionless 0.9979 1.00
Base Temperature TB °Fahrenheit 60
°Rankine 1.00 °Rankine 519.67
Flowing Pressure PF psia 25 psia 1.00
Flowing Compressibility ZF Dimensionless 0.9332 1.00
Flowing Temperature TF °Fahrenheit 55
°Rankine 1.00 °Rankine 514.67
Base Pressure PB psia 14.73 psia 1.00
Installation Effect Factor Dimensionless 1 1.00
Meter Condition Factor Dimensionless 1 1.00
Energy Content BTU/ft3 1000 BTU/ft3 1.00
Carbon Content lbm/ft3 0.035 lbm/ft3 1.00
Volume Flow Rate
295 SCFH
Total Volume Uncertainty
Energy Flow Rate
294,669 BTU per Hour Total Energy Uncertainty
Carbon Flow Rate
0.005 Tons per Hour Total Carbon Uncertainty
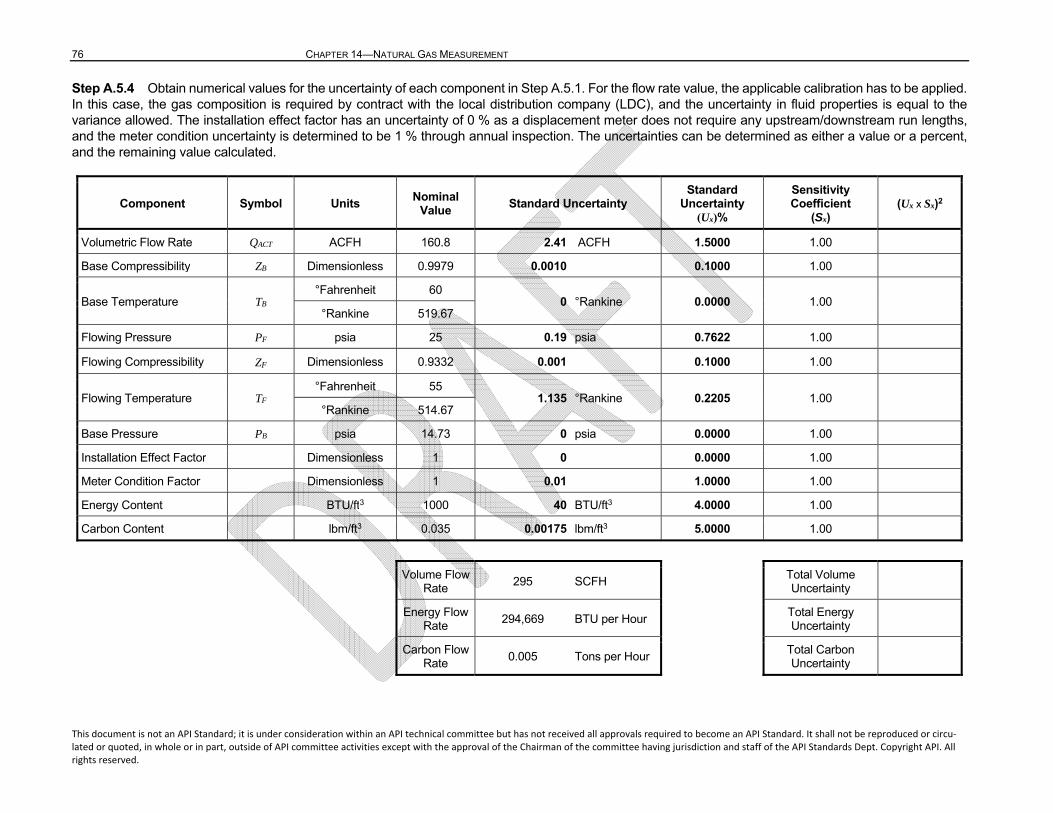
76 CHAPTER 14—NATURAL GAS MEASUREMENT
This document is not an API Standard; it is under consideration within an API technical committee but has not received all approvals required to become an API Standard. It shall not be reproduced or circu‐lated or quoted, in whole or in part, outside of API committee activities except with the approval of the Chairman of the committee having jurisdiction and staff of the API Standards Dept. Copyright API. All rights reserved.
Step A.5.4 Obtain numerical values for the uncertainty of each component in Step A.5.1. For the flow rate value, the applicable calibration has to be applied. In this case, the gas composition is required by contract with the local distribution company (LDC), and the uncertainty in fluid properties is equal to the variance allowed. The installation effect factor has an uncertainty of 0 % as a displacement meter does not require any upstream/downstream run lengths, and the meter condition uncertainty is determined to be 1 % through annual inspection. The uncertainties can be determined as either a value or a percent, and the remaining value calculated.
Component Symbol Units Nominal
Value Standard Uncertainty
Standard Uncertainty
(Ux)%
Sensitivity Coefficient
(Sx)(Ux x Sx)2
Volumetric Flow Rate QACT ACFH 160.8 2.41 ACFH 1.5000 1.00
Base Compressibility ZB Dimensionless 0.9979 0.0010 0.1000 1.00
Base Temperature TB °Fahrenheit 60
0 °Rankine 0.0000 1.00 °Rankine 519.67
Flowing Pressure PF psia 25 0.19 psia 0.7622 1.00
Flowing Compressibility ZF Dimensionless 0.9332 0.001 0.1000 1.00
Flowing Temperature TF °Fahrenheit 55
1.135 °Rankine 0.2205 1.00 °Rankine 514.67
Base Pressure PB psia 14.73 0 psia 0.0000 1.00
Installation Effect Factor Dimensionless 1 0 0.0000 1.00
Meter Condition Factor Dimensionless 1 0.01 1.0000 1.00
Energy Content BTU/ft3 1000 40 BTU/ft3 4.0000 1.00
Carbon Content lbm/ft3 0.035 0.00175 lbm/ft3 5.0000 1.00
Volume Flow Rate
295 SCFH
Total Volume Uncertainty
Energy Flow Rate
294,669 BTU per Hour Total Energy Uncertainty
Carbon Flow Rate
0.005 Tons per Hour Total Carbon Uncertainty

FUEL GAS MEASUREMENT 77
This document is not an API Standard; it is under consideration within an API technical committee but has not received all approvals required to become an API Standard. It shall not be reproduced or circu‐lated or quoted, in whole or in part, outside of API committee activities except with the approval of the Chairman of the committee having jurisdiction and staff of the API Standards Dept. Copyright API. All rights reserved.
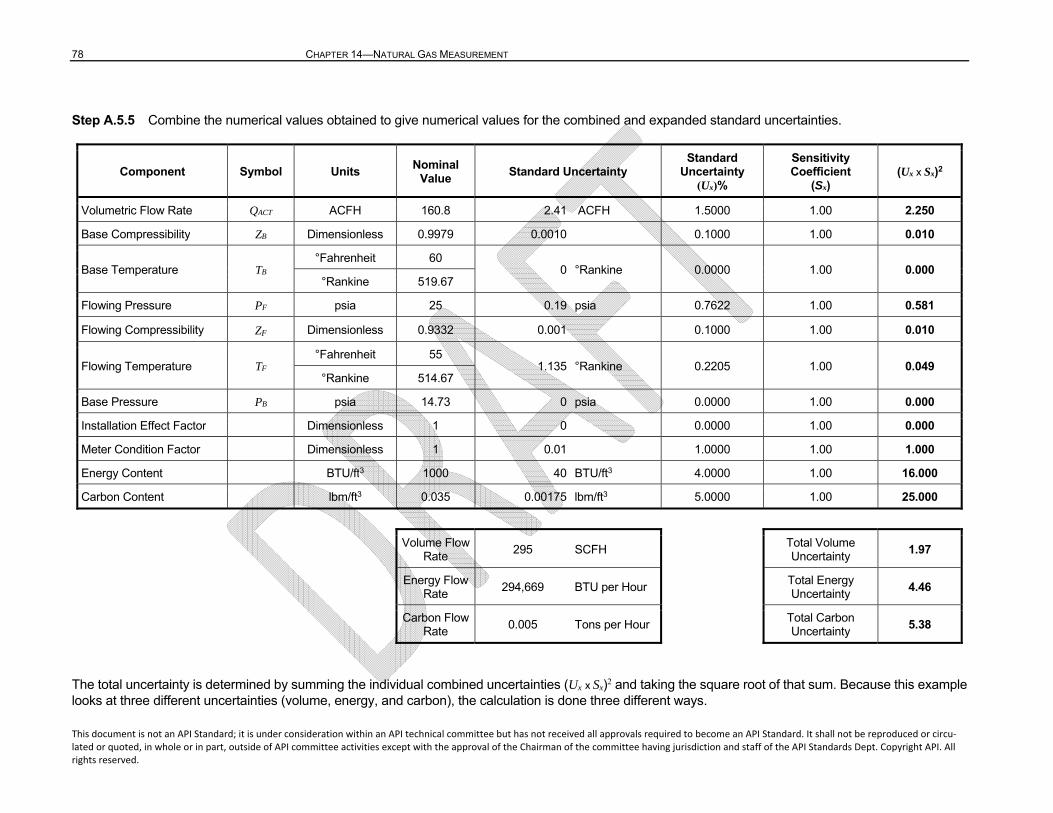
78 CHAPTER 14—NATURAL GAS MEASUREMENT
This document is not an API Standard; it is under consideration within an API technical committee but has not received all approvals required to become an API Standard. It shall not be reproduced or circu‐lated or quoted, in whole or in part, outside of API committee activities except with the approval of the Chairman of the committee having jurisdiction and staff of the API Standards Dept. Copyright API. All rights reserved.
Step A.5.5 Combine the numerical values obtained to give numerical values for the combined and expanded standard uncertainties.
Component Symbol Units Nominal
Value Standard Uncertainty
Standard Uncertainty
(Ux)%
Sensitivity Coefficient
(Sx)(Ux x Sx)2
Volumetric Flow Rate QACT ACFH 160.8 2.41 ACFH 1.5000 1.00 2.250
Base Compressibility ZB Dimensionless 0.9979 0.0010 0.1000 1.00 0.010
Base Temperature TB °Fahrenheit 60
0 °Rankine 0.0000 1.00 0.000 °Rankine 519.67
Flowing Pressure PF psia 25 0.19 psia 0.7622 1.00 0.581
Flowing Compressibility ZF Dimensionless 0.9332 0.001 0.1000 1.00 0.010
Flowing Temperature TF °Fahrenheit 55
1.135 °Rankine 0.2205 1.00 0.049 °Rankine 514.67
Base Pressure PB psia 14.73 0 psia 0.0000 1.00 0.000
Installation Effect Factor Dimensionless 1 0 0.0000 1.00 0.000
Meter Condition Factor Dimensionless 1 0.01 1.0000 1.00 1.000
Energy Content BTU/ft3 1000 40 BTU/ft3 4.0000 1.00 16.000
Carbon Content lbm/ft3 0.035 0.00175 lbm/ft3 5.0000 1.00 25.000
Volume Flow Rate
295 SCFH
Total Volume Uncertainty
1.97
Energy Flow Rate
294,669 BTU per Hour Total Energy Uncertainty
4.46
Carbon Flow Rate
0.005 Tons per Hour Total Carbon Uncertainty
5.38
The total uncertainty is determined by summing the individual combined uncertainties (Ux x Sx)2 and taking the square root of that sum. Because this example looks at three different uncertainties (volume, energy, and carbon), the calculation is done three different ways.
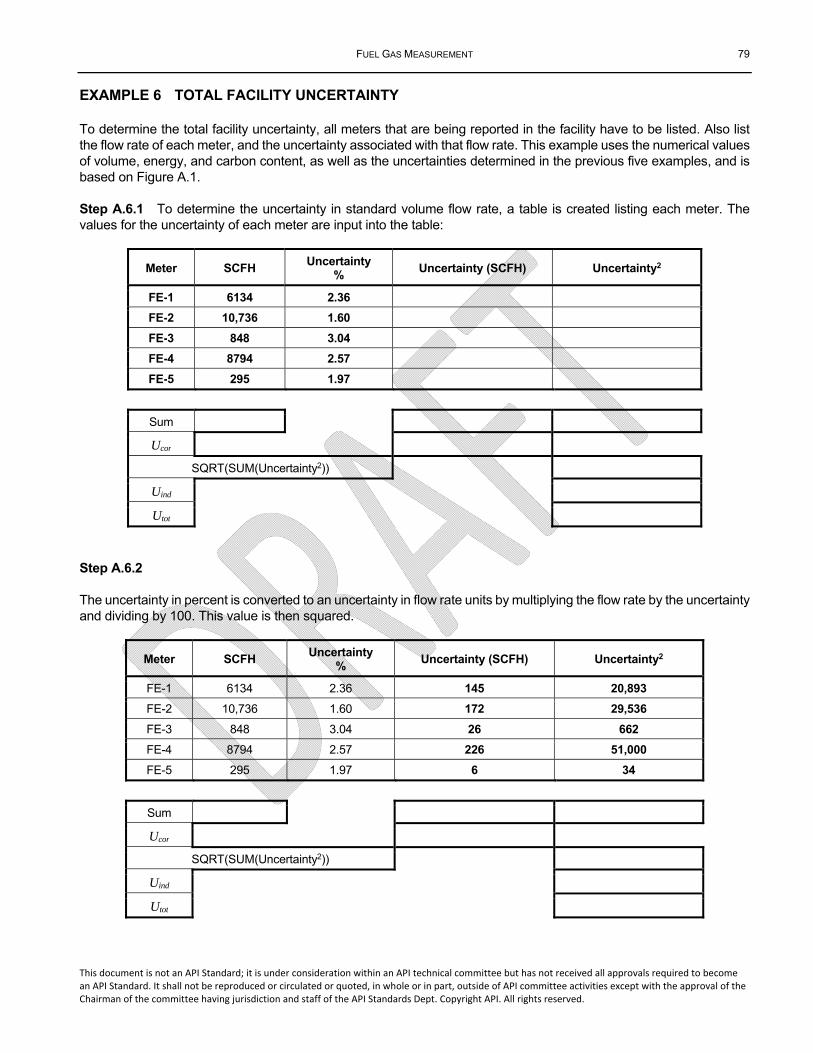
FUEL GAS MEASUREMENT 79
This document is not an API Standard; it is under consideration within an API technical committee but has not received all approvals required to become an API Standard. It shall not be reproduced or circulated or quoted, in whole or in part, outside of API committee activities except with the approval of the Chairman of the committee having jurisdiction and staff of the API Standards Dept. Copyright API. All rights reserved.
EXAMPLE 6 TOTAL FACILITY UNCERTAINTY
To determine the total facility uncertainty, all meters that are being reported in the facility have to be listed. Also list the flow rate of each meter, and the uncertainty associated with that flow rate. This example uses the numerical values of volume, energy, and carbon content, as well as the uncertainties determined in the previous five examples, and is based on Figure A.1.
Step A.6.1 To determine the uncertainty in standard volume flow rate, a table is created listing each meter. The values for the uncertainty of each meter are input into the table:
Meter SCFH Uncertainty
%Uncertainty (SCFH) Uncertainty2
FE-1 6134 2.36
FE-2 10,736 1.60
FE-3 848 3.04
FE-4 8794 2.57
FE-5 295 1.97
Sum
Ucor
SQRT(SUM(Uncertainty2))
Uind
Utot
Step A.6.2
The uncertainty in percent is converted to an uncertainty in flow rate units by multiplying the flow rate by the uncertainty and dividing by 100. This value is then squared.
Meter SCFH Uncertainty
%Uncertainty (SCFH) Uncertainty2
FE-1 6134 2.36 145 20,893
FE-2 10,736 1.60 172 29,536
FE-3 848 3.04 26 662
FE-4 8794 2.57 226 51,000
FE-5 295 1.97 6 34
Sum
Ucor
SQRT(SUM(Uncertainty2))
Uind
Utot

80 CHAPTER 14—NATURAL GAS MEASUREMENT
This document is not an API Standard; it is under consideration within an API technical committee but has not received all approvals required to become an API Standard. It shall not be reproduced or circulated or quoted, in whole or in part, outside of API committee activities except with the approval of the Chairman of the committee having jurisdiction and staff of the API Standards Dept. Copyright API. All rights reserved.
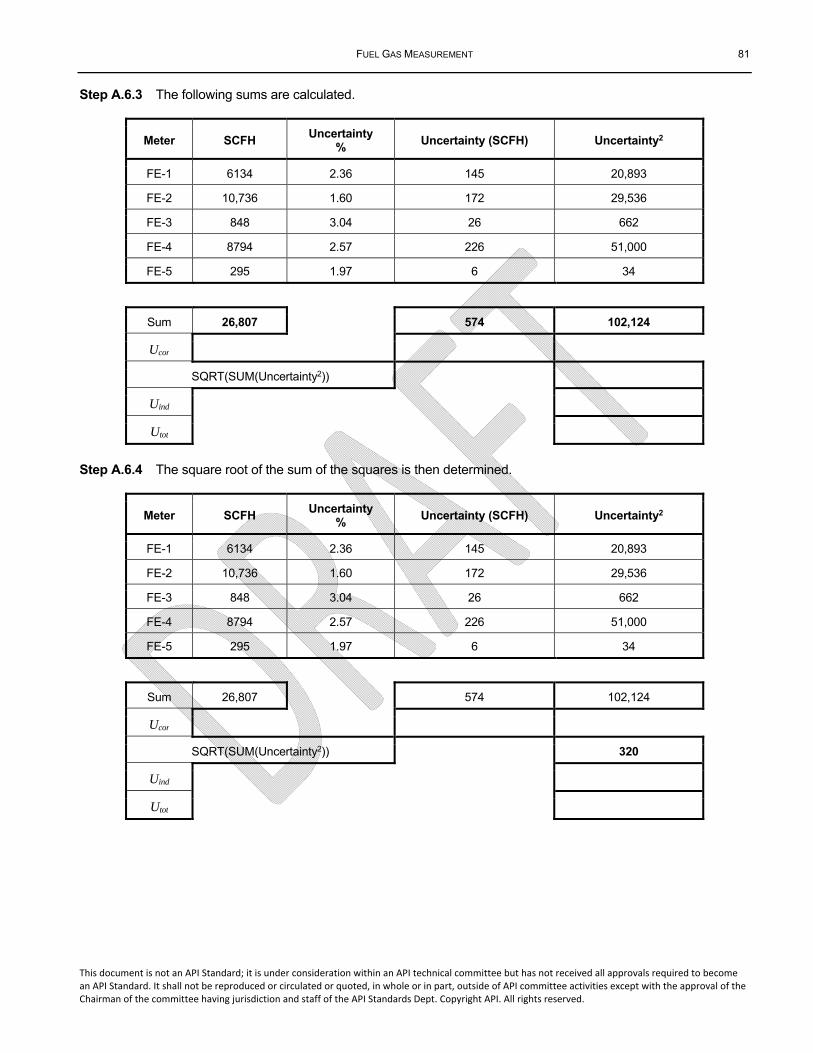
FUEL GAS MEASUREMENT 81
This document is not an API Standard; it is under consideration within an API technical committee but has not received all approvals required to become an API Standard. It shall not be reproduced or circulated or quoted, in whole or in part, outside of API committee activities except with the approval of the Chairman of the committee having jurisdiction and staff of the API Standards Dept. Copyright API. All rights reserved.
Step A.6.3 The following sums are calculated.
Meter SCFH Uncertainty
%Uncertainty (SCFH) Uncertainty2
FE-1 6134 2.36 145 20,893
FE-2 10,736 1.60 172 29,536
FE-3 848 3.04 26 662
FE-4 8794 2.57 226 51,000
FE-5 295 1.97 6 34
Sum 26,807 574 102,124
Ucor
SQRT(SUM(Uncertainty2))
Uind
Utot
Step A.6.4 The square root of the sum of the squares is then determined.
Meter SCFH Uncertainty
%Uncertainty (SCFH) Uncertainty2
FE-1 6134 2.36 145 20,893
FE-2 10,736 1.60 172 29,536
FE-3 848 3.04 26 662
FE-4 8794 2.57 226 51,000
FE-5 295 1.97 6 34
Sum 26,807 574 102,124
Ucor
SQRT(SUM(Uncertainty2)) 320
Uind
Utot
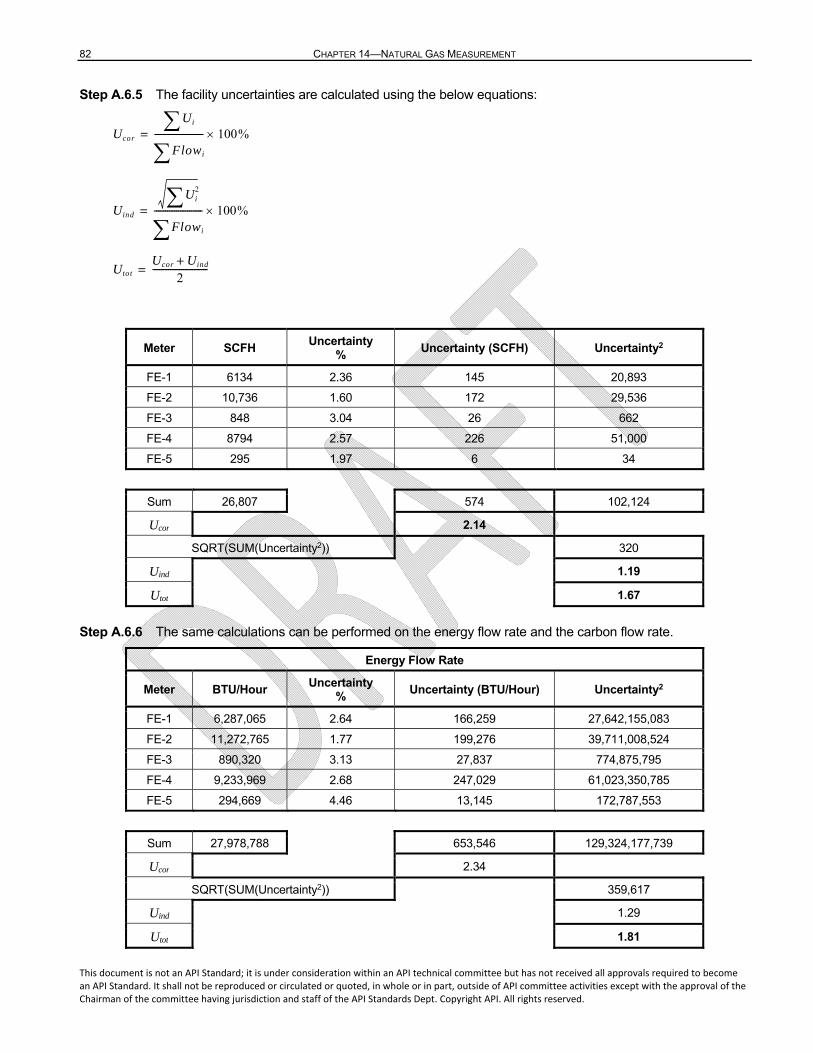
82 CHAPTER 14—NATURAL GAS MEASUREMENT
This document is not an API Standard; it is under consideration within an API technical committee but has not received all approvals required to become an API Standard. It shall not be reproduced or circulated or quoted, in whole or in part, outside of API committee activities except with the approval of the Chairman of the committee having jurisdiction and staff of the API Standards Dept. Copyright API. All rights reserved.
Step A.6.5 The facility uncertainties are calculated using the below equations:
Meter SCFH Uncertainty
%Uncertainty (SCFH) Uncertainty2
FE-1 6134 2.36 145 20,893
FE-2 10,736 1.60 172 29,536
FE-3 848 3.04 26 662
FE-4 8794 2.57 226 51,000
FE-5 295 1.97 6 34
Sum 26,807 574 102,124
Ucor 2.14
SQRT(SUM(Uncertainty2)) 320
Uind 1.19
Utot 1.67
Step A.6.6 The same calculations can be performed on the energy flow rate and the carbon flow rate.
Energy Flow Rate
Meter BTU/Hour Uncertainty
%Uncertainty (BTU/Hour) Uncertainty2
FE-1 6,287,065 2.64 166,259 27,642,155,083
FE-2 11,272,765 1.77 199,276 39,711,008,524
FE-3 890,320 3.13 27,837 774,875,795
FE-4 9,233,969 2.68 247,029 61,023,350,785
FE-5 294,669 4.46 13,145 172,787,553
Sum 27,978,788 653,546 129,324,177,739
Ucor 2.34
SQRT(SUM(Uncertainty2)) 359,617
Uind 1.29
Utot 1.81
Ucor
UiFlowi
---------------------- 100%=
Uind
Ui2
Flowi---------------------- 100%=
Utot
Ucor Uind+2
-------------------------=
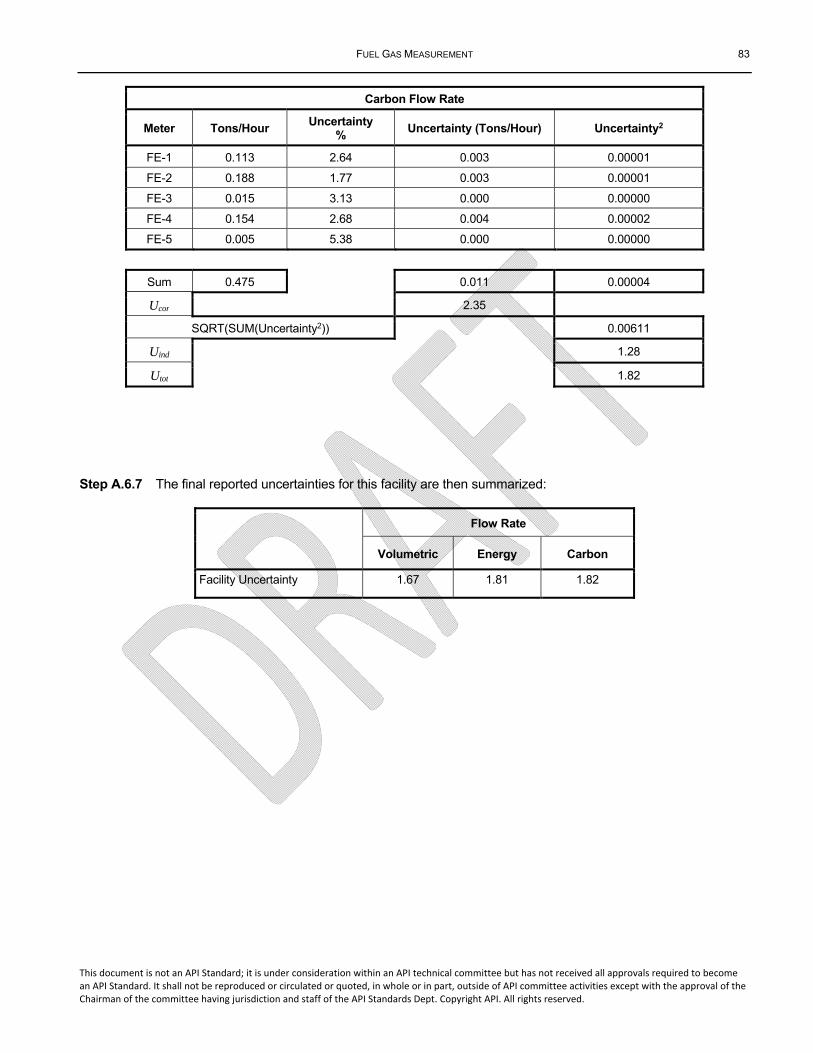
FUEL GAS MEASUREMENT 83
This document is not an API Standard; it is under consideration within an API technical committee but has not received all approvals required to become an API Standard. It shall not be reproduced or circulated or quoted, in whole or in part, outside of API committee activities except with the approval of the Chairman of the committee having jurisdiction and staff of the API Standards Dept. Copyright API. All rights reserved.
Carbon Flow Rate
Meter Tons/Hour Uncertainty
%Uncertainty (Tons/Hour) Uncertainty2
FE-1 0.113 2.64 0.003 0.00001
FE-2 0.188 1.77 0.003 0.00001
FE-3 0.015 3.13 0.000 0.00000
FE-4 0.154 2.68 0.004 0.00002
FE-5 0.005 5.38 0.000 0.00000
Sum 0.475 0.011 0.00004
Ucor 2.35
SQRT(SUM(Uncertainty2)) 0.00611
Uind 1.28
Utot 1.82
Step A.6.7 The final reported uncertainties for this facility are then summarized:
Flow Rate
Volumetric Energy Carbon
Facility Uncertainty 1.67 1.81 1.82
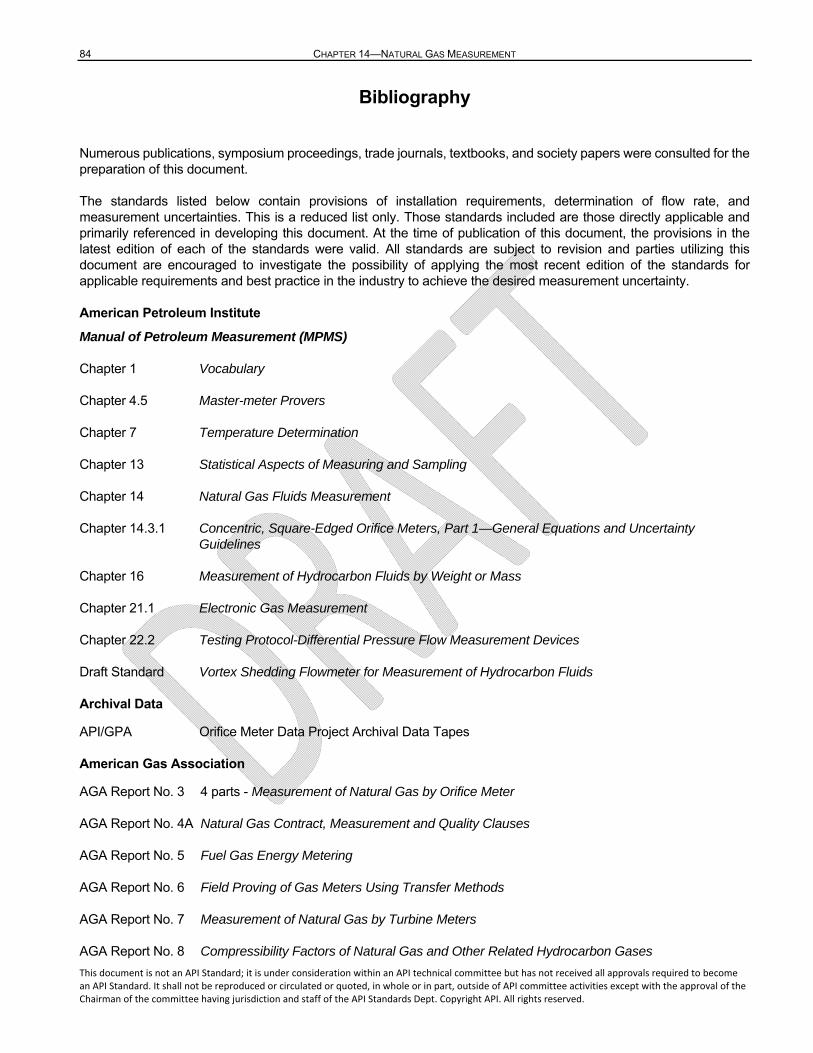
84 CHAPTER 14—NATURAL GAS MEASUREMENT
This document is not an API Standard; it is under consideration within an API technical committee but has not received all approvals required to become an API Standard. It shall not be reproduced or circulated or quoted, in whole or in part, outside of API committee activities except with the approval of the Chairman of the committee having jurisdiction and staff of the API Standards Dept. Copyright API. All rights reserved.
Bibliography
Numerous publications, symposium proceedings, trade journals, textbooks, and society papers were consulted for the preparation of this document.
The standards listed below contain provisions of installation requirements, determination of flow rate, and measurement uncertainties. This is a reduced list only. Those standards included are those directly applicable and primarily referenced in developing this document. At the time of publication of this document, the provisions in the latest edition of each of the standards were valid. All standards are subject to revision and parties utilizing this document are encouraged to investigate the possibility of applying the most recent edition of the standards for applicable requirements and best practice in the industry to achieve the desired measurement uncertainty.
American Petroleum Institute
Manual of Petroleum Measurement (MPMS)
Chapter 1 Vocabulary
Chapter 4.5 Master-meter Provers
Chapter 7 Temperature Determination
Chapter 13 Statistical Aspects of Measuring and Sampling
Chapter 14 Natural Gas Fluids Measurement
Chapter 14.3.1 Concentric, Square-Edged Orifice Meters, Part 1—General Equations and Uncertainty Guidelines
Chapter 16 Measurement of Hydrocarbon Fluids by Weight or Mass
Chapter 21.1 Electronic Gas Measurement
Chapter 22.2 Testing Protocol-Differential Pressure Flow Measurement Devices
Draft Standard Vortex Shedding Flowmeter for Measurement of Hydrocarbon Fluids
Archival Data
API/GPA Orifice Meter Data Project Archival Data Tapes
American Gas Association
AGA Report No. 3 4 parts - Measurement of Natural Gas by Orifice Meter
AGA Report No. 4A Natural Gas Contract, Measurement and Quality Clauses
AGA Report No. 5 Fuel Gas Energy Metering
AGA Report No. 6 Field Proving of Gas Meters Using Transfer Methods
AGA Report No. 7 Measurement of Natural Gas by Turbine Meters
AGA Report No. 8 Compressibility Factors of Natural Gas and Other Related Hydrocarbon Gases
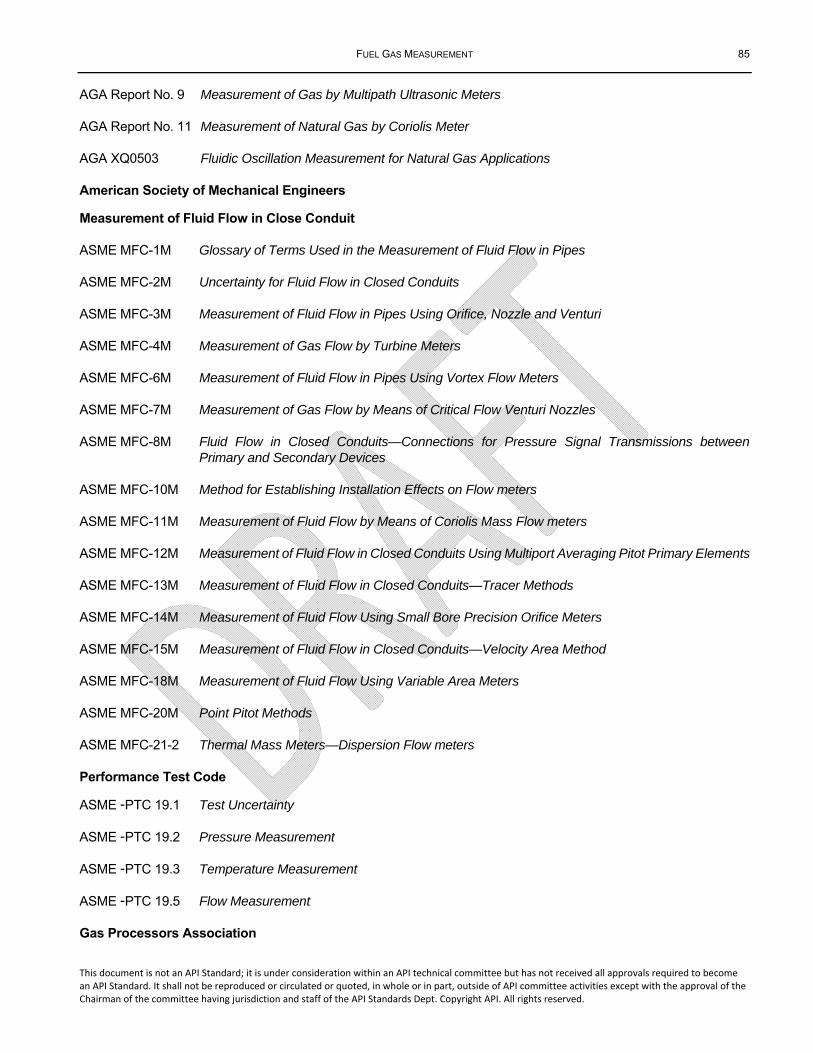
FUEL GAS MEASUREMENT 85
This document is not an API Standard; it is under consideration within an API technical committee but has not received all approvals required to become an API Standard. It shall not be reproduced or circulated or quoted, in whole or in part, outside of API committee activities except with the approval of the Chairman of the committee having jurisdiction and staff of the API Standards Dept. Copyright API. All rights reserved.
AGA Report No. 9 Measurement of Gas by Multipath Ultrasonic Meters
AGA Report No. 11 Measurement of Natural Gas by Coriolis Meter
AGA XQ0503 Fluidic Oscillation Measurement for Natural Gas Applications
American Society of Mechanical Engineers
Measurement of Fluid Flow in Close Conduit
ASME MFC-1M Glossary of Terms Used in the Measurement of Fluid Flow in Pipes
ASME MFC-2M Uncertainty for Fluid Flow in Closed Conduits
ASME MFC-3M Measurement of Fluid Flow in Pipes Using Orifice, Nozzle and Venturi
ASME MFC-4M Measurement of Gas Flow by Turbine Meters
ASME MFC-6M Measurement of Fluid Flow in Pipes Using Vortex Flow Meters
ASME MFC-7M Measurement of Gas Flow by Means of Critical Flow Venturi Nozzles
ASME MFC-8M Fluid Flow in Closed Conduits—Connections for Pressure Signal Transmissions between Primary and Secondary Devices
ASME MFC-10M Method for Establishing Installation Effects on Flow meters
ASME MFC-11M Measurement of Fluid Flow by Means of Coriolis Mass Flow meters
ASME MFC-12M Measurement of Fluid Flow in Closed Conduits Using Multiport Averaging Pitot Primary Elements
ASME MFC-13M Measurement of Fluid Flow in Closed Conduits—Tracer Methods
ASME MFC-14M Measurement of Fluid Flow Using Small Bore Precision Orifice Meters
ASME MFC-15M Measurement of Fluid Flow in Closed Conduits—Velocity Area Method
ASME MFC-18M Measurement of Fluid Flow Using Variable Area Meters
ASME MFC-20M Point Pitot Methods
ASME MFC-21-2 Thermal Mass Meters—Dispersion Flow meters
Performance Test Code
ASME -PTC 19.1 Test Uncertainty
ASME -PTC 19.2 Pressure Measurement
ASME -PTC 19.3 Temperature Measurement
ASME -PTC 19.5 Flow Measurement
Gas Processors Association
86 CHAPTER 14—NATURAL GAS MEASUREMENT
This document is not an API Standard; it is under consideration within an API technical committee but has not received all approvals required to become an API Standard. It shall not be reproduced or circulated or quoted, in whole or in part, outside of API committee activities except with the approval of the Chairman of the committee having jurisdiction and staff of the API Standards Dept. Copyright API. All rights reserved.
GPA 2166 Obtaining Natural Gas Samples for Analysis by Gas Chromatography
GPA 2261 Analysis of Natural Gas and Similar Gaseous Mixtures by Gas Chromatography
GPA 2286 Tentative Method of Extended Analysis for Natural Gas and Similar Gaseous Mixtures by Temperature Programmed Gas Chromatography
ASTM International (ASTM)
ASTM D1070 Standard Test Methods for Relative Density of Gaseous Fuels
Federal Register
Environmental Protection Agency
Part II: 40 CFR Parts 51, 52, 70 et al. Prevention of Significant Deterioration and Title V Greenhouse Gas Tailoring Rule; Proposed Rule—Tuesday October 27, 2009
Part II: 40 CFR Parts 86, 87, 89 et al. Mandatory Reporting of Greenhouse Gases, Final Rule—Friday October 30, 2009
ISO
ISO 5167-2 Measurement of fluid flow by means of pressure differential devices inserted in circular cross-section conduits running full—Part 2: Orifice plates
ISO 5168 Measurement of fluid flow—Procedures for the evaluation of uncertainties
ISO/IEC Guide 98-3:2008 Uncertainty of measurement—Part 3: Guide to the expression of uncertainty in measurement (GUM:1995)