Embed Size (px)
Citation preview

Universidade de São Paulo Faculdade de Filosofia, Ciências e Letras de Ribeirão Preto Departamento de Química
Manual Of the Program MS Analyzer
Laboratory of Organic synthesis Ribeirão Preto, 2000

Índice
Index 1.Introduction 1 2. Install/Uninstall 3 3. “What is it for?” or Overview on Program Features 4 4. How to... 13 5. How are effected some of the calculations 17

1. Introduction 3
Manual of the Program “MS Analyzer”
1.Introduction The program MS Analyzer was elaborated with the intention to provide research chemists with a useful tool for the analysis of mass spectra. Computers of Mass Spectrometers usually have a library of spectra which permits the identification of known substances by comparison. In the case, however, of the chemist who investigates new substances, those libraries are not of much use, and there are not many computer programs that we could consider appropriate for the analysis of unknown samples spectra. This analysis requires tedious arithmetical calculations – one needs to subtract the mass corresponding to a peak from the mass corresponding to another peak, to look over tables (usually very incomplete) to find possible formulas for the fragments, to calculate percentages of isotope peaks, and so on. Moreover, it is necessary to make some suppositions about possible fragmentation mechanisms and, based on those suppositions, remake several times the arithmetical calculations. All those calculations are very simple, but extremely boring. Take as an example the molecular weight (mass) of possible fragment formulas. It is very easy to calculate molecular weights but, after repeating this for 10 or 20 formulas, the chemist usually starts to find this a very tiring task. Reminding ourselves that one of the most useful features of the computer is their ability to repeat operations “forever”, it becomes obvious that the best solution to this problem is to transfer the repetitious job to the machine, mainly if we consider that every laboratory has good computers nowadays. We have thus elaborated the MS Analyzer program with the intention of: a) Realize in the computer all arithmetical calculations involved in the analysis of mass spectra. This goes well beyond than merely mechanizing the same operations usually done by the chemist, because the computer has a much larger ability to make long and complex calculations. As an example, a chemist would hardly have the patience to calculate all possible formulas for a molecular weight 200 (with elements C, H, O). These calculations would take too much time, and would not be worthwhile. The computer, on the other hand, can make it in a fraction of a second and, in addition, it easily decides whether the “ion” or the neutral fragment has or not an unpaired electron for each calculated formula. Another example is the case of the isotope peaks: if you never tried, you can do it now to see how hard it is to calculate certain isotope peaks – try with the molecular ion of a substance containing selenium. This calculation is also easily realized by the computer, without any special tricks: all possibilities are considered.
1. Introduction 4
Manual of the Program “MS Analyzer”
b) Reduce the need to look over tables; several tables were included in the program, such as tables of mass and abundance of isotopes, tables of formulas for neutral and ionic fragments, etc. The corresponding data are displayed when needed, thus saving time and rendering the job less boring. c) Providing the chemist with a tool for a few graphical treatment of spectral data. Numerical data, introduced in the computer through a *.txt file or simply by typing, are transformed in a graph (the “spectrum”) which can be copied and pasted in a “Word” document, for instance. The structural or molecular formula can be pasted over the spectrum, can be moved, resized, fixed, and can also be copied and pasted together with the spectrum. We thus believe that this program will be a useful tool for the research chemist, and also for students that are willing to learn or deepen their knowledge about certain aspects of mass spectrometry.

2. Install / Uninstall 5
Manual of the Program “MS Analyzer”
2. Install / Uninstall The dimensioning of the frames displayed by the program was optimized for a screen area of 800 × 600 pixels (control panel → video → configurations). If you use a screen with less pixels (e.g. 640 × 480), the frames will not fit in the screen, forcing a continuous use of the scroll bars, badly exasperating the user. A screen with more pixels (e.g. 1024 × 768) is OK, except that it can be a little deceptive because the frames are rather crowded while there is space remaining around. 2.1. Install After downloading you should extract to a temporary directory and then click in “Setup.exe”. Then follow instructions. If you have a previous version of this program in your computer, you must uninstall it before installing the new one. When installation is completed, copy the folder “Examples” to the same directory where is the program. 2.2. Uninstall Proceed as usual, opening “My Computer”, then “Control Panel”, then “Add or Remove Programs”. During the process, the program usually asks if you want to remove this or that shared file; it is advisable to keep them all. If everything comes out as usual, the (uninstalling) program should warn you that it was not possible to remove the folder “C:\Program Files\MS Analyzer\”, or whatever was the MS Analyzer program directory. Remove this folder with “Windows Explorer”, thus eliminating the folder “Examples” that should be still there, and the file MS Analyzer.ini, created by the program when running for the first time.

3. “What is it for?” or Overview on Program Features 6
Manual of the Program “MS Analyzer”
Periodic Table Molecular Weights
3. “What is it for?” or Overview on Program Features
The first question that occurs to the user when considering a new program is “what is it for?” or “what can I do with this program?”. We will try to answer those questions in this section, doing our best to keep it as short as possible. Things will seem much more clear if you run the program while reading. When opening, the program will display 6 windows with the following titles:
- Data Input- followed by a second title - Formulas & Isotope Peaks - Isotopes of Elements - Graph of Isotope Peaks - Mass Spectrum - Periodic Table of Elements
Moving the mouse pointer over the periodic table (without pressing the buttons), an enlarged picture will show details of the element over which is the mouse pointer, including atomic number (up left), average atomic mass (down left) and valences (up right). For each element there is a valence with darker background: this is the selected valence for the calculations for removing “impossible” formulas (see ahead). The reader can certainly infer the meaning of the colors used in the table. Clicking on an element the user will see above (in the window “Isotopes of Elements”) a table of the isotopes of the clicked element. The graph at left (Graph of Isotope Peaks) simulates a mass spectrum corresponding to those isotopes. You can take this opportunity to see how small are the isotope peaks of elements commonly found in organic compounds, such as C, H, N, O, S, Si, F, P, I and observe the sharp contrast with other elements such as Cl, Br, Se, Te (and several others). The program can be used to calculate molecular weights: in the window “Data Input - ...” choose the tab “Formula”, and type the desired formula in the appropriate box (you must use uppercase and lowercase letters correctly for the symbol of the elements). Typing CH4, for instance, above the formula will be displayed the values of the average molecular weight (16.0426) and of the molecular weight corresponding to the more abundant isotopes (16.03130016). The average weight can be easily calculated using atomic weights from a common periodic table, but the weight corresponding to the main isotopes (which is the weight given by a high resolution mass spectrometer) would require an isotope weights table, not always as much at hand for a chemist as a periodic table.

3. “What is it for?” or Overview on Program Features 7
Manual of the Program “MS Analyzer”
Isotope Peaks Molecular Weight and Formulas Conditions for Calculations Condition 2 (Removing Formulas)
Pressing “Enter” or clicking the button “Go”, the program will make calculations of the isotope peaks corresponding to the molecular ion or molecular peak of the typed formula (CH4). The result is shown in a graph and in a table; the graph is visible at left, in the lower part of the screen. To see the table, choose the tab “Isotope Peaks” in the window “Formulas & Isotope Peaks”. Both the table and the graph can be copied through the menu “Edit”, and pasted in other programs (like “Word”, for instance). Choosing the tab “Mol. Weight” (in the same window “Data Input - ...), you can give a molecular weight to the computer (type in appropriate box) (try the value 200); when pressing “Enter” (or clicking the button “Go”) the computer will find all possible formulas having this molecular weight (200), under the specified conditions (see ahead). To see the formulas, choose the tab “Formulas” in the window “Formulas & Isotope Peaks”. For the value 200, with elements C, H, O and removing “impossible” formulas, the computer will find 21 formulas. Checking the small box corresponding to a formula provokes the calculation of isotope peaks (from the molecular ion peak) for that formula. The results are shown, as before, in the graph and in the table. As already mentioned, there are three conditions for these calculations:
1) Which elements should be considered? 2) All calculated formulas should be shown, or some
obviously “impossible” formulas should be removed?
3) Precision required. The first two conditions are established in the window “Data Input - ...”; the second one is more evident, because there is a small frame with the title “Formulas” and two options: choose the option “Show All” and click again in the button “Go”, verifying that the number of found formulas rises to 120 (with molecular weight 200). Give a look to those formulas and you will see absurdities such as C10H64O, C4H151, H198, etc. this occurs because the computer tries all combinations of the selected elements, finding all formulas having the given molecular weight. When choosing the option “Remove formulas with excess monovalent elements”, most of the absurdities is eliminated. We should remind here that, being based exclusively on valences, only monovalent elements can be limited. We cannot say that the formula C14O2, for instance, cannot exist, based only on the valences of the elements. Even less probable formulas, such as C2O11, would be hypothetically possible:
O
OOO
CO O
COO
OO O O
OOO
CO O
COO
O O
O

3. “What is it for?” or Overview on Program Features 8
Manual of the Program “MS Analyzer”
Condition 1 Selected Elements May / Must be present Condition 3 Precision Required
Those are highly improbable formulas, because any chemist knows how weak is the O-O bond, mainly when one tries to extend the chain. It is very hard to transfer this type of information to the computer without risking that it starts to remove reasonable formulas together with the bad ones, because there are so many elements and so many possible combinations. It is much more safe to rely on the chemist to remove the improbable formulas calculated by the computer.1 The first condition, “Which elements should be considered?”, is very important because the time spent in calculations rises very much when considering a larger number of elements. This program admits a maximum of seven selected elements. The chosen elements are shown in the small frame entitled “Selected Elements”. To modify the list, choose the tab “Elements” (always in the window “Data Input - ...”) and click on the desired element on the periodic table, both to add or to remove. For each element two options are shown, and the option “May be present” comes automatically selected. If you choose the option “Must be present” for a certain element, only formulas containing that element will be considered. The option “Must be present” should not be chosen for the analysis of a mass spectrum, because the same option is valid for all calculations. Take as an example the case of a molecule containing 1 atom of chlorine: if the option “Must be present” is chosen for the chlorine, that will mean that the molecular ion, the neutral fragment and the positive fragment should all contain chlorine, which is not possible. Finally the third condition, “Precision Required”, is modified as wished in the Box contained in the toolbar. The value ± 0.5 amu is appropriate for common low resolution spectra. In the case of higher resolution spectra this value can (and should) be modified accordingly. Try to type in the molecular weight box the value “200” and, with a precision required of ± 0.5 amu, elements C, H, O, removing formulas with excess monovalent elements, the computer will find 21 formulas. Change the precision required to ± 0.05 amu and the number of formulas will be reduced to 10; with ± 0.005 amu, just one formula is found.
1 Even the elimination of formulas with excess monovalent elements, safe in the present circumstances, can lead to some mistakes when analyzing a mass spectrum: suppose that the molecular ion of a substance looses simultaneously H(⋅) and H2O, giving a peak in M-19; entering “19” in the molecular weight box, the computer will not find the “real” formula (H2O + H = “H3O”), because it will decide that this formula (“H3O”) has an excess of monovalent elements. Choosing the option “Show All”, three formulas are found, including H3O (which shows in the computer screen as a positive íon because, when calculations are done in this way, the computer assumes that this is a peak in the mass spectrum, and not a neutral fragment).
3. “What is it for?” or Overview on Program Features 9
Manual of the Program “MS Analyzer”
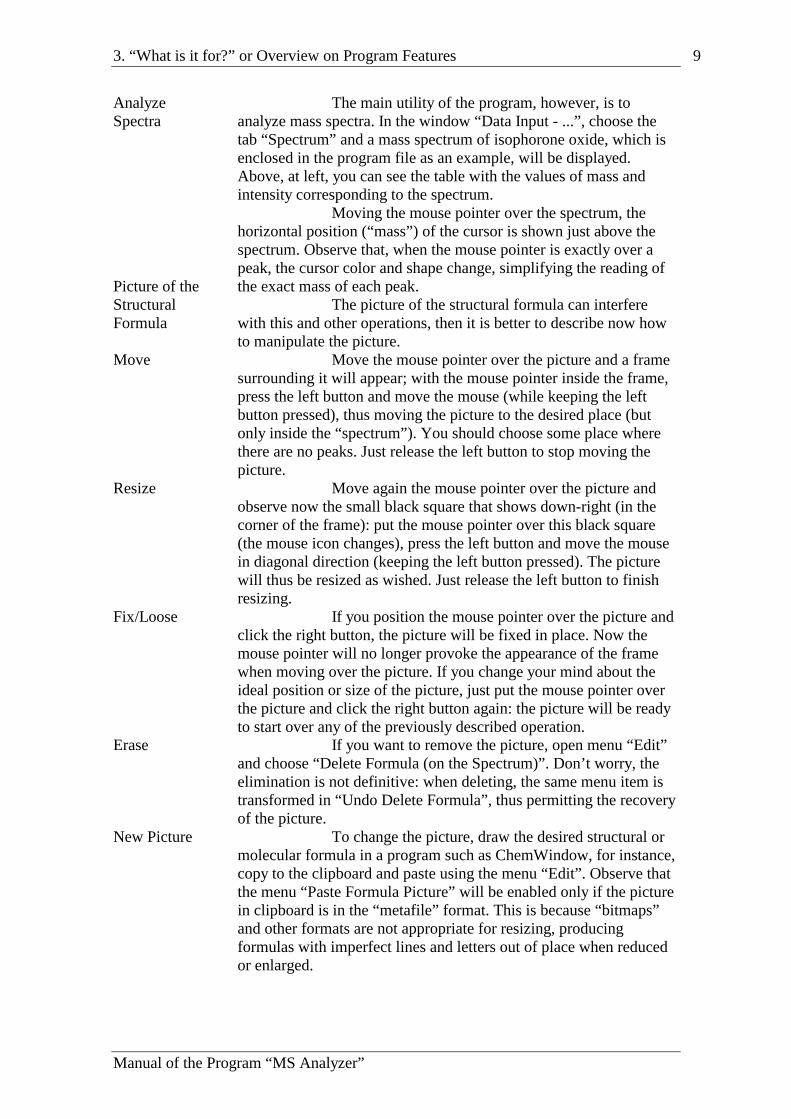
Analyze Spectra Picture of the Structural Formula Move Resize Fix/Loose Erase New Picture
The main utility of the program, however, is to analyze mass spectra. In the window “Data Input - ...”, choose the tab “Spectrum” and a mass spectrum of isophorone oxide, which is enclosed in the program file as an example, will be displayed. Above, at left, you can see the table with the values of mass and intensity corresponding to the spectrum. Moving the mouse pointer over the spectrum, the horizontal position (“mass”) of the cursor is shown just above the spectrum. Observe that, when the mouse pointer is exactly over a peak, the cursor color and shape change, simplifying the reading of the exact mass of each peak. The picture of the structural formula can interfere with this and other operations, then it is better to describe now how to manipulate the picture. Move the mouse pointer over the picture and a frame surrounding it will appear; with the mouse pointer inside the frame, press the left button and move the mouse (while keeping the left button pressed), thus moving the picture to the desired place (but only inside the “spectrum”). You should choose some place where there are no peaks. Just release the left button to stop moving the picture. Move again the mouse pointer over the picture and observe now the small black square that shows down-right (in the corner of the frame): put the mouse pointer over this black square (the mouse icon changes), press the left button and move the mouse in diagonal direction (keeping the left button pressed). The picture will thus be resized as wished. Just release the left button to finish resizing. If you position the mouse pointer over the picture and click the right button, the picture will be fixed in place. Now the mouse pointer will no longer provoke the appearance of the frame when moving over the picture. If you change your mind about the ideal position or size of the picture, just put the mouse pointer over the picture and click the right button again: the picture will be ready to start over any of the previously described operation. If you want to remove the picture, open menu “Edit” and choose “Delete Formula (on the Spectrum)”. Don’t worry, the elimination is not definitive: when deleting, the same menu item is transformed in “Undo Delete Formula”, thus permitting the recovery of the picture. To change the picture, draw the desired structural or molecular formula in a program such as ChemWindow, for instance, copy to the clipboard and paste using the menu “Edit”. Observe that the menu “Paste Formula Picture” will be enabled only if the picture in clipboard is in the “metafile” format. This is because “bitmaps” and other formats are not appropriate for resizing, producing formulas with imperfect lines and letters out of place when reduced or enlarged.

3. “What is it for?” or Overview on Program Features 10
Manual of the Program “MS Analyzer”
Parent Peak Selected Peak Calculated Formulas Tables from the Literature Eliminating Possibilities
Beginning the spectrum analysis, click on the picture of the down-pointing hand, in the toolbar, and move the mouse pointer over the spectrum: the picture of the hand will move together with the cursor. Position the cursor exactly over the peak in “154” (the vertical line should become yellow and the mouse icon should become a cross), and click the left button (the right button will cancel the operation!). A new window will show, containing a list of the 12 possible formulas for that molecular weight (154). Go back to the toolbar, click in the down-pointing arrow and move the mouse pointer in the spectrum (only on the left side of the hand picture that marks the “Parent Peak”; on the right side of the hand the thing doesn’t work [try it!], because the fragment cannot have a larger mass than the molecule from which it is formed). Put the cursor exactly over the peak in 139 and click the left button. Several lists will become visible now. The upper part is consisted of lists of calculated formulas: at left, the 12 formulas for the Parent Peak (they were already there); in the center, the 9 formulas of the Selected Peak (139); at right, the unique possible formula for the neutral fragment (15), that can only be [⋅]CH3. The lower part is consisted of lists containing literature data for the weights corresponding to the Selected Peak (the one marked by the arrow) and to the neutral fragment (the weight of which is the difference between the weight of the Parent Peak and the weight of the Selected Peak). Those tables are simple, and the reader can easily find how to use them. Observe only that the table at left (Gottlieb) is separated in aliphatic and aromatic compounds, and the corresponding option should be selected. We should remind that the authors themselves clearly state that those tables are not complete, but they show only more common examples for each mass. In fact, for higher values of mass (as is the case here for the Selected Peak – 139) the tables from the literature are very incomplete. At this point the reader can be a little discouraged, imagining that his analysis would involve considerations to choose among 12 formulas for the Parent Peak and among 9 formulas for the Selected Peak. If the sample were actually fully unknown, something like that would really have to be done, but the program can simplify the task a little bit: click in the small box of [⋅]CH3 (in the neutral fragments list, above at right) and the 12 formulas of the Parent Peak will be reduced to 9 (the nine formulas that, on loosing CH3, would give rise to the 9 different formulas of the Selected Peak). Actually, however, even with unknown samples, there are usually some reasons to believe that the substance can or should correspond to a certain molecular formula.

3. “What is it for?” or Overview on Program Features 11
Manual of the Program “MS Analyzer”
Move the Arrow
If this is the case (as it happens here, because we “know” that the sample should have the formula C9H14O2), the whole operation can be highly simplified by checking (on the left list, above) the small box of the supposed molecular formula: several possibilities are eliminated at once (in this particular case, only one possibility is left for the Selected Peak: C8H11O2, which is the result of subtracting CH3 from the formula C9H14O2).Take note of these formulas, as they will be useful later. This means that, if we have reasons to believe that the formula corresponding to the molecular íon peak is C9H14O2, we can be almost certain that the formula corresponding to the peak in 139 is C8H11O2. In this case there is just one possibility because there is just one possible formula for the neutral fragment. Continue the analysis by moving the arrow to the next peak (126). This can be done in two different ways: 1) click again in the arrow in the toolbar and move the mouse pointer over the spectrum, or 2) move the mouse pointer slowly over the upper part of the arrow picture on the spectrum until the icon is converted into a hook, then click the left mouse button, thus capturing the arrow. Now there are two possible formulas for the neutral fragment (C2H4 and CO) and, if you have left the Parent Peak formula C9H14O2 checked, there are also two formulas for the Selected Peak: C7H10O2 and C8H14O, each of them corresponding to the loss of the neutral fragment that is on the same line. You can proceed the analysis now by moving the arrow to each peak you wish to, taking notes of the formulas for Selected Peaks and for neutral fragments. Don’t forget that each of these positive fragments (the peaks) can be formed from some other positive fragment, and not directly from the Parent Peak. If you leave the supposed molecular formula checked, each case will show only two or three possibilities. On the other hand, you can leave the arrow (Selected Peak) in 126 and move the hand (Parent Peak) to 139: this will give just one formula for the neutral fragment, [⋅]CH, which the literature quotes as “impossible”; you have there a strong indication that the positive fragment with mass 126 is formed from the molecular ion (154) (loosing CO or C2H4), and not from the fragment with mass 139. Proceeding in a similar way, we will conclude that the positive fragment with mass 111 can be formed from the molecular ion (loosing [⋅]C3H7 or [⋅]C2H3O), from the fragment with mass 139 (loosing C2H4 or CO), or from the fragment with mass 126 (loosing [⋅]CH3). The positive fragment with mass 97, however, is probably not formed from the fragment with mass 111, as the loss of CH2 (the only possibility) is considered as “very uncommon” by the literature; fragments with mass 126 and 129, as well as the molecular ion, are possible starting points to form “97”.

3. “What is it for?” or Overview on Program Features 12
Manual of the Program “MS Analyzer”
Options Introduce New Spectrum Compare Isotope Peaks
This has possibly already given to the reader an Idea of the versatility of the program for doing this arithmetical analysis. We should remark, however, that the program will work in a slightly different manner depending on the selected options. Click in the menu “Options” and you will see that there are three aspects to be decided: the tab “Formulas” refers to an aspect already discussed; the tab “Peak Markers” refers to copying the spectrum (as a picture to be pasted in other programs); the tab “PP Choose” determines how the program will work when the user checks one of the Parent Peak formulas. Until now we were assuming that the second option was selected (Delete all other formulas and use the chosen one to find the “Selected Peak” formulas). If you want to try, choose the other option and verify that, when checking one of the Parent Peak formulas, the other formulas will no longer be eliminated. Observe also that, when you close the program, it will save the selected options. On restarting, it will come with the same options it had when closed. Another aspect of the analysis of a mass spectrum, the isotope peaks, cannot be well illustrated with this example because this spectrum is not well done and doesn’t show important isotope peaks. In the folder “Examples” there is another spectrum of the same substance, “Isophorone Oxide”, which is more suitable for this purpose. For this reason we will see now how to introduce data of a new spectrum in the program. There are two ways: 1) open a *.txt file (a data table that can be made by most mass spectrometers) or 2) type the data directly in the table. In the toolbar, click in the picture of a mass spectrum to bring the window “Data Input – Spectrum Analyzer” (with the tab “Spectrum” already selected) to front and observe the buttons: to open a new spectrum, click in “Open”, then open the folder “Examples” and choose “Isophorone Oxide.txt” (only *.txt files can be opened). Proceed and observe that the spectrum comes already traced, with the new formula, in a short time. Put the formula in a suitable place, reduce and fix. Click in the arrow in the toolbar and select the peak in 154. In the list of formulas, check the Box of the formula C9H14O2. Then click (again in the toolbar) in the picture of the whole (not torn) yellow page (the one at left): this will show the table of calculated isotope peaks (at right) and the table of spectral data (at left) simultaneously. Use the scroll bar to make visible the values 154.1 and 155.15, and compare their intensities (10.74 and 1.06) with the calculated values (10.74 and 1.106). The value 10.74 was, obviously, taken as reference for calculations; the comparison should be between 1.06 and 1.106, which brings to the conclusion that the experimental isotope peak has the expected intensity, according to calculations. It should be remarked that isotope peaks of this kind of formula are small and subject to large experimental errors – remember that in the previous spectrum the peak in 155 didn’t show at all.

3. “What is it for?” or Overview on Program Features 13
Manual of the Program “MS Analyzer”
Type New Spectral Data Add M+
Repeat the procedure for the peak in 139. Reminding that, as previously determined, its formula should be C8H11O2, check that formula in the list and compare the peaks 139 and 140. Again the values being compared (2.82 experimental and 2.975 calculated) are reasonably close. The peak in 126 brings a curious aspect of the problem. There are two possible formulas for this “peak” (as previously determined): C8H14O and C7H10O2. The first gives rise to an isotope peak in 127 (calculated) with intensity 1.743%, while the second gives the value 1.527%; as the experimental value is 1.53%, the reader will possibly be tempted to conclude that the most probable formula is C7H10O2. For the reasons exposed above, however, it is not advisable to jump to conclusions based on isotope peaks: it is more safe to proceed a mechanistic analysis. The most important utility of the isotope peaks is to detect, in the molecular íon and in the fragments, the presence of elements that have a high percentage of isotopes, such as Cl, Br, Se, Te, etc. To introduce new spectral data by typing, click in the button “Type in Data”, answer “No” when the program asks if you want to keep old data, and type the mass values, always pressing “Enter” at the end of each value. Then do the same with the intensity values. The yellow Box for typing can be moved with the arrow keys. When finished, click in the button “End Data” (the same button “Type in Data”, that changed its name when clicked). In the case (a frequent case, by the way) of a spectrum that doesn’t show the molecular ion peak, you can add a ghost molecular peak, with intensity zero, to render the analysis more easy. Of course, this assumes that you know the molecular formula of the substance, or have some good reasons to think that you know it. In the window “Data Input - ...” choose the tab “Formula”. Type the supposed molecular formula and take note of the molecular weight corresponding to the main isotopes (if you are dealing with a low resolution mass spectrum, 1 to 3 decimal places are enough). Choose the tab “Spectrum” and click in the button “Add M+”; type the found value and press “Enter”. Move the cursor on the spectrum over the region of M+ and you will see that the peak is there (it is not visible because its intensity is zero). This peak can now be marked as “Parent Peak” (or as “Selected Peak”) for the calculations of the fragments. Some of the examples (those with names ending by “M+”) contain those ghost peaks, that were introduced in the way described above.

3. “What is it for?” or Overview on Program Features 14
Manual of the Program “MS Analyzer”
Copy Spectrum Save Spectrum Save Formula Picture Open Formula Picture
The spectrum can be copied, through the menu “Edit”, to be pasted in other programs. You can copy it as it shows in the screen (with blue background) or with white background. If the formula is fixed in the spectrum, it will also be copied; otherwise, the program will ask if you want to copy the formula. The selection markers (the hand and the arrow) will be copied or not together with the spectrum, according to your option (menu “Options”, tab “Peak Markers”). You can also save the spectral data, a specially useful feature when the data were typed, or when you have added a ghost M+. Click in the button “Save As...” (visible on the right side of the data table), type an appropriate name and save. If you save the formula picture (menu “File”, sub-menu “Save Formula Picture As...”) with the same name∗ used for the spectral data (obviously the extension is different, because it is “txt” for the data and “wmf” for the picture) and in the same directory, when you open the data the picture will come together. If you use a different name or a different directory, you will have to open the picture separately (menu “File”, sub-menu “Open Formula Picture”). If you look inside the folder “Examples” with the Windows Explorer, you can have an idea of how to organize your files in a practical way.
∗ if you have added a ghost molecular peak to your file and want to write “M+” at the end of the name to remind this particularity (for instance, “MentholM+”), the name of the picture file should not contain “M+” (in the given example, it should be just “Menthol”); in this way, the same picture will open together with the data with and without ghost molecular peak. Look inside the folder “Examples” to see how it is done.
4. How to... 15
Manual of the Program “MS Analyzer”
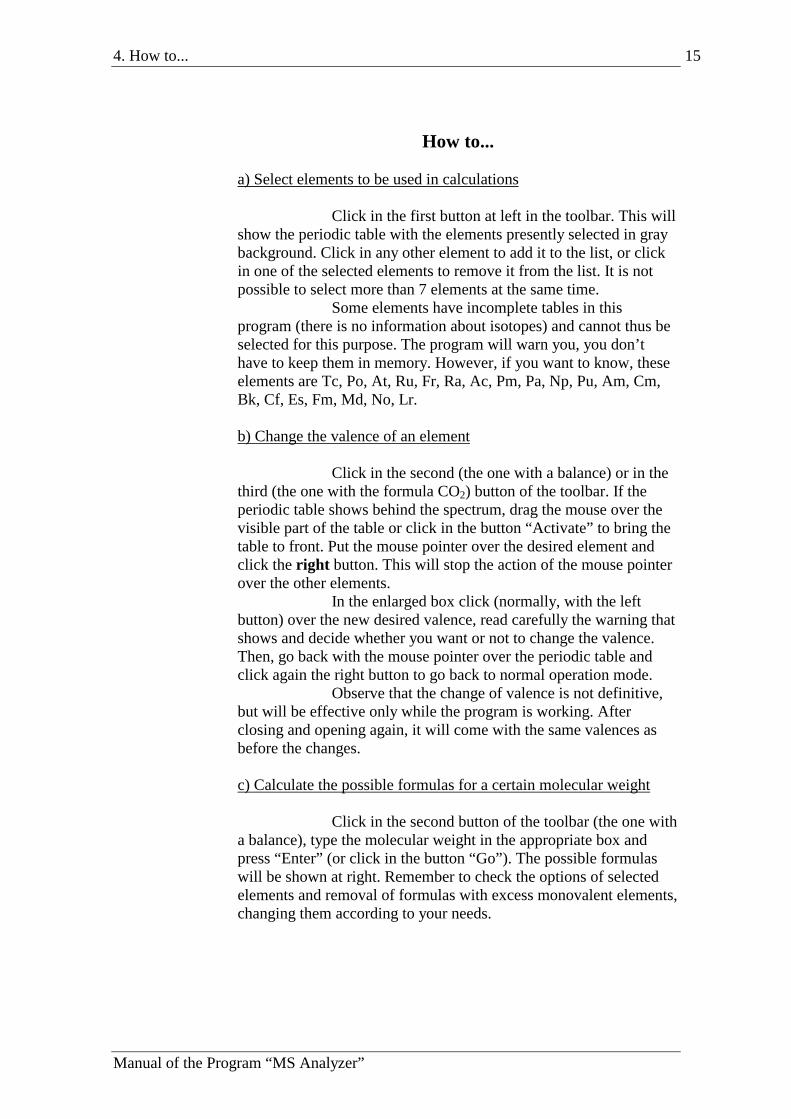
How to... a) Select elements to be used in calculations Click in the first button at left in the toolbar. This will show the periodic table with the elements presently selected in gray background. Click in any other element to add it to the list, or click in one of the selected elements to remove it from the list. It is not possible to select more than 7 elements at the same time. Some elements have incomplete tables in this program (there is no information about isotopes) and cannot thus be selected for this purpose. The program will warn you, you don’t have to keep them in memory. However, if you want to know, these elements are Tc, Po, At, Ru, Fr, Ra, Ac, Pm, Pa, Np, Pu, Am, Cm, Bk, Cf, Es, Fm, Md, No, Lr. b) Change the valence of an element Click in the second (the one with a balance) or in the third (the one with the formula CO2) button of the toolbar. If the periodic table shows behind the spectrum, drag the mouse over the visible part of the table or click in the button “Activate” to bring the table to front. Put the mouse pointer over the desired element and click the right button. This will stop the action of the mouse pointer over the other elements. In the enlarged box click (normally, with the left button) over the new desired valence, read carefully the warning that shows and decide whether you want or not to change the valence. Then, go back with the mouse pointer over the periodic table and click again the right button to go back to normal operation mode. Observe that the change of valence is not definitive, but will be effective only while the program is working. After closing and opening again, it will come with the same valences as before the changes. c) Calculate the possible formulas for a certain molecular weight Click in the second button of the toolbar (the one with a balance), type the molecular weight in the appropriate box and press “Enter” (or click in the button “Go”). The possible formulas will be shown at right. Remember to check the options of selected elements and removal of formulas with excess monovalent elements, changing them according to your needs.

4. How to... 16
Manual of the Program “MS Analyzer”
The isotope peaks for each formula will be calculated if you check the small box at left of the formula. To see the isotope peaks table, choose the tab “Isotope Peaks”, or click in the toolbar button that shows a whole (not torn) yellow page. d) Calculate the molecular weight of a given formula In the toolbar, click in the third button (the one with the formula “CO2”) and type the formula in the appropriate box. You must use correctly the uppercase and lowercase letters for the elements symbols. When finishing typing the formula, the molecular weights (average and corresponding to the more abundant isotopes) will be already visible just above. e) Calculate the isotope peaks of a given formula Type the formula as described in (d), and press “Enter” (or click in the button “Go”). The isotope peaks, as a graph, will be visible at left, below. If you want to see the table, click in the toolbar button that shows a whole (not torn) yellow page. f) Introduce data of a new spectrum Click in the 4th button of the toolbar (the one that shows the picture of a mass spectrum). If the data of your new spectrum are in na appropriate file (*.txt) just open the file, starting by clicking in the button “Open” (or, in the menu “File”, choose “Open Spectrum File”). If the data table of the file is in one of the formats supported by the program, the data will be copied and the spectrum will be automatically traced. If your data are not in a format that can be read by the program, you can type them directly in the table: click in the button “Type in Data”, answer “No” to the question about keeping old data and start typing the values of mass, always pressing “Enter” at the end of each value (the typed value is transferred to the table only when you press “Enter”). Then, put the yellow box on the top of the “intensities” column (move the box with the arrow keys) and type the intensities, always pressing “Enter” at the end of each value. When finished, click in the button “End Data”. g) Add ghost M+ Proceed as in (f) until you see the data table. Click in the button “Add M+”, type the value of the molecular weight of the peak M+ and press “Enter”. If you have only the molecular formula, proceed initially as in (d), taking the weight value corresponding to the more abundant isotopes (not the average). For common low resolution mass spectra, 1 to 3 decimal places are enough.

4. How to... 17
Manual of the Program “MS Analyzer”
h) Save data of a spectrum Proceed as in (f) until you see the data table. Click in the button “Save As...”, type a name for your file (it is not necessary to add the extension .txt, it will be added automatically) and click in “Save”. i) Introduce a structural and/or molecular formula in the spectrum Draw or write the formula in a program such as ChemWindow (several other programs can be used, but it is important that the program furnishes the picture in “metafile” format, which is the only format accepted by MS Analyzer). Copy the picture (to the “clipboard”) and paste it in the spectrum opening the menu “Edit” and choosing “Paste Formula Picture”. If the copied formula is not in “metafile” format, this sub-menu will not be enabled. j) Move and resize the formula Moving the mouse pointer over the formula, a frame surrounding it will appear; press the left mouse button (inside the frame) and drag to put the picture in the desired place. Release the left button to finish. To resize, put the mouse pointer over the black square (that shows when you move the mouse pointer over the picture), pressing the left button and dragging diagonally. Again, just release the button to finish. The picture can be fixed in place by clicking the right mouse button, while the mouse pointer is over the picture. To loose (release) the picture, just click again the right mouse button. k) Save formula picture In the menu “File”, choose “Save Formula Picture As...”, type the desired name and click in “Save”. It is important to save the picture with the same name used to save the spectral data. Only in this way the picture will be loaded together with the data. See note in (l). It is not necessary to write the extensions “.wmf” for the picture and “.txt” for the data.
4. How to... 18
Manual of the Program “MS Analyzer”
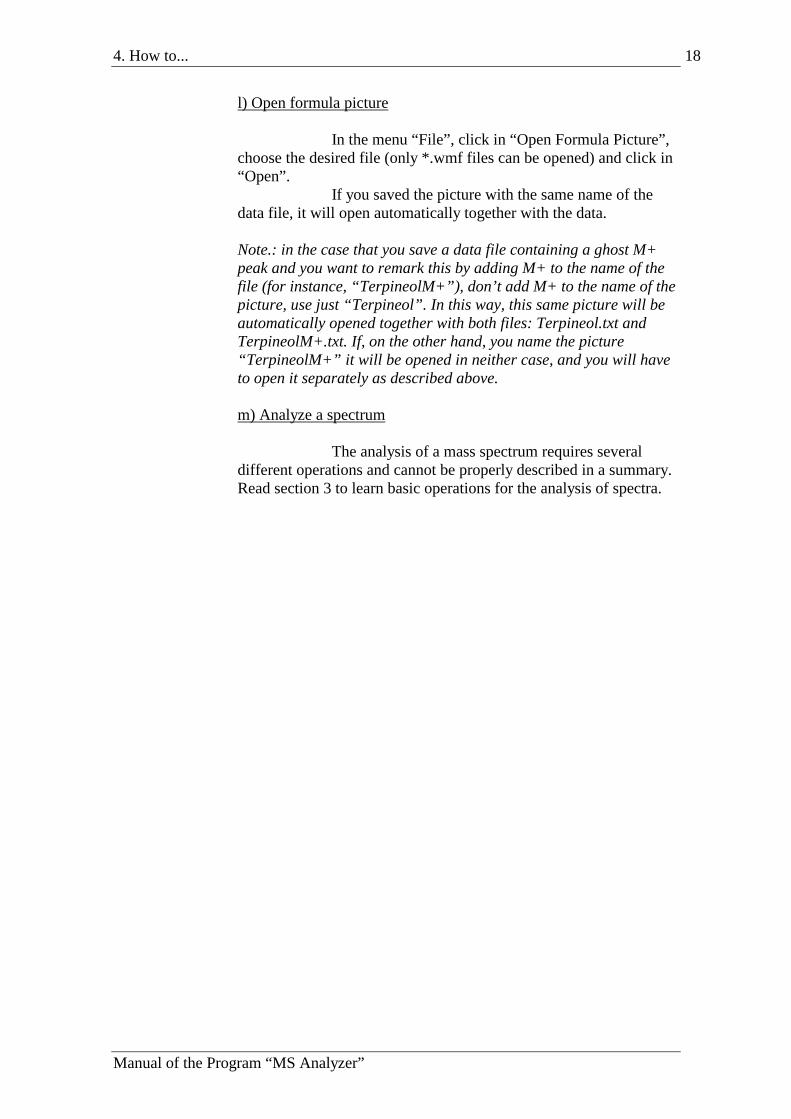
l) Open formula picture In the menu “File”, click in “Open Formula Picture”, choose the desired file (only *.wmf files can be opened) and click in “Open”. If you saved the picture with the same name of the data file, it will open automatically together with the data. Note.: in the case that you save a data file containing a ghost M+ peak and you want to remark this by adding M+ to the name of the file (for instance, “TerpineolM+”), don’t add M+ to the name of the picture, use just “Terpineol”. In this way, this same picture will be automatically opened together with both files: Terpineol.txt and TerpineolM+.txt. If, on the other hand, you name the picture “TerpineolM+” it will be opened in neither case, and you will have to open it separately as described above. m) Analyze a spectrum The analysis of a mass spectrum requires several different operations and cannot be properly described in a summary. Read section 3 to learn basic operations for the analysis of spectra.

5. How are Effected Some of the Calculations 19
Manual of the Program “MS Analyzer”
5. How are Effected Some of the Calculations Certain calculations realized by this program are very simple and obvious. Some of the calculations, however, have certain features that require a more detailed explanation, at least to give the reader an idea of how reliable he should consider the results. 5.1. Calculation of formulas When a certain molecular weight is given, to calculate the formulas that could have that weight the program tries all possible combinations of elements, considering the established parameters. Among these parameters are: which elements should be considered and which is the precision required. The main routine that realizes these operations is reproduced below:
Sub FNLoop(El)Dim g As Integer, Beg As IntegerDim N As Integer, PAnt As DoubleNLoop = NLoop + 1For g = 1 To El - 1
PAnt = PAnt + PP(g)Next gBeg = Int((PMol - PAnt) / PA(El))For N = Beg + 1 To MayMust(El) Step -1
NEl(El) = NPP(El) = NEl(El) * PA(El)PFrag = PAnt + PP(El)If Abs(PFrag - PMol) < PcReq Then
Call ImpFormulaGoTo Fim
End IfIf NLoop < NElSel Then
Call FNLoop(El + 1)End If
Fim:Next NIf El > 1 Then
NEl(El) = 0NLoop = NLoop - 1
End IfEnd Sub
Of course, before entering this routine several preparations are needed. We will not discuss this. The main part of the routine consists of a loop For...Next, with the special feature that the routine is called again from inside itself (a “recurrent” process). In this way, the result is equivalent to several nested loops For...Next.

5. How are Effected Some of the Calculations 20
Manual of the Program “MS Analyzer”
As it is needed one loop for each element, to write seven nested loops would be a complicated and, as seen above, an unnecessary task.. The limitation to seven elements is only of practical nature, because with many elements the process would require too much time and memory, it could exceed the limit of the Lists that store the formulas, etc. The routine itself can be used for as many elements as wished. The counting of the loop is regressive, starting in the higher possible value (Beg + 1) and reducing to 1 (if the user has chosen the option “must be present” for that element) or zero, which are the two possible values for the variable MayMust(El). The value of “N” represents the number of atoms of the considered element contained in the formula; as you can see, for each value of N the program calculates the molecular weight (Pfrag) and, if the difference (absolute value) between this value and the given molecular weight (Pmol) is below the precision required (PcReq), then the formula will be considered, for now, as a solution (Call ImpFormula). The routine ImpFormula (too long to be reproduced here) then realizes the following operations with the received formula: calculates the total number of electrons of the formula ( ∑i (atomic number of element i) × (number of atoms of element i in formula)) and verifies if it is even or odd. In the case of a neutral fragment, if it is even there is no unpaired electron. On the other hand, if the fragment is positive, it has lost one electron (only ions with just one positive charge are considered in this program), and the conclusion above is inverted. The program thus decides the symbols [⋅⋅⋅⋅], [++++⋅⋅⋅⋅] and [+] that it puts in front of the formulas. The next operation, to decide whether the formula contains or not an excess of monovalent elements, is a bit more complicated. This is based on the following considerations. Elements with valence above 1 can, in principle, make chains bonding to themselves or to other polyvalent elements. For this reason it is not possible to establish limits for the number of each of these elements that can be present in a formula. Those chains, if they are linear, leave V-2 valences resting for each of the intermediate elements (because the intermediate element has to “use” two valences to bind itself to its two neighbors), and V-1 for each of the elements in the extreme of the chain (V is the total number of valences of the considered element). In this way, a molecule containing n1 atoms of the element 1, with valence V1, n2 atoms of the element 2, with valence V2, etc., will have a maximum number of “free valences” (those to which the monovalent elements can be bound) equal to
∑ −+=i
ii VnesFreeValenc )2(2max
This is, also, the maximum number of monovalent elements that this molecule can contain.

5. How are Effected Some of the Calculations 21
Manual of the Program “MS Analyzer”
In Basic programming language this has the following aspect:
For N = 1 To NElSelNFElV(Vl(N)) = NFElV(Vl(N)) + NEl(N)
Next NFor N = 2 To 10
MonoMax = MonoMax + (N - 2) * NFElV(N)Next NMonoMax = MonoMax + 2
The first loop just counts the total number of atoms of each valence that is present on the molecule; the second loop makes the summation of the mathematical formula above and the last line adds two to the result. Even if it has been calculated for linear chains, the result is also valid for branched chains: a branched chain can always be made from a linear chain by breaking a part of it (and thus producing two more free valences) and connecting this part somewhere also in the chain (and thus consuming again the two recently liberated valences, resulting in the same number of free valences). 5.2. Isotope peaks calculation In principle, the isotope peaks calculation is a simple process; in practice, however, it involves several steps, rendering the routines rather complex. There is a large number of variables involved, resulting in a hard to understand process. It seems to us that the more simple way of approaching the problem is the following:
1) To make all possible combinations∗ of the isotopes of one element at a time, and calculate the probability§ of each combination;
2) Make the combinations of the groups found for one element with the groups of the other elements.
∗ In this text, the word “combination” written in normal way is being used with its common meaning; when used with the meaning it has in mathematics, it will appear in italic: combination, permutation. § The word “probability” will be used here with a special meaning, which we could perhaps call “relative probability”. It is certainly familiar to the reader that, in mass spectrometry, to the main peak is usually given the value 100% (or 1.00). In the case, for instance, of the isotopes of an element, the main isotope will be 100% (1.00) and another isotope can have an intensity of 40% (0.40), resulting in a total of 140% (1.40). When talking about probability, the sum of the probabilities would have to be 100% (1.00), and this term could not be used for those intensities (100% and 40%). However, these numbers are proportional to the probabilities; at the end we will just compare the relative intensities of the peaks, then it makes no difference to use one or other value, because the final ratio will be the same.

5. How are Effected Some of the Calculations 22
Manual of the Program “MS Analyzer”
Step 1: Step 2:
As an example, we will examine the molecule of water (H2O): a) For the hydrogen b) For the oxygen combination probability combination probability
A1: 1H1H 1.00×1.00
=1.00
B1: 16O
1.00
A2: 1H2H 1.00×0.00016
=0.00016
B2: 17O
0.0004
A3: 2H1H 0.00016×1.00
=0.00016
B3: 18O
0.002
A4: 2H2H 0.00016×0.00016
=2.56×10⁻⁸
Now we would have to combine all “A’s” with all “B’s”, calculating the corresponding probability (product of the probabilities of each one). The resulting groups are: A1B1 A2B1 A3B1 A4B1 A1B2 A2B2 A3B2 A4B2 A1B3 A2B3 A3B3 A4B3 (We think it is not necessary to show probabilities here) For the case of hydrogen shown above, what we call “combination” is, actually, permutation (or arrangement, according to some texts), because A2 and A3 differ only by the order. You can see here a certain waste of work in this calculation, because A2 and A3 have the same mass and the same probability, then it makes no sense to calculate twice. It would be more reasonable to make the combinations (really combinations, differing only by the kind) for the hydrogen isotopes and then multiply the probability of each combination by the number of possible permutations for each one (permutations, here, taking all components of each combination). combinations permutations Probability A1 : 1H1H
--
1
1.00×1
A2 : 1H2H
2H1H
2
0.00016×2 A3 : 2H2H
--
1
2.56×108×1
It should be remarked that the combinations and permutations belong to the kind that allow repetition of components, because the same isotope can appear several times in each combination (or permutation). An example that can clear up several of these aspects is the calculation of the isotopes of hydrogen for CH4:

5. How are Effected Some of the Calculations 23
Manual of the Program “MS Analyzer”
combinations permutations Probability A1: 1H1H1H1H --
1
PA1×1 A2: 1H1H1H2H
1H1H2H1H 1H2H1H1H 2H1H1H1H
4
PA2×4
A3: 1H1H2H2H
1H2H1H2H 2H1H1H2H 1H2H2H1H 2H1H2H1H 2H2H1H1H
6
PA3×6
A4: 1H2H2H2H
2H1H2H2H 2H2H1H2H 2H2H2H1H
4
PA4×4
A5: 2H2H2H2H
--
1
PA5×1
A very important point to understand the whole thing is that, in the case of combinations, we have really to determine each one of the combinations, to be able to calculate its “molecular” weight and its probability. In the case of the permutations we don’t need to know each one, but only the number of permutations for each case (the mass and the probability are already known, and they are the same for each case from a set of permutations). When combining one element with other, A2 will appear just once (instead of 4 times, as it would be if we worked as before), but its probability will already be multiplied by 4, which will bring to the same final result. In the same way, A3 will appear only once (and not 6 times), with its probability multiplied by 6. In the computer these calculations are effected in part by a main routine named “IsotPeaks”, that calls several other routines to effect minor specialized calculations. We will not show the whole IsotPeaks routine here, because it is too long and a considerable part of it is destined to read formulas, printing results, etc. We will reproduce only some more important parts and the other routines will also be “cleaned” of less relevant parts.

5. How are Effected Some of the Calculations 24
Manual of the Program “MS Analyzer”
Routine IsotPeaks, part 1
ReDim Cr(Cnt)MainPkMass = 0Dim Zmin As Integer, Zmax As IntegerFor N = 1 To Cnt
For g = 1 To 103If AtSymb(N) = Symb(g) Then
Exit ForEnd If
Next gAtNum(N) = gFor j = 1 To NIsot(AtNum(N))
If AbundIsot(AtNum(N), j) = 100 ThenAtW(N, 0) = AtomW(AtNum(N), j)AbIs(N, 0) = 100Exit For
End IfNext jFor j = 1 To NIsot(AtNum(N))
Z = Abs(AtomW(AtNum(N), j) - AtW(N, 0))ZInt = Int(Z)If Z - ZInt >= 0.5 Then ZInt = ZInt + 1If AtomW(AtNum(N), j) - AtW(N, 0) < 0 Then
ZInt = -ZIntAtW(N, ZInt) = AtomW(AtNum(N), j)AbIs(N, ZInt) = AbundIsot(AtNum(N), j)If ZInt < Zmin Then Zmin = ZIntIf ZInt > Zmax Then Zmax = ZInt
Next jMainPkMass = MainPkMass + AtW(N, 0) * NFEl(N)Call PrepComb(N, NFEl(N), AtNum(N))
Next N This is the final part of formula reading. The computer already knows how many different elements are present (Cnt), how many atoms of each element there are in the formula [NFEl(x)], and now it will find, for each element, the atomic number [AtNum(x)] and the atomic weight [AtW(x,y)] and abundance [AbIs(x,y)] for each isotope. It also calculates the weight of the “main” peak (the one formed by the more abundant isotopes) (MainPkMass), and calls the routine PrepComb for each element.
Sub PrepComb(NOrd, NElF, Atn)Dim Conj As Integer, So As Integer, P As DoubleDim N As Integer, F As Double
Conj = NIsot(Atn)So = 0P = 1For N = 0 To NElF - 1
So = Conj + NP = P * So
Next NF = 1For N = 1 To NElF
F = F * NNext NCr(NOrd) = P / F
End Sub

5. How are Effected Some of the Calculations 25
Manual of the Program “MS Analyzer”
This is a simple routine, and has the function of calculating the number of combinations with repetitions [Cr(x)] for each element in the formula. The mathematical formula corresponding to the calculations done by this routine is:
!)1.().........2)(1()(
ppmmmmCR p
m−+++=
m: number of isotopes of the considered element. p: number of times that the element appears in the considered molecular formula. If we know the number of possible combinations, then we can properly dimension several variables, and we can also calculate the number of isotope peaks (Npk), which is done by the small section of the routine IsotPeaks reproduced below:
Routine IsotPeaks – part2
CRmax = 0Npk = 1For N = 1 To Cnt
If Cr(N) > CRmax Then CRmax = Cr(N)Npk = Npk * Cr(N)
Next N
As you can see, the total number of peaks is the product of all the number of combinations of each element. This becomes clear when you consider that each combination of an element can be “combined” (“grouped”) with all the combinations of another element (see again the example of water given before). In the next step the routine IstotPeaks makes a dimensioning of several variables and calls, for each element of the formula, the routine CombLoop.
Routine IsotPeaks – part 3
ReDim MolWE(50, CRmax): ReDim ProbWE(50, CRmax):ReDim Pmut(50, CRmax)
ReDim MolW(Npk): ReDim ProbW(Npk)For N = 1 To Cnt
ReDim ZMolW(NFEl(N))ReDim ZProbW(NFEl(N))ReDim ZZ$(NFEl(N))ReDim Rep(NFEl(N))'Cont = 0Call CombLoop(1, NIsot(AtNum(N)), 0, N,
NFEl(N), AtNum(N), 0)Next N

5. How are Effected Some of the Calculations 26
Manual of the Program “MS Analyzer”
The routine CombLoop (reproduced below) is, in a way, the most important, because it makes the possible combinations of isotopes for each element and calculates the corresponding probability. Sub CombLoop(Inic, NIs, NLoop, NOrd, NElF, AtoNu, Cont) Dim N As Integer, PrZ$, g As Integer, PrZ2$ NLoop = NLoop + 1 For N = Inic To NIs ZMolW(NLoop) = AtomW(AtoNu, N) ZProbW(NLoop) = AbundIsot(AtoNu, N) / 100 ZZ$(NLoop) = N & Symb(AtoNu) If NLoop = NElF Then Cont = Cont + 1 MolWE(NOrd, Cont) = 0 ProbWE(NOrd, Cont) = 1 PrZ$ = "" For g = 1 To NElF MolWE(NOrd, Cont) = MolWE(NOrd, Cont) + ZMolW(g) ProbWE(NOrd, Cont) = ProbWE(NOrd, Cont) * ZProbW(g) PrZ$ = PrZ$ & "[" & ZZ$(g) & "]" Rep(g) = 1 Next g Call FindRep(1, 0, NElF) PrZ2$ = "" For g = 1 To NElF PrZ2$ = PrZ2$ & Rep(g) & "," Next g Call NPermutRep(NElF, NOrd, Cont) ProbWE(NOrd, Cont) = ProbWE(NOrd, Cont) * Pmut(NOrd, Cont) End If If NLoop < NElF Then Call CombLoop(N, NIs, NLoop, NOrd, NElF, AtoNu, Cont) End If Next N NLoop = NLoop - 1 End Sub As the reader can easily notice, this is again a recurrent routine, meaning that it calls itself, resulting in several nested loops For-Next. The central part of the operations is realized only when NLoop = NElF or, in other words, when the number of executed loops equals the number of times that the considered element shows in the formula. At this time the routine has just finished one of the possible combinations, and is ready to calculate its “molecular” weight and its probability. As an example, imagine that we are calculating the hydrogen combinations in CH4: when first entering the routine (Nloop = 1) variables ZmolW(x) and ZprobW(x) are charged with the data (atomic weight and abundance/100) of the lighter isotope (1H), the same occurring in the three following passages; then Nloop equals NElF, and the variables MolWE(x,y) and ProbWE(x,y) are charged respectively with the “molecular” weight and with the

5. How are Effected Some of the Calculations 27
Manual of the Program “MS Analyzer”
probability of the corresponding combination (1H1H1H1H). Then two other routines are called, FindRep and NpermutRep: they will count the repetitions and calculate the number of permutations of the recently found combination (those routines are examined ahead). Once we know the number of permutations, Pmut(x,y), the probability of the combination ProbWE(x,y) is multiplied by this value. The loop For-Next goes now to the second isotope (2H), finding the combination (1H1H1H2H) and again calculating mass and probability. Then it goes back to the previous loop, puts a deuterium in the third position (1H1H2H) and goes again to the fourth loop with N = 2: notice the call: Call CombLoop (N,....) which makes that in later loops the first isotopes are no longer considered. In this way the routine cannot find the fake “combination” 1H1H2H1H (that would be a permutation of the previous one), but only the true combination 1H1H2H2H. The routine FindRep is meant to find the number of repetitions in each combination, needed to calculate the number of permutations. Sub FindRep(Inic2, NLoop2, NElF2)
Dim N As IntegerNLoop2 = NLoop2 + 1For N = Inic2 + 1 To NElF2
If ZZ$(N) = ZZ$(Inic2) ThenRep(Inic2) = Rep(Inic2) + 1
End IfNext NIf Inic2 + Rep(Inic2) < NElF2 Then
Call FindRep(Inic2 + Rep(Inic2), NLoop2, NElF2)End If
End Sub Each one of the values Rep(x) found by this routine is, actually, the number of times that the corresponding isotope figures in the combination. When entering the routine, Rep(x)=1 for all elements∗ of the combination (observe the loop For g = 1 to NElF ----Next g that comes before calling FindRep in the routine CombLoop). In FindRep one of the values of Rep(x) is increased by 1 for each time that an isotope identical to the considered one is found. The routine is very simple because the combinations are formed in an orderly manner; it is not necessary to verify the previous elements, as the elements equal to the first (of its kind) considered will always be ahead of it. As an example, take the case of the following combination of isotopes: 1X1X2X2X2X3X4X4X. The recurring loop will run four times, effecting the following transformations:
∗ Elements in italic, in this text, are members of a set, and not chemical elements.

5. How are Effected Some of the Calculations 28
Manual of the Program “MS Analyzer”
Beginning 1st time 2nd time 3rd time 4th time Rep(1) = 1 → 2 Rep(2) = 1 Rep(3) = 1→ 3 Rep(4) = 1 Rep(5) = 1 Rep(6) = 1→ 1 Rep(7) = 1→ 2 Rep(8) = 1 Following FindRep, the routine CombLoop calls NPermut Rep, that calculates the number of permutations (with repetitions) Pmut(x,y) that is possible to do with a given combination. Sub NPermutRep(NElF3, NOrd3, Cont3)
Dim Div As Double, NumFac As Double, N As IntegerDim Fac As Double, g As IntegerDiv = 1NumFac = 1For N = 1 To NElF3
NumFac = NumFac * NIf Rep(N) <> 1 Then
Fac = 1For g = 1 To Rep(N)
Fac = Fac * gNext gDiv = Div * Fac
End IfNext NPmut(NOrd3, Cont3) = NumFac / Div
End Sub
The mathematical formula corresponding to the calculations realized by this routine is:
!!.........!!!)(
λγβαmPR =
where: m is the number of elements in the combination α is the number of elements equal to a β is the number of elements equal to b . . etc. Examining the routine you can easily see that the values of Rep(x) = 1 are ignored. After all these operations, the processing goes back to the routine IsotPeaks in the part represented below:
5. How are Effected Some of the Calculations 29
Manual of the Program “MS Analyzer”
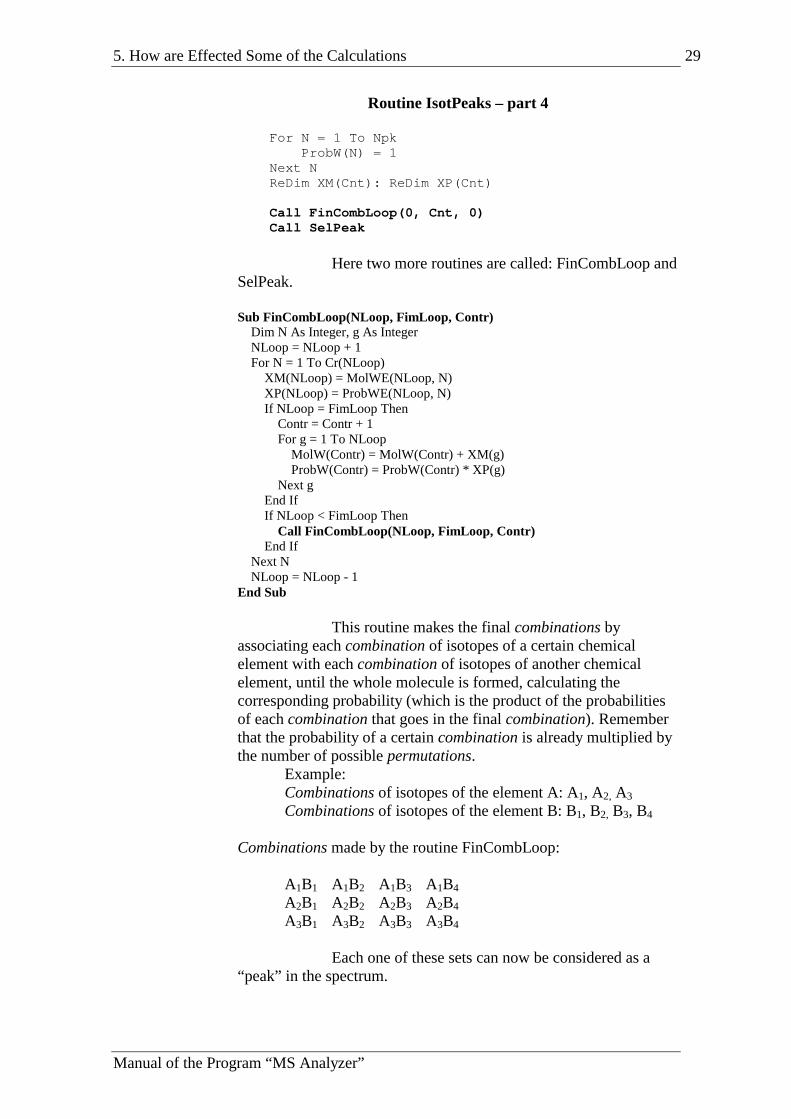
Routine IsotPeaks – part 4
For N = 1 To NpkProbW(N) = 1
Next NReDim XM(Cnt): ReDim XP(Cnt)
Call FinCombLoop(0, Cnt, 0)Call SelPeak
Here two more routines are called: FinCombLoop and SelPeak. Sub FinCombLoop(NLoop, FimLoop, Contr) Dim N As Integer, g As Integer NLoop = NLoop + 1 For N = 1 To Cr(NLoop) XM(NLoop) = MolWE(NLoop, N) XP(NLoop) = ProbWE(NLoop, N) If NLoop = FimLoop Then Contr = Contr + 1 For g = 1 To NLoop MolW(Contr) = MolW(Contr) + XM(g) ProbW(Contr) = ProbW(Contr) * XP(g) Next g End If If NLoop < FimLoop Then Call FinCombLoop(NLoop, FimLoop, Contr) End If Next N NLoop = NLoop - 1 End Sub This routine makes the final combinations by associating each combination of isotopes of a certain chemical element with each combination of isotopes of another chemical element, until the whole molecule is formed, calculating the corresponding probability (which is the product of the probabilities of each combination that goes in the final combination). Remember that the probability of a certain combination is already multiplied by the number of possible permutations. Example: Combinations of isotopes of the element A: A1, A2, A3 Combinations of isotopes of the element B: B1, B2, B3, B4 Combinations made by the routine FinCombLoop: A1B1 A1B2 A1B3 A1B4
A2B1 A2B2 A2B3 A2B4
A3B1 A3B2 A3B3 A3B4 Each one of these sets can now be considered as a “peak” in the spectrum.

5. How are Effected Some of the Calculations 30
Manual of the Program “MS Analyzer”
Sub SelPeak() Dim N As Integer, g As Integer, H As Integer Dim MPP As Double, MPN As Integer, tempM As Double Dim tempP As Double PcReq = CDbl(Form1.Text2.Text) 'Put together peaks of same mass N = 1 Do While N < Npk g = N + 1 Do While g < Npk If Abs(MolW(N) - MolW(g)) < PcReq Then ProbW(N) = ProbW(N) + ProbW(g) For H = (g + 1) To Npk MolW(H - 1) = MolW(H) ProbW(H - 1) = ProbW(H) Next H Npk = Npk - 1 g = g - 1 End If g = g + 1 Loop N = N + 1 Loop 'find main peak MPP = 0 For N = 1 To Npk If ProbW(N) > MPP Then MPP = ProbW(N) MPN = N End If Next N 'adjust intensities (main peak is 1, or 100%) For N = 1 To Npk ProbW(N) = ProbW(N) / MPP Next N 'remove peaks of too small intensity N = 1 Do While N <= Npk If ProbW(N) < 0.000005 Then For g = N + 1 To Npk MolW(g - 1) = MolW(g) ProbW(g - 1) = ProbW(g) Next g Npk = Npk - 1 N = N - 1 End If N = N + 1 Loop 'Sort peaks by Molecular Weight For N = 1 To Npk For g = N + 1 To Npk If MolW(g) < MolW(N) Then tempM = MolW(N): tempP = ProbW(N) MolW(N) = MolW(g): ProbW(N) = ProbW(g) MolW(g) = tempM: ProbW(g) = tempP End If Next g Next N End Sub Finally, the routine SelPeak makes the final adjustments by realizing the following operations:

5. How are Effected Some of the Calculations 31
Manual of the Program “MS Analyzer”
1) Puts together the peaks of the same mass (according to the precision required).
2) Finds the larger peak and adjust the “probabilities” (or “intensities”) in such a way that the main peak becomes 1 (or 100%).
3) Removes the peaks of too low intensity (<0,000005). 4) Sorts peaks according to molecular weight.
Evidently, many other operations are necessary to obtain the final performance of the program. The complete set of routines has a total of hundreds of pages. The part here exposed, however, clears the main points of the calculations, and the reader will probably find that it is enough to understand how the program works.