Embed Size (px)
Citation preview
1
Manufacturing Cost and Installed Price
Analysis of Stationary Fuel Cell Systems
30 September 2015
By:
Brian D. James
Daniel A. DeSantis
Revision 3
2
Sponsorship and Acknowledgements
This research was conducted under Subcontract Number AGB-0-40628-01 and AGB-0-40628-03 to the
National Renewable Energy Laboratory1 (NREL) under Prime Contract Number DE-AC36-08GO28308 to
the US Department of Energy.
The authors wish to thank Dr. Bryan Pivovar of NREL and Mr. Jason Marcinkoski of DOE’s Office of
Energy Efficiency and Renewable Energy (EERE), Fuel Cell Technologies Office (FCTO) for their technical
and programmatic contributions and leadership.
Authors Contact Information
Strategic Analysis Inc. may be contacted at:
Strategic Analysis Inc.
4075 Wilson Blvd, Suite 200
Arlington VA 22203
(703) 527-5410
www.sainc.com
The authors may be contacted at:
Brian D. James, [email protected] (703) 778-7114
Document Revisions
Rev 1 September 2015 Original document
Rev 2 October 2015 Minor formatting corrections
Rev 3 August 2016 Correction of installation costs as applied to all three fuel cell
technologies
1 Actual subcontract is with the Alliance for Sustainable Energy, LLC which is the management and operating
contractor for NREL.
3
Table of Abbreviations AC alternating current
ATS automatic transfer switch
BOL beginning of life
BOM bill of material
BOP balance of plant
CCB customer critical bus
CFCL Ceramic Fuel Cells Limited (of Australia)
CO carbon monoxide
CPU central processing unit
DC direct current
DFMA Design for Manufacturing and Assembly
DI de-ionizing
DOE US Department of Energy
EOL end of life
ELRB electrically resistive load bank
ePTFE expanded polytetrafluoroethylene
ESC electrical subsystem configuration
FC fuel cell
FCS fuel cell system
FP fuel processor
GDC gadolinia-doped ceria
GDL gas diffusion layer
HDPE high density polyethylene
HHV higher heating value
HT high temperature
kWe kilowatts of electricity
LB load bank
LHV lower heating value
LSCF lanthanum-strontium-cobalt-ferrite
LT low temperature
MCFC molten carbonate fuel cell
MCO manganese cobalt oxide
MEA membrane electrode assembly
MPPT Maximum Power Point Tracking
NiO nickel oxide
Ni-Co nickel cobalt
NLB No Load Bank
Nm3 normal cubic meters
NRE non-recurring engineering
4
NREL National Renewable Energy Laboratory
NSTF nanostructured thin film
PEM proton exchange membrane
ppmv parts per million (by volume)
PROX preferential oxidation
Pt/Co/Mn platinum-cobalt-manganese
PV photovoltaic
SA Strategic Analysis, Inc.
SMR steam methane reformer
SOFC solid oxide fuel cell
SR steam reforming
TB tie bar
TIG tungsten inert gas
WGS water gas shift
YSZ yttrium stabilized zirconia
5
Table of Contents 1 Executive Summary ............................................................................................................................... 9
1.1 Abstract ......................................................................................................................................... 9
1.2 Summary of System Configurations and Operating Conditions ................................................. 10
1.3 Overview of Changes to the 2012 Fuel Cell System Cost Report ................................................ 13
1.4 Summary of System Cost and Price Results ................................................................................ 13
1.4.1 System Price Comparison as a function of Manufacturing Rate ........................................ 13
1.4.2 Breakdown of price results at subsystem level .................................................................. 15
1.4.3 Cumulative global installed capacity ................................................................................... 18
1.4.4 Additional Cost Comparisons of Fuel Cell Subsystems ....................................................... 19
1.4.5 Comparison of System Installed Price between the Three FC Types .................................. 21
1.4.6 Primary Findings .................................................................................................................. 22
2 Introduction ........................................................................................................................................ 25 2.1 Project Motivation ...................................................................................................................... 25
2.2 Fuel Cell System Summary .......................................................................................................... 25
2.3 Structure of Report ..................................................................................................................... 26
3 Analysis Methodology ......................................................................................................................... 28 3.1 System Conceptual Design .......................................................................................................... 28
3.2 System Physical Design ............................................................................................................... 29
3.3 Cost Modeling ............................................................................................................................. 29
3.3.1 Core System Components ................................................................................................... 29
3.3.2 Balance of Plant Components ............................................................................................. 32
3.3.3 Cost and Price Factors Included in Analysis ........................................................................ 32
3.3.4 Iteration to Improve Analysis .............................................................................................. 33
4 System Design, Performance, and Manufacturing Details ................................................................. 34 4.1 System Overview......................................................................................................................... 34
4.1.1 Breakdown of Subsystems .................................................................................................. 34
4.1.2 Common Design and Cost Assumptions ............................................................................. 35
4.1.2.1 Power levels and Manufacturing Rates .......................................................................... 35
4.1.2.2 Gross Power vs. Net Power ............................................................................................. 35
4.1.2.3 System Efficiency ............................................................................................................ 35
4.1.2.4 Air Supply ........................................................................................................................ 36
4.1.2.5 Fuel and Water Supply .................................................................................................... 36
4.1.2.6 Desulfurization System ................................................................................................... 37
4.1.2.7 Fuel Processor ................................................................................................................. 37
4.1.2.8 Stack Degradation ........................................................................................................... 40
6
4.1.2.9 CHP Operation ................................................................................................................ 41
4.1.2.10 System Housing ........................................................................................................... 42
4.1.2.11 Grid-Dependent vs. Grid-Independent Operation ...................................................... 42
4.2 System Schematics ...................................................................................................................... 44
4.2.1 LT PEM ................................................................................................................................. 44
4.2.2 HT PEM ................................................................................................................................ 44
4.2.3 SOFC .................................................................................................................................... 44
4.3 Fuel Cell Subsystem .................................................................................................................... 46
4.3.1 Fuel Cell Stack ..................................................................................................................... 46
4.3.1.1 LT PEM Stack Parameters................................................................................................ 46
4.3.1.2 HT PEM Stack Parameters ............................................................................................... 48
4.3.1.3 SOFC Stack Parameters ................................................................................................... 49
4.3.2 Fuel Cell Balance of Plant .................................................................................................... 53
4.3.2.1 Common FC BOP Parts .................................................................................................... 53
4.3.2.2 Unique LT PEM BOP Components ................................................................................... 56
4.3.2.3 Unique HT PEM BOP Components .................................................................................. 56
4.3.2.4 Unique SOFC BOP Components ...................................................................................... 56
4.3.3 Fuel Cell Subsystem Assembly ............................................................................................ 56
4.4 Fuel Processor Subsystem ........................................................................................................... 56
4.4.1 Reactor ................................................................................................................................ 56
4.4.1.1 LT PEM ............................................................................................................................. 56
4.4.1.2 HT PEM ............................................................................................................................ 57
4.4.1.3 SOFC ................................................................................................................................ 57
4.4.2 Fuel Processor Balance of Plant .......................................................................................... 58
4.4.2.1 Common FP BOP Parts .................................................................................................... 58
4.4.3 Fuel Processing Reactor Assembly ...................................................................................... 59
5 System Performance Projections ........................................................................................................ 60 6 Fuel Cell System Electrical Configurations .......................................................................................... 61
6.1 Electrical Subsystem Framework ................................................................................................ 61
6.2 ESC for Configuration 4a with fast ramping fuel cells ................................................................. 65
6.3 ESC for Configuration 4a with slow ramping fuel cells using a resistive load bank .................... 66
6.4 Critical Power using Other Electrically Resistive Loads, Capacitors, or Batteries ....................... 68
6.5 ESC selected for cost analysis ..................................................................................................... 69
7 Manufacturer Markup Rate (to Convert FCS Cost into FCS Price) ...................................................... 70 8 Installation Cost .................................................................................................................................. 71
7
8.1 Installation Cost Analysis Methodology ...................................................................................... 71
8.2 Installation Cost Result Summary ............................................................................................... 75
9 System Cost and Price Results ............................................................................................................ 77 9.1 LT PEM Costs ............................................................................................................................... 77
9.1.1 LT PEM System Price Projections ........................................................................................ 77
9.1.2 LT PEM System Projected Price as a Function of Subsystem and Component Costs ......... 80
9.1.3 LT PEM FP Subsystem Costs ................................................................................................ 82
9.1.4 LT PEM FC Subsystem Costs ................................................................................................ 87
9.2 HT PEM Costs .............................................................................................................................. 89
9.2.1 HT PEM System Costs .......................................................................................................... 89
9.2.2 HT PEM System Projected Price as a Function of Subsystem and Component Costs ........ 90
9.2.3 HT PEM FP Subsystem Costs ............................................................................................... 93
9.2.4 HT PEM FC Subsystem Costs ............................................................................................... 98
9.3 SOFC Costs ................................................................................................................................ 100
9.3.1 SOFC System Price Projections.......................................................................................... 100
9.3.2 SOFC System Projected Price as a Function of Subsystem and Component Costs ........... 101
9.3.3 SOFC FP Subsystem Results .............................................................................................. 103
9.3.4 SOFC FC Subsystem Costs ................................................................................................. 108
10 Summary and Comparison of Installed FCS Price Projections .......................................................... 110 10.1 Summary of FCS Installed Price Projections ............................................................................. 110
10.2 Comparisons by Fuel Cell System Type ..................................................................................... 112
11 Fuel cell System Price Conclusions .................................................................................................... 115 12 Appendices of System Detailed Cost Results .................................................................................... 118
12.1 Appendix A: Stack BOM ............................................................................................................ 118
12.1.1 LT PEM Stack BOM ............................................................................................................ 118
12.1.2 HT PEM Stack BOM ........................................................................................................... 119
12.1.3 SOFC Stack BOM................................................................................................................ 120
12.2 Appendix B: FC BOP BOM ......................................................................................................... 121
12.2.1 LT PEM FC BOP BOM ......................................................................................................... 121
12.2.2 HT PEM FC BOP BOM ........................................................................................................ 122
12.2.3 SOFC FC BOP BOM ............................................................................................................ 123
12.3 Appendix C: FC Subsystem Summary ........................................................................................ 124
12.3.1 LT PEM FC Subsystem Summary ....................................................................................... 124
12.3.2 HT PEM FC Subsystem Summary ...................................................................................... 124
12.3.3 SOFC FC Subsystem Summary ........................................................................................... 125
12.4 Appendix D: Fuel Processing Reactor BOM .............................................................................. 126
12.4.1 LT PEM Reactor BOM ........................................................................................................ 126
12.4.2 HT PEM Reactor BOM ....................................................................................................... 127
12.4.3 SOFC Reactor BOM............................................................................................................ 128
8
12.5 Appendix E: FP BOP BOM .......................................................................................................... 129
12.5.1 LT PEM FP BOP BOM ......................................................................................................... 129
12.5.2 HT PEM FP BOP BOM ........................................................................................................ 131
12.5.3 SOFC FP BOP BOM ............................................................................................................ 133
12.6 Appendix F: FP Subsystem Assembly ........................................................................................ 135
12.6.1 LT PEM FP Subsystem Assembly ....................................................................................... 135
12.6.2 HT PEM FP Subsystem Assembly ...................................................................................... 135
12.6.3 SOFC FP Subsystem Assembly ........................................................................................... 135
12.7 Appendix G: Power Electronics BOM ........................................................................................ 136
12.7.1 LT PEM Power Electronics BOM ........................................................................................ 136
12.7.2 HT PEM Power Electronics BOM ....................................................................................... 137
12.7.3 SOFC Power Electronics BOM ........................................................................................... 138
12.8 Appendix H: Housing and Final System Assembly .................................................................... 140
12.8.1 LT PEM Housing and Final System Assembly .................................................................... 140
12.8.2 HT PEM Housing and Final System Assembly ................................................................... 140
12.8.3 SOFC Housing and Final System Assembly ........................................................................ 140
12.9 Appendix I: CHP ......................................................................................................................... 141
12.9.1 LT PEM CHP ....................................................................................................................... 141
12.9.2 HT PEM CHP ...................................................................................................................... 141
12.9.3 SOFC CHP........................................................................................................................... 141
12.10 Appendix J: Tabular Summary of Costs and Prices at the Subsystem Level ......................... 142
12.10.1 LT PEM Tabular Summary of Costs and Prices at the Subsystem Level ............................ 142
12.10.2 HT PEM Tabular Summary of Costs and Prices at the Subsystem Level ........................... 142
12.10.3 SOFC Tabular Summary of Costs and Prices at the Subsystem Level ............................... 142
9
1 Executive Summary
1.1 Abstract This report builds upon past Strategic Analysis Inc. (SA) reports to conceptually design and estimate the
capital and installation cost of stationary fuel cell systems (FCSs) based on three different fuel cell
technologies: low temperature (LT) proton exchange membrane (PEM), high temperature (HT) PEM, and
solid oxide fuel cell (SOFC). Each system is configured for operation in combined heat and power (CHP)
mode to allow utilization of the system exhaust heat for building heating. Each system’s fuel cell (FC)
stack, fuel processor (FP) subsystem, and balance of plant (BOP) design and performance parameters
are discussed and the methods of cost-modeling each are explained. Cost trends for each FCS and its
subsystems are evaluated in terms of the capital costs per unit in dollars per kilowatt-electric ($/kWe) as
a function of system installed capacity and system annual production rate. A Design for Manufacturing
and Assembly (DFMA) process-based cost estimating methodology is used to derive stack and reactor
cost values. Price quotations or estimates based on analogous function components are used to obtain
cost estimates for other balance of plant (BOP) components. A 10% cost contingency is added to all
systems to reflect non-enumerated costs and components. The marginal cost increase from enhancing
an electricity-only FCS (base design) to one that can serve combined heat and power (CHP) applications
and/or grid-independent conditions is assessed for each system. Finally, the cost results of all three FCS
designs are compared to assess capital cost differences. Systems are cost-modeled with peak electrical
capacities of 1 kWe, 5 kWe, 25 kWe, and 100 kWe across annual production rates of 100, 1,000, 10,000,
and 50,000 systems per year.
The report represents the synthesis of past SA analysis. The baseline body of work is an SA 2012 analysis
of the material and manufacturing cost of CHP FCS systems.2 This work established detailed bills of
materials and performance assumptions for each of the three FC technologies examined. This work was
then augmented to update details of the fuel cell designs (primarily the SOEC system). Results were
then combined with a detailed 2013 analysis of the fuel cell electrical configuration3 to identify the
hardware and likely operating conditions of CHP FCS. Next, a markup rate was added onto FCS cost to
project a price that the consumer might pay for the system. Finally, results from a 2015 report4 on
installation cost were added to the analysis. In total, the final system results contained in this report
represent projected CHP FCS final installed price i.e. cost plus manufacturer markup plus installation.
The installation cost projections in this report are based on a first of its kind DFMATM installation cost
assessment of CHP fuel cell systems.5 Installation costs account for transport, permits, siting,
2 “Manufacturing Cost Analysis of Stationary Fuel Cell Systems”, Strategic Analysis Inc., Brian D. James, Andrew B.
Spisak, Whitney G. Colella, 7 September 2012. Under Subcontract Number AGM-0-40628-01 to the National Renewable Energy Laboratory. 3 3 Colella, W. G., James, B. D., Assessing Electrical Sub-system Configurations and Installation Costs for
Stationary Fuel Cell Systems, report for the National Renewable Energy Laboratory, 9 Sept. 2013. 4 James, B.D., DeSantis, D.A., “Installation Cost Analysis of Stationary Fuel Cell Systems,” Strategic Analysis Inc.,
under sub-contract to the National Renewable Energy Laboratory, 30 September 2015. 5 James, B.D., DeSantis, D.A., “Installation Cost Analysis of Stationary Fuel Cell Systems,” Strategic Analysis Inc.,
under sub-contract to the National Renewable Energy Laboratory, 30 September 2015.
10
electrical/plumbing/gas-line hookup, installer profit & contingency, and test of the FCS into its final
destination. Given the myriad electrical, plumbing, and hardware options available, a focus is placed on
SOFC installations linked with a hot water heating system for CHP benefits. While primarily SOFC-based,
the installation approach, issues, and results are broadly applicable to the other types of fuel cell
systems considered (LT PEM and HT PEM). Installation costs are projected for an average of new home
construction and retrofits.
A manufacturing markup is applied to convert FCS “cost” into “price”. Manufacturer’s markup
specifically accounts for the manufacturer’s expenses relating to profit, general & administrative (G&A),
research & development (R&D), warranty, advertising, and other corporate expenses. A constant
markup of 50% is applied at all production rates.
The report is composed of 12 sections:
Section 1: Executive Summary
Section 2: Introduction
Section 3: Analysis Methodology
Section 4: System Design, Performance, and Manufacturing Details
Section 5: Summary of System Performance Projections
Section 6: Fuel Cell System Electrical Configuration
Section 7: Manufacturer Markup Rate
Section 8: Installation Cost
Section 9: System Cost and Price Results
Section 10: Summary and Comparison of System Price Projections
Section 11: Fuel Cell System Price Conclusions
Section 12: Appendices A-J containing detailed tabular cost and price results
1.2 Summary of System Configurations and Operating Conditions The cost analysis considers stationary fuel cell power systems suitable for electricity generation for
residential or office building power. The systems are configured for combined heat and power (CHP)
operation: waste heat from the fuel cell system is available for building heat.
The fuel cell systems (FCS) are examined:
For three fuel cell technologies (low temperature PEM, high temperature PEM, and solid oxide),
at four power levels (1, 5, 25, and 100kWe),
and at four annual manufacturing rates (100, 1,000, 10,000, and 50,000 systems per year).
Although the FCSs vary significantly in technology and system power, they share many of the same
configuration characteristics.
11
These characteristics include:
Operation
o operation on natural gas and air
o design for water-neutral operation using a condenser to capture liquid product
water for use in the system
o produce 110VAC electricity
o provide waste heat to a building CHP load
o able to be connected to the external electrical grid that can load follow demands
Fuel Processing (FP) Subsystem
o converts NG into a hydrogen-rich reformate gas which is fed to the FC stacks
o based on Tokyo Gas designs of a highly thermally-integrated concentric-shell reactor
which combines the functionality of fuel preheat, raising steam, and steam
reforming in one piece of hardware
o metal monolith catalyst bed for steam reforming (SR), water-gas shift (WGS) (if
needed), and preferential oxidation (PROX) (if needed)
o catalysts applied to monoliths via washcoating
o catalyst beds sized by assumed space velocities
Fuel Cell Subsystem
o operation on NG reformate and air
o operation at approximately 1.4 atm inlet pressure
Power Electronics Subsystem (baseline case)
o contains the system controls, inverters, and sensors for full system operation
o relies on the grid for system start-up
o does not contain batteries
CHP Subsystem
o uses waste heat from the fuel cell stack and fuel processing sub-system exhaust to
heat building water or air
o includes heat exchangers for this purpose
Housing and Final System Assembly
o includes a FCS housing suitable for outdoor installation
o does not include any cost allowance for system installation in the field
Cost Margin
o includes a 10% cost contingency to cover the cost of un-enumerated components
System Lifetime
o although system lifetime and cost are related, we treat them as independent
variables to allow a cost assessment among FC technologies at different maturity
levels.
o consequently, all systems are oversized by 20% to correspond to future mature FC
technologies that only decay 20% in power density over their useful lifetime.
12
Additionally, technology specific characteristics include:
Low Temperature (LT) Polymer Electrolyte Membrane (PEM) Fuel Cell
o planar metallic cell construction
o stamped stainless steel bipolar plates with an anti-corrosion coating
o based on a Nafion®-based supported membrane achieving 408 milliwatts per
square centimeter (mW/cm2)at 0.676 volts/cell at 80 degrees Celsius (°C) at 0.4
milligrams (mg) platinum (Pt) catalyst/cm2 at beginning of life
High Temperature (HT) PEM Fuel Cell
o planar metallic cell construction
o stamped stainless steel bipolar plates with an anti-corrosion coating
o based on a pyridine-based aromatic polyether membrane achieving 240 mW/cm2
at 0.6 volts/cell at 160°C at 1.0mgPt/cm2 at beginning of life
Solid Oxide Fuel Cell (SOFC)
o electrolyte supported planar ceramic cell construction based on the NexTech
Materials Inc.6 Flexcell design
o tape cast ceramic layers
o nickel –cobalt (Ni-Co) catalyst, lanthanum-strontium-cobalt-ferrite (LSCF)
cathode, and yttrium stabilized zirconia (YSZ) electrolyte
o achieving 291 mW/cm2 at 0.8 volts/cell at 819°C at beginning of life
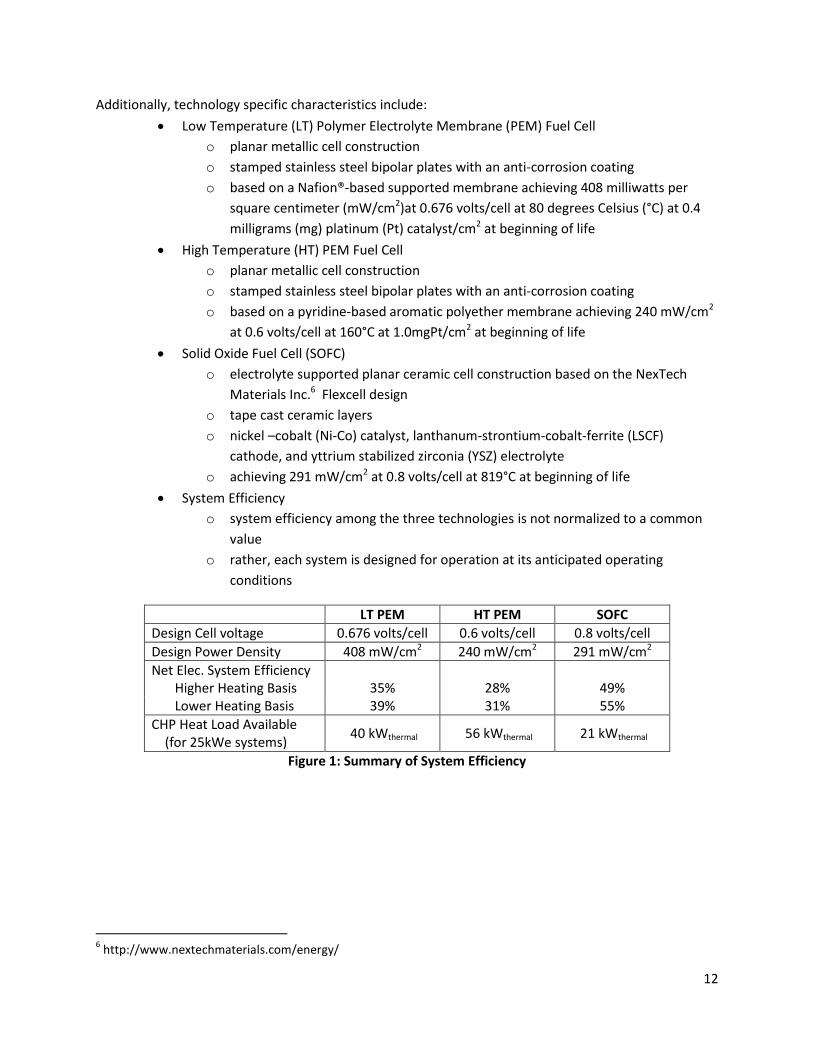
System Efficiency
o system efficiency among the three technologies is not normalized to a common
value
o rather, each system is designed for operation at its anticipated operating
conditions
LT PEM HT PEM SOFC
Design Cell voltage 0.676 volts/cell 0.6 volts/cell 0.8 volts/cell
Design Power Density 408 mW/cm2 240 mW/cm2 291 mW/cm2
Net Elec. System Efficiency Higher Heating Basis
35%
28%
49%
Lower Heating Basis 39% 31% 55%
CHP Heat Load Available (for 25kWe systems)
40 kWthermal 56 kWthermal 21 kWthermal
Figure 1: Summary of System Efficiency
6 http://www.nextechmaterials.com/energy/
13
1.3 Overview of Changes to the 2012 Fuel Cell System Cost Report The following list summarizes changes made to the SA 2012 report7 to both update the analysis and
translate cost into FCS installed price.
A series of SOFC system changes to improve accuracy of the previous cost estimates
o Incorporation of updated material price quotes discounts for purchased quantity
o Addition of current collector material cost (which was previously erroneously
omitted)
o Update to the anode wash coating process
o Update to the amount of ceramics recycled
o Addition of a GDC barrier layer (to prevent contamination of the electrolyte layer)
(previously omitted)
o Change of the high temperature sintering from a batch furnace operation to a
tunnel kiln operation
o Addition of an electrical meter to the baseline configuration
For all three FC technologies (LT PEM, HT PEM, SOFC)
o Update of the AC/DC inverter prices to align with grid-tied PV inverter costs
Addition of a description of the FCS electrical configuration (Section 0)
Incorporation of FCS installation costs based on a Design for Manufacturing and Assembly
(DFMA) analysis (based on SOFC but applicable to all three FC technologies) (Section 0)
Projection of FCS installed price (Sections 9 and 10)
o Application of a 50% markup factor to translate the cost of the fuel cell system into
a price projection
o Addition of installation cost to the FCS price to project the price of the complete
installed FCS
1.4 Summary of System Cost and Price Results
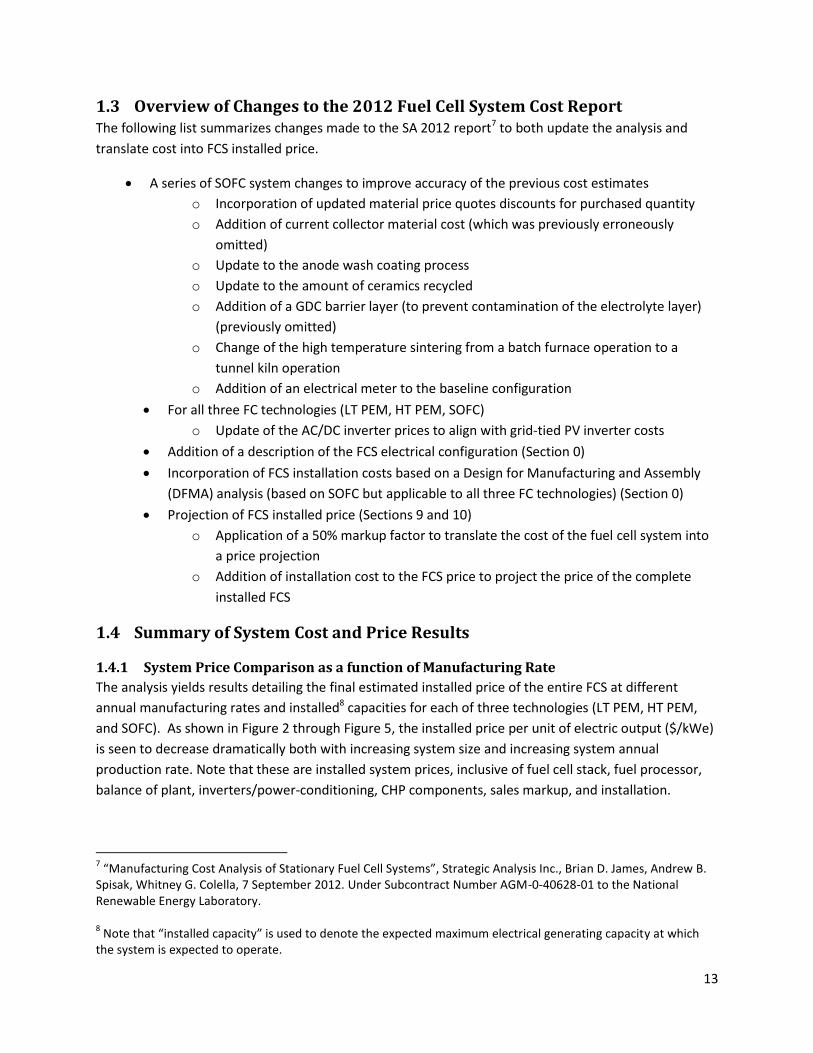
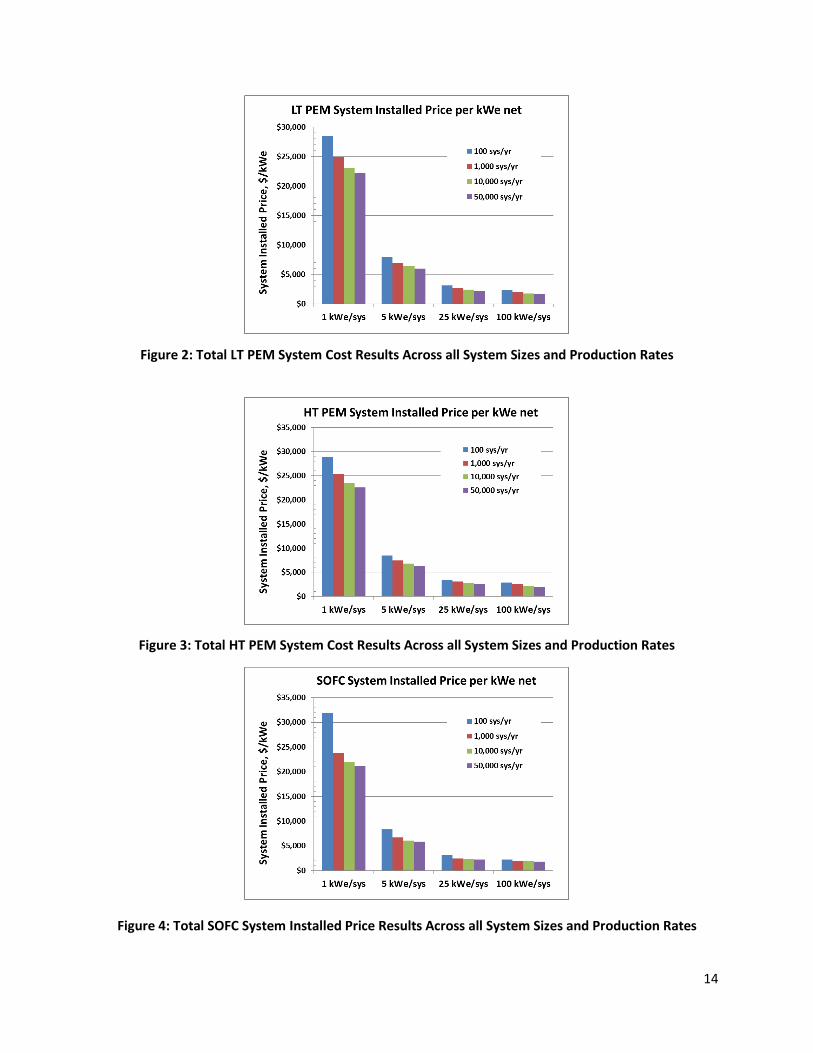
1.4.1 System Price Comparison as a function of Manufacturing Rate
The analysis yields results detailing the final estimated installed price of the entire FCS at different
annual manufacturing rates and installed8 capacities for each of three technologies (LT PEM, HT PEM,
and SOFC). As shown in Figure 2 through Figure 5, the installed price per unit of electric output ($/kWe)
is seen to decrease dramatically both with increasing system size and increasing system annual
production rate. Note that these are installed system prices, inclusive of fuel cell stack, fuel processor,
balance of plant, inverters/power-conditioning, CHP components, sales markup, and installation.
7 “Manufacturing Cost Analysis of Stationary Fuel Cell Systems”, Strategic Analysis Inc., Brian D. James, Andrew B.
Spisak, Whitney G. Colella, 7 September 2012. Under Subcontract Number AGM-0-40628-01 to the National Renewable Energy Laboratory. 8 Note that “installed capacity” is used to denote the expected maximum electrical generating capacity at which
the system is expected to operate.
14
Figure 2: Total LT PEM System Cost Results Across all System Sizes and Production Rates
Figure 3: Total HT PEM System Cost Results Across all System Sizes and Production Rates
Figure 4: Total SOFC System Installed Price Results Across all System Sizes and Production Rates
15
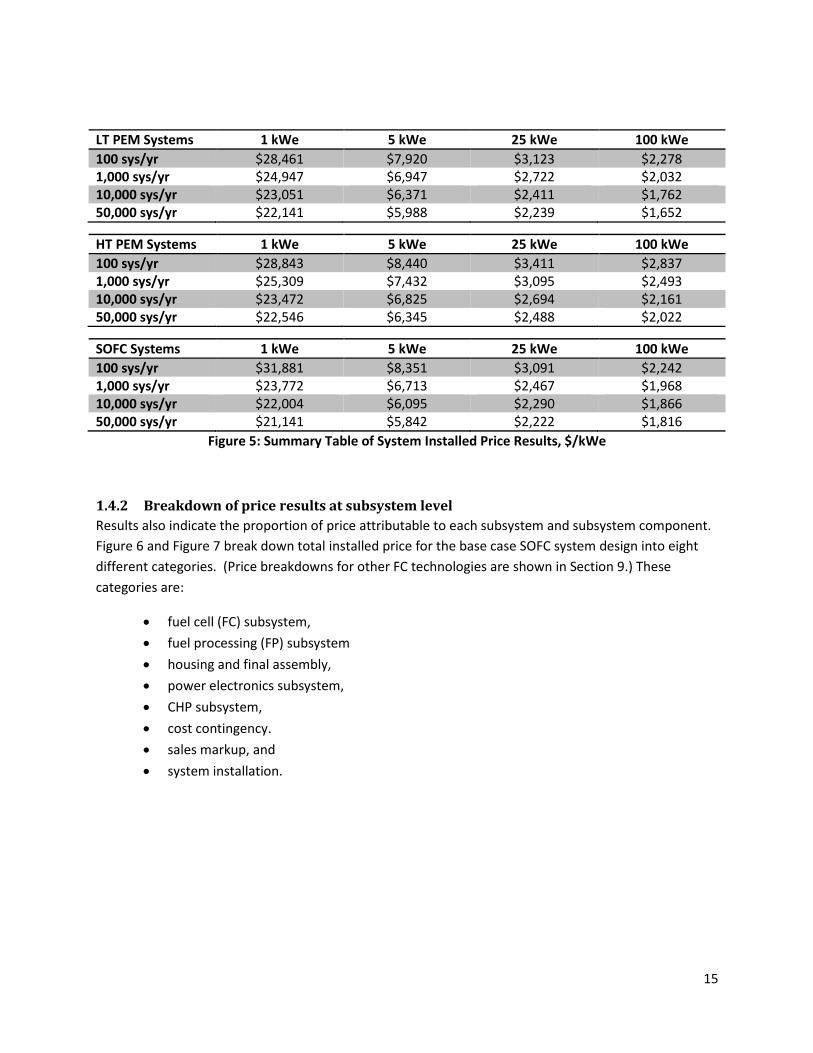
LT PEM Systems 1 kWe 5 kWe 25 kWe 100 kWe
100 sys/yr $28,461 $7,920 $3,123 $2,278 1,000 sys/yr $24,947 $6,947 $2,722 $2,032 10,000 sys/yr $23,051 $6,371 $2,411 $1,762 50,000 sys/yr $22,141 $5,988 $2,239 $1,652
HT PEM Systems 1 kWe 5 kWe 25 kWe 100 kWe
100 sys/yr $28,843 $8,440 $3,411 $2,837 1,000 sys/yr $25,309 $7,432 $3,095 $2,493 10,000 sys/yr $23,472 $6,825 $2,694 $2,161 50,000 sys/yr $22,546 $6,345 $2,488 $2,022
SOFC Systems 1 kWe 5 kWe 25 kWe 100 kWe
100 sys/yr $31,881 $8,351 $3,091 $2,242 1,000 sys/yr $23,772 $6,713 $2,467 $1,968 10,000 sys/yr $22,004 $6,095 $2,290 $1,866 50,000 sys/yr $21,141 $5,842 $2,222 $1,816
Figure 5: Summary Table of System Installed Price Results, $/kWe
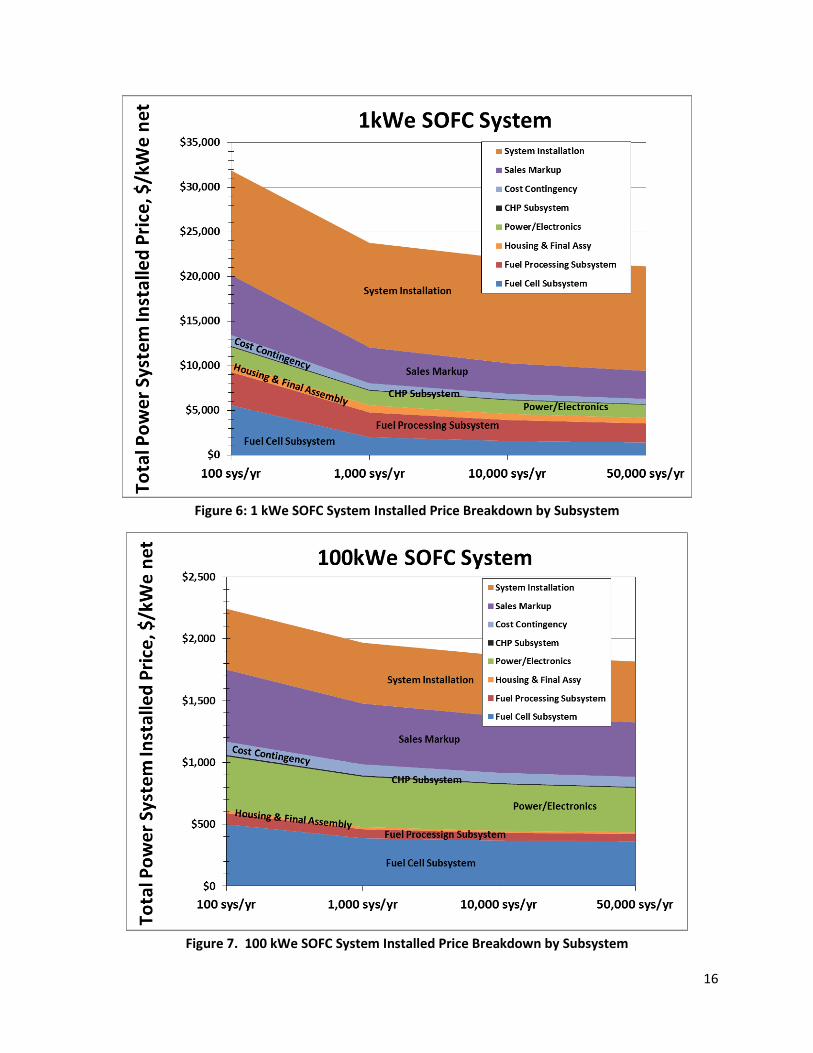
1.4.2 Breakdown of price results at subsystem level
Results also indicate the proportion of price attributable to each subsystem and subsystem component.
Figure 6 and Figure 7 break down total installed price for the base case SOFC system design into eight
different categories. (Price breakdowns for other FC technologies are shown in Section 9.) These
categories are:
fuel cell (FC) subsystem,
fuel processing (FP) subsystem
housing and final assembly,
power electronics subsystem,
CHP subsystem,
cost contingency.
sales markup, and
system installation.
16
Figure 6: 1 kWe SOFC System Installed Price Breakdown by Subsystem
Figure 7. 100 kWe SOFC System Installed Price Breakdown by Subsystem
17
As evident from the figures, installation cost and the sales mark are major contributors to system price.
Indeed, installation cost accounts for approximately half of the sales price at the 1kW system power
level, but drop to ~25% at 100kW due to installation economies of scale Sales margin is assumed to be
50% of the FCS cost (not including installation) and thus will always be a significant contributor. Power
electronics is a major cost contributor primarily due to the high cost of DC/AC inverter. The CHP
subsystem is small contributor primarily due to the definition of the category: only one heat exchanger
to capture exhaust waste heat. Housing and final system assembly is a modest contributor at both
power levels.
While the fuel cell and fuel processor subsystems can rightly be termed the core of the system, together
they only make up a third or less of total system price. At the 1kW power level, the fuel processor is
observed to be more costly than the fuel cell due to the poor manner in which the fuel processor scales
with power level. At 100kW, the fuel cell subsystem is the dominant cost contributor of the two. These
trends are similarly seen within the other FCS technologies and within the intermediate system power
levels examined (5kW and 25kW).
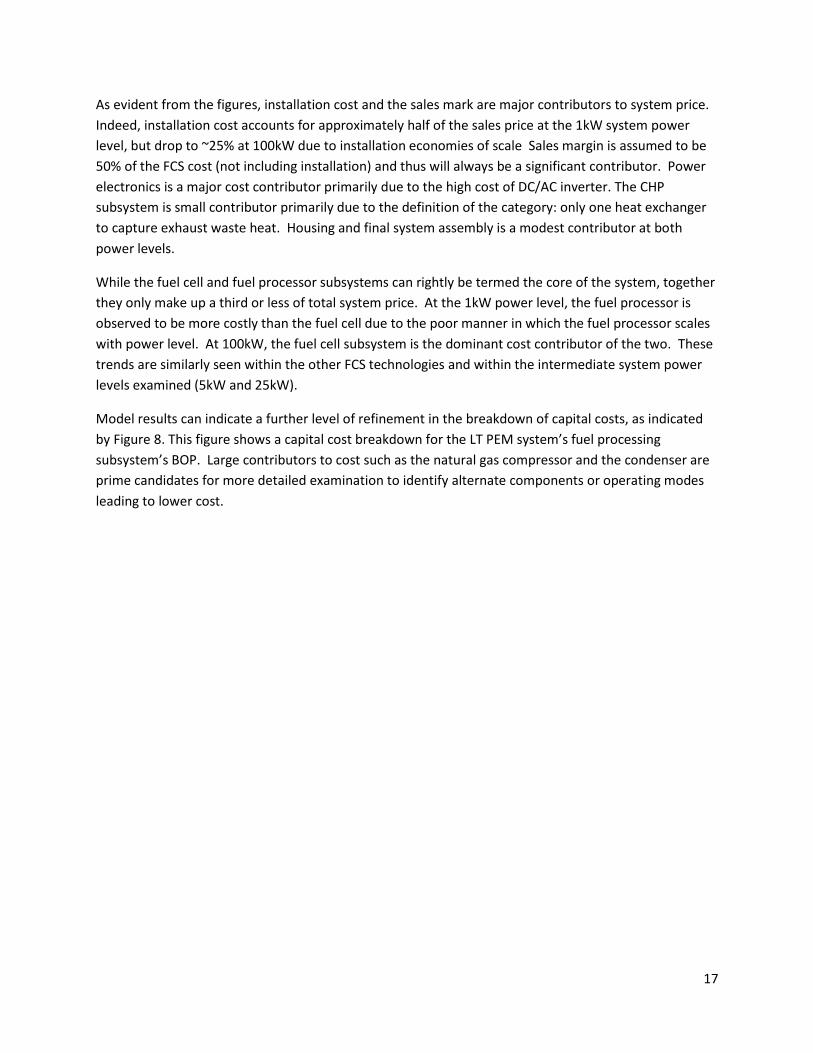
Model results can indicate a further level of refinement in the breakdown of capital costs, as indicated
by Figure 8. This figure shows a capital cost breakdown for the LT PEM system’s fuel processing
subsystem’s BOP. Large contributors to cost such as the natural gas compressor and the condenser are
prime candidates for more detailed examination to identify alternate components or operating modes
leading to lower cost.
18
Figure 8: 1 kWe LT System Fuel Processor Subsystem BOP Cost Breakdown
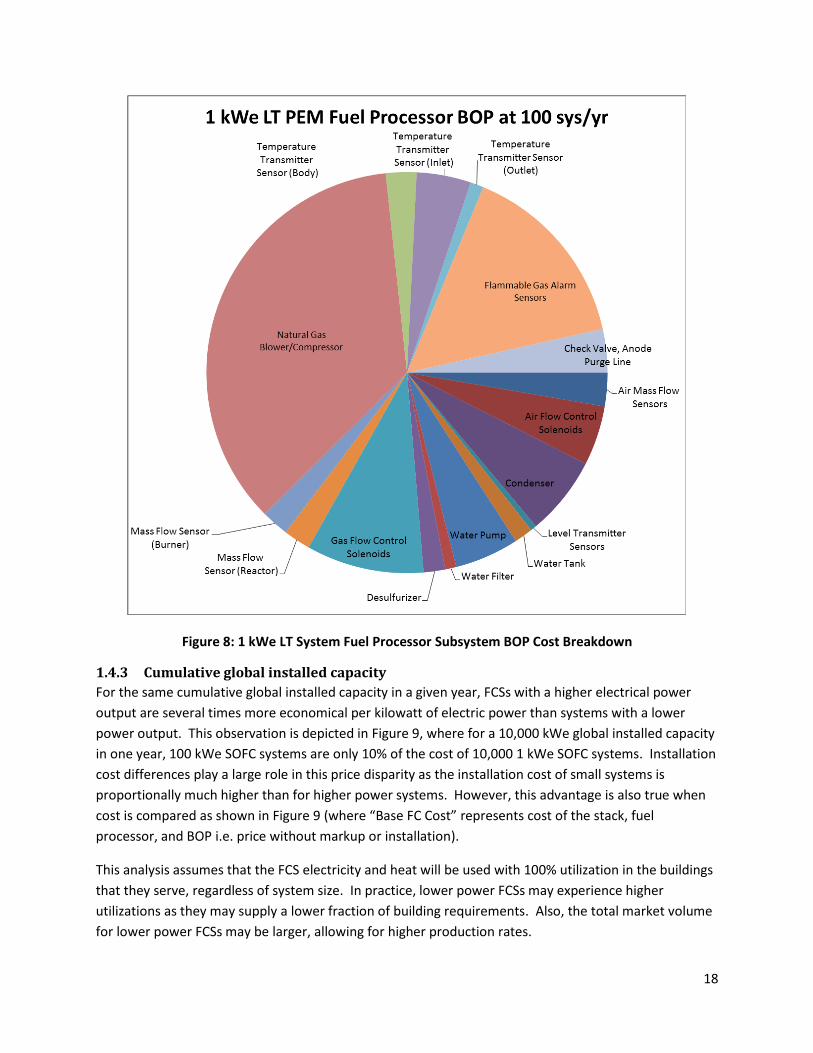
1.4.3 Cumulative global installed capacity
For the same cumulative global installed capacity in a given year, FCSs with a higher electrical power
output are several times more economical per kilowatt of electric power than systems with a lower
power output. This observation is depicted in Figure 9, where for a 10,000 kWe global installed capacity
in one year, 100 kWe SOFC systems are only 10% of the cost of 10,000 1 kWe SOFC systems. Installation
cost differences play a large role in this price disparity as the installation cost of small systems is
proportionally much higher than for higher power systems. However, this advantage is also true when
cost is compared as shown in Figure 9 (where “Base FC Cost” represents cost of the stack, fuel
processor, and BOP i.e. price without markup or installation).
This analysis assumes that the FCS electricity and heat will be used with 100% utilization in the buildings
that they serve, regardless of system size. In practice, lower power FCSs may experience higher
utilizations as they may supply a lower fraction of building requirements. Also, the total market volume
for lower power FCSs may be larger, allowing for higher production rates.
19
Figure 9: Price comparison of 1 kWe and 100 kWe SOFC systems for the same cumulative global installed9 capacity
1.4.4 Additional Cost Comparisons of Fuel Cell Subsystems
Additional results include the comparison of fuel cell stack cost to fuel cell subsystem balance of plant at
different system sizes. Figure 10 indicates that for a 1 kWe SOFC system, at the highest production rates
evaluated (50,000 units/year), the FC BOP is the largest contributor to fuel cell subsystem capital costs.
At this FC size and production rate, FC BOP costs are higher than FC stack costs. By contrast, for higher
power FCSs, FC stack costs dominate FC subsystem costs. As shown in Figure 11, in the larger 100 kWe
SOFC systems, the FC stack costs are the largest contributor to the fuel cell subsystem capital costs.
The cost of the FC stack (before markup) is noteworthy. At 1kW system power level, stack cost is
~$4000/kW at low production but drops to ~$450/kW at high production. For the much larger 100kW
system power level, stack cost is ~$400/kW at all production rates considered. Thus a pathway to
relatively low cost stacks is already evident and made possible by the volume production of repeat cells
within a stack. While further price declines are possible, the already low projected cost of these stacks
(at high manufacturing volume) suggests that future cost reduction focus should be on non-stack system
components.
9 Note that “installed capacity” is used to denote the expected maximum electrical generating capacity at which
the system is expected to operate.

20
Figure 10: SOFC fuel cell stack subsystem cost breakdown for a 1 kWe system
Figure 11: SOFC fuel cell stack subsystem cost breakdown for a 100 kWe system
21
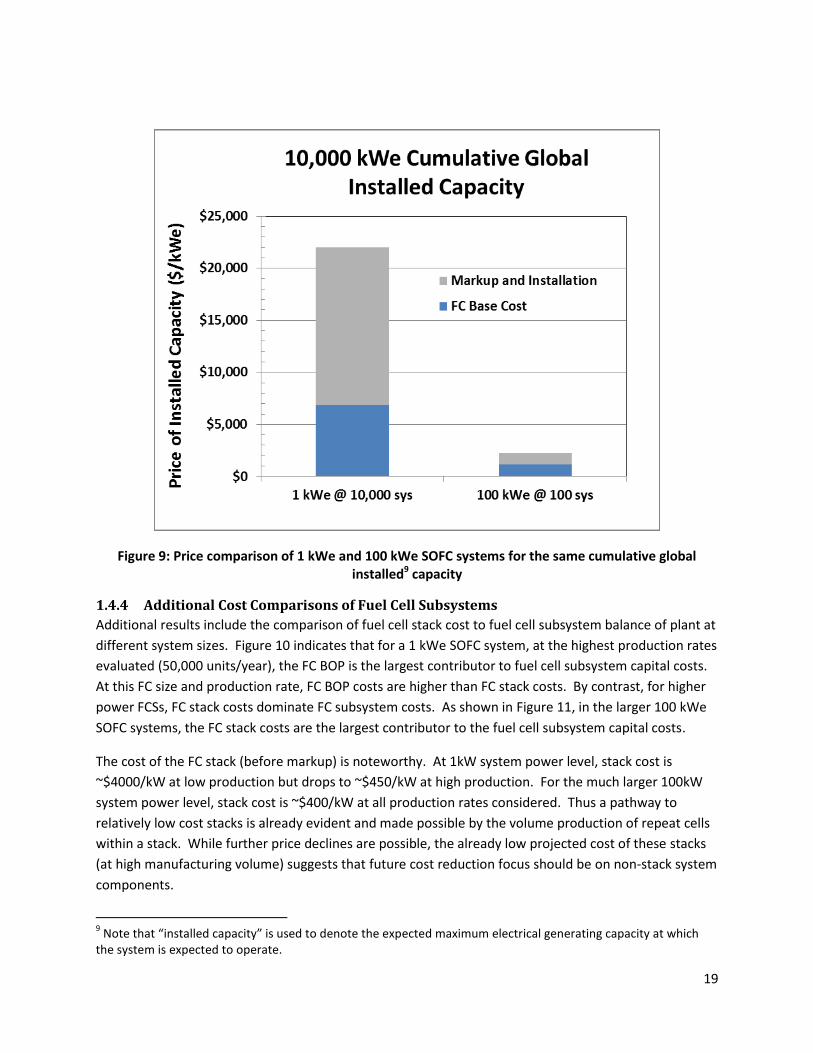
1.4.5 Comparison of System Installed Price between the Three FC Types
As shown in Figure 12, system installed prices tend to be very similar at the 1kW power level but start to
diverge as power level increases. HT PEM systems tend to have the highest system projected prices. LT
PEM and SOFC systems are projected to have very similar costs, with SOFC slightly edging out LT PEM
except at 100kW. Stack power densities assumed in these analyses are 291 mW/cm2, 408 mW/cm2, and
240 mW/cm2, respectively for LT PEM, HT PEM, and SOFC. The relatively low power density of HT PEM
and (relatively) high fuel processor cost are the primary reasons HT PEM is projected to be the most
costly. SOFC likewise has a (comparatively) low power density, but the SOFC system has intrinsically low
materials cost and a simplified fuel processing system (due to high temperature operation and internal
reforming). Overall, there are not dramatically different projected installed prices between the three
technologies.
Figure 12: Cost Comparison between Technologies for all Systems
It is further noted that the cost comparisons between fuel cell technologies in this analysis apply only to
initial capital cost rather than CO2 emissions or life cycle cost. The projected net system electrical
efficiency based on higher heating value (HHV) of natural gas of the SOFC FCS (49%) is substantially
higher than that of LT PEM (35%) or HT PEM (28%). While a life-cycle analysis has not been conducted,
it is expected that the higher net electrical efficiency of the SOFC system would make those systems
even more attractive on a total life cycle cost basis.
22
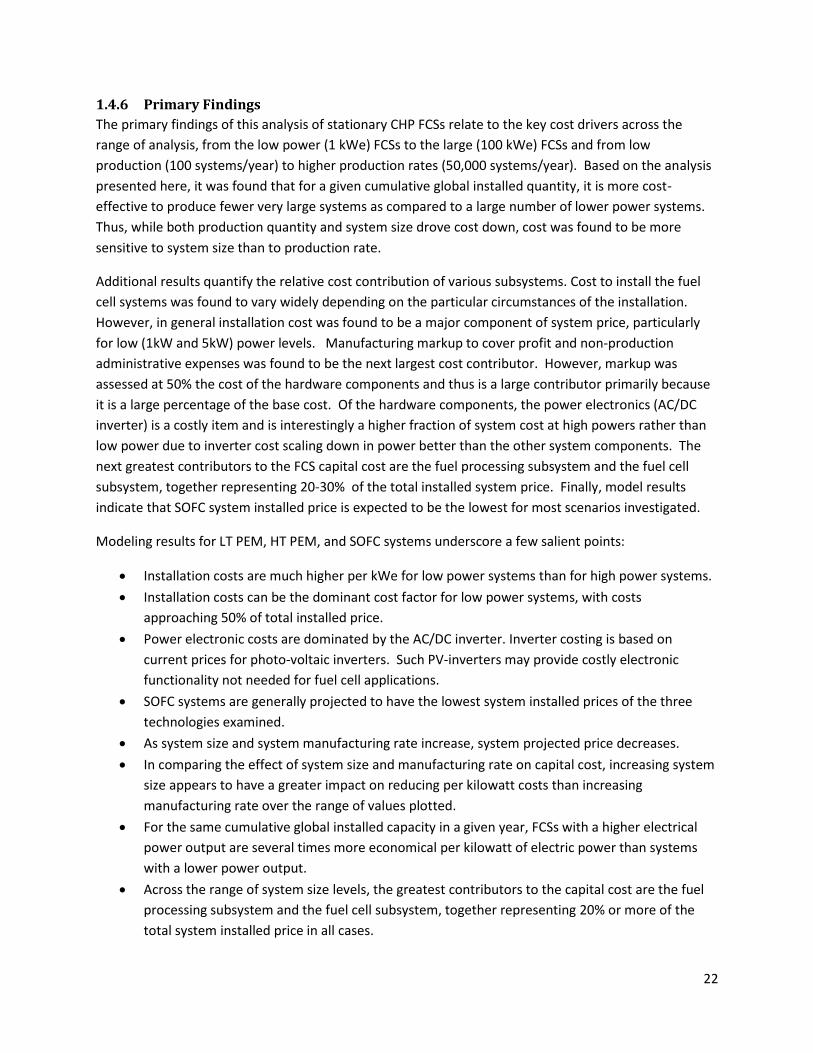
1.4.6 Primary Findings
The primary findings of this analysis of stationary CHP FCSs relate to the key cost drivers across the
range of analysis, from the low power (1 kWe) FCSs to the large (100 kWe) FCSs and from low
production (100 systems/year) to higher production rates (50,000 systems/year). Based on the analysis
presented here, it was found that for a given cumulative global installed quantity, it is more cost-
effective to produce fewer very large systems as compared to a large number of lower power systems.
Thus, while both production quantity and system size drove cost down, cost was found to be more
sensitive to system size than to production rate.
Additional results quantify the relative cost contribution of various subsystems. Cost to install the fuel
cell systems was found to vary widely depending on the particular circumstances of the installation.
However, in general installation cost was found to be a major component of system price, particularly
for low (1kW and 5kW) power levels. Manufacturing markup to cover profit and non-production
administrative expenses was found to be the next largest cost contributor. However, markup was
assessed at 50% the cost of the hardware components and thus is a large contributor primarily because
it is a large percentage of the base cost. Of the hardware components, the power electronics (AC/DC
inverter) is a costly item and is interestingly a higher fraction of system cost at high powers rather than
low power due to inverter cost scaling down in power better than the other system components. The
next greatest contributors to the FCS capital cost are the fuel processing subsystem and the fuel cell
subsystem, together representing 20-30% of the total installed system price. Finally, model results
indicate that SOFC system installed price is expected to be the lowest for most scenarios investigated.
Modeling results for LT PEM, HT PEM, and SOFC systems underscore a few salient points:
Installation costs are much higher per kWe for low power systems than for high power systems.
Installation costs can be the dominant cost factor for low power systems, with costs
approaching 50% of total installed price.
Power electronic costs are dominated by the AC/DC inverter. Inverter costing is based on
current prices for photo-voltaic inverters. Such PV-inverters may provide costly electronic
functionality not needed for fuel cell applications.
SOFC systems are generally projected to have the lowest system installed prices of the three
technologies examined.
As system size and system manufacturing rate increase, system projected price decreases.
In comparing the effect of system size and manufacturing rate on capital cost, increasing system
size appears to have a greater impact on reducing per kilowatt costs than increasing
manufacturing rate over the range of values plotted.
For the same cumulative global installed capacity in a given year, FCSs with a higher electrical
power output are several times more economical per kilowatt of electric power than systems
with a lower power output.
Across the range of system size levels, the greatest contributors to the capital cost are the fuel
processing subsystem and the fuel cell subsystem, together representing 20% or more of the
total system installed price in all cases.
23
The primary cost drivers for the FP BOP vary more with system size than with manufacturing
rate.
The primary cost drivers for the FP BOP may include NG compressors/blowers, water pumps,
flammable gas alarm sensors, gas flow control solenoids, pressure regulators, and/or
condensers, depending on fuel cell system size and type.
Modeling results for LT PEM CHP systems emphasize several key points:
Modeling results for FCS capital costs are broadly consistent with manufacturer price values
provided by Japan’s Ene Farm program for similar system sizes and production rates: $30,000-
$43,000 at thousands per year production rate versus a projected price of ~$25,000 at 1,000
systems per year (both for 1kWe systems). Non-recurring engineering (NRE) and warranty
expenses may shift the projections considerably. For the 1 kWe system, the FP subsystem is
relatively more costly than the FC subsystem at all production levels.
For the 100 kWe system, the FC subsystem is more expensive than the FP subsystem at lower
production levels, specifically at 1,000 sys/yr and below.
For the 1 kWe system, the FP’s costs are dominated by the BOP. This modeling result is
consistent with the manufacturer test results of Japan’s Ene Farm program, which found that a
primary cost driver for CHP LT PEM systems was the FP sub-system balance of plant (BOP).
At higher power levels, the FP BOP component costs decline significantly as a proportion of the
total.
For 1 kWe FCSs, the primary cost drivers for the FP BOP are the natural gas compressor, the
flammable gas alarm sensors, and the gas flow control solenoids, in that order.
For 100 kWe FCSs, the primary cost drivers for the FP BOP are the water pump and the
condenser, in that order.
For 1 kWe FCSs, BOP component costs constitute as much as 70% of FC subsystem costs.
For 100 kWe FCSs, FC stack costs constitute as much as 80% of FC subsystem costs.
At both the 1 kWe and 100 kWe size range, fuel cell subsystem assembly costs are estimated to
be fairly negligible.
Modeling results for HT PEM CHP systems emphasize additional important points:
Modeling results for HT PEM FCS capital costs are broadly consistent with manufacturer values
provided via a 2012 DOE deployment program of 5kWe HTPEM systems. Data for 15 deployed
5kWe systems suggest a price of ~$16,000/kW compared to a projected price of ~$8,000/kWe at
100 sys/year. This factor of two underestimation of installed price may be an artifact of
different annual manufacturing rates, comparison with a non-commercial product early in its
development stage, or lack of inclusion of non-recurring engineering expenses. Further
investigation is needed to reconcile cost estimates with manufacturer price.
The lower power density of the HTPEM stack results in a large mass and volume of FC stack
needed, compared with the LTPEM. At the same time, the HT and LT PEM system designs are
very similar, and costs tend to scale with mass and/or volume. As a result, HT PEM stack costs
are higher and contribute to a larger percentage of total system costs.
24
At the 1 kWe size, BOP costs dominate FP subsystem costs. At the 100 kWe size, fuel processor
costs dominate FP subsystem costs.
For 1 kWe FCSs, the primary cost drivers for the FP BOP are the natural gas compressor, the
flammable gas alarm sensors, and the gas flow control solenoids, in that order.
For 100 kWe FCSs, the primary cost drivers for the FP BOP are the water pump and the
condenser, in that order.
At low power (1 kWe), the FP subsystem cost is dominated by the FP BOP components.
At high power (100 kWe), the FC stack cost dominates the total system cost.
At 1 kWe, FC BOP component costs constitute 60% or more of FC subsystem costs.
Modeling results for SOFC CHP systems underscore some additional key points:
Modeling results for SOFC capital costs show very good agreement with manufacturer values
provided by Ceramic Fuel Cells Limited (CFCL) of Australia. The CFCL combined capital and
installation cost is roughly $27,000/kWe10, 11 for 1kWe systems produced in ~100 units (possibly
over several years). For comparison, modeling projections indicate a cost of roughly
$32,000/kWe at the 100 sys/yr production rate. This is close agreement considering the many
company specific factors which go into setting a price.
For the 1 kWe system, model results indicate that the FP subsystem is relatively more costly
than the FC subsystem at production levels of 1,000 sys/yr and above. By contrast, for the 100
kWe system, the FC subsystem contributes about 65% to total cost.
For the 1 kWe and 100 kWe systems, the fuel processing subsystem costs are dominated by the
FP BOP.
At low power (1kWe), at production rates above 1,000 sys/yr, the FP subsystem cost is
dominated by the BOP components.
At 100 kWe, FC stack costs constitute over 90% of FC subsystem costs.
10
Colella, W.G. and Pilli, S.P., 2012, “Energy System and Thermoeconomic Analysis of Combined Heat and Power (CHP) High Temperature Proton Exchange Membrane (HTPEM) Fuel Cell Systems (FCSs) for Light Commercial Buildings,” ASME Journal of Fuel Cell Science and Technology, (in print). PNNL-SA-86986. Fig. 11. 11
Colella, W.G. and Pilli, S.P., 2012, “Independent Evaluation of Micro-Cogenerative Fuel Cell Systems For Commercial Buildings,” Proceedings of the ASME 2012 10th Fuel Cell Science, Engineering and Technology Conference, July 23-26, 2012, San Diego, CA, USA. ESFuelCell2012-91479. PNNL-SA-84709. Fig. 11.
25
2 Introduction
2.1 Project Motivation Stationary applications for FCSs are an active and growing area of FC product development. Numerous
companies already have preliminary products on the market for a variety of sizes and applications12 and
research continues into the full range of uses for stationary systems.13 To better assess the potential
usefulness and market-worthiness of the stationary FCS concept, this work describes a “Design for
Manufacturing and Assembly” (DFMA)14-style analysis of the cost to manufacture a series of stationary
FCSs. Because there is a broad range of applications and fuel cell technologies under the “stationary”
umbrella, it is useful to examine the relative cost impact of systems based on several fuel cell
technologies at different installed capacities, as well as applications such as CHP and grid-independent
operation. Finally, the impact of annual production rate on the cost of all systems is examined to assess
the difference between a nascent and a mature product manufacturing base.
2.2 Fuel Cell System Summary The stationary FCSs modeled in this report include four major functional subsystems. The first is the fuel
processor (FP) subsystem which includes a steam reforming reactor external to the fuel cell stack that
converts natural gas (NG) into a hydrogen-rich reformate gas for the fuel cells. This subsystem draws
heavily on an interpretation of a Ballard Power Systems integrated steam reformer concept reactor
based on patents by Tokyo Gas. The reactor has a highly thermally-integrated concentric shell design
which combines the functionality of fuel preheating, raising steam, and steam reforming. These shells
contain metal monolith catalyst beds for steam reforming, water-gas shift (WGS), and preferential
oxidation (PROX) reactions but are adapted for the specific needs of each fuel cell technology. (For
more details on the breakdown of the FCSs into various subsystems, see Section 4.1.1. For more details
on FP subsystem design for each system technology, see Sections 4.1.2.7 and 4.4.)
After the FP subsystem processes the NG fuel into reformate, the reformate is fed into the FC stack. The
stack performance parameters are highly dependent on the stack technology (Low Temperature (LT)
Polymer Electrolyte Membrane (PEM), High Temperature (HT) PEM, or Solid Oxide Fuel Cell (SOFC)), but
all stacks are sized appropriately to yield the desired system net peak electrical capacity (1 kWe, 5kWe,
25 kWe, or 100 kWe) given the stack’s power density, efficiency, and parasitic electrical loads. Stack
anode and cathode exhaust gas is then fed back into the FP subsystem via a burner assembly, which
combusts unreacted fuel to provide heat for the steam reforming reaction. Finally, the burner exhaust
gas is fed through a series of heat exchangers, first to extract a combined heat and power (CHP) load
and then to condense out product water for feeding back into the reactor inlet.
12
See e.g. UTC Power PureCell http://www.utcpower.com/products/purecell400, FuelCell Energy http://www.fuelcellenergy.com/products.php, and Bloom Energy http://www.bloomenergy.com/fuel-cell/energy-server/. 13 Colella, W.G., Network Design Optimization of Fuel Cell Systems and Distributed Energy Devices, Sandia Report,
Sandia National Laboratories, Albuquerque, New Mexico 87185, SAND2010-5071, July 2010. 14
Boothroyd, G., P. Dewhurst, and W. Knight. “Product Design for Manufacture and Assembly, Second Edition,” 2002.
26
The LT PEM stacks consist of coated and stamped stainless steel bipolar plates, a Nafion® membrane on
an expanded polytetrafluoroethylene (ePTFE) support, and 3M Inc. nanostructured thin film (NSTF)
platinum-cobalt-manganese (Pt/Co/Mn) catalyst based on automotive design. For the HT PEM stacks, a
pyridine-based aromatic polyether membrane is used in place of the Nafion®. An NSTF catalyst layer is
also assumed used but with a higher Pt loading. Other design details remain unchanged. The SOFC
stack is an electrolyte supported planar thin film cast ceramic with nickel –cobalt (Ni-Co) catalyst,
lanthanum-strontium-cobalt-ferrite (LSCF) cathode, and yttrium stabilized zirconia (YSZ) electrolyte. The
overall stack construction is based on a design by NexTech Materials, Inc. For more details on FC stack
subsystem design for each system technology, see Section 4.3.
The third major subsystem is the thermal management subsystem for CHP operation and includes the
additional heat exchangers required to provide CHP heat to the building space heating and service water
loads. This subsystem is counted separately to assess the cost impact of configuring a system for CHP
operation versus a system that does not supply CHP. The CHP subsystem is configured differently for
different system sizes and is discussed in Section 4.1.2.9.
The final major functional subsystem is the Power Electronics subsystem. This subsystem includes all of
the equipment and parts required to convert the stack direct current (DC) power into alternating current
(AC), regulate the AC power supplied by the system, and provide power to peripherals. The baseline
system is configured for grid-dependent operation, but a grid-independent case is also examined to
assess the cost impact of grid-independent operation. The grid-independent system configuration
includes batteries for start-up and transient management. For more information on the Power
Electronics subsystem, see Section 4.1.2.11.
2.3 Structure of Report Cost modeling results are limited in their utility without a clear description of the system being modeled,
the assumptions underlying the model itself, and the methodology used to reach the conclusions. Thus,
this report gives detailed explanations and definitions of the analyzed systems.
The report is composed of 12 sections:
Section 1: Executive Summary
Section 2: Introduction
Section 3: Analysis Methodology
Section 4: System Design, Performance, and Manufacturing Details
Section 5: Summary of System Performance Projections
Section 6: Fuel Cell System Electrical Configuration
Section 7: Manufacturer Markup Rate
Section 8: Installation Cost
Section 9: System Cost and Price Results
Section 10: Summary and Comparison of System Price Projections
Section 11: Fuel Cell System Price Conclusions
Section 12: Appendices A-J containing detailed tabular cost and price results

27
Because there is a great amount of detail to be specified relating to the fuel cell systems, descriptions of
the systems are presented in several tiers. First, the general costing methodology is explained, from
system conceptual design to cost modeling of all components. Then an overview is given describing the
features, subsystems, and design elements which are common to all three FCS technologies. Once the
commonalities are described, this report then provides a description of the unique aspects of each FCS
on a subsystem-by-subsystem basis. After system description is complete, cost results are given for
each FCS, again at the subsystem level.
28
3 Analysis Methodology The cost model relies upon a DFMA-style methodology to determine the cost to manufacture several
stationary system designs at varied rates of production. The methodology consists of three major steps:
(1) System Conceptual Design,
(2) System Physical Design, and
(3) Cost Modeling.
3.1 System Conceptual Design The main purpose of the system conceptual design phase is to develop a valid thermodynamic model of
a physical system. In this phase, design requirements are identified and performance parameters are
determined. Design requirements include considerations such as system technology (LT PEM, HT PEM,
or SOFC), system peak rated net electrical output (1, 5, 25, and 100 kWe for each technology), whether
to allow for CHP operation or grid-independent operation, input fuel composition, water neutrality, and
so forth (see Section 4.1.2 for more discussion of system design requirements). Once these design
requirements are identified, a conceptual system can be laid out which satisfies the requirements.
For each system technology, detailed designs are developed for the four main FCS subsystems: the FC
subsystem, the FP subsystem, the electrical management subsystem, and the CHP subsystem (for more
detail on the terminology of the breakdown into various subsystems, see Section 4.1.1). The entire FCS
is modeled within Aspen HYSYSTM chemical engineering process plant modeling software to determine
performance parameters such as net system electrical efficiency, flow rates, temperatures, and
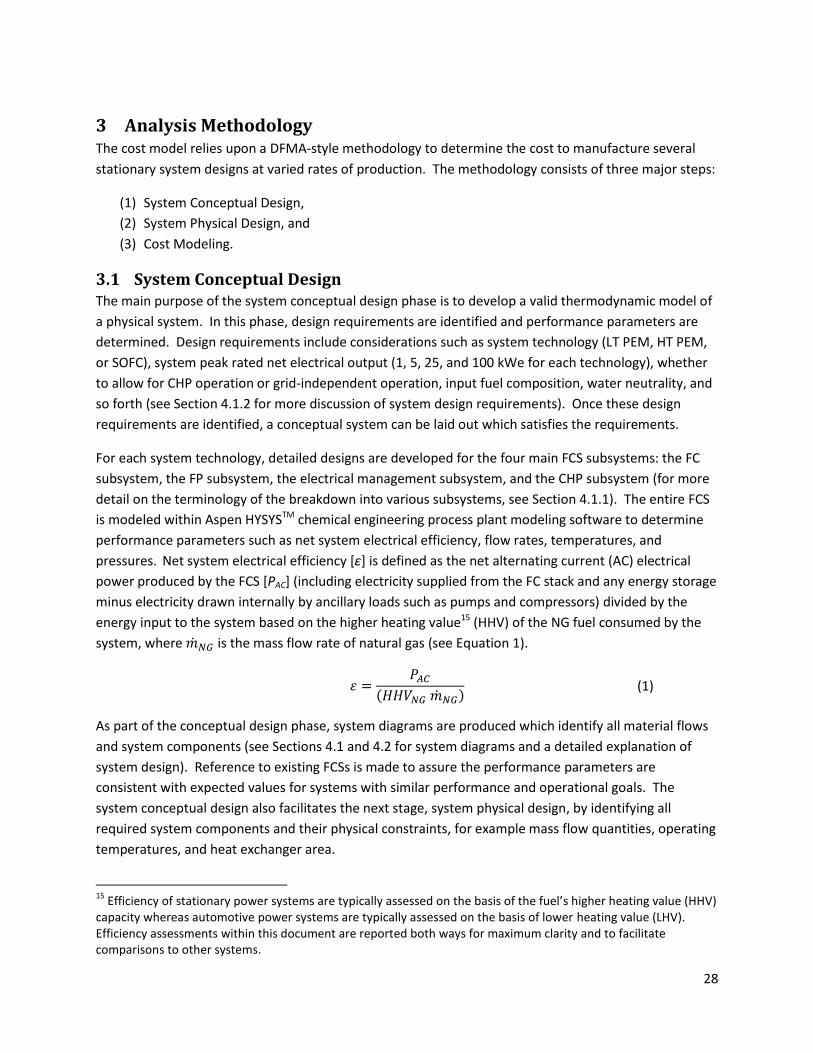
pressures. Net system electrical efficiency [ε] is defined as the net alternating current (AC) electrical
power produced by the FCS [PAC] (including electricity supplied from the FC stack and any energy storage
minus electricity drawn internally by ancillary loads such as pumps and compressors) divided by the
energy input to the system based on the higher heating value15 (HHV) of the NG fuel consumed by the
system, where �̇�𝑁𝐺 is the mass flow rate of natural gas (see Equation 1).
𝜀 =
𝑃𝐴𝐶
(𝐻𝐻𝑉𝑁𝐺 �̇�𝑁𝐺) (1)
As part of the conceptual design phase, system diagrams are produced which identify all material flows
and system components (see Sections 4.1 and 4.2 for system diagrams and a detailed explanation of
system design). Reference to existing FCSs is made to assure the performance parameters are
consistent with expected values for systems with similar performance and operational goals. The
system conceptual design also facilitates the next stage, system physical design, by identifying all
required system components and their physical constraints, for example mass flow quantities, operating
temperatures, and heat exchanger area.
15
Efficiency of stationary power systems are typically assessed on the basis of the fuel’s higher heating value (HHV) capacity whereas automotive power systems are typically assessed on the basis of lower heating value (LHV). Efficiency assessments within this document are reported both ways for maximum clarity and to facilitate comparisons to other systems.
29
3.2 System Physical Design A main purpose of the system physical design phase is to develop detailed bills of materials (BOMs) for
all major system and subsystem components. With the system conceptual design in hand, it becomes
possible to define the system physical design. For standardized components such as compressors,
blowers, sensors, heat exchangers, piping, etc. (common in the BOP), it is sufficient to use the required
performance parameters to obtain an appropriate quote for each piece of equipment. For integral
components for which a full DFMA-style analysis will be performed, the system physical design step
involves determining the full physical embodiment of the system, including materials, geometry, and
manufacturing methods. Design for this step is supplemented by assistance from industry partners and
previous design work. For example, the fuel processor subsystem design is based upon an integrated
reactor designed by Tokyo Gas. For the LT and HT PEM FCSs, fuel cell subsystem designs are based upon
prior work on automotive PEM subsystems, adapted for the new requirements identified in the previous
step. The physical design for the SOFC stack was based upon the FlexCell SOFC system by NexTech
Materials Inc.
3.3 Cost Modeling Once the physical embodiment has been determined, costs can be modeled. There are two levels of
detail in cost modeling. The first and more detailed level corresponds to the core system components,
while the second and less-detailed level corresponds to standardized components common in the
system BOP.
3.3.1 Core System Components
DFMA is a costing methodology developed by Boothroyd-Dewhurst, Inc. and used by hundreds of
companies worldwide. For this project, the standard DFMA techniques were blended with detailed
knowledge of industry standards and best practices, application of new materials, technology, or
manufacturing ideas, and Strategic Analysis, Inc.’s own cost modeling software, innovative ideas, and
practical common sense. For the core system components, the estimated cost [CEst] is the sum of
materials cost [CMat], manufacturing cost [CMan], tooling cost [CTool], and assembly cost [CAssy] (see
Equation 2).
𝐶𝐸𝑠𝑡 = 𝐶𝑀𝑎𝑡 + 𝐶𝑀𝑎𝑛 + 𝐶𝑇𝑜𝑜𝑙 + 𝐶𝐴𝑠𝑠𝑦 (2)
To determine materials cost [CMat], the system physical design is used to determine the amount of
required raw materials to manufacture each individual part. The material, geometry, and manufacturing
method are identified for every component. From this information, it is possible to take into account
material wastage because of flash, scrap, or defects.
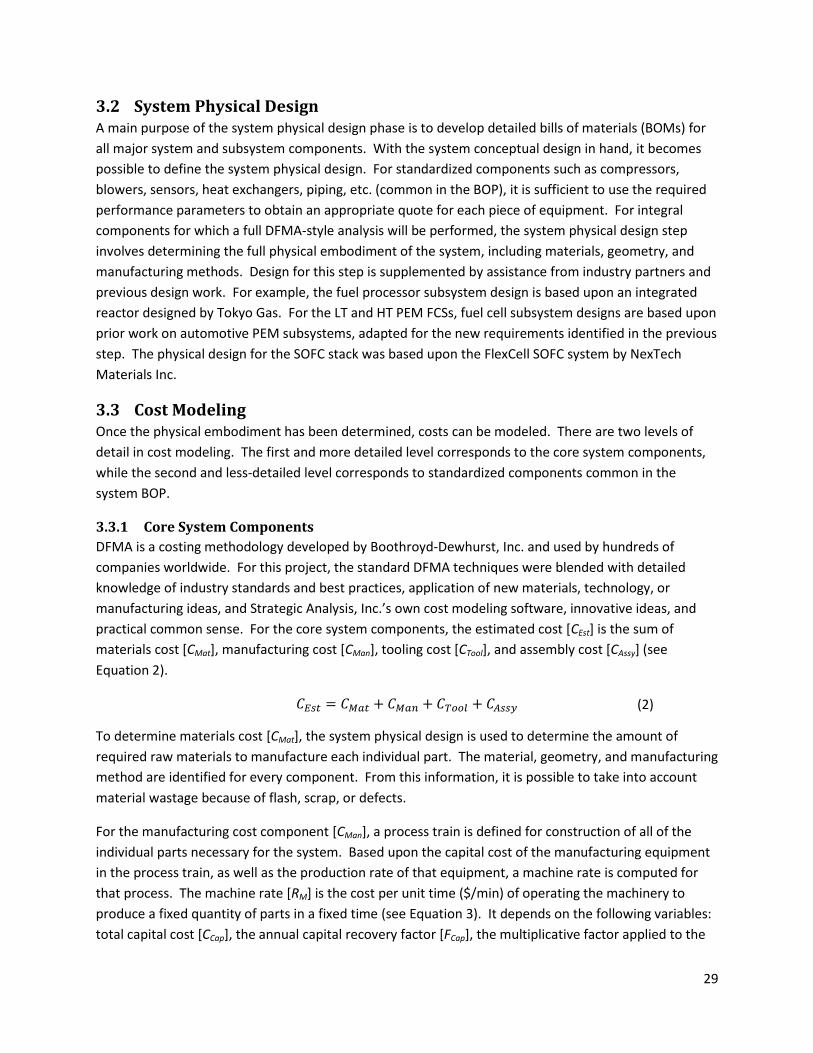
For the manufacturing cost component [CMan], a process train is defined for construction of all of the
individual parts necessary for the system. Based upon the capital cost of the manufacturing equipment
in the process train, as well as the production rate of that equipment, a machine rate is computed for
that process. The machine rate [RM] is the cost per unit time ($/min) of operating the machinery to
produce a fixed quantity of parts in a fixed time (see Equation 3). It depends on the following variables:
total capital cost [CCap], the annual capital recovery factor [FCap], the multiplicative factor applied to the
30
total capital cost to account for installation and delivery of the machinery onto the factory floor [FInst],
the annual maintenance cost factor as a fraction of capital cost [FMaint], annual miscellaneous expense
factor as a fraction of capital cost [FMisc], the total annual runtime [TR], the total annual setup time [TS],
the electrical utility energy cost [CP], the process power usage [P], fully loaded labor cost [CL], and the
number of simultaneous laborers required for the process train [L]. The values assumed for these
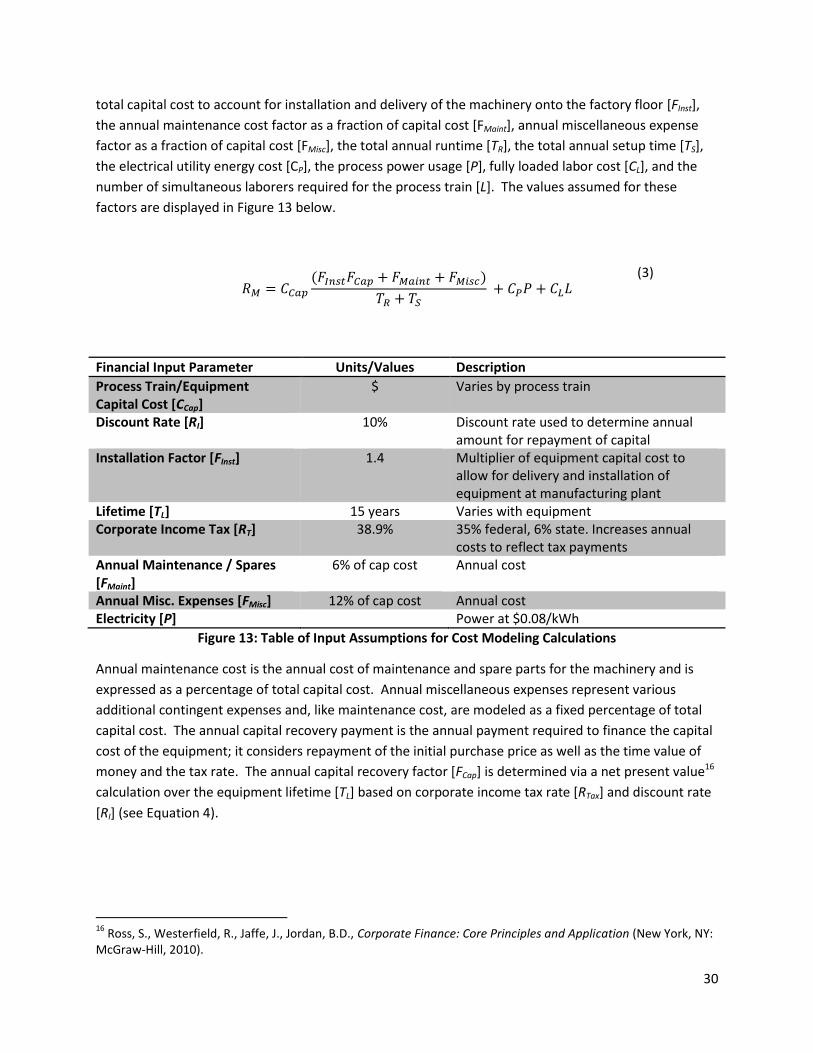
factors are displayed in Figure 13 below.
𝑅𝑀 = 𝐶𝐶𝑎𝑝
(𝐹𝐼𝑛𝑠𝑡𝐹𝐶𝑎𝑝 + 𝐹𝑀𝑎𝑖𝑛𝑡 + 𝐹𝑀𝑖𝑠𝑐)
𝑇𝑅 + 𝑇𝑆 + 𝐶𝑃𝑃 + 𝐶𝐿𝐿
(3)
Financial Input Parameter Units/Values Description
Process Train/Equipment Capital Cost [CCap]
$ Varies by process train
Discount Rate [RI] 10% Discount rate used to determine annual amount for repayment of capital
Installation Factor [FInst] 1.4 Multiplier of equipment capital cost to allow for delivery and installation of equipment at manufacturing plant
Lifetime [TL] 15 years Varies with equipment Corporate Income Tax [RT] 38.9% 35% federal, 6% state. Increases annual
costs to reflect tax payments Annual Maintenance / Spares [FMaint]
6% of cap cost Annual cost
Annual Misc. Expenses [FMisc] 12% of cap cost Annual cost Electricity [P] Power at $0.08/kWh
Figure 13: Table of Input Assumptions for Cost Modeling Calculations
Annual maintenance cost is the annual cost of maintenance and spare parts for the machinery and is
expressed as a percentage of total capital cost. Annual miscellaneous expenses represent various
additional contingent expenses and, like maintenance cost, are modeled as a fixed percentage of total
capital cost. The annual capital recovery payment is the annual payment required to finance the capital
cost of the equipment; it considers repayment of the initial purchase price as well as the time value of
money and the tax rate. The annual capital recovery factor [FCap] is determined via a net present value16
calculation over the equipment lifetime [TL] based on corporate income tax rate [RTax] and discount rate
[RI] (see Equation 4).
16
Ross, S., Westerfield, R., Jaffe, J., Jordan, B.D., Corporate Finance: Core Principles and Application (New York, NY: McGraw-Hill, 2010).
31
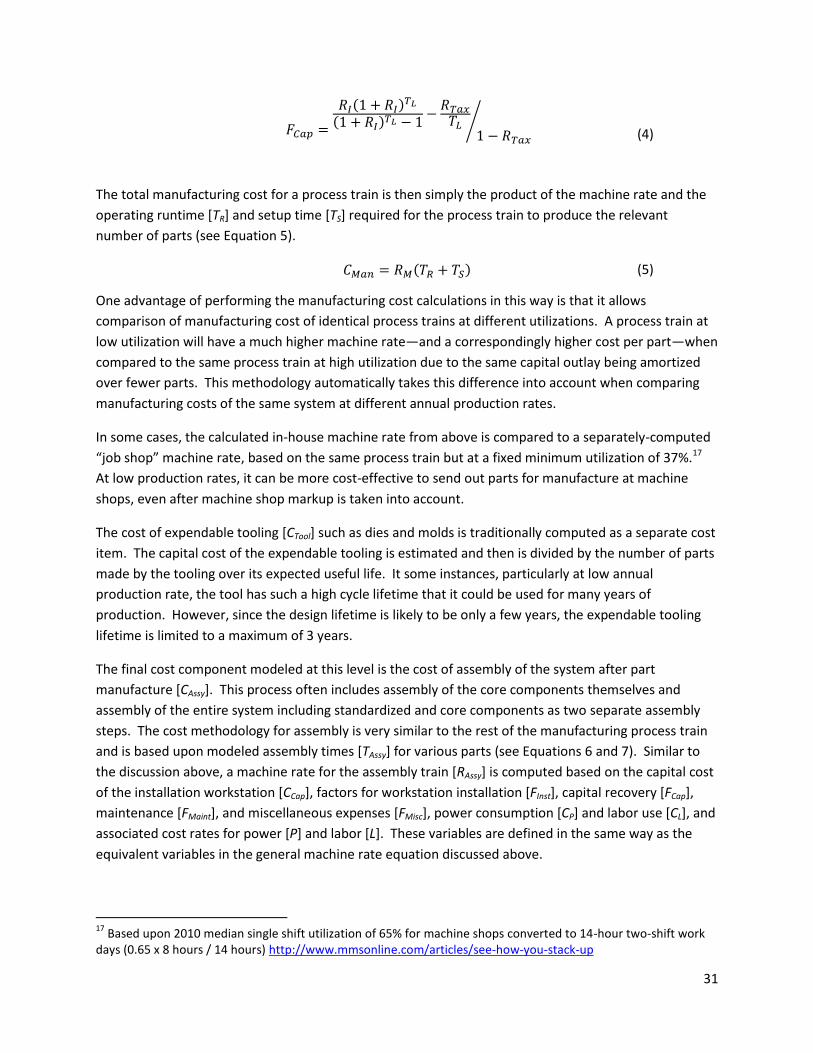
𝐹𝐶𝑎𝑝 =
𝑅𝐼(1 + 𝑅𝐼)𝑇𝐿
(1 + 𝑅𝐼)𝑇𝐿 − 1−
𝑅𝑇𝑎𝑥𝑇𝐿
1 − 𝑅𝑇𝑎𝑥
⁄ (4)
The total manufacturing cost for a process train is then simply the product of the machine rate and the
operating runtime [TR] and setup time [TS] required for the process train to produce the relevant
number of parts (see Equation 5).
𝐶𝑀𝑎𝑛 = 𝑅𝑀(𝑇𝑅 + 𝑇𝑆) (5)
One advantage of performing the manufacturing cost calculations in this way is that it allows
comparison of manufacturing cost of identical process trains at different utilizations. A process train at
low utilization will have a much higher machine rate—and a correspondingly higher cost per part—when
compared to the same process train at high utilization due to the same capital outlay being amortized
over fewer parts. This methodology automatically takes this difference into account when comparing
manufacturing costs of the same system at different annual production rates.
In some cases, the calculated in-house machine rate from above is compared to a separately-computed
“job shop” machine rate, based on the same process train but at a fixed minimum utilization of 37%.17
At low production rates, it can be more cost-effective to send out parts for manufacture at machine
shops, even after machine shop markup is taken into account.
The cost of expendable tooling [CTool] such as dies and molds is traditionally computed as a separate cost
item. The capital cost of the expendable tooling is estimated and then is divided by the number of parts
made by the tooling over its expected useful life. It some instances, particularly at low annual
production rate, the tool has such a high cycle lifetime that it could be used for many years of
production. However, since the design lifetime is likely to be only a few years, the expendable tooling
lifetime is limited to a maximum of 3 years.
The final cost component modeled at this level is the cost of assembly of the system after part
manufacture [CAssy]. This process often includes assembly of the core components themselves and
assembly of the entire system including standardized and core components as two separate assembly
steps. The cost methodology for assembly is very similar to the rest of the manufacturing process train
and is based upon modeled assembly times [TAssy] for various parts (see Equations 6 and 7). Similar to
the discussion above, a machine rate for the assembly train [RAssy] is computed based on the capital cost
of the installation workstation [CCap], factors for workstation installation [FInst], capital recovery [FCap],
maintenance [FMaint], and miscellaneous expenses [FMisc], power consumption [CP] and labor use [CL], and
associated cost rates for power [P] and labor [L]. These variables are defined in the same way as the
equivalent variables in the general machine rate equation discussed above.
17
Based upon 2010 median single shift utilization of 65% for machine shops converted to 14-hour two-shift work days (0.65 x 8 hours / 14 hours) http://www.mmsonline.com/articles/see-how-you-stack-up
32
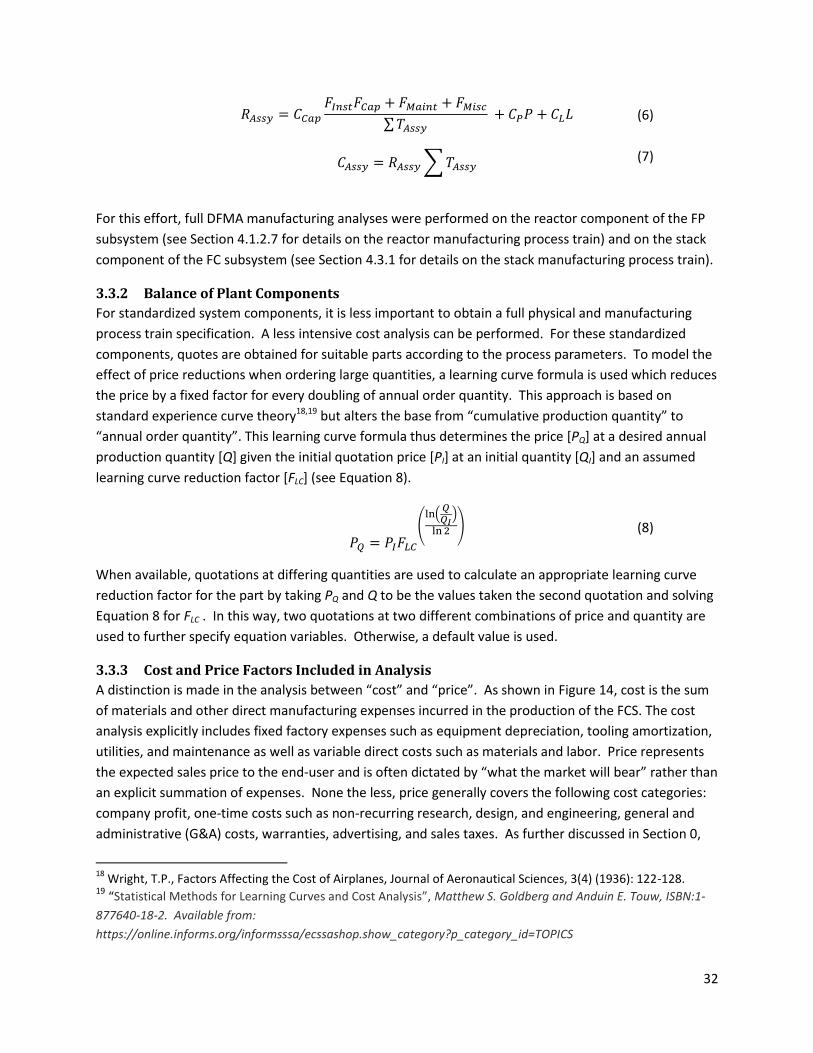
𝑅𝐴𝑠𝑠𝑦 = 𝐶𝐶𝑎𝑝
𝐹𝐼𝑛𝑠𝑡𝐹𝐶𝑎𝑝 + 𝐹𝑀𝑎𝑖𝑛𝑡 + 𝐹𝑀𝑖𝑠𝑐
∑ 𝑇𝐴𝑠𝑠𝑦 + 𝐶𝑃𝑃 + 𝐶𝐿𝐿 (6)
𝐶𝐴𝑠𝑠𝑦 = 𝑅𝐴𝑠𝑠𝑦 ∑ 𝑇𝐴𝑠𝑠𝑦 (7)
For this effort, full DFMA manufacturing analyses were performed on the reactor component of the FP
subsystem (see Section 4.1.2.7 for details on the reactor manufacturing process train) and on the stack
component of the FC subsystem (see Section 4.3.1 for details on the stack manufacturing process train).
3.3.2 Balance of Plant Components
For standardized system components, it is less important to obtain a full physical and manufacturing
process train specification. A less intensive cost analysis can be performed. For these standardized
components, quotes are obtained for suitable parts according to the process parameters. To model the
effect of price reductions when ordering large quantities, a learning curve formula is used which reduces
the price by a fixed factor for every doubling of annual order quantity. This approach is based on
standard experience curve theory18,19 but alters the base from “cumulative production quantity” to
“annual order quantity”. This learning curve formula thus determines the price [PQ] at a desired annual
production quantity [Q] given the initial quotation price [PI] at an initial quantity [QI] and an assumed
learning curve reduction factor [FLC] (see Equation 8).
𝑃𝑄 = 𝑃𝐼𝐹𝐿𝐶
(ln(
𝑄𝑄𝐼
)
ln 2 )
(8)
When available, quotations at differing quantities are used to calculate an appropriate learning curve
reduction factor for the part by taking PQ and Q to be the values taken the second quotation and solving
Equation 8 for FLC . In this way, two quotations at two different combinations of price and quantity are
used to further specify equation variables. Otherwise, a default value is used.
3.3.3 Cost and Price Factors Included in Analysis
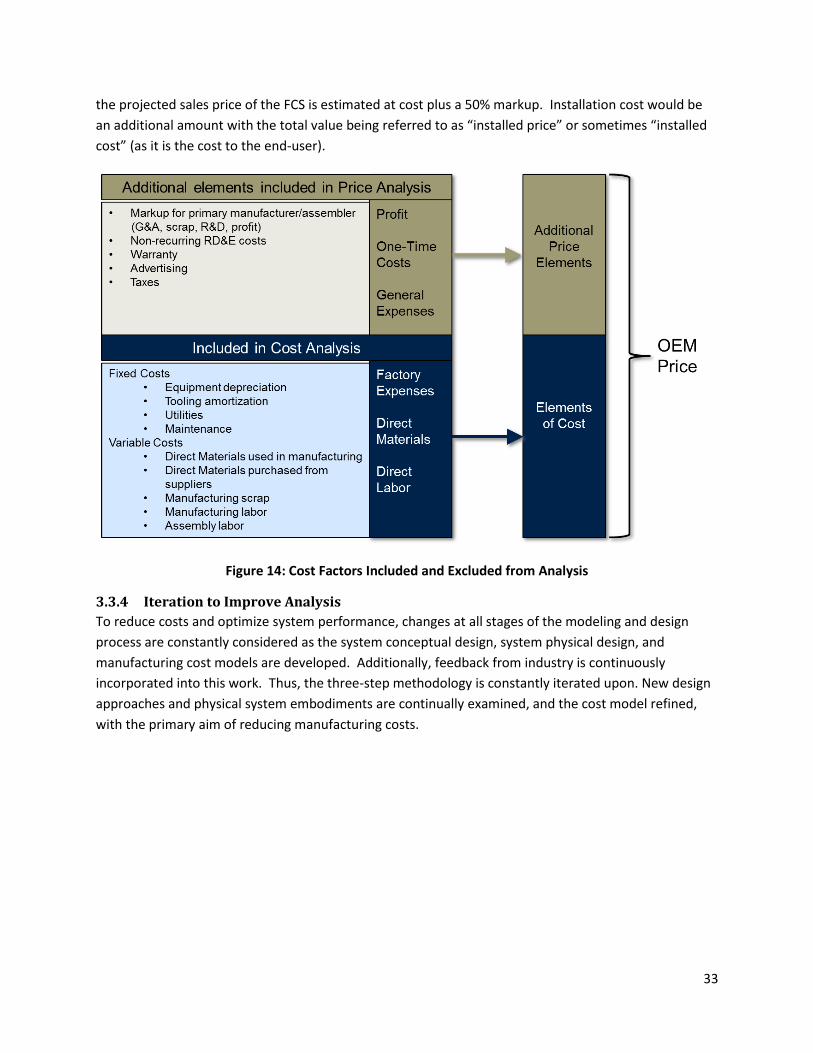
A distinction is made in the analysis between “cost” and “price”. As shown in Figure 14, cost is the sum
of materials and other direct manufacturing expenses incurred in the production of the FCS. The cost
analysis explicitly includes fixed factory expenses such as equipment depreciation, tooling amortization,
utilities, and maintenance as well as variable direct costs such as materials and labor. Price represents
the expected sales price to the end-user and is often dictated by “what the market will bear” rather than
an explicit summation of expenses. None the less, price generally covers the following cost categories:
company profit, one-time costs such as non-recurring research, design, and engineering, general and
administrative (G&A) costs, warranties, advertising, and sales taxes. As further discussed in Section 0,
18
Wright, T.P., Factors Affecting the Cost of Airplanes, Journal of Aeronautical Sciences, 3(4) (1936): 122-128. 19 “Statistical Methods for Learning Curves and Cost Analysis”, Matthew S. Goldberg and Anduin E. Touw, ISBN:1-
877640-18-2. Available from:
https://online.informs.org/informsssa/ecssashop.show_category?p_category_id=TOPICS
33
the projected sales price of the FCS is estimated at cost plus a 50% markup. Installation cost would be
an additional amount with the total value being referred to as “installed price” or sometimes “installed
cost” (as it is the cost to the end-user).
Figure 14: Cost Factors Included and Excluded from Analysis
3.3.4 Iteration to Improve Analysis
To reduce costs and optimize system performance, changes at all stages of the modeling and design
process are constantly considered as the system conceptual design, system physical design, and
manufacturing cost models are developed. Additionally, feedback from industry is continuously
incorporated into this work. Thus, the three-step methodology is constantly iterated upon. New design
approaches and physical system embodiments are continually examined, and the cost model refined,
with the primary aim of reducing manufacturing costs.
34
4 System Design, Performance, and Manufacturing Details This section describes the assumptions regarding system design, performance, and manufacturing that
underlie the cost analysis. It begins by giving an overview of the design assumptions that are common
among all three FCS technologies. Next it provides full design and manufacturing specifications for each
FCS technology on a subsystem-by-subsystem basis.
4.1 System Overview From a top-level perspective, all three FCSs are based on the same general design concept and operate
in a similar manner. Natural gas (NG) fuel and water are pumped into the reactor for conversion into
hydrogen-rich reformate. Conversion occurs due to the SMR reaction, optionally assisted by WGS and
PROX (system-dependent). Heat for the SMR conversion is provided by oxidation of unconsumed fuel
and air from the FC stack anode and cathode exhaust streams, supplemented by providing additional NG
fuel as needed. The reformate is fed into the fuel cell stack, where it is converted into DC electricity and
heat. If the stack is actively cooled, a coolant system removes heat from the stack and makes it
available to the CHP system. The stack exhaust streams are burned to provide reactor heat and then
flow into the CHP system, which includes a condenser to capture product water and achieve overall
water-neutral system operation.
4.1.1 Breakdown of Subsystems
The overall system design includes four functional subsystems and six primary cost categories. Of those
four subsystems, several are broken down further into subsystem components. The four functional
subsystems and their subsystem components are:
Fuel Cell Subsystem
o Stack: FC stack including its assembly
o FC BOP: peripheral components associated with the FC subsystem, including controls
o Assembly: integration of the stack with the BOP components
Fuel Processing Subsystem
o Fuel processing Reactor: integrated reactor device that performs the fuel and air
preheating, reforming, and other fuel processing reactions. Also includes reactor
assembly
o FP BOP: peripheral components associated with the FP subsystem, including controls
o Assembly: integration of the reactor with the BOP components
Power Electronics Subsystem: components required for power regulation and system control,
including voltage regulation, overall system control, and batteries (if grid-independent operation
is being analyzed)
CHP Subsystem: components required for use of system waste heat as heat supply for building
use.
In addition to these four functional subsystems, two additional cost contributors make up the full set of
six cost categories.
35
Housing and Final System Assembly: assembly of all subsystem components and BOP
components inside a general system housing
Cost Margin: a 10% cost markup is applied to cover non-enumerated components or processes.
Adding a margin follows judicious cost estimation practice, particularly in preliminary costing
exercises.
4.1.2 Common Design and Cost Assumptions
4.1.2.1 Power levels and Manufacturing Rates
For each of the three FCS technologies examined, systems were modeled at maximum installed
electrical capacities of 1 kWe, 5 kWe, 25 kWe, and 100 kWe. In most cases the differences between
different peak capacities are manifested by progressively increasing size in the relevant part or
subsystem design, e.g. stack area and cell count (see Section 4.3.1) or reactor dimensions (see Sections
4.1.2.7 and 4.4.1). In some cases, however, an increase in system peak capacity necessitated a discrete
change in system design, e.g. multiple reactors for 100 kWe systems (see Sections 4.1.2.7 and 4.4.1).
These system size-dependent design differences will always be discussed in the relevant section or
sections below.
In addition to the three modeled technologies at four different system sizes, the manufacturing process
was modeled at four different annual system production rates: 100, 1,000, 10,000, and 50,000 systems
per year. This allows an analysis of the effect of economies of scale in manufacturing on each FCS size
and design. As production rates increase from a low value of 100 systems per year to a high value of
50,000 systems per year, capital equipment utilization increases dramatically. In some cases, equipment
or methods that are well-suited to high production are not economical at low production, and vise-
versa. Thus, manufacturing process may change for the same design over the range of production rates,
e.g. from a manual process to an automated process. Production rate-dependent manufacturing
process differences will always be discussed in the relevant section or sections below.
4.1.2.2 Gross Power vs. Net Power
Although energy and mass models of each system were generated in the chemical engineering
simulation software HYSYSTM, there is an insufficient basis to assess gross power differences between
the three technologies. All three technologies are expected to operate at approximately the same stack
pressure (6psig) and thus are expected to have similar parasitic loads. Consequently, to avoid disparate
treatment without valid basis of discernment, a standard addition equal to 5% of net power is added to
all systems to represent the sum of all parasitic power loads (blowers, pumps, sensors, system
controllers, etc.).
4.1.2.3 System Efficiency
System efficiencies between the three FC technologies are not standardized. Instead, a reasonable stack
operating point is selected for each technology based on consideration of each technologies strengths
and weaknesses (primarily polarization performance and power density), and the resulting system
efficiency is computed. For instance, SOFC systems are able to achieve reasonable power density at
high cell voltage, leading to the possibility of a high system efficiency at a reasonable capital cost. In
36
contrast, HT PEM systems have a generally lower polarization performance leading to selection of a
lower system efficiency operating point to reduce stack cost.
While cell voltages, operating conditions, and mass and heat balances differ between fuel cell
technologies, there are several assumptions affecting system efficiency which are applied uniformly to
all systems:
Parasitic load: 5% of gross power
AC /DC Inverter: 93% efficiency.
4.1.2.4 Air Supply
Air is supplied to the stack(s) via a regenerative air blower. Costs are projected based a pair of
proprietary estimates at 10,000/year production rate and assumed 0.97 learning curve factor: $540 for a
blower suitable for a 25 kWe system and $300 for a blower suitable for a 1 kWe system. These quotes
include the full system and controller. In addition to the blower, the air supply system includes an air
mass flow sensor, an air filter and housing, and the requisite ducting for air flow. The cost of the air
mass flow sensor is based upon a Cardone Reman Mass Air Flow Sensor which costs $59 at 10,000/year
with a 0.97 learning curve factor. The air filter and housing is based on a part which costs $20 for a 1
kWe system and $90 for a 100 kWe system, both at 10,000/year with a 0.97 learning curve factor. For
the ducting, a comparison analysis was conducted against the 80 kW automotive system. A cost
representing $122 for an 80 kWe system at 100k/year with a 0.2 exponential scaling factor on system
size and a 0.97 learning curve factor was determined to most closely reflect the automotive results for
this part. The components comprising the air supply are all considered BOP components of the FC
Subsystem.
4.1.2.5 Fuel and Water Supply
Fuel and water supply components are considered to be part of the FP Subsystem BOP items, and the
price scaling is based on the same basic equipment for all three system technologies. The fuel supply
system included in the system cost depends upon the fuel supply assumed for the system. For 1 kWe
and 5 kWe systems, a residential installation is assumed with a 1 psig NG supply pressure. Thus, a NG
compressor is required for those system sizes to boost to the approximate 6 psig operating pressure.
The base cost of the NG compressor is $1300 for 1 kWe PEM system at 10/year with a learning curve of
0.96. The $1300 base cost consists of $500 for the compressor, $300 for the motor, and another $500
for the controller based on proprietary conversations with fuel cell system experts. The cost is scaled
according to system size by an exponent of 0.5, and in the case of the SOFC system is also scaled
according to cathode air stoichiometry and system efficiency, to capture the difference in air and fuel
flows in the SOFC system. For 25 and 100 kWe systems, a commercial installation is assumed with a 15
psig NG supply pressure. For these systems only a pressure regulator is required since the NG supply
pressure exceeds the 6 psig system operating pressure. The 25 kWe system uses a $220 pressure
regulator, while the 100 kWe system uses a cost of $369. Both costs are obtained from FLOMEC quotes
for single, 10k, and 50k purchases quantities. A learning curve factor of 0.99 is used.
The water supply system is based on pumps of two distinct designs. The first pump, suitable for 1 kWe
and 5 kWe systems, is based upon Thomas-Magnete price quotation of $188 for a single unit, with an
37
assumed learning curve factor of 0.96. In the 1 kWe system, a single pump in used while in the 5 kWe
system two are used in parallel. The pump used in the 25 kWe and 100 kWe systems is based on a Flight
Works, Inc. price quote of $799 with a learning curve of 0.96. One pump is used in the 25 kWe systems,
while the 100 kWe systems use four (one per reactor). Included in the water supply systems in addition
to the pumps are a tank, a water level sensor, and a demineralized water filter. For the tanks, one price
was obtained for 1 kWe, 5 kWe, and 25 kWe systems while a second was used for the 100 kWe system.
Tank pricing was based on quotations from Grainger. The smaller tank was $30 and the larger $53, both
for 10,000/year and with a learning curve of 0.93. The level sensors cost $20 and the filter cost $37,
both at a quantity of 1 with a learning curve factor of 0.96. Each system has a single level sensor. The 1
kWe and 5 kWe systems both have a single filter, while the 25 kWe system has two and the 100 kWe
system has eight.
4.1.2.6 Desulfurization System
The desulfurization system is based on an analysis of SulfaTrap passive sulfur adsorbent by TDA
Research, Inc.20 This adsorbent system can achieve a weight capacity of up to 2.35%, resulting in bed
volumes 30 times smaller than traditional activated carbon adsorbents. However, a sulfur adsorption of
1% wt (sulfur/adsorbent) is assumed in the cost analysis based on worst case operating conditions (45°C
wet NG). Sulfur concentration in the NG is assumed to be 2.57 ppmv. The adsorbent is housed in a high
density polyethylene (HDPE) canister of 12.7cm diameter and a length varying between ~12 cm (at
1kWe) to ~24cm (at 100kWe). A single canister is used for 1kWe systems and four canisters in parallel
are used for 100kWe systems. Canister replacement frequency is estimated at once per year for 1kWe
systems and monthly for 100kWe systems. While total annual absorbent costs are computed, only the
cost of a single set of desulfurization canisters is included in the tabulated capital cost. The adsorbent
can be regenerated and does not parasitically adsorb hydrocarbons. Cost is estimated to range from
$24-$10 per pound, depending on production scale, with an estimated final cost of $4.71 / 1,000 Nm3 of
NG processed.
4.1.2.7 Fuel Processor
The reactor component of the FP subsystem represents an interpretation of an existing Ballard Power
Systems design which was in turn based upon patents by Tokyo Gas. 21,22 The fuel processing reactor
consists of several metal cylinders which create annular flow fields for fuel and exhaust flow, as well as
promote heat transfer between different flows. In the basic operation, fuel and water flow into their
respective inlet ports and follow a spiral path through dedicated feed coils. Heat transfers into the inlet
fluids from the burner zone on one side and the reformate exit stream on the other, raising the
temperature of both fluids and converting the water to steam. The steam and natural gas are forced
through the mixing plate, a flat plate filled with many small holes designed to promote turbulence and
mixing as the fuel and steam pass through. At this point the fuel/steam mixture enters the steam
methane reforming (SMR) catalyst zone. This zone is situated closest to the internal tail gas burner, and
20
Alptekin , Gökhan O., “Sorbents for Desulfurization of Natural Gas, LPG and Transportation Fuels,” Sixth annual SECA Workshop, April 21, 2004. 21
Komiya, J., et al., “Single-Pipe Cylinder-Type Reformer.” US Patent 7,037,472, issued May 2, 2006. 22
Miura, T., et al., “Cylindrical Steam Reforming Unit.” US Patent 7,182,921, issued February 27, 2007.
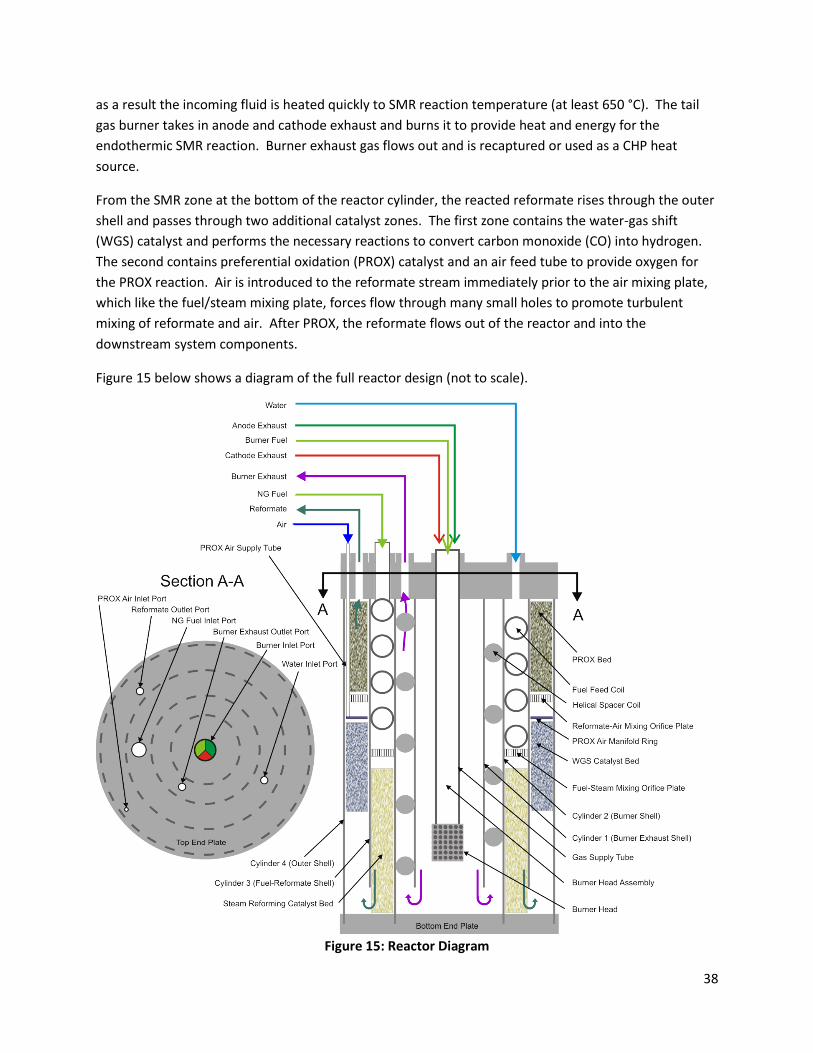
38
as a result the incoming fluid is heated quickly to SMR reaction temperature (at least 650 °C). The tail
gas burner takes in anode and cathode exhaust and burns it to provide heat and energy for the
endothermic SMR reaction. Burner exhaust gas flows out and is recaptured or used as a CHP heat
source.
From the SMR zone at the bottom of the reactor cylinder, the reacted reformate rises through the outer
shell and passes through two additional catalyst zones. The first zone contains the water-gas shift
(WGS) catalyst and performs the necessary reactions to convert carbon monoxide (CO) into hydrogen.
The second contains preferential oxidation (PROX) catalyst and an air feed tube to provide oxygen for
the PROX reaction. Air is introduced to the reformate stream immediately prior to the air mixing plate,
which like the fuel/steam mixing plate, forces flow through many small holes to promote turbulent
mixing of reformate and air. After PROX, the reformate flows out of the reactor and into the
downstream system components.
Figure 15 below shows a diagram of the full reactor design (not to scale).
Figure 15: Reactor Diagram
39
The reactor is designed to be modular to allow for multiple scale-up alternatives. Sizing is derived from
gas-hourly space velocity (GHSV) data and modeling provided by Ballard.23 The 1 kWe system reactor is
based upon the operating conditions of the current prototype. The 5 kWe system is based upon a single
reactor running at modeled future expected conditions of the system. For the 25 kWe system, reactor
volume was increased by increasing total diameter by a factor of 2.5 and by doubling reactor length.
Finally, the 100 kWe system makes use of the modular aspect to include 2 or 4 reactors at the 25 kWe
scale. See Section 4.4 for further discussion of reactor scaling and modularity for the three system
types.
Note that the above description most accurately describes the reactors used in the LT and HT PEM FCS;
the reactor for the SOFC system is configured and sized slightly differently. As further described in
section 4.4.1.3, the SOFC FCS employs some internal reforming within the SOFC stack. Consequently the
SMR reactor is used primarily for start-up and to provide a moderately hydrogen rich NG stream to the
stack for ease of reaction. Because only a 25% reforming reaction is assumed to be conducted within
the reactor, reactor space velocity is nominally multiplied by four and the sizing of the SOFC reactor
accordingly adjusted.
The cylindrical reactor’s manufacturing methods are modeled as follows. The inner two of the reactor’s
four annular cylinder surfaces are formed from pre-cut sheets of 35 mil Inconel 625, an alloy chosen for
its superior corrosion resistance at elevated temperatures. The outer two cylinders, which do not reach
temperatures as high as the cylinders immediately adjacent to the burner and reactor zones, are made
from 35 mil 316 stainless steel. The sheets are rolled by a slip rolling machine and welded together with
an integrated tungsten inert gas (TIG) welder. The cylinders are then annealed for 20 minutes at 820 °C
in a large batch furnace. The burner assembly is constructed from a nested pair of Inconel tubes
through which anode and cathode exhaust separately flow. At the exit point of the tubes is a ceramic
mixing plate to force the anode and cathode exhaust streams together. Finally, a pair of high
temperature wires provides an electric arc to ignite the stream. The metal monoliths that occupy the
interior annular spaces between nested cylinders are formed from 2 mil FeCrAlloy® (Iron/Chromium)
sheets, heat treated to create microscopic porosity24, processed through a fin forming machine25 (15
fins per inch) and then die cut into the appropriate shapes. For systems which require WGS or PROX
catalysts, the monoliths corresponding to those reaction regions in the reactor are washcoated with
catalyst26. The washcoating process involves coating and drying several layers of catalyst and solvent
slurry, followed by a one hour calcining at 600°C in air. The calcining step drives out the solvent and
oxidizes the binder, firmly entrenching the catalyst on the surface of the monolith. The WGS catalyst is
modeled as 3% Pt on alumina and the PROX catalyst is 1% Pt on alumina. For systems which do not
require either WGS or PROX, the uncatalyzed monoliths are still included in the reactor design because
they promote heat transfer between different reactor flow zones. The SMR monolith is washcoated in a
23
Personal communication with Pat Hearn, Ballard Power Systems. 24
Heat treatment modeled as ten minutes at 1200°C in air. 25
Fin forming machine modeled as a $300,000 initial price with a $110,000 rebuild cost after 5 years of service. Line speed is 0.15 meters/minute. 26
Modeled as a gamma alumina support with loading of 0.106 grams alumina per cm3 of monolith. (Consistent
with a 40 micron layer thickness.) Active metal catalyst is 1-3% (as specified) as a fraction of alumina mass.
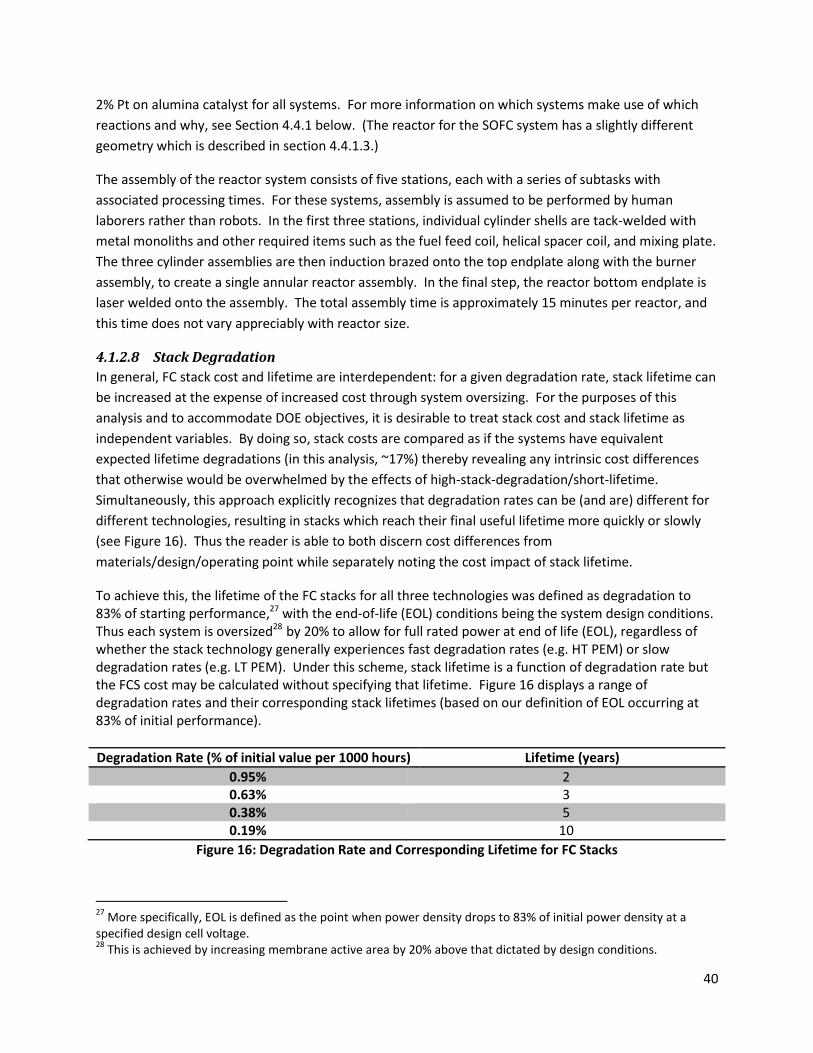
40
2% Pt on alumina catalyst for all systems. For more information on which systems make use of which
reactions and why, see Section 4.4.1 below. (The reactor for the SOFC system has a slightly different
geometry which is described in section 4.4.1.3.)
The assembly of the reactor system consists of five stations, each with a series of subtasks with
associated processing times. For these systems, assembly is assumed to be performed by human
laborers rather than robots. In the first three stations, individual cylinder shells are tack-welded with
metal monoliths and other required items such as the fuel feed coil, helical spacer coil, and mixing plate.
The three cylinder assemblies are then induction brazed onto the top endplate along with the burner
assembly, to create a single annular reactor assembly. In the final step, the reactor bottom endplate is
laser welded onto the assembly. The total assembly time is approximately 15 minutes per reactor, and
this time does not vary appreciably with reactor size.
4.1.2.8 Stack Degradation
In general, FC stack cost and lifetime are interdependent: for a given degradation rate, stack lifetime can
be increased at the expense of increased cost through system oversizing. For the purposes of this
analysis and to accommodate DOE objectives, it is desirable to treat stack cost and stack lifetime as
independent variables. By doing so, stack costs are compared as if the systems have equivalent
expected lifetime degradations (in this analysis, ~17%) thereby revealing any intrinsic cost differences
that otherwise would be overwhelmed by the effects of high-stack-degradation/short-lifetime.
Simultaneously, this approach explicitly recognizes that degradation rates can be (and are) different for
different technologies, resulting in stacks which reach their final useful lifetime more quickly or slowly
(see Figure 16). Thus the reader is able to both discern cost differences from
materials/design/operating point while separately noting the cost impact of stack lifetime.
To achieve this, the lifetime of the FC stacks for all three technologies was defined as degradation to 83% of starting performance,27 with the end-of-life (EOL) conditions being the system design conditions. Thus each system is oversized28 by 20% to allow for full rated power at end of life (EOL), regardless of whether the stack technology generally experiences fast degradation rates (e.g. HT PEM) or slow degradation rates (e.g. LT PEM). Under this scheme, stack lifetime is a function of degradation rate but the FCS cost may be calculated without specifying that lifetime. Figure 16 displays a range of degradation rates and their corresponding stack lifetimes (based on our definition of EOL occurring at 83% of initial performance).
Degradation Rate (% of initial value per 1000 hours) Lifetime (years)
0.95% 2 0.63% 3 0.38% 5 0.19% 10
Figure 16: Degradation Rate and Corresponding Lifetime for FC Stacks
27
More specifically, EOL is defined as the point when power density drops to 83% of initial power density at a specified design cell voltage. 28
This is achieved by increasing membrane active area by 20% above that dictated by design conditions.
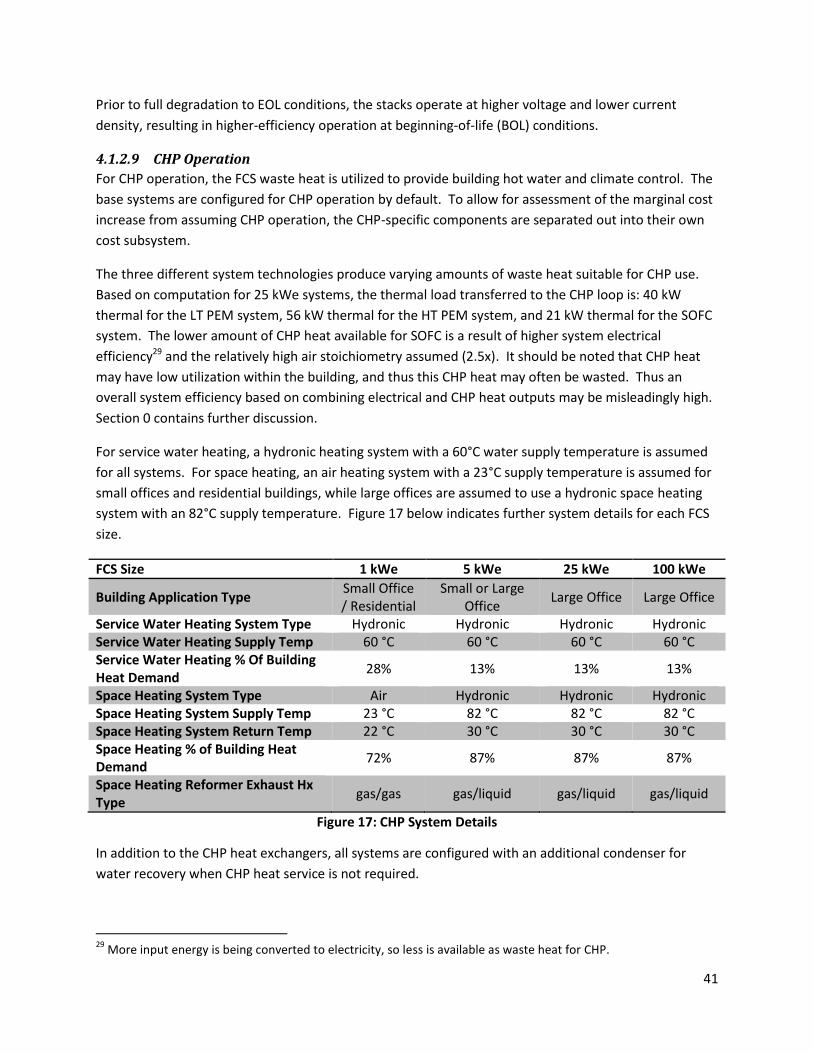
41
Prior to full degradation to EOL conditions, the stacks operate at higher voltage and lower current
density, resulting in higher-efficiency operation at beginning-of-life (BOL) conditions.
4.1.2.9 CHP Operation
For CHP operation, the FCS waste heat is utilized to provide building hot water and climate control. The
base systems are configured for CHP operation by default. To allow for assessment of the marginal cost
increase from assuming CHP operation, the CHP-specific components are separated out into their own
cost subsystem.
The three different system technologies produce varying amounts of waste heat suitable for CHP use.
Based on computation for 25 kWe systems, the thermal load transferred to the CHP loop is: 40 kW
thermal for the LT PEM system, 56 kW thermal for the HT PEM system, and 21 kW thermal for the SOFC
system. The lower amount of CHP heat available for SOFC is a result of higher system electrical
efficiency29 and the relatively high air stoichiometry assumed (2.5x). It should be noted that CHP heat
may have low utilization within the building, and thus this CHP heat may often be wasted. Thus an
overall system efficiency based on combining electrical and CHP heat outputs may be misleadingly high.
Section 0 contains further discussion.
For service water heating, a hydronic heating system with a 60°C water supply temperature is assumed
for all systems. For space heating, an air heating system with a 23°C supply temperature is assumed for
small offices and residential buildings, while large offices are assumed to use a hydronic space heating
system with an 82°C supply temperature. Figure 17 below indicates further system details for each FCS
size.
FCS Size 1 kWe 5 kWe 25 kWe 100 kWe
Building Application Type Small Office / Residential
Small or Large Office
Large Office Large Office
Service Water Heating System Type Hydronic Hydronic Hydronic Hydronic Service Water Heating Supply Temp 60 °C 60 °C 60 °C 60 °C Service Water Heating % Of Building Heat Demand
28% 13% 13% 13%
Space Heating System Type Air Hydronic Hydronic Hydronic Space Heating System Supply Temp 23 °C 82 °C 82 °C 82 °C Space Heating System Return Temp 22 °C 30 °C 30 °C 30 °C Space Heating % of Building Heat Demand
72% 87% 87% 87%
Space Heating Reformer Exhaust Hx Type
gas/gas gas/liquid gas/liquid gas/liquid
Figure 17: CHP System Details
In addition to the CHP heat exchangers, all systems are configured with an additional condenser for
water recovery when CHP heat service is not required.
29
More input energy is being converted to electricity, so less is available as waste heat for CHP.
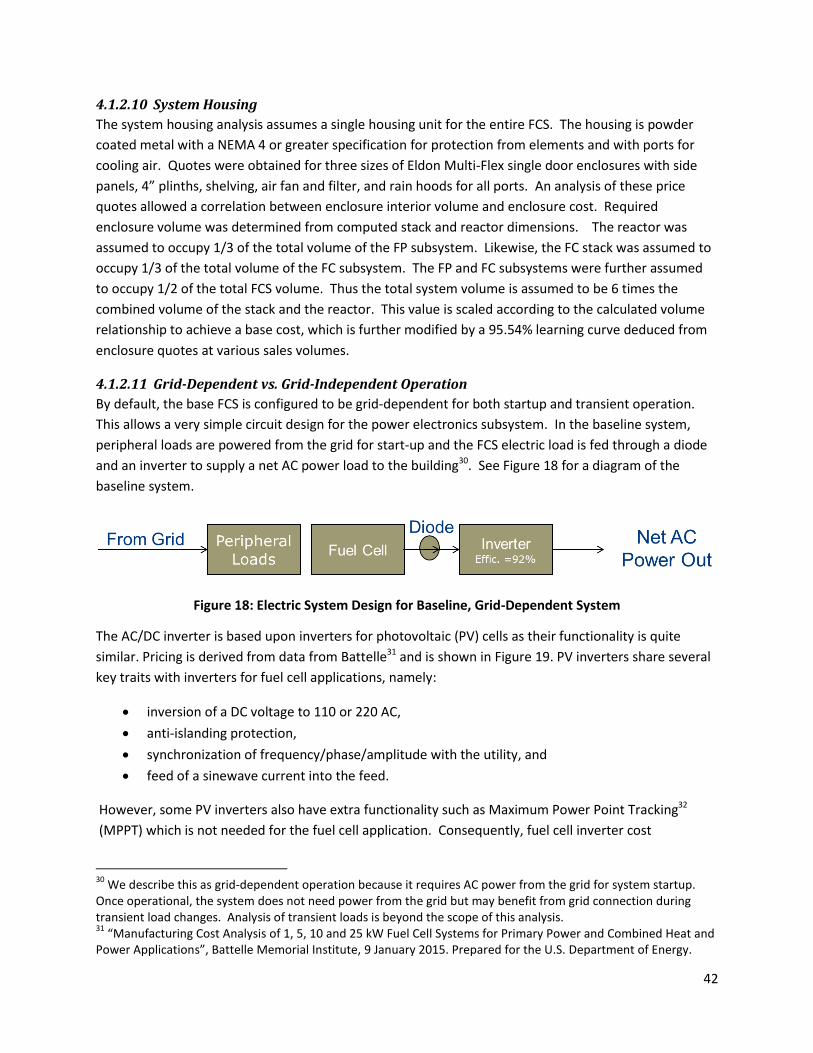
42
4.1.2.10 System Housing
The system housing analysis assumes a single housing unit for the entire FCS. The housing is powder
coated metal with a NEMA 4 or greater specification for protection from elements and with ports for
cooling air. Quotes were obtained for three sizes of Eldon Multi-Flex single door enclosures with side
panels, 4” plinths, shelving, air fan and filter, and rain hoods for all ports. An analysis of these price
quotes allowed a correlation between enclosure interior volume and enclosure cost. Required
enclosure volume was determined from computed stack and reactor dimensions. The reactor was
assumed to occupy 1/3 of the total volume of the FP subsystem. Likewise, the FC stack was assumed to
occupy 1/3 of the total volume of the FC subsystem. The FP and FC subsystems were further assumed
to occupy 1/2 of the total FCS volume. Thus the total system volume is assumed to be 6 times the
combined volume of the stack and the reactor. This value is scaled according to the calculated volume
relationship to achieve a base cost, which is further modified by a 95.54% learning curve deduced from
enclosure quotes at various sales volumes.
4.1.2.11 Grid-Dependent vs. Grid-Independent Operation
By default, the base FCS is configured to be grid-dependent for both startup and transient operation.
This allows a very simple circuit design for the power electronics subsystem. In the baseline system,
peripheral loads are powered from the grid for start-up and the FCS electric load is fed through a diode
and an inverter to supply a net AC power load to the building30. See Figure 18 for a diagram of the
baseline system.
Figure 18: Electric System Design for Baseline, Grid-Dependent System
The AC/DC inverter is based upon inverters for photovoltaic (PV) cells as their functionality is quite
similar. Pricing is derived from data from Battelle31 and is shown in Figure 19. PV inverters share several
key traits with inverters for fuel cell applications, namely:
inversion of a DC voltage to 110 or 220 AC,
anti-islanding protection,
synchronization of frequency/phase/amplitude with the utility, and
feed of a sinewave current into the feed.
However, some PV inverters also have extra functionality such as Maximum Power Point Tracking32
(MPPT) which is not needed for the fuel cell application. Consequently, fuel cell inverter cost
30
We describe this as grid-dependent operation because it requires AC power from the grid for system startup. Once operational, the system does not need power from the grid but may benefit from grid connection during transient load changes. Analysis of transient loads is beyond the scope of this analysis. 31
“Manufacturing Cost Analysis of 1, 5, 10 and 25 kW Fuel Cell Systems for Primary Power and Combined Heat and Power Applications”, Battelle Memorial Institute, 9 January 2015. Prepared for the U.S. Department of Energy.
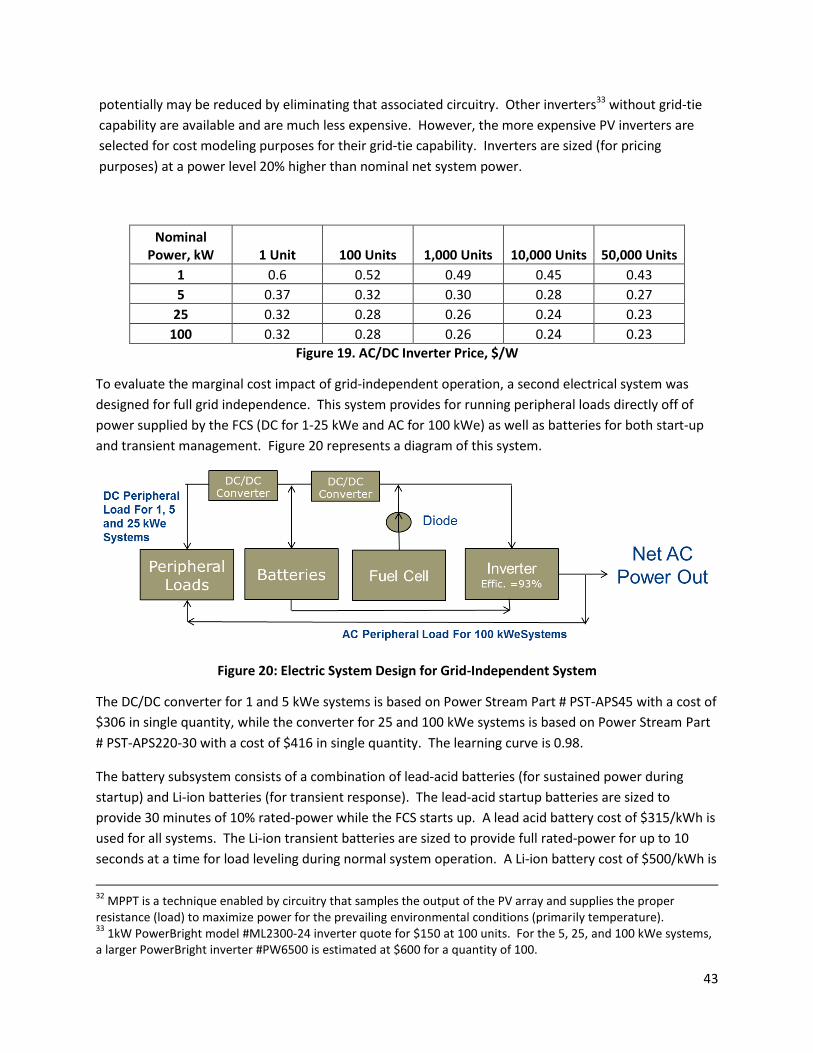
43
potentially may be reduced by eliminating that associated circuitry. Other inverters33 without grid-tie
capability are available and are much less expensive. However, the more expensive PV inverters are
selected for cost modeling purposes for their grid-tie capability. Inverters are sized (for pricing
purposes) at a power level 20% higher than nominal net system power.
Nominal Power, kW 1 Unit 100 Units 1,000 Units 10,000 Units 50,000 Units
1 0.6 0.52 0.49 0.45 0.43
5 0.37 0.32 0.30 0.28 0.27
25 0.32 0.28 0.26 0.24 0.23
100 0.32 0.28 0.26 0.24 0.23
Figure 19. AC/DC Inverter Price, $/W
To evaluate the marginal cost impact of grid-independent operation, a second electrical system was
designed for full grid independence. This system provides for running peripheral loads directly off of
power supplied by the FCS (DC for 1-25 kWe and AC for 100 kWe) as well as batteries for both start-up
and transient management. Figure 20 represents a diagram of this system.
Figure 20: Electric System Design for Grid-Independent System
The DC/DC converter for 1 and 5 kWe systems is based on Power Stream Part # PST-APS45 with a cost of
$306 in single quantity, while the converter for 25 and 100 kWe systems is based on Power Stream Part
# PST-APS220-30 with a cost of $416 in single quantity. The learning curve is 0.98.
The battery subsystem consists of a combination of lead-acid batteries (for sustained power during
startup) and Li-ion batteries (for transient response). The lead-acid startup batteries are sized to
provide 30 minutes of 10% rated-power while the FCS starts up. A lead acid battery cost of $315/kWh is
used for all systems. The Li-ion transient batteries are sized to provide full rated-power for up to 10
seconds at a time for load leveling during normal system operation. A Li-ion battery cost of $500/kWh is
32
MPPT is a technique enabled by circuitry that samples the output of the PV array and supplies the proper resistance (load) to maximize power for the prevailing environmental conditions (primarily temperature). 33
1kW PowerBright model #ML2300-24 inverter quote for $150 at 100 units. For the 5, 25, and 100 kWe systems, a larger PowerBright inverter #PW6500 is estimated at $600 for a quantity of 100.
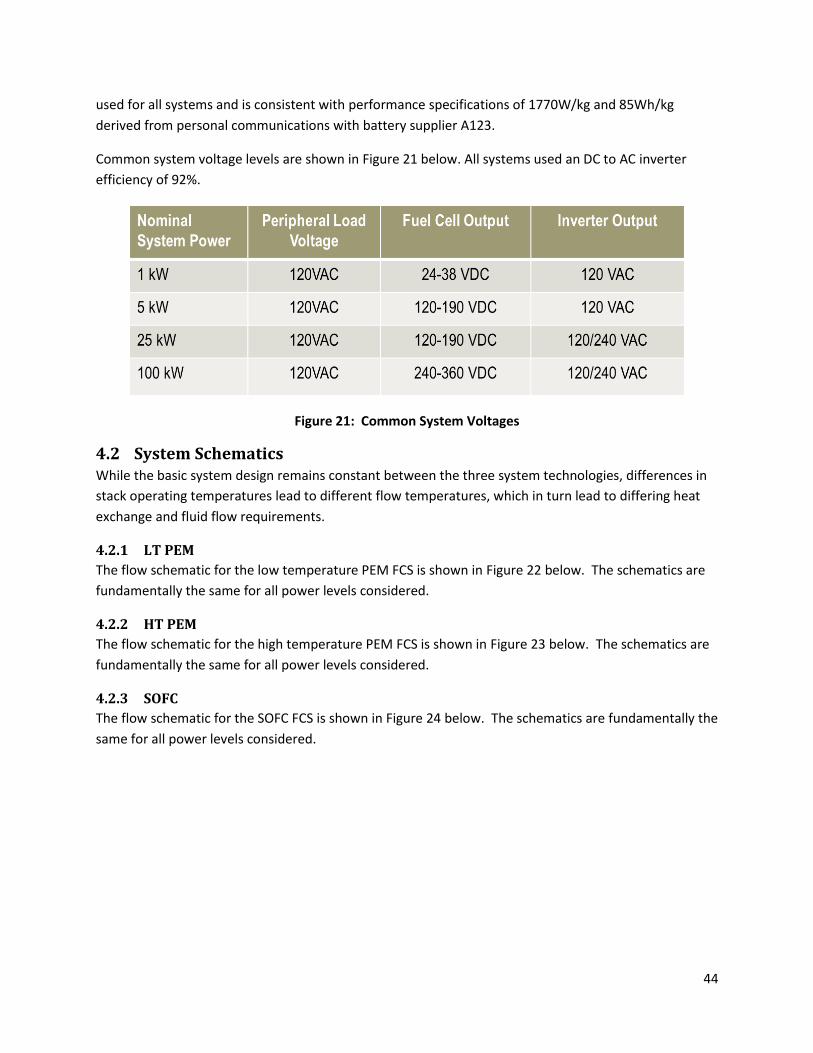
44
used for all systems and is consistent with performance specifications of 1770W/kg and 85Wh/kg
derived from personal communications with battery supplier A123.
Common system voltage levels are shown in Figure 21 below. All systems used an DC to AC inverter
efficiency of 92%.
Figure 21: Common System Voltages
4.2 System Schematics While the basic system design remains constant between the three system technologies, differences in
stack operating temperatures lead to different flow temperatures, which in turn lead to differing heat
exchange and fluid flow requirements.
4.2.1 LT PEM
The flow schematic for the low temperature PEM FCS is shown in Figure 22 below. The schematics are
fundamentally the same for all power levels considered.
4.2.2 HT PEM
The flow schematic for the high temperature PEM FCS is shown in Figure 23 below. The schematics are
fundamentally the same for all power levels considered.
4.2.3 SOFC
The flow schematic for the SOFC FCS is shown in Figure 24 below. The schematics are fundamentally the
same for all power levels considered.
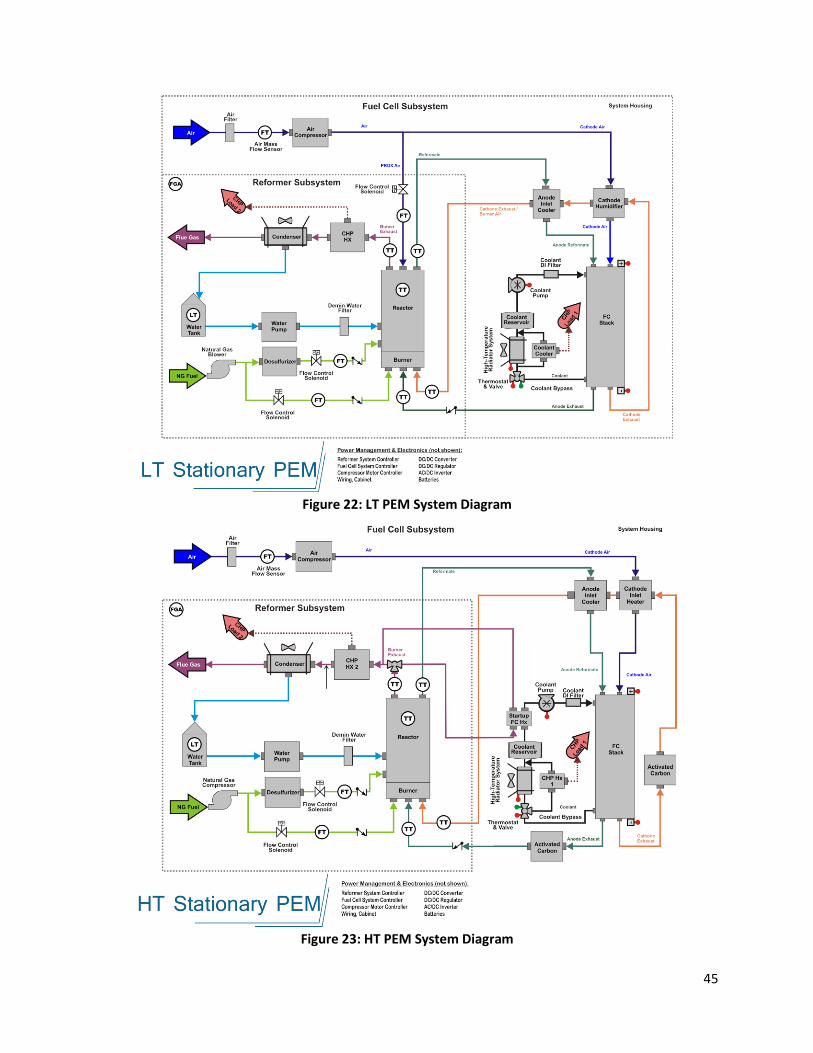
45
Figure 22: LT PEM System Diagram
Figure 23: HT PEM System Diagram
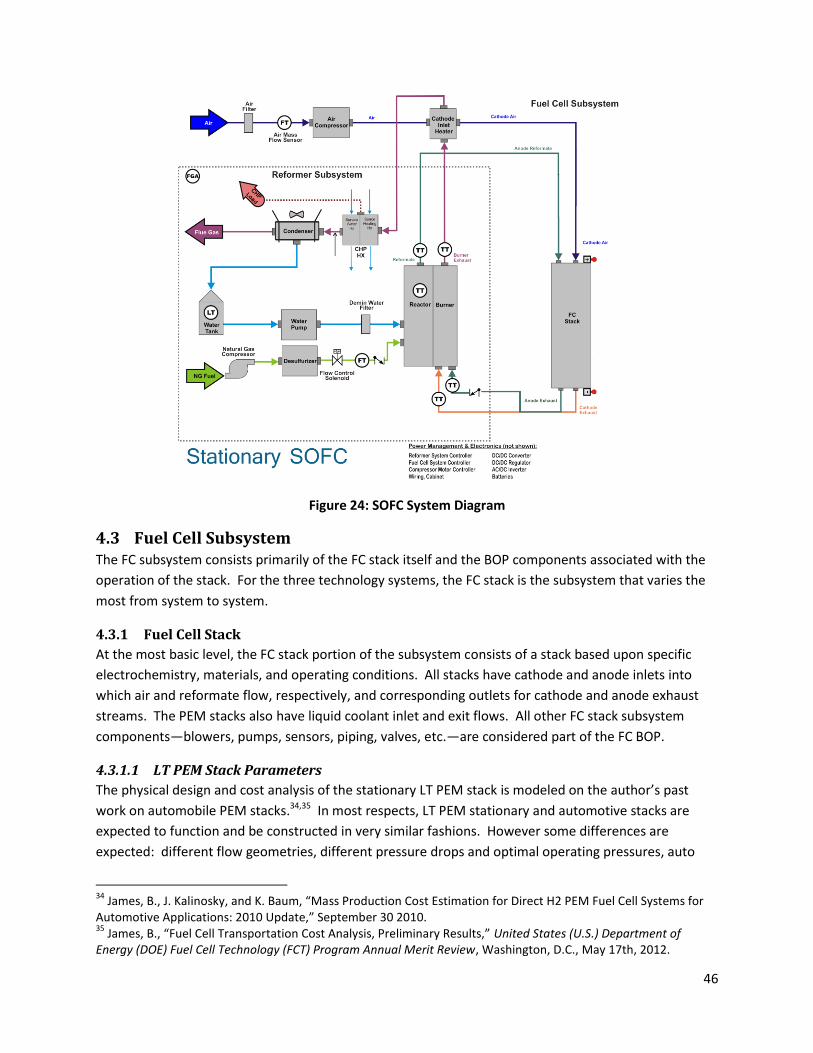
46
Figure 24: SOFC System Diagram
4.3 Fuel Cell Subsystem The FC subsystem consists primarily of the FC stack itself and the BOP components associated with the
operation of the stack. For the three technology systems, the FC stack is the subsystem that varies the
most from system to system.
4.3.1 Fuel Cell Stack
At the most basic level, the FC stack portion of the subsystem consists of a stack based upon specific
electrochemistry, materials, and operating conditions. All stacks have cathode and anode inlets into
which air and reformate flow, respectively, and corresponding outlets for cathode and anode exhaust
streams. The PEM stacks also have liquid coolant inlet and exit flows. All other FC stack subsystem
components—blowers, pumps, sensors, piping, valves, etc.—are considered part of the FC BOP.
4.3.1.1 LT PEM Stack Parameters
The physical design and cost analysis of the stationary LT PEM stack is modeled on the author’s past
work on automobile PEM stacks.34,35 In most respects, LT PEM stationary and automotive stacks are
expected to function and be constructed in very similar fashions. However some differences are
expected: different flow geometries, different pressure drops and optimal operating pressures, auto
34
James, B., J. Kalinosky, and K. Baum, “Mass Production Cost Estimation for Direct H2 PEM Fuel Cell Systems for Automotive Applications: 2010 Update,” September 30 2010. 35
James, B., “Fuel Cell Transportation Cost Analysis, Preliminary Results,” United States (U.S.) Department of Energy (DOE) Fuel Cell Technology (FCT) Program Annual Merit Review, Washington, D.C., May 17th, 2012.
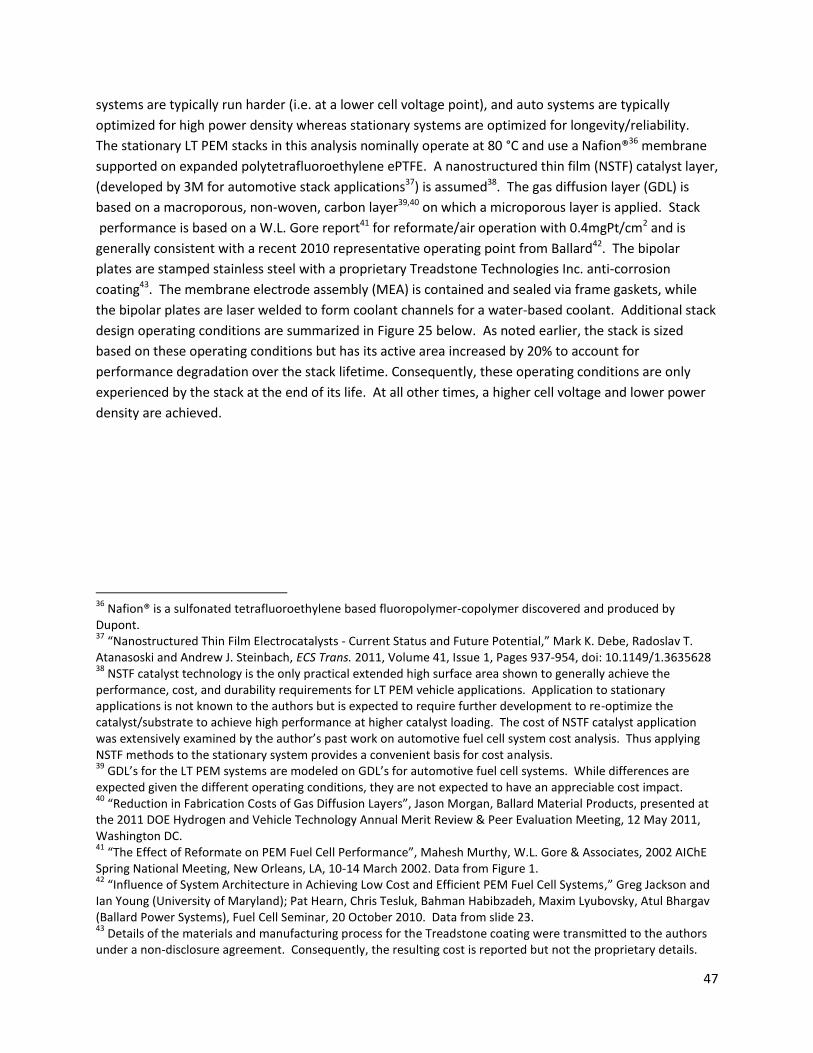
47
systems are typically run harder (i.e. at a lower cell voltage point), and auto systems are typically
optimized for high power density whereas stationary systems are optimized for longevity/reliability.
The stationary LT PEM stacks in this analysis nominally operate at 80 °C and use a Nafion®36 membrane
supported on expanded polytetrafluoroethylene ePTFE. A nanostructured thin film (NSTF) catalyst layer,
(developed by 3M for automotive stack applications37) is assumed38. The gas diffusion layer (GDL) is
based on a macroporous, non-woven, carbon layer39,40 on which a microporous layer is applied. Stack
performance is based on a W.L. Gore report41 for reformate/air operation with 0.4mgPt/cm2 and is
generally consistent with a recent 2010 representative operating point from Ballard42. The bipolar
plates are stamped stainless steel with a proprietary Treadstone Technologies Inc. anti-corrosion
coating43. The membrane electrode assembly (MEA) is contained and sealed via frame gaskets, while
the bipolar plates are laser welded to form coolant channels for a water-based coolant. Additional stack
design operating conditions are summarized in Figure 25 below. As noted earlier, the stack is sized
based on these operating conditions but has its active area increased by 20% to account for
performance degradation over the stack lifetime. Consequently, these operating conditions are only
experienced by the stack at the end of its life. At all other times, a higher cell voltage and lower power
density are achieved.
36
Nafion® is a sulfonated tetrafluoroethylene based fluoropolymer-copolymer discovered and produced by Dupont. 37
“Nanostructured Thin Film Electrocatalysts - Current Status and Future Potential,” Mark K. Debe, Radoslav T. Atanasoski and Andrew J. Steinbach, ECS Trans. 2011, Volume 41, Issue 1, Pages 937-954, doi: 10.1149/1.3635628 38
NSTF catalyst technology is the only practical extended high surface area shown to generally achieve the performance, cost, and durability requirements for LT PEM vehicle applications. Application to stationary applications is not known to the authors but is expected to require further development to re-optimize the catalyst/substrate to achieve high performance at higher catalyst loading. The cost of NSTF catalyst application was extensively examined by the author’s past work on automotive fuel cell system cost analysis. Thus applying NSTF methods to the stationary system provides a convenient basis for cost analysis. 39
GDL’s for the LT PEM systems are modeled on GDL’s for automotive fuel cell systems. While differences are expected given the different operating conditions, they are not expected to have an appreciable cost impact. 40
“Reduction in Fabrication Costs of Gas Diffusion Layers”, Jason Morgan, Ballard Material Products, presented at the 2011 DOE Hydrogen and Vehicle Technology Annual Merit Review & Peer Evaluation Meeting, 12 May 2011, Washington DC. 41
“The Effect of Reformate on PEM Fuel Cell Performance”, Mahesh Murthy, W.L. Gore & Associates, 2002 AIChE Spring National Meeting, New Orleans, LA, 10-14 March 2002. Data from Figure 1. 42
“Influence of System Architecture in Achieving Low Cost and Efficient PEM Fuel Cell Systems,” Greg Jackson and Ian Young (University of Maryland); Pat Hearn, Chris Tesluk, Bahman Habibzadeh, Maxim Lyubovsky, Atul Bhargav (Ballard Power Systems), Fuel Cell Seminar, 20 October 2010. Data from slide 23. 43
Details of the materials and manufacturing process for the Treadstone coating were transmitted to the authors under a non-disclosure agreement. Consequently, the resulting cost is reported but not the proprietary details.
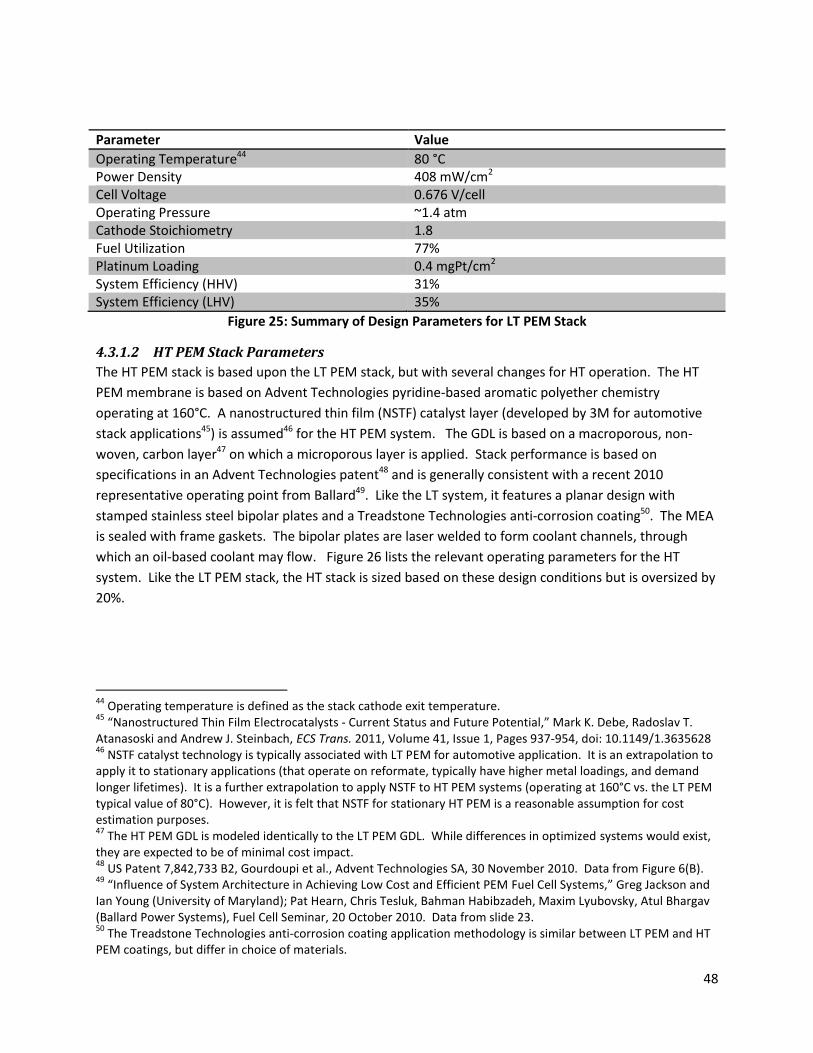
48
Parameter Value
Operating Temperature44 80 °C Power Density 408 mW/cm2 Cell Voltage 0.676 V/cell Operating Pressure ~1.4 atm Cathode Stoichiometry 1.8 Fuel Utilization 77% Platinum Loading 0.4 mgPt/cm2 System Efficiency (HHV) 31% System Efficiency (LHV) 35%
Figure 25: Summary of Design Parameters for LT PEM Stack
4.3.1.2 HT PEM Stack Parameters
The HT PEM stack is based upon the LT PEM stack, but with several changes for HT operation. The HT
PEM membrane is based on Advent Technologies pyridine-based aromatic polyether chemistry
operating at 160°C. A nanostructured thin film (NSTF) catalyst layer (developed by 3M for automotive
stack applications45) is assumed46 for the HT PEM system. The GDL is based on a macroporous, non-
woven, carbon layer47 on which a microporous layer is applied. Stack performance is based on
specifications in an Advent Technologies patent48 and is generally consistent with a recent 2010
representative operating point from Ballard49. Like the LT system, it features a planar design with
stamped stainless steel bipolar plates and a Treadstone Technologies anti-corrosion coating50. The MEA
is sealed with frame gaskets. The bipolar plates are laser welded to form coolant channels, through
which an oil-based coolant may flow. Figure 26 lists the relevant operating parameters for the HT
system. Like the LT PEM stack, the HT stack is sized based on these design conditions but is oversized by
20%.
44
Operating temperature is defined as the stack cathode exit temperature. 45
“Nanostructured Thin Film Electrocatalysts - Current Status and Future Potential,” Mark K. Debe, Radoslav T. Atanasoski and Andrew J. Steinbach, ECS Trans. 2011, Volume 41, Issue 1, Pages 937-954, doi: 10.1149/1.3635628 46
NSTF catalyst technology is typically associated with LT PEM for automotive application. It is an extrapolation to apply it to stationary applications (that operate on reformate, typically have higher metal loadings, and demand longer lifetimes). It is a further extrapolation to apply NSTF to HT PEM systems (operating at 160°C vs. the LT PEM typical value of 80°C). However, it is felt that NSTF for stationary HT PEM is a reasonable assumption for cost estimation purposes. 47
The HT PEM GDL is modeled identically to the LT PEM GDL. While differences in optimized systems would exist, they are expected to be of minimal cost impact. 48
US Patent 7,842,733 B2, Gourdoupi et al., Advent Technologies SA, 30 November 2010. Data from Figure 6(B). 49
“Influence of System Architecture in Achieving Low Cost and Efficient PEM Fuel Cell Systems,” Greg Jackson and Ian Young (University of Maryland); Pat Hearn, Chris Tesluk, Bahman Habibzadeh, Maxim Lyubovsky, Atul Bhargav (Ballard Power Systems), Fuel Cell Seminar, 20 October 2010. Data from slide 23. 50
The Treadstone Technologies anti-corrosion coating application methodology is similar between LT PEM and HT PEM coatings, but differ in choice of materials.
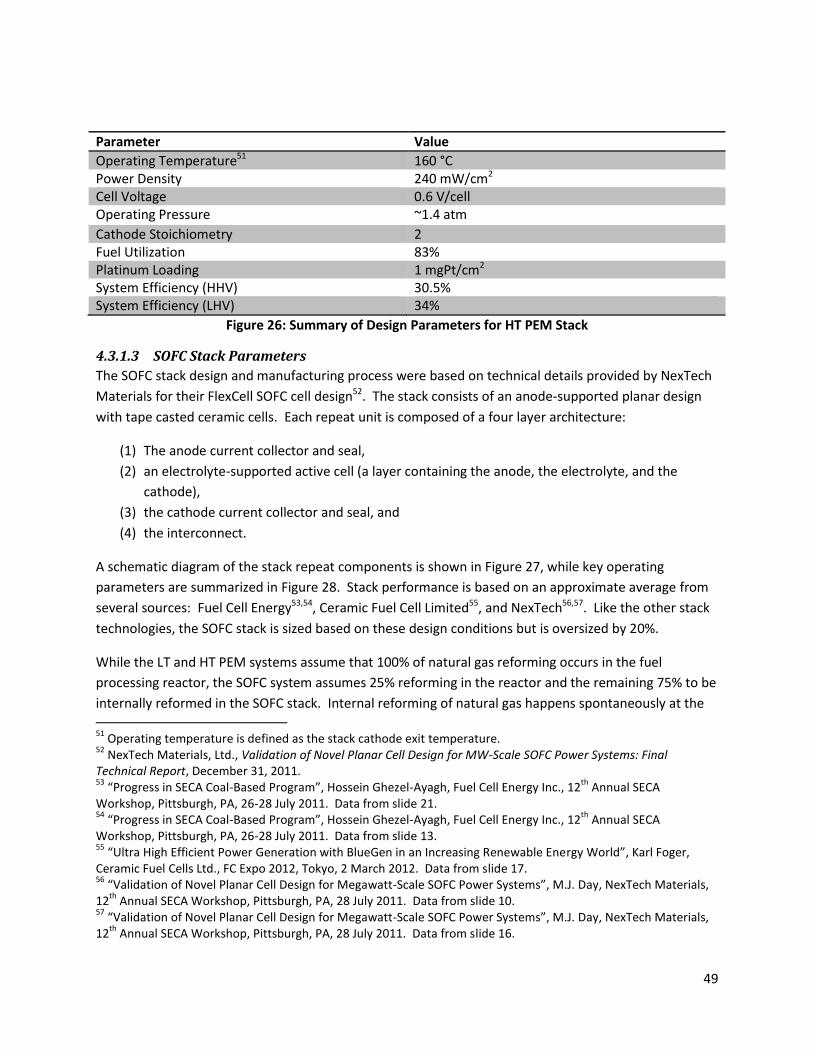
49
Parameter Value
Operating Temperature51 160 °C Power Density 240 mW/cm2 Cell Voltage 0.6 V/cell Operating Pressure ~1.4 atm
Cathode Stoichiometry 2 Fuel Utilization 83% Platinum Loading 1 mgPt/cm2 System Efficiency (HHV) 30.5% System Efficiency (LHV) 34%
Figure 26: Summary of Design Parameters for HT PEM Stack
4.3.1.3 SOFC Stack Parameters
The SOFC stack design and manufacturing process were based on technical details provided by NexTech
Materials for their FlexCell SOFC cell design52. The stack consists of an anode-supported planar design
with tape casted ceramic cells. Each repeat unit is composed of a four layer architecture:
(1) The anode current collector and seal,
(2) an electrolyte-supported active cell (a layer containing the anode, the electrolyte, and the
cathode),
(3) the cathode current collector and seal, and
(4) the interconnect.
A schematic diagram of the stack repeat components is shown in Figure 27, while key operating
parameters are summarized in Figure 28. Stack performance is based on an approximate average from
several sources: Fuel Cell Energy53,54, Ceramic Fuel Cell Limited55, and NexTech56,57. Like the other stack
technologies, the SOFC stack is sized based on these design conditions but is oversized by 20%.
While the LT and HT PEM systems assume that 100% of natural gas reforming occurs in the fuel
processing reactor, the SOFC system assumes 25% reforming in the reactor and the remaining 75% to be
internally reformed in the SOFC stack. Internal reforming of natural gas happens spontaneously at the 51
Operating temperature is defined as the stack cathode exit temperature. 52
NexTech Materials, Ltd., Validation of Novel Planar Cell Design for MW-Scale SOFC Power Systems: Final Technical Report, December 31, 2011. 53
“Progress in SECA Coal-Based Program”, Hossein Ghezel-Ayagh, Fuel Cell Energy Inc., 12th
Annual SECA Workshop, Pittsburgh, PA, 26-28 July 2011. Data from slide 21. 54
“Progress in SECA Coal-Based Program”, Hossein Ghezel-Ayagh, Fuel Cell Energy Inc., 12th
Annual SECA Workshop, Pittsburgh, PA, 26-28 July 2011. Data from slide 13. 55
“Ultra High Efficient Power Generation with BlueGen in an Increasing Renewable Energy World”, Karl Foger, Ceramic Fuel Cells Ltd., FC Expo 2012, Tokyo, 2 March 2012. Data from slide 17. 56
“Validation of Novel Planar Cell Design for Megawatt-Scale SOFC Power Systems”, M.J. Day, NexTech Materials, 12
th Annual SECA Workshop, Pittsburgh, PA, 28 July 2011. Data from slide 10.
57 “Validation of Novel Planar Cell Design for Megawatt-Scale SOFC Power Systems”, M.J. Day, NexTech Materials,
12th
Annual SECA Workshop, Pittsburgh, PA, 28 July 2011. Data from slide 16.
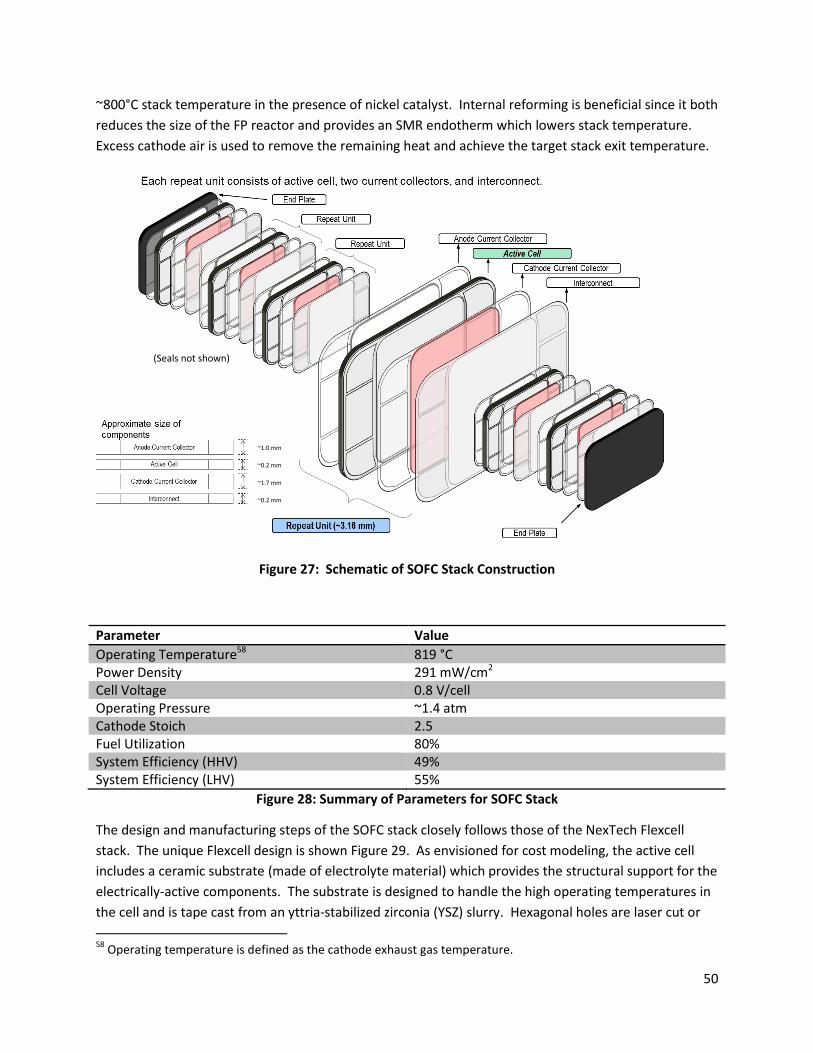
50
~800°C stack temperature in the presence of nickel catalyst. Internal reforming is beneficial since it both
reduces the size of the FP reactor and provides an SMR endotherm which lowers stack temperature.
Excess cathode air is used to remove the remaining heat and achieve the target stack exit temperature.
Figure 27: Schematic of SOFC Stack Construction
Parameter Value
Operating Temperature58 819 °C Power Density 291 mW/cm2 Cell Voltage 0.8 V/cell Operating Pressure ~1.4 atm Cathode Stoich 2.5 Fuel Utilization 80% System Efficiency (HHV) 49% System Efficiency (LHV) 55%
Figure 28: Summary of Parameters for SOFC Stack
The design and manufacturing steps of the SOFC stack closely follows those of the NexTech Flexcell
stack. The unique Flexcell design is shown Figure 29. As envisioned for cost modeling, the active cell
includes a ceramic substrate (made of electrolyte material) which provides the structural support for the
electrically-active components. The substrate is designed to handle the high operating temperatures in
the cell and is tape cast from an yttria-stabilized zirconia (YSZ) slurry. Hexagonal holes are laser cut or
58
Operating temperature is defined as the cathode exhaust gas temperature.
~1.0 mm
~0.2 mm
~1.7 mm
~0.2 mm
(Seals not shown)
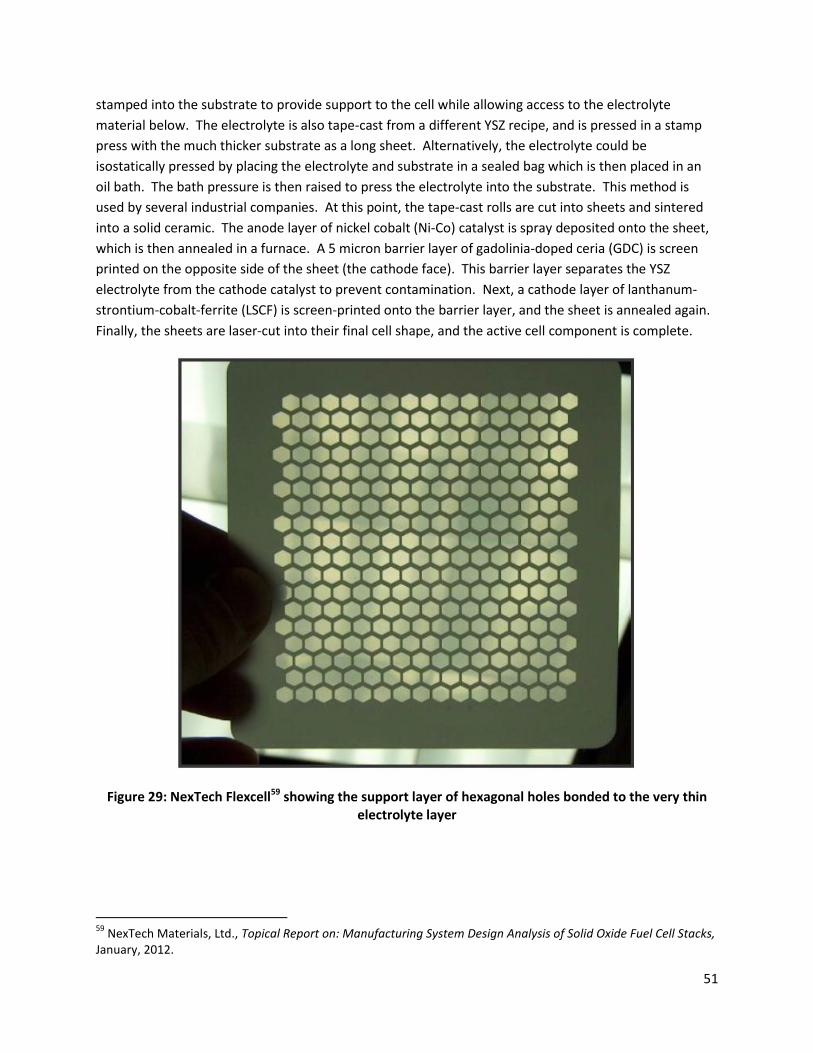
51
stamped into the substrate to provide support to the cell while allowing access to the electrolyte
material below. The electrolyte is also tape-cast from a different YSZ recipe, and is pressed in a stamp
press with the much thicker substrate as a long sheet. Alternatively, the electrolyte could be
isostatically pressed by placing the electrolyte and substrate in a sealed bag which is then placed in an
oil bath. The bath pressure is then raised to press the electrolyte into the substrate. This method is
used by several industrial companies. At this point, the tape-cast rolls are cut into sheets and sintered
into a solid ceramic. The anode layer of nickel cobalt (Ni-Co) catalyst is spray deposited onto the sheet,
which is then annealed in a furnace. A 5 micron barrier layer of gadolinia-doped ceria (GDC) is screen
printed on the opposite side of the sheet (the cathode face). This barrier layer separates the YSZ
electrolyte from the cathode catalyst to prevent contamination. Next, a cathode layer of lanthanum-
strontium-cobalt-ferrite (LSCF) is screen-printed onto the barrier layer, and the sheet is annealed again.
Finally, the sheets are laser-cut into their final cell shape, and the active cell component is complete.
Figure 29: NexTech Flexcell59 showing the support layer of hexagonal holes bonded to the very thin electrolyte layer
59
NexTech Materials, Ltd., Topical Report on: Manufacturing System Design Analysis of Solid Oxide Fuel Cell Stacks, January, 2012.
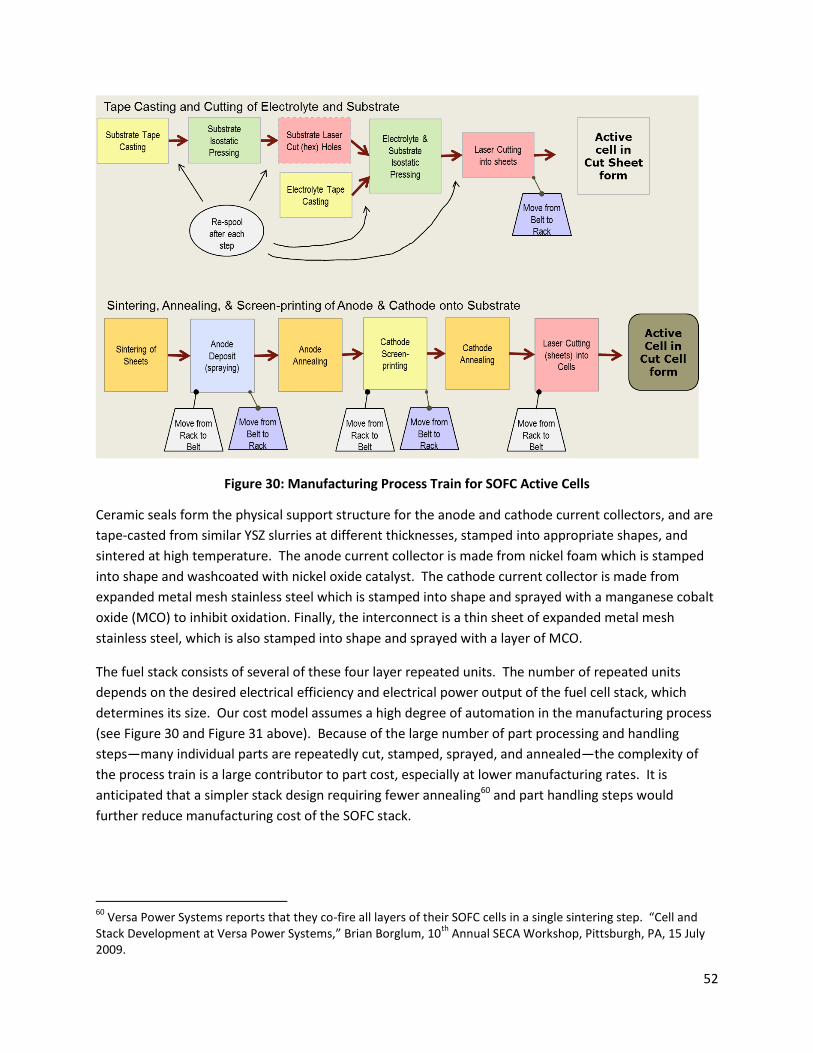
52
Figure 30: Manufacturing Process Train for SOFC Active Cells
Ceramic seals form the physical support structure for the anode and cathode current collectors, and are
tape-casted from similar YSZ slurries at different thicknesses, stamped into appropriate shapes, and
sintered at high temperature. The anode current collector is made from nickel foam which is stamped
into shape and washcoated with nickel oxide catalyst. The cathode current collector is made from
expanded metal mesh stainless steel which is stamped into shape and sprayed with a manganese cobalt
oxide (MCO) to inhibit oxidation. Finally, the interconnect is a thin sheet of expanded metal mesh
stainless steel, which is also stamped into shape and sprayed with a layer of MCO.
The fuel stack consists of several of these four layer repeated units. The number of repeated units
depends on the desired electrical efficiency and electrical power output of the fuel cell stack, which
determines its size. Our cost model assumes a high degree of automation in the manufacturing process
(see Figure 30 and Figure 31 above). Because of the large number of part processing and handling
steps—many individual parts are repeatedly cut, stamped, sprayed, and annealed—the complexity of
the process train is a large contributor to part cost, especially at lower manufacturing rates. It is
anticipated that a simpler stack design requiring fewer annealing60 and part handling steps would
further reduce manufacturing cost of the SOFC stack.
60
Versa Power Systems reports that they co-fire all layers of their SOFC cells in a single sintering step. “Cell and Stack Development at Versa Power Systems,” Brian Borglum, 10
th Annual SECA Workshop, Pittsburgh, PA, 15 July
2009.
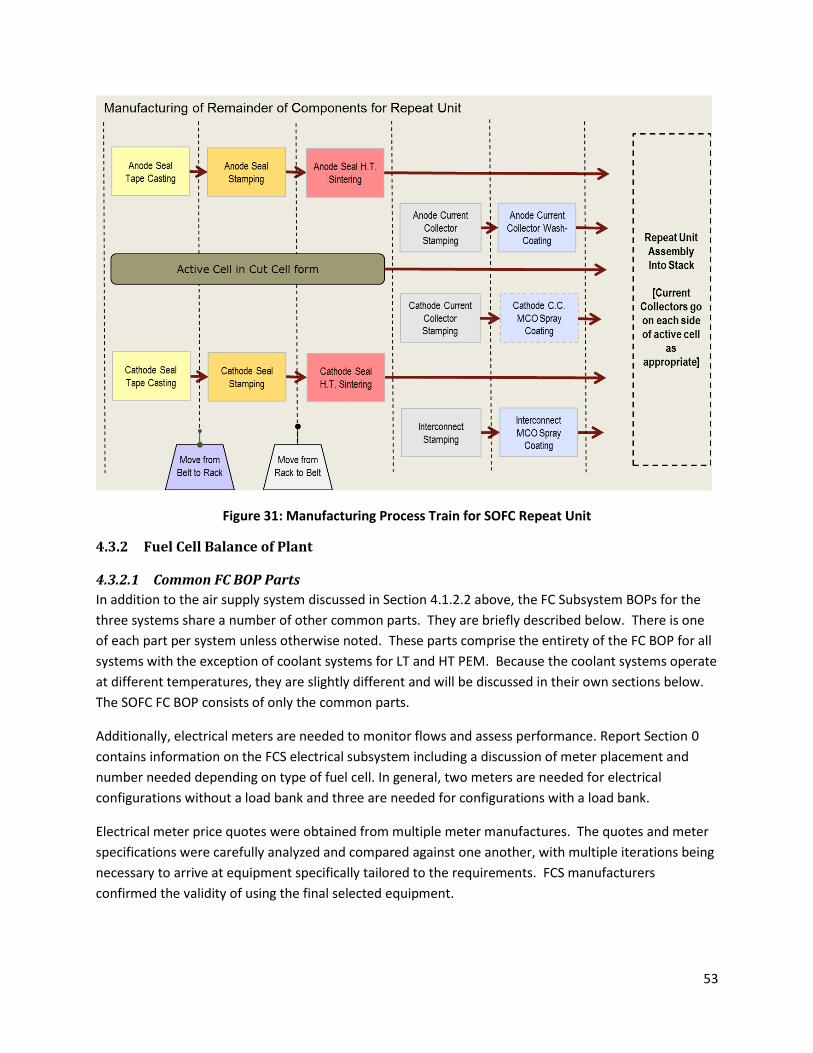
53
Figure 31: Manufacturing Process Train for SOFC Repeat Unit
4.3.2 Fuel Cell Balance of Plant
4.3.2.1 Common FC BOP Parts
In addition to the air supply system discussed in Section 4.1.2.2 above, the FC Subsystem BOPs for the
three systems share a number of other common parts. They are briefly described below. There is one
of each part per system unless otherwise noted. These parts comprise the entirety of the FC BOP for all
systems with the exception of coolant systems for LT and HT PEM. Because the coolant systems operate
at different temperatures, they are slightly different and will be discussed in their own sections below.
The SOFC FC BOP consists of only the common parts.
Additionally, electrical meters are needed to monitor flows and assess performance. Report Section 0
contains information on the FCS electrical subsystem including a discussion of meter placement and
number needed depending on type of fuel cell. In general, two meters are needed for electrical
configurations without a load bank and three are needed for configurations with a load bank.
Electrical meter price quotes were obtained from multiple meter manufactures. The quotes and meter
specifications were carefully analyzed and compared against one another, with multiple iterations being
necessary to arrive at equipment specifically tailored to the requirements. FCS manufacturers
confirmed the validity of using the final selected equipment.
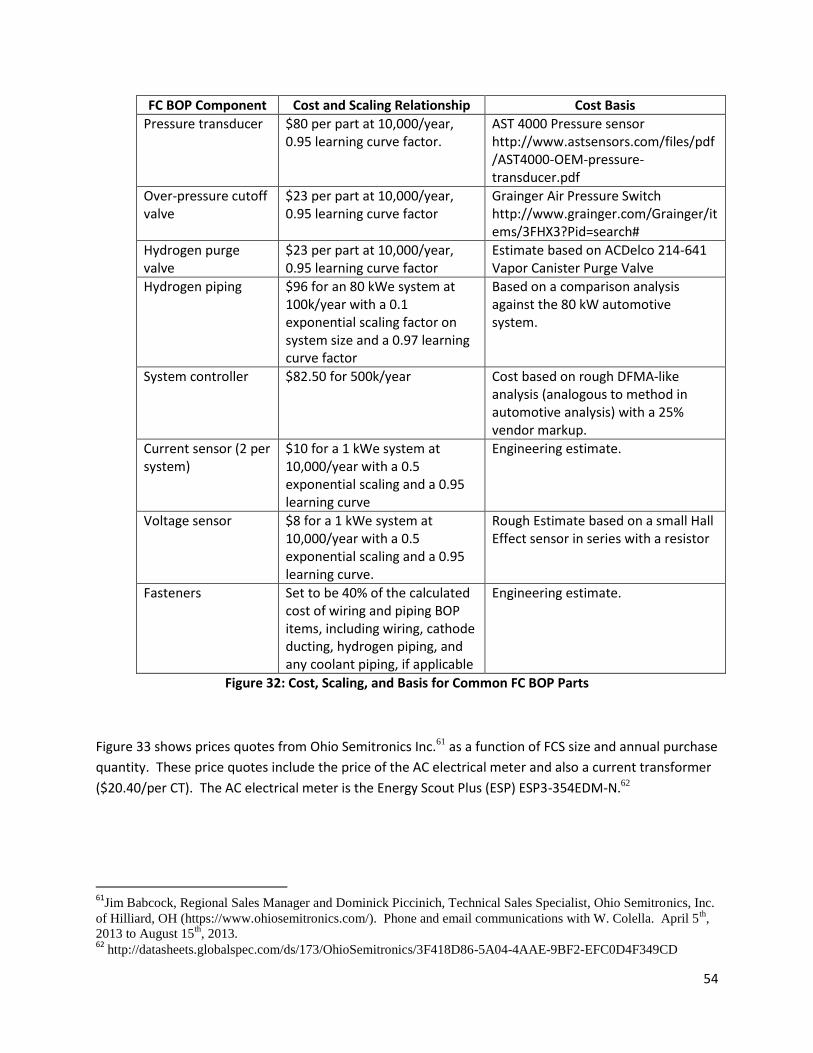
54
FC BOP Component Cost and Scaling Relationship Cost Basis
Pressure transducer $80 per part at 10,000/year, 0.95 learning curve factor.
AST 4000 Pressure sensor http://www.astsensors.com/files/pdf/AST4000-OEM-pressure-transducer.pdf
Over-pressure cutoff valve
$23 per part at 10,000/year, 0.95 learning curve factor
Grainger Air Pressure Switch http://www.grainger.com/Grainger/items/3FHX3?Pid=search#
Hydrogen purge valve
$23 per part at 10,000/year, 0.95 learning curve factor
Estimate based on ACDelco 214-641 Vapor Canister Purge Valve
Hydrogen piping $96 for an 80 kWe system at 100k/year with a 0.1 exponential scaling factor on system size and a 0.97 learning curve factor
Based on a comparison analysis against the 80 kW automotive system.
System controller $82.50 for 500k/year Cost based on rough DFMA-like analysis (analogous to method in automotive analysis) with a 25% vendor markup.
Current sensor (2 per system)
$10 for a 1 kWe system at 10,000/year with a 0.5 exponential scaling and a 0.95 learning curve
Engineering estimate.
Voltage sensor $8 for a 1 kWe system at 10,000/year with a 0.5 exponential scaling and a 0.95 learning curve.
Rough Estimate based on a small Hall Effect sensor in series with a resistor
Fasteners Set to be 40% of the calculated cost of wiring and piping BOP items, including wiring, cathode ducting, hydrogen piping, and any coolant piping, if applicable
Engineering estimate.
Figure 32: Cost, Scaling, and Basis for Common FC BOP Parts
Figure 33 shows prices quotes from Ohio Semitronics Inc.61 as a function of FCS size and annual purchase
quantity. These price quotes include the price of the AC electrical meter and also a current transformer
($20.40/per CT). The AC electrical meter is the Energy Scout Plus (ESP) ESP3-354EDM-N.62
61
Jim Babcock, Regional Sales Manager and Dominick Piccinich, Technical Sales Specialist, Ohio Semitronics, Inc.
of Hilliard, OH (https://www.ohiosemitronics.com/). Phone and email communications with W. Colella. April 5th
,
2013 to August 15th
, 2013. 62
http://datasheets.globalspec.com/ds/173/OhioSemitronics/3F418D86-5A04-4AAE-9BF2-EFC0D4F349CD
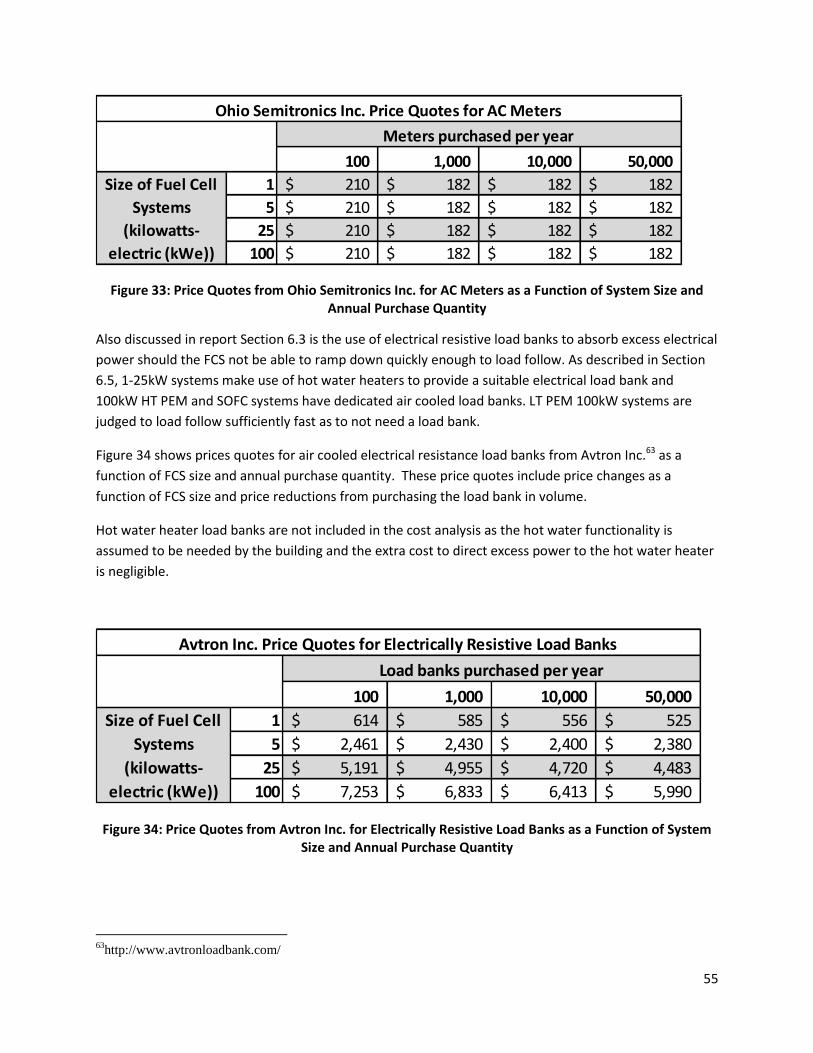
55
Figure 33: Price Quotes from Ohio Semitronics Inc. for AC Meters as a Function of System Size and Annual Purchase Quantity
Also discussed in report Section 6.3 is the use of electrical resistive load banks to absorb excess electrical
power should the FCS not be able to ramp down quickly enough to load follow. As described in Section
6.5, 1-25kW systems make use of hot water heaters to provide a suitable electrical load bank and
100kW HT PEM and SOFC systems have dedicated air cooled load banks. LT PEM 100kW systems are
judged to load follow sufficiently fast as to not need a load bank.
Figure 34 shows prices quotes for air cooled electrical resistance load banks from Avtron Inc.63 as a
function of FCS size and annual purchase quantity. These price quotes include price changes as a
function of FCS size and price reductions from purchasing the load bank in volume.
Hot water heater load banks are not included in the cost analysis as the hot water functionality is
assumed to be needed by the building and the extra cost to direct excess power to the hot water heater
is negligible.
Figure 34: Price Quotes from Avtron Inc. for Electrically Resistive Load Banks as a Function of System Size and Annual Purchase Quantity
63
http://www.avtronloadbank.com/
100 1,000 10,000 50,000
1 210$ 182$ 182$ 182$
5 210$ 182$ 182$ 182$
25 210$ 182$ 182$ 182$
100 210$ 182$ 182$ 182$
Ohio Semitronics Inc. Price Quotes for AC Meters
Meters purchased per year
Size of Fuel Cell
Systems
(kilowatts-
electric (kWe))
100 1,000 10,000 50,000
1 614$ 585$ 556$ 525$
5 2,461$ 2,430$ 2,400$ 2,380$
25 5,191$ 4,955$ 4,720$ 4,483$
100 7,253$ 6,833$ 6,413$ 5,990$
Avtron Inc. Price Quotes for Electrically Resistive Load Banks
Load banks purchased per year
Size of Fuel Cell
Systems
(kilowatts-
electric (kWe))
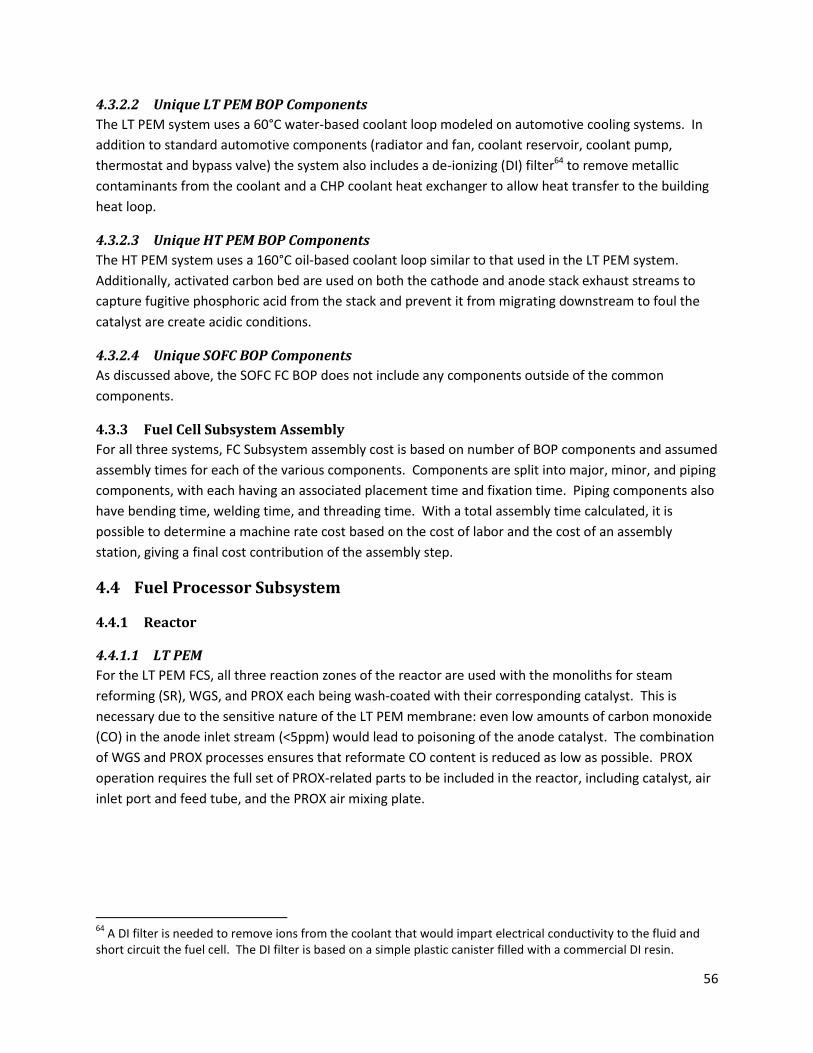
56
4.3.2.2 Unique LT PEM BOP Components
The LT PEM system uses a 60°C water-based coolant loop modeled on automotive cooling systems. In
addition to standard automotive components (radiator and fan, coolant reservoir, coolant pump,
thermostat and bypass valve) the system also includes a de-ionizing (DI) filter64 to remove metallic
contaminants from the coolant and a CHP coolant heat exchanger to allow heat transfer to the building
heat loop.
4.3.2.3 Unique HT PEM BOP Components
The HT PEM system uses a 160°C oil-based coolant loop similar to that used in the LT PEM system.
Additionally, activated carbon bed are used on both the cathode and anode stack exhaust streams to
capture fugitive phosphoric acid from the stack and prevent it from migrating downstream to foul the
catalyst are create acidic conditions.
4.3.2.4 Unique SOFC BOP Components
As discussed above, the SOFC FC BOP does not include any components outside of the common
components.
4.3.3 Fuel Cell Subsystem Assembly
For all three systems, FC Subsystem assembly cost is based on number of BOP components and assumed
assembly times for each of the various components. Components are split into major, minor, and piping
components, with each having an associated placement time and fixation time. Piping components also
have bending time, welding time, and threading time. With a total assembly time calculated, it is
possible to determine a machine rate cost based on the cost of labor and the cost of an assembly
station, giving a final cost contribution of the assembly step.
4.4 Fuel Processor Subsystem
4.4.1 Reactor
4.4.1.1 LT PEM
For the LT PEM FCS, all three reaction zones of the reactor are used with the monoliths for steam
reforming (SR), WGS, and PROX each being wash-coated with their corresponding catalyst. This is
necessary due to the sensitive nature of the LT PEM membrane: even low amounts of carbon monoxide
(CO) in the anode inlet stream (<5ppm) would lead to poisoning of the anode catalyst. The combination
of WGS and PROX processes ensures that reformate CO content is reduced as low as possible. PROX
operation requires the full set of PROX-related parts to be included in the reactor, including catalyst, air
inlet port and feed tube, and the PROX air mixing plate.
64
A DI filter is needed to remove ions from the coolant that would impart electrical conductivity to the fluid and short circuit the fuel cell. The DI filter is based on a simple plastic canister filled with a commercial DI resin.
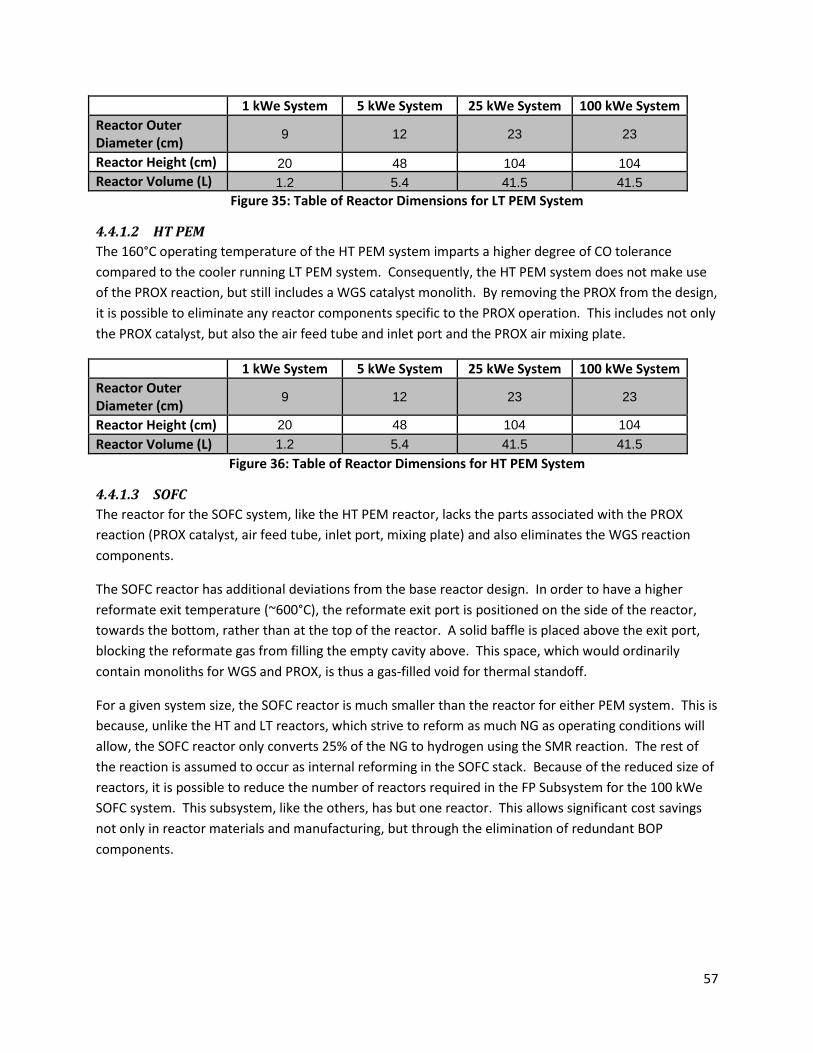
57
1 kWe System 5 kWe System 25 kWe System 100 kWe System
Reactor Outer Diameter (cm)
9 12 23 23
Reactor Height (cm) 20 48 104 104 Reactor Volume (L) 1.2 5.4 41.5 41.5
Figure 35: Table of Reactor Dimensions for LT PEM System
4.4.1.2 HT PEM
The 160°C operating temperature of the HT PEM system imparts a higher degree of CO tolerance
compared to the cooler running LT PEM system. Consequently, the HT PEM system does not make use
of the PROX reaction, but still includes a WGS catalyst monolith. By removing the PROX from the design,
it is possible to eliminate any reactor components specific to the PROX operation. This includes not only
the PROX catalyst, but also the air feed tube and inlet port and the PROX air mixing plate.
1 kWe System 5 kWe System 25 kWe System 100 kWe System
Reactor Outer Diameter (cm)
9 12 23 23
Reactor Height (cm) 20 48 104 104
Reactor Volume (L) 1.2 5.4 41.5 41.5
Figure 36: Table of Reactor Dimensions for HT PEM System
4.4.1.3 SOFC
The reactor for the SOFC system, like the HT PEM reactor, lacks the parts associated with the PROX
reaction (PROX catalyst, air feed tube, inlet port, mixing plate) and also eliminates the WGS reaction
components.
The SOFC reactor has additional deviations from the base reactor design. In order to have a higher
reformate exit temperature (~600°C), the reformate exit port is positioned on the side of the reactor,
towards the bottom, rather than at the top of the reactor. A solid baffle is placed above the exit port,
blocking the reformate gas from filling the empty cavity above. This space, which would ordinarily
contain monoliths for WGS and PROX, is thus a gas-filled void for thermal standoff.
For a given system size, the SOFC reactor is much smaller than the reactor for either PEM system. This is
because, unlike the HT and LT reactors, which strive to reform as much NG as operating conditions will
allow, the SOFC reactor only converts 25% of the NG to hydrogen using the SMR reaction. The rest of
the reaction is assumed to occur as internal reforming in the SOFC stack. Because of the reduced size of
reactors, it is possible to reduce the number of reactors required in the FP Subsystem for the 100 kWe
SOFC system. This subsystem, like the others, has but one reactor. This allows significant cost savings
not only in reactor materials and manufacturing, but through the elimination of redundant BOP
components.
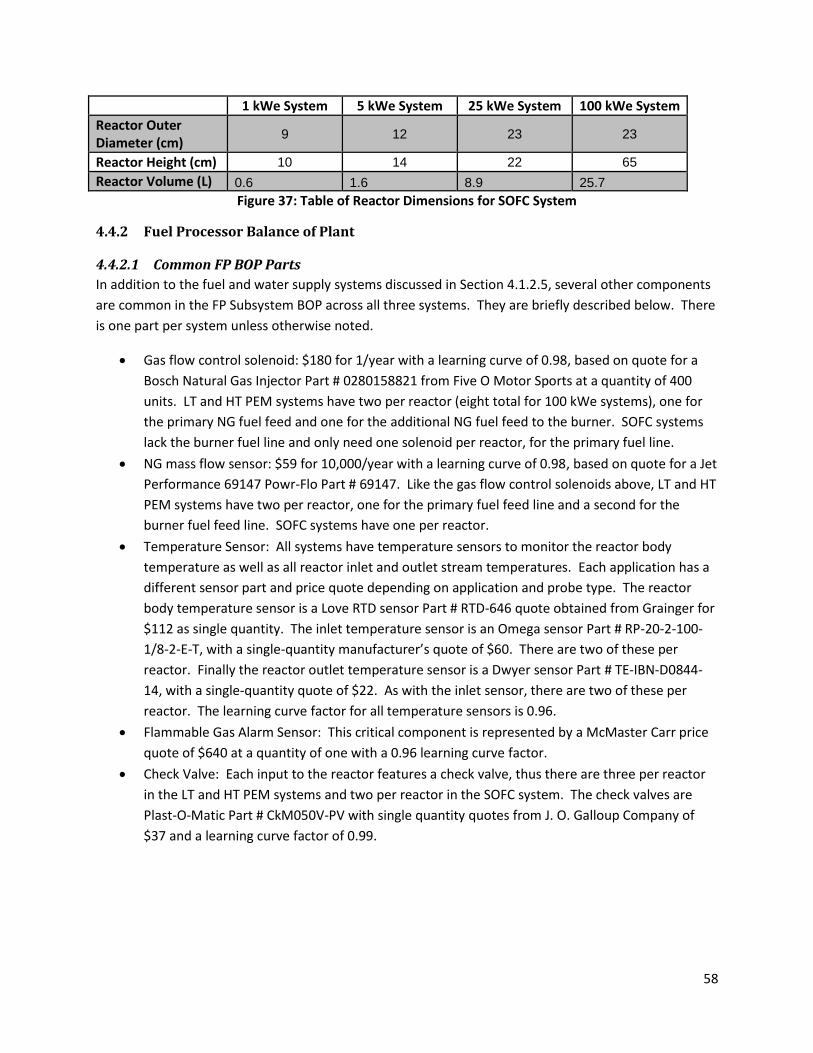
58
1 kWe System 5 kWe System 25 kWe System 100 kWe System
Reactor Outer Diameter (cm)
9 12 23 23
Reactor Height (cm) 10 14 22 65
Reactor Volume (L) 0.6 1.6 8.9 25.7 Figure 37: Table of Reactor Dimensions for SOFC System
4.4.2 Fuel Processor Balance of Plant
4.4.2.1 Common FP BOP Parts
In addition to the fuel and water supply systems discussed in Section 4.1.2.5, several other components
are common in the FP Subsystem BOP across all three systems. They are briefly described below. There
is one part per system unless otherwise noted.
Gas flow control solenoid: $180 for 1/year with a learning curve of 0.98, based on quote for a
Bosch Natural Gas Injector Part # 0280158821 from Five O Motor Sports at a quantity of 400
units. LT and HT PEM systems have two per reactor (eight total for 100 kWe systems), one for
the primary NG fuel feed and one for the additional NG fuel feed to the burner. SOFC systems
lack the burner fuel line and only need one solenoid per reactor, for the primary fuel line.
NG mass flow sensor: $59 for 10,000/year with a learning curve of 0.98, based on quote for a Jet
Performance 69147 Powr-Flo Part # 69147. Like the gas flow control solenoids above, LT and HT
PEM systems have two per reactor, one for the primary fuel feed line and a second for the
burner fuel feed line. SOFC systems have one per reactor.
Temperature Sensor: All systems have temperature sensors to monitor the reactor body
temperature as well as all reactor inlet and outlet stream temperatures. Each application has a
different sensor part and price quote depending on application and probe type. The reactor
body temperature sensor is a Love RTD sensor Part # RTD-646 quote obtained from Grainger for
$112 as single quantity. The inlet temperature sensor is an Omega sensor Part # RP-20-2-100-
1/8-2-E-T, with a single-quantity manufacturer’s quote of $60. There are two of these per
reactor. Finally the reactor outlet temperature sensor is a Dwyer sensor Part # TE-IBN-D0844-
14, with a single-quantity quote of $22. As with the inlet sensor, there are two of these per
reactor. The learning curve factor for all temperature sensors is 0.96.
Flammable Gas Alarm Sensor: This critical component is represented by a McMaster Carr price
quote of $640 at a quantity of one with a 0.96 learning curve factor.
Check Valve: Each input to the reactor features a check valve, thus there are three per reactor
in the LT and HT PEM systems and two per reactor in the SOFC system. The check valves are
Plast-O-Matic Part # CkM050V-PV with single quantity quotes from J. O. Galloup Company of
$37 and a learning curve factor of 0.99.
59
4.4.3 Fuel Processing Reactor Assembly
The FP reactor is specifically designed for low cost and ease of assembly. The relatively small size and
light weight of the individual components facilitate manual handling and assembly on custom
workstation jigs. Reactor assembly is modeled as taking place at five custom workstations:
Station 1: Burner Exhaust Shell Attachments
Station 2: Burner Shell Attachments
Station 3: Fuel-Reformate Shell Attachments
Station 4: Induction Brazing of Top Head Assembly
Station 5: Laser Welding of Bottom Assembly
Only three primary pieces of equipment are required: laser welder to affix the bottom plate to the
cylinder shells, a tack welder to temporarily hold parts in position, and an induction brazing unit to braze
the top head to the cylinder shells. Process step times for part acquisition, part placement, processing,
and part removal are summed at each station. Capital cost of each station is assessed and utilization
rates and number of parallel workstations to achieve full annual production is computed.
Assembly of the FP BOP components with the reactor is separately tabulated via a simplified method.
The number of major system components, minor system components, fluid hose segments, and
individual wiring harness are summed and then multiplied by their corresponding placement and
fixation time. This time total is then added to the expected fluid pipe assembly time which is
determined by multiplying the total number of pipe segments by representative number of pipe bends
per segment, time per bend, pipe segment placement time, welds per pipe, and weld time.
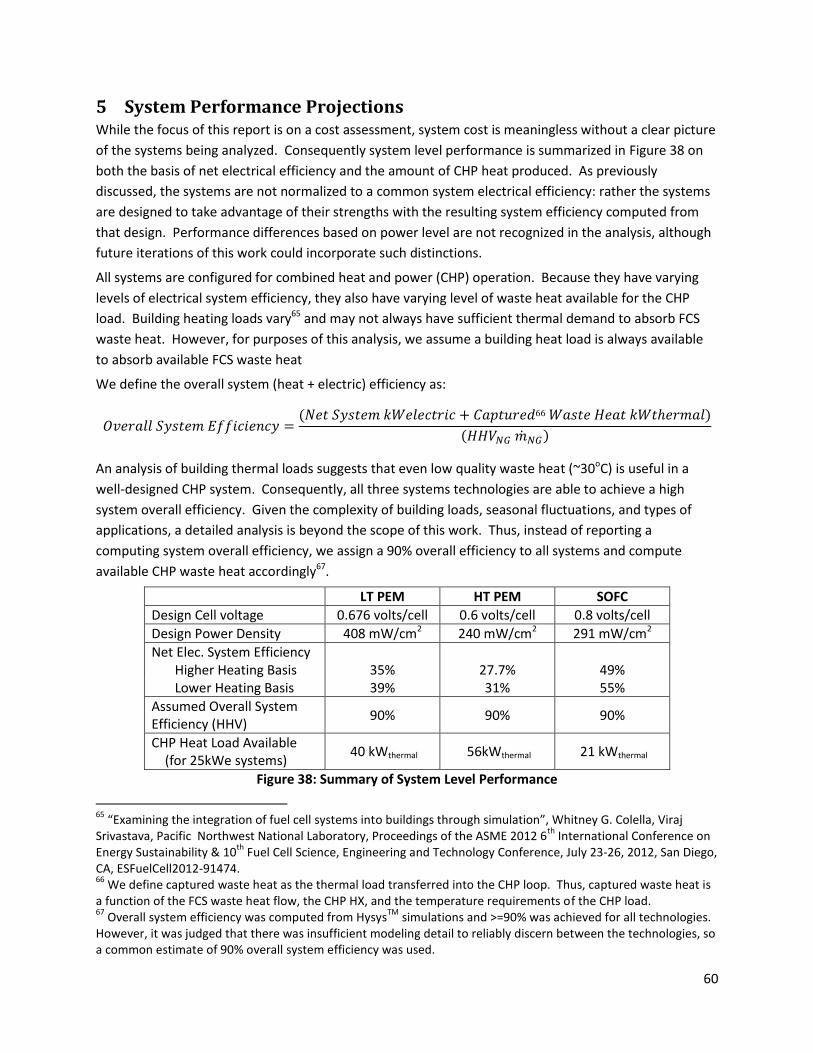
60
5 System Performance Projections While the focus of this report is on a cost assessment, system cost is meaningless without a clear picture
of the systems being analyzed. Consequently system level performance is summarized in Figure 38 on
both the basis of net electrical efficiency and the amount of CHP heat produced. As previously
discussed, the systems are not normalized to a common system electrical efficiency: rather the systems
are designed to take advantage of their strengths with the resulting system efficiency computed from
that design. Performance differences based on power level are not recognized in the analysis, although
future iterations of this work could incorporate such distinctions.
All systems are configured for combined heat and power (CHP) operation. Because they have varying
levels of electrical system efficiency, they also have varying level of waste heat available for the CHP
load. Building heating loads vary65 and may not always have sufficient thermal demand to absorb FCS
waste heat. However, for purposes of this analysis, we assume a building heat load is always available
to absorb available FCS waste heat
We define the overall system (heat + electric) efficiency as:
𝑂𝑣𝑒𝑟𝑎𝑙𝑙 𝑆𝑦𝑠𝑡𝑒𝑚 𝐸𝑓𝑓𝑖𝑐𝑖𝑒𝑛𝑐𝑦 =(𝑁𝑒𝑡 𝑆𝑦𝑠𝑡𝑒𝑚 𝑘𝑊𝑒𝑙𝑒𝑐𝑡𝑟𝑖𝑐 + 𝐶𝑎𝑝𝑡𝑢𝑟𝑒𝑑66 𝑊𝑎𝑠𝑡𝑒 𝐻𝑒𝑎𝑡 𝑘𝑊𝑡ℎ𝑒𝑟𝑚𝑎𝑙)
(𝐻𝐻𝑉𝑁𝐺 �̇�𝑁𝐺)
An analysis of building thermal loads suggests that even low quality waste heat (~30oC) is useful in a
well-designed CHP system. Consequently, all three systems technologies are able to achieve a high
system overall efficiency. Given the complexity of building loads, seasonal fluctuations, and types of
applications, a detailed analysis is beyond the scope of this work. Thus, instead of reporting a
computing system overall efficiency, we assign a 90% overall efficiency to all systems and compute
available CHP waste heat accordingly67.
LT PEM HT PEM SOFC
Design Cell voltage 0.676 volts/cell 0.6 volts/cell 0.8 volts/cell
Design Power Density 408 mW/cm2 240 mW/cm2 291 mW/cm2
Net Elec. System Efficiency Higher Heating Basis
35%
27.7%
49%
Lower Heating Basis 39% 31% 55%
Assumed Overall System Efficiency (HHV)
90% 90% 90%
CHP Heat Load Available (for 25kWe systems)
40 kWthermal 56kWthermal 21 kWthermal
Figure 38: Summary of System Level Performance
65
“Examining the integration of fuel cell systems into buildings through simulation”, Whitney G. Colella, Viraj Srivastava, Pacific Northwest National Laboratory, Proceedings of the ASME 2012 6
th International Conference on
Energy Sustainability & 10th
Fuel Cell Science, Engineering and Technology Conference, July 23-26, 2012, San Diego, CA, ESFuelCell2012-91474. 66
We define captured waste heat as the thermal load transferred into the CHP loop. Thus, captured waste heat is a function of the FCS waste heat flow, the CHP HX, and the temperature requirements of the CHP load. 67
Overall system efficiency was computed from HysysTM
simulations and >=90% was achieved for all technologies. However, it was judged that there was insufficient modeling detail to reliably discern between the technologies, so a common estimate of 90% overall system efficiency was used.
61
6 Fuel Cell System Electrical Configurations
6.1 Electrical Subsystem Framework In 2013, SA conducted a detailed analysis of fuel cell electrical configurations68 to assess the electrical
hardware needs for various applications. An electrical subsystem configuration (ESC) framework was
generated to assist with characterization of various operating modes and is shown in Figure 39. A full
description of each ESC is provided in the 2013 report. However, Configuration 4a is of primary interest
as it represents a grid-connected system, with power sell-back capability, and critical load power supply
in the event of a grid outage. Consequently, further discussion will be centered around Configuration
4a. The text below draws heavily from this earlier work.
For Configuration 4A, ESC hardware is a function of the FC stack’s electrical ramp rate. A survey of
colleagues in the industry indicated that certain FCSs have not demonstrated an ability to electrically
ramp their power output quickly, specifically: all HTPEM FCSs and all high power SOFC systems (25 kWe
and 100 kWe). Due to an inability to ramp quickly, additional costs are incurred in a configuration 4A
critical back-up power scenario with these FCSs. Specifically, these slow ramping FCSs remain on and
running during a grid power outage, for example, producing a constant 5 kWe of power. However, if the
critical loads are only 3 kWe, these FCSs cannot ramp down to that power level easily or quickly, for a
variety of reasons. As a result, one engineering solution that has been implemented successfully for
other FCSs is to install an electrically resistive load bank (ERLB) with an additional electrical meter. The
electrically resistive load bank is a set of resistors that dissipates the power and includes any equipment
needed to control the load bank. In this example, the FCS sends 2 kWe to the electrically resistive load
bank and 3 kWe to critical power in the building allowing the FCS to remain at a constant power output
of 5 kWe the entire time. The load bank and electrical meter add additional cost to these FCSs in this
Configuration 4A for critical back up power. This scenario and these costs were investigated further.
(These added costs only apply to FCs with slow electrical ramp rates.)
68
Colella, W. G., James, B. D., Assessing Electrical Sub-system Configurations and Installation Costs for
Stationary Fuel Cell Systems, report for the National Renewable Energy Laboratory, 9 Sept. 2013.
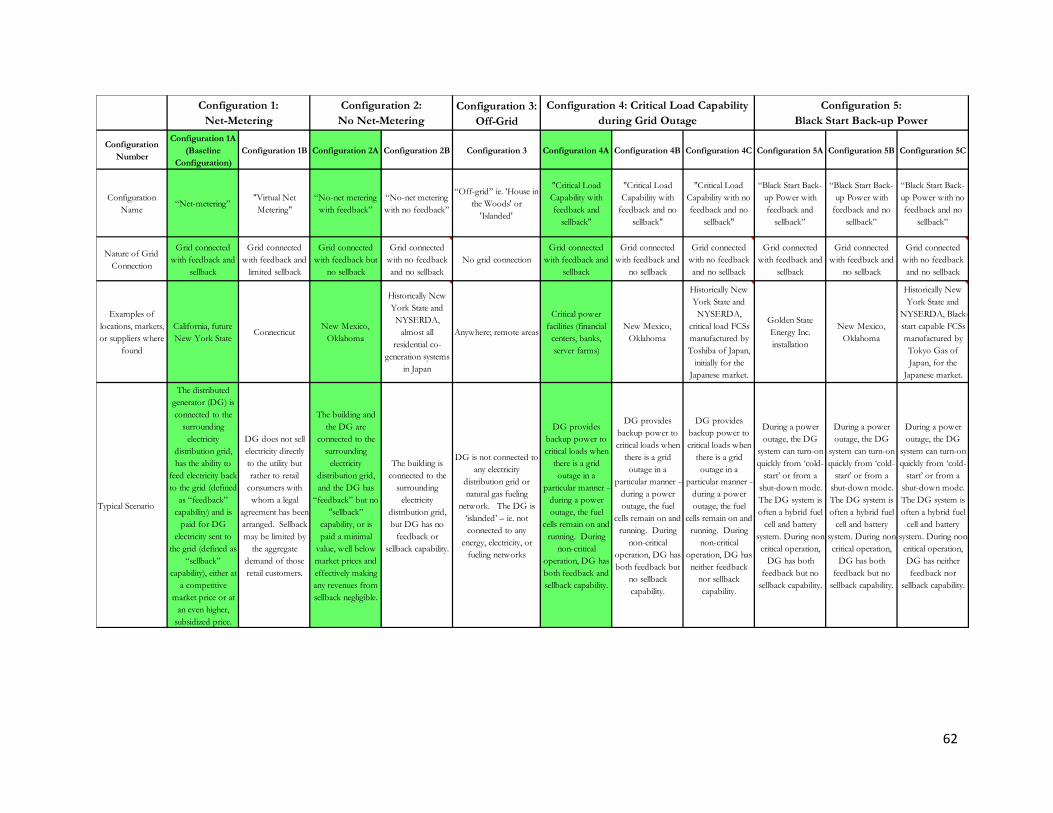
62
Configuration 3:
Off-Grid
Configuration
Number
Configuration 1A
(Baseline
Configuration)
Configuration 1B Configuration 2A Configuration 2B Configuration 3 Configuration 4A Configuration 4B Configuration 4C Configuration 5A Configuration 5B Configuration 5C
Configuration
Name“Net-metering”
"Virtual Net
Metering"
“No-net metering
with feedback”
“No-net metering
with no feedback”
“Off-grid” ie. 'House in
the Woods' or
'Islanded'
"Critical Load
Capability with
feedback and
sellback"
"Critical Load
Capability with
feedback and no
sellback"
"Critical Load
Capability with no
feedback and no
sellback"
“Black Start Back-
up Power with
feedback and
sellback”
“Black Start Back-
up Power with
feedback and no
sellback”
“Black Start Back-
up Power with no
feedback and no
sellback”
Nature of Grid
Connection
Grid connected
with feedback and
sellback
Grid connected
with feedback and
limited sellback
Grid connected
with feedback but
no sellback
Grid connected
with no feedback
and no sellback
No grid connection
Grid connected
with feedback and
sellback
Grid connected
with feedback and
no sellback
Grid connected
with no feedback
and no sellback
Grid connected
with feedback and
sellback
Grid connected
with feedback and
no sellback
Grid connected
with no feedback
and no sellback
Examples of
locations, markets,
or suppliers where
found
California, future
New York StateConnecticut
New Mexico,
Oklahoma
Historically New
York State and
NYSERDA,
almost all
residential co-
generation systems
in Japan
Anywhere; remote areas
Critical power
facilities (financial
centers, banks,
server farms)
New Mexico,
Oklahoma
Historically New
York State and
NYSERDA,
critical load FCSs
manufactured by
Toshiba of Japan,
initially for the
Japanese market.
Golden State
Energy Inc.
installation
New Mexico,
Oklahoma
Historically New
York State and
NYSERDA, Black-
start capable FCSs
manufactured by
Tokyo Gas of
Japan, for the
Japanese market.
Typical Scenario
The distributed
generator (DG) is
connected to the
surrounding
electricity
distribution grid,
has the ability to
feed electricity back
to the grid (defined
as “feedback”
capability) and is
paid for DG
electricity sent to
the grid (defined as
“sellback”
capability), either at
a competitive
market price or at
an even higher,
subsidized price.
DG does not sell
electricity directly
to the utility but
rather to retail
consumers with
whom a legal
agreement has been
arranged. Sellback
may be limited by
the aggregate
demand of those
retail customers.
The building and
the DG are
connected to the
surrounding
electricity
distribution grid,
and the DG has
“feedback” but no
"sellback”
capability, or is
paid a minimal
value, well below
market prices and
effectively making
any revenues from
sellback negligible.
The building is
connected to the
surrounding
electricity
distribution grid,
but DG has no
feedback or
sellback capability.
DG is not connected to
any electricity
distribution grid or
natural gas fueling
network. The DG is
‘islanded’ – ie. not
connected to any
energy, electricity, or
fueling networks
DG provides
backup power to
critical loads when
there is a grid
outage in a
particular manner --
during a power
outage, the fuel
cells remain on and
running. During
non-critical
operation, DG has
both feedback and
sellback capability.
DG provides
backup power to
critical loads when
there is a grid
outage in a
particular manner --
during a power
outage, the fuel
cells remain on and
running. During
non-critical
operation, DG has
both feedback but
no sellback
capability.
DG provides
backup power to
critical loads when
there is a grid
outage in a
particular manner --
during a power
outage, the fuel
cells remain on and
running. During
non-critical
operation, DG has
neither feedback
nor sellback
capability.
During a power
outage, the DG
system can turn-on
quickly from ‘cold-
start’ or from a
shut-down mode.
The DG system is
often a hybrid fuel
cell and battery
system. During non-
critical operation,
DG has both
feedback but no
sellback capability.
During a power
outage, the DG
system can turn-on
quickly from ‘cold-
start’ or from a
shut-down mode.
The DG system is
often a hybrid fuel
cell and battery
system. During non-
critical operation,
DG has both
feedback but no
sellback capability.
During a power
outage, the DG
system can turn-on
quickly from ‘cold-
start’ or from a
shut-down mode.
The DG system is
often a hybrid fuel
cell and battery
system. During non-
critical operation,
DG has neither
feedback nor
sellback capability.
Configuration 1:
Net-Metering
Configuration 2:
No Net-Metering
Configuration 4: Critical Load Capability
during Grid Outage
Configuration 5:
Black Start Back-up Power
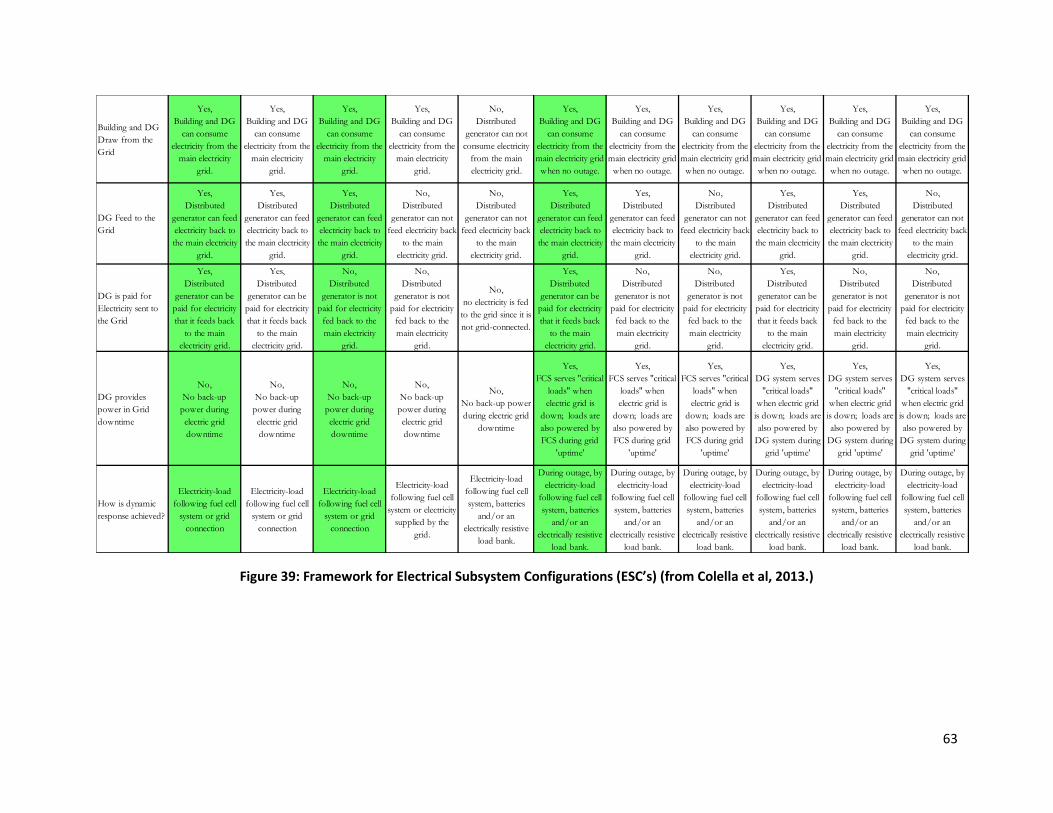
63
Figure 39: Framework for Electrical Subsystem Configurations (ESC’s) (from Colella et al, 2013.)
Building and DG
Draw from the
Grid
Yes,
Building and DG
can consume
electricity from the
main electricity
grid.
Yes,
Building and DG
can consume
electricity from the
main electricity
grid.
Yes,
Building and DG
can consume
electricity from the
main electricity
grid.
Yes,
Building and DG
can consume
electricity from the
main electricity
grid.
No,
Distributed
generator can not
consume electricity
from the main
electricity grid.
Yes,
Building and DG
can consume
electricity from the
main electricity grid
when no outage.
Yes,
Building and DG
can consume
electricity from the
main electricity grid
when no outage.
Yes,
Building and DG
can consume
electricity from the
main electricity grid
when no outage.
Yes,
Building and DG
can consume
electricity from the
main electricity grid
when no outage.
Yes,
Building and DG
can consume
electricity from the
main electricity grid
when no outage.
Yes,
Building and DG
can consume
electricity from the
main electricity grid
when no outage.
DG Feed to the
Grid
Yes,
Distributed
generator can feed
electricity back to
the main electricity
grid.
Yes,
Distributed
generator can feed
electricity back to
the main electricity
grid.
Yes,
Distributed
generator can feed
electricity back to
the main electricity
grid.
No,
Distributed
generator can not
feed electricity back
to the main
electricity grid.
No,
Distributed
generator can not
feed electricity back
to the main
electricity grid.
Yes,
Distributed
generator can feed
electricity back to
the main electricity
grid.
Yes,
Distributed
generator can feed
electricity back to
the main electricity
grid.
No,
Distributed
generator can not
feed electricity back
to the main
electricity grid.
Yes,
Distributed
generator can feed
electricity back to
the main electricity
grid.
Yes,
Distributed
generator can feed
electricity back to
the main electricity
grid.
No,
Distributed
generator can not
feed electricity back
to the main
electricity grid.
DG is paid for
Electricity sent to
the Grid
Yes,
Distributed
generator can be
paid for electricity
that it feeds back
to the main
electricity grid.
Yes,
Distributed
generator can be
paid for electricity
that it feeds back
to the main
electricity grid.
No,
Distributed
generator is not
paid for electricity
fed back to the
main electricity
grid.
No,
Distributed
generator is not
paid for electricity
fed back to the
main electricity
grid.
No,
no electricity is fed
to the grid since it is
not grid-connected.
Yes,
Distributed
generator can be
paid for electricity
that it feeds back
to the main
electricity grid.
No,
Distributed
generator is not
paid for electricity
fed back to the
main electricity
grid.
No,
Distributed
generator is not
paid for electricity
fed back to the
main electricity
grid.
Yes,
Distributed
generator can be
paid for electricity
that it feeds back
to the main
electricity grid.
No,
Distributed
generator is not
paid for electricity
fed back to the
main electricity
grid.
No,
Distributed
generator is not
paid for electricity
fed back to the
main electricity
grid.
DG provides
power in Grid
downtime
No,
No back-up
power during
electric grid
downtime
No,
No back-up
power during
electric grid
downtime
No,
No back-up
power during
electric grid
downtime
No,
No back-up
power during
electric grid
downtime
No,
No back-up power
during electric grid
downtime
Yes,
FCS serves "critical
loads" when
electric grid is
down; loads are
also powered by
FCS during grid
'uptime'
Yes,
FCS serves "critical
loads" when
electric grid is
down; loads are
also powered by
FCS during grid
'uptime'
Yes,
FCS serves "critical
loads" when
electric grid is
down; loads are
also powered by
FCS during grid
'uptime'
Yes,
DG system serves
"critical loads"
when electric grid
is down; loads are
also powered by
DG system during
grid 'uptime'
Yes,
DG system serves
"critical loads"
when electric grid
is down; loads are
also powered by
DG system during
grid 'uptime'
Yes,
DG system serves
"critical loads"
when electric grid
is down; loads are
also powered by
DG system during
grid 'uptime'
How is dynamic
response achieved?
Electricity-load
following fuel cell
system or grid
connection
Electricity-load
following fuel cell
system or grid
connection
Electricity-load
following fuel cell
system or grid
connection
Electricity-load
following fuel cell
system or electricity
supplied by the
grid.
Electricity-load
following fuel cell
system, batteries
and/or an
electrically resistive
load bank.
During outage, by
electricity-load
following fuel cell
system, batteries
and/or an
electrically resistive
load bank.
During outage, by
electricity-load
following fuel cell
system, batteries
and/or an
electrically resistive
load bank.
During outage, by
electricity-load
following fuel cell
system, batteries
and/or an
electrically resistive
load bank.
During outage, by
electricity-load
following fuel cell
system, batteries
and/or an
electrically resistive
load bank.
During outage, by
electricity-load
following fuel cell
system, batteries
and/or an
electrically resistive
load bank.
During outage, by
electricity-load
following fuel cell
system, batteries
and/or an
electrically resistive
load bank.
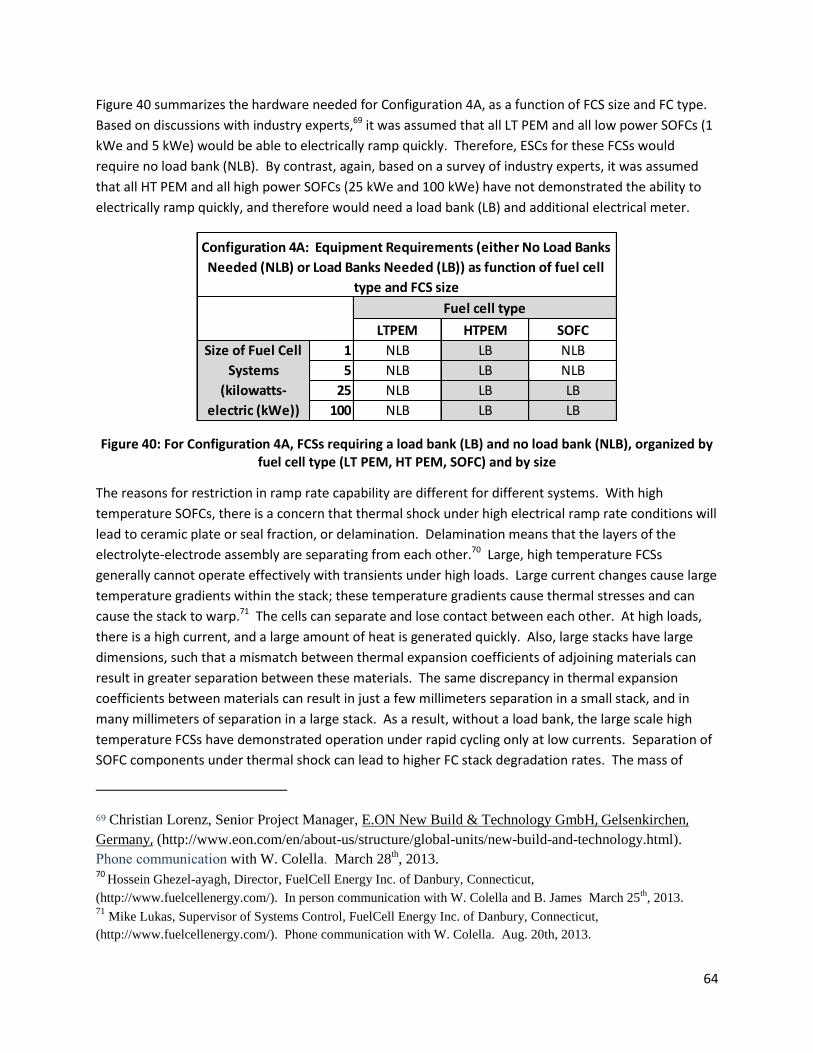
64
Figure 40 summarizes the hardware needed for Configuration 4A, as a function of FCS size and FC type.
Based on discussions with industry experts,69 it was assumed that all LT PEM and all low power SOFCs (1
kWe and 5 kWe) would be able to electrically ramp quickly. Therefore, ESCs for these FCSs would
require no load bank (NLB). By contrast, again, based on a survey of industry experts, it was assumed
that all HT PEM and all high power SOFCs (25 kWe and 100 kWe) have not demonstrated the ability to
electrically ramp quickly, and therefore would need a load bank (LB) and additional electrical meter.
Figure 40: For Configuration 4A, FCSs requiring a load bank (LB) and no load bank (NLB), organized by fuel cell type (LT PEM, HT PEM, SOFC) and by size
The reasons for restriction in ramp rate capability are different for different systems. With high
temperature SOFCs, there is a concern that thermal shock under high electrical ramp rate conditions will
lead to ceramic plate or seal fraction, or delamination. Delamination means that the layers of the
electrolyte-electrode assembly are separating from each other.70 Large, high temperature FCSs
generally cannot operate effectively with transients under high loads. Large current changes cause large
temperature gradients within the stack; these temperature gradients cause thermal stresses and can
cause the stack to warp.71 The cells can separate and lose contact between each other. At high loads,
there is a high current, and a large amount of heat is generated quickly. Also, large stacks have large
dimensions, such that a mismatch between thermal expansion coefficients of adjoining materials can
result in greater separation between these materials. The same discrepancy in thermal expansion
coefficients between materials can result in just a few millimeters separation in a small stack, and in
many millimeters of separation in a large stack. As a result, without a load bank, the large scale high
temperature FCSs have demonstrated operation under rapid cycling only at low currents. Separation of
SOFC components under thermal shock can lead to higher FC stack degradation rates. The mass of
69 Christian Lorenz, Senior Project Manager, E.ON New Build & Technology GmbH, Gelsenkirchen,
Germany, (http://www.eon.com/en/about-us/structure/global-units/new-build-and-technology.html).
Phone communication with W. Colella. March 28th, 2013.
70 Hossein Ghezel-ayagh, Director, FuelCell Energy Inc. of Danbury, Connecticut,
(http://www.fuelcellenergy.com/). In person communication with W. Colella and B. James March 25th
, 2013. 71
Mike Lukas, Supervisor of Systems Control, FuelCell Energy Inc. of Danbury, Connecticut,
(http://www.fuelcellenergy.com/). Phone communication with W. Colella. Aug. 20th, 2013.
LTPEM HTPEM SOFC
1 NLB LB NLB
5 NLB LB NLB
25 NLB LB LB
100 NLB LB LB
Configuration 4A: Equipment Requirements (either No Load Banks
Needed (NLB) or Load Banks Needed (LB)) as function of fuel cell
type and FCS size
Fuel cell type
Size of Fuel Cell
Systems
(kilowatts-
electric (kWe))
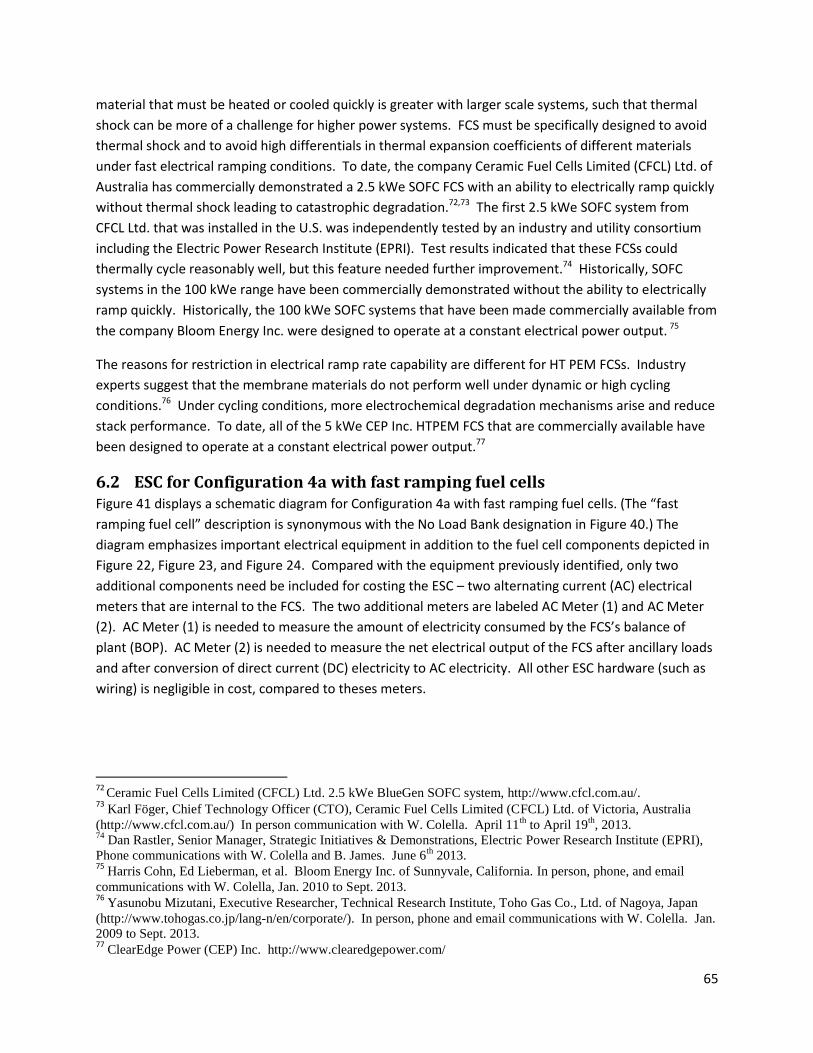
65
material that must be heated or cooled quickly is greater with larger scale systems, such that thermal
shock can be more of a challenge for higher power systems. FCS must be specifically designed to avoid
thermal shock and to avoid high differentials in thermal expansion coefficients of different materials
under fast electrical ramping conditions. To date, the company Ceramic Fuel Cells Limited (CFCL) Ltd. of
Australia has commercially demonstrated a 2.5 kWe SOFC FCS with an ability to electrically ramp quickly
without thermal shock leading to catastrophic degradation.72,73 The first 2.5 kWe SOFC system from
CFCL Ltd. that was installed in the U.S. was independently tested by an industry and utility consortium
including the Electric Power Research Institute (EPRI). Test results indicated that these FCSs could
thermally cycle reasonably well, but this feature needed further improvement.74 Historically, SOFC
systems in the 100 kWe range have been commercially demonstrated without the ability to electrically
ramp quickly. Historically, the 100 kWe SOFC systems that have been made commercially available from
the company Bloom Energy Inc. were designed to operate at a constant electrical power output. 75
The reasons for restriction in electrical ramp rate capability are different for HT PEM FCSs. Industry
experts suggest that the membrane materials do not perform well under dynamic or high cycling
conditions.76 Under cycling conditions, more electrochemical degradation mechanisms arise and reduce
stack performance. To date, all of the 5 kWe CEP Inc. HTPEM FCS that are commercially available have
been designed to operate at a constant electrical power output.77
6.2 ESC for Configuration 4a with fast ramping fuel cells Figure 41 displays a schematic diagram for Configuration 4a with fast ramping fuel cells. (The “fast
ramping fuel cell” description is synonymous with the No Load Bank designation in Figure 40.) The
diagram emphasizes important electrical equipment in addition to the fuel cell components depicted in
Figure 22, Figure 23, and Figure 24. Compared with the equipment previously identified, only two
additional components need be included for costing the ESC – two alternating current (AC) electrical
meters that are internal to the FCS. The two additional meters are labeled AC Meter (1) and AC Meter
(2). AC Meter (1) is needed to measure the amount of electricity consumed by the FCS’s balance of
plant (BOP). AC Meter (2) is needed to measure the net electrical output of the FCS after ancillary loads
and after conversion of direct current (DC) electricity to AC electricity. All other ESC hardware (such as
wiring) is negligible in cost, compared to theses meters.
72
Ceramic Fuel Cells Limited (CFCL) Ltd. 2.5 kWe BlueGen SOFC system, http://www.cfcl.com.au/. 73
Karl Föger, Chief Technology Officer (CTO), Ceramic Fuel Cells Limited (CFCL) Ltd. of Victoria, Australia
(http://www.cfcl.com.au/) In person communication with W. Colella. April 11th
to April 19th
, 2013. 74
Dan Rastler, Senior Manager, Strategic Initiatives & Demonstrations, Electric Power Research Institute (EPRI),
Phone communications with W. Colella and B. James. June 6th
2013. 75
Harris Cohn, Ed Lieberman, et al. Bloom Energy Inc. of Sunnyvale, California. In person, phone, and email
communications with W. Colella, Jan. 2010 to Sept. 2013. 76
Yasunobu Mizutani, Executive Researcher, Technical Research Institute, Toho Gas Co., Ltd. of Nagoya, Japan
(http://www.tohogas.co.jp/lang-n/en/corporate/). In person, phone and email communications with W. Colella. Jan.
2009 to Sept. 2013. 77
ClearEdge Power (CEP) Inc. http://www.clearedgepower.com/
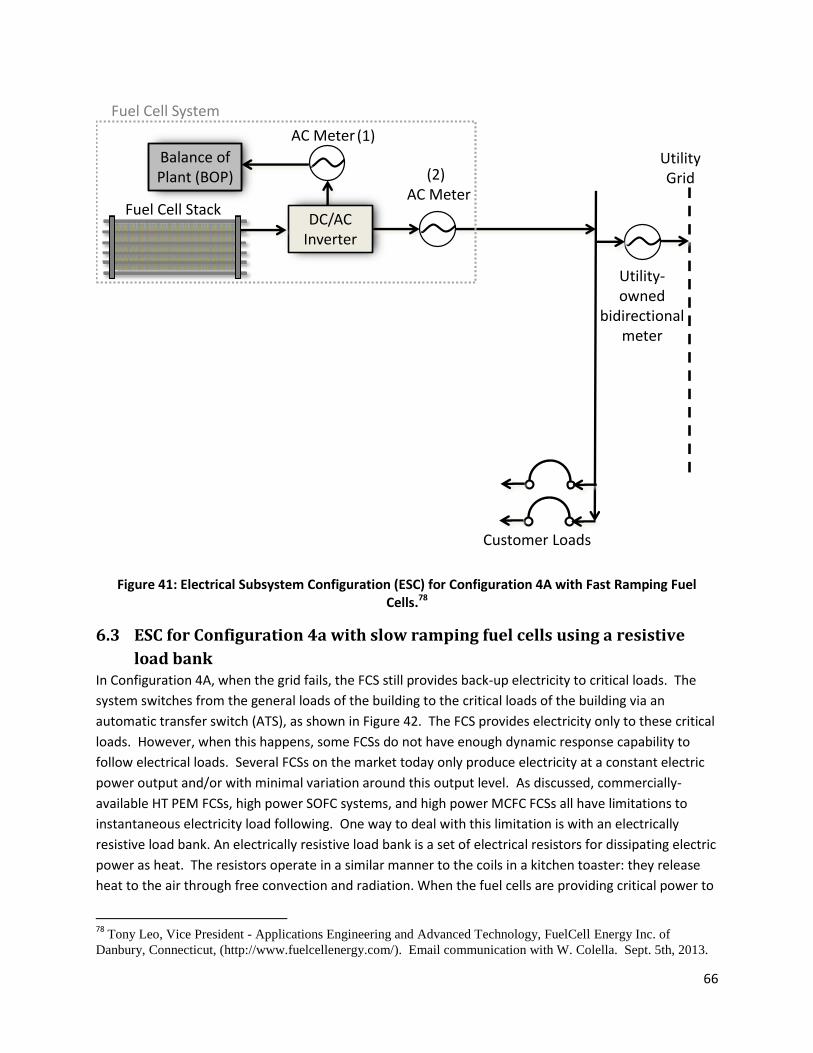
66
Figure 41: Electrical Subsystem Configuration (ESC) for Configuration 4A with Fast Ramping Fuel Cells.78
6.3 ESC for Configuration 4a with slow ramping fuel cells using a resistive
load bank In Configuration 4A, when the grid fails, the FCS still provides back-up electricity to critical loads. The
system switches from the general loads of the building to the critical loads of the building via an
automatic transfer switch (ATS), as shown in Figure 42. The FCS provides electricity only to these critical
loads. However, when this happens, some FCSs do not have enough dynamic response capability to
follow electrical loads. Several FCSs on the market today only produce electricity at a constant electric
power output and/or with minimal variation around this output level. As discussed, commercially-
available HT PEM FCSs, high power SOFC systems, and high power MCFC FCSs all have limitations to
instantaneous electricity load following. One way to deal with this limitation is with an electrically
resistive load bank. An electrically resistive load bank is a set of electrical resistors for dissipating electric
power as heat. The resistors operate in a similar manner to the coils in a kitchen toaster: they release
heat to the air through free convection and radiation. When the fuel cells are providing critical power to
78
Tony Leo, Vice President - Applications Engineering and Advanced Technology, FuelCell Energy Inc. of
Danbury, Connecticut, (http://www.fuelcellenergy.com/). Email communication with W. Colella. Sept. 5th, 2013.
Fuel Cell Stack
Balance of Plant (BOP)
DC/AC Inverter
AC Meter
AC Meter
(1)
(2)
Customer Loads
Utility Grid
Utility-owned
bidirectional meter
Fuel Cell System
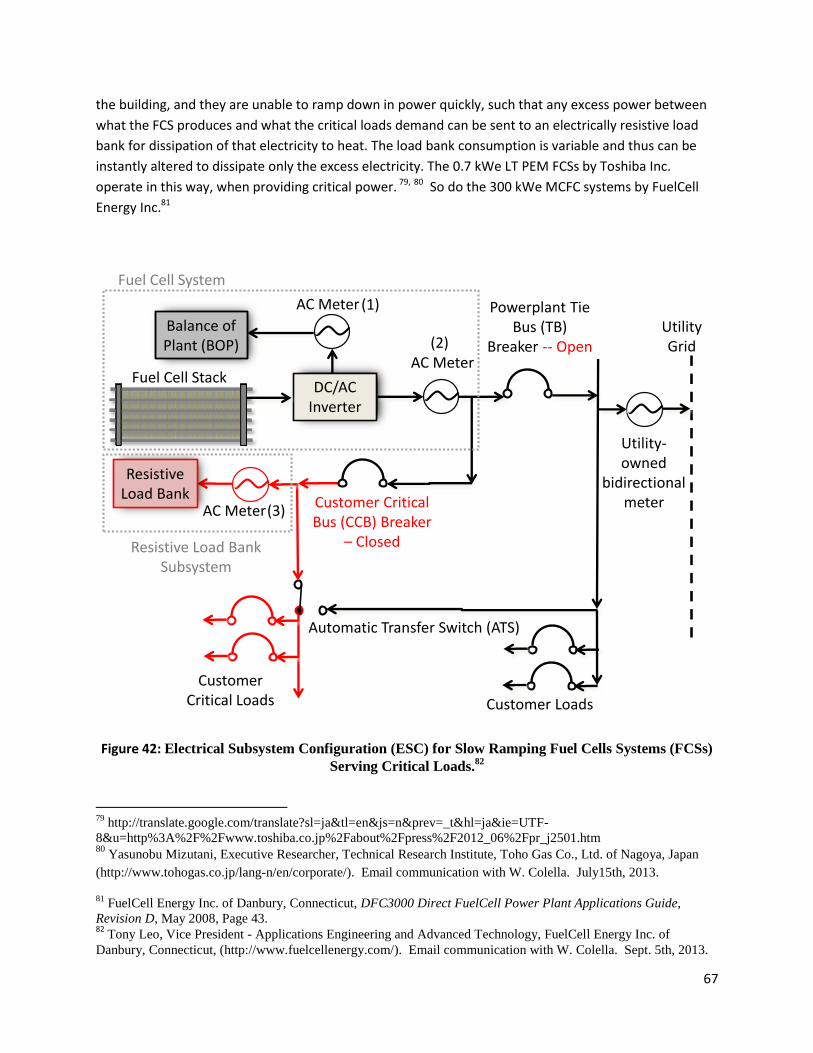
67
the building, and they are unable to ramp down in power quickly, such that any excess power between
what the FCS produces and what the critical loads demand can be sent to an electrically resistive load
bank for dissipation of that electricity to heat. The load bank consumption is variable and thus can be
instantly altered to dissipate only the excess electricity. The 0.7 kWe LT PEM FCSs by Toshiba Inc.
operate in this way, when providing critical power. 79, 80 So do the 300 kWe MCFC systems by FuelCell
Energy Inc.81
Figure 42: Electrical Subsystem Configuration (ESC) for Slow Ramping Fuel Cells Systems (FCSs)
Serving Critical Loads.82
79
http://translate.google.com/translate?sl=ja&tl=en&js=n&prev=_t&hl=ja&ie=UTF-
8&u=http%3A%2F%2Fwww.toshiba.co.jp%2Fabout%2Fpress%2F2012_06%2Fpr_j2501.htm 80
Yasunobu Mizutani, Executive Researcher, Technical Research Institute, Toho Gas Co., Ltd. of Nagoya, Japan
(http://www.tohogas.co.jp/lang-n/en/corporate/). Email communication with W. Colella. July15th, 2013.
81 FuelCell Energy Inc. of Danbury, Connecticut, DFC3000 Direct FuelCell Power Plant Applications Guide,
Revision D, May 2008, Page 43. 82
Tony Leo, Vice President - Applications Engineering and Advanced Technology, FuelCell Energy Inc. of
Danbury, Connecticut, (http://www.fuelcellenergy.com/). Email communication with W. Colella. Sept. 5th, 2013.
Fuel Cell Stack
Balance of Plant (BOP)
DC/AC Inverter
AC Meter
AC Meter
Powerplant Tie Bus (TB)
Breaker -- Open
(1)
(2)
Customer Critical Bus (CCB) Breaker
– Closed
Customer Critical Loads Customer Loads
Automatic Transfer Switch (ATS)
Utility Grid
Utility-owned
bidirectional meter
Fuel Cell System
Resistive Load Bank
AC Meter(3)
Resistive Load Bank Subsystem
68
Figure 42 depicts the critical load scenario with slow ramping FCSs. Traditionally, non-critical loads are
shed mechanically, as shown in Figure 42. When there is a loss of grid power, the power plant tie bus
(TB) breaker is opened; the customer critical bus (CCB) breaker is closed; and the ATS is activated -- all to
disconnect the FCS from the non-critical customer loads and to connect it to the critical customer load
circuit. Figure 42 also shows the electrically resistive load bank and meter needed for the slow ramping
FCSs.
As shown in Figure 42, three AC meters are required in addition to the load bank.
6.4 Critical Power using Other Electrically Resistive Loads, Capacitors, or
Batteries In additional to the dedicated electrically resistive load banks described above, there are different ways
to deal with ‘lack of ramping ability’ of FC stacks. The approach described above is one approach proven
to work in commercial systems. Another approach is to use other electrically resistive loads in a similar
manner to the electrically resistive load banks described above. For example, the Toshiba 0.7 kWe LT
PEM systems use two types of electrically resistive non-critical loads to dissipate electric power: (1) an
electric hot water heater and (2) an air cooling radiator, which consists of an electrically-driven cooling
fan and a heat exchanger to cool hot water.83 The air cooling radiator looks like a cooling fan and a heat
sink for a central processor unit (CPU) of a computer, and only uses 10 to 20W of electric power.84 An
aim of the air cooling radiator is to facilitate continuous operation of the FCS even if there is no heat
demand. While in critical back-up power mode, the FCS generates 350W constantly and any excess
electric power not used by the critical loads will be consumed by these heaters.
An additional method is to use capacitors, which both store and dissipate electricity. The Bloom Energy
Inc. 100 kWe SOFC systems use ultra-capacitors instead of resistors to dissipate power.85 This approach
may be more expensive, and there is a time limitation that results for the period of critical back-up
power. With this approach, the hybrid system could run out of either power supply from the capacitors
or electrical storage capacity (sink).
A third approach is to use batteries to store electrical energy. However, both capacitors and batteries
were considered to be more costly than electrically resistive load banks. Although batteries may be
used in lieu of a resistive load bank, a resistive load bank was judged to be a less costly solution
compared with batteries on a capital cost basis.
83
Yasunobu Mizutani, Executive Researcher, Technical Research Institute, Toho Gas Co., Ltd. of Nagoya, Japan
(http://www.tohogas.co.jp/lang-n/en/corporate/). Email communication with W. Colella. July 23rd, 2013.
84 Yasunobu Mizutani, Executive Researcher, Technical Research Institute, Toho Gas Co., Ltd. of Nagoya, Japan
(http://www.tohogas.co.jp/lang-n/en/corporate/). Email communication with W. Colella. Aug. 21st, 2013. 85
Keith Spitznagel, President, KAS Energy Services, LLC of Pittsburgh, Pennsylvania,
http://kasenergyservices.com/. Phone and email communications with W. Colella. June 13th
2013.
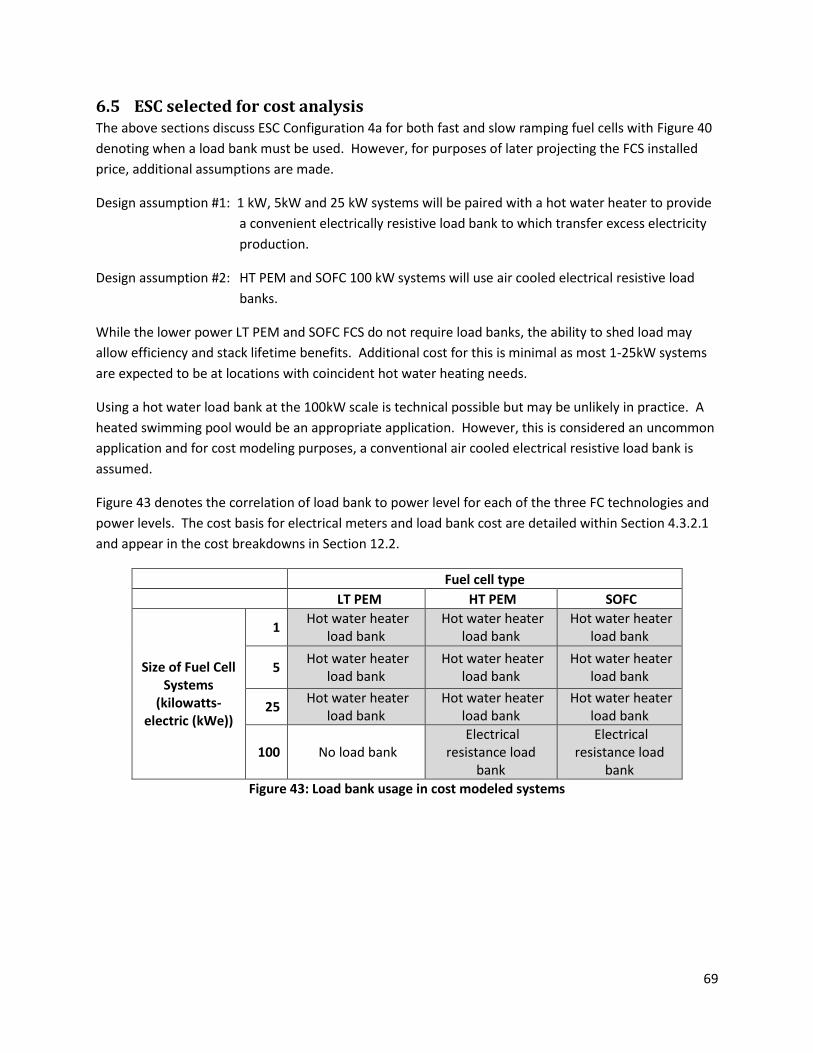
69
6.5 ESC selected for cost analysis The above sections discuss ESC Configuration 4a for both fast and slow ramping fuel cells with Figure 40
denoting when a load bank must be used. However, for purposes of later projecting the FCS installed
price, additional assumptions are made.
Design assumption #1: 1 kW, 5kW and 25 kW systems will be paired with a hot water heater to provide
a convenient electrically resistive load bank to which transfer excess electricity
production.
Design assumption #2: HT PEM and SOFC 100 kW systems will use air cooled electrical resistive load
banks.
While the lower power LT PEM and SOFC FCS do not require load banks, the ability to shed load may
allow efficiency and stack lifetime benefits. Additional cost for this is minimal as most 1-25kW systems
are expected to be at locations with coincident hot water heating needs.
Using a hot water load bank at the 100kW scale is technical possible but may be unlikely in practice. A
heated swimming pool would be an appropriate application. However, this is considered an uncommon
application and for cost modeling purposes, a conventional air cooled electrical resistive load bank is
assumed.
Figure 43 denotes the correlation of load bank to power level for each of the three FC technologies and
power levels. The cost basis for electrical meters and load bank cost are detailed within Section 4.3.2.1
and appear in the cost breakdowns in Section 12.2.
Fuel cell type
LT PEM HT PEM SOFC
Size of Fuel Cell Systems
(kilowatts-electric (kWe))
1 Hot water heater
load bank Hot water heater
load bank Hot water heater
load bank
5 Hot water heater
load bank Hot water heater
load bank Hot water heater
load bank
25 Hot water heater
load bank Hot water heater
load bank Hot water heater
load bank
100 No load bank Electrical
resistance load bank
Electrical resistance load
bank
Figure 43: Load bank usage in cost modeled systems
70
7 Manufacturer Markup Rate (to Convert FCS Cost into FCS Price) Section 9 details FCS costs for the three FC technologies. However, those costs are not the only
expenses borne by the manufacturer that will be passed along to the FCS buyer. In addition to direct
material and manufacturing expenses are business expenses for:
General and Administrative (G&A) costs (corporate staff, legal, accounting, etc.)
Research and Development (R&D) costs
Company profit
Scrap (at the system level)
Warranty expenses
Advertising expenses
Taxes
Any and all other expenses to operate a successful company
These expenses are generally enumerated in a company’s annual financial report or business plan and
can be represented as a markup rate (expenses as % of the direct material/manufacturing cost) or as a
gross margin (expenses as a % of the net revenues of the company). Markup rates (and gross margins)
vary considerably between industries, company sizes, and company life-stages (i.e. start-up vs. mature
businesses). An argument could be made for applying a sliding scale of markup rates within the cost
analysis, with a higher markup applied at low FCS production rates and a lower markup applied at high
production rates. However, to reduce complexity a single markup rate of 50% is selected for all FC
technologies and production rates. A 50% markup rate correlates to a 33% gross margin and is
representative of a mature established business. The assumption of a constant markup rate is
consistent with the business scenario in which the company has multiple product lines such that the
revenue differences between FCS production rates does not materially impact the company’s business
efficiency (because FCS revenue is a small percentage of overall company revenue).
Non-recurring engineering (NRE) and warranty expenses cause difficulties in the projection of markup
rate. Recovery of NRE may be primarily determined by the market place and level of industry cost
competition. Warranty expenses can vary widely from company to company and are often poorly
quantified for new products or technologies. For these reasons, the 50% markup rate is meant to be a
representative value with no explicit modeling of NRE or warranty.
71
8 Installation Cost
Fuel cell system installation cost, i.e. the cost to site and connect the fuel cell system to its power load,
can be a significant cost element of total installed FCS price. Past studies either ignore installation cost
or represent it as a nominal percentage of base FCS cost. To more fully explore the cost impact, a
ground up DFMA analysis of installation cost was conducted, specifically focused on CHP FCS
applications. Details of this study are reported in James 201586 and are summarized below.
8.1 Installation Cost Analysis Methodology The installation cost analysis builds on past work by the authors87 analyzing FCS installation cost at
system power levels from 1kW to 100kW. The fuel cell systems envisioned are Combined Heat and
Power (CHP) units, meaning that fuel cell waste heat is captured and used for building heating.
Installation of CHP FCS is an extra layer of installation complication as a hot exhaust gas connection to
the building must be made in addition to the electrical connection. To simplify this impact, a sub-set of
CHP systems is solely considered: CHP FCS wherein waste heat is supplied to heat hot water.88
Because the FCS electrical power range is 1-100kW, installation analysis is conducted with primarily
residential and small office building applications in mind: residential townhouses, single family homes,
or groupings of homes for the 1-25kW power level and apartment building and small offices for 100kW.
However, the analysis does not assess the building application in detail. Thus the results should be
considered as applicable to a range of building types.
The analysis applies a Design for Manufacturing and Assembly (DFMA®) cost estimation methodology.
This approach is typically applied to hardware devices or systems, rather than installation or electrical
connection projects. However, the DFMA® methodology is process-based and thus its core approach of
assessing cost by modeling the materials consumed and labor times of each activity, is equally
appropriate to evaluation of FCS installation cost.
Past examination of installation cost have indicated a wide range of potential costs.89 This analysis
likewise finds high variability. To better quantify the cost impacts, a scenario based approach is applied.
“Easy” and “Difficult” scenarios are envisioned with “Easy” representing new-construction with easy-
access and “Difficult” representing home renovations with less-access. Furthermore, each category is
subdivided into Low, Mid, and High sub-categories to allow consideration of a range of values for each 86
James, B.D., DeSantis, D.A., “Installation Cost Analysis of Stationary Fuel Cell Systems,” Strategic Analysis Inc., under sub-contract to the National Renewable Energy Laboratory, 30 September 2015. 87
Colella, W.G., James, B.D., “Assessing Electrical Sub-system Configurations and Installation Costs for Stationary Fuel Cell Systems,” Strategic Analysis Inc., under sub-contract to the National Renewable Energy Laboratory, 9 September 2013. 88
The other main CHP thermal linkage to the building is to use FCS waste heat to heat hot air for the building. However, this is more complicated as it requires more intrusive intra-building ducting that does a hot water system. 89
Colella, W.G., James, B.D., “Assessing Electrical Sub-system Configurations and Installation Costs for Stationary Fuel Cell Systems,” Strategic Analysis Inc., under sub-contract to the National Renewable Energy Laboratory, 9 September 2013.
72
parameter. Thus a representative set of three values may be assigned to each parameter for each
category e.g. the length of a wiring run might be 1/3/5 meters representing Low/Mid/High for the
“Easy” scenario and 5/10/15 meters for the “Difficult” scenario. In this manner, a range of installation
costs may be assessed for each power level and Easy/Difficult scenario.
Additionally, Monte Carlo analysis is applied to determine the mostly likely installation costs for set of
possibilities. The Low/Mid/High analysis returns installation cost for the case when all parameters have
simultaneously low, medium, or high value. Such an alignment of parameter values is unlikely.
Consequently, use of Monte Carlo analysis allows determination of what is most probable.
To narrow the breadth of analysis options (already quite wide as discussed above), the installation
analysis is conducted from the vantage point of an FCS which is:
based on solid oxide fuel cell (SOFC) technology,
operating on pipeline natural gas,
producing AC power,
connected to the electrical grid, and
contains a combined heat and power (CHP) capability where excess heat and energy is supplied to the building hot water heater.
These FCS assumptions are vital to define as they significantly impact installation cost. Additionally,
their specification allows the reader to qualitatively (and potentially quantitatively) assess how the
installation costs of alternate FCS would be affected.
Figure 44 summarizes each of the cost subcategories which are summed to determine installation cost.
Additionally the figure details the costing parameters for each subcategory. Subcategories are generally
kept consistent with those used within the previous Installation Report (Colella 2013), although some
differences exist.
Note that the electrical inverter (needed to convert fuel cell direct current (DC) to alternating current
(AC) is not included in the installation cost as it is in some tabulations. Rather, inverter cost is included
in the fuel cell capital cost.
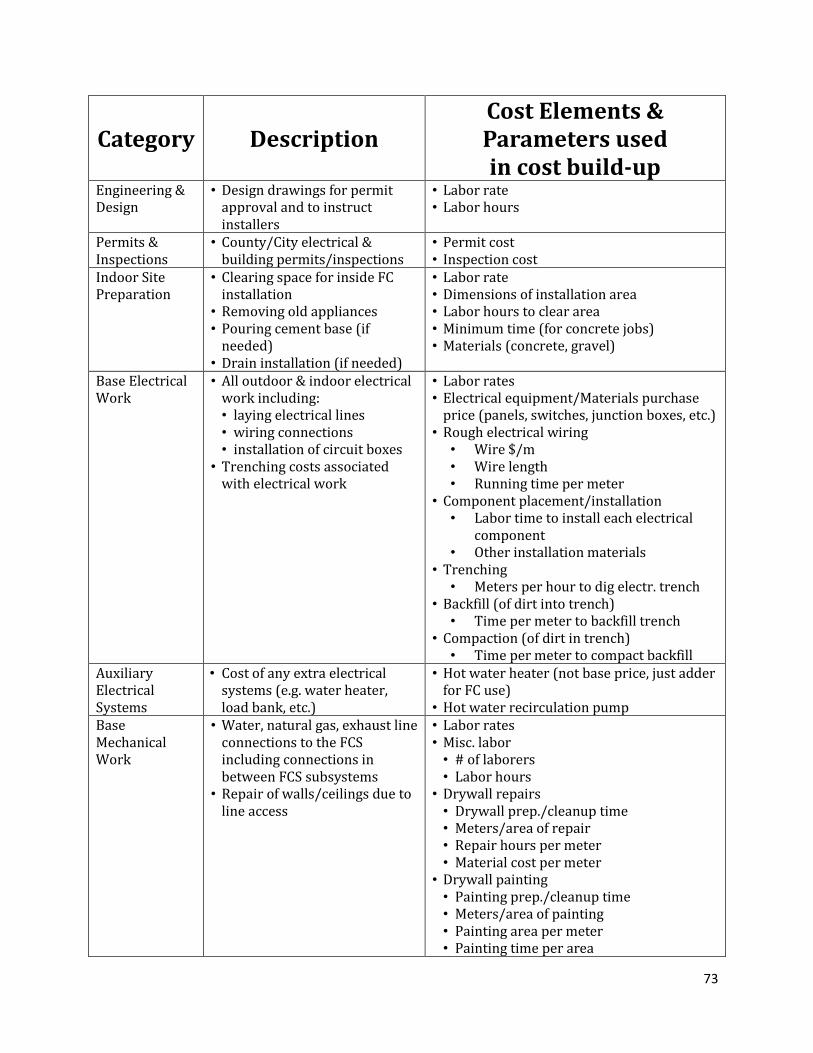
73
Category Description Cost Elements & Parameters used in cost build-up
Engineering & Design
• Design drawings for permit approval and to instruct installers
• Labor rate • Labor hours
Permits & Inspections
• County/City electrical & building permits/inspections
• Permit cost • Inspection cost
Indoor Site Preparation
• Clearing space for inside FC installation
• Removing old appliances • Pouring cement base (if
needed) • Drain installation (if needed)
• Labor rate • Dimensions of installation area • Labor hours to clear area • Minimum time (for concrete jobs) • Materials (concrete, gravel)
Base Electrical Work
• All outdoor & indoor electrical work including: • laying electrical lines • wiring connections • installation of circuit boxes
• Trenching costs associated with electrical work
• Labor rates • Electrical equipment/Materials purchase
price (panels, switches, junction boxes, etc.) • Rough electrical wiring
• Wire $/m • Wire length • Running time per meter
• Component placement/installation • Labor time to install each electrical
component • Other installation materials
• Trenching • Meters per hour to dig electr. trench
• Backfill (of dirt into trench) • Time per meter to backfill trench
• Compaction (of dirt in trench) • Time per meter to compact backfill
Auxiliary Electrical Systems
• Cost of any extra electrical systems (e.g. water heater, load bank, etc.)
• Hot water heater (not base price, just adder for FC use)
• Hot water recirculation pump Base Mechanical Work
• Water, natural gas, exhaust line connections to the FCS including connections in between FCS subsystems
• Repair of walls/ceilings due to line access
• Labor rates • Misc. labor • # of laborers • Labor hours
• Drywall repairs • Drywall prep./cleanup time • Meters/area of repair • Repair hours per meter • Material cost per meter
• Drywall painting • Painting prep./cleanup time • Meters/area of painting • Painting area per meter • Painting time per area
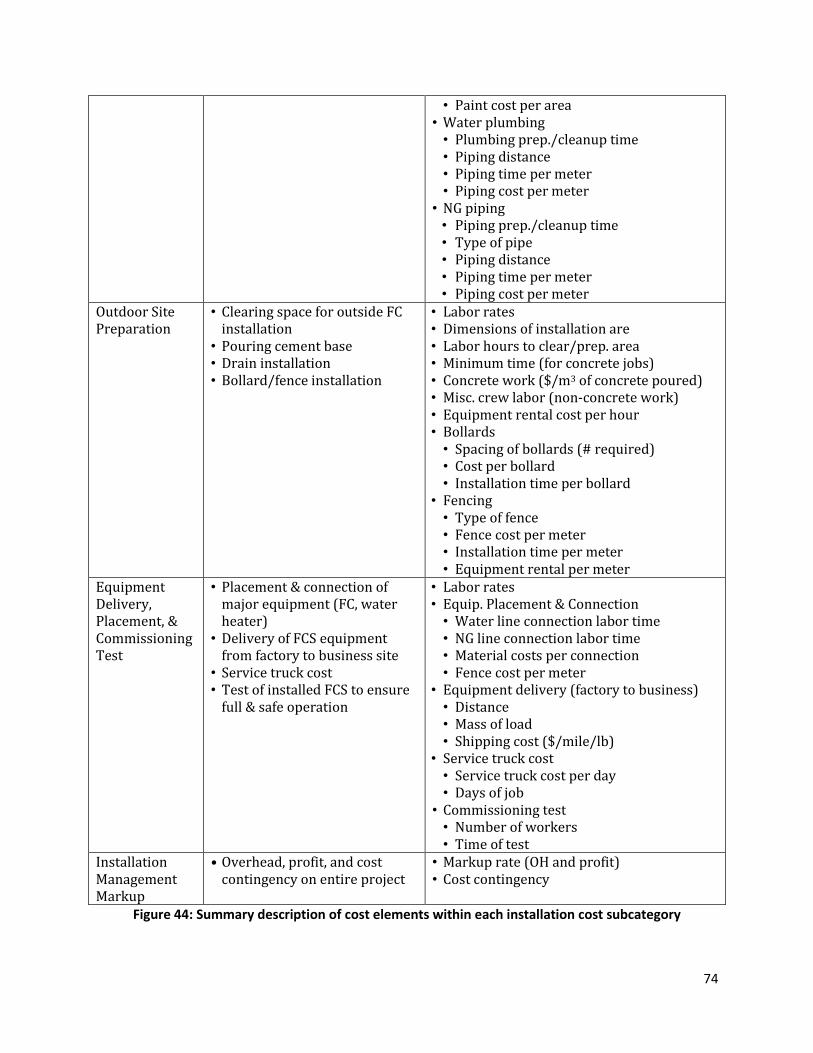
74
• Paint cost per area • Water plumbing • Plumbing prep./cleanup time • Piping distance • Piping time per meter • Piping cost per meter
• NG piping • Piping prep./cleanup time • Type of pipe • Piping distance • Piping time per meter • Piping cost per meter
Outdoor Site Preparation
• Clearing space for outside FC installation
• Pouring cement base • Drain installation • Bollard/fence installation
• Labor rates • Dimensions of installation are • Labor hours to clear/prep. area • Minimum time (for concrete jobs) • Concrete work ($/m3 of concrete poured) • Misc. crew labor (non-concrete work) • Equipment rental cost per hour • Bollards • Spacing of bollards (# required) • Cost per bollard • Installation time per bollard
• Fencing • Type of fence • Fence cost per meter • Installation time per meter • Equipment rental per meter
Equipment Delivery, Placement, & Commissioning Test
• Placement & connection of major equipment (FC, water heater)
• Delivery of FCS equipment from factory to business site
• Service truck cost • Test of installed FCS to ensure
full & safe operation
• Labor rates • Equip. Placement & Connection • Water line connection labor time • NG line connection labor time • Material costs per connection • Fence cost per meter
• Equipment delivery (factory to business) • Distance • Mass of load • Shipping cost ($/mile/lb)
• Service truck cost • Service truck cost per day • Days of job
• Commissioning test • Number of workers • Time of test
Installation Management Markup
• Overhead, profit, and cost contingency on entire project
• Markup rate (OH and profit) • Cost contingency
Figure 44: Summary description of cost elements within each installation cost subcategory
75
As is clear from Figure 44, numerous empirical parameters are used to estimate the cost of each
installation activity. To avoid the “Garbage In, Garbage Out” paradigm, it is vital to obtain realistic
values for each. Fortunately, a series of handbooks by the Craftsman Book Company90 painstakingly
collects and documents data for hundreds of construction and home improvement activities. These
empirical books are directly analogous to the Chilton automotive repair guides91 which enumerate the
average labor hours to conduct many auto repair/part-replacement activities. While the Chilton books
tailor the labor hour estimates to specific cars, the Craftsman books include category differentiations
such as different painting times based on application method (brush, roller, spray), type of surface
painted, first or second coat, type of paint, and painting speed (slow, medium, fast). Labor costs are
tabulated by class of worker (electrician, plumber, heavy construction, etc.) and residential vs.
commercial. Labor rate data averages are provided for each state, and for each county within each
state, thereby allowing regional differences as well as low/high ranges to be assessed.
8.2 Installation Cost Result Summary Summary installation cost results are shown in Figure 45 and Figure 46. Only a simplified set of results
are displayed, with additional results available in James 2015. The simplified results correspond to the
average of the “Easy” and “Difficult” installation scenarios, with error bars determined by Monte Carlo
analysis. Thus the error bars represent the 5% and 95% confidence limits on installation price, with the
nominal installation price being the average of the “Easy” and “Difficult” mean values.
These simplified installation cost results are used in the Section 9 computation of FCS installed price.
Note that the installation “costs” are actually “prices” as they contain markup and profit for the
installation company (which is at a different set of rates than the FCS manufacturer).
90
The Craftsman Book Company carries a line of print and electronic cost estimating guides. http://craftsman-book.com 91
Chilton Labor Guides, http://chilton.cengage.com/home/pro
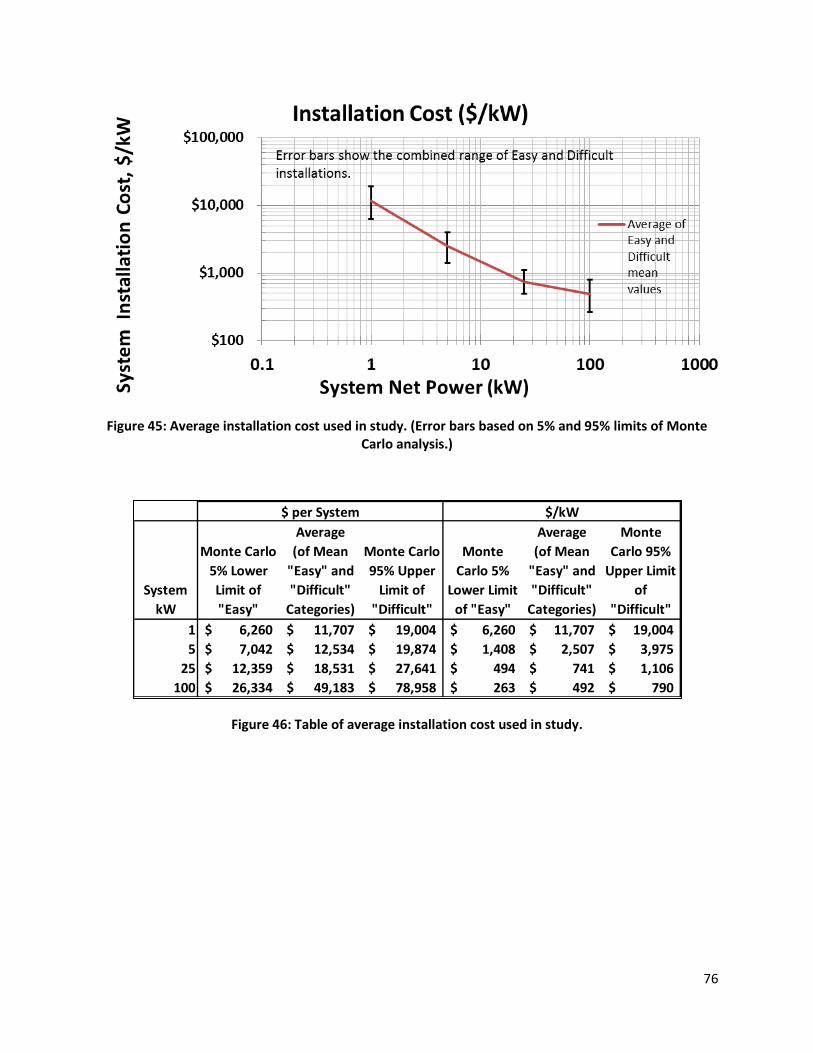
76
Figure 45: Average installation cost used in study. (Error bars based on 5% and 95% limits of Monte Carlo analysis.)
Figure 46: Table of average installation cost used in study.
System
kW
Monte Carlo
5% Lower
Limit of
"Easy"
Average
(of Mean
"Easy" and
"Difficult"
Categories)
Monte Carlo
95% Upper
Limit of
"Difficult"
Monte
Carlo 5%
Lower Limit
of "Easy"
Average
(of Mean
"Easy" and
"Difficult"
Categories)
Monte
Carlo 95%
Upper Limit
of
"Difficult"
1 6,260$ 11,707$ 19,004$ 6,260$ 11,707$ 19,004$
5 7,042$ 12,534$ 19,874$ 1,408$ 2,507$ 3,975$
25 12,359$ 18,531$ 27,641$ 494$ 741$ 1,106$
100 26,334$ 49,183$ 78,958$ 263$ 492$ 790$
$ per System $/kW
77
9 System Cost and Price Results
The cost analysis yields results detailing the final estimated installed price of entire fuel cell power
systems, at different annual manufacturing rates and installed capacities. Results also indicate the
proportion of capital cost attributable to each subsystem and subsystem component.
Modeling results for LT PEM, HT PEM, and SOFC systems underscore a few salient points:
SOFC systems are projected to have the lowest system capital cost of the three technologies
examined.
As system size and system manufacturing rate increase, system cost decreases.
In comparing the effect of system size and manufacturing rate on capital cost, increasing system
size appears to have a greater impact on reducing costs per kilowatt than increasing
manufacturing rate over the range of values plotted.
For the same cumulative global installed capacity in a given year, FCSs with a higher electrical
power output are several times more economical per kilowatt of electric power than systems
with a lower power output.
Installation cost can be a major cost contributor to system price and has a larger effect at low
system powers than at high system powers.
Installation costs, sales markup, and power electronics typically amount to more than half of
total installed price.
The core subsystems (FC and FP) typically amount to <30% of total installed price.
The primary cost drivers for the FP BOP vary more with system size than with manufacturing
rate.
The primary cost drivers for the FP BOP may include NG compressors/blowers, water pumps,
flammable gas alarm sensors, gas flow control solenoids, pressure regulators, and/or
condensers, depending on fuel cell system size and type.
A substantial quantity of cost results are generated from the analysis since there are three technologies,
four system power levels, and four annual manufacturing rates (plus the lower level costs associated
with the eight major subsystems and the individual components of each subsystem). Consequently, to
aid in the analysis of these data, graphical data (column and pie charts) are presented in this section,
and tabular detailed information are presented in the report appendices. Furthermore, only the
“corners” of the data range (i.e. the lowest (1kWe) and highest (100kWe) power levels and the lowest
(100 systems/year) and highest (50k systems/year) manufacturing rates) are graphically displayed to
illustrate trends without overwhelming the reader with repetitive charts. Data for all systems is
contained in the appendices.
9.1 LT PEM Costs
9.1.1 LT PEM System Price Projections
Figure 47 and Figure 48 display the final results for the LT PEM system broken down by system size and
manufacturing rate. As shown in the figures, the system installed price per unit of electric output
78
($/kWe) is seen to decrease dramatically both with increasing system size and increasing system annual
production rate. As system size and system manufacturing rate increase, system price decreases. In
comparing the effect of system size and manufacturing rate on system installed cost, increasing system
size appears to have a greater impact on reducing costs than increasing manufacturing rate over the
range of values plotted. In comparing an increase in system size of 100 fold (moving from 1 kWe to 100
kWe) and an increase in manufacturing rate of 100 fold (moving from 100 systems per year to 10,000
systems per year), there is a greater reduction in system installed price from increasing system size (an
average decrease of 93% over the range of plotted values) than from increasing manufacturing rate (an
average decrease of only 27%). This advantage is likewise observed for total cost comparisons.
Model results indicate that, at the same cumulative global installed capacity, higher power FCSs are
expected to have lower per unit capital costs ($/kWe) than lower power FCSs. For the same cumulative
global installed capacity in a given year, FCSs with a higher electrical power output are several times
more economical per kilowatt of electric power than systems with a lower power output. This
observation is shown in Figure 47 and Figure 48. For example, for a 10,000 kWe global installed capacity
in one year, 100 kWe systems are 10% of the cost of 1 kWe systems ($2,278/kWe vs. $23,051/kWe). For
a 50,000 kWe global installed capacity in one year, 5 kWe systems are 29% of the cost of 1 kWe systems
($6,371/kWe vs. $22,141/kWe). For a 250,000 kWe global installed capacity in one year, 25 kWe
systems are 40% of the cost of 5 kWe systems ($2,411/kWe vs. $5,988/kWe). This analysis implicitly
assumes that the FCS electricity and heat will be used with 100% utilization in the buildings that they
serve, regardless of system size. In practice, lower power FCSs may experience different utilizations.92,93
Also, the total market volume for lower power FCSs may be larger, allowing for higher production rates.
It can be informative to compare modeled values with current manufacturer values. The ENE Farm
Program has deployed several thousand ~1 kWe LT PEM CHP systems in Japanese homes since 2005.94
The combined capital and installation costs for these systems are roughly $43,000/kWe for Toshiba Inc.
LTPEM CHP systems, $40,000/kWe for JX Oil & Energy Inc. LTPEM CHP systems, and $30,000/kWe for
Panasonic Inc. LTPEM CHP systems at production rates of several thousand 1 kWe units per year.95, 96
This compares to this analysis’ projection of ~$28,000/kWe at 100 systems per year and ~$25,000/kWe
at 1,000 systems per year. Note also that these modeling projections are based on a constant
manufacturer’s markup of 50%. While this estimated percentage is meant to be representative, many
92
Colella, W.G. and Srivastava, V., 2012, “Examining the Integration of Fuel Cell Systems Into Buildings Through Simulation,” Proceedings of the ASME 2012 10th Fuel Cell Science, Engineering and Technology Conference, July 23-26, 2012, San Diego, CA, USA. ESFuelCell2012-91474. PNNL-SA-87066. 93
Colella, W.G. and Pilli, S.P., 2012, “Independent Evaluation of Micro-Cogenerative Fuel Cell Systems For Commercial Buildings,” Proceedings of the ASME 2012 10th Fuel Cell Science, Engineering and Technology Conference, July 23-26, 2012, San Diego, CA, USA. ESFuelCell2012-91479. PNNL-SA-84709. 94
ASME Fuel Cell Conference 2011, Keynote Presentation by ToHo Gas Company. 95
Colella, W.G. and Pilli, S.P., 2012, “Energy System and Thermoeconomic Analysis of Combined Heat and Power (CHP) High Temperature Proton Exchange Membrane (HTPEM) Fuel Cell Systems (FCSs) for Light Commercial Buildings,” ASME Journal of Fuel Cell Science and Technology, (in print). PNNL-SA-86986. Fig. 11. 96
Colella, W.G. and Pilli, S.P., 2012, “Independent Evaluation of Micro-Cogenerative Fuel Cell Systems For Commercial Buildings,” Proceedings of the ASME 2012 10th Fuel Cell Science, Engineering and Technology Conference, July 23-26, 2012, San Diego, CA, USA. ESFuelCell2012-91479. PNNL-SA-84709. Fig. 11.
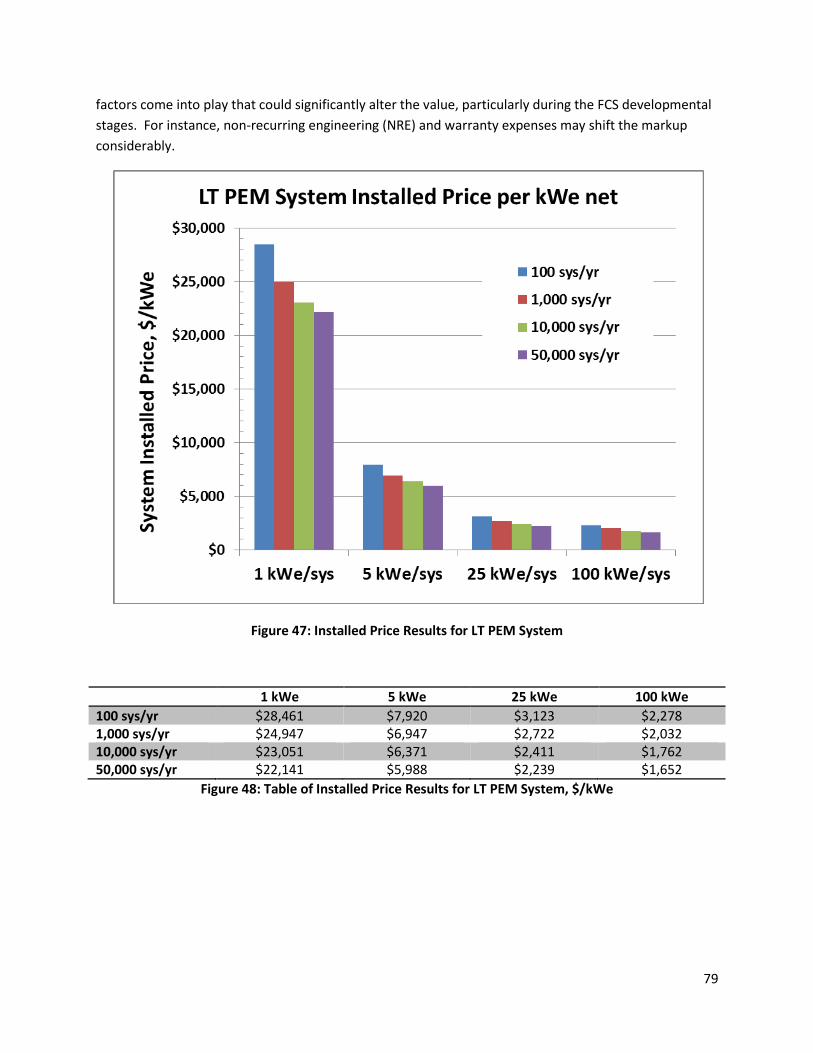
79
factors come into play that could significantly alter the value, particularly during the FCS developmental
stages. For instance, non-recurring engineering (NRE) and warranty expenses may shift the markup
considerably.
Figure 47: Installed Price Results for LT PEM System
1 kWe 5 kWe 25 kWe 100 kWe
100 sys/yr $28,461 $7,920 $3,123 $2,278 1,000 sys/yr $24,947 $6,947 $2,722 $2,032 10,000 sys/yr $23,051 $6,371 $2,411 $1,762 50,000 sys/yr $22,141 $5,988 $2,239 $1,652
Figure 48: Table of Installed Price Results for LT PEM System, $/kWe
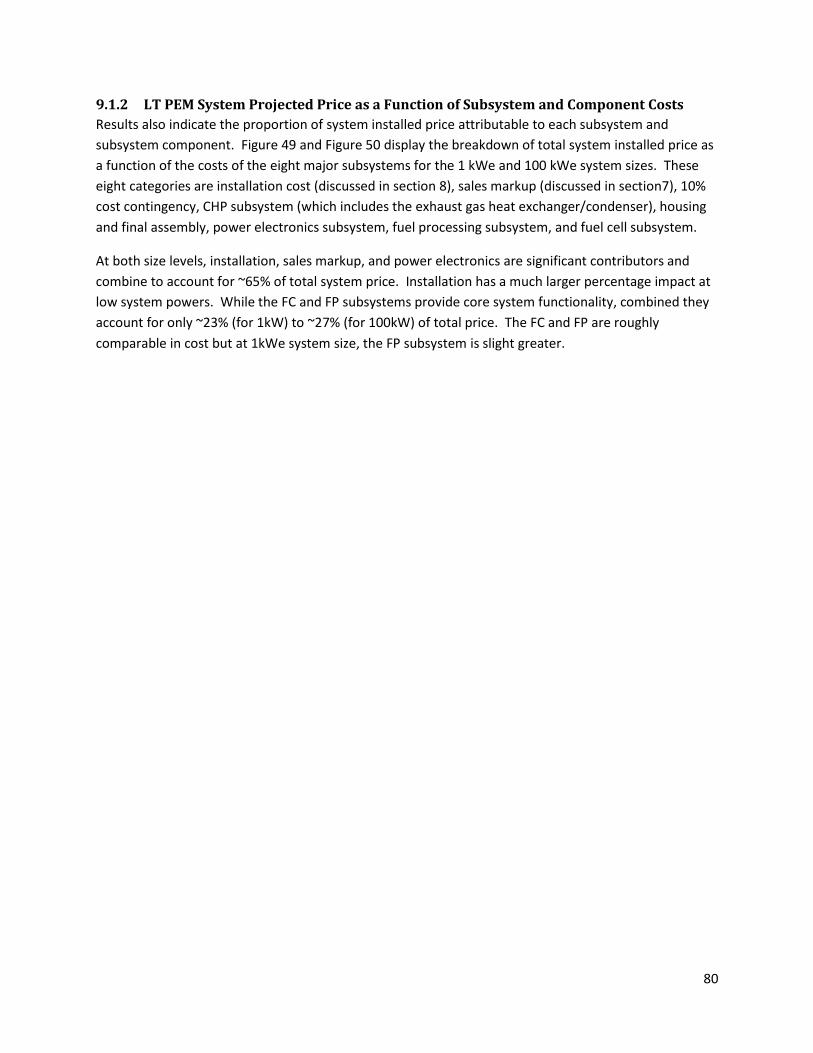
80
9.1.2 LT PEM System Projected Price as a Function of Subsystem and Component Costs
Results also indicate the proportion of system installed price attributable to each subsystem and
subsystem component. Figure 49 and Figure 50 display the breakdown of total system installed price as
a function of the costs of the eight major subsystems for the 1 kWe and 100 kWe system sizes. These
eight categories are installation cost (discussed in section 8), sales markup (discussed in section7), 10%
cost contingency, CHP subsystem (which includes the exhaust gas heat exchanger/condenser), housing
and final assembly, power electronics subsystem, fuel processing subsystem, and fuel cell subsystem.
At both size levels, installation, sales markup, and power electronics are significant contributors and
combine to account for ~65% of total system price. Installation has a much larger percentage impact at
low system powers. While the FC and FP subsystems provide core system functionality, combined they
account for only ~23% (for 1kW) to ~27% (for 100kW) of total price. The FC and FP are roughly
comparable in cost but at 1kWe system size, the FP subsystem is slight greater.
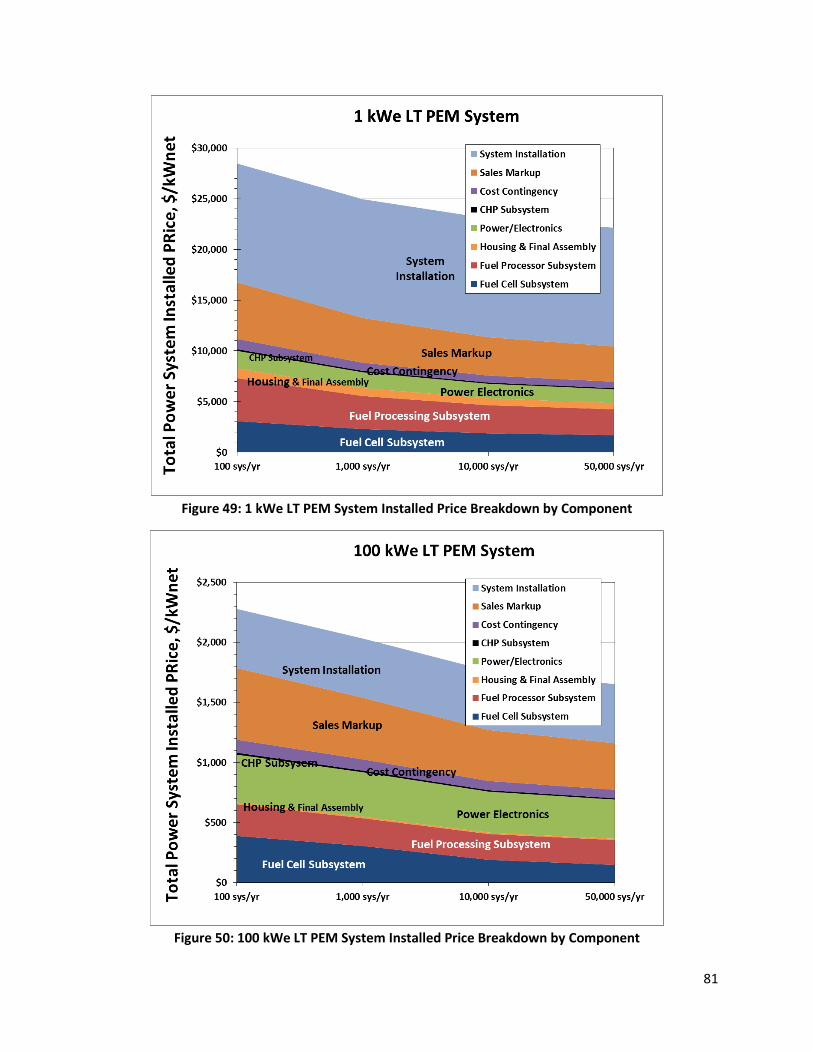
81
Figure 49: 1 kWe LT PEM System Installed Price Breakdown by Component
Figure 50: 100 kWe LT PEM System Installed Price Breakdown by Component
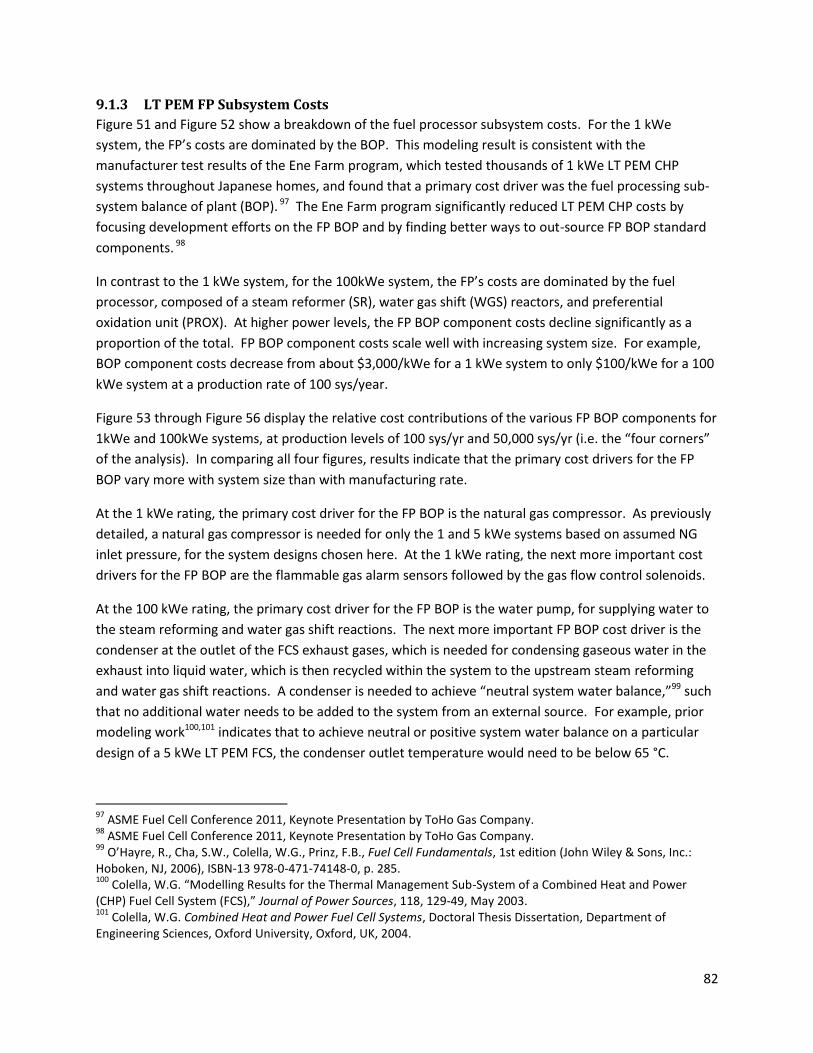
82
9.1.3 LT PEM FP Subsystem Costs
Figure 51 and Figure 52 show a breakdown of the fuel processor subsystem costs. For the 1 kWe
system, the FP’s costs are dominated by the BOP. This modeling result is consistent with the
manufacturer test results of the Ene Farm program, which tested thousands of 1 kWe LT PEM CHP
systems throughout Japanese homes, and found that a primary cost driver was the fuel processing sub-
system balance of plant (BOP). 97 The Ene Farm program significantly reduced LT PEM CHP costs by
focusing development efforts on the FP BOP and by finding better ways to out-source FP BOP standard
components. 98
In contrast to the 1 kWe system, for the 100kWe system, the FP’s costs are dominated by the fuel
processor, composed of a steam reformer (SR), water gas shift (WGS) reactors, and preferential
oxidation unit (PROX). At higher power levels, the FP BOP component costs decline significantly as a
proportion of the total. FP BOP component costs scale well with increasing system size. For example,
BOP component costs decrease from about $3,000/kWe for a 1 kWe system to only $100/kWe for a 100
kWe system at a production rate of 100 sys/year.
Figure 53 through Figure 56 display the relative cost contributions of the various FP BOP components for
1kWe and 100kWe systems, at production levels of 100 sys/yr and 50,000 sys/yr (i.e. the “four corners”
of the analysis). In comparing all four figures, results indicate that the primary cost drivers for the FP
BOP vary more with system size than with manufacturing rate.
At the 1 kWe rating, the primary cost driver for the FP BOP is the natural gas compressor. As previously
detailed, a natural gas compressor is needed for only the 1 and 5 kWe systems based on assumed NG
inlet pressure, for the system designs chosen here. At the 1 kWe rating, the next more important cost
drivers for the FP BOP are the flammable gas alarm sensors followed by the gas flow control solenoids.
At the 100 kWe rating, the primary cost driver for the FP BOP is the water pump, for supplying water to
the steam reforming and water gas shift reactions. The next more important FP BOP cost driver is the
condenser at the outlet of the FCS exhaust gases, which is needed for condensing gaseous water in the
exhaust into liquid water, which is then recycled within the system to the upstream steam reforming
and water gas shift reactions. A condenser is needed to achieve “neutral system water balance,”99 such
that no additional water needs to be added to the system from an external source. For example, prior
modeling work100,101 indicates that to achieve neutral or positive system water balance on a particular
design of a 5 kWe LT PEM FCS, the condenser outlet temperature would need to be below 65 °C.
97
ASME Fuel Cell Conference 2011, Keynote Presentation by ToHo Gas Company. 98
ASME Fuel Cell Conference 2011, Keynote Presentation by ToHo Gas Company. 99
O’Hayre, R., Cha, S.W., Colella, W.G., Prinz, F.B., Fuel Cell Fundamentals, 1st edition (John Wiley & Sons, Inc.: Hoboken, NJ, 2006), ISBN-13 978-0-471-74148-0, p. 285. 100
Colella, W.G. “Modelling Results for the Thermal Management Sub-System of a Combined Heat and Power (CHP) Fuel Cell System (FCS),” Journal of Power Sources, 118, 129-49, May 2003. 101
Colella, W.G. Combined Heat and Power Fuel Cell Systems, Doctoral Thesis Dissertation, Department of Engineering Sciences, Oxford University, Oxford, UK, 2004.
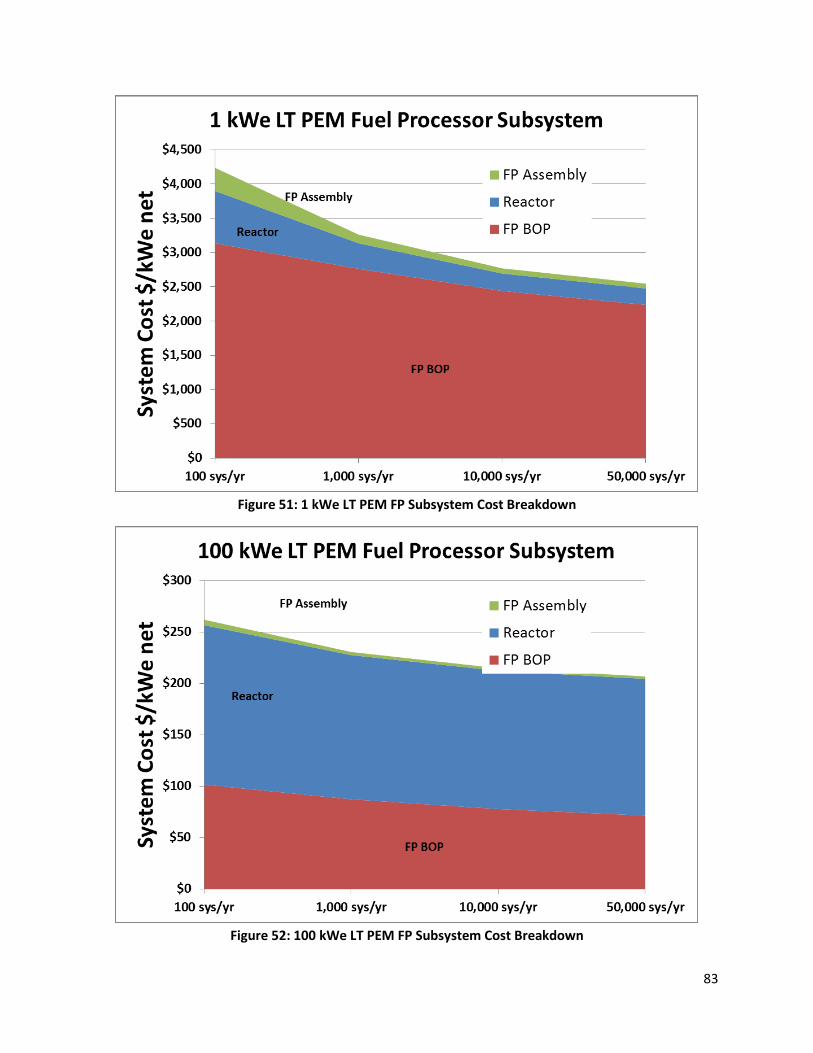
83
Figure 51: 1 kWe LT PEM FP Subsystem Cost Breakdown
Figure 52: 100 kWe LT PEM FP Subsystem Cost Breakdown
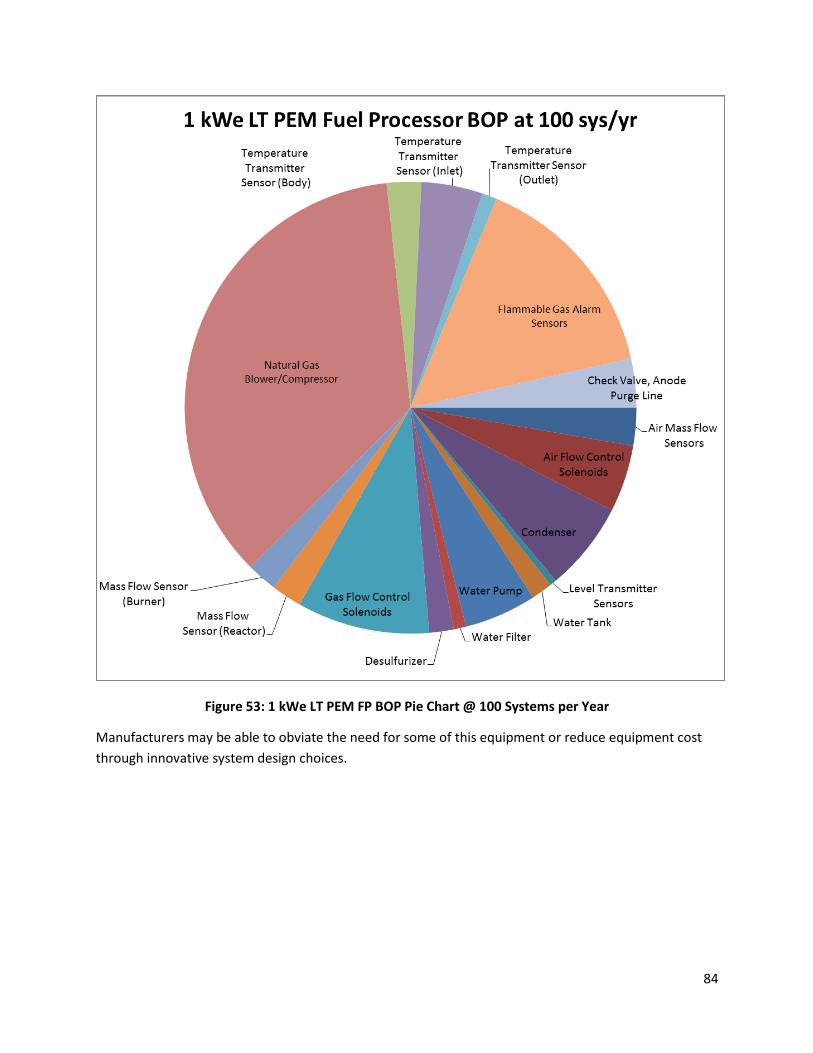
84
Figure 53: 1 kWe LT PEM FP BOP Pie Chart @ 100 Systems per Year
Manufacturers may be able to obviate the need for some of this equipment or reduce equipment cost
through innovative system design choices.
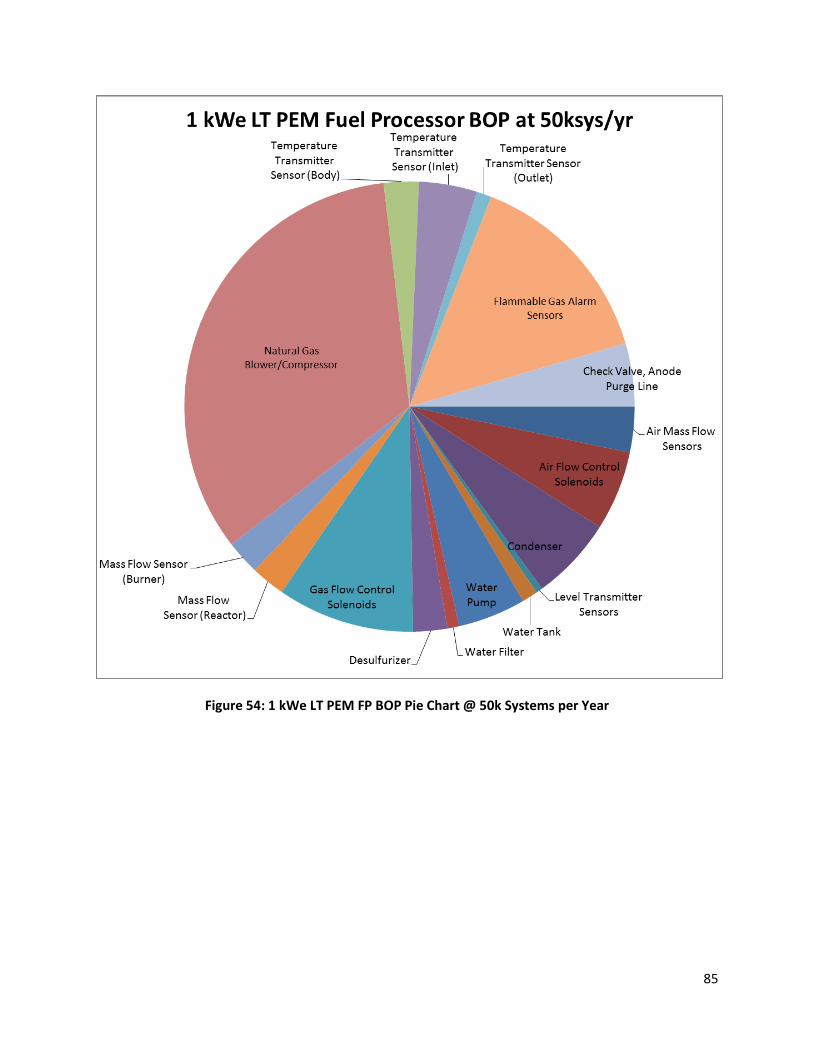
85
Figure 54: 1 kWe LT PEM FP BOP Pie Chart @ 50k Systems per Year
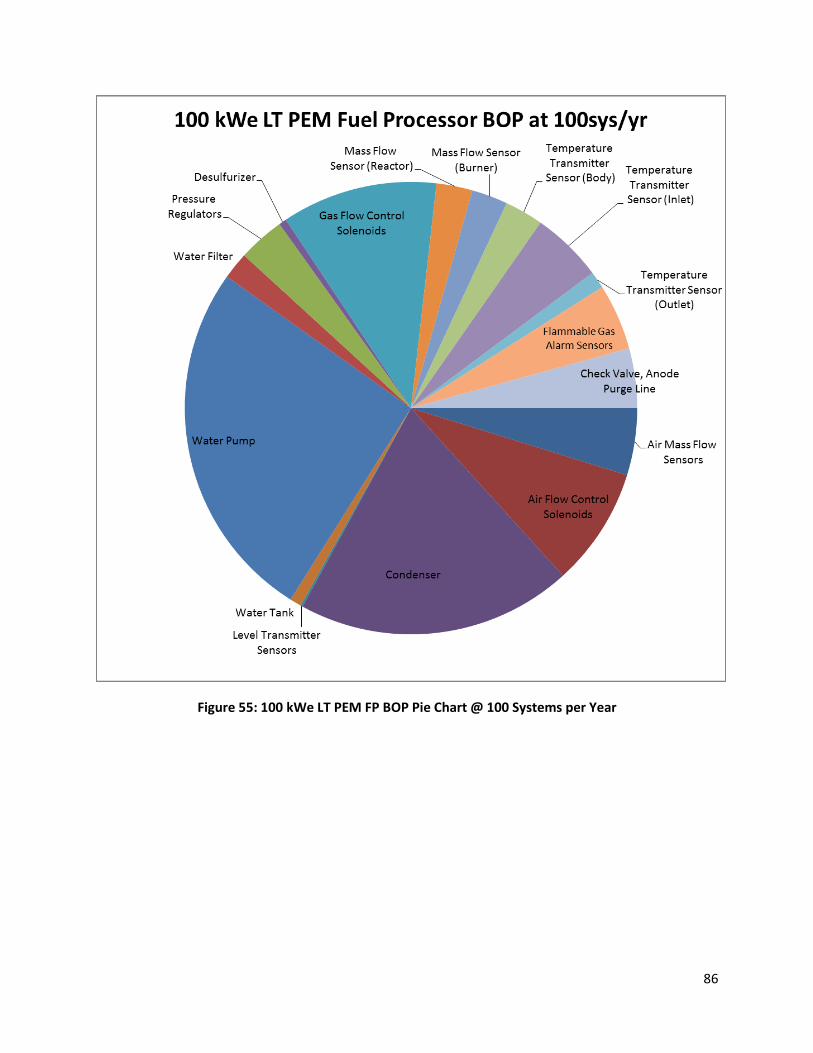
86
Figure 55: 100 kWe LT PEM FP BOP Pie Chart @ 100 Systems per Year
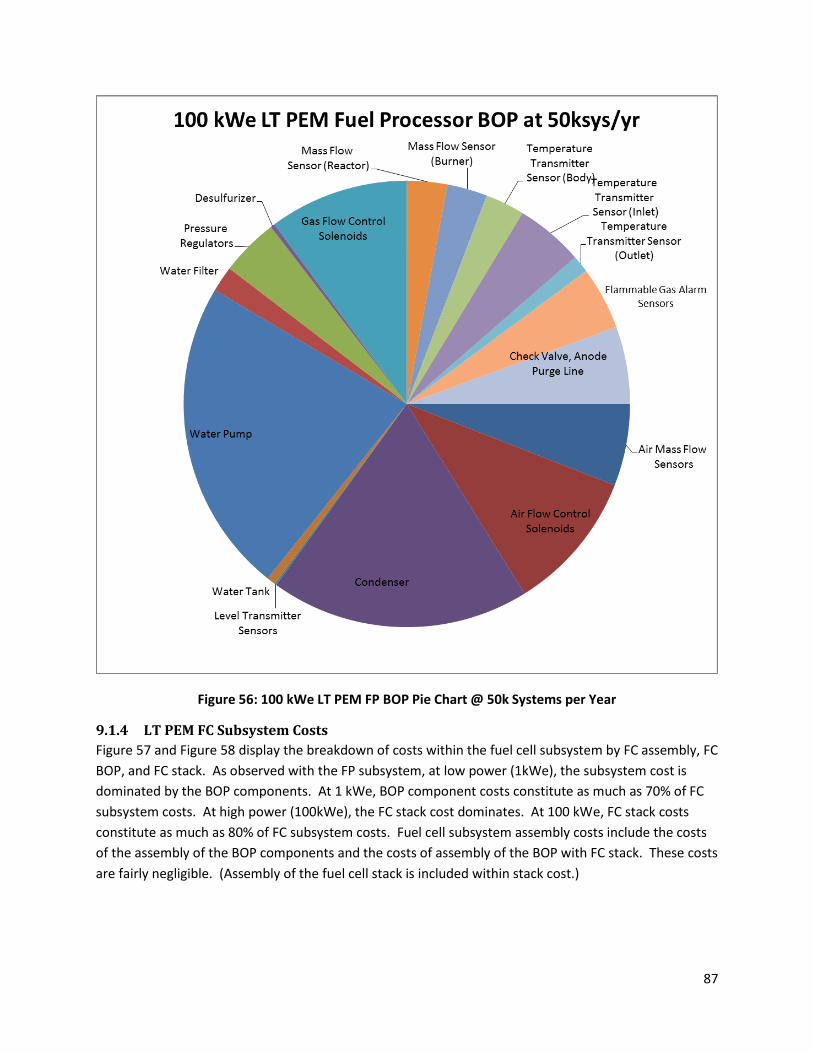
87
Figure 56: 100 kWe LT PEM FP BOP Pie Chart @ 50k Systems per Year
9.1.4 LT PEM FC Subsystem Costs
Figure 57 and Figure 58 display the breakdown of costs within the fuel cell subsystem by FC assembly, FC
BOP, and FC stack. As observed with the FP subsystem, at low power (1kWe), the subsystem cost is
dominated by the BOP components. At 1 kWe, BOP component costs constitute as much as 70% of FC
subsystem costs. At high power (100kWe), the FC stack cost dominates. At 100 kWe, FC stack costs
constitute as much as 80% of FC subsystem costs. Fuel cell subsystem assembly costs include the costs
of the assembly of the BOP components and the costs of assembly of the BOP with FC stack. These costs
are fairly negligible. (Assembly of the fuel cell stack is included within stack cost.)
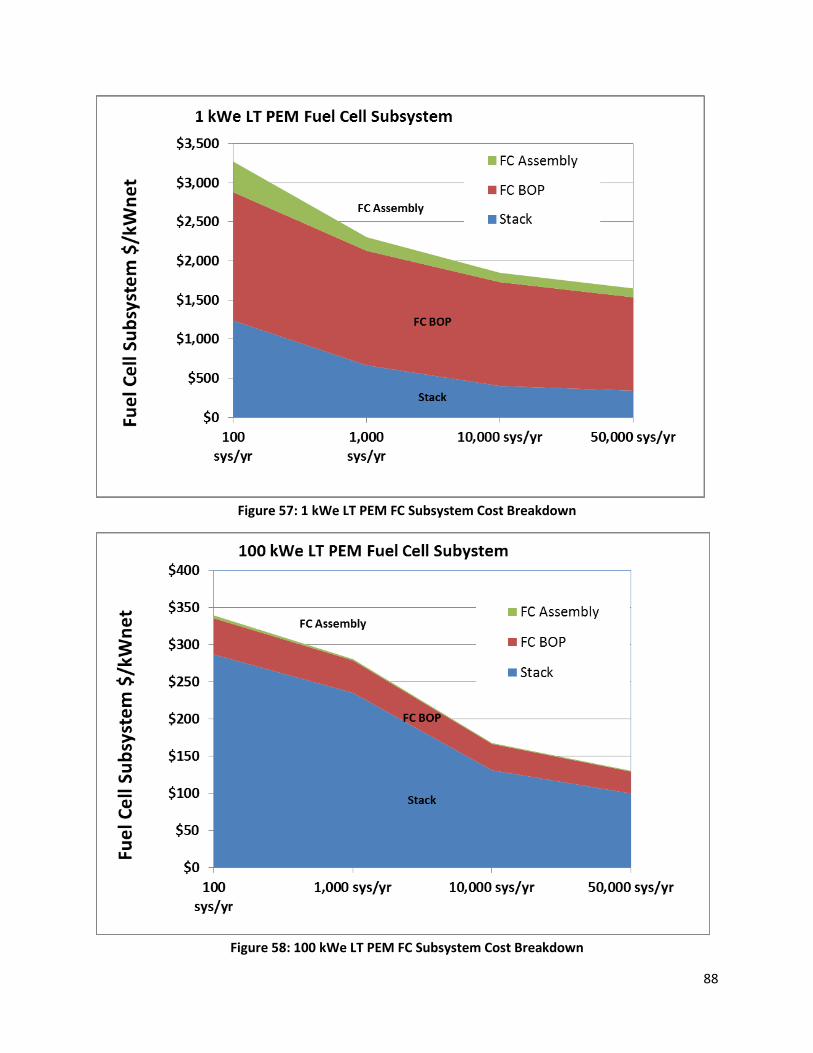
88
Figure 57: 1 kWe LT PEM FC Subsystem Cost Breakdown
Figure 58: 100 kWe LT PEM FC Subsystem Cost Breakdown
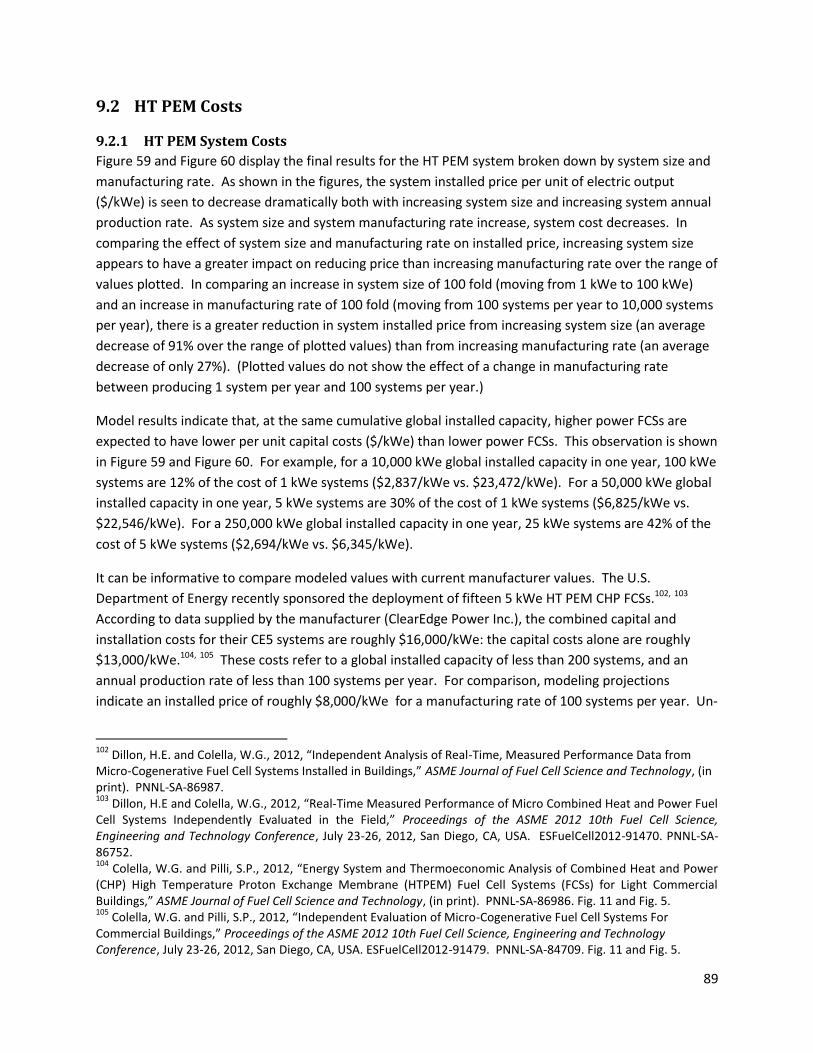
89
9.2 HT PEM Costs
9.2.1 HT PEM System Costs
Figure 59 and Figure 60 display the final results for the HT PEM system broken down by system size and
manufacturing rate. As shown in the figures, the system installed price per unit of electric output
($/kWe) is seen to decrease dramatically both with increasing system size and increasing system annual
production rate. As system size and system manufacturing rate increase, system cost decreases. In
comparing the effect of system size and manufacturing rate on installed price, increasing system size
appears to have a greater impact on reducing price than increasing manufacturing rate over the range of
values plotted. In comparing an increase in system size of 100 fold (moving from 1 kWe to 100 kWe)
and an increase in manufacturing rate of 100 fold (moving from 100 systems per year to 10,000 systems
per year), there is a greater reduction in system installed price from increasing system size (an average
decrease of 91% over the range of plotted values) than from increasing manufacturing rate (an average
decrease of only 27%). (Plotted values do not show the effect of a change in manufacturing rate
between producing 1 system per year and 100 systems per year.)
Model results indicate that, at the same cumulative global installed capacity, higher power FCSs are
expected to have lower per unit capital costs ($/kWe) than lower power FCSs. This observation is shown
in Figure 59 and Figure 60. For example, for a 10,000 kWe global installed capacity in one year, 100 kWe
systems are 12% of the cost of 1 kWe systems ($2,837/kWe vs. $23,472/kWe). For a 50,000 kWe global
installed capacity in one year, 5 kWe systems are 30% of the cost of 1 kWe systems ($6,825/kWe vs.
$22,546/kWe). For a 250,000 kWe global installed capacity in one year, 25 kWe systems are 42% of the
cost of 5 kWe systems ($2,694/kWe vs. $6,345/kWe).
It can be informative to compare modeled values with current manufacturer values. The U.S.
Department of Energy recently sponsored the deployment of fifteen 5 kWe HT PEM CHP FCSs.102, 103
According to data supplied by the manufacturer (ClearEdge Power Inc.), the combined capital and
installation costs for their CE5 systems are roughly $16,000/kWe: the capital costs alone are roughly
$13,000/kWe.104, 105 These costs refer to a global installed capacity of less than 200 systems, and an
annual production rate of less than 100 systems per year. For comparison, modeling projections
indicate an installed price of roughly $8,000/kWe for a manufacturing rate of 100 systems per year. Un-
102
Dillon, H.E. and Colella, W.G., 2012, “Independent Analysis of Real-Time, Measured Performance Data from Micro-Cogenerative Fuel Cell Systems Installed in Buildings,” ASME Journal of Fuel Cell Science and Technology, (in print). PNNL-SA-86987. 103
Dillon, H.E and Colella, W.G., 2012, “Real-Time Measured Performance of Micro Combined Heat and Power Fuel Cell Systems Independently Evaluated in the Field,” Proceedings of the ASME 2012 10th Fuel Cell Science, Engineering and Technology Conference, July 23-26, 2012, San Diego, CA, USA. ESFuelCell2012-91470. PNNL-SA-86752. 104
Colella, W.G. and Pilli, S.P., 2012, “Energy System and Thermoeconomic Analysis of Combined Heat and Power (CHP) High Temperature Proton Exchange Membrane (HTPEM) Fuel Cell Systems (FCSs) for Light Commercial Buildings,” ASME Journal of Fuel Cell Science and Technology, (in print). PNNL-SA-86986. Fig. 11 and Fig. 5. 105
Colella, W.G. and Pilli, S.P., 2012, “Independent Evaluation of Micro-Cogenerative Fuel Cell Systems For Commercial Buildings,” Proceedings of the ASME 2012 10th Fuel Cell Science, Engineering and Technology Conference, July 23-26, 2012, San Diego, CA, USA. ESFuelCell2012-91479. PNNL-SA-84709. Fig. 11 and Fig. 5.
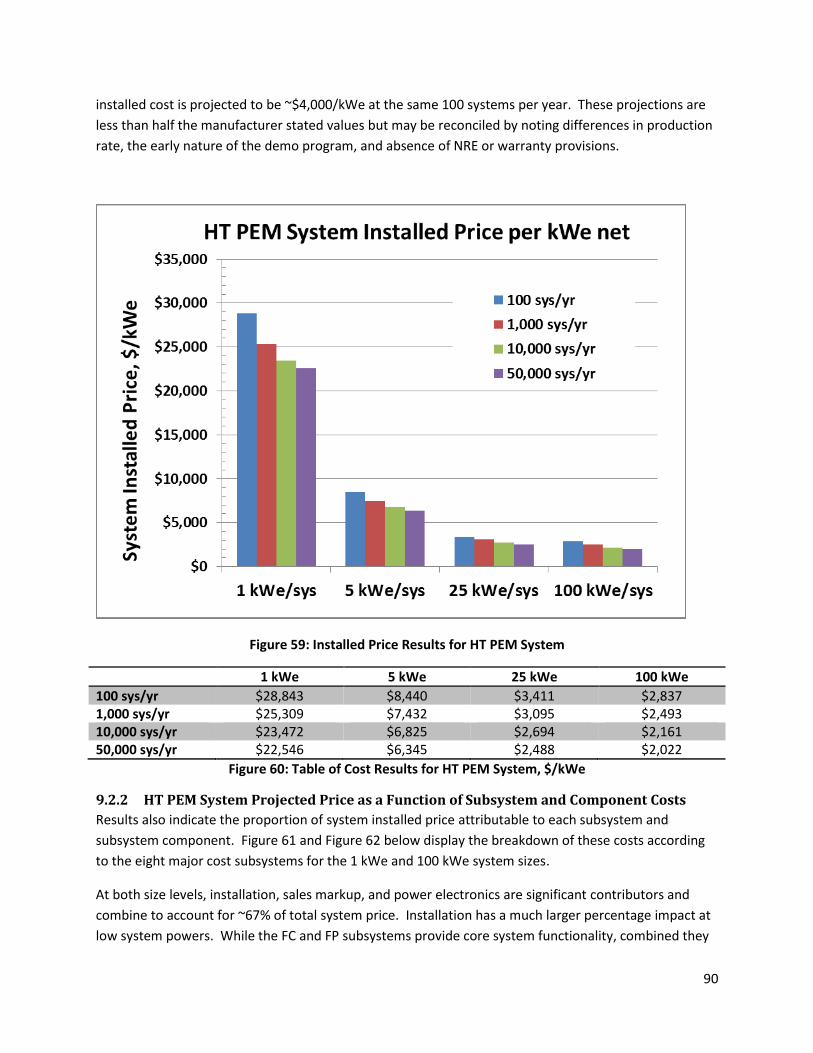
90
installed cost is projected to be ~$4,000/kWe at the same 100 systems per year. These projections are
less than half the manufacturer stated values but may be reconciled by noting differences in production
rate, the early nature of the demo program, and absence of NRE or warranty provisions.
Figure 59: Installed Price Results for HT PEM System
1 kWe 5 kWe 25 kWe 100 kWe
100 sys/yr $28,843 $8,440 $3,411 $2,837 1,000 sys/yr $25,309 $7,432 $3,095 $2,493 10,000 sys/yr $23,472 $6,825 $2,694 $2,161 50,000 sys/yr $22,546 $6,345 $2,488 $2,022
Figure 60: Table of Cost Results for HT PEM System, $/kWe
9.2.2 HT PEM System Projected Price as a Function of Subsystem and Component Costs
Results also indicate the proportion of system installed price attributable to each subsystem and
subsystem component. Figure 61 and Figure 62 below display the breakdown of these costs according
to the eight major cost subsystems for the 1 kWe and 100 kWe system sizes.
At both size levels, installation, sales markup, and power electronics are significant contributors and
combine to account for ~67% of total system price. Installation has a much larger percentage impact at
low system powers. While the FC and FP subsystems provide core system functionality, combined they
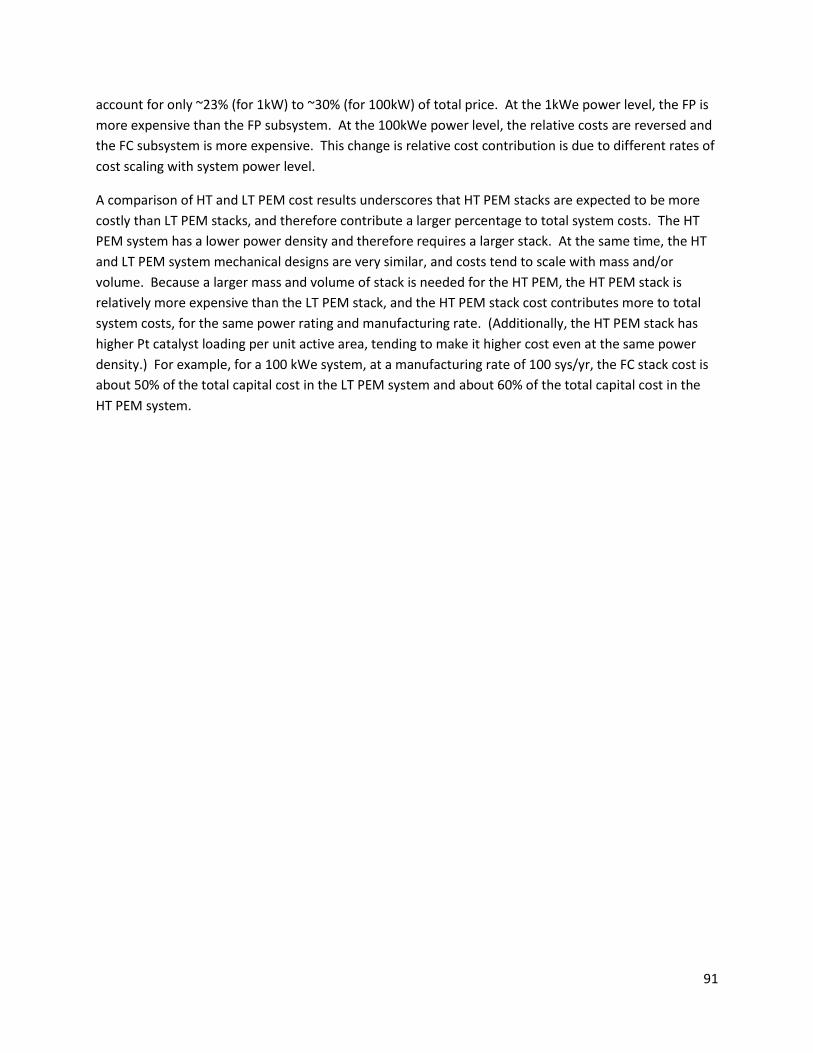
91
account for only ~23% (for 1kW) to ~30% (for 100kW) of total price. At the 1kWe power level, the FP is
more expensive than the FP subsystem. At the 100kWe power level, the relative costs are reversed and
the FC subsystem is more expensive. This change is relative cost contribution is due to different rates of
cost scaling with system power level.
A comparison of HT and LT PEM cost results underscores that HT PEM stacks are expected to be more
costly than LT PEM stacks, and therefore contribute a larger percentage to total system costs. The HT
PEM system has a lower power density and therefore requires a larger stack. At the same time, the HT
and LT PEM system mechanical designs are very similar, and costs tend to scale with mass and/or
volume. Because a larger mass and volume of stack is needed for the HT PEM, the HT PEM stack is
relatively more expensive than the LT PEM stack, and the HT PEM stack cost contributes more to total
system costs, for the same power rating and manufacturing rate. (Additionally, the HT PEM stack has
higher Pt catalyst loading per unit active area, tending to make it higher cost even at the same power
density.) For example, for a 100 kWe system, at a manufacturing rate of 100 sys/yr, the FC stack cost is
about 50% of the total capital cost in the LT PEM system and about 60% of the total capital cost in the
HT PEM system.
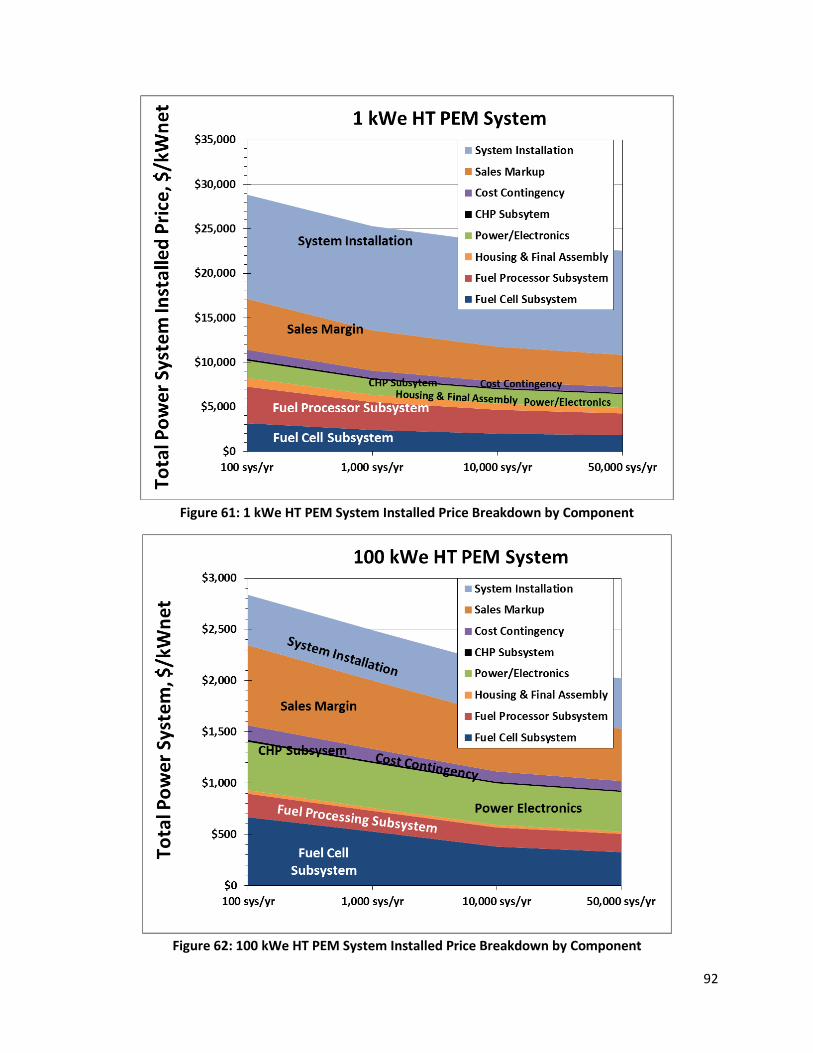
92
Figure 61: 1 kWe HT PEM System Installed Price Breakdown by Component
Figure 62: 100 kWe HT PEM System Installed Price Breakdown by Component
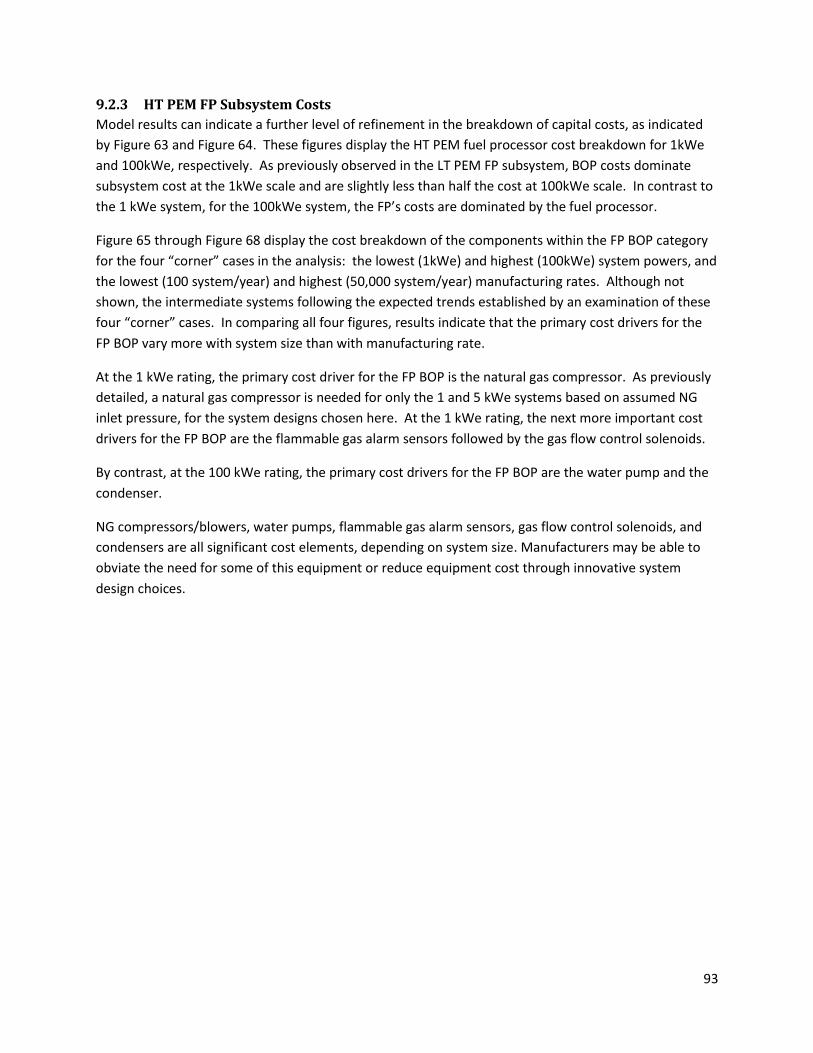
93
9.2.3 HT PEM FP Subsystem Costs
Model results can indicate a further level of refinement in the breakdown of capital costs, as indicated
by Figure 63 and Figure 64. These figures display the HT PEM fuel processor cost breakdown for 1kWe
and 100kWe, respectively. As previously observed in the LT PEM FP subsystem, BOP costs dominate
subsystem cost at the 1kWe scale and are slightly less than half the cost at 100kWe scale. In contrast to
the 1 kWe system, for the 100kWe system, the FP’s costs are dominated by the fuel processor.
Figure 65 through Figure 68 display the cost breakdown of the components within the FP BOP category
for the four “corner” cases in the analysis: the lowest (1kWe) and highest (100kWe) system powers, and
the lowest (100 system/year) and highest (50,000 system/year) manufacturing rates. Although not
shown, the intermediate systems following the expected trends established by an examination of these
four “corner” cases. In comparing all four figures, results indicate that the primary cost drivers for the
FP BOP vary more with system size than with manufacturing rate.
At the 1 kWe rating, the primary cost driver for the FP BOP is the natural gas compressor. As previously
detailed, a natural gas compressor is needed for only the 1 and 5 kWe systems based on assumed NG
inlet pressure, for the system designs chosen here. At the 1 kWe rating, the next more important cost
drivers for the FP BOP are the flammable gas alarm sensors followed by the gas flow control solenoids.
By contrast, at the 100 kWe rating, the primary cost drivers for the FP BOP are the water pump and the
condenser.
NG compressors/blowers, water pumps, flammable gas alarm sensors, gas flow control solenoids, and
condensers are all significant cost elements, depending on system size. Manufacturers may be able to
obviate the need for some of this equipment or reduce equipment cost through innovative system
design choices.
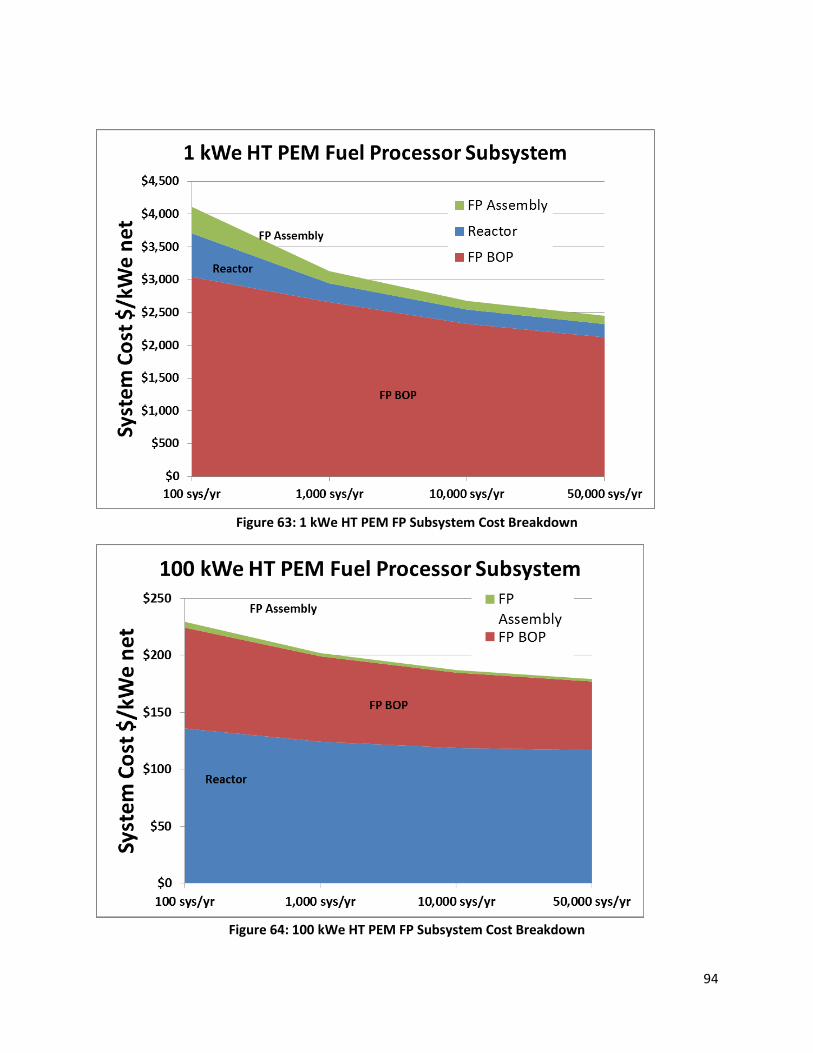
94
Figure 63: 1 kWe HT PEM FP Subsystem Cost Breakdown
Figure 64: 100 kWe HT PEM FP Subsystem Cost Breakdown
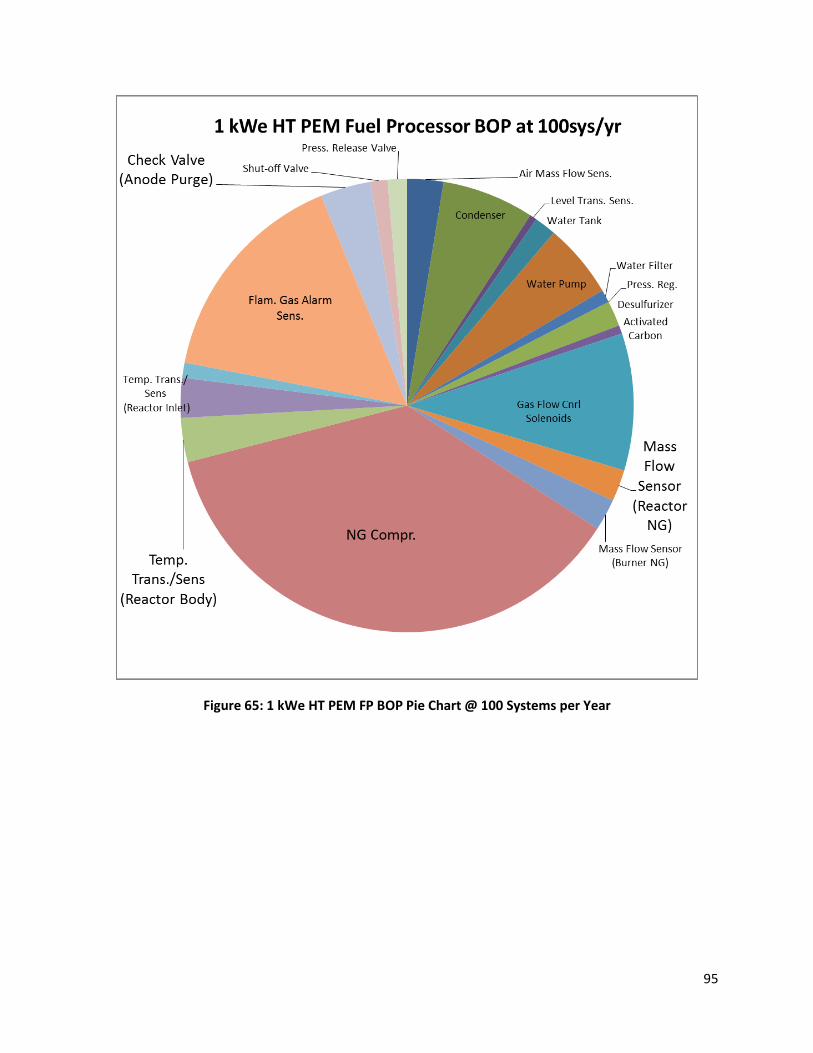
95
Figure 65: 1 kWe HT PEM FP BOP Pie Chart @ 100 Systems per Year
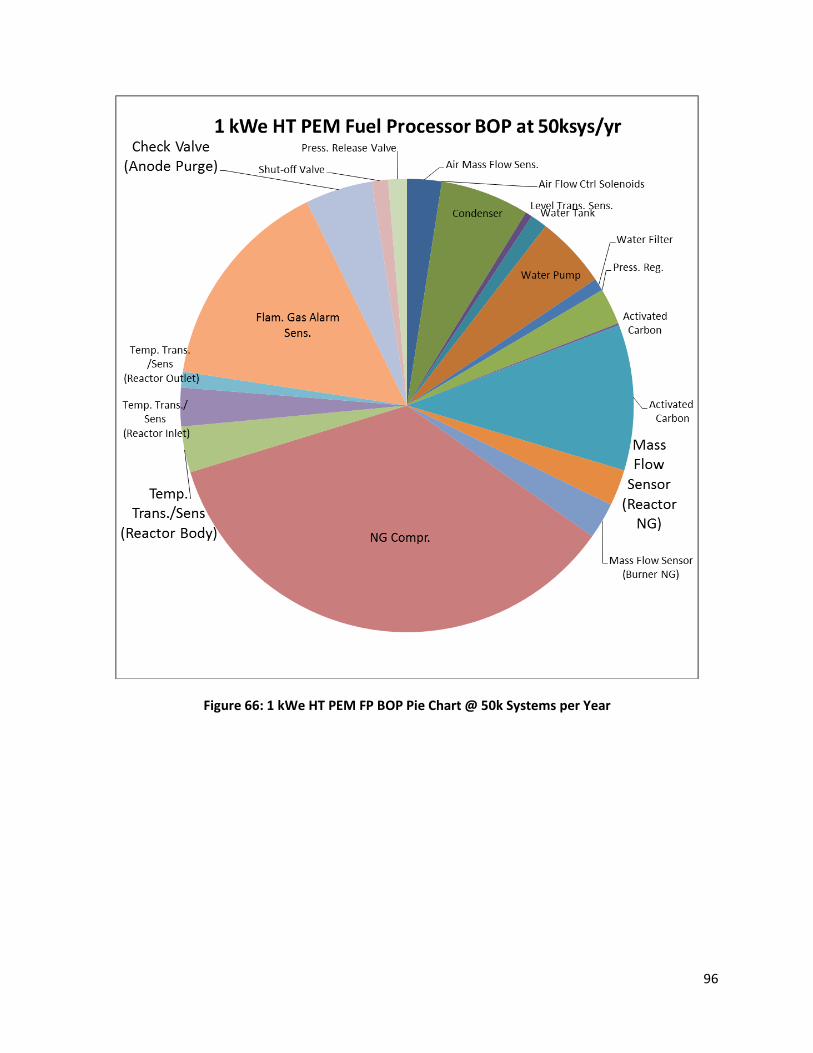
96
Figure 66: 1 kWe HT PEM FP BOP Pie Chart @ 50k Systems per Year
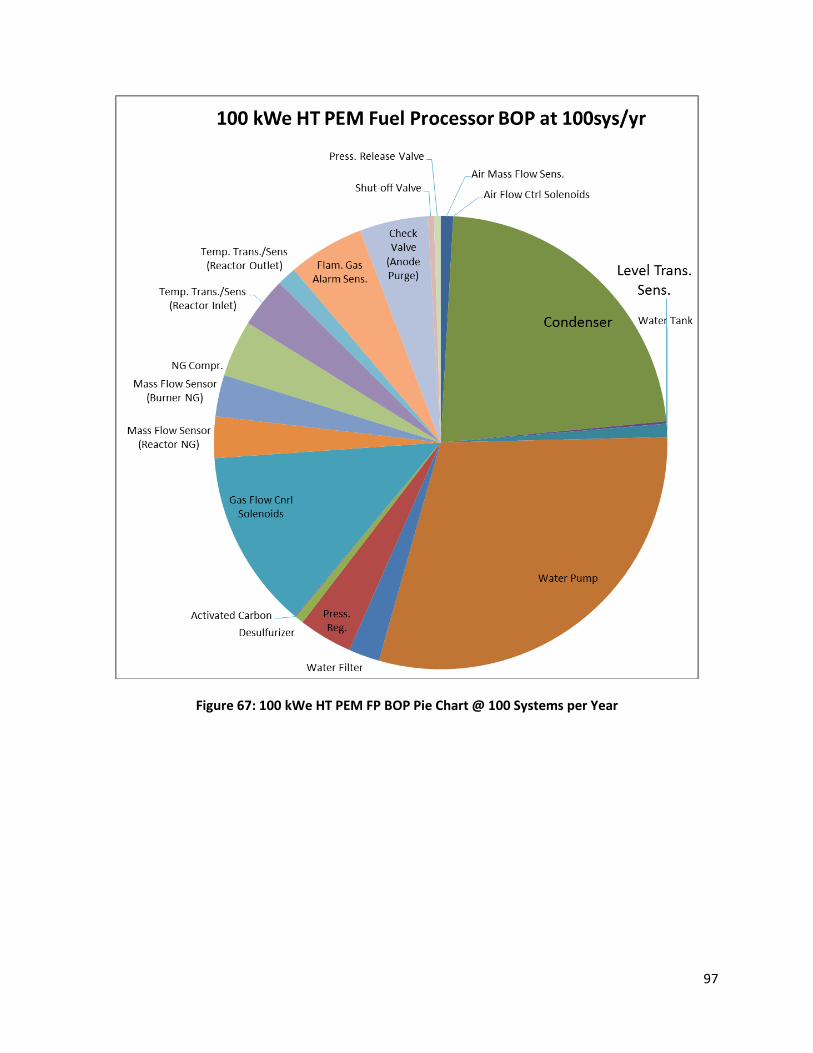
97
Figure 67: 100 kWe HT PEM FP BOP Pie Chart @ 100 Systems per Year
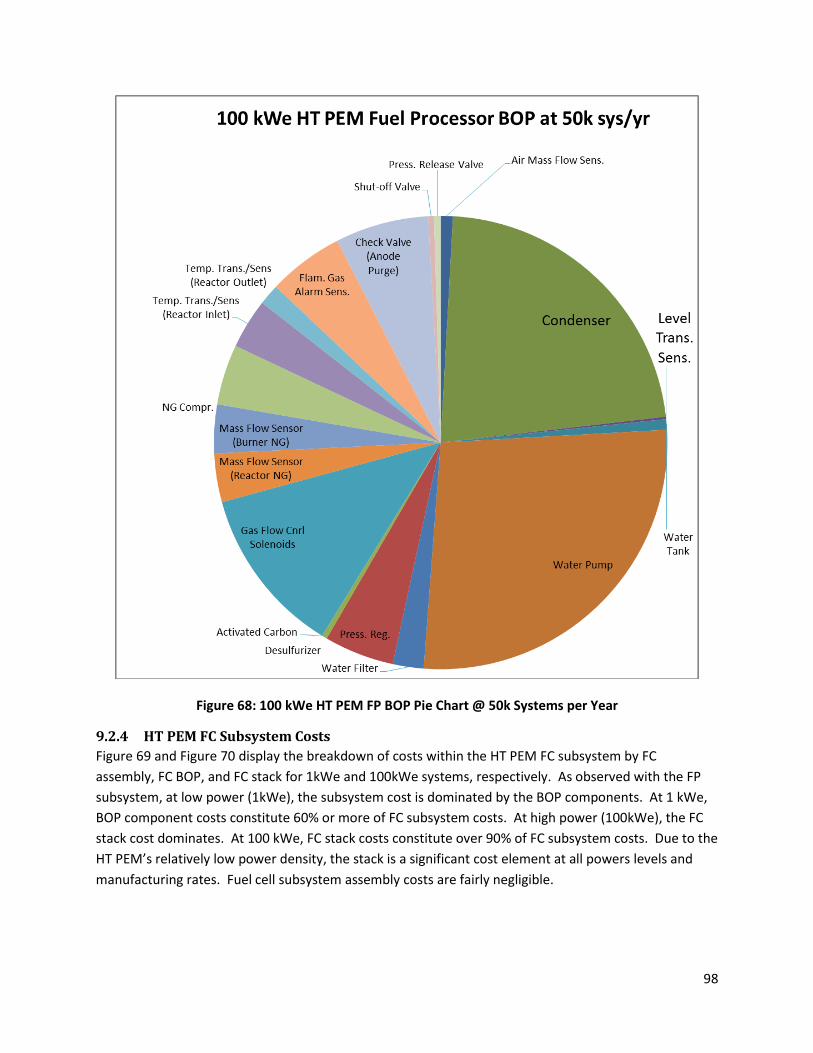
98
Figure 68: 100 kWe HT PEM FP BOP Pie Chart @ 50k Systems per Year
9.2.4 HT PEM FC Subsystem Costs
Figure 69 and Figure 70 display the breakdown of costs within the HT PEM FC subsystem by FC
assembly, FC BOP, and FC stack for 1kWe and 100kWe systems, respectively. As observed with the FP
subsystem, at low power (1kWe), the subsystem cost is dominated by the BOP components. At 1 kWe,
BOP component costs constitute 60% or more of FC subsystem costs. At high power (100kWe), the FC
stack cost dominates. At 100 kWe, FC stack costs constitute over 90% of FC subsystem costs. Due to the
HT PEM’s relatively low power density, the stack is a significant cost element at all powers levels and
manufacturing rates. Fuel cell subsystem assembly costs are fairly negligible.
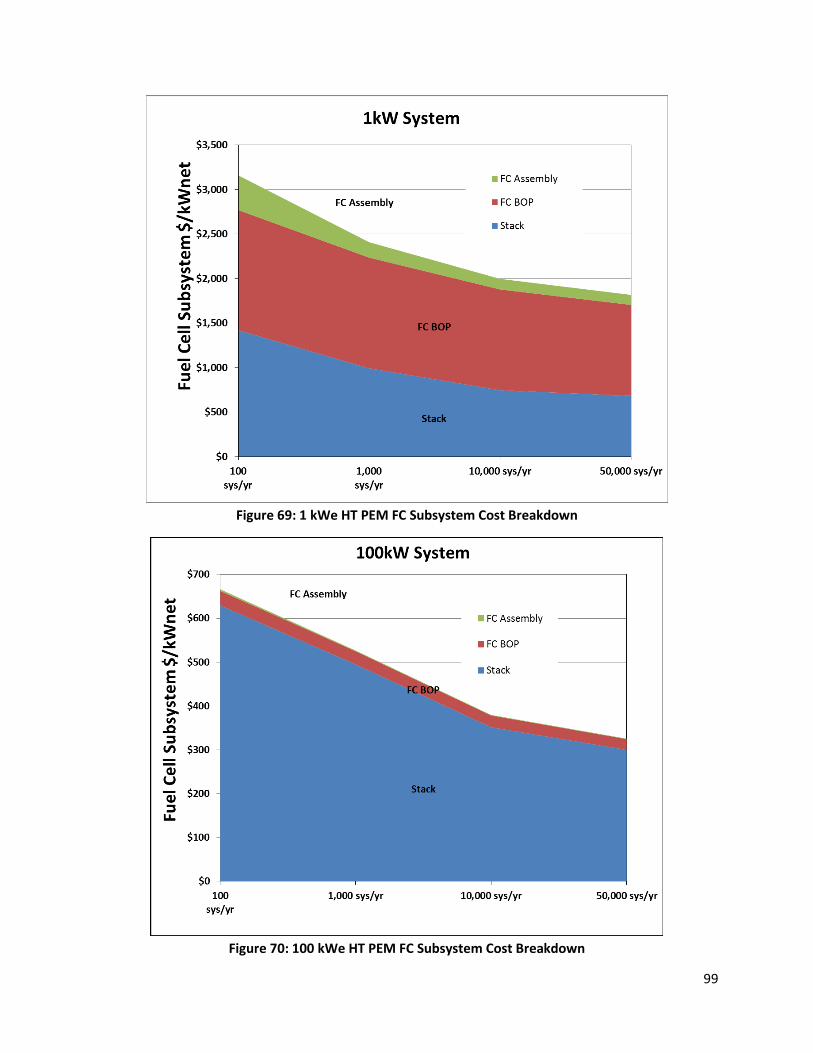
99
Figure 69: 1 kWe HT PEM FC Subsystem Cost Breakdown
Figure 70: 100 kWe HT PEM FC Subsystem Cost Breakdown
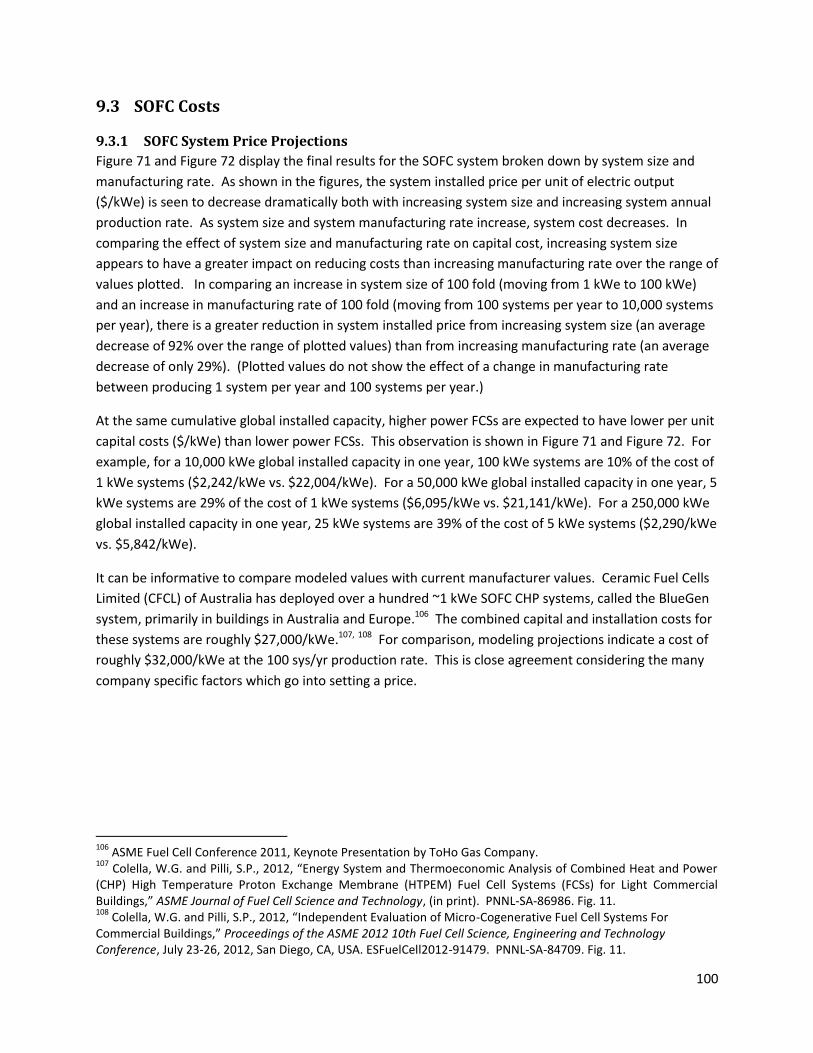
100
9.3 SOFC Costs
9.3.1 SOFC System Price Projections
Figure 71 and Figure 72 display the final results for the SOFC system broken down by system size and
manufacturing rate. As shown in the figures, the system installed price per unit of electric output
($/kWe) is seen to decrease dramatically both with increasing system size and increasing system annual
production rate. As system size and system manufacturing rate increase, system cost decreases. In
comparing the effect of system size and manufacturing rate on capital cost, increasing system size
appears to have a greater impact on reducing costs than increasing manufacturing rate over the range of
values plotted. In comparing an increase in system size of 100 fold (moving from 1 kWe to 100 kWe)
and an increase in manufacturing rate of 100 fold (moving from 100 systems per year to 10,000 systems
per year), there is a greater reduction in system installed price from increasing system size (an average
decrease of 92% over the range of plotted values) than from increasing manufacturing rate (an average
decrease of only 29%). (Plotted values do not show the effect of a change in manufacturing rate
between producing 1 system per year and 100 systems per year.)
At the same cumulative global installed capacity, higher power FCSs are expected to have lower per unit
capital costs ($/kWe) than lower power FCSs. This observation is shown in Figure 71 and Figure 72. For
example, for a 10,000 kWe global installed capacity in one year, 100 kWe systems are 10% of the cost of
1 kWe systems ($2,242/kWe vs. $22,004/kWe). For a 50,000 kWe global installed capacity in one year, 5
kWe systems are 29% of the cost of 1 kWe systems ($6,095/kWe vs. $21,141/kWe). For a 250,000 kWe
global installed capacity in one year, 25 kWe systems are 39% of the cost of 5 kWe systems ($2,290/kWe
vs. $5,842/kWe).
It can be informative to compare modeled values with current manufacturer values. Ceramic Fuel Cells
Limited (CFCL) of Australia has deployed over a hundred ~1 kWe SOFC CHP systems, called the BlueGen
system, primarily in buildings in Australia and Europe.106 The combined capital and installation costs for
these systems are roughly $27,000/kWe.107, 108 For comparison, modeling projections indicate a cost of
roughly $32,000/kWe at the 100 sys/yr production rate. This is close agreement considering the many
company specific factors which go into setting a price.
106
ASME Fuel Cell Conference 2011, Keynote Presentation by ToHo Gas Company. 107
Colella, W.G. and Pilli, S.P., 2012, “Energy System and Thermoeconomic Analysis of Combined Heat and Power (CHP) High Temperature Proton Exchange Membrane (HTPEM) Fuel Cell Systems (FCSs) for Light Commercial Buildings,” ASME Journal of Fuel Cell Science and Technology, (in print). PNNL-SA-86986. Fig. 11. 108
Colella, W.G. and Pilli, S.P., 2012, “Independent Evaluation of Micro-Cogenerative Fuel Cell Systems For Commercial Buildings,” Proceedings of the ASME 2012 10th Fuel Cell Science, Engineering and Technology Conference, July 23-26, 2012, San Diego, CA, USA. ESFuelCell2012-91479. PNNL-SA-84709. Fig. 11.
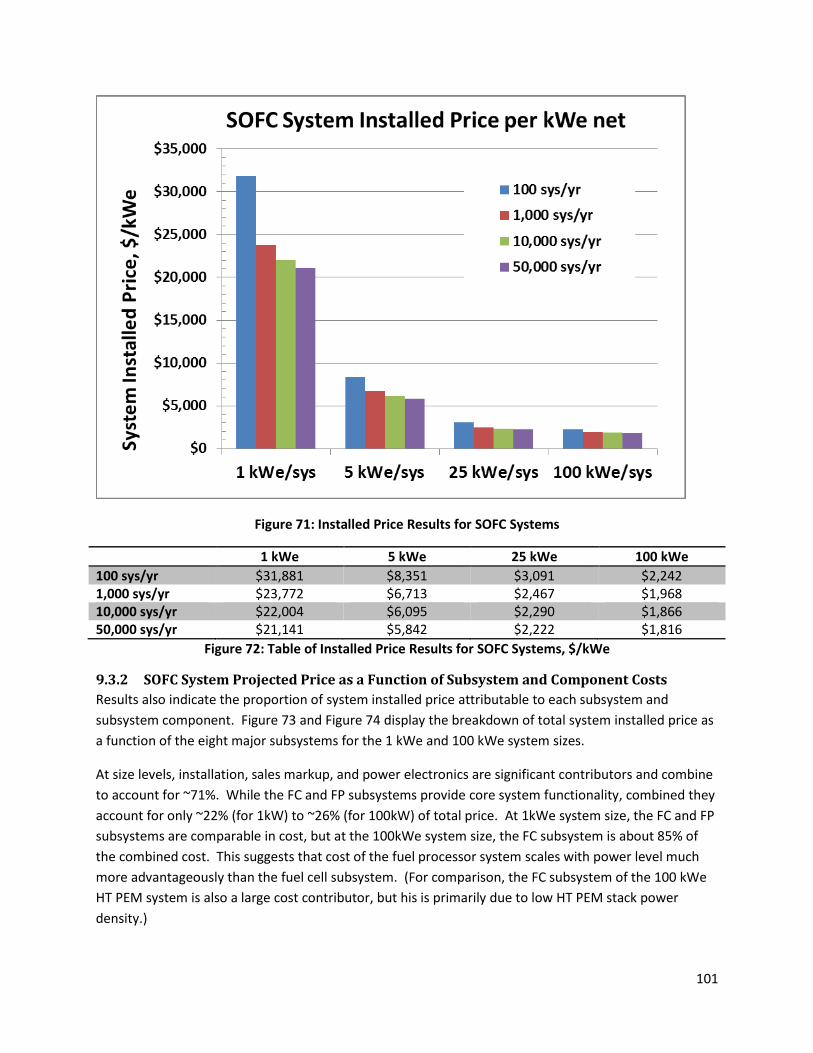
101
Figure 71: Installed Price Results for SOFC Systems
1 kWe 5 kWe 25 kWe 100 kWe
100 sys/yr $31,881 $8,351 $3,091 $2,242 1,000 sys/yr $23,772 $6,713 $2,467 $1,968 10,000 sys/yr $22,004 $6,095 $2,290 $1,866 50,000 sys/yr $21,141 $5,842 $2,222 $1,816
Figure 72: Table of Installed Price Results for SOFC Systems, $/kWe
9.3.2 SOFC System Projected Price as a Function of Subsystem and Component Costs
Results also indicate the proportion of system installed price attributable to each subsystem and
subsystem component. Figure 73 and Figure 74 display the breakdown of total system installed price as
a function of the eight major subsystems for the 1 kWe and 100 kWe system sizes.
At size levels, installation, sales markup, and power electronics are significant contributors and combine
to account for ~71%. While the FC and FP subsystems provide core system functionality, combined they
account for only ~22% (for 1kW) to ~26% (for 100kW) of total price. At 1kWe system size, the FC and FP
subsystems are comparable in cost, but at the 100kWe system size, the FC subsystem is about 85% of
the combined cost. This suggests that cost of the fuel processor system scales with power level much
more advantageously than the fuel cell subsystem. (For comparison, the FC subsystem of the 100 kWe
HT PEM system is also a large cost contributor, but his is primarily due to low HT PEM stack power
density.)

102
Figure 73: 1 kWe SOFC System Installed Price Breakdown by Component
Figure 74: 100 kWe SOFC System Installed Price Breakdown by Component
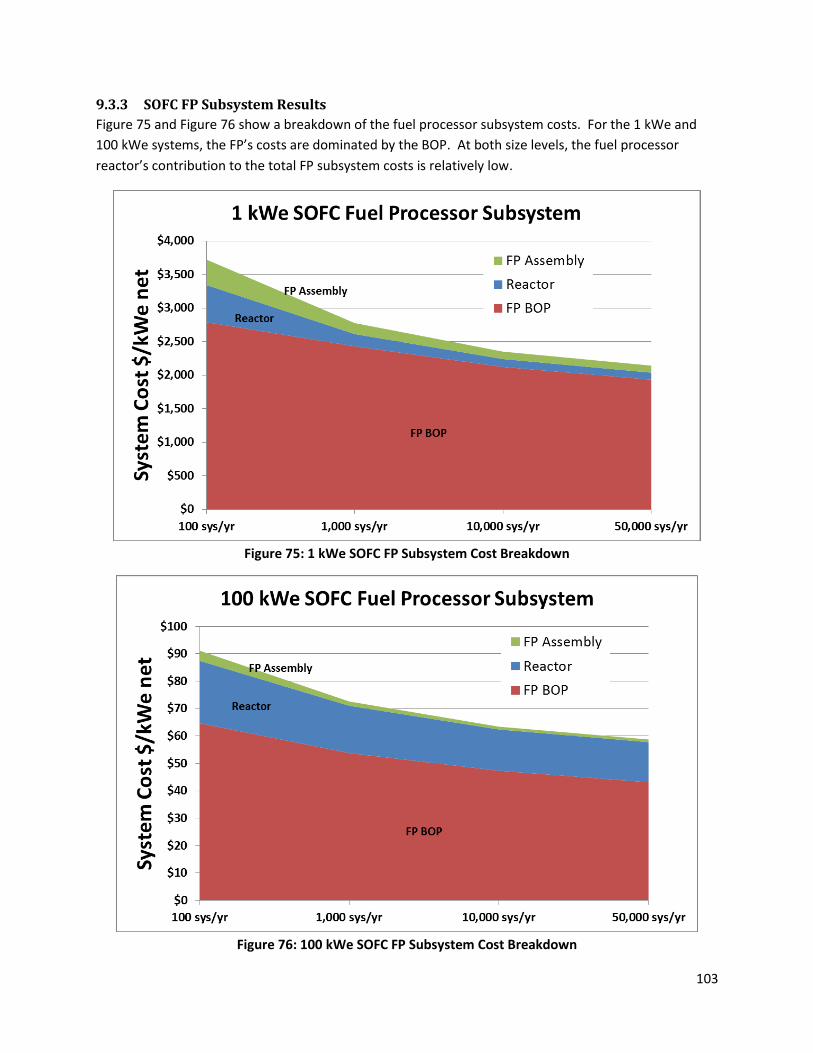
103
9.3.3 SOFC FP Subsystem Results
Figure 75 and Figure 76 show a breakdown of the fuel processor subsystem costs. For the 1 kWe and
100 kWe systems, the FP’s costs are dominated by the BOP. At both size levels, the fuel processor
reactor’s contribution to the total FP subsystem costs is relatively low.
Figure 75: 1 kWe SOFC FP Subsystem Cost Breakdown
Figure 76: 100 kWe SOFC FP Subsystem Cost Breakdown
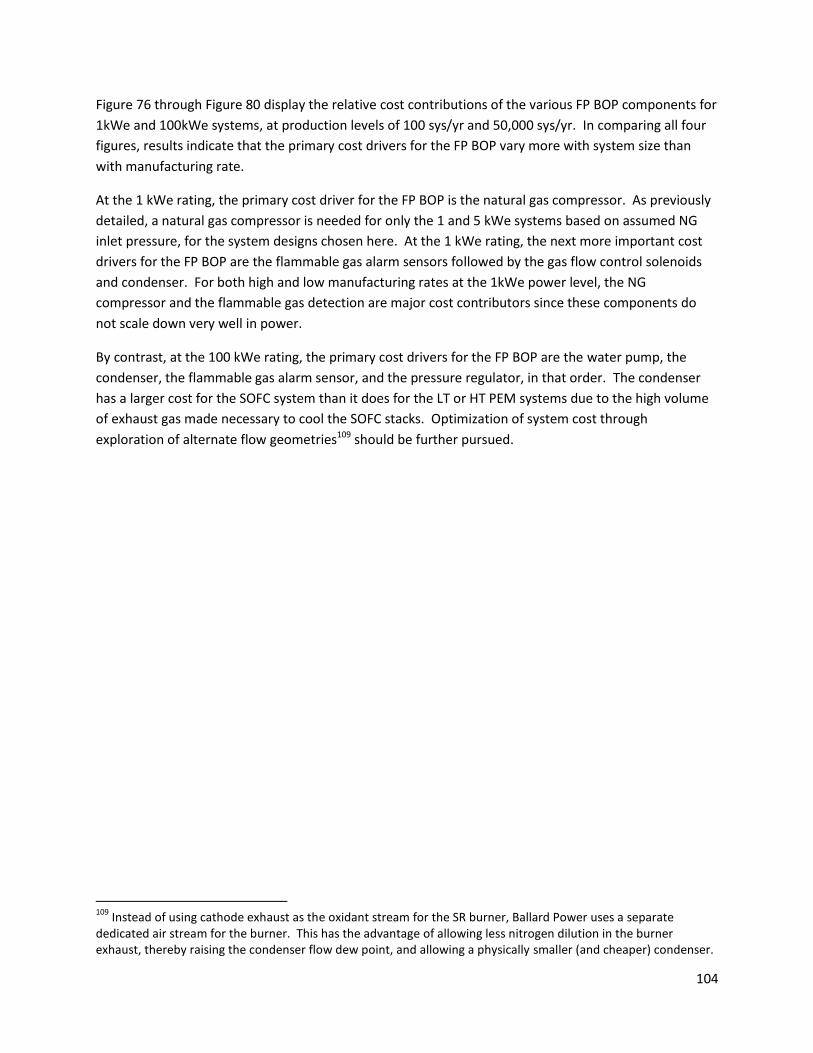
104
Figure 76 through Figure 80 display the relative cost contributions of the various FP BOP components for
1kWe and 100kWe systems, at production levels of 100 sys/yr and 50,000 sys/yr. In comparing all four
figures, results indicate that the primary cost drivers for the FP BOP vary more with system size than
with manufacturing rate.
At the 1 kWe rating, the primary cost driver for the FP BOP is the natural gas compressor. As previously
detailed, a natural gas compressor is needed for only the 1 and 5 kWe systems based on assumed NG
inlet pressure, for the system designs chosen here. At the 1 kWe rating, the next more important cost
drivers for the FP BOP are the flammable gas alarm sensors followed by the gas flow control solenoids
and condenser. For both high and low manufacturing rates at the 1kWe power level, the NG
compressor and the flammable gas detection are major cost contributors since these components do
not scale down very well in power.
By contrast, at the 100 kWe rating, the primary cost drivers for the FP BOP are the water pump, the
condenser, the flammable gas alarm sensor, and the pressure regulator, in that order. The condenser
has a larger cost for the SOFC system than it does for the LT or HT PEM systems due to the high volume
of exhaust gas made necessary to cool the SOFC stacks. Optimization of system cost through
exploration of alternate flow geometries109 should be further pursued.
109
Instead of using cathode exhaust as the oxidant stream for the SR burner, Ballard Power uses a separate dedicated air stream for the burner. This has the advantage of allowing less nitrogen dilution in the burner exhaust, thereby raising the condenser flow dew point, and allowing a physically smaller (and cheaper) condenser.
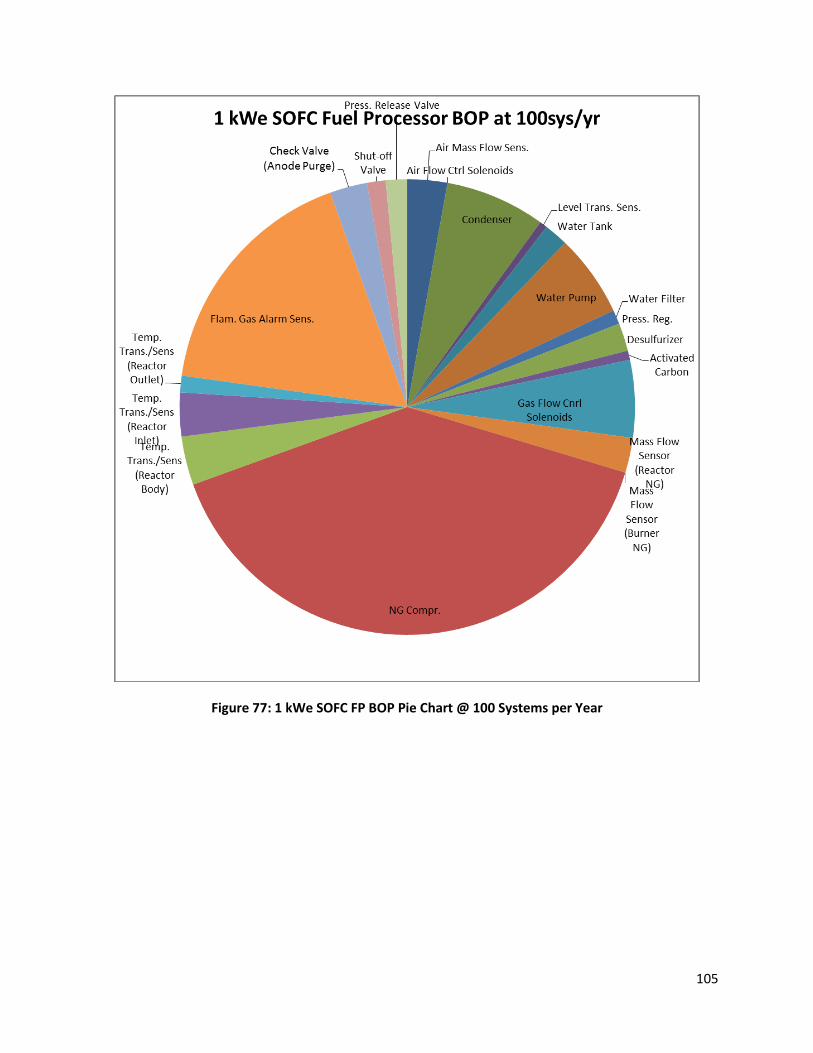
105
Figure 77: 1 kWe SOFC FP BOP Pie Chart @ 100 Systems per Year
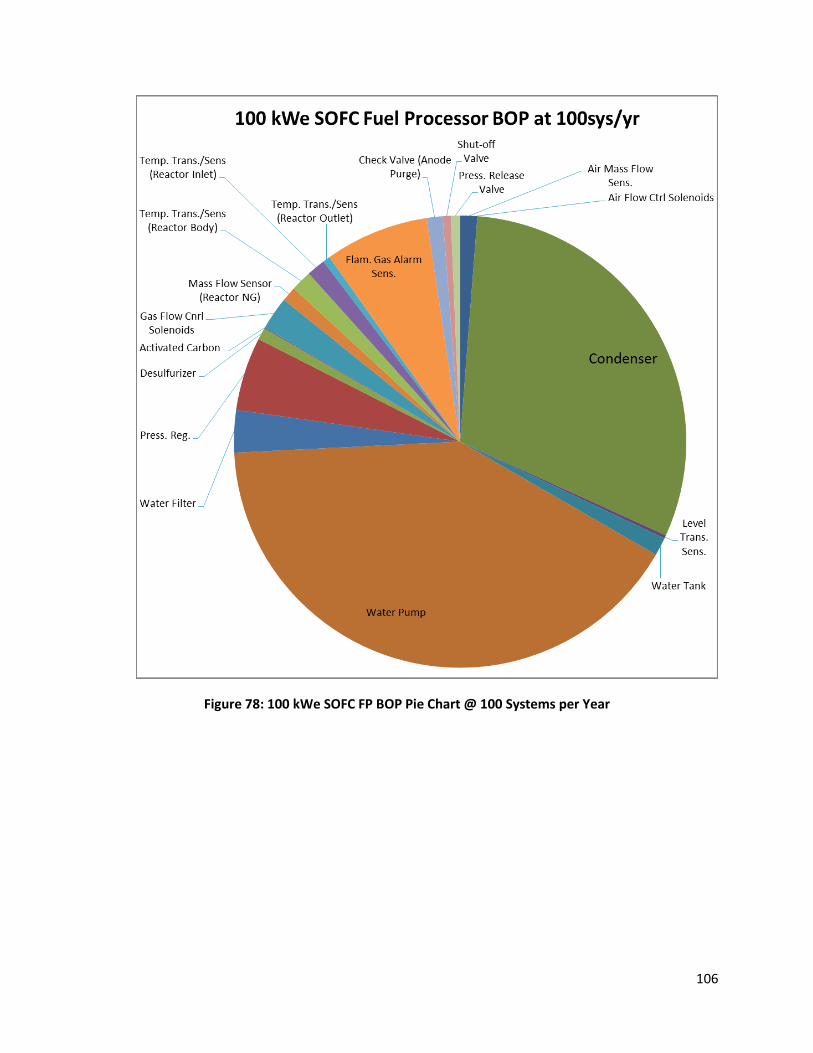
106
Figure 78: 100 kWe SOFC FP BOP Pie Chart @ 100 Systems per Year
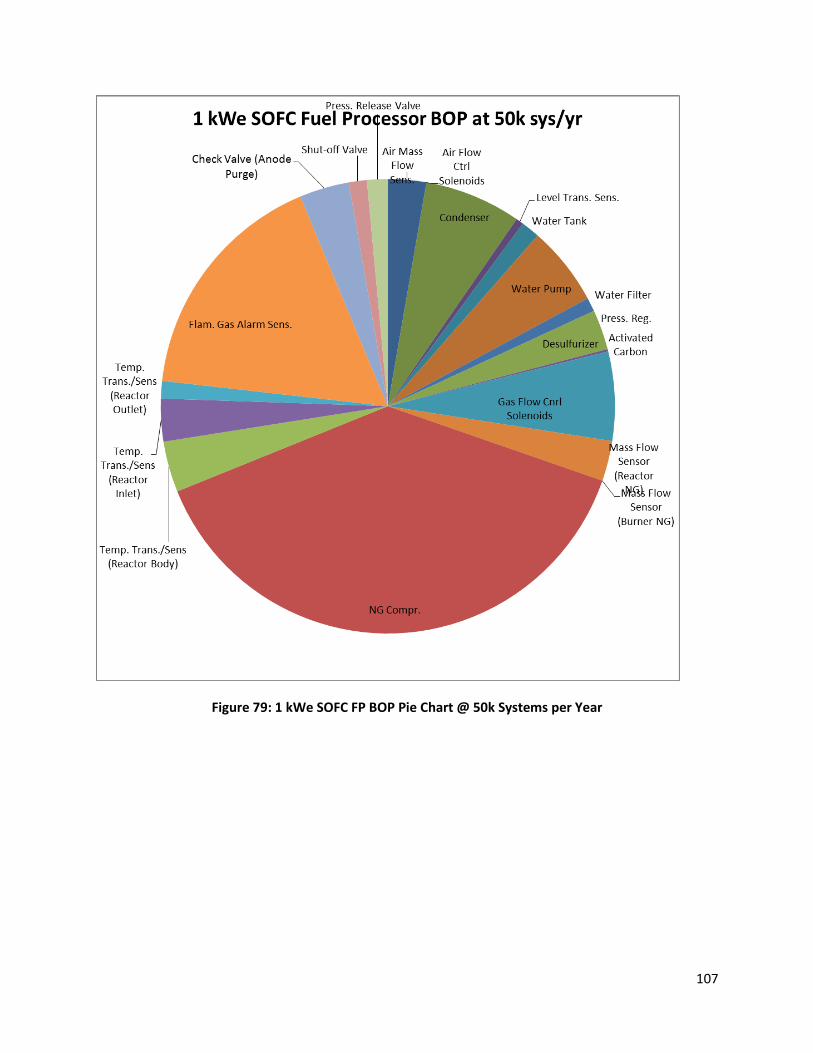
107
Figure 79: 1 kWe SOFC FP BOP Pie Chart @ 50k Systems per Year
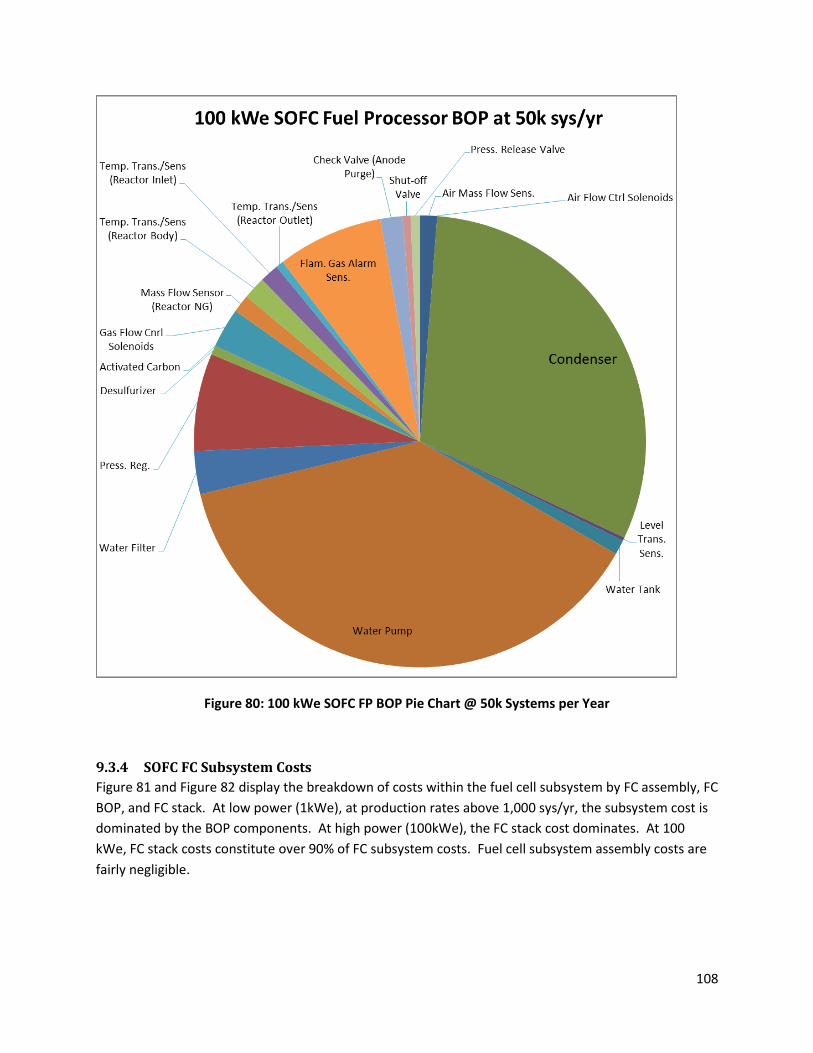
108
Figure 80: 100 kWe SOFC FP BOP Pie Chart @ 50k Systems per Year
9.3.4 SOFC FC Subsystem Costs
Figure 81 and Figure 82 display the breakdown of costs within the fuel cell subsystem by FC assembly, FC
BOP, and FC stack. At low power (1kWe), at production rates above 1,000 sys/yr, the subsystem cost is
dominated by the BOP components. At high power (100kWe), the FC stack cost dominates. At 100
kWe, FC stack costs constitute over 90% of FC subsystem costs. Fuel cell subsystem assembly costs are
fairly negligible.
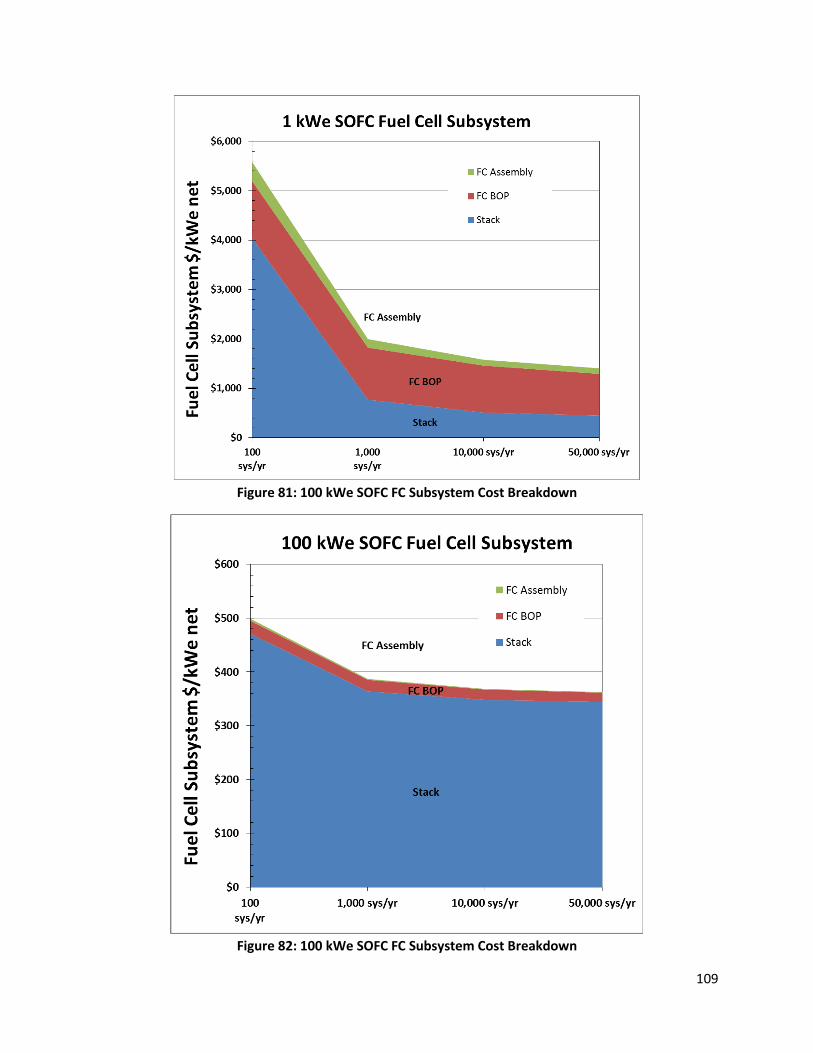
109
Figure 81: 100 kWe SOFC FC Subsystem Cost Breakdown
Figure 82: 100 kWe SOFC FC Subsystem Cost Breakdown
110
10 Summary and Comparison of Installed FCS Price Projections
10.1 Summary of FCS Installed Price Projections Detailed cost and price breakdowns for each of the FCSs examined appear in the Appendices of this
report. Condensed installed system price projects at the subsystem level are shown in the table and
graphs below. Note that all system prices include the fuel-cell/reformer/BOP cost elements detailed in
Section 9, inclusive of a 10% cost contingency to account for non-enumerated expenses, the sales
markup detailed in Section 7, and a representative FCS installation cost detailed in Section 8.
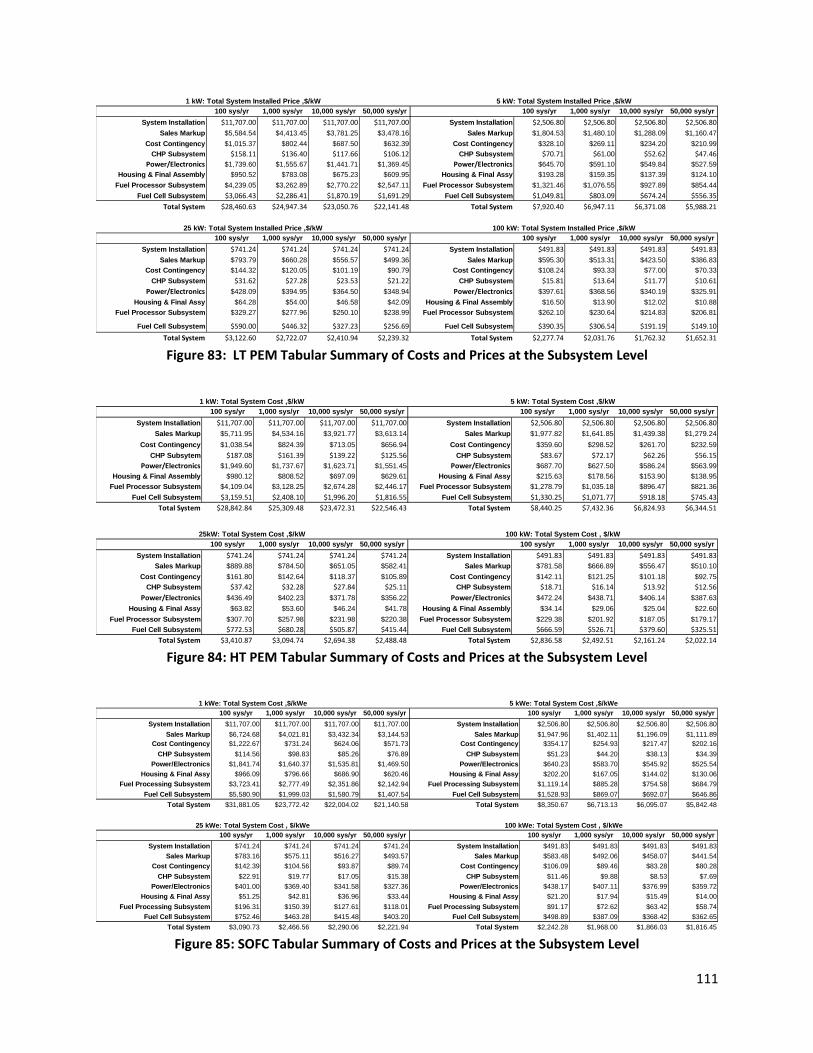
111
Figure 83: LT PEM Tabular Summary of Costs and Prices at the Subsystem Level
Figure 84: HT PEM Tabular Summary of Costs and Prices at the Subsystem Level
Figure 85: SOFC Tabular Summary of Costs and Prices at the Subsystem Level
100 sys/yr 1,000 sys/yr 10,000 sys/yr 50,000 sys/yr 100 sys/yr 1,000 sys/yr 10,000 sys/yr 50,000 sys/yr
System Installation $11,707.00 $11,707.00 $11,707.00 $11,707.00 System Installation $2,506.80 $2,506.80 $2,506.80 $2,506.80
Sales Markup $5,584.54 $4,413.45 $3,781.25 $3,478.16 Sales Markup $1,804.53 $1,480.10 $1,288.09 $1,160.47
Cost Contingency $1,015.37 $802.44 $687.50 $632.39 Cost Contingency $328.10 $269.11 $234.20 $210.99
CHP Subsystem $158.11 $136.40 $117.66 $106.12 CHP Subsystem $70.71 $61.00 $52.62 $47.46
Power/Electronics $1,739.60 $1,555.67 $1,441.71 $1,369.45 Power/Electronics $645.70 $591.10 $549.84 $527.59
Housing & Final Assembly $950.52 $783.08 $675.23 $609.95 Housing & Final Assy $193.28 $159.35 $137.39 $124.10
Fuel Processor Subsystem $4,239.05 $3,262.89 $2,770.22 $2,547.11 Fuel Processor Subsystem $1,321.46 $1,076.55 $927.89 $854.44
Fuel Cell Subsystem $3,066.43 $2,286.41 $1,870.19 $1,691.29 Fuel Cell Subsystem $1,049.81 $803.09 $674.24 $556.35
Total System $28,460.63 $24,947.34 $23,050.76 $22,141.48 Total System $7,920.40 $6,947.11 $6,371.08 $5,988.21
100 sys/yr 1,000 sys/yr 10,000 sys/yr 50,000 sys/yr 100 sys/yr 1,000 sys/yr 10,000 sys/yr 50,000 sys/yr
System Installation $741.24 $741.24 $741.24 $741.24 System Installation $491.83 $491.83 $491.83 $491.83
Sales Markup $793.79 $660.28 $556.57 $499.36 Sales Markup $595.30 $513.31 $423.50 $386.83
Cost Contingency $144.32 $120.05 $101.19 $90.79 Cost Contingency $108.24 $93.33 $77.00 $70.33
CHP Subsystem $31.62 $27.28 $23.53 $21.22 CHP Subsystem $15.81 $13.64 $11.77 $10.61
Power/Electronics $428.09 $394.95 $364.50 $348.94 Power/Electronics $397.61 $368.56 $340.19 $325.91
Housing & Final Assy $64.28 $54.00 $46.58 $42.09 Housing & Final Assembly $16.50 $13.90 $12.02 $10.88
Fuel Processor Subsystem $329.27 $277.96 $250.10 $238.99 Fuel Processor Subsystem $262.10 $230.64 $214.83 $206.81
Fuel Cell Subsystem $590.00 $446.32 $327.23 $256.69 Fuel Cell Subsystem $390.35 $306.54 $191.19 $149.10
Total System $3,122.60 $2,722.07 $2,410.94 $2,239.32 Total System $2,277.74 $2,031.76 $1,762.32 $1,652.31
5 kW: Total System Installed Price ,$/kW1 kW: Total System Installed Price ,$/kW
25 kW: Total System Installed Price ,$/kW 100 kW: Total System Installed Price ,$/kW
100 sys/yr 1,000 sys/yr 10,000 sys/yr 50,000 sys/yr 100 sys/yr 1,000 sys/yr 10,000 sys/yr 50,000 sys/yr
System Installation $11,707.00 $11,707.00 $11,707.00 $11,707.00 System Installation $2,506.80 $2,506.80 $2,506.80 $2,506.80
Sales Markup $5,711.95 $4,534.16 $3,921.77 $3,613.14 Sales Markup $1,977.82 $1,641.85 $1,439.38 $1,279.24
Cost Contingency $1,038.54 $824.39 $713.05 $656.94 Cost Contingency $359.60 $298.52 $261.70 $232.59
CHP Subsytem $187.08 $161.39 $139.22 $125.56 CHP Subsystem $83.67 $72.17 $62.26 $56.15
Power/Electronics $1,949.60 $1,737.67 $1,623.71 $1,551.45 Power/Electronics $687.70 $627.50 $586.24 $563.99
Housing & Final Assembly $980.12 $808.52 $697.09 $629.61 Housing & Final Assy $215.63 $178.56 $153.90 $138.95
Fuel Processor Subsystem $4,109.04 $3,128.25 $2,674.28 $2,446.17 Fuel Processor Subsystem $1,278.79 $1,035.18 $896.47 $821.36
Fuel Cell Subsystem $3,159.51 $2,408.10 $1,996.20 $1,816.55 Fuel Cell Subsystem $1,330.25 $1,071.77 $918.18 $745.43
Total System $28,842.84 $25,309.48 $23,472.31 $22,546.43 Total System $8,440.25 $7,432.36 $6,824.93 $6,344.51
100 sys/yr 1,000 sys/yr 10,000 sys/yr 50,000 sys/yr 100 sys/yr 1,000 sys/yr 10,000 sys/yr 50,000 sys/yr
System Installation $741.24 $741.24 $741.24 $741.24 System Installation $491.83 $491.83 $491.83 $491.83
Sales Markup $889.88 $784.50 $651.05 $582.41 Sales Markup $781.58 $666.89 $556.47 $510.10
Cost Contingency $161.80 $142.64 $118.37 $105.89 Cost Contingency $142.11 $121.25 $101.18 $92.75
CHP Subsystem $37.42 $32.28 $27.84 $25.11 CHP Subsystem $18.71 $16.14 $13.92 $12.56
Power/Electronics $436.49 $402.23 $371.78 $356.22 Power/Electronics $472.24 $438.71 $406.14 $387.63
Housing & Final Assy $63.82 $53.60 $46.24 $41.78 Housing & Final Assembly $34.14 $29.06 $25.04 $22.60
Fuel Processor Subsystem $307.70 $257.98 $231.98 $220.38 Fuel Processor Subsystem $229.38 $201.92 $187.05 $179.17
Fuel Cell Subsystem $772.53 $680.28 $505.87 $415.44 Fuel Cell Subsystem $666.59 $526.71 $379.60 $325.51
Total System $3,410.87 $3,094.74 $2,694.38 $2,488.48 Total System $2,836.58 $2,492.51 $2,161.24 $2,022.14
5 kW: Total System Cost ,$/kW
100 kW: Total System Cost , $/kW
1 kW: Total System Cost ,$/kW
25kW: Total System Cost ,$/kW
100 sys/yr 1,000 sys/yr 10,000 sys/yr 50,000 sys/yr 100 sys/yr 1,000 sys/yr 10,000 sys/yr 50,000 sys/yr
System Installation $11,707.00 $11,707.00 $11,707.00 $11,707.00 System Installation $2,506.80 $2,506.80 $2,506.80 $2,506.80
Sales Markup $6,724.68 $4,021.81 $3,432.34 $3,144.53 Sales Markup $1,947.96 $1,402.11 $1,196.09 $1,111.89
Cost Contingency $1,222.67 $731.24 $624.06 $571.73 Cost Contingency $354.17 $254.93 $217.47 $202.16
CHP Subsystem $114.56 $98.83 $85.26 $76.89 CHP Subsystem $51.23 $44.20 $38.13 $34.39
Power/Electronics $1,841.74 $1,640.37 $1,535.81 $1,469.50 Power/Electronics $640.23 $583.70 $545.92 $525.54
Housing & Final Assy $966.09 $796.66 $686.90 $620.46 Housing & Final Assy $202.20 $167.05 $144.02 $130.06
Fuel Processing Subsystem $3,723.41 $2,777.49 $2,351.86 $2,142.94 Fuel Processing Subsystem $1,119.14 $885.28 $754.58 $684.79
Fuel Cell Subsystem $5,580.90 $1,999.03 $1,580.79 $1,407.54 Fuel Cell Subsystem $1,528.93 $869.07 $692.07 $646.86
Total System $31,881.05 $23,772.42 $22,004.02 $21,140.58 Total System $8,350.67 $6,713.13 $6,095.07 $5,842.48
100 sys/yr 1,000 sys/yr 10,000 sys/yr 50,000 sys/yr 100 sys/yr 1,000 sys/yr 10,000 sys/yr 50,000 sys/yr
System Installation $741.24 $741.24 $741.24 $741.24 System Installation $491.83 $491.83 $491.83 $491.83
Sales Markup $783.16 $575.11 $516.27 $493.57 Sales Markup $583.48 $492.06 $458.07 $441.54
Cost Contingency $142.39 $104.56 $93.87 $89.74 Cost Contingency $106.09 $89.46 $83.28 $80.28
CHP Subsystem $22.91 $19.77 $17.05 $15.38 CHP Subsystem $11.46 $9.88 $8.53 $7.69
Power/Electronics $401.00 $369.40 $341.58 $327.36 Power/Electronics $438.17 $407.11 $376.99 $359.72
Housing & Final Assy $51.25 $42.81 $36.96 $33.44 Housing & Final Assy $21.20 $17.94 $15.49 $14.00
Fuel Processing Subsystem $196.31 $150.39 $127.61 $118.01 Fuel Processing Subsystem $91.17 $72.62 $63.42 $58.74
Fuel Cell Subsystem $752.46 $463.28 $415.48 $403.20 Fuel Cell Subsystem $498.89 $387.09 $368.42 $362.65
Total System $3,090.73 $2,466.56 $2,290.06 $2,221.94 Total System $2,242.28 $1,968.00 $1,866.03 $1,816.45
5 kWe: Total System Cost ,$/kWe
25 kWe: Total System Cost , $/kWe
1 kWe: Total System Cost ,$/kWe
100 kWe: Total System Cost , $/kWe
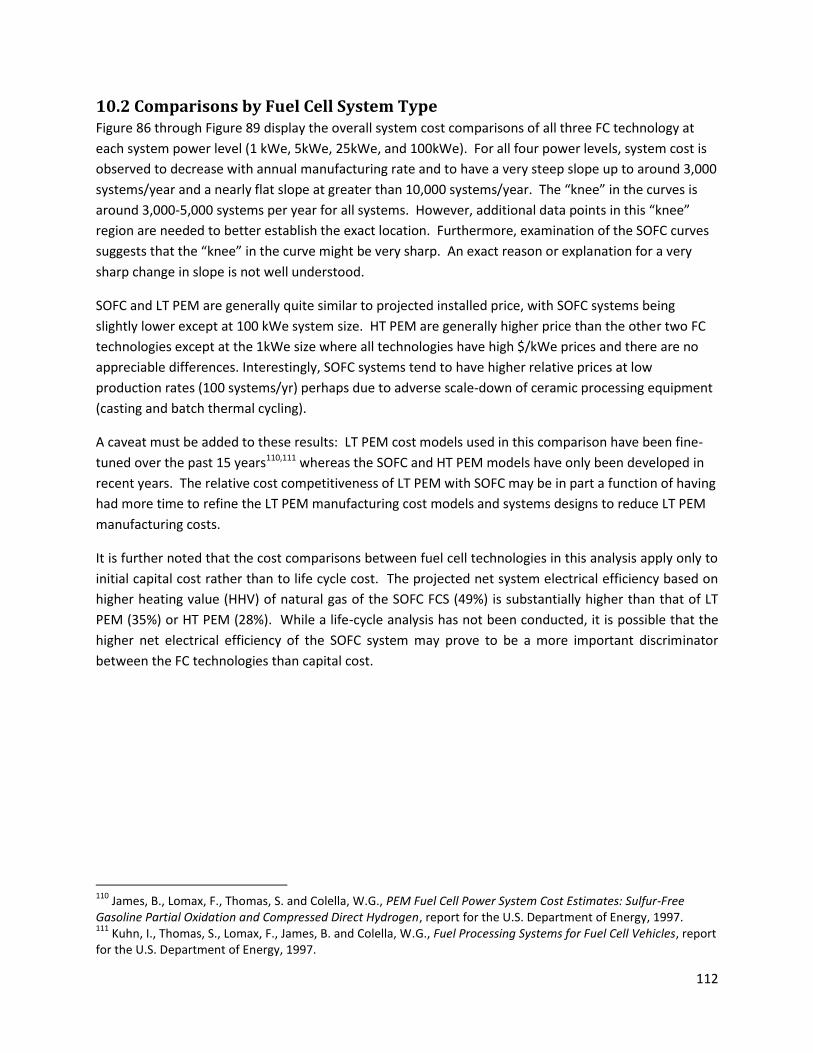
112
10.2 Comparisons by Fuel Cell System Type Figure 86 through Figure 89 display the overall system cost comparisons of all three FC technology at
each system power level (1 kWe, 5kWe, 25kWe, and 100kWe). For all four power levels, system cost is
observed to decrease with annual manufacturing rate and to have a very steep slope up to around 3,000
systems/year and a nearly flat slope at greater than 10,000 systems/year. The “knee” in the curves is
around 3,000-5,000 systems per year for all systems. However, additional data points in this “knee”
region are needed to better establish the exact location. Furthermore, examination of the SOFC curves
suggests that the “knee” in the curve might be very sharp. An exact reason or explanation for a very
sharp change in slope is not well understood.
SOFC and LT PEM are generally quite similar to projected installed price, with SOFC systems being
slightly lower except at 100 kWe system size. HT PEM are generally higher price than the other two FC
technologies except at the 1kWe size where all technologies have high $/kWe prices and there are no
appreciable differences. Interestingly, SOFC systems tend to have higher relative prices at low
production rates (100 systems/yr) perhaps due to adverse scale-down of ceramic processing equipment
(casting and batch thermal cycling).
A caveat must be added to these results: LT PEM cost models used in this comparison have been fine-
tuned over the past 15 years110,111 whereas the SOFC and HT PEM models have only been developed in
recent years. The relative cost competitiveness of LT PEM with SOFC may be in part a function of having
had more time to refine the LT PEM manufacturing cost models and systems designs to reduce LT PEM
manufacturing costs.
It is further noted that the cost comparisons between fuel cell technologies in this analysis apply only to
initial capital cost rather than to life cycle cost. The projected net system electrical efficiency based on
higher heating value (HHV) of natural gas of the SOFC FCS (49%) is substantially higher than that of LT
PEM (35%) or HT PEM (28%). While a life-cycle analysis has not been conducted, it is possible that the
higher net electrical efficiency of the SOFC system may prove to be a more important discriminator
between the FC technologies than capital cost.
110
James, B., Lomax, F., Thomas, S. and Colella, W.G., PEM Fuel Cell Power System Cost Estimates: Sulfur-Free Gasoline Partial Oxidation and Compressed Direct Hydrogen, report for the U.S. Department of Energy, 1997. 111
Kuhn, I., Thomas, S., Lomax, F., James, B. and Colella, W.G., Fuel Processing Systems for Fuel Cell Vehicles, report for the U.S. Department of Energy, 1997.
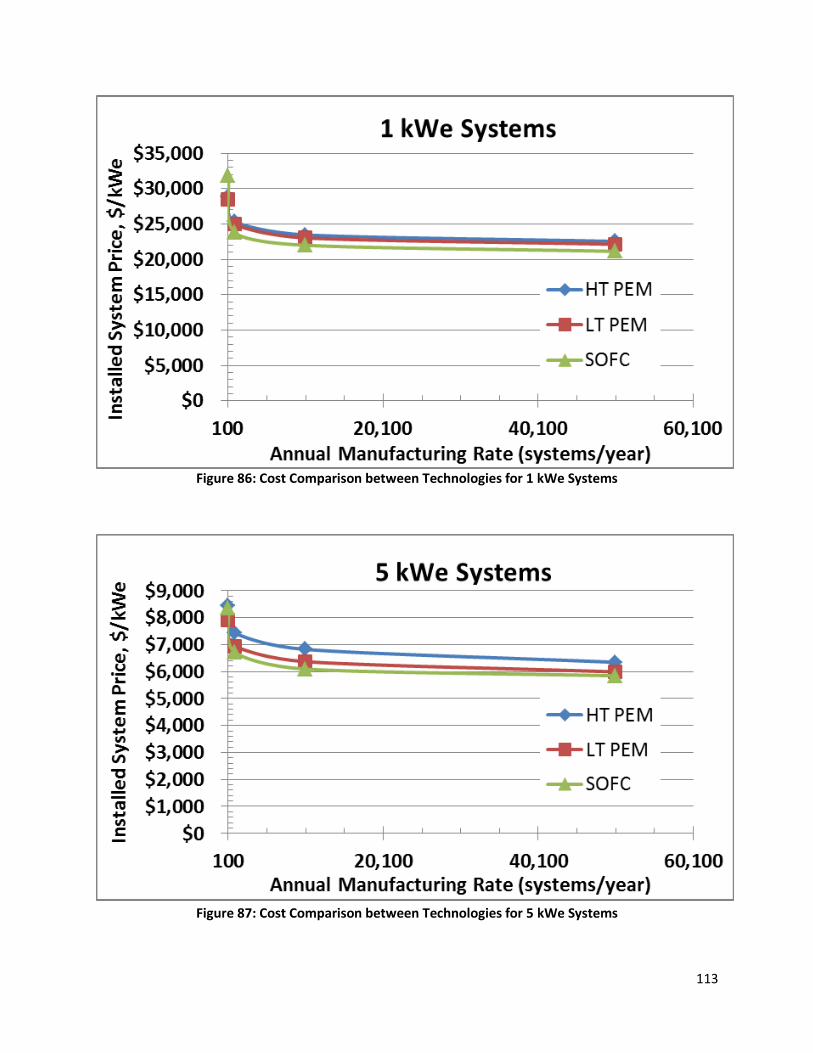
113
Figure 86: Cost Comparison between Technologies for 1 kWe Systems
Figure 87: Cost Comparison between Technologies for 5 kWe Systems
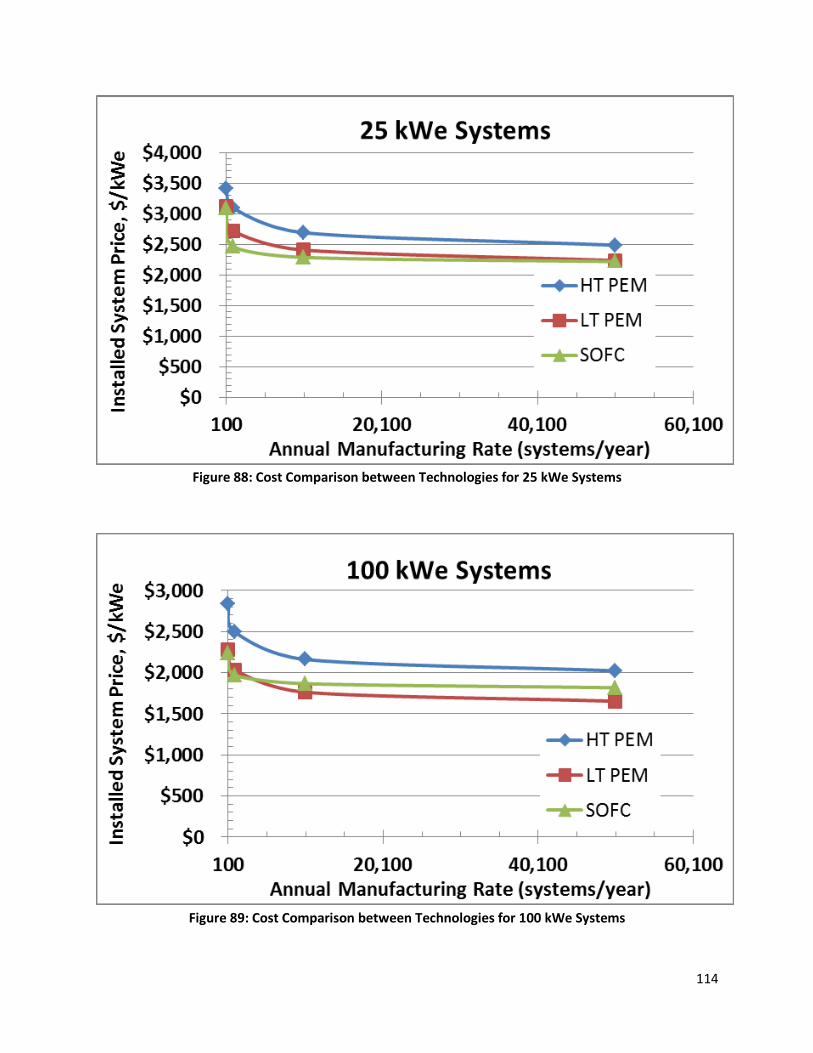
114
Figure 88: Cost Comparison between Technologies for 25 kWe Systems
Figure 89: Cost Comparison between Technologies for 100 kWe Systems
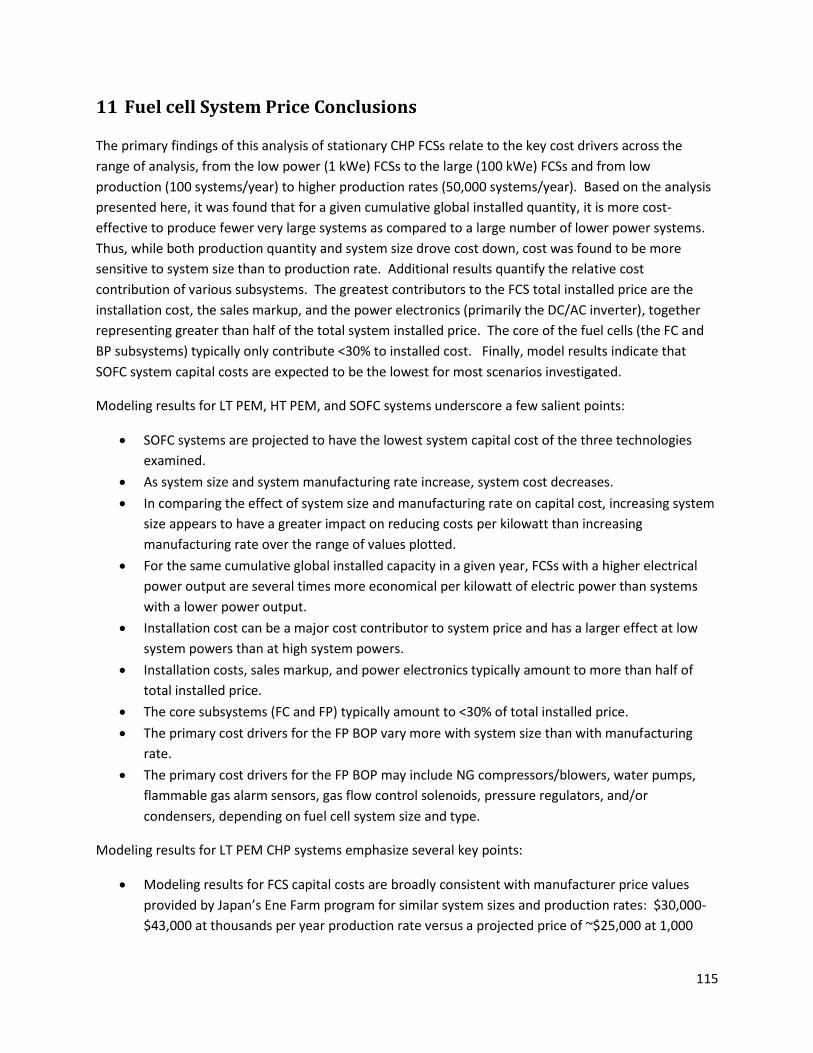
115
11 Fuel cell System Price Conclusions
The primary findings of this analysis of stationary CHP FCSs relate to the key cost drivers across the
range of analysis, from the low power (1 kWe) FCSs to the large (100 kWe) FCSs and from low
production (100 systems/year) to higher production rates (50,000 systems/year). Based on the analysis
presented here, it was found that for a given cumulative global installed quantity, it is more cost-
effective to produce fewer very large systems as compared to a large number of lower power systems.
Thus, while both production quantity and system size drove cost down, cost was found to be more
sensitive to system size than to production rate. Additional results quantify the relative cost
contribution of various subsystems. The greatest contributors to the FCS total installed price are the
installation cost, the sales markup, and the power electronics (primarily the DC/AC inverter), together
representing greater than half of the total system installed price. The core of the fuel cells (the FC and
BP subsystems) typically only contribute <30% to installed cost. Finally, model results indicate that
SOFC system capital costs are expected to be the lowest for most scenarios investigated.
Modeling results for LT PEM, HT PEM, and SOFC systems underscore a few salient points:
SOFC systems are projected to have the lowest system capital cost of the three technologies
examined.
As system size and system manufacturing rate increase, system cost decreases.
In comparing the effect of system size and manufacturing rate on capital cost, increasing system
size appears to have a greater impact on reducing costs per kilowatt than increasing
manufacturing rate over the range of values plotted.
For the same cumulative global installed capacity in a given year, FCSs with a higher electrical
power output are several times more economical per kilowatt of electric power than systems
with a lower power output.
Installation cost can be a major cost contributor to system price and has a larger effect at low
system powers than at high system powers.
Installation costs, sales markup, and power electronics typically amount to more than half of
total installed price.
The core subsystems (FC and FP) typically amount to <30% of total installed price.
The primary cost drivers for the FP BOP vary more with system size than with manufacturing
rate.
The primary cost drivers for the FP BOP may include NG compressors/blowers, water pumps,
flammable gas alarm sensors, gas flow control solenoids, pressure regulators, and/or
condensers, depending on fuel cell system size and type.
Modeling results for LT PEM CHP systems emphasize several key points:
Modeling results for FCS capital costs are broadly consistent with manufacturer price values
provided by Japan’s Ene Farm program for similar system sizes and production rates: $30,000-
$43,000 at thousands per year production rate versus a projected price of ~$25,000 at 1,000
116
systems per year (both for 1kWe systems). Non-recurring engineering (NRE) and warranty
expenses may shift the projections considerably.
For the 1 kWe system, the FP subsystem is relatively more costly than the FC subsystem at all
production levels.
For the 100 kWe system, the FC subsystem is more expensive than the FP subsystem at lower
production levels, specifically at 1,000 sys/yr and below.
For the 1 kWe system, the FP’s costs are dominated by the BOP. This modeling result is
consistent with the manufacturer test results of Japan’s Ene Farm program, which found that a
primary cost driver for CHP LT PEM systems was the FP sub-system balance of plant (BOP).
At higher power levels, the FP BOP component costs decline significantly as a proportion of the
total.
For 1 kWe FCSs, the primary cost drivers for the FP BOP are the natural gas compressor, the
flammable gas alarm sensors, and the gas flow control solenoids, in that order.
For 100 kWe FCSs, the primary cost drivers for the FP BOP are the water pump and the
condenser, in that order.
For 1 kWe FCSs, BOP component costs constitute as much as 70% of FC subsystem costs.
For 100 kWe FCSs, FC stack costs constitute as much as 80% of FC subsystem costs.
At both the 1 kWe and 100 kWe size range, fuel cell subsystem assembly costs are estimated to
be fairly negligible.
Modeling results for HT PEM CHP systems emphasize additional important points:
Modeling results for HT PEM FCS capital costs are broadly consistent with manufacturer values
provided via a 2012 DOE deployment program of HTPEM systems. Data for 15 deployed 5kWe
systems suggest a price of ~$16,000/kW compared to a projected price of ~$8,000/kWe at 100
sys/year. This factor of two underestimation of installed price may be an artifact of different
annual manufacturing rates, comparison with a non-commercial product early in its
development stage, or lack of inclusion of non-recurring engineering expenses.
The lower power density of the HTPEM stack results in a large mass and volume of FC stack
needed, compared with the LTPEM. At the same time, the HT and LT PEM system designs are
very similar, and costs tend to scale with mass and/or volume. As a result, HT PEM stack costs
are higher and contribute to a larger percentage of total system costs.
At the 1 kWe size, BOP costs dominate FP subsystem costs. At the 100 kWe size, fuel processor
costs dominate FP subsystem costs.
For 1 kWe FCSs, the primary cost drivers for the FP BOP are the natural gas compressor, the
flammable gas alarm sensors, and the gas flow control solenoids, in that order.
For 100 kWe FCSs, the primary cost drivers for the FP BOP are the water pump and the
condenser, in that order.
At low power (1 kWe), the FP subsystem cost is dominated by the FP BOP components.
At high power (100 kWe), the FC stack cost dominates the total system cost.
At 1 kWe, FC BOP component costs constitute 60% or more of FC subsystem costs.
117
Modeling results for SOFC CHP systems underscore some additional key points:
Modeling results for SOFC capital costs show very good agreement with manufacturer values
provided by Ceramic Fuel Cells Limited (CFCL) of Australia. The CFCL combined capital and
installation cost is roughly $27,000/kWe112, 113 for 1kWe systems produced in ~100 units
(possibly over several years). For comparison, modeling projections indicate a cost of roughly
$32,000/kWe at the 100 sys/yr production rate. This is close agreement considering the many
company specific factors which go into setting a price.
For the 1 kWe system, model results indicate that the FP subsystem is relatively more costly
than the FC subsystem at production levels of 1,000 sys/yr and above. By contrast, for the 100
kWe system, the FC subsystem contributes about 65% to total cost.
For the 1 kWe and 100 kWe systems, the fuel processing subsystem costs are dominated by the
FP BOP.
At low power (1kWe), at production rates above 1,000 sys/yr, the FP subsystem cost is
dominated by the BOP components.
At 100 kWe, FC stack costs constitute over 90% of FC subsystem costs.
112
Colella, W.G. and Pilli, S.P., 2012, “Energy System and Thermoeconomic Analysis of Combined Heat and Power (CHP) High Temperature Proton Exchange Membrane (HTPEM) Fuel Cell Systems (FCSs) for Light Commercial Buildings,” ASME Journal of Fuel Cell Science and Technology, (in print). PNNL-SA-86986. Fig. 11. 113
Colella, W.G. and Pilli, S.P., 2012, “Independent Evaluation of Micro-Cogenerative Fuel Cell Systems For Commercial Buildings,” Proceedings of the ASME 2012 10th Fuel Cell Science, Engineering and Technology Conference, July 23-26, 2012, San Diego, CA, USA. ESFuelCell2012-91479. PNNL-SA-84709. Fig. 11.
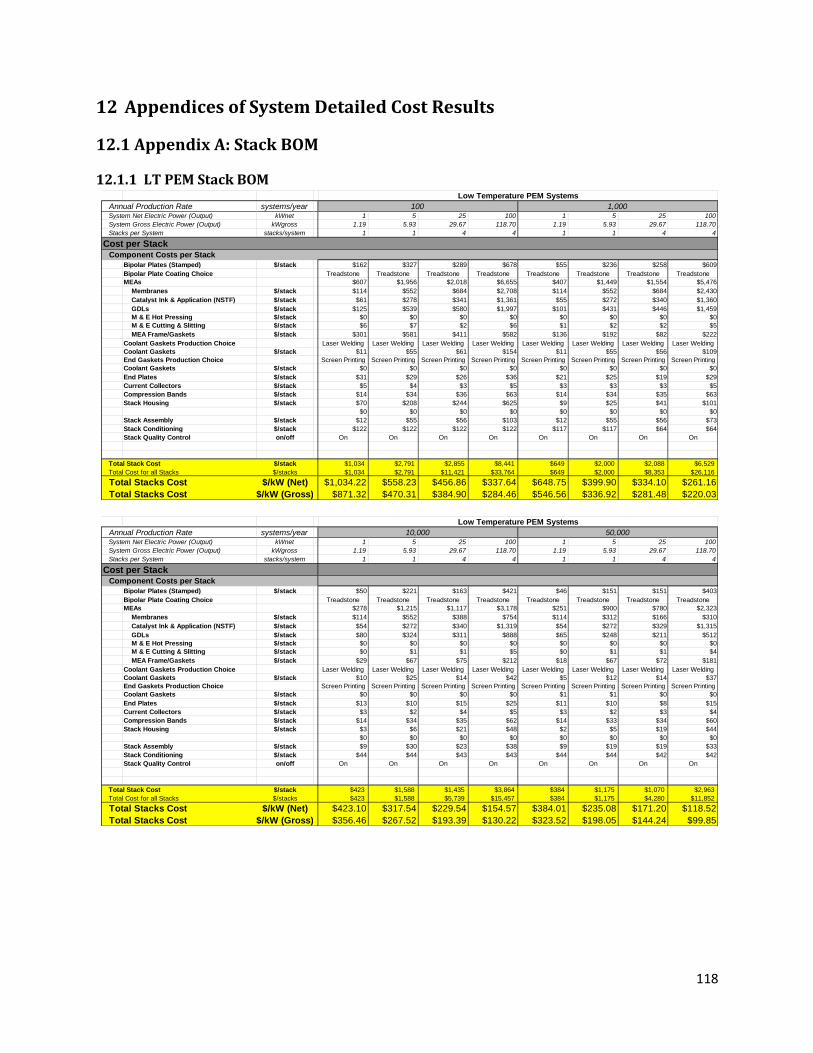
118
12 Appendices of System Detailed Cost Results
12.1 Appendix A: Stack BOM
12.1.1 LT PEM Stack BOM
Annual Production Rate systems/yearSystem Net Electric Power (Output) kWnet 1 5 25 100 1 5 25 100
System Gross Electric Power (Output) kWgross 1.19 5.93 29.67 118.70 1.19 5.93 29.67 118.70
Stacks per System stacks/system 1 1 4 4 1 1 4 4
Cost per Stack Component Costs per Stack
Bipolar Plates (Stamped) $/stack $162 $327 $289 $678 $55 $236 $258 $609
Bipolar Plate Coating Choice Treadstone Treadstone Treadstone Treadstone Treadstone Treadstone Treadstone Treadstone
MEAs $607 $1,956 $2,018 $6,655 $407 $1,449 $1,554 $5,476
Membranes $/stack $114 $552 $684 $2,708 $114 $552 $684 $2,430
Catalyst Ink & Application (NSTF) $/stack $61 $278 $341 $1,361 $55 $272 $340 $1,360
GDLs $/stack $125 $539 $580 $1,997 $101 $431 $446 $1,459
M & E Hot Pressing $/stack $0 $0 $0 $0 $0 $0 $0 $0
M & E Cutting & Slitting $/stack $6 $7 $2 $6 $1 $2 $2 $5
MEA Frame/Gaskets $/stack $301 $581 $411 $582 $136 $192 $82 $222
Coolant Gaskets Production Choice Laser Welding Laser Welding Laser Welding Laser Welding Laser Welding Laser Welding Laser Welding Laser Welding
Coolant Gaskets $/stack $11 $55 $61 $154 $11 $55 $56 $109
End Gaskets Production Choice Screen Printing Screen Printing Screen Printing Screen Printing Screen Printing Screen Printing Screen Printing Screen Printing
Coolant Gaskets $/stack $0 $0 $0 $0 $0 $0 $0 $0
End Plates $/stack $31 $29 $26 $36 $21 $25 $19 $29
Current Collectors $/stack $5 $4 $3 $5 $3 $3 $3 $5
Compression Bands $/stack $14 $34 $36 $63 $14 $34 $35 $63
Stack Housing $/stack $70 $208 $244 $625 $9 $25 $41 $101
$0 $0 $0 $0 $0 $0 $0 $0
Stack Assembly $/stack $12 $55 $56 $103 $12 $55 $56 $73
Stack Conditioning $/stack $122 $122 $122 $122 $117 $117 $64 $64
Stack Quality Control on/off On On On On On On On On
Total Stack Cost $/stack $1,034 $2,791 $2,855 $8,441 $649 $2,000 $2,088 $6,529
Total Cost for all Stacks $/stacks $1,034 $2,791 $11,421 $33,764 $649 $2,000 $8,353 $26,116
Total Stacks Cost $/kW (Net) $1,034.22 $558.23 $456.86 $337.64 $648.75 $399.90 $334.10 $261.16
Total Stacks Cost $/kW (Gross) $871.32 $470.31 $384.90 $284.46 $546.56 $336.92 $281.48 $220.03
Low Temperature PEM Systems
100 1,000
Annual Production Rate systems/yearSystem Net Electric Power (Output) kWnet 1 5 25 100 1 5 25 100
System Gross Electric Power (Output) kWgross 1.19 5.93 29.67 118.70 1.19 5.93 29.67 118.70
Stacks per System stacks/system 1 1 4 4 1 1 4 4
Cost per Stack Component Costs per Stack
Bipolar Plates (Stamped) $/stack $50 $221 $163 $421 $46 $151 $151 $403
Bipolar Plate Coating Choice Treadstone Treadstone Treadstone Treadstone Treadstone Treadstone Treadstone Treadstone
MEAs $278 $1,215 $1,117 $3,178 $251 $900 $780 $2,323
Membranes $/stack $114 $552 $388 $754 $114 $312 $166 $310
Catalyst Ink & Application (NSTF) $/stack $54 $272 $340 $1,319 $54 $272 $329 $1,315
GDLs $/stack $80 $324 $311 $888 $65 $248 $211 $512
M & E Hot Pressing $/stack $0 $0 $0 $0 $0 $0 $0 $0
M & E Cutting & Slitting $/stack $0 $1 $1 $5 $0 $1 $1 $4
MEA Frame/Gaskets $/stack $29 $67 $75 $212 $18 $67 $72 $181
Coolant Gaskets Production Choice Laser Welding Laser Welding Laser Welding Laser Welding Laser Welding Laser Welding Laser Welding Laser Welding
Coolant Gaskets $/stack $10 $25 $14 $42 $5 $12 $14 $37
End Gaskets Production Choice Screen Printing Screen Printing Screen Printing Screen Printing Screen Printing Screen Printing Screen Printing Screen Printing
Coolant Gaskets $/stack $0 $0 $0 $0 $1 $1 $0 $0
End Plates $/stack $13 $10 $15 $25 $11 $10 $8 $15
Current Collectors $/stack $3 $2 $4 $5 $3 $2 $3 $4
Compression Bands $/stack $14 $34 $35 $62 $14 $33 $34 $60
Stack Housing $/stack $3 $6 $21 $48 $2 $5 $19 $44
$0 $0 $0 $0 $0 $0 $0 $0
Stack Assembly $/stack $9 $30 $23 $38 $9 $19 $19 $33
Stack Conditioning $/stack $44 $44 $43 $43 $44 $44 $42 $42
Stack Quality Control on/off On On On On On On On On
Total Stack Cost $/stack $423 $1,588 $1,435 $3,864 $384 $1,175 $1,070 $2,963
Total Cost for all Stacks $/stacks $423 $1,588 $5,739 $15,457 $384 $1,175 $4,280 $11,852
Total Stacks Cost $/kW (Net) $423.10 $317.54 $229.54 $154.57 $384.01 $235.08 $171.20 $118.52
Total Stacks Cost $/kW (Gross) $356.46 $267.52 $193.39 $130.22 $323.52 $198.05 $144.24 $99.85
Low Temperature PEM Systems
10,000 50,000
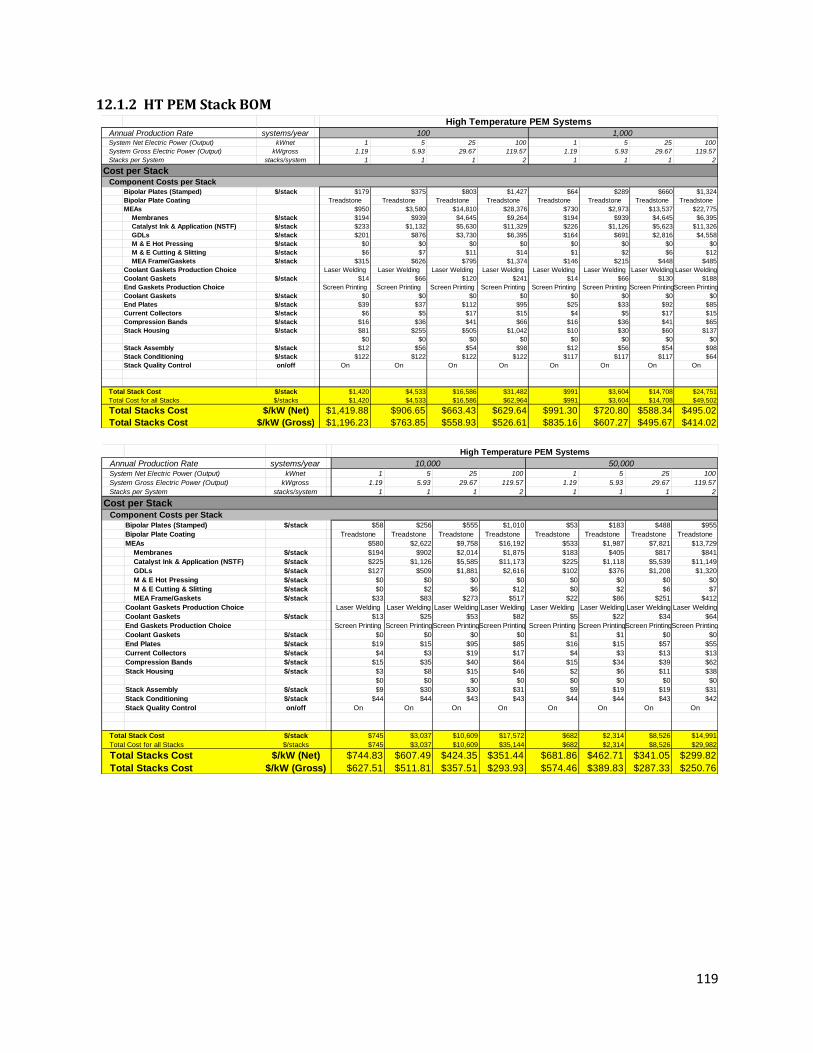
119
12.1.2 HT PEM Stack BOM
Annual Production Rate systems/yearSystem Net Electric Power (Output) kWnet 1 5 25 100 1 5 25 100
System Gross Electric Power (Output) kWgross 1.19 5.93 29.67 119.57 1.19 5.93 29.67 119.57
Stacks per System stacks/system 1 1 1 2 1 1 1 2
Cost per Stack Component Costs per Stack
Bipolar Plates (Stamped) $/stack $179 $375 $803 $1,427 $64 $289 $660 $1,324
Bipolar Plate Coating Treadstone Treadstone Treadstone Treadstone Treadstone Treadstone Treadstone Treadstone
MEAs $950 $3,580 $14,810 $28,376 $730 $2,973 $13,537 $22,775
Membranes $/stack $194 $939 $4,645 $9,264 $194 $939 $4,645 $6,395
Catalyst Ink & Application (NSTF) $/stack $233 $1,132 $5,630 $11,329 $226 $1,126 $5,623 $11,326
GDLs $/stack $201 $876 $3,730 $6,395 $164 $691 $2,816 $4,558
M & E Hot Pressing $/stack $0 $0 $0 $0 $0 $0 $0 $0
M & E Cutting & Slitting $/stack $6 $7 $11 $14 $1 $2 $6 $12
MEA Frame/Gaskets $/stack $315 $626 $795 $1,374 $146 $215 $448 $485
Coolant Gaskets Production Choice Laser Welding Laser Welding Laser Welding Laser Welding Laser Welding Laser Welding Laser Welding Laser Welding
Coolant Gaskets $/stack $14 $66 $120 $241 $14 $66 $130 $188
End Gaskets Production Choice Screen Printing Screen Printing Screen Printing Screen Printing Screen Printing Screen Printing Screen PrintingScreen Printing
Coolant Gaskets $/stack $0 $0 $0 $0 $0 $0 $0 $0
End Plates $/stack $39 $37 $112 $95 $25 $33 $92 $85
Current Collectors $/stack $6 $5 $17 $15 $4 $5 $17 $15
Compression Bands $/stack $16 $36 $41 $66 $16 $36 $41 $65
Stack Housing $/stack $81 $255 $505 $1,042 $10 $30 $60 $137
$0 $0 $0 $0 $0 $0 $0 $0
Stack Assembly $/stack $12 $56 $54 $98 $12 $56 $54 $98
Stack Conditioning $/stack $122 $122 $122 $122 $117 $117 $117 $64
Stack Quality Control on/off On On On On On On On On
Total Stack Cost $/stack $1,420 $4,533 $16,586 $31,482 $991 $3,604 $14,708 $24,751
Total Cost for all Stacks $/stacks $1,420 $4,533 $16,586 $62,964 $991 $3,604 $14,708 $49,502
Total Stacks Cost $/kW (Net) $1,419.88 $906.65 $663.43 $629.64 $991.30 $720.80 $588.34 $495.02
Total Stacks Cost $/kW (Gross) $1,196.23 $763.85 $558.93 $526.61 $835.16 $607.27 $495.67 $414.02
High Temperature PEM Systems
100 1,000
Annual Production Rate systems/yearSystem Net Electric Power (Output) kWnet 1 5 25 100 1 5 25 100
System Gross Electric Power (Output) kWgross 1.19 5.93 29.67 119.57 1.19 5.93 29.67 119.57
Stacks per System stacks/system 1 1 1 2 1 1 1 2
Cost per Stack Component Costs per Stack
Bipolar Plates (Stamped) $/stack $58 $256 $555 $1,010 $53 $183 $488 $955
Bipolar Plate Coating Treadstone Treadstone Treadstone Treadstone Treadstone Treadstone Treadstone Treadstone
MEAs $580 $2,622 $9,758 $16,192 $533 $1,987 $7,821 $13,729
Membranes $/stack $194 $902 $2,014 $1,875 $183 $405 $817 $841
Catalyst Ink & Application (NSTF) $/stack $225 $1,126 $5,585 $11,173 $225 $1,118 $5,539 $11,149
GDLs $/stack $127 $509 $1,881 $2,616 $102 $376 $1,208 $1,320
M & E Hot Pressing $/stack $0 $0 $0 $0 $0 $0 $0 $0
M & E Cutting & Slitting $/stack $0 $2 $6 $12 $0 $2 $6 $7
MEA Frame/Gaskets $/stack $33 $83 $273 $517 $22 $86 $251 $412
Coolant Gaskets Production Choice Laser Welding Laser Welding Laser Welding Laser Welding Laser Welding Laser Welding Laser Welding Laser Welding
Coolant Gaskets $/stack $13 $25 $53 $82 $5 $22 $34 $64
End Gaskets Production Choice Screen Printing Screen PrintingScreen PrintingScreen Printing Screen Printing Screen PrintingScreen PrintingScreen Printing
Coolant Gaskets $/stack $0 $0 $0 $0 $1 $1 $0 $0
End Plates $/stack $19 $15 $95 $85 $16 $15 $57 $55
Current Collectors $/stack $4 $3 $19 $17 $4 $3 $13 $13
Compression Bands $/stack $15 $35 $40 $64 $15 $34 $39 $62
Stack Housing $/stack $3 $8 $15 $46 $2 $6 $11 $38
$0 $0 $0 $0 $0 $0 $0 $0
Stack Assembly $/stack $9 $30 $30 $31 $9 $19 $19 $31
Stack Conditioning $/stack $44 $44 $43 $43 $44 $44 $43 $42
Stack Quality Control on/off On On On On On On On On
Total Stack Cost $/stack $745 $3,037 $10,609 $17,572 $682 $2,314 $8,526 $14,991
Total Cost for all Stacks $/stacks $745 $3,037 $10,609 $35,144 $682 $2,314 $8,526 $29,982
Total Stacks Cost $/kW (Net) $744.83 $607.49 $424.35 $351.44 $681.86 $462.71 $341.05 $299.82
Total Stacks Cost $/kW (Gross) $627.51 $511.81 $357.51 $293.93 $574.46 $389.83 $287.33 $250.76
High Temperature PEM Systems
10,000 50,000
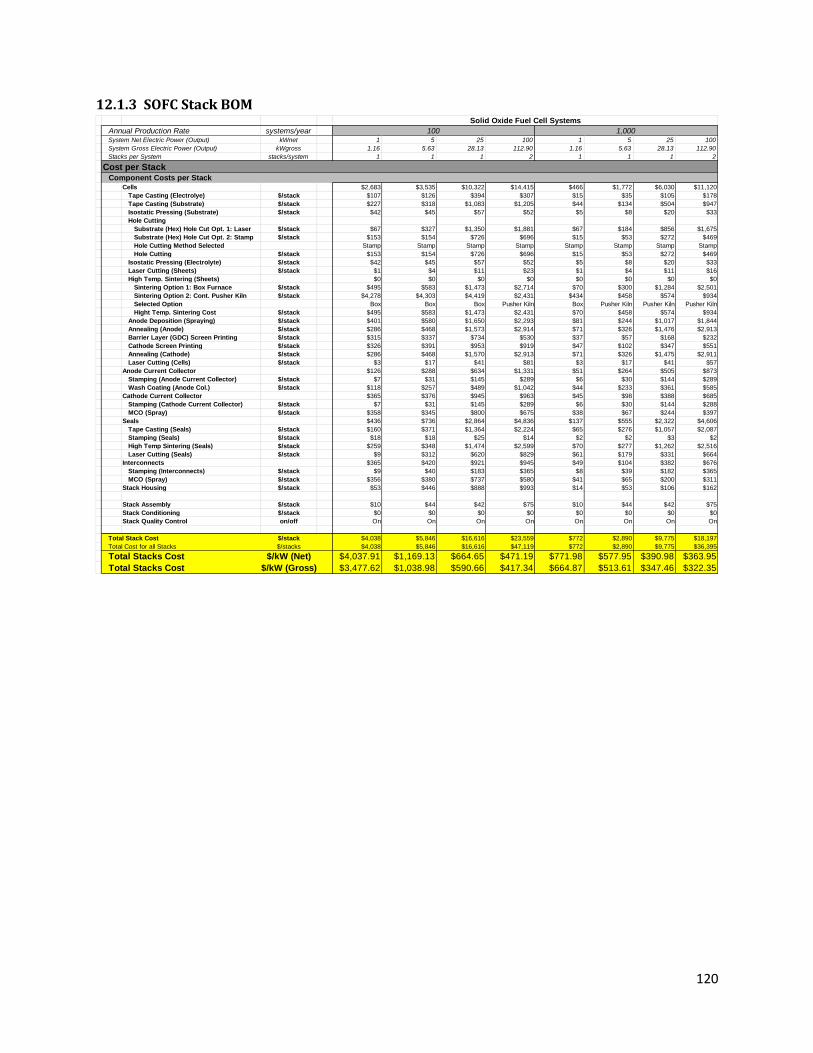
120
12.1.3 SOFC Stack BOM
Annual Production Rate systems/yearSystem Net Electric Power (Output) kWnet 1 5 25 100 1 5 25 100
System Gross Electric Power (Output) kWgross 1.16 5.63 28.13 112.90 1.16 5.63 28.13 112.90
Stacks per System stacks/system 1 1 1 2 1 1 1 2
Cost per StackComponent Costs per Stack
Cells $2,683 $3,535 $10,322 $14,415 $466 $1,772 $6,030 $11,120
Tape Casting (Electrolye) $/stack $107 $126 $394 $307 $15 $35 $105 $178
Tape Casting (Substrate) $/stack $227 $318 $1,083 $1,205 $44 $134 $504 $947
Isostatic Pressing (Substrate) $/stack $42 $45 $57 $52 $5 $8 $20 $33
Hole Cutting
Substrate (Hex) Hole Cut Opt. 1: Laser $/stack $67 $327 $1,350 $1,881 $67 $184 $856 $1,675
Substrate (Hex) Hole Cut Opt. 2: Stamp $/stack $153 $154 $726 $696 $15 $53 $272 $469
Hole Cutting Method Selected Stamp Stamp Stamp Stamp Stamp Stamp Stamp Stamp
Hole Cutting $/stack $153 $154 $726 $696 $15 $53 $272 $469
Isostatic Pressing (Electrolyte) $/stack $42 $45 $57 $52 $5 $8 $20 $33
Laser Cutting (Sheets) $/stack $1 $4 $11 $23 $1 $4 $11 $16
High Temp. Sintering (Sheets) $0 $0 $0 $0 $0 $0 $0 $0
Sintering Option 1: Box Furnace $/stack $495 $583 $1,473 $2,714 $70 $300 $1,284 $2,501
Sintering Option 2: Cont. Pusher Kiln $/stack $4,278 $4,303 $4,419 $2,431 $434 $458 $574 $934
Selected Option Box Box Box Pusher Kiln Box Pusher Kiln Pusher Kiln Pusher Kiln
Hight Temp. Sintering Cost $/stack $495 $583 $1,473 $2,431 $70 $458 $574 $934
Anode Deposition (Spraying) $/stack $401 $580 $1,650 $2,293 $81 $244 $1,017 $1,844
Annealing (Anode) $/stack $286 $468 $1,573 $2,914 $71 $326 $1,476 $2,913
Barrier Layer (GDC) Screen Printing $/stack $315 $337 $734 $530 $37 $57 $168 $232
Cathode Screen Printing $/stack $326 $391 $953 $919 $47 $102 $347 $551
Annealing (Cathode) $/stack $286 $468 $1,570 $2,913 $71 $326 $1,475 $2,911
Laser Cutting (Cells) $/stack $3 $17 $41 $81 $3 $17 $41 $57
Anode Current Collector $126 $288 $634 $1,331 $51 $264 $505 $873
Stamping (Anode Current Collector) $/stack $7 $31 $145 $289 $6 $30 $144 $289
Wash Coating (Anode Col.) $/stack $118 $257 $489 $1,042 $44 $233 $361 $585
Cathode Current Collector $365 $376 $945 $963 $45 $98 $388 $685
Stamping (Cathode Current Collector) $/stack $7 $31 $145 $289 $6 $30 $144 $288
MCO (Spray) $/stack $358 $345 $800 $675 $38 $67 $244 $397
Seals $436 $736 $2,864 $4,836 $137 $555 $2,322 $4,606
Tape Casting (Seals) $/stack $160 $371 $1,364 $2,224 $65 $276 $1,057 $2,087
Stamping (Seals) $/stack $18 $18 $25 $14 $2 $2 $3 $2
High Temp Sintering (Seals) $/stack $259 $348 $1,474 $2,599 $70 $277 $1,262 $2,516
Laser Cutting (Seals) $/stack $9 $312 $620 $829 $61 $179 $331 $664
Interconnects $365 $420 $921 $945 $49 $104 $382 $676
Stamping (Interconnects) $/stack $9 $40 $183 $365 $8 $39 $182 $365
MCO (Spray) $/stack $356 $380 $737 $580 $41 $65 $200 $311
Stack Housing $/stack $53 $446 $888 $993 $14 $53 $106 $162
Stack Assembly $/stack $10 $44 $42 $75 $10 $44 $42 $75
Stack Conditioning $/stack $0 $0 $0 $0 $0 $0 $0 $0
Stack Quality Control on/off On On On On On On On On
Total Stack Cost $/stack $4,038 $5,846 $16,616 $23,559 $772 $2,890 $9,775 $18,197
Total Cost for all Stacks $/stacks $4,038 $5,846 $16,616 $47,119 $772 $2,890 $9,775 $36,395
Total Stacks Cost $/kW (Net) $4,037.91 $1,169.13 $664.65 $471.19 $771.98 $577.95 $390.98 $363.95
Total Stacks Cost $/kW (Gross) $3,477.62 $1,038.98 $590.66 $417.34 $664.87 $513.61 $347.46 $322.35
Solid Oxide Fuel Cell Systems
100 1,000
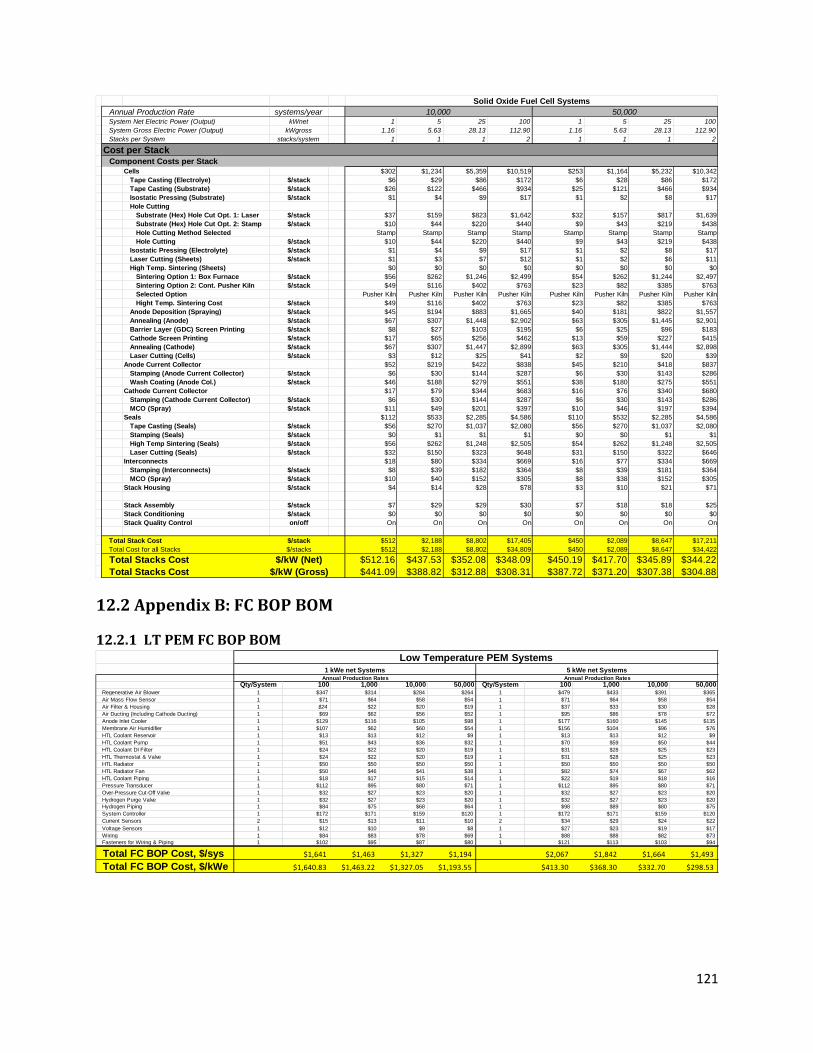
121
12.2 Appendix B: FC BOP BOM
12.2.1 LT PEM FC BOP BOM
Annual Production Rate systems/yearSystem Net Electric Power (Output) kWnet 1 5 25 100 1 5 25 100
System Gross Electric Power (Output) kWgross 1.16 5.63 28.13 112.90 1.16 5.63 28.13 112.90
Stacks per System stacks/system 1 1 1 2 1 1 1 2
Cost per StackComponent Costs per Stack
Cells $302 $1,234 $5,359 $10,519 $253 $1,164 $5,232 $10,342
Tape Casting (Electrolye) $/stack $6 $29 $86 $172 $6 $28 $86 $172
Tape Casting (Substrate) $/stack $26 $122 $466 $934 $25 $121 $466 $934
Isostatic Pressing (Substrate) $/stack $1 $4 $9 $17 $1 $2 $8 $17
Hole Cutting
Substrate (Hex) Hole Cut Opt. 1: Laser $/stack $37 $159 $823 $1,642 $32 $157 $817 $1,639
Substrate (Hex) Hole Cut Opt. 2: Stamp $/stack $10 $44 $220 $440 $9 $43 $219 $438
Hole Cutting Method Selected Stamp Stamp Stamp Stamp Stamp Stamp Stamp Stamp
Hole Cutting $/stack $10 $44 $220 $440 $9 $43 $219 $438
Isostatic Pressing (Electrolyte) $/stack $1 $4 $9 $17 $1 $2 $8 $17
Laser Cutting (Sheets) $/stack $1 $3 $7 $12 $1 $2 $6 $11
High Temp. Sintering (Sheets) $0 $0 $0 $0 $0 $0 $0 $0
Sintering Option 1: Box Furnace $/stack $56 $262 $1,246 $2,499 $54 $262 $1,244 $2,497
Sintering Option 2: Cont. Pusher Kiln $/stack $49 $116 $402 $763 $23 $82 $385 $763
Selected Option Pusher Kiln Pusher Kiln Pusher Kiln Pusher Kiln Pusher Kiln Pusher Kiln Pusher Kiln Pusher Kiln
Hight Temp. Sintering Cost $/stack $49 $116 $402 $763 $23 $82 $385 $763
Anode Deposition (Spraying) $/stack $45 $194 $883 $1,665 $40 $181 $822 $1,557
Annealing (Anode) $/stack $67 $307 $1,448 $2,902 $63 $305 $1,445 $2,901
Barrier Layer (GDC) Screen Printing $/stack $8 $27 $103 $195 $6 $25 $96 $183
Cathode Screen Printing $/stack $17 $65 $256 $462 $13 $59 $227 $415
Annealing (Cathode) $/stack $67 $307 $1,447 $2,899 $63 $305 $1,444 $2,898
Laser Cutting (Cells) $/stack $3 $12 $25 $41 $2 $9 $20 $39
Anode Current Collector $52 $219 $422 $838 $45 $210 $418 $837
Stamping (Anode Current Collector) $/stack $6 $30 $144 $287 $6 $30 $143 $286
Wash Coating (Anode Col.) $/stack $46 $188 $279 $551 $38 $180 $275 $551
Cathode Current Collector $17 $79 $344 $683 $16 $76 $340 $680
Stamping (Cathode Current Collector) $/stack $6 $30 $144 $287 $6 $30 $143 $286
MCO (Spray) $/stack $11 $49 $201 $397 $10 $46 $197 $394
Seals $112 $533 $2,285 $4,586 $110 $532 $2,285 $4,586
Tape Casting (Seals) $/stack $56 $270 $1,037 $2,080 $56 $270 $1,037 $2,080
Stamping (Seals) $/stack $0 $1 $1 $1 $0 $0 $1 $1
High Temp Sintering (Seals) $/stack $56 $262 $1,248 $2,505 $54 $262 $1,248 $2,505
Laser Cutting (Seals) $/stack $32 $150 $323 $648 $31 $150 $322 $646
Interconnects $18 $80 $334 $669 $16 $77 $334 $669
Stamping (Interconnects) $/stack $8 $39 $182 $364 $8 $39 $181 $364
MCO (Spray) $/stack $10 $40 $152 $305 $8 $38 $152 $305
Stack Housing $/stack $4 $14 $28 $78 $3 $10 $21 $71
Stack Assembly $/stack $7 $29 $29 $30 $7 $18 $18 $25
Stack Conditioning $/stack $0 $0 $0 $0 $0 $0 $0 $0
Stack Quality Control on/off On On On On On On On On
Total Stack Cost $/stack $512 $2,188 $8,802 $17,405 $450 $2,089 $8,647 $17,211
Total Cost for all Stacks $/stacks $512 $2,188 $8,802 $34,809 $450 $2,089 $8,647 $34,422
Total Stacks Cost $/kW (Net) $512.16 $437.53 $352.08 $348.09 $450.19 $417.70 $345.89 $344.22
Total Stacks Cost $/kW (Gross) $441.09 $388.82 $312.88 $308.31 $387.72 $371.20 $307.38 $304.88
Solid Oxide Fuel Cell Systems
10,000 50,000
Qty/System 100 1,000 10,000 50,000 Qty/System 100 1,000 10,000 50,000Regenerative Air Blower 1 $347 $314 $284 $264 1 $479 $433 $391 $365
Air Mass Flow Sensor 1 $71 $64 $58 $54 1 $71 $64 $58 $54
Air Filter & Housing 1 $24 $22 $20 $19 1 $37 $33 $30 $28
Air Ducting (Including Cathode Ducting) 1 $69 $62 $56 $52 1 $95 $86 $78 $72
Anode Inlet Cooler 1 $129 $116 $105 $98 1 $177 $160 $145 $135
Membrane Air Humidifier 1 $107 $62 $60 $54 1 $156 $104 $96 $76
HTL Coolant Reservoir 1 $13 $13 $12 $9 1 $13 $13 $12 $9
HTL Coolant Pump 1 $51 $43 $36 $32 1 $70 $59 $50 $44
HTL Coolant DI Filter 1 $24 $22 $20 $19 1 $31 $28 $25 $23
HTL Thermostat & Valve 1 $24 $22 $20 $19 1 $31 $28 $25 $23
HTL Radiator 1 $50 $50 $50 $50 1 $50 $50 $50 $50
HTL Radiator Fan 1 $50 $46 $41 $38 1 $82 $74 $67 $62
HTL Coolant Piping 1 $18 $17 $15 $14 1 $22 $19 $18 $16
Pressure Transducer 1 $112 $95 $80 $71 1 $112 $95 $80 $71
Over-Pressure Cut-Off Valve 1 $32 $27 $23 $20 1 $32 $27 $23 $20
Hydrogen Purge Valve 1 $32 $27 $23 $20 1 $32 $27 $23 $20
Hydrogen Piping 1 $84 $75 $68 $64 1 $98 $89 $80 $75
System Controller 1 $172 $171 $159 $120 1 $172 $171 $159 $120
Current Sensors 2 $15 $13 $11 $10 2 $34 $29 $24 $22
Voltage Sensors 1 $12 $10 $9 $8 1 $27 $23 $19 $17
Wiring 1 $84 $83 $78 $69 1 $88 $88 $82 $73
Fasteners for Wiring & Piping 1 $102 $95 $87 $80 1 $121 $113 $103 $94
Total FC BOP Cost, $/sys $1,641 $1,463 $1,327 $1,194 $2,067 $1,842 $1,664 $1,493
Total FC BOP Cost, $/kWe $1,640.83 $1,463.22 $1,327.05 $1,193.55 $413.30 $368.30 $332.70 $298.53
Low Temperature PEM Systems1 kWe net Systems 5 kWe net Systems
Annual Production RatesAnnual Production Rates
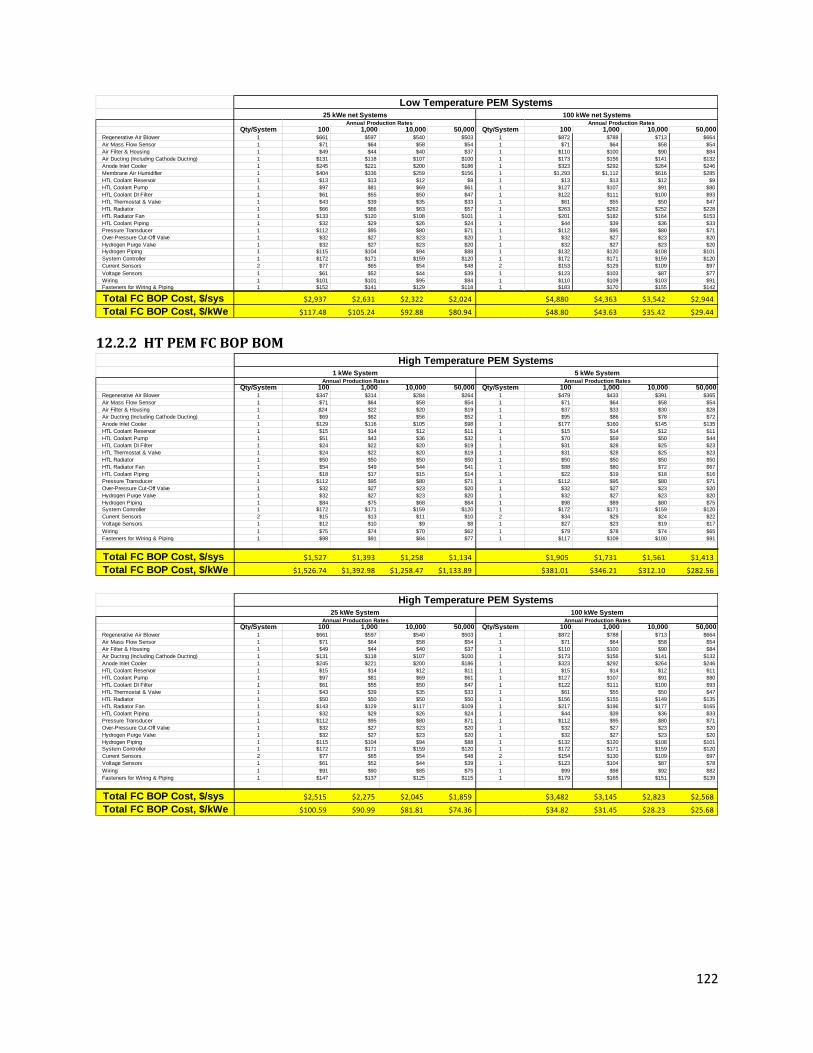
122
12.2.2 HT PEM FC BOP BOM
Qty/System 100 1,000 10,000 50,000 Qty/System 100 1,000 10,000 50,000Regenerative Air Blower 1 $661 $597 $540 $503 1 $872 $788 $713 $664
Air Mass Flow Sensor 1 $71 $64 $58 $54 1 $71 $64 $58 $54
Air Filter & Housing 1 $49 $44 $40 $37 1 $110 $100 $90 $84
Air Ducting (Including Cathode Ducting) 1 $131 $118 $107 $100 1 $173 $156 $141 $132
Anode Inlet Cooler 1 $245 $221 $200 $186 1 $323 $292 $264 $246
Membrane Air Humidifier 1 $404 $336 $259 $156 1 $1,293 $1,112 $616 $285
HTL Coolant Reservoir 1 $13 $13 $12 $9 1 $13 $13 $12 $9
HTL Coolant Pump 1 $97 $81 $69 $61 1 $127 $107 $91 $80
HTL Coolant DI Filter 1 $61 $55 $50 $47 1 $122 $111 $100 $93
HTL Thermostat & Valve 1 $43 $39 $35 $33 1 $61 $55 $50 $47
HTL Radiator 1 $66 $66 $63 $57 1 $263 $262 $252 $228
HTL Radiator Fan 1 $133 $120 $108 $101 1 $201 $182 $164 $153
HTL Coolant Piping 1 $32 $29 $26 $24 1 $44 $39 $36 $33
Pressure Transducer 1 $112 $95 $80 $71 1 $112 $95 $80 $71
Over-Pressure Cut-Off Valve 1 $32 $27 $23 $20 1 $32 $27 $23 $20
Hydrogen Purge Valve 1 $32 $27 $23 $20 1 $32 $27 $23 $20
Hydrogen Piping 1 $115 $104 $94 $88 1 $132 $120 $108 $101
System Controller 1 $172 $171 $159 $120 1 $172 $171 $159 $120
Current Sensors 2 $77 $65 $54 $48 2 $153 $129 $109 $97
Voltage Sensors 1 $61 $52 $44 $39 1 $123 $103 $87 $77
Wiring 1 $101 $101 $95 $84 1 $110 $109 $103 $91
Fasteners for Wiring & Piping 1 $152 $141 $129 $118 1 $183 $170 $155 $142
Total FC BOP Cost, $/sys $2,937 $2,631 $2,322 $2,024 $4,880 $4,363 $3,542 $2,944
Total FC BOP Cost, $/kWe $117.48 $105.24 $92.88 $80.94 $48.80 $43.63 $35.42 $29.44
25 kWe net Systems 100 kWe net Systems
Low Temperature PEM Systems
Annual Production Rates Annual Production Rates
Qty/System 100 1,000 10,000 50,000 Qty/System 100 1,000 10,000 50,000Regenerative Air Blower 1 $347 $314 $284 $264 1 $479 $433 $391 $365
Air Mass Flow Sensor 1 $71 $64 $58 $54 1 $71 $64 $58 $54
Air Filter & Housing 1 $24 $22 $20 $19 1 $37 $33 $30 $28
Air Ducting (Including Cathode Ducting) 1 $69 $62 $56 $52 1 $95 $86 $78 $72
Anode Inlet Cooler 1 $129 $116 $105 $98 1 $177 $160 $145 $135
HTL Coolant Reservoir 1 $15 $14 $12 $11 1 $15 $14 $12 $11
HTL Coolant Pump 1 $51 $43 $36 $32 1 $70 $59 $50 $44
HTL Coolant DI Filter 1 $24 $22 $20 $19 1 $31 $28 $25 $23
HTL Thermostat & Valve 1 $24 $22 $20 $19 1 $31 $28 $25 $23
HTL Radiator 1 $50 $50 $50 $50 1 $50 $50 $50 $50
HTL Radiator Fan 1 $54 $49 $44 $41 1 $88 $80 $72 $67
HTL Coolant Piping 1 $18 $17 $15 $14 1 $22 $19 $18 $16
Pressure Transducer 1 $112 $95 $80 $71 1 $112 $95 $80 $71
Over-Pressure Cut-Off Valve 1 $32 $27 $23 $20 1 $32 $27 $23 $20
Hydrogen Purge Valve 1 $32 $27 $23 $20 1 $32 $27 $23 $20
Hydrogen Piping 1 $84 $75 $68 $64 1 $98 $89 $80 $75
System Controller 1 $172 $171 $159 $120 1 $172 $171 $159 $120
Current Sensors 2 $15 $13 $11 $10 2 $34 $29 $24 $22
Voltage Sensors 1 $12 $10 $9 $8 1 $27 $23 $19 $17
Wiring 1 $75 $74 $70 $62 1 $79 $78 $74 $65
Fasteners for Wiring & Piping 1 $98 $91 $84 $77 1 $117 $109 $100 $91
Total FC BOP Cost, $/sys $1,527 $1,393 $1,258 $1,134 $1,905 $1,731 $1,561 $1,413
Total FC BOP Cost, $/kWe $1,526.74 $1,392.98 $1,258.47 $1,133.89 $381.01 $346.21 $312.10 $282.56
Annual Production Rates
High Temperature PEM Systems1 kWe System 5 kWe System
Annual Production Rates
Qty/System 100 1,000 10,000 50,000 Qty/System 100 1,000 10,000 50,000Regenerative Air Blower 1 $661 $597 $540 $503 1 $872 $788 $713 $664
Air Mass Flow Sensor 1 $71 $64 $58 $54 1 $71 $64 $58 $54
Air Filter & Housing 1 $49 $44 $40 $37 1 $110 $100 $90 $84
Air Ducting (Including Cathode Ducting) 1 $131 $118 $107 $100 1 $173 $156 $141 $132
Anode Inlet Cooler 1 $245 $221 $200 $186 1 $323 $292 $264 $246
HTL Coolant Reservoir 1 $15 $14 $12 $11 1 $15 $14 $12 $11
HTL Coolant Pump 1 $97 $81 $69 $61 1 $127 $107 $91 $80
HTL Coolant DI Filter 1 $61 $55 $50 $47 1 $122 $111 $100 $93
HTL Thermostat & Valve 1 $43 $39 $35 $33 1 $61 $55 $50 $47
HTL Radiator 1 $50 $50 $50 $50 1 $156 $155 $149 $135
HTL Radiator Fan 1 $143 $129 $117 $109 1 $217 $196 $177 $165
HTL Coolant Piping 1 $32 $29 $26 $24 1 $44 $39 $36 $33
Pressure Transducer 1 $112 $95 $80 $71 1 $112 $95 $80 $71
Over-Pressure Cut-Off Valve 1 $32 $27 $23 $20 1 $32 $27 $23 $20
Hydrogen Purge Valve 1 $32 $27 $23 $20 1 $32 $27 $23 $20
Hydrogen Piping 1 $115 $104 $94 $88 1 $132 $120 $108 $101
System Controller 1 $172 $171 $159 $120 1 $172 $171 $159 $120
Current Sensors 2 $77 $65 $54 $48 2 $154 $130 $109 $97
Voltage Sensors 1 $61 $52 $44 $39 1 $123 $104 $87 $78
Wiring 1 $91 $90 $85 $75 1 $99 $98 $92 $82
Fasteners for Wiring & Piping 1 $147 $137 $125 $115 1 $179 $165 $151 $139
Total FC BOP Cost, $/sys $2,515 $2,275 $2,045 $1,859 $3,482 $3,145 $2,823 $2,568
Total FC BOP Cost, $/kWe $100.59 $90.99 $81.81 $74.36 $34.82 $31.45 $28.23 $25.68
Annual Production Rates Annual Production Rates
High Temperature PEM Systems25 kWe System 100 kWe System
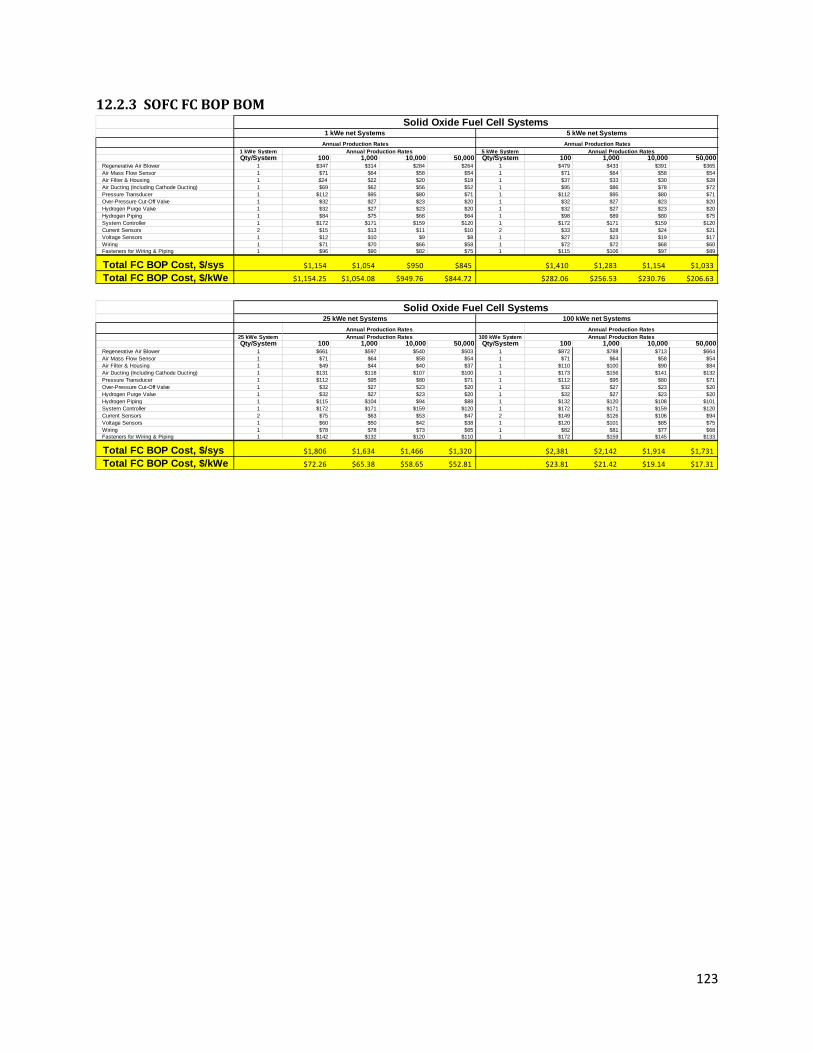
123
12.2.3 SOFC FC BOP BOM
1 kWe System 5 kWe System
Qty/System 100 1,000 10,000 50,000 Qty/System 100 1,000 10,000 50,000Regenerative Air Blower 1 $347 $314 $284 $264 1 $479 $433 $391 $365
Air Mass Flow Sensor 1 $71 $64 $58 $54 1 $71 $64 $58 $54
Air Filter & Housing 1 $24 $22 $20 $19 1 $37 $33 $30 $28
Air Ducting (Including Cathode Ducting) 1 $69 $62 $56 $52 1 $95 $86 $78 $72
Pressure Transducer 1 $112 $95 $80 $71 1 $112 $95 $80 $71
Over-Pressure Cut-Off Valve 1 $32 $27 $23 $20 1 $32 $27 $23 $20
Hydrogen Purge Valve 1 $32 $27 $23 $20 1 $32 $27 $23 $20
Hydrogen Piping 1 $84 $75 $68 $64 1 $98 $89 $80 $75
System Controller 1 $172 $171 $159 $120 1 $172 $171 $159 $120
Current Sensors 2 $15 $13 $11 $10 2 $33 $28 $24 $21
Voltage Sensors 1 $12 $10 $9 $8 1 $27 $23 $19 $17
Wiring 1 $71 $70 $66 $58 1 $72 $72 $68 $60
Fasteners for Wiring & Piping 1 $96 $90 $82 $75 1 $115 $106 $97 $89
Total FC BOP Cost, $/sys $1,154 $1,054 $950 $845 $1,410 $1,283 $1,154 $1,033
Total FC BOP Cost, $/kWe $1,154.25 $1,054.08 $949.76 $844.72 $282.06 $256.53 $230.76 $206.63
Annual Production Rates Annual Production Rates
Annual Production Rates Annual Production Rates
Solid Oxide Fuel Cell Systems1 kWe net Systems 5 kWe net Systems
25 kWe System 100 kWe System
Qty/System 100 1,000 10,000 50,000 Qty/System 100 1,000 10,000 50,000Regenerative Air Blower 1 $661 $597 $540 $503 1 $872 $788 $713 $664
Air Mass Flow Sensor 1 $71 $64 $58 $54 1 $71 $64 $58 $54
Air Filter & Housing 1 $49 $44 $40 $37 1 $110 $100 $90 $84
Air Ducting (Including Cathode Ducting) 1 $131 $118 $107 $100 1 $173 $156 $141 $132
Pressure Transducer 1 $112 $95 $80 $71 1 $112 $95 $80 $71
Over-Pressure Cut-Off Valve 1 $32 $27 $23 $20 1 $32 $27 $23 $20
Hydrogen Purge Valve 1 $32 $27 $23 $20 1 $32 $27 $23 $20
Hydrogen Piping 1 $115 $104 $94 $88 1 $132 $120 $108 $101
System Controller 1 $172 $171 $159 $120 1 $172 $171 $159 $120
Current Sensors 2 $75 $63 $53 $47 2 $149 $126 $106 $94
Voltage Sensors 1 $60 $50 $42 $38 1 $120 $101 $85 $75
Wiring 1 $78 $78 $73 $65 1 $82 $81 $77 $68
Fasteners for Wiring & Piping 1 $142 $132 $120 $110 1 $172 $159 $145 $133
Total FC BOP Cost, $/sys $1,806 $1,634 $1,466 $1,320 $2,381 $2,142 $1,914 $1,731
Total FC BOP Cost, $/kWe $72.26 $65.38 $58.65 $52.81 $23.81 $21.42 $19.14 $17.31
25 kWe net Systems 100 kWe net Systems
Annual Production Rates Annual Production Rates
Annual Production Rates Annual Production Rates
Solid Oxide Fuel Cell Systems
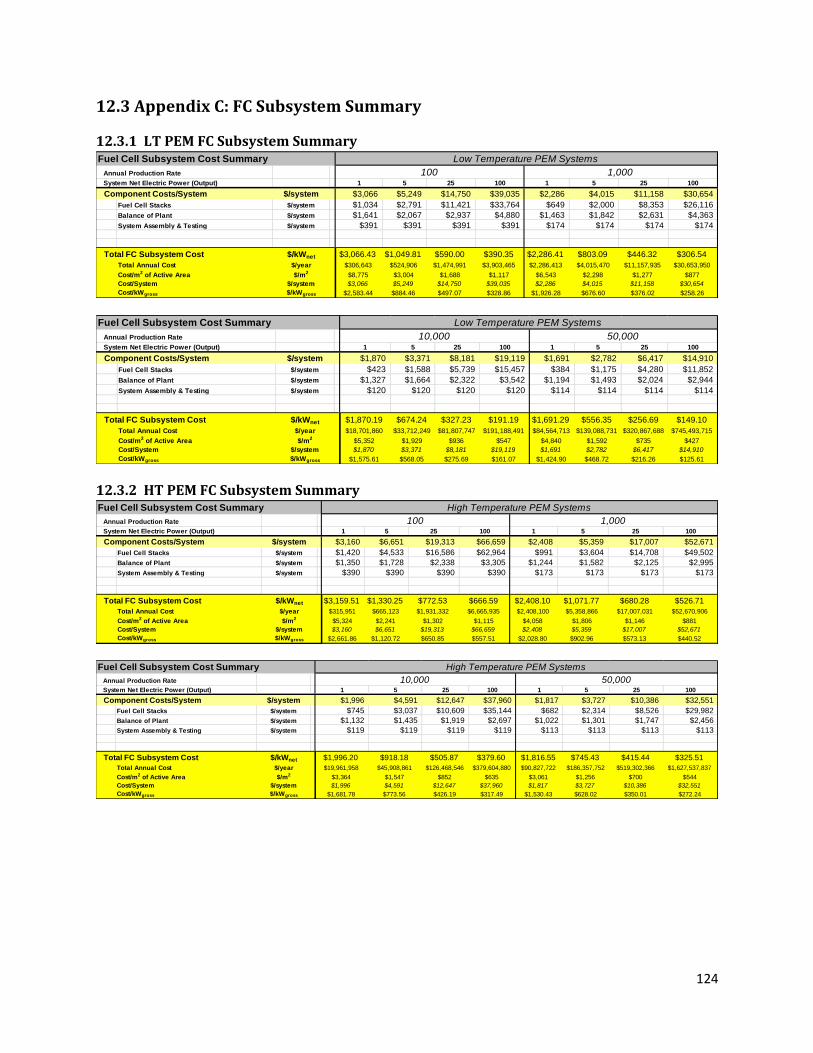
124
12.3 Appendix C: FC Subsystem Summary
12.3.1 LT PEM FC Subsystem Summary
12.3.2 HT PEM FC Subsystem Summary
Fuel Cell Subsystem Cost Summary
Annual Production Rate
System Net Electric Power (Output) 1 5 25 100 1 5 25 100
Component Costs/System $/system $3,066 $5,249 $14,750 $39,035 $2,286 $4,015 $11,158 $30,654
Fuel Cell Stacks $/system $1,034 $2,791 $11,421 $33,764 $649 $2,000 $8,353 $26,116
Balance of Plant $/system $1,641 $2,067 $2,937 $4,880 $1,463 $1,842 $2,631 $4,363
System Assembly & Testing $/system $391 $391 $391 $391 $174 $174 $174 $174
Total FC Subsystem Cost $/kWnet $3,066.43 $1,049.81 $590.00 $390.35 $2,286.41 $803.09 $446.32 $306.54
Total Annual Cost $/year $306,643 $524,906 $1,474,991 $3,903,465 $2,286,413 $4,015,470 $11,157,935 $30,653,950
Cost/m2 of Active Area $/m2 $8,775 $3,004 $1,688 $1,117 $6,543 $2,298 $1,277 $877
Cost/System $/system $3,066 $5,249 $14,750 $39,035 $2,286 $4,015 $11,158 $30,654
Cost/kWgross $/kWgross $2,583.44 $884.46 $497.07 $328.86 $1,926.28 $676.60 $376.02 $258.26
Low Temperature PEM Systems
100 1,000
Fuel Cell Subsystem Cost Summary
Annual Production Rate
System Net Electric Power (Output) 1 5 25 100 1 5 25 100
Component Costs/System $/system $1,870 $3,371 $8,181 $19,119 $1,691 $2,782 $6,417 $14,910
Fuel Cell Stacks $/system $423 $1,588 $5,739 $15,457 $384 $1,175 $4,280 $11,852
Balance of Plant $/system $1,327 $1,664 $2,322 $3,542 $1,194 $1,493 $2,024 $2,944
System Assembly & Testing $/system $120 $120 $120 $120 $114 $114 $114 $114
Total FC Subsystem Cost $/kWnet $1,870.19 $674.24 $327.23 $191.19 $1,691.29 $556.35 $256.69 $149.10
Total Annual Cost $/year $18,701,860 $33,712,249 $81,807,747 $191,188,491 $84,564,713 $139,088,731 $320,867,688 $745,493,715
Cost/m2 of Active Area $/m2 $5,352 $1,929 $936 $547 $4,840 $1,592 $735 $427
Cost/System $/system $1,870 $3,371 $8,181 $19,119 $1,691 $2,782 $6,417 $14,910
Cost/kWgross $/kWgross $1,575.61 $568.05 $275.69 $161.07 $1,424.90 $468.72 $216.26 $125.61
Low Temperature PEM Systems
10,000 50,000
Fuel Cell Subsystem Cost Summary
Annual Production Rate
System Net Electric Power (Output) 1 5 25 100 1 5 25 100
Component Costs/System $/system $3,160 $6,651 $19,313 $66,659 $2,408 $5,359 $17,007 $52,671
Fuel Cell Stacks $/system $1,420 $4,533 $16,586 $62,964 $991 $3,604 $14,708 $49,502
Balance of Plant $/system $1,350 $1,728 $2,338 $3,305 $1,244 $1,582 $2,125 $2,995
System Assembly & Testing $/system $390 $390 $390 $390 $173 $173 $173 $173
Total FC Subsystem Cost $/kWnet $3,159.51 $1,330.25 $772.53 $666.59 $2,408.10 $1,071.77 $680.28 $526.71
Total Annual Cost $/year $315,951 $665,123 $1,931,332 $6,665,935 $2,408,100 $5,358,866 $17,007,031 $52,670,906
Cost/m2 of Active Area $/m2 $5,324 $2,241 $1,302 $1,115 $4,058 $1,806 $1,146 $881
Cost/System $/system $3,160 $6,651 $19,313 $66,659 $2,408 $5,359 $17,007 $52,671
Cost/kWgross $/kWgross $2,661.86 $1,120.72 $650.85 $557.51 $2,028.80 $902.96 $573.13 $440.52
High Temperature PEM Systems
100 1,000
Fuel Cell Subsystem Cost Summary
Annual Production Rate
System Net Electric Power (Output) 1 5 25 100 1 5 25 100
Component Costs/System $/system $1,996 $4,591 $12,647 $37,960 $1,817 $3,727 $10,386 $32,551
Fuel Cell Stacks $/system $745 $3,037 $10,609 $35,144 $682 $2,314 $8,526 $29,982
Balance of Plant $/system $1,132 $1,435 $1,919 $2,697 $1,022 $1,301 $1,747 $2,456
System Assembly & Testing $/system $119 $119 $119 $119 $113 $113 $113 $113
Total FC Subsystem Cost $/kWnet $1,996.20 $918.18 $505.87 $379.60 $1,816.55 $745.43 $415.44 $325.51
Total Annual Cost $/year $19,961,958 $45,908,861 $126,468,546 $379,604,880 $90,827,722 $186,357,752 $519,302,366 $1,627,537,837
Cost/m2 of Active Area $/m2 $3,364 $1,547 $852 $635 $3,061 $1,256 $700 $544
Cost/System $/system $1,996 $4,591 $12,647 $37,960 $1,817 $3,727 $10,386 $32,551
Cost/kWgross $/kWgross $1,681.78 $773.56 $426.19 $317.49 $1,530.43 $628.02 $350.01 $272.24
High Temperature PEM Systems
10,000 50,000
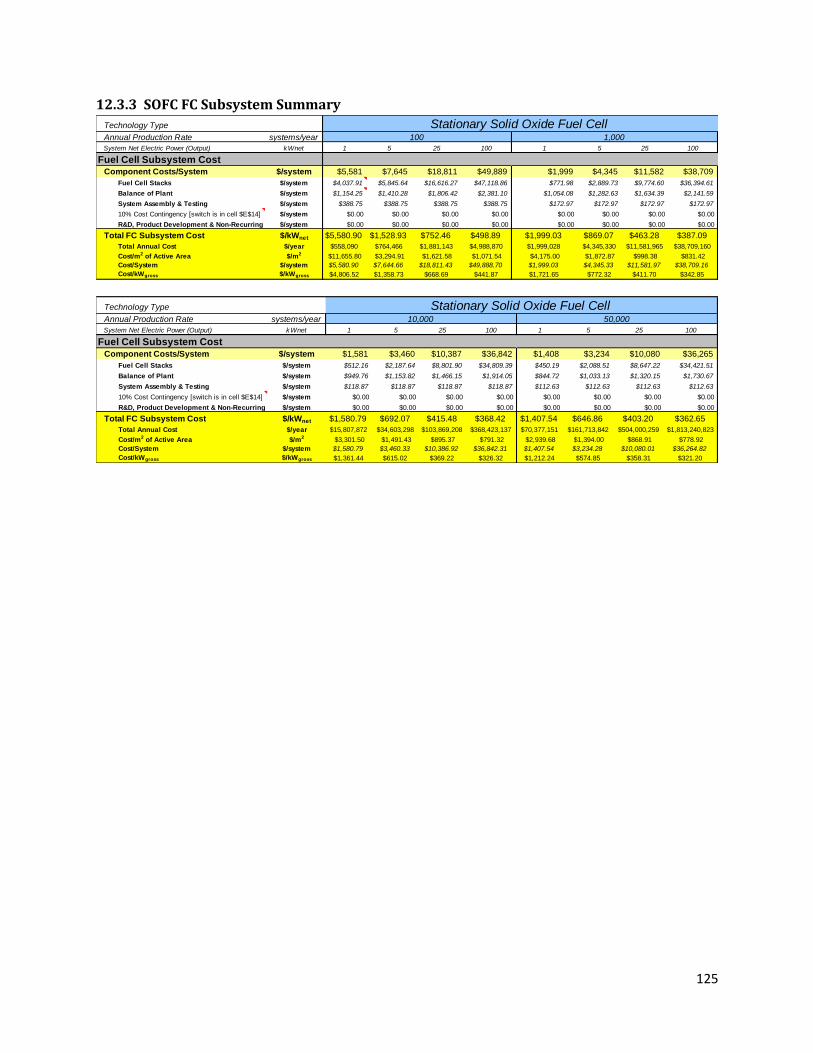
125
12.3.3 SOFC FC Subsystem Summary
Technology Type
Annual Production Rate systems/year
System Net Electric Power (Output) kWnet 1 5 25 100 1 5 25 100
Fuel Cell Subsystem CostComponent Costs/System $/system $5,581 $7,645 $18,811 $49,889 $1,999 $4,345 $11,582 $38,709
Fuel Cell Stacks $/system $4,037.91 $5,845.64 $16,616.27 $47,118.86 $771.98 $2,889.73 $9,774.60 $36,394.61
Balance of Plant $/system $1,154.25 $1,410.28 $1,806.42 $2,381.10 $1,054.08 $1,282.63 $1,634.39 $2,141.59
System Assembly & Testing $/system $388.75 $388.75 $388.75 $388.75 $172.97 $172.97 $172.97 $172.97
10% Cost Contingency [switch is in cell $E$14] $/system $0.00 $0.00 $0.00 $0.00 $0.00 $0.00 $0.00 $0.00
R&D, Product Development & Non-Recurring Engineering$/system $0.00 $0.00 $0.00 $0.00 $0.00 $0.00 $0.00 $0.00
Total FC Subsystem Cost $/kWnet $5,580.90 $1,528.93 $752.46 $498.89 $1,999.03 $869.07 $463.28 $387.09
Total Annual Cost $/year $558,090 $764,466 $1,881,143 $4,988,870 $1,999,028 $4,345,330 $11,581,965 $38,709,160
Cost/m2 of Active Area $/m2 $11,655.80 $3,294.91 $1,621.58 $1,071.54 $4,175.00 $1,872.87 $998.38 $831.42
Cost/System $/system $5,580.90 $7,644.66 $18,811.43 $49,888.70 $1,999.03 $4,345.33 $11,581.97 $38,709.16
Cost/kWgross $/kWgross $4,806.52 $1,358.73 $668.69 $441.87 $1,721.65 $772.32 $411.70 $342.85
Stationary Solid Oxide Fuel Cell100 1,000
Technology Type
Annual Production Rate systems/year
System Net Electric Power (Output) kWnet 1 5 25 100 1 5 25 100
Fuel Cell Subsystem CostComponent Costs/System $/system $1,581 $3,460 $10,387 $36,842 $1,408 $3,234 $10,080 $36,265
Fuel Cell Stacks $/system $512.16 $2,187.64 $8,801.90 $34,809.39 $450.19 $2,088.51 $8,647.22 $34,421.51
Balance of Plant $/system $949.76 $1,153.82 $1,466.15 $1,914.05 $844.72 $1,033.13 $1,320.15 $1,730.67
System Assembly & Testing $/system $118.87 $118.87 $118.87 $118.87 $112.63 $112.63 $112.63 $112.63
10% Cost Contingency [switch is in cell $E$14] $/system $0.00 $0.00 $0.00 $0.00 $0.00 $0.00 $0.00 $0.00
R&D, Product Development & Non-Recurring Engineering$/system $0.00 $0.00 $0.00 $0.00 $0.00 $0.00 $0.00 $0.00
Total FC Subsystem Cost $/kWnet $1,580.79 $692.07 $415.48 $368.42 $1,407.54 $646.86 $403.20 $362.65
Total Annual Cost $/year $15,807,872 $34,603,298 $103,869,208 $368,423,137 $70,377,151 $161,713,842 $504,000,259 $1,813,240,823
Cost/m2 of Active Area $/m2 $3,301.50 $1,491.43 $895.37 $791.32 $2,939.68 $1,394.00 $868.91 $778.92
Cost/System $/system $1,580.79 $3,460.33 $10,386.92 $36,842.31 $1,407.54 $3,234.28 $10,080.01 $36,264.82
Cost/kWgross $/kWgross $1,361.44 $615.02 $369.22 $326.32 $1,212.24 $574.85 $358.31 $321.20
Stationary Solid Oxide Fuel Cell10,000 50,000
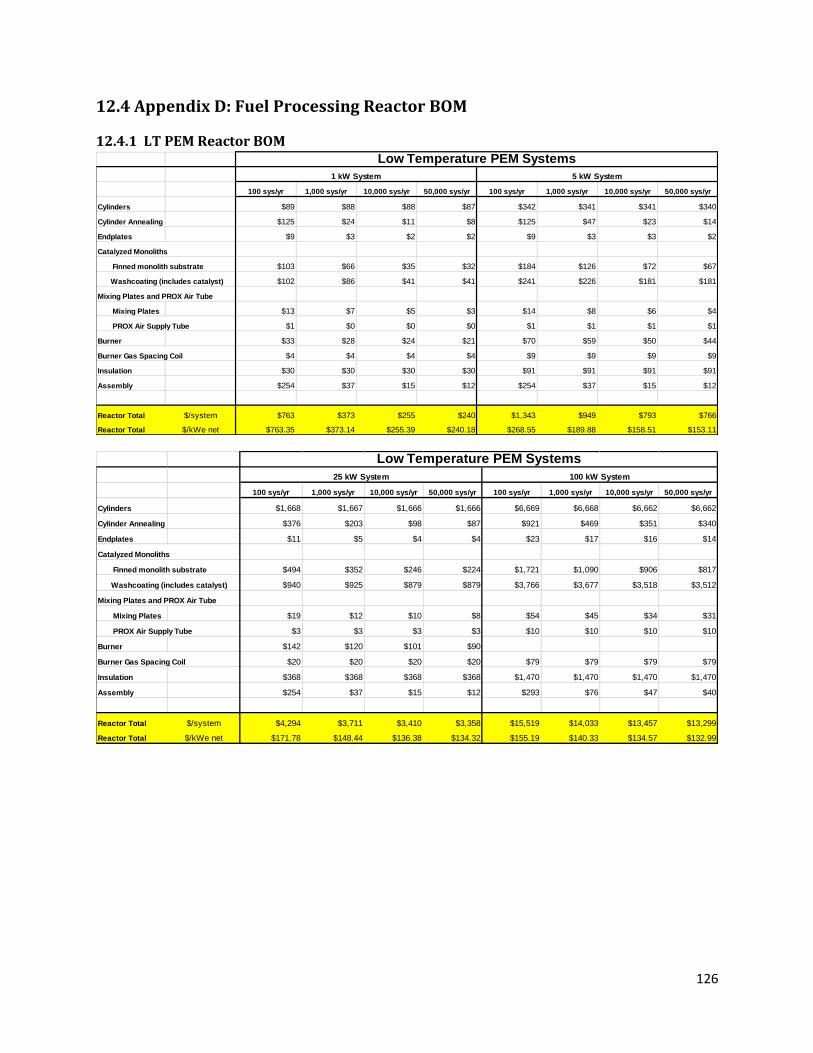
126
12.4 Appendix D: Fuel Processing Reactor BOM
12.4.1 LT PEM Reactor BOM
100 sys/yr 1,000 sys/yr 10,000 sys/yr 50,000 sys/yr 100 sys/yr 1,000 sys/yr 10,000 sys/yr 50,000 sys/yr
Cylinders $89 $88 $88 $87 $342 $341 $341 $340
Cylinder Annealing $125 $24 $11 $8 $125 $47 $23 $14
Endplates $9 $3 $2 $2 $9 $3 $3 $2
Catalyzed Monoliths
Finned monolith substrate $103 $66 $35 $32 $184 $126 $72 $67
Washcoating (includes catalyst) $102 $86 $41 $41 $241 $226 $181 $181
Mixing Plates and PROX Air Tube
Mixing Plates $13 $7 $5 $3 $14 $8 $6 $4
PROX Air Supply Tube $1 $0 $0 $0 $1 $1 $1 $1
Burner $33 $28 $24 $21 $70 $59 $50 $44
Burner Gas Spacing Coil $4 $4 $4 $4 $9 $9 $9 $9
Insulation $30 $30 $30 $30 $91 $91 $91 $91
Assembly $254 $37 $15 $12 $254 $37 $15 $12
Reactor Total $/system $763 $373 $255 $240 $1,343 $949 $793 $766
Reactor Total $/kWe net $763.35 $373.14 $255.39 $240.18 $268.55 $189.88 $158.51 $153.11
1 kW System 5 kW System
Low Temperature PEM Systems
100 sys/yr 1,000 sys/yr 10,000 sys/yr 50,000 sys/yr 100 sys/yr 1,000 sys/yr 10,000 sys/yr 50,000 sys/yr
Cylinders $1,668 $1,667 $1,666 $1,666 $6,669 $6,668 $6,662 $6,662
Cylinder Annealing $376 $203 $98 $87 $921 $469 $351 $340
Endplates $11 $5 $4 $4 $23 $17 $16 $14
Catalyzed Monoliths
Finned monolith substrate $494 $352 $246 $224 $1,721 $1,090 $906 $817
Washcoating (includes catalyst) $940 $925 $879 $879 $3,766 $3,677 $3,518 $3,512
Mixing Plates and PROX Air Tube
Mixing Plates $19 $12 $10 $8 $54 $45 $34 $31
PROX Air Supply Tube $3 $3 $3 $3 $10 $10 $10 $10
Burner $142 $120 $101 $90
Burner Gas Spacing Coil $20 $20 $20 $20 $79 $79 $79 $79
Insulation $368 $368 $368 $368 $1,470 $1,470 $1,470 $1,470
Assembly $254 $37 $15 $12 $293 $76 $47 $40
Reactor Total $/system $4,294 $3,711 $3,410 $3,358 $15,519 $14,033 $13,457 $13,299
Reactor Total $/kWe net $171.78 $148.44 $136.38 $134.32 $155.19 $140.33 $134.57 $132.99
100 kW System25 kW System
Low Temperature PEM Systems
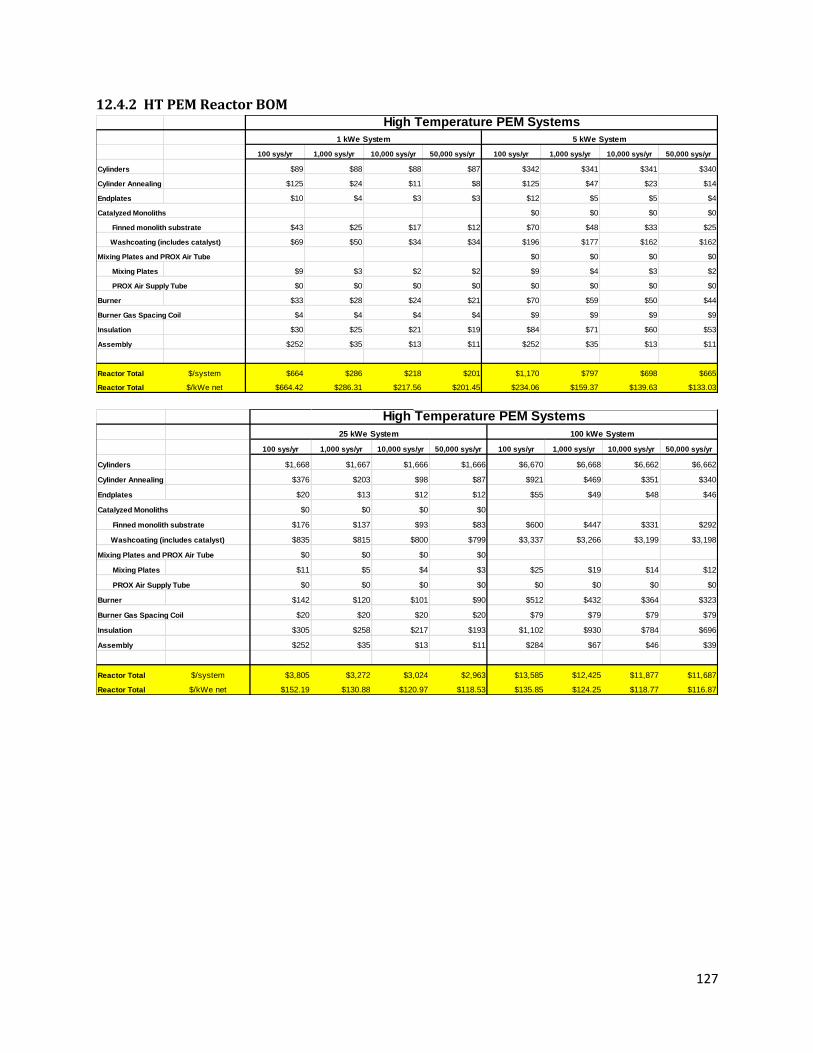
127
12.4.2 HT PEM Reactor BOM
100 sys/yr 1,000 sys/yr 10,000 sys/yr 50,000 sys/yr 100 sys/yr 1,000 sys/yr 10,000 sys/yr 50,000 sys/yr
Cylinders $89 $88 $88 $87 $342 $341 $341 $340
Cylinder Annealing $125 $24 $11 $8 $125 $47 $23 $14
Endplates $10 $4 $3 $3 $12 $5 $5 $4
Catalyzed Monoliths $0 $0 $0 $0
Finned monolith substrate $43 $25 $17 $12 $70 $48 $33 $25
Washcoating (includes catalyst) $69 $50 $34 $34 $196 $177 $162 $162
Mixing Plates and PROX Air Tube $0 $0 $0 $0
Mixing Plates $9 $3 $2 $2 $9 $4 $3 $2
PROX Air Supply Tube $0 $0 $0 $0 $0 $0 $0 $0
Burner $33 $28 $24 $21 $70 $59 $50 $44
Burner Gas Spacing Coil $4 $4 $4 $4 $9 $9 $9 $9
Insulation $30 $25 $21 $19 $84 $71 $60 $53
Assembly $252 $35 $13 $11 $252 $35 $13 $11
Reactor Total $/system $664 $286 $218 $201 $1,170 $797 $698 $665
Reactor Total $/kWe net $664.42 $286.31 $217.56 $201.45 $234.06 $159.37 $139.63 $133.03
1 kWe System
High Temperature PEM Systems
5 kWe System
100 sys/yr 1,000 sys/yr 10,000 sys/yr 50,000 sys/yr 100 sys/yr 1,000 sys/yr 10,000 sys/yr 50,000 sys/yr
Cylinders $1,668 $1,667 $1,666 $1,666 $6,670 $6,668 $6,662 $6,662
Cylinder Annealing $376 $203 $98 $87 $921 $469 $351 $340
Endplates $20 $13 $12 $12 $55 $49 $48 $46
Catalyzed Monoliths $0 $0 $0 $0
Finned monolith substrate $176 $137 $93 $83 $600 $447 $331 $292
Washcoating (includes catalyst) $835 $815 $800 $799 $3,337 $3,266 $3,199 $3,198
Mixing Plates and PROX Air Tube $0 $0 $0 $0
Mixing Plates $11 $5 $4 $3 $25 $19 $14 $12
PROX Air Supply Tube $0 $0 $0 $0 $0 $0 $0 $0
Burner $142 $120 $101 $90 $512 $432 $364 $323
Burner Gas Spacing Coil $20 $20 $20 $20 $79 $79 $79 $79
Insulation $305 $258 $217 $193 $1,102 $930 $784 $696
Assembly $252 $35 $13 $11 $284 $67 $46 $39
Reactor Total $/system $3,805 $3,272 $3,024 $2,963 $13,585 $12,425 $11,877 $11,687
Reactor Total $/kWe net $152.19 $130.88 $120.97 $118.53 $135.85 $124.25 $118.77 $116.87
100 kWe System
High Temperature PEM Systems
25 kWe System
Annual Production Rate, sys/yr
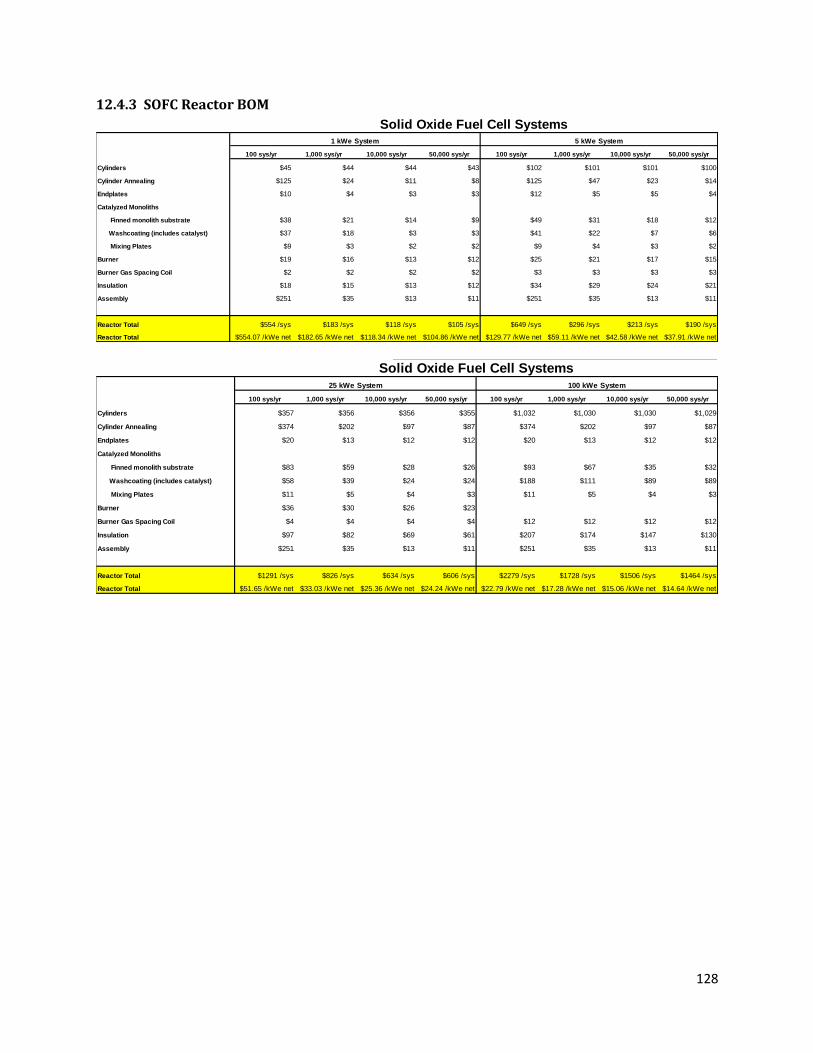
128
12.4.3 SOFC Reactor BOM
100 sys/yr 1,000 sys/yr 10,000 sys/yr 50,000 sys/yr 100 sys/yr 1,000 sys/yr 10,000 sys/yr 50,000 sys/yr
Cylinders $45 $44 $44 $43 $102 $101 $101 $100
Cylinder Annealing $125 $24 $11 $8 $125 $47 $23 $14
Endplates $10 $4 $3 $3 $12 $5 $5 $4
Catalyzed Monoliths
Finned monolith substrate $38 $21 $14 $9 $49 $31 $18 $12
Washcoating (includes catalyst) $37 $18 $3 $3 $41 $22 $7 $6
Mixing Plates $9 $3 $2 $2 $9 $4 $3 $2
Burner $19 $16 $13 $12 $25 $21 $17 $15
Burner Gas Spacing Coil $2 $2 $2 $2 $3 $3 $3 $3
Insulation $18 $15 $13 $12 $34 $29 $24 $21
Assembly $251 $35 $13 $11 $251 $35 $13 $11
Reactor Total $554 /sys $183 /sys $118 /sys $105 /sys $649 /sys $296 /sys $213 /sys $190 /sys
Reactor Total $554.07 /kWe net $182.65 /kWe net $118.34 /kWe net $104.86 /kWe net $129.77 /kWe net $59.11 /kWe net $42.58 /kWe net $37.91 /kWe net
1 kWe System 5 kWe System
Solid Oxide Fuel Cell Systems
100 sys/yr 1,000 sys/yr 10,000 sys/yr 50,000 sys/yr 100 sys/yr 1,000 sys/yr 10,000 sys/yr 50,000 sys/yr
Cylinders $357 $356 $356 $355 $1,032 $1,030 $1,030 $1,029
Cylinder Annealing $374 $202 $97 $87 $374 $202 $97 $87
Endplates $20 $13 $12 $12 $20 $13 $12 $12
Catalyzed Monoliths
Finned monolith substrate $83 $59 $28 $26 $93 $67 $35 $32
Washcoating (includes catalyst) $58 $39 $24 $24 $188 $111 $89 $89
Mixing Plates $11 $5 $4 $3 $11 $5 $4 $3
Burner $36 $30 $26 $23
Burner Gas Spacing Coil $4 $4 $4 $4 $12 $12 $12 $12
Insulation $97 $82 $69 $61 $207 $174 $147 $130
Assembly $251 $35 $13 $11 $251 $35 $13 $11
Reactor Total $1291 /sys $826 /sys $634 /sys $606 /sys $2279 /sys $1728 /sys $1506 /sys $1464 /sys
Reactor Total $51.65 /kWe net $33.03 /kWe net $25.36 /kWe net $24.24 /kWe net $22.79 /kWe net $17.28 /kWe net $15.06 /kWe net $14.64 /kWe net
100 kWe System25 kWe System
Solid Oxide Fuel Cell Systems
Annual Production Rate, sys/yr
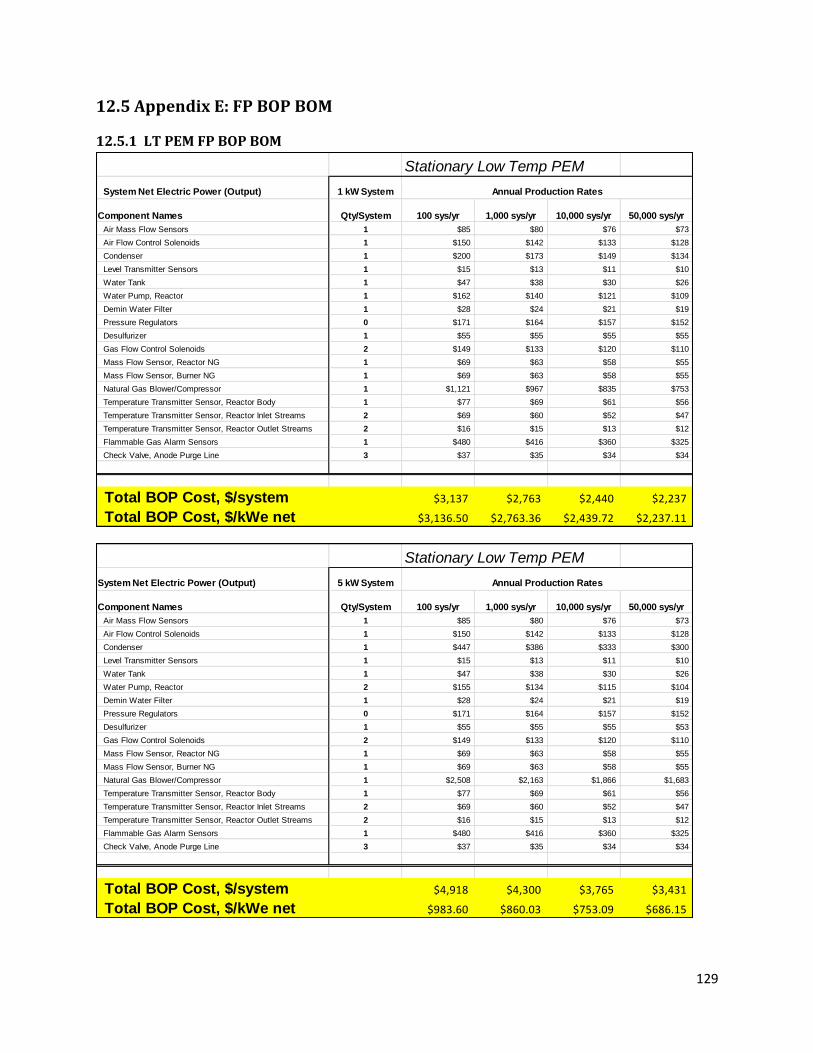
129
12.5 Appendix E: FP BOP BOM
12.5.1 LT PEM FP BOP BOM
Stationary Low Temp PEM
System Net Electric Power (Output) 1 kW System
Component Names Qty/System 100 sys/yr 1,000 sys/yr 10,000 sys/yr 50,000 sys/yr
Air Mass Flow Sensors 1 $85 $80 $76 $73
Air Flow Control Solenoids 1 $150 $142 $133 $128
Condenser 1 $200 $173 $149 $134
Level Transmitter Sensors 1 $15 $13 $11 $10
Water Tank 1 $47 $38 $30 $26
Water Pump, Reactor 1 $162 $140 $121 $109
Demin Water Filter 1 $28 $24 $21 $19
Pressure Regulators 0 $171 $164 $157 $152
Desulfurizer 1 $55 $55 $55 $55
Gas Flow Control Solenoids 2 $149 $133 $120 $110
Mass Flow Sensor, Reactor NG 1 $69 $63 $58 $55
Mass Flow Sensor, Burner NG 1 $69 $63 $58 $55
Natural Gas Blower/Compressor 1 $1,121 $967 $835 $753
Temperature Transmitter Sensor, Reactor Body 1 $77 $69 $61 $56
Temperature Transmitter Sensor, Reactor Inlet Streams 2 $69 $60 $52 $47
Temperature Transmitter Sensor, Reactor Outlet Streams 2 $16 $15 $13 $12
Flammable Gas Alarm Sensors 1 $480 $416 $360 $325
Check Valve, Anode Purge Line 3 $37 $35 $34 $34
Total BOP Cost, $/system $3,137 $2,763 $2,440 $2,237
Total BOP Cost, $/kWe net $3,136.50 $2,763.36 $2,439.72 $2,237.11
Annual Production Rates
Stationary Low Temp PEM
System Net Electric Power (Output) 5 kW System
Component Names Qty/System 100 sys/yr 1,000 sys/yr 10,000 sys/yr 50,000 sys/yr
Air Mass Flow Sensors 1 $85 $80 $76 $73
Air Flow Control Solenoids 1 $150 $142 $133 $128
Condenser 1 $447 $386 $333 $300
Level Transmitter Sensors 1 $15 $13 $11 $10
Water Tank 1 $47 $38 $30 $26
Water Pump, Reactor 2 $155 $134 $115 $104
Demin Water Filter 1 $28 $24 $21 $19
Pressure Regulators 0 $171 $164 $157 $152
Desulfurizer 1 $55 $55 $55 $53
Gas Flow Control Solenoids 2 $149 $133 $120 $110
Mass Flow Sensor, Reactor NG 1 $69 $63 $58 $55
Mass Flow Sensor, Burner NG 1 $69 $63 $58 $55
Natural Gas Blower/Compressor 1 $2,508 $2,163 $1,866 $1,683
Temperature Transmitter Sensor, Reactor Body 1 $77 $69 $61 $56
Temperature Transmitter Sensor, Reactor Inlet Streams 2 $69 $60 $52 $47
Temperature Transmitter Sensor, Reactor Outlet Streams 2 $16 $15 $13 $12
Flammable Gas Alarm Sensors 1 $480 $416 $360 $325
Check Valve, Anode Purge Line 3 $37 $35 $34 $34
Total BOP Cost, $/system $4,918 $4,300 $3,765 $3,431
Total BOP Cost, $/kWe net $983.60 $860.03 $753.09 $686.15
Annual Production Rates
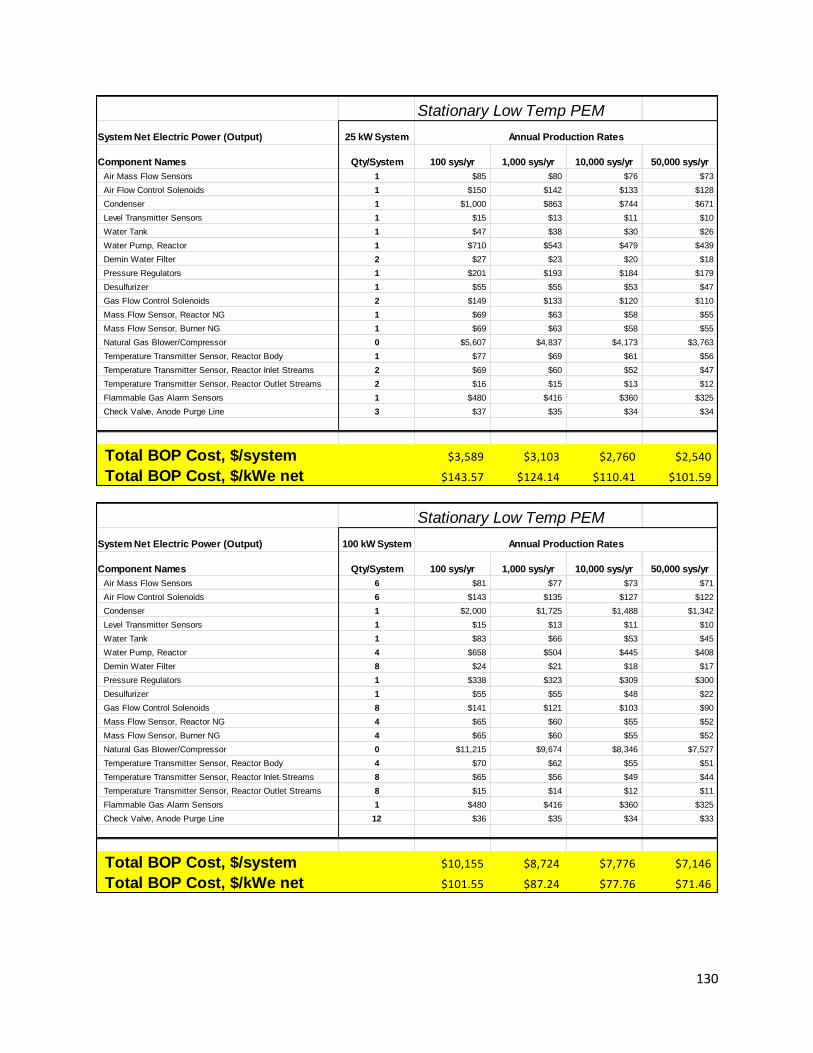
130
Stationary Low Temp PEM
System Net Electric Power (Output) 25 kW System
Component Names Qty/System 100 sys/yr 1,000 sys/yr 10,000 sys/yr 50,000 sys/yr
Air Mass Flow Sensors 1 $85 $80 $76 $73
Air Flow Control Solenoids 1 $150 $142 $133 $128
Condenser 1 $1,000 $863 $744 $671
Level Transmitter Sensors 1 $15 $13 $11 $10
Water Tank 1 $47 $38 $30 $26
Water Pump, Reactor 1 $710 $543 $479 $439
Demin Water Filter 2 $27 $23 $20 $18
Pressure Regulators 1 $201 $193 $184 $179
Desulfurizer 1 $55 $55 $53 $47
Gas Flow Control Solenoids 2 $149 $133 $120 $110
Mass Flow Sensor, Reactor NG 1 $69 $63 $58 $55
Mass Flow Sensor, Burner NG 1 $69 $63 $58 $55
Natural Gas Blower/Compressor 0 $5,607 $4,837 $4,173 $3,763
Temperature Transmitter Sensor, Reactor Body 1 $77 $69 $61 $56
Temperature Transmitter Sensor, Reactor Inlet Streams 2 $69 $60 $52 $47
Temperature Transmitter Sensor, Reactor Outlet Streams 2 $16 $15 $13 $12
Flammable Gas Alarm Sensors 1 $480 $416 $360 $325
Check Valve, Anode Purge Line 3 $37 $35 $34 $34
Total BOP Cost, $/system $3,589 $3,103 $2,760 $2,540
Total BOP Cost, $/kWe net $143.57 $124.14 $110.41 $101.59
Annual Production Rates
Stationary Low Temp PEM
System Net Electric Power (Output) 100 kW System
Component Names Qty/System 100 sys/yr 1,000 sys/yr 10,000 sys/yr 50,000 sys/yr
Air Mass Flow Sensors 6 $81 $77 $73 $71
Air Flow Control Solenoids 6 $143 $135 $127 $122
Condenser 1 $2,000 $1,725 $1,488 $1,342
Level Transmitter Sensors 1 $15 $13 $11 $10
Water Tank 1 $83 $66 $53 $45
Water Pump, Reactor 4 $658 $504 $445 $408
Demin Water Filter 8 $24 $21 $18 $17
Pressure Regulators 1 $338 $323 $309 $300
Desulfurizer 1 $55 $55 $48 $22
Gas Flow Control Solenoids 8 $141 $121 $103 $90
Mass Flow Sensor, Reactor NG 4 $65 $60 $55 $52
Mass Flow Sensor, Burner NG 4 $65 $60 $55 $52
Natural Gas Blower/Compressor 0 $11,215 $9,674 $8,346 $7,527
Temperature Transmitter Sensor, Reactor Body 4 $70 $62 $55 $51
Temperature Transmitter Sensor, Reactor Inlet Streams 8 $65 $56 $49 $44
Temperature Transmitter Sensor, Reactor Outlet Streams 8 $15 $14 $12 $11
Flammable Gas Alarm Sensors 1 $480 $416 $360 $325
Check Valve, Anode Purge Line 12 $36 $35 $34 $33
Total BOP Cost, $/system $10,155 $8,724 $7,776 $7,146
Total BOP Cost, $/kWe net $101.55 $87.24 $77.76 $71.46
Annual Production Rates
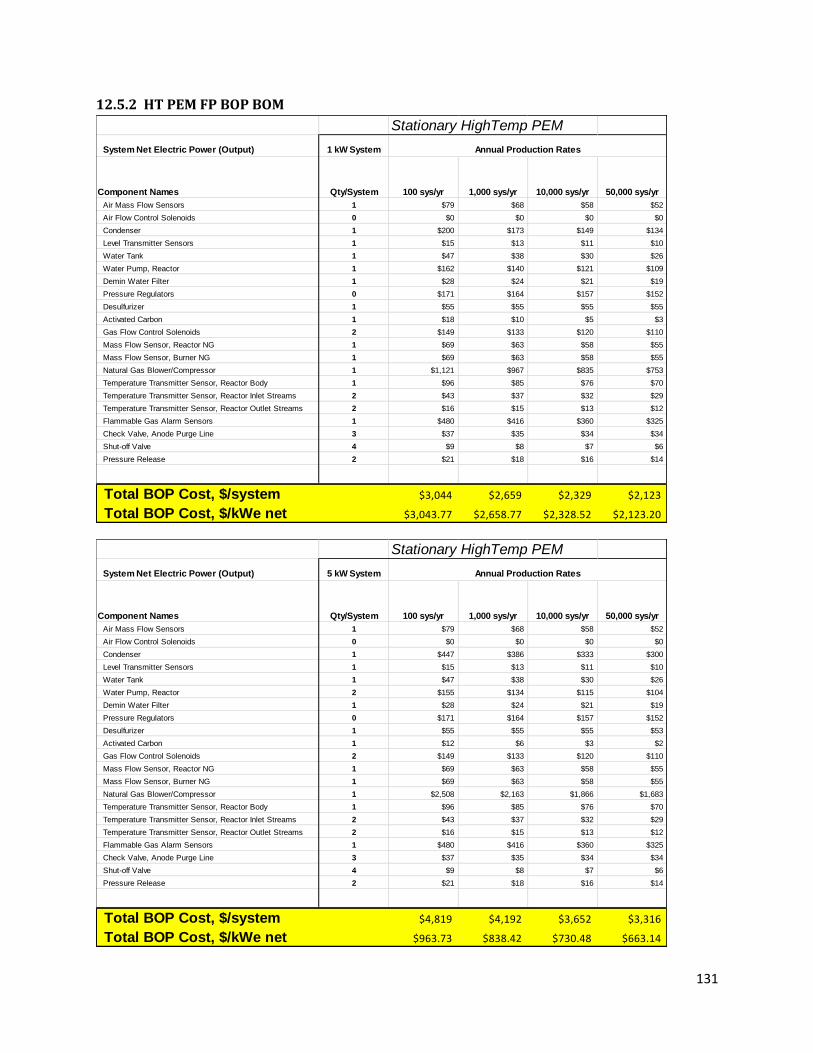
131
12.5.2 HT PEM FP BOP BOM
Stationary HighTemp PEM
System Net Electric Power (Output) 1 kW System
Component Names Qty/System 100 sys/yr 1,000 sys/yr 10,000 sys/yr 50,000 sys/yr
Air Mass Flow Sensors 1 $79 $68 $58 $52
Air Flow Control Solenoids 0 $0 $0 $0 $0
Condenser 1 $200 $173 $149 $134
Level Transmitter Sensors 1 $15 $13 $11 $10
Water Tank 1 $47 $38 $30 $26
Water Pump, Reactor 1 $162 $140 $121 $109
Demin Water Filter 1 $28 $24 $21 $19
Pressure Regulators 0 $171 $164 $157 $152
Desulfurizer 1 $55 $55 $55 $55
Activated Carbon 1 $18 $10 $5 $3
Gas Flow Control Solenoids 2 $149 $133 $120 $110
Mass Flow Sensor, Reactor NG 1 $69 $63 $58 $55
Mass Flow Sensor, Burner NG 1 $69 $63 $58 $55
Natural Gas Blower/Compressor 1 $1,121 $967 $835 $753
Temperature Transmitter Sensor, Reactor Body 1 $96 $85 $76 $70
Temperature Transmitter Sensor, Reactor Inlet Streams 2 $43 $37 $32 $29
Temperature Transmitter Sensor, Reactor Outlet Streams 2 $16 $15 $13 $12
Flammable Gas Alarm Sensors 1 $480 $416 $360 $325
Check Valve, Anode Purge Line 3 $37 $35 $34 $34
Shut-off Valve 4 $9 $8 $7 $6
Pressure Release 2 $21 $18 $16 $14
Total BOP Cost, $/system $3,044 $2,659 $2,329 $2,123
Total BOP Cost, $/kWe net $3,043.77 $2,658.77 $2,328.52 $2,123.20
Annual Production Rates
Stationary HighTemp PEM
System Net Electric Power (Output) 5 kW System
Component Names Qty/System 100 sys/yr 1,000 sys/yr 10,000 sys/yr 50,000 sys/yr
Air Mass Flow Sensors 1 $79 $68 $58 $52
Air Flow Control Solenoids 0 $0 $0 $0 $0
Condenser 1 $447 $386 $333 $300
Level Transmitter Sensors 1 $15 $13 $11 $10
Water Tank 1 $47 $38 $30 $26
Water Pump, Reactor 2 $155 $134 $115 $104
Demin Water Filter 1 $28 $24 $21 $19
Pressure Regulators 0 $171 $164 $157 $152
Desulfurizer 1 $55 $55 $55 $53
Activated Carbon 1 $12 $6 $3 $2
Gas Flow Control Solenoids 2 $149 $133 $120 $110
Mass Flow Sensor, Reactor NG 1 $69 $63 $58 $55
Mass Flow Sensor, Burner NG 1 $69 $63 $58 $55
Natural Gas Blower/Compressor 1 $2,508 $2,163 $1,866 $1,683
Temperature Transmitter Sensor, Reactor Body 1 $96 $85 $76 $70
Temperature Transmitter Sensor, Reactor Inlet Streams 2 $43 $37 $32 $29
Temperature Transmitter Sensor, Reactor Outlet Streams 2 $16 $15 $13 $12
Flammable Gas Alarm Sensors 1 $480 $416 $360 $325
Check Valve, Anode Purge Line 3 $37 $35 $34 $34
Shut-off Valve 4 $9 $8 $7 $6
Pressure Release 2 $21 $18 $16 $14
Total BOP Cost, $/system $4,819 $4,192 $3,652 $3,316
Total BOP Cost, $/kWe net $963.73 $838.42 $730.48 $663.14
Annual Production Rates
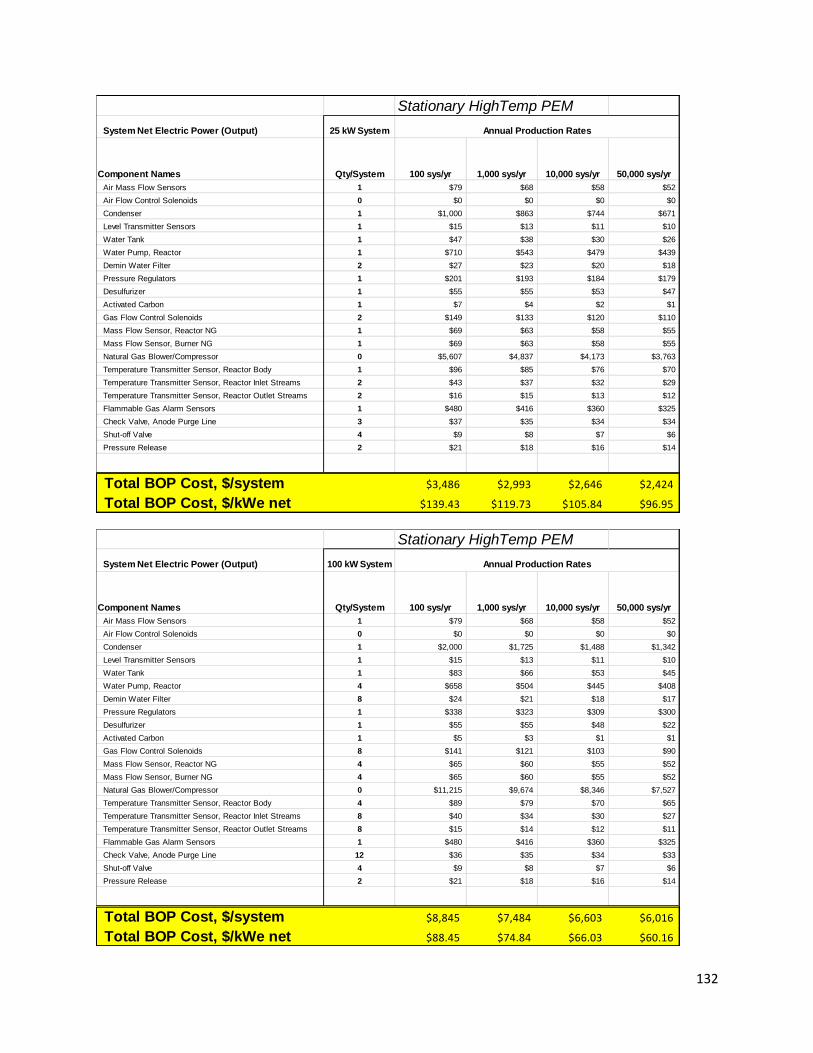
132
Stationary HighTemp PEM
System Net Electric Power (Output) 25 kW System
Component Names Qty/System 100 sys/yr 1,000 sys/yr 10,000 sys/yr 50,000 sys/yr
Air Mass Flow Sensors 1 $79 $68 $58 $52
Air Flow Control Solenoids 0 $0 $0 $0 $0
Condenser 1 $1,000 $863 $744 $671
Level Transmitter Sensors 1 $15 $13 $11 $10
Water Tank 1 $47 $38 $30 $26
Water Pump, Reactor 1 $710 $543 $479 $439
Demin Water Filter 2 $27 $23 $20 $18
Pressure Regulators 1 $201 $193 $184 $179
Desulfurizer 1 $55 $55 $53 $47
Activated Carbon 1 $7 $4 $2 $1
Gas Flow Control Solenoids 2 $149 $133 $120 $110
Mass Flow Sensor, Reactor NG 1 $69 $63 $58 $55
Mass Flow Sensor, Burner NG 1 $69 $63 $58 $55
Natural Gas Blower/Compressor 0 $5,607 $4,837 $4,173 $3,763
Temperature Transmitter Sensor, Reactor Body 1 $96 $85 $76 $70
Temperature Transmitter Sensor, Reactor Inlet Streams 2 $43 $37 $32 $29
Temperature Transmitter Sensor, Reactor Outlet Streams 2 $16 $15 $13 $12
Flammable Gas Alarm Sensors 1 $480 $416 $360 $325
Check Valve, Anode Purge Line 3 $37 $35 $34 $34
Shut-off Valve 4 $9 $8 $7 $6
Pressure Release 2 $21 $18 $16 $14
Total BOP Cost, $/system $3,486 $2,993 $2,646 $2,424
Total BOP Cost, $/kWe net $139.43 $119.73 $105.84 $96.95
Annual Production Rates
Stationary HighTemp PEM
System Net Electric Power (Output) 100 kW System
Component Names Qty/System 100 sys/yr 1,000 sys/yr 10,000 sys/yr 50,000 sys/yr
Air Mass Flow Sensors 1 $79 $68 $58 $52
Air Flow Control Solenoids 0 $0 $0 $0 $0
Condenser 1 $2,000 $1,725 $1,488 $1,342
Level Transmitter Sensors 1 $15 $13 $11 $10
Water Tank 1 $83 $66 $53 $45
Water Pump, Reactor 4 $658 $504 $445 $408
Demin Water Filter 8 $24 $21 $18 $17
Pressure Regulators 1 $338 $323 $309 $300
Desulfurizer 1 $55 $55 $48 $22
Activated Carbon 1 $5 $3 $1 $1
Gas Flow Control Solenoids 8 $141 $121 $103 $90
Mass Flow Sensor, Reactor NG 4 $65 $60 $55 $52
Mass Flow Sensor, Burner NG 4 $65 $60 $55 $52
Natural Gas Blower/Compressor 0 $11,215 $9,674 $8,346 $7,527
Temperature Transmitter Sensor, Reactor Body 4 $89 $79 $70 $65
Temperature Transmitter Sensor, Reactor Inlet Streams 8 $40 $34 $30 $27
Temperature Transmitter Sensor, Reactor Outlet Streams 8 $15 $14 $12 $11
Flammable Gas Alarm Sensors 1 $480 $416 $360 $325
Check Valve, Anode Purge Line 12 $36 $35 $34 $33
Shut-off Valve 4 $9 $8 $7 $6
Pressure Release 2 $21 $18 $16 $14
Total BOP Cost, $/system $8,845 $7,484 $6,603 $6,016
Total BOP Cost, $/kWe net $88.45 $74.84 $66.03 $60.16
Annual Production Rates
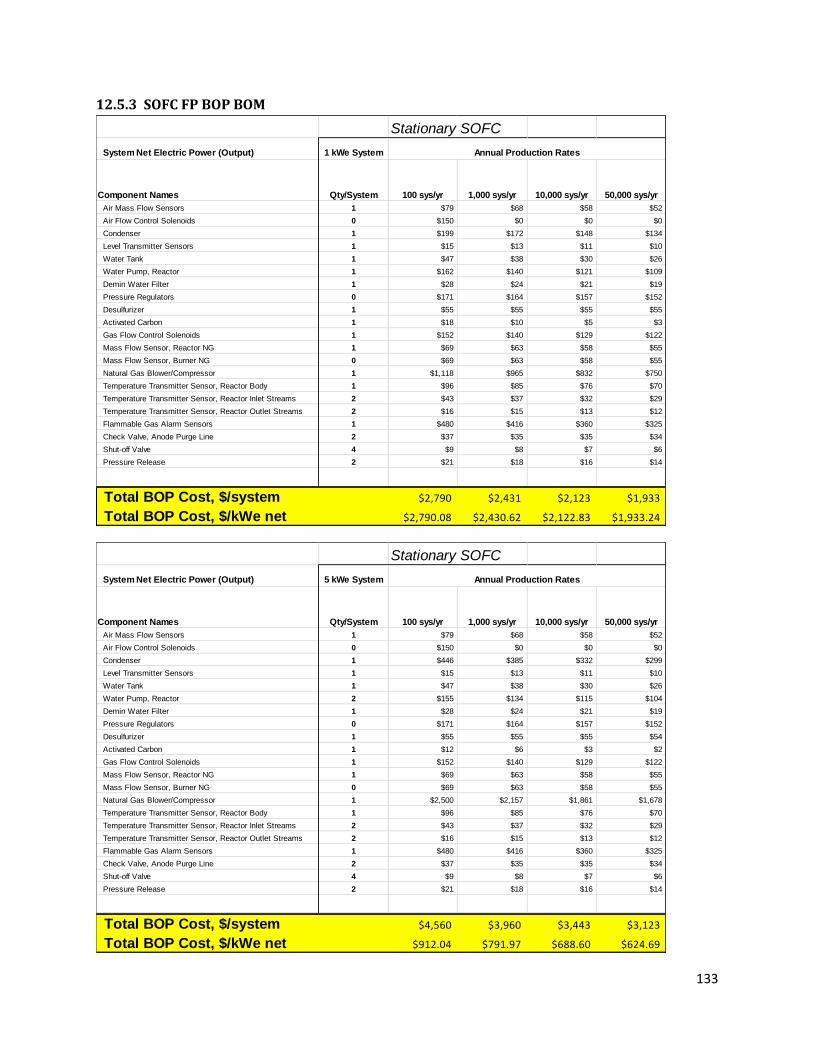
133
12.5.3 SOFC FP BOP BOM
Stationary SOFC
System Net Electric Power (Output) 1 kWe System
Component Names Qty/System 100 sys/yr 1,000 sys/yr 10,000 sys/yr 50,000 sys/yr
Air Mass Flow Sensors 1 $79 $68 $58 $52
Air Flow Control Solenoids 0 $150 $0 $0 $0
Condenser 1 $199 $172 $148 $134
Level Transmitter Sensors 1 $15 $13 $11 $10
Water Tank 1 $47 $38 $30 $26
Water Pump, Reactor 1 $162 $140 $121 $109
Demin Water Filter 1 $28 $24 $21 $19
Pressure Regulators 0 $171 $164 $157 $152
Desulfurizer 1 $55 $55 $55 $55
Activated Carbon 1 $18 $10 $5 $3
Gas Flow Control Solenoids 1 $152 $140 $129 $122
Mass Flow Sensor, Reactor NG 1 $69 $63 $58 $55
Mass Flow Sensor, Burner NG 0 $69 $63 $58 $55
Natural Gas Blower/Compressor 1 $1,118 $965 $832 $750
Temperature Transmitter Sensor, Reactor Body 1 $96 $85 $76 $70
Temperature Transmitter Sensor, Reactor Inlet Streams 2 $43 $37 $32 $29
Temperature Transmitter Sensor, Reactor Outlet Streams 2 $16 $15 $13 $12
Flammable Gas Alarm Sensors 1 $480 $416 $360 $325
Check Valve, Anode Purge Line 2 $37 $35 $35 $34
Shut-off Valve 4 $9 $8 $7 $6
Pressure Release 2 $21 $18 $16 $14
Total BOP Cost, $/system $2,790 $2,431 $2,123 $1,933
Total BOP Cost, $/kWe net $2,790.08 $2,430.62 $2,122.83 $1,933.24
Annual Production Rates
Stationary SOFC
System Net Electric Power (Output) 5 kWe System
Component Names Qty/System 100 sys/yr 1,000 sys/yr 10,000 sys/yr 50,000 sys/yr
Air Mass Flow Sensors 1 $79 $68 $58 $52
Air Flow Control Solenoids 0 $150 $0 $0 $0
Condenser 1 $446 $385 $332 $299
Level Transmitter Sensors 1 $15 $13 $11 $10
Water Tank 1 $47 $38 $30 $26
Water Pump, Reactor 2 $155 $134 $115 $104
Demin Water Filter 1 $28 $24 $21 $19
Pressure Regulators 0 $171 $164 $157 $152
Desulfurizer 1 $55 $55 $55 $54
Activated Carbon 1 $12 $6 $3 $2
Gas Flow Control Solenoids 1 $152 $140 $129 $122
Mass Flow Sensor, Reactor NG 1 $69 $63 $58 $55
Mass Flow Sensor, Burner NG 0 $69 $63 $58 $55
Natural Gas Blower/Compressor 1 $2,500 $2,157 $1,861 $1,678
Temperature Transmitter Sensor, Reactor Body 1 $96 $85 $76 $70
Temperature Transmitter Sensor, Reactor Inlet Streams 2 $43 $37 $32 $29
Temperature Transmitter Sensor, Reactor Outlet Streams 2 $16 $15 $13 $12
Flammable Gas Alarm Sensors 1 $480 $416 $360 $325
Check Valve, Anode Purge Line 2 $37 $35 $35 $34
Shut-off Valve 4 $9 $8 $7 $6
Pressure Release 2 $21 $18 $16 $14
Total BOP Cost, $/system $4,560 $3,960 $3,443 $3,123
Total BOP Cost, $/kWe net $912.04 $791.97 $688.60 $624.69
Annual Production Rates
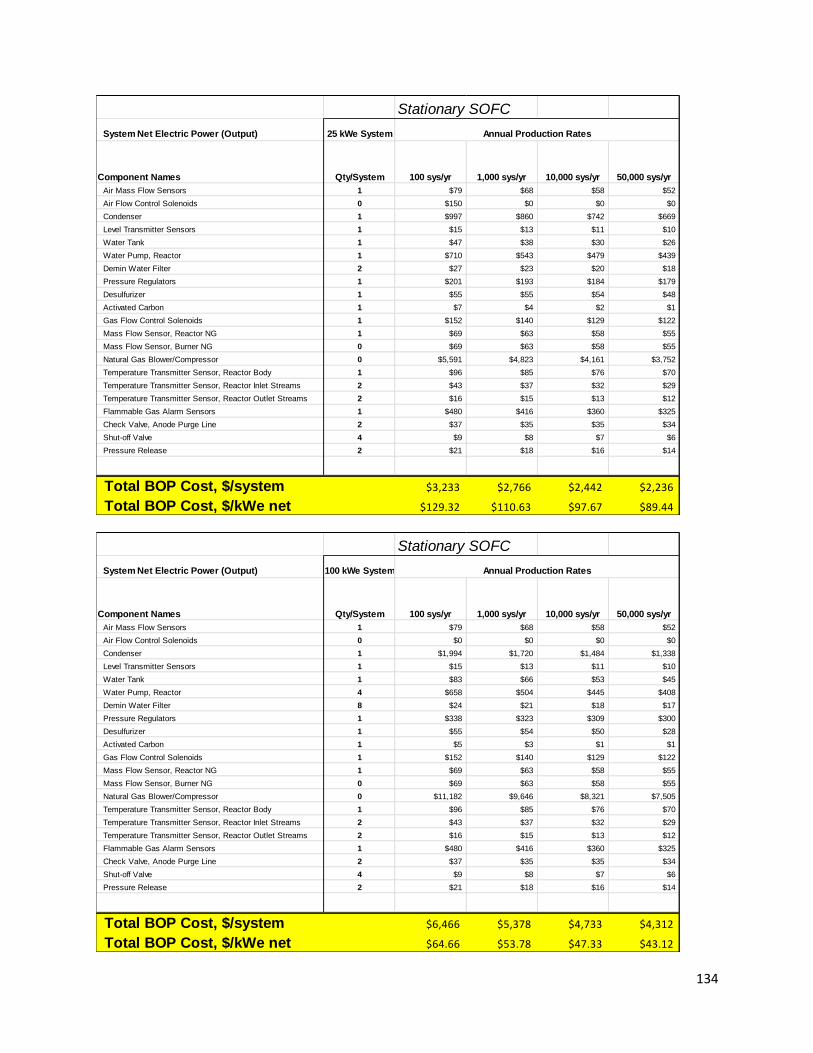
134
Stationary SOFC
System Net Electric Power (Output) 25 kWe System
Component Names Qty/System 100 sys/yr 1,000 sys/yr 10,000 sys/yr 50,000 sys/yr
Air Mass Flow Sensors 1 $79 $68 $58 $52
Air Flow Control Solenoids 0 $150 $0 $0 $0
Condenser 1 $997 $860 $742 $669
Level Transmitter Sensors 1 $15 $13 $11 $10
Water Tank 1 $47 $38 $30 $26
Water Pump, Reactor 1 $710 $543 $479 $439
Demin Water Filter 2 $27 $23 $20 $18
Pressure Regulators 1 $201 $193 $184 $179
Desulfurizer 1 $55 $55 $54 $48
Activated Carbon 1 $7 $4 $2 $1
Gas Flow Control Solenoids 1 $152 $140 $129 $122
Mass Flow Sensor, Reactor NG 1 $69 $63 $58 $55
Mass Flow Sensor, Burner NG 0 $69 $63 $58 $55
Natural Gas Blower/Compressor 0 $5,591 $4,823 $4,161 $3,752
Temperature Transmitter Sensor, Reactor Body 1 $96 $85 $76 $70
Temperature Transmitter Sensor, Reactor Inlet Streams 2 $43 $37 $32 $29
Temperature Transmitter Sensor, Reactor Outlet Streams 2 $16 $15 $13 $12
Flammable Gas Alarm Sensors 1 $480 $416 $360 $325
Check Valve, Anode Purge Line 2 $37 $35 $35 $34
Shut-off Valve 4 $9 $8 $7 $6
Pressure Release 2 $21 $18 $16 $14
Total BOP Cost, $/system $3,233 $2,766 $2,442 $2,236
Total BOP Cost, $/kWe net $129.32 $110.63 $97.67 $89.44
Annual Production Rates
Stationary SOFC
System Net Electric Power (Output) 100 kWe System
Component Names Qty/System 100 sys/yr 1,000 sys/yr 10,000 sys/yr 50,000 sys/yr
Air Mass Flow Sensors 1 $79 $68 $58 $52
Air Flow Control Solenoids 0 $0 $0 $0 $0
Condenser 1 $1,994 $1,720 $1,484 $1,338
Level Transmitter Sensors 1 $15 $13 $11 $10
Water Tank 1 $83 $66 $53 $45
Water Pump, Reactor 4 $658 $504 $445 $408
Demin Water Filter 8 $24 $21 $18 $17
Pressure Regulators 1 $338 $323 $309 $300
Desulfurizer 1 $55 $54 $50 $28
Activated Carbon 1 $5 $3 $1 $1
Gas Flow Control Solenoids 1 $152 $140 $129 $122
Mass Flow Sensor, Reactor NG 1 $69 $63 $58 $55
Mass Flow Sensor, Burner NG 0 $69 $63 $58 $55
Natural Gas Blower/Compressor 0 $11,182 $9,646 $8,321 $7,505
Temperature Transmitter Sensor, Reactor Body 1 $96 $85 $76 $70
Temperature Transmitter Sensor, Reactor Inlet Streams 2 $43 $37 $32 $29
Temperature Transmitter Sensor, Reactor Outlet Streams 2 $16 $15 $13 $12
Flammable Gas Alarm Sensors 1 $480 $416 $360 $325
Check Valve, Anode Purge Line 2 $37 $35 $35 $34
Shut-off Valve 4 $9 $8 $7 $6
Pressure Release 2 $21 $18 $16 $14
Total BOP Cost, $/system $6,466 $5,378 $4,733 $4,312
Total BOP Cost, $/kWe net $64.66 $53.78 $47.33 $43.12
Annual Production Rates
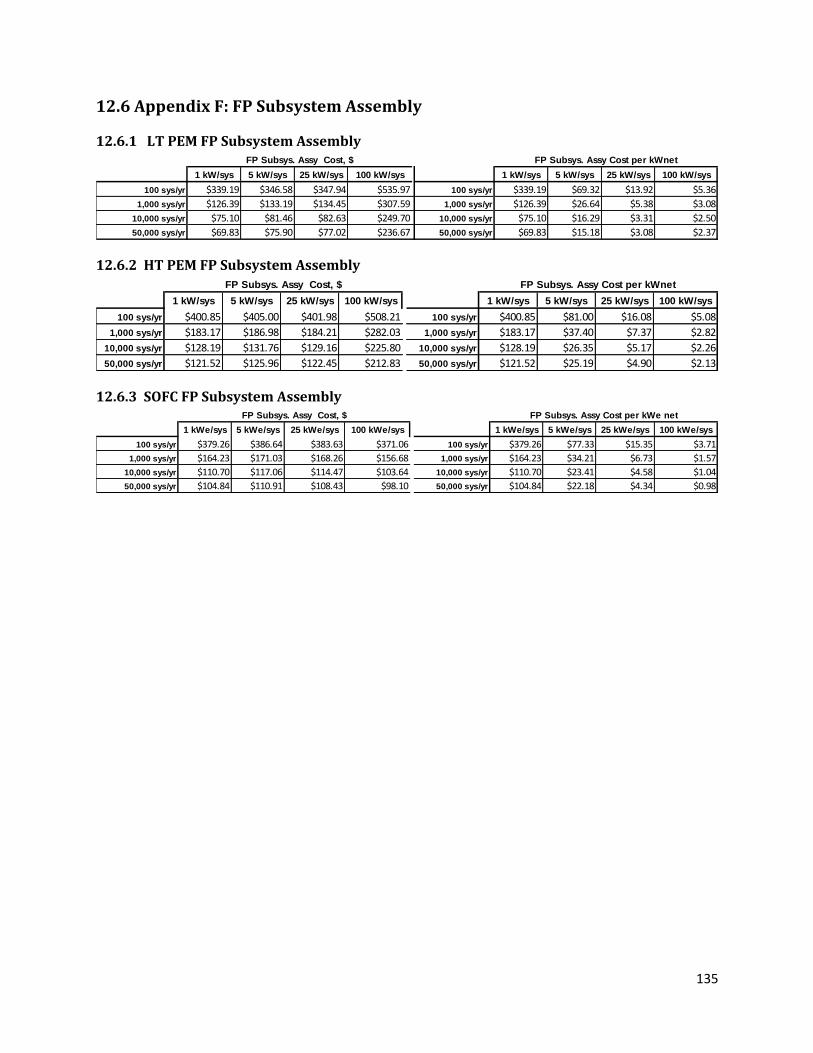
135
12.6 Appendix F: FP Subsystem Assembly
12.6.1 LT PEM FP Subsystem Assembly
12.6.2 HT PEM FP Subsystem Assembly
12.6.3 SOFC FP Subsystem Assembly
1 kW/sys 5 kW/sys 25 kW/sys 100 kW/sys 1 kW/sys 5 kW/sys 25 kW/sys 100 kW/sys
100 sys/yr $339.19 $346.58 $347.94 $535.97 100 sys/yr $339.19 $69.32 $13.92 $5.36
1,000 sys/yr $126.39 $133.19 $134.45 $307.59 1,000 sys/yr $126.39 $26.64 $5.38 $3.08
10,000 sys/yr $75.10 $81.46 $82.63 $249.70 10,000 sys/yr $75.10 $16.29 $3.31 $2.50
50,000 sys/yr $69.83 $75.90 $77.02 $236.67 50,000 sys/yr $69.83 $15.18 $3.08 $2.37
FP Subsys. Assy Cost, $ FP Subsys. Assy Cost per kWnet
1 kW/sys 5 kW/sys 25 kW/sys 100 kW/sys 1 kW/sys 5 kW/sys 25 kW/sys 100 kW/sys
100 sys/yr $400.85 $405.00 $401.98 $508.21 100 sys/yr $400.85 $81.00 $16.08 $5.08
1,000 sys/yr $183.17 $186.98 $184.21 $282.03 1,000 sys/yr $183.17 $37.40 $7.37 $2.82
10,000 sys/yr $128.19 $131.76 $129.16 $225.80 10,000 sys/yr $128.19 $26.35 $5.17 $2.26
50,000 sys/yr $121.52 $125.96 $122.45 $212.83 50,000 sys/yr $121.52 $25.19 $4.90 $2.13
FP Subsys. Assy Cost, $ FP Subsys. Assy Cost per kWnet
1 kWe/sys 5 kWe/sys 25 kWe/sys 100 kWe/sys 1 kWe/sys 5 kWe/sys 25 kWe/sys 100 kWe/sys
100 sys/yr $379.26 $386.64 $383.63 $371.06 100 sys/yr $379.26 $77.33 $15.35 $3.71
1,000 sys/yr $164.23 $171.03 $168.26 $156.68 1,000 sys/yr $164.23 $34.21 $6.73 $1.57
10,000 sys/yr $110.70 $117.06 $114.47 $103.64 10,000 sys/yr $110.70 $23.41 $4.58 $1.04
50,000 sys/yr $104.84 $110.91 $108.43 $98.10 50,000 sys/yr $104.84 $22.18 $4.34 $0.98
FP Subsys. Assy Cost, $ FP Subsys. Assy Cost per kWe net
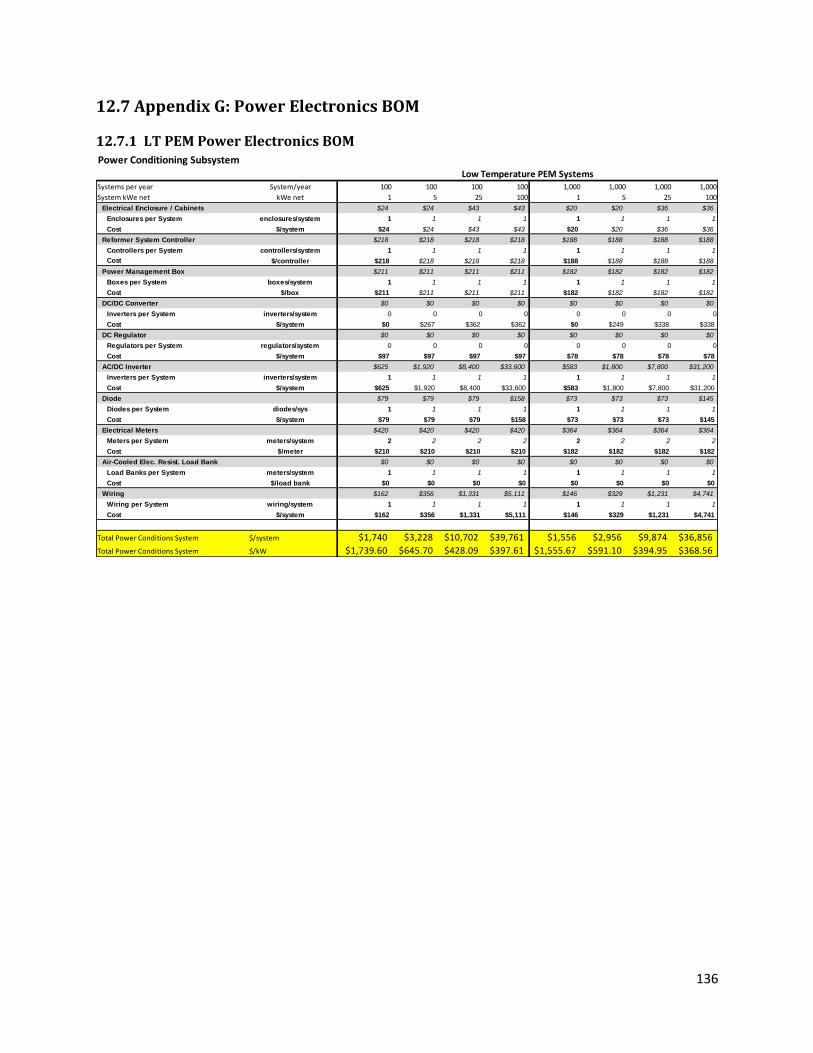
136
12.7 Appendix G: Power Electronics BOM
12.7.1 LT PEM Power Electronics BOM
Power Conditioning Subsystem
Systems per year System/year 100 100 100 100 1,000 1,000 1,000 1,000
System kWe net kWe net 1 5 25 100 1 5 25 100
Electrical Enclosure / Cabinets $24 $24 $43 $43 $20 $20 $36 $36
Enclosures per System enclosures/system 1 1 1 1 1 1 1 1
Cost $/system $24 $24 $43 $43 $20 $20 $36 $36
Reformer System Controller $218 $218 $218 $218 $188 $188 $188 $188
Controllers per System controllers/system 1 1 1 1 1 1 1 1
Cost $/controller $218 $218 $218 $218 $188 $188 $188 $188
Power Management Box $211 $211 $211 $211 $182 $182 $182 $182
Boxes per System boxes/system 1 1 1 1 1 1 1 1
Cost $/box $211 $211 $211 $211 $182 $182 $182 $182
DC/DC Converter $0 $0 $0 $0 $0 $0 $0 $0
Inverters per System inverters/system 0 0 0 0 0 0 0 0
Cost $/system $0 $267 $362 $362 $0 $249 $338 $338
DC Regulator $0 $0 $0 $0 $0 $0 $0 $0
Regulators per System regulators/system 0 0 0 0 0 0 0 0
Cost $/system $97 $97 $97 $97 $78 $78 $78 $78
AC/DC Inverter $625 $1,920 $8,400 $33,600 $583 $1,800 $7,800 $31,200
Inverters per System inverters/system 1 1 1 1 1 1 1 1
Cost $/system $625 $1,920 $8,400 $33,600 $583 $1,800 $7,800 $31,200
Diode $79 $79 $79 $158 $73 $73 $73 $145
Diodes per System diodes/sys 1 1 1 1 1 1 1 1
Cost $/system $79 $79 $79 $158 $73 $73 $73 $145
Electrical Meters $420 $420 $420 $420 $364 $364 $364 $364
Meters per System meters/system 2 2 2 2 2 2 2 2
Cost $/meter $210 $210 $210 $210 $182 $182 $182 $182
Air-Cooled Elec. Resist. Load Bank $0 $0 $0 $0 $0 $0 $0 $0
Load Banks per System meters/system 1 1 1 1 1 1 1 1
Cost $/load bank $0 $0 $0 $0 $0 $0 $0 $0
Wiring $162 $356 $1,331 $5,111 $146 $329 $1,231 $4,741
Wiring per System wiring/system 1 1 1 1 1 1 1 1
Cost $/system $162 $356 $1,331 $5,111 $146 $329 $1,231 $4,741
Total Power Conditions System $/system $1,740 $3,228 $10,702 $39,761 $1,556 $2,956 $9,874 $36,856
Total Power Conditions System $/kW $1,739.60 $645.70 $428.09 $397.61 $1,555.67 $591.10 $394.95 $368.56
Low Temperature PEM Systems
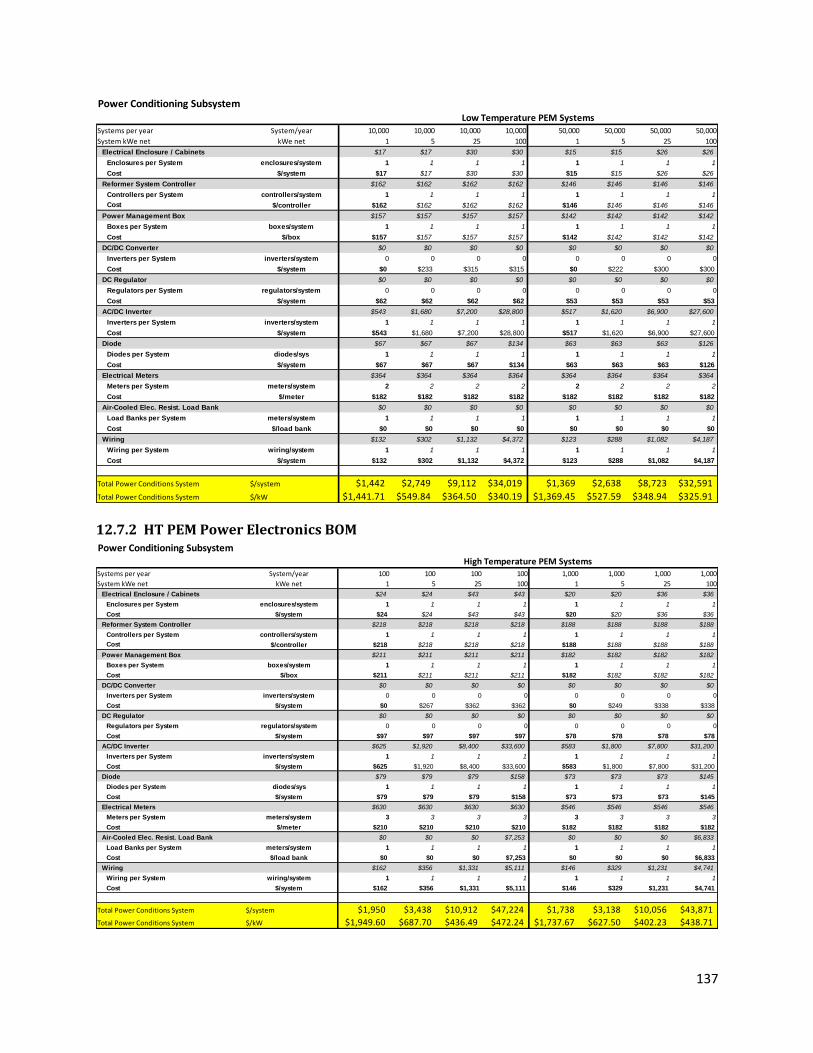
137
12.7.2 HT PEM Power Electronics BOM
Power Conditioning Subsystem
Systems per year System/year 10,000 10,000 10,000 10,000 50,000 50,000 50,000 50,000
System kWe net kWe net 1 5 25 100 1 5 25 100
Electrical Enclosure / Cabinets $17 $17 $30 $30 $15 $15 $26 $26
Enclosures per System enclosures/system 1 1 1 1 1 1 1 1
Cost $/system $17 $17 $30 $30 $15 $15 $26 $26
Reformer System Controller $162 $162 $162 $162 $146 $146 $146 $146
Controllers per System controllers/system 1 1 1 1 1 1 1 1
Cost $/controller $162 $162 $162 $162 $146 $146 $146 $146
Power Management Box $157 $157 $157 $157 $142 $142 $142 $142
Boxes per System boxes/system 1 1 1 1 1 1 1 1
Cost $/box $157 $157 $157 $157 $142 $142 $142 $142
DC/DC Converter $0 $0 $0 $0 $0 $0 $0 $0
Inverters per System inverters/system 0 0 0 0 0 0 0 0
Cost $/system $0 $233 $315 $315 $0 $222 $300 $300
DC Regulator $0 $0 $0 $0 $0 $0 $0 $0
Regulators per System regulators/system 0 0 0 0 0 0 0 0
Cost $/system $62 $62 $62 $62 $53 $53 $53 $53
AC/DC Inverter $543 $1,680 $7,200 $28,800 $517 $1,620 $6,900 $27,600
Inverters per System inverters/system 1 1 1 1 1 1 1 1
Cost $/system $543 $1,680 $7,200 $28,800 $517 $1,620 $6,900 $27,600
Diode $67 $67 $67 $134 $63 $63 $63 $126
Diodes per System diodes/sys 1 1 1 1 1 1 1 1
Cost $/system $67 $67 $67 $134 $63 $63 $63 $126
Electrical Meters $364 $364 $364 $364 $364 $364 $364 $364
Meters per System meters/system 2 2 2 2 2 2 2 2
Cost $/meter $182 $182 $182 $182 $182 $182 $182 $182
Air-Cooled Elec. Resist. Load Bank $0 $0 $0 $0 $0 $0 $0 $0
Load Banks per System meters/system 1 1 1 1 1 1 1 1
Cost $/load bank $0 $0 $0 $0 $0 $0 $0 $0
Wiring $132 $302 $1,132 $4,372 $123 $288 $1,082 $4,187
Wiring per System wiring/system 1 1 1 1 1 1 1 1
Cost $/system $132 $302 $1,132 $4,372 $123 $288 $1,082 $4,187
Total Power Conditions System $/system $1,442 $2,749 $9,112 $34,019 $1,369 $2,638 $8,723 $32,591
Total Power Conditions System $/kW $1,441.71 $549.84 $364.50 $340.19 $1,369.45 $527.59 $348.94 $325.91
Low Temperature PEM Systems
Power Conditioning Subsystem
Systems per year System/year 100 100 100 100 1,000 1,000 1,000 1,000
System kWe net kWe net 1 5 25 100 1 5 25 100
Electrical Enclosure / Cabinets $24 $24 $43 $43 $20 $20 $36 $36
Enclosures per System enclosures/system 1 1 1 1 1 1 1 1
Cost $/system $24 $24 $43 $43 $20 $20 $36 $36
Reformer System Controller $218 $218 $218 $218 $188 $188 $188 $188
Controllers per System controllers/system 1 1 1 1 1 1 1 1
Cost $/controller $218 $218 $218 $218 $188 $188 $188 $188
Power Management Box $211 $211 $211 $211 $182 $182 $182 $182
Boxes per System boxes/system 1 1 1 1 1 1 1 1
Cost $/box $211 $211 $211 $211 $182 $182 $182 $182
DC/DC Converter $0 $0 $0 $0 $0 $0 $0 $0
Inverters per System inverters/system 0 0 0 0 0 0 0 0
Cost $/system $0 $267 $362 $362 $0 $249 $338 $338
DC Regulator $0 $0 $0 $0 $0 $0 $0 $0
Regulators per System regulators/system 0 0 0 0 0 0 0 0
Cost $/system $97 $97 $97 $97 $78 $78 $78 $78
AC/DC Inverter $625 $1,920 $8,400 $33,600 $583 $1,800 $7,800 $31,200
Inverters per System inverters/system 1 1 1 1 1 1 1 1
Cost $/system $625 $1,920 $8,400 $33,600 $583 $1,800 $7,800 $31,200
Diode $79 $79 $79 $158 $73 $73 $73 $145
Diodes per System diodes/sys 1 1 1 1 1 1 1 1
Cost $/system $79 $79 $79 $158 $73 $73 $73 $145
Electrical Meters $630 $630 $630 $630 $546 $546 $546 $546
Meters per System meters/system 3 3 3 3 3 3 3 3
Cost $/meter $210 $210 $210 $210 $182 $182 $182 $182
Air-Cooled Elec. Resist. Load Bank $0 $0 $0 $7,253 $0 $0 $0 $6,833
Load Banks per System meters/system 1 1 1 1 1 1 1 1
Cost $/load bank $0 $0 $0 $7,253 $0 $0 $0 $6,833
Wiring $162 $356 $1,331 $5,111 $146 $329 $1,231 $4,741
Wiring per System wiring/system 1 1 1 1 1 1 1 1
Cost $/system $162 $356 $1,331 $5,111 $146 $329 $1,231 $4,741
Total Power Conditions System $/system $1,950 $3,438 $10,912 $47,224 $1,738 $3,138 $10,056 $43,871
Total Power Conditions System $/kW $1,949.60 $687.70 $436.49 $472.24 $1,737.67 $627.50 $402.23 $438.71
High Temperature PEM Systems
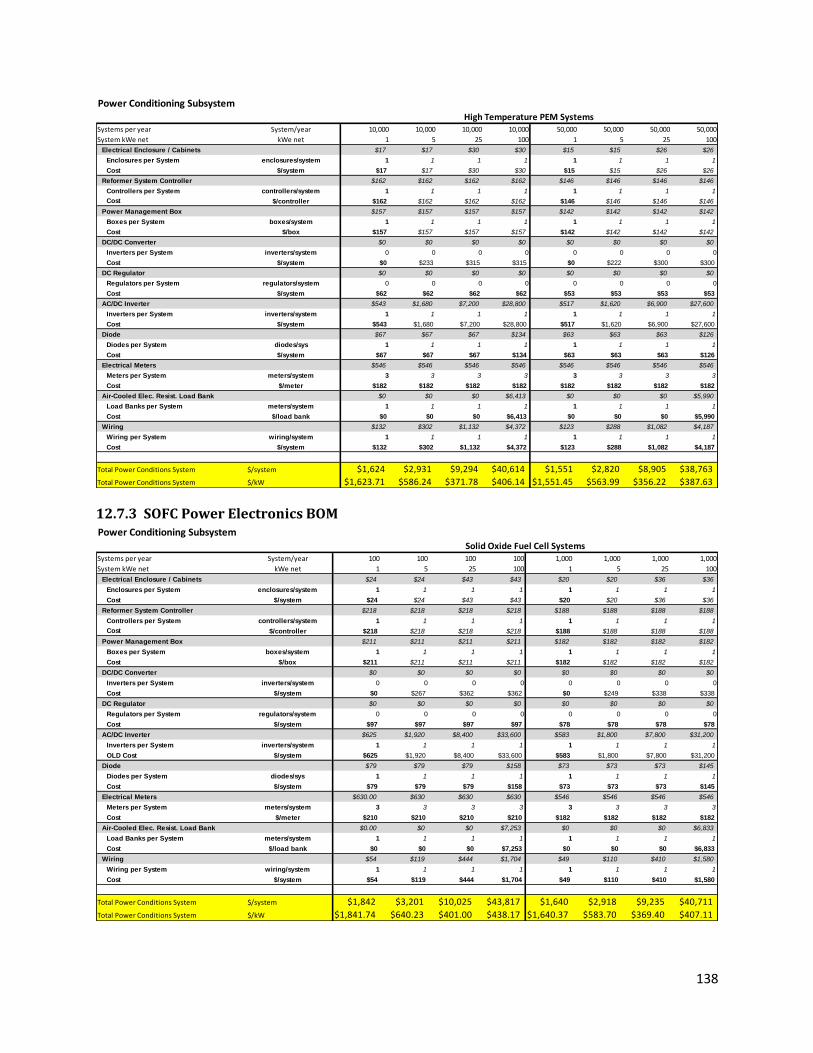
138
12.7.3 SOFC Power Electronics BOM
Power Conditioning Subsystem
Systems per year System/year 10,000 10,000 10,000 10,000 50,000 50,000 50,000 50,000
System kWe net kWe net 1 5 25 100 1 5 25 100
Electrical Enclosure / Cabinets $17 $17 $30 $30 $15 $15 $26 $26
Enclosures per System enclosures/system 1 1 1 1 1 1 1 1
Cost $/system $17 $17 $30 $30 $15 $15 $26 $26
Reformer System Controller $162 $162 $162 $162 $146 $146 $146 $146
Controllers per System controllers/system 1 1 1 1 1 1 1 1
Cost $/controller $162 $162 $162 $162 $146 $146 $146 $146
Power Management Box $157 $157 $157 $157 $142 $142 $142 $142
Boxes per System boxes/system 1 1 1 1 1 1 1 1
Cost $/box $157 $157 $157 $157 $142 $142 $142 $142
DC/DC Converter $0 $0 $0 $0 $0 $0 $0 $0
Inverters per System inverters/system 0 0 0 0 0 0 0 0
Cost $/system $0 $233 $315 $315 $0 $222 $300 $300
DC Regulator $0 $0 $0 $0 $0 $0 $0 $0
Regulators per System regulators/system 0 0 0 0 0 0 0 0
Cost $/system $62 $62 $62 $62 $53 $53 $53 $53
AC/DC Inverter $543 $1,680 $7,200 $28,800 $517 $1,620 $6,900 $27,600
Inverters per System inverters/system 1 1 1 1 1 1 1 1
Cost $/system $543 $1,680 $7,200 $28,800 $517 $1,620 $6,900 $27,600
Diode $67 $67 $67 $134 $63 $63 $63 $126
Diodes per System diodes/sys 1 1 1 1 1 1 1 1
Cost $/system $67 $67 $67 $134 $63 $63 $63 $126
Electrical Meters $546 $546 $546 $546 $546 $546 $546 $546
Meters per System meters/system 3 3 3 3 3 3 3 3
Cost $/meter $182 $182 $182 $182 $182 $182 $182 $182
Air-Cooled Elec. Resist. Load Bank $0 $0 $0 $6,413 $0 $0 $0 $5,990
Load Banks per System meters/system 1 1 1 1 1 1 1 1
Cost $/load bank $0 $0 $0 $6,413 $0 $0 $0 $5,990
Wiring $132 $302 $1,132 $4,372 $123 $288 $1,082 $4,187
Wiring per System wiring/system 1 1 1 1 1 1 1 1
Cost $/system $132 $302 $1,132 $4,372 $123 $288 $1,082 $4,187
Total Power Conditions System $/system $1,624 $2,931 $9,294 $40,614 $1,551 $2,820 $8,905 $38,763
Total Power Conditions System $/kW $1,623.71 $586.24 $371.78 $406.14 $1,551.45 $563.99 $356.22 $387.63
High Temperature PEM Systems
Power Conditioning Subsystem
Systems per year System/year 100 100 100 100 1,000 1,000 1,000 1,000
System kWe net kWe net 1 5 25 100 1 5 25 100
Electrical Enclosure / Cabinets $24 $24 $43 $43 $20 $20 $36 $36
Enclosures per System enclosures/system 1 1 1 1 1 1 1 1
Cost $/system $24 $24 $43 $43 $20 $20 $36 $36
Reformer System Controller $218 $218 $218 $218 $188 $188 $188 $188
Controllers per System controllers/system 1 1 1 1 1 1 1 1
Cost $/controller $218 $218 $218 $218 $188 $188 $188 $188
Power Management Box $211 $211 $211 $211 $182 $182 $182 $182
Boxes per System boxes/system 1 1 1 1 1 1 1 1
Cost $/box $211 $211 $211 $211 $182 $182 $182 $182
DC/DC Converter $0 $0 $0 $0 $0 $0 $0 $0
Inverters per System inverters/system 0 0 0 0 0 0 0 0
Cost $/system $0 $267 $362 $362 $0 $249 $338 $338
DC Regulator $0 $0 $0 $0 $0 $0 $0 $0
Regulators per System regulators/system 0 0 0 0 0 0 0 0
Cost $/system $97 $97 $97 $97 $78 $78 $78 $78
AC/DC Inverter $625 $1,920 $8,400 $33,600 $583 $1,800 $7,800 $31,200
Inverters per System inverters/system 1 1 1 1 1 1 1 1
OLD Cost $/system $625 $1,920 $8,400 $33,600 $583 $1,800 $7,800 $31,200
Diode $79 $79 $79 $158 $73 $73 $73 $145
Diodes per System diodes/sys 1 1 1 1 1 1 1 1
Cost $/system $79 $79 $79 $158 $73 $73 $73 $145
Electrical Meters $630.00 $630 $630 $630 $546 $546 $546 $546
Meters per System meters/system 3 3 3 3 3 3 3 3
Cost $/meter $210 $210 $210 $210 $182 $182 $182 $182
Air-Cooled Elec. Resist. Load Bank $0.00 $0 $0 $7,253 $0 $0 $0 $6,833
Load Banks per System meters/system 1 1 1 1 1 1 1 1
Cost $/load bank $0 $0 $0 $7,253 $0 $0 $0 $6,833
Wiring $54 $119 $444 $1,704 $49 $110 $410 $1,580
Wiring per System wiring/system 1 1 1 1 1 1 1 1
Cost $/system $54 $119 $444 $1,704 $49 $110 $410 $1,580
Total Power Conditions System $/system $1,842 $3,201 $10,025 $43,817 $1,640 $2,918 $9,235 $40,711
Total Power Conditions System $/kW $1,841.74 $640.23 $401.00 $438.17 $1,640.37 $583.70 $369.40 $407.11
Solid Oxide Fuel Cell Systems
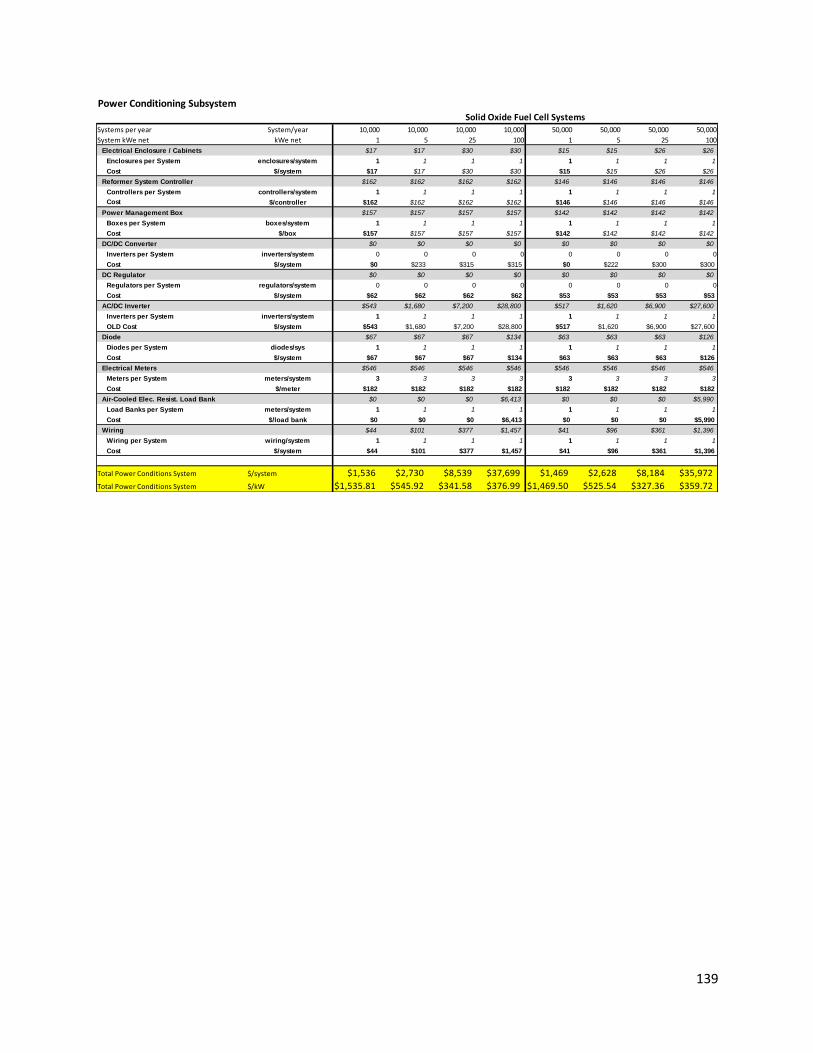
139
Power Conditioning Subsystem
Systems per year System/year 10,000 10,000 10,000 10,000 50,000 50,000 50,000 50,000
System kWe net kWe net 1 5 25 100 1 5 25 100
Electrical Enclosure / Cabinets $17 $17 $30 $30 $15 $15 $26 $26
Enclosures per System enclosures/system 1 1 1 1 1 1 1 1
Cost $/system $17 $17 $30 $30 $15 $15 $26 $26
Reformer System Controller $162 $162 $162 $162 $146 $146 $146 $146
Controllers per System controllers/system 1 1 1 1 1 1 1 1
Cost $/controller $162 $162 $162 $162 $146 $146 $146 $146
Power Management Box $157 $157 $157 $157 $142 $142 $142 $142
Boxes per System boxes/system 1 1 1 1 1 1 1 1
Cost $/box $157 $157 $157 $157 $142 $142 $142 $142
DC/DC Converter $0 $0 $0 $0 $0 $0 $0 $0
Inverters per System inverters/system 0 0 0 0 0 0 0 0
Cost $/system $0 $233 $315 $315 $0 $222 $300 $300
DC Regulator $0 $0 $0 $0 $0 $0 $0 $0
Regulators per System regulators/system 0 0 0 0 0 0 0 0
Cost $/system $62 $62 $62 $62 $53 $53 $53 $53
AC/DC Inverter $543 $1,680 $7,200 $28,800 $517 $1,620 $6,900 $27,600
Inverters per System inverters/system 1 1 1 1 1 1 1 1
OLD Cost $/system $543 $1,680 $7,200 $28,800 $517 $1,620 $6,900 $27,600
Diode $67 $67 $67 $134 $63 $63 $63 $126
Diodes per System diodes/sys 1 1 1 1 1 1 1 1
Cost $/system $67 $67 $67 $134 $63 $63 $63 $126
Electrical Meters $546 $546 $546 $546 $546 $546 $546 $546
Meters per System meters/system 3 3 3 3 3 3 3 3
Cost $/meter $182 $182 $182 $182 $182 $182 $182 $182
Air-Cooled Elec. Resist. Load Bank $0 $0 $0 $6,413 $0 $0 $0 $5,990
Load Banks per System meters/system 1 1 1 1 1 1 1 1
Cost $/load bank $0 $0 $0 $6,413 $0 $0 $0 $5,990
Wiring $44 $101 $377 $1,457 $41 $96 $361 $1,396
Wiring per System wiring/system 1 1 1 1 1 1 1 1
Cost $/system $44 $101 $377 $1,457 $41 $96 $361 $1,396
Total Power Conditions System $/system $1,536 $2,730 $8,539 $37,699 $1,469 $2,628 $8,184 $35,972
Total Power Conditions System $/kW $1,535.81 $545.92 $341.58 $376.99 $1,469.50 $525.54 $327.36 $359.72
Solid Oxide Fuel Cell Systems
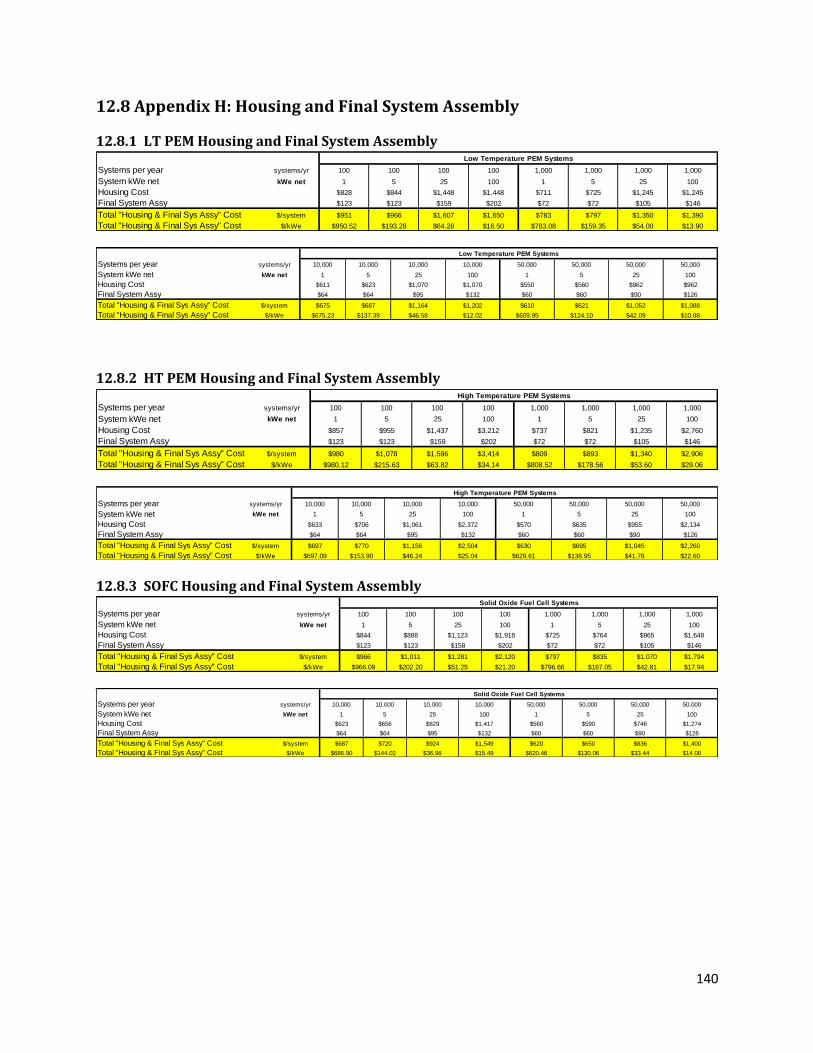
140
12.8 Appendix H: Housing and Final System Assembly
12.8.1 LT PEM Housing and Final System Assembly
12.8.2 HT PEM Housing and Final System Assembly
12.8.3 SOFC Housing and Final System Assembly
Systems per year systems/yr 100 100 100 100 1,000 1,000 1,000 1,000
System kWe net kWe net 1 5 25 100 1 5 25 100
Housing Cost $828 $844 $1,448 $1,448 $711 $725 $1,245 $1,245
Final System Assy $123 $123 $159 $202 $72 $72 $105 $146
Total "Housing & Final Sys Assy" Cost $/system $951 $966 $1,607 $1,650 $783 $797 $1,350 $1,390
Total "Housing & Final Sys Assy" Cost $/kWe $950.52 $193.28 $64.28 $16.50 $783.08 $159.35 $54.00 $13.90
Low Temperature PEM Systems
Systems per year systems/yr 10,000 10,000 10,000 10,000 50,000 50,000 50,000 50,000
System kWe net kWe net 1 5 25 100 1 5 25 100
Housing Cost $611 $623 $1,070 $1,070 $550 $560 $962 $962
Final System Assy $64 $64 $95 $132 $60 $60 $90 $126
Total "Housing & Final Sys Assy" Cost $/system $675 $687 $1,164 $1,202 $610 $621 $1,052 $1,088
Total "Housing & Final Sys Assy" Cost $/kWe $675.23 $137.39 $46.58 $12.02 $609.95 $124.10 $42.09 $10.88
Low Temperature PEM Systems
Systems per year systems/yr 100 100 100 100 1,000 1,000 1,000 1,000
System kWe net kWe net 1 5 25 100 1 5 25 100
Housing Cost $857 $955 $1,437 $3,212 $737 $821 $1,235 $2,760
Final System Assy $123 $123 $159 $202 $72 $72 $105 $146
Total "Housing & Final Sys Assy" Cost $/system $980 $1,078 $1,596 $3,414 $809 $893 $1,340 $2,906
Total "Housing & Final Sys Assy" Cost $/kWe $980.12 $215.63 $63.82 $34.14 $808.52 $178.56 $53.60 $29.06
High Temperature PEM Systems
Systems per year systems/yr 10,000 10,000 10,000 10,000 50,000 50,000 50,000 50,000
System kWe net kWe net 1 5 25 100 1 5 25 100
Housing Cost $633 $706 $1,061 $2,372 $570 $635 $955 $2,134
Final System Assy $64 $64 $95 $132 $60 $60 $90 $126
Total "Housing & Final Sys Assy" Cost $/system $697 $770 $1,156 $2,504 $630 $695 $1,045 $2,260
Total "Housing & Final Sys Assy" Cost $/kWe $697.09 $153.90 $46.24 $25.04 $629.61 $138.95 $41.78 $22.60
High Temperature PEM Systems
Systems per year systems/yr 100 100 100 100 1,000 1,000 1,000 1,000
System kWe net kWe net 1 5 25 100 1 5 25 100
Housing Cost $844 $888 $1,123 $1,918 $725 $764 $965 $1,648
Final System Assy $123 $123 $158 $202 $72 $72 $105 $146
Total "Housing & Final Sys Assy" Cost $/system $966 $1,011 $1,281 $2,120 $797 $835 $1,070 $1,794
Total "Housing & Final Sys Assy" Cost $/kWe $966.09 $202.20 $51.25 $21.20 $796.66 $167.05 $42.81 $17.94
Solid Oxide Fuel Cell Systems
Systems per year systems/yr 10,000 10,000 10,000 10,000 50,000 50,000 50,000 50,000
System kWe net kWe net 1 5 25 100 1 5 25 100
Housing Cost $623 $656 $829 $1,417 $560 $590 $746 $1,274
Final System Assy $64 $64 $95 $132 $60 $60 $90 $126
Total "Housing & Final Sys Assy" Cost $/system $687 $720 $924 $1,549 $620 $650 $836 $1,400
Total "Housing & Final Sys Assy" Cost $/kWe $686.90 $144.02 $36.96 $15.49 $620.46 $130.06 $33.44 $14.00
Solid Oxide Fuel Cell Systems
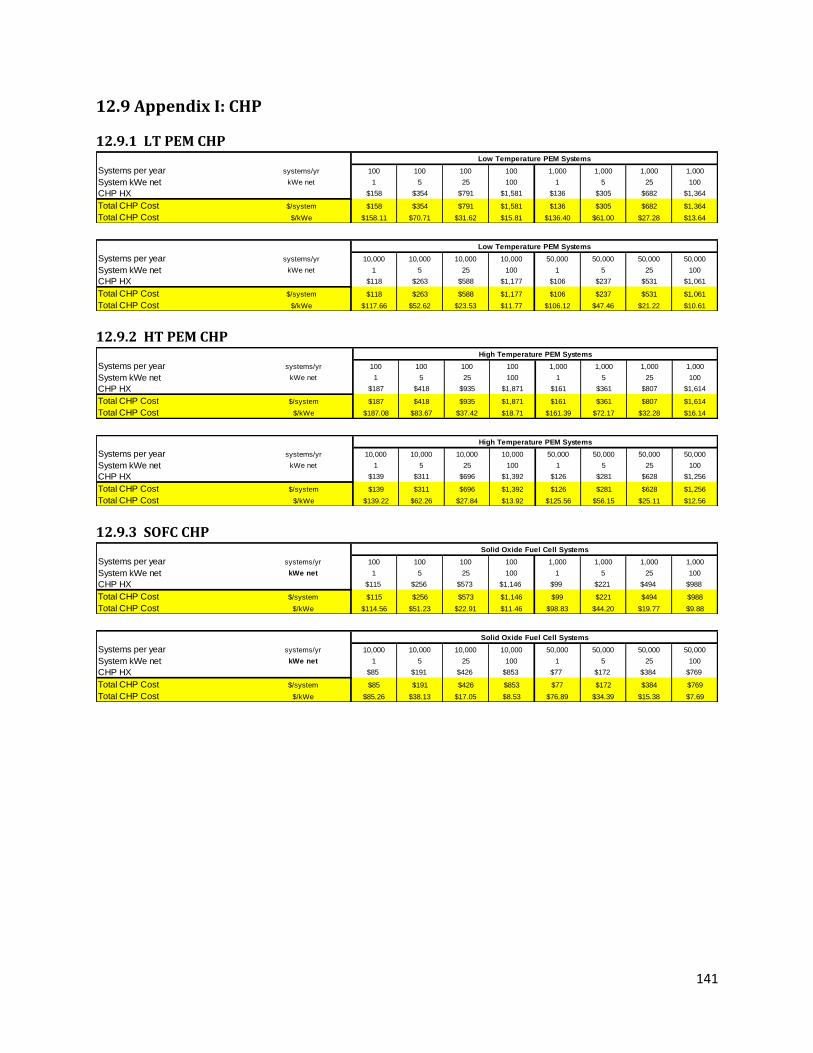
141
12.9 Appendix I: CHP
12.9.1 LT PEM CHP
12.9.2 HT PEM CHP
12.9.3 SOFC CHP
Systems per year systems/yr 100 100 100 100 1,000 1,000 1,000 1,000
System kWe net kWe net 1 5 25 100 1 5 25 100
CHP HX $158 $354 $791 $1,581 $136 $305 $682 $1,364
Total CHP Cost $/system $158 $354 $791 $1,581 $136 $305 $682 $1,364
Total CHP Cost $/kWe $158.11 $70.71 $31.62 $15.81 $136.40 $61.00 $27.28 $13.64
Low Temperature PEM Systems
Systems per year systems/yr 10,000 10,000 10,000 10,000 50,000 50,000 50,000 50,000
System kWe net kWe net 1 5 25 100 1 5 25 100
CHP HX $118 $263 $588 $1,177 $106 $237 $531 $1,061
Total CHP Cost $/system $118 $263 $588 $1,177 $106 $237 $531 $1,061
Total CHP Cost $/kWe $117.66 $52.62 $23.53 $11.77 $106.12 $47.46 $21.22 $10.61
Low Temperature PEM Systems
Systems per year systems/yr 100 100 100 100 1,000 1,000 1,000 1,000
System kWe net kWe net 1 5 25 100 1 5 25 100
CHP HX $187 $418 $935 $1,871 $161 $361 $807 $1,614
Total CHP Cost $/system $187 $418 $935 $1,871 $161 $361 $807 $1,614
Total CHP Cost $/kWe $187.08 $83.67 $37.42 $18.71 $161.39 $72.17 $32.28 $16.14
High Temperature PEM Systems
Systems per year systems/yr 10,000 10,000 10,000 10,000 50,000 50,000 50,000 50,000
System kWe net kWe net 1 5 25 100 1 5 25 100
CHP HX $139 $311 $696 $1,392 $126 $281 $628 $1,256
Total CHP Cost $/system $139 $311 $696 $1,392 $126 $281 $628 $1,256
Total CHP Cost $/kWe $139.22 $62.26 $27.84 $13.92 $125.56 $56.15 $25.11 $12.56
High Temperature PEM Systems
Systems per year systems/yr 100 100 100 100 1,000 1,000 1,000 1,000
System kWe net kWe net 1 5 25 100 1 5 25 100
CHP HX $115 $256 $573 $1,146 $99 $221 $494 $988
Total CHP Cost $/system $115 $256 $573 $1,146 $99 $221 $494 $988
Total CHP Cost $/kWe $114.56 $51.23 $22.91 $11.46 $98.83 $44.20 $19.77 $9.88
Solid Oxide Fuel Cell Systems
Systems per year systems/yr 10,000 10,000 10,000 10,000 50,000 50,000 50,000 50,000
System kWe net kWe net 1 5 25 100 1 5 25 100
CHP HX $85 $191 $426 $853 $77 $172 $384 $769
Total CHP Cost $/system $85 $191 $426 $853 $77 $172 $384 $769
Total CHP Cost $/kWe $85.26 $38.13 $17.05 $8.53 $76.89 $34.39 $15.38 $7.69
Solid Oxide Fuel Cell Systems
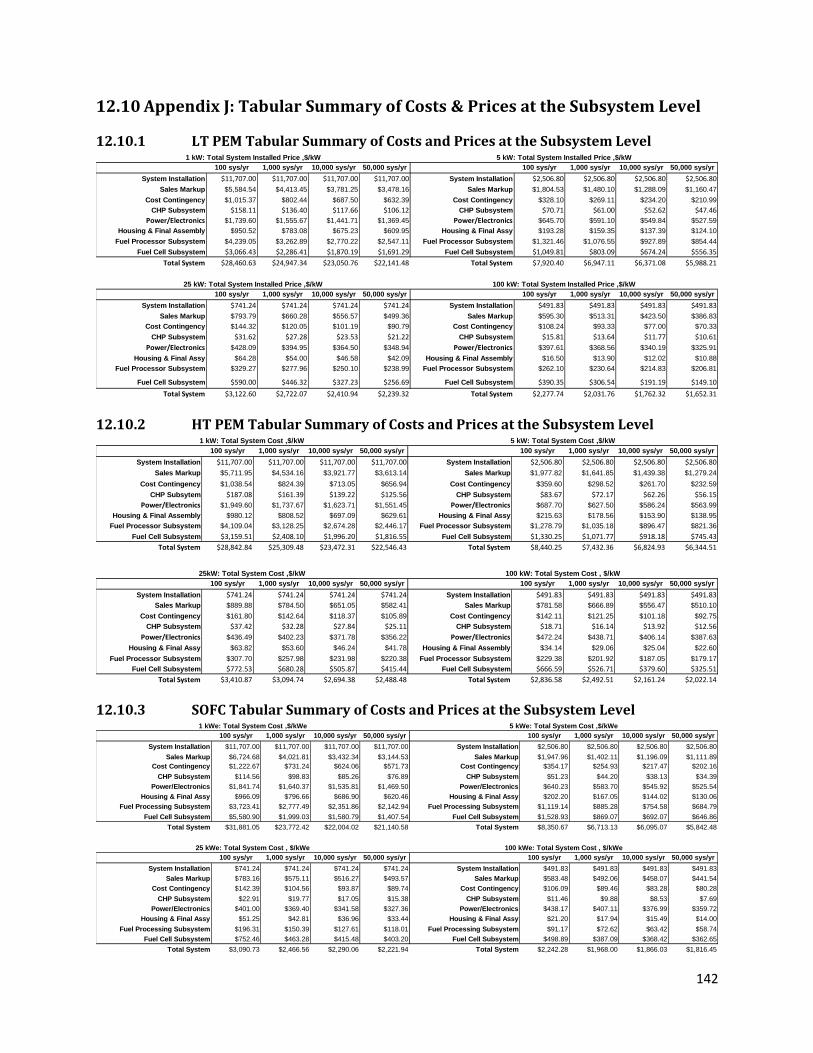
142
12.10 Appendix J: Tabular Summary of Costs & Prices at the Subsystem Level
12.10.1 LT PEM Tabular Summary of Costs and Prices at the Subsystem Level
12.10.2 HT PEM Tabular Summary of Costs and Prices at the Subsystem Level
12.10.3 SOFC Tabular Summary of Costs and Prices at the Subsystem Level
100 sys/yr 1,000 sys/yr 10,000 sys/yr 50,000 sys/yr 100 sys/yr 1,000 sys/yr 10,000 sys/yr 50,000 sys/yr
System Installation $11,707.00 $11,707.00 $11,707.00 $11,707.00 System Installation $2,506.80 $2,506.80 $2,506.80 $2,506.80
Sales Markup $5,584.54 $4,413.45 $3,781.25 $3,478.16 Sales Markup $1,804.53 $1,480.10 $1,288.09 $1,160.47
Cost Contingency $1,015.37 $802.44 $687.50 $632.39 Cost Contingency $328.10 $269.11 $234.20 $210.99
CHP Subsystem $158.11 $136.40 $117.66 $106.12 CHP Subsystem $70.71 $61.00 $52.62 $47.46
Power/Electronics $1,739.60 $1,555.67 $1,441.71 $1,369.45 Power/Electronics $645.70 $591.10 $549.84 $527.59
Housing & Final Assembly $950.52 $783.08 $675.23 $609.95 Housing & Final Assy $193.28 $159.35 $137.39 $124.10
Fuel Processor Subsystem $4,239.05 $3,262.89 $2,770.22 $2,547.11 Fuel Processor Subsystem $1,321.46 $1,076.55 $927.89 $854.44
Fuel Cell Subsystem $3,066.43 $2,286.41 $1,870.19 $1,691.29 Fuel Cell Subsystem $1,049.81 $803.09 $674.24 $556.35
Total System $28,460.63 $24,947.34 $23,050.76 $22,141.48 Total System $7,920.40 $6,947.11 $6,371.08 $5,988.21
100 sys/yr 1,000 sys/yr 10,000 sys/yr 50,000 sys/yr 100 sys/yr 1,000 sys/yr 10,000 sys/yr 50,000 sys/yr
System Installation $741.24 $741.24 $741.24 $741.24 System Installation $491.83 $491.83 $491.83 $491.83
Sales Markup $793.79 $660.28 $556.57 $499.36 Sales Markup $595.30 $513.31 $423.50 $386.83
Cost Contingency $144.32 $120.05 $101.19 $90.79 Cost Contingency $108.24 $93.33 $77.00 $70.33
CHP Subsystem $31.62 $27.28 $23.53 $21.22 CHP Subsystem $15.81 $13.64 $11.77 $10.61
Power/Electronics $428.09 $394.95 $364.50 $348.94 Power/Electronics $397.61 $368.56 $340.19 $325.91
Housing & Final Assy $64.28 $54.00 $46.58 $42.09 Housing & Final Assembly $16.50 $13.90 $12.02 $10.88
Fuel Processor Subsystem $329.27 $277.96 $250.10 $238.99 Fuel Processor Subsystem $262.10 $230.64 $214.83 $206.81
Fuel Cell Subsystem $590.00 $446.32 $327.23 $256.69 Fuel Cell Subsystem $390.35 $306.54 $191.19 $149.10
Total System $3,122.60 $2,722.07 $2,410.94 $2,239.32 Total System $2,277.74 $2,031.76 $1,762.32 $1,652.31
5 kW: Total System Installed Price ,$/kW1 kW: Total System Installed Price ,$/kW
25 kW: Total System Installed Price ,$/kW 100 kW: Total System Installed Price ,$/kW
100 sys/yr 1,000 sys/yr 10,000 sys/yr 50,000 sys/yr 100 sys/yr 1,000 sys/yr 10,000 sys/yr 50,000 sys/yr
System Installation $11,707.00 $11,707.00 $11,707.00 $11,707.00 System Installation $2,506.80 $2,506.80 $2,506.80 $2,506.80
Sales Markup $5,711.95 $4,534.16 $3,921.77 $3,613.14 Sales Markup $1,977.82 $1,641.85 $1,439.38 $1,279.24
Cost Contingency $1,038.54 $824.39 $713.05 $656.94 Cost Contingency $359.60 $298.52 $261.70 $232.59
CHP Subsytem $187.08 $161.39 $139.22 $125.56 CHP Subsystem $83.67 $72.17 $62.26 $56.15
Power/Electronics $1,949.60 $1,737.67 $1,623.71 $1,551.45 Power/Electronics $687.70 $627.50 $586.24 $563.99
Housing & Final Assembly $980.12 $808.52 $697.09 $629.61 Housing & Final Assy $215.63 $178.56 $153.90 $138.95
Fuel Processor Subsystem $4,109.04 $3,128.25 $2,674.28 $2,446.17 Fuel Processor Subsystem $1,278.79 $1,035.18 $896.47 $821.36
Fuel Cell Subsystem $3,159.51 $2,408.10 $1,996.20 $1,816.55 Fuel Cell Subsystem $1,330.25 $1,071.77 $918.18 $745.43
Total System $28,842.84 $25,309.48 $23,472.31 $22,546.43 Total System $8,440.25 $7,432.36 $6,824.93 $6,344.51
100 sys/yr 1,000 sys/yr 10,000 sys/yr 50,000 sys/yr 100 sys/yr 1,000 sys/yr 10,000 sys/yr 50,000 sys/yr
System Installation $741.24 $741.24 $741.24 $741.24 System Installation $491.83 $491.83 $491.83 $491.83
Sales Markup $889.88 $784.50 $651.05 $582.41 Sales Markup $781.58 $666.89 $556.47 $510.10
Cost Contingency $161.80 $142.64 $118.37 $105.89 Cost Contingency $142.11 $121.25 $101.18 $92.75
CHP Subsystem $37.42 $32.28 $27.84 $25.11 CHP Subsystem $18.71 $16.14 $13.92 $12.56
Power/Electronics $436.49 $402.23 $371.78 $356.22 Power/Electronics $472.24 $438.71 $406.14 $387.63
Housing & Final Assy $63.82 $53.60 $46.24 $41.78 Housing & Final Assembly $34.14 $29.06 $25.04 $22.60
Fuel Processor Subsystem $307.70 $257.98 $231.98 $220.38 Fuel Processor Subsystem $229.38 $201.92 $187.05 $179.17
Fuel Cell Subsystem $772.53 $680.28 $505.87 $415.44 Fuel Cell Subsystem $666.59 $526.71 $379.60 $325.51
Total System $3,410.87 $3,094.74 $2,694.38 $2,488.48 Total System $2,836.58 $2,492.51 $2,161.24 $2,022.14
5 kW: Total System Cost ,$/kW
100 kW: Total System Cost , $/kW
1 kW: Total System Cost ,$/kW
25kW: Total System Cost ,$/kW
100 sys/yr 1,000 sys/yr 10,000 sys/yr 50,000 sys/yr 100 sys/yr 1,000 sys/yr 10,000 sys/yr 50,000 sys/yr
System Installation $11,707.00 $11,707.00 $11,707.00 $11,707.00 System Installation $2,506.80 $2,506.80 $2,506.80 $2,506.80
Sales Markup $6,724.68 $4,021.81 $3,432.34 $3,144.53 Sales Markup $1,947.96 $1,402.11 $1,196.09 $1,111.89
Cost Contingency $1,222.67 $731.24 $624.06 $571.73 Cost Contingency $354.17 $254.93 $217.47 $202.16
CHP Subsystem $114.56 $98.83 $85.26 $76.89 CHP Subsystem $51.23 $44.20 $38.13 $34.39
Power/Electronics $1,841.74 $1,640.37 $1,535.81 $1,469.50 Power/Electronics $640.23 $583.70 $545.92 $525.54
Housing & Final Assy $966.09 $796.66 $686.90 $620.46 Housing & Final Assy $202.20 $167.05 $144.02 $130.06
Fuel Processing Subsystem $3,723.41 $2,777.49 $2,351.86 $2,142.94 Fuel Processing Subsystem $1,119.14 $885.28 $754.58 $684.79
Fuel Cell Subsystem $5,580.90 $1,999.03 $1,580.79 $1,407.54 Fuel Cell Subsystem $1,528.93 $869.07 $692.07 $646.86
Total System $31,881.05 $23,772.42 $22,004.02 $21,140.58 Total System $8,350.67 $6,713.13 $6,095.07 $5,842.48
100 sys/yr 1,000 sys/yr 10,000 sys/yr 50,000 sys/yr 100 sys/yr 1,000 sys/yr 10,000 sys/yr 50,000 sys/yr
System Installation $741.24 $741.24 $741.24 $741.24 System Installation $491.83 $491.83 $491.83 $491.83
Sales Markup $783.16 $575.11 $516.27 $493.57 Sales Markup $583.48 $492.06 $458.07 $441.54
Cost Contingency $142.39 $104.56 $93.87 $89.74 Cost Contingency $106.09 $89.46 $83.28 $80.28
CHP Subsystem $22.91 $19.77 $17.05 $15.38 CHP Subsystem $11.46 $9.88 $8.53 $7.69
Power/Electronics $401.00 $369.40 $341.58 $327.36 Power/Electronics $438.17 $407.11 $376.99 $359.72
Housing & Final Assy $51.25 $42.81 $36.96 $33.44 Housing & Final Assy $21.20 $17.94 $15.49 $14.00
Fuel Processing Subsystem $196.31 $150.39 $127.61 $118.01 Fuel Processing Subsystem $91.17 $72.62 $63.42 $58.74
Fuel Cell Subsystem $752.46 $463.28 $415.48 $403.20 Fuel Cell Subsystem $498.89 $387.09 $368.42 $362.65
Total System $3,090.73 $2,466.56 $2,290.06 $2,221.94 Total System $2,242.28 $1,968.00 $1,866.03 $1,816.45
5 kWe: Total System Cost ,$/kWe
25 kWe: Total System Cost , $/kWe
1 kWe: Total System Cost ,$/kWe
100 kWe: Total System Cost , $/kWe