Embed Size (px)
Citation preview

• Iowa is home to approximately 5,980 manufacturing firms.
• Manufacturing contributed $27.6 billion to Iowa’s economy in 2011, representing 18.6 percent of the state’s total GDP.
• Iowa ranks sixth among all states in its percentage of GDP from manufacturing.
• The manufacturing sector’s 211,998 jobs accounted for 10.8 percent of Iowa’s total employment in 2011.
• More than half (53.4 percent) of Iowa’s manufacturing jobs are located in its non-metropolitan counties.
• The average manufacturing job in Iowa paid $51,120 in wages and salaries in 2011.
• Manufacturing accounts for 12.7 percent of total earnings in Iowa’s metropolitan areas and 19.4 percent of total earnings in non-metropolitan regions.
• Iowa exported $11.7 billion worth of manufactured goods to other countries in 2011.
D E C E M B E R 2 0 1 2
MANUFACTURING IN IOWA
I N S I D E :
S E C T O R S I Z E 2
C O M P O S I T I O N 4
A V E R A G E E A R N I N G S 5
E X P O R T S 6
R E C E N T T R E N D S 7
S T A T E R A N K I N G S 9
C O U N T Y D E P E N D E N C E 1 0
H I G H L I G H T S

Iowa is home to approximately 5,980
manufacturing firms operating from 6,440
physical establishments throughout the state.
• A large fraction of Iowa’s manufacturing
firms are small proprietorships or
partnerships with no paid employees
other than the principals. Known as
“nonemployer firms,” these
establishments comprise 47.6 percent of
Iowa’s manufacturing firms.
• 47.5 percent of Iowa’s manufacturing
firms are owned by small or medium-sized
enterprises (SMEs) with fewer than 500
paid employees.
• Large manufacturing enterprises, with
500 or more employees, account for 4.9
percent of Iowa’s manufacturing firms.
N U M B E R O F F I R M S
Page 2 M A N U F A C T U R I N G S E C T O R S I Z E
G R O S S D O M E S T I C P R O D U C T
Source: U.S. Bureau of Economic Analysis
Note: Agriculture and related industries include production agriculture, agricultural services, forestry, fishing, hunting, and mining. Activities such as grain processing, ethanol production, meat slaughtering and processing, agricultural chemical and fertilizer production, and agricultural equipment manufacturing are classified within the manufacturing sector, per national industrial accounting standards.
Gross domestic product (GDP) measures
the contributions of labor and capital to
the market value of goods and services
produced in a state. The total GDP for
Iowa’s industries in 2011 was $149.0
billion.
The manufacturing sector contributed
$27.6 billion to Iowa’s economy in 2011,
representing 18.6 percent of the state’s
total GDP. Iowa ranks sixth among all
states in the percentage of GDP derived
from the manufacturing sector.
When measured by GDP size,
manufacturing ranks first among Iowa’s
major economic sectors. Manufacturing
ranks third in GDP size among major
economic sectors in the United States.
N U M B E R O F I O W A M A N U F A C T U R I N G F I R M S B Y E M P L O Y M E N T S I Z E O F T H E P A R E N T E N T E R P R I S E
P E R C E N T A G E O F I O W A G D P B Y M A J O R S E C T O R
2,845
1,097
518400
561
266 293
1–4 5–9 10–19 20–99 100–499 500+
Nonemployer Firms
Small to Medium Enterprises (SMEs) Large Enterprises
18.6%
1.7%
2.7%
3.2%
3.3%
5.1%
6.3%
6.6%
7.8%
9.5%
11.3%
11.4%
12.6%
Utilities and mining
Information
Construction
Transportation
Recreational, personal and other svcs.
Professional and administrative services
Agriculture and related
Educational and health care services
Real estate
Government
Trade
Finance and insurance
Manufacturing
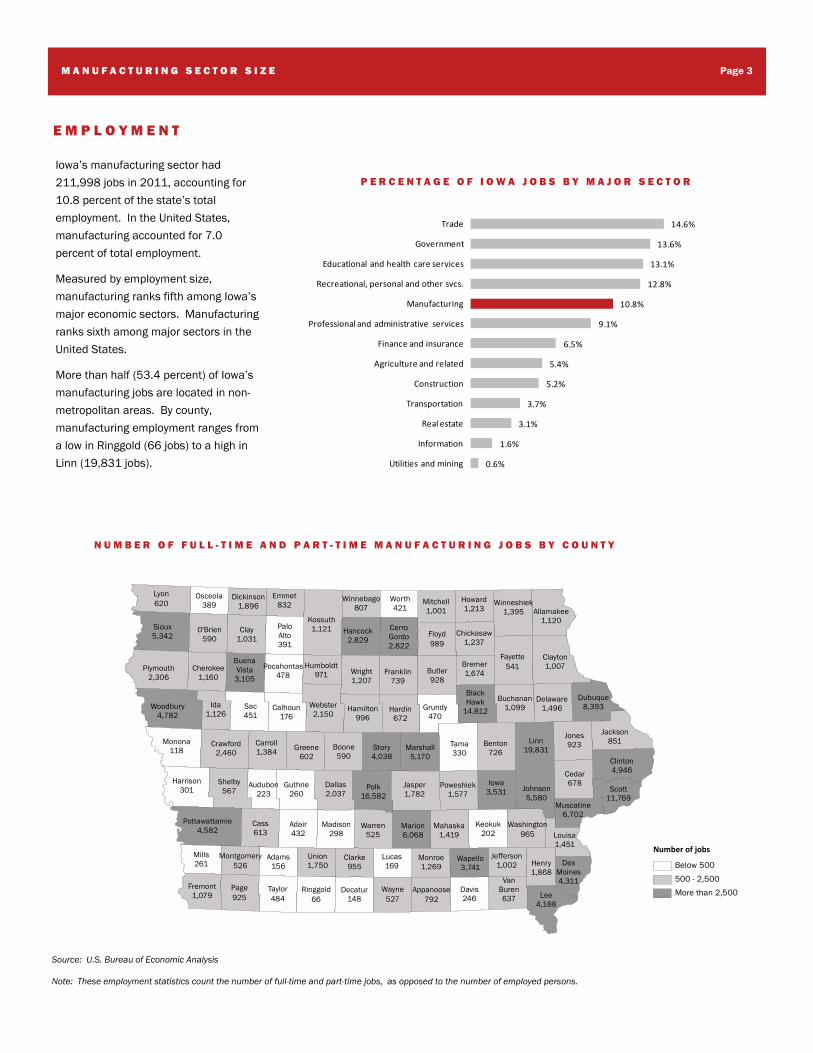
Iowa’s manufacturing sector had
211,998 jobs in 2011, accounting for
10.8 percent of the state’s total
employment. In the United States,
manufacturing accounted for 7.0
percent of total employment.
Measured by employment size,
manufacturing ranks fifth among Iowa’s
major economic sectors. Manufacturing
ranks sixth among major sectors in the
United States.
More than half (53.4 percent) of Iowa’s
manufacturing jobs are located in non-
metropolitan areas. By county,
manufacturing employment ranges from
a low in Ringgold (66 jobs) to a high in
Linn (19,831 jobs).
E M P L O Y M E N T
10.8%
0.6%
1.6%
3.1%
3.7%
5.2%
5.4%
6.5%
9.1%
12.8%
13.1%
13.6%
14.6%
Utilities and mining
Information
Real estate
Transportation
Construction
Agriculture and related
Finance and insurance
Professional and administrative services
Manufacturing
Recreational, personal and other svcs.
Educational and health care services
Government
Trade
Page 3 M A N U F A C T U R I N G S E C T O R S I Z E
P E R C E N T A G E O F I O W A J O B S B Y M A J O R S E C T O R
N U M B E R O F F U L L - T I M E A N D P A R T - T I M E M A N U F A C T U R I N G J O B S B Y C O U N T Y
Source: U.S. Bureau of Economic Analysis
Note: These employment statistics count the number of full-time and part-time jobs, as opposed to the number of employed persons.
Dickinson1,896
Allamakee1,120
Winneshiek1,395
Howard1,213
Osceola389
Emmet832
Kossuth1,121
Lyon620 Mitchell
1,001
Winnebago807
Worth421
Sioux5,342
O'Brien590
CerroGordo2,822
Hancock2,829
Clay1,031
PaloAlto391
Chickasaw1,237
Floyd989
Fayette541
Clayton1,007Cherokee
1,160Plymouth
2,306
BuenaVista3,105
Pocahontas478 Wright
1,207Franklin
739
Humboldt971 Butler
928
Bremer1,674
Dubuque8,393
Delaware1,496Webster
2,150
Buchanan1,099
BlackHawk
14,812Woodbury
4,782Ida
1,126Sac451
Calhoun176
Hamilton996
Hardin672
Grundy470
Jackson851Benton
726
Linn19,831
Tama330
Jones923Monona
118Crawford
2,460Carroll1,384 Marshall
5,170Boone590
Greene602
Story4,038 Clinton
4,946Cedar678Harrison
301Shelby
567Dallas2,037
Polk16,582
Audubon223
Guthrie260
Jasper1,782
Iowa3,531
Poweshiek1,577
Johnson5,580
Scott11,769
Muscatine6,702
Warren525
Madison298
Washington965
Keokuk202
Mahaska1,419
Marion6,068
Pottawattamie4,582
Cass613
Adair432 Louisa
1,451Jefferson
1,002 Henry1,868
Wapello3,741
Clarke955
Monroe1,269
Lucas169
Mills261
Montgomery526
Adams156
Union1,750 Des
Moines4,311
Fremont1,079
Page925
VanBuren637
Taylor484
Davis246
Ringgold66
Decatur148
Appanoose792
Wayne527 Lee
4,188
Number of jobs
Below 500
500 - 2,500
More than 2,500

I O W A ’ S D I V E R S E M A N U F A C T U R I N G S E C T O R
Page 4 M A N U F A C T U R I N G S E C T O R C O M P O S I T I O N B Y I N D U S T R Y
2010 GDP Location($ mill ions) GDP Jobs Establishments GDP Jobs Establishments Quotient
Machinery................................................................. 6,451 25.1% 18.3% 8.5% 8.2% 8.9% 6.4% 2.05 Food and beverages............................................... 6,275 24.5% 24.6% 13.7% 12.2% 13.8% 10.9% 1.79 Chemicals................................................................. 3,304 12.9% 4.5% 3.7% 13.3% 6.5% 3.9% 0.69 Computers and electronics................................... 1,565 6.1% 6.4% 1.8% 15.6% 9.1% 3.7% 0.70 Fabricated metals................................................... 1,331 5.2% 8.9% 15.6% 7.1% 11.3% 15.1% 0.78 Plastics and rubber products................................ 1,046 4.1% 4.7% 3.2% 3.9% 5.2% 2.9% 0.89 Transportation equipment..................................... 825 3.2% 7.2% 3.2% 7.4% 11.4% 3.0% 0.63 Paper.......................................................................... 726 2.8% 1.8% 0.9% 3.3% 3.2% 1.0% 0.56 Furniture and related products............................. 715 2.8% 3.2% 5.3% 1.7% 3.1% 5.5% 1.02 Primary metals......................................................... 630 2.5% 3.8% 1.6% 2.5% 3.2% 1.4% 1.19 Electrical equipment and appliances.................. 621 2.4% 2.8% 1.4% 2.6% 3.1% 2.1% 0.90 Wood products......................................................... 507 2.0% 4.1% 7.7% 1.3% 3.1% 6.2% 1.31 Nonmetallic mineral products.............................. 503 2.0% 2.4% 5.9% 2.1% 3.2% 4.1% 0.75 Miscellaneous.......................................................... 456 1.8% 2.4% 13.1% 5.2% 5.5% 15.6% 0.43 Printing and related................................................. 442 1.7% 3.6% 8.0% 1.9% 4.4% 9.1% 0.81 Petroleum and coal................................................. 145 0.6% 0.2% 0.4% 10.1% 0.9% 0.7% 0.23 Textile and textile product mills........................... 63 0.2% 0.5% 2.1% 0.9% 2.1% 2.3% 0.23 Apparel...................................................................... 55 0.2% 0.8% 3.9% 0.7% 1.9% 6.1% 0.40
% of Iowa Manufacturing Totals Comparative U.S. Percentages
Sources: U.S. Bureau of Economic Analysis and County Business Patterns, U.S. Census Bureau
I O W A ’ S M A N U F A C T U R I N G I N D U S T R I E S R A N K E D B Y G D P
D U R A B L E A N D N O N D U R A B L E G O O D S
Industries within the manufacturing sector are frequently grouped into two
broad categories: durable goods and nondurable goods. Durable goods are
tangible products that can be stored or inventoried and that have an average
life of at least three years. Nondurable goods have an average life of less
than three years.
Durable goods production accounts for a slightly larger share of Iowa’s
manufacturing activity, both in terms of GDP and employment. Durable goods
production accounts for 54.0 percent of Iowa’s manufacturing GDP and 59.4
percent of its manufacturing jobs. Nationally, durable goods production
accounts for 53.9 percent of manufacturing GDP and 62.0 percent of
manufacturing jobs.
S P E C I A L I Z A T I O N B Y I N D U S T R Y
Areas of relative industrial specialization within the manufacturing sector may
be identified using “location quotients,” which divide a state’s percentage of
employment in a given industry by that same industry’s percentage of U.S.
employment. A location quotient greater than one indicates specialization
and suggests the state has a relative competitive advantage in that industry.
Iowa demonstrates relative specialization in the following manufacturing
industries: machinery, food and beverages, wood products, primary metals,
and furniture and related products.
Machinery.................................................. 38,710 Fabricated metals.................................... 18,795 Transportation equipment...................... 15,322 Computers and electronics.................... 13,547 Wood products.......................................... 8,753 Primary metals.......................................... 8,153 Furniture and related products.............. 6,746 Electrical equipment and appliances... 5,837 Miscellaneous........................................... 5,070 Nonmetallic mineral products............... 4,987 Total, durable goods............................... 125,920
Food and beverages................................ 52,203 Plastics and rubber products................. 9,888 Chemicals.................................................. 9,544 Printing and related.................................. 7,579 Paper........................................................... 3,782 Apparel....................................................... 1,617 Textile and textile product mills............ 1,011 Petroleum and coal.................................. 454 Total, non-durable goods....................... 86,078
D U R A B L E G O O D S E M P L O Y M E N T
N O N D U R A B L E G O O D S E M P L O Y M E N T

• Iowa’s manufacturing workers earned an average of $51,120 in wages
and salaries in 2011. Workers across all sectors of Iowa’s economy
earned an average of $38,390 in wages and salaries per job.
• Average earnings per job in Iowa’s manufacturing sector were 84.9
percent of the U.S. average for manufacturing jobs. Iowa’s all-sector
average earnings per job were 79.5 percent of the U.S. average.
• Manufacturing ranked third among Iowa’s major sectors in average
wage and salary earnings per job.
• By detailed manufacturing industry, average earnings were highest in
Computers and electronics manufacturing, at $77,561 per job.
• Manufacturing wages vary across the state, with higher levels typically
found in and near metropolitan areas and larger cities. In 2011, the
top three counties by average manufacturing wages and salaries per
job were Linn ($75,929), Black Hawk ($61,857), and Monroe
($57,201).
• Manufacturing jobs in 18 of Iowa’s 99 counties paid more than the
statewide average of $51,120 in wages and salaries per job in 2011.
Manufacturing pay levels were below 80 percent of the statewide
average in 45 counties.
Page 5 M A N U F A C T U R I N G E A R N I N G S
Sources: U.S. Bureau of Economic Analysis, U.S. Bureau of Labor Statistics
A V E R A G E W A G E A N D S A L A R Y E A R N I N G S P E R J O B I N I O W A
( $ 0 0 0 S )
A V E R A G E M A N U F A C T U R I N G E A R N I N G S P E R J O B
A V E R A G E M A N U F A C T U R I N G W A G E S B Y C O U N T Y
Manufacturing wages as a %of Iowa's manufacturing average
Below 80 percent80 to 100 percentAbove 100 percent
Average for all sectors................................ 38.4
Utilities and mining..................................... 71.5Finance and insurance............................... 61.2Manufacturing.............................................. 51.1Information................................................... 46.7Construction................................................. 45.1Transportation.............................................. 41.3Professional and administrative svcs..... 41.1Real estate................................................... 39.3Government.................................................. 39.1Educational and health care services..... 35.1Trade.............................................................. 31.7Agriculture and related............................... 29.6Recreational, personal and other svcs... 19.3
Computers and electronics....................... 77.6Machinery..................................................... 61.8Chemicals..................................................... 59.0Primary metals............................................. 56.0Petroleum and coal..................................... 53.7Paper.............................................................. 52.5Electrical equipment and appliances...... 50.2Plastics and rubber products.................... 48.0Fabricated metals....................................... 45.2Food............................................................... 44.9Nonmetallic minerals................................. 44.7Furniture and related.................................. 43.4Wood products............................................. 42.4Miscellaneous.............................................. 40.8Beverage and tobacco............................... 38.2Printing and related..................................... 38.0Textile mills................................................... 33.9Apparel.......................................................... 32.8Leather and allied products...................... 31.7Textile product mills.................................... 26.3Transportation equipment......................... (N/A)
By Manufacturing Industry
By Major Sector

B Y T Y P E O F G O O D
In 2011, the state of Iowa was the
transportation origin for $13.3 billion worth
of tangible merchandise exports including
agricultural commodities, raw materials,
and manufactured goods. Manufactured
goods accounted for 88 percent of the
state’s total exports.
With $11.7 billion worth of manufactured
exports in 2011, Iowa ranked 28th among
all states on this measure (see Export Data
Notes for information about export
measurement).
Iowa’s single largest manufacturing export
industry was Machinery manufacturing,
which accounted for 32.6 percent of the
state’s total manufacturing exports.
B Y D E S T I N A T I O N
The greatest share (45.2 percent) of Iowa’s
manufactured exports are shipped to its
trading partners in North America. Asia
and Europe follow as the top importers of
manufactured goods from Iowa.
Canada was the top destination country for
Iowa’s manufactured exports in 2011,
followed by Mexico and Japan.
E X P O R T S F R O M I O W A
D E S T I N A T I O N S O F I O W A M A N U F A C T U R I N G E X P O R T S
I O W A ’ S T O P 1 0 M A N U F A C T U R I N G E X P O R T I N D U S T R I E S
Origin of Movement
It is important to note that the value of agricultural and other goods that were originally produced in Iowa but
ultimately exported from other states are not reflected in Iowa’s export totals. The trade statistics on this page are
based on origin of movement (OM) data from the U.S. Department of Commerce. These data credit exports to the
state where the goods began their final journey to the point of exit from the United States, as specified on official U.S.
export declarations filed by shippers. The place from which merchandise began its export journey is not necessarily
the place where the merchandise was produced. In many cases, the OM is the location of a distributor, warehouse, or
cargo processing facility. Consequently, OM cannot be used to reliably describe the production origin of U.S. exports.
Source: ITA Trade Stats Express, Office of Trade and Industry Information, International Trade Administration, U.S.
Department of Commerce
Page 6 M A N U F A C T U R I N G E X P O R T S
T O P 1 0 D E S T I N A T I O N C O U N T R I E S F O R I O W A
M A N U F A C T U R I N G E X P O R T S
278
299
315
366
507
638
849
1,175
2,945
3,819
Miscellaneous
Plastics & Rubber
Electrical equipment and appliances
Fabricated metals
Computers and electronics
Primary metals
Transportation equipment
Chemicals
Processed Foods
Machinery
Value of manufacturing exports in $ millions
Canada............................ 3,988 Mexico............................. 1,301 Japan............................... 957 Germany.......................... 583 Brazil................................ 523 China................................ 449 Australia.......................... 432 South Korea.................... 306 France.............................. 285 Russian Federation....... 273
Exports ($ mill ions)
E X P O R T D A T A N O T E S
North America (NAFTA), 5,289
Asia, 2,927
Europe, 1,949
Other Americas, 937Australia, 432
All Other, 170
Value of manufacturing
exports in $ millions

Page 7 M A N U F A C T U R I N G S E C T O R T R E N D S
M A N U F A C T U R I N G G D P
Source: U.S. Bureau of Economic Analysis
M A N U F A C T U R I N G J O B S
I O W A E M P L O Y M E N T G A I N S A N D L O S S E S I N T H O U S A N D S O F J O B S ,
2 0 0 1 - 2 0 1 1
B Y M A J O R S E C T O R
B Y D E T A I L E D M A N U F A C T U R I N G
I N D U S T R Y
Education & health services 34.3Professional & administrative svcs. 27.7Finance & insurance 27.3Other services 14.7Real estate 13.7Government 10.9Transportation 9.4Mining & utilities 0.1Construction (0.4)Information (9.0)Agriculture & related (10.1)Trade (15.7)Manufacturing (33.4)
Durable GoodsMachinery 2.9Primary metals (0.2)Computers and electronics (0.3)Nonmetallic mineral products (2.6)Furniture and related products (3.1)Fabricated metals (3.7)Wood products (3.9)Transportation equipment (4.5)Electrical equipt. & appliances (7.0)
Nondurable GoodsChemicals 2.2Petroleum and coal (0.1)Textile and textile product mills (0.2)Food and beverages (0.3)Paper (1.5)Apparel (2.1)Printing and related (2.7)Plastics and rubber products (5.0)
Miscellaneous Manufacturing (1.6)
2001 2002 2003 2004 2005 2006 2007 2008 2009 2010 2011
Durable 149.8 139.7 134.7 139.4 144.3 146.9 145.9 142.7 121.7 120.2 125.9
Non‐durable 95.6 93.2 90.8 89.3 90.6 90.4 90.0 90.6 88.0 86.5 86.1
Thousandsof jobs
2001 2002 2003 2004 2005 2006 2007 2008 2009 2010 2011
Durable 10.0 10.7 10.6 12.9 13.7 14.1 14.1 12.7 10.2 13.0 14.0
Non‐durable 9.3 9.4 10.3 10.1 9.5 10.5 10.8 10.5 9.8 10.2 10.4
RealGDP
in 2005$billions
80%
85%
90%
95%
2001
2002
2003
2004
2005
2006
2007
2008
2009
2010
2011
%ofU.S.
average
Durable Non‐durable
I O W A M A N U F A C T U R I N G E A R N I N G S P E R J O B C O M P A R E D T O U . S . A V E R A G E S
R E C E N T T R E N D S I N I O W A M A N U F A C T U R I N G
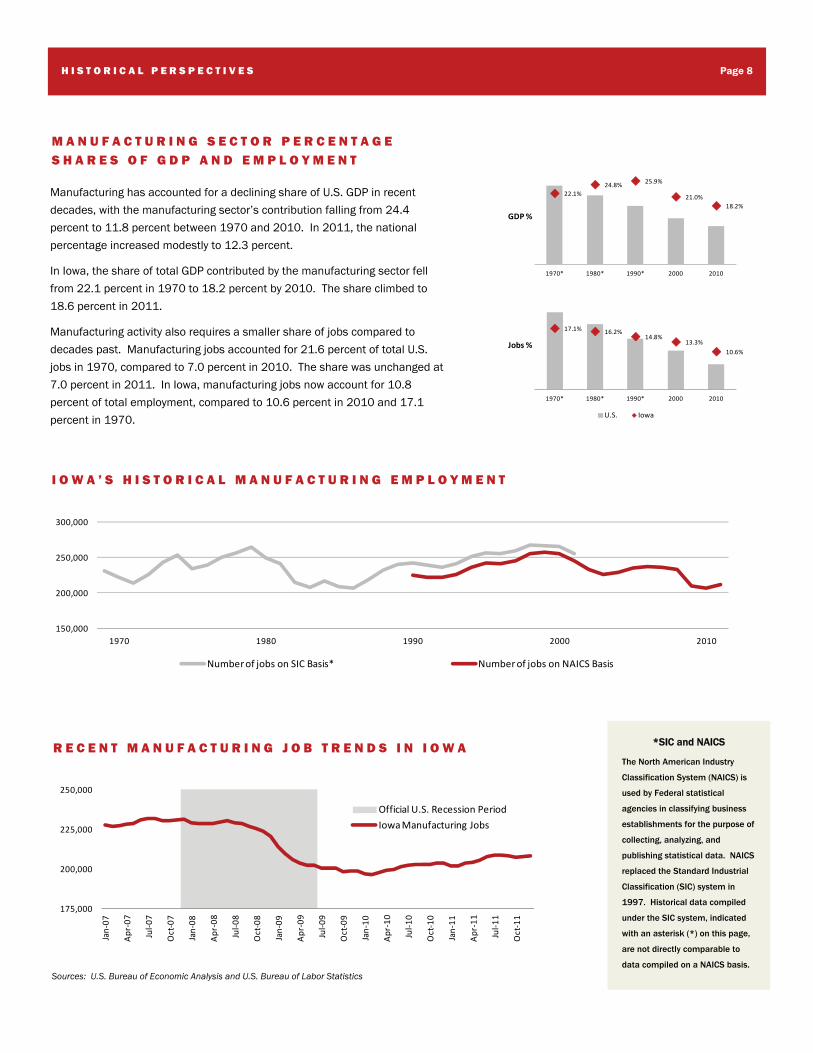
Manufacturing has accounted for a declining share of U.S. GDP in recent
decades, with the manufacturing sector’s contribution falling from 24.4
percent to 11.8 percent between 1970 and 2010. In 2011, the national
percentage increased modestly to 12.3 percent.
In Iowa, the share of total GDP contributed by the manufacturing sector fell
from 22.1 percent in 1970 to 18.2 percent by 2010. The share climbed to
18.6 percent in 2011.
Manufacturing activity also requires a smaller share of jobs compared to
decades past. Manufacturing jobs accounted for 21.6 percent of total U.S.
jobs in 1970, compared to 7.0 percent in 2010. The share was unchanged at
7.0 percent in 2011. In Iowa, manufacturing jobs now account for 10.8
percent of total employment, compared to 10.6 percent in 2010 and 17.1
percent in 1970.
Page 8 H I S T O R I C A L P E R S P E C T I V E S
M A N U F A C T U R I N G S E C T O R P E R C E N T A G E S H A R E S O F G D P A N D E M P L O Y M E N T
I O W A ’ S H I S T O R I C A L M A N U F A C T U R I N G E M P L O Y M E N T
R E C E N T M A N U F A C T U R I N G J O B T R E N D S I N I O W A
175,000
200,000
225,000
250,000
Jan‐07
Apr‐07
Jul‐0
7
Oct‐07
Jan‐08
Apr‐08
Jul‐0
8
Oct‐08
Jan‐09
Apr‐09
Jul‐0
9
Oct‐09
Jan‐10
Apr‐10
Jul‐1
0
Oct‐10
Jan‐11
Apr‐11
Jul‐1
1
Oct‐11
Official U.S. Recession Period
Iowa Manufacturing Jobs
22.1%24.8% 25.9%
21.0%18.2%
1970* 1980* 1990* 2000 2010
GDP %
17.1% 16.2%14.8%
13.3%
10.6%
1970* 1980* 1990* 2000 2010
Jobs %
U.S. Iowa
Sources: U.S. Bureau of Economic Analysis and U.S. Bureau of Labor Statistics
*SIC and NAICS
The North American Industry
Classification System (NAICS) is
used by Federal statistical
agencies in classifying business
establishments for the purpose of
collecting, analyzing, and
publishing statistical data. NAICS
replaced the Standard Industrial
Classification (SIC) system in
1997. Historical data compiled
under the SIC system, indicated
with an asterisk (*) on this page,
are not directly comparable to
data compiled on a NAICS basis.
150,000
200,000
250,000
300,000
1970 1980 1990 2000 2010
Number of jobs on SIC Basis* Number of jobs on NAICS Basis

I N D I C A T O R S O F I N N O V A T I O N P O T E N T I A L : W H E R E I O W A R A N K S A M O N G A L L S T A T E S
Page 9 S T A T E R A N K I N G S
Source: U.S. Bureau of Economic Analysis
Oregon 28.8%Indiana 26.7%Louisiana 25.4%North Carolina 19.7%Wisconsin 19.6%Iowa 18.6%Ohio 16.7%Kentucky 16.5%South Carolina 16.0%Michigan 15.8%
T O P 1 0 S T A T E S B Y % O F G D P F R O M
M A N U F A C T U R I N G
Iowa’s economy employs 7.1 engineers for every thousand workers. The U.S. economy demands 11.2 engineers per thousand workers.
R E S E A R C H A N D T E C H N O L O G Y
Below 10 percent 10 to 15 percent Above 15 percent
P E R C E N T A G E O F S T A T E G D P F R O M M A N U F A C T U R I N G
W O R K F O R C E
7
29
36
43
Percentage of adults with high school diploma or higher....................................
Science & engineering degrees as % of higher education degrees conferred....
Percentage of adults with bachelor's degree or higher.......................................
Engineers as a percentage of the workforce......................................................
20
25
27
49
Academic R&D in science & engineering fields per $1 million in GDP................
Utility patents awarded per 1,000 jobs..............................................................
Business R&D performance as a percentage of private sector GDP.................
High-technology firms as a percentage of all business establishments..............
Sources: 2008-2011 American Community Survey, U.S. Census Bureau; Science & Engineering Indicators 2012, National Science Foundation; and U.S. Patent and Trademark Office

• On average, manufacturing jobs account for
10.8 percent of total employment in Iowa.
This fraction is lower in the state’s
metropolitan counties (8.5 percent) and
higher in non-metropolitan counties (14.1
percent), according to data for 2011.
• Manufacturing accounts for 15.3 percent of
total worker earnings in Iowa. The sector’s
earnings percentage exceeds its
employment percentage because
manufacturing jobs tend to pay higher
wages than many other sectors.
• Manufacturing accounts for 12.7 percent of
total earnings in Iowa’s metropolitan areas
and 19.4 percent of total earnings in non-
metropolitan regions.
• Of Iowa’s 99 counties, 15 derive more than
one quarter of total worker earnings from
manufacturing jobs.
• The top three counties by percentage of total
earnings from manufacturing in 2011 were
Marion (46.2%), Monroe (43.2%), and Iowa
(41.3%).
Iowa State University does not discriminate on the
basis of race, color, age, religion, national origin, sexual
orientation, gender identity, genetic information, sex, marital
status, disability, or status as a U.S. veteran. Inquiries
can be directed to the Director of Equal Opportunity and
Compliance, 3280 Beardshear Hall, 515-294-7612.
The ISU Extension and Outreach Center for Industrial Research and Service
(CIRAS) provides applied research, education, and technical assistance to Iowa
industry through partnerships with Iowa's universities, community colleges, and
government agencies. Assistance is supported in part by the DoC/NIST Hollings
Manufacturing Extension Partnership, the DoD/DLA Procurement Technical
Assistance Program, the DoC/EDA University Center Program, and the USDA
BioPreferred Program. For additional information, contact Dr. Ronald Cox at
[email protected] or 515-294-0099.
Page 10 C O U N T Y D E P E N D E N C E O N M A N U F A C T U R I N G
C O N T R I B U T I O N S T O L O C A L E C O N O M I E S
The manufacturing sector contributes to local economies in Iowa in a number of ways. Manufacturing firms pay wages to
local workers, they purchase raw materials and services from local producers and firms, their profits accrue to local owners
and investors, and they pay taxes to local and state governments.
M A N U F A C T U R I N G P E R C E N T A G E O F T O T A L E A R N I N G S
Percentage oftotal earnings
Below 10 percent10 to 25 percentAbove 25 percent