Embed Size (px)
Citation preview

נת ישראלמדי
S T A T E O F I S R A E L
MANUFACTURING, MINING AND QUARRYING
ANNUAL INDICES AND SUMMARIES
2015
PUBLICTAION No. 1720 www.cbs.gov.il
Jerusalem, July 2018

Copyright © 2018 The State of Israel
ISSN 1565-9976

( 3 )
PREFACE
This publication presents data on Manufacturing, Mining and Quarrying in Israel according to several variables: jobs, establishments, labour cost and wages, revenue from local sales and exports, manufacturing production indices, technological intensity, etc. These data are collected from establishments in Manufacturing Indices Survey every month, and annual data are presented in this publication.
Manufacturing indices are estimates of changes in Manufacturing (including Mining and Quarrying) – a sector that is of considerable importance. In 2015, approximately 12% of all employed persons in the economy worked there; the industries of this sector constituted approximately 11% of the net domestic product, and they produced approximately 98% of all export goods (excluding diamonds).
In this publication, the data on Manufacturing industries are classified by technological intensity (according to the Standard Industrial Classification of All Economic Activities 2011). In that way, it is possible to learn about the differences between the respective technological intensity groups and their contribution to Manufacturing.
This publication provides information regarding the development of Manufacturing in Israel, which will be useful for various factors in the economy, such as: national institutions, economic research institutions, government ministries, and the general public.
These data are used each month for the preparation of the Manufacturing indices that appear in the Monthly Bulletin of Statistics and the CBS database.
The Manufacturing indices survey is designated for issuing monthly indices and also includes annual data.
Further annual data are collected later in a separate survey – Manufacturing, Mining and Quarrying Survey (annual), which includes data from establishments on jobs, revenue, output, product, input, inventory, cost of sales, expenditures, assets and liabilities, etc. The sources of Manufacturing Survey data are annual financial reports and administrative files. The results of that survey are presented late in the publication Manufacturing, Mining and Quarrying Survey 2014, because there is a lapse between the end of the tax year and the time when the financial statements are submitted.
Avigail Levi
Senior Department Director
Business-Economic Statistics
Jerusalem, 2018

( 4 )
Staff of the Central Bureau of Statistics who participated in the preparation of this publication
Senior Department of
Business-Economic Statistics: Avigail Levi – Senior Department Director
Business and Manufacturing
Indices Sector: Galia Yohay – Director of Sector
Rachel Ben Yoseph
Eyal Cahana
Nechemia Fortgang
Senior Department
of Surveys: Rachel Gur – Senior Department Director
Eti Yaakov – Director of Sector
Zohar Chessakov
Miri Shem Tov
Ram Kandil
Senior Department of
Information Technology: Marina Klempner
Vladimir Otcheretianski
Statistical Survey Methods
Sector: Tzahi Makovky – Director of Sector
Naomi Baum
Yehudit Shayevitz
Devora Touati
Publication Sector: Liora Moshonov
Tamar Ben Yishai
Miriam Schneiderman
For additional information regarding this publication, please contact Ms. Galia Yohay, Tel. 02-6592942.

( 5 )
CONTENTS Page
INTRODUCTION
1. General .......................................................................................................... )9(
2. Main Findings ................................................................................................ )10(
3. Terms, Definitions and Explanations.............................................................. )20(
4. Methodology .................................................................................................. )22(
5. Methods of Calculation .................................................................................. (24)
TABLES (Presented in Hebrew order – from right to left)
Special symbols and abbreviations in the tables .................................................. (31)
Explanatory notes................................................................................................. (32)
1. Jobs, by Industry (Division) (2011 Classification) .......................................... 29
2. Establishments, Employee Jobs and Actual Work Hours, by Industry (Division) (2011 Classification) ................................................... 30
3. Labour Cost and Wages, by Industry (Division) (2011 Classification) ........... 31
4. Revenue from Local Sales and Exports, by Industry (Class) (2011 Classification)....................................................... 32
5. Establishments and Jobs, by Sector and Size Group .................................... 36
6. Revenue, Labour Cost and Wages, by Sector and Size Group ..................... 37
7. Establishments and Jobs, by District ............................................................. 38
8. Revenue, Labour Cost and Wages, by District .............................................. 39
9. Establishments, Jobs and Revenue, by Industry (Division) (2011 Classification) and Size Group of Revenue.......................................................................... 40
10. Jobs, Revenue, Exports and Labour Cost in Export-Intensive Establishments, by Industry (Division) (2011 Classification) ................................................... 48
11. Jobs, Revenue, Exports and Labour Cost in Export-Intensive Establishments, by Sector and Size Group .................... 49
12. Indices of Revenue from Local Sales and Exports, by Industry (Division) (2011 Classification) ................................................... 50
13. Indices of Manufacturing Production, Employee Jobs and Actual Work Hours, by Industry (Class) (2011 Classification)................ 51
14. Establishments, Jobs, Actual Work Hours, Labour Cost and W22ages, by Technological Intensity ................................ 59

( 6 )
Page
15. Establishments, Jobs, Revenue and Labour Cost, by Technological Intensity and Size Group................................................... 60
16. Establishments, Jobs, Revenue, Exports and Labour Cost, by Technological Intensity - Export-Intensive Establishments ...................... 61
17. Manufacturing Production Indices, Revenue, Employee Jobs and Actual Work Hours, by Technological Intensity............................................................................. 62
18. Establishments, Jobs, Revenue and Labour Cost, by Technological Intensity and Sector .......................................................... 63

( 7 )
INTRODUCTION


( 9 )
1. General
The Central Bureau of Statistics (CBS) collects monthly data from a sample of approximately 2,700 Manufacturing, Mining and Quarrying establishments in which there is at least one employee job. These data are used to prepare the current Manufacturing indices, which are an indicator of the development in Manufacturing and in the economy in general.
This publication presents Manufacturing indices for 2015 as an annual average of the indices that are calculated monthly. The indices were calculated on the basis of data collected from the new sample of 2012, according to the base 2011=100.0. These data are based on the Standard Industrial Classification of All Economic Activities 2011.
According to the new classification, the Manufacturing Indices Survey, which includes Mining and Quarrying, deals with two sections:
Section B: Mining and Quarrying (Divisions 06–09)
Section C: Manufacturing (Divisions 10–33), excluding Working of Diamonds
In the past these sections constituted one category.
The Manufacturing indices include the following:
(1) Manufacturing production indices;
(2) Employment indices (jobs, employee jobs, work hours);
(3) Revenue indices (from local sales and exports);
(4) Labour cost indices (wages, supplementary expenditures);
(5) Derived indices (cost and wage per paid work hour, wage per employee job, revenue per job, etc.).
Because the methods of calculating Manufacturing production indices differ from those used to calculate all other indices, they are listed in separate sections.
Tables 1–9 present data on jobs in Manufacturing, as well as data on labour cost and revenue according to industry, sector, and size of the establishment.
Tables 10–11 present data on export-intensive establishments – Manufacturing establishments whose exports constitute over 50% of the value of their sales, and establishments whose exports amount to over NIS 10 million a year and comprise over 25% of their sales.
Table 12 presents indices of Manufacturing revenue at constant prices, and thus enables calculation of the real change in Manufacturing revenue.
Table 13 presents indices of Manufacturing production, employee jobs, and actual work hours, according to aggregated classes.
Tables 14–18 present data on employment and revenue, by technological intensity.

( 10 )
Publication of the Indices
The 2015 indices are calculated newly according to the new sample, and the indices for previous years were transferred to 2011 base according to a transition matrix.
The monthly indices as of 2004 are published according to the base 2011=100.0 in the monthly bulletin and the CBS web database. Additionally, a media release on the subject is posted monthly on the CBS website.
A preliminary estimate of the indices is calculated and published approximately one month and 20 days after the surveyed month, based on data from approximately 65% of all establishments in the sample and including most of the large establishments. A second estimate, based on data from approximately 80% of the sample establishments, is published two months and 20 days after the surveyed month. One month later, when additional data are obtained, adjusted indices are published; and one month after that (four months and 20 days after the surveyed month), a final index is published based on data from approximately 95% of all establishments in the sample.
2. Main Findings
2.1 Production and Revenue
In 2015, the level of Manufacturing production in Manufacturing, Mining and Quarrying establishments with at least one employee job (excluding Working of Diamonds) was 2.3% higher (at constant prices) than in 2014, following an increase of 1.1% in 2014, 0.6% in 2013, 4% in 2012, 2% in 2011, of 9.5% in 2010, a decline of 6.6% in 2009, and continuous increments of 7.2% in 2008, 6% in 2007, 8.5% in 2006 and 4.9% in 2005.
In 2015, the revenue of Manufacturing, Mining and quarrying the revenue amounted to NIS 410 billion in 2015 (Table 4), a real increase of 1% (Table 12). Local sales constituted 58% of the Manufacturing, Mining and Quarrying revenue, and export sales constituted 42% of the Manufacturing revenue (Table 4).
The Manufacturing production index, which aims to reflect the changes in the value added of Manufacturing, is calculated by weighting the indices of the indicators for which the changes are similar to the changes in value added, such as output of products, work hours invested in production, and revenue at constant prices.
The index of Manufacturing revenue at constant prices is calculated as follows: The index of revenue at current prices is divided by a combined index made up of indices of wholesale prices of Manufacturing output for the domestic market and export price indices.
The difference in the development of the production index and the development of the revenue index at constant prices in 2015 versus 2014 can be attributed to the fact that the Manufacturing production index is weighted by the changes in value added (which is calculated from the annual Manufacturing Survey), as mentioned, and the index of revenue is weighted by the distribution of revenue. Those weights are different. Although revenue is an indicator in the index of Manufacturing production, it

( 11 )
is not the only indicator. There are industries for which the index of actual work hours and the amounts of products produced are part of the calculation of their Manufacturing production index (Table E).
In 2015, exports as a percentage of revenue, of establishments under foreign ownership and of government corporations was 61% and 55%, respectively (see definition of “Sector” in Paragraph 3.1: “Definitions”, below)(Table 6).
Establishments in which sales reached NIS 100 million and over in 2015 constituted 4.3% of all Manufacturing, Mining and Quarrying establishments, and employed 52% of all workers in these industries. The sales of these establishments amounted to 79% of the total revenue in the industries. In the division Manufacture of Computers and Electronic and Optical Products, the sales of 18% of all establishments amounted to NIS 100 million and over (92% of the total revenue in this division), and 81% of all jobs in the industries were in those establishments. In the division Manufacture of Petroleum Products, Chemicals and Chemical Products the sales of 20% of the establishments amounted to NIS 100 million and over (95% of the total revenue in this division), and 73% of all jobs in the division were in those establishments (Table 9).
2.2 Employment and Wages
The number of jobs in Manufacturing, Mining and Quarrying in 2015 was estimated at an average of 366,000 per month (see the definition of “Jobs” in Paragraph 3.1: "Definitions", below), compared to 368,000 jobs in 2014. 13,000 of the workers in 2015 (3.5%) were hired through employment agencies (Table 1). Regarding the number of actual work hours, there was a decrease of 0.6% (Table 2).
In 2015, 68.4% of the jobs in Manufacturing were in the private sector under Israeli ownership, 6.2% were in co-operatives, another 7.1% were in government corporations, 15.4% were in the private sector under foreign ownership, and 2.8% were in the households sector (Table 5).
The cost per work hour in Manufacturing, Mining and Quarrying amounted to NIS 85 in 2015, compared with NIS 82 in 2014 (Table 3). The highest cost was recorded in establishments with 300 jobs and over – NIS 113 per paid work hour per employee job; and the lowest cost – NIS 47 – was recorded in establishments with 1–4 jobs (Table 6).
The share of supplementary expenditures for wages in 2015 was 20.8%. The highest average annual wage per employee job was recorded in the following divisions: Mining and Quarrying industries (NIS 254,000), Manufacture of Computers and Electronic and Optical Products (NIS 242,000), and Manufacture of Other Transport Equipment (NIS 221,000), whereas the average in total Manufacturing, Mining and Quarrying was NIS 157,000. The lowest average annual wage was recorded in Manufacture and Processing of leather and Related Products, Manufacture of Wearing Apparel, NIS 84,000 (Table 3).
As in previous years, in 2015 government corporations paid the highest annual wage per employee job – NIS 282,000, compared to NIS 128,000 in co-operatives, and NIS 139,000 in private establishments under Israeli ownership and NIS 62,000 in the Households Sector. This was also a result of differences in the distribution and centralization of the establishments in the different sectors (Table 6).

( 12 )
2.3 Export-Intensive Establishments1
In 2015, 96% of the Manufacturing exports were carried out by 840 export-intensive establishments (Tables 11 and 4), which constituted 6.5% of all Manufacturing, Mining and Quarrying establishments. They employed 39% of the workers in Manufacturing, Mining and Quarrying and their revenue was 53% of the total revenue of these industries.
The cost per work hour in export-intensive establishments was 38% higher than the average in Manufacturing, Mining and Quarrying, and amounted to a total of NIS 117 (Table 10). The revenue per job in these establishments was 34% higher than the corresponding revenue in all Manufacturing, Mining and Quarrying establishments.
The average number of jobs per establishment in the export-intensive establishments was 172 (based on table 11), compared to an average of 28 jobs per establishment in total Manufacturing, Mining and Quarrying (based on Table 2). Of the export-intensive establishments, 72% were in the private sector under Israeli ownership, 18% were in the private sector under foreign ownership, 9% were co-operatives, and 1% were government corporations (Table 11).
2.4 Technological Intensity
In accordance with the classification recommended by the OECD and the EUROSTAT, the Manufacturing industries (Section C) were divided into four groups, by technological intensity: This classification is done according to the main activity of each establishment and its industrial affiliation, by the Standard Industrial Classification of All Economic Activities 2011.
The classification by technological intensity differs from the 1993 classification and was adjusted to the 2011 classification. The main difference is that Mining and Quarrying, and Publishing Activities are not included in Manufacturing, and the changes introduced in the division of Manufacturing industries to different levels of intensity.
The four groups of technological intensity are: high technology, medium-high technology, medium-low technology and low technology.
Table A displays in detail the industries included in each technological intensity group.
High-technology industries are characterized by their substantial contribution to Manufacturing exports. In 2015, 57% of the Manufacturing exports derived from establishments classified as high-technology industries (Table 15).
1 Establishments whose exports constitute over 50% of their sales value, and those
whose exports amount to over NIS 10 million a year and comprise over 25% of their sales.

( 13 )
Table A1. Industries, High technology2
Description Code
Manufacture of pharmaceutical products, including homeopathic preparations
21
Manufacture of computers, and electronic and optical products
26
Manufacture of air and spacecraft, and related machinery 303
Table A2. Industries, Medium-high technology3
Description Code
Manufacture of chemicals and chemical products 20
Manufacture of weapons and ammunition 252
Manufacture of electrical equipment 27
Manufacture of machinery and equipment n.e.c. 28
Manufacture of motor vehicles, trailers and semi-trailers 29
Manufacture of other transport equipment Excluding 301: Building of ships and boats 303: Manufacture of air and spacecraft and related machinery
30
Manufacture of medical, dental and orthopedic instruments and supplies
325
2 See CBS (2012). Standard Industrial Classification of All Economic Industries
2011. Technical Publication No. 80. Jerusalem: Author. 3 See CBS (2012). Standard Industrial Classification of All Economic Industries
2011. Technical Publication No. 80. Jerusalem: Author.

( 14 )
Table A3. Industries, Medium-low technology4
Description Code
Reproduction of recorded media 182
Manufacture of coke and refined petroleum products 19
Manufacture of rubber and plastic products 22
Manufacture of other non-metallic mineral products 23
Manufacture of basic metals 24
Manufacture of fabricated metal products, except machinery and equipment Excluding 252: Manufacture of weapons and ammunition
25
Building of ships and boats 301
Repair and installation of machinery and equipment 33
Table A4. Industries, Low technology5
Code Description
Manufacture of food products 10
Manufacture of beverages 11
Manufacture of tobacco products 12
Manufacture of textiles 13
Manufacture of wearing apparel 14
Manufacture and processing of leather and related products 15
Manufacture of wood and of products of wood and cork, except furniture; manufacture of articles of straw and plaiting materials
16
Manufacture of paper and paper products 17
Printing and reproduction of recorded media Excluding 182: Reproduction of recorded media
18
Manufacture of furniture 31
Other manufacturing Excluding 325: Manufacture of medical, dental and orthopedic instruments and supplies
32
4 See CBS (2012). Standard Industrial Classification of All Economic Industries
2011. Technical Publication No. 80. Jerusalem: Author. 5 See CBS (2012). Standard Industrial Classification of All Economic Industries
2011. Technical Publication No. 80. Jerusalem: Author.

( 15 )
In 2015, exports in Manufacturing, Mining and Quarrying totalled NIS 168 billion (Table 4). High-technology exports were 2.8 times higher than medium-high technology exports, and 10 times higher than low-technology exports.
The revenue from local sales in Manufacturing, Mining and Quarrying in 2015 amounted to NIS 226 billion (Table 4), and 33% of it derived from low-technology industries (based on table 15). In 2015, there was a 0.3% increase in revenue from exports at constant prices, a 1.8% increase in revenue from local sales, and a 1.2% increase in total revenue (Diagram 2).
The Manufacturing production index increased by 2.5% in 2015. The increase in Manufacturing production was mostly due to the medium-low technology industries, whereas the high and medium-high technologies remained stable (Table B).
1. EXPORTS OF MANUFACTURING ESTABLISHMENTS,
BY TECHNOLOGICAL INTENSITY (at constant prices)
Base: 2011=100.0
2006–2015
70
80
90
100
110
120
130
2006 2007 2008 2009 2010 2011 2012 2013 2014 2015
Ind
ices
Manufacturing - total
High technology
Medium-high technology
Medium-low technology
Low technology
2. INDICES FOR OVERALL MANUFACTURING:
REVENUE, EXPORTS, AND LOCAL SALES (at constant prices)
Base: 2011=100.0
2006–2015
70
80
90
100
110
120
130
2006 2007 2008 2009 2010 2011 2012 2013 2014 2015
Ind
ices
Revenue
Exports (NIS)
Local sales

( 16 )
Table B. Annual Change in the Manufacturing Production Index, by Technological Intensity (2011 Classification)
Percentages
2015 2014 2013 2012 2011 2010 Technological Intensity
2.5 0.6 -1.1 4.7 2.2 9.7 Manufacturing – total
3.4 -0.1 -1.9 9.3 -0.1 8.8 High technology
1.4 0.0 -0.4 4.1 3.4 5.6 Medium-high technology
1.3 2.6 0.1 1.8 8.1 13.1 Medium-low technology
2.2 0.3 -0.6 -1.0 1.1 2.9 Low technology
In 2015, 27% of the jobs in Manufacturing were in high-technology industries; and 31% of the jobs in Manufacturing were in low-technology industries, which are labour-intensive (Table 18). In 2010–2012, the number of jobs increased in all groups (except for a decline in low-technology industries in 2011). During 2014–2015, the number of jobs in Manufacturing remained stable. However, with regard to development by technological intensity, the number of jobs in medium-low technological technology increased, and the number of jobs in medium-high technology declined (Diagram 4).
3. MANUFACTURING PRODUCTION INDEX,
BY TECHNOLOGICAL INTENSITY (at constant prices)
Base: 2011=100.0
2006–2015
70
80
90
100
110
120
130
2006 2007 2008 2009 2010 2011 2012 2013 2014 2015
Ind
ices
Manufacturing - total
High technology
Medium-high technology
Medium-low technology
Low technology

( 17 )
Table C1. Percentage of Change in Manufacturing Production, Employee Jobs, and Wage per Employee Job, by Technological Intensity 2005–2015 (Each Year Compared to the Previous One) – Low technology6
Wage per employee job (at constant prices)
Employee jobs Production YearS
2.6 0.4 1.4 2005 1.8 0.7 2.5 2006 2.6 1.0 2.2 2007
-1.2 -0.4 -0.8 2008 -1.9 -4.2 -5.1 2009 1.2 1.6 2.9 2010 0.5 -0.3 1.1 2011 0.3 0.2 -1.0 2012 1.2 -0.3 -0.6 2013 1.1 1.0 0.3 2014 5.6 -0.1 2.2 2015
6 The changes were calculated for the chained series based on 2011 due to the
transition to the new classification.
4. JOBS IN MANUFACTURING,
BY TECHNOLOGICAL INTENSITY (at constant prices)
Base: 2011=100.0
2006–2015
70
80
90
100
110
120
130
2006 2007 2008 2009 2010 2011 2012 2013 2014 2015
Ind
ices
Manufacturing - total
High technology
Medium-high technology
Medium-low technology
Low technology

( 18 )
Table C2. Percentage of Change in Manufacturing Production, Employee Jobs,
and Wage per Employee Job, by Technological Intensity 2005–2015 (Each Year
Compared to the Previous One) – Medium-low technology7
Wage per employee job (at constant prices)
Employee jobs Production yearS
0.4 1.7 5.9 2005 4.7 2.5 7.2 2006 3.4 5.8 4.7 2007
-2.9 3.2 2.9 2008 -3.2 -7.4 -14.6 2009 2.5 1.8 13.1 2010 0.1 3.8 8.1 2011 0.8 1.3 1.8 2012 1.5 1.0 0.1 2013 2.2 0.8 2.6 2014 2.6 1.2 1.3 2015
S
Table C3. Percentage of Change in Manufacturing Production, Employee Jobs,
and Wage per Employee Job, by Technological Intensity 2005–2015 (Each Year
Compared to the Previous One) – Medium-high technology8
Wage per employee job (at constant prices)
Employee jobs Production yearS
3.4 0.5 0.6 2005 -0.4 4.7 0.2 2006 4.3 6.0 11.9 2007
-2.5 2.5 5.1 2008 -1.5 -3.0 -9.3 2009 1.0 2.6 5.6 2010 1.3 0.7 3.4 2011 2.2 1.9 4.1 2012 0.0 1.6 -0.4 2013 1.5 -0.1 0.0 2014 1.6 -1.8 1.4 2015
S
7 The changes were calculated for the chained series based on 2011 due to the
transition to the new classification. 8 The changes were calculated for the chained series based on 2011 due to the
transition to the new classification.

( 19 )
Table C4. Percentage of Change in Manufacturing Production, Employee Jobs,
and Wage per Employee Job, by Technological Intensity
2005–2015 (Each Year Compared to the Previous One) – High technology9
Wage per employee job (at constant prices)
Employee jobs Production yearS
2.6 4.2 9.1 2005 1.7 6.6 17.9 2006 2.9 6.1 6.1 2007
-7.7 3.9 14.3 2008 -1.1 -4.7 -0.9 2009 0.9 4.2 8.8 2010
-1.5 3.1 -0.1 2011 -0.1 0.2 9.3 2012 1.4 -0.6 -1.9 2013 2.6 -1.3 -0.1 2014 3.4 -0.7 3.4 2015
Table C5. Percentage of Change in Manufacturing Production, Employee Jobs,
and Wage per Employee Job, by Technological Intensity
2005–2015 (Each Year Compared to the Previous One) – Manufacturing – total10
Wage per employee job (at constant prices)
Employee jobs ProductionSyearS
2.8 1.8 5.1 2005 2.6 3.1 9.1 2006 3.8 4.2 5.5 2007
-4.1 2.1 6.9 2008 -1.6 -4.7 -5.8 2009 1.3 4.2 7.9 2010 2.2 1.7 2.2 2011 0.5 0.7 4.7 2012 1.1 0.3 -1.1 2013 1.6 0.1 0.6 2014 3.3 -0.2 2.5 2015
9 The changes were calculated for the chained series based on 2011 due to the
transition to the new classification. 10 The changes were calculated for the chained series based on 2011 due to the
transition to the new classification.

( 20 )
3. Terms, Definitions and Explanations
3.1 Definitions
Jobs (formerly: employed persons): Employee jobs, owners and unpaid family members, kibbutz members, workers employed through employment agencies (in monthly estimates jobs are calculated excluding workers employed through employment agencies).11
Employee jobs (formerly: employees): All workers on the employee payroll, including members of co-operatives, as well as workers from Judea and Samaria Area. Unsalaried kibbutz members employed in a kibbutz establishment are considered to be owners. Self-employed persons engaging in piecework for the establishment are not included.
Actual work hours include overtime hours and do not include paid absence hours (such as sick days, vacations), or work hours of proprietors and their family members.
Wages (formerly: wages and salaries): All payments on which income tax is due (before deduction of taxes) appearing in employee payrolls, including: basic salary, and the following increments: cost of living, professional, seniority, and family allowances (excluding allowances for employees’ children) and travel allowance,
premiums, bonuses and overtime payment, absence (e.g., vacation, sick pay, religious holidays), convalescence, professional literature and “13th-month” salary,
as well as car allowance (including imputation for a vehicle owned by the employer and used by the employee), telephone, clothing, per diem expenses (on which only income tax is due), and payments in kind (e.g., meals, holiday gifts, and housing), as well as non-recurrent payments, back pay for previous periods, shift work, on-call pay, incentive pays, proficiency allowance and retirement grants.
Labour cost includes, in addition to wages, supplementary expenditures for them and other cost components such as the employer’s portion in payments to national
insurance, training funds, provident funds, severance pay by the establishment, transport of workers, upkeep of cafeteria, and worker training expenses. These data, after “smoothing” the non-recurrent payments (see Paragraph 3.2: “Explanations of
the Data Used for the Estimates”, below), are used in the calculation of the index of all payments related to engaging workers – the labour cost index.12
Paid hourly labour cost index – calculated as the ratio of the total labour cost index to the paid work hours index for all employees, standardized according to number of work days per month.
The index of wage per paid work hour per employee job is obtained by dividing the wage index (except non-recurrent payments and back pay for previous periods) by
11 For an explanation on employed persons, employees/jobs, and employee jobs,
see: CBS. Statistical Abstract of Israel 2014, No. 65. Jerusalem: Author, p. 462. 12 See detailed definition in CBS. Statistical Abstract of Israel 2014, No. 65.
Jerusalem: Author, p. 164.

( 21 )
the paid work hours index (actual paid work hours and paid hours of absence), and standardized according to number of work days per month.
Revenue (value of sales) at current prices includes the value of local sales, sales for export, income from work (including repairs), and income from products manufactured by the establishment for its own use; taxes, such as purchase tax, excise duty, and value added tax. Subsidies and export incentives are not included.
Manufacturing industries by technological intensity:
In accordance with the Standard Industrial Classification of All Industrial Activities 2011 (p. 87), 13 The Manufacturing industries (excluding Mining and Quarrying) were divided into four major groups by degree of technological intensity: High-technology industries, medium-high technology industries, medium-low technology industries, and low-technology industries (an itemization of the industries included in each level of technological intensity is presented in Table A above).
Sector: The division of Manufacturing into sectors makes it possible to include institutions with similar economic behaviour and goals in the same category. An institution is an economic unit that can have assets, take on obligations, engage in economic activity, and conduct transactions with other economic units. In order to aggregate the institutional units into sectors, it is necessary to classify each unit separately. The classification of each institutional unit into sectors is determined according to the control of shares in the company. These accounts presented by sector provide information on the distribution of income in Manufacturing, the distribution of employment, etc.
According to the recommendations of the System of National Accounts 1993, Manufacturing establishments are divided into the following sectors:
Non-financial sector
– Private under Israeli ownership – private establishments
– Private under foreign ownership – includes establishments with at least 50% of their stock under non-Israeli ownership
– Government corporations – includes establishments with at least 50% of their stock under government ownership
– Co-operatives – co-operative establishments
Household sector – includes businesses that are owned by households and not incorporated as companies.
3.2 Explanations of the Data Used for the Estimates
Collection – The data used to prepare the indices are gathered from Manufacturing establishments. The data on establishments with up to 10 employee jobs are usually received from administrative sources: data on jobs and wages are received from the National Insurance Institute, and the revenue data – from the Value Added Tax system. 13 See: CBS (2012). Standard Industrial Classification of All Economic Activities
2011. Technical Publication No. 80. Jerusalem: Author.

( 22 )
Imputation – Data that were not received while calculating the indices were imputed according to the changes in the recorded data.
The “smoothing” system of non-recurrent payments – Usually, non-recurrent payments and back pay relate to a period of a few months. Since it is impossible to receive from the establishments accurate data of these payments according to the months to which they relate, and since there are sharp fluctuations concerning the sum of the non-recurrent payments, it was decided to include in the moving average wage every month the non-recurrent payments and back pay of the last four months (the reported month and the preceding three months). For some of these establishments, the data received referred to payments which are divided backwards, throughout the entire year.
4. Methodology
4.1 Survey Population
The survey population includes establishments that meet two criteria:
Industrial characteristics – Establishments belonging to Manufacturing, Mining and Quarrying industries, as defined in the Standard Industrial Classification of All Economic Activities 2011,14 excluding the Working of Diamonds industry. In the Working of Diamonds industry, manufacturing activities are combined with commercial activities, and there is no way to obtain reliable data on the aspect of the industry that involves Manufacturing (i.e., polishing diamonds).
Economic characteristics – Establishments with at least one employee job in the business sector, and kibbutz establishments that produce commodities for sale on the market.
This population excludes establishments of self-employed proprietors with no employee jobs, non-profit establishments, and auxiliary manufacturing units of kibbutzim that only serve the kibbutz and do not sell their products on the market (e.g., sewing and metal workshops). In addition, Israeli-owned units that operate outside of the country were not included in the frame.
4.2 Sampling Frame
The frame was constructed on the basis of the business register in the CBS. The register is based mainly on combined information from two administrative files:
(a) The VAT file of dealers;
(b) The employers file of the National Insurance Institute.
From the business register, the establishments that met the criteria described in Paragraph 4.1: “Survey Population”, above, were chosen for the frame of Manufacturing indices.
14 See: Central Bureau of Statistics (2012). Standard Industrial Classification of All
Economic Activities 2011). Technical Publication No. 80. Jerusalem: Author, pp. 34–41.
( 23 )
4.3 Sample
4.3.1 General
The manufacturing sample is planned so that the sum of revenue and not the number of establishments is estimated effectively. Therefore it is likely that the estimates obtained for the revenue (or for other variables which operate similarly) will be more accurate, whereas the estimates of the number of jobs will be less accurate and those of the number of establishments or the division by district will be even less accurate.
The frame was divided into sampling industries, which were stratified by revenue data. In each sampling stratum, a simple random sample without replacement was drawn. A supplementary sample is drawn bimonthly, covering the new businesses in the economy. In each year the sampling frame is updated and the businesses are allocated anew to the size strata according to the revenue data from the last year. Following this the sampling strata and probabilities are updated, and the sampling is done again, preserving the continuity of the sample as much as possible.
The dealers with the highest revenue in each industry (in the highest sampling stratum) are sampled with certainty. Dealers employing over 200 persons are sampled with certainty as well, even if their revenue was relatively low.
Following the transition to the new industrial classification the sample was renovated in 2011. The renovation included: increasing the number of sampling strata, setting new boundaries for strata, and a new allocation of the sample size per stratum. The new sample has lower sampling errors and thus its estimates are more reliable.
4.3.2 Basic Sample
The boundaries of size groups in the industry were determined using a computerized algorithm. In each industry the dealers were divided into size strata according to the total annual revenue of the business. In each sampling stratum the dealers were sampled at equal probabilities using Neyman optimal allocation (the sampling reliability changes among strata), and dealers in the top size stratum in each industry were all sampled with certainty. The higher the revenue of the unit, the higher the stratum to which it was assigned and in which the sampling probability is higher.
Each sampling unit in the framework was assigned a “Permanent Random Number” (PRN), which was used throughout the survey. This number was intended to ensure, as much as possible, the continuity of the sample over time.
Note: Following the transition to the new industrial classification the PRN of the businesses was set anew in the basic sample in 2011. Thus we obtained a sample which does not depend on the previous ones, before 2011, according to the old industrial classification.
4.3.3 Supplementary Samples – New Businesses
New businesses are frequently opened, and in order to keep the sample up to date and avoid undercoverage of new businesses, a supplementary sample of new businesses is issued every 2 months. For this purpose, a sampling frame of units created during this period, known as a supplementary sample, is used. The units in the frame intended for supplementary samples are allocated to strata by the division

( 24 )
boundaries determined in the basic sample (in accordance with the industry and the size of the new business).
The process of supplementary sampling is “accumulative sampling”, in which the number of those being sampled in the supplement depends, inter alia, on the size of the accumulative sample up to the previous supplement, and the size of the accumulative sample required for the present supplement.
New dealers who have not yet been allocated to a sample stratum enter a “waiting group”. In many cases it is difficult to estimate the extent of economic activity of entirely new businesses. Thus after two months, when revenue data are added, the possibility of including them in the sampling frame is re-examined.
4.3.4 Estimation
For every dealer in the sample a weighting factor was assigned, which is the inverse of the sample probability. Intuitively, the weighting factor reflects the number of dealers in the population that he/she represents in the sample. The data on every dealer in the sample were multiplied by his/her weighting factor, and thus the datum estimated in the sample represents the survey population.
As noted, the sample probability was determined so that it will significantly reduce the relative sampling errors (of the entire survey population) of the estimated revenue. It is also possible to estimate the number of establishments or any other datum in the same manner (multiplication by the weighting factor). It is also possible to classify the economic activity by different variables, such as district, size group of businesses, or number of establishments, but the relative sampling error will generally be bigger. Thus caution should be exercised when comparing data of different years by these variables.
5. Methods of Calculation
5.1 Base
The base for calculating Manufacturing indices in the new sample is 2011=100.0 (mean).
During the course of the year, revisions are made in the base, due to the need to update historical data in a way that the indices will not be influenced by the revisions. As a result, the data for the previous year are revised according to the ratio of indices multiplied by absolute data for the current year. Since the revisions for the previous year have been introduced at the level of divisions, there may be a lack of correspondence between the sums for total Manufacturing obtained according to the various types of categories (e.g., technological intensity).
Following adjustments in the base during the course of the year, the absolute data for revenue, jobs, labour cost, and other variables presented in this publication are the most up to date.
To calculate the absolute data for previous years, it is necessary to relate to the absolute data for this year, as well as to the indices that are relevant to the time of this publication.

( 25 )
5.2 Indices of Revenue, Employment and Labour Cost
The indices of revenue, employment, and labour cost at the level of groups, divisions, and total Manufacturing are calculated as the ratio of the data on establishments after inflation in the current period, to base data. The derived indices are calculated as the ratio of the main indices. Thus, the index of wage per employee is calculated as the ratio between the index of wages and the index of total employees.
Additionally, revenue and labour cost indices are also calculated at constant prices. Measures relating to labour cost indices are divided by the Consumer Price Index, whereas the index of revenue at constant prices is calculated by dividing the index of revenue at current prices by the combined index of wholesale Manufacturing product prices and export prices.
5.3 Indicators, Weights, and Method of Calculating the Manufacturing Production Index
5.3.1 Manufacturing Production Index
The aim of the Manufacturing production index is to reflect monthly changes in the volume of production, which is the added value of Manufacturing in each industry.
In practical terms, there is no way to obtain monthly data on added value in order to calculate the index. Therefore, other indicators and variables are used, for which the changes are similar to those of the added value, for example: product output, work hours invested in production, and revenue at constant prices, or a combination of indicators. Indices are calculated for the indicators (the changes in the indicators since the base period) within the group. The indices of the indicators for each group are weighted by the indicators weights, to obtain a production index for the group. Indices for the division and for total Manufacturing are weighted according to the added value of the groups in the division and total Manufacturing.

( 26 )
5.3.2 Indicators
In the new system, the indicators and their weights for calculating the Manufacturing production index every month were updated. The number of groups and their weights by type of indicator are presented in Table D, below.
Table D. Number of Groups and Their Weight, by Type of Indicator
Type of indicator
Old sample No. of groups
Old sample Weights of Manufacturing production index
New sample No. of groups
New sample Weights of Manufacturing production index
Total 121 100.00 151 100.0
Products (Amounts of production) 15 9.95 9 4.8
Products (Amounts of production) + revenue (At constant prices) 19 13.33 25 17.2
Revenue (At constant prices) + work hours 48 45.90 64 43.6
Revenue (At constant prices) 36 28.90 50 30.0
Products (Amounts of production) + work hours + revenue (At constant prices) 3 1.92
Work hours 3 4.4
5.3.3 Manufacturing Production Weights
When the indices were changed to the new base 2011=100.0, the weights used to calculate Manufacturing indices were updated (the previous sample of the production index was calculated according to the 2004 weights).
In the current sample replacement the weights were updated according to the value added data of manufacturing industries from the 2009 Manufacturing Survey (with revisions based on primary findings from the 2010 Manufacturing Survey), and adjusted to the base year 2011.
Table E presents the differences between weights. The table shows that the main change occurred in the Mining and Quarrying industries, which include the Extraction of Natural Gas, whose weight in the new sample rose sharply. In addition, the weight of Textiles and Wearing Apparel industries has continued to decline since 2004.

( 27 )
Table E. Added Value Weights for Manufacturing Industries and Manufacturing Production Index Weights, by Industry (Division) Percentages Code according to the; old classifica-tion (1993)
Code according to the new classification (2011)
Description
Old sample 2004 weight
Old sample Propor-tion in 2011
New sample (2011) 2011
New sample (2011) 2014
Sections B–C
Manufacturing; mining and quarrying 100 100 100 100
13 Section B Mining and quarrying 2.78 1.99 5.28 6.29
Section C Manufacturing 97.22 98.01 94.72 93.7
14–15 10 Food products 12.26 10.05 10.52 10.7
16 11–12 Beverages and tobacco products 1.74 1.39 1.51 1.47
17–18 13–14 Textiles and Wearing apparel 3.67 2.25 1.66 1.44
19 15 Leather and related products 0.21 0.15 0.20 0.22
20 16 Wood, cork and straw products, except furniture 0.76 0.58 0.50 0.54
21 17 Paper and paper products 2.32 1.99 1.88 1.44
22 18 Printing and reproduction of recorded media 2.29 1.60 1.73 1.37
23–24, excluding 245
19–20 Petroleum products, chemicals and chemical products 9.04 7.64 8.25 6.73

( 28 )
245 21 Manufacture of pharmaceutical products, including homeopathic preparations 6.73 13.46 12.12 10.32
25 22 Rubber and plastic products 5.84 6.36 4.54 4.36
Code according to the; old classifica-tion (1993)
Code according to the new classification (2011)
Description
Old sample 2004 weight
Old sample Proporti-on in 2011
New sample (2011) 2011
New sample (2011) 2014
26 23 Other non-metallic mineral products
2.85 2.32 2.69 3.45
27 24 Basic metals 1.69 1.28 1.57 1.4
28 25 Fabricated metal products, except machinery and equipment 10.00 9.70 8.86 8.98
32–34 26 Computers and electronic and optical products 23.05 25.46 24.25 27.46
31 27 Electrical equipment 2.06 1.68 1.88 1.47
29 28 Machinery and equipment n.e.c. 2.89 2.81 3.66 3.26
35 29–30 Transport equipment 6.00 5.99 4.98 5.06
36 31 Furniture 2.87 2.51 1.98 2.32
38–39 32 Other manufacturing. 0.96 0.79 1.58 1.24
33 Repair and installation of machinery and equipment 0.35 0.47

( 29 )
5.3.4 Formula for Calculating the Production Index for Group
To calculate the production index for group Ik-k
X Ikj WkjS=kS
S
Where k = group;
j = indicator number;
Ikj = index of indicator j in group k;
Wkj = weight of indicator j in group k;
Where:
4 =j
WkjS
5.3.5 Formulas for Calculation of the Production Index for a Division and for Total Manufacturing
The division index, which is the sum of the groups – mainly division in Manufacturing – is the weighting of indices for groups by the weights of the industries, which add up to 1. More specifically:
(1) Calculation of the production index for R industry (division) =Ir
X Ikk
Wrk Ir =S
where Wrk – the group weight in a division
4S=k
WrkS
(2) Calculation of the production index for total Manufacturing T – IT
where Wk is the weight of the group and Wk = 1
SS x Ir Wr x Ik = WkS=ITS
where Wr is the weight of an industry (division) in total Manufacturing
4SS=WrS


( 31 )
TABLES
Special Symbols and Abbreviations
0.0 = A value smaller than half the unit by which data are presented in the table
* = Provisional data
R = Revised data
n.e.c. = Not elsewhere classified
( 32 )
EXPLANATORY NOTES
Area Covered by the Statistical Data
The statistical data relate to the economic territory of the State of Israel, unless otherwise stated.
A. The economic territory of a country (according to the definition of the OECD-SNA. For a detailed definition, see: OECD, Glossary of Statistical Terms): The economic territory of a country consists of the geographic territory administered by a government within which persons, goods and capital circulate freely.
The economic territory of the State of Israel: According to this definition, the economic territory of the State of Israel is as indicated in paragraph B below.
B. District and Sub-District: The districts and sub-districts are defined according to the official administrative division of the State of Israel, which includes 6 districts and 15 sub-districts. Including Israeli localities in the Judea and Samaria Area.
Special Symbols in the Tables
0.0 = A value smaller than half the unit by which data are presented in the table
* = Provisional data
R = Revised data

TA
BL
E 1. JO
BS
, BY
IND
US
TR
Y (D
IVIS
ION
) (2011 CL
AS
SIF
ICA
TIO
N)
(20
11
סיווג שי (
אף כלכלי ר
פי ענת, ל
שרומ
.1ח לו
Monthly average
שיממוצע חוד
של עובדים שכיר
שרות מ
המועסקים באמצעותבעלים וחברי קיבוץ (אלפים)
שכירשרות
מ(אלפים)
שרות – סך הכל מ
(אלפים)חברות כוח אדם
(אלפים)C
odeIndustry (division)
Em
ployee jobs of workers
employed
Proprietors and kibbutz
mem
bersE
mployee jobs
(thousands)Jobs – total (thousands)
שיענף כלכלי רא
סמל
through employm
ent(thousands)
agencies (thousands)*2015
R2014
*2015R
2014*2015
R2014
*2015R
2014
B–
C M
AN
UF
AC
TU
RIN
G; M
ININ
Gהה; כריי
שייתע
B–
C
AN
D Q
UA
RR
YIN
G(1)(2) – G
RA
ND
TO
TA
L1
2.9
12
.92
.92
.93
50
.63
51
.73
66
.33
67
.5סך כולל
ה(1)(2) – בחצי
וB
MIN
ING
AN
D Q
UA
RR
YIN
G – T
OT
AL
0.0
0.0
0.0
0.0
4.1
4.0
4.2
4.1
הכלסך
ה – בחצי
ה וכריי
BC
MA
NU
FA
CT
UR
ING
(2) – TO
TA
L1
2.8
12
.82
.92
.93
46
.53
47
.63
62
.13
63
.3הכל
סך ה(2) –
שייתע
C
10 M
anufacture of food products3.4
3.40.4
0.453.8
53.857.6
57.7ייצור מוצרי מזון
1011–12
Manufacture of beverages
0.20.2
0.00.0
5.55.4
5.75.7
שקאות ומוצרי טבקייצור מ
12–11 and tobacco products
13 M
anufacture of textiles0.0
0.00.1
0.13.7
3.73.8
3.8ייצור טקסטיל
1314
Manufacture of w
earing apparel0.0
0.00.0
0.05.9
6.25.9
6.2שה
ייצור מוצרי הלב14
15 M
anufacture and processing of leatherשל מוצרי עור
ייצור ועיבוד 15
and related products0.0
0.00.0
0.01.8
1.71.8
1.8של אביזרים נלווים
ו16
Manufacture of w
ood, cork and strawש,שעם וק
ייצור מוצרי עץ, 16
products, except furniture0.0
0.00.1
0.12.9
3.03.0
3.1 פרט לרהיטים
17 M
anufacture of paper and paper products0.5
0.50.1
0.17.9
7.78.5
8.2ייצור נייר ומוצריו
1718
Printing and reproduction of
של חומרשכפול
הדפסה ו18
recorded media
0.30.3
0.10.1
9.19.0
9.59.4
שורתי מוקלטתק
19–20 M
anufacture of petroleum products,
ייצור מוצרי נפט, כימיקלים20–19
chemicals and chem
ical products0.9
0.90.0
0.019.8
20.020.7
21.0 ומוצריהם
21 M
anufacture of pharmaceutical products,
including homeopathic preparations
0.80.8
0.00.0
14.014.0
14.914.8
ייצור תרופות, כולל תרופות הומאופתיות
21
22 M
anufacture of rubber and plastic products2.0
2.00.8
0.821.0
20.923.8
23.7ייצור מוצרי גומי ופלסטיק
2223
Manufacture of other non-m
etallicייצור מוצרים אחרים על בסיס
23 m
ineral products0.2
0.20.1
0.011.1
11.111.3
11.4 מינרלים אל-מתכתיים
24 M
anufacture of basic metals
0.20.3
0.00.0
6.46.7
6.77.0
שיית מתכות בסיסיותתע
2425
Manufacture of fabricated m
etal products,ייצור מוצרי מתכת בהרכבה,
25 except m
achinery and equipment
1.01.0
0.30.4
43.943.3
45.244.6
פרט למכונות ולציוד26
Manufacture of com
puters, electronicשור
שבים, מכייצור מח
26 and optical products
1.21.2
0.10.1
67.968.6
69.269.9
אלקטרוני ואופטי27
Manufacture of electrical equipm
ent0.4
0.50.2
0.28.4
8.99.1
9.5שמלי
ייצור ציוד ח27
28 M
anufacture of machinery
and equipment n.e.c.
0.90.9
0.30.3
17.417.8
18.619.0
ייצור מכונות וציוד לנמ"א28
29 M
anufacture of motor vehicles,
trailers and semi-trailers
0.10.1
0.00.0
4.84.6
5.04.8
ייצור כלי רכב מנועיים ונגררים 29
30 M
anufacture of other transport equipment
0.00.0
0.00.0
13.413.5
13.513.5
ייצור כלי תחבורה והובלה אחרים30
31 M
anufacture of furniture0.3
0.30.0
0.013.1
12.913.4
13.2ייצור רהיטים
3132
Other m
anufacturing0.2
0.20.1
0.110.5
10.610.8
10.9ענפי ייצור אחרים
3233
Repair and installation of m
achineryתיקון, תחזוקה והתקנה
33 and equipm
ent0.0
0.00.0
0.04.1
4.14.2
4.1של מכונות וציוד
(1) Form
erly: Manufacturing.
שייה. (1) קודם: תע
(2) Excluding diam
onds.(2) לא כולל יהלומים.
- 29 -

TA
BL
E 2. E
ST
AB
LIS
HM
EN
TS
, EM
PL
OY
EE
JOB
S A
ND
AC
TU
AL
WO
RK
HO
UR
S,
ה,שמע
ה לבוד
ת עשעו
שכיר ות שרו
מם, פעלי
מח 2.
לו B
Y IN
DU
ST
RY
(DIV
ISIO
N) (2011 C
LA
SS
IFIC
AT
ION
)סיווג 2011)
שי (אף כלכלי ר
פי ענ ל
מפעלים
Code
Industry (division)Actual w
ork hoursActual w
ork hours –Em
ployee jobs –שיענף כלכלי רא
סמלper m
onthtotal
monthly average
Establish-per em
ployee job(thousands)
ments
*2015R
2014*2015
R2014
*2015R
2014*2015
B–C
MA
NU
FA
CT
UR
ING
; MIN
ING
הה; כריי
שייתע
B–C
AN
D Q
UA
RR
YIN
G(1)(2) – G
RA
ND
TO
TA
L169
169 709,845
714,426 350.6
351.7 12,913
סך כוללה(1)(2) –
בחצי
וB
MIN
ING
AN
D Q
UA
RR
YIN
G – T
OT
AL
162 168
8,005 8,164
4.1 4.0
108 הכל
סך ה –
בחצי
ה וכריי
BC
MA
NU
FA
CT
UR
ING
(2) – TO
TA
L169
169 701,840
706,262 346.5
347.6 12,806
הכלסך
ה(2) – שיי
תעC
10 M
anufacture of food products161
162 103,554
104,379 53.8
53.8 1,857
ייצור מוצרי מזון10
11–12 M
anufacture of beverages and tobacco products176
171 11,550
11,211 5.5
5.4 134
שקאות ומוצרי טבקייצור מ
12–1113
Manufacture of textiles
170 171
7,546 7,662
3.7 3.7
279 ייצור טקסטיל
1314
Manufacture of w
earing apparel158
156 11,182
11,638 5.9
6.2 536
שהייצור מוצרי הלב
1415
Manufacture and processing of leather
של מוצרי עורייצור ועיבוד
15 and related products
141 139
2,963 2,910
1.8 1.7
116 של אביזרים נלווים
ו16
Manufacture of w
ood, cork and strawש,שעם וק
ייצור מוצרי עץ, 16
products, except furniture174
169 5,953
6,065 2.9
3.0 193
פרט לרהיטים17
Manufacture of paper and paper products
188 188
17,868 17,349
7.9 7.7
167 ייצור נייר ומוצריו
1718
Printing and reproduction ofשל חומר
שכפול הדפסה ו
18 recorded m
edia164
169 17,803
18,312 9.1
9.0 936
שורתי מוקלט תק
19–20 M
anufacture of petroleum products,
ייצור מוצרי נפט, כימיקלים20–19
chemicals and chem
ical products166
169 39,310
40,635 19.8
20.0 284
ומוצריהם
21 M
anufacture of pharmaceutical products,
including homeopathic preparations
163 164
27,469 27,580
14.0 14.0
49 ייצור תרופות,
כולל תרופות הומאופתיות21
22 M
anufacture of rubber and plastic products175
174 43,977
43,598 21.0
20.9 516
ייצור מוצרי גומי ופלסטיק 22
23 M
anufacture of other non-metallic
ייצור מוצרים אחרים על בסיס23
mineral products
185 183
24,567 24,384
11.1 11.1
612 מינרלים אל-מתכתיים
24 M
anufacture of basic metals
178 179
13,752 14,367
6.4 6.7
243 שיית מתכות בסיסיות
תע24
25 M
anufacture of fabricated metal products,
ייצור מוצרי מתכת בהרכבה,25
except machinery and equipm
ent174
174 91,962
90,115 43.9
43.3 2,412
פרט למכונות ולציוד26
Manufacture of com
puters, electronicשור
שבים, מכייצור מח
26 and optical products
169 171
137,765 140,836
67.9 68.6
500 אלקטרוני ואופטי
27 M
anufacture of electrical equipment
168 170
17,029 18,108
8.4 8.9
205 שמלי
ייצור ציוד ח27
28 M
anufacture of machinery
and equipment n.e.c.
167 167
35,045 35,771
17.4 17.8
409 ייצור מכונות וציוד לנמ"א
2829
Manufacture of m
otor vehicles, trailers and sem
i-trailers172
172 9,889
9,571 4.8
4.6 108
ייצור כלי רכב מנועיים ונגררים 29
30 M
anufacture of other transport equipment
169 165
27,189 26,734
13.4 13.5
38 ייצור כלי תחבורה והובלה אחרים
3031
Manufacture of furniture
174 174
27,347 27,001
13.1 12.9
1,819 ייצור רהיטים
3132
Other m
anufacturing160
159 20,101
20,216 10.5
10.6 912
ענפי ייצור אחרים32
33 R
epair and installation of machinery
תיקון, תחזוקה והתקנה33
and equipment
161 160
8,018 7,819
4.1 4.1
482 של מכונות וציוד
(1) Formerly: M
anufacturing.שייה.
(1) קודם: תע(2) Excluding diam
onds.(2) לא כולל יהלומים.
- 30 -
שה –שעות עבודה למעסך הכל(אלפים)
שכיר –שרות
משיממוצע חוד(אלפים)
(thousands)
שהשעות עבודה למע
שלחוד
שכירשרת
למ

TA
BL
E 3. L
AB
OU
R C
OS
T A
ND
WA
GE
S, B
Y IN
DU
ST
RY
(DIV
ISIO
N)
(2011סיווג
שי (אף כלכלי ר
פי ענשכר, ל
ה ובוד
ת עח 3. עלו
לו (2011 C
LA
SS
IFIC
AT
ION
)
שנתישכר
שכר –שעת
עלות לעלות עבודה –
שכירשרת
למסך הכל
שלוםעבודה בת
סך הכלש"ח)
(אלפי ש"ח)(2)
(מיליוני ש"ח)(1)
)ש"ח)(1)
(מיליוני A
nnual wages
Wages –
Supplem
entaryC
ost per paidLabour cost –
Code
Industry (division)per em
ployee jobtotal
expenditures forw
ork hourtotal
שיענף כלכלי רא
סמל(N
IS thousand)
(NIS
million)(2)
wages, as
(NIS
)(1)(N
IS m
illion)(1)
percentage
of them
*2015R
2014*2015
R2014
*2015R
2014*2015
R2014
*2015R
2014
B–
C M
AN
UF
AC
TU
RIN
G; M
ININ
Gהה; כריי
שייתע
B–
C A
ND
QU
AR
RY
ING
(3)(4) – GR
AN
D T
OT
AL
15
7
15
3
54
,89
2
53
,71
1
20
.8
20
.6
85
8
2
66
,33
2
64
,76
4
סך כוללה(3)(4) –
בחצי
וB
MIN
ING
AN
D Q
UA
RR
YIN
G – T
OT
AL
25
4
26
8
1,0
44
1
,08
7
27
.8
29
.1
15
2
15
6
1,3
35
1
,40
2
הכלסך
ה – בחצי
ה וכריי
BC
MA
NU
FA
CT
UR
ING
(4) – TO
TA
L1
55
1
51
5
3,8
48
5
2,6
25
2
0.7
2
0.4
8
4
81
6
4,9
98
6
3,3
61
הכל
סך ה(4) –
שייתע
C
10 M
anufacture of food products99
95 5,342
5,095 16.6
16.7 55
52 6,230
5,945 ייצור מוצרי מזון
1011–12
Manufacture of beverages and tobacco products
159 152
871 826
16.1 15.7
79 77
1,011 955
שקאות ומוצרי טבקייצור מ
12–1113
Manufacture of textiles
117 111
433 414
14.1 17.7
61 60
494 488
ייצור טקסטיל13
14 M
anufacture of wearing apparel
84 79
500 491
16.9 16.4
48 46
584 571
שהייצור מוצרי הלב
1415
Manufacture and processing of leather
של מוצרי עורייצור ועיבוד
15 and related products
84 82
148 143
15.9 15.1
53 52
171 164
של אביזרים נלווים ו
16 M
anufacture of wood, cork and straw
ש,שעם וק
ייצור מוצרי עץ, 16
products, except furniture105
104 299
309 16.4
14.8 54
55 348
355 פרט לרהיטים
17 M
anufacture of paper and paper products137
125 1,089
963 20.2
20.0 68
62 1,310
1,156 ייצור נייר ומוצריו
1718
Printing and reproduction of
של חומרשכפול
הדפסה ו18
recorded media
104 104
946 936
15.0 14.5
57 54
1,087 1,072
שורתי מוקלט תק
19–20 M
anufacture of petroleum products,
ייצור מוצרי נפט, וכימיקלים20–19
chemicals and chem
ical products178
180 3,513
3,601 19.6
20.2 97
96 4,200
4,331 ומוצריהם
21 M
anufacture of pharmaceutical products,
including homeopathic preparations
223 212
3,125 2,963
27.1 25.6
124 116
3,972 3,722
ייצור תרופות, כולל תרופות הומאופתיות
21
22 M
anufacture of rubber and plastic products124
120 2,601
2,519 18.4
18.0 65
64 3,080
2,974 ייצור מוצרי גומי ופלסטיק
2223
Manufacture of other non-m
etallicייצור מוצרים אחרים על בסיס
23 m
ineral products144
140 1,599
1,553 18.8
18.0 72
71 1,899
1,833 מינרלים אל-מתכתיים
24 M
anufacture of basic metals
125 124
806 832
19.0 19.4
64 64
959 993
שיית מתכות בסיסיותתע
2425
Manufacture of fabricated m
etal products,ייצור מוצרי מתכת בהרכבה,
25 except m
achinery and equipment
126 125
5,552 5,407
19.0 18.7
66 65
6,605 6,417
פרט למכונות ולציוד26
Manufacture of com
puters, and electronicשור
שבים, ומכייצור מח
26 and optical products
242 236
16,428 16,181
22.9 22.9
129 126
20,192 19,887
אלקטרוני ואופטי27
Manufacture of electrical equipm
ent135
130 1,141
1,156 18.9
18.1 74
70 1,357
1,364 שמלי
ייצור ציוד ח27
28 M
anufacture of machinery
and equipment n.e.c.
168 164
2,930 2,933
20.7 18.9
93 90
3,536 3,488
ייצור מכונות וציוד לנמ"א28
29 M
anufacture of motor vehicles,
trailers and semi-trailers
122 120
586 555
18.6 19.6
65 63
695 664
ייצור כלי רכב מנועיים ונגררים29
30 M
anufacture of other transport equipment
221 216
2,966 2,919
25.8 25.8
117 117
3,732 3,673
ייצור כלי תחבורה והובלה אחרים30
31 M
anufacture of furniture99
95 1,297
1,233 15.2
15.6 51
49 1,494
1,426 ייצור רהיטים
3132
Other m
anufacturing109
104 1,141
1,095 23.2
18.0 63
58 1,406
1,292 ענפי ייצור אחרים
3233
Repair and installation of m
achineryתיקון, תחזוקה והתקנה
33 and equipm
ent128
122 532
498 19.0
18.4 74
70 633
590 של מכונות וציוד
(1) Including w
ages, non-recurrent payments, back pay for previous periods,
שים לתקופות קודמות, שלומים חד-פעמיים, הפר
שכר, ת(1) כולל
supplementary expenditures and other cost com
ponents. הוצאות נלוות ומרכיבי עלות נוספים.
(2) Including non-recurrent payments and back pay for previous periods.
שים לתקופות קודמות.שלומים חד-פעמיים והפר
(2) כולל ת(3) Form
erly: Manufacturing.
שייה.(3) קודם: תע
(4) Excluding diam
onds.(4) לא כולל יהלומים.
הוצאות נלוותשכר,
לכאחוז ממנו
- 31 -

TABLE 4. REVENUE FROM LOCAL SALES AND EXPORTS, לוח 4. פדיון ממכירות מקומיות ומיצוא, BY INDUSTRY (CLASS) לפי תת-ענף כלכלי (2011 CLASSIFICATION) (סיווג 2011)
*2015פדיון אחוזלמשרה היצוא
(אלפי ש"ח) מהפדיון יצוא מכירות סך הכל(מיליוני מקומיות (מיליוני
Industry (ש"ח (מיליוני ש"ח) ענף כלכלי סמל(division and class) ש"ח) (ענף ראשי ותת-ענף) Code
Revenue per Exports, Exports Local Totaljob (NIS as percentage (NIS sales (NIS
thousand) of revenue million) (NIS million)million)
MANUFACTURING; MINING AND 1,118 42.1 172,428 237,072 409,500 (2)(1)תעשייה; כרייה וחציבה B–C
QUARRYING(1)(2)
MINING AND QUARRYING כרייה וחציבה 14,663 10,252 4,411 30.1 3,508 B
MANUFACTURING(2) תעשייה(2) 394,837 226,820 168,017 42.6 1,090 C
Manufacture of food products ייצור מוצרי מזון 60,312 57,982 2,331 3.9 1,047 10
Processing and preserving of meat עיבוד בשר ושימורו 8,205 8,102 103 1.3 1,315 1010
Slaughterhouses for cattle and poultry משחטות ובתי מטבחיים 5,224 5,215 9 0.2 1,298 1011
Processing and preserving of fish, עיבוד דגים, סרטנים, 1030–1020
crustaceans, molluscs, fruit and ,רכיכות, פירות וירקות vegetables ושימורם 6,230 4,950 1,280 20.5 1,086Manufacture of vegetable and animal ייצור שומנים ושמנים מן החי ומן 1040
oils and fats הצומח 2,130 1,945 185 8.7 1,193Manufacture of dairy products ייצור מוצרי חלב 12,198 12,146 53 0.4 2,228 1050
Manufacture of grain mill products, ייצור מיני דגנים (טחינת תבואה 1062–1061
starches and starch products וגריסתה), עמילנים ומוצרים 2,256 2,130 126 5.6 2,225עמילניים
Manufacture of matzot (unleavened 289 32.2 68 142 210 ייצור מצות 1070
bread)
Manufacture of bakery products ייצור דברי מאפה 6,742 6,657 84 1.3 363 1071
Manufacture of sugar, cocoa, chocolate ייצור סוכר, קקאו, שוקולד 1073 ,1072
and sugar confectionery וממתקים 2,959 2,832 127 4.3 992Manufacture of macaroni, noodles, ייצור מקרוני, אטריות, קוסקוס 1074
couscous and similar farinaceous 754 3.9 95 2,343 2,438 ומזונות עמילניים דומים products
Manufacture of prepared meals and ייצור מזון מוכן, מזון מוכן לבעלי 1080–1079 ,1075
dishes, prepared animal feeds and חיים ומוצרי מזון אחרים לנמ"א 11,720 11,518 202 1.7 1,506 other food products n.e.c.
Manufacture of beverages and ייצור משקאות ומוצרי טבק 8,065 7,846 219 2.7 1,414 12–11
tobacco products
Distilling, rectifying and blending of spirits, זיקוק וערבוב של אלכוהול, ייצור 1102–1101
manufacture of wines יינות 1,376 1,206 169 12.3 860Manufacture of textiles ייצור טקסטיל 3,912 1,534 2,377 60.8 1,023 13
Spinning, weaving and finishing of textiles טווייה, אריגה וגימור של טקסטיל 2,321 735 1,586 68.3 1,302 1313–1311
Manufacture of other textiles ייצור סוגים אחרים של טקסטיל 1,591 800 791 49.7 779 1399 ,1394–1391
Manufacture of wearing apparel ייצור מוצרי הלבשה 3,035 1,608 1,427 47.0 511 14
Manufacture of wearing apparel ייצור בגדים (פרט לבגדי פרווה) 1,619 1,538 80 5.0 349 1410
(except fur apparel)
Manufacture of underwear ייצור הלבשה תחתונה 1,186 17 1,169 98.6 1,129 1411
Revenue (NIS million)פדיון (מיליוני ש"ח)
- 32 -

TABLE 4. REVENUE FROM LOCAL SALES AND EXPORTS, לוח 4. פדיון ממכירות מקומיות ומיצוא, BY INDUSTRY (CLASS) לפי תת-ענף כלכלי (2011 CLASSIFICATION) (Cont.) (סיווג 2011) (המשך)
*2015פדיון אחוזלמשרה היצוא
(אלפי ש"ח) מהפדיון יצוא מכירות סך הכל(מיליוני מקומיות (מיליוני
Industry (ש"ח (מיליוני ש"ח) ענף כלכלי סמל(division and class) ש"ח) (ענף ראשי ותת-ענף) Code
Revenue per Exports, Exports Local Totaljob (NIS as percentage (NIS sales (NIS
thousand) of revenue million) (NIS million)million)
Manufacture and processing of leather ייצור ועיבוד של מוצרי עור ושל 15
and related products אביזרים נלווים 764 448 316 41.4 434
Tanning and dressing of leather, עיבוד עורות, ייצור מזוודות, 1512—1511
manufacture of luggage, handbags, תיקים, אוכפים ורתמות, saddlery and harness, dressing 526 20.4 44 171 215 עיבוד וצביעה של פרוות and dyeing of fur
Manufacture of footwear ייצור נעליים 549 277 272 49.6 406 1520Manufacture of wood, cork and ייצור מוצרי עץ, שעם וקש, 16
straw products, except furniture פרט לרהיטים 2,330 2,295 34 1.5 788
Manufacture of veneer sheets ייצור לוחות פורניר ופנלים מעץ 945 937 8 0.8 1,195 1621
and wood-based panels
Manufacture of products of wood, cork ייצור מוצרי עץ, שעם, קש 1623—1622 straw and plaiting materials 643 1.9 26 1,339 1,364 1629 וחומרים לקליעה
Manufacture of paper and paper 894 9.2 699 6,927 7,627 ייצור נייר ומוצריו 17
products
Printing and reproduction of recorded הדפסה ושכפול של חומר 18
media תקשורתי מוקלט 4,384 4,187 197 4.5 461
Manufacture of petroleum ,ייצור מוצרי נפט 20—19
products, chemicals 3,071 42.3 26,872 36,716 63,588 כימיקלים ומוצריהם and chemical products
Manufacture of pharmaceutical products, 2,247 88.2 29,463 3,924 33,387 ייצור תרופות, כולל תרופות 21
including homeopathic preparations הומאופתיות
Manufacture of rubber and plastic 823 45.5 8,912 10,666 19,578 ייצור מוצרי גומי ופלסטיק 22
products
Manufacture of rubber products ייצור מוצרי גומי 1,047 474 573 54.7 659 2219 ,2211
Manufacture of plastic sleeves and sheets 940 51.5 2,690 2,532 5,222 ייצור שרוולים ויריעות מפלסטיק 2220
Manufacture of plastic plates, tubes and pipes ייצור לוחות וצינורות מפלסטיק 4,595 1,894 2,701 58.8 1,288 2230
Manufacture of plastic containers and bottles 646 5.2 77 1,405 1,482 ייצור מכלים ובקבוקים מפלסטיק 2240
Manufacture of reinforced plastic products ייצור מוצרים מפלסטיק משוריין 317 263 53 16.9 690 2250
Manufacture of plastic kitchenware, ייצור מוצרים מפלסטיק למטבח, 2260
tableware and household products לשולחן ולבית 1,727 705 1,022 59.2 702Manufacture of plastic products for technical, ייצור מוצרים מפלסטיק לשימושים 2270
agricultural and industrial uses טכניים, חקלאיים ותעשייתיים 3,157 1,698 1,459 46.2 628Manufacture of plastic products n.e.c. ייצור מוצרים מפלסטיק לנמ"א 2,031 1,694 337 16.6 716 2280Manufacture of other non-metallic ייצור מוצרים אחרים על בסיס 23
mineral products מינרלים אל-מתכתיים 15,454 13,704 1,750 11.3 1,362
Manufacture of glass and glass products ייצור זכוכית ומוצרים מזכוכית 1,161 949 212 18.2 598 2310
Manufacture of ceramic (refractory) ייצור מוצרי קרמיקה (חסיני אש), 2393—2391
products, clay building materials and other חומרי בנייה מחרס ומוצרים אחרים porcelain and ceramic products מקרמיקה ומחרסינה 454 408 46 10.1 602Manufacture of cement, lime and plaster, ייצור צמנט, סיד, טיח, בטון מוכן 2398—2397, 2394
ready-made concrete, bricks ליציקה ובלוקים 8,547 8,505 41 0.5 2,273Manufacture of articles of concrete, cement ייצור מוצרי בטון, צמנט וטיח 1,521 1,519 2 0.1 768 2395
and plaster
Cutting, shaping and finishing of stone, חיתוך, עיצוב וליטוש של אבנים, 2399 ,2396
manufacture of other non-metallic mineral ייצור מוצרים אחרים ממינרלים products n.e.c. אל-מתכתיים, לנמ"א 3,772 2,323 1,449 38.4 1,298
פדיון (מיליוני ש"ח)Revenue (NIS million)
- 33 -

TABLE 4. REVENUE FROM LOCAL SALES AND EXPORTS, לוח 4. פדיון ממכירות מקומיות ומיצוא, BY INDUSTRY (CLASS) לפי תת-ענף כלכלי (2011 CLASSIFICATION) (Cont.) (סיווג 2011) (המשך)
*2015פדיון אחוזלמשרה היצוא
(אלפי ש"ח) מהפדיון יצוא מכירות סך הכל(מיליוני מקומיות (מיליוני
Industry (ש"ח (מיליוני ש"ח) ענף כלכלי סמל(division and class) ש"ח) (ענף ראשי ותת-ענף) Code
Revenue per Exports, Exports Local Totaljob (NIS as percentage (NIS sales (NIS
thousand) of revenue million) (NIS million)million)
Manufacture of basic metals תעשיית מתכות בסיסיות 9,963 9,468 495 5.0 1,488 24
Manufacture of basic iron and steel ייצור ברזל ופלדה בסיסיים 6,251 6,105 147 2.3 2,491 2410
Manufacture of basic precious and other ייצור מתכות יקרות בסיסיות ומתכות 2420 non-ferrous metals אל-ברזליות אחרות 1,754 1,597 157 9.0 944Casting of metal יציקות מתכת 1,957 1,766 191 9.7 841 2432—2431
Manufacture of fabricated metal ,ייצור מוצרי מתכת בהרכבה 25
products, except machinery and 577 24.7 6,436 19,654 26,090 פרט למכונות ולציוד equipment
Manufacture of structural metal products ייצור שלדי מתכת 6,152 5,842 310 5.0 600 2511
Manufacture of tanks, reservoirs ייצור מכלים וכלי אגירה ממתכת 574 441 133 23.1 737 2512 and containers of metal
Manufacture of weapons and ammunition, ייצור נשק ותחמושת, עיבוד מתכות 2592—2591 ,2520 treatment and coating, forging, pressing, וציפוין, חישול, לחיצה, הטבעה stamping and roll-forming of metal, powder וגלגול של מתכות, מטלורגיית metallurgy, welding workshops and אבקות, מסגריות, עיבוד מכני machining ועיבוד שבבי 10,049 8,736 1,313 13.1 491
Manufacture of hand tools, general hardware ייצור כלי עבודה ידניים, ציוד מכני כללי 2599, 2596, 2593 and cutlery, metal cookingware, וסכו"ם, כלי בישול, מבלטים dies and moulds, other fabricated ותבניות ממתכת, מוצרי מתכת metal products n.e.c. לנמ"א 6,179 1,804 4,374 70.8 726
Manufacture of tin containers and packing ייצור אריזות ומכלים מפח, זיווד 2594 products, electronic packaging and other אלקטרוני ומוצרי פח לנמ"א 2,597 2,340 257 9.9 556 tinware products n.e.c.
Manufacture of wire fencing, cables, wires ייצור רשתות, כבלים, חוטים ותיל, 2595 and wire products from ferrous and ממתכת ברזלית ואל-ברזלית 475 433 42 8.9 976 non-ferrous metals
Manufacture of computers, ייצור מחשבים, מכשור אלקטרוני 26
electronic and optical products ואופטי 82,313 22,534 59,779 72.6 1,190
Manufacture of electronic components ייצור רכיבים ולוחות אלקטרוניים 19,488 3,957 15,531 79.7 1,112 2610 and boards
Manufacture of computers and ייצור מחשבים וציוד היקפי 1,629 265 1,365 83.8 1,246 2621 peripheral equipment
Manufacture of communication equipment ייצור ציוד תקשורת 15,591 4,639 10,952 70.2 1,133 2630
Manufacture of consumer electronics, ייצור מוצרי צריכה אלקטרוניים 2640, 2680 magnetic and optical media ומדיה מגנטית ואופטית 452 48 404 89.4 968
Manufacture of measuring, testing, ייצור מכשירי מדידה, בדיקה, 2651 navigating and control equipment ניווט ובקרה 31,865 11,381 20,484 64.3 1,148
Manufacture of irradiation, electromedical, ייצור ציוד הקרנה, מכשור אלקטרוני 2660 electrotherapeutic and surgical equipment רפואי, מכשור אלקטרוני טיפולי
ומכשור רפואי כירורגי 10,152 835 9,316 91.8 1,847
Manufacture of optical instruments and ייצור מכשור אופטי וציוד צילום 3,137 1,410 1,727 55.1 1,098 2670
photographic equipment
פדיון (מיליוני ש"ח)Revenue (NIS million)
- 34 -
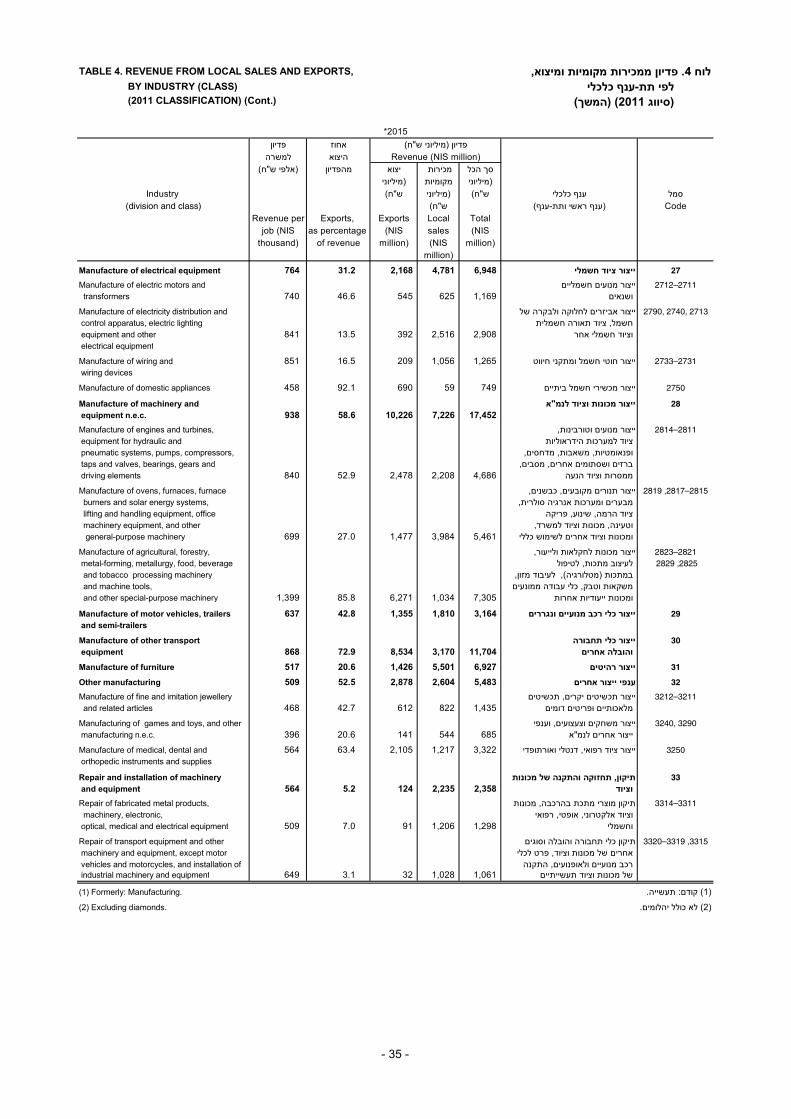
TABLE 4. REVENUE FROM LOCAL SALES AND EXPORTS, לוח 4. פדיון ממכירות מקומיות ומיצוא, BY INDUSTRY (CLASS) לפי תת-ענף כלכלי (2011 CLASSIFICATION) (Cont.) (סיווג 2011) (המשך)
*2015פדיון אחוזלמשרה היצוא
(אלפי ש"ח) מהפדיון יצוא מכירות סך הכל(מיליוני מקומיות (מיליוני
Industry (ש"ח (מיליוני ש"ח) ענף כלכלי סמל(division and class) ש"ח) (ענף ראשי ותת-ענף) Code
Revenue per Exports, Exports Local Totaljob (NIS as percentage (NIS sales (NIS
thousand) of revenue million) (NIS million)million)
Manufacture of electrical equipment ייצור ציוד חשמלי 6,948 4,781 2,168 31.2 764 27
Manufacture of electric motors and ייצור מנועים חשמליים 2712—2711 transformers ושנאים 1,169 625 545 46.6 740
Manufacture of electricity distribution and ייצור אביזרים לחלוקה ולבקרה של 2790, 2740, 2713 control apparatus, electric lighting חשמל, ציוד תאורה חשמלית equipment and other 841 13.5 392 2,516 2,908 וציוד חשמלי אחר electrical equipment
Manufacture of wiring and ייצור חוטי חשמל ומתקני חיווט 1,265 1,056 209 16.5 851 2733—2731 wiring devices
Manufacture of domestic appliances ייצור מכשירי חשמל ביתיים 749 59 690 92.1 458 2750
Manufacture of machinery and ייצור מכונות וציוד לנמ"א 28
equipment n.e.c. 938 58.6 10,226 7,226 17,452
Manufacture of engines and turbines, ,ייצור מנועים וטורבינות 2814—2811 equipment for hydraulic and ציוד למערכות הידראוליות pneumatic systems, pumps, compressors, ופנאומטיות, משאבות, מדחסים, taps and valves, bearings, gears and ברזים ושסתומים אחרים, מסבים, driving elements ממסרות וציוד הנעה 4,686 2,208 2,478 52.9 840
Manufacture of ovens, furnaces, furnace ייצור תנורים מקובעים, כבשנים, 2819 ,2817—2815 burners and solar energy systems, ,מבערים ומערכות אנרגיה סולרית lifting and handling equipment, office ציוד הרמה, שינוע, פריקה machinery equipment, and other ,וטעינה, מכונות וציוד למשרד general-purpose machinery ומכונות וציוד אחרים לשימוש כללי 5,461 3,984 1,477 27.0 699
Manufacture of agricultural, forestry, ייצור מכונות לחקלאות ולייעור, 2823—2821 metal-forming, metallurgy, food, beverage 2825, 2829 לעיצוב מתכות, לטיפול and tobacco processing machinery במתכות (מטלורגיה), לעיבוד מזון, and machine tools, משקאות וטבק, כלי עבודה ממונעים and other special-purpose machinery ומכונות ייעודיות אחרות 7,305 1,034 6,271 85.8 1,399
Manufacture of motor vehicles, trailers 637 42.8 1,355 1,810 3,164 ייצור כלי רכב מנועיים ונגררים 29
and semi-trailers
Manufacture of other transport ייצור כלי תחבורה 30
equipment והובלה אחרים 11,704 3,170 8,534 72.9 868
Manufacture of furniture ייצור רהיטים 6,927 5,501 1,426 20.6 517 31
Other manufacturing ענפי ייצור אחרים 5,483 2,604 2,878 52.5 509 32
Manufacture of fine and imitation jewellery ייצור תכשיטים יקרים, תכשיטים 3212—3211 and related articles מלאכותיים ופריטים דומים 1,435 822 612 42.7 468
Manufacturing of games and toys, and other ייצור משחקים וצעצועים, וענפי 3240, 3290 manufacturing n.e.c. ייצור אחרים לנמ"א 685 544 141 20.6 396
Manufacture of medical, dental and ייצור ציוד רפואי, דנטלי ואורתופדי 3,322 1,217 2,105 63.4 564 3250 orthopedic instruments and supplies
Repair and installation of machinery תיקון, תחזוקה והתקנה של מכונות 33
and equipment וציוד 2,358 2,235 124 5.2 564
Repair of fabricated metal products, תיקון מוצרי מתכת בהרכבה, מכונות 3314—3311 machinery, electronic, וציוד אלקטרוני, אופטי, רפואי optical, medical and electrical equipment וחשמלי 1,298 1,206 91 7.0 509
Repair of transport equipment and other תיקון כלי תחבורה והובלה וסוגים 3320—3319 ,3315 machinery and equipment, except motor אחרים של מכונות וציוד, פרט לכלי vehicles and motorcycles, and installation of רכב מנועיים ולאופנועים, התקנה industrial machinery and equipment של מכונות וציוד תעשייתיים 1,061 1,028 32 3.1 649
(1) Formerly: Manufacturing. (1) קודם: תעשייה.
(2) Excluding diamonds. (2) לא כולל יהלומים.
פדיון (מיליוני ש"ח)Revenue (NIS million)
- 35 -
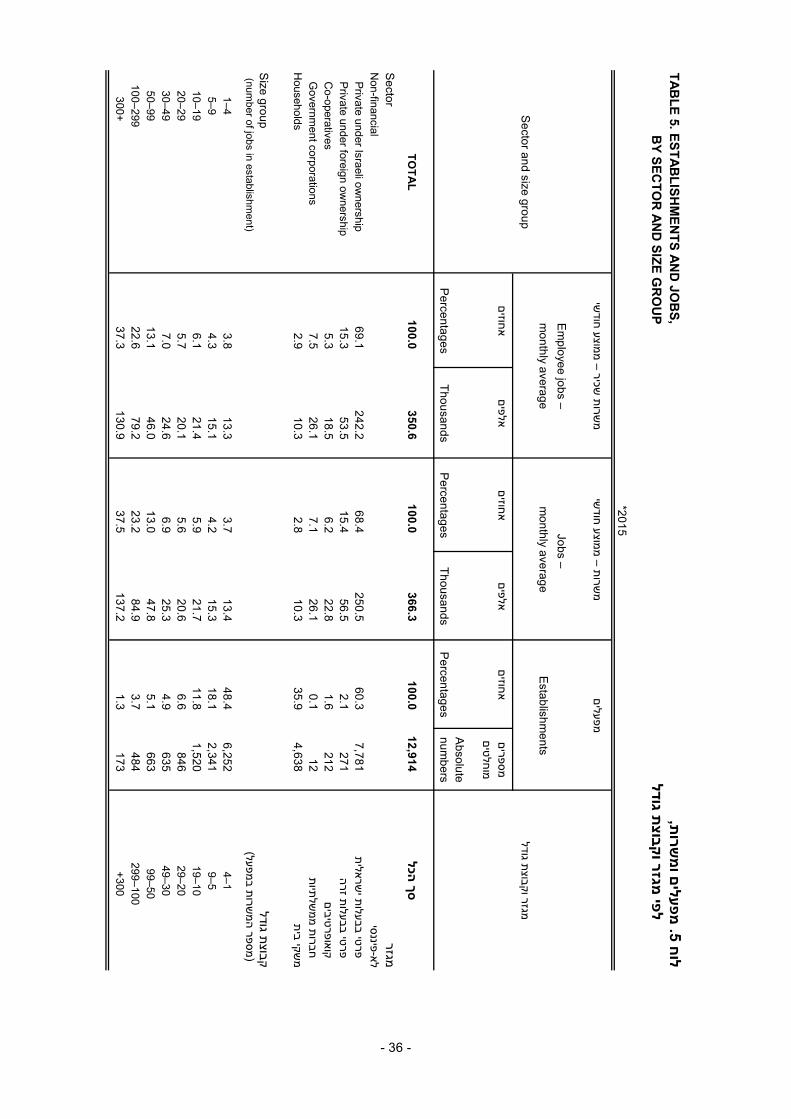
TA
BL
E 5. E
ST
AB
LIS
HM
EN
TS
AN
D JO
BS
,ת,שרו
מם ופעלי
מח 5.
לו B
Y S
EC
TO
R A
ND
SIZ
E G
RO
UP
ת גודלבוצ
קמגזר ו
פי ל
*2015
שישכיר – ממוצע חוד
שרות מ
שישרות – ממוצע חוד
ממפעלים
Em
ployee jobs – Jobs –
monthly average
monthly average
Establishm
entsS
ector and size groupמגזר וקבוצת גודל
אחוזיםאלפים
אחוזיםאלפים
אחוזיםמספריםמוחלטים
Absolute
Percentages
ThousandsP
ercentagesThousands
Percentages
numbers
TO
TA
L1
00
.0
35
0.6
1
00
.0
36
6.3
1
00
.0
12
,91
4
הכלסך
Sector
מגזרN
on-financialלא-פיננסי
Private under Israeli ow
nership69.1
242.2 68.4
250.5 60.3
7,781 שראלית
פרטי בבעלות י P
rivate under foreign ownership
15.3 53.5
15.4 56.5
2.1 271
פרטי בבעלות זרה C
o-operatives5.3
18.5 6.2
22.8 1.6
212 קואופרטיבים
Governm
ent corporations7.5
26.1 7.1
26.1 0.1
12 שלתיות
חברות ממH
ouseholds2.9
10.3 2.8
10.3 35.9
4,638 שקי בית
מ
Size group
קבוצת גודל (num
ber of jobs in establishment)
שרות במפעל) (מספר המ
1–43.8
13.3 3.7
13.4 48.4
6,252 4–1
5–9 4.3
15.1 4.2
15.3 18.1
2,341 9–5
10–196.1
21.4 5.9
21.7 11.8
1,520 19–10
20–29 5.7
20.1 5.6
20.6 6.6
846 29–20
30–497.0
24.6 6.9
25.3 4.9
635 49–30
50–99 13.1
46.0 13.0
47.8 5.1
663 99–50
100–29922.6
79.2 23.2
84.9 3.7
484 299–100
300+37.3
130.9 37.5
137.2 1.3
173 +300
- 36 -

TA
BL
E 6
. RE
VE
NU
E, L
AB
OU
R C
OS
T A
ND
WA
GE
S,
שכר,ה ובוד
ת עפדיון, עלו
ח 6. לו
BY
SE
CT
OR
AN
D S
IZE
GR
OU
Pת גודל
בוצקמגזר ו
פי ל
*2015 Labour cost and w
agesשכר
R עלות עבודה וevenue
פדיון
שנתישכר
שכר –הוצאות נלוות
עלותעלות עבודה –
שרהלמ
מזה: יצוא סך הכל
שכירשרת
למסך הכל
שכר,ל
שעת עבודהל
סך הכלש"ח)
(אלפי Thereof: Exports
(מיליוני
ש"ח)(אלפי
ש"ח)(2)(מיליוני
כאחוז ממנושלום
בת(מיליוני
אחוזיםמיליוני
ש"ח)
Sector and size groupש"ח)(1)
)ש"ח)(1)
ש"חמגזר וקבוצת גודל
Supplementary
Cost
Labour cost –
Annual wages
Wages –
expenditures forper paid
totalTotal
per em
ployee jobtotal
wages, as per-
work hour
(NIS
Per job (NIS
NIS
(NIS
(NIS thousand)
(NIS m
illion)(2)centage of them
(NIS)(1)
million)(1)
thousand)Percentages
million
million)
TO
TA
L157
54,892 20.8
85 66,332
1,118
42.1 172,428
409,500 הכל
סך
Sectorמגזר
Non-financial
לא-פיננסי Private under Israeli ow
nership139
33,769 19.4
75 40,324
1,048
35.4 93,014
262,389 שראלית
פרטי בבעלות י Private under foreign ow
nership201
10,737 20.9
107 12,984
1,613
61.0 55,682
91,213 פרטי בבעלות זרה
Co-operatives
128 2,376
20.6 71
2,866 1,001
33.1
7,555 22,804
קואופרטיבים G
overnment corporations
282 7,371
27.4 146
9,393 1,121
55.1
16,137 29,303
שלתיות חברות ממ
Households
62 639
19.9 35
767 367
1.0
40 3,792
שקי ביתמ
Size groupקבוצת גודל
(number of jobs in establishm
ent)שרות במפעל)
(מספר המ
1–4
82 1,097
20.4 47
1,321 518
4.8
335 6,944
4–15–9
95 1,432
21.8 53
1,744 497
7.9
600 7,581
9–510–19
104 2,236
17.9 57
2,637 532
7.2
834 11,564
19–1020–29
108 2,170
16.5 58
2,527 601
10.9
1,354 12,379
29–2030–49
113 2,778
17.2 61
3,255 771
17.5
3,411 19,540
49–3050–99
129 5,909
17.3 68
6,932 775
19.9
7,382 37,002
99–50100–299
146 11,601
19.6 78
13,878 1,102
32.5
30,357 93,529
299–100300+
211 27,670
23.0 113
34,039 1,610
58.0
128,156 220,961
+300
(1) Including wages, non-recurrent paym
ents, back pay for previous periods,שים לתקופות קודמות,
שלומים חד-פעמיים, הפרשכר, ת
(1) כולל supplem
entary expenditures and other cost components.
הוצאות נלוות ומרכיבי עלות נוספים.(2) Including non-recurrent paym
ents and back pay for previous periods.שים לתקופות קודמות.
שלומים חד-פעמיים והפר(2) כולל ת
- 37 -

TA
BL
E 7. E
ST
AB
LIS
HM
EN
TS
AN
D JO
BS
, BY
DIS
TR
ICT
חוזמ
פי ת, ל
שרומם ו
פעלימ
.7ח לו
*2015שישכיר – ממוצע חוד
שרות מ
שישרות – ממוצע חוד
ממפעלים
Em
ployee jobs –Jobs –
District
monthly average
monthly average
Establishm
entsמחוז
אחוזיםאלפים
אחוזיםאלפים
אחוזיםמספריםמוחלטים
Absolute
Percentages
ThousandsP
ercentagesThousands
Percentages
numbers
TO
TA
L1
00
.0
35
0.6
1
00
.0
36
6.3
1
00
.0
12
,91
3
הכלסך
Thereof:מזה:
Jerusalem D
istrict5.2
18.4 5.2
19.0 9.4
1,217 שלים
מחוז ירו
Northern D
istrict20.6
72.3 20.9
76.7 20.8
2,684 מחוז הצפון
Haifa D
istrict14.8
52.0 14.7
54.0 11.6
1,502 מחוז חיפה
Central D
istrict25.8
90.5 25.6
93.8 24.7
3,189 מחוז המרכז
Tel Aviv D
istrict16.2
56.7 16.0
58.7 23.2
3,000 מחוז תל אביב
Southern D
istrict15.2
53.1 15.5
56.7 8.0
1,038 מחוז הדרום
- 38 -
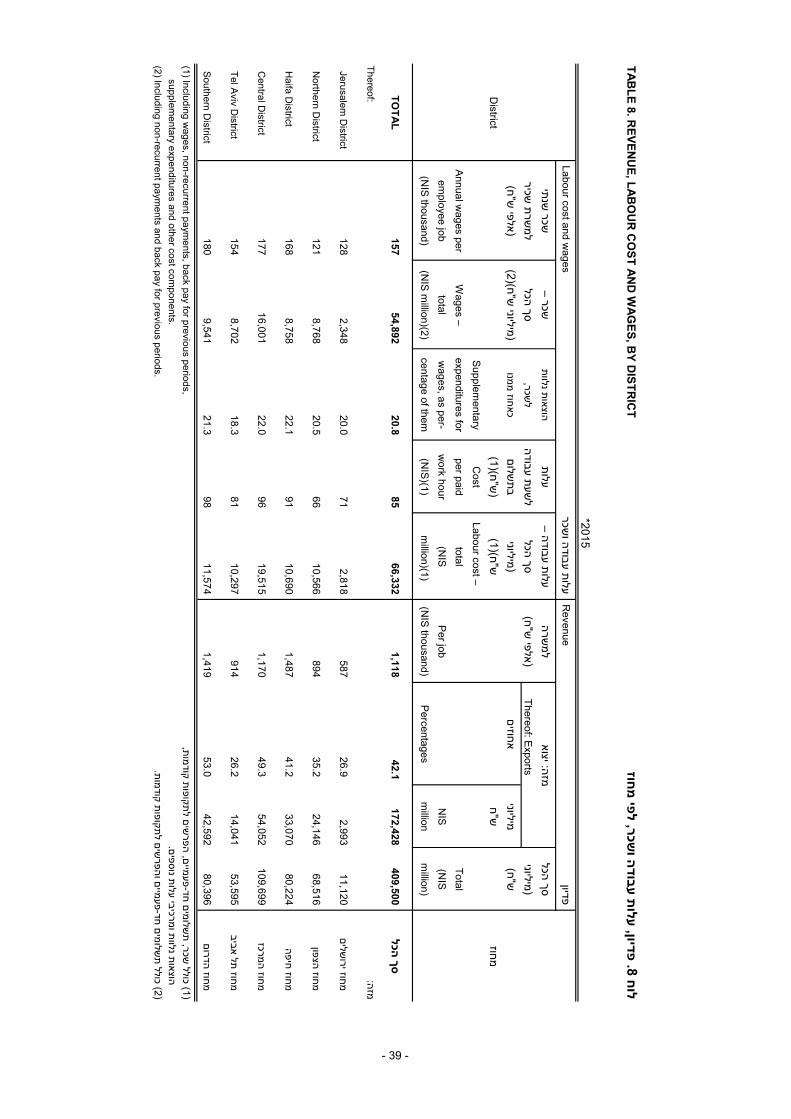
TA
BL
E 8. R
EV
EN
UE
, LA
BO
UR
CO
ST
AN
D W
AG
ES
, BY
DIS
TR
ICT
חוזמ
פי שכר, ל
ה ובוד
ת עפדיון, עלו
ח 8. לו
*2015 Labour cost and w
agesשכר
עלות עבודה ו R
evenue פדיון
שנתישכר
שכר –הוצאות נלוות
עלותעלות עבודה –
שרהלמ
מזה: יצואסך הכל
שכירשרת
למסך הכל
שכר,ל
שעת עבודהל
סך הכלש"ח)
(אלפי Thereof: Exports
(מיליוניש"ח)
(אלפי ש"ח)(2)
(מיליוני כאחוז ממנו
שלוםבת
(מיליוניאחוזים
מיליוניש"ח)
District
ש"ח)(1))
ש"ח)(1)ש"ח
מחוזSupplem
entaryC
ostLabour cost –
Annual w
ages perW
ages –expenditures for
per paidtotal
Totalem
ployee jobtotal
wages, as per-
work hour
(NIS
Per jobN
IS(N
IS
(NIS thousand)
(NIS m
illion)(2)centage of them
(NIS)(1)
million)(1)
(NIS thousand)
Percentagesm
illionm
illion)
TO
TA
L157
54,892 20.8
85 66,332
1,118 42.1
172,428409,500
הכלסך
Thereof:מזה:
Jerusalem D
istrict128
2,348 20.0
71 2,818
587 26.9
2,99311,120
שלים מחוז ירו
Northern D
istrict121
8,768 20.5
66 10,566
894 35.2
24,14668,516
מחוז הצפון
Haifa D
istrict168
8,758 22.1
91 10,690
1,487 41.2
33,07080,224
מחוז חיפה
Central D
istrict177
16,001 22.0
96 19,515
1,170 49.3
54,052109,699
מחוז המרכז
Tel Aviv D
istrict154
8,702 18.3
81 10,297
914 26.2
14,04153,595
מחוז תל אביב
Southern D
istrict180
9,541 21.3
98 11,574
1,419 53.0
42,59280,396
מחוז הדרום
(1) Including wages, non-recurrent paym
ents, back pay for previous periods,שים לתקופות קודמות,
שלומים חד-פעמיים, הפרשכר, ת
(1) כולל supplem
entary expenditures and other cost components.
הוצאות נלוות ומרכיבי עלות נוספים.(2) Including non-recurrent paym
ents and back pay for previous periods.שים לתקופות קודמות.
שלומים חד-פעמיים והפר(2) כולל ת
- 39 -

TA
BL
E 9. E
ST
AB
LIS
HM
EN
TS
, JOB
S A
ND
RE
VE
NU
E,
פדיון,ת ו
שרומ
ם, פעלי
מח 9.
לו B
Y IN
DU
ST
RY
(DIV
ISIO
N) (2011 C
LA
SS
IFIC
AT
ION
) סיווג 2011)
שי (אף כלכלי ר
פי ענ ל
AN
D S
IZE
GR
OU
P O
F R
EV
EN
UE
פדיוןה
ת גודל בוצ
ק ו
פדיוןשישרות – ממוצע חוד
ממפעלים
Industry (division) andR
evenue Jobs –
שיענף כלכלי רא
size group of revenuem
onthly averageEstablishm
ents וקבוצת גודל הפדיון
Code
(annual revenue of establishment,
של מפעל, שנתי
(פדיון סמל
NIS m
illion)אחוזים
ש"ח מיליוני
אחוזיםאלפים
אחוזיםמספרים
ש"ח)מיליוני
מוחלטיםAbsolute
Percentages
NIS m
illionPercentages
ThousandsPercentages
numbers
B–C
MA
NU
FA
CT
UR
ING
; MIN
ING
הה; כריי
שייתע
B–C
AN
D Q
UA
RR
YIN
G(1)(2) – G
RA
ND
TO
TA
L100.0
409,500 100.0
366.3 100.0
12,913 סך כולל
– (2
)(1ה(בחצי
וU
p to 4.993.1
12,491 13.5
49.4 70.2
9,059 עד 4.99
5–9.992.2
8,878 5.4
19.6 9.5
1,226 9.99–5
10–24.994.4
17,815 9.8
35.9 8.6
1,114 24.99–10
25–49.994.8
19,635 9.6
35.2 4.4
566 49.99–25
50–99.996.7
27,408 9.7
35.7 3.1
399 99.99–50
100+78.9
323,273 52.0
190.6 4.3
549 +100
B M
ININ
G A
ND
QU
AR
RY
ING
– TO
TA
L100.0
14,663 100.0
4.2 100.0
108 הכל
סך –
ה בחצי
ה וכריי
B
Up to 4.99
0.6 81
8.2 0.3
66.7 72
עד 4.995–9.99
0.5 80
4.0 0.2
9.3 10
9.99–510–24.99
0.4 58
1.3 0.1
3.7 4
24.99–1025–49.99
1.1 159
1.7 0.1
4.6 5
49.99–2550–99.99
2.6 376
5.8 0.2
4.6 5
99.99–50100+
94.9 13,910
78.9 3.3
11.1 12
+100
C M
AN
UF
AC
TU
RIN
G(2)– T
OT
AL
100.0 394,837
100.0 362.1
100.0 12,806
הכלסך
– (2
ה(שיי
תעC
Up to 4.99
3.1 12,410
13.5 49.0
70.2 8,987
עד 4.995–9.99
2.2 8,798
5.4 19.4
9.5 1,217
9.99–510–24.99
4.5 17,757
9.9 35.8
8.7 1,110
24.99–1025–49.99
4.9 19,476
9.7 35.1
4.4 561
49.99–2550–99.99
6.8 27,032
9.8 35.4
3.1 394
99.99–50100+
78.4 309,364
51.7 187.3
4.2 537
+100
*2015
- 40 -

TA
BL
E 9. E
ST
AB
LIS
HM
EN
TS
, JOB
S A
ND
RE
VE
NU
E,
פדיון,ת ו
שרומ
ם, פעלי
מח 9.
לו B
Y IN
DU
ST
RY
(DIV
ISIO
N) (2011 C
LA
SS
IFIC
AT
ION
)סיווג 2011)
שי (אף כלכלי ר
פי ענ ל
AN
D S
IZE
GR
OU
P O
F R
EV
EN
UE
(Co
nt.)
שך)מה
פדיון (ה
ת גודל בוצ
ק ו
*2015פדיון
שישרות – ממוצע חוד
ממפעלים
Industry (division) andR
evenue Jobs –
שיענף כלכלי רא
size group of revenuem
onthly averageEstablishm
ents וקבוצת גודל הפדיון
Code
(annual revenue of establishment,
של מפעל, שנתי
(פדיון סמל
NIS m
illion)אחוזים
ש"ח מיליוני
אחוזיםאלפים
אחוזיםמספרים
ש"ח)מיליוני
מוחלטיםAbsolute
PercentagesN
IS million
PercentagesThousands
Percentagesnum
bers
10 M
anu
facture o
f foo
d p
rod
ucts
100.0 60,312
100.0 57.6
100.0 1,858
מזוןמוצרי
ייצור 10
Up to 4.99
2.6 1,588
14.6 8.4
62.1 1,154
עד 4.995–9.99
2.7 1,635
6.1 3.5
12.8 237
9.99–510–24.99
5.4 3,247
12.8 7.4
11.0 205
24.99–1025–49.99
4.0 2,383
8.5 4.9
3.6 67
49.99–2550–99.99
9.3 5,615
11.0 6.3
4.6 85
99.99–50100+
76.0 45,844
47.0 27.1
5.9 110
+100
11–12 M
anu
facture o
f beverag
es
and
tob
acco p
rod
ucts
100.0 8,065
100.0 5.7
100.0 134
קבט
מוצרי ת ו
אוקשמ
ייצור 12–11
Up to 4.99
1.6 129
6.3 0.4
61.9 83
עד 4.995–9.99
1.3 108
4.6 0.3
10.4 14
9.99–510–24.99
3.0 242
7.2 0.4
11.2 15
24.99–1025–49.99
2.5 200
3.4 0.2
4.5 6
49.99–2550–99.99
3.4 275
6.0 0.3
3.0 4
99.99–50100+
88.2 7,109
72.4 4.1
9.0 12
+100
13 M
anu
facture o
f textiles100.0
3,912 100.0
3.8 100.0
279 טיל
סקט
ייצור 13
Up to 4.99
6.6 260
23.8 0.9
77.8 217
עד 4.995–9.99
2.9 114
5.5 0.2
5.0 14
9.99–510–24.99
9.4 369
17.1 0.7
8.2 23
24.99–1025–49.99
8.0 314
12.4 0.5
3.6 10
49.99–2550–99.99
11.1 435
11.7 0.4
2.5 7
99.99–50100+
61.9 2,420
29.6 1.1
2.9 8
+100
- 41 -

TA
BL
E 9. E
ST
AB
LIS
HM
EN
TS
, JOB
S A
ND
RE
VE
NU
E,
פדיון,ת ו
שרומ
ם, פעלי
מח 9.
לו B
Y IN
DU
ST
RY
(DIV
ISIO
N) (2011 C
LA
SS
IFIC
AT
ION
)סיווג 2011)
שי (אף כלכלי ר
פי ענ ל
AN
D S
IZE
GR
OU
P O
F R
EV
EN
UE
(Co
nt.)
שך)מה
פדיון (ה
ת גודל בוצ
ק ו
*2015פדיון
שישרות – ממוצע חוד
ממפעלים
Industry (division) andR
evenue Jobs –
שיענף כלכלי רא
size group of revenuem
onthly averageEstablishm
ents וקבוצת גודל הפדיון
Code
(annual revenue of establishment,
של מפעל, שנתי
(פדיון סמל
NIS m
illion)אחוזים
ש"ח מיליוני
אחוזיםאלפים
אחוזיםמספרים
ש"ח)מיליוני
מוחלטיםAbsolute
PercentagesN
IS million
PercentagesThousands
Percentagesnum
bers
14 M
anu
facture o
f wearin
g ap
parel
100.0 3,035
100.0 5.9
100.0 537
השבהל
מוצרי ייצור
14
Up to 4.99
17.5 530
41.3 2.5
84.9 456
עד 4.995–9.99
10.5 319
12.8 0.8
8.8 47
9.99–510–24.99
10.4 317
11.3 0.7
4.1 22
24.99–1025–49.99
7.2 219
6.9 0.4
1.3 7
49.99–25100+
54.4 1,650
27.6 1.6
0.9 5
+100
15 M
anu
facture an
d p
rocessin
g o
f leather
מוצרי עורשל
בוד ייצור ועי
15
and
related p
rod
ucts
100.0 764
100.0 1.8
100.0 115
םם נלווי
ביזריא
של ו
Up to 4.99
24.7 188
33.6 0.6
90.4 104
עד 4.995–24.99
8.8 67
6.1 0.1
4.3 5
24.99–525+
66.5 508
60.2 1.1
5.2 6
+25
16 M
anu
facture o
f wo
od
, cork an
d straw
ש,קם ושע
מוצרי עץ, ייצור
16
pro
du
cts, except fu
rnitu
re100.0
2,330 100.0
3.0 100.0
193 םטיהיט לר
פר
Up to 4.99
9.2 214
15.8 0.5
67.4 130
עד 4.995–9.99
6.1 142
9.8 0.3
10.9 21
9.99–510–24.99
19.1 446
23.9 0.7
16.1 31
24.99–1025–99.99
9.6 224
10.8 0.3
2.6 5
99.99–25100+
56.0 1,304
39.7 1.2
3.1 6
+100
- 42 -

TA
BL
E 9. E
ST
AB
LIS
HM
EN
TS
, JOB
S A
ND
RE
VE
NU
E,
פדיון,ת ו
שרומ
ם, פעלי
מח 9.
לו B
Y IN
DU
ST
RY
(DIV
ISIO
N) (2011 C
LA
SS
IFIC
AT
ION
)סיווג 2011)
שי (אף כלכלי ר
פי ענ ל
AN
D S
IZE
GR
OU
P O
F R
EV
EN
UE
(Co
nt.)
שך)מה
פדיון (ה
ת גודל בוצ
ק ו
*2015פדיון
שישרות – ממוצע חוד
ממפעלים
Industry (division) andR
evenue Jobs –
שיענף כלכלי רא
size group of revenuem
onthly averageEstablishm
ents וקבוצת גודל הפדיון
Code
(annual revenue of establishment,
של מפעל, שנתי
(פדיון סמל
NIS m
illion)אחוזים
ש"ח מיליוני
אחוזיםאלפים
אחוזיםמספרים
ש"ח)מיליוני
מוחלטיםA
bsolutePercentages
NIS m
illionPercentages
ThousandsPercentages
numbers
17 M
anu
facture o
f pap
er and
pap
er pro
du
cts100.0
7,627 100.0
8.5 100.0
168 מוצריו
ייצור נייר ו17
Up to 4.99
0.9 70
6.8 0.6
36.9 62
עד 4.995–9.99
3.1 238
5.3 0.5
19.0 32
9.99–510–24.99
6.8 519
11.3 1.0
18.5 31
24.99–1025–49.99
8.2 629
11.1 0.9
10.7 18
49.99–2550–99.99
12.1 923
14.3 1.2
7.7 13
99.99–50100+
68.8 5,247
51.2 4.4
7.1 12
+100
18 P
rintin
g an
d rep
rod
uctio
n o
fמרחו
של פול
שכה וספהד
18 reco
rded
med
ia100.0
4,384 100.0
9.5 100.0
936 טקלמו
תי שור
קת
Up to 4.99
25.3 1,110
38.7 3.7
83.9 785
עד 4.995–9.99
10.0 439
11.9 1.1
7.4 69
9.99–510–24.99
16.1 706
15.7 1.5
5.1 48
24.99–1025–49.99
14.1 617
13.7 1.3
2.0 19
49.99–2550–99.99
13.5 590
9.2 0.9
1.0 9
99.99–50100+
21.0 922
10.8 1.0
0.6 6
+100
19–20 M
anu
facture o
f pe
trole
um
pro
du
cts
,םקלי
מיט, כי
פמוצרי נ
ייצור 20–19
chem
icals and
chem
ical pro
du
cts100.0
63,588 100.0
20.7 100.0
284 םהמוצרי
ו
Up to 4.99
0.3 170
5.3 1.1
35.2 100
עד 4.995–9.99
0.6 361
2.8 0.6
17.6 50
9.99–510–24.99
0.6 398
2.7 0.6
7.4 21
24.99–1025–49.99
2.1 1,344
11.3 2.3
15.1 43
49.99–2550–99.99
1.6 1,043
4.8 1.0
4.6 13
99.99–50100+
94.8 60,271
73.1 15.1
20.1 57
+100
- 43 -
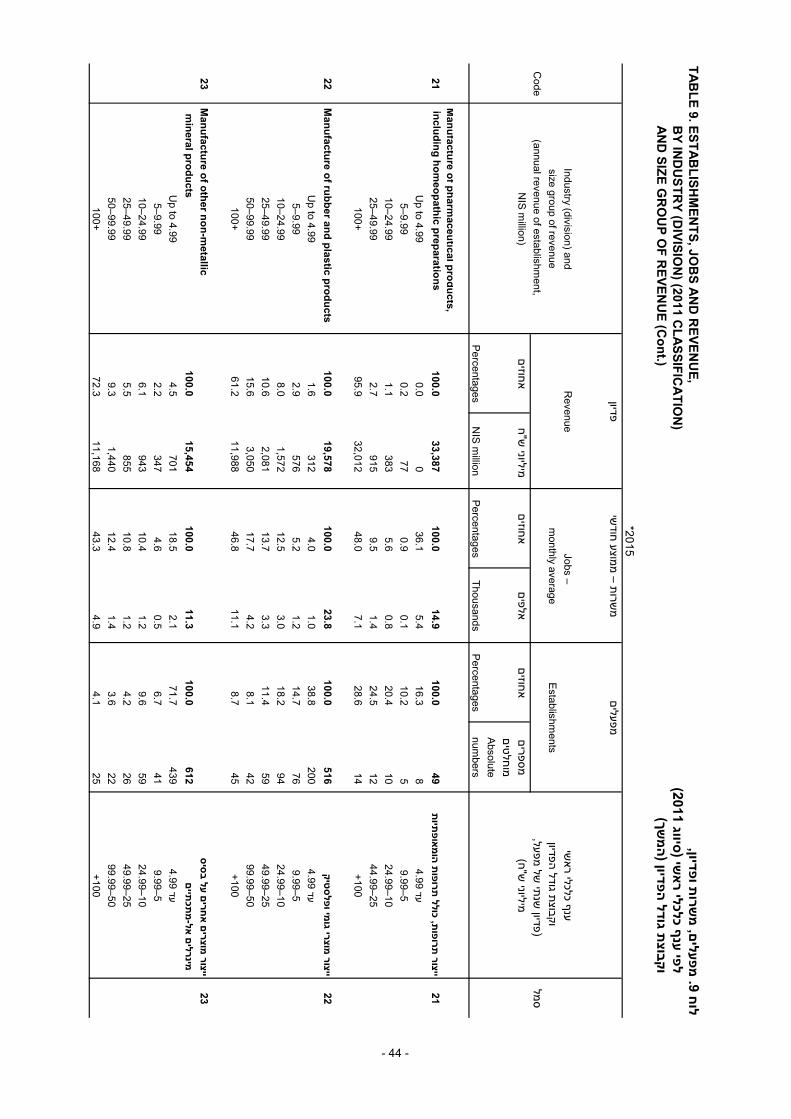
TA
BL
E 9. E
ST
AB
LIS
HM
EN
TS
, JOB
S A
ND
RE
VE
NU
E,
פדיון,ת ו
שרומ
ם, פעלי
מח 9.
לו B
Y IN
DU
ST
RY
(DIV
ISIO
N) (2011 C
LA
SS
IFIC
AT
ION
)סיווג 2011)
שי (אף כלכלי ר
פי ענ ל
AN
D S
IZE
GR
OU
P O
F R
EV
EN
UE
(Co
nt.)
שך)מה
פדיון (ה
ת גודל בוצ
ק ו
*2015פדיון
שישרות – ממוצע חוד
ממפעלים
Industry (division) andR
evenue Jobs –
שיענף כלכלי רא
size group of revenuem
onthly averageEstablishm
ents וקבוצת גודל הפדיון
Code
(annual revenue of establishment,
של מפעל, שנתי
(פדיון סמל
NIS m
illion)אחוזים
ש"ח מיליוני
אחוזיםאלפים
אחוזיםמספרים
ש"ח)מיליוני
מוחלטיםAbsolute
PercentagesN
IS million
PercentagesThousands
Percentagesnum
bers
21
Man
ufactu
re of p
harm
aceutical p
rod
ucts,
inclu
din
g h
om
eop
athic p
reparatio
ns
100.0 33,387
100.0 14.9
100.0 49
תתיו
פאומהו
ת פותרו
ת, כולל פותרו
ייצור 21
Up to 4.99
0.0 0
36.1 5.4
16.3 8
עד 4.995–9.99
0.2 77
0.9 0.1
10.2 5
9.99–510–24.99
1.1 383
5.6 0.8
20.4 10
24.99–1025–49.99
2.7 915
9.5 1.4
24.5 12
44.99–25100+
95.9 32,012
48.0 7.1
28.6 14
+100
22 M
anu
facture o
f rub
ber an
d p
lastic pro
du
cts100.0
19,578 100.0
23.8 100.0
516 ק טיספלמי ו
מוצרי גוייצור
22
Up to 4.99
1.6 312
4.0 1.0
38.8 200
עד 4.995–9.99
2.9 576
5.2 1.2
14.7 76
9.99–510–24.99
8.0 1,572
12.5 3.0
18.2 94
24.99–1025–49.99
10.6 2,081
13.7 3.3
11.4 59
49.99–2550–99.99
15.6 3,050
17.7 4.2
8.1 42
99.99–50100+
61.2 11,988
46.8 11.1
8.7 45
+100
23 M
anu
facture o
f oth
er no
n-m
etallicססיב
ם על חרי
אם מוצרי
ייצור 23
min
eral pro
du
cts100.0
15,454 100.0
11.3 100.0
612 םתיי
תכמ
אל-ם מינרלי
Up to 4.99
4.5 701
18.5 2.1
71.7 439
עד 4.995–9.99
2.2 347
4.6 0.5
6.7 41
9.99–510–24.99
6.1 943
10.4 1.2
9.6 59
24.99–1025–49.99
5.5 855
10.8 1.2
4.2 26
49.99–2550–99.99
9.3 1,440
12.4 1.4
3.6 22
99.99–50100+
72.3 11,168
43.3 4.9
4.1 25
+100
- 44 -

TA
BL
E 9. E
ST
AB
LIS
HM
EN
TS
, JOB
S A
ND
RE
VE
NU
E,
פדיון,ת ו
שרומ
ם, פעלי
מח 9.
לו B
Y IN
DU
ST
RY
(DIV
ISIO
N) (2011 C
LA
SS
IFIC
AT
ION
)סיווג 2011)
שי (אף כלכלי ר
פי ענ ל
AN
D S
IZE
GR
OU
P O
F R
EV
EN
UE
(Co
nt.)
שך)מה
פדיון (ה
ת גודל בוצ
ק ו
*2015פדיון
שישרות – ממוצע חוד
ממפעלים
Industry (division) andR
evenue Jobs –
שיענף כלכלי רא
size group of revenuem
onthly averageEstablishm
ents וקבוצת גודל הפדיון
Code
(annual revenue of establishment,
של מפעל, שנתי
(פדיון סמל
NIS m
illion)אחוזים
ש"ח מיליוני
אחוזיםאלפים
אחוזיםמספרים
ש"ח)מיליוני
מוחלטיםAbsolute
PercentagesN
IS million
PercentagesThousands
Percentagesnum
bers
24 M
anu
facture o
f basic m
etals100.0
9,963 100.0
6.7 100.0
243 תסיוסיב
ת תכו
מת שיי
תע24
Up to 4.99
2.6 260
12.6 0.8
66.3 161
עד 4.995–9.99
2.3 231
5.9 0.4
11.5 28
9.99–510–24.99
2.4 240
5.7 0.4
6.6 16
24.99–1025–49.99
3.0 300
4.7 0.3
3.3 8
49.99–2550–99.99
3.9 385
9.2 0.6
2.5 6
99.99–50100+
85.8 8,545
61.9 4.1
9.9 24
+100
25 M
anu
facture o
f fabricated
metal p
rod
ucts,
ה,בהרכ
בת תכ
ממוצרי
ייצור 25
except m
achin
ery and
equ
ipm
ent
100.0 26,090
100.0 45.2
100.0 2,412
ת ולציודמכונו
ט לפר
Up to 4.99
10.0 2,605
16.4 7.4
71.4 1,722
עד 4.995–9.99
7.9 2,070
11.5 5.2
11.7 282
9.99–510–24.99
13.8 3,594
17.0 7.7
9.2 221
24.99–1025–49.99
12.2 3,183
13.7 6.2
3.8 92
49.99–2550–99.99
14.3 3,744
12.0 5.4
2.3 56
99.99–50100+
41.8 10,894
29.5 13.4
1.6 39
+100
26 M
anu
facture o
f com
pu
ters, electron
icשור
מכם, בישחמ
ייצור 26
and
op
tical pro
du
cts100.0
82,313 100.0
69.2 100.0
500 טיפאוטרוני ו
קאל
Up to 4.99
0.4 319
3.5 2.4
40.6 203
עד 4.995–9.99
0.4 316
1.0 0.7
9.4 47
9.99–510–24.99
1.1 909
2.7 1.9
10.6 53
24.99–1025–49.99
2.6 2,118
7.0 4.8
12.0 60
49.99–2550–99.99
4.0 3,271
5.4 3.7
9.6 48
99.99–50100+
91.6 75,380
80.5 55.7
17.8 89
+100
- 45 -

TA
BL
E 9. E
ST
AB
LIS
HM
EN
TS
, JOB
S A
ND
RE
VE
NU
E,
פדיון,ת ו
שרומ
ם, פעלי
מח 9.
לו B
Y IN
DU
ST
RY
(DIV
ISIO
N) (2011 C
LA
SS
IFIC
AT
ION
)סיווג 2011)
שי (אף כלכלי ר
פי ענ ל
AN
D S
IZE
GR
OU
P O
F R
EV
EN
UE
(Co
nt.)
שך)מה
פדיון (ה
ת גודל בוצ
ק ו
*2015פדיון
שישרות – ממוצע חוד
ממפעלים
Industry (division) andR
evenue Jobs –
שיענף כלכלי רא
size group of revenuem
onthly averageEstablishm
ents וקבוצת גודל הפדיון
Code
(annual revenue of establishment,
של מפעל, שנתי
(פדיון סמל
NIS m
illion)אחוזים
ש"ח מיליוני
אחוזיםאלפים
אחוזיםמספרים
ש"ח)מיליוני
מוחלטיםAbsolute
PercentagesN
IS million
PercentagesThousands
Percentagesnum
bers
27 M
anu
facture o
f electrical equ
ipm
ent
100.0 6,948
100.0 9.1
100.0 204
מלישח
ייצור ציוד 27
Up to 4.99
2.8 194
5.4 0.5
48.0 98
עד 4.995–9.99
1.7 119
2.7 0.2
6.4 13
9.99–510–24.99
11.0 767
15.2 1.4
23.5 48
24.99–1025–49.99
7.5 522
7.6 0.7
6.9 14
49.99–2550–99.99
15.4 1,069
15.0 1.4
7.4 15
99.99–50100+
61.5 4,276
54.0 4.9
7.8 16
+10028
Man
ufactu
re of m
achin
ery
and
equ
ipm
ent n
.e.c.100.0
17,452 100.0
18.6 100.0
409 א
מ"ת וציוד לנ
מכונוייצור
28
Up to 4.99
2.6 452
6.0 1.1
49.6 203
עד 4.995–9.99
2.6 450
5.1 0.9
15.6 64
9.99–510–24.99
4.9 858
7.4 1.4
12.5 51
24.99–1025–49.99
6.7 1,172
11.0 2.1
8.3 34
49.99–2550–99.99
10.4 1,808
11.7 2.2
6.1 25
99.99–50100+
72.8 12,710
58.9 11.0
7.8 32
+10029
Man
ufactu
re of m
oto
r vehicles,
trailers and
semi-trailers
100.0 3,164
100.0 5.0
100.0 108
ם ם ונגררי
מנועייב ייצור כלי רכ
29
Up to 4.99
3.1 97
5.9 0.3
55.6 60
עד 4.995–9.99
2.2 68
3.9 0.2
6.5 7
9.99–510–24.99
4.4 139
7.3 0.4
9.3 10
24.99–1025–49.99
20.3 642
21.4 1.1
15.7 17
49.99–2550–99.99
12.0 381
16.7 0.8
5.6 6
99.99–50100+
58.1 1,838
44.8 2.2
7.4 8
+100
- 46 -
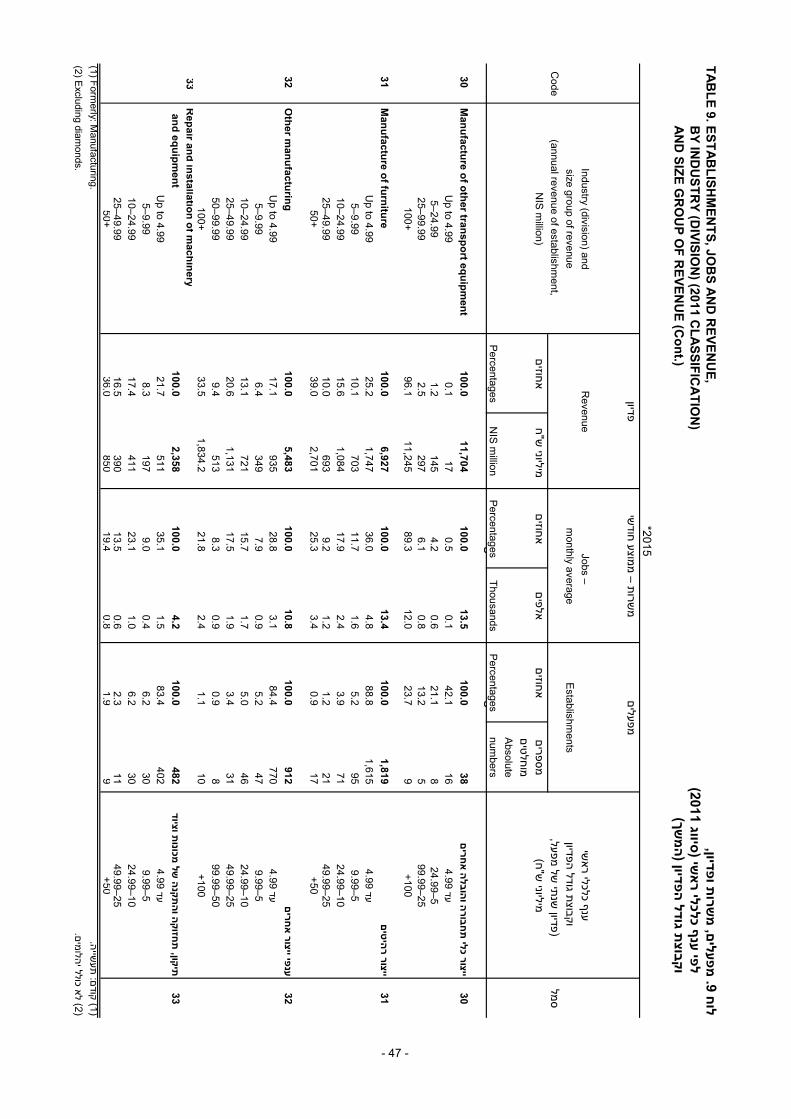
TA
BL
E 9. E
ST
AB
LIS
HM
EN
TS
, JOB
S A
ND
RE
VE
NU
E,
פדיון,ת ו
שרומ
ם, פעלי
מח 9.
לו B
Y IN
DU
ST
RY
(DIV
ISIO
N) (2011 C
LA
SS
IFIC
AT
ION
)סיווג 2011)
שי (אף כלכלי ר
פי ענ ל
AN
D S
IZE
GR
OU
P O
F R
EV
EN
UE
(Co
nt.)
שך)מה
פדיון (ה
ת גודל בוצ
ק ו
*2015פדיון
שישרות – ממוצע חוד
ממפעלים
Industry (division) andR
evenue Jobs –
שיענף כלכלי רא
size group of revenuem
onthly averageEstablishm
ents וקבוצת גודל הפדיון
Code
(annual revenue of establishment,
של מפעל, שנתי
(פדיון סמל
NIS m
illion)אחוזים
ש"ח מיליוני
אחוזיםאלפים
אחוזיםמספרים
ש"ח)מיליוני
מוחלטיםAbsolute
PercentagesN
IS million
PercentagesThousands
Percentagesnum
bersg
g
30 M
anu
facture o
f oth
er transp
ort eq
uip
men
t100.0
11,704 100.0
13.5 100.0
38 םחרי
אה בלהוה ובור
חת
ייצור כלי 30
Up to 4.99
0.1 17
0.5 0.1
42.1 16
עד 4.995–24.99
1.2 145
4.2 0.6
21.1 8
24.99–525–99.99
2.5 297
6.1 0.8
13.2 5
99.99–25100+
96.1 11,245
89.3 12.0
23.7 9
+100
31 M
anu
facture o
f furn
iture
100.0 6,927
100.0 13.4
100.0 1,819
םטיהיייצור ר
31
Up to 4.99
25.2 1,747
36.0 4.8
88.8 1,615
עד 4.995–9.99
10.1 703
11.7 1.6
5.2 95
9.99–510–24.99
15.6 1,084
17.9 2.4
3.9 71
24.99–1025–49.99
10.0 693
9.2 1.2
1.2 21
49.99–2550+
39.0 2,701
25.3 3.4
0.9 17
+50
32 O
ther m
anu
facturin
g100.0
5,483 100.0
10.8 100.0
912 םחרי
אפי ייצור
ענ32
Up to 4.99
17.1 935
28.8 3.1
84.4 770
עד 4.995–9.99
6.4 349
7.9 0.9
5.2 47
9.99–510–24.99
13.1 721
15.7 1.7
5.0 46
24.99–1025–49.99
20.6 1,131
17.5 1.9
3.4 31
49.99–2550–99.99
9.4 513
8.3 0.9
0.9 8
99.99–50100+
33.5 1,834.2
21.8 2.4
1.1 10
+10033
Rep
air and
installatio
n o
f mach
inery
and
equ
ipm
ent
100.0 2,358
100.0 4.2
100.0 482
ת וציודמכונו
של ה קנתהה וקחזו
תקון,
תי33
Up to 4.99
21.7 511
35.1 1.5
83.4 402
עד 4.995–9.99
8.3 197
9.0 0.4
6.2 30
9.99–510–24.99
17.4 411
23.1 1.0
6.2 30
24.99–1025–49.99
16.5 390
13.5 0.6
2.3 11
49.99–2550+
36.0 850
19.4 0.8
1.9 9
+50(1) Form
erly: Manufacturing.
שייה.(1) קודם: תע
(2) Excluding diamonds.
(2) לא כולל יהלומים.
- 47 -

TA
BL
E 10. JO
BS
, RE
VE
NU
E, E
XP
OR
TS
AN
D L
AB
OU
R C
OS
T,
הבוד
ת עא ועלו
פדיון, יצות,
שרומ
ח 10. לו
IN E
XP
OR
T-IN
TE
NS
IVE
ES
TA
BL
ISH
ME
NT
S,(1)
א,(1)תירי יצו
ם עפעלי
מב
B
Y IN
DU
ST
RY
(DIV
ISIO
N) (2011 C
LA
SS
IFIC
AT
ION
)סיווג 2011)
שי (אף כלכלי ר
פי ענ ל
*2015עלות
עלותיצוא
פדיוןפדיון
שרות –מ
מפעליםשעת עבודה
לעבודה
(מיליונישרה
למ(מיליוני
שיממוצע חוד
שלוםבת
(מיליוניש"ח)
ש"ח)(אלפי
ש"ח)(אלפים)
Code
Industry (division)ש"ח)(2)
)ש"ח)(2)
Exports
Revenue per
Revenue
Jobs –E
stablish-שיענף כלכלי רא
סמלC
ostLabour
(NIS
job (NIS
(NIS
monthly
ments
per paidcost
million)
thousand)m
illion)average
work hour
(NIS
(thousands)(N
IS)(2)
million)(2)
B–C
MA
NU
FA
CT
UR
ING
; MIN
ING
הה; כריי
שייתע
B–C
AN
D Q
UA
RR
YIN
G(3)(4) – G
RA
ND
TO
TA
L117
36,540 165,582
1,500 216,450
144.3 840
סך כוללה(3)(4) –
בחצי
וB
MIN
ING
AN
D Q
UA
RR
YIN
G – T
OT
AL
225 946
4,409 2,307
5,150 2.2
4 הכל
סך ה –
בחצי
ה וכריי
B
C M
AN
UF
AC
TU
RIN
G(4) – T
OT
AL
115 35,594
161,173 1,487
211,300 142.1
836 הכל
סך ה(4) –
שייתע
C
10 M
anufacture of food products69
258 1,583
1,283 2,820
2.2 19
ייצור מוצרי מזון10
13 M
anufacture of textiles74
305 2,340
1,594 3,033
1.9 24
ייצור טקסטיל13
14 M
anufacture of wearing apparel
66 192
1,378 1,116
1,436 1.3
13 שה
ייצור מוצרי הלב14
15 M
anufacture and processing of leatherשל מוצרי עור
ייצור ועיבוד 15
and related products57
75 306
559 353
0.6 6
של אביזרים נלווים ו
17 M
anufacture of paper and paper products59
47 158
666 263
0.4 3
ייצור נייר ומוצריו17
18 Printing and reproduction of
של חומרשכפול
הדפסה ו18
recorded media
73 18
92 688
95 0.1
14 שורתי מוקלט
תק19–20
Manufacture of petroleum
products,ייצור מוצרי נפט, כימיקלים
20–19 chem
icals and chemical products
114 2,901
23,902 3,666
43,495 11.9
61 ומוצריהם
21 M
anufacture of pharmaceutical products,
including homeopathic preparations
113 1,676
29,433 4,563
31,807 7.0
23 ייצור תרופות,
כולל תרופות הומאופתיות21
22 M
anufacture of rubber and plastic products72
1,659 8,557
982 11,722
11.9 87
ייצור מוצרי גומי ופלסטיק 22
23 M
anufacture of other non-metallic
ייצור מוצרים אחרים על בסיס23
mineral products
87 219
1,680 1,755
2,078 1.2
11 מינרלים אל-מתכתיים
24 M
anufacture of basic metals
63 82
390 1,011
596 0.6
18 שיית מתכות בסיסיות
תע24
25 M
anufacture of fabricated metal products,
ייצור מוצרי מתכת בהרכבה,25
except machinery and equipm
ent85
2,109 6,040
727 8,085
11.1 76
פרט למכונות ולציוד26
Manufacture of com
puters, electronicשור
שבים, מכייצור מח
26 and optical products
143 18,326
59,230 1,300
73,118 56.2
208 אלקטרוני ואופטי
27 M
anufacture of electrical equipment
80 628
2,033 647
2,792 4.3
22 שמלי
ייצור ציוד ח27
28 M
anufacture of machinery
and equipment n.e.c.
105 2,179
9,961 1,100
11,539 10.5
79 ייצור מכונות וציוד לנמ"א
2829
Manufacture of m
otor vehicles, trailers and sem
i-trailers77
278 1,333
876 1,473
1.7 9
ייצור כלי רכב מנועיים ונגררים 29
30 M
anufacture of other transport equipment
123 3,607
8,524 922
11,396 12.4
17 ייצור כלי תחבורה והובלה אחרים
3032
Other m
anufacturing71
766 2,746
667 3,441
5.2 130
ענפי ייצור אחרים32
33 R
epair and installation of machinery
תיקון, תחזוקה והתקנה33
and equipment
135 52
103 903
157 0.2
7 של מכונות וציוד
(1) Establishm
ents whose exports consitute over 50%
of the value of their sales, and thoseשבהם
50% מערך המכירות, וכן אלה שבהם ערך היצוא הוא מעל ל-
(1) מפעלים w
hose exports amount to over N
IS 10 million a year and com
prise over 25% of their sales.
25% מערך המכירות.שנה וגבוה מ-
ש"ח ב ערך היצוא מסתכם ביותר מ-10 מיליון
(2) Including wages, non-recurrent paym
ents, back pay for previous periods,שים לתקופות קודמות,
שלומים חד-פעמיים, הפרשכר, ת
(2) כולל supplem
entary expenditures and other cost components.
הוצאות נלוות ומרכיבי עלות נוספים.(3) Form
erly: Manufacturing.
שייה.(3) קודם: תע
(4) Excluding diamonds.
(4) לא כולל יהלומים.
- 48 -

TA
BL
E 11. JO
BS
, RE
VE
NU
E, E
XP
OR
TS
AN
D L
AB
OU
R C
OS
T,
הבוד
ת עא ועלו
פדיון, יצות,
שרומ
ח 11. לו
IN E
XP
OR
T-IN
TE
NS
IVE
ES
TA
BL
ISH
ME
NT
S,(1)
א,(1)תירי יצו
ם עפעלי
מב
B
Y S
EC
TO
R A
ND
SIZ
E G
RO
UP
ת גודל
בוצקמגזר ו
פי ל
*2015עלות
עלותיצוא
פדיוןפדיון
שרות –מ
מפעליםשעת עבודה
לעבודה
(מיליונישרה
למ(מיליוני
שיממוצע חוד
שלוםבת
(מיליוניש"ח)
ש"ח)(אלפי
ש"ח)(אלפים)
Sector and size group
ש"ח)(2) )
ש"ח)(2)E
xportsR
evenue perR
evenueJobs –
Establish-
מגזר וקבוצת גודלC
ostLabour
(NIS
job (NIS
(NIS
monthly
ments
per paidcost
million)
thousand)m
illion)average
work hour
(NIS
(thousands)
(NIS
)(2)m
illion)(2)
TO
TA
L1
17
3
6,5
40
1
65
,58
2
1,5
00
2
16
,45
0
14
4.3
8
40
הכל
סך
Sector
מגזר
Non-financial
לא-פיננסי P
rivate under Israeli ownership
108 15,697
87,379 1,773
119,595 67.4
608 שראלית
פרטי בבעלות י P
rivate under foreign ownership
118 10,107
54,944 1,468
58,509 39.9
149 פרטי בבעלות זרה
Co-operatives
73 1,555
7,123 871
10,312 11.8
74 קואופרטיבים
Governm
ent corporations149
9,181 16,137
1,114 28,034
25.2 9
שלתיות חברות ממ
Size group
קבוצת גודל (num
ber of jobs in establishment)
שרות במפעל) (מספר המ
1–488
60 278
1,002 327
0.3 107
4–15–9
86 119
463 910
570 0.6
90 9–5
10–1973
186 612
727 890
1.2 80
19–1020–29
82 230
1,100 1,257
1,648 1.3
54 29–20
30–4991
602 2,955
1,254 3,731
3.0 77
49–3050–99
94 2,201
6,709 834
9,264 11.1
149 99–50
100–29992
6,664 28,864
1,091 37,963
34.8 187
299–100300+
130 26,478
124,601 1,763
162,058 91.9
96 +300
(1) Establishm
ents whose exports consitute over 50%
50% מערך המכירות,
שבהם ערך היצוא הוא מעל ל-(1) מפעלים
of the value of their sales, and those whose exports
שנהש"ח ב
שבהם ערך היצוא מסתכם ביותר מ-10 מיליון וכן אלה
amount to over N
IS 10 m
illion a year and comprise over 25%
of their sales.25% מערך המכירות.
וגבוה מ-(2) Including w
ages, non-recurrent payments, back pay for previous periods,
שים לתקופות קודמות,שלומים חד-פעמיים, הפר
שכר, ת(2) כולל
supplementary expenditures and other cost com
ponents. הוצאות נלוות ומרכיבי עלות נוספים.
- 49 -

TA
BL
E 12. IN
DIC
ES
OF
RE
VE
NU
E F
RO
M L
OC
AL
SA
LE
S A
ND
EX
PO
RT
S,
א,מיצו
ת ומיו
קומ
ת מכירו
מפדיון
מדדי ח 12.
לו B
Y IN
DU
ST
RY
(DIV
ISIO
N) (2011 C
LA
SS
IFIC
AT
ION
)סיווג 2011)
שי (אף כלכלי ר
פי ענ ל
At constant pricesBase:2011=100.0=2011 :הבסיס
במחירים קבועיםיצוא
מכירות מקומיותפדיון
Code
Industry (division)Exports
Local salesR
evenueשיענף כלכלי רא
סמל2015
20142015
20142015
2014
B–C
MA
NU
FA
CT
UR
ING
; MIN
ING
הה; כריי
שייתע
B–C
AN
D Q
UA
RR
YIN
G(1)(2) – G
RA
ND
TO
TA
L107.8
108.6 106.7
104.7 107.8
106.7 סך כולל
ה(1)(2) – בחצי
ו
B M
ININ
G A
ND
QU
AR
RY
ING
– TO
TA
L79.3
99.8 150.8
142.5 117.5
122.4 הכל
סך ה –
בחצי
ה וכריי
B
C M
AN
UF
AC
TU
RIN
G(2) – T
OT
AL
109.3 109.0
105.4 103.5
107.5 106.2
הכלסך
ה(2) – שיי
תעC
10 M
anufacture of food products66.5
76.7 112.0
108.7 109.6
106.8 ייצור מוצרי מזון
1011–12
Manufacture of beverages
134.7 134.8
95.2 93.5
91.7 90.8
שקאות ומוצרי טבקייצור מ
12–11 and tobacco products
13 M
anufacture of textiles102.8
80.1 98.9
95.5 101.2
86.3 ייצור טקסטיל
1314
Manufacture of w
earing apparel81.5
86.1 113.3
114.5 96.1
99.5 שה
ייצור מוצרי הלב14
15 M
anufacture and processing of leatherשל מוצרי עור
ייצור ועיבוד 15
and related products128.4
93.8 99.6
110.9 108.0
103.4 של אביזרים נלווים
ו16
Manufacture of w
ood, cork and strawש,שעם וק
ייצור מוצרי עץ, 16
products, except furniture99.0
87.9 126.1
120.3 127.4
120.0 פרט לרהיטים
17 M
anufacture of paper and paper products67.6
72.8 99.9
98.6 96.3
95.3 ייצור נייר ומוצריו
1718
Printing and reproduction ofשל חומר
שכפול הדפסה ו
18 recorded m
edia177.9
142.1 98.3
98.0 100.3
100.1 שורתי מוקלט
תק19–20
Manufacture of petroleum
products,ייצור מוצרי נפט, כימיקלים
20–19 chem
icals and chemical products
106.6 118.8
98.9 93.9
100.1 102.1
ומוצריהם
21 M
anufacture of pharmaceutical products,
including homeopathic preparations
127.0 103.2
114.2 118.6
128.9 108.3
ייצור תרופות, כולל תרופות הומאופתיות
21
22 M
anufacture of rubber and plastic products109.6
102.7 97.0
98.4 101.5
99.3 ייצור מוצרי גומי ופלסטיק
2223
Manufacture of other non-m
etallicייצור מוצרים אחרים על בסיס
23 m
ineral products229.8
183.2 116.7
117.1 122.8
120.0 מינרלים אל-מתכתיים
24 M
anufacture of basic metals
83.9 99.4
126.4 126.0
119.4 120.7
שיית מתכות בסיסיותתע
2425
Manufacture of fabricated m
etal products,ייצור מוצרי מתכת בהרכבה,
25 except m
achinery and equipment
110.0 106.3
108.2 106.7
109.7 107.7
פרט למכונות ולציוד26
Manufacture of com
puters, electronicשור
שבים, מכייצור מח
26 and optical products
108.1 113.9
95.4 97.0
104.3 109.4
אלקטרוני ואופטי27
Manufacture of electrical equipm
ent46.5
49.9 119.4
116.0 94.6
96.2 שמלי
ייצור ציוד ח27
28 M
anufacture of machinery
and equipment n.e.c.
125.0 122.0
93.0 103.4
112.9 116.7
ייצור מכונות וציוד לנמ"א28
29 M
anufacture of motor vehicles,
trailers and semi-trailers
89.6 70.6
86.5 97.0
75.5 84.3
ייצור כלי רכב מנועיים ונגררים 29
30 M
anufacture of other transport equipment
119.8 114.6
130.2 126.4
122.6 117.7
ייצור כלי תחבורה והובלה אחרים30
31 M
anufacture of furniture125.5
121.0 112.7
103.6 114.9
107.0 ייצור רהיטים
3132
Other m
anufacturing123.2
118.0 107.5
105.6 117.7
114.2 ענפי ייצור אחרים
3233
Repair and installation of m
achineryתיקון, תחזוקה והתקנה
33 and equipm
ent69.7
88.7 111.8
99.6 103.2
92.0 של מכונות וציוד
(1) Form
erly: Manufacturing.
שייה. (1) קודם: תע
(2) Excluding diamonds.
(2) לא כולל יהלומים.
- 50 -

TABLE 13. INDICES OF MANUFACTURING PRODUCTION, לוח 13. מדדי ייצור תעשייתי, משרות שכיר EMPLOYEE JOBS AND ACTUAL WORK HOURS, ושעות עבודה למעשה, לפי תת-ענף BY INDUSTRY (CLASS) (2011 CLASSIFICATION) כלכלי (סיווג 2011)
Base: 2011=100.0 2015 הבסיס: 2011=100.0
שעות משרות שכיר ייצורעבודה תעשייתילמעשה
Code Industry ענף כלכלי סמל(division and class) (ענף ראשי ותת-ענף)
Actual Manu-work Employee facturinghours jobs production
B–C MANUFACTURING; MINING AND 98.1 100.9 108.2 (2)(1)תעשייה; כרייה וחציבה B–C QUARRYING(1)(2)
B MINING AND QUARRYING כרייה וחציבה 133.5 107.8 101.2 B
C MANUFACTURING(2) תעשייה(2) 106.8 100.9 98.0 C
10 Manufacture of food products ייצור מוצרי מזון 102.1 104.6 100.5 10
1010 Processing and preserving of meat עיבוד בשר ושימורו 101.5 102.3 103.5 1010
1011 Slaughterhouses for cattle and poultry משחטות ובתי מטבחיים 112.6 100.0 99.6 1011
1020–1030 Processing and preserving of fish, עיבוד דגים, סרטנים, 1030–1020 crustaceans, molluscs, fruit and ,רכיכות, פירות וירקות vegetables ושימורם 110.6 115.0 103.9
1040 Manufacture of vegetable and animal ייצור שומנים ושמנים מן החי ומן 1040 oils and fats הצומח 86.2 96.1 103.9
1050 Manufacture of dairy products ייצור מוצרי חלב 100.6 99.4 95.4 1050
1061–1062 Manufacture of grain mill products, ייצור מיני דגנים (טחינת תבואה 1062–1061 starches and starch products וגריסתה), עמילנים ומוצרים
עמילניים 88.9 84.4 82.5
1070 Manufacture of matzot (unleavened 83.5 89.5 100.3 ייצור מצות 1070 bread)
1071 Manufacture of bakery products ייצור דברי מאפה 98.8 111.1 102.2 1071
1072–1073 Manufacture of sugar, cocoa, chocolate ייצור סוכר, קקאו, שוקולד 1073–1072 and sugar confectionery וממתקים 108.8 100.8 94.9
1074 Manufacture of macaroni, noodles, ייצור מקרוני, אטריות, קוסקוס 1074 couscous and similar farinaceous 108.4 101.3 110.3 ומזונות עמילניים דומים products
1075, Manufacture of prepared meals and ייצור מזון מוכן, מזון מוכן לבעלי ,10751079–1080 dishes, prepared animal feeds and 1079–1080 חיים ומוצרי מזון אחרים לנמ"א 105.3 102.3 98.9
other food products n.e.c.
11–12 Manufacture of beverages and ייצור משקאות ומוצרי טבק 104.6 97.9 98.9 12–11 tobacco products
1101–1102 Distilling, rectifying and blending of spirits, זיקוק וערבוב של אלכוהול, ייצור 1102–1101 manufacture of wines יינות 129.5 94.7 100.5
13 Manufacture of textiles ייצור טקסטיל 84.9 88.2 84.5 13
1311–1313 Spinning, weaving and finishing of textiles טווייה, אריגה וגימור של טקסטיל 90.6 106.1 102.4 1313–1311
1391–1394, Manufacture of other textiles ייצור סוגים אחרים של טקסטיל 81.8 76.7 72.8 ,1394–1391 1399 1399
14 Manufacture of wearing apparel ייצור מוצרי הלבשה 98.7 95.6 90.7 14
1410 Manufacture of wearing apparel ייצור בגדים (פרט לבגדי פרווה) 118.2 101.2 94.5 1410 (except fur apparel)
1411 Manufacture of underwear ייצור הלבשה תחתונה 80.2 81.6 81.8 1411
- 51 -

TABLE 13. INDICES OF MANUFACTURING PRODUCTION, לוח 13. מדדי ייצור תעשייתי, משרות שכיר EMPLOYEE JOBS AND ACTUAL WORK HOURS, ושעות עבודה למעשה, לפי תת-ענף BY INDUSTRY (CLASS) (Cont.) כלכלי (סיווג 2011) (המשך)
Base: 2011=100.0 2015 הבסיס: 2011=100.0שעות משרות ייצורעבודה שכיר תעשייתילמעשה
Code Industry ענף כלכלי סמל(division and class) (ענף ראשי ותת-ענף)
Actual Manu-work Employee facturinghours jobs production
15 Manufacture and processing of leather ייצור ועיבוד של מוצרי עור ושל 15
and related products אביזרים נלווים 99.1 86.0 84.2
1511—1512 Tanning and dressing of leather, עיבוד עורות, ייצור מזוודות, 1512—1511 manufacture of luggage, handbags, תיקים, אוכפים ורתמות, saddlery and harness, dressing 76.5 74.6 123.7 עיבוד וצביעה של פרוות and dyeing of fur
1520 Manufacture of footwear ייצור נעליים 94.3 90.1 86.8 1520
16 Manufacture of wood, cork and ייצור מוצרי עץ, שעם וקש, 16
straw products, except furniture פרט לרהיטים 125.9 113.5 106.4
1621 Manufacture of veneer sheets ייצור לוחות פורניר ופנלים מעץ 107.3 110.5 106.3 1621and wood-based panels
1622—1623, Manufacture of products of wood, cork ייצור מוצרי עץ, שעם, קש ,1623—16221629 straw and plaiting materials 107.4 115.7 143.6 1629 וחומרים לקליעה
17 Manufacture of paper and paper 99.9 97.1 97.7 ייצור נייר ומוצריו 17
products
18 Printing and reproduction of recorded הדפסה ושכפול של חומר 18
media תקשורתי מוקלט 98.6 102.2 94.3
19—20 Manufacture of petroleum ,ייצור מוצרי נפט 20—19
products, chemicals 97.8 101.6 104.4 כימיקלים ומוצריהם and chemical products
21 Manufacture of pharmaceutical products, 100.5 105.9 128.9 ייצור תרופות, כולל תרופות 21
including homeopathic preparations הומאופתיות
22 Manufacture of rubber and plastic 104.3 103.9 99.1 ייצור מוצרי גומי ופלסטיק 22
products
2211—2219 Manufacture of rubber products ייצור מוצרי גומי 95.7 91.5 85.8 2219—2211
2220 Manufacture of plastic sleeves and sheets 104.4 104.9 92.8 ייצור שרוולים ויריעות מפלסטיק 2220
2230 Manufacture of plastic plates, tubes and pipes ייצור לוחות וצינורות מפלסטיק 129.7 109.5 117.2 2230
2240 Manufacture of plastic containers and bottles 106.3 107.5 96.5 ייצור מכלים ובקבוקים מפלסטיק 2240
2250 Manufacture of reinforced plastic products ייצור מוצרים מפלסטיק משוריין 73.7 75.5 74.2 2250
2260 Manufacture of plastic kitchenware, ייצור מוצרים מפלסטיק למטבח, 2260 tableware and household products לשולחן ולבית 103.3 96.9 104.4
2270 Manufacture of plastic products for technical, ייצור מוצרים מפלסטיק לשימושים 2270 agricultural and industrial uses טכניים, חקלאיים ותעשייתיים 93.5 106.1 104.7
2280 Manufacture of plastic products n.e.c. ייצור מוצרים מפלסטיק לנמ"א 105.4 111.2 110.0 2280
23 Manufacture of other non-metallic ייצור מוצרים אחרים על בסיס 23
mineral products מינרלים אל-מתכתיים 125.6 107.4 107.0
2310 Manufacture of glass and glass products ייצור זכוכית ומוצרים מזכוכית 144.3 98.5 103.0 2310
2391—2393 Manufacture of ceramic (refractory) ייצור מוצרי קרמיקה (חסיני אש), 2393—2391 products, clay building materials and other חומרי בנייה מחרס ומוצרים אחרים porcelain and ceramic products מקרמיקה ומחרסינה 111.9 109.2 104.8
2394, Manufacture of cement, lime and plaster, ייצור צמנט, סיד, טיח, בטון מוכן ,23942397—2398 ready-made concrete, bricks 2397—2398 ליציקה ובלוקים 114.8 109.7 109.4
2395 Manufacture of articles of concrete, cement ייצור מוצרי בטון, צמנט וטיח 104.4 122.2 124.9 2395 and plaster
2396, 2399 Cutting, shaping and finishing of stone, חיתוך, עיצוב וליטוש של אבנים, 2399 ,2396 manufacture of other non-metallic mineral ייצור מוצרים אחרים ממינרלים products n.e.c. אל-מתכתיים, לנמ"א 147.1 101.7 97.3
- 52 -

TABLE 13. INDICES OF MANUFACTURING PRODUCTION, לוח 13. מדדי ייצור תעשייתי, משרות שכיר EMPLOYEE JOBS AND ACTUAL WORK HOURS, ושעות עבודה למעשה, לפי תת-ענף BY INDUSTRY (CLASS) (Cont.) כלכלי (סיווג 2011) (המשך)
Base: 2011=100.0 2015 הבסיס: 2011=100.0שעות משרות ייצורעבודה שכיר תעשייתילמעשה
Code Industry ענף כלכלי סמל(division and class) (ענף ראשי ותת-ענף)
Actual Manu-work Employee facturinghours jobs production
24 Manufacture of basic metals תעשיית מתכות בסיסיות 96.2 99.4 96.2 24
2410 Manufacture of basic iron and steel ייצור ברזל ופלדה בסיסיים 107.3 130.9 128.9 2410
2420 Manufacture of basic precious and other ייצור מתכות יקרות בסיסיות ומתכות 2420 non-ferrous metals אל-ברזליות אחרות 103.2 108.4 105.8
2431—2432 Casting of metal יציקות מתכת 74.8 75.4 71.3 2432—2431
25 Manufacture of fabricated metal ,ייצור מוצרי מתכת בהרכבה 25
products, except machinery and 99.4 102.7 104.3 פרט למכונות ולציוד equipment
2511 Manufacture of structural metal products ייצור שלדי מתכת 119.3 100.1 98.5 2511
2512 Manufacture of tanks, reservoirs ייצור מכלים וכלי אגירה ממתכת 117.8 101.6 86.5 2512 and containers of metal
2520, Manufacture of weapons and ammunition, ייצור נשק ותחמושת, עיבוד מתכות ,25202591—2592 treatment and coating, forging, pressing, 2591—2592 וציפוין, חישול, לחיצה, הטבעה
stamping and roll-forming of metal, powder וגלגול של מתכות, מטלורגיית metallurgy, welding workshops and אבקות, מסגריות, עיבוד מכני machining ועיבוד שבבי 103.5 103.9 100.7
2593, Manufacture of hand tools, general hardware ייצור כלי עבודה ידניים, ציוד מכני כללי ,25932596, 2599 and cutlery, metal cookingware, 2596, 2599 וסכו"ם, כלי בישול, מבלטים
dies and moulds, other fabricated ותבניות ממתכת, מוצרי מתכת metal products n.e.c. לנמ"א 101.8 112.2 105.8
2594 Manufacture of tin containers and packing ייצור אריזות ומכלים מפח, זיווד 2594 products, electronic packaging and other אלקטרוני ומוצרי פח לנמ"א 94.8 90.0 88.4 tinware products n.e.c.
2595 Manufacture of wire fencing, cables, wires ייצור רשתות, כבלים, חוטים ותיל, 2595 and wire products from ferrous and ממתכת ברזלית ואל-ברזלית 101.6 106.0 107.6 non-ferrous metals
26 Manufacture of computers, ייצור מחשבים, מכשור אלקטרוני 26
electronic and optical products ואופטי 100.2 95.9 94.4
2610 Manufacture of electronic components ייצור רכיבים ולוחות אלקטרוניים 92.9 88.6 86.0 2610 and boards
2621 Manufacture of computers and ייצור מחשבים וציוד היקפי 80.3 90.0 84.0 2621 peripheral equipment
2630 Manufacture of communication equipment ייצור ציוד תקשורת 97.5 87.7 89.5 2630
2651 Manufacture of measuring, testing, ייצור מכשירי מדידה, בדיקה, 2651 navigating and control equipment ניווט ובקרה 106.8 101.4 99.6
2660 Manufacture of irradiation, electromedical, ייצור ציוד הקרנה, מכשור אלקטרוני 2660 electrotherapeutic and surgical equipment רפואי, מכשור אלקטרוני טיפולי
ומכשור רפואי כירורגי 134.7 134.3 129.4
2670 Manufacture of optical instruments and ייצור מכשור אופטי וציוד צילום 87.2 86.4 82.6 2670 photographic equipment
- 53 -

TABLE 13. INDICES OF MANUFACTURING PRODUCTION, לוח 13. מדדי ייצור תעשייתי, משרות שכיר EMPLOYEE JOBS AND ACTUAL WORK HOURS, ושעות עבודה למעשה, לפי תת-ענף BY INDUSTRY (CLASS) (Cont.) כלכלי (סיווג 2011) (המשך)
Base: 2011=100.0 2015 הבסיס: 2011=100.0שעות משרות ייצורעבודה שכיר תעשייתילמעשה
Code Industry ענף כלכלי סמל(division and class) (ענף ראשי ותת-ענף)
Actual Manu-work Employee facturinghours jobs production
27 Manufacture of electrical equipment ייצור ציוד חשמלי 100.6 93.6 90.0 27
2711—2712 Manufacture of electric motors and ייצור מנועים חשמליים ושנאים 103.8 99.0 100.5 2712—2711 transformers
2713, Manufacture of electricity distribution and ייצור אביזרים לחלוקה ולבקרה של ,27132740, 2790 control apparatus, electric lighting חשמל, ציוד תאורה חשמלית וציוד 2790 ,2740
equipment and other electrical equipment חשמלי אחר 129.5 96.6 94.5
2731—2733 Manufacture of wiring and ייצור חוטי חשמל ומתקני חיווט 85.5 91.4 87.6 2733—2731 wiring devices
2750 Manufacture of domestic appliances ייצור מכשירי חשמל ביתיים 36.4 77.3 67.2 2750
28 Manufacture of machinery and ייצור מכונות וציוד לנמ"א 113.7 105.8 101.6 28
equipment n.e.c.
2811—2814 Manufacture of engines and turbines, ,ייצור מנועים וטורבינות 2814—2811
equipment for hydraulic and ציוד למערכות הידראוליות pneumatic systems, pumps, compressors, ופנאומטיות, משאבות, מדחסים, taps and valves, bearings, gears, ברזים ושסתומים אחרים, מסבים,gearing and driving elements ממסרות וציוד הנעה 105.1 105.8 96.9
2815—2817, Manufacture of ovens, furnaces, furnace ייצור תנורים מקובעים, כבשנים, ,2817—28152819 burners and solar energy systems, ,2819 מבערים ומערכות אנרגיה סולרית
lifting and handling equipment, office ציוד הרמה, שינוע, פריקה machinery and equipment, and other ,וטעינה, מכונות וציוד למשרד general-purpose machinery ומכונות וציוד אחרים לשימוש כללי 119.0 104.5 103.5
2821—2823, Manufacture of agricultural, forestry, ייצור מכונות לחקלאות, לייעור, ,2823—2821
2825, 2829 metal-forming, metallurgy, food, beverage 2825, 2829 לעיצוב מתכות, לטיפול and tobacco processing machinery במתכות (מטלורגיה), לעיבוד מזון, and machine tools, משקאות וטבק, כלי עבודה ממונעים and other special-purpose machinery ומכונות ייעודיות אחרות 116.1 108.1 104.4
29 Manufacture of motor vehicles, trailers 93.2 91.6 82.5 ייצור כלי רכב מנועיים ונגררים 29
and semi-trailers
30 Manufacture of other transport 101.6 99.7 120.7 ייצור כלי תחבורה והובלה אחרים 30
equipment
31 Manufacture of furniture ייצור רהיטים 101.1 95.5 87.2 31
32 Other manufacturing ענפי ייצור אחרים 106.3 108.8 104.1 32
3211—3212 Manufacture of fine and imitation jewellery ייצור תכשיטים יקרים, תכשיטים 3212—3211 and related articles מלאכותיים ופריטים דומים 91.0 94.0 90.9
3240, 3290 Manufacturing of games and toys, and other ייצור משחקים וצעצועים, וענפי 102.5 107.2 103.9 3240, 3290 manufacturing n.e.c. ייצור אחרים לנמ"א
3250 Manufacture of medical, dental and ייצור ציוד רפואי, דנטלי ואורתופדי 127.0 119.2 113.1 3250 orthopedic instruments and supplies
33 Repair and installation of machinery תיקון, תחזוקה והתקנה של מכונות 33
and equipment וציוד 99.1 113.4 109.0
3311—3314 Repair of fabricated metal products, תיקון מוצרי מתכת בהרכבה, מכונות 3314—3311
machinery, electronic, וציוד אלקטרוני, אופטי, רפואי optical, medical and electrical equipment וחשמלי 95.7 105.8 107.6
3315, Repair of transport equipment and other תיקון כלי תחבורה והובלה וסוגים ,33153319—3320 machinery and equipment, except motor 3319—3320 אחרים של מכונות וציוד, פרט לכלי
vehicles, and installation of רכב מנועיים, התקנה industrial machinery and equipment של מכונות וציוד תעשייתיים 125.0 127.5 111.3
- 54 -

TABLE 13. INDICES OF MANUFACTURING PRODUCTION, לוח 13. מדדי ייצור תעשייתי, משרות שכיר EMPLOYEE JOBS AND ACTUAL WORK HOURS, ושעות עבודה למעשה, לפי תת-ענף BY INDUSTRY (CLASS) (2011 CLASSIFICATION) (Cont.) כלכלי (סיווג 2011) (המשך)
Base: 2011=100.0 2014 הבסיס: 2011=100.0
שעות משרות שכיר ייצורעבודה תעשייתילמעשה
Code Industry ענף כלכלי סמל(division and class) (ענף ראשי ותת-ענף)
Actual Manu-work Employee facturinghours jobs production
B–C MANUFACTURING; MINING AND 98.6 101.2 105.8 (2)(1)תעשייה; כרייה וחציבה B–C QUARRYING(1)(2)
B MINING AND QUARRYING כרייה וחציבה 133.7 106.2 103.2 B
C MANUFACTURING(2) תעשייה(2) 104.2 101.1 98.6 C
10 Manufacture of food products ייצור מוצרי מזון 100.7 104.7 101.3 10
1010 Processing and preserving of meat עיבוד בשר ושימורו 98.3 101.2 104.8 1010
1011 Slaughterhouses for cattle and poultry משחטות ובתי מטבחיים 105.2 102.5 105.2 1011
1020–1030 Processing and preserving of fish, עיבוד דגים, סרטנים, 1030–1020 crustaceans, molluscs, fruit and ,רכיכות, פירות וירקות vegetables ושימורם 105.7 111.0 100.5
1040 Manufacture of vegetable and animal ייצור שומנים ושמנים מן החי ומן 1040 oils and fats הצומח 80.0 99.9 102.2
1050 Manufacture of dairy products ייצור מוצרי חלב 101.7 100.3 95.6 1050
1061–1062 Manufacture of grain mill products, ייצור מיני דגנים (טחינת תבואה 1062–1061 starches and starch products וגריסתה), עמילנים ומוצרים
עמילניים 90.0 87.0 87.3
1070 Manufacture of matzot (unleavened 88.6 93.5 102.1 ייצור מצות 1070 bread)
1071 Manufacture of bakery products ייצור דברי מאפה 95.4 108.8 101.6 1071
1072–1073 Manufacture of sugar, cocoa, chocolate ייצור סוכר, קקאו, שוקולד 1073–1072 and sugar confectionery וממתקים 106.7 102.1 97.2
1074 Manufacture of macaroni, noodles, ייצור מקרוני, אטריות, קוסקוס 1074 couscous and similar farinaceous 106.9 101.3 111.1 ומזונות עמילניים דומים products
1075, Manufacture of prepared meals and ייצור מזון מוכן, מזון מוכן לבעלי ,10751079–1080 dishes, prepared animal feeds and 1079–1080 חיים ומוצרי מזון אחרים לנמ"א 105.1 105.7 103.0
other food products n.e.c.
11–12 Manufacture of beverages and ייצור משקאות ומוצרי טבק 102.3 97.5 96.0 12–11 tobacco products
1101–1102 Distilling, rectifying and blending of spirits, זיקוק וערבוב של אלכוהול, ייצור 1102–1101 manufacture of wines יינות 124.2 94.5 96.6
13 Manufacture of textiles ייצור טקסטיל 84.5 88.9 85.8 13
1311–1313 Spinning, weaving and finishing of textiles טווייה, אריגה וגימור של טקסטיל 87.4 103.7 101.9 1313–1311
1391–1394, Manufacture of other textiles ייצור סוגים אחרים של טקסטיל 83.0 80.0 76.0 ,1394–1391 1399 1399
14 Manufacture of wearing apparel ייצור מוצרי הלבשה 99.9 100.3 94.4 14
1410 Manufacture of wearing apparel ייצור בגדים (פרט לבגדי פרווה) 115.5 105.7 97.9 1410 (except fur apparel)
1411 Manufacture of underwear ייצור הלבשה תחתונה 84.4 89.6 88.0 1411
- 55 -

TABLE 13. INDICES OF MANUFACTURING PRODUCTION, לוח 13. מדדי ייצור תעשייתי, משרות שכיר EMPLOYEE JOBS AND ACTUAL WORK HOURS, ושעות עבודה למעשה, לפי תת-ענף BY INDUSTRY (CLASS) (Cont.) כלכלי (סיווג 2011) (המשך)
Base: 2011=100.0 2014 הבסיס: 2011=100.0שעות משרות ייצורעבודה שכיר תעשייתילמעשה
Code Industry ענף כלכלי סמל(division and class) (ענף ראשי ותת-ענף)
Actual Manu-work Employee facturinghours jobs production
15 Manufacture and processing of leather ייצור ועיבוד של מוצרי עור ושל 15
and related products אביזרים נלווים 94.5 85.8 82.7
1511—1512 Tanning and dressing of leather, עיבוד עורות, ייצור מזוודות, 1512—1511 manufacture of luggage, handbags, תיקים, אוכפים ורתמות, saddlery and harness, dressing 85.7 85.2 138.6 עיבוד וצביעה של פרוות and dyeing of fur
1520 Manufacture of footwear ייצור נעליים 85.9 86.0 81.8 1520
16 Manufacture of wood, cork and ייצור מוצרי עץ, שעם וקש, 16
straw products, except furniture פרט לרהיטים 118.5 118.8 108.4
1621 Manufacture of veneer sheets ייצור לוחות פורניר ופנלים מעץ 105.2 108.7 102.4 1621and wood-based panels
1622—1623, Manufacture of products of wood, cork ייצור מוצרי עץ, שעם, קש ,1623—16221629 straw and plaiting materials 112.8 125.5 131.5 1629 וחומרים לקליעה
17 Manufacture of paper and paper 97.0 94.0 86.5 ייצור נייר ומוצריו 17
products
18 Printing and reproduction of recorded הדפסה ושכפול של חומר 18
media תקשורתי מוקלט 99.6 101.6 97.0
19—20 Manufacture of petroleum ,ייצור מוצרי נפט 20—19
products, chemicals 101.1 102.9 102.7 כימיקלים ומוצריהם and chemical products
21 Manufacture of pharmaceutical 100.9 105.6 108.3 ייצור תרופות 21
products
22 Manufacture of rubber and plastic 103.4 103.6 99.5 ייצור מוצרי גומי ופלסטיק 22
products
2211—2219 Manufacture of rubber products ייצור מוצרי גומי 103.5 98.2 91.8 2219—2211
2220 Manufacture of plastic sleeves and sheets 99.9 100.8 96.7 ייצור שרוולים ויריעות מפלסטיק 2220
2230 Manufacture of plastic plates, tubes and pipes ייצור לוחות וצינורות מפלסטיק 105.7 106.3 111.3 2230
2240 Manufacture of plastic containers and bottles 104.0 102.5 103.5 ייצור מכלים ובקבוקים מפלסטיק 2240
2250 Manufacture of reinforced plastic products ייצור מוצרים מפלסטיק משוריין 85.3 90.8 90.7 2250
2260 Manufacture of plastic kitchenware, ייצור מוצרים מפלסטיק למטבח, 2260 tableware and household products לשולחן ולבית 102.7 95.3 101.7
2270 Manufacture of plastic products for technical, ייצור מוצרים מפלסטיק לשימושים 2270 agricultural and industrial uses טכניים, חקלאיים ותעשייתיים 95.6 108.8 109.0
2280 Manufacture of plastic products n.e.c. ייצור מוצרים מפלסטיק לנמ"א 102.2 112.2 104.4 2280
23 Manufacture of other non-metallic ייצור מוצרים אחרים על בסיס 23
mineral products מינרלים אל-מתכתיים 119.5 107.6 106.2
2310 Manufacture of glass and glass products ייצור זכוכית ומוצרים מזכוכית 143.9 93.2 94.6 2310
2391—2393 Manufacture of ceramic (refractory) ייצור מוצרי קרמיקה (חסיני אש), 2393—2391 products, clay building materials and other חומרי בנייה מחרס ומוצרים אחרים porcelain and ceramic products מקרמיקה ומחרסינה 106.7 113.0 110.5
2394, Manufacture of cement, lime and plaster, ייצור צמנט, סיד, טיח, בטון מוכן ,23942397—2398 ready-made concrete, bricks 2397—2398 ליציקה ובלוקים 112.7 110.9 108.5
2395 Manufacture of articles of concrete, cement ייצור מוצרי בטון, צמנט וטיח 100.2 120.3 122.9 2395 and plaster
2396, 2399 Cutting, shaping and finishing of stone, חיתוך, עיצוב וליטוש של אבנים, 2399 ,2396 manufacture of other non-metallic mineral ייצור מוצרים אחרים ממינרלים products n.e.c. אל-מתכתיים, לנמ"א 128.3 104.1 100.0
- 56 -

TABLE 13. INDICES OF MANUFACTURING PRODUCTION, לוח 13. מדדי ייצור תעשייתי, משרות שכיר EMPLOYEE JOBS AND ACTUAL WORK HOURS, ושעות עבודה למעשה, לפי תת-ענף BY INDUSTRY (CLASS) (Cont.) כלכלי (סיווג 2011) (המשך)
Base: 2011=100.0 2014 הבסיס: 2011=100.0שעות משרות ייצורעבודה שכיר תעשייתילמעשה
Code Industry ענף כלכלי סמל(division and class) (ענף ראשי ותת-ענף)
Actual Manu-work Employee facturinghours jobs production
24 Manufacture of basic metals תעשיית מתכות בסיסיות 96.8 103.5 100.5 24
2410 Manufacture of basic iron and steel ייצור ברזל ופלדה בסיסיים 110.8 125.0 123.8 2410
2420 Manufacture of basic precious and other ייצור מתכות יקרות בסיסיות ומתכות 2420 non-ferrous metals אל-ברזליות אחרות 101.8 114.0 112.4
2431—2432 Casting of metal יציקות מתכת 73.2 83.1 78.2 2432—2431
25 Manufacture of fabricated metal ,ייצור מוצרי מתכת בהרכבה 25
products, except machinery and 97.4 101.1 103.3 פרט למכונות ולציוד equipment
2511 Manufacture of structural metal products ייצור שלדי מתכת 114.5 100.8 98.4 2511
2512 Manufacture of tanks, reservoirs ייצור מכלים וכלי אגירה ממתכת 107.6 100.3 83.7 2512 and containers of metal
2520, Manufacture of weapons and ammunition, ייצור נשק ותחמושת, עיבוד מתכות ,25202591—2592 treatment and coating, forging, pressing, 2591—2592 וציפוין, חישול, לחיצה, הטבעה
stamping and roll-forming of metal, powder וגלגול של מתכות, מטלורגיית metallurgy, welding workshops and אבקות, מסגריות, עיבוד מכני machining ועיבוד שבבי 101.2 99.9 96.2
2593, Manufacture of hand tools, general hardware ייצור כלי עבודה ידניים, ציוד מכני כללי ,25932596, 2599 and cutlery, metal cookingware, 2596, 2599 וסכו"ם, כלי בישול, מבלטים
dies and moulds, other fabricated ותבניות ממתכת, מוצרי מתכת metal products n.e.c. לנמ"א 104.0 111.3 105.4
2594 Manufacture of tin containers and packing ייצור אריזות ומכלים מפח, זיווד 2594 products, electronic packaging and other אלקטרוני ומוצרי פח לנמ"א 93.2 92.0 90.8 tinware products n.e.c.
2595 Manufacture of wire fencing, cables, wires ייצור רשתות, כבלים, חוטים ותיל, 2595 and wire products from ferrous and ממתכת ברזלית ואל-ברזלית 99.8 104.1 102.6 non-ferrous metals
26 Manufacture of computers, ייצור מחשבים, מכשור אלקטרוני 26
electronic and optical products ואופטי 106.0 96.8 96.5
2610 Manufacture of electronic components ייצור רכיבים ולוחות אלקטרוניים 110.9 93.8 93.8 2610 and boards
2621 Manufacture of computers and ייצור מחשבים וציוד היקפי 84.4 87.5 81.8 2621 peripheral equipment
2630 Manufacture of communication equipment ייצור ציוד תקשורת 99.1 89.2 92.7 2630
2651 Manufacture of measuring, testing, ייצור מכשירי מדידה, בדיקה, 2651 navigating and control equipment ניווט ובקרה 106.1 101.2 100.2
2660 Manufacture of irradiation, electromedical, ייצור ציוד הקרנה, מכשור אלקטרוני 2660 electrotherapeutic and surgical equipment רפואי, מכשור אלקטרוני טיפולי
ומכשור רפואי כירורגי 126.9 126.2 121.4
2670 Manufacture of optical instruments and ייצור מכשור אופטי וציוד צילום 76.6 83.5 78.2 2670 photographic equipment
- 57 -

TABLE 13. INDICES OF MANUFACTURING PRODUCTION, לוח 13. מדדי ייצור תעשייתי, משרות שכיר EMPLOYEE JOBS AND ACTUAL WORK HOURS, ושעות עבודה למעשה, לפי תת-ענף BY INDUSTRY (CLASS) (Cont.) כלכלי (סיווג 2011) (המשך)
Base: 2011=100.0 2014 הבסיס: 2011=100.0שעות משרות ייצורעבודה שכיר תעשייתילמעשה
Code Industry ענף כלכלי סמל(division and class) (ענף ראשי ותת-ענף)
Actual Manu-work Employee facturinghours jobs production
27 Manufacture of electrical equipment ייצור ציוד חשמלי 97.4 98.3 95.7 27
2711—2712 Manufacture of electric motors and ייצור מנועים חשמליים ושנאים 101.8 97.9 98.6 2712—2711 transformers
2713, Manufacture of electricity distribution and ייצור אביזרים לחלוקה ולבקרה של ,27132740, 2790 control apparatus, electric lighting חשמל, ציוד תאורה חשמלית וציוד 2790 ,2740
equipment and other electrical equipment חשמלי אחר 126.0 99.1 97.7
2731—2733 Manufacture of wiring and ייצור חוטי חשמל ומתקני חיווט 85.1 90.7 86.5 2733—2731 wiring devices
2750 Manufacture of domestic appliances ייצור מכשירי חשמל ביתיים 50.4 106.2 99.2 2750
28 Manufacture of machinery and ייצור מכונות וציוד לנמ"א 111.9 108.2 103.7 28
equipment n.e.c.
2811—2814 Manufacture of engines and turbines, ,ייצור מנועים וטורבינות 2814—2811
equipment for hydraulic and ציוד למערכות הידראוליות pneumatic systems, pumps, compressors, ופנאומטיות, משאבות, מדחסים, taps and valves, bearings, gears, gearing ברזים ושסתומים אחרים, מסבים, and driving elements ממסרות וציוד הנעה 96.0 107.3 99.0
2815—2817, Manufacture of ovens, furnaces, furnace ייצור תנורים מקובעים, כבשנים, ,2817—28152819 burners and solar energy systems, ,2819 מבערים ומערכות אנרגיה סולרית
lifting and handling equipment, office ציוד הרמה, שינוע, פריקה machinery and equipment, and other ,וטעינה, מכונות וציוד למשרד general-purpose machinery ומכונות וציוד אחרים לשימוש כללי 121.3 109.3 106.4
2821—2823, Manufacture of agricultural, forestry, ייצור מכונות לחקלאות, לייעור, ,2823—2821
2825, 2829 metal-forming, metallurgy, food, beverage 2825, 2829 לעיצוב מתכות, לטיפול and tobacco processing machinery במתכות (מטלורגיה), לעיבוד מזון, and machine tools, משקאות וטבק, כלי עבודה ממונעים and other special-purpose machinery ומכונות ייעודיות אחרות 116.5 107.1 104.5
29 Manufacture of motor vehicles, trailers 90.2 88.4 86.4 ייצור כלי רכב מנועיים ונגררים 29
and semi-trailers
30 Manufacture of other transport 99.9 100.0 111.6 ייצור כלי תחבורה והובלה אחרים 30
equipment
31 Manufacture of furniture ייצור רהיטים 96.6 94.3 86.1 31
32 Other manufacturing ענפי ייצור אחרים 107.1 110.0 104.7 32
3211—3212 Manufacture of fine and imitation jewellery ייצור תכשיטים יקרים, תכשיטים 3212—3211 and related articles מלאכותיים ופריטים דומים 96.8 101.1 98.6
3240, 3290 Manufacturing of games and toys, and other ייצור משחקים וצעצועים, וענפי 106.1 109.5 105.2 3240, 3290 manufacturing n.e.c. ייצור אחרים לנמ"א
3250 Manufacture of medical, dental and ייצור ציוד רפואי, דנטלי ואורתופדי 121.1 116.6 109.0 3250 orthopedic instruments and supplies
33 Repair and installation of machinery תיקון, תחזוקה והתקנה של מכונות 33
and equipment וציוד 97.9 111.4 106.3
3311—3314 Repair of fabricated metal products, תיקון מוצרי מתכת בהרכבה, מכונות 3314—3311
machinery, electronic, וציוד אלקטרוני, אופטי, רפואי optical, medical and electrical equipment וחשמלי 97.3 111.7 109.6
3315, Repair of transport equipment and other תיקון כלי תחבורה והובלה וסוגים ,33153319—3320 machinery and equipment, except motor 3319—3320 אחרים של מכונות וציוד, פרט לכלי
vehicles, and installation of רכב מנועיים, התקנה industrial machinery and equipment של מכונות וציוד תעשייתיים 102.1 110.8 100.8
(1) Formerly: Manufacturing. (1) קודם: תעשייה. (2) Excluding diamonds. (2) לא כולל יהלומים.
- 58 -

ה,שמע
ה לבוד
ת עשעו
ת, שרו
מם, פעלי
מ .1
4ח לו
TA
BL
E 14. E
ST
AB
LIS
HM
EN
TS
, JOB
S, A
CT
UA
L W
OR
K H
OU
RS
,
תטכנולוגי
ה מפי עוצ
שכר, לה ובוד
ת ע עלו
LA
BO
UR
CO
ST
AN
D W
AG
ES
, BY
TE
CH
NO
LO
GIC
AL
INT
EN
SIT
Y
שייה -תע
טכנולוגיהטכנולוגיה
טכנולוגיהטכנולוגיה
סך הכל עילית
מעורבת-עיליתמעורבת-מסורתית
מסורתית
Manufacturing -
High
Medium
-highM
edium-low
Lowtotal
technologytechnology
technology technology
שישרות - סך הכל (אלפים) - ממוצע חוד
מ362.9
97.7
61.6
89.6
113.9
Jobs - total (thousands) - m
onthly average
שישכיר (אלפים) - ממוצע חוד
שרות מ
347.4
95.6
58.5
84.8
108.4
Em
ployee jobs (thousands) - monthly average
שה - סך הכל (מליונים)שעות עבודה למע
705.4
194.1
117.6
177.9
215.8
A
ctual work hours - total (m
illions)
שישכיר - ממוצע חוד
שרת שה למ
שעות עבודה למע
169
169
168
175
166
Actual w
ork hours per employee job - m
onthly average
ש"ח)(1) עלות עבודה - סך הכל (מיליוני
63,335
27,181
10,885
12,630
12,637
Labour cost - total (NIS
million)(1)
ש"ח)(1)שלום (
שעת עבודה בת עלות
82
123
84
66
54
Cost of paid w
ork hour (NIS
)(1)
שכר, כאחוז ממנוהוצאות נלוות ל
20.7
23.9
20.7
18.5
16.6
Supplem
entary expenditures for wages, as percentage of them
ש"ח)(2)שכר - סך הכל (מיליוני
52,605
21,985
9,064
10,702
10,853
W
ages - total (NIS
million)(2)
ש"ח)שכיר (אלפי
שרת שנתי למ
שכר
153
230
155
126
100
Annual w
ages per employee job (N
IS thousand)
מפעלים12,805
5731,475
4,2686,489
Establishm
ents
שישרות - סך הכל (אלפים) - ממוצע חוד
מ362.1
97.0
60.6
90.5
114.0
Jobs - total (thousands) - m
onthly average
שישכיר (אלפים) - ממוצע חוד
שרות מ
346.5
94.9
57.4
85.8
108.3
Em
ployee jobs (thousands) - monthly average
שה - סך הכל (מיליונים)שעות עבודה למע
701.8
191.5
115.1
180.3
214.9
A
ctual work hours - total (m
illions)
שישכיר - ממוצע חוד
שרת שה למ
שעות עבודה למע
169
168
167
175
165
Actual w
ork hours per employee job - m
onthly average
ש"ח)(1) עלות עבודה - סך הכל (מיליוני
64,998
27,799
10,866
13,068
13,266
Labour cost - total (NIS
million)(1)
ש"ח)(1)שלום (
שעת עבודה בת עלות
84
127
86
67
57
Cost of paid w
ork hour (NIS
)(1)
שכר, כאחוז ממנוהוצאות נלוות ל
20.7
23.9
20.7
18.5
16.6
Supplem
entary expenditures for wages, as percentage of them
ש"ח)(2)שכר - סך הכל (מיליוני
53,848
22,442
8,999
11,028
11,379
W
ages - total (NIS
million)(2)
ש"ח)שכיר (אלפי
שרת שנתי למ
שכר
155
236
157
129
105
Annual w
ages per employee job (N
IS thousand)
שכר לתקופות קודמות,שי
שלומים חד-פעמיים, הפרשכר, ת
(1) כולל (1) Including w
ages, non-recurrent payments and backpay for previous periods,
הוצאות נלוות ומרכיבי עלות נוספים. other supplem
entary labour expenditures and additional labour cost components.
שים לתקופות קודמות.שלומים חד-פעמיים והפר
(2) כולל ת(2) Including non-recurrent paym
ents and backpay for previous periods.
20
14
20
15
- 59 -

ה, בוד
ת עפדיון ועלו
ת, שרו
מם, פעלי
מ .1
5ח לו
TA
BL
E 15. E
ST
AB
LIS
HM
EN
TS
, JOB
S, R
EV
EN
UE
AN
D L
AB
OU
R C
OS
T,
ת גודלבוצ
קפי ת ול
טכנולוגיה מפי עוצ
ל B
Y T
EC
HN
OL
OG
ICA
L IN
TE
NS
ITY
AN
D B
Y S
IZE
GR
OU
P
מפעליםשרות
משכיר
שרות מ
פדיוןR
evenue עלות עבודה
עוצמה טכנולוגיתשיממוצע חוד
שיממוצע חוד
סך הכל -מזה: יצוא
סך הכלTecnological intensity
וקבוצת גודל(אלפים)
(אלפים)ש"ח)
(מיליוני ש"ח)
(מיליוני ש"ח)(1)
(מיליוני and size group
שרות במפעל)(מספר מ
Jobs E
mployee jobs
Labour cost(num
ber of jobs in establishment)
Establishm
entsm
onthly averagem
onthly averageTotal
Thereof: Exports
total (thousands)
(thousands)(N
IS m
illion)(N
IS m
illion)(N
IS m
illion)(1)
הכלסך
ה - שיי
תע12,805
362.1346.5
394,837 168,017
64,998 M
anu
facturin
g - to
tal
ת ה עילי
טכנולוגיH
igh
techn
olo
gy
סך הכל573
97.094.9
126,908 97,363
27,799 Total
19-1249
1.71.7
883 268
294 1-19
49-2088
2.72.7
2,143 1,437
523 20-49
99-5085
6.36.3
5,032 3,085
1,546 50-99
299-10088
14.914.4
15,733 11,145
3,487 100-299
+300 64
71.470.0
103,117 81,428
21,948 300+
תת-עילי
במעור
ה טכנולוגי
Med
ium
-hig
h tech
no
log
yסך הכל
1,475 60.6
57.464,292
35,079 10,866
Total4-1
559 1.2
1.2801
103 149
1-419-5
459 4.5
4.42,594
316 683
5-1949-20
203 6.4
6.24,365
1,171 977
20-4999-50
121 8.7
8.46,778
1,382 1,208
50-99299-100
97 17.9
16.620,301
10,976 3,195
100-299 +300
36 22.0
20.629,453
21,130 4,654
300+
תתיסור
מת-במעור
ה טכנולוגי
Med
ium
-low
techn
olo
gy
סך הכל4,268
90.585.8
104,172 25,779
13,068 Total
4-12,070
4.84.8
2,540 108
488 1-4
19-51,280
12.912.7
6,676 248
1,641 5-19
49-20514
16.115.5
11,343 1,239
2,156 20-49
99-50234
16.916.0
11,979 1,924
2,294 50-99
299-100148
25.724.0
22,921 4,690
3,929 100-299
+300 22
14.112.8
48,713 17,570
2,560 300+
ת תיסור
מה טכנולוגי
Lo
w tech
no
log
yסך הכל
6,489 114.0
108.399,465
9,797 13,266
Total4-1
3,462 7.2
7.13,458
116 635
1-419-5
1,951 17.8
17.78,836
610 1,720
5-1949-20
666 20.5
20.013,808
915 2,079
20-4999-50
216 15.2
14.812,252
951 1,783
50-99299-100
145 25.6
23.526,431
3,546 3,104
100-299 +300
48 27.6
25.334,680
3,659 3,945
300+שכר לתקופות קודמות,
שי שלומים חד-פעמיים, הפר
שכר, ת(1) כולל
(1) Including wages, non-recurrent paym
ents and backpay for previous periods, הוצאות נלוות ומרכיבי עלות נוספים.
other supplementary labour expenditures and additional labour cost com
ponents.
2015
- 60 -
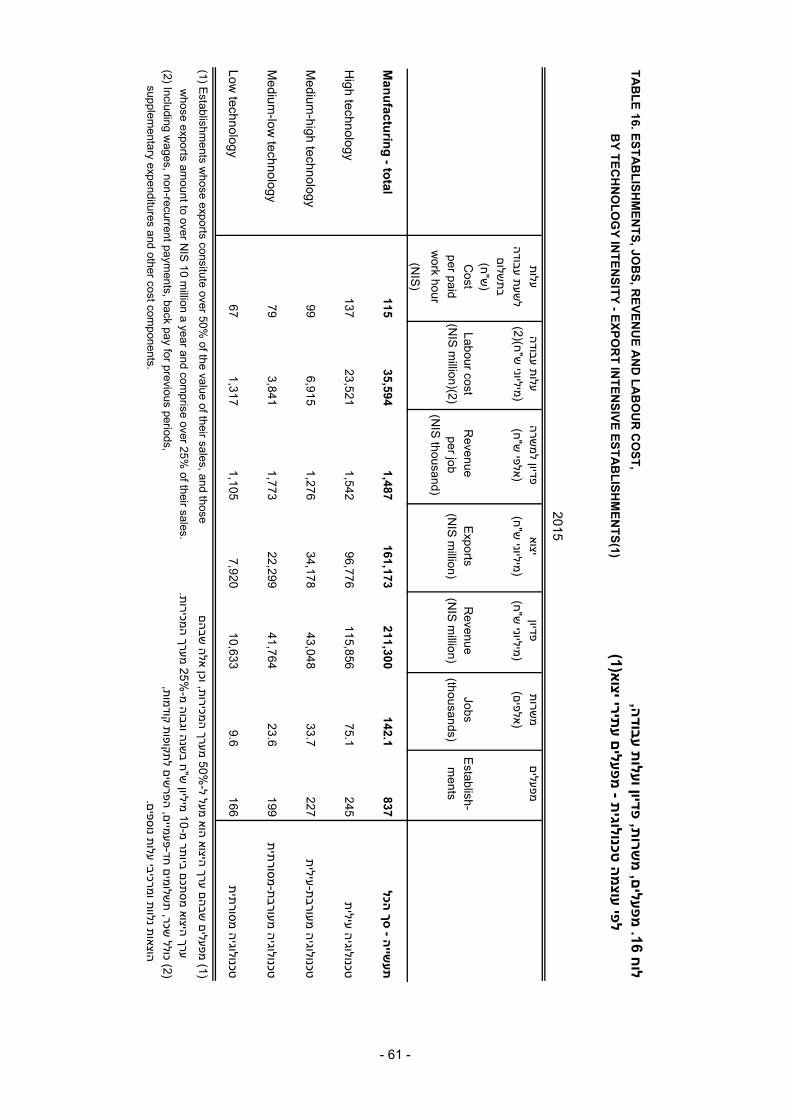
ה, בוד
ת עפדיון ועלו
ת, שרו
מם,
פעלימ
ח 16. לו
TA
BL
E 1
6. E
ST
AB
LIS
HM
EN
TS
, JO
BS
, RE
VE
NU
E A
ND
LA
BO
UR
CO
ST
,
א(1)תירי יצו
ם עפעלי
מת -
טכנולוגיה מפי עוצ
ל B
Y T
EC
HN
OL
OG
Y IN
TE
NS
ITY
- EX
PO
RT
INT
EN
SIV
E E
ST
AB
LIS
HM
EN
TS
(1)
מפעליםשרות
מפדיון
יצואשרה
פדיון למעלות עבודה
עלות(אלפים)
ש"ח)(מיליוני
ש"ח)(מיליוני
ש"ח)(אלפי
ש"ח)(2)(מיליוני
שעת עבודהל
שלוםבת
ש"ח))
Establish-
JobsR
evenueE
xportsR
evenue Labour cost
Cost
ments
(thousands)(N
IS m
illion)(N
IS m
illion)per job
(NIS
million)(2)
per paid(N
IS thousand)
work hour
(NIS
)
הכלסך
ה - שיי
תע8
37
14
2.1
21
1,3
00
16
1,1
73
1,4
87
35
,59
41
15
Man
ufactu
ring
- total
טכנולוגיה עילית245
75.1115,856
96,7761,542
23,521137
High technology
טכנולוגיה מעורבת-עילית227
33.743,048
34,1781,276
6,91599
Medium
-high technology
טכנולוגיה מעורבת-מסורתית199
23.641,764
22,2991,773
3,84179
Medium
-low technology
טכנולוגיה מסורתית166
9.610,633
7,9201,105
1,31767
Low technology
שבהם50% מערך המכירות, וכן אלה
שבהם ערך היצוא הוא מעל ל-(1) מפעלים
(1) Establishments w
hose exports consitute over 50% of the value of their sales, and those
25% מערך המכירות.שנה וגבוה מ-
ש"ח ב ערך היצוא מסתכם ביותר מ-10 מיליון
whose exports am
ount to over NIS 10 m
illion a year and comprise over 25%
of their sales.שים לתקופות קודמות,
שלומים חד-פעמיים, הפרשכר, ת
(2) כולל (2) Including w
ages, non-recurrent payments, back pay for previous periods,
הוצאות נלוות ומרכיבי עלות נוספים. supplem
entary expenditures and other cost components.
2015
- 61 -

TA
BL
E 1
7. M
AN
UF
AC
TU
RIN
G P
RO
DU
CT
ION
IND
ICE
S, R
EV
EN
UE
,פדיון,
תי, שיי
תעמדדי ייצור
ח 17. לו
EM
PL
OY
EE
JOB
S A
ND
AC
TU
AL
WO
RK
HO
UR
Sהשמע
ה לבוד
ת עשעו
שכיר ות שרו
מ
BY
TE
CH
NO
LO
GIC
AL
INT
EN
SIT
Yתטכנולוגי
ה מפי עוצ
ל
Base: 2011=100.0הבסיס: 2011=100.0
טכנולוגיהטכנולוגיה
טכנולוגיהטכנולוגיה
שייה -תע
עיליתמעורבת-עילית
מעורבת-מסורתית
סך הכלמסורתית
High
Medium
-highM
edium-low
LowM
anufacturing -technology
technology technology
technologytotal
Manufacturing production
107.1103.7
104.698.7
104.2שייתי
ייצור תעR
evenue at constant prices109.6
103.5107.1
103.0106.2
פדיון במחירים קבועים Thereof: Local sales revenue
102.1100.7
103.0105.7
103.5 מזה: פדיון מכירות מקומיות
Exports
110.6100.9
122.686.2
109.0 יצוא
Employee jobs
98.3103.4
103.1100.9
101.1שכיר
שרות מ
Actual work hours
97.4100.9
100.396.9
98.5שה
שעות עבודה למע
Manufacturing production
110.7105.2
106.0100.9
106.8שייתי
ייצור תעR
evenue at constant prices111.3
102.6107.6
105.9107.5
פדיון במחירים קבועים Thereof: Local sales revenue
100.999.2
105.7108.7
105.4 מזה: פדיון מכירות מקומיות
Exports
114.1102.7
112.286.5
109.3 יצוא
Employee jobs
97.6101.5
104.3100.8
100.9שכיר
שרות מ
Actual work hours
96.198.7
101.796.5
98.0שה
שעות עבודה למע
2014
2015
- 62 -

ה,בוד
ת עפדיון ועלו
ת, שרו
מם,
פעלימ
ח 18. לו
TA
BL
E 18. E
ST
AB
LIS
HM
EN
TS
, JOB
S, R
EV
EN
UE
AN
D L
AB
OU
R C
OS
T
מגזר פי ת ול
טכנולוגיה מפי עוצ
ל B
Y T
EC
HN
OL
OG
ICA
L IN
TE
NS
ITY
, AN
D B
Y S
EC
TO
R
מפעליםשרות
משכיר
שרות מ
פדיוןR
evenue עלות עבודה
עוצמה טכנולוגיתשיממוצע חוד
שיממוצע חוד
סך הכל מזה: יצוא
סך הכל Tecnological intensity
ומגזר(אלפים)
(אלפים)ש"ח)
(מיליוני ש"ח)
(מיליוני ש"ח)(1)
(מיליוני and sector
Jobs E
mployee jobs
Labour costE
stablishments
monthly average
monthly average
Total Thereof: E
xportstotal
(thousands)(thousands)
(NIS
million)
(NIS
million)
(NIS
million)(1)
הכלסך
ה - שיי
תע12,805
362.1
346.5
394,837
168,017
64,998
Man
ufa
ctu
ring
- total
תה עילי
טכנולוגיH
igh
tec
hn
olo
gy
סך הכל573
97.0
94.9
126,908
97,363
27,799
Totalשראלית
מגזר פרטי בבעלות ישקי בית
ומגזר מ463
45.6
44.8
59,661
47,867
11,898
Israeli-owned private corporations and households
חברות בבעלות זרה91
27.2
26.2
39,582
33,723
7,236
Foreign controlled corporationsקואופרטיבים
12
1.8
1.4
1,014
353
283
C
ooperativesשלתיות
חברות ממ7
22.5
22.5
26,651
15,420
8,381
Governm
ent corporations
תת-עילי
במעור
ה טכנולוגי
Med
ium
-hig
h te
ch
no
log
yסך הכל
1,475
60.6
57.4
64,292
35,079
10,866
Total
שראליתמגזר פרטי בבעלות ישקי בית
ומגזר מ1,361
40.9
39.6
40,635
17,442
6,771
Israeli-owned private corporations and households
חברות בבעלות זרה68
9.2
8.7
15,721
13,339
2,200
Foreign controlled corporationsקואופרטיבים
41
6.9
5.6
5,337
3,581
896
C
ooperativesשלתיות
חברות ממ4
3.6
3.6
2,598
717
998
Governm
ent corporations
תתיסור
מת-במעור
ה טכנולוגי
Med
ium
-low
tec
hn
olo
gy
סך הכל4,268
90.5
85.8
104,172
25,779
13,068
Totalשראלית
מגזר פרטי בבעלות י2,804
70.6
68.0
84,944
16,443
10,187
Israeli-owned private corporations
חברות בבעלות זרה46
10.4
9.7
12,559
6,961
1,846
Foreign controlled corporationsקואופרטיבים
67
6.6
5.2
5,500
2,372
804
C
ooperativesשקי בית
מ1,351
2.9
2.9
1,169
3
232
Households
תתיסור
מה טכנולוגי
Lo
w te
ch
no
log
yסך הכל
6,489
114.0
108.3
99,465
9,797
13,266
Total
שראלית מגזר פרטי בבעלות י
3,452
90.6
86.9
70,184
6,858
10,336
Israeli-ow
ned private corporations חברות בבעלות זרה
57
9.5
8.6
16,335
1,659
1,592
Foreign controlled corporations
שלתיותקואופרטיבים וחברות ממ
88
7.4
6.2
10,631
1,249
871
C
ooperatives and government corporations
שקי ביתמ
2,892
6.6
6.6
2,314
30
467
H
ouseholds
שכר לתקופות קודמות,שי
שלומים חד-פעמיים, הפרשכר, ת
(1) כולל (1) Including w
ages, non-recurrent payments and backpay for previous periods,
הוצאות נלוות ומרכיבי עלות נוספים. other supplem
entary labour expenditures and additional labour cost components.
2015
- 63 -