Embed Size (px)
Citation preview
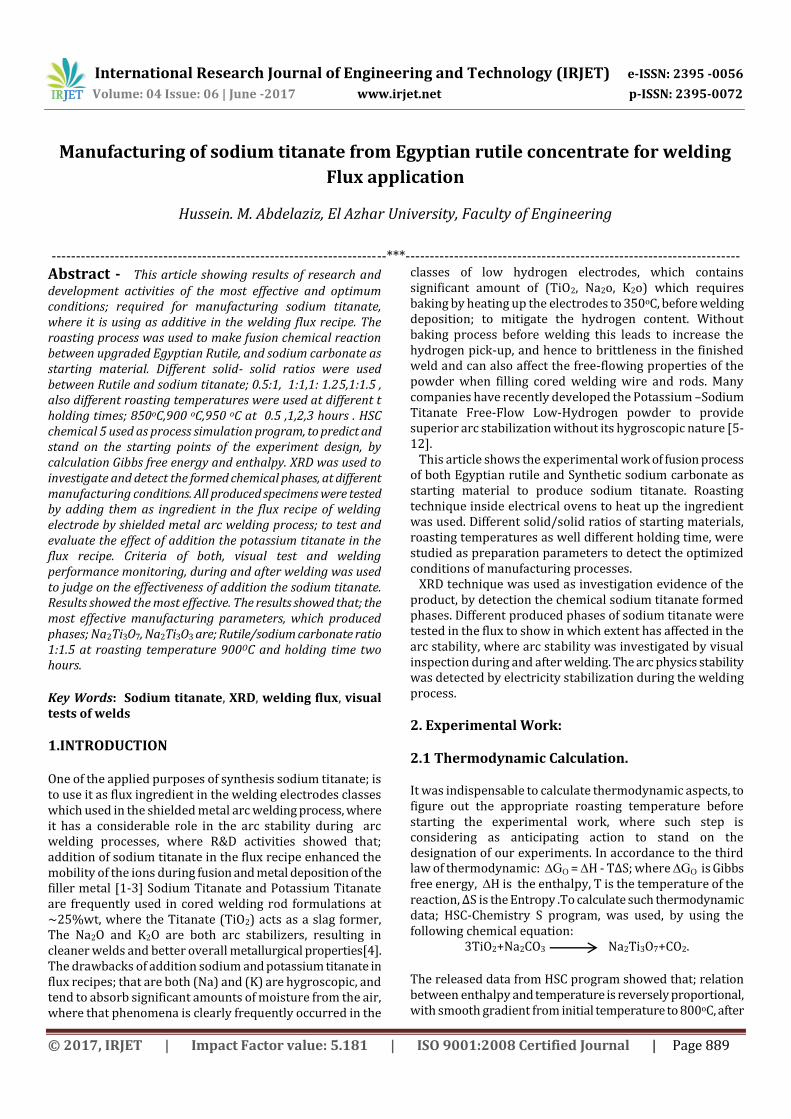
International Research Journal of Engineering and Technology (IRJET) e-ISSN: 2395 -0056
Volume: 04 Issue: 06 | June -2017 www.irjet.net p-ISSN: 2395-0072
© 2017, IRJET | Impact Factor value: 5.181 | ISO 9001:2008 Certified Journal | Page 889
Manufacturing of sodium titanate from Egyptian rutile concentrate for welding
Flux application
Hussein. M. Abdelaziz, El Azhar University, Faculty of Engineering
---------------------------------------------------------------------***---------------------------------------------------------------------
Abstract - This article showing results of research and development activities of the most effective and optimum conditions; required for manufacturing sodium titanate, where it is using as additive in the welding flux recipe. The roasting process was used to make fusion chemical reaction between upgraded Egyptian Rutile, and sodium carbonate as starting material. Different solid- solid ratios were used between Rutile and sodium titanate; 0.5:1, 1:1,1: 1.25,1:1.5 , also different roasting temperatures were used at different t holding times; 850oC,900 oC,950 oC at 0.5 ,1,2,3 hours . HSC chemical 5 used as process simulation program, to predict and stand on the starting points of the experiment design, by calculation Gibbs free energy and enthalpy. XRD was used to investigate and detect the formed chemical phases, at different manufacturing conditions. All produced specimens were tested by adding them as ingredient in the flux recipe of welding electrode by shielded metal arc welding process; to test and evaluate the effect of addition the potassium titanate in the flux recipe. Criteria of both, visual test and welding performance monitoring, during and after welding was used to judge on the effectiveness of addition the sodium titanate. Results showed the most effective. The results showed that; the most effective manufacturing parameters, which produced phases; Na2Ti3O7, Na2Ti3O3 are; Rutile/sodium carbonate ratio 1:1.5 at roasting temperature 900OC and holding time two hours. Key Words: Sodium titanate, XRD, welding flux, visual tests of welds
1.INTRODUCTION One of the applied purposes of synthesis sodium titanate; is to use it as flux ingredient in the welding electrodes classes which used in the shielded metal arc welding process, where it has a considerable role in the arc stability during arc welding processes, where R&D activities showed that; addition of sodium titanate in the flux recipe enhanced the mobility of the ions during fusion and metal deposition of the filler metal [1-3] Sodium Titanate and Potassium Titanate are frequently used in cored welding rod formulations at ~25%wt, where the Titanate (TiO2) acts as a slag former, The Na2O and K2O are both arc stabilizers, resulting in cleaner welds and better overall metallurgical properties[4]. The drawbacks of addition sodium and potassium titanate in flux recipes; that are both (Na) and (K) are hygroscopic, and tend to absorb significant amounts of moisture from the air, where that phenomena is clearly frequently occurred in the
classes of low hydrogen electrodes, which contains significant amount of (TiO2, Na2o, K2o) which requires baking by heating up the electrodes to 350oC, before welding deposition; to mitigate the hydrogen content. Without baking process before welding this leads to increase the hydrogen pick-up, and hence to brittleness in the finished weld and can also affect the free-flowing properties of the powder when filling cored welding wire and rods. Many companies have recently developed the Potassium –Sodium Titanate Free-Flow Low-Hydrogen powder to provide superior arc stabilization without its hygroscopic nature [5-12]. This article shows the experimental work of fusion process of both Egyptian rutile and Synthetic sodium carbonate as starting material to produce sodium titanate. Roasting technique inside electrical ovens to heat up the ingredient was used. Different solid/solid ratios of starting materials, roasting temperatures as well different holding time, were studied as preparation parameters to detect the optimized conditions of manufacturing processes. XRD technique was used as investigation evidence of the product, by detection the chemical sodium titanate formed phases. Different produced phases of sodium titanate were tested in the flux to show in which extent has affected in the arc stability, where arc stability was investigated by visual inspection during and after welding. The arc physics stability was detected by electricity stabilization during the welding process.
2. Experimental Work:
2.1 Thermodynamic Calculation.
It was indispensable to calculate thermodynamic aspects, to figure out the appropriate roasting temperature before starting the experimental work, where such step is considering as anticipating action to stand on the designation of our experiments. In accordance to the third law of thermodynamic: ∆GO = ∆H - T∆S; where ∆GO is Gibbs free energy, ∆H is the enthalpy, T is the temperature of the reaction, ∆S is the Entropy .To calculate such thermodynamic data; HSC-Chemistry S program, was used, by using the following chemical equation:
3TiO2+Na2CO3 Na2Ti3O7+CO2.
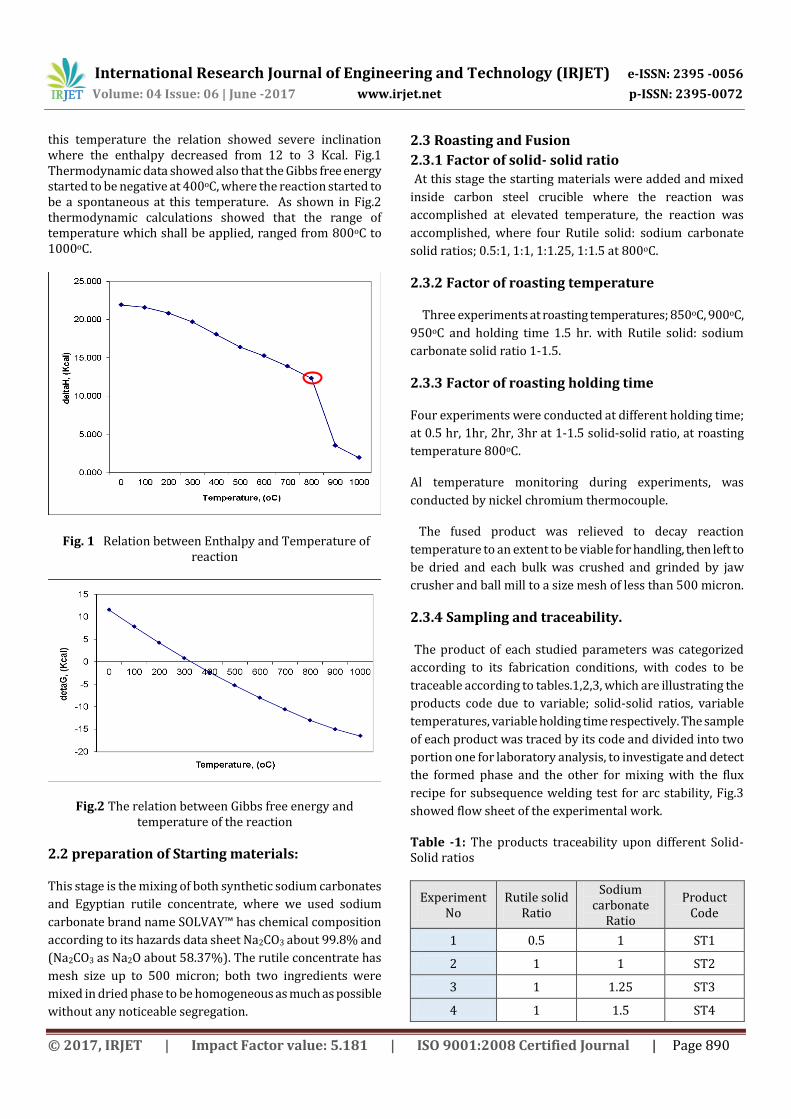
The released data from HSC program showed that; relation between enthalpy and temperature is reversely proportional, with smooth gradient from initial temperature to 800oC, after
International Research Journal of Engineering and Technology (IRJET) e-ISSN: 2395 -0056
Volume: 04 Issue: 06 | June -2017 www.irjet.net p-ISSN: 2395-0072
© 2017, IRJET | Impact Factor value: 5.181 | ISO 9001:2008 Certified Journal | Page 890
this temperature the relation showed severe inclination where the enthalpy decreased from 12 to 3 Kcal. Fig.1 Thermodynamic data showed also that the Gibbs free energy started to be negative at 400oC, where the reaction started to be a spontaneous at this temperature. As shown in Fig.2 thermodynamic calculations showed that the range of temperature which shall be applied, ranged from 800oC to 1000oC.
Fig. 1 Relation between Enthalpy and Temperature of reaction
Fig.2 The relation between Gibbs free energy and temperature of the reaction
2.2 preparation of Starting materials:
This stage is the mixing of both synthetic sodium carbonates
and Egyptian rutile concentrate, where we used sodium
carbonate brand name SOLVAY™ has chemical composition
according to its hazards data sheet Na2CO3 about 99.8% and
(Na2CO3 as Na2O about 58.37%). The rutile concentrate has
mesh size up to 500 micron; both two ingredients were
mixed in dried phase to be homogeneous as much as possible
without any noticeable segregation.
2.3 Roasting and Fusion
2.3.1 Factor of solid- solid ratio
At this stage the starting materials were added and mixed
inside carbon steel crucible where the reaction was
accomplished at elevated temperature, the reaction was
accomplished, where four Rutile solid: sodium carbonate
solid ratios; 0.5:1, 1:1, 1:1.25, 1:1.5 at 800oC.
2.3.2 Factor of roasting temperature
Three experiments at roasting temperatures; 850oC, 900oC,
950oC and holding time 1.5 hr. with Rutile solid: sodium
carbonate solid ratio 1-1.5.
2.3.3 Factor of roasting holding time
Four experiments were conducted at different holding time;
at 0.5 hr, 1hr, 2hr, 3hr at 1-1.5 solid-solid ratio, at roasting
temperature 800oC.
Al temperature monitoring during experiments, was
conducted by nickel chromium thermocouple.
The fused product was relieved to decay reaction
temperature to an extent to be viable for handling, then left to
be dried and each bulk was crushed and grinded by jaw
crusher and ball mill to a size mesh of less than 500 micron.
2.3.4 Sampling and traceability.
The product of each studied parameters was categorized
according to its fabrication conditions, with codes to be
traceable according to tables.1,2,3, which are illustrating the
products code due to variable; solid-solid ratios, variable
temperatures, variable holding time respectively. The sample
of each product was traced by its code and divided into two
portion one for laboratory analysis, to investigate and detect
the formed phase and the other for mixing with the flux
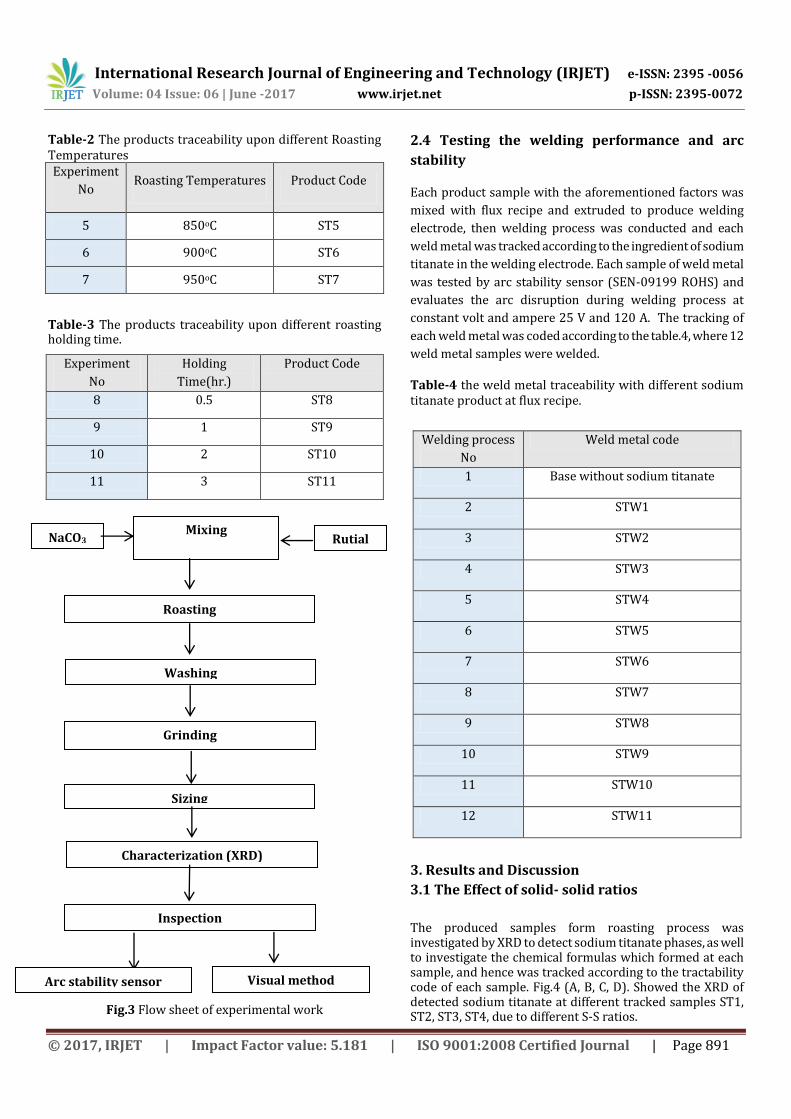
recipe for subsequence welding test for arc stability, Fig.3
showed flow sheet of the experimental work.
Table -1: The products traceability upon different Solid-Solid ratios
Experiment No
Rutile solid Ratio
Sodium carbonate
Ratio
Product Code
1 0.5 1 ST1
2 1 1 ST2
3 1 1.25 ST3
4 1 1.5 ST4
International Research Journal of Engineering and Technology (IRJET) e-ISSN: 2395 -0056
Volume: 04 Issue: 06 | June -2017 www.irjet.net p-ISSN: 2395-0072
© 2017, IRJET | Impact Factor value: 5.181 | ISO 9001:2008 Certified Journal | Page 891
Table-2 The products traceability upon different Roasting Temperatures Experiment
No Roasting Temperatures Product Code
5 850oC ST5
6 900oC ST6
7 950oC ST7
Table-3 The products traceability upon different roasting holding time.
Experiment
No
Holding
Time(hr.)
Product Code
8 0.5 ST8
9 1 ST9
10 2 ST10
11 3 ST11
Fig.3 Flow sheet of experimental work
2.4 Testing the welding performance and arc
stability
Each product sample with the aforementioned factors was
mixed with flux recipe and extruded to produce welding
electrode, then welding process was conducted and each
weld metal was tracked according to the ingredient of sodium
titanate in the welding electrode. Each sample of weld metal
was tested by arc stability sensor (SEN-09199 ROHS) and
evaluates the arc disruption during welding process at
constant volt and ampere 25 V and 120 A. The tracking of
each weld metal was coded according to the table.4, where 12
weld metal samples were welded.
Table-4 the weld metal traceability with different sodium titanate product at flux recipe.
Welding process
No
Weld metal code
1 Base without sodium titanate
2 STW1
3 STW2
4 STW3
5 STW4
6 STW5
7 STW6
8 STW7
9 STW8
10 STW9
11 STW10
12 STW11
3. Results and Discussion
3.1 The Effect of solid- solid ratios
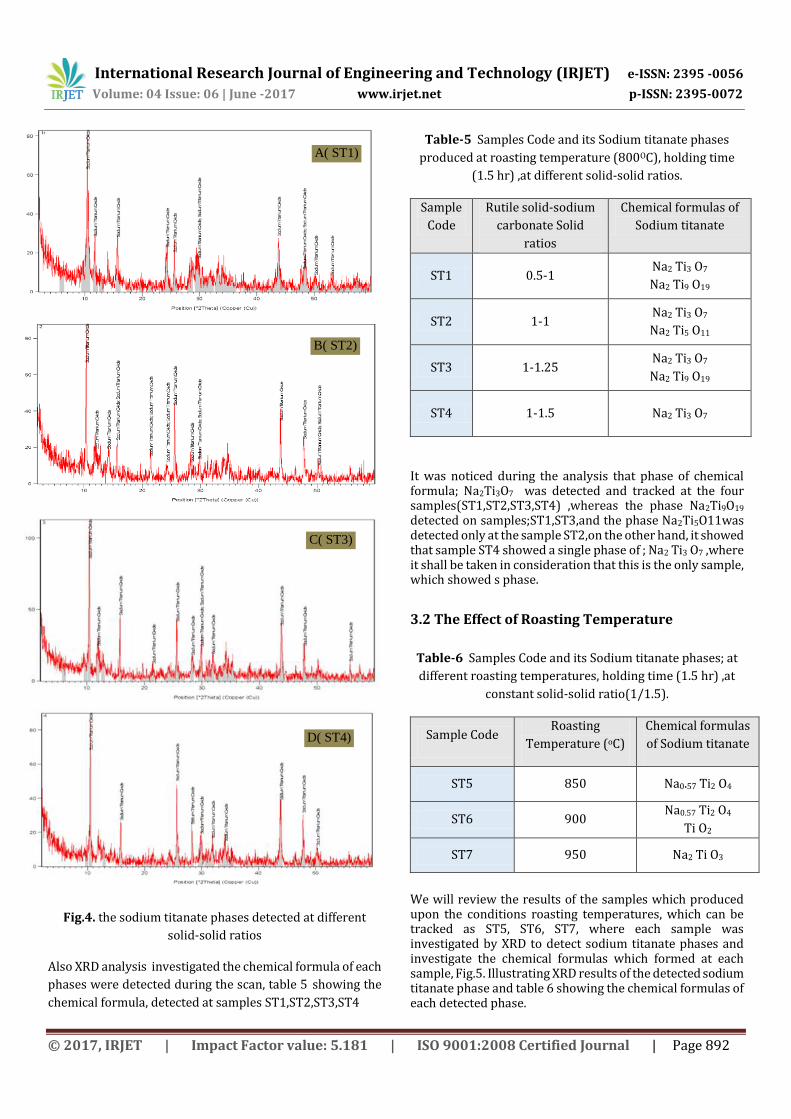
The produced samples form roasting process was investigated by XRD to detect sodium titanate phases, as well to investigate the chemical formulas which formed at each sample, and hence was tracked according to the tractability code of each sample. Fig.4 (A, B, C, D). Showed the XRD of detected sodium titanate at different tracked samples ST1, ST2, ST3, ST4, due to different S-S ratios.
Mixing
Roasting
Washing
Grinding
Sizing
Characterization (XRD)
Inspection
Visual method
Rutial NaCO3
Arc stability sensor
International Research Journal of Engineering and Technology (IRJET) e-ISSN: 2395 -0056
Volume: 04 Issue: 06 | June -2017 www.irjet.net p-ISSN: 2395-0072
© 2017, IRJET | Impact Factor value: 5.181 | ISO 9001:2008 Certified Journal | Page 892
Fig.4. the sodium titanate phases detected at different
solid-solid ratios
Also XRD analysis investigated the chemical formula of each
phases were detected during the scan, table 5 showing the
chemical formula, detected at samples ST1,ST2,ST3,ST4
Table-5 Samples Code and its Sodium titanate phases
produced at roasting temperature (800OC), holding time
(1.5 hr) ,at different solid-solid ratios.
Sample
Code
Rutile solid-sodium
carbonate Solid
ratios
Chemical formulas of
Sodium titanate
ST1 0.5-1 Na2 Ti3 O7
Na2 Ti9 O19
ST2 1-1 Na2 Ti3 O7
Na2 Ti5 O11
ST3 1-1.25 Na2 Ti3 O7
Na2 Ti9 O19
ST4 1-1.5 Na2 Ti3 O7
It was noticed during the analysis that phase of chemical formula; Na2Ti3O7 was detected and tracked at the four samples(ST1,ST2,ST3,ST4) ,whereas the phase Na2Ti9O19 detected on samples;ST1,ST3,and the phase Na2Ti5O11was detected only at the sample ST2,on the other hand, it showed that sample ST4 showed a single phase of ; Na2 Ti3 O7 ,where it shall be taken in consideration that this is the only sample, which showed s phase.
3.2 The Effect of Roasting Temperature
Table-6 Samples Code and its Sodium titanate phases; at
different roasting temperatures, holding time (1.5 hr) ,at
constant solid-solid ratio(1/1.5).
Sample Code Roasting
Temperature (oC)
Chemical formulas
of Sodium titanate
ST5 850 Na0.57 Ti2 O4
ST6 900 Na0.57 Ti2 O4
Ti O2
ST7 950 Na2 Ti O3
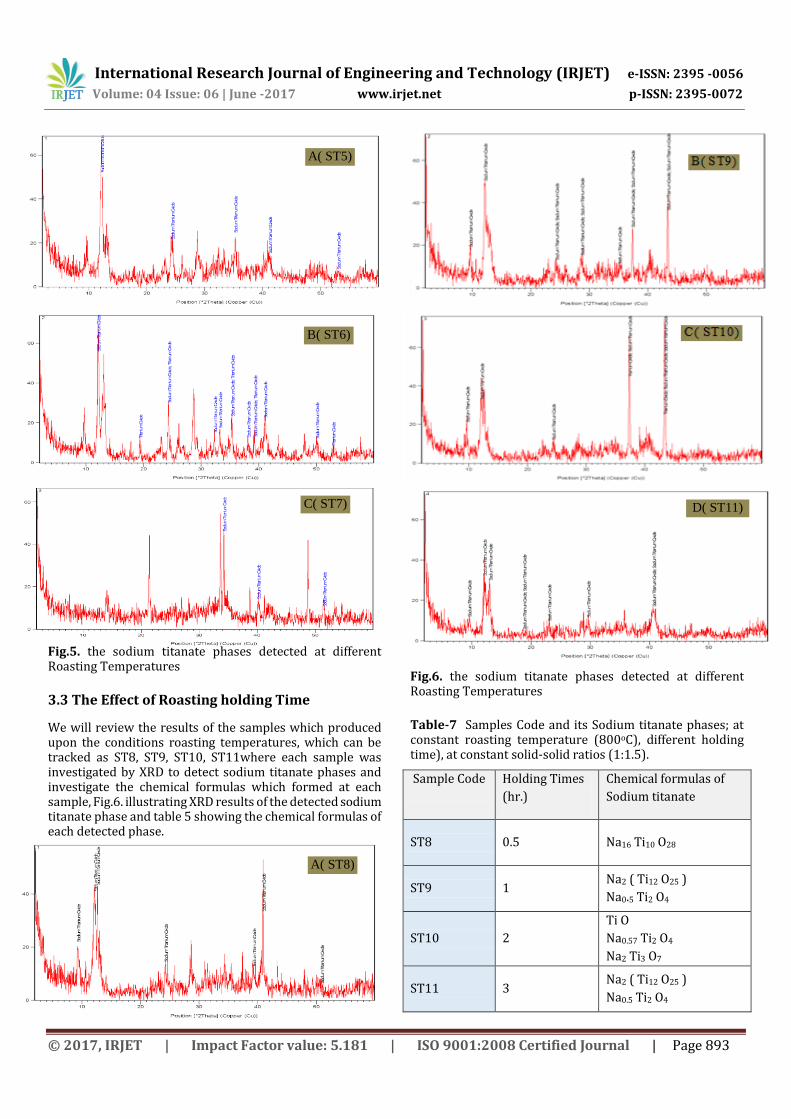
We will review the results of the samples which produced upon the conditions roasting temperatures, which can be tracked as ST5, ST6, ST7, where each sample was investigated by XRD to detect sodium titanate phases and investigate the chemical formulas which formed at each sample, Fig.5. Illustrating XRD results of the detected sodium titanate phase and table 6 showing the chemical formulas of each detected phase.
A( ST1)
B( ST2)
C( ST3)
D( ST4)
International Research Journal of Engineering and Technology (IRJET) e-ISSN: 2395 -0056
Volume: 04 Issue: 06 | June -2017 www.irjet.net p-ISSN: 2395-0072
© 2017, IRJET | Impact Factor value: 5.181 | ISO 9001:2008 Certified Journal | Page 893
Fig.5. the sodium titanate phases detected at different Roasting Temperatures
3.3 The Effect of Roasting holding Time
We will review the results of the samples which produced upon the conditions roasting temperatures, which can be tracked as ST8, ST9, ST10, ST11where each sample was investigated by XRD to detect sodium titanate phases and investigate the chemical formulas which formed at each sample, Fig.6. illustrating XRD results of the detected sodium titanate phase and table 5 showing the chemical formulas of each detected phase.
Fig.6. the sodium titanate phases detected at different Roasting Temperatures
Table-7 Samples Code and its Sodium titanate phases; at constant roasting temperature (800oC), different holding time), at constant solid-solid ratios (1:1.5).
Sample Code Holding Times
(hr.)
Chemical formulas of
Sodium titanate
ST8 0.5 Na16 Ti10 O28
ST9 1 Na2 ( Ti12 O25 )
Na0.5 Ti2 O4
ST10 2
Ti O
Na0.57 Ti2 O4
Na2 Ti3 O7
ST11 3 Na2 ( Ti12 O25 )
Na0.5 Ti2 O4
A( ST5)
D( ST11) C( ST7)
A( ST8)
B( ST9)
B( ST6)
International Research Journal of Engineering and Technology (IRJET) e-ISSN: 2395 -0056
Volume: 04 Issue: 06 | June -2017 www.irjet.net p-ISSN: 2395-0072
© 2017, IRJET | Impact Factor value: 5.181 | ISO 9001:2008 Certified Journal | Page 894
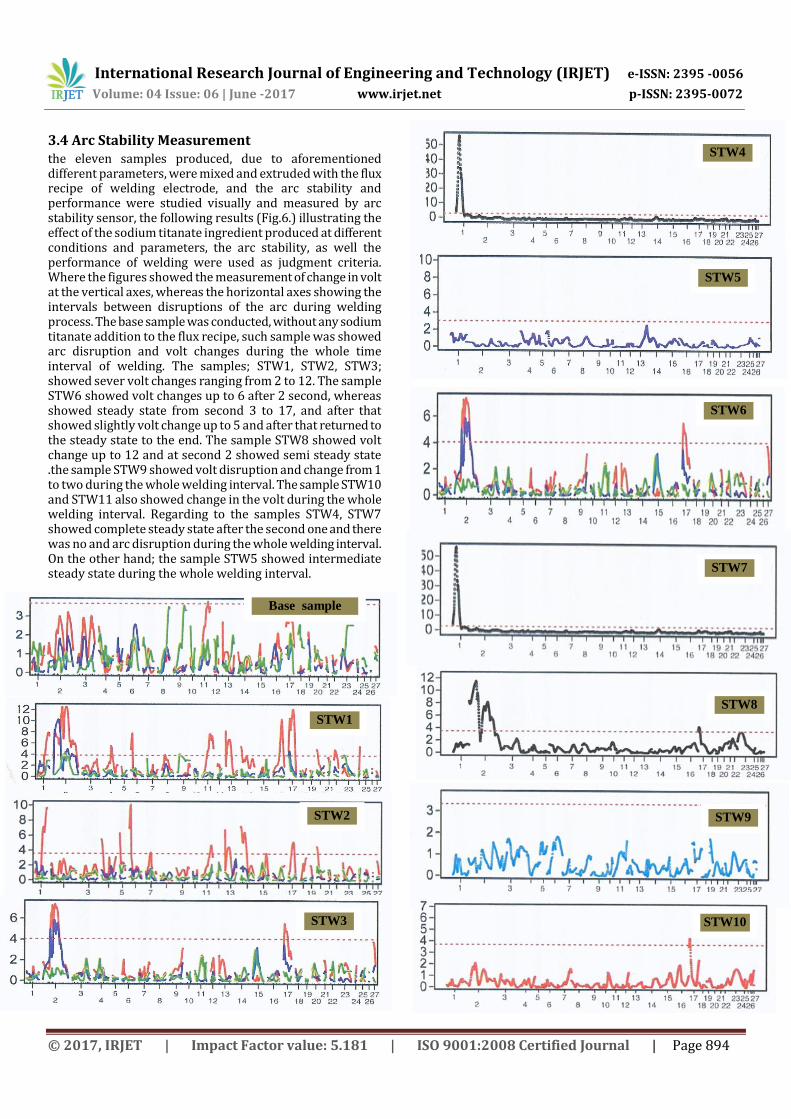
3.4 Arc Stability Measurement the eleven samples produced, due to aforementioned different parameters, were mixed and extruded with the flux recipe of welding electrode, and the arc stability and performance were studied visually and measured by arc stability sensor, the following results (Fig.6.) illustrating the effect of the sodium titanate ingredient produced at different conditions and parameters, the arc stability, as well the performance of welding were used as judgment criteria. Where the figures showed the measurement of change in volt at the vertical axes, whereas the horizontal axes showing the intervals between disruptions of the arc during welding process. The base sample was conducted, without any sodium titanate addition to the flux recipe, such sample was showed arc disruption and volt changes during the whole time interval of welding. The samples; STW1, STW2, STW3; showed sever volt changes ranging from 2 to 12. The sample STW6 showed volt changes up to 6 after 2 second, whereas showed steady state from second 3 to 17, and after that showed slightly volt change up to 5 and after that returned to the steady state to the end. The sample STW8 showed volt change up to 12 and at second 2 showed semi steady state .the sample STW9 showed volt disruption and change from 1 to two during the whole welding interval. The sample STW10 and STW11 also showed change in the volt during the whole welding interval. Regarding to the samples STW4, STW7 showed complete steady state after the second one and there was no and arc disruption during the whole welding interval. On the other hand; the sample STW5 showed intermediate steady state during the whole welding interval.
Base sample
STW2
STW1
STW3
STW4
STW5
STW6
STW7
STW8
STW9
STW10
International Research Journal of Engineering and Technology (IRJET) e-ISSN: 2395 -0056
Volume: 04 Issue: 06 | June -2017 www.irjet.net p-ISSN: 2395-0072
© 2017, IRJET | Impact Factor value: 5.181 | ISO 9001:2008 Certified Journal | Page 895
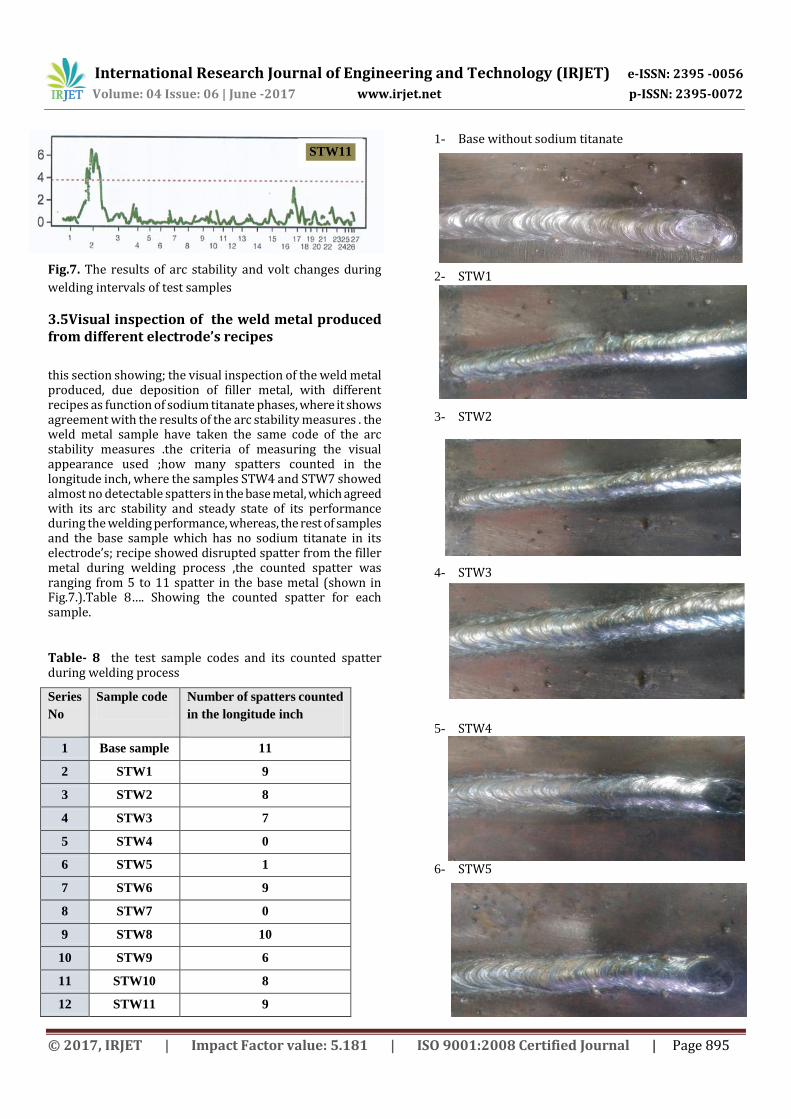
Fig.7. The results of arc stability and volt changes during
welding intervals of test samples
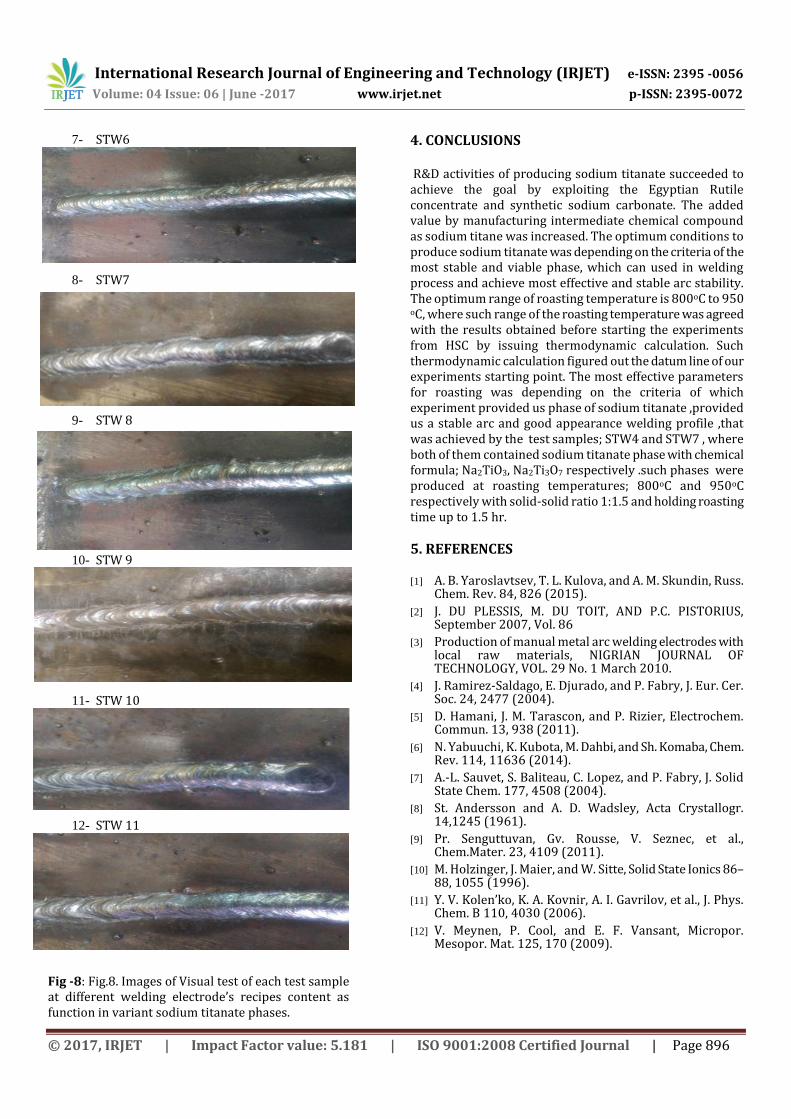
3.5Visual inspection of the weld metal produced from different electrode’s recipes
this section showing; the visual inspection of the weld metal produced, due deposition of filler metal, with different recipes as function of sodium titanate phases, where it shows agreement with the results of the arc stability measures . the weld metal sample have taken the same code of the arc stability measures .the criteria of measuring the visual appearance used ;how many spatters counted in the longitude inch, where the samples STW4 and STW7 showed almost no detectable spatters in the base metal, which agreed with its arc stability and steady state of its performance during the welding performance, whereas, the rest of samples and the base sample which has no sodium titanate in its electrode’s; recipe showed disrupted spatter from the filler metal during welding process ,the counted spatter was ranging from 5 to 11 spatter in the base metal (shown in Fig.7.).Table 8…. Showing the counted spatter for each sample.
Table- 8 the test sample codes and its counted spatter during welding process
Series
No
Sample code Number of spatters counted
in the longitude inch
1 Base sample 11
2 STW1 9
3 STW2 8
4 STW3 7
5 STW4 0
6 STW5 1
7 STW6 9
8 STW7 0
9 STW8 10
10 STW9 6
11 STW10 8
12 STW11 9
1- Base without sodium titanate
2- STW1
3- STW2
4- STW3
5- STW4
6- STW5
STW11
International Research Journal of Engineering and Technology (IRJET) e-ISSN: 2395 -0056
Volume: 04 Issue: 06 | June -2017 www.irjet.net p-ISSN: 2395-0072
© 2017, IRJET | Impact Factor value: 5.181 | ISO 9001:2008 Certified Journal | Page 896
7- STW6
8- STW7
9- STW 8
10- STW 9
11- STW 10
12- STW 11
Fig -8: Fig.8. Images of Visual test of each test sample at different welding electrode’s recipes content as function in variant sodium titanate phases.
4. CONCLUSIONS R&D activities of producing sodium titanate succeeded to achieve the goal by exploiting the Egyptian Rutile concentrate and synthetic sodium carbonate. The added value by manufacturing intermediate chemical compound as sodium titane was increased. The optimum conditions to produce sodium titanate was depending on the criteria of the most stable and viable phase, which can used in welding process and achieve most effective and stable arc stability. The optimum range of roasting temperature is 800oC to 950 oC, where such range of the roasting temperature was agreed with the results obtained before starting the experiments from HSC by issuing thermodynamic calculation. Such thermodynamic calculation figured out the datum line of our experiments starting point. The most effective parameters for roasting was depending on the criteria of which experiment provided us phase of sodium titanate ,provided us a stable arc and good appearance welding profile ,that was achieved by the test samples; STW4 and STW7 , where both of them contained sodium titanate phase with chemical formula; Na2TiO3, Na2Ti3O7 respectively .such phases were produced at roasting temperatures; 800oC and 950oC respectively with solid-solid ratio 1:1.5 and holding roasting time up to 1.5 hr.
5. REFERENCES [1] A. B. Yaroslavtsev, T. L. Kulova, and A. M. Skundin, Russ.
Chem. Rev. 84, 826 (2015).
[2] J. DU PLESSIS, M. DU TOIT, AND P.C. PISTORIUS, September 2007, Vol. 86
[3] Production of manual metal arc welding electrodes with local raw materials, NIGRIAN JOURNAL OF TECHNOLOGY, VOL. 29 No. 1 March 2010.
[4] J. Ramirez-Saldago, E. Djurado, and P. Fabry, J. Eur. Cer. Soc. 24, 2477 (2004).
[5] D. Hamani, J. M. Tarascon, and P. Rizier, Electrochem. Commun. 13, 938 (2011).
[6] N. Yabuuchi, K. Kubota, M. Dahbi, and Sh. Komaba, Chem. Rev. 114, 11636 (2014).
[7] A.-L. Sauvet, S. Baliteau, C. Lopez, and P. Fabry, J. Solid State Chem. 177, 4508 (2004).
[8] St. Andersson and A. D. Wadsley, Acta Crystallogr. 14,1245 (1961).
[9] Pr. Senguttuvan, Gv. Rousse, V. Seznec, et al., Chem.Mater. 23, 4109 (2011).
[10] M. Holzinger, J. Maier, and W. Sitte, Solid State Ionics 86–88, 1055 (1996).
[11] Y. V. Kolen’ko, K. A. Kovnir, A. I. Gavrilov, et al., J. Phys. Chem. B 110, 4030 (2006).
[12] V. Meynen, P. Cool, and E. F. Vansant, Micropor. Mesopor. Mat. 125, 170 (2009).


![Materials Chemistry and Physics · 2020. 3. 5. · ferent natural or synthetic piezoelectric ceramics (e.g. calcium titanate, barium titanate and lead zirconate titanate (PZT)) [2]](https://img.pdfslide.net/doc/110x75/60b88a1c38582264692512fa/materials-chemistry-and-physics-2020-3-5-ferent-natural-or-synthetic-piezoelectric.jpg)